Lake Hamilton, FL Map & Demographics
Lake Hamilton Map
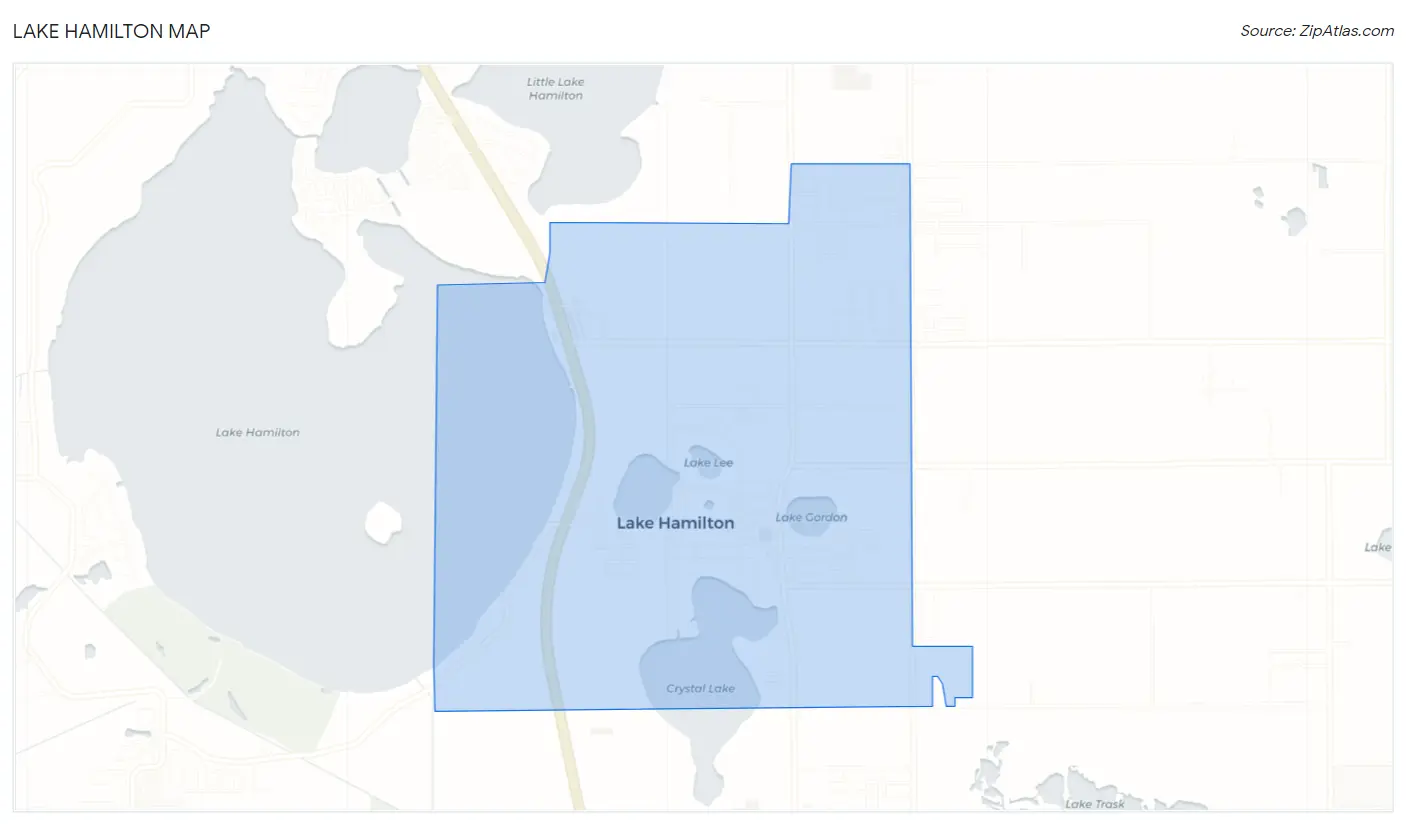
Lake Hamilton Overview
$20,297
PER CAPITA INCOME
$55,039
AVG FAMILY INCOME
$47,692
AVG HOUSEHOLD INCOME
9.6%
WAGE / INCOME GAP [ % ]
90.4¢/ $1
WAGE / INCOME GAP [ $ ]
$10,604
FAMILY INCOME DEFICIT
0.41
INEQUALITY / GINI INDEX
1,613
TOTAL POPULATION
732
MALE POPULATION
881
FEMALE POPULATION
83.09
MALES / 100 FEMALES
120.36
FEMALES / 100 MALES
41.7
MEDIAN AGE
3.5
AVG FAMILY SIZE
3.2
AVG HOUSEHOLD SIZE
651
LABOR FORCE [ PEOPLE ]
49.7%
PERCENT IN LABOR FORCE
0.6%
UNEMPLOYMENT RATE
Lake Hamilton Zip Codes
Lake Hamilton Area Codes
Income in Lake Hamilton
Income Overview in Lake Hamilton
Per Capita Income in Lake Hamilton is $20,297, while median incomes of families and households are $55,039 and $47,692 respectively.
| Characteristic | Number | Measure |
| Per Capita Income | 1,613 | $20,297 |
| Median Family Income | 421 | $55,039 |
| Mean Family Income | 421 | $59,609 |
| Median Household Income | 498 | $47,692 |
| Mean Household Income | 498 | $61,681 |
| Income Deficit | 421 | $10,604 |
| Wage / Income Gap (%) | 1,613 | 9.59% |
| Wage / Income Gap ($) | 1,613 | 90.41¢ per $1 |
| Gini / Inequality Index | 1,613 | 0.41 |
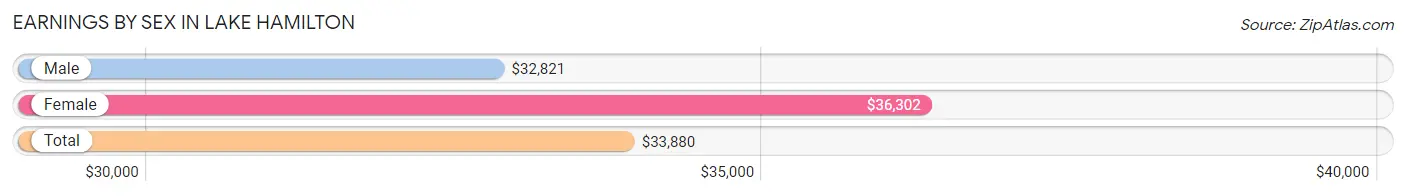
Earnings by Sex in Lake Hamilton
Average Earnings in Lake Hamilton are $33,880, $32,821 for men and $36,302 for women, a difference of 9.6%.
| Sex | Number | Average Earnings |
| Male | 324 (50.1%) | $32,821 |
| Female | 323 (49.9%) | $36,302 |
| Total | 647 (100.0%) | $33,880 |
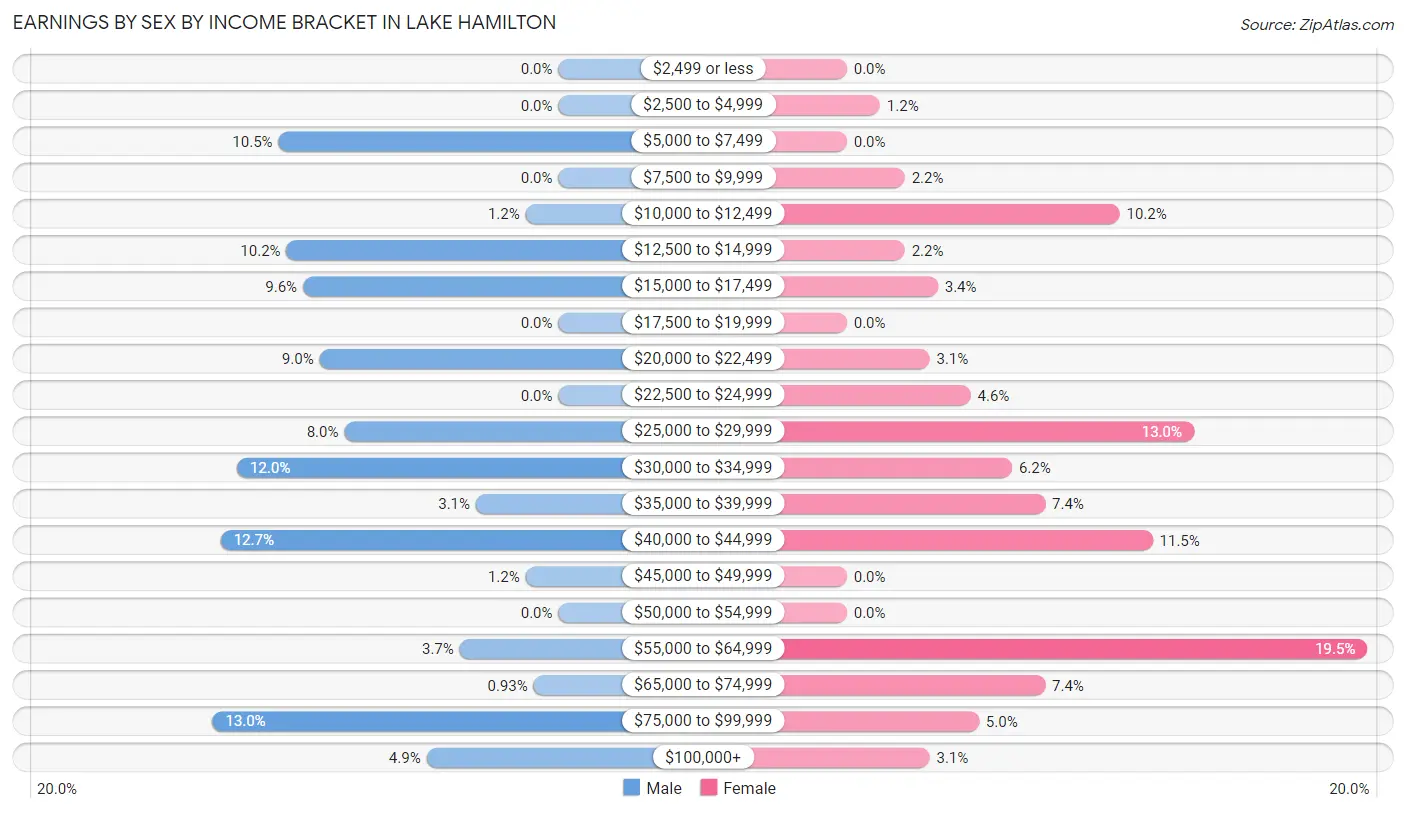
Earnings by Sex by Income Bracket in Lake Hamilton
The most common earnings brackets in Lake Hamilton are $75,000 to $99,999 for men (42 | 13.0%) and $55,000 to $64,999 for women (63 | 19.5%).
| Income | Male | Female |
| $2,499 or less | 0 (0.0%) | 0 (0.0%) |
| $2,500 to $4,999 | 0 (0.0%) | 4 (1.2%) |
| $5,000 to $7,499 | 34 (10.5%) | 0 (0.0%) |
| $7,500 to $9,999 | 0 (0.0%) | 7 (2.2%) |
| $10,000 to $12,499 | 4 (1.2%) | 33 (10.2%) |
| $12,500 to $14,999 | 33 (10.2%) | 7 (2.2%) |
| $15,000 to $17,499 | 31 (9.6%) | 11 (3.4%) |
| $17,500 to $19,999 | 0 (0.0%) | 0 (0.0%) |
| $20,000 to $22,499 | 29 (8.9%) | 10 (3.1%) |
| $22,500 to $24,999 | 0 (0.0%) | 15 (4.6%) |
| $25,000 to $29,999 | 26 (8.0%) | 42 (13.0%) |
| $30,000 to $34,999 | 39 (12.0%) | 20 (6.2%) |
| $35,000 to $39,999 | 10 (3.1%) | 24 (7.4%) |
| $40,000 to $44,999 | 41 (12.7%) | 37 (11.5%) |
| $45,000 to $49,999 | 4 (1.2%) | 0 (0.0%) |
| $50,000 to $54,999 | 0 (0.0%) | 0 (0.0%) |
| $55,000 to $64,999 | 12 (3.7%) | 63 (19.5%) |
| $65,000 to $74,999 | 3 (0.9%) | 24 (7.4%) |
| $75,000 to $99,999 | 42 (13.0%) | 16 (5.0%) |
| $100,000+ | 16 (4.9%) | 10 (3.1%) |
| Total | 324 (100.0%) | 323 (100.0%) |
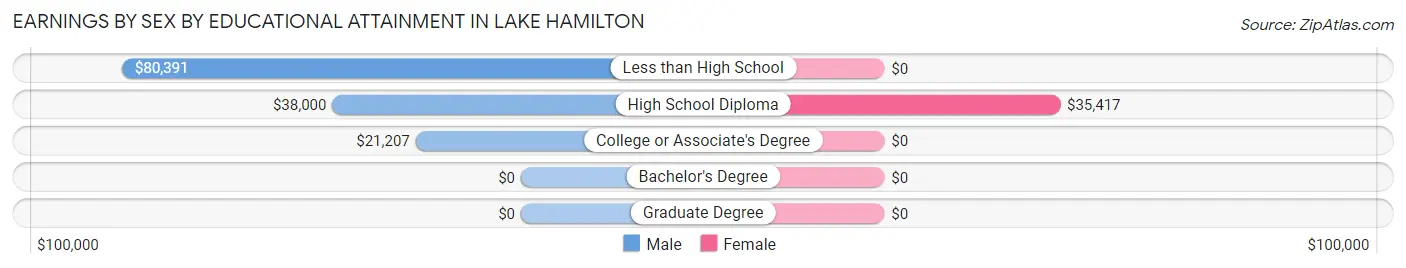
Earnings by Sex by Educational Attainment in Lake Hamilton
Average earnings in Lake Hamilton are $34,904 for men and $40,606 for women, a difference of 14.0%. Men with an educational attainment of less than high school enjoy the highest average annual earnings of $80,391, while those with college or associate's degree education earn the least with $21,207. Women with an educational attainment of high school diploma earn the most with the average annual earnings of $35,417, while those with high school diploma education have the smallest earnings of $35,417.
| Educational Attainment | Male Income | Female Income |
| Less than High School | $80,391 | $0 |
| High School Diploma | $38,000 | $35,417 |
| College or Associate's Degree | $21,207 | $0 |
| Bachelor's Degree | - | - |
| Graduate Degree | - | - |
| Total | $34,904 | $40,606 |
Family Income in Lake Hamilton
Family Income Brackets in Lake Hamilton
According to the Lake Hamilton family income data, there are 75 families falling into the $50,000 to $74,999 income range, which is the most common income bracket and makes up 17.8% of all families. Conversely, the $150,000 to $199,999 income bracket is the least frequent group with only 4 families (0.9%) belonging to this category.
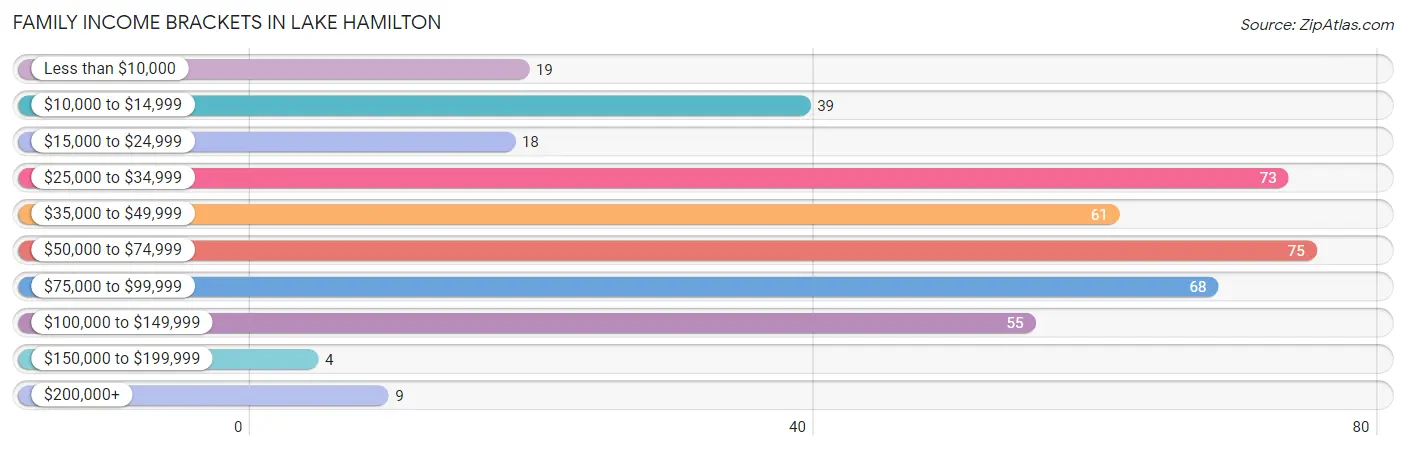
| Income Bracket | # Families | % Families |
| Less than $10,000 | 19 | 4.5% |
| $10,000 to $14,999 | 39 | 9.3% |
| $15,000 to $24,999 | 18 | 4.3% |
| $25,000 to $34,999 | 73 | 17.3% |
| $35,000 to $49,999 | 61 | 14.5% |
| $50,000 to $74,999 | 75 | 17.8% |
| $75,000 to $99,999 | 68 | 16.2% |
| $100,000 to $149,999 | 55 | 13.1% |
| $150,000 to $199,999 | 4 | 1.0% |
| $200,000+ | 9 | 2.1% |
Family Income by Famaliy Size in Lake Hamilton
4-person families (103 | 24.5%) account for the highest median family income in Lake Hamilton with $78,750 per family, while 2-person families (174 | 41.3%) have the highest median income of $21,184 per family member.
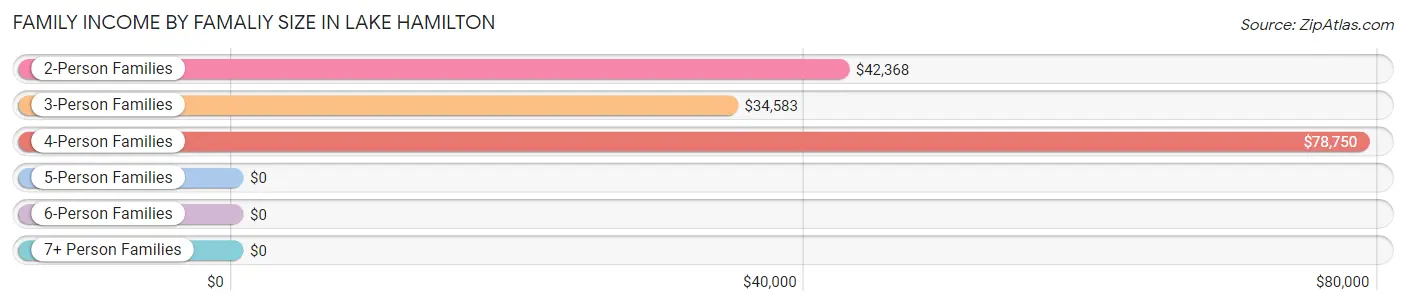
| Income Bracket | # Families | Median Income |
| 2-Person Families | 174 (41.3%) | $42,368 |
| 3-Person Families | 113 (26.8%) | $34,583 |
| 4-Person Families | 103 (24.5%) | $78,750 |
| 5-Person Families | 11 (2.6%) | $0 |
| 6-Person Families | 20 (4.8%) | $0 |
| 7+ Person Families | 0 (0.0%) | $0 |
| Total | 421 (100.0%) | $55,039 |
Family Income by Number of Earners in Lake Hamilton
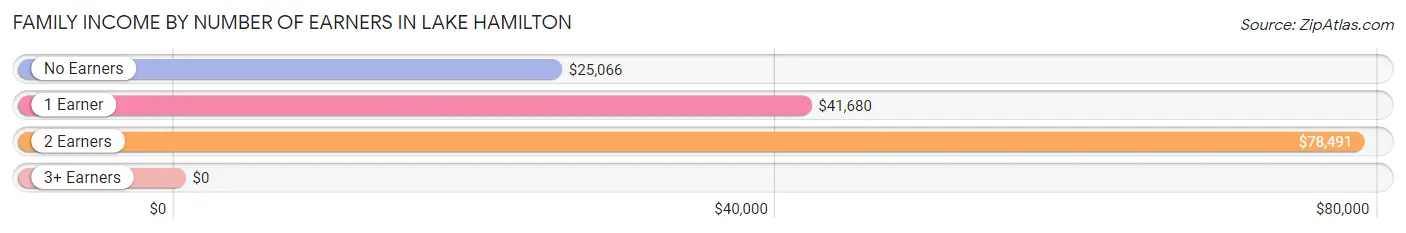
| Number of Earners | # Families | Median Income |
| No Earners | 97 (23.0%) | $25,066 |
| 1 Earner | 153 (36.3%) | $41,680 |
| 2 Earners | 129 (30.6%) | $78,491 |
| 3+ Earners | 42 (10.0%) | $0 |
| Total | 421 (100.0%) | $55,039 |
Household Income in Lake Hamilton
Household Income Brackets in Lake Hamilton
With 96 households falling in the category, the $25,000 to $34,999 income range is the most frequent in Lake Hamilton, accounting for 19.3% of all households. In contrast, only 4 households (0.8%) fall into the $150,000 to $199,999 income bracket, making it the least populous group.
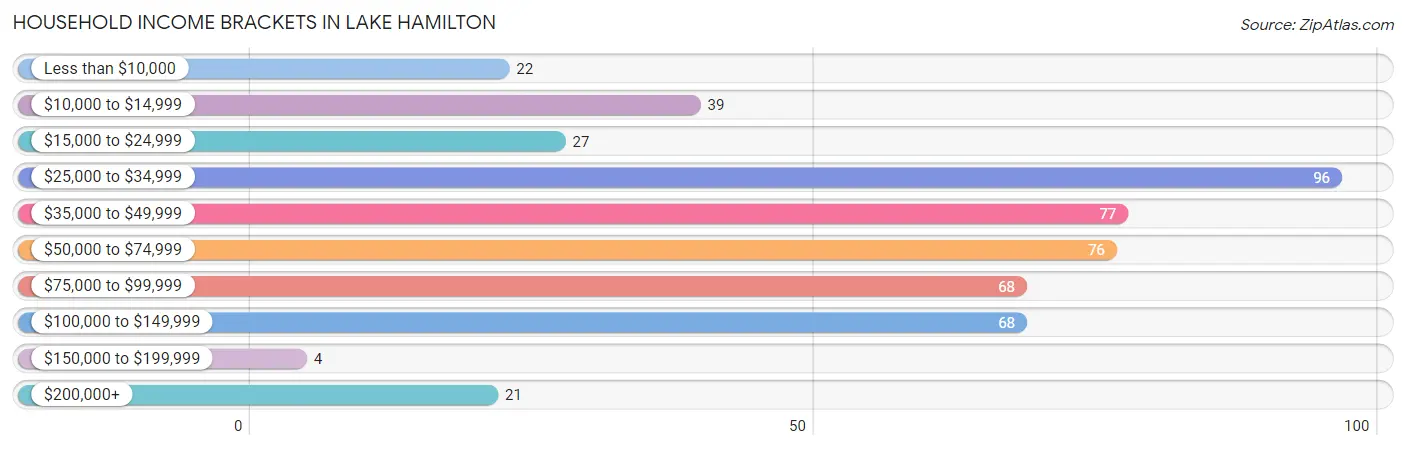
| Income Bracket | # Households | % Households |
| Less than $10,000 | 22 | 4.4% |
| $10,000 to $14,999 | 39 | 7.8% |
| $15,000 to $24,999 | 27 | 5.4% |
| $25,000 to $34,999 | 96 | 19.3% |
| $35,000 to $49,999 | 77 | 15.5% |
| $50,000 to $74,999 | 76 | 15.3% |
| $75,000 to $99,999 | 68 | 13.7% |
| $100,000 to $149,999 | 68 | 13.7% |
| $150,000 to $199,999 | 4 | 0.8% |
| $200,000+ | 21 | 4.2% |
Household Income by Householder Age in Lake Hamilton
The median household income in Lake Hamilton is $47,692, with the highest median household income of $61,477 found in the 45 to 64 years age bracket for the primary householder. A total of 211 households (42.4%) fall into this category. Meanwhile, the 15 to 24 years age bracket for the primary householder has the lowest median household income of $0, with 26 households (5.2%) in this group.
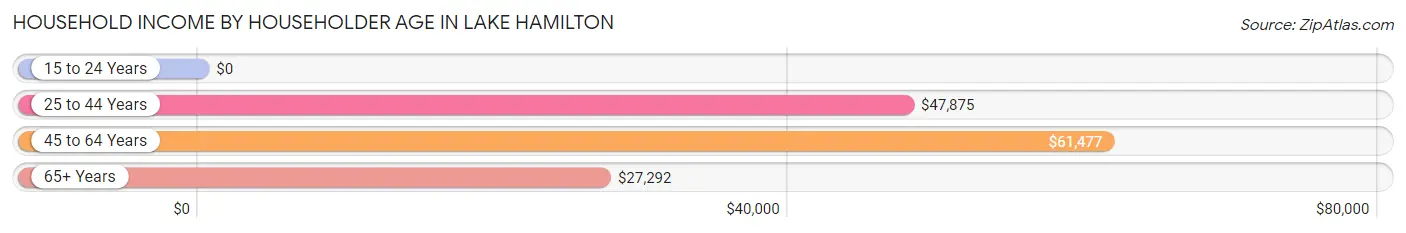
| Income Bracket | # Households | Median Income |
| 15 to 24 Years | 26 (5.2%) | $0 |
| 25 to 44 Years | 141 (28.3%) | $47,875 |
| 45 to 64 Years | 211 (42.4%) | $61,477 |
| 65+ Years | 120 (24.1%) | $27,292 |
| Total | 498 (100.0%) | $47,692 |
Poverty in Lake Hamilton
Income Below Poverty by Sex and Age in Lake Hamilton
With 13.8% poverty level for males and 28.8% for females among the residents of Lake Hamilton, 12 to 14 year old males and 12 to 14 year old females are the most vulnerable to poverty, with 12 males (100.0%) and 12 females (100.0%) in their respective age groups living below the poverty level.
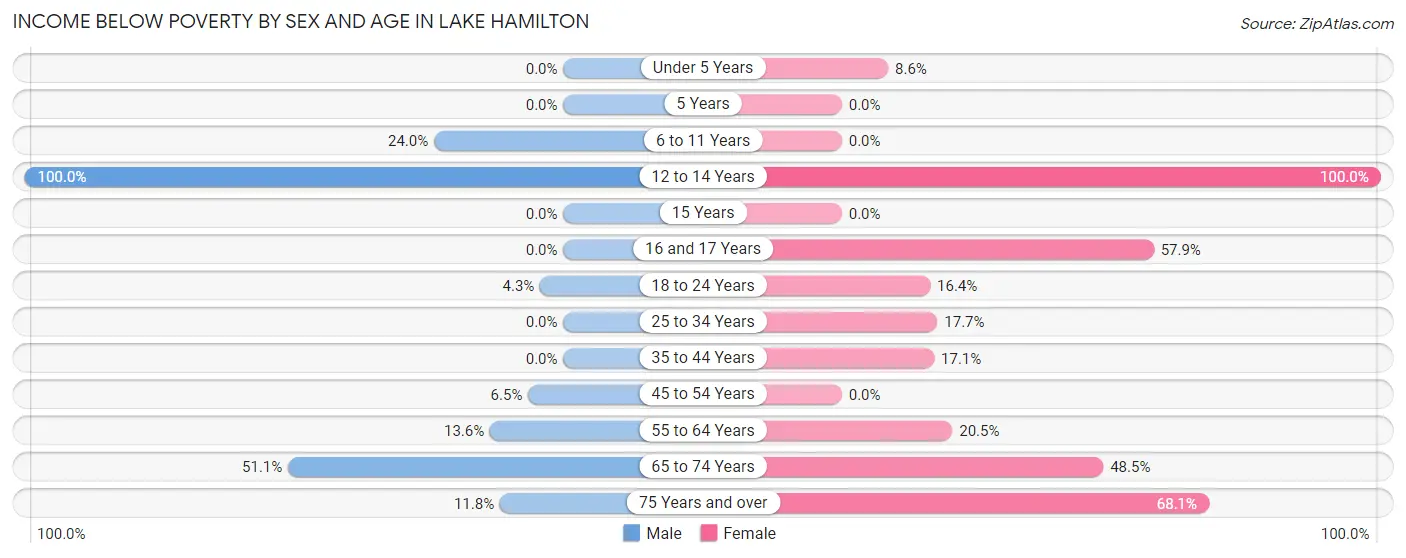
| Age Bracket | Male | Female |
| Under 5 Years | 0 (0.0%) | 8 (8.6%) |
| 5 Years | 0 (0.0%) | 0 (0.0%) |
| 6 to 11 Years | 12 (24.0%) | 0 (0.0%) |
| 12 to 14 Years | 12 (100.0%) | 12 (100.0%) |
| 15 Years | 0 (0.0%) | 0 (0.0%) |
| 16 and 17 Years | 0 (0.0%) | 22 (57.9%) |
| 18 to 24 Years | 4 (4.3%) | 10 (16.4%) |
| 25 to 34 Years | 0 (0.0%) | 11 (17.7%) |
| 35 to 44 Years | 0 (0.0%) | 18 (17.1%) |
| 45 to 54 Years | 3 (6.5%) | 0 (0.0%) |
| 55 to 64 Years | 17 (13.6%) | 16 (20.5%) |
| 65 to 74 Years | 47 (51.1%) | 33 (48.5%) |
| 75 Years and over | 6 (11.8%) | 124 (68.1%) |
| Total | 101 (13.8%) | 254 (28.8%) |
Income Above Poverty by Sex and Age in Lake Hamilton
According to the poverty statistics in Lake Hamilton, males aged under 5 years and females aged 5 years are the age groups that are most secure financially, with 100.0% of males and 100.0% of females in these age groups living above the poverty line.
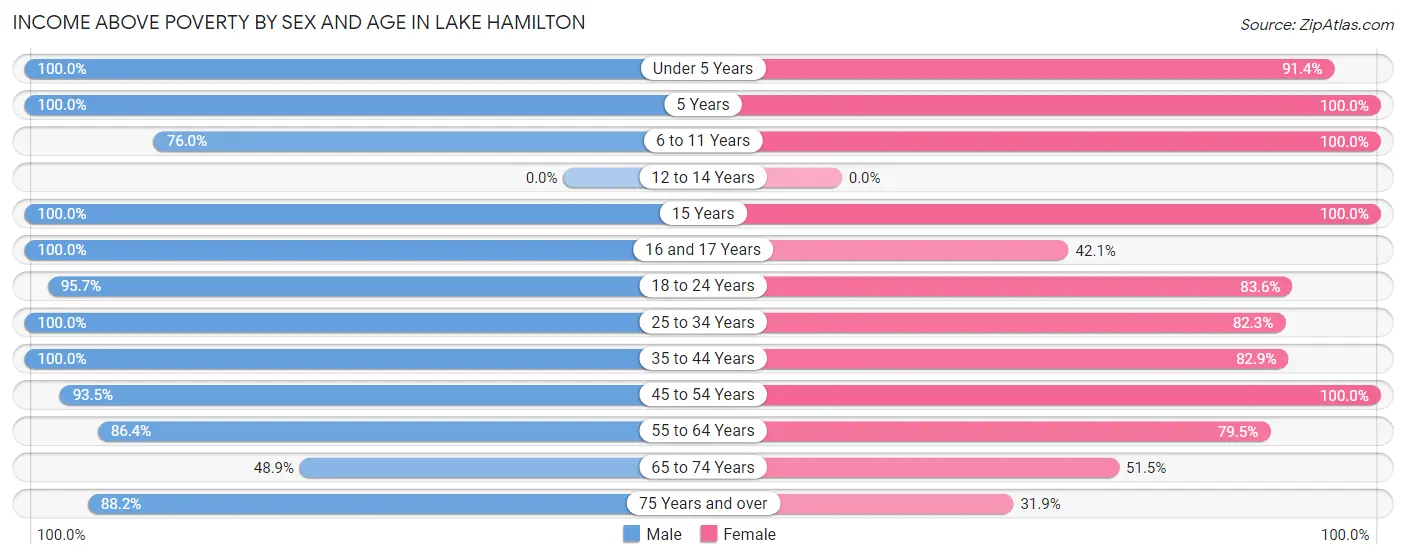
| Age Bracket | Male | Female |
| Under 5 Years | 40 (100.0%) | 85 (91.4%) |
| 5 Years | 4 (100.0%) | 3 (100.0%) |
| 6 to 11 Years | 38 (76.0%) | 45 (100.0%) |
| 12 to 14 Years | 0 (0.0%) | 0 (0.0%) |
| 15 Years | 33 (100.0%) | 12 (100.0%) |
| 16 and 17 Years | 23 (100.0%) | 16 (42.1%) |
| 18 to 24 Years | 89 (95.7%) | 51 (83.6%) |
| 25 to 34 Years | 64 (100.0%) | 51 (82.3%) |
| 35 to 44 Years | 99 (100.0%) | 87 (82.9%) |
| 45 to 54 Years | 43 (93.5%) | 122 (100.0%) |
| 55 to 64 Years | 108 (86.4%) | 62 (79.5%) |
| 65 to 74 Years | 45 (48.9%) | 35 (51.5%) |
| 75 Years and over | 45 (88.2%) | 58 (31.9%) |
| Total | 631 (86.2%) | 627 (71.2%) |
Income Below Poverty Among Married-Couple Families in Lake Hamilton
The poverty statistics for married-couple families in Lake Hamilton show that 19.6% or 48 of the total 245 families live below the poverty line. Families with 3 or 4 children have the highest poverty rate of 47.8%, comprising of 11 families. On the other hand, families with 1 or 2 children have the lowest poverty rate of 0.0%, which includes 0 families.
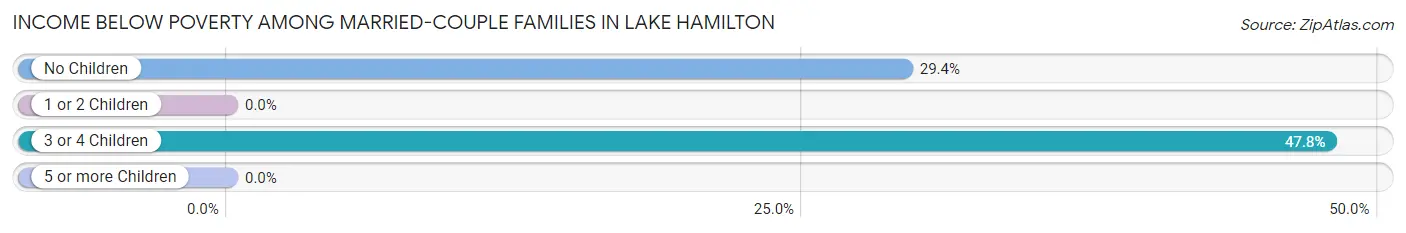
| Children | Above Poverty | Below Poverty |
| No Children | 89 (70.6%) | 37 (29.4%) |
| 1 or 2 Children | 96 (100.0%) | 0 (0.0%) |
| 3 or 4 Children | 12 (52.2%) | 11 (47.8%) |
| 5 or more Children | 0 (0.0%) | 0 (0.0%) |
| Total | 197 (80.4%) | 48 (19.6%) |
Income Below Poverty Among Single-Parent Households in Lake Hamilton
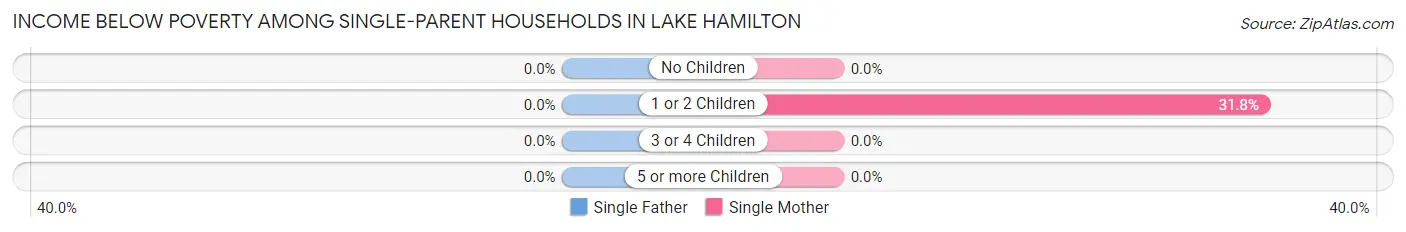
| Children | Single Father | Single Mother |
| No Children | 0 (0.0%) | 0 (0.0%) |
| 1 or 2 Children | 0 (0.0%) | 28 (31.8%) |
| 3 or 4 Children | 0 (0.0%) | 0 (0.0%) |
| 5 or more Children | 0 (0.0%) | 0 (0.0%) |
| Total | 0 (0.0%) | 28 (18.9%) |
Income Below Poverty Among Married-Couple vs Single-Parent Households in Lake Hamilton
The poverty data for Lake Hamilton shows that 48 of the married-couple family households (19.6%) and 28 of the single-parent households (15.9%) are living below the poverty level. Within the married-couple family households, those with 3 or 4 children have the highest poverty rate, with 11 households (47.8%) falling below the poverty line. Among the single-parent households, those with 1 or 2 children have the highest poverty rate, with 28 household (28.6%) living below poverty.
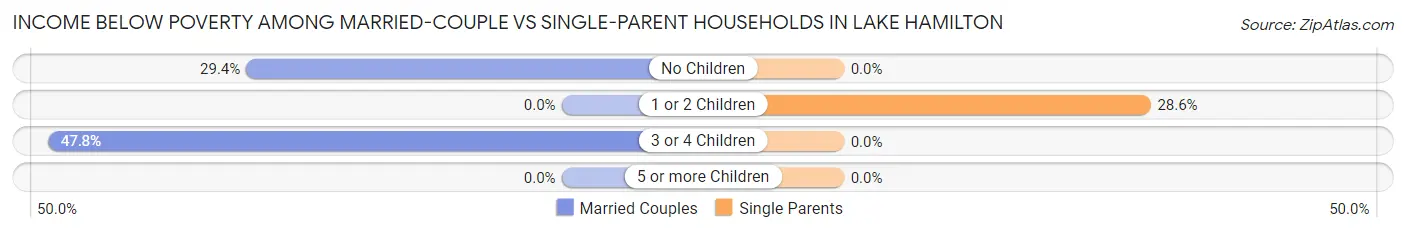
| Children | Married-Couple Families | Single-Parent Households |
| No Children | 37 (29.4%) | 0 (0.0%) |
| 1 or 2 Children | 0 (0.0%) | 28 (28.6%) |
| 3 or 4 Children | 11 (47.8%) | 0 (0.0%) |
| 5 or more Children | 0 (0.0%) | 0 (0.0%) |
| Total | 48 (19.6%) | 28 (15.9%) |
Race in Lake Hamilton
The most populous races in Lake Hamilton are White / Caucasian (918 | 56.9%), Hispanic or Latino (452 | 28.0%), and Some other Race (262 | 16.2%).
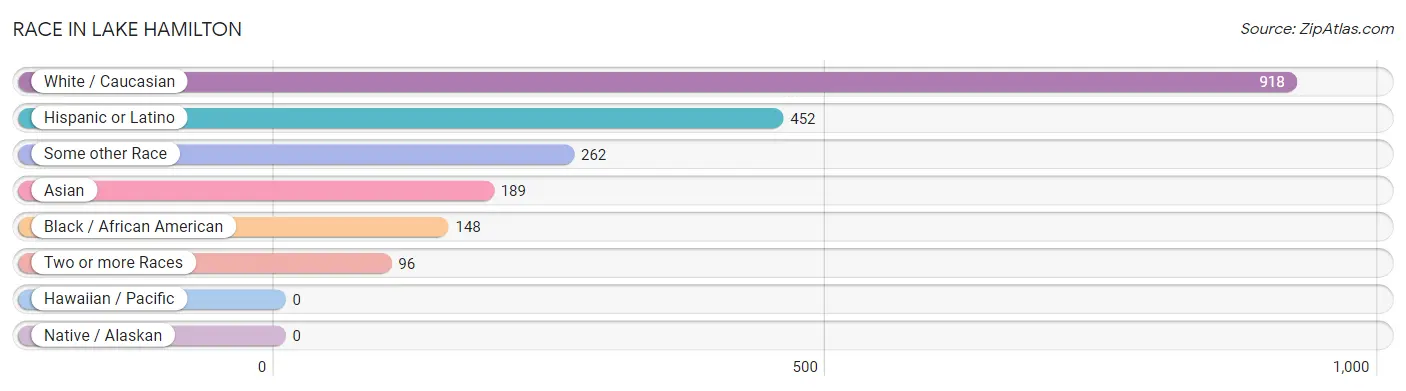
| Race | # Population | % Population |
| Asian | 189 | 11.7% |
| Black / African American | 148 | 9.2% |
| Hawaiian / Pacific | 0 | 0.0% |
| Hispanic or Latino | 452 | 28.0% |
| Native / Alaskan | 0 | 0.0% |
| White / Caucasian | 918 | 56.9% |
| Two or more Races | 96 | 5.9% |
| Some other Race | 262 | 16.2% |
| Total | 1,613 | 100.0% |
Ancestry in Lake Hamilton
The most populous ancestries reported in Lake Hamilton are American (557 | 34.5%), Puerto Rican (247 | 15.3%), Mexican (141 | 8.7%), Cherokee (37 | 2.3%), and Cuban (23 | 1.4%), together accounting for 62.3% of all Lake Hamilton residents.
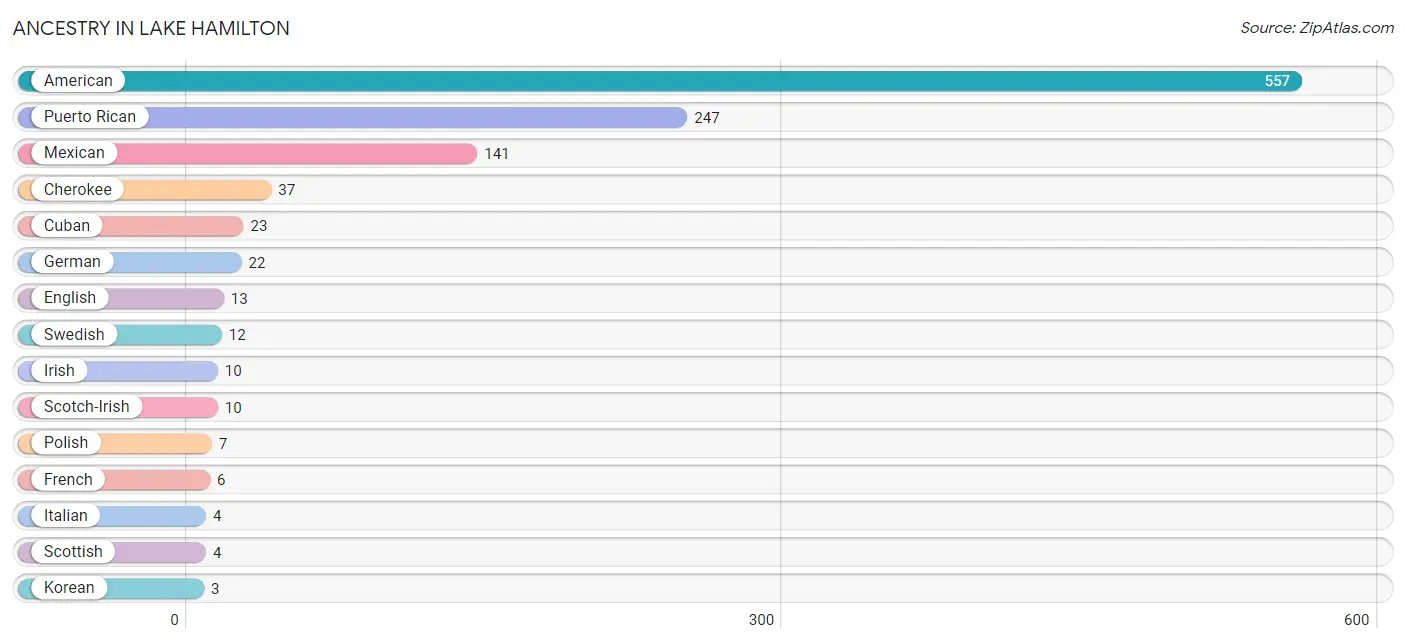
| Ancestry | # Population | % Population |
| American | 557 | 34.5% |
| Cherokee | 37 | 2.3% |
| Cuban | 23 | 1.4% |
| English | 13 | 0.8% |
| French | 6 | 0.4% |
| German | 22 | 1.4% |
| Irish | 10 | 0.6% |
| Italian | 4 | 0.3% |
| Korean | 3 | 0.2% |
| Lithuanian | 3 | 0.2% |
| Mexican | 141 | 8.7% |
| Polish | 7 | 0.4% |
| Puerto Rican | 247 | 15.3% |
| Scotch-Irish | 10 | 0.6% |
| Scottish | 4 | 0.3% |
| Swedish | 12 | 0.7% | View All 16 Rows |
Immigrants in Lake Hamilton
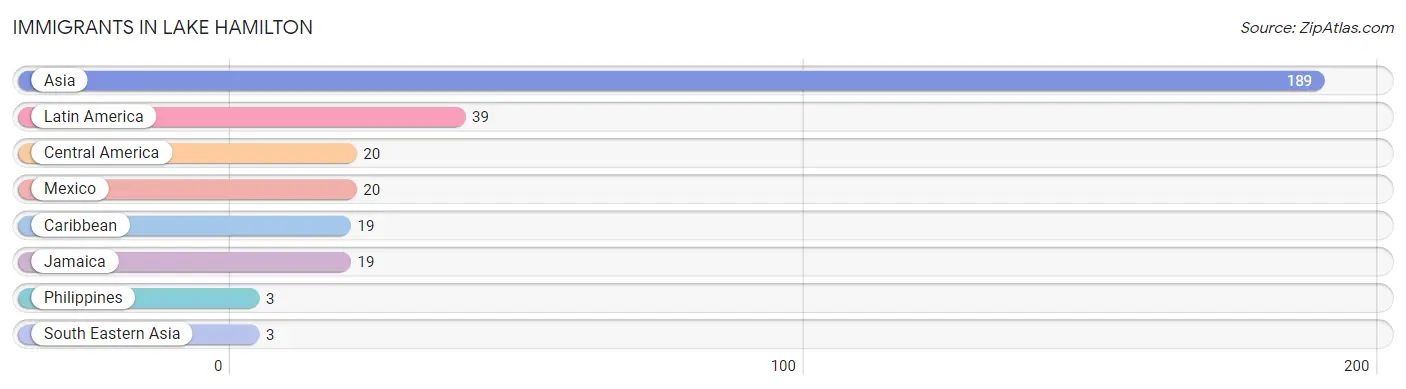
The most numerous immigrant groups reported in Lake Hamilton came from Asia (189 | 11.7%), Latin America (39 | 2.4%), Central America (20 | 1.2%), Mexico (20 | 1.2%), and Caribbean (19 | 1.2%), together accounting for 17.8% of all Lake Hamilton residents.
| Immigration Origin | # Population | % Population |
| Asia | 189 | 11.7% |
| Caribbean | 19 | 1.2% |
| Central America | 20 | 1.2% |
| Jamaica | 19 | 1.2% |
| Latin America | 39 | 2.4% |
| Mexico | 20 | 1.2% |
| Philippines | 3 | 0.2% |
| South Eastern Asia | 3 | 0.2% | View All 8 Rows |
Sex and Age in Lake Hamilton
Sex and Age in Lake Hamilton
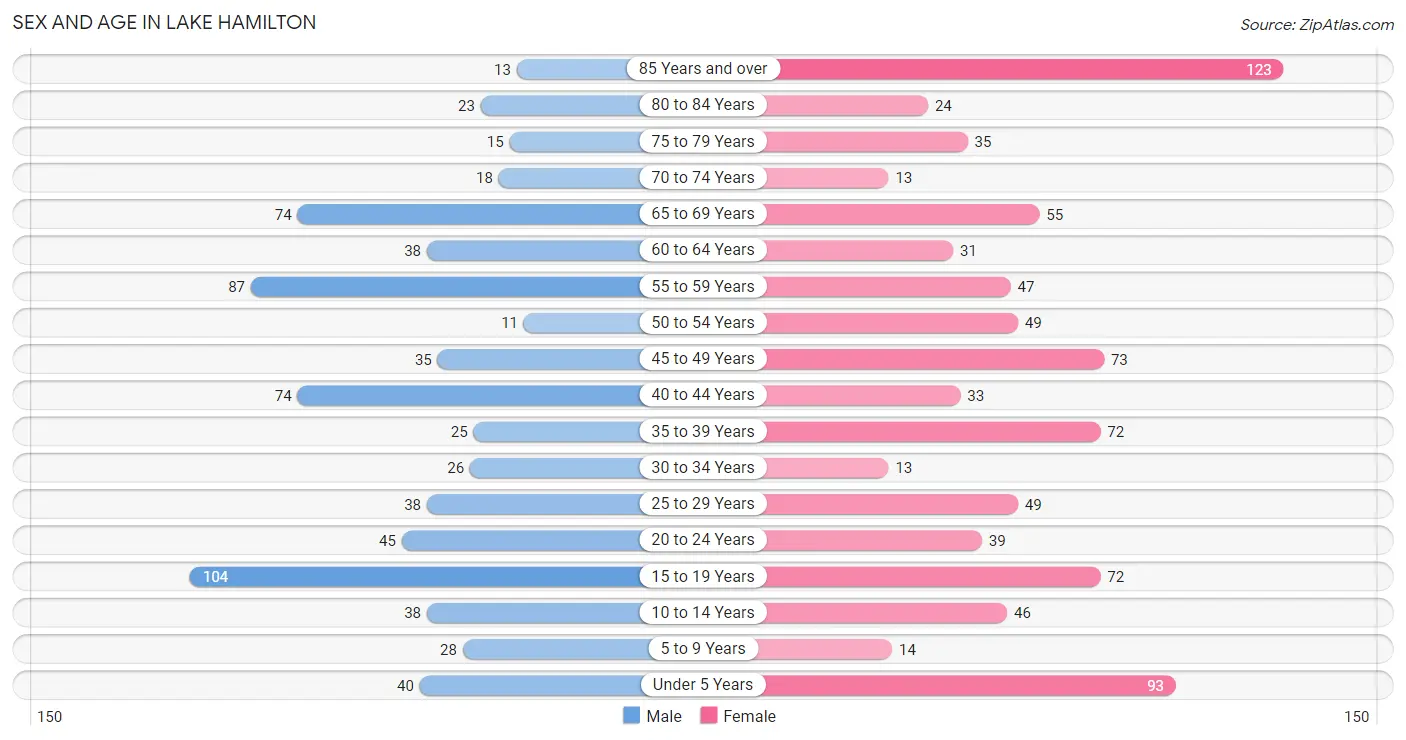
The most populous age groups in Lake Hamilton are 15 to 19 Years (104 | 14.2%) for men and 85 Years and over (123 | 14.0%) for women.
| Age Bracket | Male | Female |
| Under 5 Years | 40 (5.5%) | 93 (10.6%) |
| 5 to 9 Years | 28 (3.8%) | 14 (1.6%) |
| 10 to 14 Years | 38 (5.2%) | 46 (5.2%) |
| 15 to 19 Years | 104 (14.2%) | 72 (8.2%) |
| 20 to 24 Years | 45 (6.1%) | 39 (4.4%) |
| 25 to 29 Years | 38 (5.2%) | 49 (5.6%) |
| 30 to 34 Years | 26 (3.5%) | 13 (1.5%) |
| 35 to 39 Years | 25 (3.4%) | 72 (8.2%) |
| 40 to 44 Years | 74 (10.1%) | 33 (3.7%) |
| 45 to 49 Years | 35 (4.8%) | 73 (8.3%) |
| 50 to 54 Years | 11 (1.5%) | 49 (5.6%) |
| 55 to 59 Years | 87 (11.9%) | 47 (5.3%) |
| 60 to 64 Years | 38 (5.2%) | 31 (3.5%) |
| 65 to 69 Years | 74 (10.1%) | 55 (6.2%) |
| 70 to 74 Years | 18 (2.5%) | 13 (1.5%) |
| 75 to 79 Years | 15 (2.1%) | 35 (4.0%) |
| 80 to 84 Years | 23 (3.1%) | 24 (2.7%) |
| 85 Years and over | 13 (1.8%) | 123 (14.0%) |
| Total | 732 (100.0%) | 881 (100.0%) |
Families and Households in Lake Hamilton
Median Family Size in Lake Hamilton
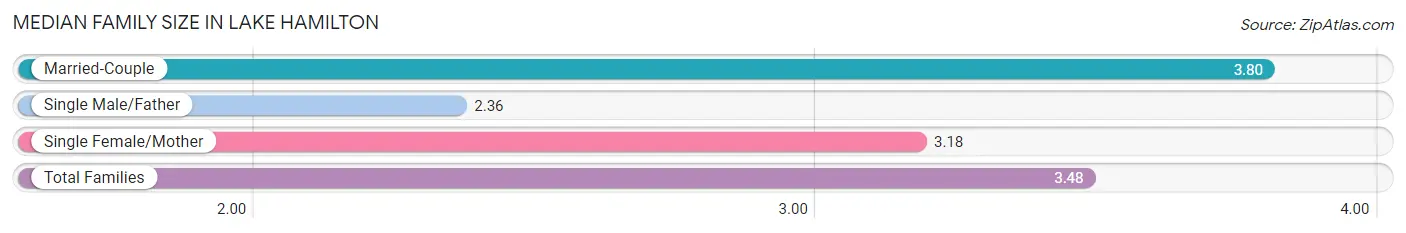
The median family size in Lake Hamilton is 3.48 persons per family, with married-couple families (245 | 58.2%) accounting for the largest median family size of 3.8 persons per family. On the other hand, single male/father families (28 | 6.7%) represent the smallest median family size with 2.36 persons per family.
| Family Type | # Families | Family Size |
| Married-Couple | 245 (58.2%) | 3.80 |
| Single Male/Father | 28 (6.7%) | 2.36 |
| Single Female/Mother | 148 (35.1%) | 3.18 |
| Total Families | 421 (100.0%) | 3.48 |
Median Household Size in Lake Hamilton
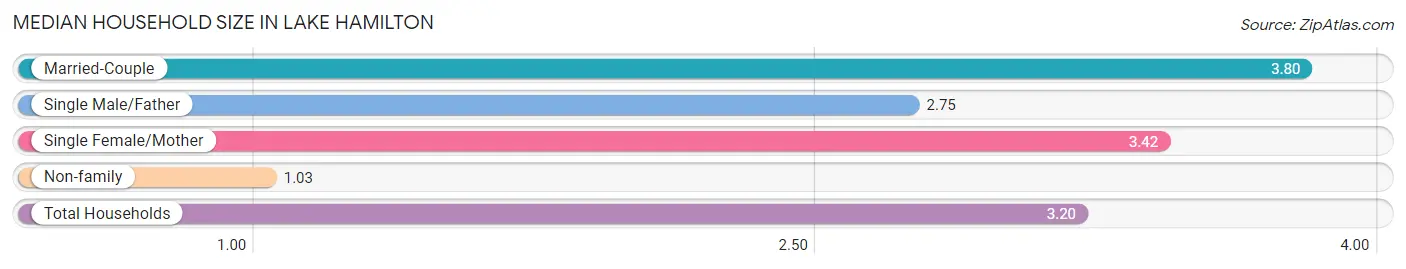
The median household size in Lake Hamilton is 3.20 persons per household, with married-couple households (245 | 49.2%) accounting for the largest median household size of 3.8 persons per household. non-family households (77 | 15.5%) represent the smallest median household size with 1.03 persons per household.
| Household Type | # Households | Household Size |
| Married-Couple | 245 (49.2%) | 3.80 |
| Single Male/Father | 28 (5.6%) | 2.75 |
| Single Female/Mother | 148 (29.7%) | 3.42 |
| Non-family | 77 (15.5%) | 1.03 |
| Total Households | 498 (100.0%) | 3.20 |
Household Size by Marriage Status in Lake Hamilton
Out of a total of 498 households in Lake Hamilton, 421 (84.5%) are family households, while 77 (15.5%) are nonfamily households. The most numerous type of family households are 2-person households, comprising 153, and the most common type of nonfamily households are 1-person households, comprising 74.
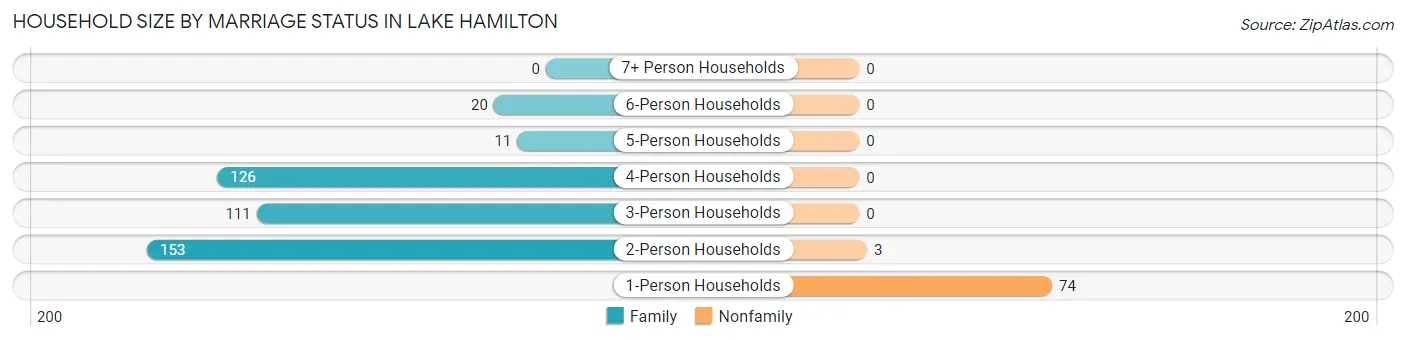
| Household Size | Family Households | Nonfamily Households |
| 1-Person Households | - | 74 (14.9%) |
| 2-Person Households | 153 (30.7%) | 3 (0.6%) |
| 3-Person Households | 111 (22.3%) | 0 (0.0%) |
| 4-Person Households | 126 (25.3%) | 0 (0.0%) |
| 5-Person Households | 11 (2.2%) | 0 (0.0%) |
| 6-Person Households | 20 (4.0%) | 0 (0.0%) |
| 7+ Person Households | 0 (0.0%) | 0 (0.0%) |
| Total | 421 (84.5%) | 77 (15.5%) |
Female Fertility in Lake Hamilton
Fertility by Age in Lake Hamilton
Average fertility rate in Lake Hamilton is 87.0 births per 1,000 women. Women in the age bracket of 20 to 34 years have the highest fertility rate with 149.0 births per 1,000 women. Women in the age bracket of 35 to 50 years acount for 54.5% of all women with births.
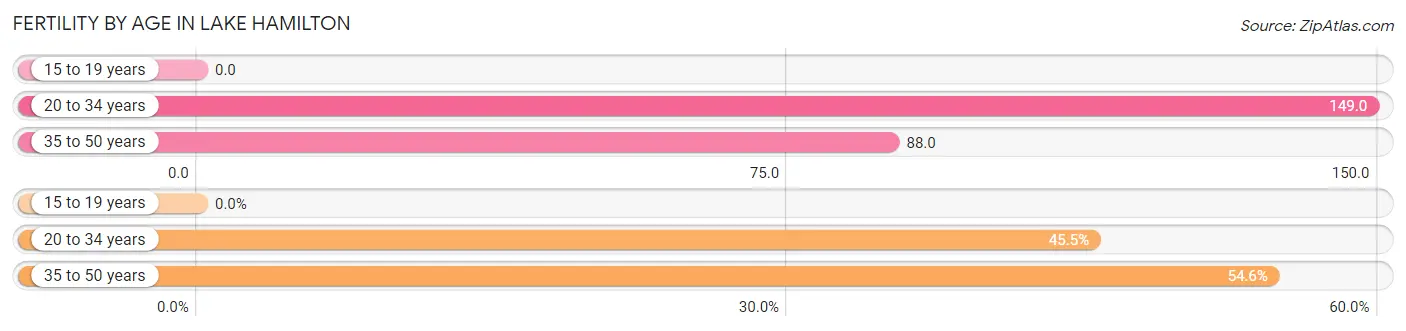
| Age Bracket | Women with Births | Births / 1,000 Women |
| 15 to 19 years | 0 (0.0%) | 0.0 |
| 20 to 34 years | 15 (45.5%) | 149.0 |
| 35 to 50 years | 18 (54.5%) | 88.0 |
| Total | 33 (100.0%) | 87.0 |
Fertility by Age by Marriage Status in Lake Hamilton
54.5% of women with births (33) in Lake Hamilton are married. The highest percentage of unmarried women with births falls into 20 to 34 years age bracket with 100.0% of them unmarried at the time of birth, while the lowest percentage of unmarried women with births belong to 35 to 50 years age bracket with 0.0% of them unmarried.
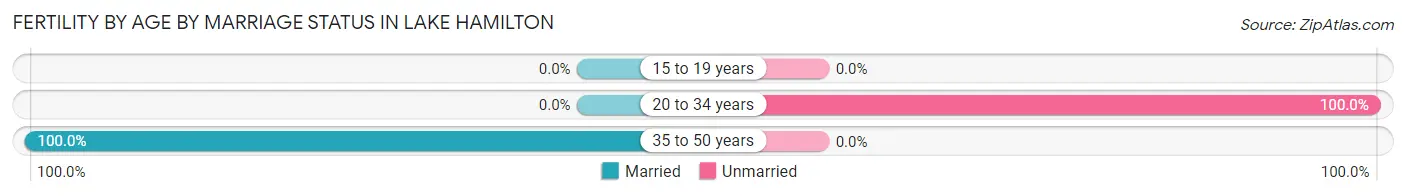
| Age Bracket | Married | Unmarried |
| 15 to 19 years | 0 (0.0%) | 0 (0.0%) |
| 20 to 34 years | 0 (0.0%) | 15 (100.0%) |
| 35 to 50 years | 18 (100.0%) | 0 (0.0%) |
| Total | 18 (54.5%) | 15 (45.5%) |
Fertility by Education in Lake Hamilton
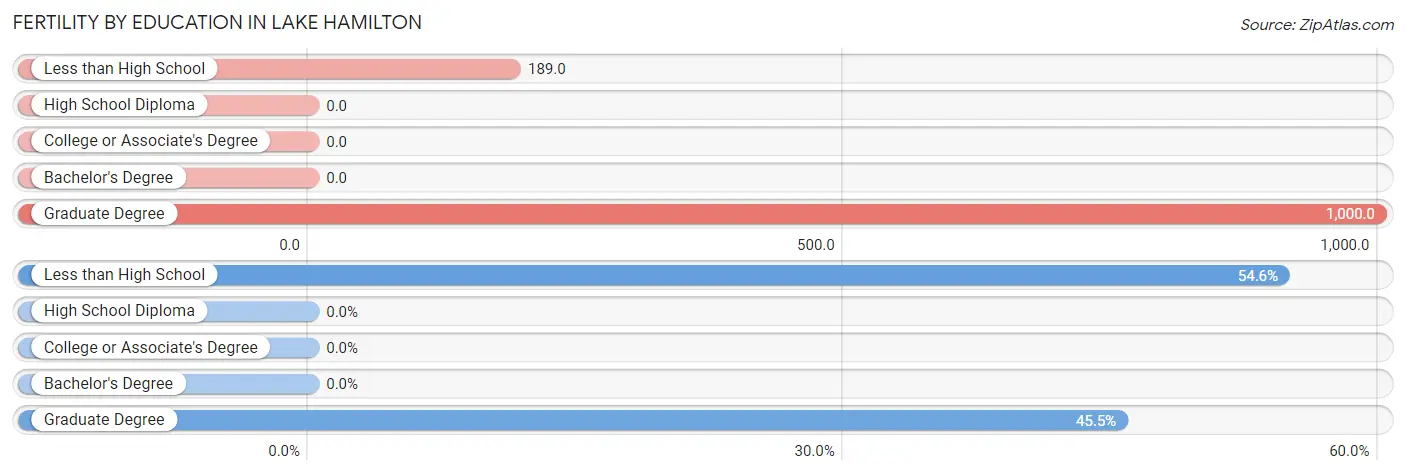
| Educational Attainment | Women with Births | Births / 1,000 Women |
| Less than High School | 18 (54.5%) | 189.0 |
| High School Diploma | 0 (0.0%) | 0.0 |
| College or Associate's Degree | 0 (0.0%) | 0.0 |
| Bachelor's Degree | 0 (0.0%) | 0.0 |
| Graduate Degree | 15 (45.5%) | 1,000.0 |
| Total | 33 (100.0%) | 87.0 |
Fertility by Education by Marriage Status in Lake Hamilton
45.5% of women with births in Lake Hamilton are unmarried. Women with the educational attainment of less than high school are most likely to be married with 100.0% of them married at childbirth, while women with the educational attainment of graduate degree are least likely to be married with 100.0% of them unmarried at childbirth.
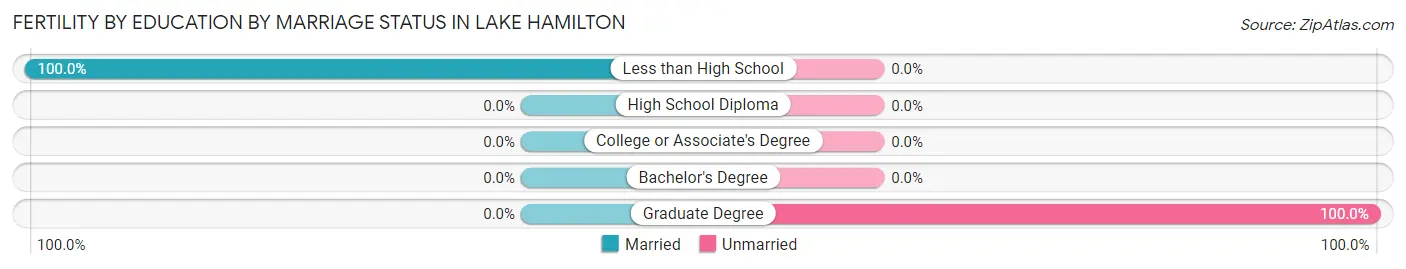
| Educational Attainment | Married | Unmarried |
| Less than High School | 18 (100.0%) | 0 (0.0%) |
| High School Diploma | 0 (0.0%) | 0 (0.0%) |
| College or Associate's Degree | 0 (0.0%) | 0 (0.0%) |
| Bachelor's Degree | 0 (0.0%) | 0 (0.0%) |
| Graduate Degree | 0 (0.0%) | 15 (100.0%) |
| Total | 18 (54.5%) | 15 (45.5%) |
Employment Characteristics in Lake Hamilton
Employment by Class of Employer in Lake Hamilton
Among the 647 employed individuals in Lake Hamilton, private company employees (542 | 83.8%), self-employed (not incorporated) (25 | 3.9%), and state government employees (25 | 3.9%) make up the most common classes of employment.
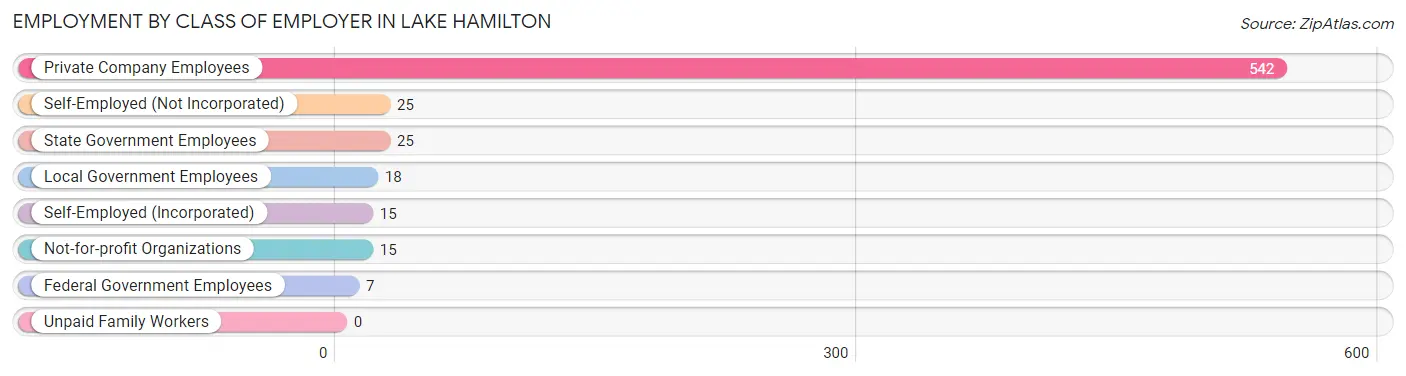
| Employer Class | # Employees | % Employees |
| Private Company Employees | 542 | 83.8% |
| Self-Employed (Incorporated) | 15 | 2.3% |
| Self-Employed (Not Incorporated) | 25 | 3.9% |
| Not-for-profit Organizations | 15 | 2.3% |
| Local Government Employees | 18 | 2.8% |
| State Government Employees | 25 | 3.9% |
| Federal Government Employees | 7 | 1.1% |
| Unpaid Family Workers | 0 | 0.0% |
| Total | 647 | 100.0% |
Employment Status by Age in Lake Hamilton
According to the labor force statistics for Lake Hamilton, out of the total population over 16 years of age (1,309), 49.7% or 651 individuals are in the labor force, with 0.6% or 4 of them unemployed. The age group with the highest labor force participation rate is 30 to 34 years, with 100.0% or 39 individuals in the labor force. Within the labor force, the 20 to 24 years age range has the highest percentage of unemployed individuals, with 5.2% or 4 of them being unemployed.
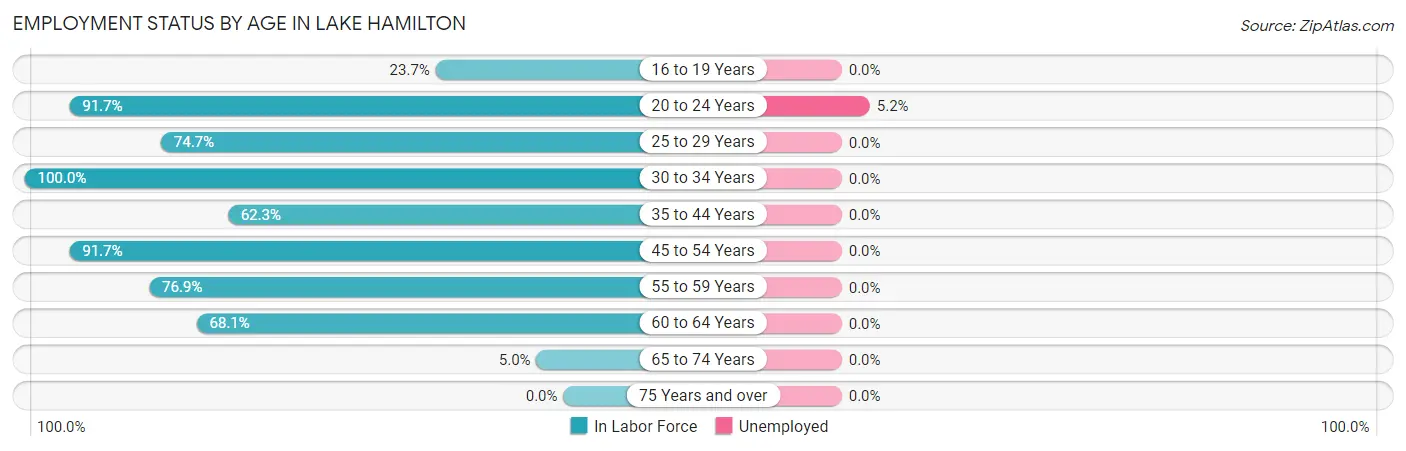
| Age Bracket | In Labor Force | Unemployed |
| 16 to 19 Years | 31 (23.7%) | 0 (0.0%) |
| 20 to 24 Years | 77 (91.7%) | 4 (5.2%) |
| 25 to 29 Years | 65 (74.7%) | 0 (0.0%) |
| 30 to 34 Years | 39 (100.0%) | 0 (0.0%) |
| 35 to 44 Years | 127 (62.3%) | 0 (0.0%) |
| 45 to 54 Years | 154 (91.7%) | 0 (0.0%) |
| 55 to 59 Years | 103 (76.9%) | 0 (0.0%) |
| 60 to 64 Years | 47 (68.1%) | 0 (0.0%) |
| 65 to 74 Years | 8 (5.0%) | 0 (0.0%) |
| 75 Years and over | 0 (0.0%) | 0 (0.0%) |
| Total | 651 (49.7%) | 4 (0.6%) |
Employment Status by Educational Attainment in Lake Hamilton
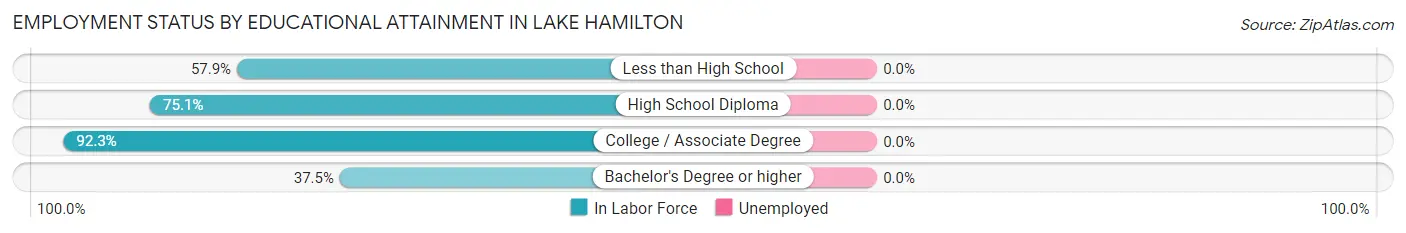
| Educational Attainment | In Labor Force | Unemployed |
| Less than High School | 44 (57.9%) | 0 (0.0%) |
| High School Diploma | 298 (75.1%) | 0 (0.0%) |
| College / Associate Degree | 181 (92.3%) | 0 (0.0%) |
| Bachelor's Degree or higher | 12 (37.5%) | 0 (0.0%) |
| Total | 535 (76.3%) | 0 (0.0%) |
Employment Occupations by Sex in Lake Hamilton
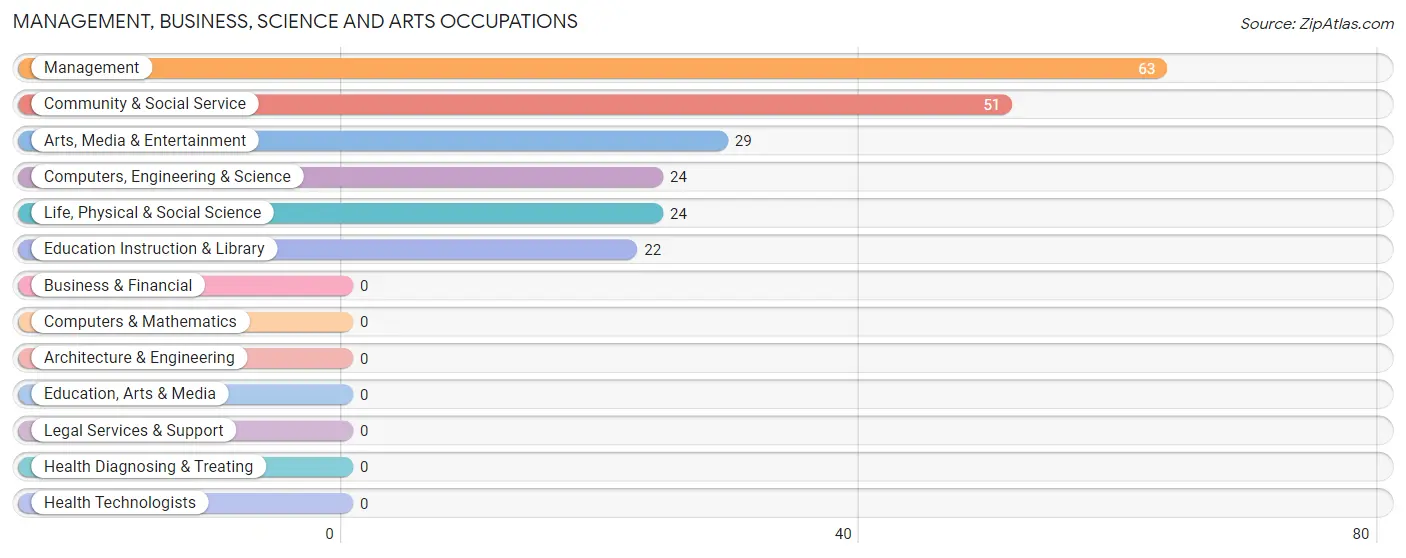
Management, Business, Science and Arts Occupations
The most common Management, Business, Science and Arts occupations in Lake Hamilton are Management (63 | 9.7%), Community & Social Service (51 | 7.9%), Arts, Media & Entertainment (29 | 4.5%), Computers, Engineering & Science (24 | 3.7%), and Life, Physical & Social Science (24 | 3.7%).
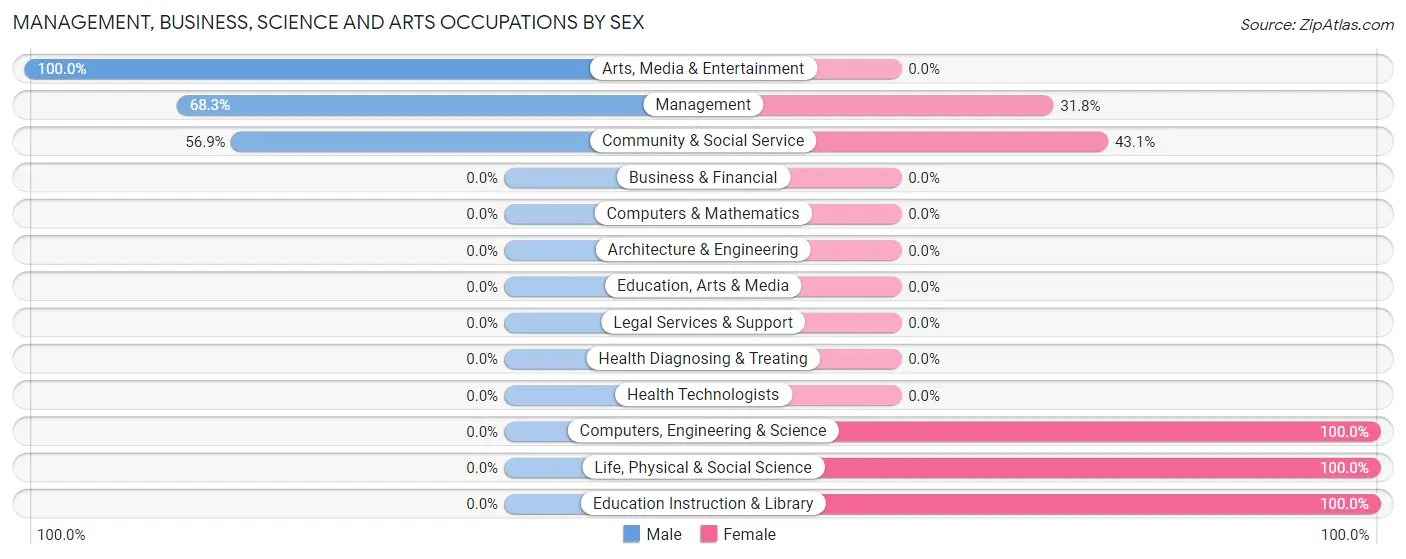
Management, Business, Science and Arts Occupations by Sex
Within the Management, Business, Science and Arts occupations in Lake Hamilton, the most male-oriented occupations are Arts, Media & Entertainment (100.0%), Management (68.2%), and Community & Social Service (56.9%), while the most female-oriented occupations are Computers, Engineering & Science (100.0%), Life, Physical & Social Science (100.0%), and Education Instruction & Library (100.0%).
| Occupation | Male | Female |
| Management | 43 (68.2%) | 20 (31.8%) |
| Business & Financial | 0 (0.0%) | 0 (0.0%) |
| Computers, Engineering & Science | 0 (0.0%) | 24 (100.0%) |
| Computers & Mathematics | 0 (0.0%) | 0 (0.0%) |
| Architecture & Engineering | 0 (0.0%) | 0 (0.0%) |
| Life, Physical & Social Science | 0 (0.0%) | 24 (100.0%) |
| Community & Social Service | 29 (56.9%) | 22 (43.1%) |
| Education, Arts & Media | 0 (0.0%) | 0 (0.0%) |
| Legal Services & Support | 0 (0.0%) | 0 (0.0%) |
| Education Instruction & Library | 0 (0.0%) | 22 (100.0%) |
| Arts, Media & Entertainment | 29 (100.0%) | 0 (0.0%) |
| Health Diagnosing & Treating | 0 (0.0%) | 0 (0.0%) |
| Health Technologists | 0 (0.0%) | 0 (0.0%) |
| Total (Category) | 72 (52.2%) | 66 (47.8%) |
| Total (Overall) | 324 (50.1%) | 323 (49.9%) |
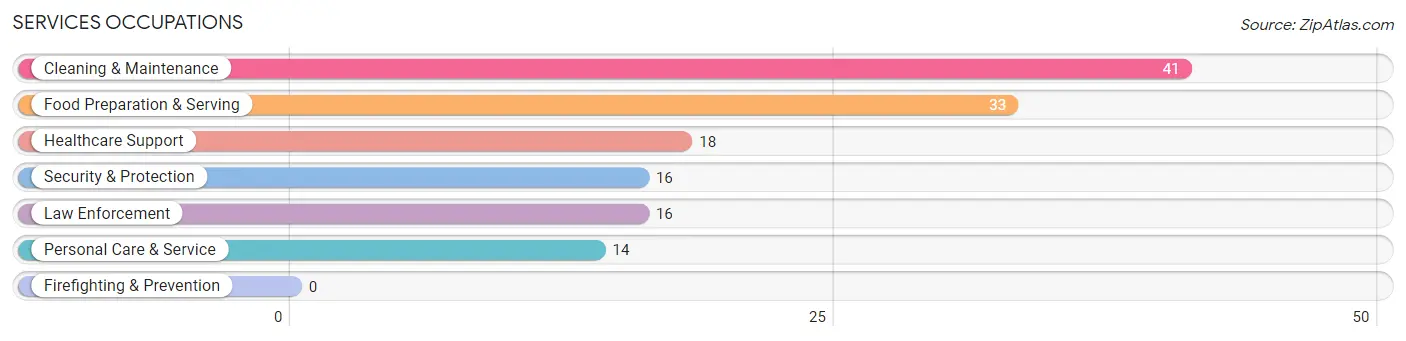
Services Occupations
The most common Services occupations in Lake Hamilton are Cleaning & Maintenance (41 | 6.3%), Food Preparation & Serving (33 | 5.1%), Healthcare Support (18 | 2.8%), Security & Protection (16 | 2.5%), and Law Enforcement (16 | 2.5%).
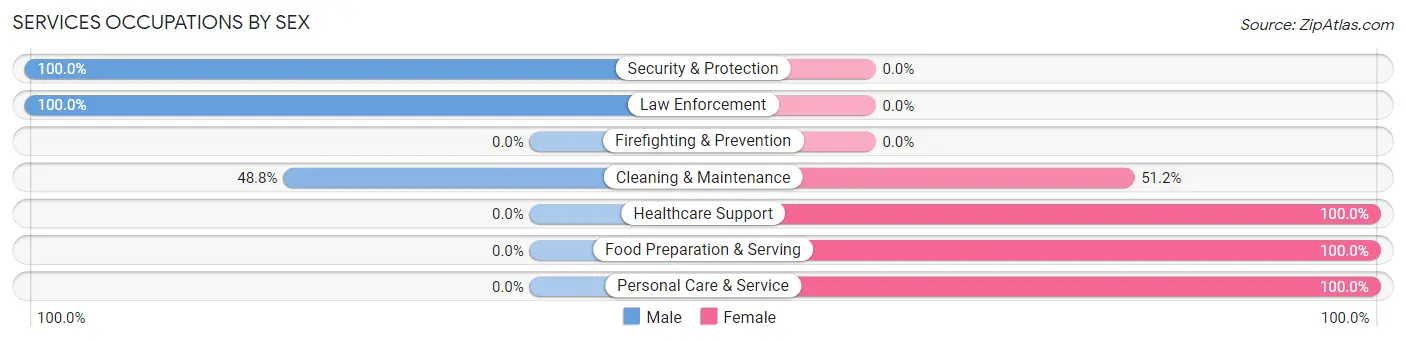
Services Occupations by Sex
Within the Services occupations in Lake Hamilton, the most male-oriented occupations are Security & Protection (100.0%), Law Enforcement (100.0%), and Cleaning & Maintenance (48.8%), while the most female-oriented occupations are Healthcare Support (100.0%), Food Preparation & Serving (100.0%), and Personal Care & Service (100.0%).
| Occupation | Male | Female |
| Healthcare Support | 0 (0.0%) | 18 (100.0%) |
| Security & Protection | 16 (100.0%) | 0 (0.0%) |
| Firefighting & Prevention | 0 (0.0%) | 0 (0.0%) |
| Law Enforcement | 16 (100.0%) | 0 (0.0%) |
| Food Preparation & Serving | 0 (0.0%) | 33 (100.0%) |
| Cleaning & Maintenance | 20 (48.8%) | 21 (51.2%) |
| Personal Care & Service | 0 (0.0%) | 14 (100.0%) |
| Total (Category) | 36 (29.5%) | 86 (70.5%) |
| Total (Overall) | 324 (50.1%) | 323 (49.9%) |
Sales and Office Occupations
The most common Sales and Office occupations in Lake Hamilton are Sales & Related (74 | 11.4%), and Office & Administration (72 | 11.1%).
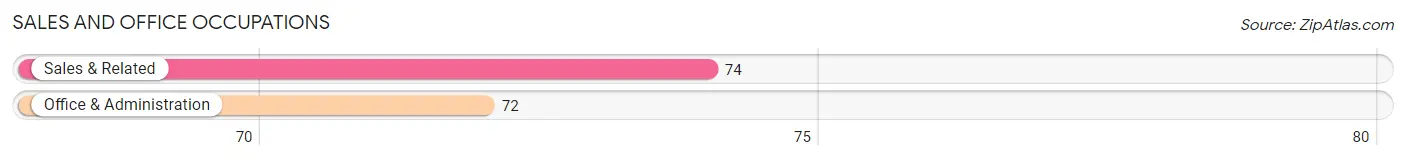
Sales and Office Occupations by Sex
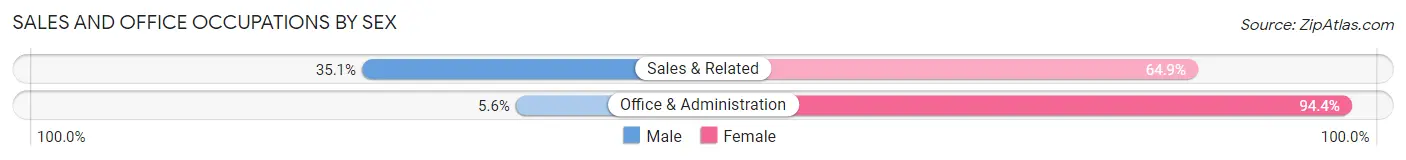
| Occupation | Male | Female |
| Sales & Related | 26 (35.1%) | 48 (64.9%) |
| Office & Administration | 4 (5.6%) | 68 (94.4%) |
| Total (Category) | 30 (20.5%) | 116 (79.4%) |
| Total (Overall) | 324 (50.1%) | 323 (49.9%) |
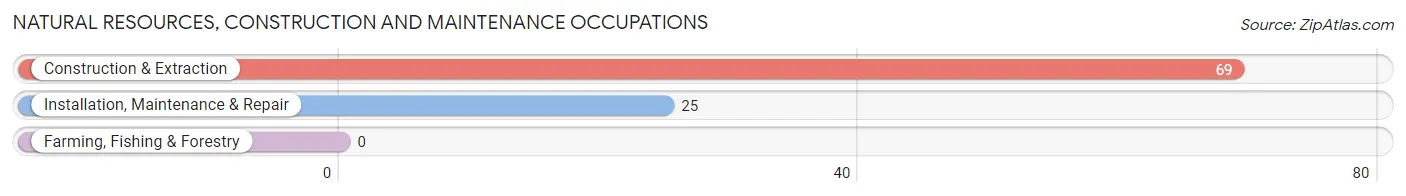
Natural Resources, Construction and Maintenance Occupations
The most common Natural Resources, Construction and Maintenance occupations in Lake Hamilton are Construction & Extraction (69 | 10.7%), and Installation, Maintenance & Repair (25 | 3.9%).
Natural Resources, Construction and Maintenance Occupations by Sex
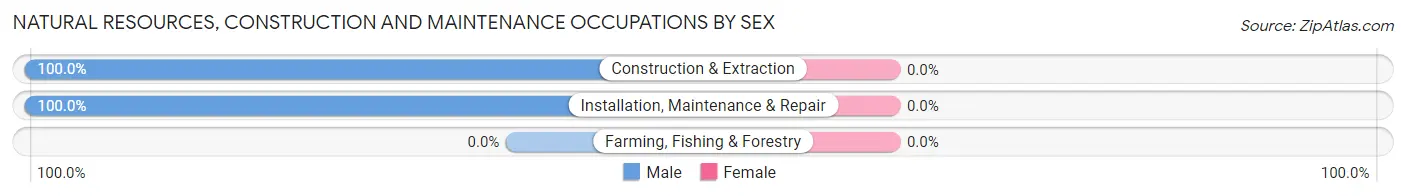
| Occupation | Male | Female |
| Farming, Fishing & Forestry | 0 (0.0%) | 0 (0.0%) |
| Construction & Extraction | 69 (100.0%) | 0 (0.0%) |
| Installation, Maintenance & Repair | 25 (100.0%) | 0 (0.0%) |
| Total (Category) | 94 (100.0%) | 0 (0.0%) |
| Total (Overall) | 324 (50.1%) | 323 (49.9%) |
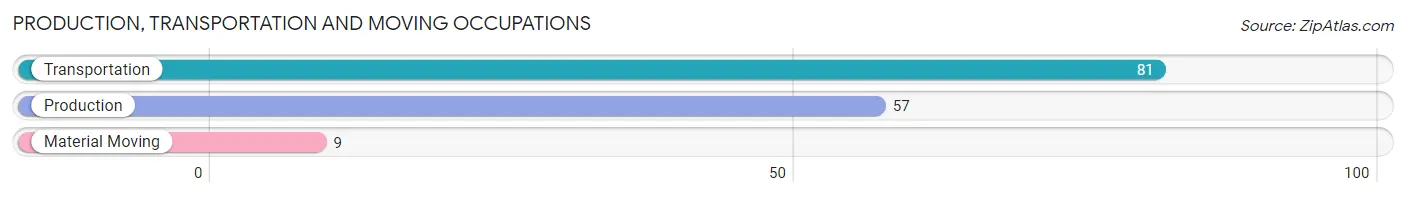
Production, Transportation and Moving Occupations
The most common Production, Transportation and Moving occupations in Lake Hamilton are Transportation (81 | 12.5%), Production (57 | 8.8%), and Material Moving (9 | 1.4%).
Production, Transportation and Moving Occupations by Sex
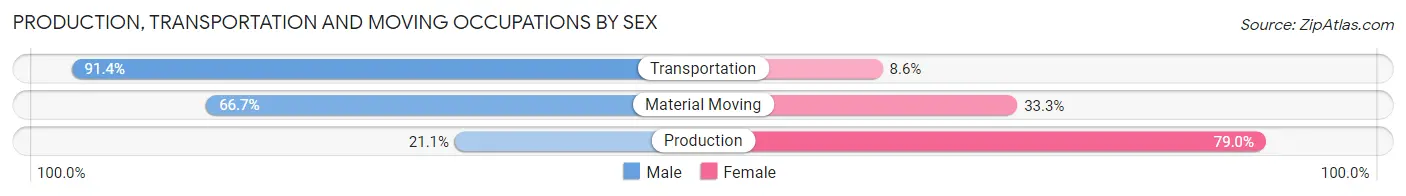
| Occupation | Male | Female |
| Production | 12 (21.0%) | 45 (78.9%) |
| Transportation | 74 (91.4%) | 7 (8.6%) |
| Material Moving | 6 (66.7%) | 3 (33.3%) |
| Total (Category) | 92 (62.6%) | 55 (37.4%) |
| Total (Overall) | 324 (50.1%) | 323 (49.9%) |
Employment Industries by Sex in Lake Hamilton
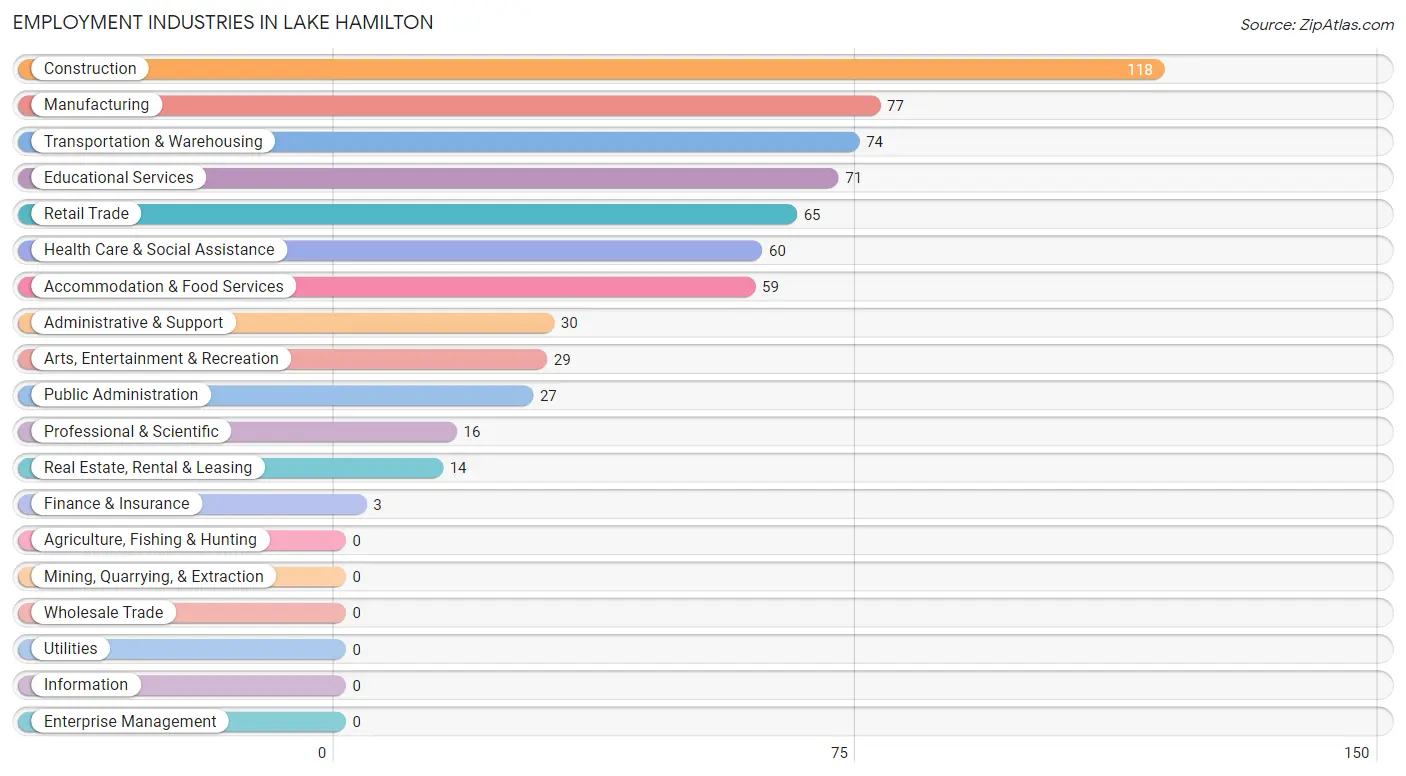
Employment Industries in Lake Hamilton
The major employment industries in Lake Hamilton include Construction (118 | 18.2%), Manufacturing (77 | 11.9%), Transportation & Warehousing (74 | 11.4%), Educational Services (71 | 11.0%), and Retail Trade (65 | 10.1%).
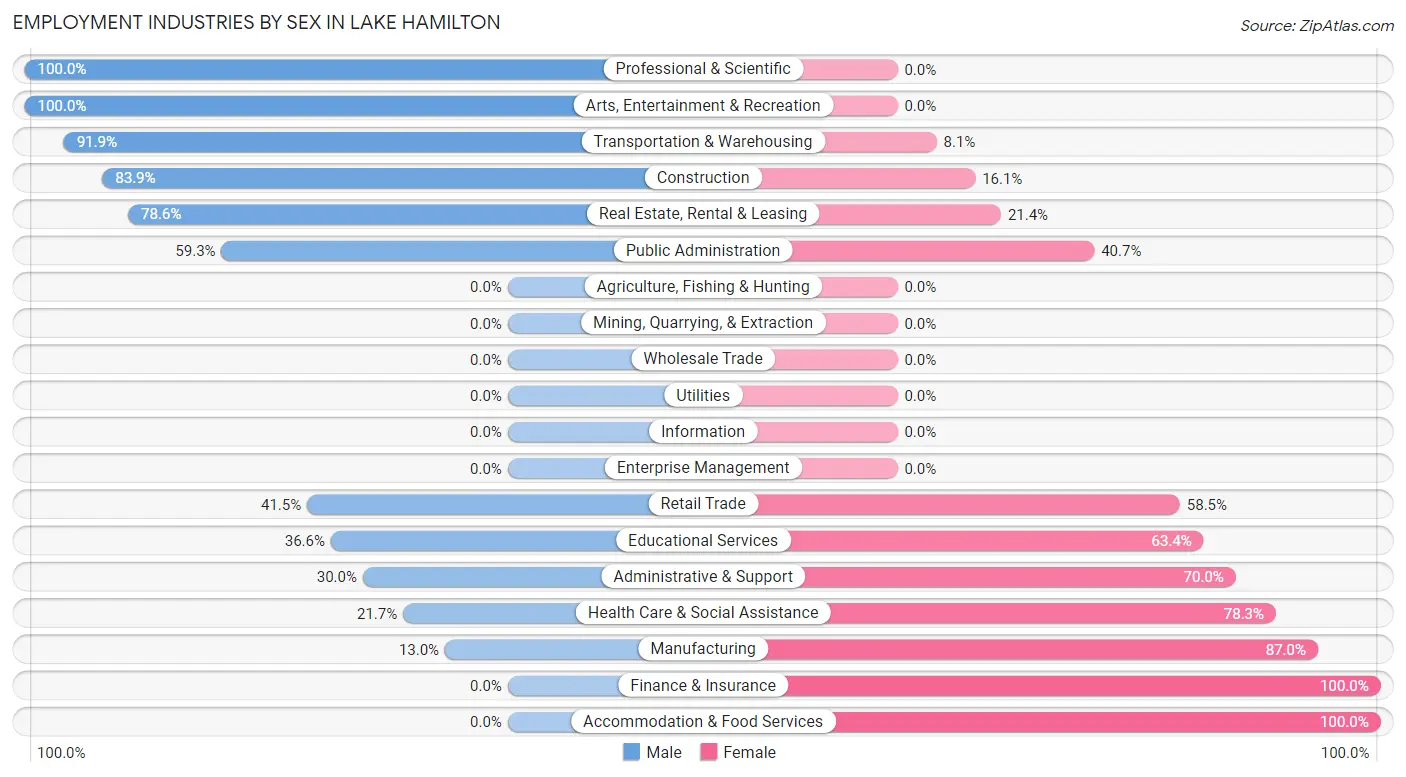
Employment Industries by Sex in Lake Hamilton
The Lake Hamilton industries that see more men than women are Professional & Scientific (100.0%), Arts, Entertainment & Recreation (100.0%), and Transportation & Warehousing (91.9%), whereas the industries that tend to have a higher number of women are Finance & Insurance (100.0%), Accommodation & Food Services (100.0%), and Manufacturing (87.0%).
| Industry | Male | Female |
| Agriculture, Fishing & Hunting | 0 (0.0%) | 0 (0.0%) |
| Mining, Quarrying, & Extraction | 0 (0.0%) | 0 (0.0%) |
| Construction | 99 (83.9%) | 19 (16.1%) |
| Manufacturing | 10 (13.0%) | 67 (87.0%) |
| Wholesale Trade | 0 (0.0%) | 0 (0.0%) |
| Retail Trade | 27 (41.5%) | 38 (58.5%) |
| Transportation & Warehousing | 68 (91.9%) | 6 (8.1%) |
| Utilities | 0 (0.0%) | 0 (0.0%) |
| Information | 0 (0.0%) | 0 (0.0%) |
| Finance & Insurance | 0 (0.0%) | 3 (100.0%) |
| Real Estate, Rental & Leasing | 11 (78.6%) | 3 (21.4%) |
| Professional & Scientific | 16 (100.0%) | 0 (0.0%) |
| Enterprise Management | 0 (0.0%) | 0 (0.0%) |
| Administrative & Support | 9 (30.0%) | 21 (70.0%) |
| Educational Services | 26 (36.6%) | 45 (63.4%) |
| Health Care & Social Assistance | 13 (21.7%) | 47 (78.3%) |
| Arts, Entertainment & Recreation | 29 (100.0%) | 0 (0.0%) |
| Accommodation & Food Services | 0 (0.0%) | 59 (100.0%) |
| Public Administration | 16 (59.3%) | 11 (40.7%) |
| Total | 324 (50.1%) | 323 (49.9%) |
Education in Lake Hamilton
School Enrollment in Lake Hamilton
The most common levels of schooling among the 336 students in Lake Hamilton are high school (113 | 33.6%), college / undergraduate (82 | 24.4%), and middle school (65 | 19.4%).
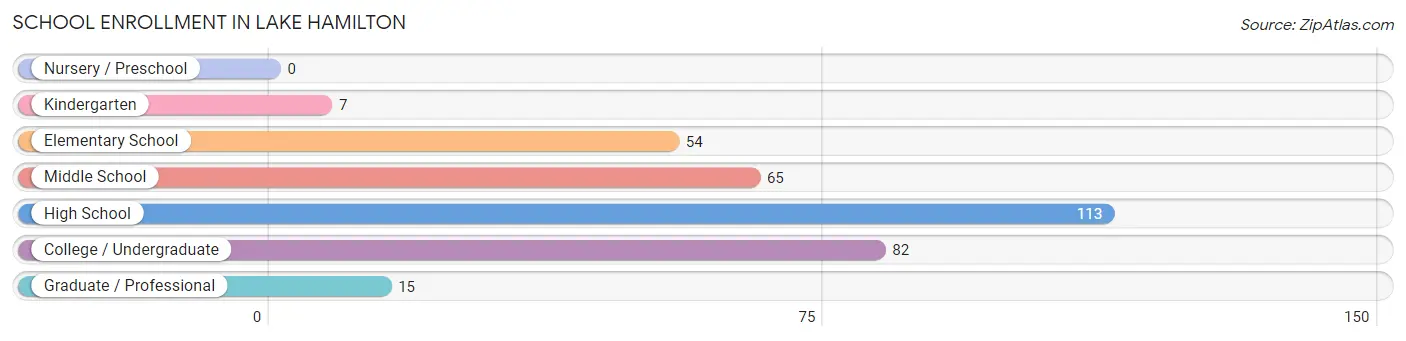
| School Level | # Students | % Students |
| Nursery / Preschool | 0 | 0.0% |
| Kindergarten | 7 | 2.1% |
| Elementary School | 54 | 16.1% |
| Middle School | 65 | 19.4% |
| High School | 113 | 33.6% |
| College / Undergraduate | 82 | 24.4% |
| Graduate / Professional | 15 | 4.5% |
| Total | 336 | 100.0% |
School Enrollment by Age by Funding Source in Lake Hamilton
Out of a total of 336 students who are enrolled in schools in Lake Hamilton, 27 (8.0%) attend a private institution, while the remaining 309 (92.0%) are enrolled in public schools. The age group of 25 to 34 year olds has the highest likelihood of being enrolled in private schools, with 11 (29.7% in the age bracket) enrolled. Conversely, the age group of 5 to 9 year old has the lowest likelihood of being enrolled in a private school, with 42 (100.0% in the age bracket) attending a public institution.
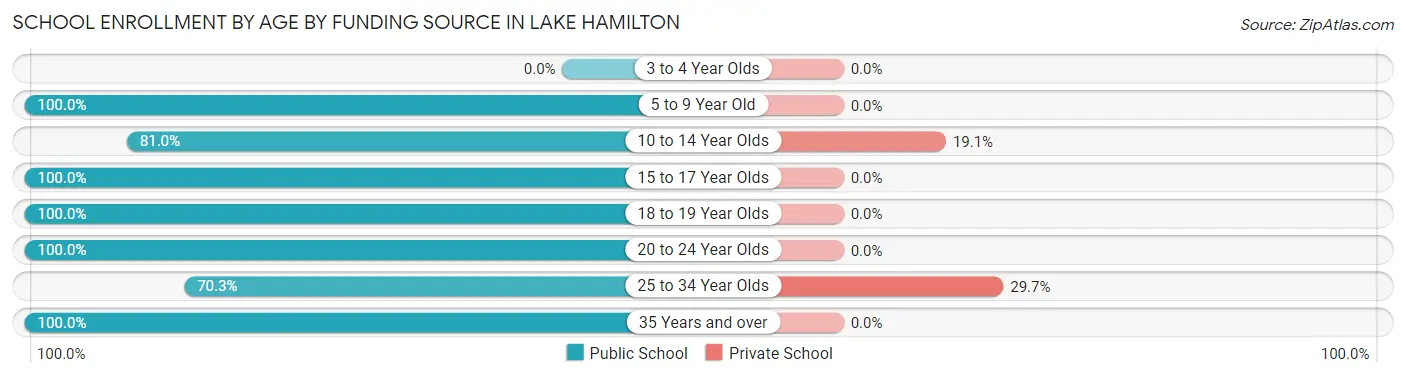
| Age Bracket | Public School | Private School |
| 3 to 4 Year Olds | 0 (0.0%) | 0 (0.0%) |
| 5 to 9 Year Old | 42 (100.0%) | 0 (0.0%) |
| 10 to 14 Year Olds | 68 (80.9%) | 16 (19.1%) |
| 15 to 17 Year Olds | 91 (100.0%) | 0 (0.0%) |
| 18 to 19 Year Olds | 66 (100.0%) | 0 (0.0%) |
| 20 to 24 Year Olds | 13 (100.0%) | 0 (0.0%) |
| 25 to 34 Year Olds | 26 (70.3%) | 11 (29.7%) |
| 35 Years and over | 3 (100.0%) | 0 (0.0%) |
| Total | 309 (92.0%) | 27 (8.0%) |
Educational Attainment by Field of Study in Lake Hamilton
Business (44 | 40.4%), education (44 | 40.4%), visual & performing arts (10 | 9.2%), engineering (6 | 5.5%), and computers & mathematics (5 | 4.6%) are the most common fields of study among 109 individuals in Lake Hamilton who have obtained a bachelor's degree or higher.
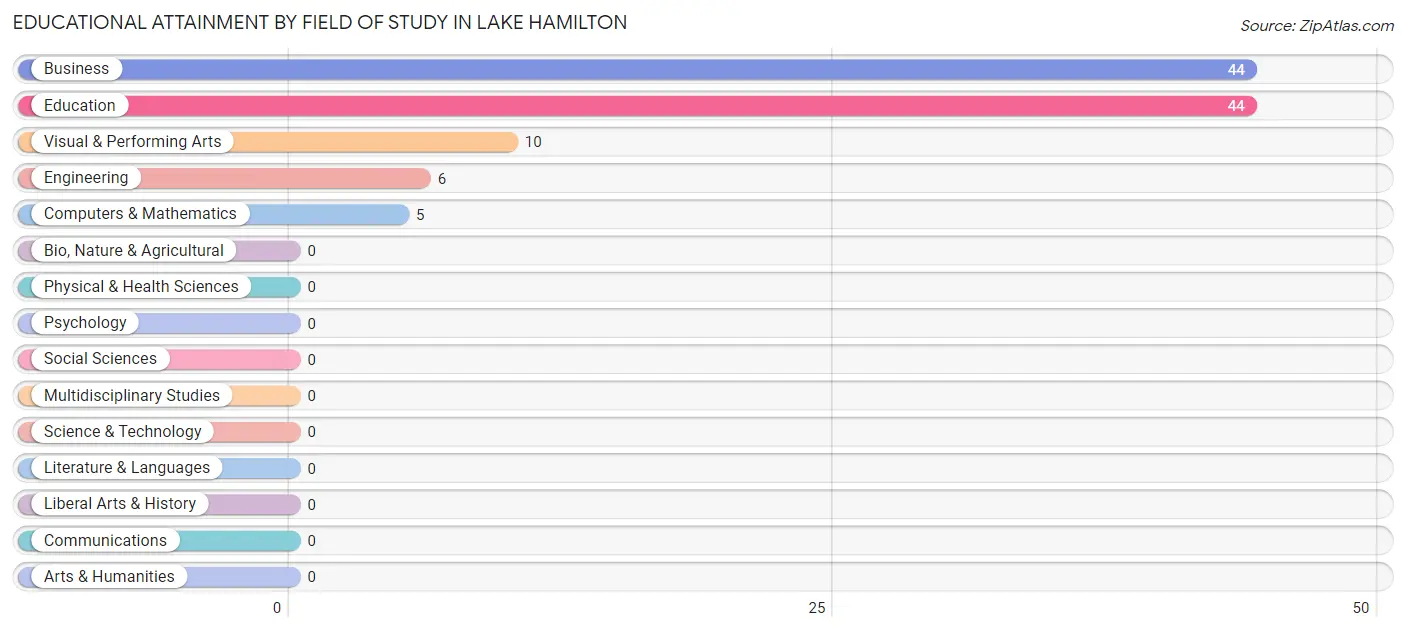
| Field of Study | # Graduates | % Graduates |
| Computers & Mathematics | 5 | 4.6% |
| Bio, Nature & Agricultural | 0 | 0.0% |
| Physical & Health Sciences | 0 | 0.0% |
| Psychology | 0 | 0.0% |
| Social Sciences | 0 | 0.0% |
| Engineering | 6 | 5.5% |
| Multidisciplinary Studies | 0 | 0.0% |
| Science & Technology | 0 | 0.0% |
| Business | 44 | 40.4% |
| Education | 44 | 40.4% |
| Literature & Languages | 0 | 0.0% |
| Liberal Arts & History | 0 | 0.0% |
| Visual & Performing Arts | 10 | 9.2% |
| Communications | 0 | 0.0% |
| Arts & Humanities | 0 | 0.0% |
| Total | 109 | 100.0% |
Transportation & Commute in Lake Hamilton
Vehicle Availability by Sex in Lake Hamilton
The most prevalent vehicle ownership categories in Lake Hamilton are males with 2 vehicles (180, accounting for 55.9%) and females with 2 vehicles (173, making up 56.6%).
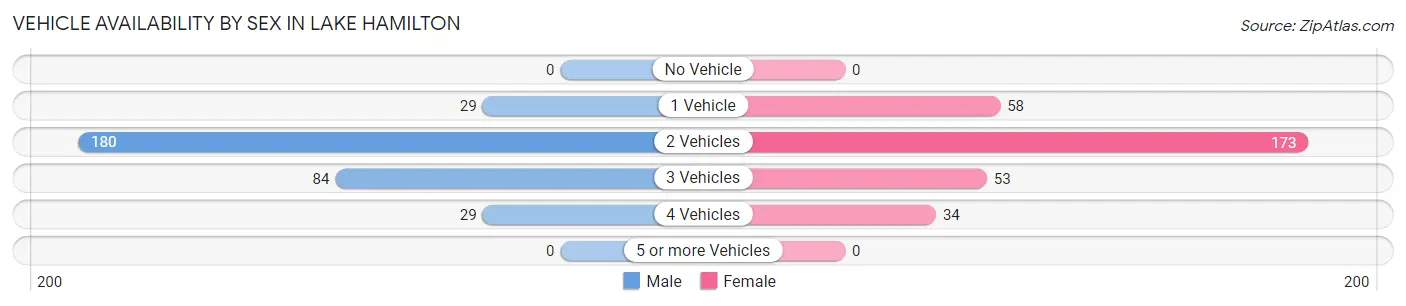
| Vehicles Available | Male | Female |
| No Vehicle | 0 (0.0%) | 0 (0.0%) |
| 1 Vehicle | 29 (9.0%) | 58 (18.2%) |
| 2 Vehicles | 180 (55.9%) | 173 (54.4%) |
| 3 Vehicles | 84 (26.1%) | 53 (16.7%) |
| 4 Vehicles | 29 (9.0%) | 34 (10.7%) |
| 5 or more Vehicles | 0 (0.0%) | 0 (0.0%) |
| Total | 322 (100.0%) | 318 (100.0%) |
Commute Time in Lake Hamilton
The most frequently occuring commute durations in Lake Hamilton are 15 to 19 minutes (138 commuters, 23.6%), 20 to 24 minutes (114 commuters, 19.5%), and 45 to 59 minutes (89 commuters, 15.2%).
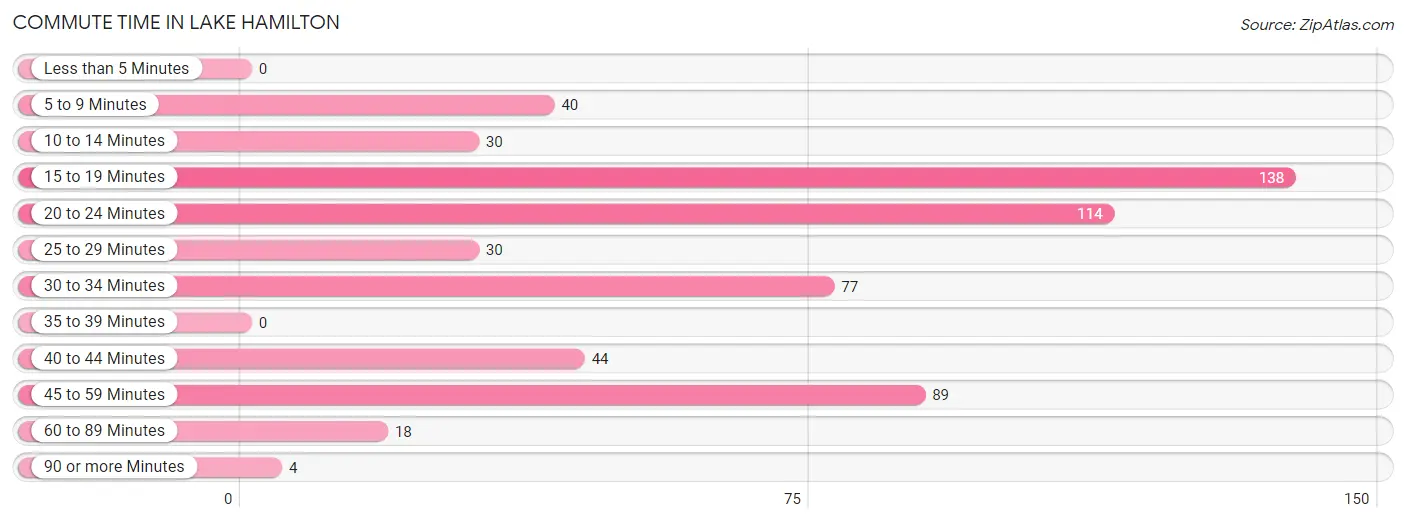
| Commute Time | # Commuters | % Commuters |
| Less than 5 Minutes | 0 | 0.0% |
| 5 to 9 Minutes | 40 | 6.9% |
| 10 to 14 Minutes | 30 | 5.1% |
| 15 to 19 Minutes | 138 | 23.6% |
| 20 to 24 Minutes | 114 | 19.5% |
| 25 to 29 Minutes | 30 | 5.1% |
| 30 to 34 Minutes | 77 | 13.2% |
| 35 to 39 Minutes | 0 | 0.0% |
| 40 to 44 Minutes | 44 | 7.5% |
| 45 to 59 Minutes | 89 | 15.2% |
| 60 to 89 Minutes | 18 | 3.1% |
| 90 or more Minutes | 4 | 0.7% |
Commute Time by Sex in Lake Hamilton
The most common commute times in Lake Hamilton are 15 to 19 minutes (68 commuters, 24.3%) for males and 20 to 24 minutes (112 commuters, 36.8%) for females.
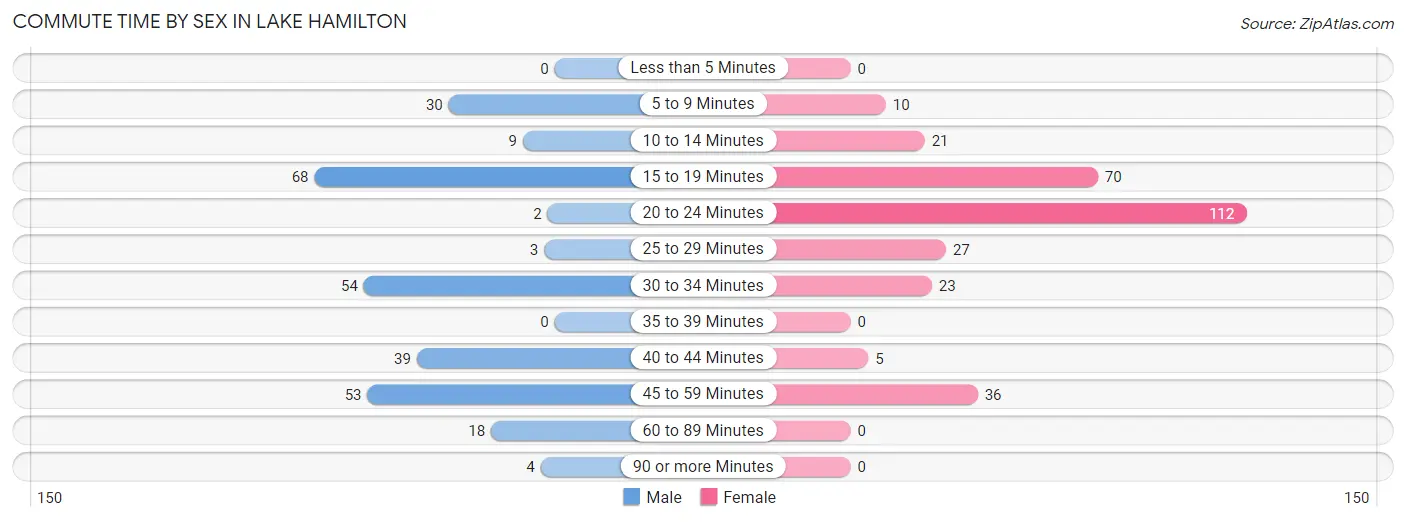
| Commute Time | Male | Female |
| Less than 5 Minutes | 0 (0.0%) | 0 (0.0%) |
| 5 to 9 Minutes | 30 (10.7%) | 10 (3.3%) |
| 10 to 14 Minutes | 9 (3.2%) | 21 (6.9%) |
| 15 to 19 Minutes | 68 (24.3%) | 70 (23.0%) |
| 20 to 24 Minutes | 2 (0.7%) | 112 (36.8%) |
| 25 to 29 Minutes | 3 (1.1%) | 27 (8.9%) |
| 30 to 34 Minutes | 54 (19.3%) | 23 (7.6%) |
| 35 to 39 Minutes | 0 (0.0%) | 0 (0.0%) |
| 40 to 44 Minutes | 39 (13.9%) | 5 (1.6%) |
| 45 to 59 Minutes | 53 (18.9%) | 36 (11.8%) |
| 60 to 89 Minutes | 18 (6.4%) | 0 (0.0%) |
| 90 or more Minutes | 4 (1.4%) | 0 (0.0%) |
Time of Departure to Work by Sex in Lake Hamilton
The most frequent times of departure to work in Lake Hamilton are 8:00 AM to 8:29 AM (55, 19.6%) for males and 7:00 AM to 7:29 AM (93, 30.6%) for females.
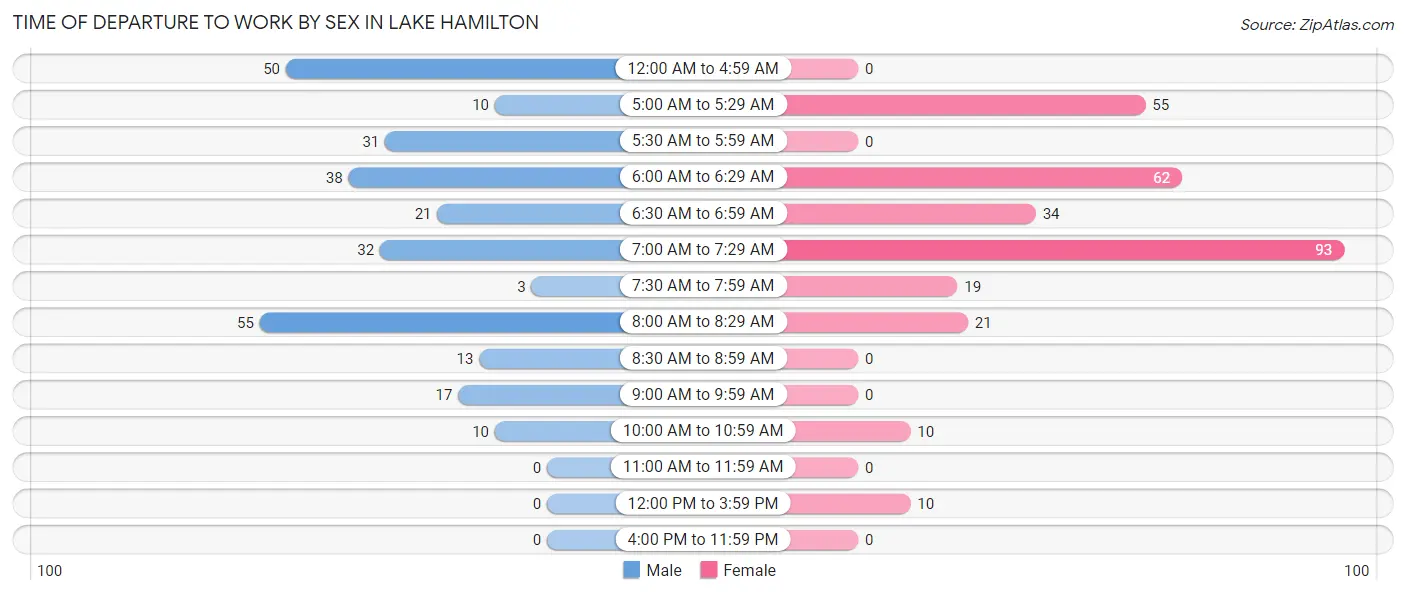
| Time of Departure | Male | Female |
| 12:00 AM to 4:59 AM | 50 (17.9%) | 0 (0.0%) |
| 5:00 AM to 5:29 AM | 10 (3.6%) | 55 (18.1%) |
| 5:30 AM to 5:59 AM | 31 (11.1%) | 0 (0.0%) |
| 6:00 AM to 6:29 AM | 38 (13.6%) | 62 (20.4%) |
| 6:30 AM to 6:59 AM | 21 (7.5%) | 34 (11.2%) |
| 7:00 AM to 7:29 AM | 32 (11.4%) | 93 (30.6%) |
| 7:30 AM to 7:59 AM | 3 (1.1%) | 19 (6.2%) |
| 8:00 AM to 8:29 AM | 55 (19.6%) | 21 (6.9%) |
| 8:30 AM to 8:59 AM | 13 (4.6%) | 0 (0.0%) |
| 9:00 AM to 9:59 AM | 17 (6.1%) | 0 (0.0%) |
| 10:00 AM to 10:59 AM | 10 (3.6%) | 10 (3.3%) |
| 11:00 AM to 11:59 AM | 0 (0.0%) | 0 (0.0%) |
| 12:00 PM to 3:59 PM | 0 (0.0%) | 10 (3.3%) |
| 4:00 PM to 11:59 PM | 0 (0.0%) | 0 (0.0%) |
| Total | 280 (100.0%) | 304 (100.0%) |
Housing Occupancy in Lake Hamilton
Occupancy by Ownership in Lake Hamilton
Of the total 498 dwellings in Lake Hamilton, owner-occupied units account for 399 (80.1%), while renter-occupied units make up 99 (19.9%).
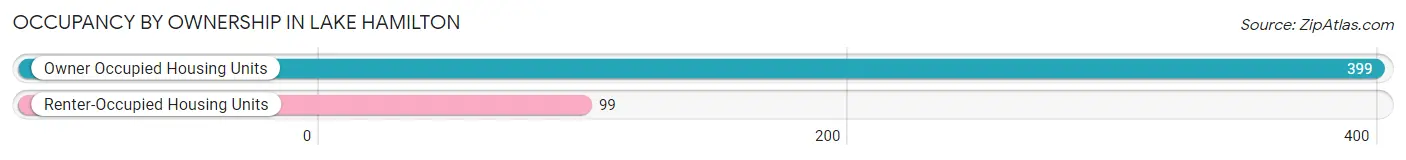
| Occupancy | # Housing Units | % Housing Units |
| Owner Occupied Housing Units | 399 | 80.1% |
| Renter-Occupied Housing Units | 99 | 19.9% |
| Total Occupied Housing Units | 498 | 100.0% |
Occupancy by Household Size in Lake Hamilton
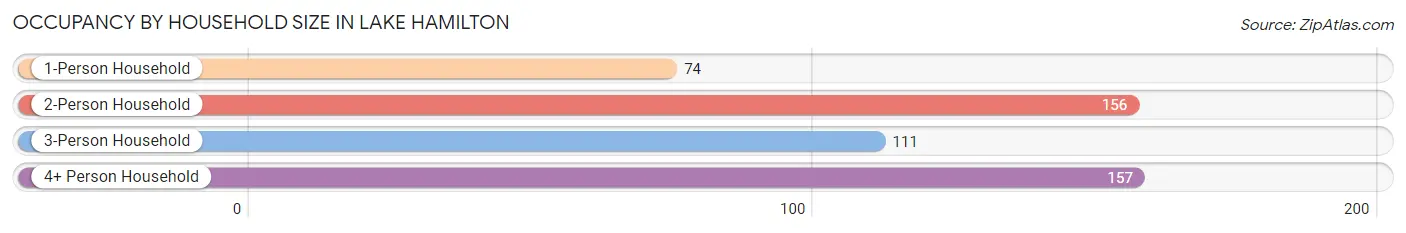
| Household Size | # Housing Units | % Housing Units |
| 1-Person Household | 74 | 14.9% |
| 2-Person Household | 156 | 31.3% |
| 3-Person Household | 111 | 22.3% |
| 4+ Person Household | 157 | 31.5% |
| Total Housing Units | 498 | 100.0% |
Occupancy by Ownership by Household Size in Lake Hamilton
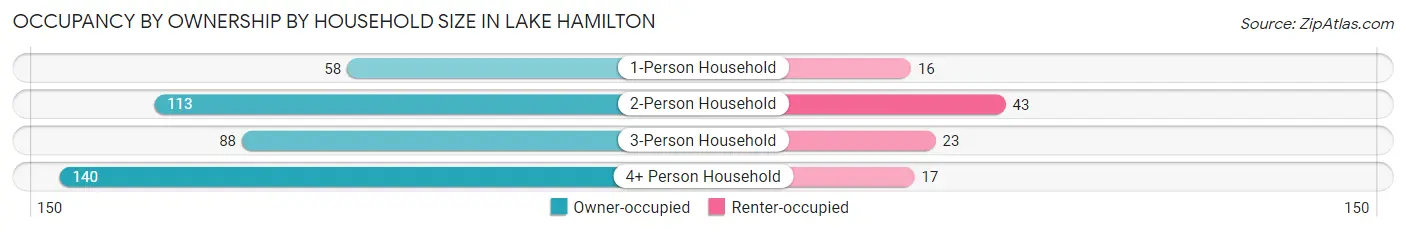
| Household Size | Owner-occupied | Renter-occupied |
| 1-Person Household | 58 (78.4%) | 16 (21.6%) |
| 2-Person Household | 113 (72.4%) | 43 (27.6%) |
| 3-Person Household | 88 (79.3%) | 23 (20.7%) |
| 4+ Person Household | 140 (89.2%) | 17 (10.8%) |
| Total Housing Units | 399 (80.1%) | 99 (19.9%) |
Occupancy by Educational Attainment in Lake Hamilton
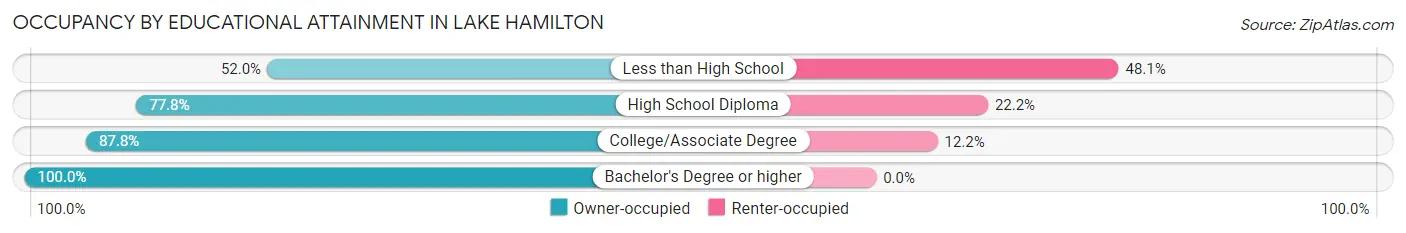
| Household Size | Owner-occupied | Renter-occupied |
| Less than High School | 40 (51.9%) | 37 (48.0%) |
| High School Diploma | 137 (77.8%) | 39 (22.2%) |
| College/Associate Degree | 166 (87.8%) | 23 (12.2%) |
| Bachelor's Degree or higher | 56 (100.0%) | 0 (0.0%) |
Occupancy by Age of Householder in Lake Hamilton
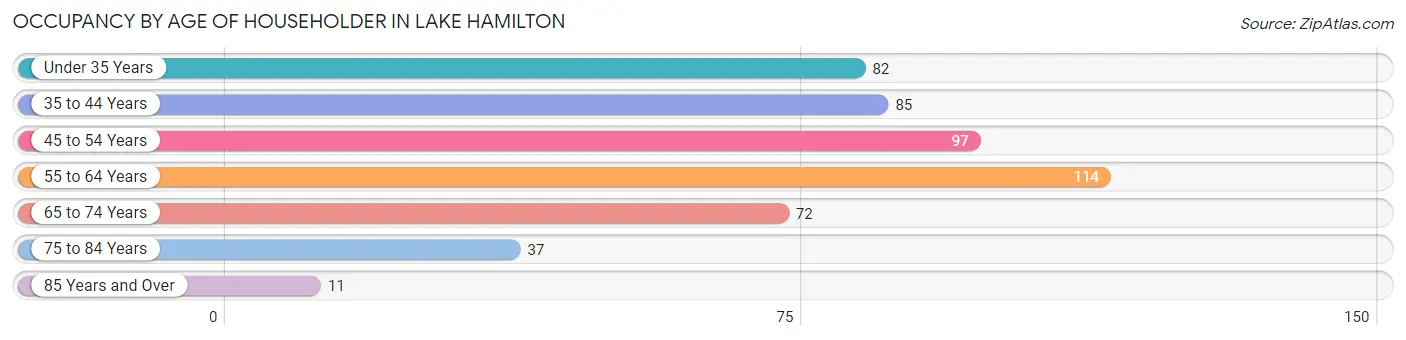
| Age Bracket | # Households | % Households |
| Under 35 Years | 82 | 16.5% |
| 35 to 44 Years | 85 | 17.1% |
| 45 to 54 Years | 97 | 19.5% |
| 55 to 64 Years | 114 | 22.9% |
| 65 to 74 Years | 72 | 14.5% |
| 75 to 84 Years | 37 | 7.4% |
| 85 Years and Over | 11 | 2.2% |
| Total | 498 | 100.0% |
Housing Finances in Lake Hamilton
Median Income by Occupancy in Lake Hamilton
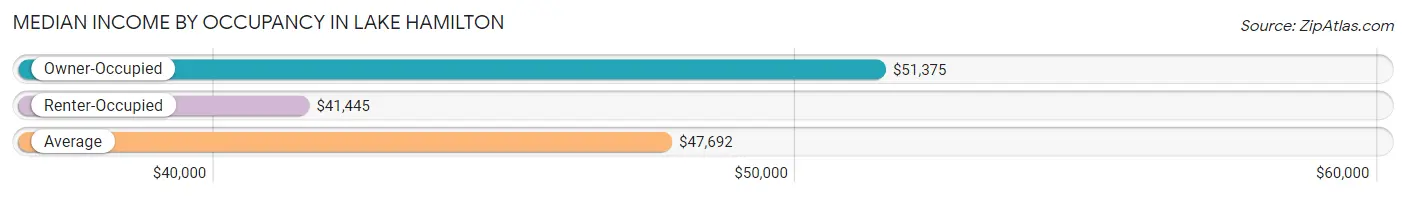
| Occupancy Type | # Households | Median Income |
| Owner-Occupied | 399 (80.1%) | $51,375 |
| Renter-Occupied | 99 (19.9%) | $41,445 |
| Average | 498 (100.0%) | $47,692 |
Occupancy by Householder Income Bracket in Lake Hamilton
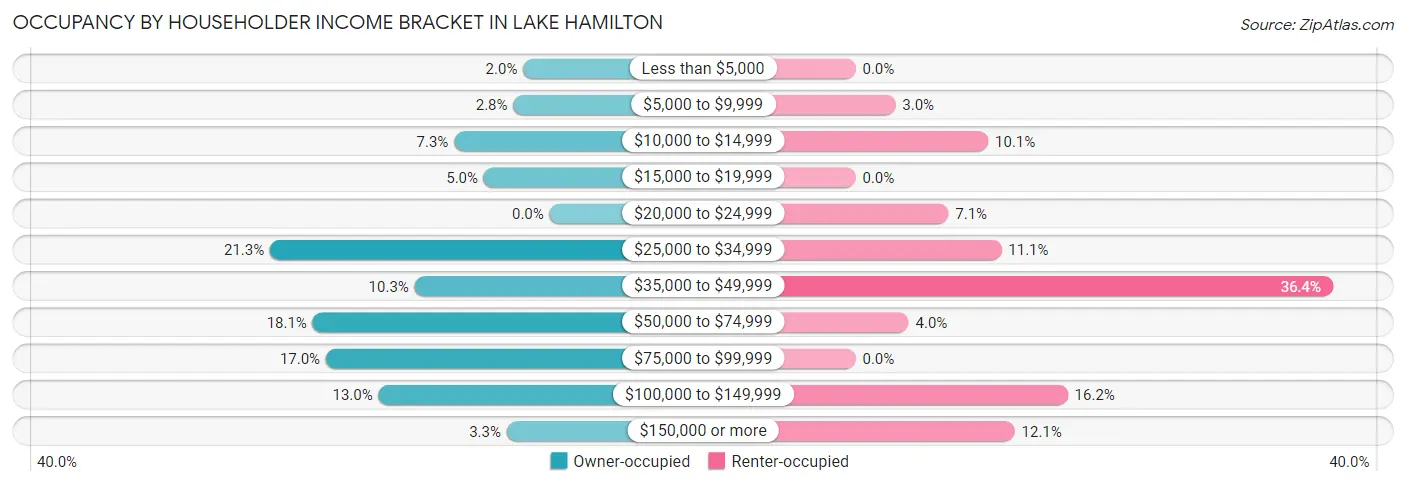
| Income Bracket | Owner-occupied | Renter-occupied |
| Less than $5,000 | 8 (2.0%) | 0 (0.0%) |
| $5,000 to $9,999 | 11 (2.8%) | 3 (3.0%) |
| $10,000 to $14,999 | 29 (7.3%) | 10 (10.1%) |
| $15,000 to $19,999 | 20 (5.0%) | 0 (0.0%) |
| $20,000 to $24,999 | 0 (0.0%) | 7 (7.1%) |
| $25,000 to $34,999 | 85 (21.3%) | 11 (11.1%) |
| $35,000 to $49,999 | 41 (10.3%) | 36 (36.4%) |
| $50,000 to $74,999 | 72 (18.0%) | 4 (4.0%) |
| $75,000 to $99,999 | 68 (17.0%) | 0 (0.0%) |
| $100,000 to $149,999 | 52 (13.0%) | 16 (16.2%) |
| $150,000 or more | 13 (3.3%) | 12 (12.1%) |
| Total | 399 (100.0%) | 99 (100.0%) |
Monthly Housing Cost Tiers in Lake Hamilton
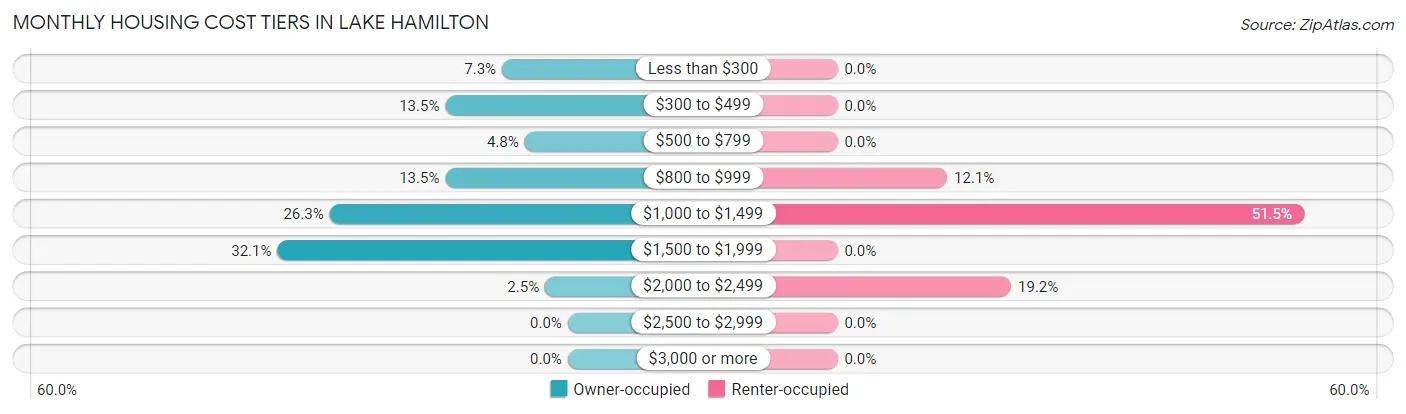
| Monthly Cost | Owner-occupied | Renter-occupied |
| Less than $300 | 29 (7.3%) | 0 (0.0%) |
| $300 to $499 | 54 (13.5%) | 0 (0.0%) |
| $500 to $799 | 19 (4.8%) | 0 (0.0%) |
| $800 to $999 | 54 (13.5%) | 12 (12.1%) |
| $1,000 to $1,499 | 105 (26.3%) | 51 (51.5%) |
| $1,500 to $1,999 | 128 (32.1%) | 0 (0.0%) |
| $2,000 to $2,499 | 10 (2.5%) | 19 (19.2%) |
| $2,500 to $2,999 | 0 (0.0%) | 0 (0.0%) |
| $3,000 or more | 0 (0.0%) | 0 (0.0%) |
| Total | 399 (100.0%) | 99 (100.0%) |
Physical Housing Characteristics in Lake Hamilton
Housing Structures in Lake Hamilton
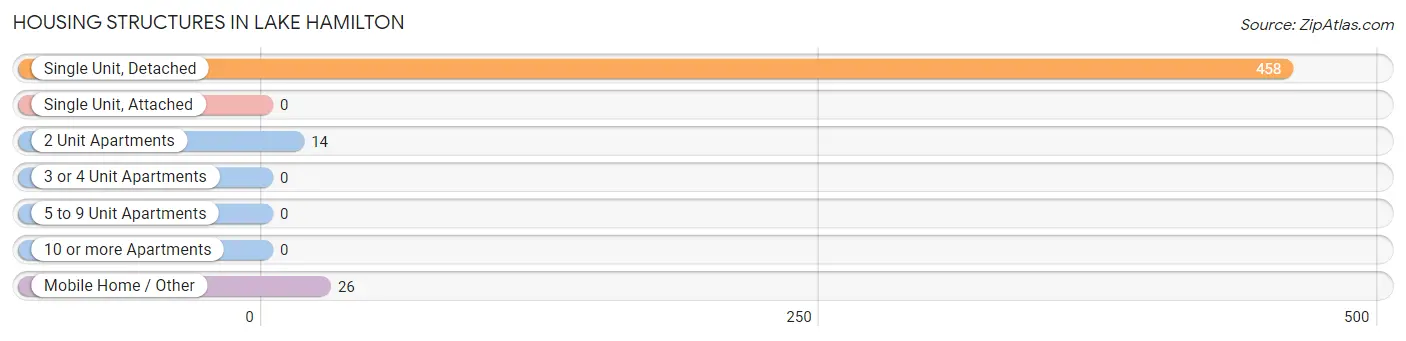
| Structure Type | # Housing Units | % Housing Units |
| Single Unit, Detached | 458 | 92.0% |
| Single Unit, Attached | 0 | 0.0% |
| 2 Unit Apartments | 14 | 2.8% |
| 3 or 4 Unit Apartments | 0 | 0.0% |
| 5 to 9 Unit Apartments | 0 | 0.0% |
| 10 or more Apartments | 0 | 0.0% |
| Mobile Home / Other | 26 | 5.2% |
| Total | 498 | 100.0% |
Housing Structures by Occupancy in Lake Hamilton
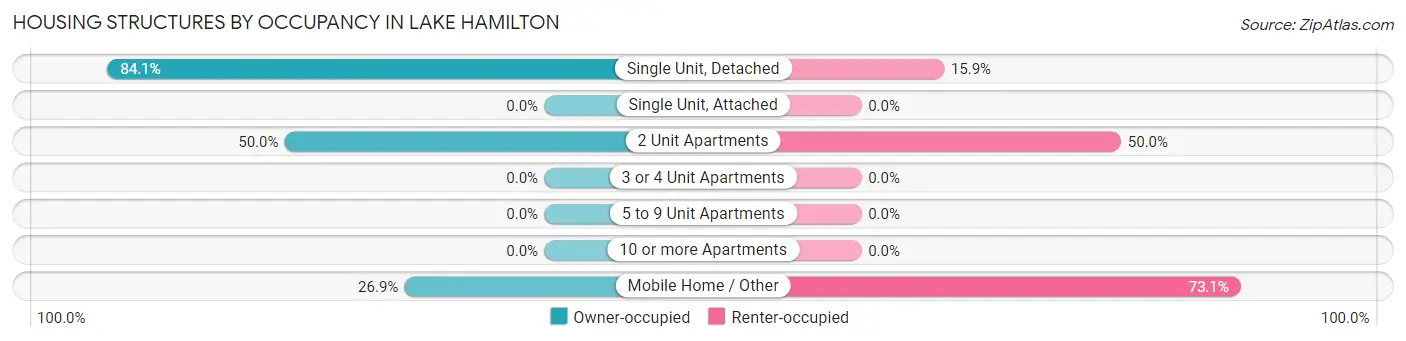
| Structure Type | Owner-occupied | Renter-occupied |
| Single Unit, Detached | 385 (84.1%) | 73 (15.9%) |
| Single Unit, Attached | 0 (0.0%) | 0 (0.0%) |
| 2 Unit Apartments | 7 (50.0%) | 7 (50.0%) |
| 3 or 4 Unit Apartments | 0 (0.0%) | 0 (0.0%) |
| 5 to 9 Unit Apartments | 0 (0.0%) | 0 (0.0%) |
| 10 or more Apartments | 0 (0.0%) | 0 (0.0%) |
| Mobile Home / Other | 7 (26.9%) | 19 (73.1%) |
| Total | 399 (80.1%) | 99 (19.9%) |
Housing Structures by Number of Rooms in Lake Hamilton
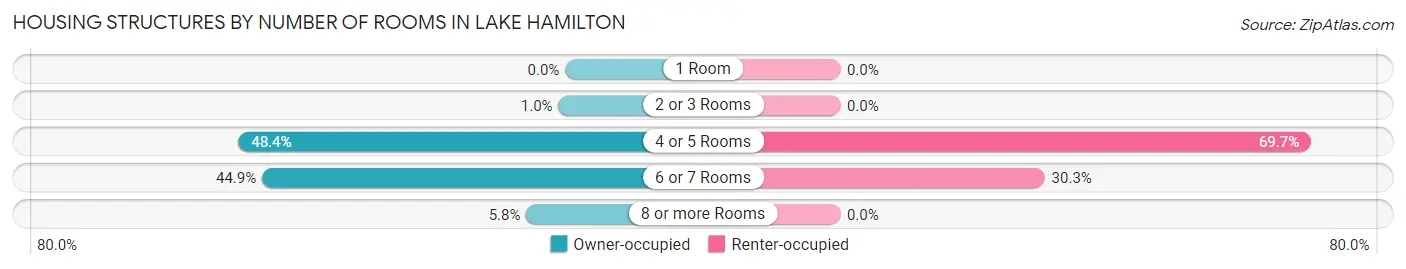
| Number of Rooms | Owner-occupied | Renter-occupied |
| 1 Room | 0 (0.0%) | 0 (0.0%) |
| 2 or 3 Rooms | 4 (1.0%) | 0 (0.0%) |
| 4 or 5 Rooms | 193 (48.4%) | 69 (69.7%) |
| 6 or 7 Rooms | 179 (44.9%) | 30 (30.3%) |
| 8 or more Rooms | 23 (5.8%) | 0 (0.0%) |
| Total | 399 (100.0%) | 99 (100.0%) |
Housing Structure by Heating Type in Lake Hamilton
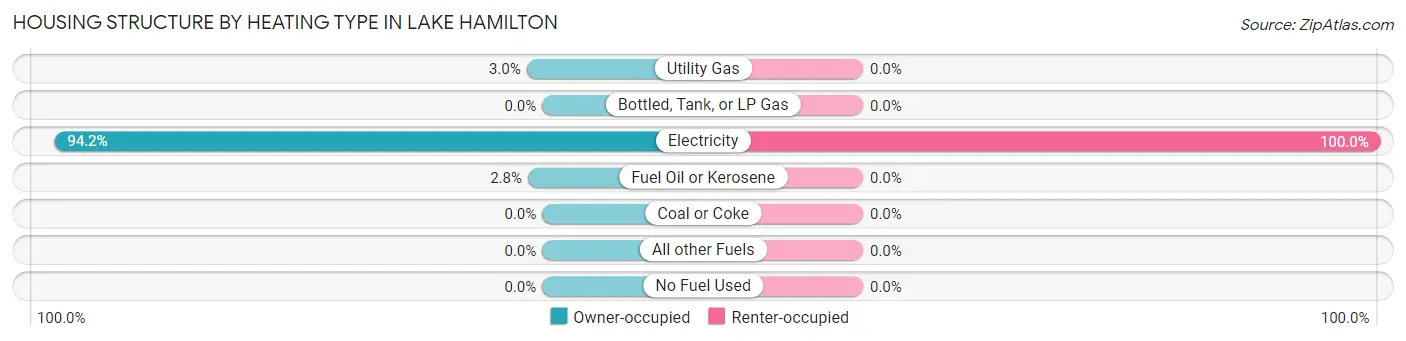
| Heating Type | Owner-occupied | Renter-occupied |
| Utility Gas | 12 (3.0%) | 0 (0.0%) |
| Bottled, Tank, or LP Gas | 0 (0.0%) | 0 (0.0%) |
| Electricity | 376 (94.2%) | 99 (100.0%) |
| Fuel Oil or Kerosene | 11 (2.8%) | 0 (0.0%) |
| Coal or Coke | 0 (0.0%) | 0 (0.0%) |
| All other Fuels | 0 (0.0%) | 0 (0.0%) |
| No Fuel Used | 0 (0.0%) | 0 (0.0%) |
| Total | 399 (100.0%) | 99 (100.0%) |
Household Vehicle Usage in Lake Hamilton
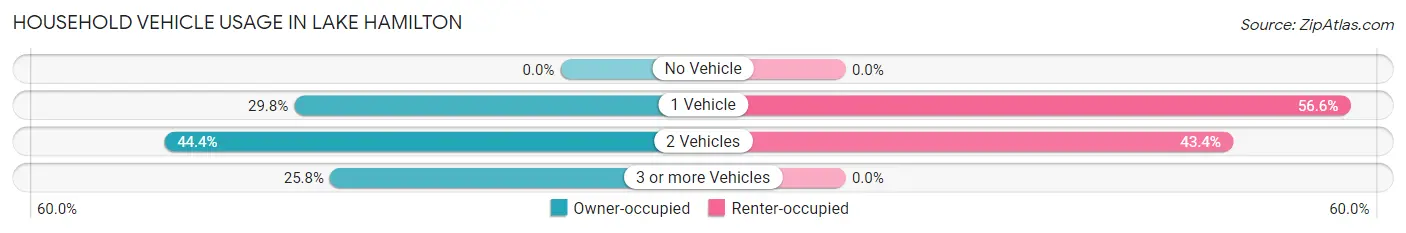
| Vehicles per Household | Owner-occupied | Renter-occupied |
| No Vehicle | 0 (0.0%) | 0 (0.0%) |
| 1 Vehicle | 119 (29.8%) | 56 (56.6%) |
| 2 Vehicles | 177 (44.4%) | 43 (43.4%) |
| 3 or more Vehicles | 103 (25.8%) | 0 (0.0%) |
| Total | 399 (100.0%) | 99 (100.0%) |
Real Estate & Mortgages in Lake Hamilton
Real Estate and Mortgage Overview in Lake Hamilton
| Characteristic | Without Mortgage | With Mortgage |
| Housing Units | 118 | 281 |
| Median Property Value | $118,600 | $217,900 |
| Median Household Income | $44,500 | $13 |
| Monthly Housing Costs | $404 | $0 |
| Real Estate Taxes | $444 | $6 |
Property Value by Mortgage Status in Lake Hamilton
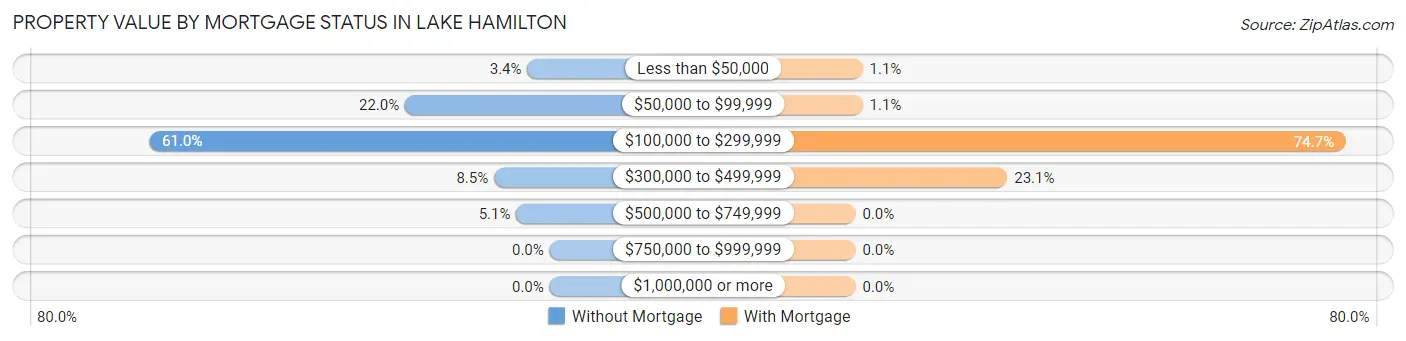
| Property Value | Without Mortgage | With Mortgage |
| Less than $50,000 | 4 (3.4%) | 3 (1.1%) |
| $50,000 to $99,999 | 26 (22.0%) | 3 (1.1%) |
| $100,000 to $299,999 | 72 (61.0%) | 210 (74.7%) |
| $300,000 to $499,999 | 10 (8.5%) | 65 (23.1%) |
| $500,000 to $749,999 | 6 (5.1%) | 0 (0.0%) |
| $750,000 to $999,999 | 0 (0.0%) | 0 (0.0%) |
| $1,000,000 or more | 0 (0.0%) | 0 (0.0%) |
| Total | 118 (100.0%) | 281 (100.0%) |
Household Income by Mortgage Status in Lake Hamilton
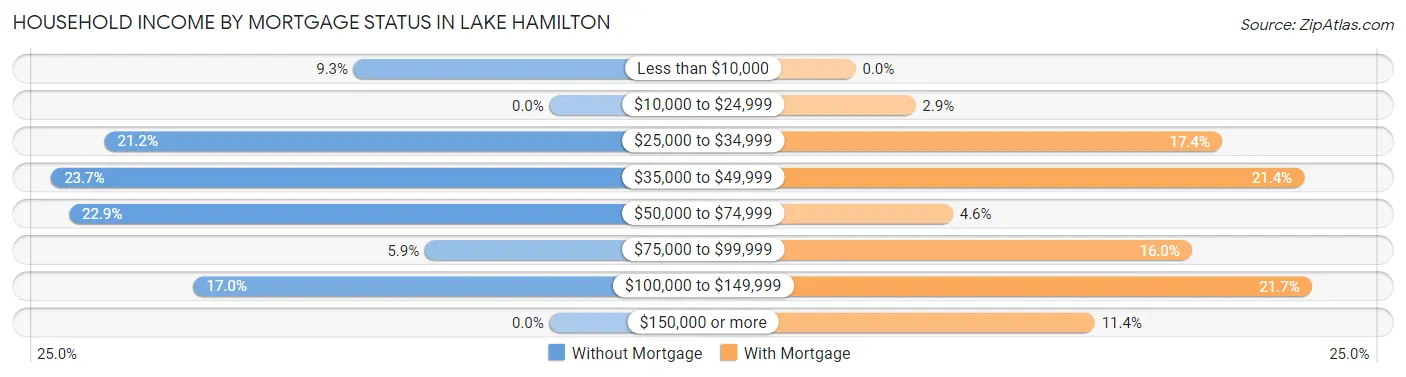
| Household Income | Without Mortgage | With Mortgage |
| Less than $10,000 | 11 (9.3%) | 0 (0.0%) |
| $10,000 to $24,999 | 0 (0.0%) | 8 (2.9%) |
| $25,000 to $34,999 | 25 (21.2%) | 49 (17.4%) |
| $35,000 to $49,999 | 28 (23.7%) | 60 (21.3%) |
| $50,000 to $74,999 | 27 (22.9%) | 13 (4.6%) |
| $75,000 to $99,999 | 7 (5.9%) | 45 (16.0%) |
| $100,000 to $149,999 | 20 (17.0%) | 61 (21.7%) |
| $150,000 or more | 0 (0.0%) | 32 (11.4%) |
| Total | 118 (100.0%) | 281 (100.0%) |
Property Value to Household Income Ratio in Lake Hamilton
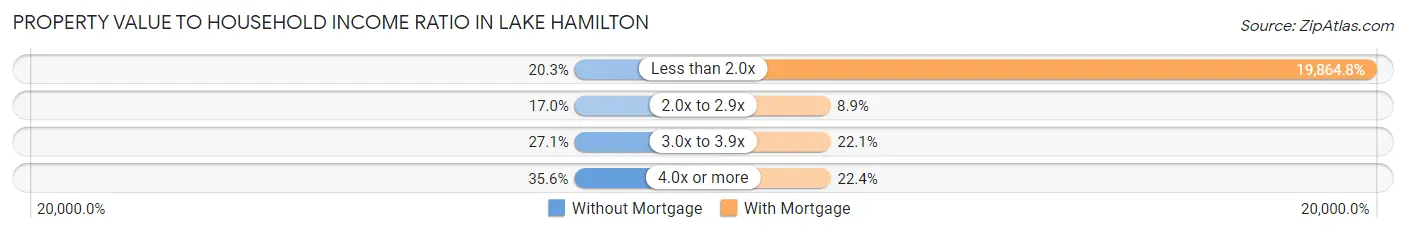
| Value-to-Income Ratio | Without Mortgage | With Mortgage |
| Less than 2.0x | 24 (20.3%) | 55,820 (19,864.8%) |
| 2.0x to 2.9x | 20 (17.0%) | 25 (8.9%) |
| 3.0x to 3.9x | 32 (27.1%) | 62 (22.1%) |
| 4.0x or more | 42 (35.6%) | 63 (22.4%) |
| Total | 118 (100.0%) | 281 (100.0%) |
Real Estate Taxes by Mortgage Status in Lake Hamilton
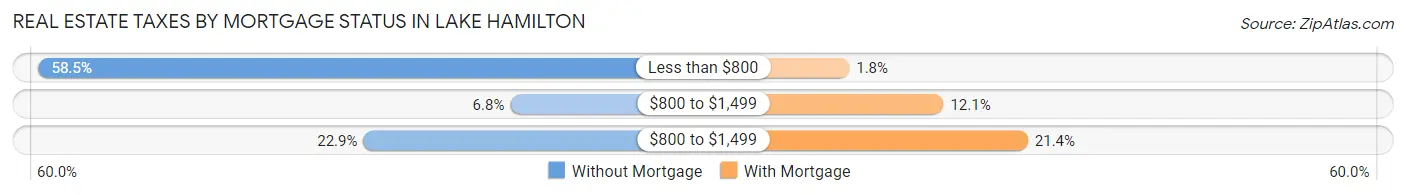
| Property Taxes | Without Mortgage | With Mortgage |
| Less than $800 | 69 (58.5%) | 5 (1.8%) |
| $800 to $1,499 | 8 (6.8%) | 34 (12.1%) |
| $800 to $1,499 | 27 (22.9%) | 60 (21.3%) |
| Total | 118 (100.0%) | 281 (100.0%) |
Health & Disability in Lake Hamilton
Health Insurance Coverage by Age in Lake Hamilton
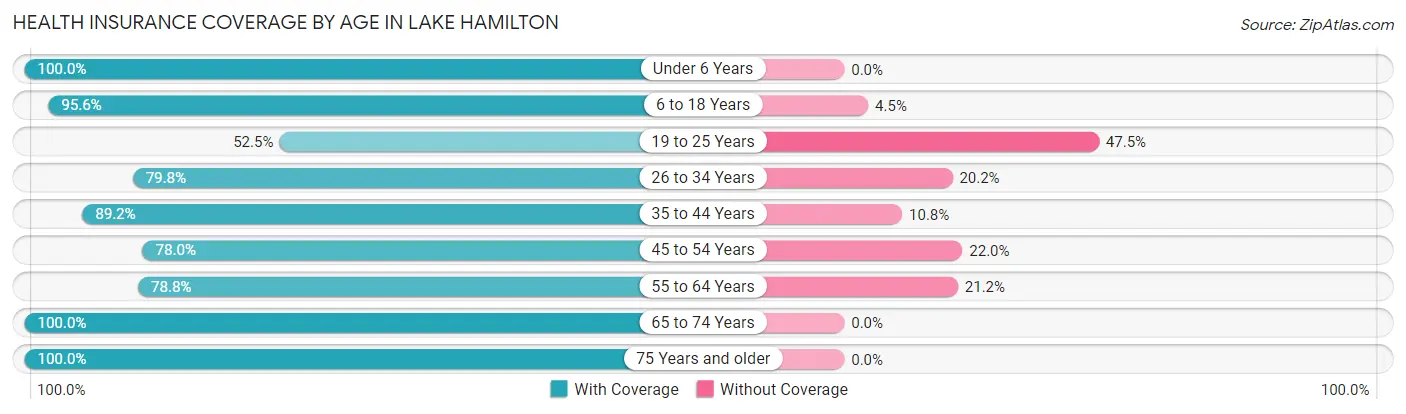
| Age Bracket | With Coverage | Without Coverage |
| Under 6 Years | 140 (100.0%) | 0 (0.0%) |
| 6 to 18 Years | 236 (95.6%) | 11 (4.4%) |
| 19 to 25 Years | 73 (52.5%) | 66 (47.5%) |
| 26 to 34 Years | 95 (79.8%) | 24 (20.2%) |
| 35 to 44 Years | 182 (89.2%) | 22 (10.8%) |
| 45 to 54 Years | 131 (78.0%) | 37 (22.0%) |
| 55 to 64 Years | 160 (78.8%) | 43 (21.2%) |
| 65 to 74 Years | 160 (100.0%) | 0 (0.0%) |
| 75 Years and older | 233 (100.0%) | 0 (0.0%) |
| Total | 1,410 (87.4%) | 203 (12.6%) |
Health Insurance Coverage by Citizenship Status in Lake Hamilton
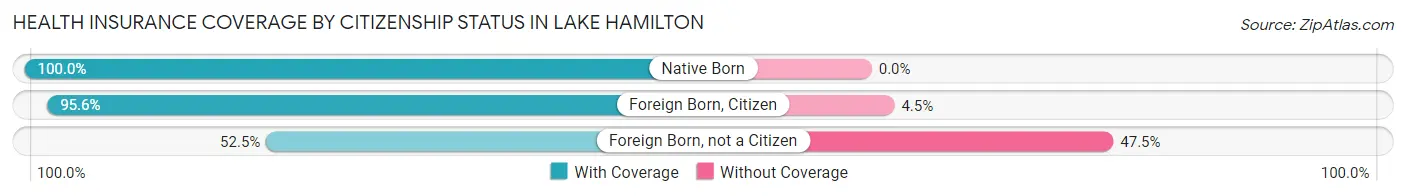
| Citizenship Status | With Coverage | Without Coverage |
| Native Born | 140 (100.0%) | 0 (0.0%) |
| Foreign Born, Citizen | 236 (95.6%) | 11 (4.4%) |
| Foreign Born, not a Citizen | 73 (52.5%) | 66 (47.5%) |
Health Insurance Coverage by Household Income in Lake Hamilton
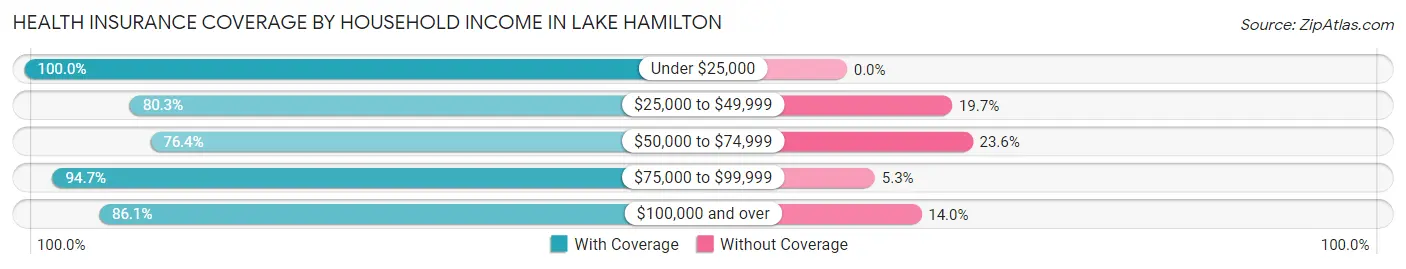
| Household Income | With Coverage | Without Coverage |
| Under $25,000 | 317 (100.0%) | 0 (0.0%) |
| $25,000 to $49,999 | 387 (80.3%) | 95 (19.7%) |
| $50,000 to $74,999 | 159 (76.4%) | 49 (23.6%) |
| $75,000 to $99,999 | 270 (94.7%) | 15 (5.3%) |
| $100,000 and over | 259 (86.1%) | 42 (14.0%) |
Public vs Private Health Insurance Coverage by Age in Lake Hamilton
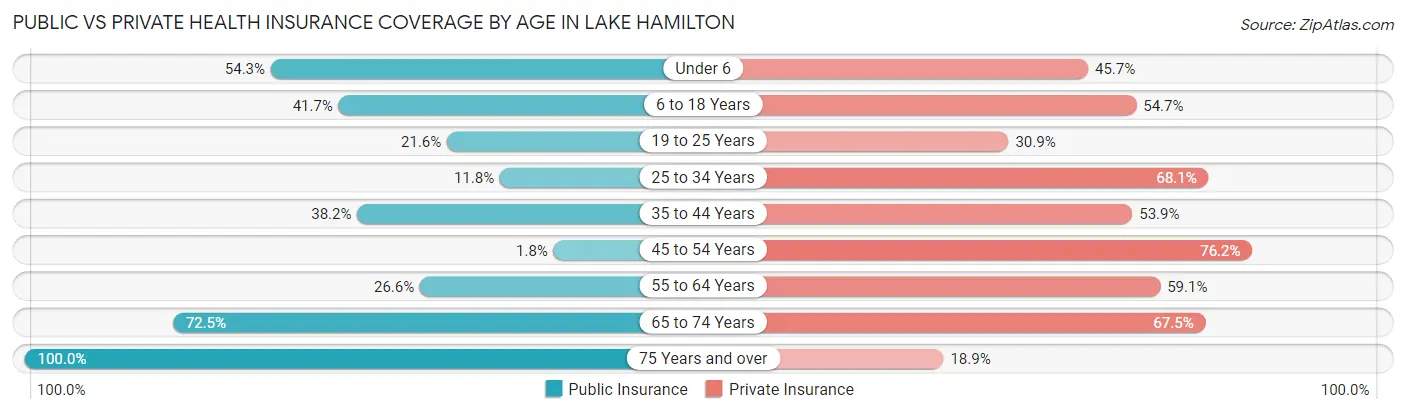
| Age Bracket | Public Insurance | Private Insurance |
| Under 6 | 76 (54.3%) | 64 (45.7%) |
| 6 to 18 Years | 103 (41.7%) | 135 (54.7%) |
| 19 to 25 Years | 30 (21.6%) | 43 (30.9%) |
| 25 to 34 Years | 14 (11.8%) | 81 (68.1%) |
| 35 to 44 Years | 78 (38.2%) | 110 (53.9%) |
| 45 to 54 Years | 3 (1.8%) | 128 (76.2%) |
| 55 to 64 Years | 54 (26.6%) | 120 (59.1%) |
| 65 to 74 Years | 116 (72.5%) | 108 (67.5%) |
| 75 Years and over | 233 (100.0%) | 44 (18.9%) |
| Total | 707 (43.8%) | 833 (51.6%) |
Disability Status by Sex by Age in Lake Hamilton
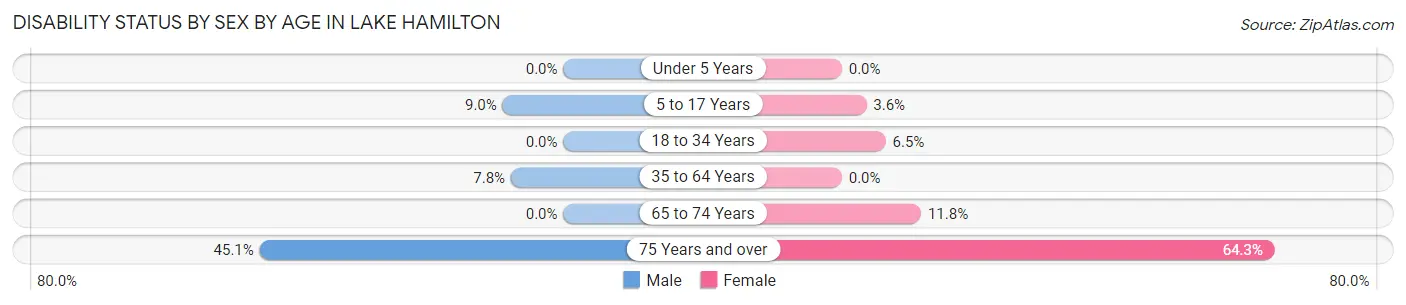
| Age Bracket | Male | Female |
| Under 5 Years | 0 (0.0%) | 0 (0.0%) |
| 5 to 17 Years | 11 (9.0%) | 4 (3.6%) |
| 18 to 34 Years | 0 (0.0%) | 8 (6.5%) |
| 35 to 64 Years | 21 (7.8%) | 0 (0.0%) |
| 65 to 74 Years | 0 (0.0%) | 8 (11.8%) |
| 75 Years and over | 23 (45.1%) | 117 (64.3%) |
Disability Class by Sex by Age in Lake Hamilton
Disability Class: Hearing Difficulty
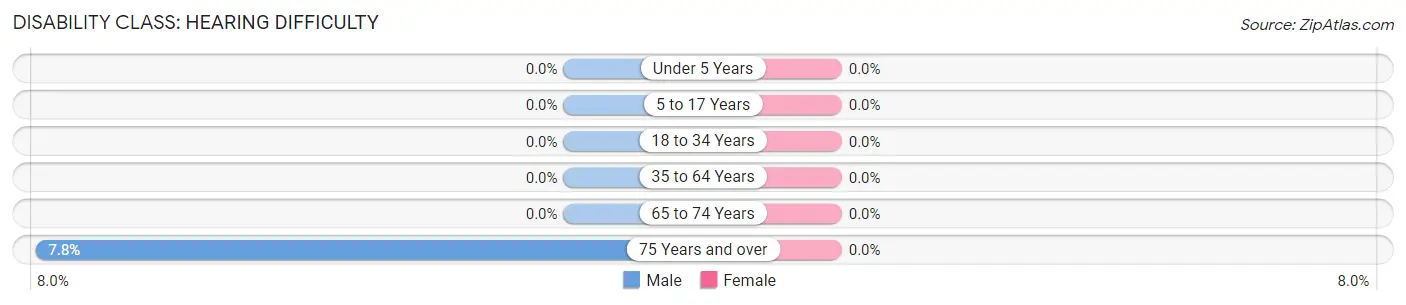
| Age Bracket | Male | Female |
| Under 5 Years | 0 (0.0%) | 0 (0.0%) |
| 5 to 17 Years | 0 (0.0%) | 0 (0.0%) |
| 18 to 34 Years | 0 (0.0%) | 0 (0.0%) |
| 35 to 64 Years | 0 (0.0%) | 0 (0.0%) |
| 65 to 74 Years | 0 (0.0%) | 0 (0.0%) |
| 75 Years and over | 4 (7.8%) | 0 (0.0%) |
Disability Class: Vision Difficulty
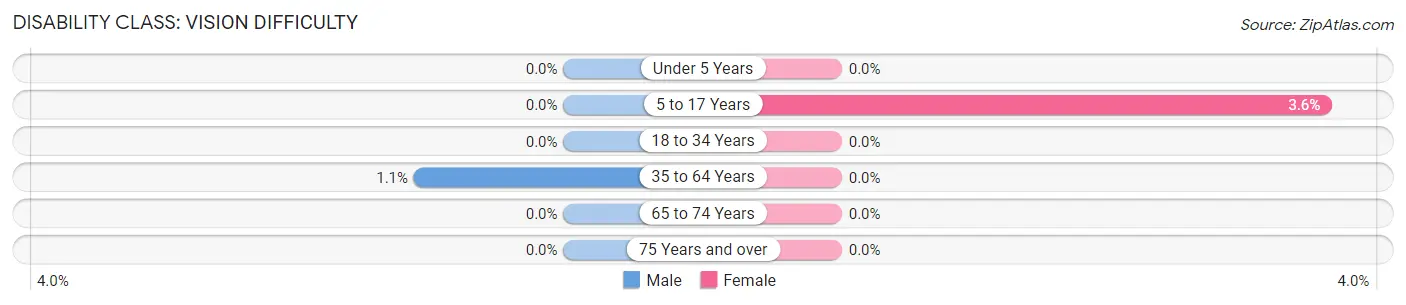
| Age Bracket | Male | Female |
| Under 5 Years | 0 (0.0%) | 0 (0.0%) |
| 5 to 17 Years | 0 (0.0%) | 4 (3.6%) |
| 18 to 34 Years | 0 (0.0%) | 0 (0.0%) |
| 35 to 64 Years | 3 (1.1%) | 0 (0.0%) |
| 65 to 74 Years | 0 (0.0%) | 0 (0.0%) |
| 75 Years and over | 0 (0.0%) | 0 (0.0%) |
Disability Class: Cognitive Difficulty
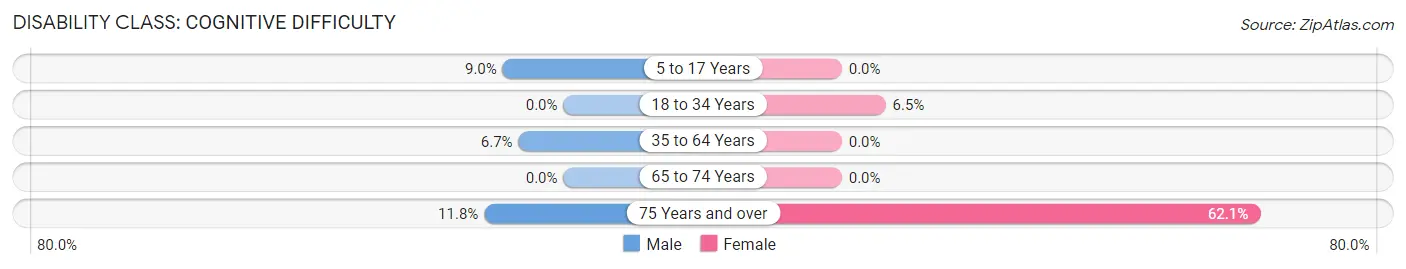
| Age Bracket | Male | Female |
| 5 to 17 Years | 11 (9.0%) | 0 (0.0%) |
| 18 to 34 Years | 0 (0.0%) | 8 (6.5%) |
| 35 to 64 Years | 18 (6.7%) | 0 (0.0%) |
| 65 to 74 Years | 0 (0.0%) | 0 (0.0%) |
| 75 Years and over | 6 (11.8%) | 113 (62.1%) |
Disability Class: Ambulatory Difficulty
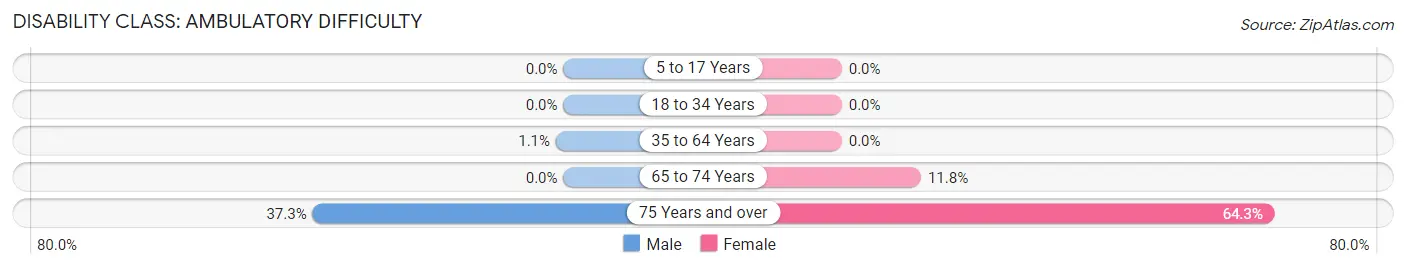
| Age Bracket | Male | Female |
| 5 to 17 Years | 0 (0.0%) | 0 (0.0%) |
| 18 to 34 Years | 0 (0.0%) | 0 (0.0%) |
| 35 to 64 Years | 3 (1.1%) | 0 (0.0%) |
| 65 to 74 Years | 0 (0.0%) | 8 (11.8%) |
| 75 Years and over | 19 (37.2%) | 117 (64.3%) |
Disability Class: Self-Care Difficulty
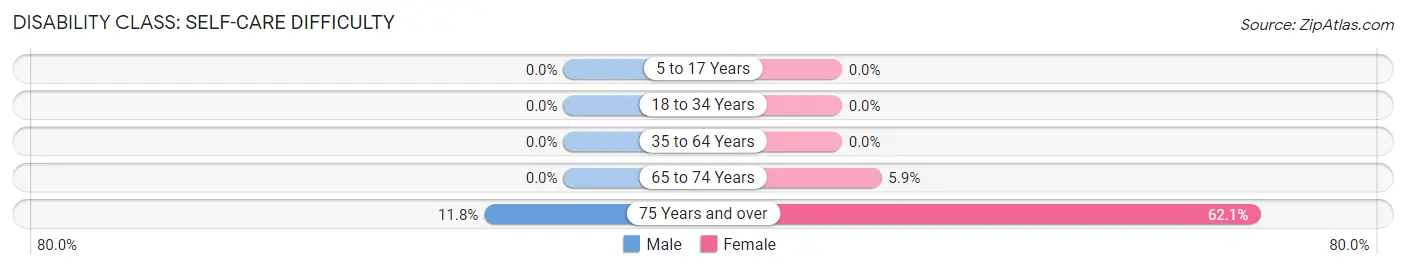
| Age Bracket | Male | Female |
| 5 to 17 Years | 0 (0.0%) | 0 (0.0%) |
| 18 to 34 Years | 0 (0.0%) | 0 (0.0%) |
| 35 to 64 Years | 0 (0.0%) | 0 (0.0%) |
| 65 to 74 Years | 0 (0.0%) | 4 (5.9%) |
| 75 Years and over | 6 (11.8%) | 113 (62.1%) |
Technology Access in Lake Hamilton
Computing Device Access in Lake Hamilton
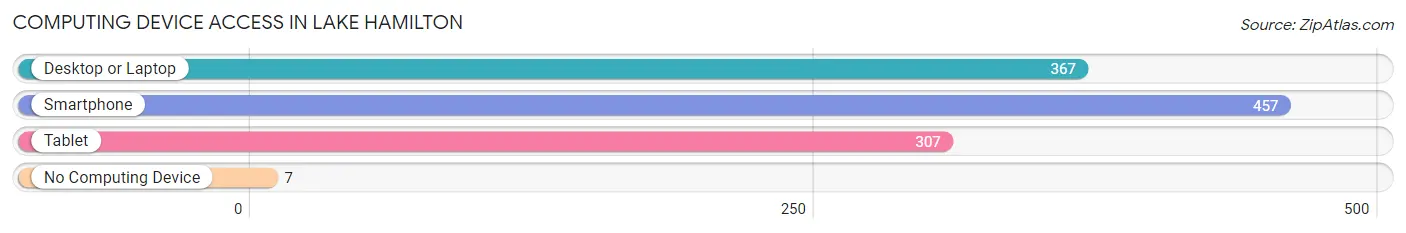
| Device Type | # Households | % Households |
| Desktop or Laptop | 367 | 73.7% |
| Smartphone | 457 | 91.8% |
| Tablet | 307 | 61.7% |
| No Computing Device | 7 | 1.4% |
| Total | 498 | 100.0% |
Internet Access in Lake Hamilton
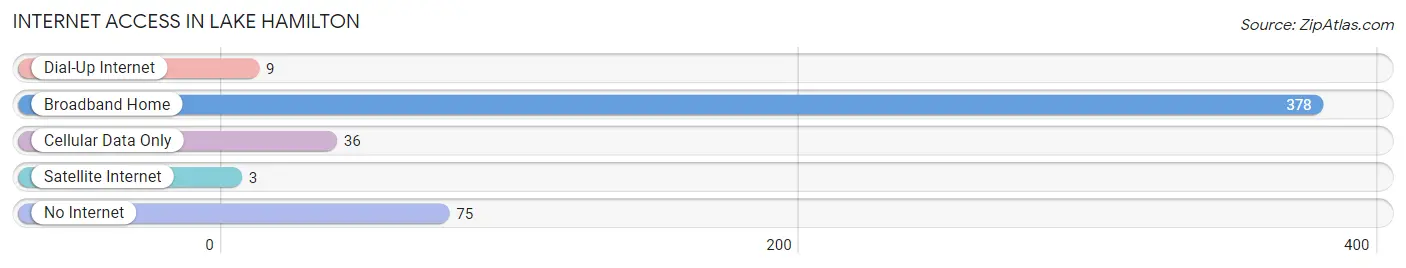
| Internet Type | # Households | % Households |
| Dial-Up Internet | 9 | 1.8% |
| Broadband Home | 378 | 75.9% |
| Cellular Data Only | 36 | 7.2% |
| Satellite Internet | 3 | 0.6% |
| No Internet | 75 | 15.1% |
| Total | 498 | 100.0% |
Lake Hamilton Summary
History
Lake Hamilton is a small town located in Polk County, Florida. It is situated on the shores of Lake Hamilton, a natural freshwater lake. The town was founded in 1883 by a group of settlers from Georgia and Alabama. The town was originally called Hamiltonville, but the name was changed to Lake Hamilton in 1887.
The town was originally a farming community, but it soon became a popular tourist destination. The town was known for its beautiful scenery and its many recreational activities. Fishing, boating, and swimming were popular activities on the lake. The town also had a number of resorts and hotels, which attracted visitors from all over the country.
In the early 1900s, the town began to experience a period of growth. The population increased from just over 500 in 1900 to over 1,000 by 1910. This growth was due in part to the development of the citrus industry in the area. The town was also home to a number of businesses, including a sawmill, a grist mill, and a general store.
In the 1920s, the town experienced a period of decline. The citrus industry had declined and the town’s population had decreased to just over 500. The town was also hit hard by the Great Depression. Many of the businesses in the town closed and the population continued to decline.
In the 1950s, the town began to experience a period of growth once again. The population increased to over 1,000 by 1960. This growth was due in part to the development of the citrus industry in the area. The town was also home to a number of businesses, including a sawmill, a grist mill, and a general store.
Geography
Lake Hamilton is located in Polk County, Florida. It is situated on the shores of Lake Hamilton, a natural freshwater lake. The town is located approximately 25 miles south of Orlando and 40 miles east of Tampa. The town is bordered by the cities of Winter Haven, Auburndale, and Haines City.
The town is situated on a flat plain, with an elevation of just over 100 feet. The town is surrounded by a number of lakes, including Lake Hamilton, Lake Alfred, Lake Wales, and Lake Marion. The town is also home to a number of parks, including Lake Hamilton Park, Lake Alfred Park, and Lake Wales Park.
Economy
The economy of Lake Hamilton is largely based on tourism and agriculture. The town is home to a number of resorts and hotels, which attract visitors from all over the country. The town is also home to a number of businesses, including a sawmill, a grist mill, and a general store.
The town is also home to a number of citrus groves, which produce oranges, grapefruits, and tangerines. The town is also home to a number of nurseries, which produce a variety of plants and flowers.
Demographics
As of the 2010 census, the population of Lake Hamilton was 1,845. The population is largely white (90.2%), with a small percentage of African Americans (4.2%) and Hispanics (3.3%). The median household income is $37,917, and the median age is 44.
Conclusion
Lake Hamilton is a small town located in Polk County, Florida. It is situated on the shores of Lake Hamilton, a natural freshwater lake. The town was founded in 1883 and has a population of 1,845 as of the 2010 census. The town is largely a tourist destination, with a number of resorts and hotels. The town is also home to a number of businesses, including a sawmill, a grist mill, and a general store. The town is also home to a number of citrus groves and nurseries.
Common Questions
What is Per Capita Income in Lake Hamilton?
Per Capita income in Lake Hamilton is $20,297.
What is the Median Family Income in Lake Hamilton?
Median Family Income in Lake Hamilton is $55,039.
What is the Median Household income in Lake Hamilton?
Median Household Income in Lake Hamilton is $47,692.
What is Income or Wage Gap in Lake Hamilton?
Income or Wage Gap in Lake Hamilton is 9.6%.
Women in Lake Hamilton earn 90.4 cents for every dollar earned by a man.
What is Family Income Deficit in Lake Hamilton?
Family Income Deficit in Lake Hamilton is $10,604.
Families that are below poverty line in Lake Hamilton earn $10,604 less on average than the poverty threshold level.
What is Inequality or Gini Index in Lake Hamilton?
Inequality or Gini Index in Lake Hamilton is 0.41.
What is the Total Population of Lake Hamilton?
Total Population of Lake Hamilton is 1,613.
What is the Total Male Population of Lake Hamilton?
Total Male Population of Lake Hamilton is 732.
What is the Total Female Population of Lake Hamilton?
Total Female Population of Lake Hamilton is 881.
What is the Ratio of Males per 100 Females in Lake Hamilton?
There are 83.09 Males per 100 Females in Lake Hamilton.
What is the Ratio of Females per 100 Males in Lake Hamilton?
There are 120.36 Females per 100 Males in Lake Hamilton.
What is the Median Population Age in Lake Hamilton?
Median Population Age in Lake Hamilton is 41.7 Years.
What is the Average Family Size in Lake Hamilton
Average Family Size in Lake Hamilton is 3.5 People.
What is the Average Household Size in Lake Hamilton
Average Household Size in Lake Hamilton is 3.2 People.
How Large is the Labor Force in Lake Hamilton?
There are 651 People in the Labor Forcein in Lake Hamilton.
What is the Percentage of People in the Labor Force in Lake Hamilton?
49.7% of People are in the Labor Force in Lake Hamilton.
What is the Unemployment Rate in Lake Hamilton?
Unemployment Rate in Lake Hamilton is 0.6%.