Key Largo, FL Map & Demographics
Key Largo Map
Key Largo Overview
$50,723
PER CAPITA INCOME
$79,904
AVG FAMILY INCOME
$74,239
AVG HOUSEHOLD INCOME
33.7%
WAGE / INCOME GAP [ % ]
66.3¢/ $1
WAGE / INCOME GAP [ $ ]
$11,720
FAMILY INCOME DEFICIT
0.51
INEQUALITY / GINI INDEX
12,021
TOTAL POPULATION
6,118
MALE POPULATION
5,903
FEMALE POPULATION
103.64
MALES / 100 FEMALES
96.49
FEMALES / 100 MALES
49.8
MEDIAN AGE
2.8
AVG FAMILY SIZE
2.4
AVG HOUSEHOLD SIZE
6,218
LABOR FORCE [ PEOPLE ]
58.7%
PERCENT IN LABOR FORCE
5.2%
UNEMPLOYMENT RATE
Key Largo Zip Codes
Key Largo Area Codes
Income in Key Largo
Income Overview in Key Largo
Per Capita Income in Key Largo is $50,723, while median incomes of families and households are $79,904 and $74,239 respectively.
| Characteristic | Number | Measure |
| Per Capita Income | 12,021 | $50,723 |
| Median Family Income | 3,197 | $79,904 |
| Mean Family Income | 3,197 | $130,170 |
| Median Household Income | 4,992 | $74,239 |
| Mean Household Income | 4,992 | $115,361 |
| Income Deficit | 3,197 | $11,720 |
| Wage / Income Gap (%) | 12,021 | 33.73% |
| Wage / Income Gap ($) | 12,021 | 66.27¢ per $1 |
| Gini / Inequality Index | 12,021 | 0.51 |
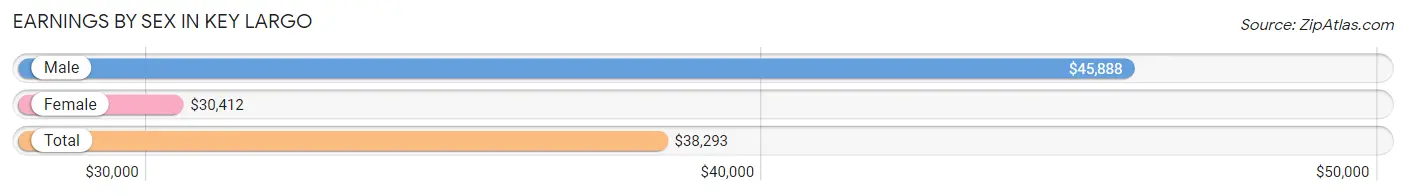
Earnings by Sex in Key Largo
Average Earnings in Key Largo are $38,293, $45,888 for men and $30,412 for women, a difference of 33.7%.
| Sex | Number | Average Earnings |
| Male | 3,656 (56.1%) | $45,888 |
| Female | 2,855 (43.9%) | $30,412 |
| Total | 6,511 (100.0%) | $38,293 |
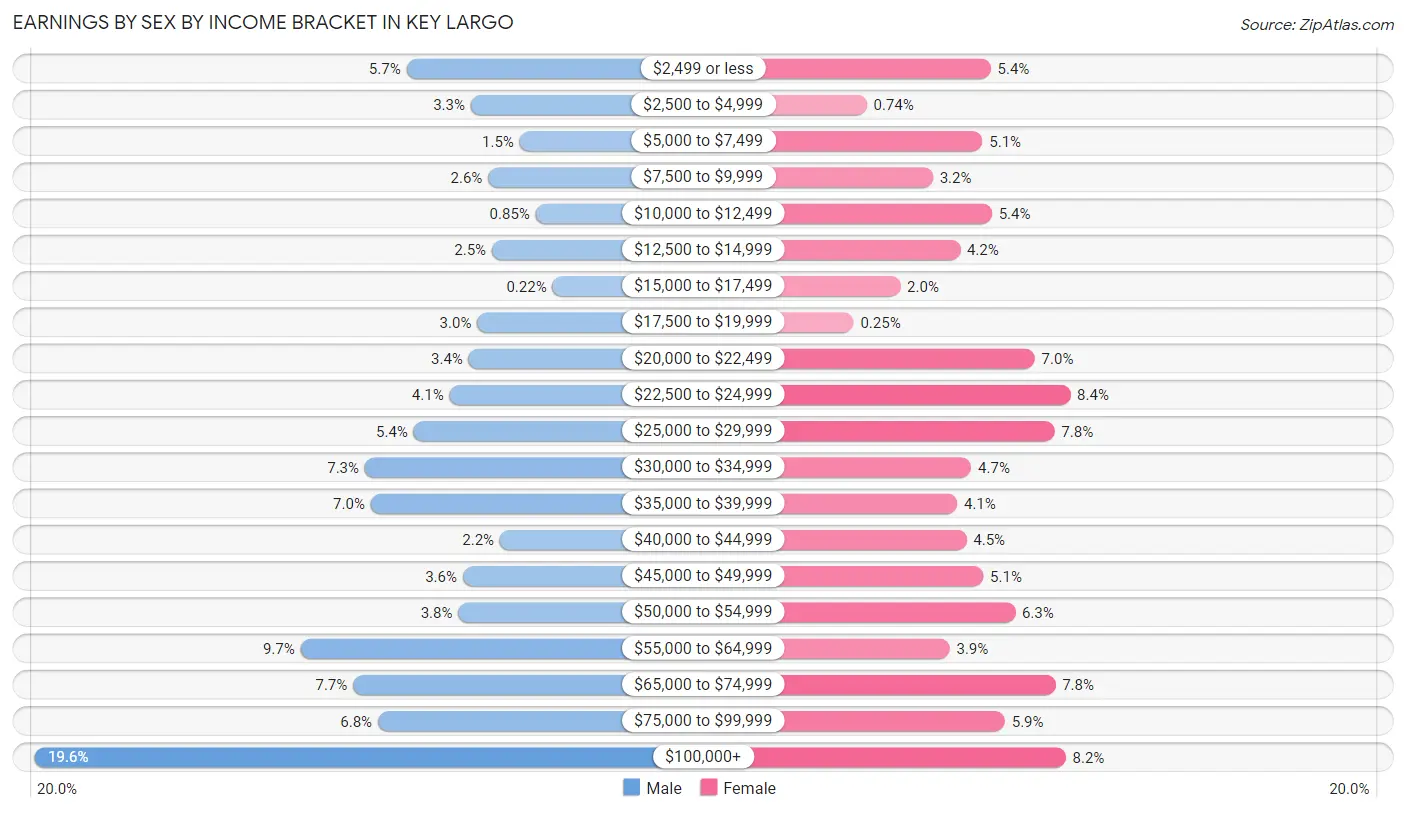
Earnings by Sex by Income Bracket in Key Largo
The most common earnings brackets in Key Largo are $100,000+ for men (717 | 19.6%) and $22,500 to $24,999 for women (239 | 8.4%).
| Income | Male | Female |
| $2,499 or less | 208 (5.7%) | 154 (5.4%) |
| $2,500 to $4,999 | 120 (3.3%) | 21 (0.7%) |
| $5,000 to $7,499 | 53 (1.5%) | 145 (5.1%) |
| $7,500 to $9,999 | 96 (2.6%) | 92 (3.2%) |
| $10,000 to $12,499 | 31 (0.9%) | 155 (5.4%) |
| $12,500 to $14,999 | 91 (2.5%) | 121 (4.2%) |
| $15,000 to $17,499 | 8 (0.2%) | 57 (2.0%) |
| $17,500 to $19,999 | 111 (3.0%) | 7 (0.3%) |
| $20,000 to $22,499 | 123 (3.4%) | 201 (7.0%) |
| $22,500 to $24,999 | 149 (4.1%) | 239 (8.4%) |
| $25,000 to $29,999 | 198 (5.4%) | 222 (7.8%) |
| $30,000 to $34,999 | 265 (7.2%) | 133 (4.7%) |
| $35,000 to $39,999 | 257 (7.0%) | 118 (4.1%) |
| $40,000 to $44,999 | 80 (2.2%) | 128 (4.5%) |
| $45,000 to $49,999 | 131 (3.6%) | 146 (5.1%) |
| $50,000 to $54,999 | 137 (3.7%) | 180 (6.3%) |
| $55,000 to $64,999 | 353 (9.7%) | 110 (3.8%) |
| $65,000 to $74,999 | 281 (7.7%) | 223 (7.8%) |
| $75,000 to $99,999 | 247 (6.8%) | 169 (5.9%) |
| $100,000+ | 717 (19.6%) | 234 (8.2%) |
| Total | 3,656 (100.0%) | 2,855 (100.0%) |
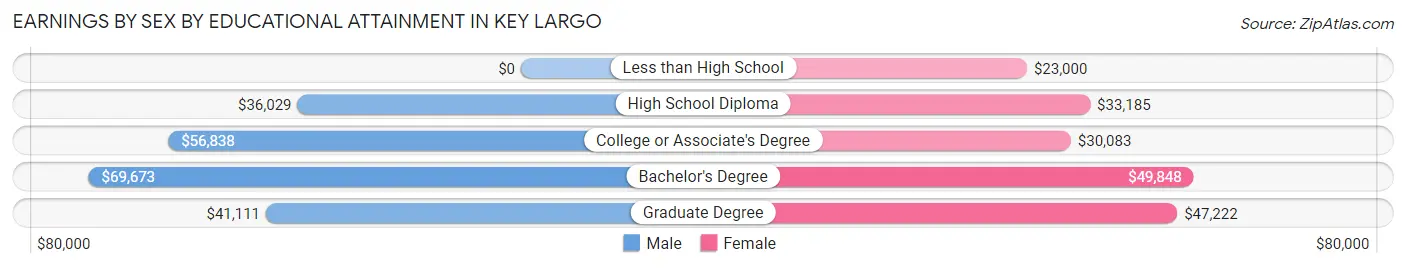
Earnings by Sex by Educational Attainment in Key Largo
Average earnings in Key Largo are $50,808 for men and $36,563 for women, a difference of 28.0%. Men with an educational attainment of bachelor's degree enjoy the highest average annual earnings of $69,673, while those with high school diploma education earn the least with $36,029. Women with an educational attainment of bachelor's degree earn the most with the average annual earnings of $49,848, while those with less than high school education have the smallest earnings of $23,000.
| Educational Attainment | Male Income | Female Income |
| Less than High School | - | - |
| High School Diploma | $36,029 | $33,185 |
| College or Associate's Degree | $56,838 | $30,083 |
| Bachelor's Degree | $69,673 | $49,848 |
| Graduate Degree | $41,111 | $47,222 |
| Total | $50,808 | $36,563 |
Family Income in Key Largo
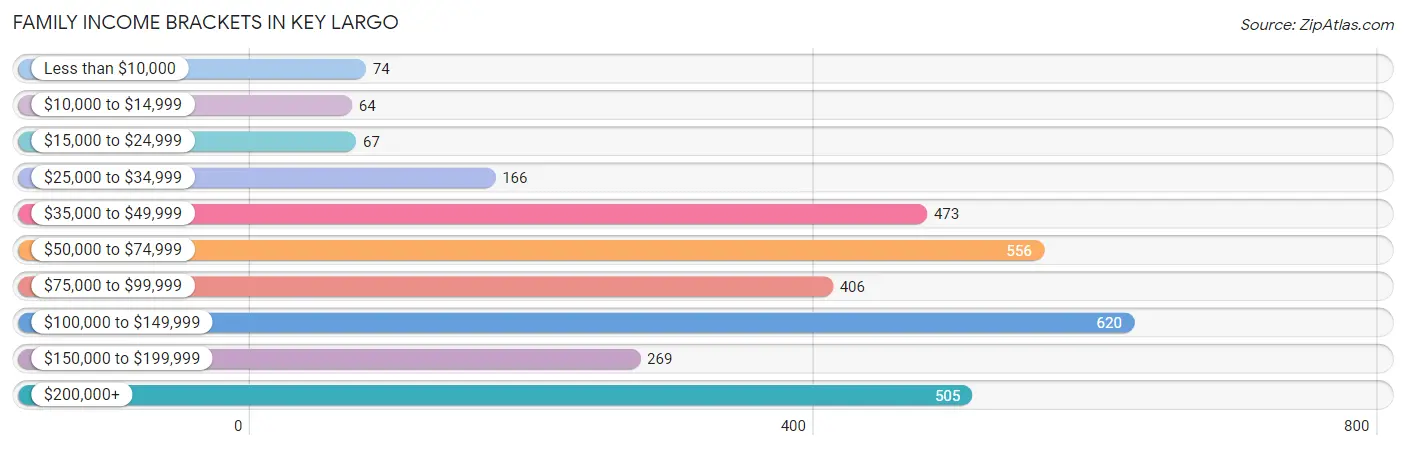
Family Income Brackets in Key Largo
According to the Key Largo family income data, there are 620 families falling into the $100,000 to $149,999 income range, which is the most common income bracket and makes up 19.4% of all families. Conversely, the $10,000 to $14,999 income bracket is the least frequent group with only 64 families (2.0%) belonging to this category.
| Income Bracket | # Families | % Families |
| Less than $10,000 | 74 | 2.3% |
| $10,000 to $14,999 | 64 | 2.0% |
| $15,000 to $24,999 | 67 | 2.1% |
| $25,000 to $34,999 | 166 | 5.2% |
| $35,000 to $49,999 | 473 | 14.8% |
| $50,000 to $74,999 | 556 | 17.4% |
| $75,000 to $99,999 | 406 | 12.7% |
| $100,000 to $149,999 | 620 | 19.4% |
| $150,000 to $199,999 | 269 | 8.4% |
| $200,000+ | 505 | 15.8% |
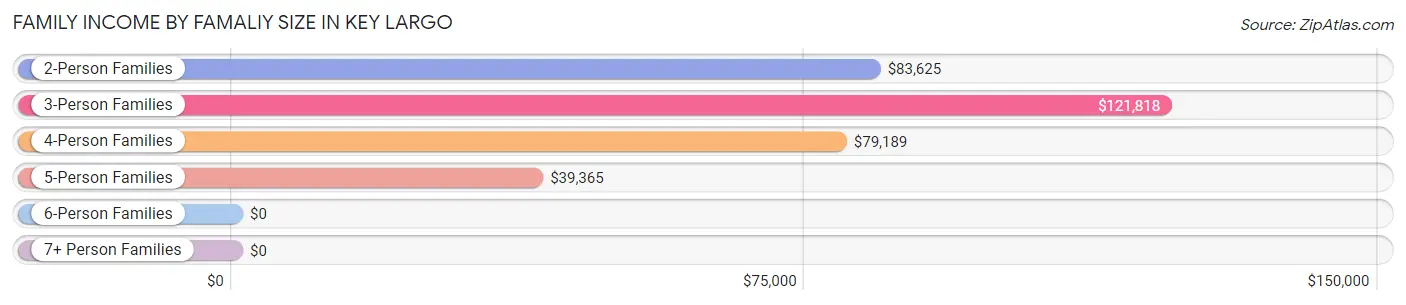
Family Income by Famaliy Size in Key Largo
3-person families (668 | 20.9%) account for the highest median family income in Key Largo with $121,818 per family, while 2-person families (1,992 | 62.3%) have the highest median income of $41,812 per family member.
| Income Bracket | # Families | Median Income |
| 2-Person Families | 1,992 (62.3%) | $83,625 |
| 3-Person Families | 668 (20.9%) | $121,818 |
| 4-Person Families | 302 (9.5%) | $79,189 |
| 5-Person Families | 198 (6.2%) | $39,365 |
| 6-Person Families | 37 (1.2%) | $0 |
| 7+ Person Families | 0 (0.0%) | $0 |
| Total | 3,197 (100.0%) | $79,904 |
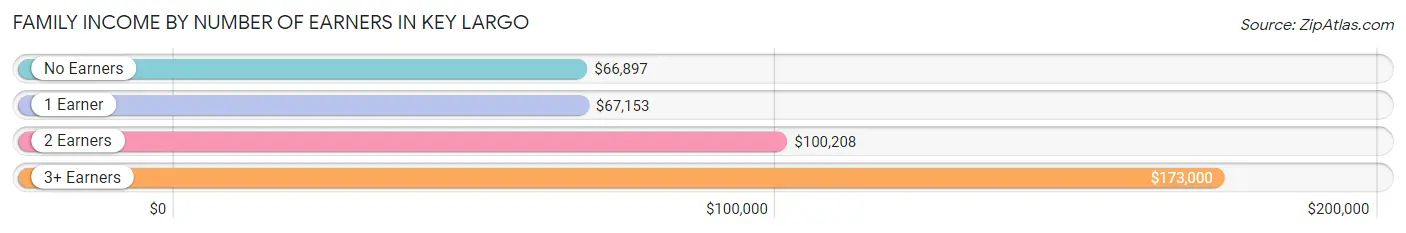
Family Income by Number of Earners in Key Largo
The median family income in Key Largo is $79,904, with families comprising 3+ earners (198) having the highest median family income of $173,000, while families with no earners (754) have the lowest median family income of $66,897, accounting for 6.2% and 23.6% of families, respectively.
| Number of Earners | # Families | Median Income |
| No Earners | 754 (23.6%) | $66,897 |
| 1 Earner | 955 (29.9%) | $67,153 |
| 2 Earners | 1,290 (40.4%) | $100,208 |
| 3+ Earners | 198 (6.2%) | $173,000 |
| Total | 3,197 (100.0%) | $79,904 |
Household Income in Key Largo
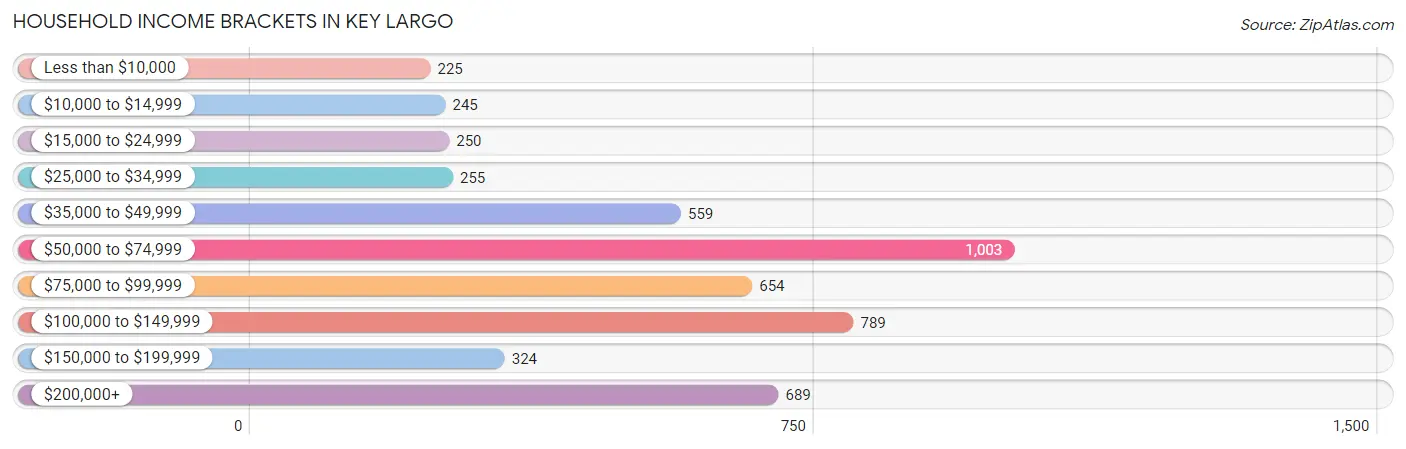
Household Income Brackets in Key Largo
With 1,003 households falling in the category, the $50,000 to $74,999 income range is the most frequent in Key Largo, accounting for 20.1% of all households. In contrast, only 225 households (4.5%) fall into the less than $10,000 income bracket, making it the least populous group.
| Income Bracket | # Households | % Households |
| Less than $10,000 | 225 | 4.5% |
| $10,000 to $14,999 | 245 | 4.9% |
| $15,000 to $24,999 | 250 | 5.0% |
| $25,000 to $34,999 | 255 | 5.1% |
| $35,000 to $49,999 | 559 | 11.2% |
| $50,000 to $74,999 | 1,003 | 20.1% |
| $75,000 to $99,999 | 654 | 13.1% |
| $100,000 to $149,999 | 789 | 15.8% |
| $150,000 to $199,999 | 324 | 6.5% |
| $200,000+ | 689 | 13.8% |
Household Income by Householder Age in Key Largo
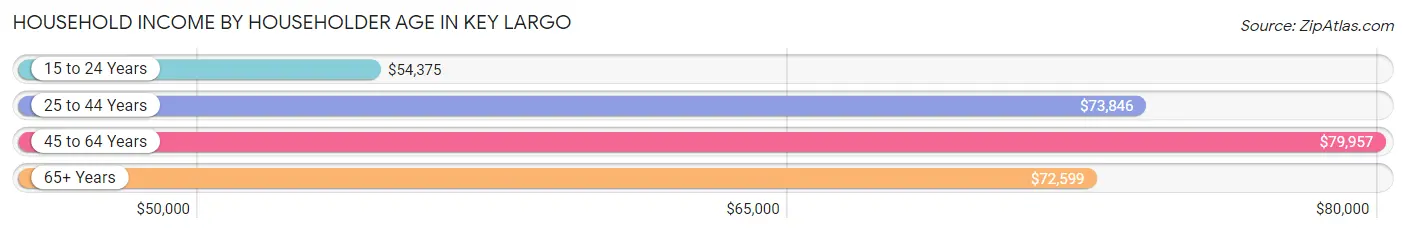
The median household income in Key Largo is $74,239, with the highest median household income of $79,957 found in the 45 to 64 years age bracket for the primary householder. A total of 2,007 households (40.2%) fall into this category. Meanwhile, the 15 to 24 years age bracket for the primary householder has the lowest median household income of $54,375, with 69 households (1.4%) in this group.
| Income Bracket | # Households | Median Income |
| 15 to 24 Years | 69 (1.4%) | $54,375 |
| 25 to 44 Years | 1,086 (21.7%) | $73,846 |
| 45 to 64 Years | 2,007 (40.2%) | $79,957 |
| 65+ Years | 1,830 (36.7%) | $72,599 |
| Total | 4,992 (100.0%) | $74,239 |
Poverty in Key Largo
Income Below Poverty by Sex and Age in Key Largo
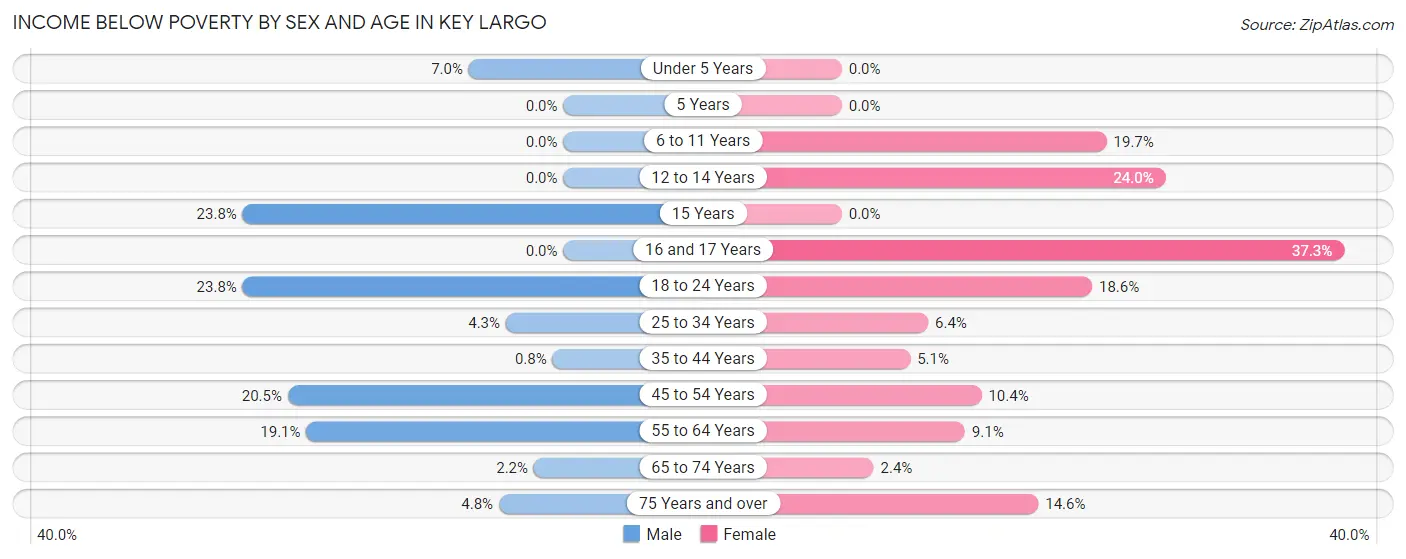
With 9.5% poverty level for males and 10.1% for females among the residents of Key Largo, 15 year old males and 16 and 17 year old females are the most vulnerable to poverty, with 5 males (23.8%) and 44 females (37.3%) in their respective age groups living below the poverty level.
| Age Bracket | Male | Female |
| Under 5 Years | 12 (7.0%) | 0 (0.0%) |
| 5 Years | 0 (0.0%) | 0 (0.0%) |
| 6 to 11 Years | 0 (0.0%) | 58 (19.7%) |
| 12 to 14 Years | 0 (0.0%) | 62 (24.0%) |
| 15 Years | 5 (23.8%) | 0 (0.0%) |
| 16 and 17 Years | 0 (0.0%) | 44 (37.3%) |
| 18 to 24 Years | 100 (23.8%) | 55 (18.6%) |
| 25 to 34 Years | 27 (4.3%) | 25 (6.4%) |
| 35 to 44 Years | 7 (0.8%) | 40 (5.1%) |
| 45 to 54 Years | 195 (20.5%) | 78 (10.4%) |
| 55 to 64 Years | 187 (19.1%) | 90 (9.1%) |
| 65 to 74 Years | 18 (2.2%) | 24 (2.4%) |
| 75 Years and over | 31 (4.8%) | 117 (14.6%) |
| Total | 582 (9.5%) | 593 (10.1%) |
Income Above Poverty by Sex and Age in Key Largo
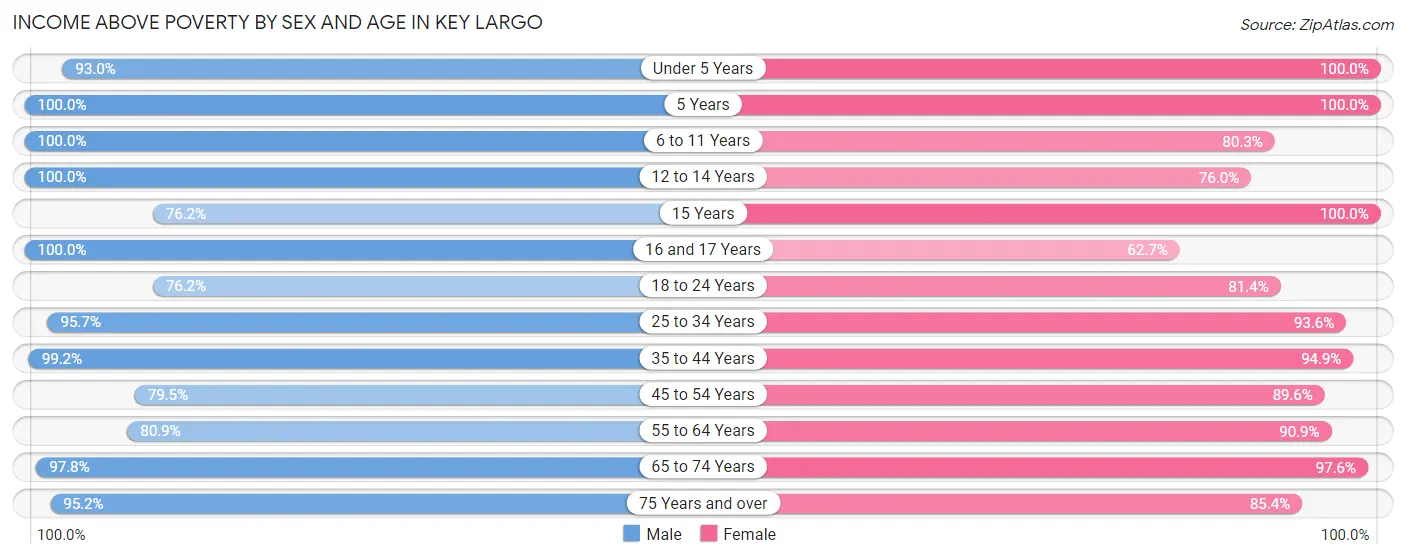
According to the poverty statistics in Key Largo, males aged 5 years and females aged under 5 years are the age groups that are most secure financially, with 100.0% of males and 100.0% of females in these age groups living above the poverty line.
| Age Bracket | Male | Female |
| Under 5 Years | 159 (93.0%) | 158 (100.0%) |
| 5 Years | 103 (100.0%) | 8 (100.0%) |
| 6 to 11 Years | 154 (100.0%) | 237 (80.3%) |
| 12 to 14 Years | 231 (100.0%) | 196 (76.0%) |
| 15 Years | 16 (76.2%) | 9 (100.0%) |
| 16 and 17 Years | 100 (100.0%) | 74 (62.7%) |
| 18 to 24 Years | 320 (76.2%) | 241 (81.4%) |
| 25 to 34 Years | 605 (95.7%) | 365 (93.6%) |
| 35 to 44 Years | 873 (99.2%) | 748 (94.9%) |
| 45 to 54 Years | 758 (79.5%) | 674 (89.6%) |
| 55 to 64 Years | 793 (80.9%) | 895 (90.9%) |
| 65 to 74 Years | 804 (97.8%) | 993 (97.6%) |
| 75 Years and over | 618 (95.2%) | 685 (85.4%) |
| Total | 5,534 (90.5%) | 5,283 (89.9%) |
Income Below Poverty Among Married-Couple Families in Key Largo
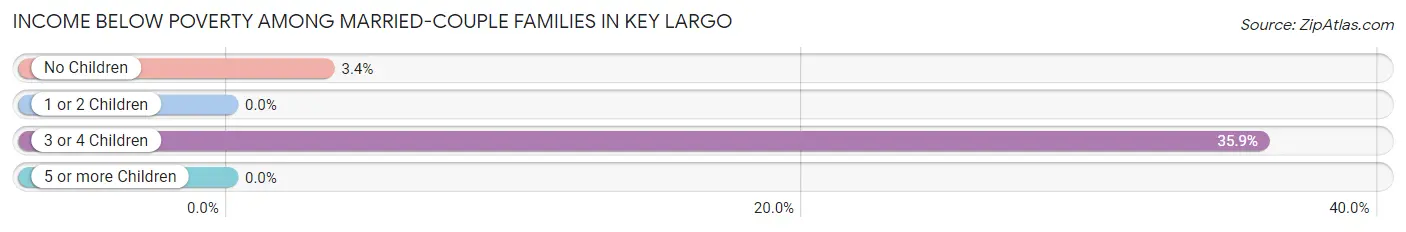
The poverty statistics for married-couple families in Key Largo show that 3.9% or 100 of the total 2,586 families live below the poverty line. Families with 3 or 4 children have the highest poverty rate of 35.9%, comprising of 37 families. On the other hand, families with 1 or 2 children have the lowest poverty rate of 0.0%, which includes 0 families.
| Children | Above Poverty | Below Poverty |
| No Children | 1,811 (96.6%) | 63 (3.4%) |
| 1 or 2 Children | 609 (100.0%) | 0 (0.0%) |
| 3 or 4 Children | 66 (64.1%) | 37 (35.9%) |
| 5 or more Children | 0 (0.0%) | 0 (0.0%) |
| Total | 2,486 (96.1%) | 100 (3.9%) |
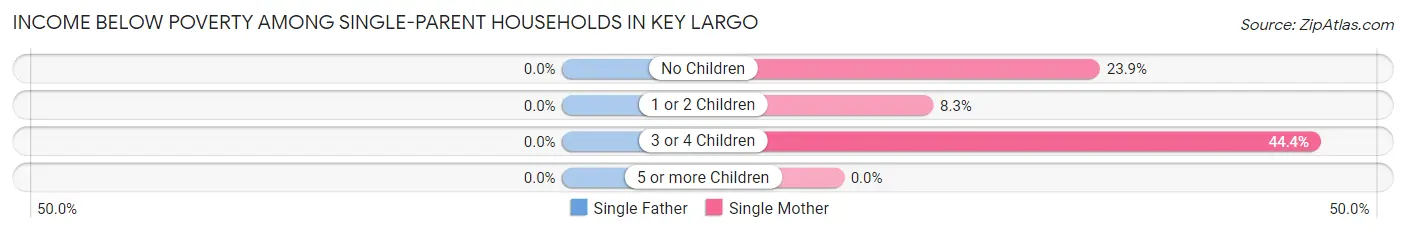
Income Below Poverty Among Single-Parent Households in Key Largo
| Children | Single Father | Single Mother |
| No Children | 0 (0.0%) | 63 (23.9%) |
| 1 or 2 Children | 0 (0.0%) | 10 (8.3%) |
| 3 or 4 Children | 0 (0.0%) | 8 (44.4%) |
| 5 or more Children | 0 (0.0%) | 0 (0.0%) |
| Total | 0 (0.0%) | 81 (20.2%) |
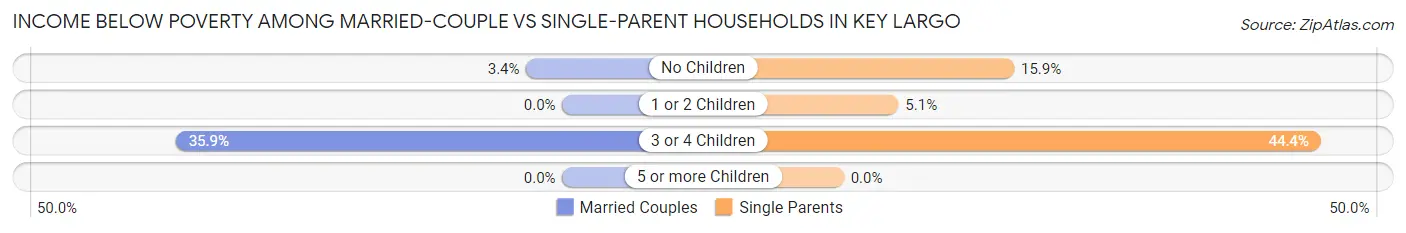
Income Below Poverty Among Married-Couple vs Single-Parent Households in Key Largo
The poverty data for Key Largo shows that 100 of the married-couple family households (3.9%) and 81 of the single-parent households (13.3%) are living below the poverty level. Within the married-couple family households, those with 3 or 4 children have the highest poverty rate, with 37 households (35.9%) falling below the poverty line. Among the single-parent households, those with 3 or 4 children have the highest poverty rate, with 8 household (44.4%) living below poverty.
| Children | Married-Couple Families | Single-Parent Households |
| No Children | 63 (3.4%) | 63 (15.9%) |
| 1 or 2 Children | 0 (0.0%) | 10 (5.1%) |
| 3 or 4 Children | 37 (35.9%) | 8 (44.4%) |
| 5 or more Children | 0 (0.0%) | 0 (0.0%) |
| Total | 100 (3.9%) | 81 (13.3%) |
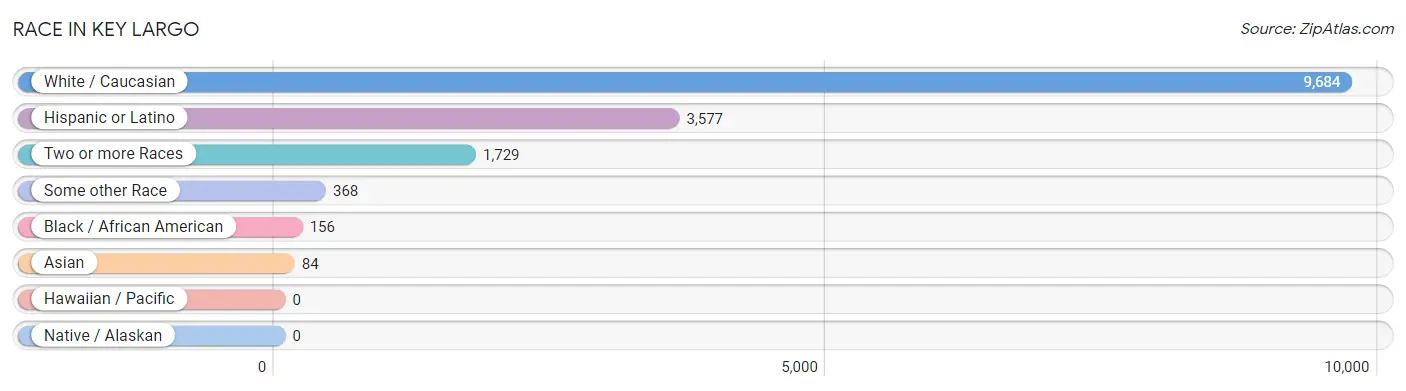
Race in Key Largo
The most populous races in Key Largo are White / Caucasian (9,684 | 80.6%), Hispanic or Latino (3,577 | 29.8%), and Two or more Races (1,729 | 14.4%).
| Race | # Population | % Population |
| Asian | 84 | 0.7% |
| Black / African American | 156 | 1.3% |
| Hawaiian / Pacific | 0 | 0.0% |
| Hispanic or Latino | 3,577 | 29.8% |
| Native / Alaskan | 0 | 0.0% |
| White / Caucasian | 9,684 | 80.6% |
| Two or more Races | 1,729 | 14.4% |
| Some other Race | 368 | 3.1% |
| Total | 12,021 | 100.0% |
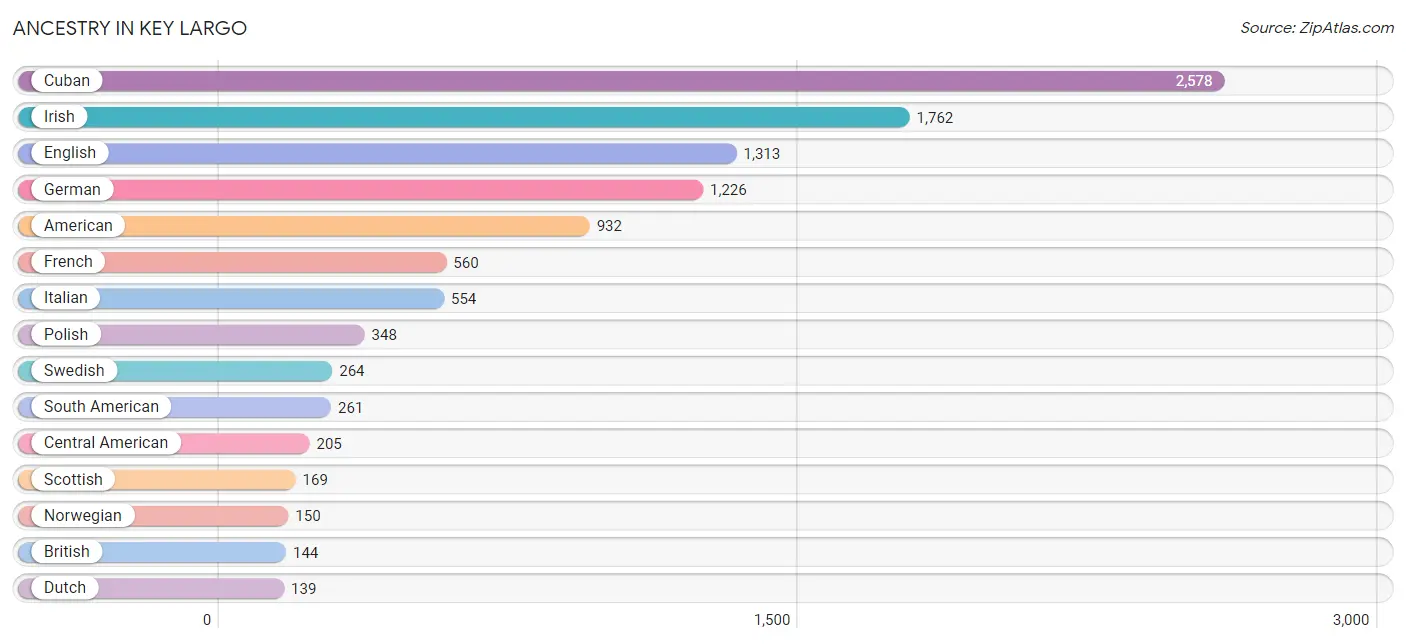
Ancestry in Key Largo
The most populous ancestries reported in Key Largo are Cuban (2,578 | 21.4%), Irish (1,762 | 14.7%), English (1,313 | 10.9%), German (1,226 | 10.2%), and American (932 | 7.7%), together accounting for 65.0% of all Key Largo residents.
| Ancestry | # Population | % Population |
| African | 2 | 0.0% |
| American | 932 | 7.7% |
| Arab | 44 | 0.4% |
| Argentinean | 47 | 0.4% |
| Australian | 7 | 0.1% |
| Austrian | 49 | 0.4% |
| Bahamian | 5 | 0.0% |
| Basque | 27 | 0.2% |
| Belgian | 25 | 0.2% |
| British | 144 | 1.2% |
| Canadian | 66 | 0.5% |
| Central American | 205 | 1.7% |
| Central American Indian | 16 | 0.1% |
| Cherokee | 43 | 0.4% |
| Chilean | 45 | 0.4% |
| Colombian | 42 | 0.4% |
| Cuban | 2,578 | 21.4% |
| Czech | 32 | 0.3% |
| Czechoslovakian | 23 | 0.2% |
| Danish | 8 | 0.1% |
| Dominican | 34 | 0.3% |
| Dutch | 139 | 1.2% |
| Dutch West Indian | 32 | 0.3% |
| Eastern European | 31 | 0.3% |
| English | 1,313 | 10.9% |
| European | 105 | 0.9% |
| Finnish | 16 | 0.1% |
| French | 560 | 4.7% |
| French Canadian | 18 | 0.2% |
| German | 1,226 | 10.2% |
| Greek | 25 | 0.2% |
| Guatemalan | 73 | 0.6% |
| Honduran | 36 | 0.3% |
| Hungarian | 24 | 0.2% |
| Indian (Asian) | 4 | 0.0% |
| Irish | 1,762 | 14.7% |
| Italian | 554 | 4.6% |
| Jamaican | 1 | 0.0% |
| Korean | 12 | 0.1% |
| Latvian | 19 | 0.2% |
| Lithuanian | 57 | 0.5% |
| Malaysian | 9 | 0.1% |
| Mexican | 124 | 1.0% |
| Nicaraguan | 96 | 0.8% |
| Norwegian | 150 | 1.3% |
| Pakistani | 12 | 0.1% |
| Peruvian | 10 | 0.1% |
| Polish | 348 | 2.9% |
| Portuguese | 17 | 0.1% |
| Puerto Rican | 75 | 0.6% |
| Romanian | 4 | 0.0% |
| Russian | 44 | 0.4% |
| Scandinavian | 37 | 0.3% |
| Scotch-Irish | 85 | 0.7% |
| Scottish | 169 | 1.4% |
| Serbian | 13 | 0.1% |
| Slavic | 16 | 0.1% |
| Slovak | 64 | 0.5% |
| South African | 17 | 0.1% |
| South American | 261 | 2.2% |
| Spaniard | 42 | 0.4% |
| Spanish | 1 | 0.0% |
| Sri Lankan | 12 | 0.1% |
| Subsaharan African | 19 | 0.2% |
| Swedish | 264 | 2.2% |
| Swiss | 8 | 0.1% |
| Syrian | 44 | 0.4% |
| Thai | 76 | 0.6% |
| Trinidadian and Tobagonian | 1 | 0.0% |
| Ukrainian | 20 | 0.2% |
| Venezuelan | 117 | 1.0% |
| Welsh | 126 | 1.1% |
| West Indian | 9 | 0.1% |
| Yugoslavian | 23 | 0.2% | View All 74 Rows |
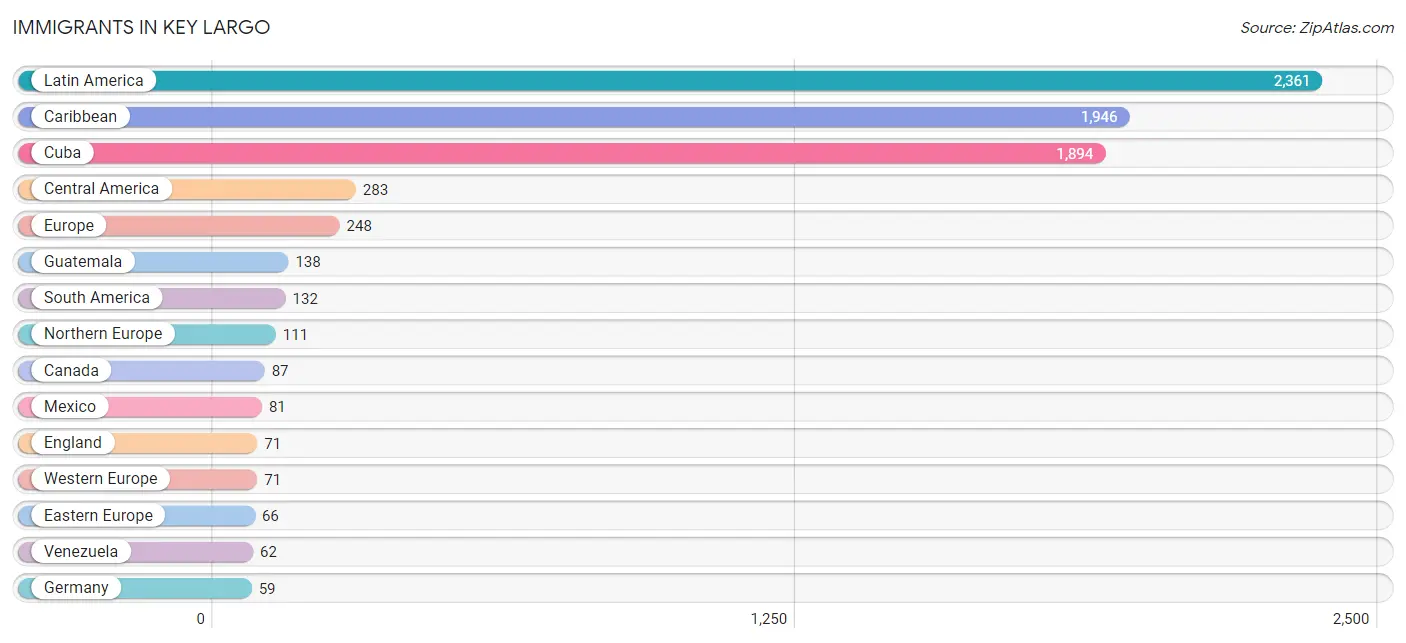
Immigrants in Key Largo
The most numerous immigrant groups reported in Key Largo came from Latin America (2,361 | 19.6%), Caribbean (1,946 | 16.2%), Cuba (1,894 | 15.8%), Central America (283 | 2.4%), and Europe (248 | 2.1%), together accounting for 56.0% of all Key Largo residents.
| Immigration Origin | # Population | % Population |
| Argentina | 18 | 0.2% |
| Asia | 27 | 0.2% |
| Australia | 12 | 0.1% |
| Bahamas | 5 | 0.0% |
| Canada | 87 | 0.7% |
| Caribbean | 1,946 | 16.2% |
| Central America | 283 | 2.4% |
| Colombia | 42 | 0.4% |
| Costa Rica | 8 | 0.1% |
| Cuba | 1,894 | 15.8% |
| Czechoslovakia | 12 | 0.1% |
| Dominican Republic | 34 | 0.3% |
| Eastern Europe | 66 | 0.5% |
| England | 71 | 0.6% |
| Europe | 248 | 2.1% |
| France | 12 | 0.1% |
| Germany | 59 | 0.5% |
| Guatemala | 138 | 1.1% |
| Honduras | 1 | 0.0% |
| Laos | 9 | 0.1% |
| Latin America | 2,361 | 19.6% |
| Mexico | 81 | 0.7% |
| Nicaragua | 55 | 0.5% |
| Northern Europe | 111 | 0.9% |
| Oceania | 12 | 0.1% |
| Peru | 10 | 0.1% |
| Poland | 16 | 0.1% |
| Russia | 38 | 0.3% |
| South America | 132 | 1.1% |
| South Eastern Asia | 27 | 0.2% |
| Thailand | 6 | 0.1% |
| Venezuela | 62 | 0.5% |
| Vietnam | 12 | 0.1% |
| Western Europe | 71 | 0.6% | View All 34 Rows |
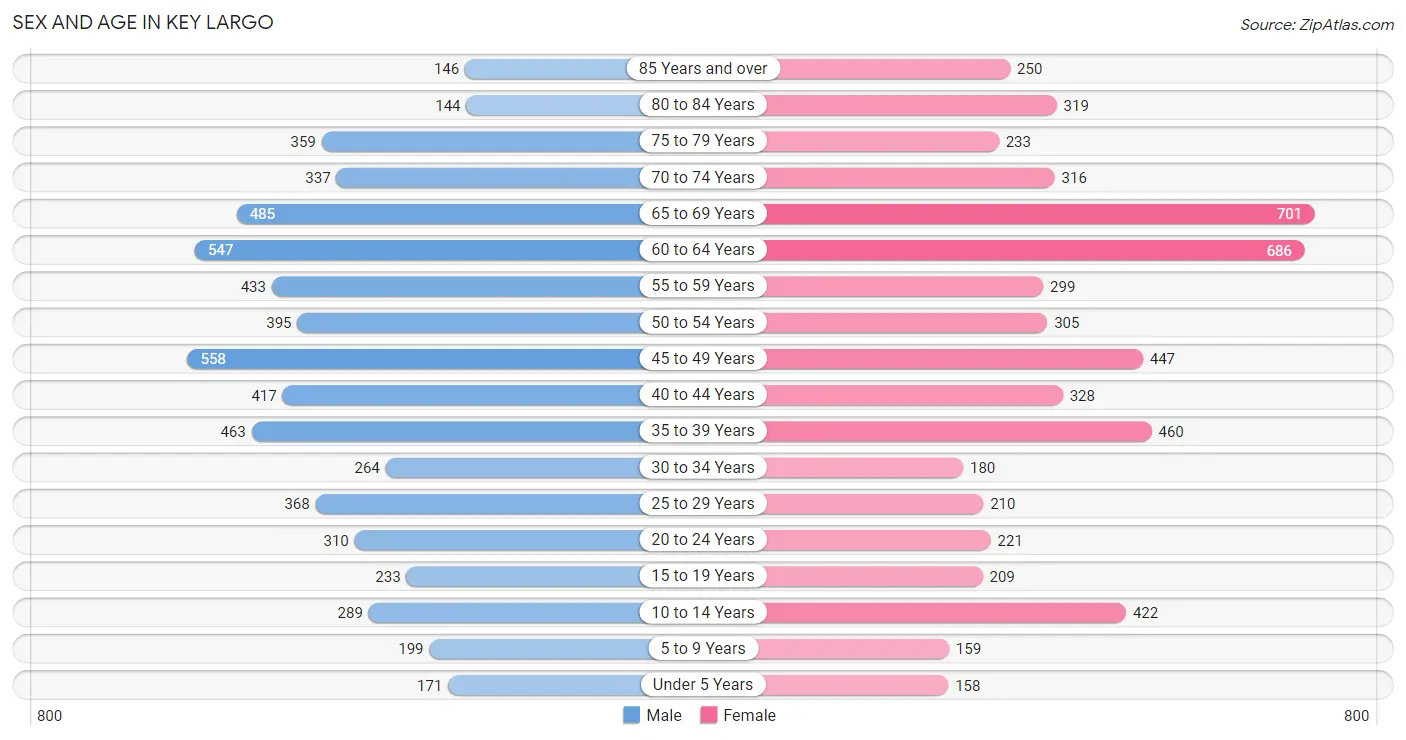
Sex and Age in Key Largo
Sex and Age in Key Largo
The most populous age groups in Key Largo are 45 to 49 Years (558 | 9.1%) for men and 65 to 69 Years (701 | 11.9%) for women.
| Age Bracket | Male | Female |
| Under 5 Years | 171 (2.8%) | 158 (2.7%) |
| 5 to 9 Years | 199 (3.3%) | 159 (2.7%) |
| 10 to 14 Years | 289 (4.7%) | 422 (7.1%) |
| 15 to 19 Years | 233 (3.8%) | 209 (3.5%) |
| 20 to 24 Years | 310 (5.1%) | 221 (3.7%) |
| 25 to 29 Years | 368 (6.0%) | 210 (3.6%) |
| 30 to 34 Years | 264 (4.3%) | 180 (3.0%) |
| 35 to 39 Years | 463 (7.6%) | 460 (7.8%) |
| 40 to 44 Years | 417 (6.8%) | 328 (5.6%) |
| 45 to 49 Years | 558 (9.1%) | 447 (7.6%) |
| 50 to 54 Years | 395 (6.5%) | 305 (5.2%) |
| 55 to 59 Years | 433 (7.1%) | 299 (5.1%) |
| 60 to 64 Years | 547 (8.9%) | 686 (11.6%) |
| 65 to 69 Years | 485 (7.9%) | 701 (11.9%) |
| 70 to 74 Years | 337 (5.5%) | 316 (5.3%) |
| 75 to 79 Years | 359 (5.9%) | 233 (4.0%) |
| 80 to 84 Years | 144 (2.4%) | 319 (5.4%) |
| 85 Years and over | 146 (2.4%) | 250 (4.2%) |
| Total | 6,118 (100.0%) | 5,903 (100.0%) |
Families and Households in Key Largo
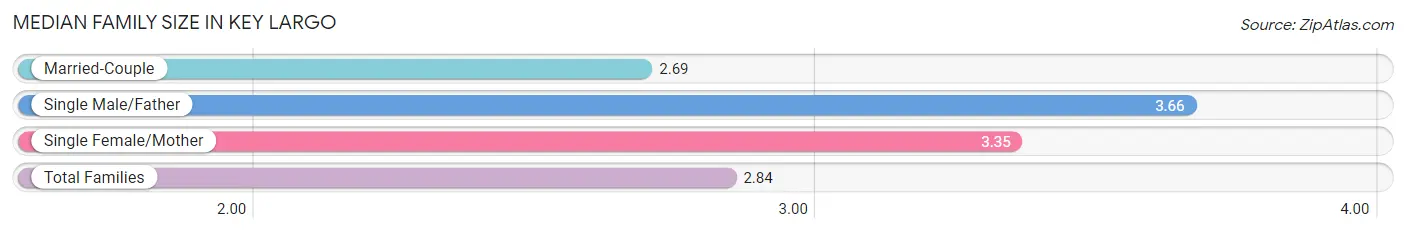
Median Family Size in Key Largo
The median family size in Key Largo is 2.84 persons per family, with single male/father families (209 | 6.5%) accounting for the largest median family size of 3.66 persons per family. On the other hand, married-couple families (2,586 | 80.9%) represent the smallest median family size with 2.69 persons per family.
| Family Type | # Families | Family Size |
| Married-Couple | 2,586 (80.9%) | 2.69 |
| Single Male/Father | 209 (6.5%) | 3.66 |
| Single Female/Mother | 402 (12.6%) | 3.35 |
| Total Families | 3,197 (100.0%) | 2.84 |
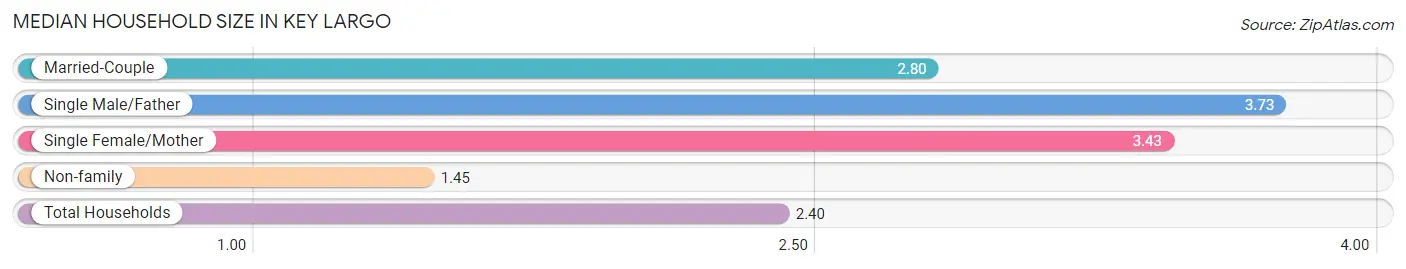
Median Household Size in Key Largo
The median household size in Key Largo is 2.40 persons per household, with single male/father households (209 | 4.2%) accounting for the largest median household size of 3.73 persons per household. non-family households (1,795 | 36.0%) represent the smallest median household size with 1.45 persons per household.
| Household Type | # Households | Household Size |
| Married-Couple | 2,586 (51.8%) | 2.80 |
| Single Male/Father | 209 (4.2%) | 3.73 |
| Single Female/Mother | 402 (8.1%) | 3.43 |
| Non-family | 1,795 (36.0%) | 1.45 |
| Total Households | 4,992 (100.0%) | 2.40 |
Household Size by Marriage Status in Key Largo
Out of a total of 4,992 households in Key Largo, 3,197 (64.0%) are family households, while 1,795 (36.0%) are nonfamily households. The most numerous type of family households are 2-person households, comprising 1,915, and the most common type of nonfamily households are 1-person households, comprising 1,284.
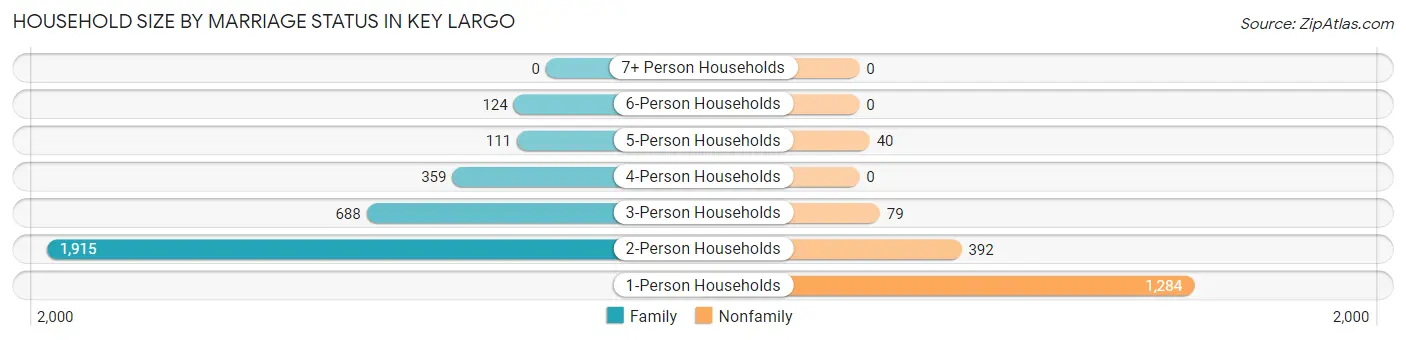
| Household Size | Family Households | Nonfamily Households |
| 1-Person Households | - | 1,284 (25.7%) |
| 2-Person Households | 1,915 (38.4%) | 392 (7.9%) |
| 3-Person Households | 688 (13.8%) | 79 (1.6%) |
| 4-Person Households | 359 (7.2%) | 0 (0.0%) |
| 5-Person Households | 111 (2.2%) | 40 (0.8%) |
| 6-Person Households | 124 (2.5%) | 0 (0.0%) |
| 7+ Person Households | 0 (0.0%) | 0 (0.0%) |
| Total | 3,197 (64.0%) | 1,795 (36.0%) |
Female Fertility in Key Largo
Fertility by Age in Key Largo
Average fertility rate in Key Largo is 19.0 births per 1,000 women. Women in the age bracket of 20 to 34 years have the highest fertility rate with 65.0 births per 1,000 women. Women in the age bracket of 20 to 34 years acount for 100.0% of all women with births.
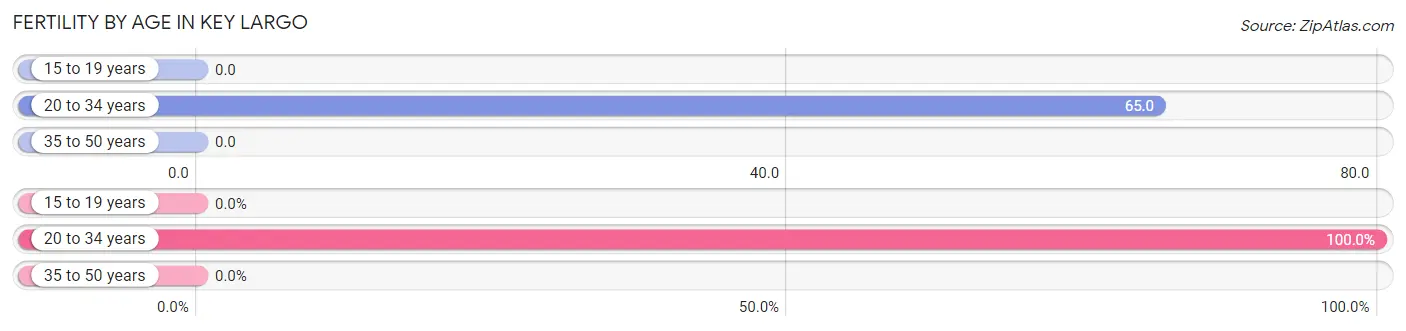
| Age Bracket | Women with Births | Births / 1,000 Women |
| 15 to 19 years | 0 (0.0%) | 0.0 |
| 20 to 34 years | 40 (100.0%) | 65.0 |
| 35 to 50 years | 0 (0.0%) | 0.0 |
| Total | 40 (100.0%) | 19.0 |
Fertility by Age by Marriage Status in Key Largo
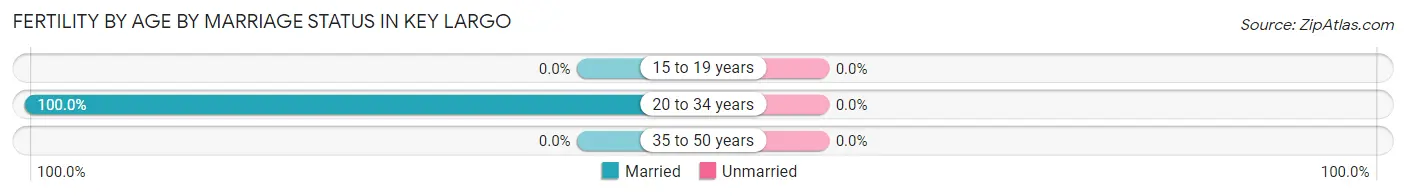
| Age Bracket | Married | Unmarried |
| 15 to 19 years | 0 (0.0%) | 0 (0.0%) |
| 20 to 34 years | 40 (100.0%) | 0 (0.0%) |
| 35 to 50 years | 0 (0.0%) | 0 (0.0%) |
| Total | 40 (100.0%) | 0 (0.0%) |
Fertility by Education in Key Largo
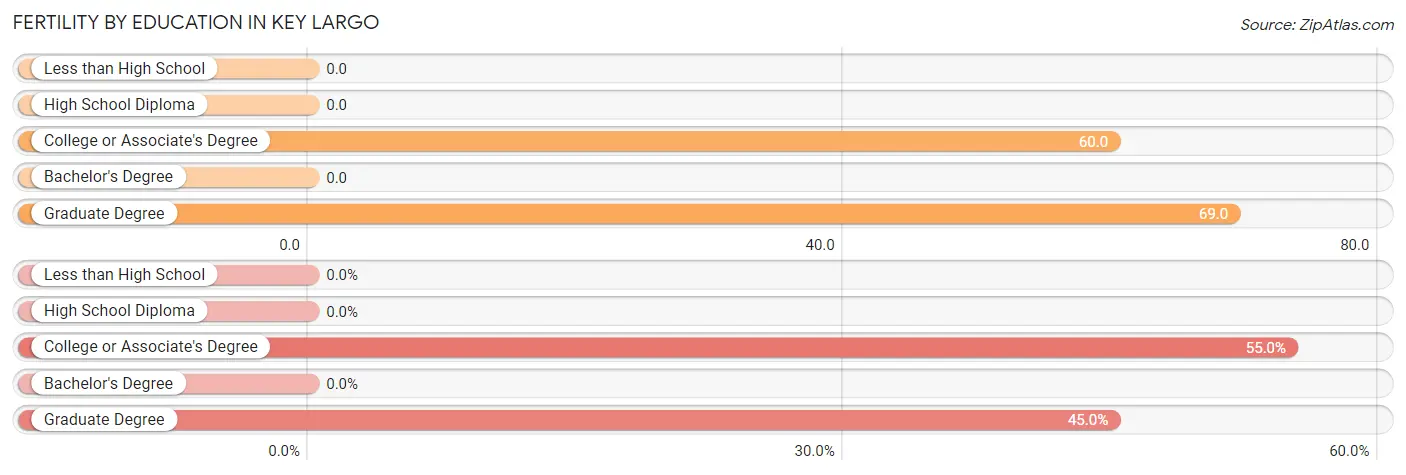
| Educational Attainment | Women with Births | Births / 1,000 Women |
| Less than High School | 0 (0.0%) | 0.0 |
| High School Diploma | 0 (0.0%) | 0.0 |
| College or Associate's Degree | 22 (55.0%) | 60.0 |
| Bachelor's Degree | 0 (0.0%) | 0.0 |
| Graduate Degree | 18 (45.0%) | 69.0 |
| Total | 40 (100.0%) | 19.0 |
Fertility by Education by Marriage Status in Key Largo
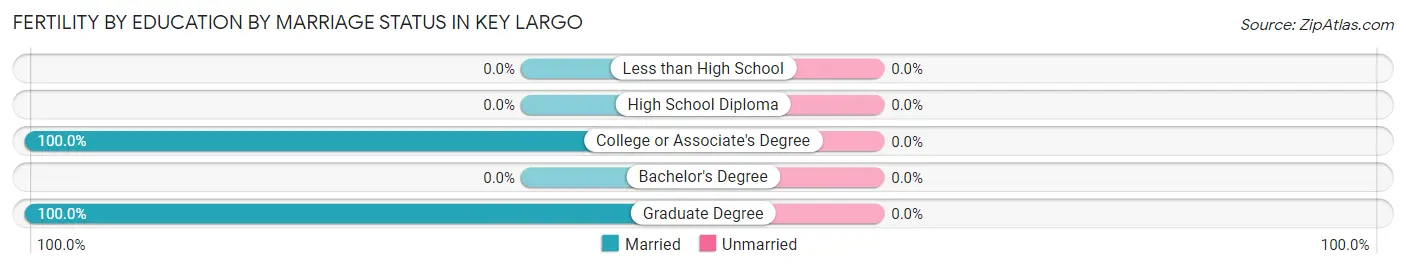
| Educational Attainment | Married | Unmarried |
| Less than High School | 0 (0.0%) | 0 (0.0%) |
| High School Diploma | 0 (0.0%) | 0 (0.0%) |
| College or Associate's Degree | 22 (100.0%) | 0 (0.0%) |
| Bachelor's Degree | 0 (0.0%) | 0 (0.0%) |
| Graduate Degree | 18 (100.0%) | 0 (0.0%) |
| Total | 40 (100.0%) | 0 (0.0%) |
Employment Characteristics in Key Largo
Employment by Class of Employer in Key Largo
Among the 5,867 employed individuals in Key Largo, private company employees (3,242 | 55.3%), self-employed (not incorporated) (649 | 11.1%), and local government employees (579 | 9.9%) make up the most common classes of employment.
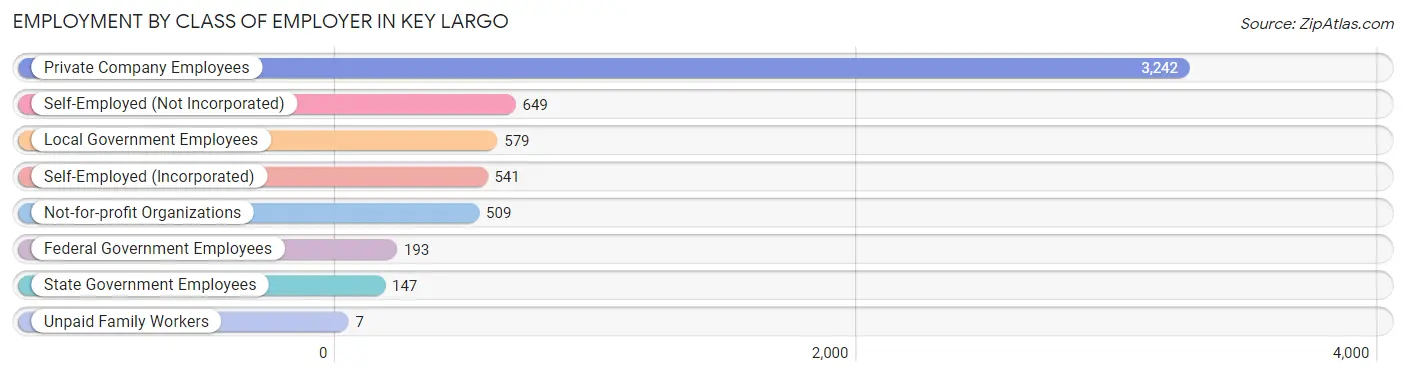
| Employer Class | # Employees | % Employees |
| Private Company Employees | 3,242 | 55.3% |
| Self-Employed (Incorporated) | 541 | 9.2% |
| Self-Employed (Not Incorporated) | 649 | 11.1% |
| Not-for-profit Organizations | 509 | 8.7% |
| Local Government Employees | 579 | 9.9% |
| State Government Employees | 147 | 2.5% |
| Federal Government Employees | 193 | 3.3% |
| Unpaid Family Workers | 7 | 0.1% |
| Total | 5,867 | 100.0% |
Employment Status by Age in Key Largo
According to the labor force statistics for Key Largo, out of the total population over 16 years of age (10,593), 58.7% or 6,218 individuals are in the labor force, with 5.2% or 323 of them unemployed. The age group with the highest labor force participation rate is 30 to 34 years, with 97.1% or 431 individuals in the labor force. Within the labor force, the 25 to 29 years age range has the highest percentage of unemployed individuals, with 21.8% or 112 of them being unemployed.

| Age Bracket | In Labor Force | Unemployed |
| 16 to 19 Years | 218 (52.9%) | 0 (0.0%) |
| 20 to 24 Years | 354 (66.7%) | 34 (9.7%) |
| 25 to 29 Years | 513 (88.8%) | 112 (21.8%) |
| 30 to 34 Years | 431 (97.1%) | 45 (10.4%) |
| 35 to 44 Years | 1,465 (87.8%) | 0 (0.0%) |
| 45 to 54 Years | 1,483 (87.0%) | 82 (5.5%) |
| 55 to 59 Years | 470 (64.2%) | 0 (0.0%) |
| 60 to 64 Years | 600 (48.7%) | 0 (0.0%) |
| 65 to 74 Years | 537 (29.2%) | 55 (10.2%) |
| 75 Years and over | 149 (10.3%) | 0 (0.0%) |
| Total | 6,218 (58.7%) | 323 (5.2%) |
Employment Status by Educational Attainment in Key Largo
According to labor force statistics for Key Largo, 78.0% of individuals (4,961) out of the total population between 25 and 64 years of age (6,360) are in the labor force, with 4.8% or 238 of them being unemployed. The group with the highest labor force participation rate are those with the educational attainment of bachelor's degree or higher, with 82.0% or 2,000 individuals in the labor force. Within the labor force, individuals with high school diploma education have the highest percentage of unemployment, with 7.6% or 109 of them being unemployed.
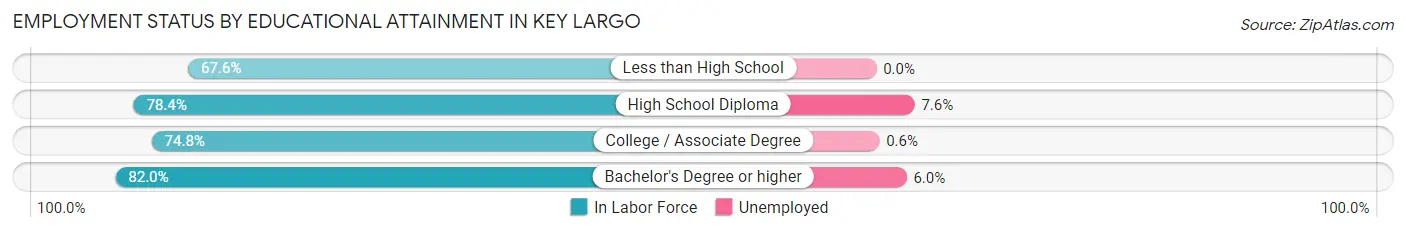
| Educational Attainment | In Labor Force | Unemployed |
| Less than High School | 359 (67.6%) | 0 (0.0%) |
| High School Diploma | 1,439 (78.4%) | 139 (7.6%) |
| College / Associate Degree | 1,163 (74.8%) | 9 (0.6%) |
| Bachelor's Degree or higher | 2,000 (82.0%) | 146 (6.0%) |
| Total | 4,961 (78.0%) | 305 (4.8%) |
Employment Occupations by Sex in Key Largo
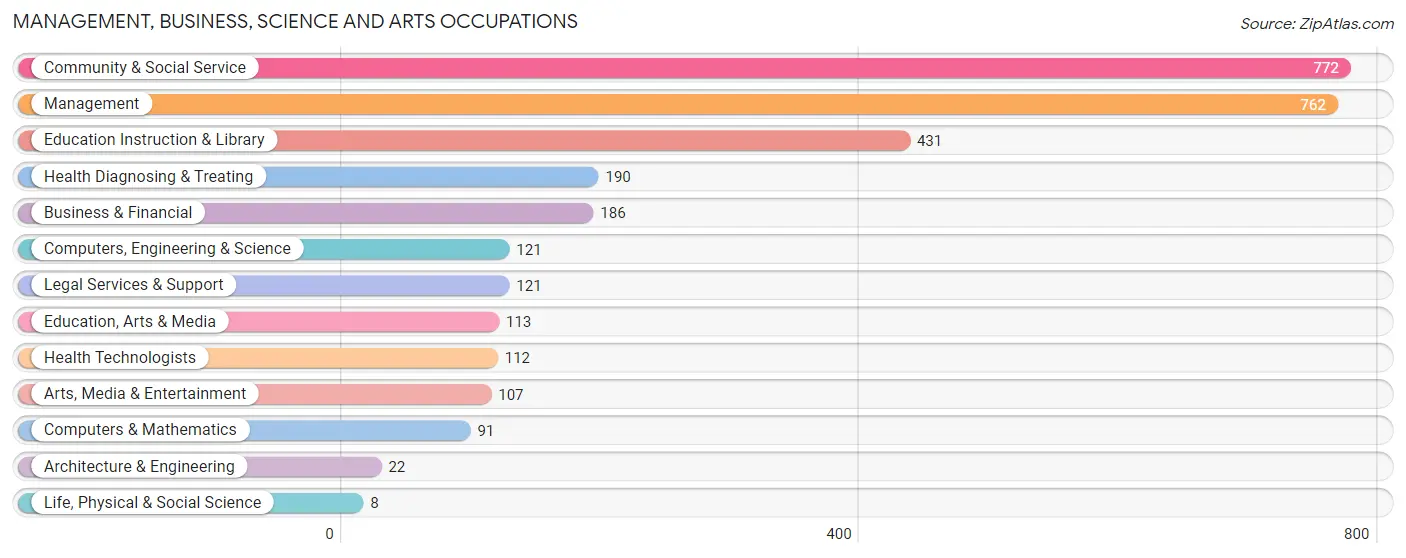
Management, Business, Science and Arts Occupations
The most common Management, Business, Science and Arts occupations in Key Largo are Community & Social Service (772 | 13.2%), Management (762 | 13.1%), Education Instruction & Library (431 | 7.4%), Health Diagnosing & Treating (190 | 3.3%), and Business & Financial (186 | 3.2%).
Management, Business, Science and Arts Occupations by Sex
Within the Management, Business, Science and Arts occupations in Key Largo, the most male-oriented occupations are Architecture & Engineering (100.0%), Life, Physical & Social Science (100.0%), and Computers, Engineering & Science (90.9%), while the most female-oriented occupations are Arts, Media & Entertainment (90.6%), Business & Financial (78.5%), and Education Instruction & Library (76.3%).
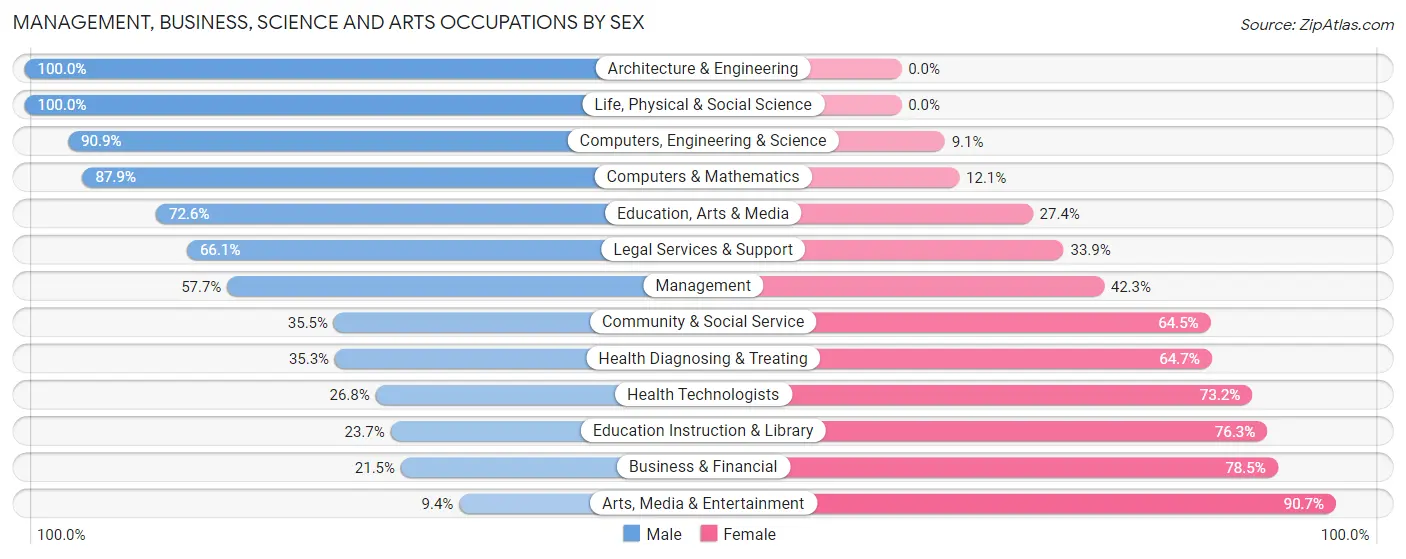
| Occupation | Male | Female |
| Management | 440 (57.7%) | 322 (42.3%) |
| Business & Financial | 40 (21.5%) | 146 (78.5%) |
| Computers, Engineering & Science | 110 (90.9%) | 11 (9.1%) |
| Computers & Mathematics | 80 (87.9%) | 11 (12.1%) |
| Architecture & Engineering | 22 (100.0%) | 0 (0.0%) |
| Life, Physical & Social Science | 8 (100.0%) | 0 (0.0%) |
| Community & Social Service | 274 (35.5%) | 498 (64.5%) |
| Education, Arts & Media | 82 (72.6%) | 31 (27.4%) |
| Legal Services & Support | 80 (66.1%) | 41 (33.9%) |
| Education Instruction & Library | 102 (23.7%) | 329 (76.3%) |
| Arts, Media & Entertainment | 10 (9.3%) | 97 (90.6%) |
| Health Diagnosing & Treating | 67 (35.3%) | 123 (64.7%) |
| Health Technologists | 30 (26.8%) | 82 (73.2%) |
| Total (Category) | 931 (45.8%) | 1,100 (54.2%) |
| Total (Overall) | 3,218 (55.2%) | 2,616 (44.8%) |
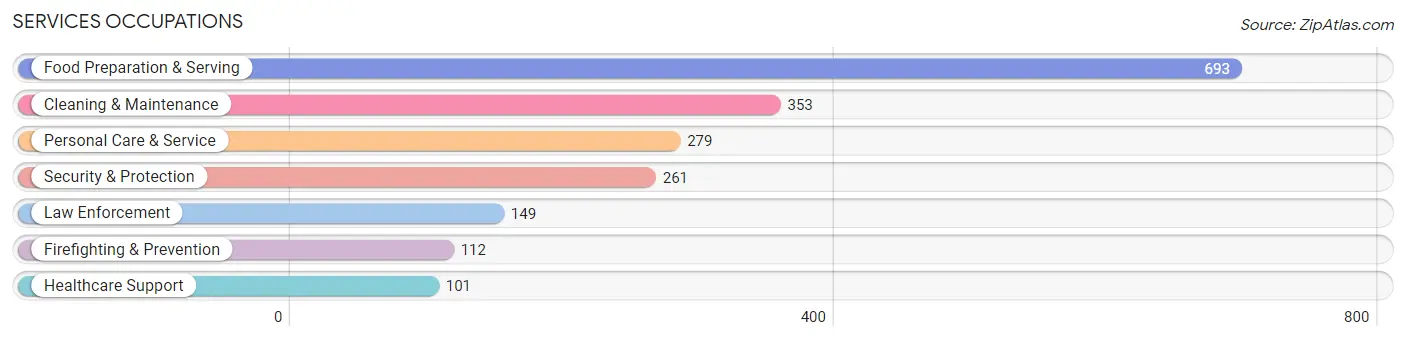
Services Occupations
The most common Services occupations in Key Largo are Food Preparation & Serving (693 | 11.9%), Cleaning & Maintenance (353 | 6.0%), Personal Care & Service (279 | 4.8%), Security & Protection (261 | 4.5%), and Law Enforcement (149 | 2.5%).
Services Occupations by Sex
Within the Services occupations in Key Largo, the most male-oriented occupations are Law Enforcement (82.6%), Security & Protection (80.8%), and Firefighting & Prevention (78.6%), while the most female-oriented occupations are Healthcare Support (88.1%), Personal Care & Service (63.4%), and Food Preparation & Serving (51.7%).
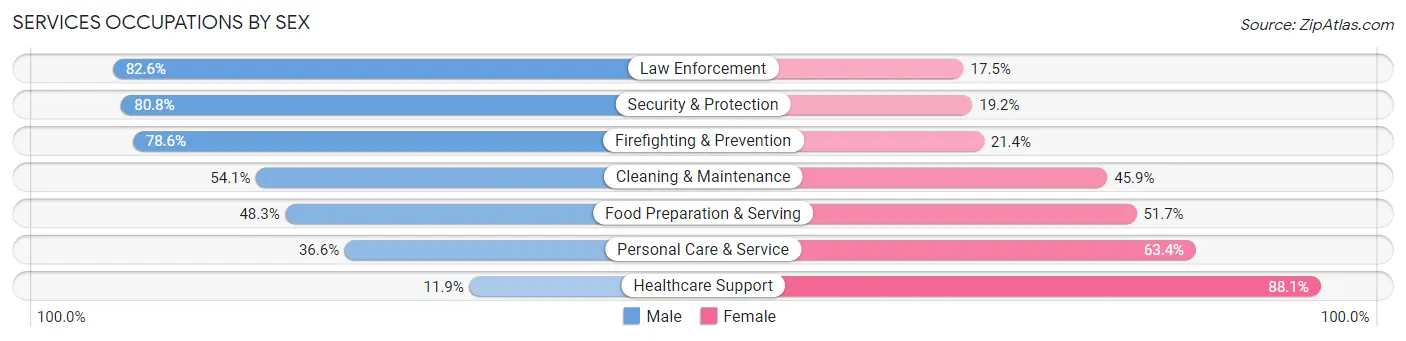
| Occupation | Male | Female |
| Healthcare Support | 12 (11.9%) | 89 (88.1%) |
| Security & Protection | 211 (80.8%) | 50 (19.2%) |
| Firefighting & Prevention | 88 (78.6%) | 24 (21.4%) |
| Law Enforcement | 123 (82.6%) | 26 (17.4%) |
| Food Preparation & Serving | 335 (48.3%) | 358 (51.7%) |
| Cleaning & Maintenance | 191 (54.1%) | 162 (45.9%) |
| Personal Care & Service | 102 (36.6%) | 177 (63.4%) |
| Total (Category) | 851 (50.4%) | 836 (49.6%) |
| Total (Overall) | 3,218 (55.2%) | 2,616 (44.8%) |
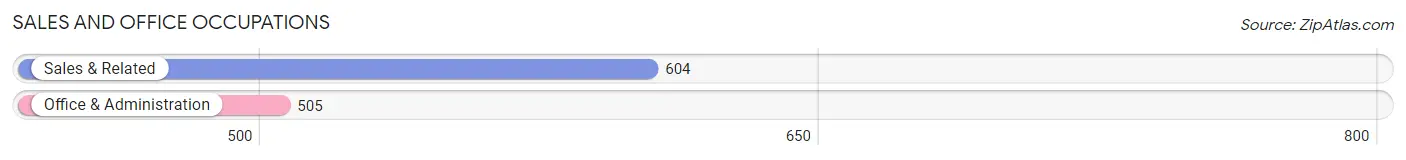
Sales and Office Occupations
The most common Sales and Office occupations in Key Largo are Sales & Related (604 | 10.3%), and Office & Administration (505 | 8.7%).
Sales and Office Occupations by Sex
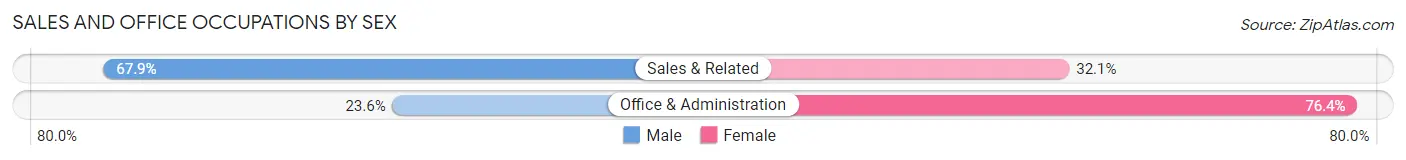
| Occupation | Male | Female |
| Sales & Related | 410 (67.9%) | 194 (32.1%) |
| Office & Administration | 119 (23.6%) | 386 (76.4%) |
| Total (Category) | 529 (47.7%) | 580 (52.3%) |
| Total (Overall) | 3,218 (55.2%) | 2,616 (44.8%) |
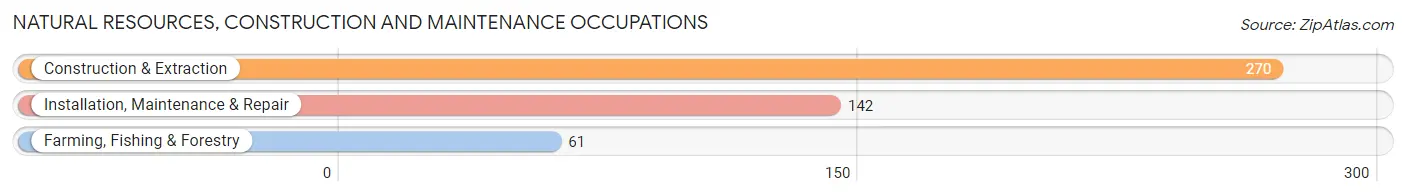
Natural Resources, Construction and Maintenance Occupations
The most common Natural Resources, Construction and Maintenance occupations in Key Largo are Construction & Extraction (270 | 4.6%), Installation, Maintenance & Repair (142 | 2.4%), and Farming, Fishing & Forestry (61 | 1.1%).
Natural Resources, Construction and Maintenance Occupations by Sex
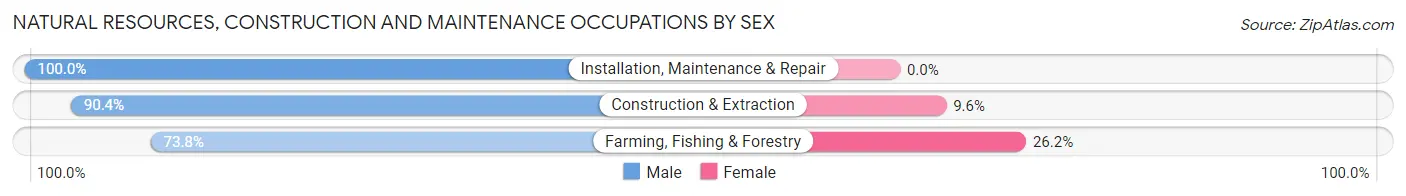
| Occupation | Male | Female |
| Farming, Fishing & Forestry | 45 (73.8%) | 16 (26.2%) |
| Construction & Extraction | 244 (90.4%) | 26 (9.6%) |
| Installation, Maintenance & Repair | 142 (100.0%) | 0 (0.0%) |
| Total (Category) | 431 (91.1%) | 42 (8.9%) |
| Total (Overall) | 3,218 (55.2%) | 2,616 (44.8%) |
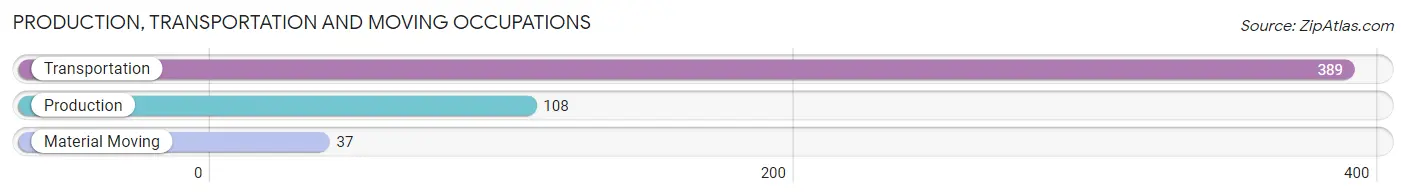
Production, Transportation and Moving Occupations
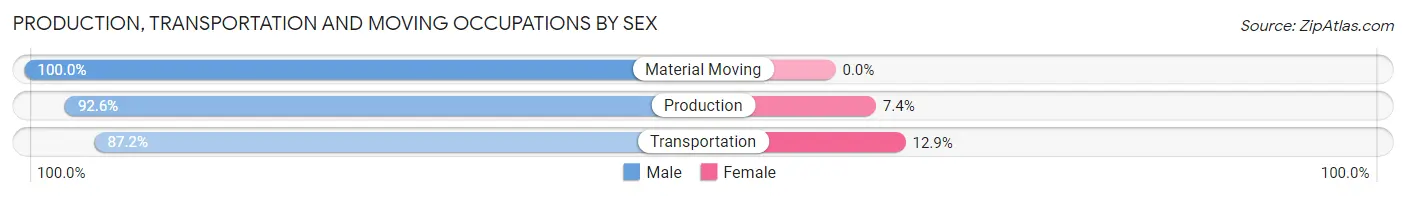
The most common Production, Transportation and Moving occupations in Key Largo are Transportation (389 | 6.7%), Production (108 | 1.8%), and Material Moving (37 | 0.6%).
Production, Transportation and Moving Occupations by Sex
| Occupation | Male | Female |
| Production | 100 (92.6%) | 8 (7.4%) |
| Transportation | 339 (87.2%) | 50 (12.9%) |
| Material Moving | 37 (100.0%) | 0 (0.0%) |
| Total (Category) | 476 (89.1%) | 58 (10.9%) |
| Total (Overall) | 3,218 (55.2%) | 2,616 (44.8%) |
Employment Industries by Sex in Key Largo
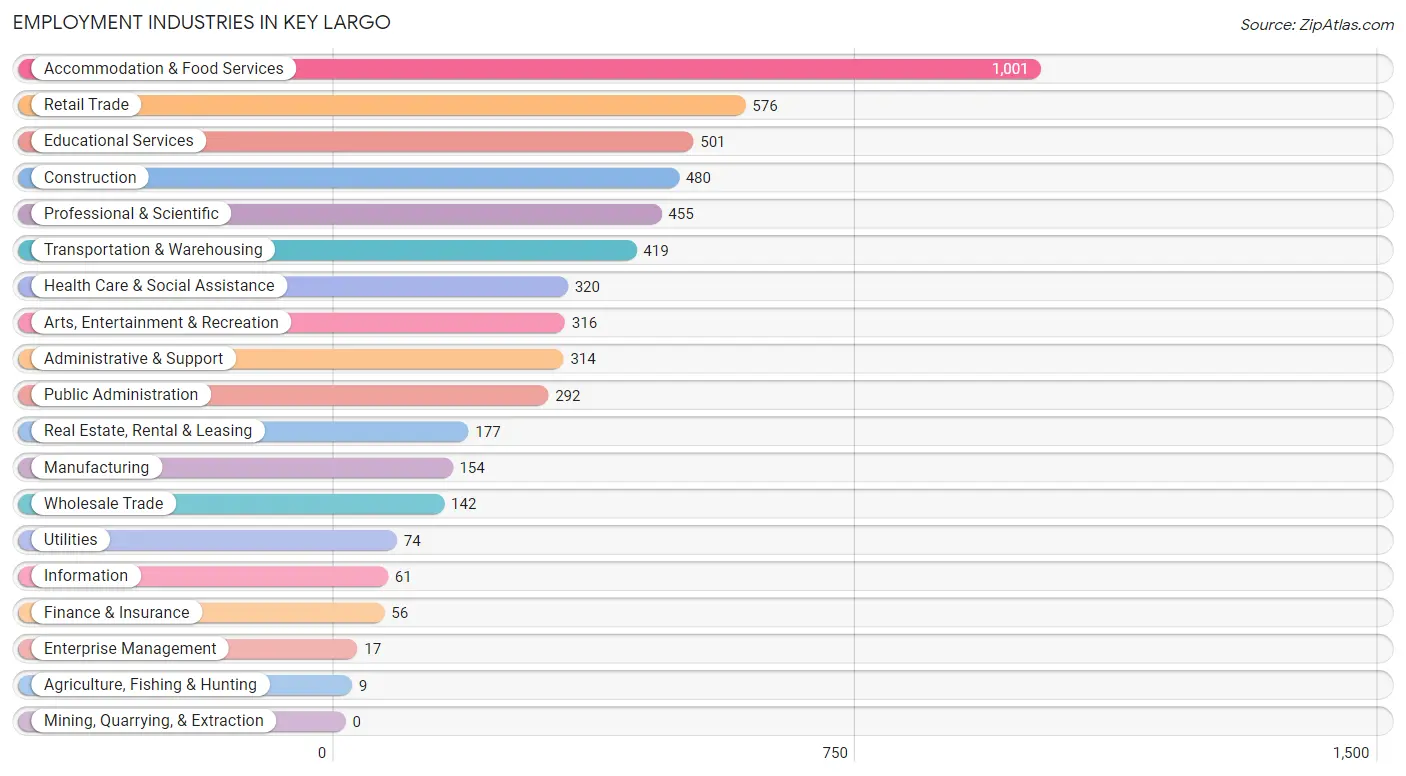
Employment Industries in Key Largo
The major employment industries in Key Largo include Accommodation & Food Services (1,001 | 17.2%), Retail Trade (576 | 9.9%), Educational Services (501 | 8.6%), Construction (480 | 8.2%), and Professional & Scientific (455 | 7.8%).
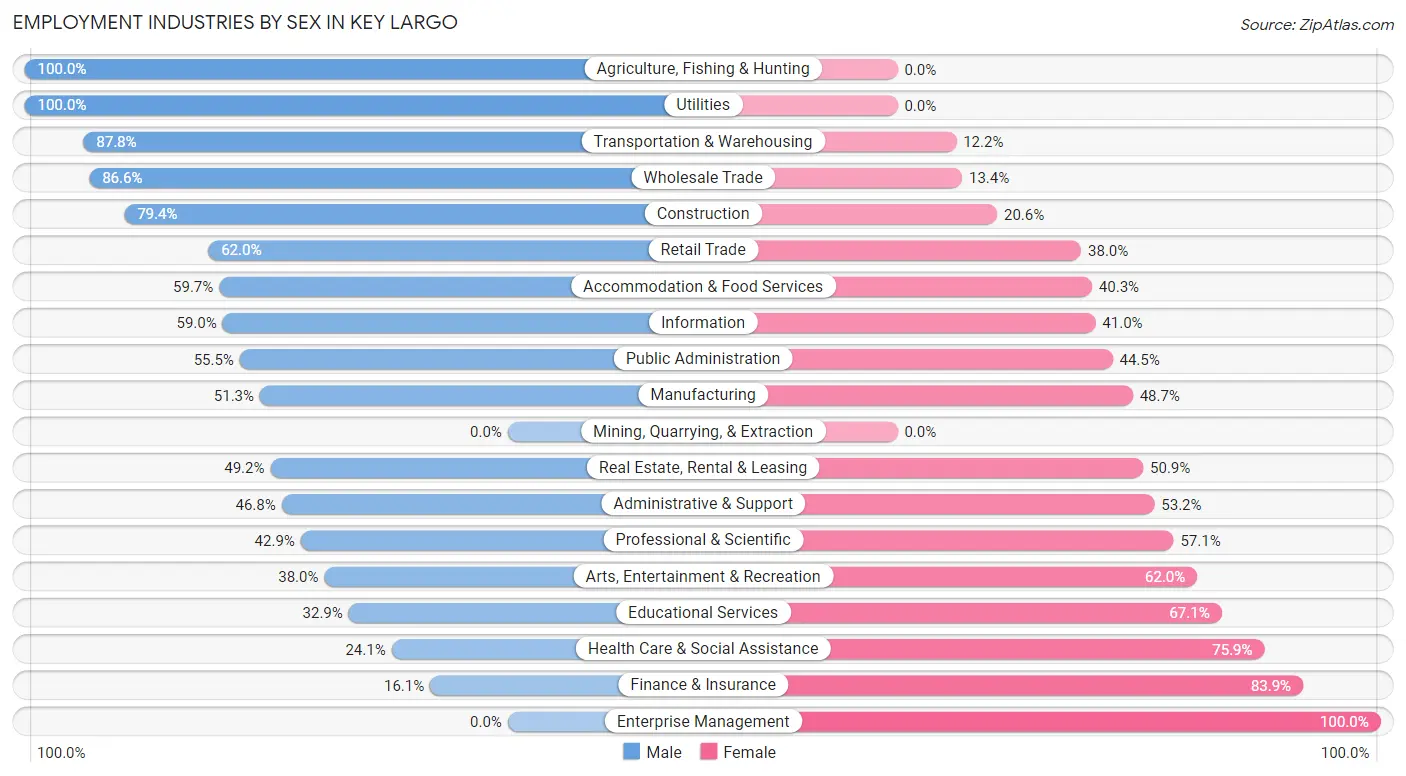
Employment Industries by Sex in Key Largo
The Key Largo industries that see more men than women are Agriculture, Fishing & Hunting (100.0%), Utilities (100.0%), and Transportation & Warehousing (87.8%), whereas the industries that tend to have a higher number of women are Enterprise Management (100.0%), Finance & Insurance (83.9%), and Health Care & Social Assistance (75.9%).
| Industry | Male | Female |
| Agriculture, Fishing & Hunting | 9 (100.0%) | 0 (0.0%) |
| Mining, Quarrying, & Extraction | 0 (0.0%) | 0 (0.0%) |
| Construction | 381 (79.4%) | 99 (20.6%) |
| Manufacturing | 79 (51.3%) | 75 (48.7%) |
| Wholesale Trade | 123 (86.6%) | 19 (13.4%) |
| Retail Trade | 357 (62.0%) | 219 (38.0%) |
| Transportation & Warehousing | 368 (87.8%) | 51 (12.2%) |
| Utilities | 74 (100.0%) | 0 (0.0%) |
| Information | 36 (59.0%) | 25 (41.0%) |
| Finance & Insurance | 9 (16.1%) | 47 (83.9%) |
| Real Estate, Rental & Leasing | 87 (49.1%) | 90 (50.8%) |
| Professional & Scientific | 195 (42.9%) | 260 (57.1%) |
| Enterprise Management | 0 (0.0%) | 17 (100.0%) |
| Administrative & Support | 147 (46.8%) | 167 (53.2%) |
| Educational Services | 165 (32.9%) | 336 (67.1%) |
| Health Care & Social Assistance | 77 (24.1%) | 243 (75.9%) |
| Arts, Entertainment & Recreation | 120 (38.0%) | 196 (62.0%) |
| Accommodation & Food Services | 598 (59.7%) | 403 (40.3%) |
| Public Administration | 162 (55.5%) | 130 (44.5%) |
| Total | 3,218 (55.2%) | 2,616 (44.8%) |
Education in Key Largo
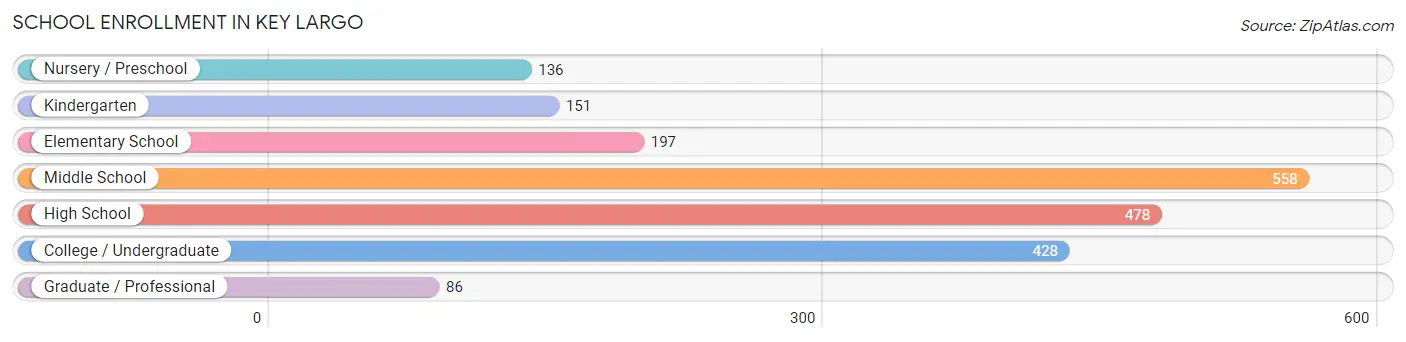
School Enrollment in Key Largo
The most common levels of schooling among the 2,034 students in Key Largo are middle school (558 | 27.4%), high school (478 | 23.5%), and college / undergraduate (428 | 21.0%).
| School Level | # Students | % Students |
| Nursery / Preschool | 136 | 6.7% |
| Kindergarten | 151 | 7.4% |
| Elementary School | 197 | 9.7% |
| Middle School | 558 | 27.4% |
| High School | 478 | 23.5% |
| College / Undergraduate | 428 | 21.0% |
| Graduate / Professional | 86 | 4.2% |
| Total | 2,034 | 100.0% |
School Enrollment by Age by Funding Source in Key Largo
Out of a total of 2,034 students who are enrolled in schools in Key Largo, 271 (13.3%) attend a private institution, while the remaining 1,763 (86.7%) are enrolled in public schools. The age group of 35 years and over has the highest likelihood of being enrolled in private schools, with 65 (40.4% in the age bracket) enrolled. Conversely, the age group of 15 to 17 year olds has the lowest likelihood of being enrolled in a private school, with 248 (100.0% in the age bracket) attending a public institution.
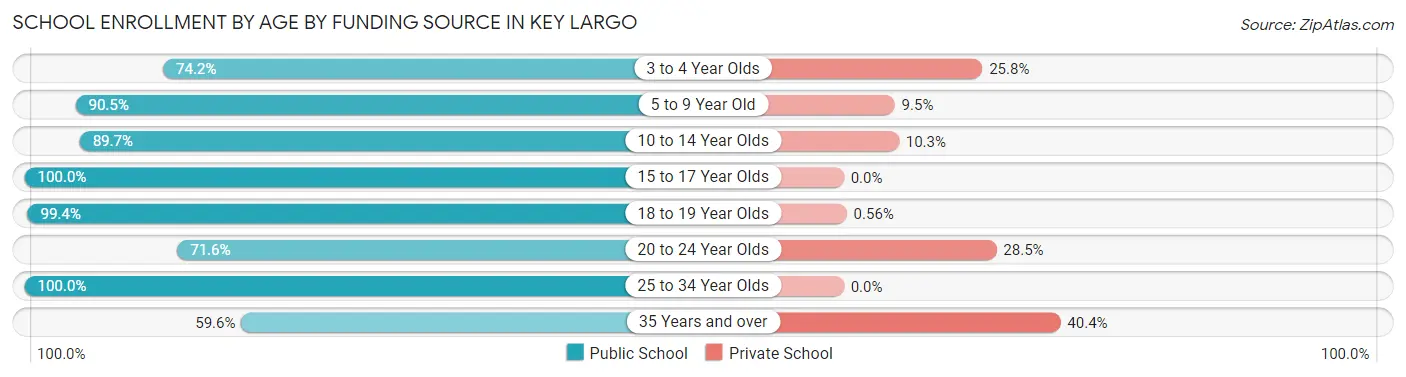
| Age Bracket | Public School | Private School |
| 3 to 4 Year Olds | 92 (74.2%) | 32 (25.8%) |
| 5 to 9 Year Old | 324 (90.5%) | 34 (9.5%) |
| 10 to 14 Year Olds | 638 (89.7%) | 73 (10.3%) |
| 15 to 17 Year Olds | 248 (100.0%) | 0 (0.0%) |
| 18 to 19 Year Olds | 179 (99.4%) | 1 (0.6%) |
| 20 to 24 Year Olds | 166 (71.6%) | 66 (28.4%) |
| 25 to 34 Year Olds | 20 (100.0%) | 0 (0.0%) |
| 35 Years and over | 96 (59.6%) | 65 (40.4%) |
| Total | 1,763 (86.7%) | 271 (13.3%) |
Educational Attainment by Field of Study in Key Largo
Business (711 | 18.3%), education (655 | 16.9%), liberal arts & history (332 | 8.6%), science & technology (320 | 8.3%), and arts & humanities (287 | 7.4%) are the most common fields of study among 3,878 individuals in Key Largo who have obtained a bachelor's degree or higher.
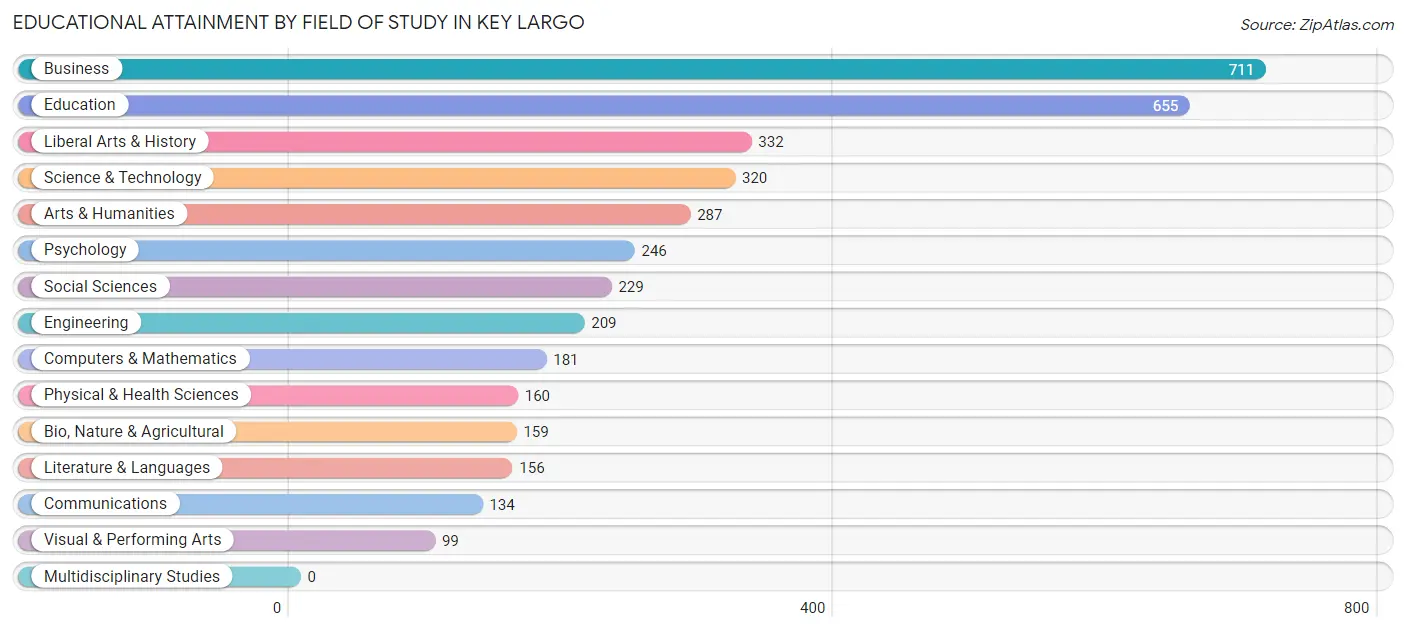
| Field of Study | # Graduates | % Graduates |
| Computers & Mathematics | 181 | 4.7% |
| Bio, Nature & Agricultural | 159 | 4.1% |
| Physical & Health Sciences | 160 | 4.1% |
| Psychology | 246 | 6.3% |
| Social Sciences | 229 | 5.9% |
| Engineering | 209 | 5.4% |
| Multidisciplinary Studies | 0 | 0.0% |
| Science & Technology | 320 | 8.3% |
| Business | 711 | 18.3% |
| Education | 655 | 16.9% |
| Literature & Languages | 156 | 4.0% |
| Liberal Arts & History | 332 | 8.6% |
| Visual & Performing Arts | 99 | 2.5% |
| Communications | 134 | 3.5% |
| Arts & Humanities | 287 | 7.4% |
| Total | 3,878 | 100.0% |
Transportation & Commute in Key Largo
Vehicle Availability by Sex in Key Largo
The most prevalent vehicle ownership categories in Key Largo are males with 2 vehicles (1,339, accounting for 41.4%) and females with 2 vehicles (1,084, making up 51.0%).
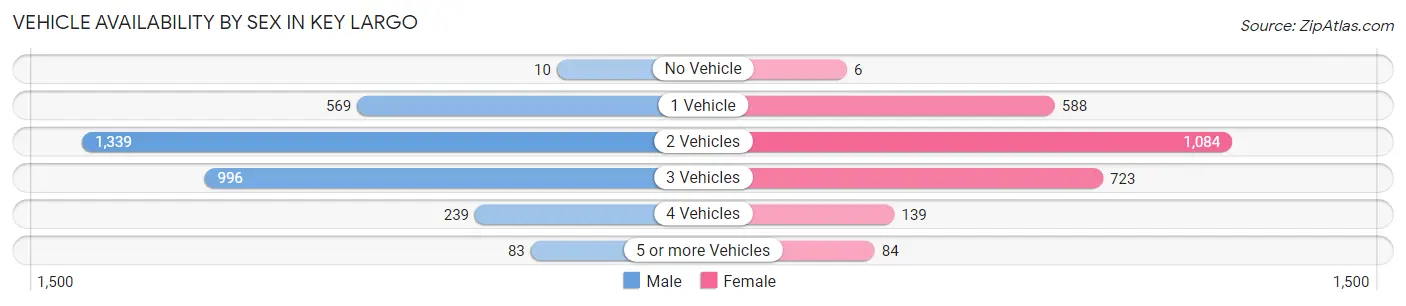
| Vehicles Available | Male | Female |
| No Vehicle | 10 (0.3%) | 6 (0.2%) |
| 1 Vehicle | 569 (17.6%) | 588 (22.4%) |
| 2 Vehicles | 1,339 (41.4%) | 1,084 (41.3%) |
| 3 Vehicles | 996 (30.8%) | 723 (27.6%) |
| 4 Vehicles | 239 (7.4%) | 139 (5.3%) |
| 5 or more Vehicles | 83 (2.6%) | 84 (3.2%) |
| Total | 3,236 (100.0%) | 2,624 (100.0%) |
Commute Time in Key Largo
The most frequently occuring commute durations in Key Largo are 5 to 9 minutes (928 commuters, 17.3%), 10 to 14 minutes (835 commuters, 15.5%), and 30 to 34 minutes (551 commuters, 10.2%).
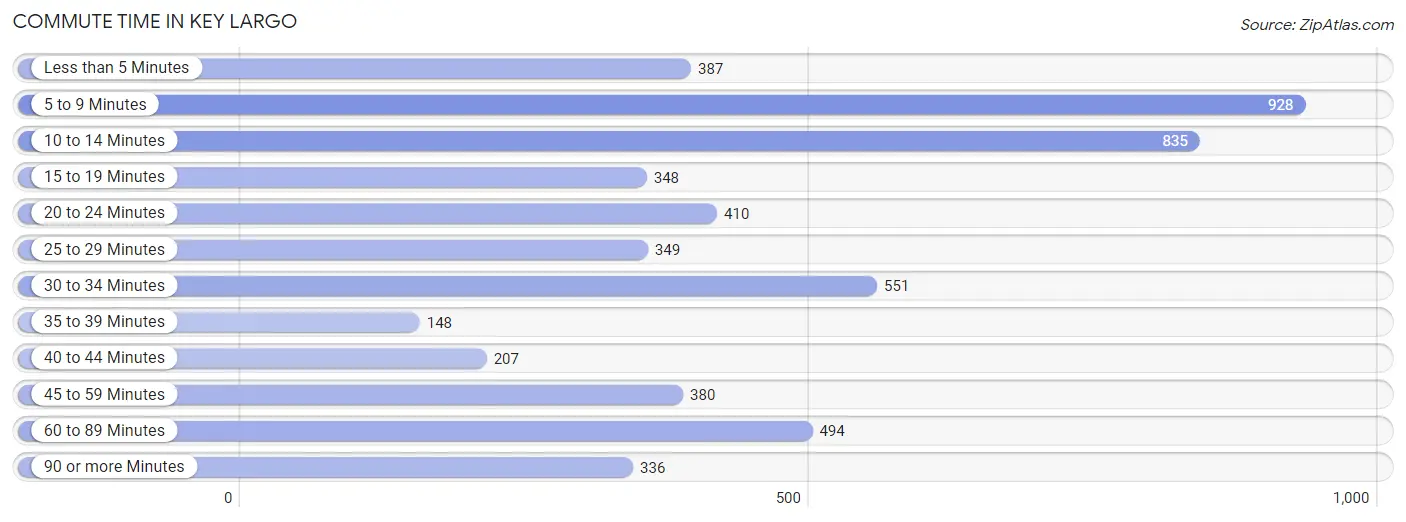
| Commute Time | # Commuters | % Commuters |
| Less than 5 Minutes | 387 | 7.2% |
| 5 to 9 Minutes | 928 | 17.3% |
| 10 to 14 Minutes | 835 | 15.5% |
| 15 to 19 Minutes | 348 | 6.5% |
| 20 to 24 Minutes | 410 | 7.6% |
| 25 to 29 Minutes | 349 | 6.5% |
| 30 to 34 Minutes | 551 | 10.2% |
| 35 to 39 Minutes | 148 | 2.8% |
| 40 to 44 Minutes | 207 | 3.8% |
| 45 to 59 Minutes | 380 | 7.1% |
| 60 to 89 Minutes | 494 | 9.2% |
| 90 or more Minutes | 336 | 6.2% |
Commute Time by Sex in Key Largo
The most common commute times in Key Largo are 5 to 9 minutes (469 commuters, 15.7%) for males and 5 to 9 minutes (459 commuters, 19.2%) for females.
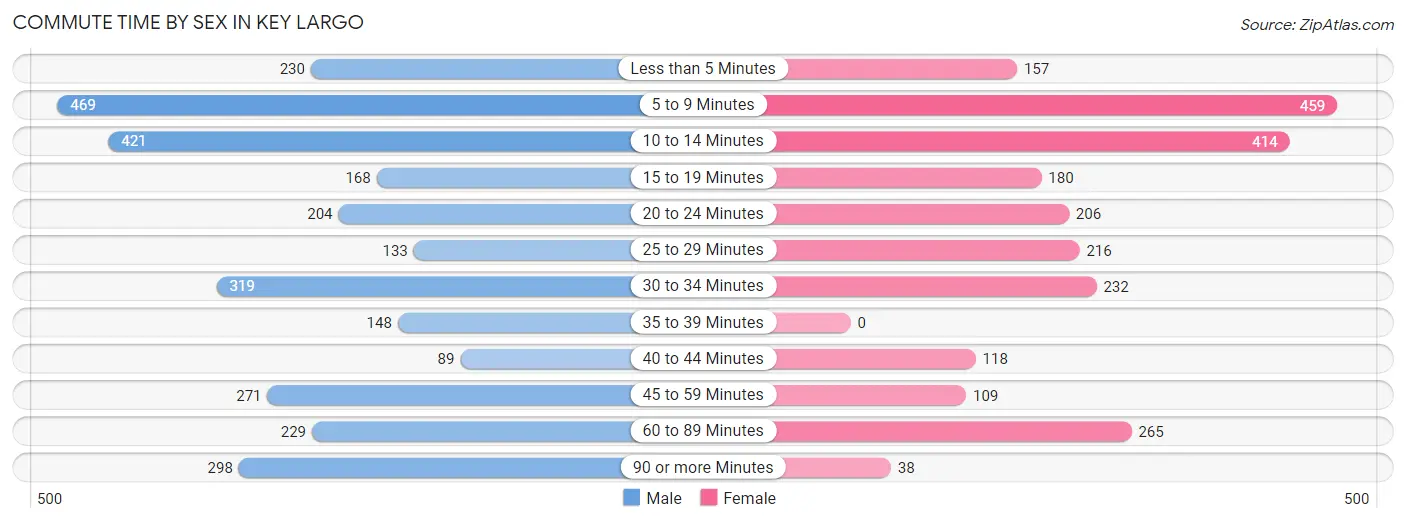
| Commute Time | Male | Female |
| Less than 5 Minutes | 230 (7.7%) | 157 (6.6%) |
| 5 to 9 Minutes | 469 (15.7%) | 459 (19.2%) |
| 10 to 14 Minutes | 421 (14.1%) | 414 (17.3%) |
| 15 to 19 Minutes | 168 (5.6%) | 180 (7.5%) |
| 20 to 24 Minutes | 204 (6.9%) | 206 (8.6%) |
| 25 to 29 Minutes | 133 (4.5%) | 216 (9.0%) |
| 30 to 34 Minutes | 319 (10.7%) | 232 (9.7%) |
| 35 to 39 Minutes | 148 (5.0%) | 0 (0.0%) |
| 40 to 44 Minutes | 89 (3.0%) | 118 (4.9%) |
| 45 to 59 Minutes | 271 (9.1%) | 109 (4.5%) |
| 60 to 89 Minutes | 229 (7.7%) | 265 (11.1%) |
| 90 or more Minutes | 298 (10.0%) | 38 (1.6%) |
Time of Departure to Work by Sex in Key Largo
The most frequent times of departure to work in Key Largo are 7:00 AM to 7:29 AM (447, 15.0%) for males and 8:00 AM to 8:29 AM (500, 20.9%) for females.
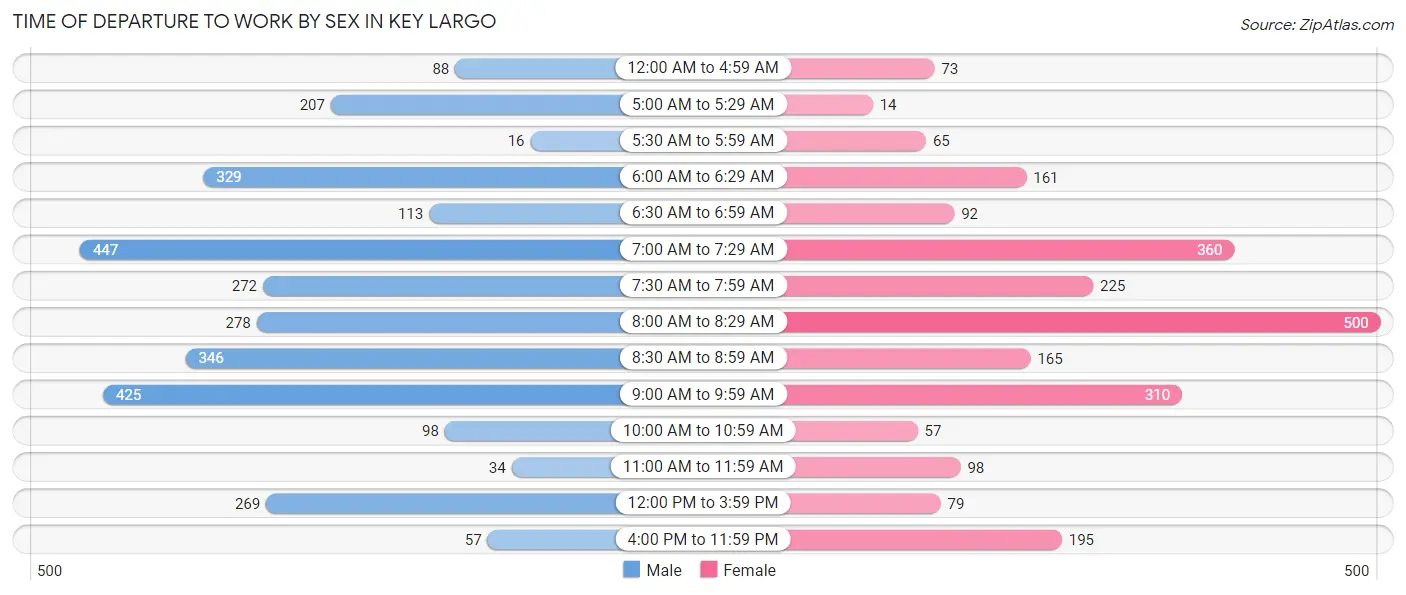
| Time of Departure | Male | Female |
| 12:00 AM to 4:59 AM | 88 (2.9%) | 73 (3.0%) |
| 5:00 AM to 5:29 AM | 207 (7.0%) | 14 (0.6%) |
| 5:30 AM to 5:59 AM | 16 (0.5%) | 65 (2.7%) |
| 6:00 AM to 6:29 AM | 329 (11.0%) | 161 (6.7%) |
| 6:30 AM to 6:59 AM | 113 (3.8%) | 92 (3.8%) |
| 7:00 AM to 7:29 AM | 447 (15.0%) | 360 (15.0%) |
| 7:30 AM to 7:59 AM | 272 (9.1%) | 225 (9.4%) |
| 8:00 AM to 8:29 AM | 278 (9.3%) | 500 (20.9%) |
| 8:30 AM to 8:59 AM | 346 (11.6%) | 165 (6.9%) |
| 9:00 AM to 9:59 AM | 425 (14.3%) | 310 (13.0%) |
| 10:00 AM to 10:59 AM | 98 (3.3%) | 57 (2.4%) |
| 11:00 AM to 11:59 AM | 34 (1.1%) | 98 (4.1%) |
| 12:00 PM to 3:59 PM | 269 (9.0%) | 79 (3.3%) |
| 4:00 PM to 11:59 PM | 57 (1.9%) | 195 (8.2%) |
| Total | 2,979 (100.0%) | 2,394 (100.0%) |
Housing Occupancy in Key Largo
Occupancy by Ownership in Key Largo
Of the total 4,992 dwellings in Key Largo, owner-occupied units account for 3,778 (75.7%), while renter-occupied units make up 1,214 (24.3%).
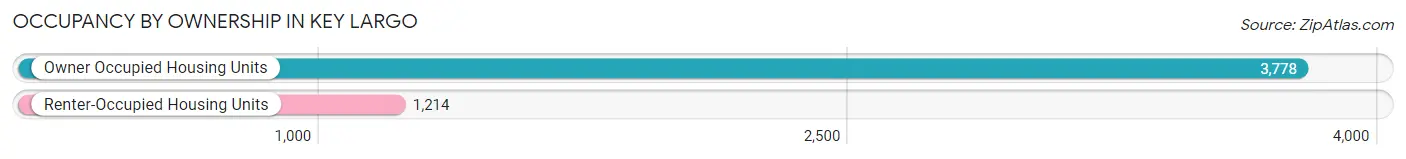
| Occupancy | # Housing Units | % Housing Units |
| Owner Occupied Housing Units | 3,778 | 75.7% |
| Renter-Occupied Housing Units | 1,214 | 24.3% |
| Total Occupied Housing Units | 4,992 | 100.0% |
Occupancy by Household Size in Key Largo
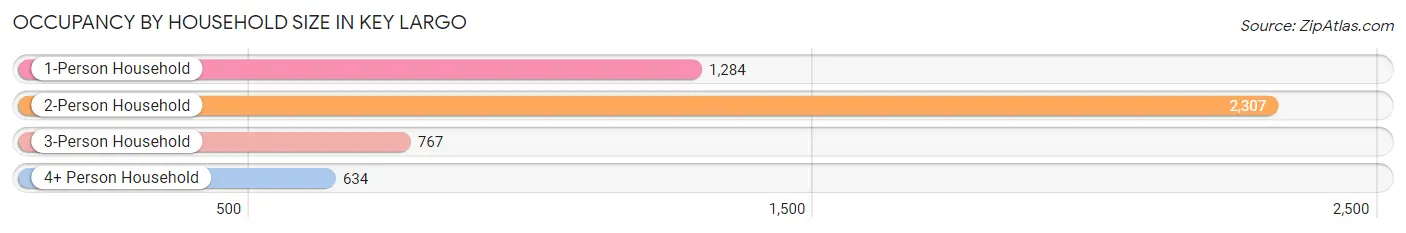
| Household Size | # Housing Units | % Housing Units |
| 1-Person Household | 1,284 | 25.7% |
| 2-Person Household | 2,307 | 46.2% |
| 3-Person Household | 767 | 15.4% |
| 4+ Person Household | 634 | 12.7% |
| Total Housing Units | 4,992 | 100.0% |
Occupancy by Ownership by Household Size in Key Largo
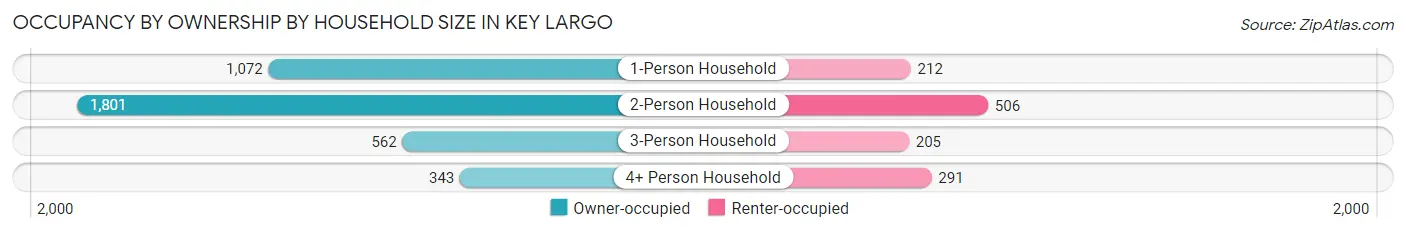
| Household Size | Owner-occupied | Renter-occupied |
| 1-Person Household | 1,072 (83.5%) | 212 (16.5%) |
| 2-Person Household | 1,801 (78.1%) | 506 (21.9%) |
| 3-Person Household | 562 (73.3%) | 205 (26.7%) |
| 4+ Person Household | 343 (54.1%) | 291 (45.9%) |
| Total Housing Units | 3,778 (75.7%) | 1,214 (24.3%) |
Occupancy by Educational Attainment in Key Largo
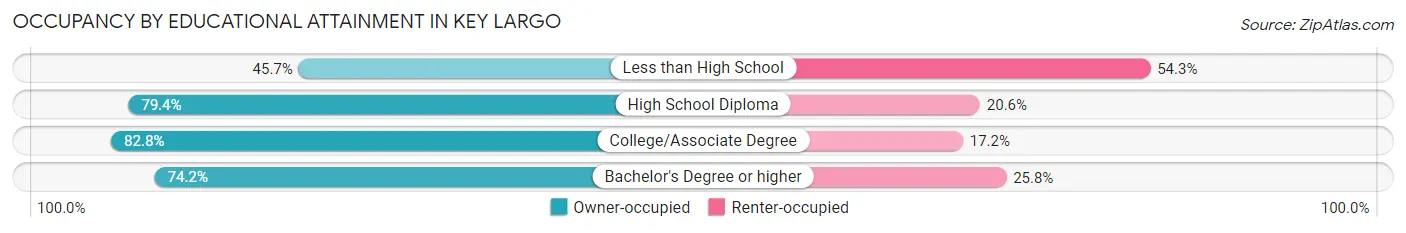
| Household Size | Owner-occupied | Renter-occupied |
| Less than High School | 179 (45.7%) | 213 (54.3%) |
| High School Diploma | 997 (79.4%) | 258 (20.6%) |
| College/Associate Degree | 1,148 (82.8%) | 238 (17.2%) |
| Bachelor's Degree or higher | 1,454 (74.2%) | 505 (25.8%) |
Occupancy by Age of Householder in Key Largo
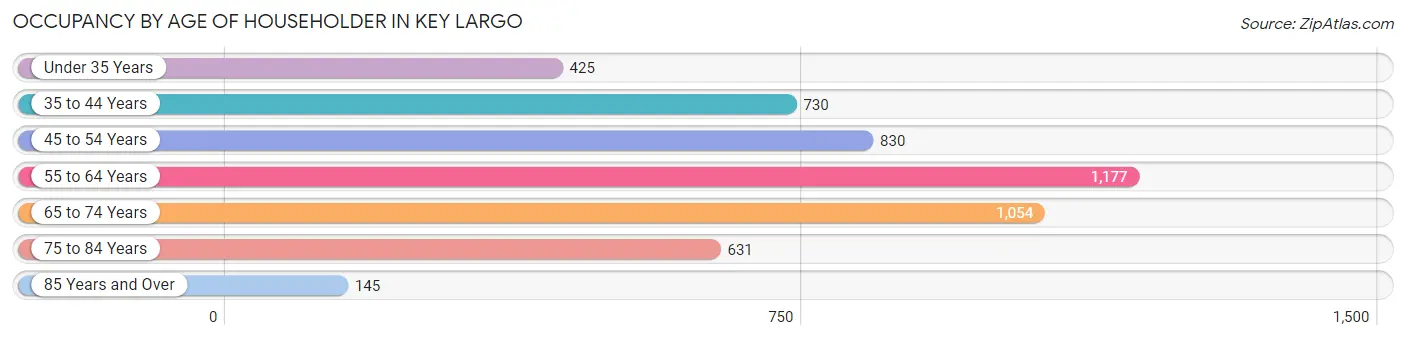
| Age Bracket | # Households | % Households |
| Under 35 Years | 425 | 8.5% |
| 35 to 44 Years | 730 | 14.6% |
| 45 to 54 Years | 830 | 16.6% |
| 55 to 64 Years | 1,177 | 23.6% |
| 65 to 74 Years | 1,054 | 21.1% |
| 75 to 84 Years | 631 | 12.6% |
| 85 Years and Over | 145 | 2.9% |
| Total | 4,992 | 100.0% |
Housing Finances in Key Largo
Median Income by Occupancy in Key Largo
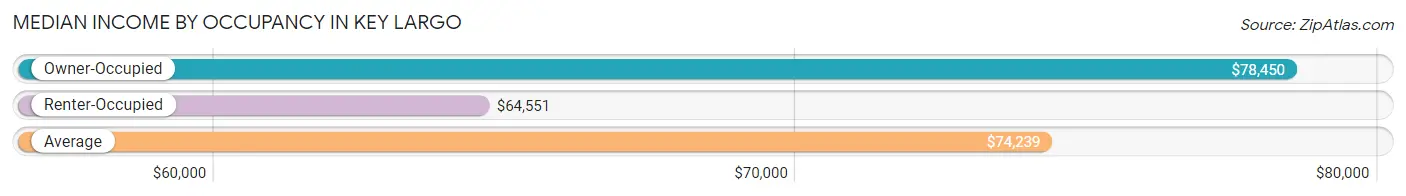
| Occupancy Type | # Households | Median Income |
| Owner-Occupied | 3,778 (75.7%) | $78,450 |
| Renter-Occupied | 1,214 (24.3%) | $64,551 |
| Average | 4,992 (100.0%) | $74,239 |
Occupancy by Householder Income Bracket in Key Largo
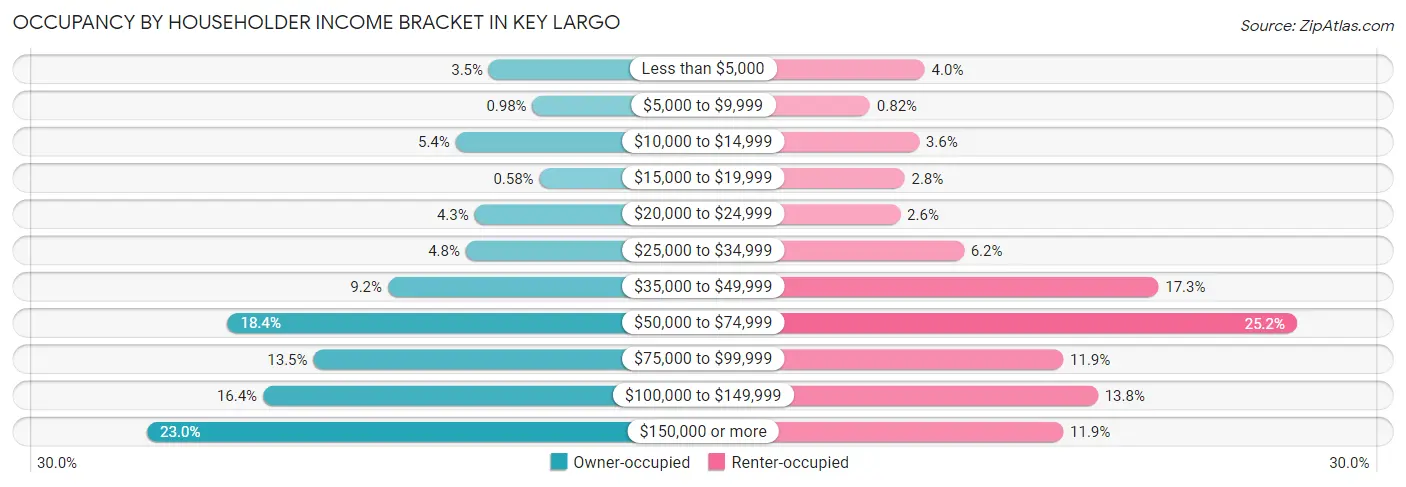
| Income Bracket | Owner-occupied | Renter-occupied |
| Less than $5,000 | 131 (3.5%) | 48 (4.0%) |
| $5,000 to $9,999 | 37 (1.0%) | 10 (0.8%) |
| $10,000 to $14,999 | 203 (5.4%) | 44 (3.6%) |
| $15,000 to $19,999 | 22 (0.6%) | 34 (2.8%) |
| $20,000 to $24,999 | 162 (4.3%) | 31 (2.5%) |
| $25,000 to $34,999 | 181 (4.8%) | 75 (6.2%) |
| $35,000 to $49,999 | 349 (9.2%) | 210 (17.3%) |
| $50,000 to $74,999 | 695 (18.4%) | 306 (25.2%) |
| $75,000 to $99,999 | 510 (13.5%) | 144 (11.9%) |
| $100,000 to $149,999 | 619 (16.4%) | 168 (13.8%) |
| $150,000 or more | 869 (23.0%) | 144 (11.9%) |
| Total | 3,778 (100.0%) | 1,214 (100.0%) |
Monthly Housing Cost Tiers in Key Largo
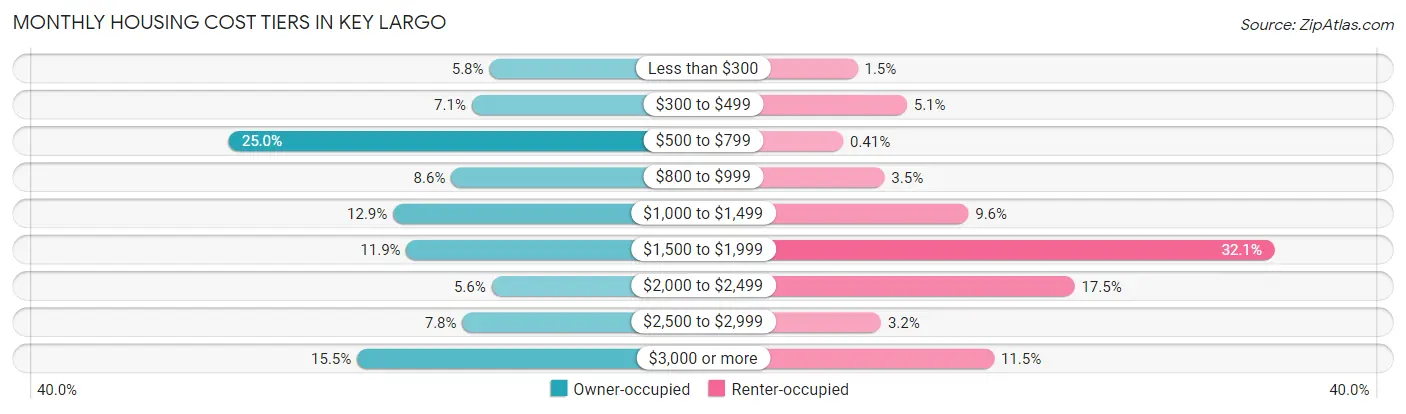
| Monthly Cost | Owner-occupied | Renter-occupied |
| Less than $300 | 218 (5.8%) | 18 (1.5%) |
| $300 to $499 | 267 (7.1%) | 62 (5.1%) |
| $500 to $799 | 943 (25.0%) | 5 (0.4%) |
| $800 to $999 | 324 (8.6%) | 42 (3.5%) |
| $1,000 to $1,499 | 486 (12.9%) | 117 (9.6%) |
| $1,500 to $1,999 | 449 (11.9%) | 390 (32.1%) |
| $2,000 to $2,499 | 212 (5.6%) | 212 (17.5%) |
| $2,500 to $2,999 | 293 (7.8%) | 39 (3.2%) |
| $3,000 or more | 586 (15.5%) | 140 (11.5%) |
| Total | 3,778 (100.0%) | 1,214 (100.0%) |
Physical Housing Characteristics in Key Largo
Housing Structures in Key Largo
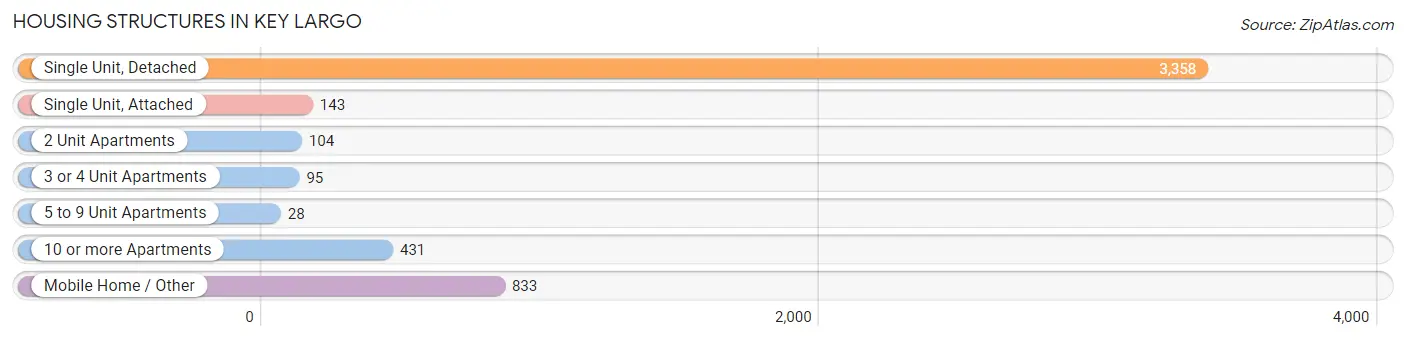
| Structure Type | # Housing Units | % Housing Units |
| Single Unit, Detached | 3,358 | 67.3% |
| Single Unit, Attached | 143 | 2.9% |
| 2 Unit Apartments | 104 | 2.1% |
| 3 or 4 Unit Apartments | 95 | 1.9% |
| 5 to 9 Unit Apartments | 28 | 0.6% |
| 10 or more Apartments | 431 | 8.6% |
| Mobile Home / Other | 833 | 16.7% |
| Total | 4,992 | 100.0% |
Housing Structures by Occupancy in Key Largo
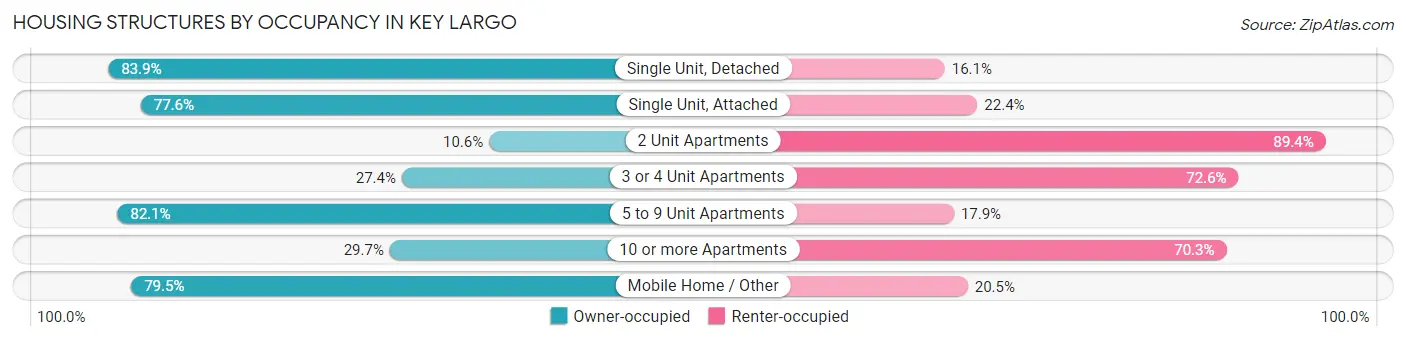
| Structure Type | Owner-occupied | Renter-occupied |
| Single Unit, Detached | 2,817 (83.9%) | 541 (16.1%) |
| Single Unit, Attached | 111 (77.6%) | 32 (22.4%) |
| 2 Unit Apartments | 11 (10.6%) | 93 (89.4%) |
| 3 or 4 Unit Apartments | 26 (27.4%) | 69 (72.6%) |
| 5 to 9 Unit Apartments | 23 (82.1%) | 5 (17.9%) |
| 10 or more Apartments | 128 (29.7%) | 303 (70.3%) |
| Mobile Home / Other | 662 (79.5%) | 171 (20.5%) |
| Total | 3,778 (75.7%) | 1,214 (24.3%) |
Housing Structures by Number of Rooms in Key Largo
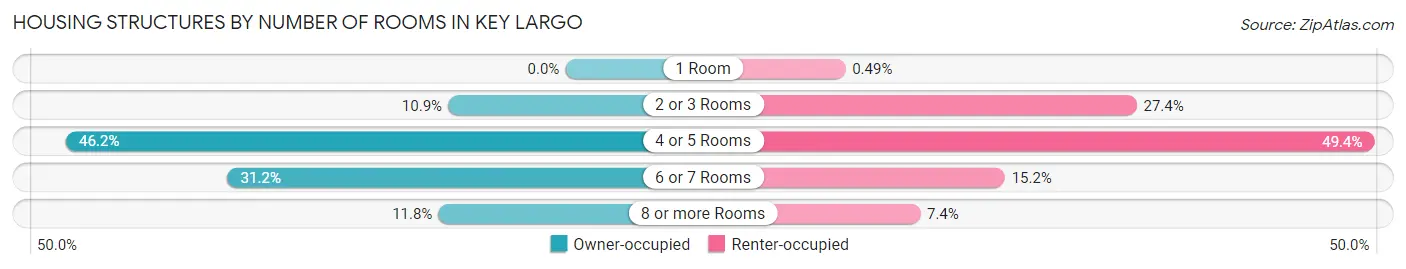
| Number of Rooms | Owner-occupied | Renter-occupied |
| 1 Room | 0 (0.0%) | 6 (0.5%) |
| 2 or 3 Rooms | 410 (10.8%) | 333 (27.4%) |
| 4 or 5 Rooms | 1,744 (46.2%) | 600 (49.4%) |
| 6 or 7 Rooms | 1,180 (31.2%) | 185 (15.2%) |
| 8 or more Rooms | 444 (11.7%) | 90 (7.4%) |
| Total | 3,778 (100.0%) | 1,214 (100.0%) |
Housing Structure by Heating Type in Key Largo
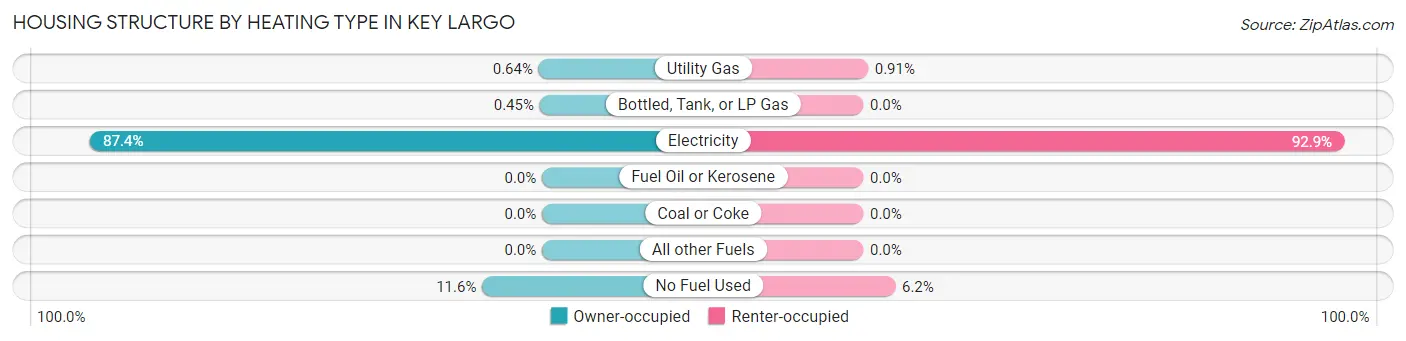
| Heating Type | Owner-occupied | Renter-occupied |
| Utility Gas | 24 (0.6%) | 11 (0.9%) |
| Bottled, Tank, or LP Gas | 17 (0.4%) | 0 (0.0%) |
| Electricity | 3,300 (87.4%) | 1,128 (92.9%) |
| Fuel Oil or Kerosene | 0 (0.0%) | 0 (0.0%) |
| Coal or Coke | 0 (0.0%) | 0 (0.0%) |
| All other Fuels | 0 (0.0%) | 0 (0.0%) |
| No Fuel Used | 437 (11.6%) | 75 (6.2%) |
| Total | 3,778 (100.0%) | 1,214 (100.0%) |
Household Vehicle Usage in Key Largo
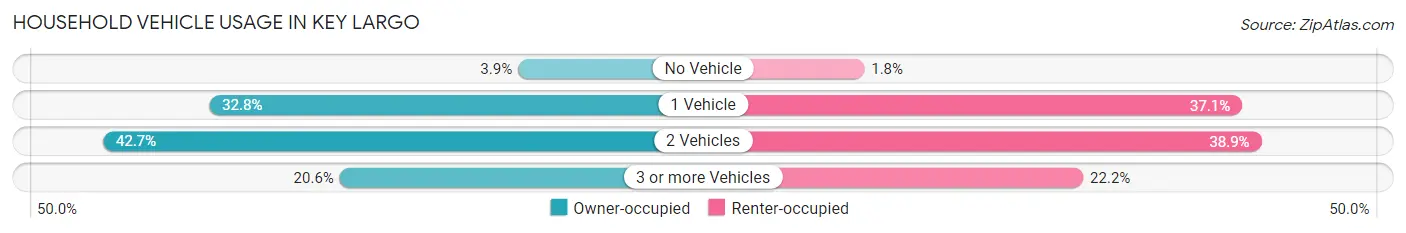
| Vehicles per Household | Owner-occupied | Renter-occupied |
| No Vehicle | 149 (3.9%) | 22 (1.8%) |
| 1 Vehicle | 1,238 (32.8%) | 450 (37.1%) |
| 2 Vehicles | 1,613 (42.7%) | 472 (38.9%) |
| 3 or more Vehicles | 778 (20.6%) | 270 (22.2%) |
| Total | 3,778 (100.0%) | 1,214 (100.0%) |
Real Estate & Mortgages in Key Largo
Real Estate and Mortgage Overview in Key Largo
| Characteristic | Without Mortgage | With Mortgage |
| Housing Units | 2,292 | 1,486 |
| Median Property Value | $579,500 | $613,100 |
| Median Household Income | $69,167 | $470 |
| Monthly Housing Costs | $711 | $555 |
| Real Estate Taxes | $2,822 | $52 |
Property Value by Mortgage Status in Key Largo
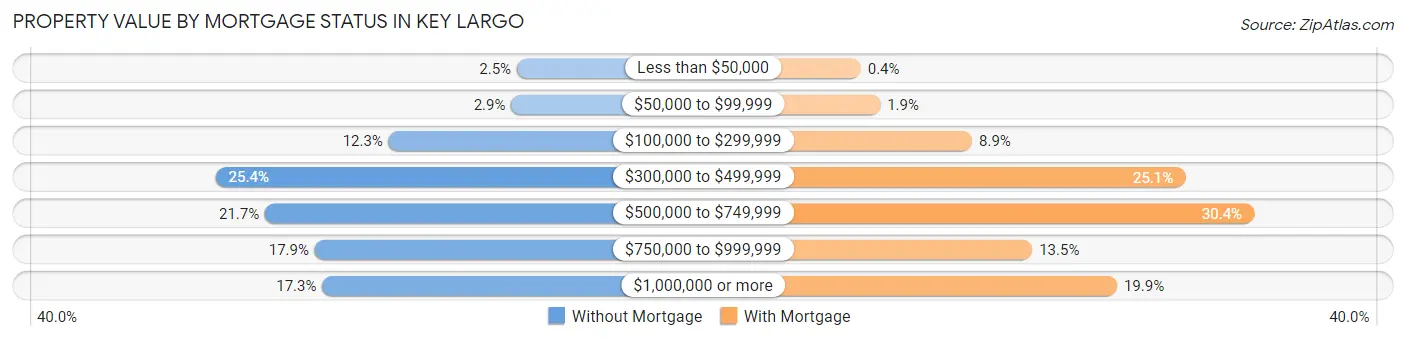
| Property Value | Without Mortgage | With Mortgage |
| Less than $50,000 | 57 (2.5%) | 6 (0.4%) |
| $50,000 to $99,999 | 67 (2.9%) | 28 (1.9%) |
| $100,000 to $299,999 | 281 (12.3%) | 132 (8.9%) |
| $300,000 to $499,999 | 583 (25.4%) | 373 (25.1%) |
| $500,000 to $749,999 | 497 (21.7%) | 451 (30.3%) |
| $750,000 to $999,999 | 410 (17.9%) | 200 (13.5%) |
| $1,000,000 or more | 397 (17.3%) | 296 (19.9%) |
| Total | 2,292 (100.0%) | 1,486 (100.0%) |
Household Income by Mortgage Status in Key Largo
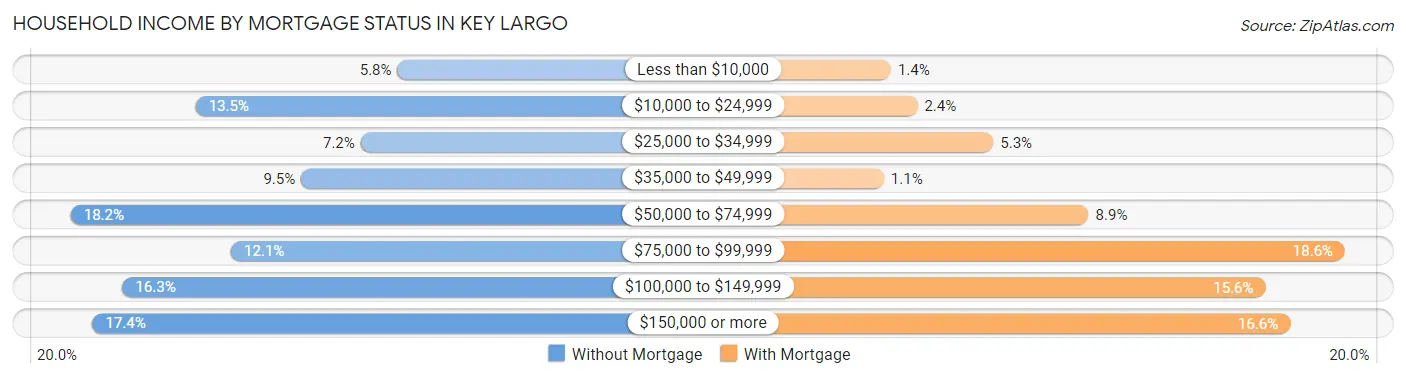
| Household Income | Without Mortgage | With Mortgage |
| Less than $10,000 | 133 (5.8%) | 20 (1.3%) |
| $10,000 to $24,999 | 309 (13.5%) | 35 (2.4%) |
| $25,000 to $34,999 | 165 (7.2%) | 78 (5.2%) |
| $35,000 to $49,999 | 217 (9.5%) | 16 (1.1%) |
| $50,000 to $74,999 | 418 (18.2%) | 132 (8.9%) |
| $75,000 to $99,999 | 278 (12.1%) | 277 (18.6%) |
| $100,000 to $149,999 | 373 (16.3%) | 232 (15.6%) |
| $150,000 or more | 399 (17.4%) | 246 (16.6%) |
| Total | 2,292 (100.0%) | 1,486 (100.0%) |
Property Value to Household Income Ratio in Key Largo
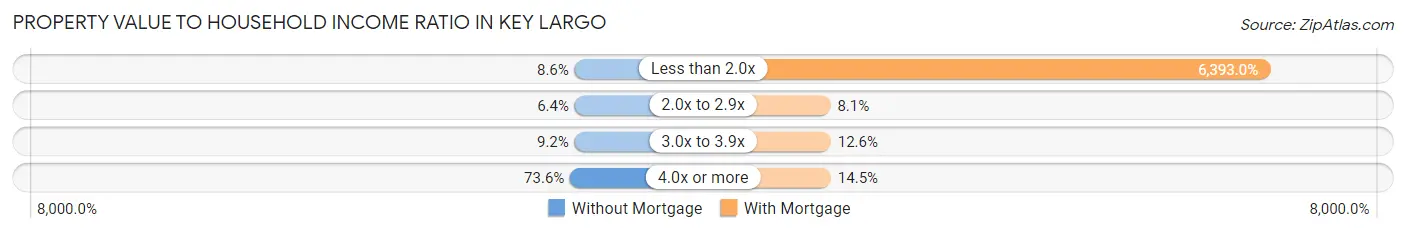
| Value-to-Income Ratio | Without Mortgage | With Mortgage |
| Less than 2.0x | 198 (8.6%) | 95,000 (6,393.0%) |
| 2.0x to 2.9x | 146 (6.4%) | 121 (8.1%) |
| 3.0x to 3.9x | 210 (9.2%) | 187 (12.6%) |
| 4.0x or more | 1,686 (73.6%) | 215 (14.5%) |
| Total | 2,292 (100.0%) | 1,486 (100.0%) |
Real Estate Taxes by Mortgage Status in Key Largo
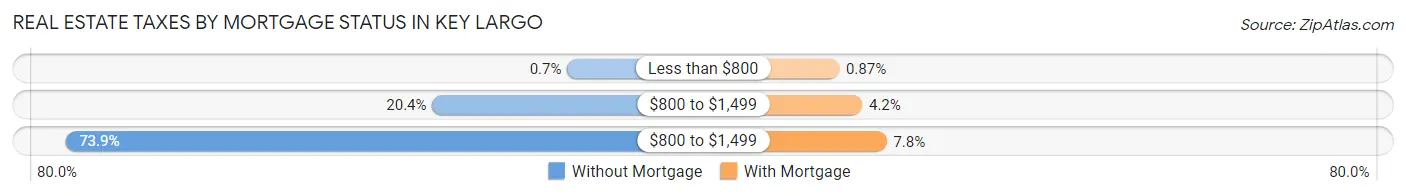
| Property Taxes | Without Mortgage | With Mortgage |
| Less than $800 | 16 (0.7%) | 13 (0.9%) |
| $800 to $1,499 | 468 (20.4%) | 63 (4.2%) |
| $800 to $1,499 | 1,694 (73.9%) | 116 (7.8%) |
| Total | 2,292 (100.0%) | 1,486 (100.0%) |
Health & Disability in Key Largo
Health Insurance Coverage by Age in Key Largo
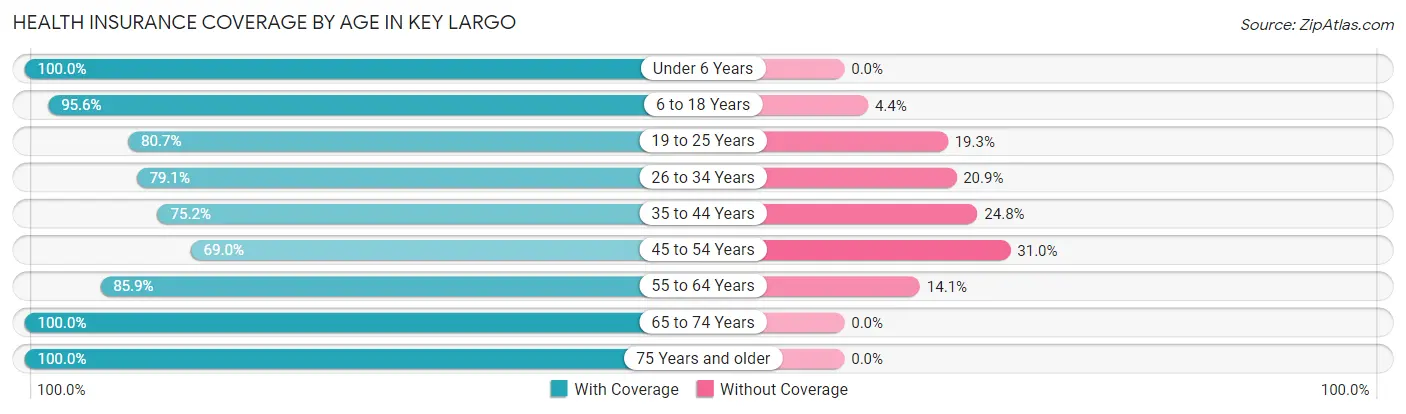
| Age Bracket | With Coverage | Without Coverage |
| Under 6 Years | 440 (100.0%) | 0 (0.0%) |
| 6 to 18 Years | 1,257 (95.6%) | 58 (4.4%) |
| 19 to 25 Years | 590 (80.7%) | 141 (19.3%) |
| 26 to 34 Years | 675 (79.1%) | 178 (20.9%) |
| 35 to 44 Years | 1,245 (75.2%) | 411 (24.8%) |
| 45 to 54 Years | 1,177 (69.0%) | 528 (31.0%) |
| 55 to 64 Years | 1,688 (85.9%) | 277 (14.1%) |
| 65 to 74 Years | 1,839 (100.0%) | 0 (0.0%) |
| 75 Years and older | 1,451 (100.0%) | 0 (0.0%) |
| Total | 10,362 (86.7%) | 1,593 (13.3%) |
Health Insurance Coverage by Citizenship Status in Key Largo
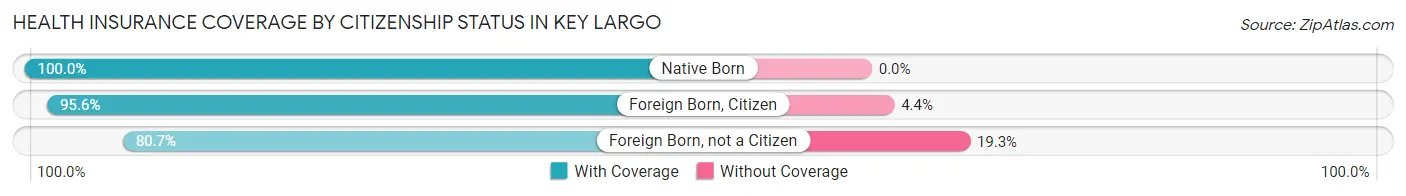
| Citizenship Status | With Coverage | Without Coverage |
| Native Born | 440 (100.0%) | 0 (0.0%) |
| Foreign Born, Citizen | 1,257 (95.6%) | 58 (4.4%) |
| Foreign Born, not a Citizen | 590 (80.7%) | 141 (19.3%) |
Health Insurance Coverage by Household Income in Key Largo
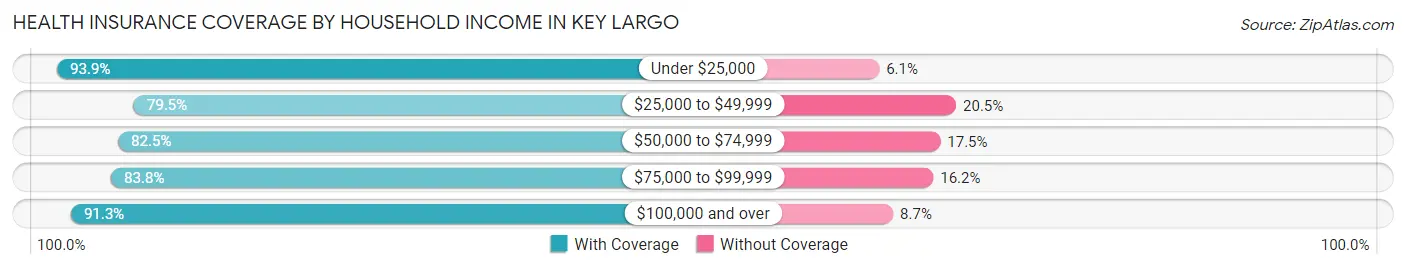
| Household Income | With Coverage | Without Coverage |
| Under $25,000 | 912 (93.9%) | 59 (6.1%) |
| $25,000 to $49,999 | 1,561 (79.5%) | 402 (20.5%) |
| $50,000 to $74,999 | 2,032 (82.5%) | 432 (17.5%) |
| $75,000 to $99,999 | 1,437 (83.8%) | 278 (16.2%) |
| $100,000 and over | 4,391 (91.3%) | 418 (8.7%) |
Public vs Private Health Insurance Coverage by Age in Key Largo
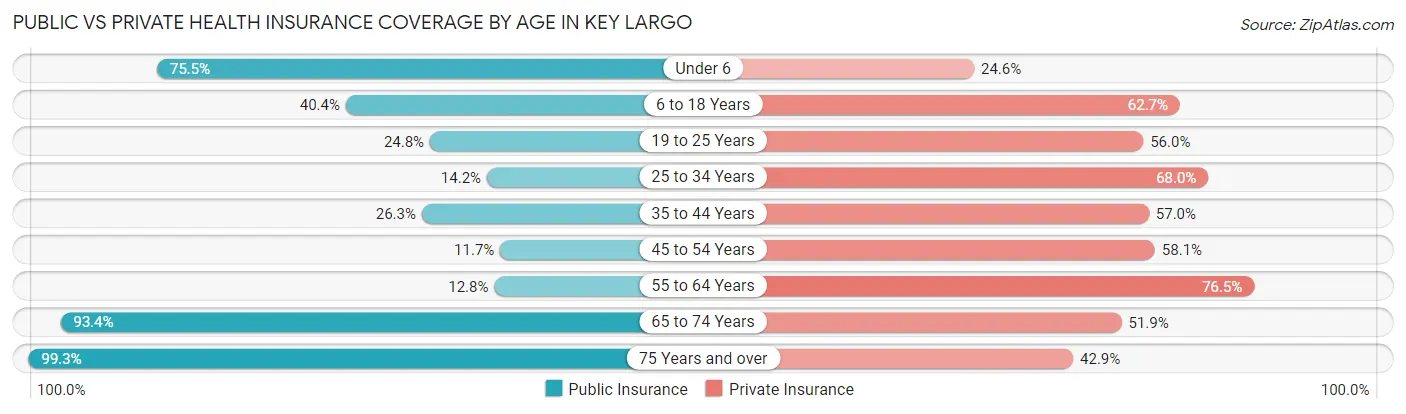
| Age Bracket | Public Insurance | Private Insurance |
| Under 6 | 332 (75.4%) | 108 (24.5%) |
| 6 to 18 Years | 531 (40.4%) | 825 (62.7%) |
| 19 to 25 Years | 181 (24.8%) | 409 (55.9%) |
| 25 to 34 Years | 121 (14.2%) | 580 (68.0%) |
| 35 to 44 Years | 435 (26.3%) | 944 (57.0%) |
| 45 to 54 Years | 200 (11.7%) | 991 (58.1%) |
| 55 to 64 Years | 252 (12.8%) | 1,504 (76.5%) |
| 65 to 74 Years | 1,717 (93.4%) | 955 (51.9%) |
| 75 Years and over | 1,441 (99.3%) | 623 (42.9%) |
| Total | 5,210 (43.6%) | 6,939 (58.0%) |
Disability Status by Sex by Age in Key Largo
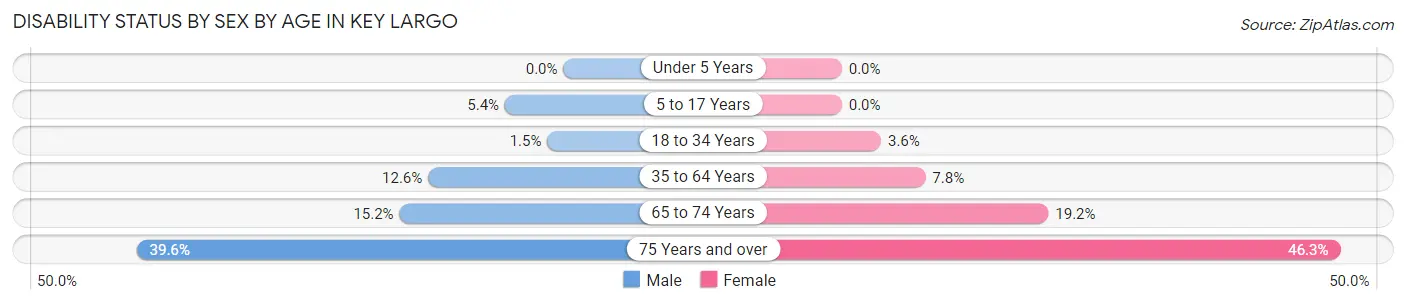
| Age Bracket | Male | Female |
| Under 5 Years | 0 (0.0%) | 0 (0.0%) |
| 5 to 17 Years | 33 (5.4%) | 0 (0.0%) |
| 18 to 34 Years | 15 (1.5%) | 25 (3.6%) |
| 35 to 64 Years | 353 (12.6%) | 195 (7.8%) |
| 65 to 74 Years | 125 (15.2%) | 195 (19.2%) |
| 75 Years and over | 257 (39.6%) | 371 (46.3%) |
Disability Class by Sex by Age in Key Largo
Disability Class: Hearing Difficulty
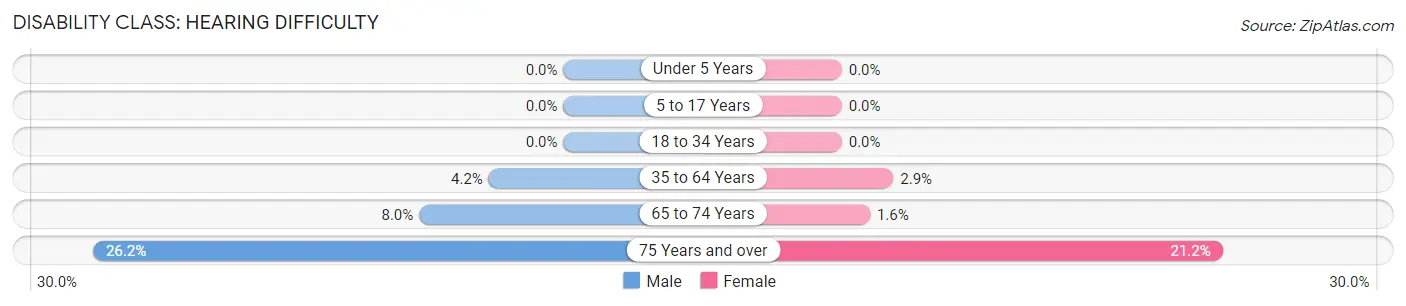
| Age Bracket | Male | Female |
| Under 5 Years | 0 (0.0%) | 0 (0.0%) |
| 5 to 17 Years | 0 (0.0%) | 0 (0.0%) |
| 18 to 34 Years | 0 (0.0%) | 0 (0.0%) |
| 35 to 64 Years | 117 (4.2%) | 72 (2.9%) |
| 65 to 74 Years | 66 (8.0%) | 16 (1.6%) |
| 75 Years and over | 170 (26.2%) | 170 (21.2%) |
Disability Class: Vision Difficulty
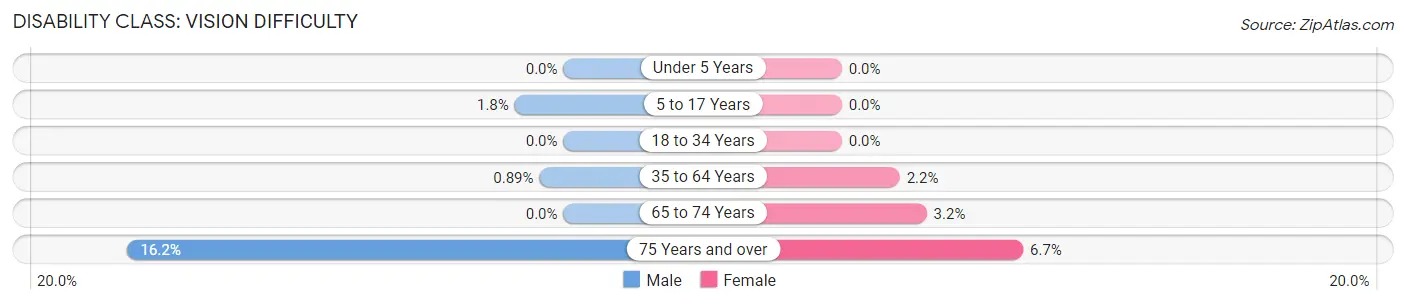
| Age Bracket | Male | Female |
| Under 5 Years | 0 (0.0%) | 0 (0.0%) |
| 5 to 17 Years | 11 (1.8%) | 0 (0.0%) |
| 18 to 34 Years | 0 (0.0%) | 0 (0.0%) |
| 35 to 64 Years | 25 (0.9%) | 54 (2.1%) |
| 65 to 74 Years | 0 (0.0%) | 32 (3.2%) |
| 75 Years and over | 105 (16.2%) | 54 (6.7%) |
Disability Class: Cognitive Difficulty
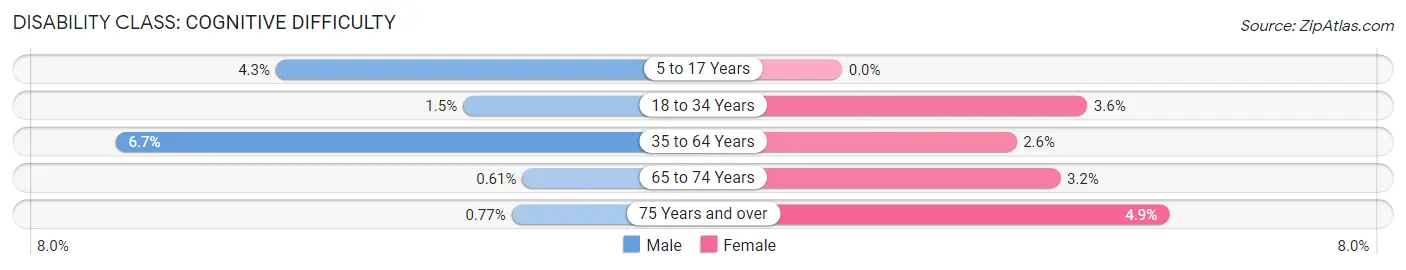
| Age Bracket | Male | Female |
| 5 to 17 Years | 26 (4.3%) | 0 (0.0%) |
| 18 to 34 Years | 15 (1.5%) | 25 (3.6%) |
| 35 to 64 Years | 187 (6.7%) | 65 (2.6%) |
| 65 to 74 Years | 5 (0.6%) | 33 (3.2%) |
| 75 Years and over | 5 (0.8%) | 39 (4.9%) |
Disability Class: Ambulatory Difficulty
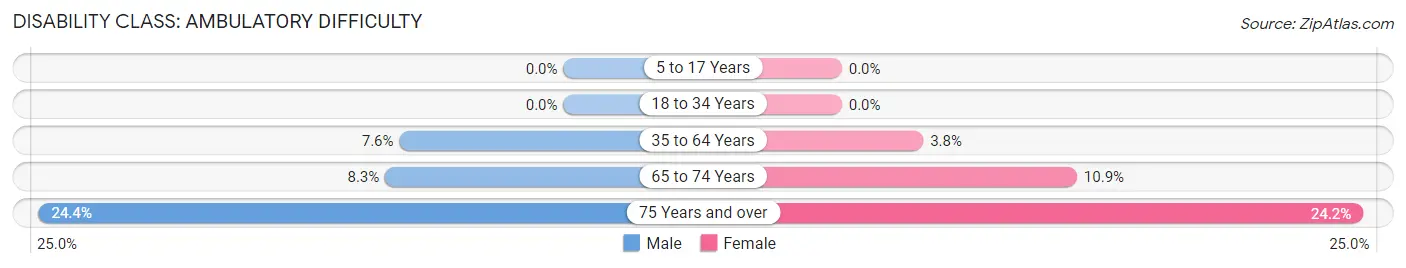
| Age Bracket | Male | Female |
| 5 to 17 Years | 0 (0.0%) | 0 (0.0%) |
| 18 to 34 Years | 0 (0.0%) | 0 (0.0%) |
| 35 to 64 Years | 214 (7.6%) | 95 (3.8%) |
| 65 to 74 Years | 68 (8.3%) | 111 (10.9%) |
| 75 Years and over | 158 (24.3%) | 194 (24.2%) |
Disability Class: Self-Care Difficulty
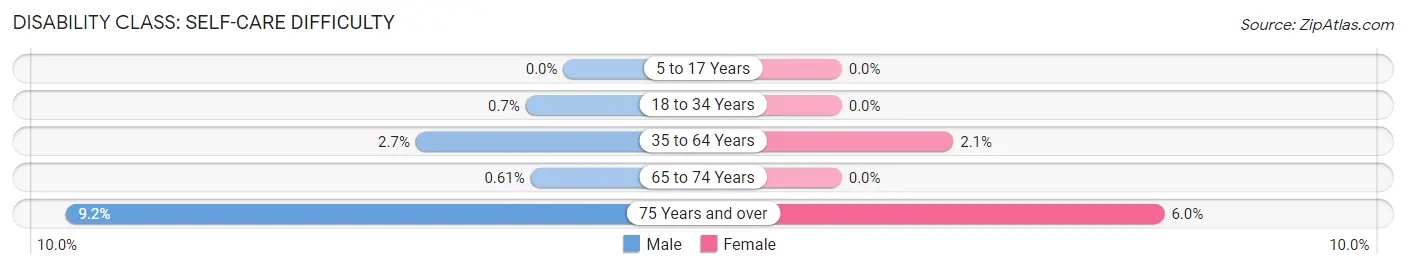
| Age Bracket | Male | Female |
| 5 to 17 Years | 0 (0.0%) | 0 (0.0%) |
| 18 to 34 Years | 7 (0.7%) | 0 (0.0%) |
| 35 to 64 Years | 77 (2.7%) | 52 (2.1%) |
| 65 to 74 Years | 5 (0.6%) | 0 (0.0%) |
| 75 Years and over | 60 (9.2%) | 48 (6.0%) |
Technology Access in Key Largo
Computing Device Access in Key Largo
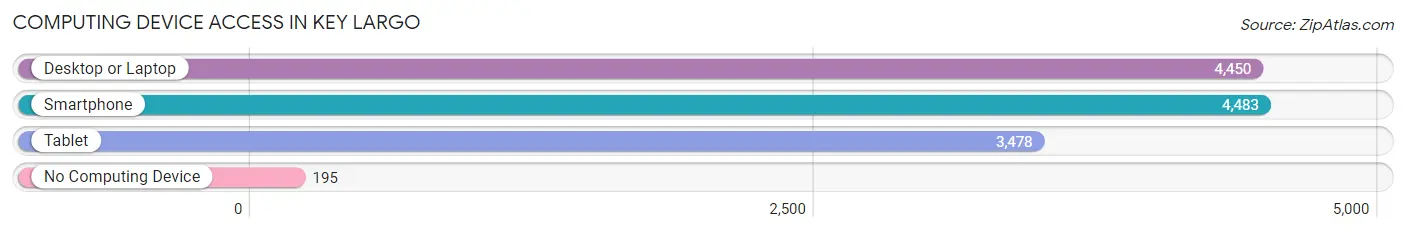
| Device Type | # Households | % Households |
| Desktop or Laptop | 4,450 | 89.1% |
| Smartphone | 4,483 | 89.8% |
| Tablet | 3,478 | 69.7% |
| No Computing Device | 195 | 3.9% |
| Total | 4,992 | 100.0% |
Internet Access in Key Largo
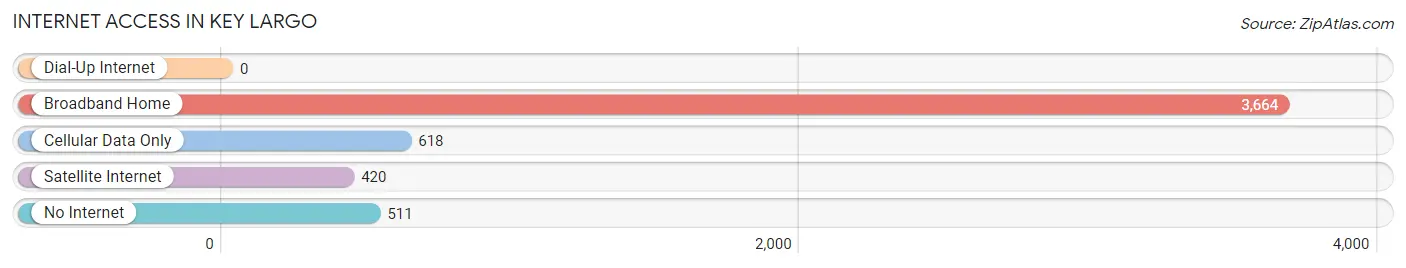
| Internet Type | # Households | % Households |
| Dial-Up Internet | 0 | 0.0% |
| Broadband Home | 3,664 | 73.4% |
| Cellular Data Only | 618 | 12.4% |
| Satellite Internet | 420 | 8.4% |
| No Internet | 511 | 10.2% |
| Total | 4,992 | 100.0% |
Key Largo Summary
Key Largo is an island located in the Florida Keys, a chain of islands off the southern tip of the state of Florida. It is the northernmost of the Florida Keys and is the largest island in the chain. Key Largo is known for its tropical climate, beautiful beaches, and abundant marine life. It is a popular tourist destination and is home to many resorts, restaurants, and attractions.
Geography
Key Largo is located in Monroe County, Florida, and is part of the Florida Keys archipelago. It is the northernmost of the Florida Keys and is the largest island in the chain. The island is approximately 25 miles long and 2 miles wide, with a total area of about 25 square miles. It is bordered by the Atlantic Ocean to the east and the Gulf of Mexico to the west. The island is connected to the mainland by two bridges, the Jewfish Creek Bridge and the Card Sound Bridge.
The island is mostly flat, with an elevation of only about 6 feet above sea level. The highest point on the island is Key Largo Hammock, which is about 18 feet above sea level. The island is surrounded by coral reefs and is home to many species of fish and other marine life.
Climate
Key Largo has a tropical climate, with warm temperatures year-round. The average high temperature in the summer is around 90°F, and the average low temperature in the winter is around 70°F. The island receives an average of about 60 inches of rain per year, with most of the rain falling in the summer months.
Demographics
As of the 2010 census, the population of Key Largo was 10,433. The population is mostly white (83.3%), with smaller percentages of African American (7.2%), Hispanic (4.7%), and Asian (2.2%) residents. The median household income is $50,945, and the median age is 47.
Economy
Key Largo is a popular tourist destination, and tourism is the main driver of the local economy. The island is home to many resorts, restaurants, and attractions, including the John Pennekamp Coral Reef State Park, the Florida Keys National Marine Sanctuary, and the Key Largo Undersea Park. Fishing and boating are also popular activities on the island.
In addition to tourism, Key Largo is home to several businesses, including a marina, a dive shop, and a boat repair shop. The island is also home to several government offices, including the Monroe County Sheriff's Office and the Key Largo Fire Rescue.
Conclusion
Key Largo is a beautiful island located in the Florida Keys. It is known for its tropical climate, beautiful beaches, and abundant marine life. Tourism is the main driver of the local economy, and the island is home to many resorts, restaurants, and attractions. Key Largo is also home to several businesses, government offices, and other amenities.
Common Questions
What is Per Capita Income in Key Largo?
Per Capita income in Key Largo is $50,723.
What is the Median Family Income in Key Largo?
Median Family Income in Key Largo is $79,904.
What is the Median Household income in Key Largo?
Median Household Income in Key Largo is $74,239.
What is Income or Wage Gap in Key Largo?
Income or Wage Gap in Key Largo is 33.7%.
Women in Key Largo earn 66.3 cents for every dollar earned by a man.
What is Family Income Deficit in Key Largo?
Family Income Deficit in Key Largo is $11,720.
Families that are below poverty line in Key Largo earn $11,720 less on average than the poverty threshold level.
What is Inequality or Gini Index in Key Largo?
Inequality or Gini Index in Key Largo is 0.51.
What is the Total Population of Key Largo?
Total Population of Key Largo is 12,021.
What is the Total Male Population of Key Largo?
Total Male Population of Key Largo is 6,118.
What is the Total Female Population of Key Largo?
Total Female Population of Key Largo is 5,903.
What is the Ratio of Males per 100 Females in Key Largo?
There are 103.64 Males per 100 Females in Key Largo.
What is the Ratio of Females per 100 Males in Key Largo?
There are 96.49 Females per 100 Males in Key Largo.
What is the Median Population Age in Key Largo?
Median Population Age in Key Largo is 49.8 Years.
What is the Average Family Size in Key Largo
Average Family Size in Key Largo is 2.8 People.
What is the Average Household Size in Key Largo
Average Household Size in Key Largo is 2.4 People.
How Large is the Labor Force in Key Largo?
There are 6,218 People in the Labor Forcein in Key Largo.
What is the Percentage of People in the Labor Force in Key Largo?
58.7% of People are in the Labor Force in Key Largo.
What is the Unemployment Rate in Key Largo?
Unemployment Rate in Key Largo is 5.2%.