Kathleen, FL Map & Demographics
Kathleen Map
Kathleen Overview
$27,808
PER CAPITA INCOME
$79,121
AVG FAMILY INCOME
$55,186
AVG HOUSEHOLD INCOME
29.6%
WAGE / INCOME GAP [ % ]
70.4¢/ $1
WAGE / INCOME GAP [ $ ]
0.41
INEQUALITY / GINI INDEX
5,843
TOTAL POPULATION
2,818
MALE POPULATION
3,025
FEMALE POPULATION
93.16
MALES / 100 FEMALES
107.35
FEMALES / 100 MALES
42.3
MEDIAN AGE
3.5
AVG FAMILY SIZE
2.6
AVG HOUSEHOLD SIZE
2,864
LABOR FORCE [ PEOPLE ]
59.6%
PERCENT IN LABOR FORCE
5.1%
UNEMPLOYMENT RATE
Kathleen Zip Codes
Kathleen Area Codes
Income in Kathleen
Income Overview in Kathleen
Per Capita Income in Kathleen is $27,808, while median incomes of families and households are $79,121 and $55,186 respectively.
| Characteristic | Number | Measure |
| Per Capita Income | 5,843 | $27,808 |
| Median Family Income | 1,301 | $79,121 |
| Mean Family Income | 1,301 | $90,634 |
| Median Household Income | 2,203 | $55,186 |
| Mean Household Income | 2,203 | $70,858 |
| Income Deficit | 1,301 | $0 |
| Wage / Income Gap (%) | 5,843 | 29.65% |
| Wage / Income Gap ($) | 5,843 | 70.35¢ per $1 |
| Gini / Inequality Index | 5,843 | 0.41 |
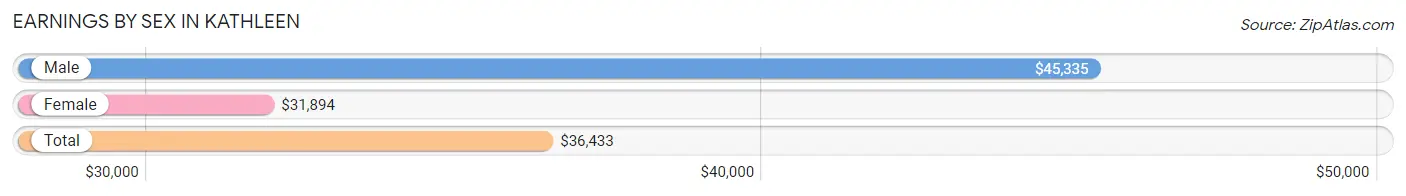
Earnings by Sex in Kathleen
Average Earnings in Kathleen are $36,433, $45,335 for men and $31,894 for women, a difference of 29.6%.
| Sex | Number | Average Earnings |
| Male | 1,555 (53.3%) | $45,335 |
| Female | 1,362 (46.7%) | $31,894 |
| Total | 2,917 (100.0%) | $36,433 |
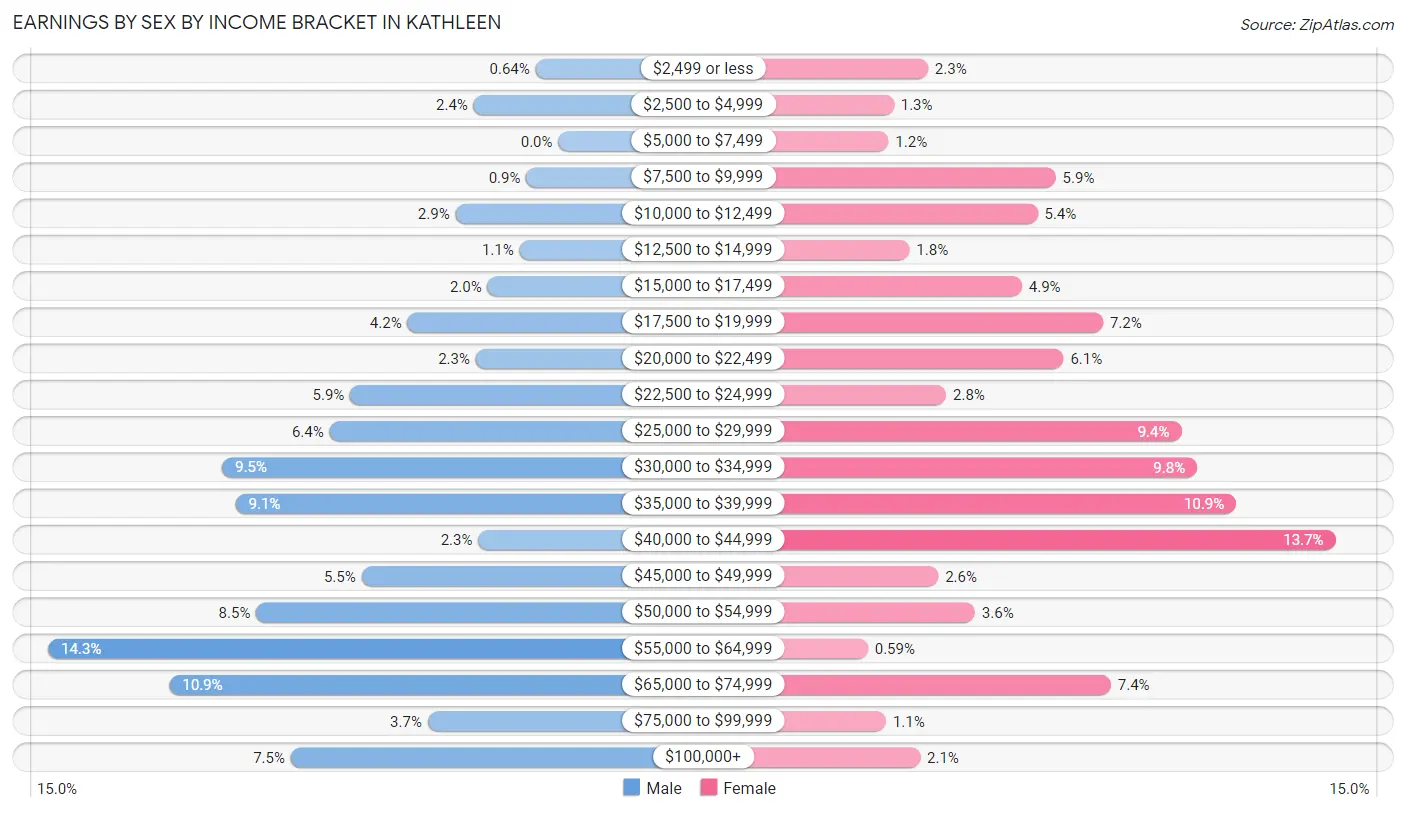
Earnings by Sex by Income Bracket in Kathleen
The most common earnings brackets in Kathleen are $55,000 to $64,999 for men (223 | 14.3%) and $40,000 to $44,999 for women (187 | 13.7%).
| Income | Male | Female |
| $2,499 or less | 10 (0.6%) | 31 (2.3%) |
| $2,500 to $4,999 | 37 (2.4%) | 18 (1.3%) |
| $5,000 to $7,499 | 0 (0.0%) | 16 (1.2%) |
| $7,500 to $9,999 | 14 (0.9%) | 80 (5.9%) |
| $10,000 to $12,499 | 45 (2.9%) | 73 (5.4%) |
| $12,500 to $14,999 | 17 (1.1%) | 24 (1.8%) |
| $15,000 to $17,499 | 31 (2.0%) | 67 (4.9%) |
| $17,500 to $19,999 | 66 (4.2%) | 98 (7.2%) |
| $20,000 to $22,499 | 36 (2.3%) | 83 (6.1%) |
| $22,500 to $24,999 | 91 (5.9%) | 38 (2.8%) |
| $25,000 to $29,999 | 100 (6.4%) | 128 (9.4%) |
| $30,000 to $34,999 | 147 (9.5%) | 134 (9.8%) |
| $35,000 to $39,999 | 141 (9.1%) | 149 (10.9%) |
| $40,000 to $44,999 | 35 (2.2%) | 187 (13.7%) |
| $45,000 to $49,999 | 86 (5.5%) | 35 (2.6%) |
| $50,000 to $54,999 | 132 (8.5%) | 49 (3.6%) |
| $55,000 to $64,999 | 223 (14.3%) | 8 (0.6%) |
| $65,000 to $74,999 | 170 (10.9%) | 101 (7.4%) |
| $75,000 to $99,999 | 57 (3.7%) | 15 (1.1%) |
| $100,000+ | 117 (7.5%) | 28 (2.1%) |
| Total | 1,555 (100.0%) | 1,362 (100.0%) |
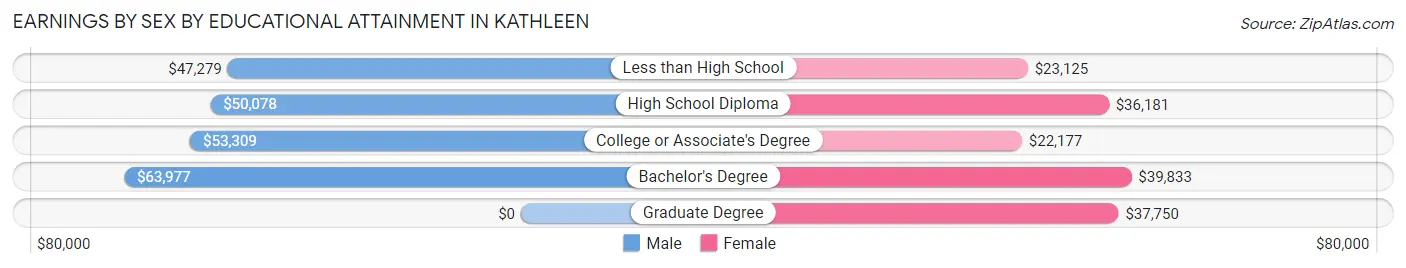
Earnings by Sex by Educational Attainment in Kathleen
Average earnings in Kathleen are $51,816 for men and $33,899 for women, a difference of 34.6%. Men with an educational attainment of bachelor's degree enjoy the highest average annual earnings of $63,977, while those with less than high school education earn the least with $47,279. Women with an educational attainment of bachelor's degree earn the most with the average annual earnings of $39,833, while those with college or associate's degree education have the smallest earnings of $22,177.
| Educational Attainment | Male Income | Female Income |
| Less than High School | $47,279 | $23,125 |
| High School Diploma | $50,078 | $36,181 |
| College or Associate's Degree | $53,309 | $22,177 |
| Bachelor's Degree | $63,977 | $39,833 |
| Graduate Degree | - | - |
| Total | $51,816 | $33,899 |
Family Income in Kathleen
Family Income Brackets in Kathleen
According to the Kathleen family income data, there are 277 families falling into the $75,000 to $99,999 income range, which is the most common income bracket and makes up 21.3% of all families. Conversely, the $10,000 to $14,999 income bracket is the least frequent group with only 16 families (1.2%) belonging to this category.
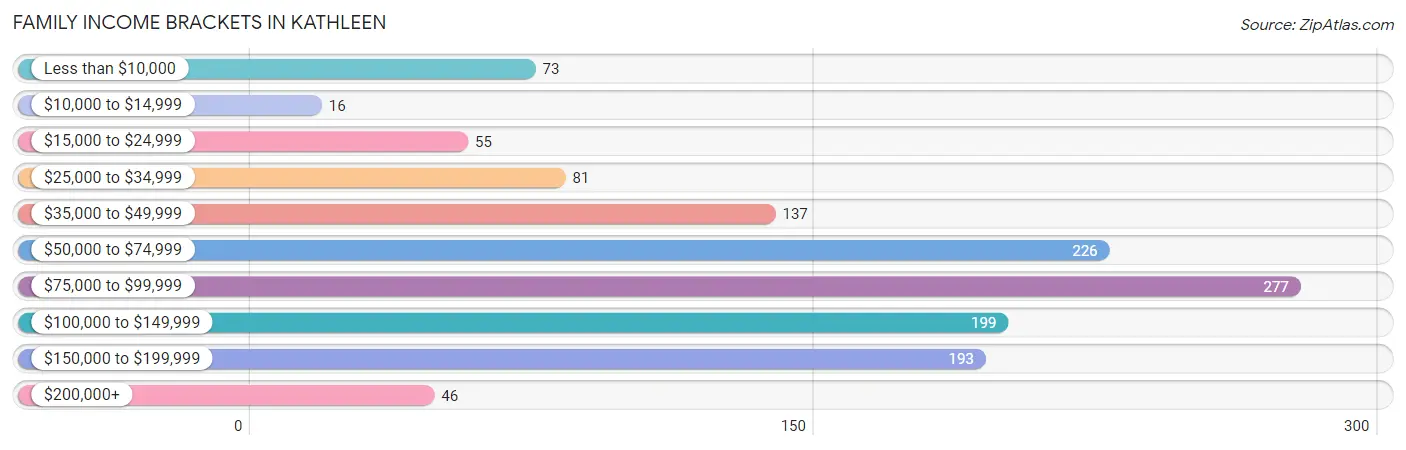
| Income Bracket | # Families | % Families |
| Less than $10,000 | 73 | 5.6% |
| $10,000 to $14,999 | 16 | 1.2% |
| $15,000 to $24,999 | 55 | 4.2% |
| $25,000 to $34,999 | 81 | 6.2% |
| $35,000 to $49,999 | 137 | 10.5% |
| $50,000 to $74,999 | 226 | 17.4% |
| $75,000 to $99,999 | 277 | 21.3% |
| $100,000 to $149,999 | 199 | 15.3% |
| $150,000 to $199,999 | 193 | 14.8% |
| $200,000+ | 46 | 3.5% |
Family Income by Famaliy Size in Kathleen
3-person families (383 | 29.4%) account for the highest median family income in Kathleen with $98,564 per family, while 2-person families (570 | 43.8%) have the highest median income of $36,111 per family member.
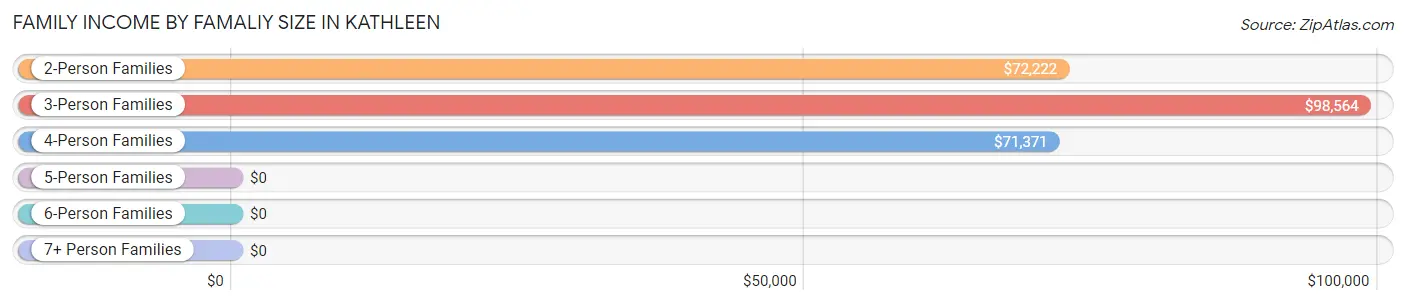
| Income Bracket | # Families | Median Income |
| 2-Person Families | 570 (43.8%) | $72,222 |
| 3-Person Families | 383 (29.4%) | $98,564 |
| 4-Person Families | 178 (13.7%) | $71,371 |
| 5-Person Families | 65 (5.0%) | $0 |
| 6-Person Families | 47 (3.6%) | $0 |
| 7+ Person Families | 58 (4.5%) | $0 |
| Total | 1,301 (100.0%) | $79,121 |
Family Income by Number of Earners in Kathleen
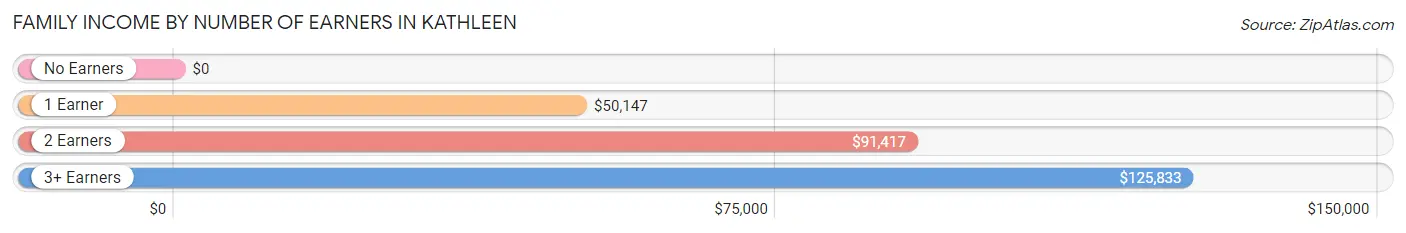
| Number of Earners | # Families | Median Income |
| No Earners | 129 (9.9%) | $0 |
| 1 Earner | 404 (31.0%) | $50,147 |
| 2 Earners | 584 (44.9%) | $91,417 |
| 3+ Earners | 184 (14.1%) | $125,833 |
| Total | 1,301 (100.0%) | $79,121 |
Household Income in Kathleen
Household Income Brackets in Kathleen
With 399 households falling in the category, the $50,000 to $74,999 income range is the most frequent in Kathleen, accounting for 18.1% of all households. In contrast, only 44 households (2.0%) fall into the $200,000+ income bracket, making it the least populous group.
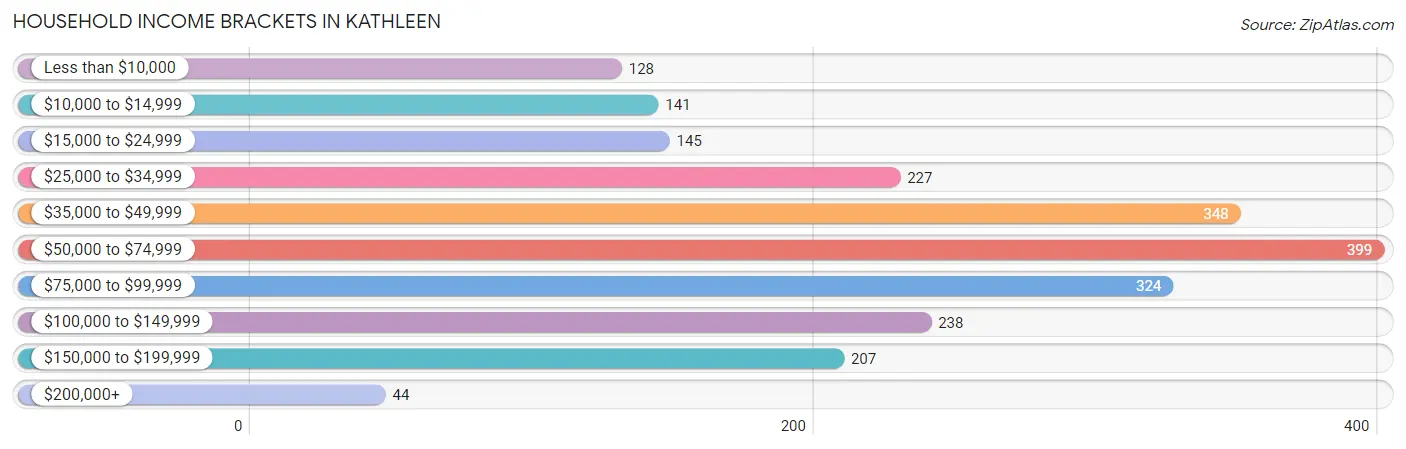
| Income Bracket | # Households | % Households |
| Less than $10,000 | 128 | 5.8% |
| $10,000 to $14,999 | 141 | 6.4% |
| $15,000 to $24,999 | 145 | 6.6% |
| $25,000 to $34,999 | 227 | 10.3% |
| $35,000 to $49,999 | 348 | 15.8% |
| $50,000 to $74,999 | 399 | 18.1% |
| $75,000 to $99,999 | 324 | 14.7% |
| $100,000 to $149,999 | 238 | 10.8% |
| $150,000 to $199,999 | 207 | 9.4% |
| $200,000+ | 44 | 2.0% |
Household Income by Householder Age in Kathleen
The median household income in Kathleen is $55,186, with the highest median household income of $55,574 found in the 25 to 44 years age bracket for the primary householder. A total of 725 households (32.9%) fall into this category. Meanwhile, the 15 to 24 years age bracket for the primary householder has the lowest median household income of $0, with 18 households (0.8%) in this group.
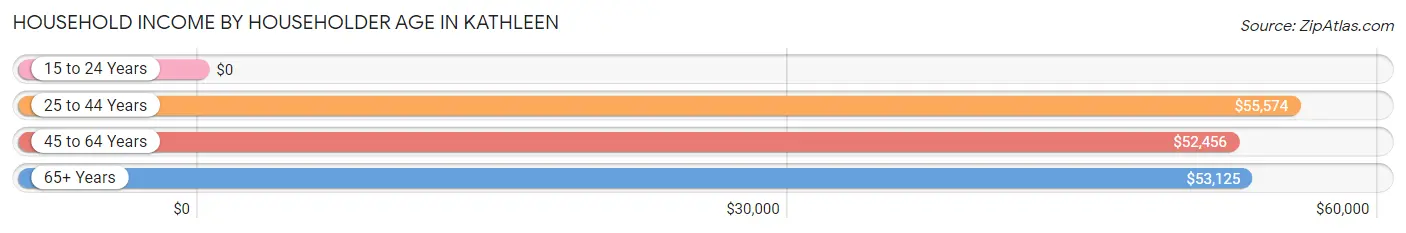
| Income Bracket | # Households | Median Income |
| 15 to 24 Years | 18 (0.8%) | $0 |
| 25 to 44 Years | 725 (32.9%) | $55,574 |
| 45 to 64 Years | 899 (40.8%) | $52,456 |
| 65+ Years | 561 (25.5%) | $53,125 |
| Total | 2,203 (100.0%) | $55,186 |
Poverty in Kathleen
Income Below Poverty by Sex and Age in Kathleen
With 17.3% poverty level for males and 21.8% for females among the residents of Kathleen, 6 to 11 year old males and under 5 year old females are the most vulnerable to poverty, with 91 males (65.5%) and 89 females (40.5%) in their respective age groups living below the poverty level.
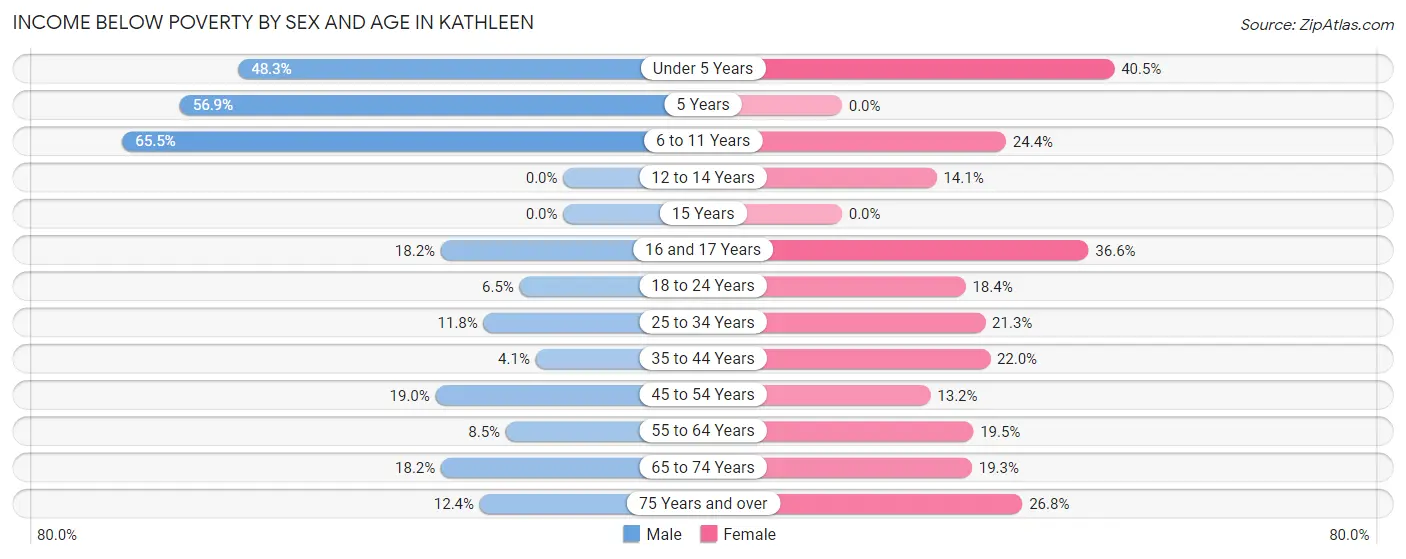
| Age Bracket | Male | Female |
| Under 5 Years | 97 (48.3%) | 89 (40.5%) |
| 5 Years | 41 (56.9%) | 0 (0.0%) |
| 6 to 11 Years | 91 (65.5%) | 58 (24.4%) |
| 12 to 14 Years | 0 (0.0%) | 9 (14.1%) |
| 15 Years | 0 (0.0%) | 0 (0.0%) |
| 16 and 17 Years | 6 (18.2%) | 26 (36.6%) |
| 18 to 24 Years | 22 (6.5%) | 45 (18.4%) |
| 25 to 34 Years | 36 (11.8%) | 79 (21.3%) |
| 35 to 44 Years | 15 (4.1%) | 110 (22.0%) |
| 45 to 54 Years | 59 (19.0%) | 33 (13.2%) |
| 55 to 64 Years | 47 (8.5%) | 88 (19.5%) |
| 65 to 74 Years | 59 (18.1%) | 77 (19.3%) |
| 75 Years and over | 15 (12.4%) | 45 (26.8%) |
| Total | 488 (17.3%) | 659 (21.8%) |
Income Above Poverty by Sex and Age in Kathleen
According to the poverty statistics in Kathleen, males aged 12 to 14 years and females aged 15 years are the age groups that are most secure financially, with 100.0% of males and 100.0% of females in these age groups living above the poverty line.
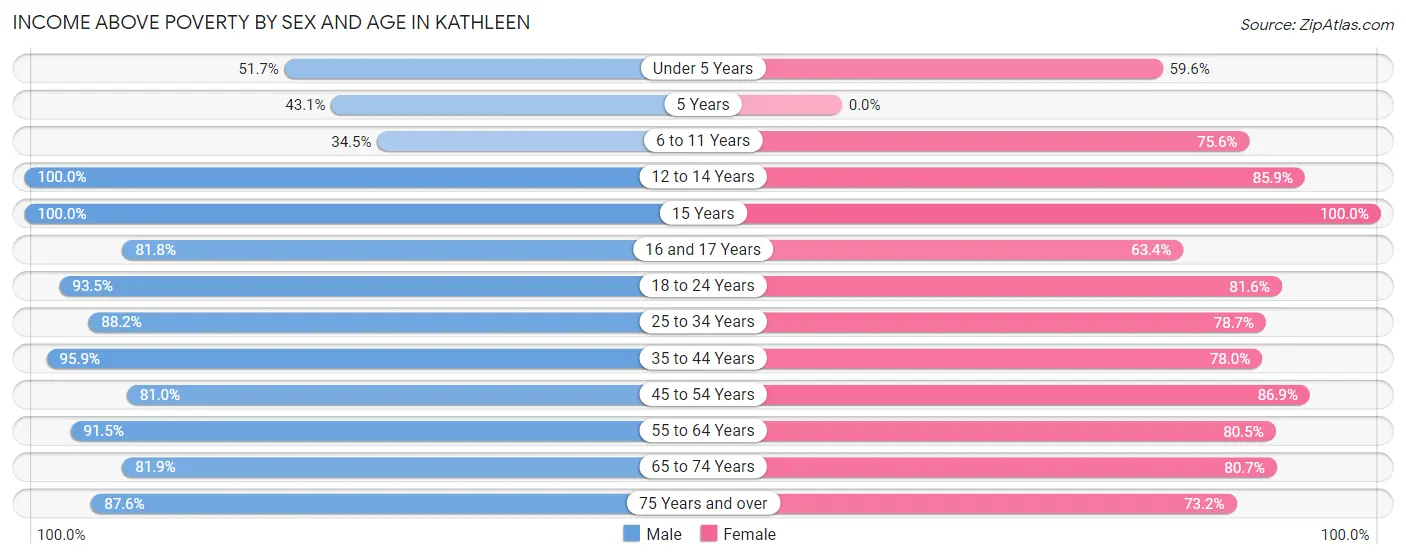
| Age Bracket | Male | Female |
| Under 5 Years | 104 (51.7%) | 131 (59.6%) |
| 5 Years | 31 (43.1%) | 0 (0.0%) |
| 6 to 11 Years | 48 (34.5%) | 180 (75.6%) |
| 12 to 14 Years | 36 (100.0%) | 55 (85.9%) |
| 15 Years | 20 (100.0%) | 47 (100.0%) |
| 16 and 17 Years | 27 (81.8%) | 45 (63.4%) |
| 18 to 24 Years | 317 (93.5%) | 200 (81.6%) |
| 25 to 34 Years | 268 (88.2%) | 292 (78.7%) |
| 35 to 44 Years | 351 (95.9%) | 390 (78.0%) |
| 45 to 54 Years | 252 (81.0%) | 218 (86.9%) |
| 55 to 64 Years | 504 (91.5%) | 363 (80.5%) |
| 65 to 74 Years | 266 (81.9%) | 322 (80.7%) |
| 75 Years and over | 106 (87.6%) | 123 (73.2%) |
| Total | 2,330 (82.7%) | 2,366 (78.2%) |
Income Below Poverty Among Married-Couple Families in Kathleen
The poverty statistics for married-couple families in Kathleen show that 4.6% or 42 of the total 903 families live below the poverty line. Families with 3 or 4 children have the highest poverty rate of 24.7%, comprising of 20 families. On the other hand, families with 1 or 2 children have the lowest poverty rate of 2.5%, which includes 6 families.
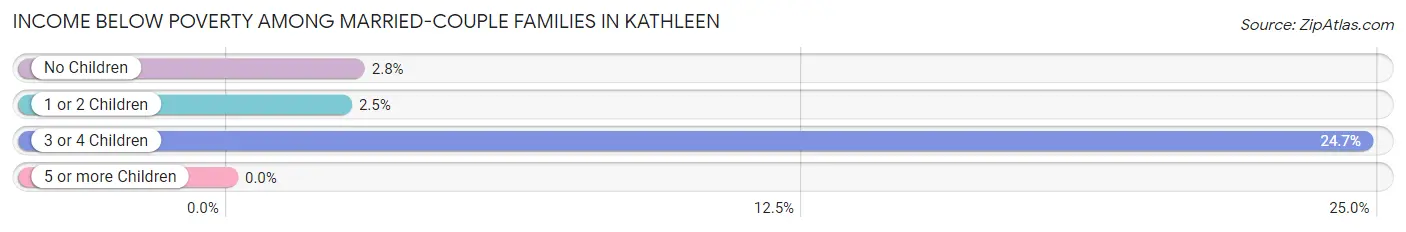
| Children | Above Poverty | Below Poverty |
| No Children | 564 (97.2%) | 16 (2.8%) |
| 1 or 2 Children | 236 (97.5%) | 6 (2.5%) |
| 3 or 4 Children | 61 (75.3%) | 20 (24.7%) |
| 5 or more Children | 0 (0.0%) | 0 (0.0%) |
| Total | 861 (95.4%) | 42 (4.6%) |
Income Below Poverty Among Single-Parent Households in Kathleen
According to the poverty data in Kathleen, 15.1% or 22 single-father households and 30.6% or 77 single-mother households are living below the poverty line. Among single-father households, those with 3 or 4 children have the highest poverty rate, with 10 households (58.8%) experiencing poverty. Likewise, among single-mother households, those with 3 or 4 children have the highest poverty rate, with 49 households (100.0%) falling below the poverty line.
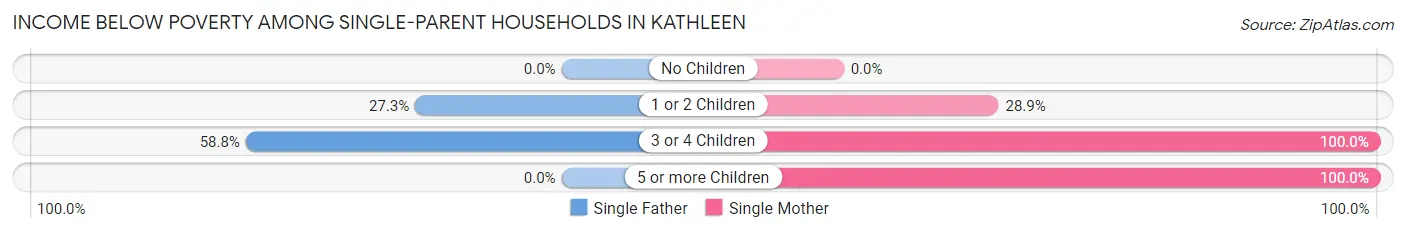
| Children | Single Father | Single Mother |
| No Children | 0 (0.0%) | 0 (0.0%) |
| 1 or 2 Children | 12 (27.3%) | 15 (28.8%) |
| 3 or 4 Children | 10 (58.8%) | 49 (100.0%) |
| 5 or more Children | 0 (0.0%) | 13 (100.0%) |
| Total | 22 (15.1%) | 77 (30.6%) |
Income Below Poverty Among Married-Couple vs Single-Parent Households in Kathleen
The poverty data for Kathleen shows that 42 of the married-couple family households (4.6%) and 99 of the single-parent households (24.9%) are living below the poverty level. Within the married-couple family households, those with 3 or 4 children have the highest poverty rate, with 20 households (24.7%) falling below the poverty line. Among the single-parent households, those with 5 or more children have the highest poverty rate, with 13 household (100.0%) living below poverty.
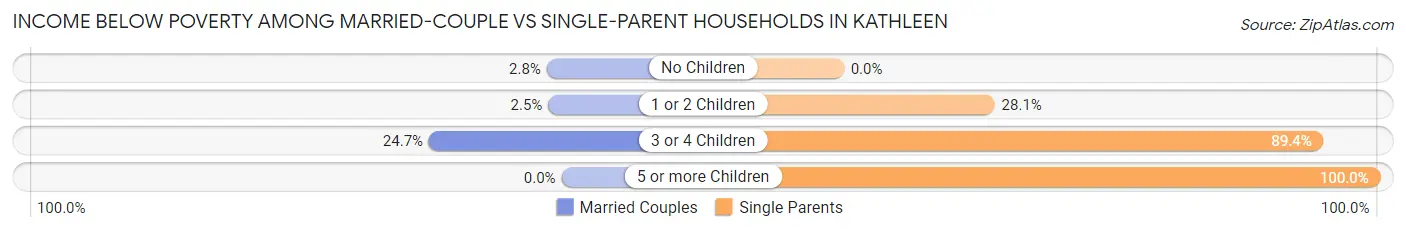
| Children | Married-Couple Families | Single-Parent Households |
| No Children | 16 (2.8%) | 0 (0.0%) |
| 1 or 2 Children | 6 (2.5%) | 27 (28.1%) |
| 3 or 4 Children | 20 (24.7%) | 59 (89.4%) |
| 5 or more Children | 0 (0.0%) | 13 (100.0%) |
| Total | 42 (4.6%) | 99 (24.9%) |
Race in Kathleen
The most populous races in Kathleen are White / Caucasian (4,767 | 81.6%), Hispanic or Latino (1,302 | 22.3%), and Two or more Races (568 | 9.7%).
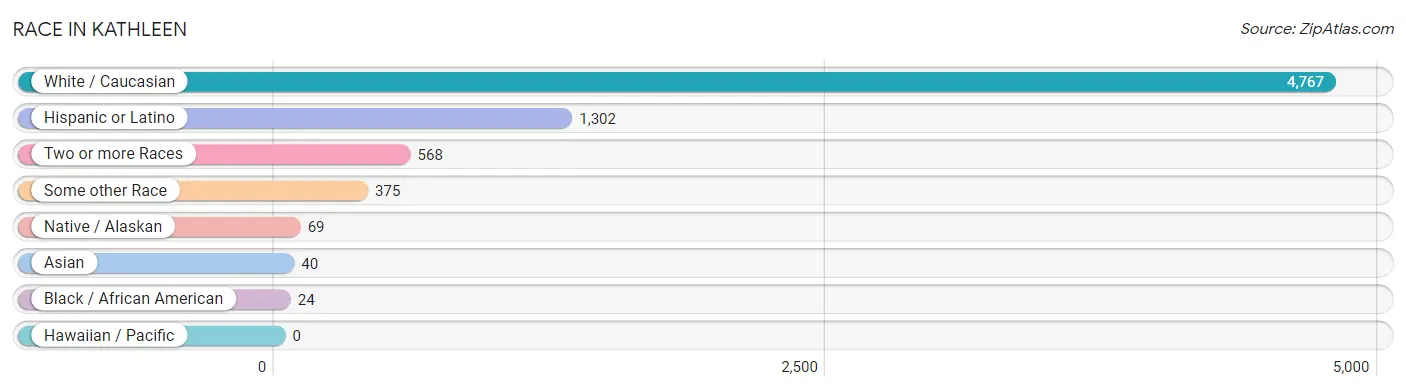
| Race | # Population | % Population |
| Asian | 40 | 0.7% |
| Black / African American | 24 | 0.4% |
| Hawaiian / Pacific | 0 | 0.0% |
| Hispanic or Latino | 1,302 | 22.3% |
| Native / Alaskan | 69 | 1.2% |
| White / Caucasian | 4,767 | 81.6% |
| Two or more Races | 568 | 9.7% |
| Some other Race | 375 | 6.4% |
| Total | 5,843 | 100.0% |
Ancestry in Kathleen
The most populous ancestries reported in Kathleen are American (1,175 | 20.1%), English (639 | 10.9%), Puerto Rican (611 | 10.5%), German (541 | 9.3%), and Irish (470 | 8.0%), together accounting for 58.8% of all Kathleen residents.
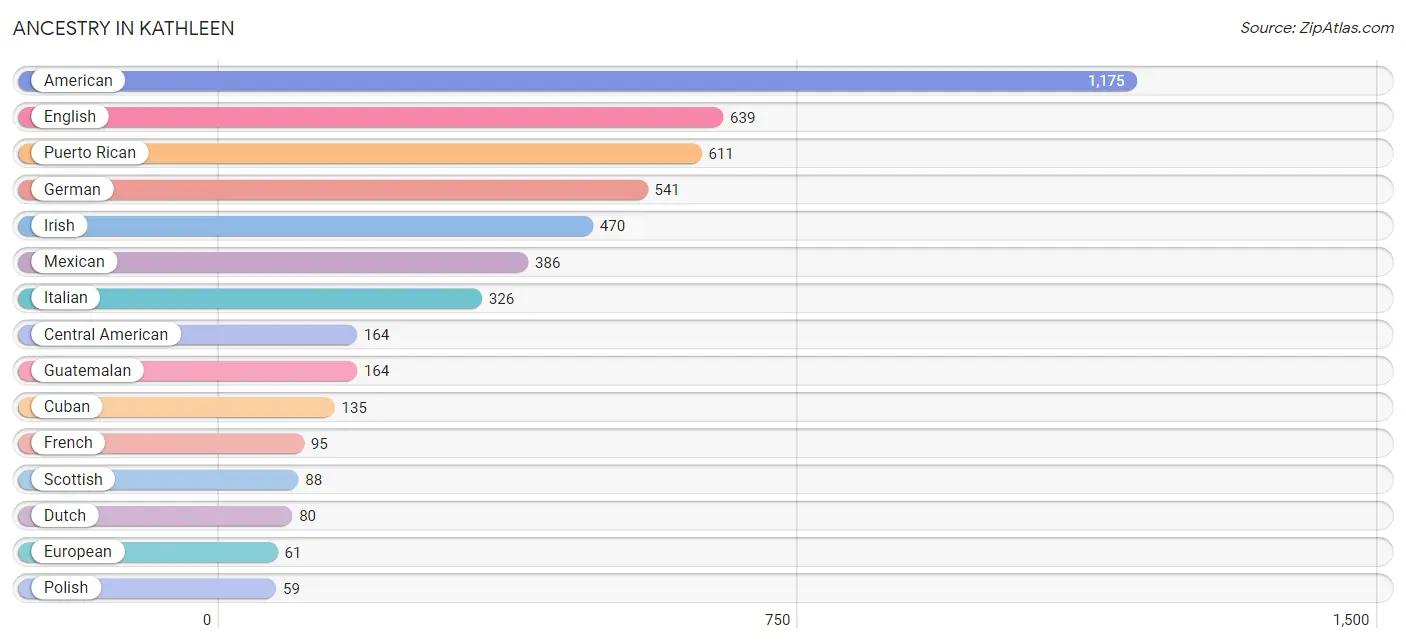
| Ancestry | # Population | % Population |
| American | 1,175 | 20.1% |
| Australian | 9 | 0.2% |
| British | 40 | 0.7% |
| Central American | 164 | 2.8% |
| Choctaw | 6 | 0.1% |
| Colombian | 6 | 0.1% |
| Cuban | 135 | 2.3% |
| Czech | 54 | 0.9% |
| Dutch | 80 | 1.4% |
| Eastern European | 7 | 0.1% |
| English | 639 | 10.9% |
| Estonian | 26 | 0.4% |
| European | 61 | 1.0% |
| French | 95 | 1.6% |
| French Canadian | 25 | 0.4% |
| German | 541 | 9.3% |
| Guatemalan | 164 | 2.8% |
| Irish | 470 | 8.0% |
| Italian | 326 | 5.6% |
| Jamaican | 5 | 0.1% |
| Korean | 38 | 0.6% |
| Laotian | 11 | 0.2% |
| Mexican | 386 | 6.6% |
| Navajo | 13 | 0.2% |
| Polish | 59 | 1.0% |
| Puerto Rican | 611 | 10.5% |
| Scotch-Irish | 28 | 0.5% |
| Scottish | 88 | 1.5% |
| Slovene | 15 | 0.3% |
| South American | 6 | 0.1% |
| Welsh | 28 | 0.5% | View All 31 Rows |
Immigrants in Kathleen
The most numerous immigrant groups reported in Kathleen came from Latin America (373 | 6.4%), Central America (240 | 4.1%), Mexico (192 | 3.3%), Caribbean (80 | 1.4%), and Cuba (69 | 1.2%), together accounting for 16.3% of all Kathleen residents.
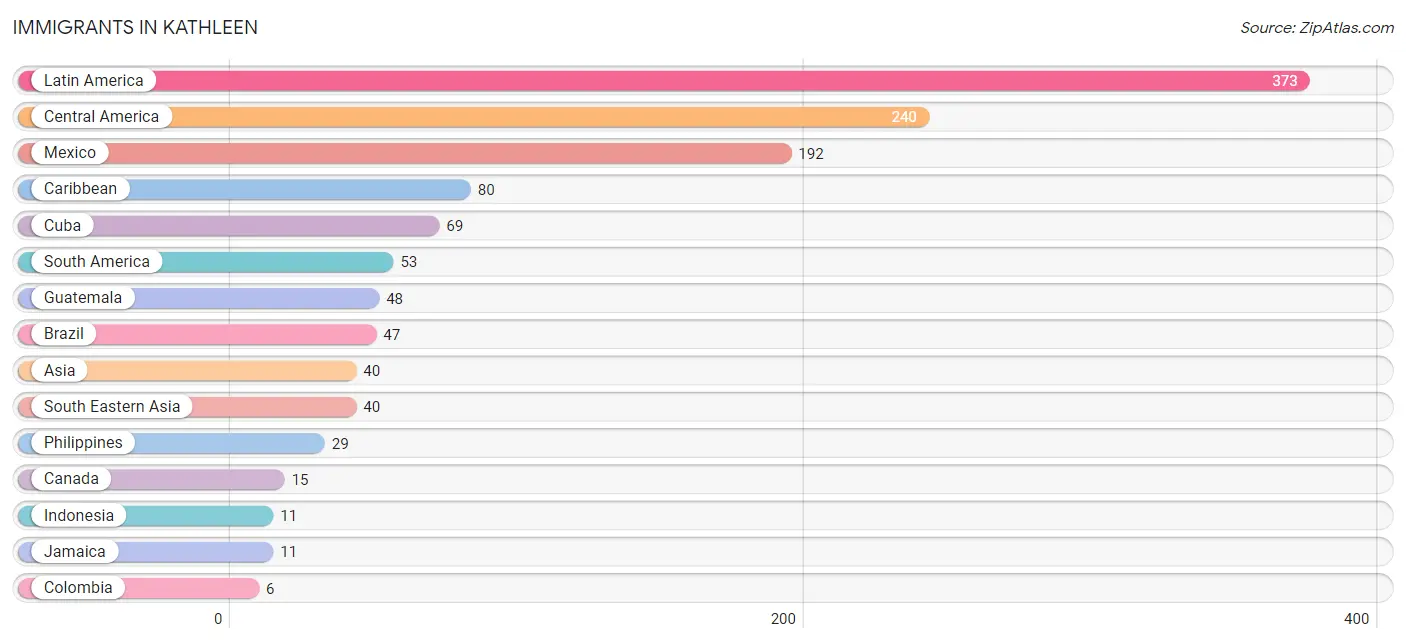
| Immigration Origin | # Population | % Population |
| Asia | 40 | 0.7% |
| Brazil | 47 | 0.8% |
| Canada | 15 | 0.3% |
| Caribbean | 80 | 1.4% |
| Central America | 240 | 4.1% |
| Colombia | 6 | 0.1% |
| Cuba | 69 | 1.2% |
| Guatemala | 48 | 0.8% |
| Indonesia | 11 | 0.2% |
| Jamaica | 11 | 0.2% |
| Latin America | 373 | 6.4% |
| Mexico | 192 | 3.3% |
| Philippines | 29 | 0.5% |
| South America | 53 | 0.9% |
| South Eastern Asia | 40 | 0.7% | View All 15 Rows |
Sex and Age in Kathleen
Sex and Age in Kathleen
The most populous age groups in Kathleen are 55 to 59 Years (333 | 11.8%) for men and 40 to 44 Years (275 | 9.1%) for women.
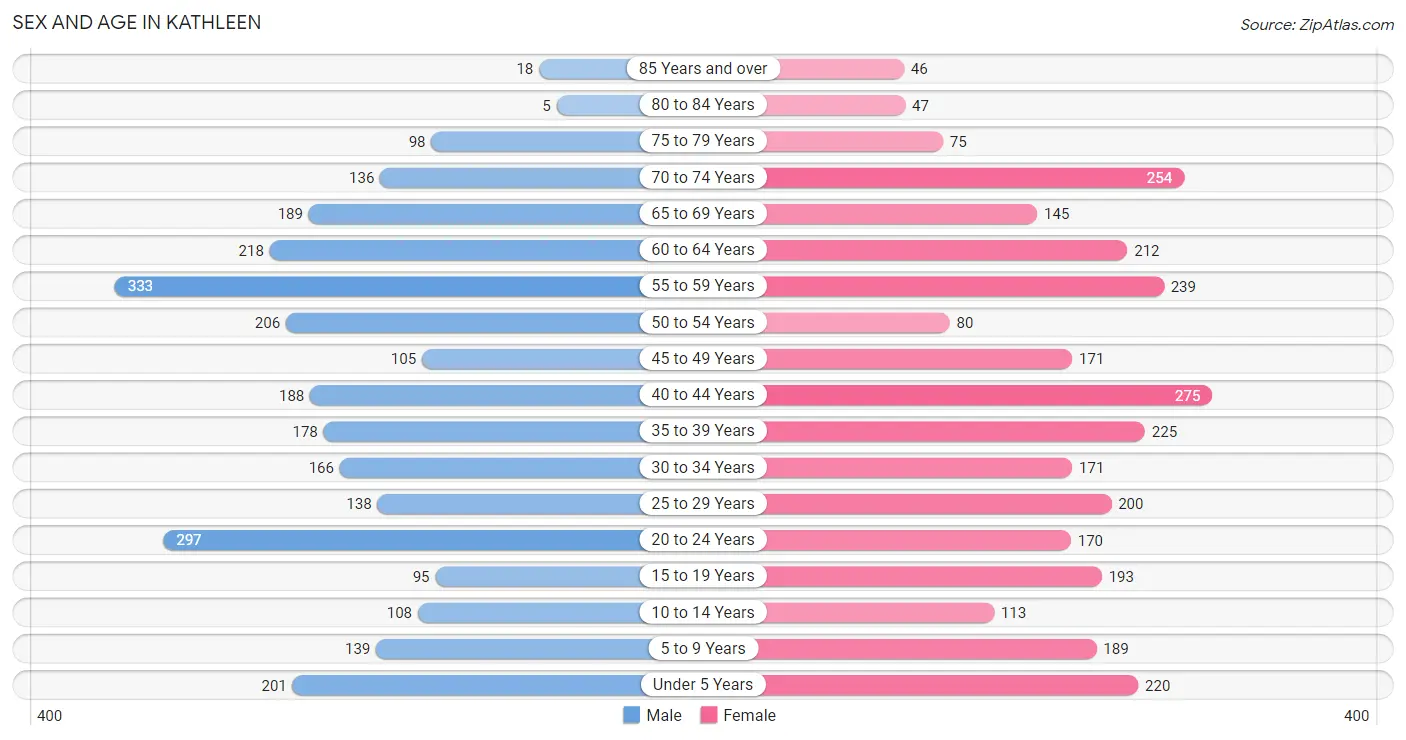
| Age Bracket | Male | Female |
| Under 5 Years | 201 (7.1%) | 220 (7.3%) |
| 5 to 9 Years | 139 (4.9%) | 189 (6.2%) |
| 10 to 14 Years | 108 (3.8%) | 113 (3.7%) |
| 15 to 19 Years | 95 (3.4%) | 193 (6.4%) |
| 20 to 24 Years | 297 (10.5%) | 170 (5.6%) |
| 25 to 29 Years | 138 (4.9%) | 200 (6.6%) |
| 30 to 34 Years | 166 (5.9%) | 171 (5.7%) |
| 35 to 39 Years | 178 (6.3%) | 225 (7.4%) |
| 40 to 44 Years | 188 (6.7%) | 275 (9.1%) |
| 45 to 49 Years | 105 (3.7%) | 171 (5.7%) |
| 50 to 54 Years | 206 (7.3%) | 80 (2.6%) |
| 55 to 59 Years | 333 (11.8%) | 239 (7.9%) |
| 60 to 64 Years | 218 (7.7%) | 212 (7.0%) |
| 65 to 69 Years | 189 (6.7%) | 145 (4.8%) |
| 70 to 74 Years | 136 (4.8%) | 254 (8.4%) |
| 75 to 79 Years | 98 (3.5%) | 75 (2.5%) |
| 80 to 84 Years | 5 (0.2%) | 47 (1.5%) |
| 85 Years and over | 18 (0.6%) | 46 (1.5%) |
| Total | 2,818 (100.0%) | 3,025 (100.0%) |
Families and Households in Kathleen
Median Family Size in Kathleen
The median family size in Kathleen is 3.48 persons per family, with single female/mother families (252 | 19.4%) accounting for the largest median family size of 3.94 persons per family. On the other hand, married-couple families (903 | 69.4%) represent the smallest median family size with 3.31 persons per family.
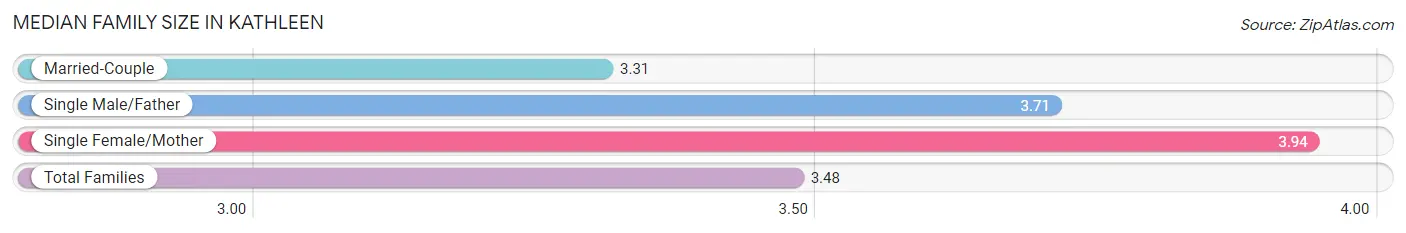
| Family Type | # Families | Family Size |
| Married-Couple | 903 (69.4%) | 3.31 |
| Single Male/Father | 146 (11.2%) | 3.71 |
| Single Female/Mother | 252 (19.4%) | 3.94 |
| Total Families | 1,301 (100.0%) | 3.48 |
Median Household Size in Kathleen
The median household size in Kathleen is 2.65 persons per household, with single female/mother households (252 | 11.4%) accounting for the largest median household size of 4.17 persons per household. non-family households (902 | 40.9%) represent the smallest median household size with 1.32 persons per household.
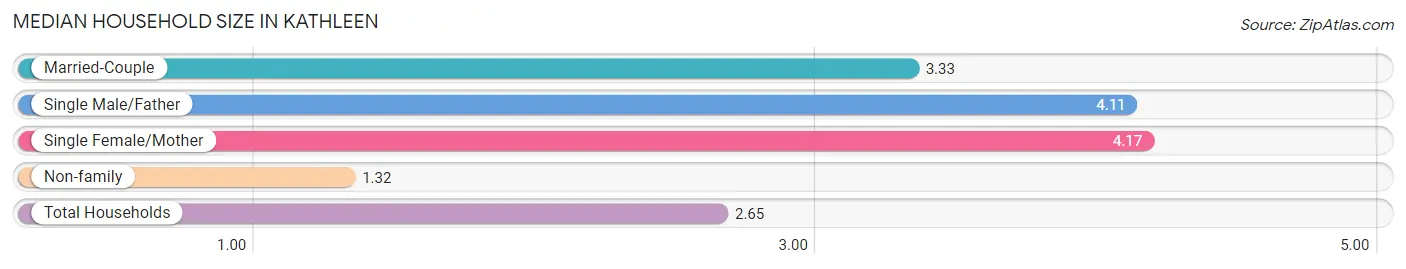
| Household Type | # Households | Household Size |
| Married-Couple | 903 (41.0%) | 3.33 |
| Single Male/Father | 146 (6.6%) | 4.11 |
| Single Female/Mother | 252 (11.4%) | 4.17 |
| Non-family | 902 (40.9%) | 1.32 |
| Total Households | 2,203 (100.0%) | 2.65 |
Household Size by Marriage Status in Kathleen
Out of a total of 2,203 households in Kathleen, 1,301 (59.1%) are family households, while 902 (40.9%) are nonfamily households. The most numerous type of family households are 2-person households, comprising 539, and the most common type of nonfamily households are 1-person households, comprising 675.
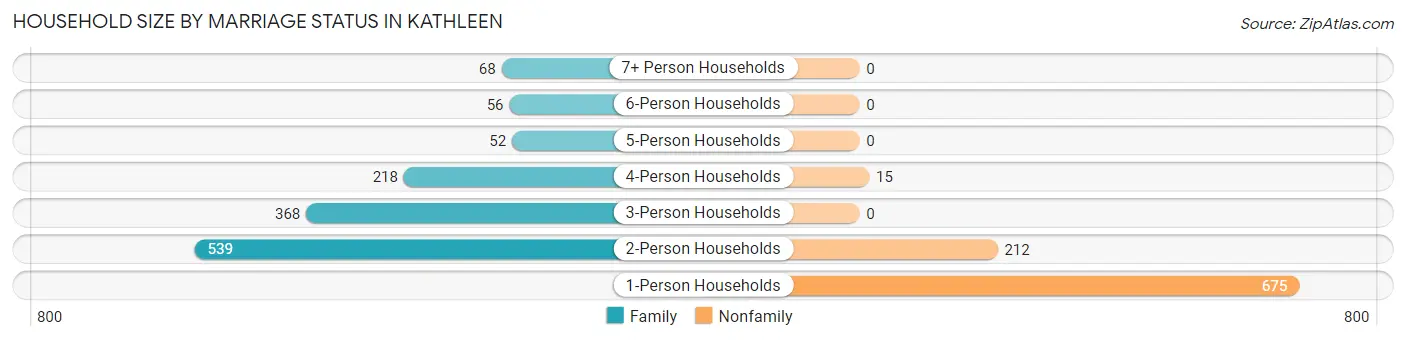
| Household Size | Family Households | Nonfamily Households |
| 1-Person Households | - | 675 (30.6%) |
| 2-Person Households | 539 (24.5%) | 212 (9.6%) |
| 3-Person Households | 368 (16.7%) | 0 (0.0%) |
| 4-Person Households | 218 (9.9%) | 15 (0.7%) |
| 5-Person Households | 52 (2.4%) | 0 (0.0%) |
| 6-Person Households | 56 (2.5%) | 0 (0.0%) |
| 7+ Person Households | 68 (3.1%) | 0 (0.0%) |
| Total | 1,301 (59.1%) | 902 (40.9%) |
Female Fertility in Kathleen
Fertility by Age in Kathleen
Average fertility rate in Kathleen is 73.0 births per 1,000 women. Women in the age bracket of 20 to 34 years have the highest fertility rate with 170.0 births per 1,000 women. Women in the age bracket of 20 to 34 years acount for 90.2% of all women with births.
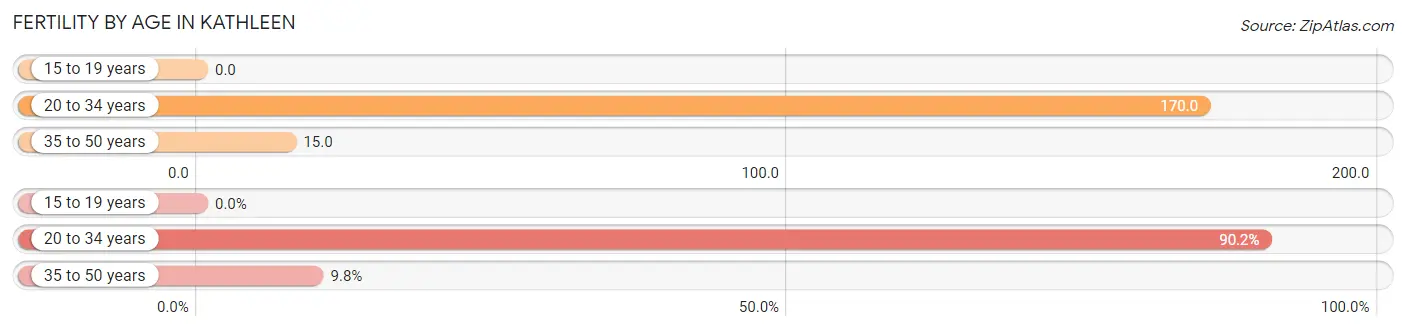
| Age Bracket | Women with Births | Births / 1,000 Women |
| 15 to 19 years | 0 (0.0%) | 0.0 |
| 20 to 34 years | 92 (90.2%) | 170.0 |
| 35 to 50 years | 10 (9.8%) | 15.0 |
| Total | 102 (100.0%) | 73.0 |
Fertility by Age by Marriage Status in Kathleen
38.2% of women with births (102) in Kathleen are married. The highest percentage of unmarried women with births falls into 20 to 34 years age bracket with 62.0% of them unmarried at the time of birth, while the lowest percentage of unmarried women with births belong to 35 to 50 years age bracket with 60.0% of them unmarried.
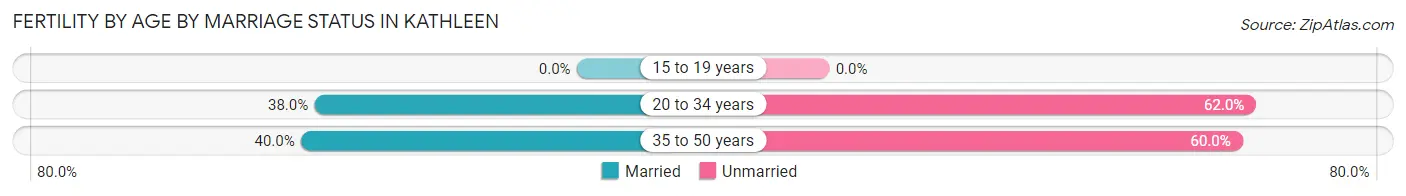
| Age Bracket | Married | Unmarried |
| 15 to 19 years | 0 (0.0%) | 0 (0.0%) |
| 20 to 34 years | 35 (38.0%) | 57 (62.0%) |
| 35 to 50 years | 4 (40.0%) | 6 (60.0%) |
| Total | 39 (38.2%) | 63 (61.8%) |
Fertility by Education in Kathleen
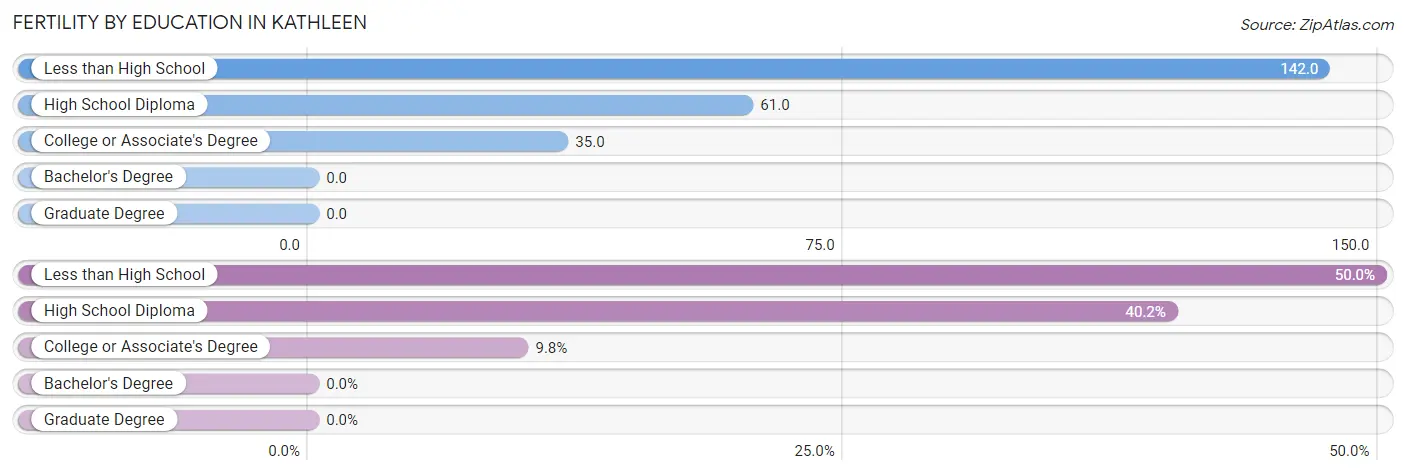
| Educational Attainment | Women with Births | Births / 1,000 Women |
| Less than High School | 51 (50.0%) | 142.0 |
| High School Diploma | 41 (40.2%) | 61.0 |
| College or Associate's Degree | 10 (9.8%) | 35.0 |
| Bachelor's Degree | 0 (0.0%) | 0.0 |
| Graduate Degree | 0 (0.0%) | 0.0 |
| Total | 102 (100.0%) | 73.0 |
Fertility by Education by Marriage Status in Kathleen
61.8% of women with births in Kathleen are unmarried. Women with the educational attainment of college or associate's degree are most likely to be married with 40.0% of them married at childbirth, while women with the educational attainment of less than high school are least likely to be married with 62.7% of them unmarried at childbirth.
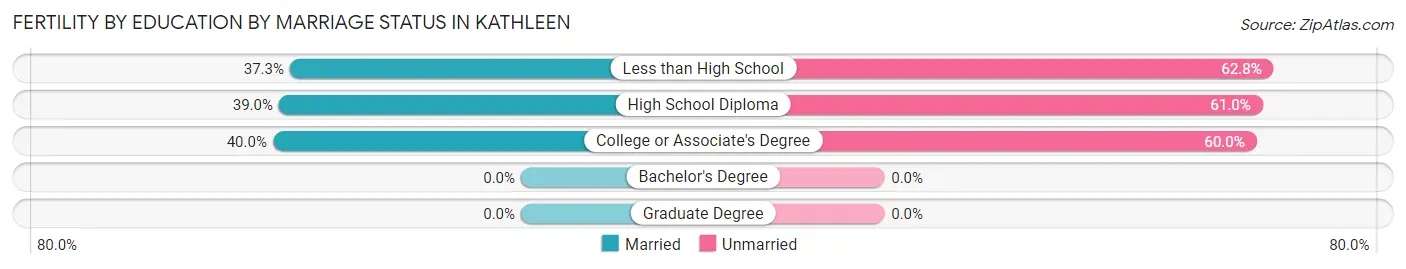
| Educational Attainment | Married | Unmarried |
| Less than High School | 19 (37.2%) | 32 (62.7%) |
| High School Diploma | 16 (39.0%) | 25 (61.0%) |
| College or Associate's Degree | 4 (40.0%) | 6 (60.0%) |
| Bachelor's Degree | 0 (0.0%) | 0 (0.0%) |
| Graduate Degree | 0 (0.0%) | 0 (0.0%) |
| Total | 39 (38.2%) | 63 (61.8%) |
Employment Characteristics in Kathleen
Employment by Class of Employer in Kathleen
Among the 2,582 employed individuals in Kathleen, private company employees (2,134 | 82.7%), not-for-profit organizations (110 | 4.3%), and local government employees (97 | 3.8%) make up the most common classes of employment.
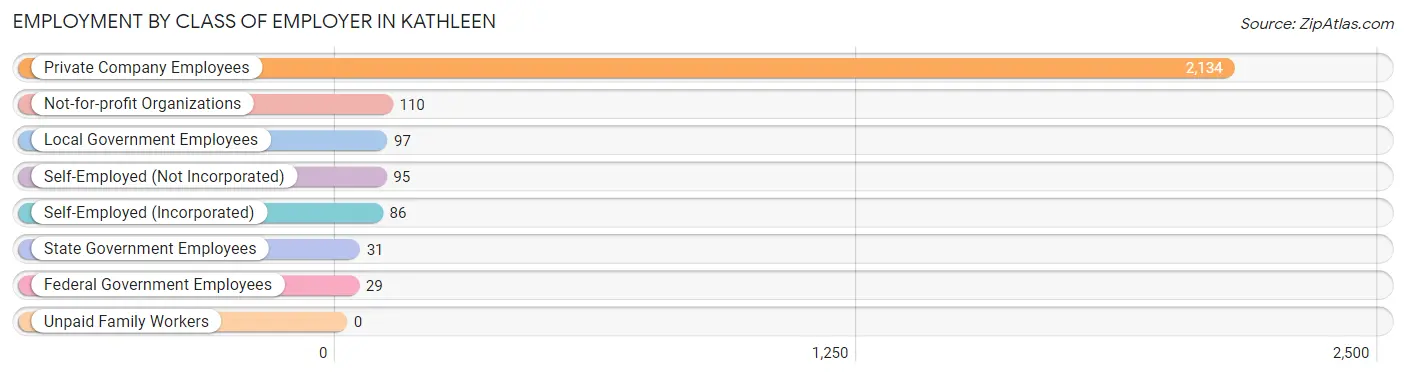
| Employer Class | # Employees | % Employees |
| Private Company Employees | 2,134 | 82.7% |
| Self-Employed (Incorporated) | 86 | 3.3% |
| Self-Employed (Not Incorporated) | 95 | 3.7% |
| Not-for-profit Organizations | 110 | 4.3% |
| Local Government Employees | 97 | 3.8% |
| State Government Employees | 31 | 1.2% |
| Federal Government Employees | 29 | 1.1% |
| Unpaid Family Workers | 0 | 0.0% |
| Total | 2,582 | 100.0% |
Employment Status by Age in Kathleen
According to the labor force statistics for Kathleen, out of the total population over 16 years of age (4,806), 59.6% or 2,864 individuals are in the labor force, with 5.1% or 146 of them unemployed. The age group with the highest labor force participation rate is 30 to 34 years, with 87.2% or 294 individuals in the labor force. Within the labor force, the 16 to 19 years age range has the highest percentage of unemployed individuals, with 26.5% or 18 of them being unemployed.
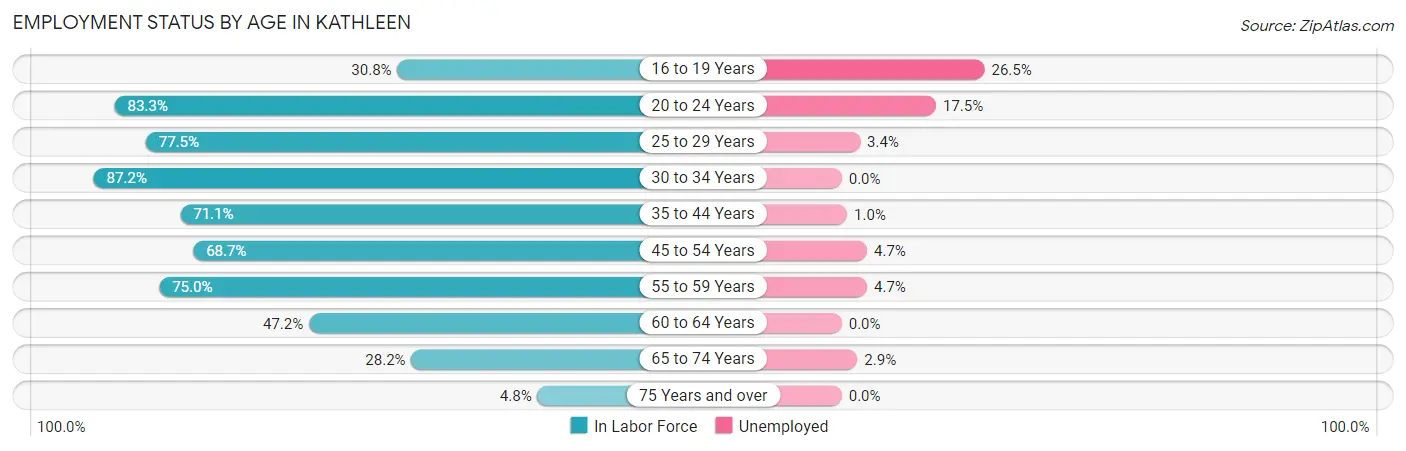
| Age Bracket | In Labor Force | Unemployed |
| 16 to 19 Years | 68 (30.8%) | 18 (26.5%) |
| 20 to 24 Years | 389 (83.3%) | 68 (17.5%) |
| 25 to 29 Years | 262 (77.5%) | 9 (3.4%) |
| 30 to 34 Years | 294 (87.2%) | 0 (0.0%) |
| 35 to 44 Years | 616 (71.1%) | 6 (1.0%) |
| 45 to 54 Years | 386 (68.7%) | 18 (4.7%) |
| 55 to 59 Years | 429 (75.0%) | 20 (4.7%) |
| 60 to 64 Years | 203 (47.2%) | 0 (0.0%) |
| 65 to 74 Years | 204 (28.2%) | 6 (2.9%) |
| 75 Years and over | 14 (4.8%) | 0 (0.0%) |
| Total | 2,864 (59.6%) | 146 (5.1%) |
Employment Status by Educational Attainment in Kathleen
According to labor force statistics for Kathleen, 70.5% of individuals (2,189) out of the total population between 25 and 64 years of age (3,105) are in the labor force, with 2.4% or 53 of them being unemployed. The group with the highest labor force participation rate are those with the educational attainment of college / associate degree, with 82.4% or 565 individuals in the labor force. Within the labor force, individuals with less than high school education have the highest percentage of unemployment, with 7.8% or 29 of them being unemployed.
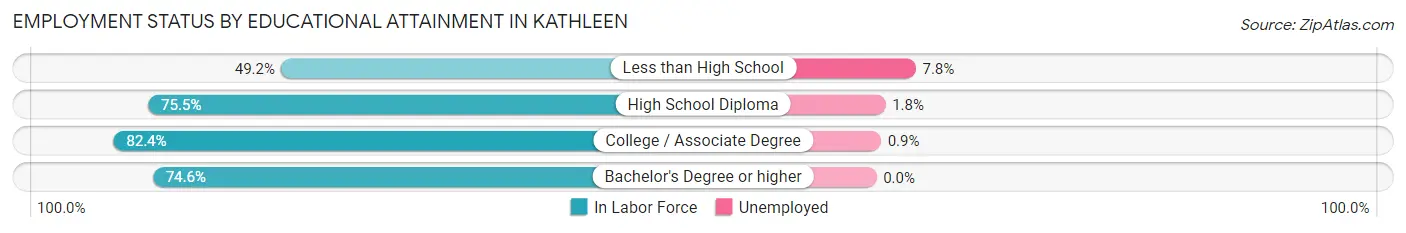
| Educational Attainment | In Labor Force | Unemployed |
| Less than High School | 372 (49.2%) | 59 (7.8%) |
| High School Diploma | 1,062 (75.5%) | 25 (1.8%) |
| College / Associate Degree | 565 (82.4%) | 6 (0.9%) |
| Bachelor's Degree or higher | 191 (74.6%) | 0 (0.0%) |
| Total | 2,189 (70.5%) | 75 (2.4%) |
Employment Occupations by Sex in Kathleen
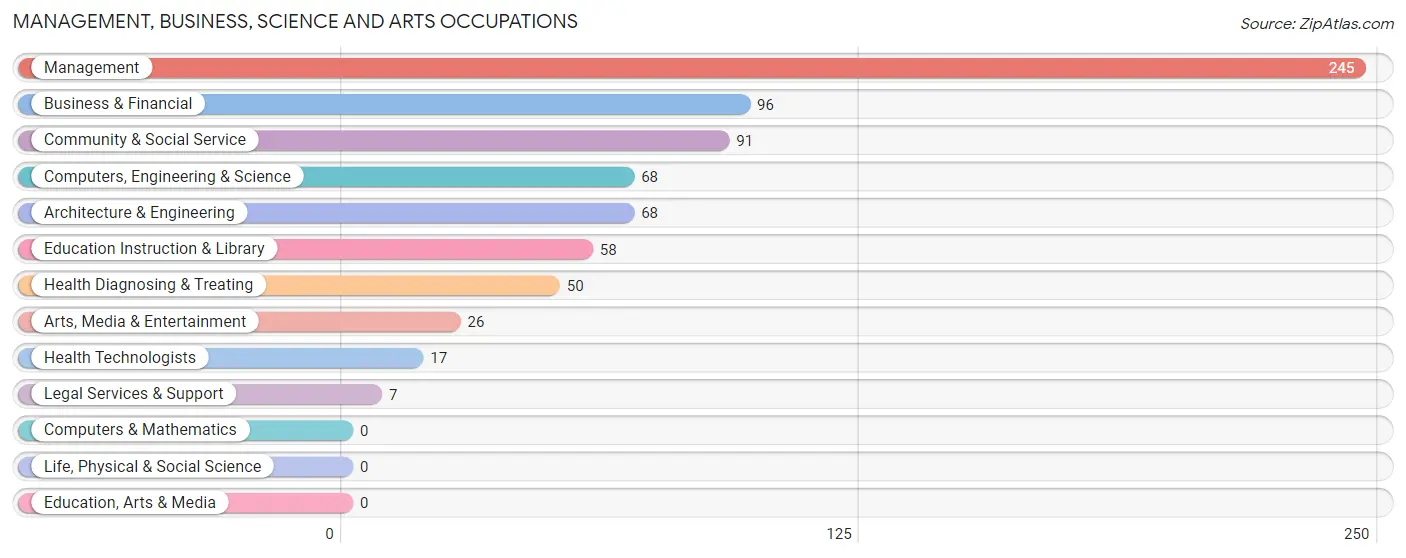
Management, Business, Science and Arts Occupations
The most common Management, Business, Science and Arts occupations in Kathleen are Management (245 | 9.0%), Business & Financial (96 | 3.5%), Community & Social Service (91 | 3.4%), Computers, Engineering & Science (68 | 2.5%), and Architecture & Engineering (68 | 2.5%).
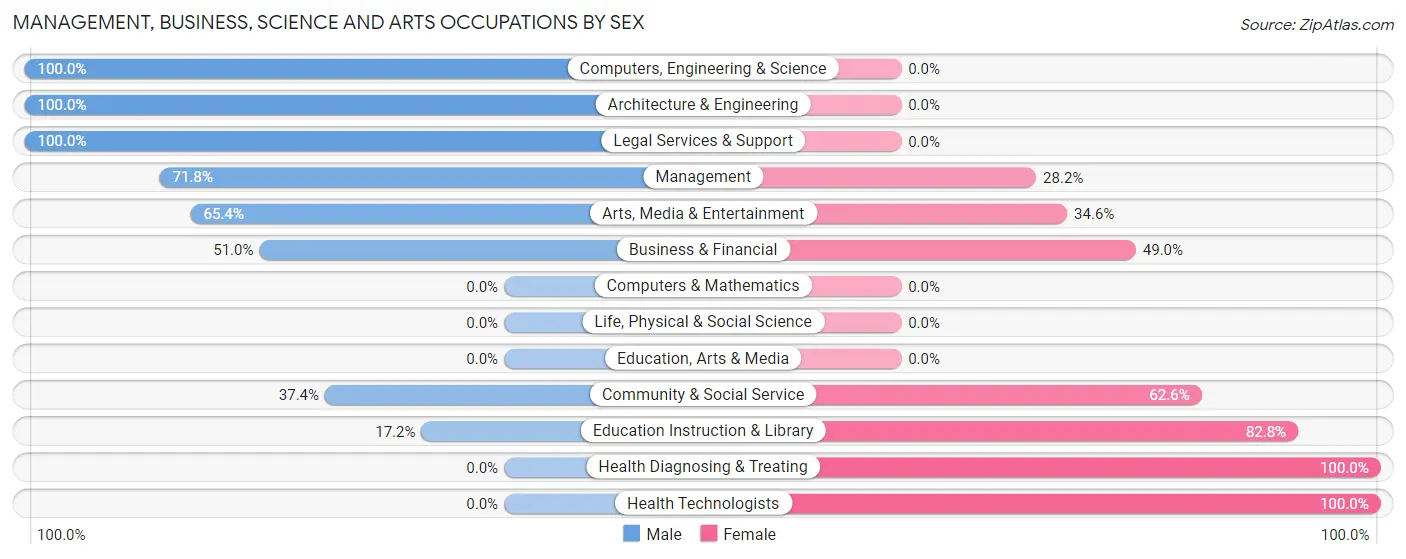
Management, Business, Science and Arts Occupations by Sex
Within the Management, Business, Science and Arts occupations in Kathleen, the most male-oriented occupations are Computers, Engineering & Science (100.0%), Architecture & Engineering (100.0%), and Legal Services & Support (100.0%), while the most female-oriented occupations are Health Diagnosing & Treating (100.0%), Health Technologists (100.0%), and Education Instruction & Library (82.8%).
| Occupation | Male | Female |
| Management | 176 (71.8%) | 69 (28.2%) |
| Business & Financial | 49 (51.0%) | 47 (49.0%) |
| Computers, Engineering & Science | 68 (100.0%) | 0 (0.0%) |
| Computers & Mathematics | 0 (0.0%) | 0 (0.0%) |
| Architecture & Engineering | 68 (100.0%) | 0 (0.0%) |
| Life, Physical & Social Science | 0 (0.0%) | 0 (0.0%) |
| Community & Social Service | 34 (37.4%) | 57 (62.6%) |
| Education, Arts & Media | 0 (0.0%) | 0 (0.0%) |
| Legal Services & Support | 7 (100.0%) | 0 (0.0%) |
| Education Instruction & Library | 10 (17.2%) | 48 (82.8%) |
| Arts, Media & Entertainment | 17 (65.4%) | 9 (34.6%) |
| Health Diagnosing & Treating | 0 (0.0%) | 50 (100.0%) |
| Health Technologists | 0 (0.0%) | 17 (100.0%) |
| Total (Category) | 327 (59.5%) | 223 (40.6%) |
| Total (Overall) | 1,434 (52.7%) | 1,286 (47.3%) |
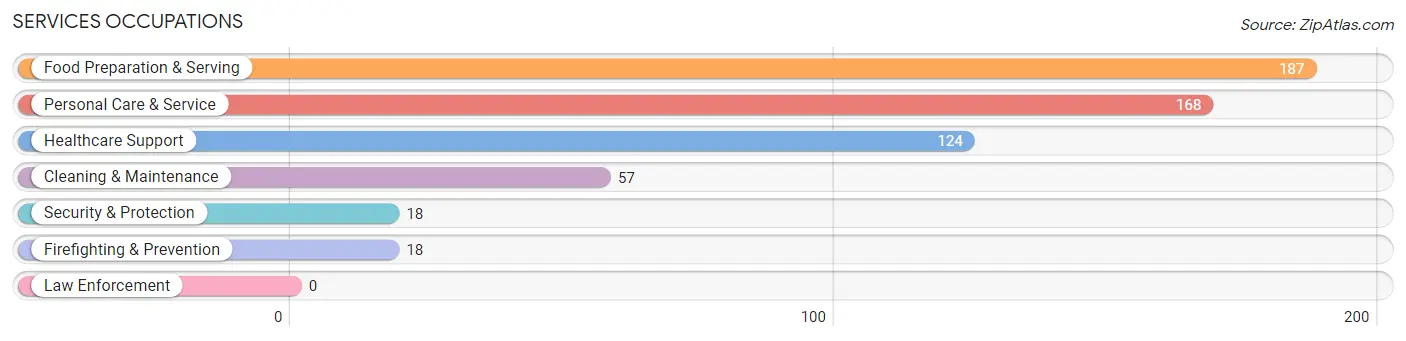
Services Occupations
The most common Services occupations in Kathleen are Food Preparation & Serving (187 | 6.9%), Personal Care & Service (168 | 6.2%), Healthcare Support (124 | 4.6%), Cleaning & Maintenance (57 | 2.1%), and Security & Protection (18 | 0.7%).
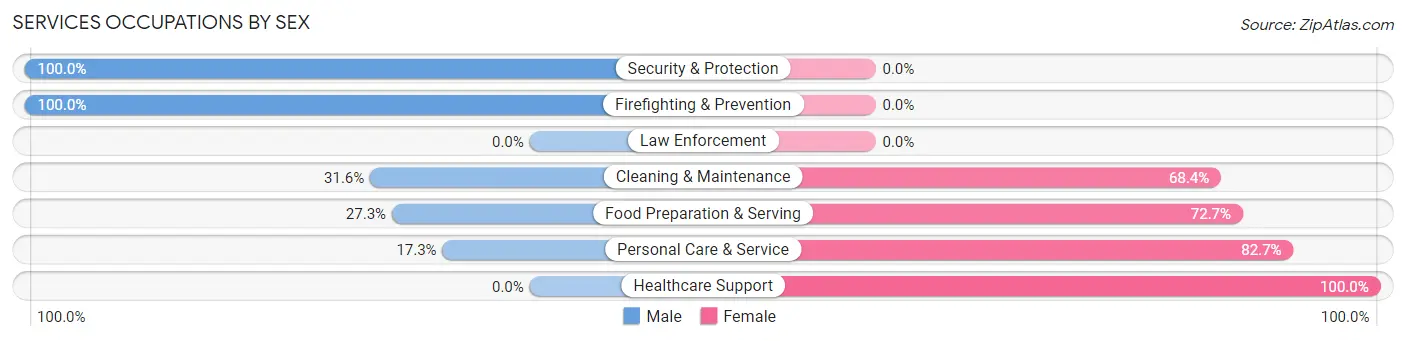
Services Occupations by Sex
Within the Services occupations in Kathleen, the most male-oriented occupations are Security & Protection (100.0%), Firefighting & Prevention (100.0%), and Cleaning & Maintenance (31.6%), while the most female-oriented occupations are Healthcare Support (100.0%), Personal Care & Service (82.7%), and Food Preparation & Serving (72.7%).
| Occupation | Male | Female |
| Healthcare Support | 0 (0.0%) | 124 (100.0%) |
| Security & Protection | 18 (100.0%) | 0 (0.0%) |
| Firefighting & Prevention | 18 (100.0%) | 0 (0.0%) |
| Law Enforcement | 0 (0.0%) | 0 (0.0%) |
| Food Preparation & Serving | 51 (27.3%) | 136 (72.7%) |
| Cleaning & Maintenance | 18 (31.6%) | 39 (68.4%) |
| Personal Care & Service | 29 (17.3%) | 139 (82.7%) |
| Total (Category) | 116 (20.9%) | 438 (79.1%) |
| Total (Overall) | 1,434 (52.7%) | 1,286 (47.3%) |
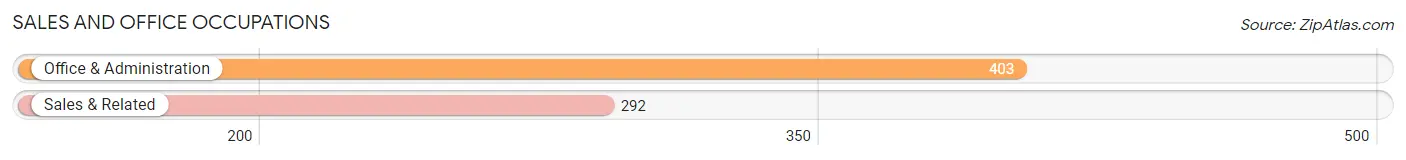
Sales and Office Occupations
The most common Sales and Office occupations in Kathleen are Office & Administration (403 | 14.8%), and Sales & Related (292 | 10.7%).
Sales and Office Occupations by Sex
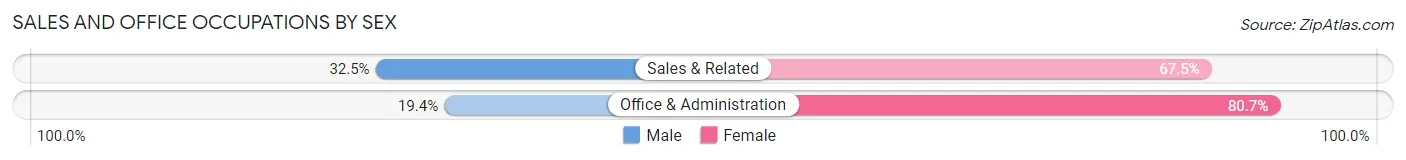
| Occupation | Male | Female |
| Sales & Related | 95 (32.5%) | 197 (67.5%) |
| Office & Administration | 78 (19.4%) | 325 (80.6%) |
| Total (Category) | 173 (24.9%) | 522 (75.1%) |
| Total (Overall) | 1,434 (52.7%) | 1,286 (47.3%) |
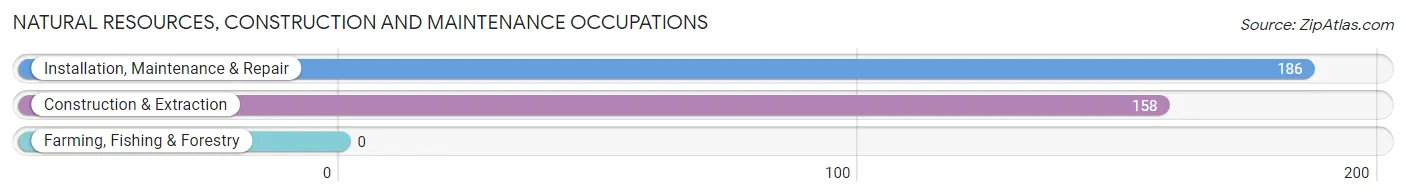
Natural Resources, Construction and Maintenance Occupations
The most common Natural Resources, Construction and Maintenance occupations in Kathleen are Installation, Maintenance & Repair (186 | 6.8%), and Construction & Extraction (158 | 5.8%).
Natural Resources, Construction and Maintenance Occupations by Sex
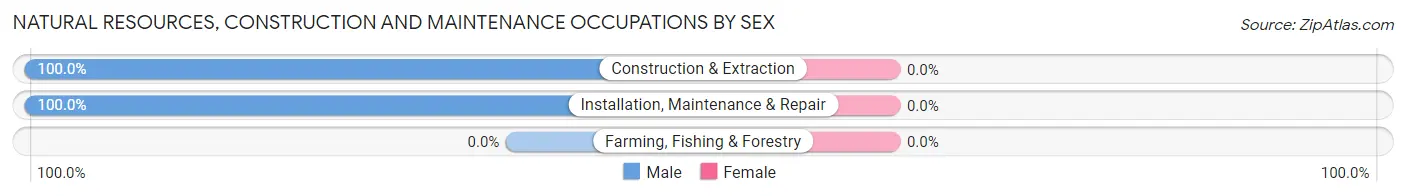
| Occupation | Male | Female |
| Farming, Fishing & Forestry | 0 (0.0%) | 0 (0.0%) |
| Construction & Extraction | 158 (100.0%) | 0 (0.0%) |
| Installation, Maintenance & Repair | 186 (100.0%) | 0 (0.0%) |
| Total (Category) | 344 (100.0%) | 0 (0.0%) |
| Total (Overall) | 1,434 (52.7%) | 1,286 (47.3%) |
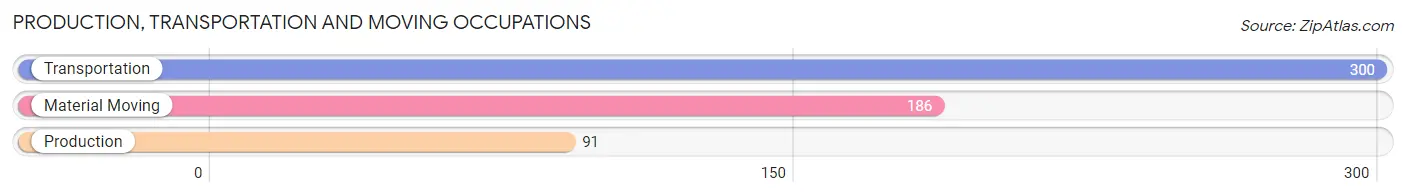
Production, Transportation and Moving Occupations
The most common Production, Transportation and Moving occupations in Kathleen are Transportation (300 | 11.0%), Material Moving (186 | 6.8%), and Production (91 | 3.4%).
Production, Transportation and Moving Occupations by Sex
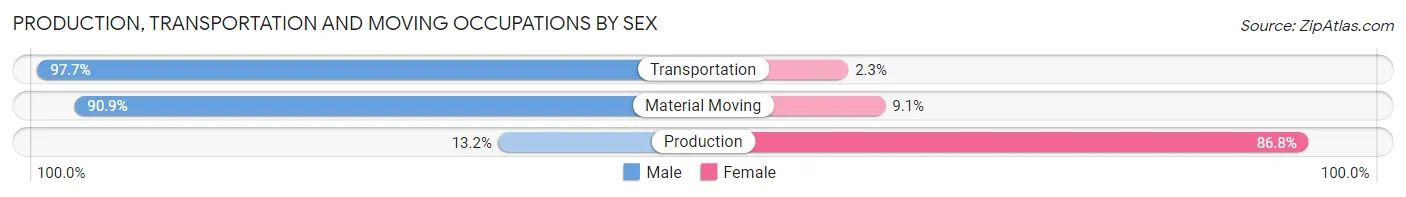
| Occupation | Male | Female |
| Production | 12 (13.2%) | 79 (86.8%) |
| Transportation | 293 (97.7%) | 7 (2.3%) |
| Material Moving | 169 (90.9%) | 17 (9.1%) |
| Total (Category) | 474 (82.2%) | 103 (17.8%) |
| Total (Overall) | 1,434 (52.7%) | 1,286 (47.3%) |
Employment Industries by Sex in Kathleen
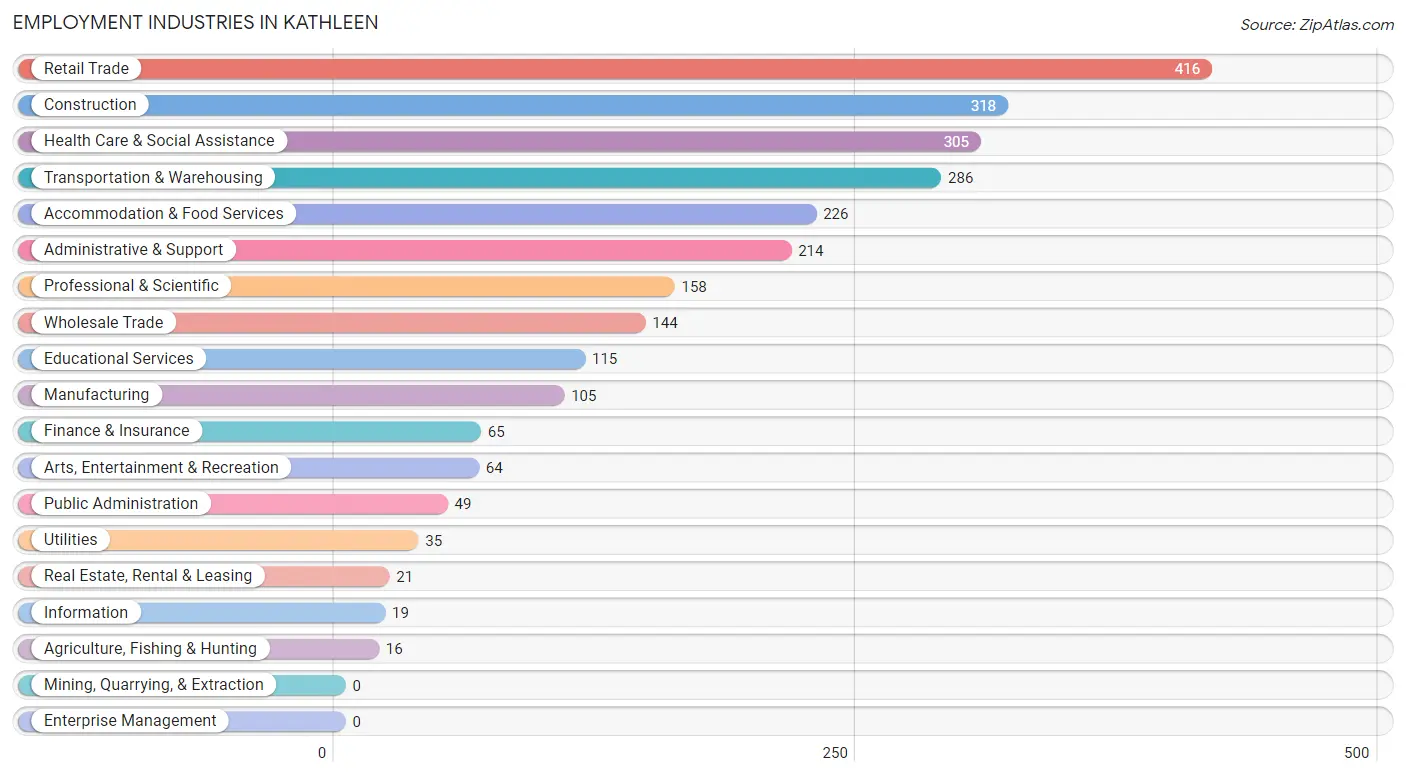
Employment Industries in Kathleen
The major employment industries in Kathleen include Retail Trade (416 | 15.3%), Construction (318 | 11.7%), Health Care & Social Assistance (305 | 11.2%), Transportation & Warehousing (286 | 10.5%), and Accommodation & Food Services (226 | 8.3%).
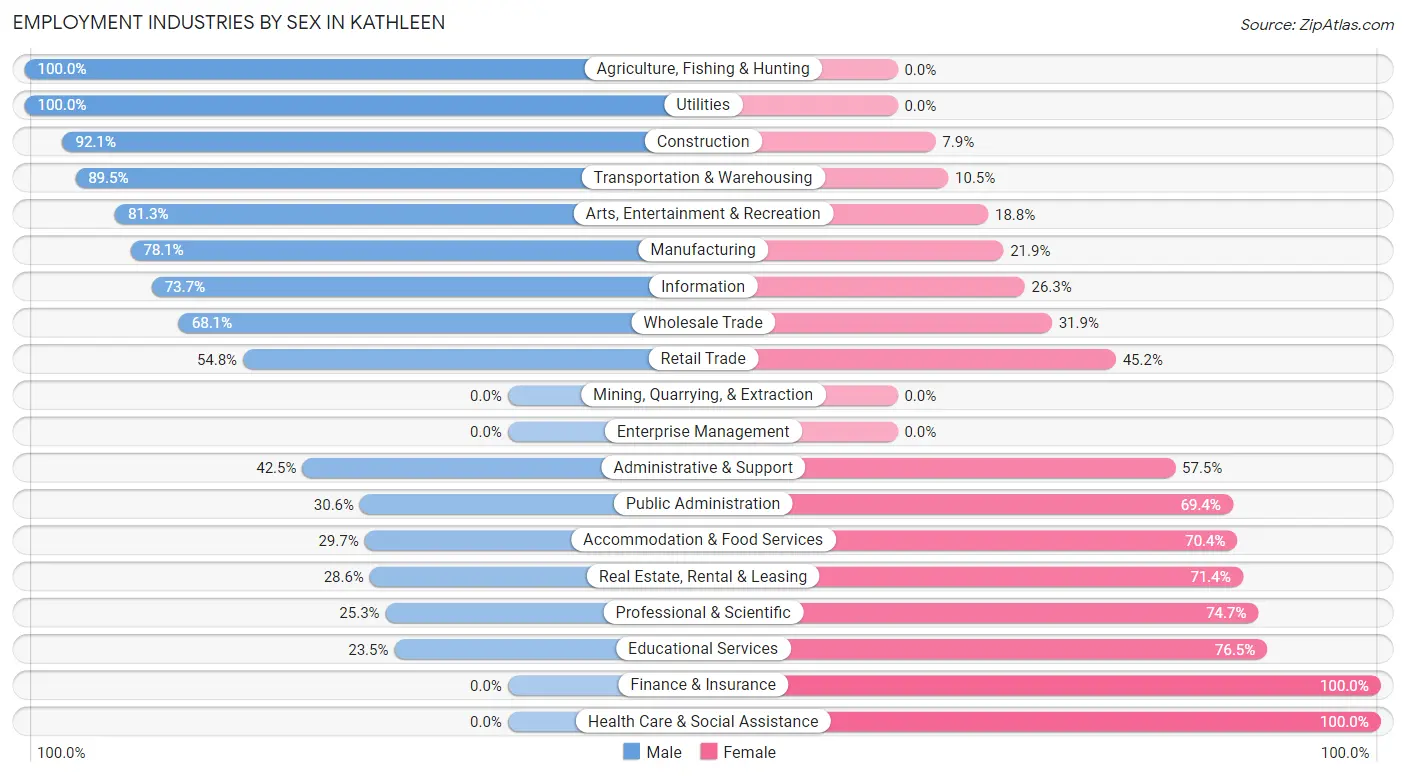
Employment Industries by Sex in Kathleen
The Kathleen industries that see more men than women are Agriculture, Fishing & Hunting (100.0%), Utilities (100.0%), and Construction (92.1%), whereas the industries that tend to have a higher number of women are Finance & Insurance (100.0%), Health Care & Social Assistance (100.0%), and Educational Services (76.5%).
| Industry | Male | Female |
| Agriculture, Fishing & Hunting | 16 (100.0%) | 0 (0.0%) |
| Mining, Quarrying, & Extraction | 0 (0.0%) | 0 (0.0%) |
| Construction | 293 (92.1%) | 25 (7.9%) |
| Manufacturing | 82 (78.1%) | 23 (21.9%) |
| Wholesale Trade | 98 (68.1%) | 46 (31.9%) |
| Retail Trade | 228 (54.8%) | 188 (45.2%) |
| Transportation & Warehousing | 256 (89.5%) | 30 (10.5%) |
| Utilities | 35 (100.0%) | 0 (0.0%) |
| Information | 14 (73.7%) | 5 (26.3%) |
| Finance & Insurance | 0 (0.0%) | 65 (100.0%) |
| Real Estate, Rental & Leasing | 6 (28.6%) | 15 (71.4%) |
| Professional & Scientific | 40 (25.3%) | 118 (74.7%) |
| Enterprise Management | 0 (0.0%) | 0 (0.0%) |
| Administrative & Support | 91 (42.5%) | 123 (57.5%) |
| Educational Services | 27 (23.5%) | 88 (76.5%) |
| Health Care & Social Assistance | 0 (0.0%) | 305 (100.0%) |
| Arts, Entertainment & Recreation | 52 (81.2%) | 12 (18.8%) |
| Accommodation & Food Services | 67 (29.6%) | 159 (70.4%) |
| Public Administration | 15 (30.6%) | 34 (69.4%) |
| Total | 1,434 (52.7%) | 1,286 (47.3%) |
Education in Kathleen
School Enrollment in Kathleen
The most common levels of schooling among the 762 students in Kathleen are high school (198 | 26.0%), middle school (160 | 21.0%), and elementary school (149 | 19.6%).

| School Level | # Students | % Students |
| Nursery / Preschool | 3 | 0.4% |
| Kindergarten | 136 | 17.8% |
| Elementary School | 149 | 19.6% |
| Middle School | 160 | 21.0% |
| High School | 198 | 26.0% |
| College / Undergraduate | 116 | 15.2% |
| Graduate / Professional | 0 | 0.0% |
| Total | 762 | 100.0% |
School Enrollment by Age by Funding Source in Kathleen
Out of a total of 762 students who are enrolled in schools in Kathleen, 158 (20.7%) attend a private institution, while the remaining 604 (79.3%) are enrolled in public schools. The age group of 20 to 24 year olds has the highest likelihood of being enrolled in private schools, with 24 (60.0% in the age bracket) enrolled. Conversely, the age group of 10 to 14 year olds has the lowest likelihood of being enrolled in a private school, with 185 (96.9% in the age bracket) attending a public institution.
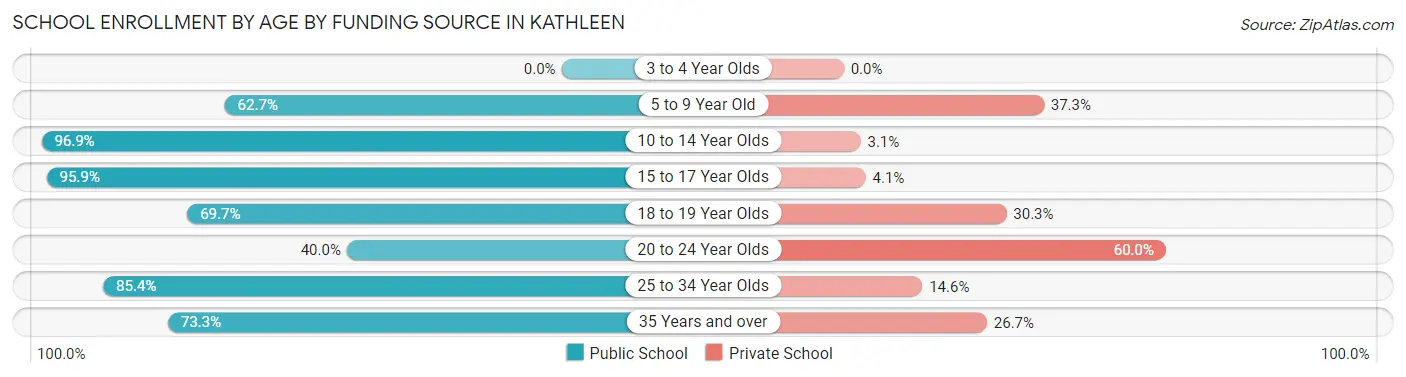
| Age Bracket | Public School | Private School |
| 3 to 4 Year Olds | 0 (0.0%) | 0 (0.0%) |
| 5 to 9 Year Old | 170 (62.7%) | 101 (37.3%) |
| 10 to 14 Year Olds | 185 (96.9%) | 6 (3.1%) |
| 15 to 17 Year Olds | 164 (95.9%) | 7 (4.1%) |
| 18 to 19 Year Olds | 23 (69.7%) | 10 (30.3%) |
| 20 to 24 Year Olds | 16 (40.0%) | 24 (60.0%) |
| 25 to 34 Year Olds | 35 (85.4%) | 6 (14.6%) |
| 35 Years and over | 11 (73.3%) | 4 (26.7%) |
| Total | 604 (79.3%) | 158 (20.7%) |
Educational Attainment by Field of Study in Kathleen
Education (88 | 26.0%), science & technology (75 | 22.1%), social sciences (55 | 16.2%), business (43 | 12.7%), and bio, nature & agricultural (42 | 12.4%) are the most common fields of study among 339 individuals in Kathleen who have obtained a bachelor's degree or higher.
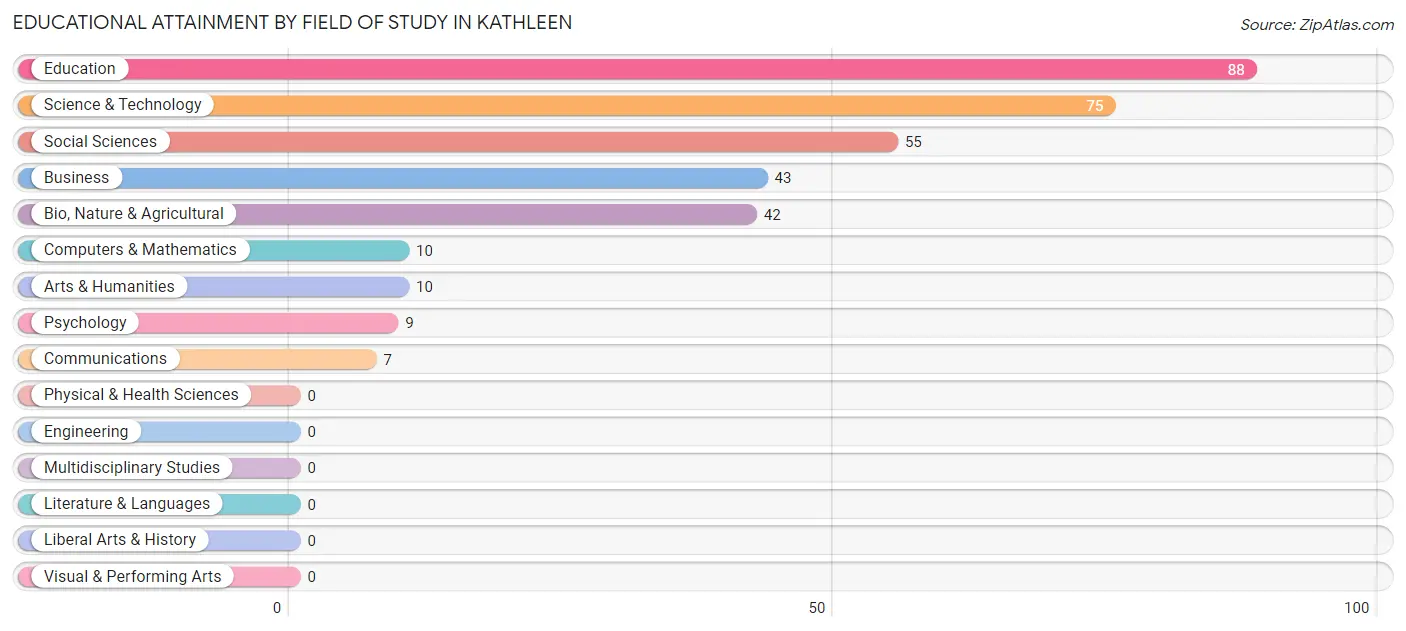
| Field of Study | # Graduates | % Graduates |
| Computers & Mathematics | 10 | 2.9% |
| Bio, Nature & Agricultural | 42 | 12.4% |
| Physical & Health Sciences | 0 | 0.0% |
| Psychology | 9 | 2.6% |
| Social Sciences | 55 | 16.2% |
| Engineering | 0 | 0.0% |
| Multidisciplinary Studies | 0 | 0.0% |
| Science & Technology | 75 | 22.1% |
| Business | 43 | 12.7% |
| Education | 88 | 26.0% |
| Literature & Languages | 0 | 0.0% |
| Liberal Arts & History | 0 | 0.0% |
| Visual & Performing Arts | 0 | 0.0% |
| Communications | 7 | 2.1% |
| Arts & Humanities | 10 | 2.9% |
| Total | 339 | 100.0% |
Transportation & Commute in Kathleen
Vehicle Availability by Sex in Kathleen
The most prevalent vehicle ownership categories in Kathleen are males with 2 vehicles (649, accounting for 47.1%) and females with 2 vehicles (637, making up 53.9%).
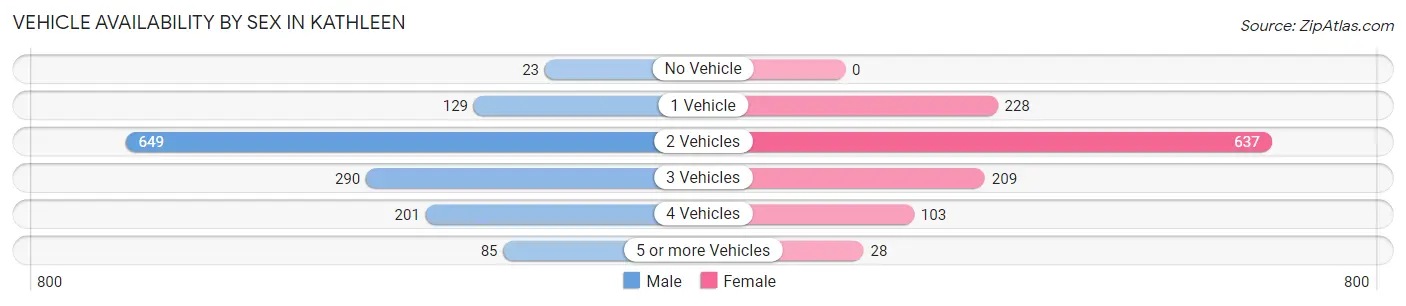
| Vehicles Available | Male | Female |
| No Vehicle | 23 (1.7%) | 0 (0.0%) |
| 1 Vehicle | 129 (9.4%) | 228 (18.9%) |
| 2 Vehicles | 649 (47.1%) | 637 (52.9%) |
| 3 Vehicles | 290 (21.1%) | 209 (17.3%) |
| 4 Vehicles | 201 (14.6%) | 103 (8.6%) |
| 5 or more Vehicles | 85 (6.2%) | 28 (2.3%) |
| Total | 1,377 (100.0%) | 1,205 (100.0%) |
Commute Time in Kathleen
The most frequently occuring commute durations in Kathleen are 20 to 24 minutes (550 commuters, 22.0%), 15 to 19 minutes (498 commuters, 20.0%), and 30 to 34 minutes (398 commuters, 16.0%).
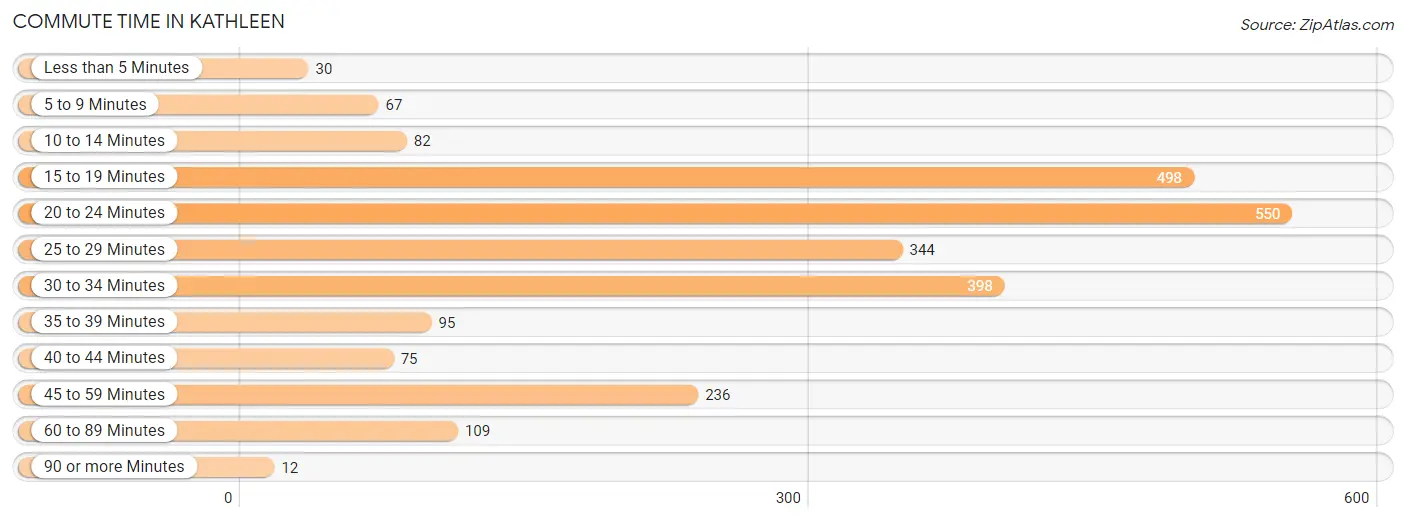
| Commute Time | # Commuters | % Commuters |
| Less than 5 Minutes | 30 | 1.2% |
| 5 to 9 Minutes | 67 | 2.7% |
| 10 to 14 Minutes | 82 | 3.3% |
| 15 to 19 Minutes | 498 | 20.0% |
| 20 to 24 Minutes | 550 | 22.0% |
| 25 to 29 Minutes | 344 | 13.8% |
| 30 to 34 Minutes | 398 | 16.0% |
| 35 to 39 Minutes | 95 | 3.8% |
| 40 to 44 Minutes | 75 | 3.0% |
| 45 to 59 Minutes | 236 | 9.5% |
| 60 to 89 Minutes | 109 | 4.4% |
| 90 or more Minutes | 12 | 0.5% |
Commute Time by Sex in Kathleen
The most common commute times in Kathleen are 20 to 24 minutes (268 commuters, 19.5%) for males and 20 to 24 minutes (282 commuters, 25.2%) for females.
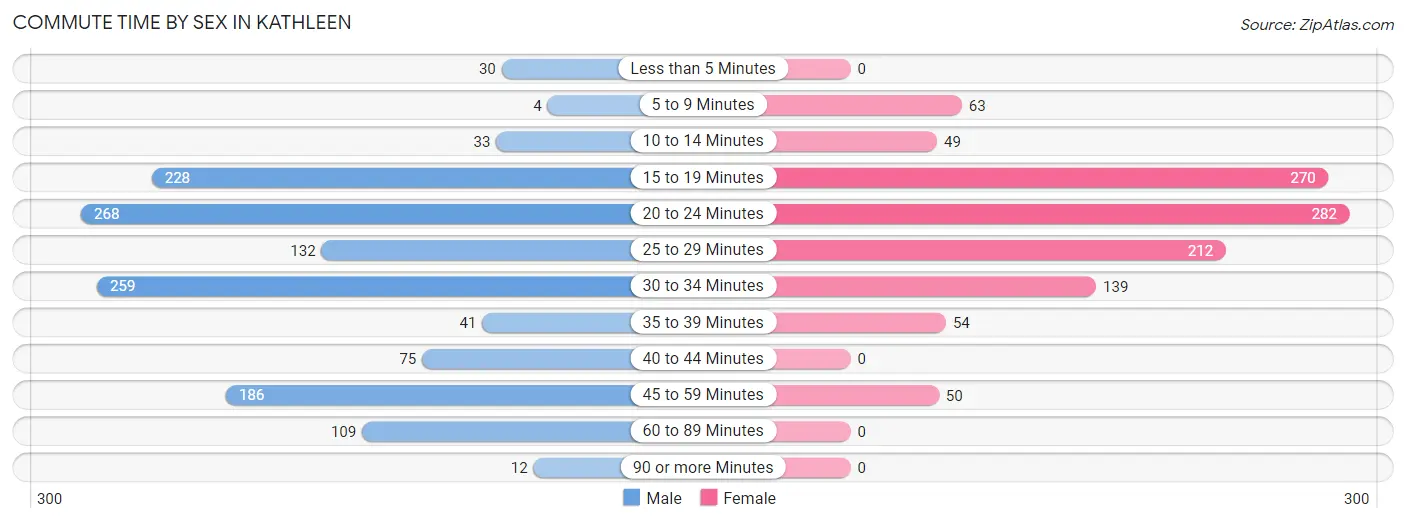
| Commute Time | Male | Female |
| Less than 5 Minutes | 30 (2.2%) | 0 (0.0%) |
| 5 to 9 Minutes | 4 (0.3%) | 63 (5.6%) |
| 10 to 14 Minutes | 33 (2.4%) | 49 (4.4%) |
| 15 to 19 Minutes | 228 (16.6%) | 270 (24.1%) |
| 20 to 24 Minutes | 268 (19.5%) | 282 (25.2%) |
| 25 to 29 Minutes | 132 (9.6%) | 212 (19.0%) |
| 30 to 34 Minutes | 259 (18.8%) | 139 (12.4%) |
| 35 to 39 Minutes | 41 (3.0%) | 54 (4.8%) |
| 40 to 44 Minutes | 75 (5.4%) | 0 (0.0%) |
| 45 to 59 Minutes | 186 (13.5%) | 50 (4.5%) |
| 60 to 89 Minutes | 109 (7.9%) | 0 (0.0%) |
| 90 or more Minutes | 12 (0.9%) | 0 (0.0%) |
Time of Departure to Work by Sex in Kathleen
The most frequent times of departure to work in Kathleen are 7:00 AM to 7:29 AM (282, 20.5%) for males and 8:30 AM to 8:59 AM (266, 23.8%) for females.
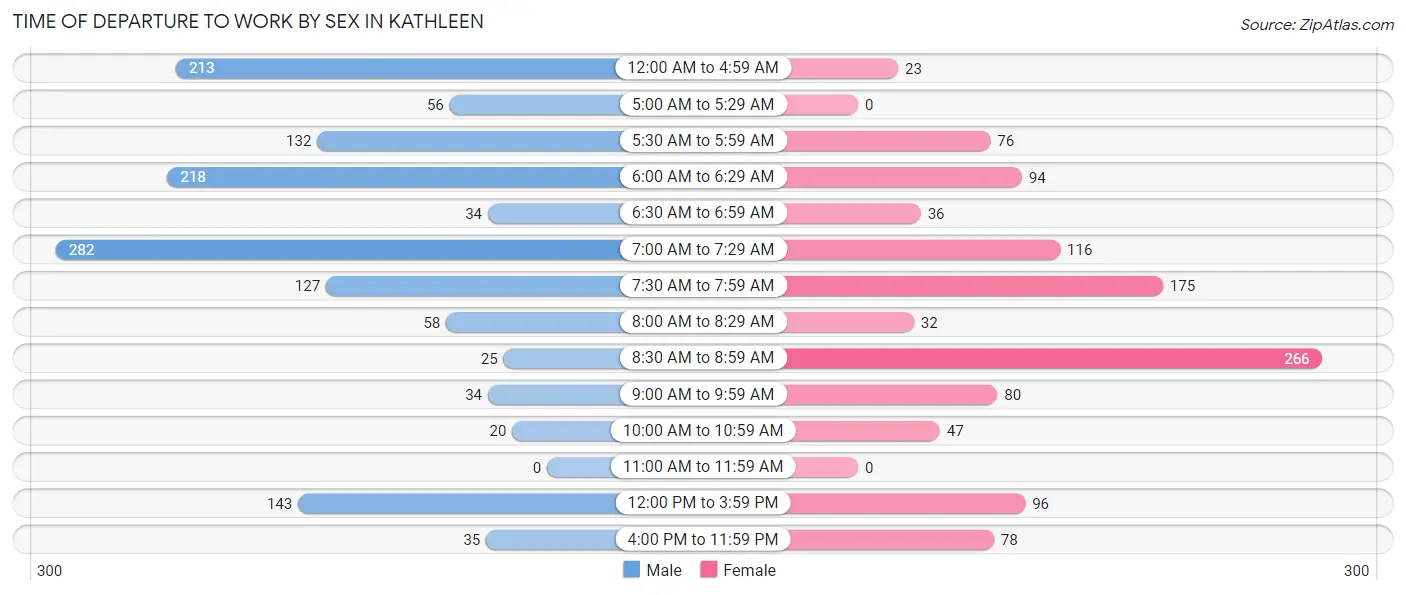
| Time of Departure | Male | Female |
| 12:00 AM to 4:59 AM | 213 (15.5%) | 23 (2.1%) |
| 5:00 AM to 5:29 AM | 56 (4.1%) | 0 (0.0%) |
| 5:30 AM to 5:59 AM | 132 (9.6%) | 76 (6.8%) |
| 6:00 AM to 6:29 AM | 218 (15.8%) | 94 (8.4%) |
| 6:30 AM to 6:59 AM | 34 (2.5%) | 36 (3.2%) |
| 7:00 AM to 7:29 AM | 282 (20.5%) | 116 (10.4%) |
| 7:30 AM to 7:59 AM | 127 (9.2%) | 175 (15.6%) |
| 8:00 AM to 8:29 AM | 58 (4.2%) | 32 (2.9%) |
| 8:30 AM to 8:59 AM | 25 (1.8%) | 266 (23.8%) |
| 9:00 AM to 9:59 AM | 34 (2.5%) | 80 (7.1%) |
| 10:00 AM to 10:59 AM | 20 (1.5%) | 47 (4.2%) |
| 11:00 AM to 11:59 AM | 0 (0.0%) | 0 (0.0%) |
| 12:00 PM to 3:59 PM | 143 (10.4%) | 96 (8.6%) |
| 4:00 PM to 11:59 PM | 35 (2.5%) | 78 (7.0%) |
| Total | 1,377 (100.0%) | 1,119 (100.0%) |
Housing Occupancy in Kathleen
Occupancy by Ownership in Kathleen
Of the total 2,203 dwellings in Kathleen, owner-occupied units account for 1,848 (83.9%), while renter-occupied units make up 355 (16.1%).
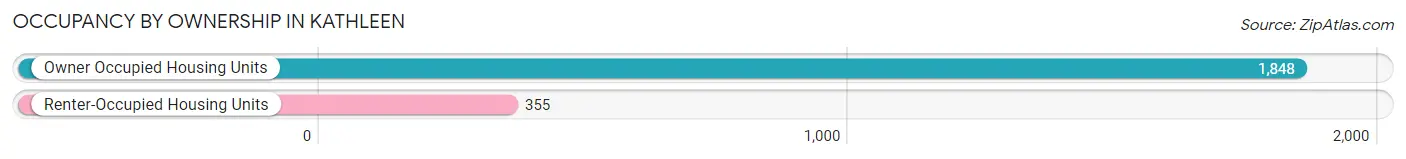
| Occupancy | # Housing Units | % Housing Units |
| Owner Occupied Housing Units | 1,848 | 83.9% |
| Renter-Occupied Housing Units | 355 | 16.1% |
| Total Occupied Housing Units | 2,203 | 100.0% |
Occupancy by Household Size in Kathleen
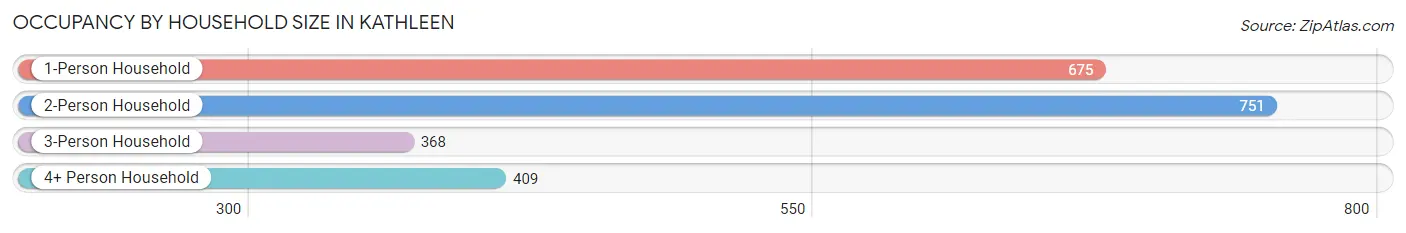
| Household Size | # Housing Units | % Housing Units |
| 1-Person Household | 675 | 30.6% |
| 2-Person Household | 751 | 34.1% |
| 3-Person Household | 368 | 16.7% |
| 4+ Person Household | 409 | 18.6% |
| Total Housing Units | 2,203 | 100.0% |
Occupancy by Ownership by Household Size in Kathleen
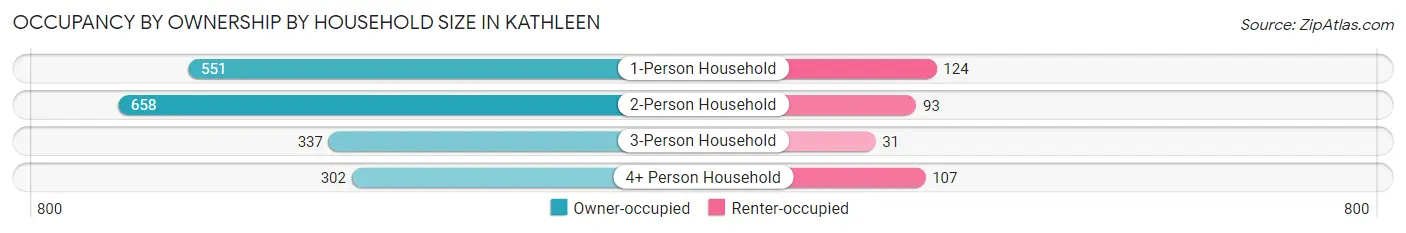
| Household Size | Owner-occupied | Renter-occupied |
| 1-Person Household | 551 (81.6%) | 124 (18.4%) |
| 2-Person Household | 658 (87.6%) | 93 (12.4%) |
| 3-Person Household | 337 (91.6%) | 31 (8.4%) |
| 4+ Person Household | 302 (73.8%) | 107 (26.2%) |
| Total Housing Units | 1,848 (83.9%) | 355 (16.1%) |
Occupancy by Educational Attainment in Kathleen
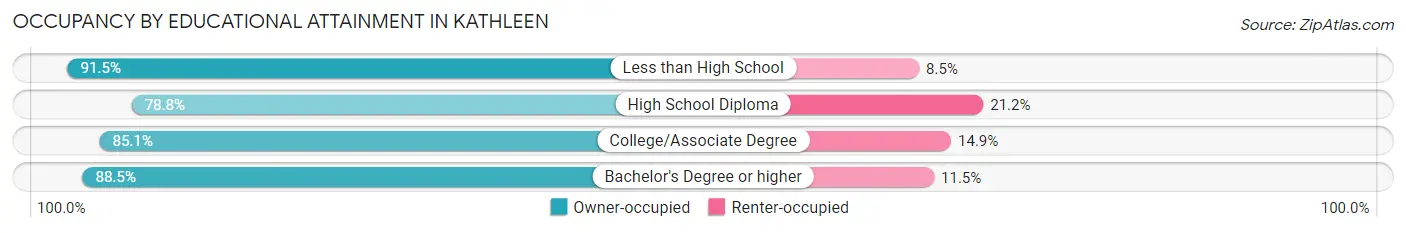
| Household Size | Owner-occupied | Renter-occupied |
| Less than High School | 440 (91.5%) | 41 (8.5%) |
| High School Diploma | 790 (78.8%) | 213 (21.2%) |
| College/Associate Degree | 464 (85.1%) | 81 (14.9%) |
| Bachelor's Degree or higher | 154 (88.5%) | 20 (11.5%) |
Occupancy by Age of Householder in Kathleen
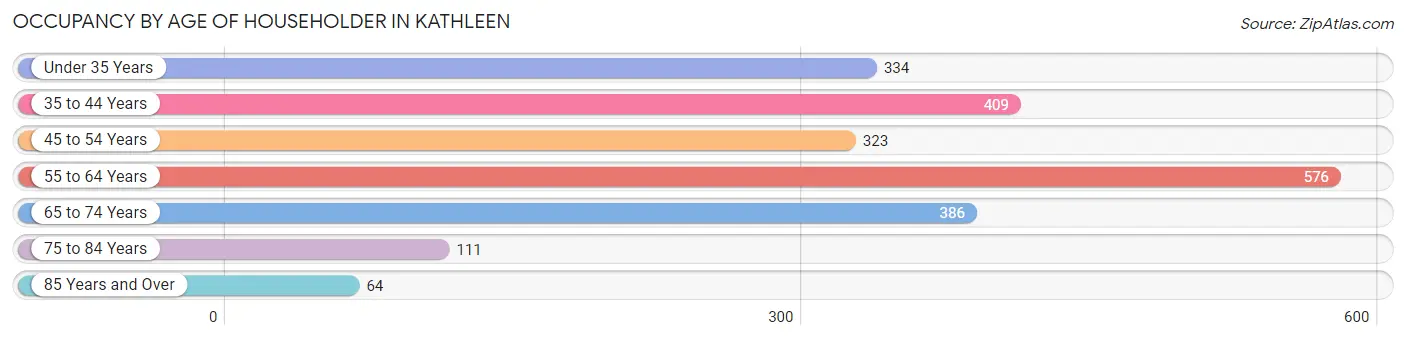
| Age Bracket | # Households | % Households |
| Under 35 Years | 334 | 15.2% |
| 35 to 44 Years | 409 | 18.6% |
| 45 to 54 Years | 323 | 14.7% |
| 55 to 64 Years | 576 | 26.2% |
| 65 to 74 Years | 386 | 17.5% |
| 75 to 84 Years | 111 | 5.0% |
| 85 Years and Over | 64 | 2.9% |
| Total | 2,203 | 100.0% |
Housing Finances in Kathleen
Median Income by Occupancy in Kathleen
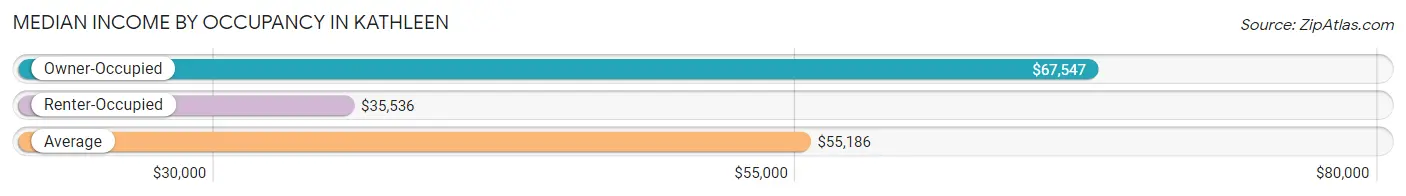
| Occupancy Type | # Households | Median Income |
| Owner-Occupied | 1,848 (83.9%) | $67,547 |
| Renter-Occupied | 355 (16.1%) | $35,536 |
| Average | 2,203 (100.0%) | $55,186 |
Occupancy by Householder Income Bracket in Kathleen
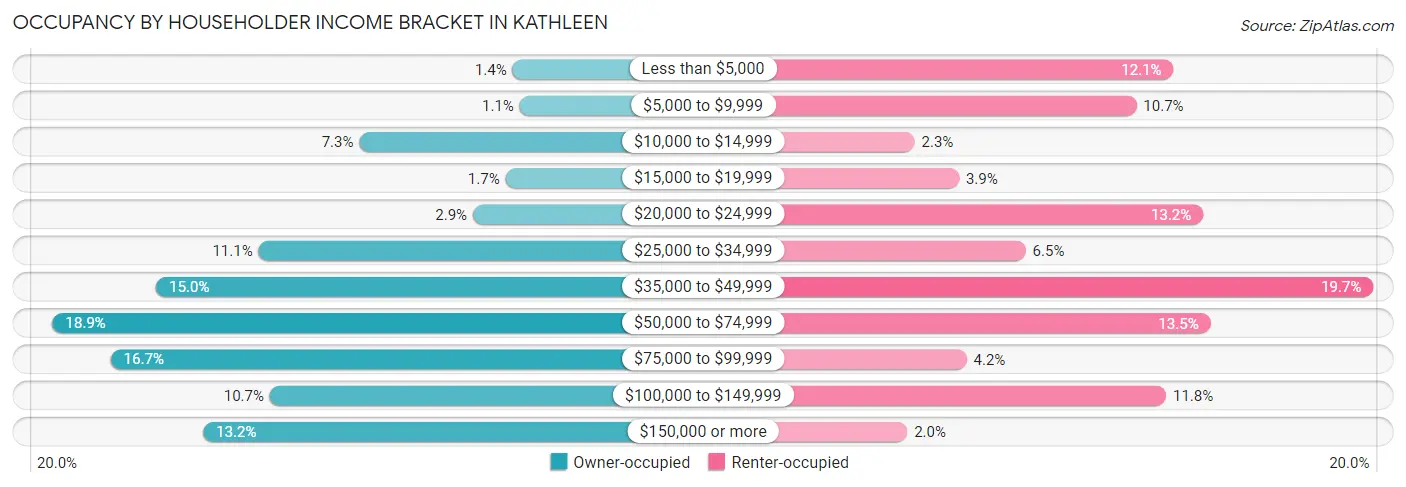
| Income Bracket | Owner-occupied | Renter-occupied |
| Less than $5,000 | 26 (1.4%) | 43 (12.1%) |
| $5,000 to $9,999 | 21 (1.1%) | 38 (10.7%) |
| $10,000 to $14,999 | 134 (7.2%) | 8 (2.2%) |
| $15,000 to $19,999 | 31 (1.7%) | 14 (3.9%) |
| $20,000 to $24,999 | 54 (2.9%) | 47 (13.2%) |
| $25,000 to $34,999 | 205 (11.1%) | 23 (6.5%) |
| $35,000 to $49,999 | 277 (15.0%) | 70 (19.7%) |
| $50,000 to $74,999 | 350 (18.9%) | 48 (13.5%) |
| $75,000 to $99,999 | 309 (16.7%) | 15 (4.2%) |
| $100,000 to $149,999 | 197 (10.7%) | 42 (11.8%) |
| $150,000 or more | 244 (13.2%) | 7 (2.0%) |
| Total | 1,848 (100.0%) | 355 (100.0%) |
Monthly Housing Cost Tiers in Kathleen
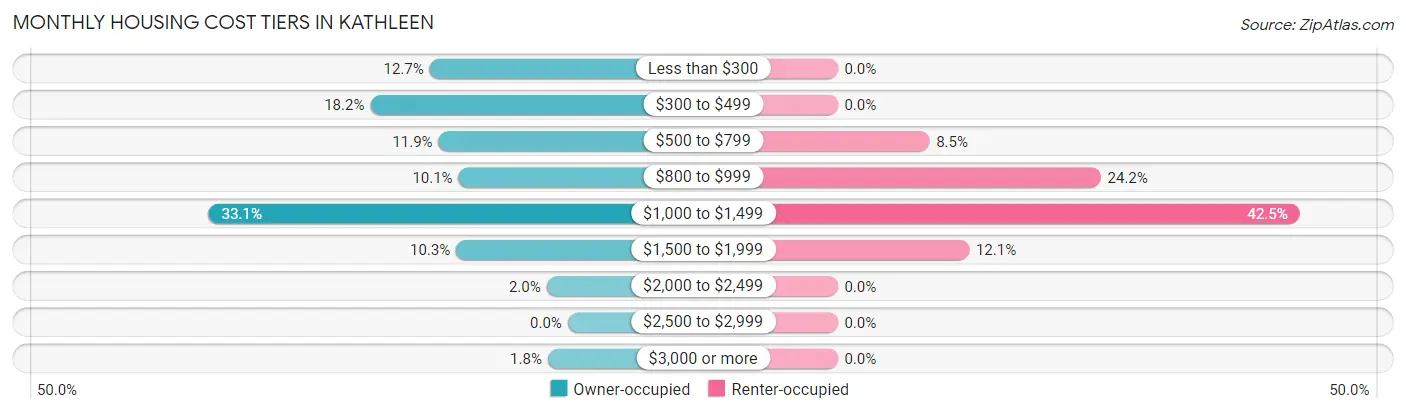
| Monthly Cost | Owner-occupied | Renter-occupied |
| Less than $300 | 235 (12.7%) | 0 (0.0%) |
| $300 to $499 | 336 (18.2%) | 0 (0.0%) |
| $500 to $799 | 220 (11.9%) | 30 (8.5%) |
| $800 to $999 | 186 (10.1%) | 86 (24.2%) |
| $1,000 to $1,499 | 611 (33.1%) | 151 (42.5%) |
| $1,500 to $1,999 | 190 (10.3%) | 43 (12.1%) |
| $2,000 to $2,499 | 36 (1.9%) | 0 (0.0%) |
| $2,500 to $2,999 | 0 (0.0%) | 0 (0.0%) |
| $3,000 or more | 34 (1.8%) | 0 (0.0%) |
| Total | 1,848 (100.0%) | 355 (100.0%) |
Physical Housing Characteristics in Kathleen
Housing Structures in Kathleen
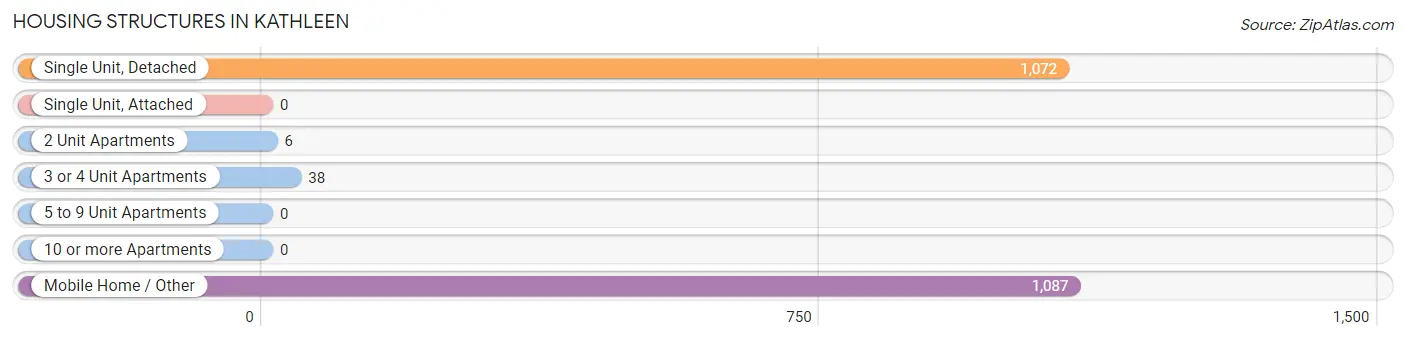
| Structure Type | # Housing Units | % Housing Units |
| Single Unit, Detached | 1,072 | 48.7% |
| Single Unit, Attached | 0 | 0.0% |
| 2 Unit Apartments | 6 | 0.3% |
| 3 or 4 Unit Apartments | 38 | 1.7% |
| 5 to 9 Unit Apartments | 0 | 0.0% |
| 10 or more Apartments | 0 | 0.0% |
| Mobile Home / Other | 1,087 | 49.3% |
| Total | 2,203 | 100.0% |
Housing Structures by Occupancy in Kathleen
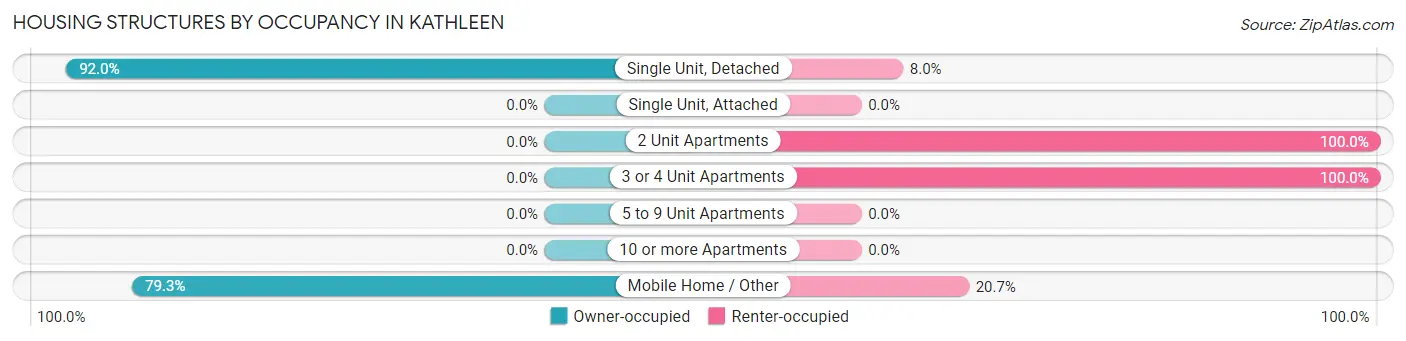
| Structure Type | Owner-occupied | Renter-occupied |
| Single Unit, Detached | 986 (92.0%) | 86 (8.0%) |
| Single Unit, Attached | 0 (0.0%) | 0 (0.0%) |
| 2 Unit Apartments | 0 (0.0%) | 6 (100.0%) |
| 3 or 4 Unit Apartments | 0 (0.0%) | 38 (100.0%) |
| 5 to 9 Unit Apartments | 0 (0.0%) | 0 (0.0%) |
| 10 or more Apartments | 0 (0.0%) | 0 (0.0%) |
| Mobile Home / Other | 862 (79.3%) | 225 (20.7%) |
| Total | 1,848 (83.9%) | 355 (16.1%) |
Housing Structures by Number of Rooms in Kathleen
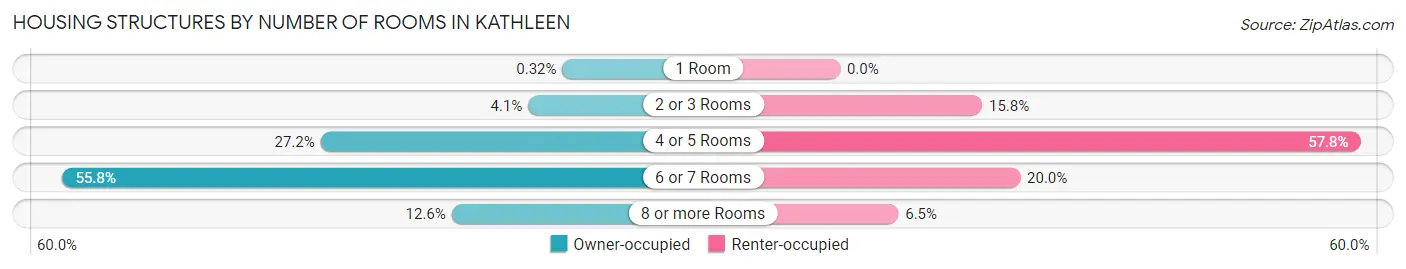
| Number of Rooms | Owner-occupied | Renter-occupied |
| 1 Room | 6 (0.3%) | 0 (0.0%) |
| 2 or 3 Rooms | 76 (4.1%) | 56 (15.8%) |
| 4 or 5 Rooms | 502 (27.2%) | 205 (57.8%) |
| 6 or 7 Rooms | 1,031 (55.8%) | 71 (20.0%) |
| 8 or more Rooms | 233 (12.6%) | 23 (6.5%) |
| Total | 1,848 (100.0%) | 355 (100.0%) |
Housing Structure by Heating Type in Kathleen
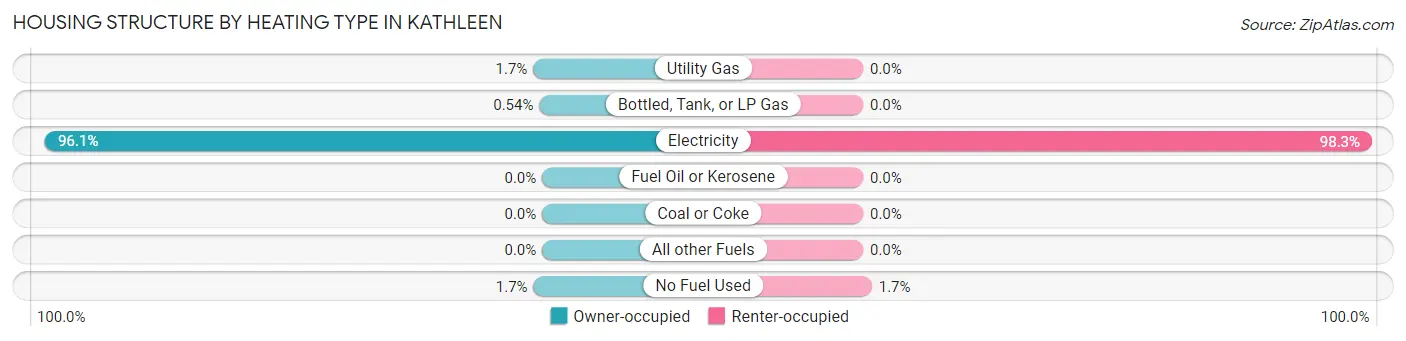
| Heating Type | Owner-occupied | Renter-occupied |
| Utility Gas | 32 (1.7%) | 0 (0.0%) |
| Bottled, Tank, or LP Gas | 10 (0.5%) | 0 (0.0%) |
| Electricity | 1,775 (96.1%) | 349 (98.3%) |
| Fuel Oil or Kerosene | 0 (0.0%) | 0 (0.0%) |
| Coal or Coke | 0 (0.0%) | 0 (0.0%) |
| All other Fuels | 0 (0.0%) | 0 (0.0%) |
| No Fuel Used | 31 (1.7%) | 6 (1.7%) |
| Total | 1,848 (100.0%) | 355 (100.0%) |
Household Vehicle Usage in Kathleen
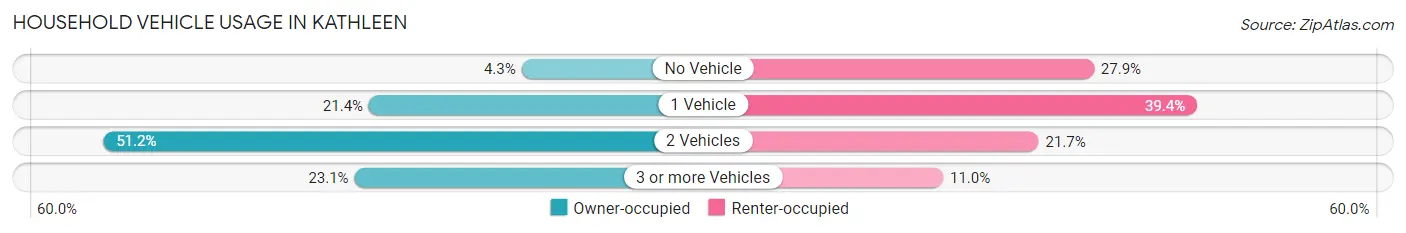
| Vehicles per Household | Owner-occupied | Renter-occupied |
| No Vehicle | 80 (4.3%) | 99 (27.9%) |
| 1 Vehicle | 396 (21.4%) | 140 (39.4%) |
| 2 Vehicles | 946 (51.2%) | 77 (21.7%) |
| 3 or more Vehicles | 426 (23.1%) | 39 (11.0%) |
| Total | 1,848 (100.0%) | 355 (100.0%) |
Real Estate & Mortgages in Kathleen
Real Estate and Mortgage Overview in Kathleen
| Characteristic | Without Mortgage | With Mortgage |
| Housing Units | 730 | 1,118 |
| Median Property Value | $102,400 | $169,700 |
| Median Household Income | $47,083 | $131 |
| Monthly Housing Costs | $357 | $34 |
| Real Estate Taxes | $843 | $54 |
Property Value by Mortgage Status in Kathleen

| Property Value | Without Mortgage | With Mortgage |
| Less than $50,000 | 132 (18.1%) | 51 (4.6%) |
| $50,000 to $99,999 | 226 (31.0%) | 128 (11.5%) |
| $100,000 to $299,999 | 306 (41.9%) | 797 (71.3%) |
| $300,000 to $499,999 | 22 (3.0%) | 106 (9.5%) |
| $500,000 to $749,999 | 27 (3.7%) | 23 (2.1%) |
| $750,000 to $999,999 | 17 (2.3%) | 0 (0.0%) |
| $1,000,000 or more | 0 (0.0%) | 13 (1.2%) |
| Total | 730 (100.0%) | 1,118 (100.0%) |
Household Income by Mortgage Status in Kathleen
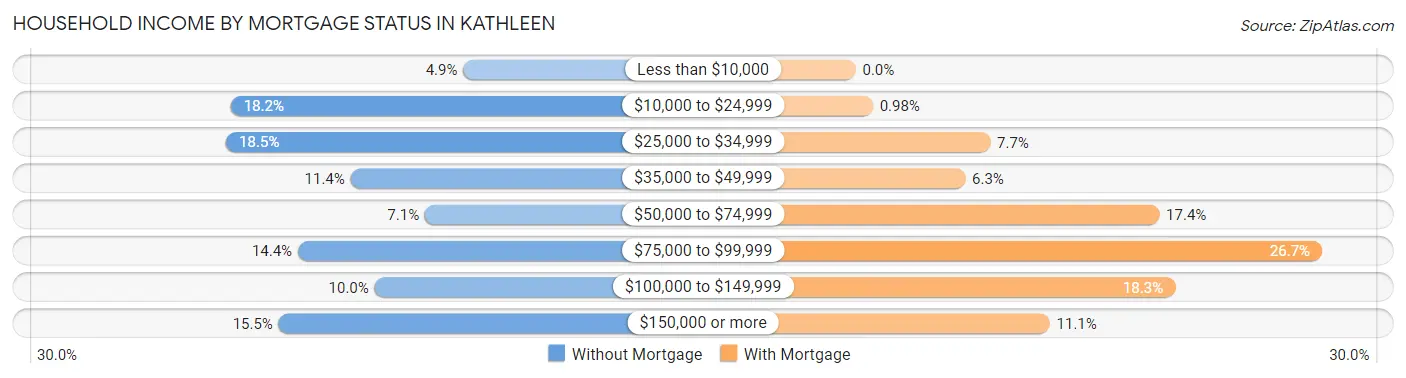
| Household Income | Without Mortgage | With Mortgage |
| Less than $10,000 | 36 (4.9%) | 0 (0.0%) |
| $10,000 to $24,999 | 133 (18.2%) | 11 (1.0%) |
| $25,000 to $34,999 | 135 (18.5%) | 86 (7.7%) |
| $35,000 to $49,999 | 83 (11.4%) | 70 (6.3%) |
| $50,000 to $74,999 | 52 (7.1%) | 194 (17.3%) |
| $75,000 to $99,999 | 105 (14.4%) | 298 (26.7%) |
| $100,000 to $149,999 | 73 (10.0%) | 204 (18.2%) |
| $150,000 or more | 113 (15.5%) | 124 (11.1%) |
| Total | 730 (100.0%) | 1,118 (100.0%) |
Property Value to Household Income Ratio in Kathleen
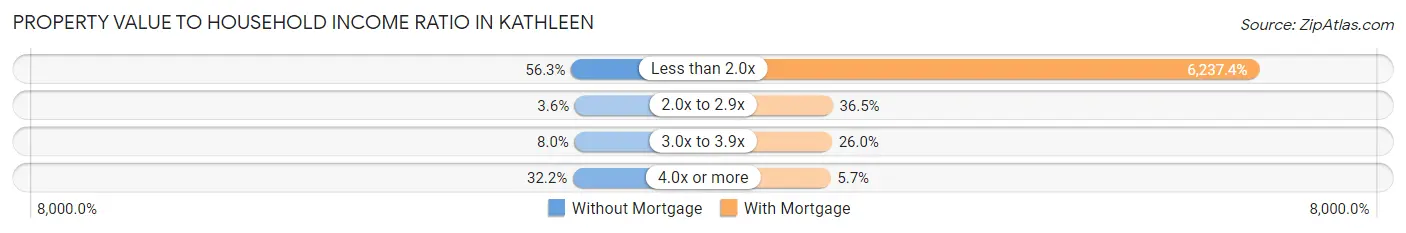
| Value-to-Income Ratio | Without Mortgage | With Mortgage |
| Less than 2.0x | 411 (56.3%) | 69,734 (6,237.4%) |
| 2.0x to 2.9x | 26 (3.6%) | 408 (36.5%) |
| 3.0x to 3.9x | 58 (8.0%) | 291 (26.0%) |
| 4.0x or more | 235 (32.2%) | 64 (5.7%) |
| Total | 730 (100.0%) | 1,118 (100.0%) |
Real Estate Taxes by Mortgage Status in Kathleen
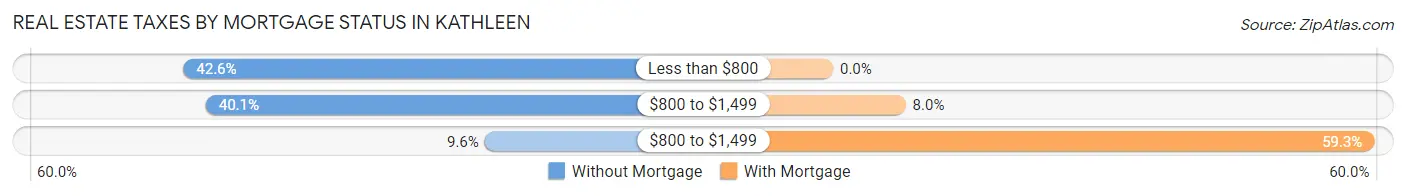
| Property Taxes | Without Mortgage | With Mortgage |
| Less than $800 | 311 (42.6%) | 0 (0.0%) |
| $800 to $1,499 | 293 (40.1%) | 89 (8.0%) |
| $800 to $1,499 | 70 (9.6%) | 663 (59.3%) |
| Total | 730 (100.0%) | 1,118 (100.0%) |
Health & Disability in Kathleen
Health Insurance Coverage by Age in Kathleen
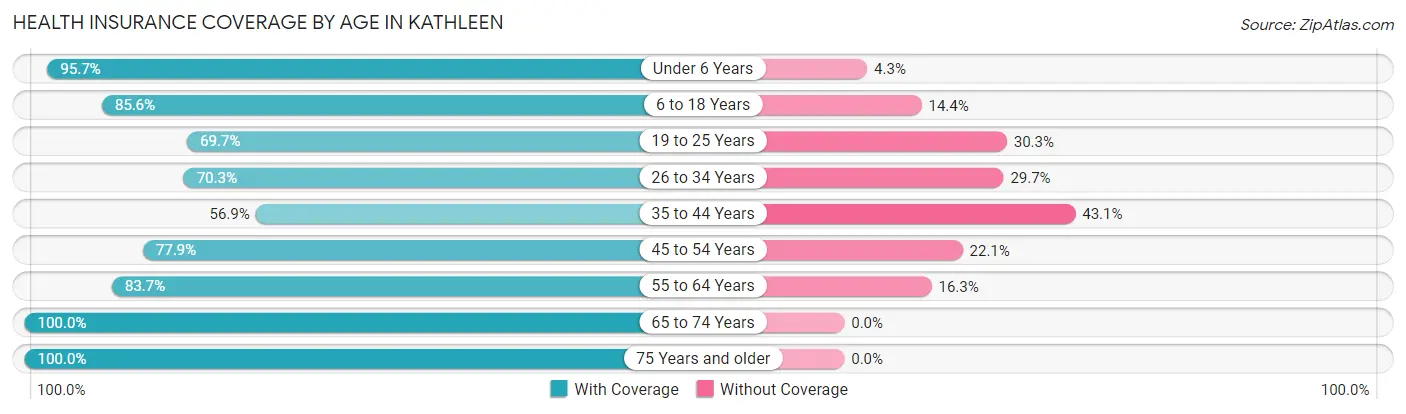
| Age Bracket | With Coverage | Without Coverage |
| Under 6 Years | 472 (95.7%) | 21 (4.3%) |
| 6 to 18 Years | 576 (85.6%) | 97 (14.4%) |
| 19 to 25 Years | 421 (69.7%) | 183 (30.3%) |
| 26 to 34 Years | 443 (70.3%) | 187 (29.7%) |
| 35 to 44 Years | 493 (56.9%) | 373 (43.1%) |
| 45 to 54 Years | 438 (77.9%) | 124 (22.1%) |
| 55 to 64 Years | 839 (83.7%) | 163 (16.3%) |
| 65 to 74 Years | 724 (100.0%) | 0 (0.0%) |
| 75 Years and older | 289 (100.0%) | 0 (0.0%) |
| Total | 4,695 (80.3%) | 1,148 (19.7%) |
Health Insurance Coverage by Citizenship Status in Kathleen
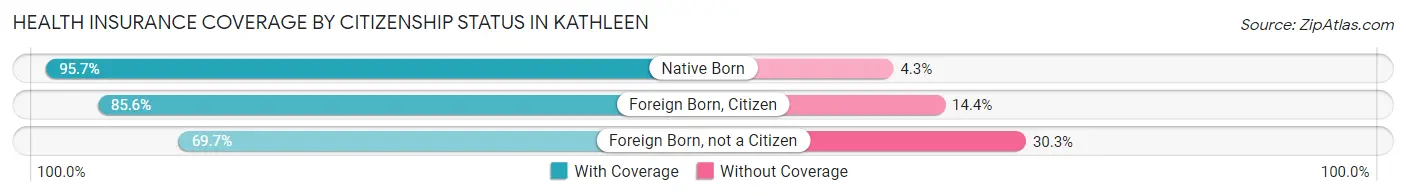
| Citizenship Status | With Coverage | Without Coverage |
| Native Born | 472 (95.7%) | 21 (4.3%) |
| Foreign Born, Citizen | 576 (85.6%) | 97 (14.4%) |
| Foreign Born, not a Citizen | 421 (69.7%) | 183 (30.3%) |
Health Insurance Coverage by Household Income in Kathleen
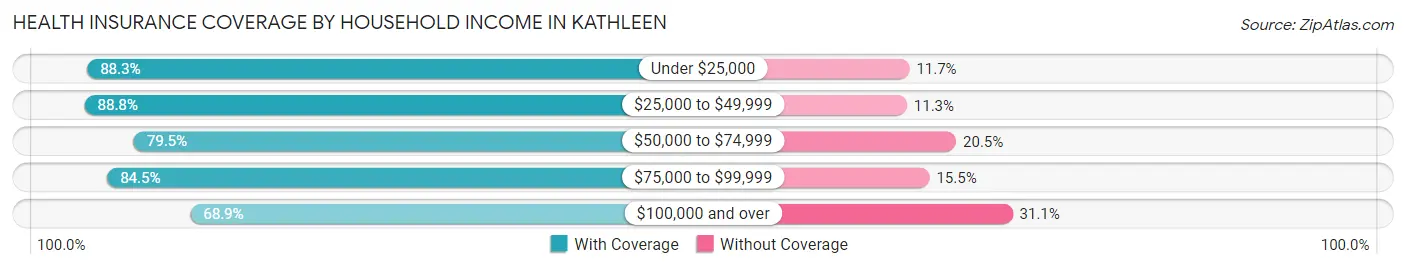
| Household Income | With Coverage | Without Coverage |
| Under $25,000 | 812 (88.3%) | 108 (11.7%) |
| $25,000 to $49,999 | 1,057 (88.7%) | 134 (11.3%) |
| $50,000 to $74,999 | 761 (79.5%) | 196 (20.5%) |
| $75,000 to $99,999 | 824 (84.5%) | 151 (15.5%) |
| $100,000 and over | 1,241 (68.9%) | 559 (31.1%) |
Public vs Private Health Insurance Coverage by Age in Kathleen
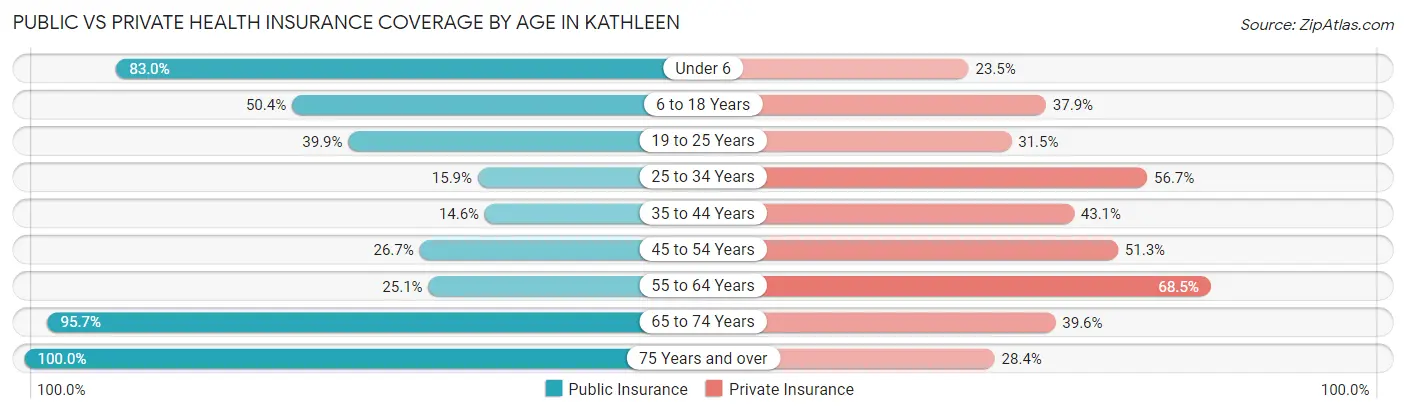
| Age Bracket | Public Insurance | Private Insurance |
| Under 6 | 409 (83.0%) | 116 (23.5%) |
| 6 to 18 Years | 339 (50.4%) | 255 (37.9%) |
| 19 to 25 Years | 241 (39.9%) | 190 (31.5%) |
| 25 to 34 Years | 100 (15.9%) | 357 (56.7%) |
| 35 to 44 Years | 126 (14.5%) | 373 (43.1%) |
| 45 to 54 Years | 150 (26.7%) | 288 (51.2%) |
| 55 to 64 Years | 251 (25.1%) | 686 (68.5%) |
| 65 to 74 Years | 693 (95.7%) | 287 (39.6%) |
| 75 Years and over | 289 (100.0%) | 82 (28.4%) |
| Total | 2,598 (44.5%) | 2,634 (45.1%) |
Disability Status by Sex by Age in Kathleen
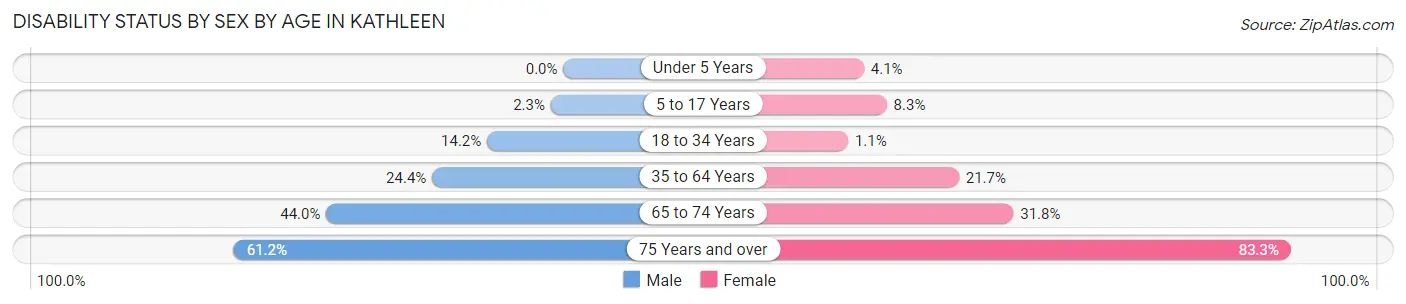
| Age Bracket | Male | Female |
| Under 5 Years | 0 (0.0%) | 9 (4.1%) |
| 5 to 17 Years | 7 (2.3%) | 35 (8.3%) |
| 18 to 34 Years | 91 (14.1%) | 7 (1.1%) |
| 35 to 64 Years | 299 (24.3%) | 261 (21.7%) |
| 65 to 74 Years | 143 (44.0%) | 127 (31.8%) |
| 75 Years and over | 74 (61.2%) | 140 (83.3%) |
Disability Class by Sex by Age in Kathleen
Disability Class: Hearing Difficulty
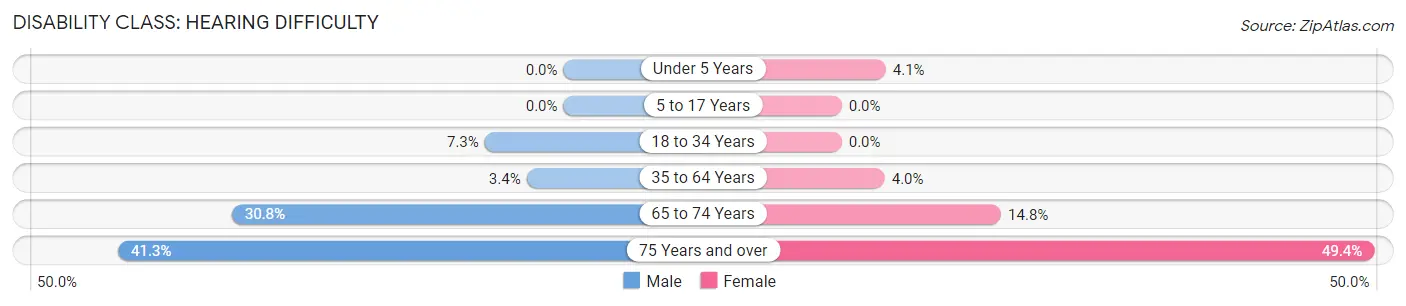
| Age Bracket | Male | Female |
| Under 5 Years | 0 (0.0%) | 9 (4.1%) |
| 5 to 17 Years | 0 (0.0%) | 0 (0.0%) |
| 18 to 34 Years | 47 (7.3%) | 0 (0.0%) |
| 35 to 64 Years | 42 (3.4%) | 48 (4.0%) |
| 65 to 74 Years | 100 (30.8%) | 59 (14.8%) |
| 75 Years and over | 50 (41.3%) | 83 (49.4%) |
Disability Class: Vision Difficulty
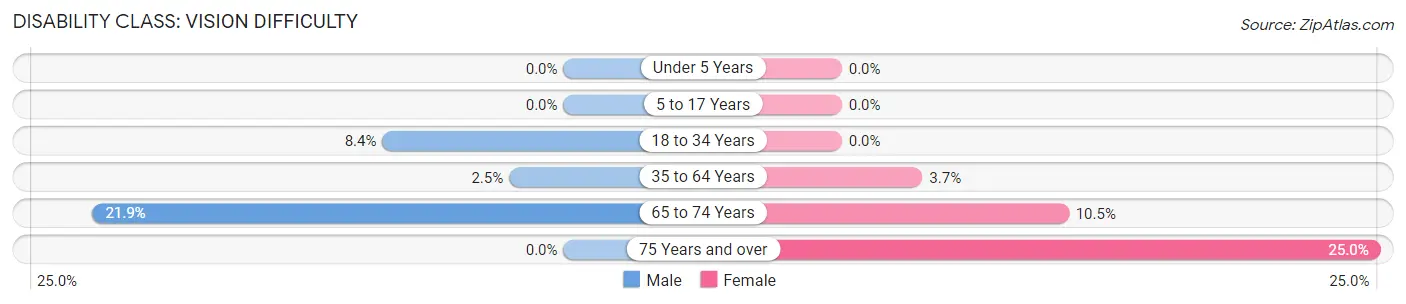
| Age Bracket | Male | Female |
| Under 5 Years | 0 (0.0%) | 0 (0.0%) |
| 5 to 17 Years | 0 (0.0%) | 0 (0.0%) |
| 18 to 34 Years | 54 (8.4%) | 0 (0.0%) |
| 35 to 64 Years | 31 (2.5%) | 45 (3.7%) |
| 65 to 74 Years | 71 (21.8%) | 42 (10.5%) |
| 75 Years and over | 0 (0.0%) | 42 (25.0%) |
Disability Class: Cognitive Difficulty
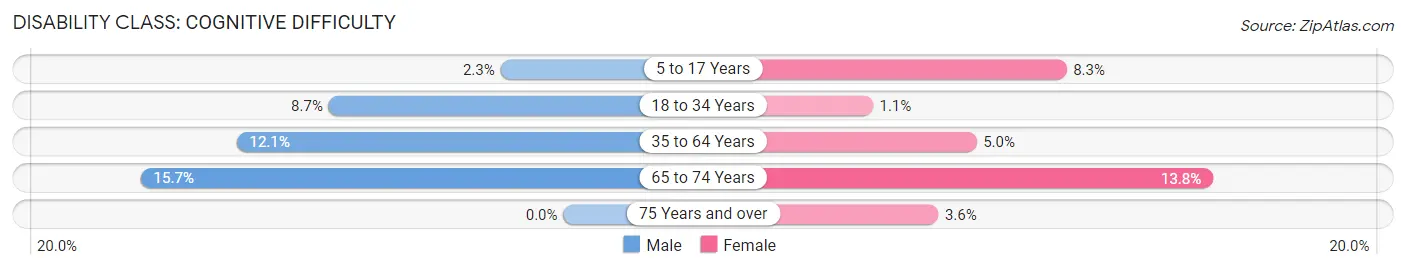
| Age Bracket | Male | Female |
| 5 to 17 Years | 7 (2.3%) | 35 (8.3%) |
| 18 to 34 Years | 56 (8.7%) | 7 (1.1%) |
| 35 to 64 Years | 149 (12.1%) | 60 (5.0%) |
| 65 to 74 Years | 51 (15.7%) | 55 (13.8%) |
| 75 Years and over | 0 (0.0%) | 6 (3.6%) |
Disability Class: Ambulatory Difficulty
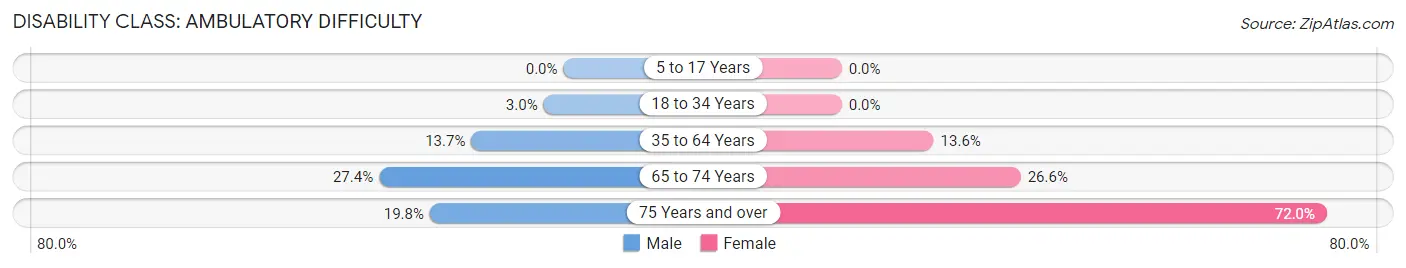
| Age Bracket | Male | Female |
| 5 to 17 Years | 0 (0.0%) | 0 (0.0%) |
| 18 to 34 Years | 19 (2.9%) | 0 (0.0%) |
| 35 to 64 Years | 168 (13.7%) | 164 (13.6%) |
| 65 to 74 Years | 89 (27.4%) | 106 (26.6%) |
| 75 Years and over | 24 (19.8%) | 121 (72.0%) |
Disability Class: Self-Care Difficulty
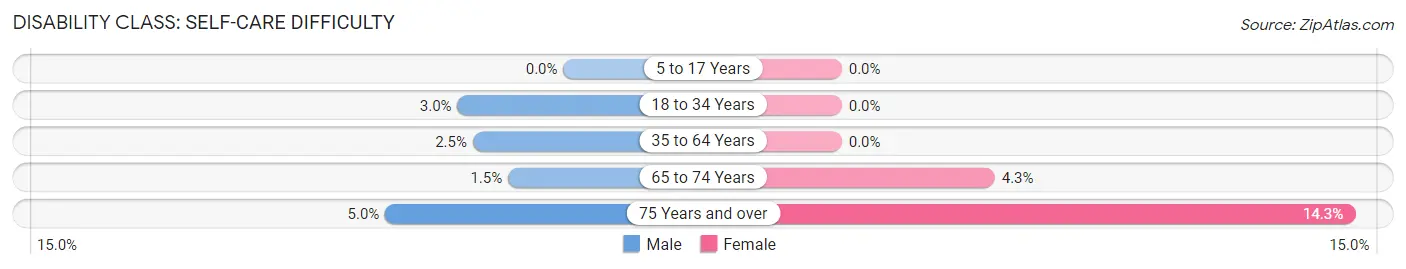
| Age Bracket | Male | Female |
| 5 to 17 Years | 0 (0.0%) | 0 (0.0%) |
| 18 to 34 Years | 19 (2.9%) | 0 (0.0%) |
| 35 to 64 Years | 31 (2.5%) | 0 (0.0%) |
| 65 to 74 Years | 5 (1.5%) | 17 (4.3%) |
| 75 Years and over | 6 (5.0%) | 24 (14.3%) |
Technology Access in Kathleen
Computing Device Access in Kathleen
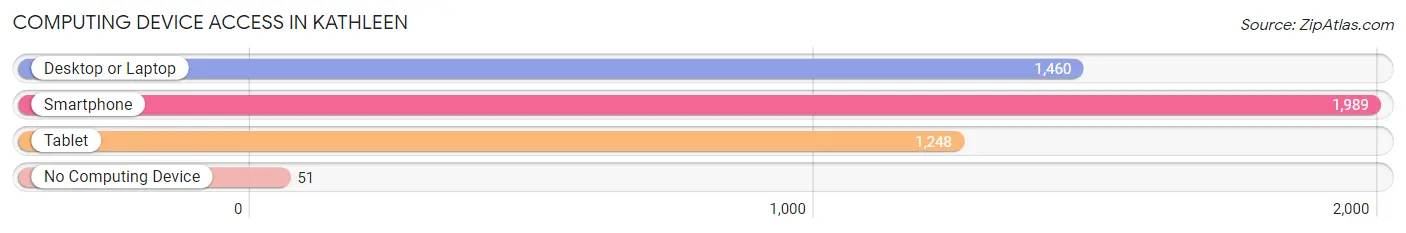
| Device Type | # Households | % Households |
| Desktop or Laptop | 1,460 | 66.3% |
| Smartphone | 1,989 | 90.3% |
| Tablet | 1,248 | 56.7% |
| No Computing Device | 51 | 2.3% |
| Total | 2,203 | 100.0% |
Internet Access in Kathleen
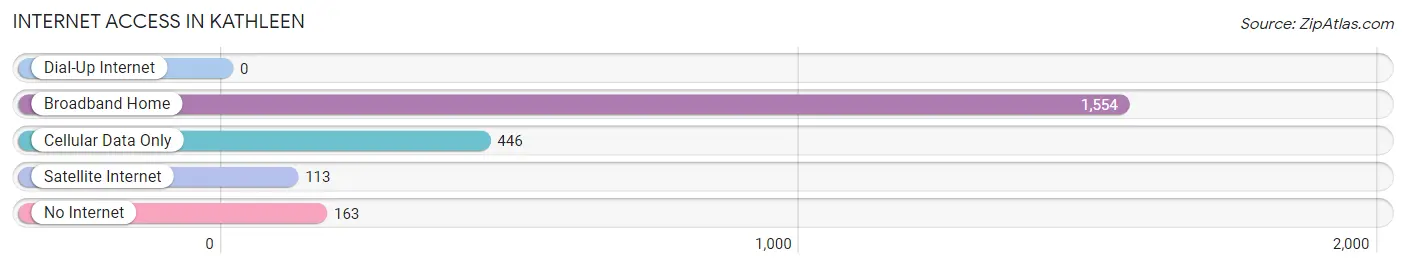
| Internet Type | # Households | % Households |
| Dial-Up Internet | 0 | 0.0% |
| Broadband Home | 1,554 | 70.5% |
| Cellular Data Only | 446 | 20.3% |
| Satellite Internet | 113 | 5.1% |
| No Internet | 163 | 7.4% |
| Total | 2,203 | 100.0% |
Kathleen Summary
Kathleen is a small unincorporated community located in Polk County, Florida. It is situated approximately 10 miles east of Lakeland and is part of the Lakeland-Winter Haven Metropolitan Statistical Area. The population of Kathleen was estimated to be 2,845 in 2019.
History
Kathleen was founded in 1883 by a group of settlers from Kentucky. The town was named after the daughter of one of the settlers, Kathleen McRae. The town was originally a farming community, but it soon developed into a small commercial center. The first post office was established in 1884 and the first school was built in 1885.
In the early 1900s, the town began to grow and the population increased. The first bank was established in 1906 and the first newspaper, the Kathleen News, was published in 1907. The town was incorporated in 1911 and the first mayor was elected in 1912.
Geography
Kathleen is located in central Florida, approximately 10 miles east of Lakeland. It is situated in the northern part of Polk County, near the intersection of State Road 33 and State Road 540. The town is bordered by the cities of Lakeland, Winter Haven, and Auburndale.
The terrain of Kathleen is mostly flat, with some rolling hills. The town is located in a humid subtropical climate zone, with hot, humid summers and mild winters. The average annual temperature is around 73°F (23°C).
Economy
Kathleen’s economy is largely based on agriculture and tourism. The town is home to several farms, which produce a variety of crops, including citrus fruits, vegetables, and hay. The town is also home to several small businesses, including restaurants, retail stores, and service providers.
The town is also a popular tourist destination, with many visitors coming to enjoy the area’s natural beauty and recreational activities. The town is home to several parks, including Lakeland Hills Park and the Kathleen Nature Preserve.
Demographics
As of 2019, the population of Kathleen was estimated to be 2,845. The racial makeup of the town was 79.3% White, 15.2% African American, 0.7% Native American, 0.7% Asian, and 3.9% from other races. The median household income was $41,945, and the median age was 37.7 years.
Kathleen is a small, close-knit community with a rich history and a vibrant economy. The town is home to a diverse population and offers a variety of recreational activities and attractions. With its friendly atmosphere and beautiful natural surroundings, Kathleen is a great place to live and visit.
Common Questions
What is Per Capita Income in Kathleen?
Per Capita income in Kathleen is $27,808.
What is the Median Family Income in Kathleen?
Median Family Income in Kathleen is $79,121.
What is the Median Household income in Kathleen?
Median Household Income in Kathleen is $55,186.
What is Income or Wage Gap in Kathleen?
Income or Wage Gap in Kathleen is 29.6%.
Women in Kathleen earn 70.4 cents for every dollar earned by a man.
What is Inequality or Gini Index in Kathleen?
Inequality or Gini Index in Kathleen is 0.41.
What is the Total Population of Kathleen?
Total Population of Kathleen is 5,843.
What is the Total Male Population of Kathleen?
Total Male Population of Kathleen is 2,818.
What is the Total Female Population of Kathleen?
Total Female Population of Kathleen is 3,025.
What is the Ratio of Males per 100 Females in Kathleen?
There are 93.16 Males per 100 Females in Kathleen.
What is the Ratio of Females per 100 Males in Kathleen?
There are 107.35 Females per 100 Males in Kathleen.
What is the Median Population Age in Kathleen?
Median Population Age in Kathleen is 42.3 Years.
What is the Average Family Size in Kathleen
Average Family Size in Kathleen is 3.5 People.
What is the Average Household Size in Kathleen
Average Household Size in Kathleen is 2.6 People.
How Large is the Labor Force in Kathleen?
There are 2,864 People in the Labor Forcein in Kathleen.
What is the Percentage of People in the Labor Force in Kathleen?
59.6% of People are in the Labor Force in Kathleen.
What is the Unemployment Rate in Kathleen?
Unemployment Rate in Kathleen is 5.1%.