Jensen Beach, FL Map & Demographics
Jensen Beach Map
Jensen Beach Overview
$46,431
PER CAPITA INCOME
$91,993
AVG FAMILY INCOME
$62,699
AVG HOUSEHOLD INCOME
16.6%
WAGE / INCOME GAP [ % ]
83.4¢/ $1
WAGE / INCOME GAP [ $ ]
$5,151
FAMILY INCOME DEFICIT
0.52
INEQUALITY / GINI INDEX
12,581
TOTAL POPULATION
6,074
MALE POPULATION
6,507
FEMALE POPULATION
93.35
MALES / 100 FEMALES
107.13
FEMALES / 100 MALES
53.7
MEDIAN AGE
3.0
AVG FAMILY SIZE
2.1
AVG HOUSEHOLD SIZE
5,571
LABOR FORCE [ PEOPLE ]
50.6%
PERCENT IN LABOR FORCE
4.8%
UNEMPLOYMENT RATE
Jensen Beach Zip Codes
Jensen Beach Area Codes
Income in Jensen Beach
Income Overview in Jensen Beach
Per Capita Income in Jensen Beach is $46,431, while median incomes of families and households are $91,993 and $62,699 respectively.
| Characteristic | Number | Measure |
| Per Capita Income | 12,581 | $46,431 |
| Median Family Income | 2,882 | $91,993 |
| Mean Family Income | 2,882 | $137,273 |
| Median Household Income | 5,876 | $62,699 |
| Mean Household Income | 5,876 | $95,780 |
| Income Deficit | 2,882 | $5,151 |
| Wage / Income Gap (%) | 12,581 | 16.57% |
| Wage / Income Gap ($) | 12,581 | 83.43¢ per $1 |
| Gini / Inequality Index | 12,581 | 0.52 |
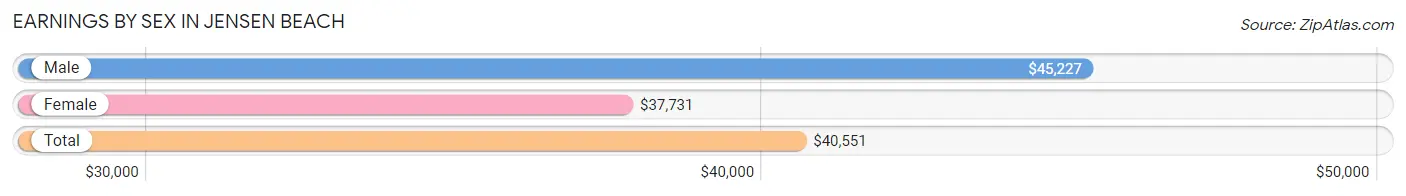
Earnings by Sex in Jensen Beach
Average Earnings in Jensen Beach are $40,551, $45,227 for men and $37,731 for women, a difference of 16.6%.
| Sex | Number | Average Earnings |
| Male | 3,324 (56.4%) | $45,227 |
| Female | 2,573 (43.6%) | $37,731 |
| Total | 5,897 (100.0%) | $40,551 |
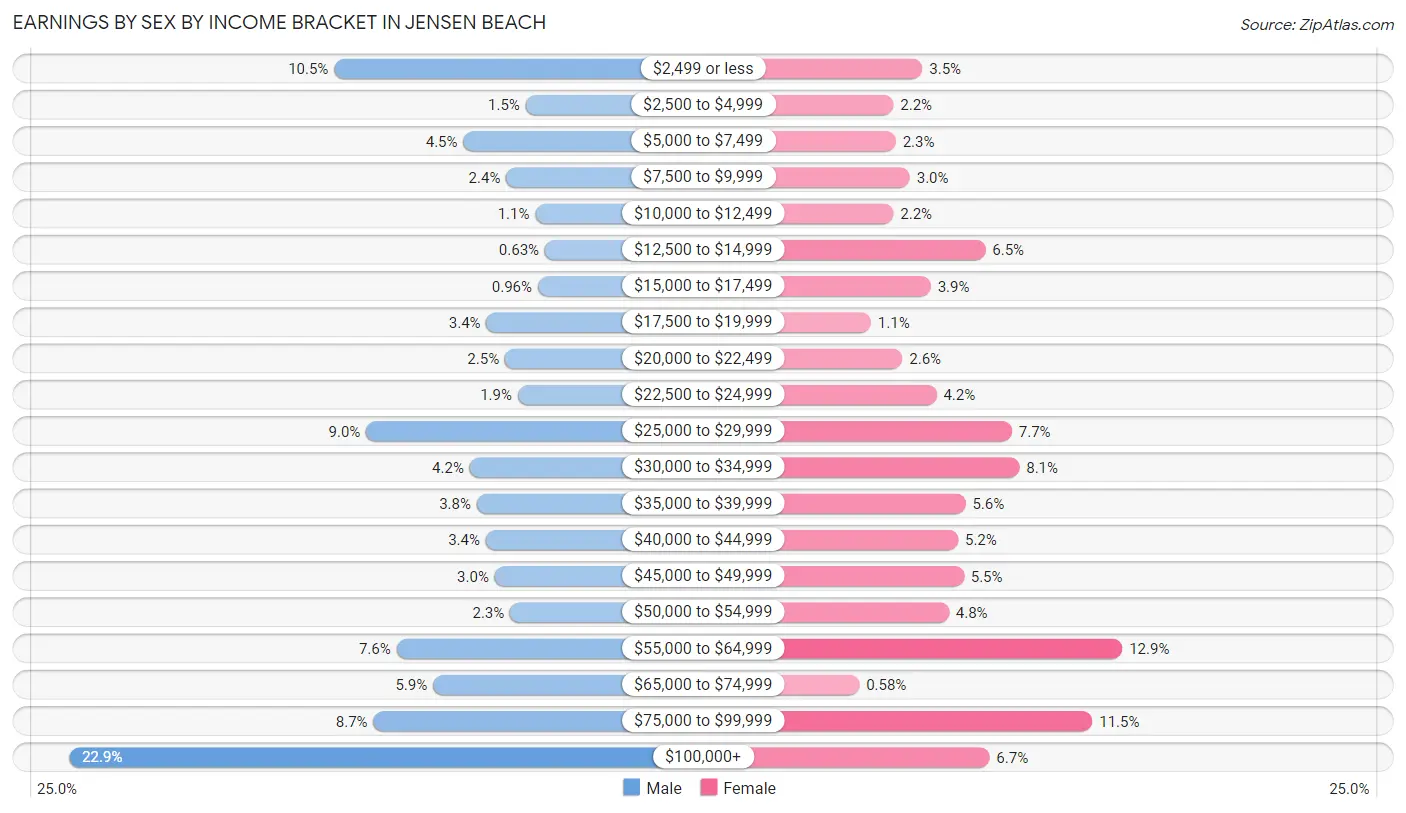
Earnings by Sex by Income Bracket in Jensen Beach
The most common earnings brackets in Jensen Beach are $100,000+ for men (762 | 22.9%) and $55,000 to $64,999 for women (332 | 12.9%).
| Income | Male | Female |
| $2,499 or less | 349 (10.5%) | 91 (3.5%) |
| $2,500 to $4,999 | 51 (1.5%) | 56 (2.2%) |
| $5,000 to $7,499 | 148 (4.4%) | 59 (2.3%) |
| $7,500 to $9,999 | 81 (2.4%) | 76 (2.9%) |
| $10,000 to $12,499 | 36 (1.1%) | 56 (2.2%) |
| $12,500 to $14,999 | 21 (0.6%) | 167 (6.5%) |
| $15,000 to $17,499 | 32 (1.0%) | 101 (3.9%) |
| $17,500 to $19,999 | 112 (3.4%) | 29 (1.1%) |
| $20,000 to $22,499 | 83 (2.5%) | 67 (2.6%) |
| $22,500 to $24,999 | 63 (1.9%) | 108 (4.2%) |
| $25,000 to $29,999 | 299 (9.0%) | 199 (7.7%) |
| $30,000 to $34,999 | 138 (4.2%) | 208 (8.1%) |
| $35,000 to $39,999 | 127 (3.8%) | 143 (5.6%) |
| $40,000 to $44,999 | 113 (3.4%) | 134 (5.2%) |
| $45,000 to $49,999 | 99 (3.0%) | 141 (5.5%) |
| $50,000 to $54,999 | 75 (2.3%) | 123 (4.8%) |
| $55,000 to $64,999 | 252 (7.6%) | 332 (12.9%) |
| $65,000 to $74,999 | 195 (5.9%) | 15 (0.6%) |
| $75,000 to $99,999 | 288 (8.7%) | 296 (11.5%) |
| $100,000+ | 762 (22.9%) | 172 (6.7%) |
| Total | 3,324 (100.0%) | 2,573 (100.0%) |
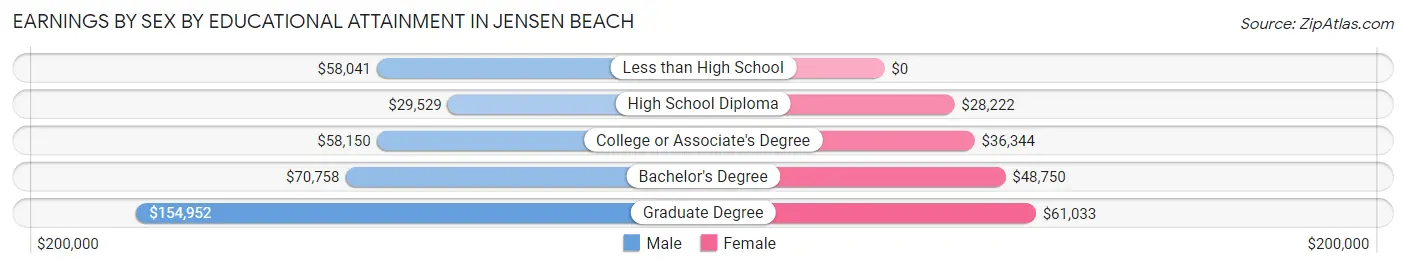
Earnings by Sex by Educational Attainment in Jensen Beach
Average earnings in Jensen Beach are $51,448 for men and $39,846 for women, a difference of 22.6%. Men with an educational attainment of graduate degree enjoy the highest average annual earnings of $154,952, while those with high school diploma education earn the least with $29,529. Women with an educational attainment of graduate degree earn the most with the average annual earnings of $61,033, while those with high school diploma education have the smallest earnings of $28,222.
| Educational Attainment | Male Income | Female Income |
| Less than High School | $58,041 | $0 |
| High School Diploma | $29,529 | $28,222 |
| College or Associate's Degree | $58,150 | $36,344 |
| Bachelor's Degree | $70,758 | $48,750 |
| Graduate Degree | $154,952 | $61,033 |
| Total | $51,448 | $39,846 |
Family Income in Jensen Beach
Family Income Brackets in Jensen Beach
According to the Jensen Beach family income data, there are 602 families falling into the $100,000 to $149,999 income range, which is the most common income bracket and makes up 20.9% of all families. Conversely, the $10,000 to $14,999 income bracket is the least frequent group with only 32 families (1.1%) belonging to this category.
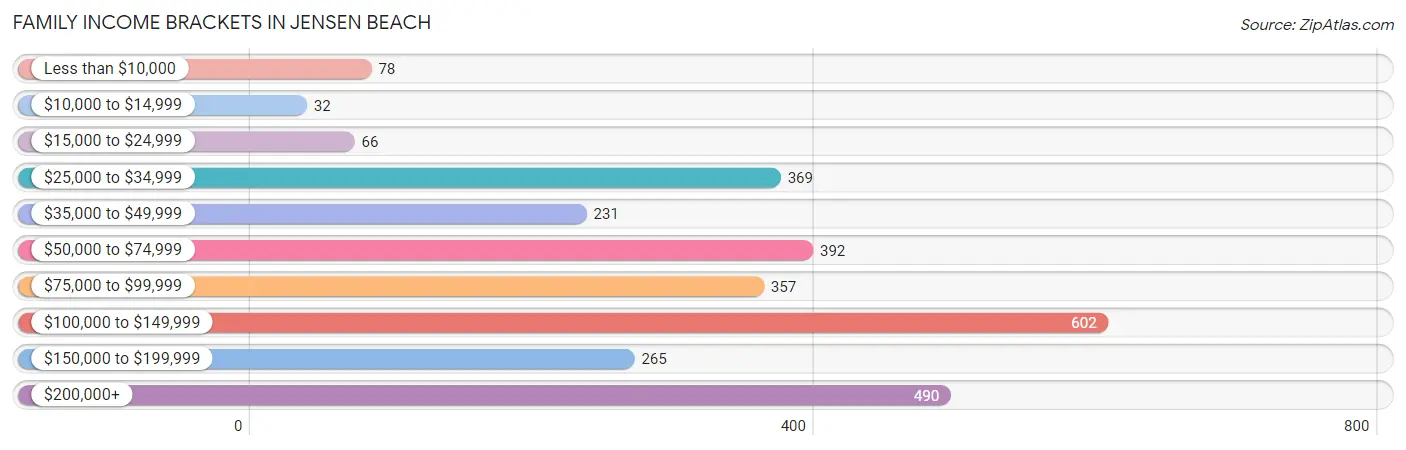
| Income Bracket | # Families | % Families |
| Less than $10,000 | 78 | 2.7% |
| $10,000 to $14,999 | 32 | 1.1% |
| $15,000 to $24,999 | 66 | 2.3% |
| $25,000 to $34,999 | 369 | 12.8% |
| $35,000 to $49,999 | 231 | 8.0% |
| $50,000 to $74,999 | 392 | 13.6% |
| $75,000 to $99,999 | 357 | 12.4% |
| $100,000 to $149,999 | 602 | 20.9% |
| $150,000 to $199,999 | 265 | 9.2% |
| $200,000+ | 490 | 17.0% |
Family Income by Famaliy Size in Jensen Beach
5-person families (133 | 4.6%) account for the highest median family income in Jensen Beach with $151,172 per family, while 2-person families (1,757 | 61.0%) have the highest median income of $45,102 per family member.
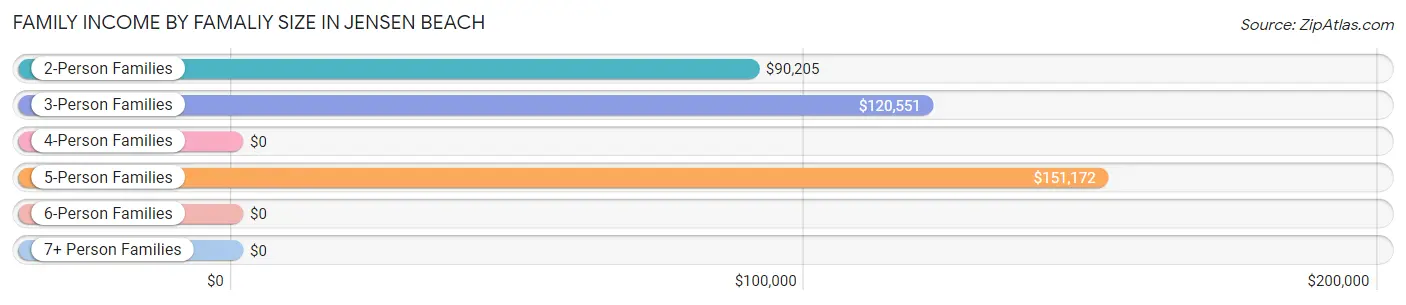
| Income Bracket | # Families | Median Income |
| 2-Person Families | 1,757 (61.0%) | $90,205 |
| 3-Person Families | 563 (19.5%) | $120,551 |
| 4-Person Families | 386 (13.4%) | $0 |
| 5-Person Families | 133 (4.6%) | $151,172 |
| 6-Person Families | 7 (0.2%) | $0 |
| 7+ Person Families | 36 (1.3%) | $0 |
| Total | 2,882 (100.0%) | $91,993 |
Family Income by Number of Earners in Jensen Beach
The median family income in Jensen Beach is $91,993, with families comprising 3+ earners (157) having the highest median family income of $175,050, while families with 1 earner (1,108) have the lowest median family income of $59,118, accounting for 5.4% and 38.5% of families, respectively.
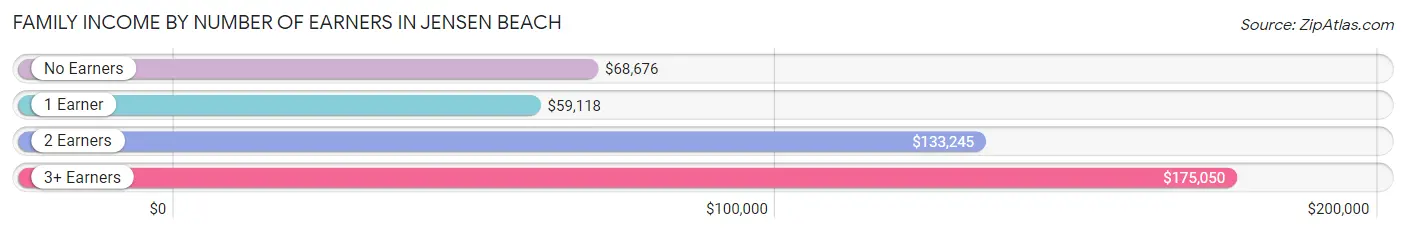
| Number of Earners | # Families | Median Income |
| No Earners | 754 (26.2%) | $68,676 |
| 1 Earner | 1,108 (38.5%) | $59,118 |
| 2 Earners | 863 (29.9%) | $133,245 |
| 3+ Earners | 157 (5.4%) | $175,050 |
| Total | 2,882 (100.0%) | $91,993 |
Household Income in Jensen Beach
Household Income Brackets in Jensen Beach
With 975 households falling in the category, the $100,000 to $149,999 income range is the most frequent in Jensen Beach, accounting for 16.6% of all households. In contrast, only 206 households (3.5%) fall into the $10,000 to $14,999 income bracket, making it the least populous group.
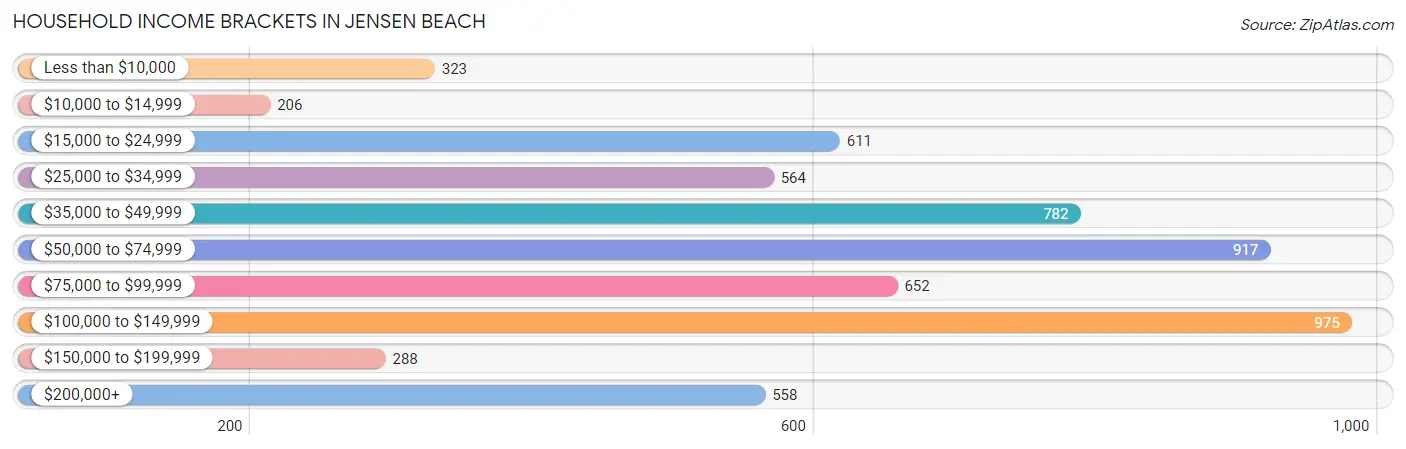
| Income Bracket | # Households | % Households |
| Less than $10,000 | 323 | 5.5% |
| $10,000 to $14,999 | 206 | 3.5% |
| $15,000 to $24,999 | 611 | 10.4% |
| $25,000 to $34,999 | 564 | 9.6% |
| $35,000 to $49,999 | 782 | 13.3% |
| $50,000 to $74,999 | 917 | 15.6% |
| $75,000 to $99,999 | 652 | 11.1% |
| $100,000 to $149,999 | 975 | 16.6% |
| $150,000 to $199,999 | 288 | 4.9% |
| $200,000+ | 558 | 9.5% |
Household Income by Householder Age in Jensen Beach
The median household income in Jensen Beach is $62,699, with the highest median household income of $90,335 found in the 45 to 64 years age bracket for the primary householder. A total of 2,372 households (40.4%) fall into this category. Meanwhile, the 15 to 24 years age bracket for the primary householder has the lowest median household income of $0, with 30 households (0.5%) in this group.
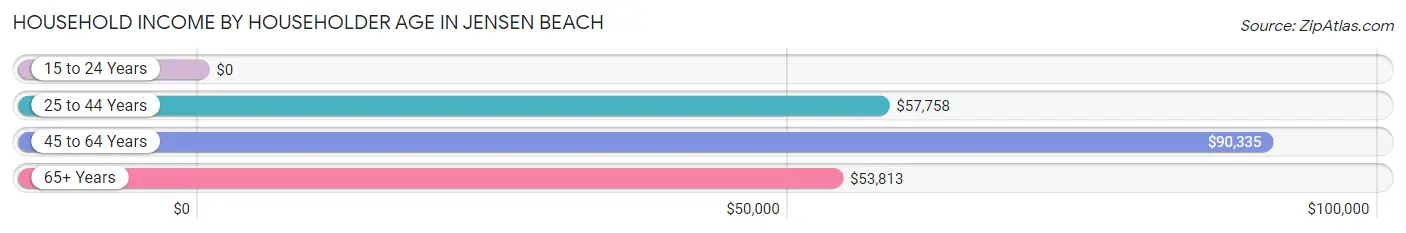
| Income Bracket | # Households | Median Income |
| 15 to 24 Years | 30 (0.5%) | $0 |
| 25 to 44 Years | 1,142 (19.4%) | $57,758 |
| 45 to 64 Years | 2,372 (40.4%) | $90,335 |
| 65+ Years | 2,332 (39.7%) | $53,813 |
| Total | 5,876 (100.0%) | $62,699 |
Poverty in Jensen Beach
Income Below Poverty by Sex and Age in Jensen Beach
With 17.6% poverty level for males and 16.6% for females among the residents of Jensen Beach, 16 and 17 year old males and 35 to 44 year old females are the most vulnerable to poverty, with 231 males (61.8%) and 390 females (54.7%) in their respective age groups living below the poverty level.
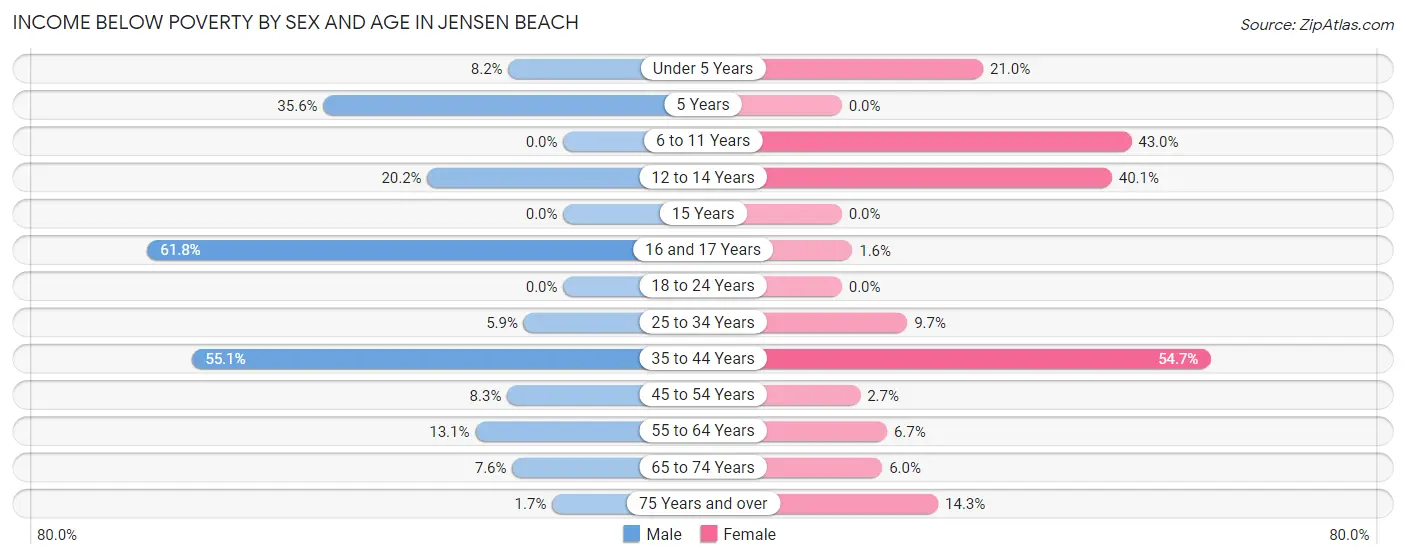
| Age Bracket | Male | Female |
| Under 5 Years | 11 (8.2%) | 39 (21.0%) |
| 5 Years | 31 (35.6%) | 0 (0.0%) |
| 6 to 11 Years | 0 (0.0%) | 184 (43.0%) |
| 12 to 14 Years | 22 (20.2%) | 87 (40.1%) |
| 15 Years | 0 (0.0%) | 0 (0.0%) |
| 16 and 17 Years | 231 (61.8%) | 1 (1.6%) |
| 18 to 24 Years | 0 (0.0%) | 0 (0.0%) |
| 25 to 34 Years | 35 (5.9%) | 60 (9.7%) |
| 35 to 44 Years | 422 (55.1%) | 390 (54.7%) |
| 45 to 54 Years | 57 (8.3%) | 16 (2.7%) |
| 55 to 64 Years | 179 (13.1%) | 73 (6.7%) |
| 65 to 74 Years | 60 (7.6%) | 56 (6.0%) |
| 75 Years and over | 10 (1.7%) | 166 (14.3%) |
| Total | 1,058 (17.6%) | 1,072 (16.6%) |
Income Above Poverty by Sex and Age in Jensen Beach
According to the poverty statistics in Jensen Beach, males aged 6 to 11 years and females aged 5 years are the age groups that are most secure financially, with 100.0% of males and 100.0% of females in these age groups living above the poverty line.
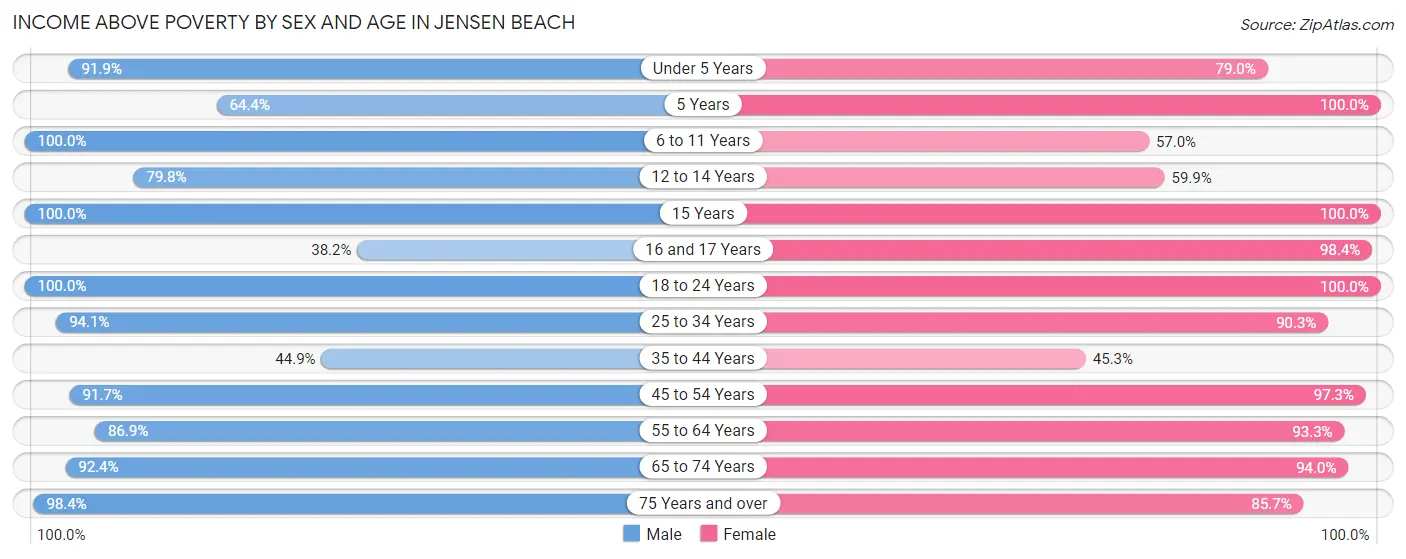
| Age Bracket | Male | Female |
| Under 5 Years | 124 (91.8%) | 147 (79.0%) |
| 5 Years | 56 (64.4%) | 22 (100.0%) |
| 6 to 11 Years | 198 (100.0%) | 244 (57.0%) |
| 12 to 14 Years | 87 (79.8%) | 130 (59.9%) |
| 15 Years | 48 (100.0%) | 102 (100.0%) |
| 16 and 17 Years | 143 (38.2%) | 63 (98.4%) |
| 18 to 24 Years | 244 (100.0%) | 330 (100.0%) |
| 25 to 34 Years | 561 (94.1%) | 557 (90.3%) |
| 35 to 44 Years | 344 (44.9%) | 323 (45.3%) |
| 45 to 54 Years | 627 (91.7%) | 571 (97.3%) |
| 55 to 64 Years | 1,191 (86.9%) | 1,015 (93.3%) |
| 65 to 74 Years | 733 (92.4%) | 878 (94.0%) |
| 75 Years and over | 597 (98.4%) | 995 (85.7%) |
| Total | 4,953 (82.4%) | 5,377 (83.4%) |
Income Below Poverty Among Married-Couple Families in Jensen Beach
The poverty statistics for married-couple families in Jensen Beach show that 12.8% or 286 of the total 2,238 families live below the poverty line. Families with 1 or 2 children have the highest poverty rate of 39.8%, comprising of 197 families. On the other hand, families with 3 or 4 children have the lowest poverty rate of 0.0%, which includes 0 families.
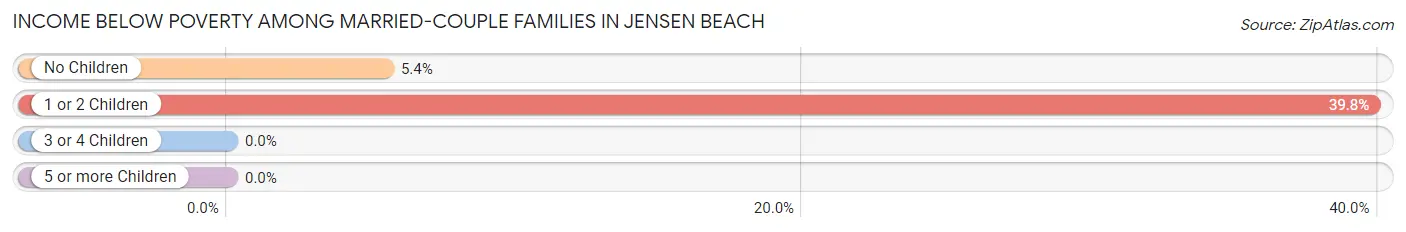
| Children | Above Poverty | Below Poverty |
| No Children | 1,549 (94.6%) | 89 (5.4%) |
| 1 or 2 Children | 298 (60.2%) | 197 (39.8%) |
| 3 or 4 Children | 69 (100.0%) | 0 (0.0%) |
| 5 or more Children | 36 (100.0%) | 0 (0.0%) |
| Total | 1,952 (87.2%) | 286 (12.8%) |
Income Below Poverty Among Single-Parent Households in Jensen Beach
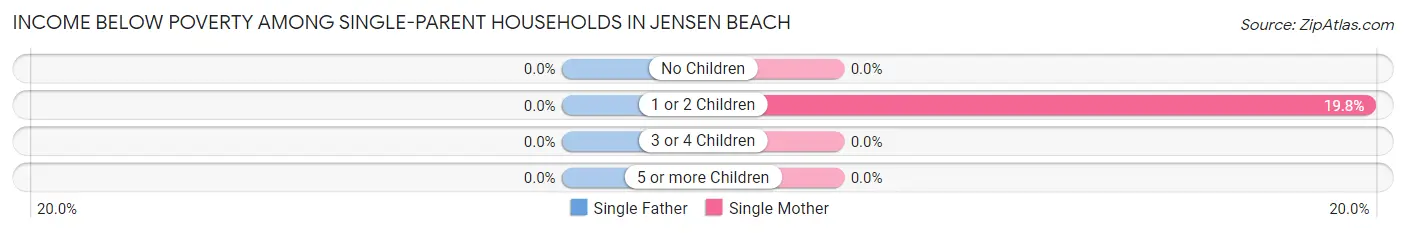
| Children | Single Father | Single Mother |
| No Children | 0 (0.0%) | 0 (0.0%) |
| 1 or 2 Children | 0 (0.0%) | 48 (19.8%) |
| 3 or 4 Children | 0 (0.0%) | 0 (0.0%) |
| 5 or more Children | 0 (0.0%) | 0 (0.0%) |
| Total | 0 (0.0%) | 48 (10.2%) |
Income Below Poverty Among Married-Couple vs Single-Parent Households in Jensen Beach
The poverty data for Jensen Beach shows that 286 of the married-couple family households (12.8%) and 48 of the single-parent households (7.4%) are living below the poverty level. Within the married-couple family households, those with 1 or 2 children have the highest poverty rate, with 197 households (39.8%) falling below the poverty line. Among the single-parent households, those with 1 or 2 children have the highest poverty rate, with 48 household (17.8%) living below poverty.
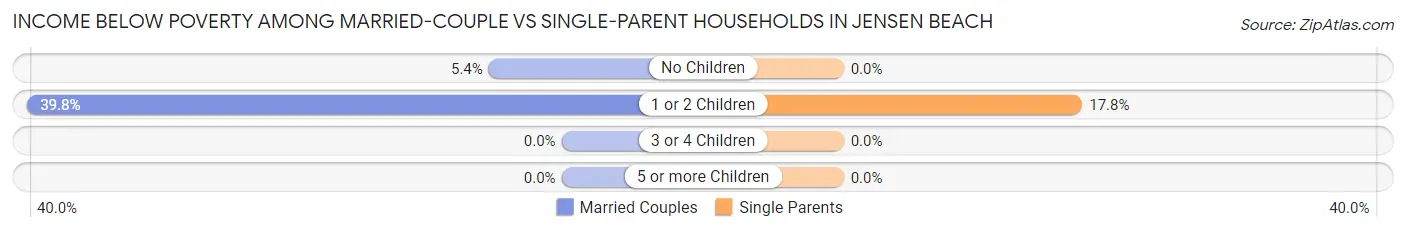
| Children | Married-Couple Families | Single-Parent Households |
| No Children | 89 (5.4%) | 0 (0.0%) |
| 1 or 2 Children | 197 (39.8%) | 48 (17.8%) |
| 3 or 4 Children | 0 (0.0%) | 0 (0.0%) |
| 5 or more Children | 0 (0.0%) | 0 (0.0%) |
| Total | 286 (12.8%) | 48 (7.4%) |
Race in Jensen Beach
The most populous races in Jensen Beach are White / Caucasian (11,752 | 93.4%), Hispanic or Latino (971 | 7.7%), and Two or more Races (348 | 2.8%).
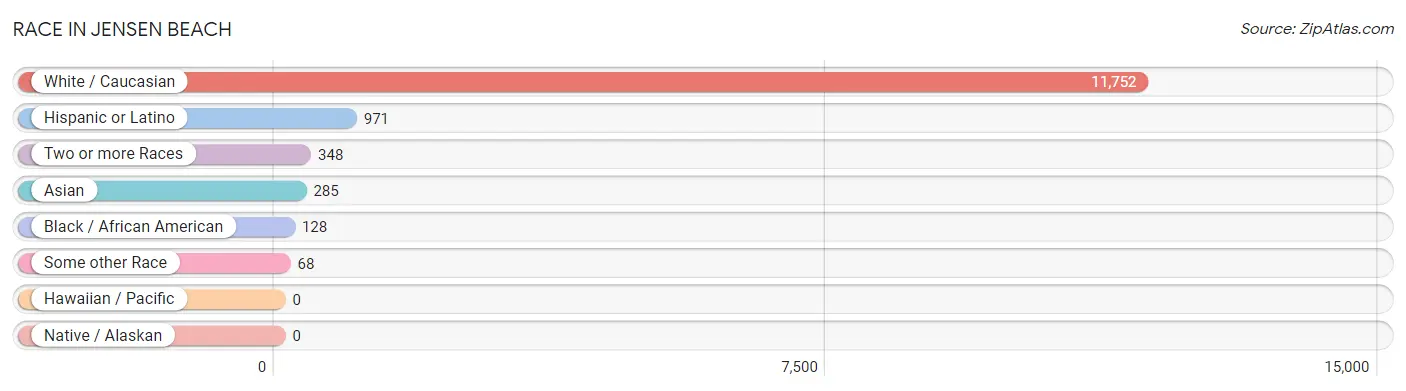
| Race | # Population | % Population |
| Asian | 285 | 2.3% |
| Black / African American | 128 | 1.0% |
| Hawaiian / Pacific | 0 | 0.0% |
| Hispanic or Latino | 971 | 7.7% |
| Native / Alaskan | 0 | 0.0% |
| White / Caucasian | 11,752 | 93.4% |
| Two or more Races | 348 | 2.8% |
| Some other Race | 68 | 0.5% |
| Total | 12,581 | 100.0% |
Ancestry in Jensen Beach
The most populous ancestries reported in Jensen Beach are English (2,375 | 18.9%), German (1,900 | 15.1%), Irish (1,796 | 14.3%), Italian (1,528 | 12.1%), and American (614 | 4.9%), together accounting for 65.3% of all Jensen Beach residents.
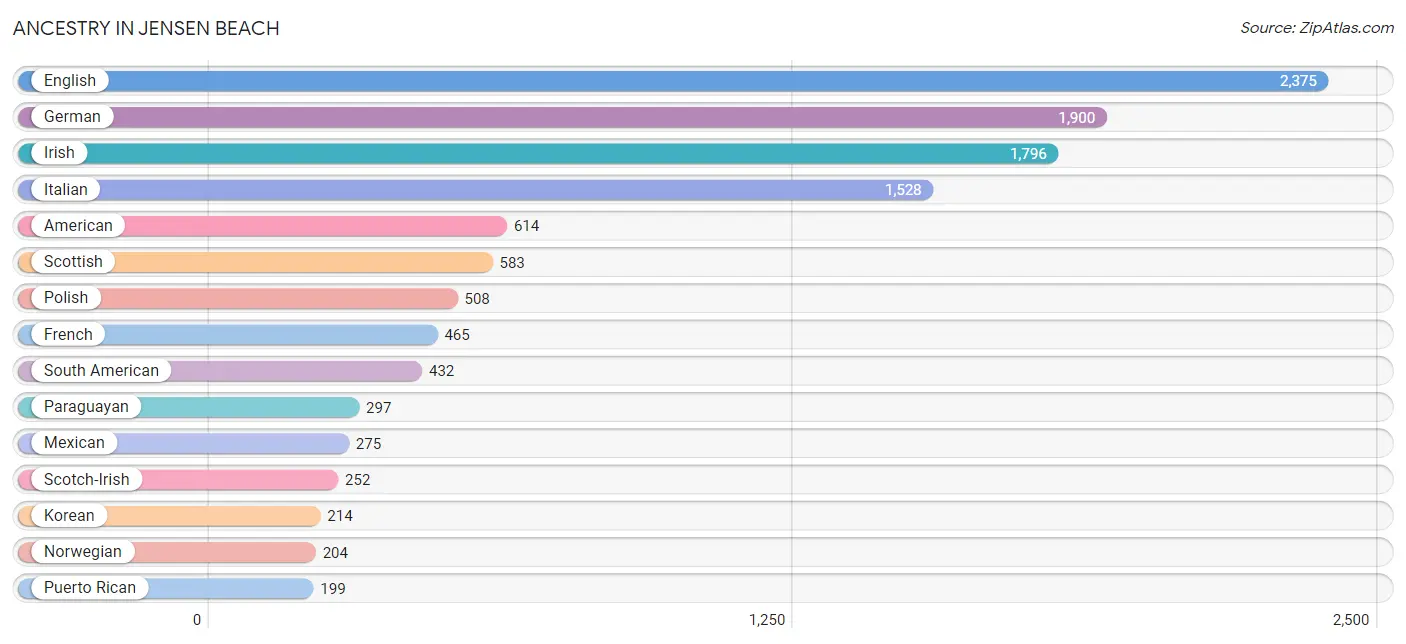
| Ancestry | # Population | % Population |
| American | 614 | 4.9% |
| Arab | 52 | 0.4% |
| Armenian | 23 | 0.2% |
| Austrian | 16 | 0.1% |
| Bhutanese | 10 | 0.1% |
| British | 19 | 0.2% |
| Burmese | 24 | 0.2% |
| Central American | 25 | 0.2% |
| Chilean | 61 | 0.5% |
| Colombian | 30 | 0.2% |
| Cuban | 40 | 0.3% |
| Czech | 30 | 0.2% |
| Czechoslovakian | 30 | 0.2% |
| Danish | 2 | 0.0% |
| Dutch | 61 | 0.5% |
| Eastern European | 18 | 0.1% |
| Ecuadorian | 33 | 0.3% |
| English | 2,375 | 18.9% |
| European | 179 | 1.4% |
| Finnish | 15 | 0.1% |
| French | 465 | 3.7% |
| French Canadian | 44 | 0.4% |
| German | 1,900 | 15.1% |
| Ghanaian | 10 | 0.1% |
| Haitian | 29 | 0.2% |
| Hungarian | 80 | 0.6% |
| Icelander | 24 | 0.2% |
| Indian (Asian) | 99 | 0.8% |
| Irish | 1,796 | 14.3% |
| Iroquois | 11 | 0.1% |
| Italian | 1,528 | 12.1% |
| Korean | 214 | 1.7% |
| Lithuanian | 67 | 0.5% |
| Mexican | 275 | 2.2% |
| Moroccan | 34 | 0.3% |
| Nicaraguan | 3 | 0.0% |
| Northern European | 14 | 0.1% |
| Norwegian | 204 | 1.6% |
| Pakistani | 13 | 0.1% |
| Panamanian | 22 | 0.2% |
| Paraguayan | 297 | 2.4% |
| Pennsylvania German | 54 | 0.4% |
| Peruvian | 11 | 0.1% |
| Polish | 508 | 4.0% |
| Puerto Rican | 199 | 1.6% |
| Russian | 49 | 0.4% |
| Scandinavian | 58 | 0.5% |
| Scotch-Irish | 252 | 2.0% |
| Scottish | 583 | 4.6% |
| Slovak | 63 | 0.5% |
| South African | 42 | 0.3% |
| South American | 432 | 3.4% |
| Subsaharan African | 61 | 0.5% |
| Swedish | 106 | 0.8% |
| Swiss | 7 | 0.1% |
| Trinidadian and Tobagonian | 41 | 0.3% |
| Ukrainian | 130 | 1.0% |
| Welsh | 87 | 0.7% | View All 58 Rows |
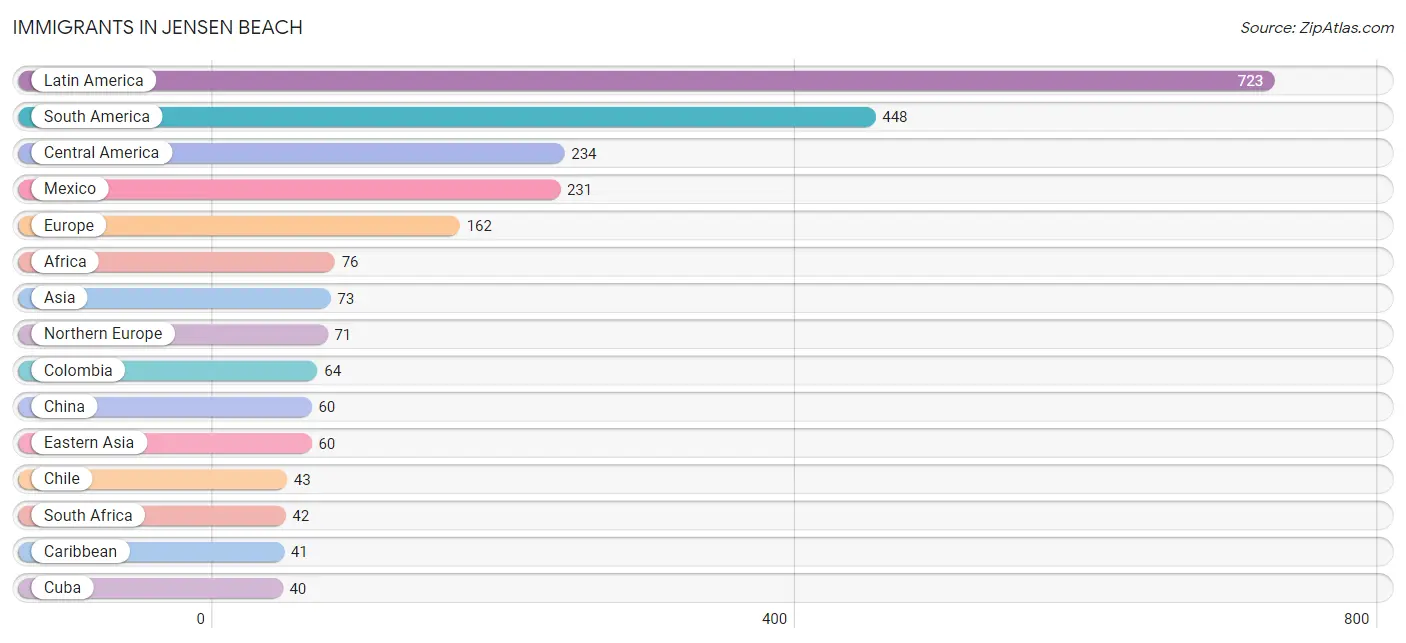
Immigrants in Jensen Beach
The most numerous immigrant groups reported in Jensen Beach came from Latin America (723 | 5.8%), South America (448 | 3.6%), Central America (234 | 1.9%), Mexico (231 | 1.8%), and Europe (162 | 1.3%), together accounting for 14.3% of all Jensen Beach residents.
| Immigration Origin | # Population | % Population |
| Africa | 76 | 0.6% |
| Asia | 73 | 0.6% |
| Canada | 26 | 0.2% |
| Caribbean | 41 | 0.3% |
| Central America | 234 | 1.9% |
| Chile | 43 | 0.3% |
| China | 60 | 0.5% |
| Colombia | 64 | 0.5% |
| Cuba | 40 | 0.3% |
| Eastern Asia | 60 | 0.5% |
| Eastern Europe | 23 | 0.2% |
| Ecuador | 33 | 0.3% |
| England | 9 | 0.1% |
| Europe | 162 | 1.3% |
| France | 20 | 0.2% |
| Germany | 8 | 0.1% |
| Italy | 40 | 0.3% |
| Latin America | 723 | 5.8% |
| Mexico | 231 | 1.8% |
| Morocco | 34 | 0.3% |
| Nicaragua | 3 | 0.0% |
| Northern Africa | 34 | 0.3% |
| Northern Europe | 71 | 0.6% |
| Norway | 29 | 0.2% |
| Peru | 11 | 0.1% |
| Poland | 23 | 0.2% |
| South Africa | 42 | 0.3% |
| South America | 448 | 3.6% |
| South Eastern Asia | 13 | 0.1% |
| Southern Europe | 40 | 0.3% |
| Thailand | 13 | 0.1% |
| Trinidad and Tobago | 1 | 0.0% |
| Western Europe | 28 | 0.2% | View All 33 Rows |
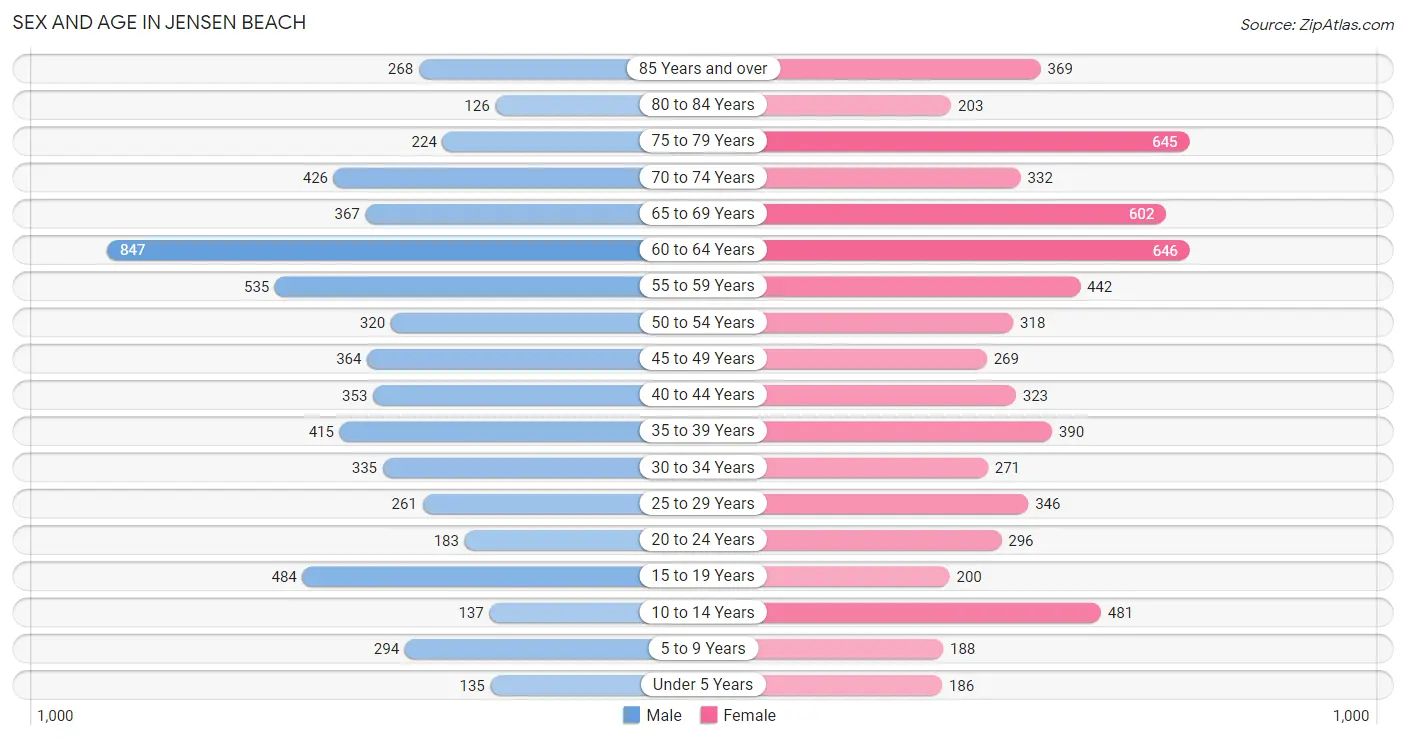
Sex and Age in Jensen Beach
Sex and Age in Jensen Beach
The most populous age groups in Jensen Beach are 60 to 64 Years (847 | 13.9%) for men and 60 to 64 Years (646 | 9.9%) for women.
| Age Bracket | Male | Female |
| Under 5 Years | 135 (2.2%) | 186 (2.9%) |
| 5 to 9 Years | 294 (4.8%) | 188 (2.9%) |
| 10 to 14 Years | 137 (2.3%) | 481 (7.4%) |
| 15 to 19 Years | 484 (8.0%) | 200 (3.1%) |
| 20 to 24 Years | 183 (3.0%) | 296 (4.5%) |
| 25 to 29 Years | 261 (4.3%) | 346 (5.3%) |
| 30 to 34 Years | 335 (5.5%) | 271 (4.2%) |
| 35 to 39 Years | 415 (6.8%) | 390 (6.0%) |
| 40 to 44 Years | 353 (5.8%) | 323 (5.0%) |
| 45 to 49 Years | 364 (6.0%) | 269 (4.1%) |
| 50 to 54 Years | 320 (5.3%) | 318 (4.9%) |
| 55 to 59 Years | 535 (8.8%) | 442 (6.8%) |
| 60 to 64 Years | 847 (13.9%) | 646 (9.9%) |
| 65 to 69 Years | 367 (6.0%) | 602 (9.2%) |
| 70 to 74 Years | 426 (7.0%) | 332 (5.1%) |
| 75 to 79 Years | 224 (3.7%) | 645 (9.9%) |
| 80 to 84 Years | 126 (2.1%) | 203 (3.1%) |
| 85 Years and over | 268 (4.4%) | 369 (5.7%) |
| Total | 6,074 (100.0%) | 6,507 (100.0%) |
Families and Households in Jensen Beach
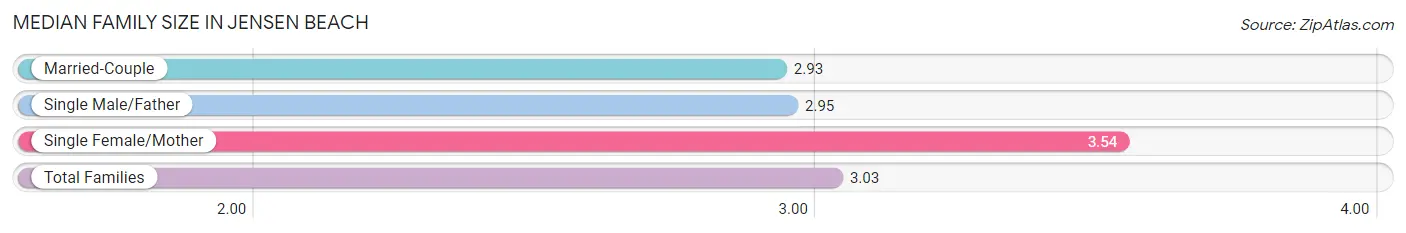
Median Family Size in Jensen Beach
The median family size in Jensen Beach is 3.03 persons per family, with single female/mother families (470 | 16.3%) accounting for the largest median family size of 3.54 persons per family. On the other hand, married-couple families (2,238 | 77.6%) represent the smallest median family size with 2.93 persons per family.
| Family Type | # Families | Family Size |
| Married-Couple | 2,238 (77.6%) | 2.93 |
| Single Male/Father | 174 (6.0%) | 2.95 |
| Single Female/Mother | 470 (16.3%) | 3.54 |
| Total Families | 2,882 (100.0%) | 3.03 |
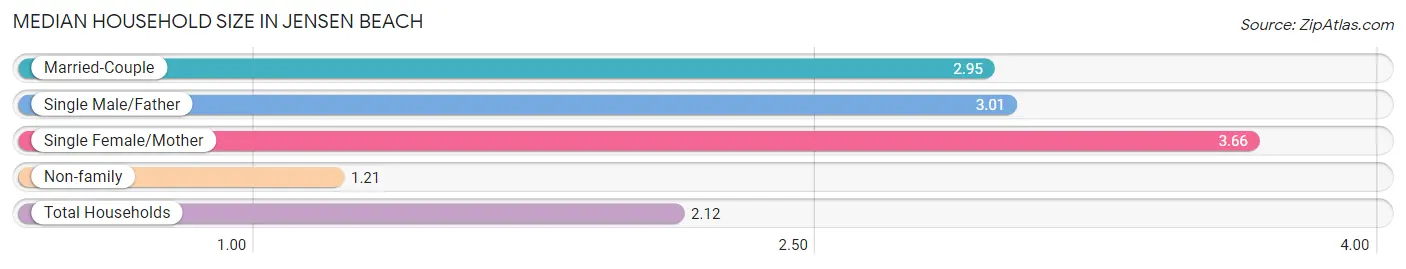
Median Household Size in Jensen Beach
The median household size in Jensen Beach is 2.12 persons per household, with single female/mother households (470 | 8.0%) accounting for the largest median household size of 3.66 persons per household. non-family households (2,994 | 50.9%) represent the smallest median household size with 1.21 persons per household.
| Household Type | # Households | Household Size |
| Married-Couple | 2,238 (38.1%) | 2.95 |
| Single Male/Father | 174 (3.0%) | 3.01 |
| Single Female/Mother | 470 (8.0%) | 3.66 |
| Non-family | 2,994 (50.9%) | 1.21 |
| Total Households | 5,876 (100.0%) | 2.12 |
Household Size by Marriage Status in Jensen Beach
Out of a total of 5,876 households in Jensen Beach, 2,882 (49.0%) are family households, while 2,994 (50.9%) are nonfamily households. The most numerous type of family households are 2-person households, comprising 1,695, and the most common type of nonfamily households are 1-person households, comprising 2,595.
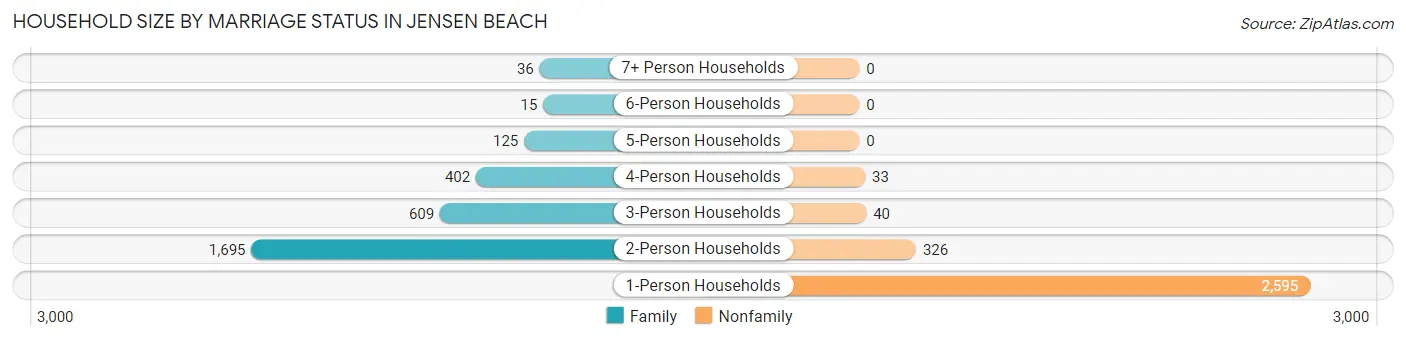
| Household Size | Family Households | Nonfamily Households |
| 1-Person Households | - | 2,595 (44.2%) |
| 2-Person Households | 1,695 (28.8%) | 326 (5.6%) |
| 3-Person Households | 609 (10.4%) | 40 (0.7%) |
| 4-Person Households | 402 (6.8%) | 33 (0.6%) |
| 5-Person Households | 125 (2.1%) | 0 (0.0%) |
| 6-Person Households | 15 (0.3%) | 0 (0.0%) |
| 7+ Person Households | 36 (0.6%) | 0 (0.0%) |
| Total | 2,882 (49.0%) | 2,994 (50.9%) |
Female Fertility in Jensen Beach
Fertility by Age in Jensen Beach
Average fertility rate in Jensen Beach is 8.0 births per 1,000 women. Women in the age bracket of 20 to 34 years have the highest fertility rate with 11.0 births per 1,000 women. Women in the age bracket of 20 to 34 years acount for 55.6% of all women with births.
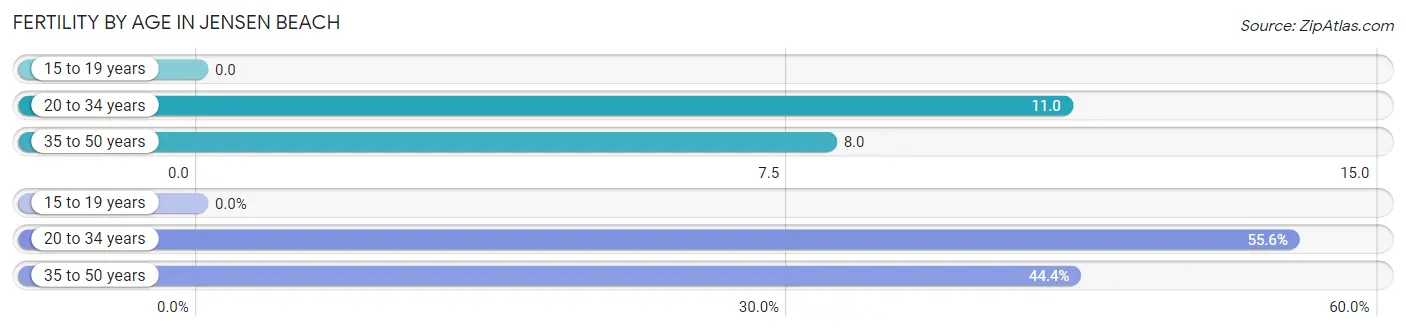
| Age Bracket | Women with Births | Births / 1,000 Women |
| 15 to 19 years | 0 (0.0%) | 0.0 |
| 20 to 34 years | 10 (55.6%) | 11.0 |
| 35 to 50 years | 8 (44.4%) | 8.0 |
| Total | 18 (100.0%) | 8.0 |
Fertility by Age by Marriage Status in Jensen Beach
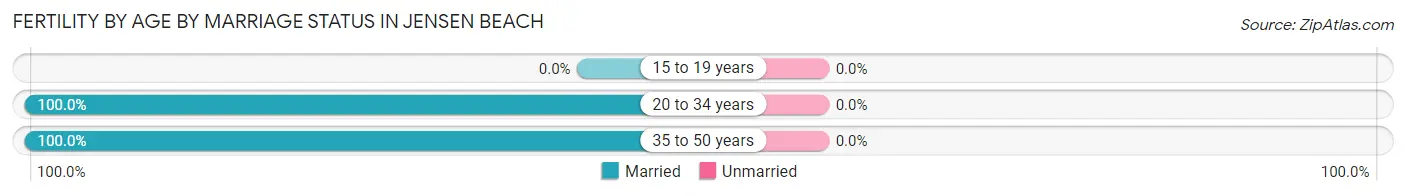
| Age Bracket | Married | Unmarried |
| 15 to 19 years | 0 (0.0%) | 0 (0.0%) |
| 20 to 34 years | 10 (100.0%) | 0 (0.0%) |
| 35 to 50 years | 8 (100.0%) | 0 (0.0%) |
| Total | 18 (100.0%) | 0 (0.0%) |
Fertility by Education in Jensen Beach
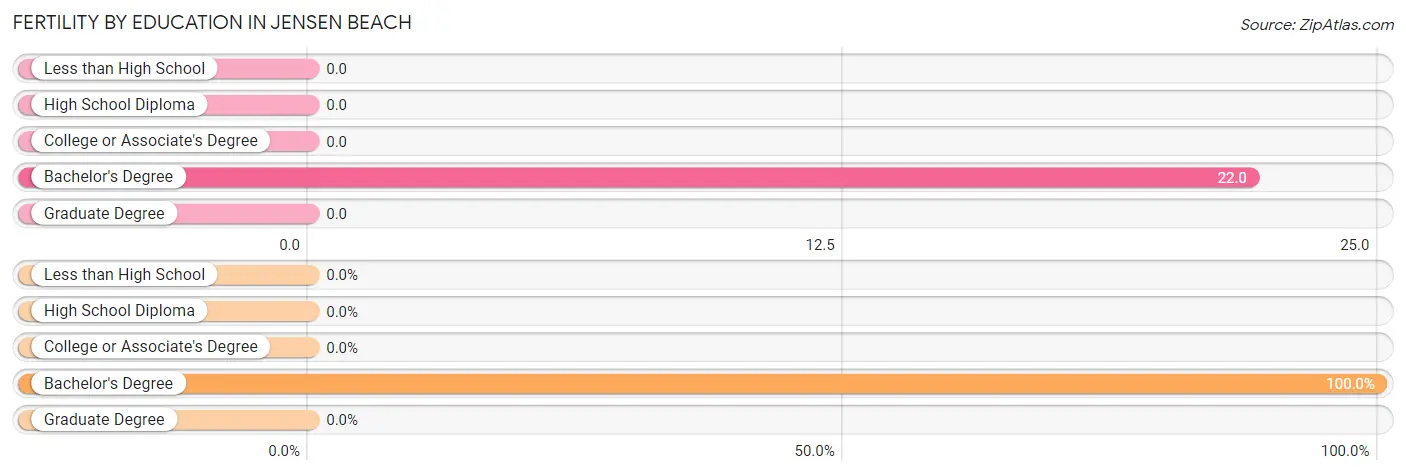
| Educational Attainment | Women with Births | Births / 1,000 Women |
| Less than High School | 0 (0.0%) | 0.0 |
| High School Diploma | 0 (0.0%) | 0.0 |
| College or Associate's Degree | 0 (0.0%) | 0.0 |
| Bachelor's Degree | 18 (100.0%) | 22.0 |
| Graduate Degree | 0 (0.0%) | 0.0 |
| Total | 18 (100.0%) | 8.0 |
Fertility by Education by Marriage Status in Jensen Beach
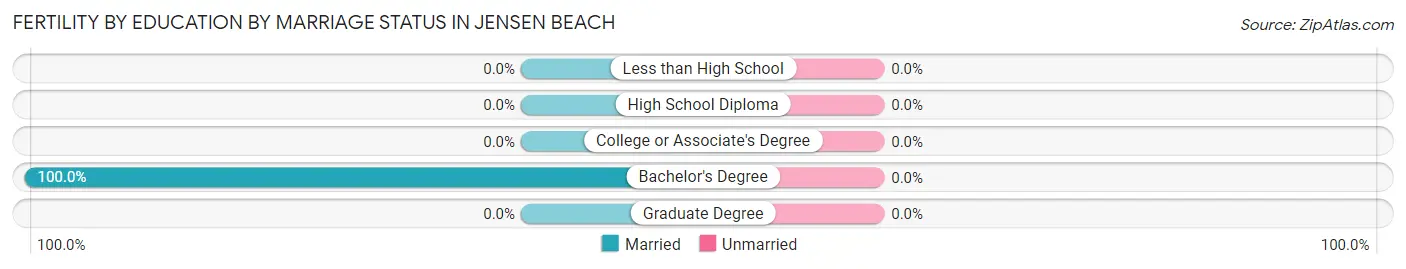
| Educational Attainment | Married | Unmarried |
| Less than High School | 0 (0.0%) | 0 (0.0%) |
| High School Diploma | 0 (0.0%) | 0 (0.0%) |
| College or Associate's Degree | 0 (0.0%) | 0 (0.0%) |
| Bachelor's Degree | 18 (100.0%) | 0 (0.0%) |
| Graduate Degree | 0 (0.0%) | 0 (0.0%) |
| Total | 18 (100.0%) | 0 (0.0%) |
Employment Characteristics in Jensen Beach
Employment by Class of Employer in Jensen Beach
Among the 5,227 employed individuals in Jensen Beach, private company employees (3,371 | 64.5%), self-employed (not incorporated) (574 | 11.0%), and self-employed (incorporated) (508 | 9.7%) make up the most common classes of employment.
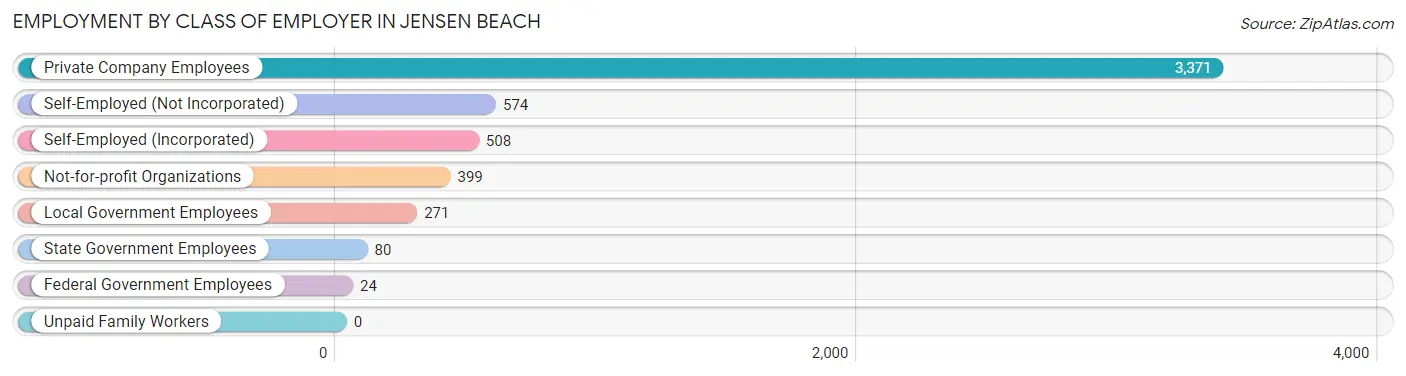
| Employer Class | # Employees | % Employees |
| Private Company Employees | 3,371 | 64.5% |
| Self-Employed (Incorporated) | 508 | 9.7% |
| Self-Employed (Not Incorporated) | 574 | 11.0% |
| Not-for-profit Organizations | 399 | 7.6% |
| Local Government Employees | 271 | 5.2% |
| State Government Employees | 80 | 1.5% |
| Federal Government Employees | 24 | 0.5% |
| Unpaid Family Workers | 0 | 0.0% |
| Total | 5,227 | 100.0% |
Employment Status by Age in Jensen Beach
According to the labor force statistics for Jensen Beach, out of the total population over 16 years of age (11,009), 50.6% or 5,571 individuals are in the labor force, with 4.8% or 267 of them unemployed. The age group with the highest labor force participation rate is 25 to 29 years, with 93.4% or 567 individuals in the labor force. Within the labor force, the 16 to 19 years age range has the highest percentage of unemployed individuals, with 19.3% or 16 of them being unemployed.
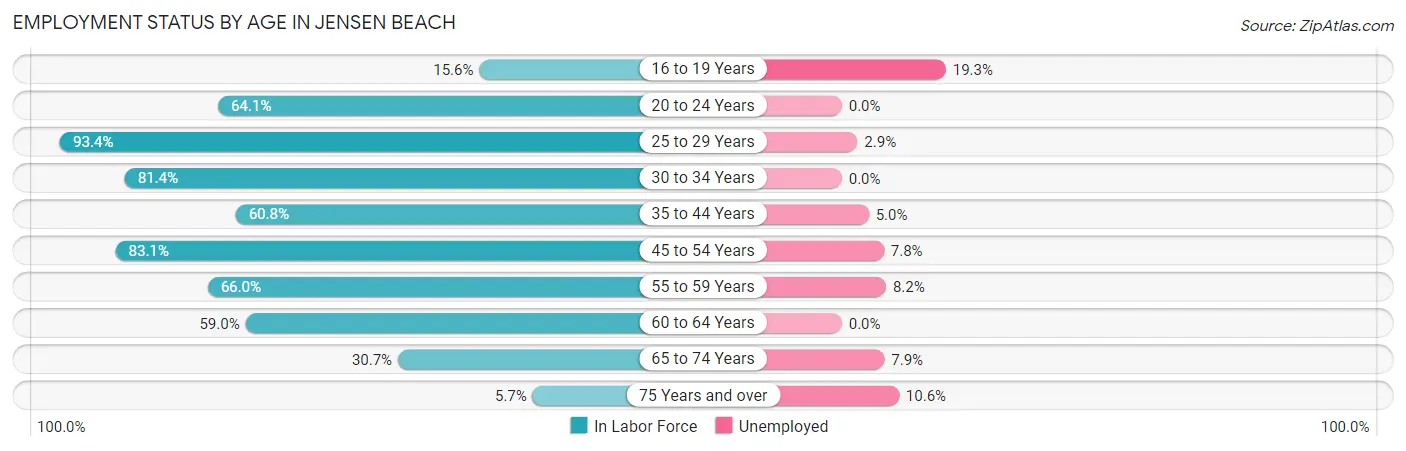
| Age Bracket | In Labor Force | Unemployed |
| 16 to 19 Years | 83 (15.6%) | 16 (19.3%) |
| 20 to 24 Years | 307 (64.1%) | 0 (0.0%) |
| 25 to 29 Years | 567 (93.4%) | 16 (2.9%) |
| 30 to 34 Years | 493 (81.4%) | 0 (0.0%) |
| 35 to 44 Years | 900 (60.8%) | 45 (5.0%) |
| 45 to 54 Years | 1,056 (83.1%) | 82 (7.8%) |
| 55 to 59 Years | 645 (66.0%) | 53 (8.2%) |
| 60 to 64 Years | 881 (59.0%) | 0 (0.0%) |
| 65 to 74 Years | 530 (30.7%) | 42 (7.9%) |
| 75 Years and over | 105 (5.7%) | 11 (10.6%) |
| Total | 5,571 (50.6%) | 267 (4.8%) |
Employment Status by Educational Attainment in Jensen Beach
According to labor force statistics for Jensen Beach, 70.6% of individuals (4,543) out of the total population between 25 and 64 years of age (6,435) are in the labor force, with 4.3% or 195 of them being unemployed. The group with the highest labor force participation rate are those with the educational attainment of high school diploma, with 76.5% or 1,316 individuals in the labor force. Within the labor force, individuals with less than high school education have the highest percentage of unemployment, with 10.2% or 26 of them being unemployed.
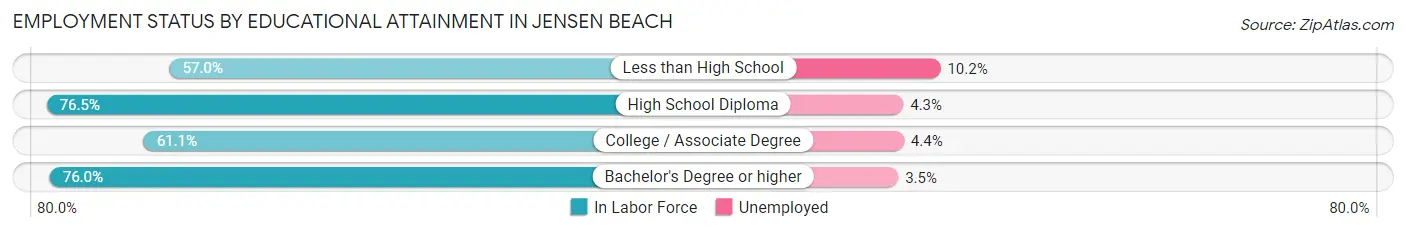
| Educational Attainment | In Labor Force | Unemployed |
| Less than High School | 256 (57.0%) | 46 (10.2%) |
| High School Diploma | 1,316 (76.5%) | 74 (4.3%) |
| College / Associate Degree | 1,108 (61.1%) | 80 (4.4%) |
| Bachelor's Degree or higher | 1,864 (76.0%) | 86 (3.5%) |
| Total | 4,543 (70.6%) | 277 (4.3%) |
Employment Occupations by Sex in Jensen Beach
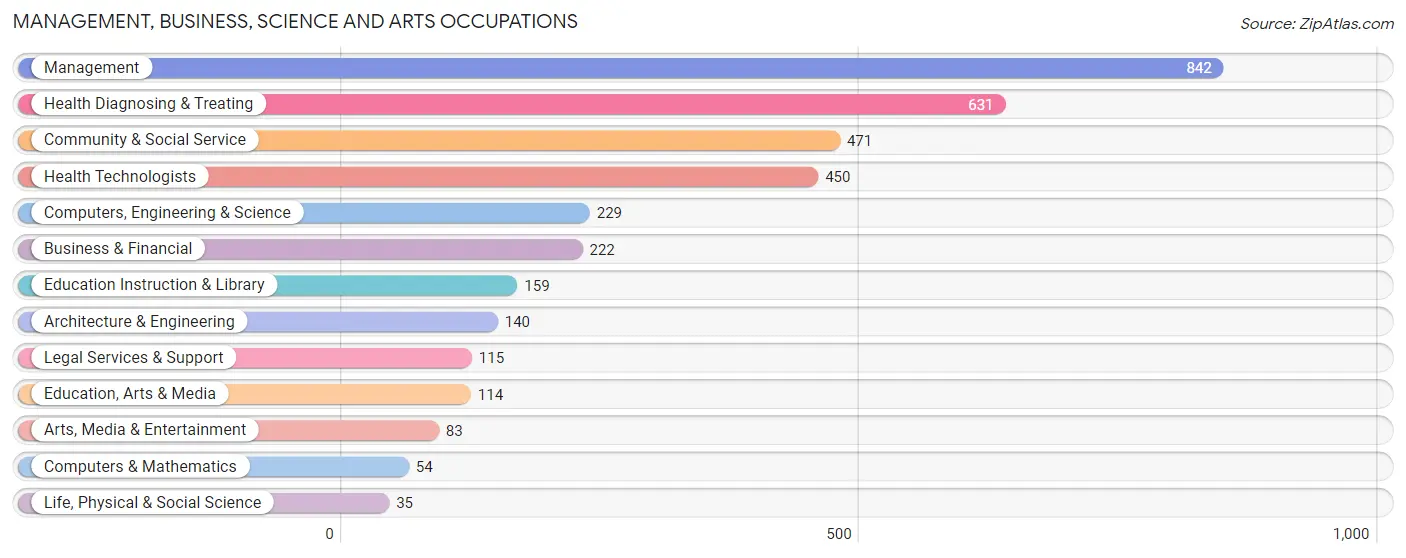
Management, Business, Science and Arts Occupations
The most common Management, Business, Science and Arts occupations in Jensen Beach are Management (842 | 15.9%), Health Diagnosing & Treating (631 | 11.9%), Community & Social Service (471 | 8.9%), Health Technologists (450 | 8.5%), and Computers, Engineering & Science (229 | 4.3%).
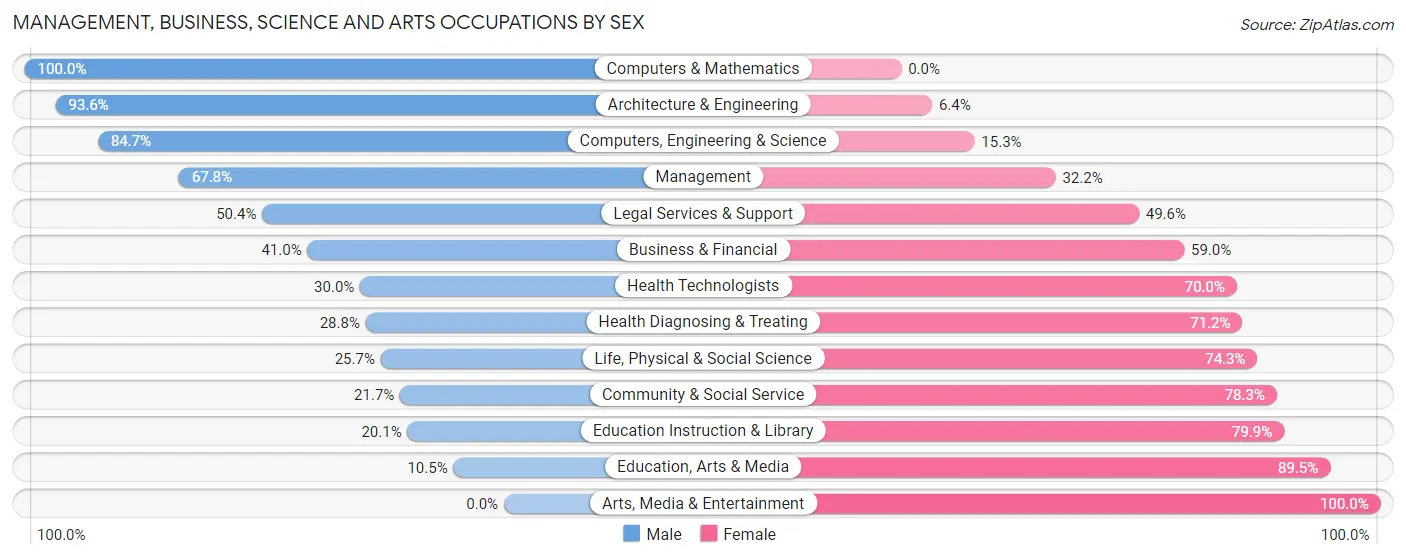
Management, Business, Science and Arts Occupations by Sex
Within the Management, Business, Science and Arts occupations in Jensen Beach, the most male-oriented occupations are Computers & Mathematics (100.0%), Architecture & Engineering (93.6%), and Computers, Engineering & Science (84.7%), while the most female-oriented occupations are Arts, Media & Entertainment (100.0%), Education, Arts & Media (89.5%), and Education Instruction & Library (79.9%).
| Occupation | Male | Female |
| Management | 571 (67.8%) | 271 (32.2%) |
| Business & Financial | 91 (41.0%) | 131 (59.0%) |
| Computers, Engineering & Science | 194 (84.7%) | 35 (15.3%) |
| Computers & Mathematics | 54 (100.0%) | 0 (0.0%) |
| Architecture & Engineering | 131 (93.6%) | 9 (6.4%) |
| Life, Physical & Social Science | 9 (25.7%) | 26 (74.3%) |
| Community & Social Service | 102 (21.7%) | 369 (78.3%) |
| Education, Arts & Media | 12 (10.5%) | 102 (89.5%) |
| Legal Services & Support | 58 (50.4%) | 57 (49.6%) |
| Education Instruction & Library | 32 (20.1%) | 127 (79.9%) |
| Arts, Media & Entertainment | 0 (0.0%) | 83 (100.0%) |
| Health Diagnosing & Treating | 182 (28.8%) | 449 (71.2%) |
| Health Technologists | 135 (30.0%) | 315 (70.0%) |
| Total (Category) | 1,140 (47.6%) | 1,255 (52.4%) |
| Total (Overall) | 2,896 (54.8%) | 2,391 (45.2%) |
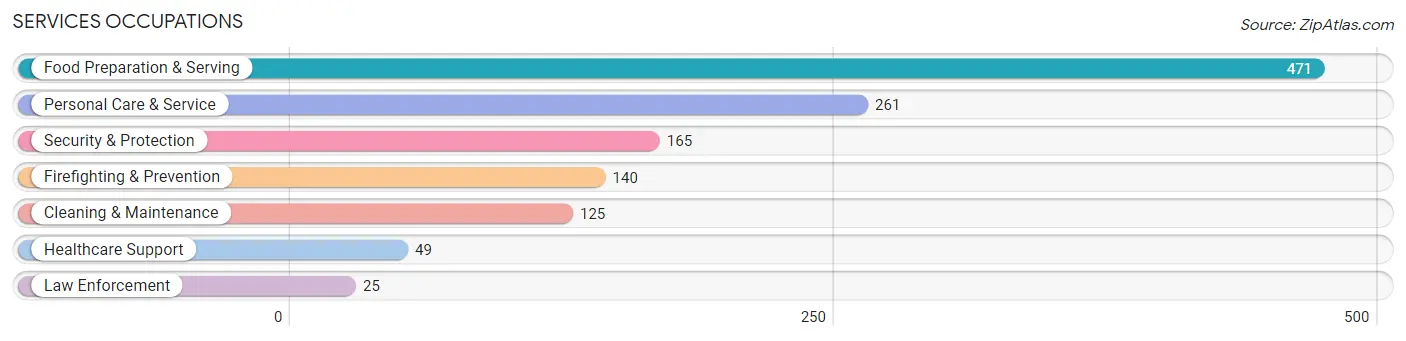
Services Occupations
The most common Services occupations in Jensen Beach are Food Preparation & Serving (471 | 8.9%), Personal Care & Service (261 | 4.9%), Security & Protection (165 | 3.1%), Firefighting & Prevention (140 | 2.6%), and Cleaning & Maintenance (125 | 2.4%).
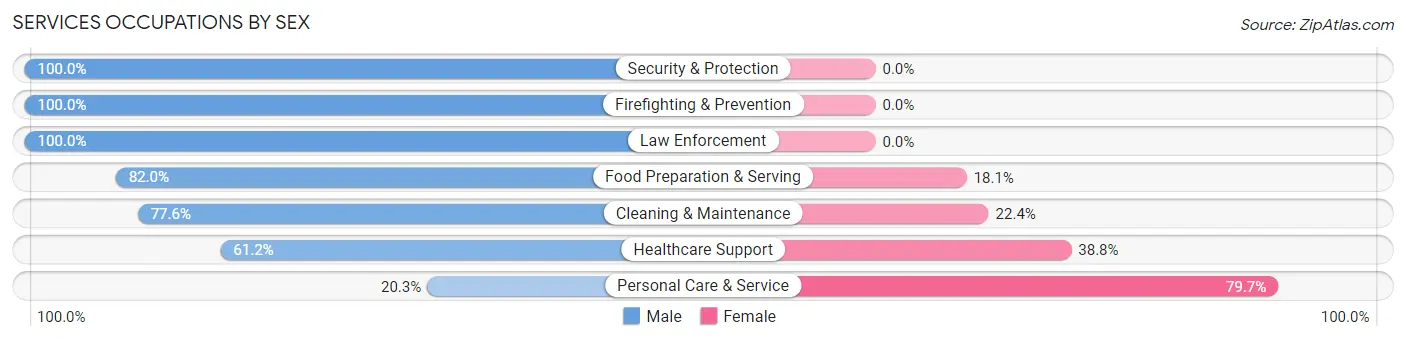
Services Occupations by Sex
Within the Services occupations in Jensen Beach, the most male-oriented occupations are Security & Protection (100.0%), Firefighting & Prevention (100.0%), and Law Enforcement (100.0%), while the most female-oriented occupations are Personal Care & Service (79.7%), Healthcare Support (38.8%), and Cleaning & Maintenance (22.4%).
| Occupation | Male | Female |
| Healthcare Support | 30 (61.2%) | 19 (38.8%) |
| Security & Protection | 165 (100.0%) | 0 (0.0%) |
| Firefighting & Prevention | 140 (100.0%) | 0 (0.0%) |
| Law Enforcement | 25 (100.0%) | 0 (0.0%) |
| Food Preparation & Serving | 386 (82.0%) | 85 (18.0%) |
| Cleaning & Maintenance | 97 (77.6%) | 28 (22.4%) |
| Personal Care & Service | 53 (20.3%) | 208 (79.7%) |
| Total (Category) | 731 (68.2%) | 340 (31.8%) |
| Total (Overall) | 2,896 (54.8%) | 2,391 (45.2%) |
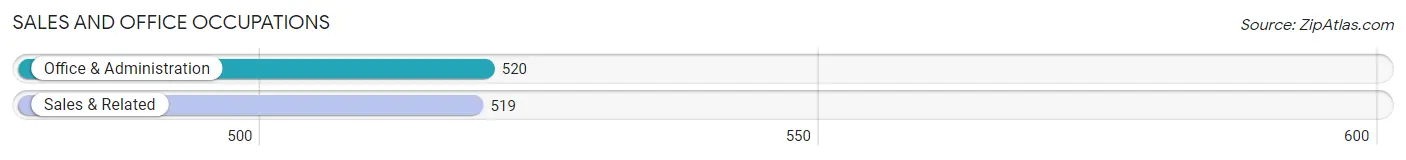
Sales and Office Occupations
The most common Sales and Office occupations in Jensen Beach are Office & Administration (520 | 9.8%), and Sales & Related (519 | 9.8%).
Sales and Office Occupations by Sex
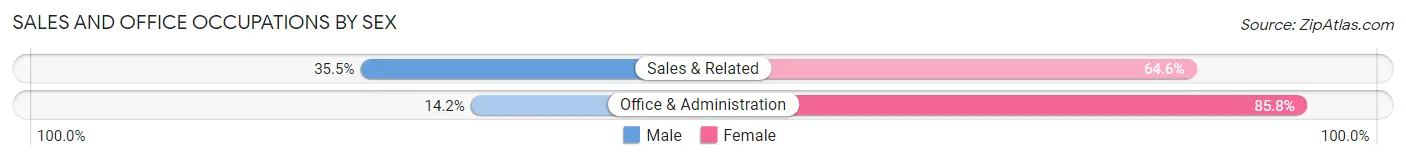
| Occupation | Male | Female |
| Sales & Related | 184 (35.4%) | 335 (64.5%) |
| Office & Administration | 74 (14.2%) | 446 (85.8%) |
| Total (Category) | 258 (24.8%) | 781 (75.2%) |
| Total (Overall) | 2,896 (54.8%) | 2,391 (45.2%) |
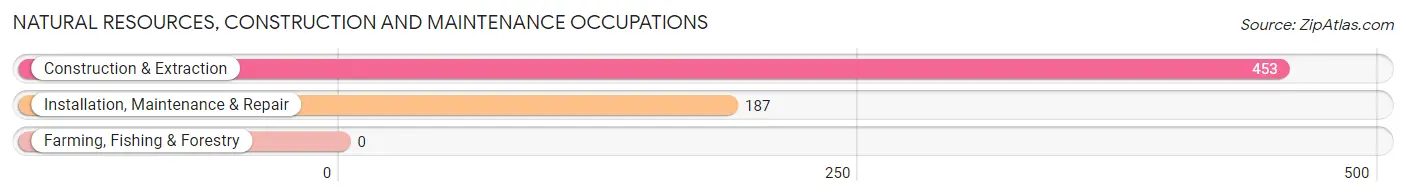
Natural Resources, Construction and Maintenance Occupations
The most common Natural Resources, Construction and Maintenance occupations in Jensen Beach are Construction & Extraction (453 | 8.6%), and Installation, Maintenance & Repair (187 | 3.5%).
Natural Resources, Construction and Maintenance Occupations by Sex
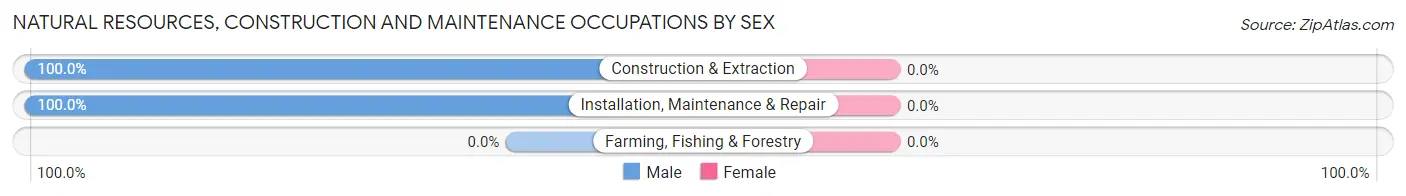
| Occupation | Male | Female |
| Farming, Fishing & Forestry | 0 (0.0%) | 0 (0.0%) |
| Construction & Extraction | 453 (100.0%) | 0 (0.0%) |
| Installation, Maintenance & Repair | 187 (100.0%) | 0 (0.0%) |
| Total (Category) | 640 (100.0%) | 0 (0.0%) |
| Total (Overall) | 2,896 (54.8%) | 2,391 (45.2%) |
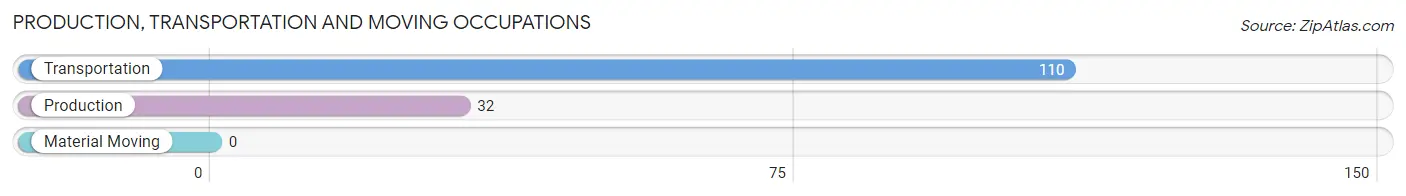
Production, Transportation and Moving Occupations
The most common Production, Transportation and Moving occupations in Jensen Beach are Transportation (110 | 2.1%), and Production (32 | 0.6%).
Production, Transportation and Moving Occupations by Sex
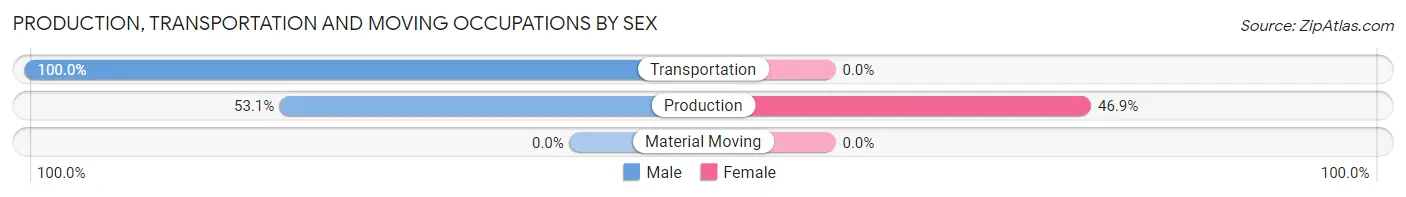
| Occupation | Male | Female |
| Production | 17 (53.1%) | 15 (46.9%) |
| Transportation | 110 (100.0%) | 0 (0.0%) |
| Material Moving | 0 (0.0%) | 0 (0.0%) |
| Total (Category) | 127 (89.4%) | 15 (10.6%) |
| Total (Overall) | 2,896 (54.8%) | 2,391 (45.2%) |
Employment Industries by Sex in Jensen Beach
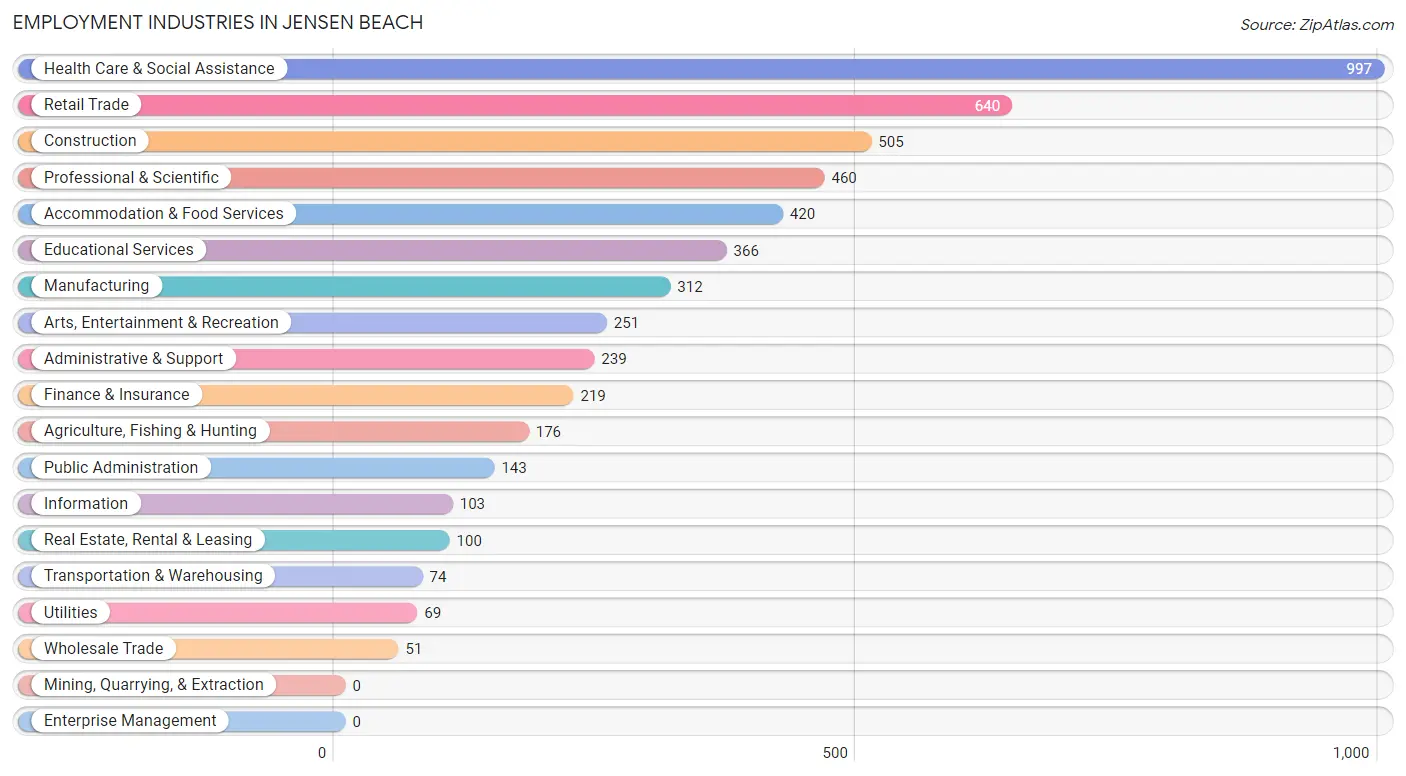
Employment Industries in Jensen Beach
The major employment industries in Jensen Beach include Health Care & Social Assistance (997 | 18.9%), Retail Trade (640 | 12.1%), Construction (505 | 9.6%), Professional & Scientific (460 | 8.7%), and Accommodation & Food Services (420 | 7.9%).
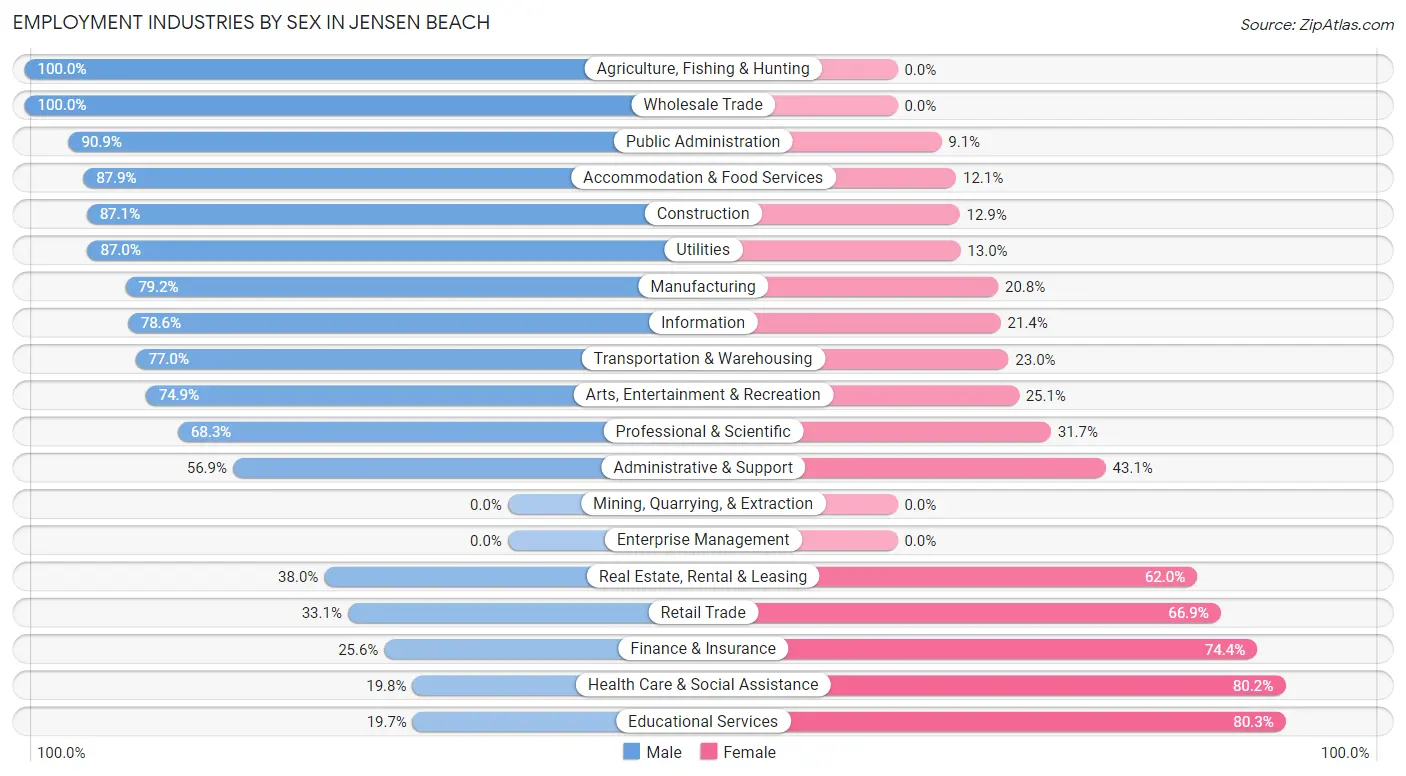
Employment Industries by Sex in Jensen Beach
The Jensen Beach industries that see more men than women are Agriculture, Fishing & Hunting (100.0%), Wholesale Trade (100.0%), and Public Administration (90.9%), whereas the industries that tend to have a higher number of women are Educational Services (80.3%), Health Care & Social Assistance (80.2%), and Finance & Insurance (74.4%).
| Industry | Male | Female |
| Agriculture, Fishing & Hunting | 176 (100.0%) | 0 (0.0%) |
| Mining, Quarrying, & Extraction | 0 (0.0%) | 0 (0.0%) |
| Construction | 440 (87.1%) | 65 (12.9%) |
| Manufacturing | 247 (79.2%) | 65 (20.8%) |
| Wholesale Trade | 51 (100.0%) | 0 (0.0%) |
| Retail Trade | 212 (33.1%) | 428 (66.9%) |
| Transportation & Warehousing | 57 (77.0%) | 17 (23.0%) |
| Utilities | 60 (87.0%) | 9 (13.0%) |
| Information | 81 (78.6%) | 22 (21.4%) |
| Finance & Insurance | 56 (25.6%) | 163 (74.4%) |
| Real Estate, Rental & Leasing | 38 (38.0%) | 62 (62.0%) |
| Professional & Scientific | 314 (68.3%) | 146 (31.7%) |
| Enterprise Management | 0 (0.0%) | 0 (0.0%) |
| Administrative & Support | 136 (56.9%) | 103 (43.1%) |
| Educational Services | 72 (19.7%) | 294 (80.3%) |
| Health Care & Social Assistance | 197 (19.8%) | 800 (80.2%) |
| Arts, Entertainment & Recreation | 188 (74.9%) | 63 (25.1%) |
| Accommodation & Food Services | 369 (87.9%) | 51 (12.1%) |
| Public Administration | 130 (90.9%) | 13 (9.1%) |
| Total | 2,896 (54.8%) | 2,391 (45.2%) |
Education in Jensen Beach
School Enrollment in Jensen Beach
The most common levels of schooling among the 2,440 students in Jensen Beach are high school (622 | 25.5%), middle school (576 | 23.6%), and elementary school (375 | 15.4%).
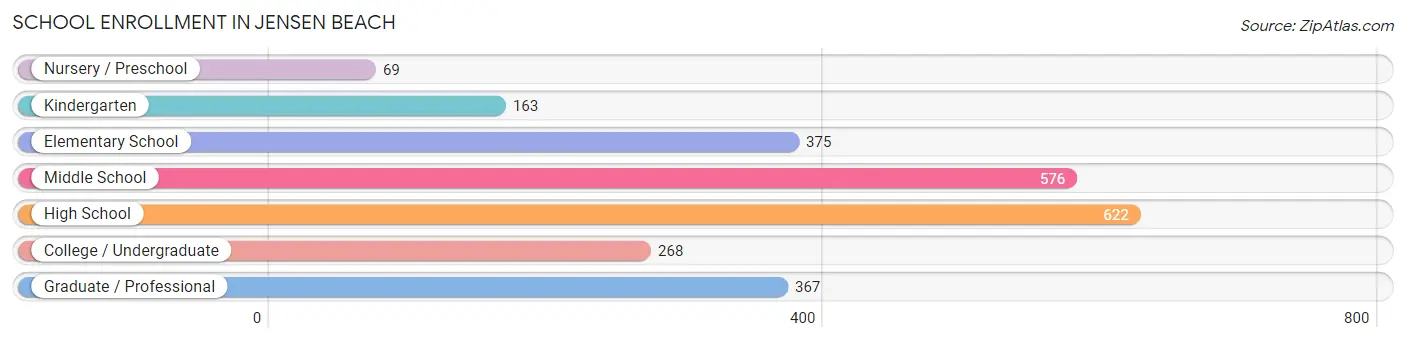
| School Level | # Students | % Students |
| Nursery / Preschool | 69 | 2.8% |
| Kindergarten | 163 | 6.7% |
| Elementary School | 375 | 15.4% |
| Middle School | 576 | 23.6% |
| High School | 622 | 25.5% |
| College / Undergraduate | 268 | 11.0% |
| Graduate / Professional | 367 | 15.0% |
| Total | 2,440 | 100.0% |
School Enrollment by Age by Funding Source in Jensen Beach
Out of a total of 2,440 students who are enrolled in schools in Jensen Beach, 637 (26.1%) attend a private institution, while the remaining 1,803 (73.9%) are enrolled in public schools. The age group of 3 to 4 year olds has the highest likelihood of being enrolled in private schools, with 66 (79.5% in the age bracket) enrolled. Conversely, the age group of 18 to 19 year olds has the lowest likelihood of being enrolled in a private school, with 95 (100.0% in the age bracket) attending a public institution.
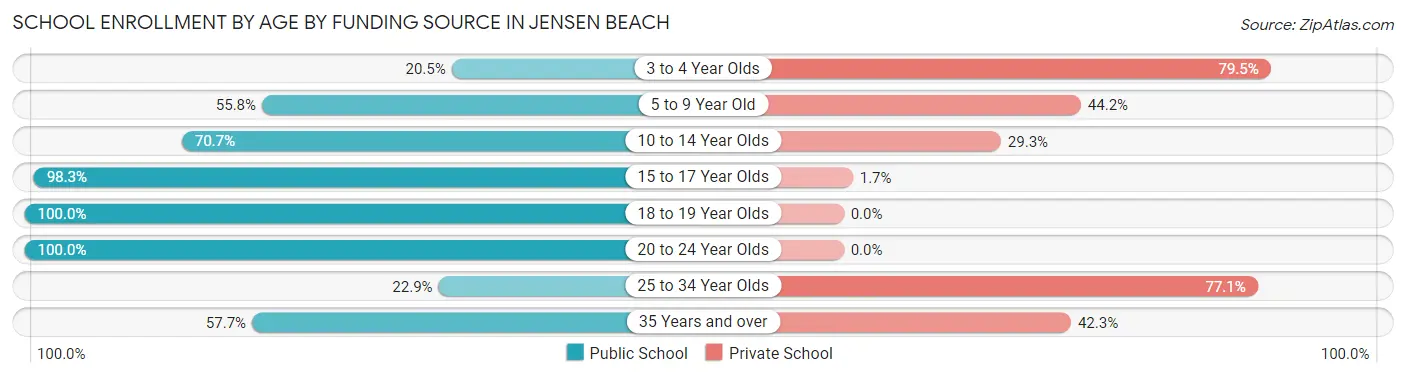
| Age Bracket | Public School | Private School |
| 3 to 4 Year Olds | 17 (20.5%) | 66 (79.5%) |
| 5 to 9 Year Old | 269 (55.8%) | 213 (44.2%) |
| 10 to 14 Year Olds | 437 (70.7%) | 181 (29.3%) |
| 15 to 17 Year Olds | 579 (98.3%) | 10 (1.7%) |
| 18 to 19 Year Olds | 95 (100.0%) | 0 (0.0%) |
| 20 to 24 Year Olds | 255 (100.0%) | 0 (0.0%) |
| 25 to 34 Year Olds | 22 (22.9%) | 74 (77.1%) |
| 35 Years and over | 128 (57.7%) | 94 (42.3%) |
| Total | 1,803 (73.9%) | 637 (26.1%) |
Educational Attainment by Field of Study in Jensen Beach
Business (813 | 20.2%), science & technology (593 | 14.7%), education (501 | 12.4%), bio, nature & agricultural (435 | 10.8%), and social sciences (402 | 10.0%) are the most common fields of study among 4,033 individuals in Jensen Beach who have obtained a bachelor's degree or higher.
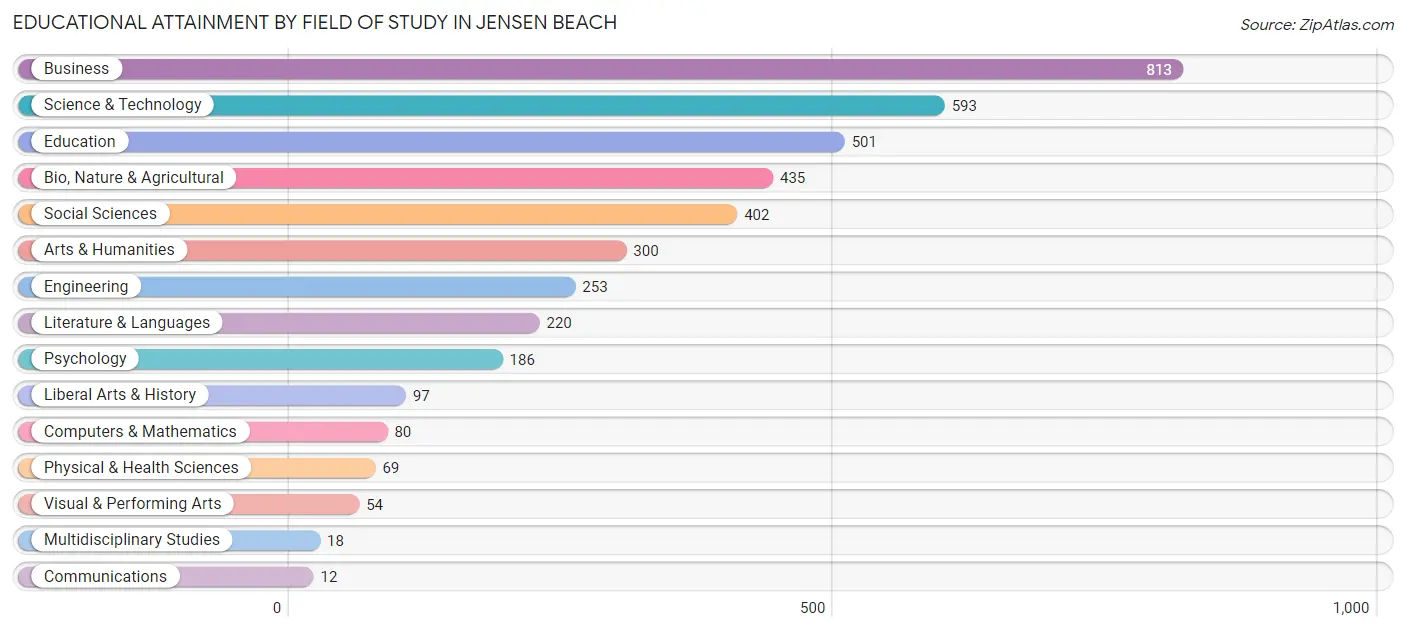
| Field of Study | # Graduates | % Graduates |
| Computers & Mathematics | 80 | 2.0% |
| Bio, Nature & Agricultural | 435 | 10.8% |
| Physical & Health Sciences | 69 | 1.7% |
| Psychology | 186 | 4.6% |
| Social Sciences | 402 | 10.0% |
| Engineering | 253 | 6.3% |
| Multidisciplinary Studies | 18 | 0.4% |
| Science & Technology | 593 | 14.7% |
| Business | 813 | 20.2% |
| Education | 501 | 12.4% |
| Literature & Languages | 220 | 5.4% |
| Liberal Arts & History | 97 | 2.4% |
| Visual & Performing Arts | 54 | 1.3% |
| Communications | 12 | 0.3% |
| Arts & Humanities | 300 | 7.4% |
| Total | 4,033 | 100.0% |
Transportation & Commute in Jensen Beach
Vehicle Availability by Sex in Jensen Beach
The most prevalent vehicle ownership categories in Jensen Beach are males with 2 vehicles (1,666, accounting for 58.5%) and females with 2 vehicles (953, making up 70.1%).
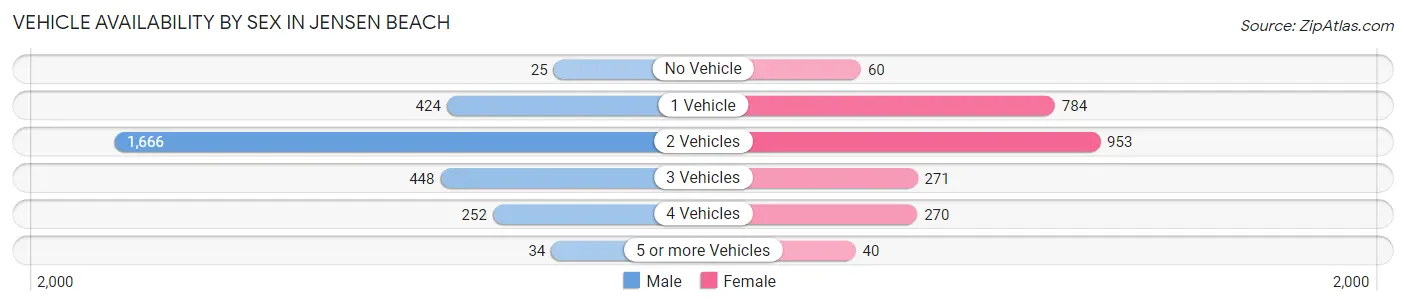
| Vehicles Available | Male | Female |
| No Vehicle | 25 (0.9%) | 60 (2.5%) |
| 1 Vehicle | 424 (14.9%) | 784 (33.0%) |
| 2 Vehicles | 1,666 (58.5%) | 953 (40.1%) |
| 3 Vehicles | 448 (15.7%) | 271 (11.4%) |
| 4 Vehicles | 252 (8.8%) | 270 (11.4%) |
| 5 or more Vehicles | 34 (1.2%) | 40 (1.7%) |
| Total | 2,849 (100.0%) | 2,378 (100.0%) |
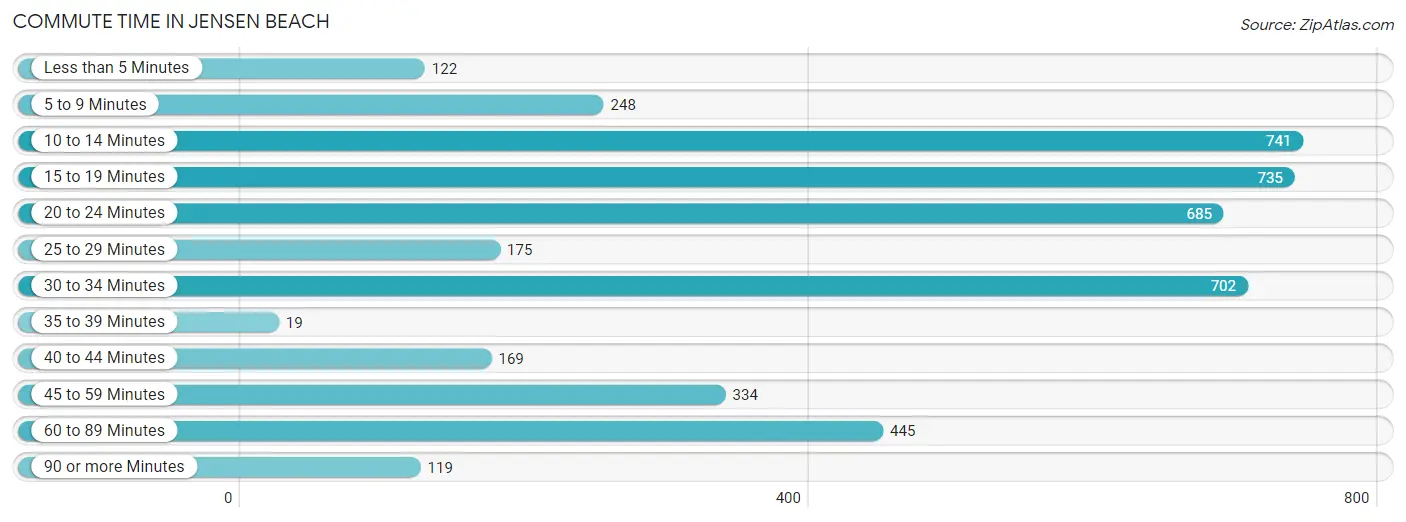
Commute Time in Jensen Beach
The most frequently occuring commute durations in Jensen Beach are 10 to 14 minutes (741 commuters, 16.5%), 15 to 19 minutes (735 commuters, 16.4%), and 30 to 34 minutes (702 commuters, 15.6%).
| Commute Time | # Commuters | % Commuters |
| Less than 5 Minutes | 122 | 2.7% |
| 5 to 9 Minutes | 248 | 5.5% |
| 10 to 14 Minutes | 741 | 16.5% |
| 15 to 19 Minutes | 735 | 16.4% |
| 20 to 24 Minutes | 685 | 15.2% |
| 25 to 29 Minutes | 175 | 3.9% |
| 30 to 34 Minutes | 702 | 15.6% |
| 35 to 39 Minutes | 19 | 0.4% |
| 40 to 44 Minutes | 169 | 3.8% |
| 45 to 59 Minutes | 334 | 7.4% |
| 60 to 89 Minutes | 445 | 9.9% |
| 90 or more Minutes | 119 | 2.6% |
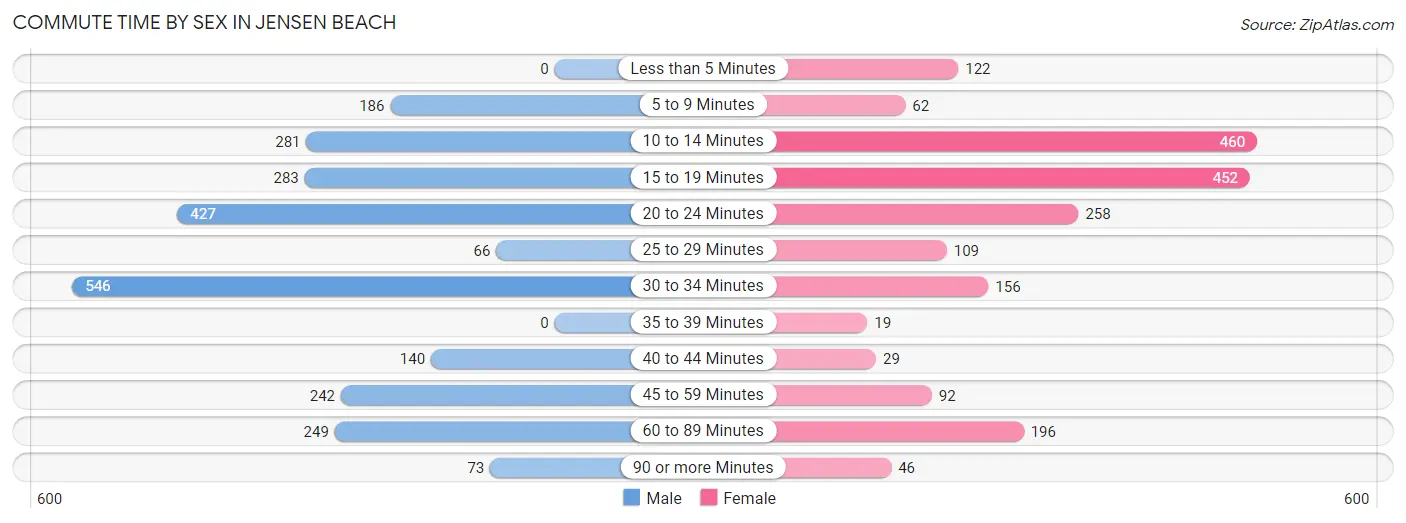
Commute Time by Sex in Jensen Beach
The most common commute times in Jensen Beach are 30 to 34 minutes (546 commuters, 21.9%) for males and 10 to 14 minutes (460 commuters, 23.0%) for females.
| Commute Time | Male | Female |
| Less than 5 Minutes | 0 (0.0%) | 122 (6.1%) |
| 5 to 9 Minutes | 186 (7.5%) | 62 (3.1%) |
| 10 to 14 Minutes | 281 (11.3%) | 460 (23.0%) |
| 15 to 19 Minutes | 283 (11.4%) | 452 (22.6%) |
| 20 to 24 Minutes | 427 (17.1%) | 258 (12.9%) |
| 25 to 29 Minutes | 66 (2.6%) | 109 (5.4%) |
| 30 to 34 Minutes | 546 (21.9%) | 156 (7.8%) |
| 35 to 39 Minutes | 0 (0.0%) | 19 (0.9%) |
| 40 to 44 Minutes | 140 (5.6%) | 29 (1.5%) |
| 45 to 59 Minutes | 242 (9.7%) | 92 (4.6%) |
| 60 to 89 Minutes | 249 (10.0%) | 196 (9.8%) |
| 90 or more Minutes | 73 (2.9%) | 46 (2.3%) |
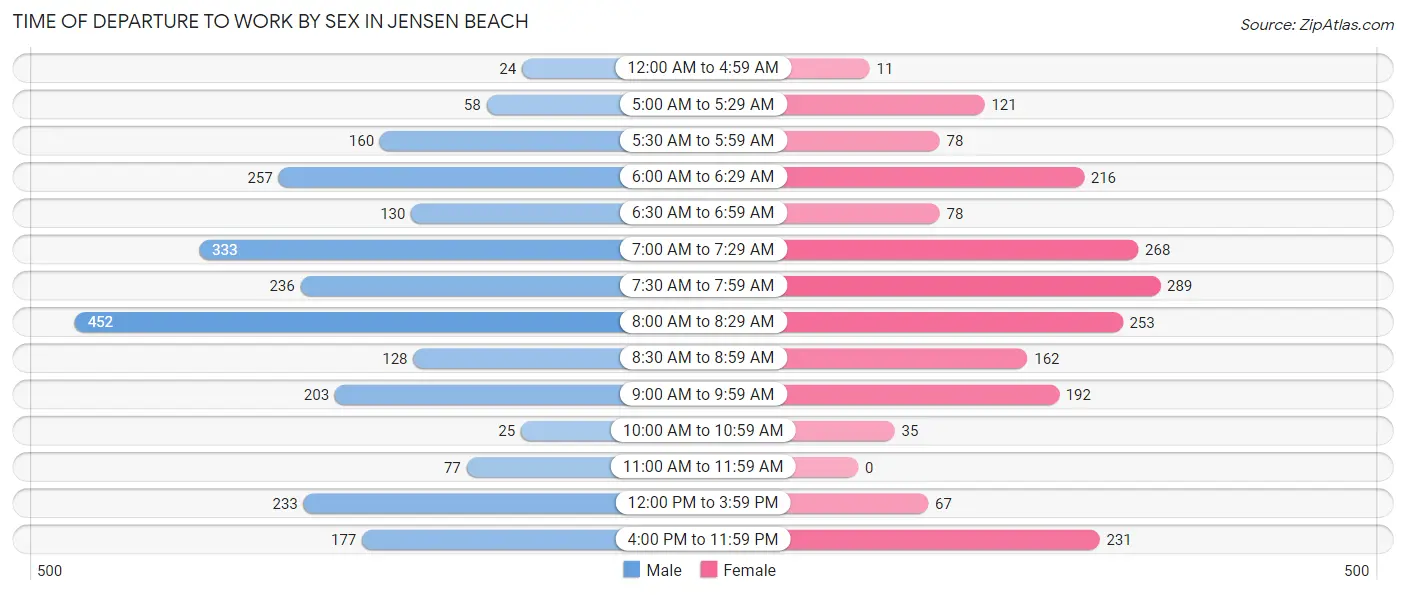
Time of Departure to Work by Sex in Jensen Beach
The most frequent times of departure to work in Jensen Beach are 8:00 AM to 8:29 AM (452, 18.1%) for males and 7:30 AM to 7:59 AM (289, 14.4%) for females.
| Time of Departure | Male | Female |
| 12:00 AM to 4:59 AM | 24 (1.0%) | 11 (0.5%) |
| 5:00 AM to 5:29 AM | 58 (2.3%) | 121 (6.0%) |
| 5:30 AM to 5:59 AM | 160 (6.4%) | 78 (3.9%) |
| 6:00 AM to 6:29 AM | 257 (10.3%) | 216 (10.8%) |
| 6:30 AM to 6:59 AM | 130 (5.2%) | 78 (3.9%) |
| 7:00 AM to 7:29 AM | 333 (13.4%) | 268 (13.4%) |
| 7:30 AM to 7:59 AM | 236 (9.5%) | 289 (14.4%) |
| 8:00 AM to 8:29 AM | 452 (18.1%) | 253 (12.6%) |
| 8:30 AM to 8:59 AM | 128 (5.1%) | 162 (8.1%) |
| 9:00 AM to 9:59 AM | 203 (8.1%) | 192 (9.6%) |
| 10:00 AM to 10:59 AM | 25 (1.0%) | 35 (1.8%) |
| 11:00 AM to 11:59 AM | 77 (3.1%) | 0 (0.0%) |
| 12:00 PM to 3:59 PM | 233 (9.3%) | 67 (3.4%) |
| 4:00 PM to 11:59 PM | 177 (7.1%) | 231 (11.5%) |
| Total | 2,493 (100.0%) | 2,001 (100.0%) |
Housing Occupancy in Jensen Beach
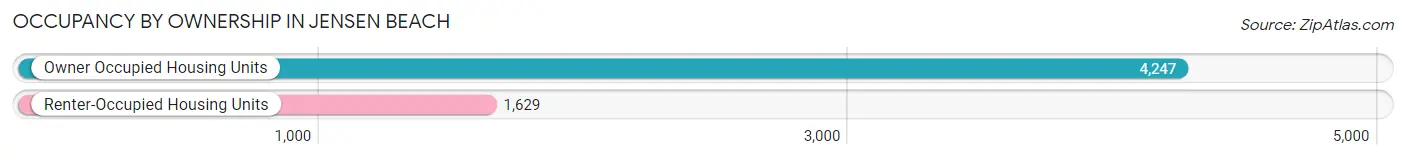
Occupancy by Ownership in Jensen Beach
Of the total 5,876 dwellings in Jensen Beach, owner-occupied units account for 4,247 (72.3%), while renter-occupied units make up 1,629 (27.7%).
| Occupancy | # Housing Units | % Housing Units |
| Owner Occupied Housing Units | 4,247 | 72.3% |
| Renter-Occupied Housing Units | 1,629 | 27.7% |
| Total Occupied Housing Units | 5,876 | 100.0% |
Occupancy by Household Size in Jensen Beach
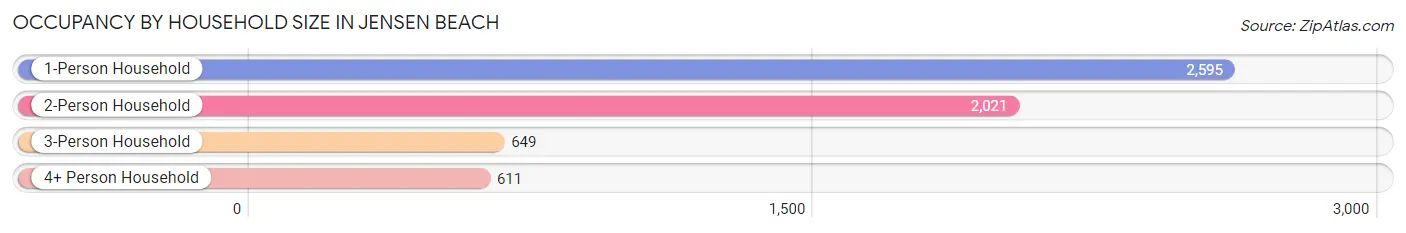
| Household Size | # Housing Units | % Housing Units |
| 1-Person Household | 2,595 | 44.2% |
| 2-Person Household | 2,021 | 34.4% |
| 3-Person Household | 649 | 11.0% |
| 4+ Person Household | 611 | 10.4% |
| Total Housing Units | 5,876 | 100.0% |
Occupancy by Ownership by Household Size in Jensen Beach
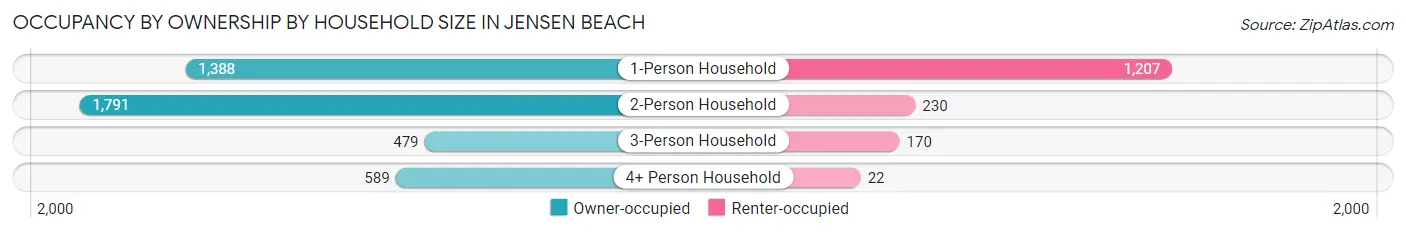
| Household Size | Owner-occupied | Renter-occupied |
| 1-Person Household | 1,388 (53.5%) | 1,207 (46.5%) |
| 2-Person Household | 1,791 (88.6%) | 230 (11.4%) |
| 3-Person Household | 479 (73.8%) | 170 (26.2%) |
| 4+ Person Household | 589 (96.4%) | 22 (3.6%) |
| Total Housing Units | 4,247 (72.3%) | 1,629 (27.7%) |
Occupancy by Educational Attainment in Jensen Beach
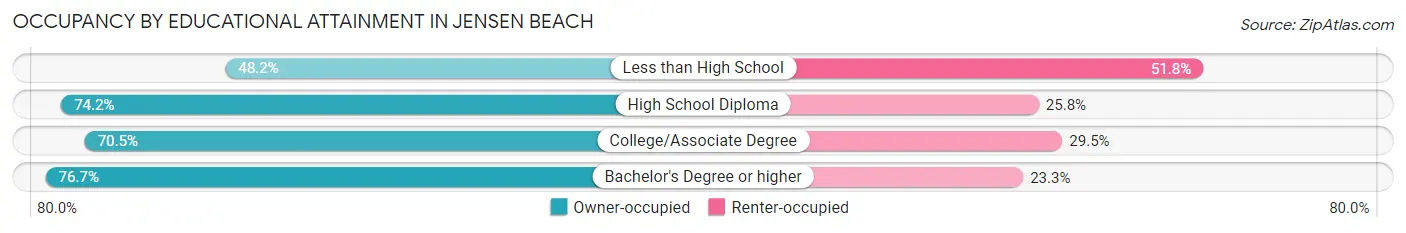
| Household Size | Owner-occupied | Renter-occupied |
| Less than High School | 170 (48.2%) | 183 (51.8%) |
| High School Diploma | 1,150 (74.2%) | 400 (25.8%) |
| College/Associate Degree | 1,350 (70.5%) | 566 (29.5%) |
| Bachelor's Degree or higher | 1,577 (76.7%) | 480 (23.3%) |
Occupancy by Age of Householder in Jensen Beach
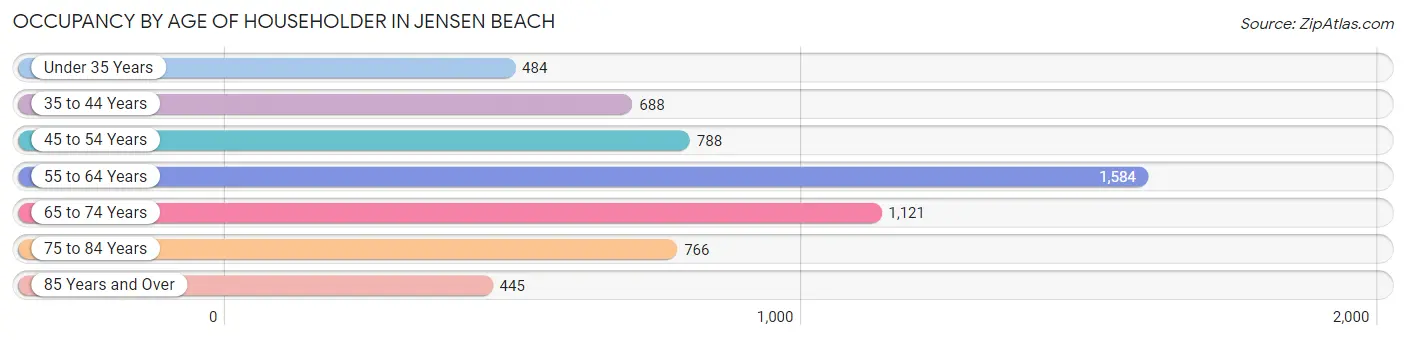
| Age Bracket | # Households | % Households |
| Under 35 Years | 484 | 8.2% |
| 35 to 44 Years | 688 | 11.7% |
| 45 to 54 Years | 788 | 13.4% |
| 55 to 64 Years | 1,584 | 27.0% |
| 65 to 74 Years | 1,121 | 19.1% |
| 75 to 84 Years | 766 | 13.0% |
| 85 Years and Over | 445 | 7.6% |
| Total | 5,876 | 100.0% |
Housing Finances in Jensen Beach
Median Income by Occupancy in Jensen Beach
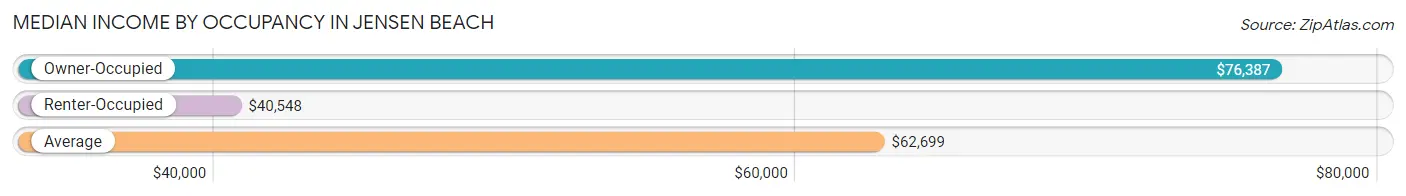
| Occupancy Type | # Households | Median Income |
| Owner-Occupied | 4,247 (72.3%) | $76,387 |
| Renter-Occupied | 1,629 (27.7%) | $40,548 |
| Average | 5,876 (100.0%) | $62,699 |
Occupancy by Householder Income Bracket in Jensen Beach
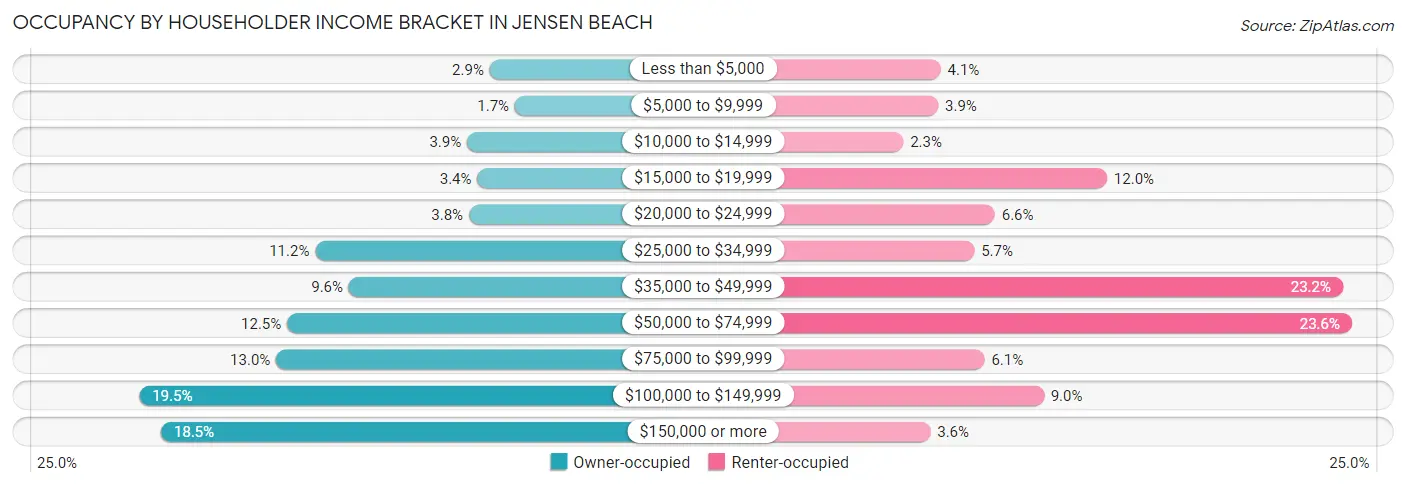
| Income Bracket | Owner-occupied | Renter-occupied |
| Less than $5,000 | 121 (2.9%) | 66 (4.1%) |
| $5,000 to $9,999 | 70 (1.7%) | 64 (3.9%) |
| $10,000 to $14,999 | 167 (3.9%) | 37 (2.3%) |
| $15,000 to $19,999 | 146 (3.4%) | 195 (12.0%) |
| $20,000 to $24,999 | 163 (3.8%) | 108 (6.6%) |
| $25,000 to $34,999 | 474 (11.2%) | 92 (5.7%) |
| $35,000 to $49,999 | 406 (9.6%) | 378 (23.2%) |
| $50,000 to $74,999 | 531 (12.5%) | 385 (23.6%) |
| $75,000 to $99,999 | 553 (13.0%) | 100 (6.1%) |
| $100,000 to $149,999 | 830 (19.5%) | 146 (9.0%) |
| $150,000 or more | 786 (18.5%) | 58 (3.6%) |
| Total | 4,247 (100.0%) | 1,629 (100.0%) |
Monthly Housing Cost Tiers in Jensen Beach
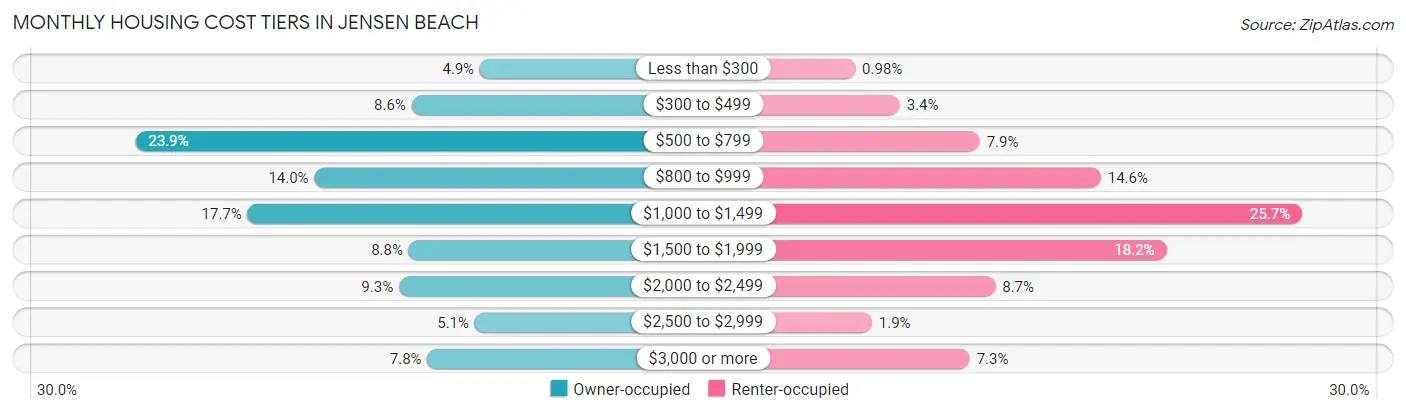
| Monthly Cost | Owner-occupied | Renter-occupied |
| Less than $300 | 206 (4.9%) | 16 (1.0%) |
| $300 to $499 | 366 (8.6%) | 56 (3.4%) |
| $500 to $799 | 1,014 (23.9%) | 128 (7.9%) |
| $800 to $999 | 594 (14.0%) | 237 (14.5%) |
| $1,000 to $1,499 | 751 (17.7%) | 418 (25.7%) |
| $1,500 to $1,999 | 373 (8.8%) | 296 (18.2%) |
| $2,000 to $2,499 | 396 (9.3%) | 142 (8.7%) |
| $2,500 to $2,999 | 218 (5.1%) | 31 (1.9%) |
| $3,000 or more | 329 (7.7%) | 119 (7.3%) |
| Total | 4,247 (100.0%) | 1,629 (100.0%) |
Physical Housing Characteristics in Jensen Beach
Housing Structures in Jensen Beach
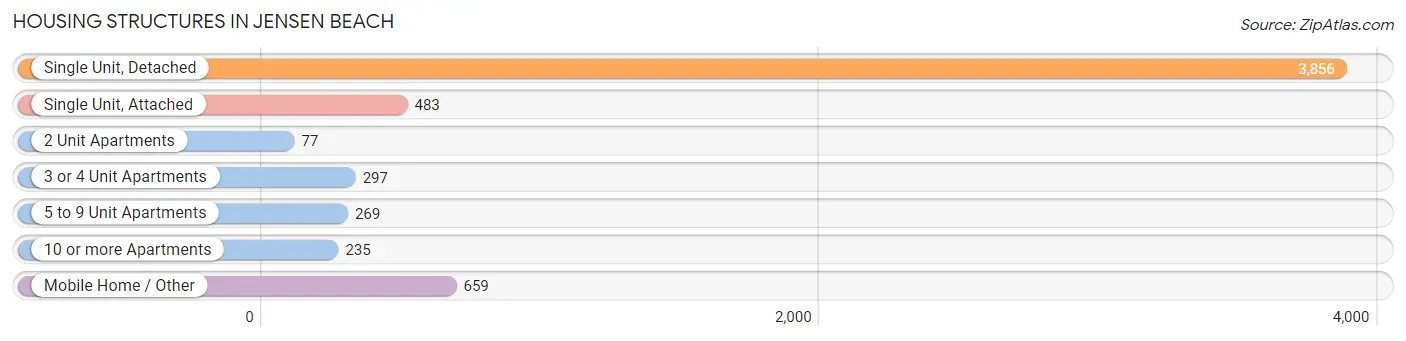
| Structure Type | # Housing Units | % Housing Units |
| Single Unit, Detached | 3,856 | 65.6% |
| Single Unit, Attached | 483 | 8.2% |
| 2 Unit Apartments | 77 | 1.3% |
| 3 or 4 Unit Apartments | 297 | 5.1% |
| 5 to 9 Unit Apartments | 269 | 4.6% |
| 10 or more Apartments | 235 | 4.0% |
| Mobile Home / Other | 659 | 11.2% |
| Total | 5,876 | 100.0% |
Housing Structures by Occupancy in Jensen Beach
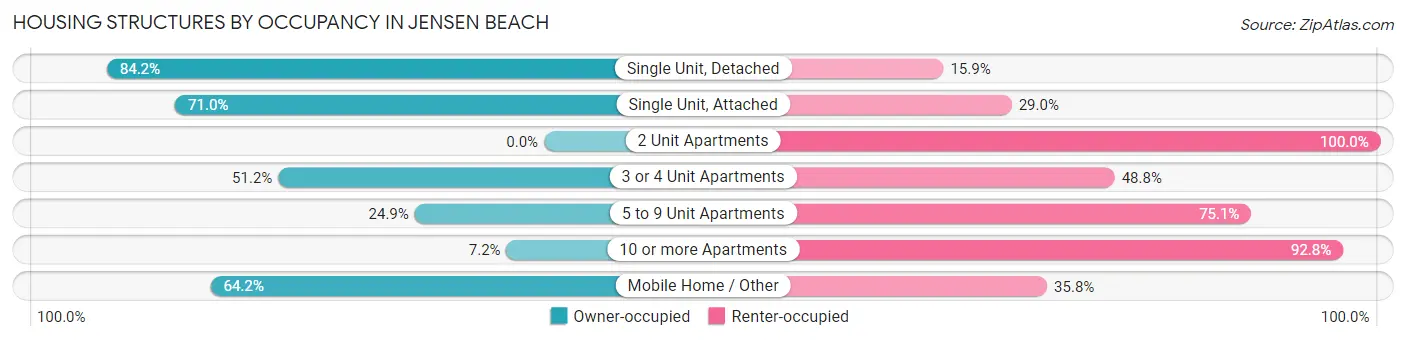
| Structure Type | Owner-occupied | Renter-occupied |
| Single Unit, Detached | 3,245 (84.2%) | 611 (15.9%) |
| Single Unit, Attached | 343 (71.0%) | 140 (29.0%) |
| 2 Unit Apartments | 0 (0.0%) | 77 (100.0%) |
| 3 or 4 Unit Apartments | 152 (51.2%) | 145 (48.8%) |
| 5 to 9 Unit Apartments | 67 (24.9%) | 202 (75.1%) |
| 10 or more Apartments | 17 (7.2%) | 218 (92.8%) |
| Mobile Home / Other | 423 (64.2%) | 236 (35.8%) |
| Total | 4,247 (72.3%) | 1,629 (27.7%) |
Housing Structures by Number of Rooms in Jensen Beach
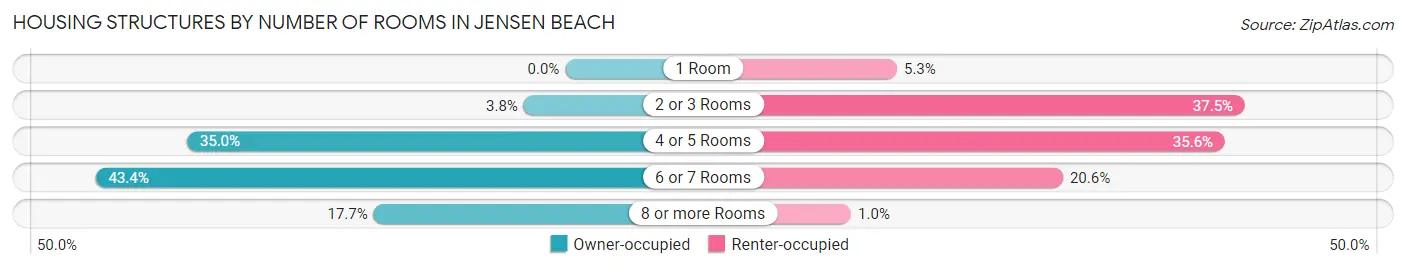
| Number of Rooms | Owner-occupied | Renter-occupied |
| 1 Room | 0 (0.0%) | 86 (5.3%) |
| 2 or 3 Rooms | 163 (3.8%) | 610 (37.4%) |
| 4 or 5 Rooms | 1,486 (35.0%) | 580 (35.6%) |
| 6 or 7 Rooms | 1,845 (43.4%) | 336 (20.6%) |
| 8 or more Rooms | 753 (17.7%) | 17 (1.0%) |
| Total | 4,247 (100.0%) | 1,629 (100.0%) |
Housing Structure by Heating Type in Jensen Beach
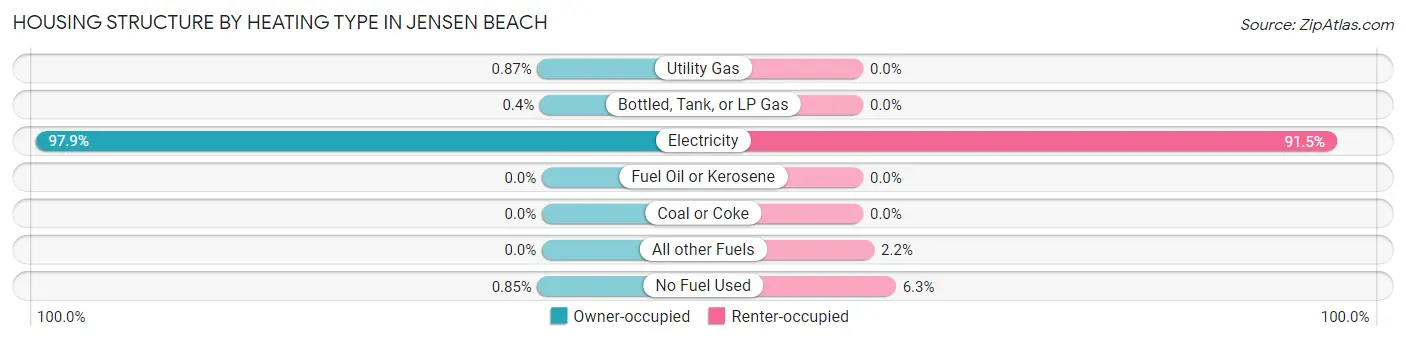
| Heating Type | Owner-occupied | Renter-occupied |
| Utility Gas | 37 (0.9%) | 0 (0.0%) |
| Bottled, Tank, or LP Gas | 17 (0.4%) | 0 (0.0%) |
| Electricity | 4,157 (97.9%) | 1,491 (91.5%) |
| Fuel Oil or Kerosene | 0 (0.0%) | 0 (0.0%) |
| Coal or Coke | 0 (0.0%) | 0 (0.0%) |
| All other Fuels | 0 (0.0%) | 35 (2.1%) |
| No Fuel Used | 36 (0.9%) | 103 (6.3%) |
| Total | 4,247 (100.0%) | 1,629 (100.0%) |
Household Vehicle Usage in Jensen Beach
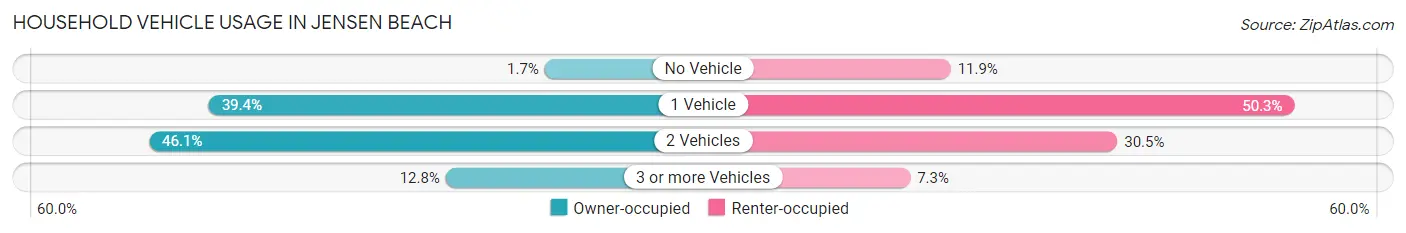
| Vehicles per Household | Owner-occupied | Renter-occupied |
| No Vehicle | 74 (1.7%) | 193 (11.8%) |
| 1 Vehicle | 1,672 (39.4%) | 820 (50.3%) |
| 2 Vehicles | 1,956 (46.1%) | 497 (30.5%) |
| 3 or more Vehicles | 545 (12.8%) | 119 (7.3%) |
| Total | 4,247 (100.0%) | 1,629 (100.0%) |
Real Estate & Mortgages in Jensen Beach
Real Estate and Mortgage Overview in Jensen Beach
| Characteristic | Without Mortgage | With Mortgage |
| Housing Units | 2,201 | 2,046 |
| Median Property Value | $245,900 | $382,400 |
| Median Household Income | $58,464 | $514 |
| Monthly Housing Costs | $651 | $306 |
| Real Estate Taxes | $2,534 | $18 |
Property Value by Mortgage Status in Jensen Beach
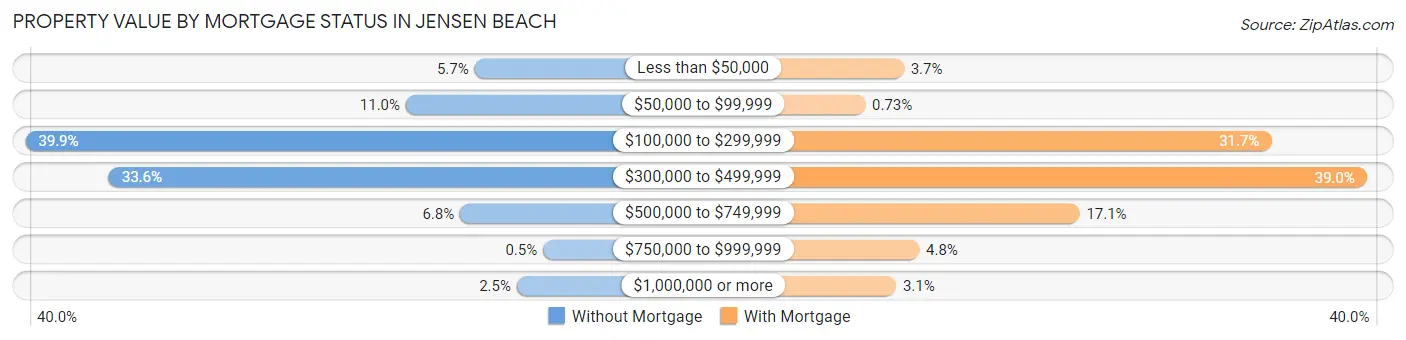
| Property Value | Without Mortgage | With Mortgage |
| Less than $50,000 | 126 (5.7%) | 75 (3.7%) |
| $50,000 to $99,999 | 241 (11.0%) | 15 (0.7%) |
| $100,000 to $299,999 | 879 (39.9%) | 648 (31.7%) |
| $300,000 to $499,999 | 739 (33.6%) | 797 (39.0%) |
| $500,000 to $749,999 | 150 (6.8%) | 349 (17.1%) |
| $750,000 to $999,999 | 11 (0.5%) | 99 (4.8%) |
| $1,000,000 or more | 55 (2.5%) | 63 (3.1%) |
| Total | 2,201 (100.0%) | 2,046 (100.0%) |
Household Income by Mortgage Status in Jensen Beach
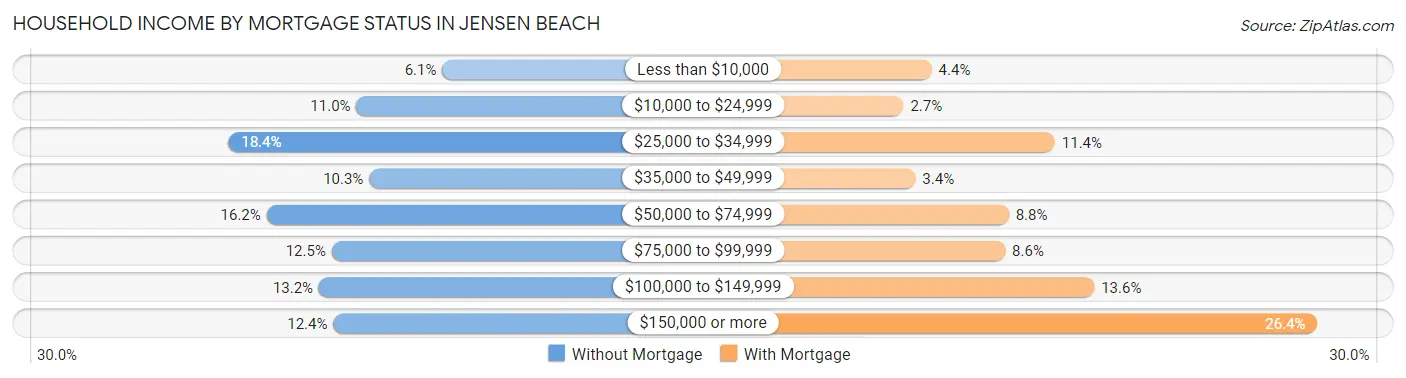
| Household Income | Without Mortgage | With Mortgage |
| Less than $10,000 | 135 (6.1%) | 89 (4.3%) |
| $10,000 to $24,999 | 243 (11.0%) | 56 (2.7%) |
| $25,000 to $34,999 | 404 (18.4%) | 233 (11.4%) |
| $35,000 to $49,999 | 227 (10.3%) | 70 (3.4%) |
| $50,000 to $74,999 | 356 (16.2%) | 179 (8.7%) |
| $75,000 to $99,999 | 274 (12.4%) | 175 (8.6%) |
| $100,000 to $149,999 | 290 (13.2%) | 279 (13.6%) |
| $150,000 or more | 272 (12.4%) | 540 (26.4%) |
| Total | 2,201 (100.0%) | 2,046 (100.0%) |
Property Value to Household Income Ratio in Jensen Beach
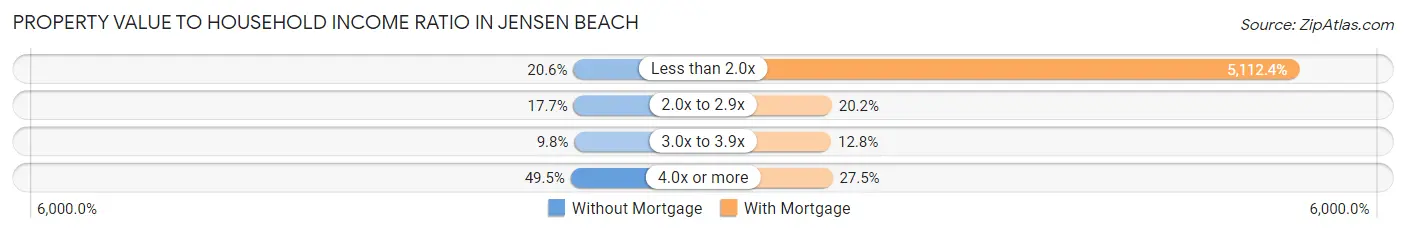
| Value-to-Income Ratio | Without Mortgage | With Mortgage |
| Less than 2.0x | 453 (20.6%) | 104,600 (5,112.4%) |
| 2.0x to 2.9x | 390 (17.7%) | 413 (20.2%) |
| 3.0x to 3.9x | 215 (9.8%) | 261 (12.8%) |
| 4.0x or more | 1,090 (49.5%) | 563 (27.5%) |
| Total | 2,201 (100.0%) | 2,046 (100.0%) |
Real Estate Taxes by Mortgage Status in Jensen Beach
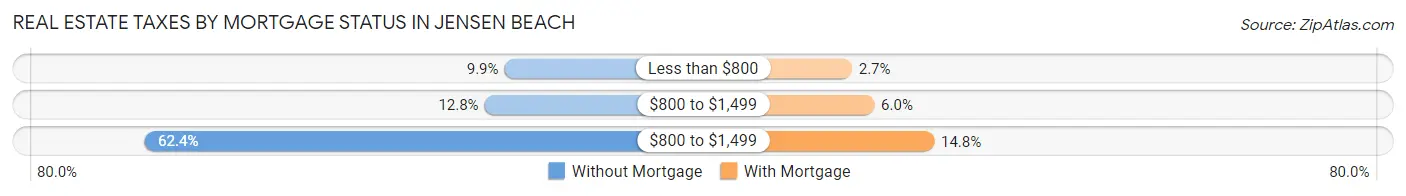
| Property Taxes | Without Mortgage | With Mortgage |
| Less than $800 | 218 (9.9%) | 56 (2.7%) |
| $800 to $1,499 | 282 (12.8%) | 123 (6.0%) |
| $800 to $1,499 | 1,373 (62.4%) | 302 (14.8%) |
| Total | 2,201 (100.0%) | 2,046 (100.0%) |
Health & Disability in Jensen Beach
Health Insurance Coverage by Age in Jensen Beach
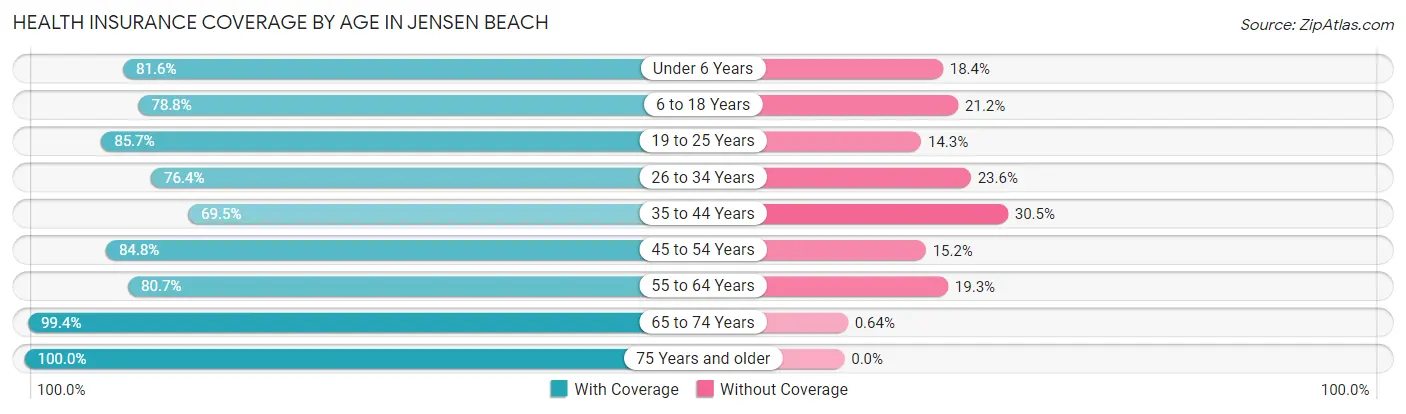
| Age Bracket | With Coverage | Without Coverage |
| Under 6 Years | 351 (81.6%) | 79 (18.4%) |
| 6 to 18 Years | 1,281 (78.8%) | 345 (21.2%) |
| 19 to 25 Years | 461 (85.7%) | 77 (14.3%) |
| 26 to 34 Years | 904 (76.4%) | 279 (23.6%) |
| 35 to 44 Years | 1,028 (69.5%) | 451 (30.5%) |
| 45 to 54 Years | 1,078 (84.8%) | 193 (15.2%) |
| 55 to 64 Years | 1,983 (80.7%) | 475 (19.3%) |
| 65 to 74 Years | 1,716 (99.4%) | 11 (0.6%) |
| 75 Years and older | 1,768 (100.0%) | 0 (0.0%) |
| Total | 10,570 (84.7%) | 1,910 (15.3%) |
Health Insurance Coverage by Citizenship Status in Jensen Beach
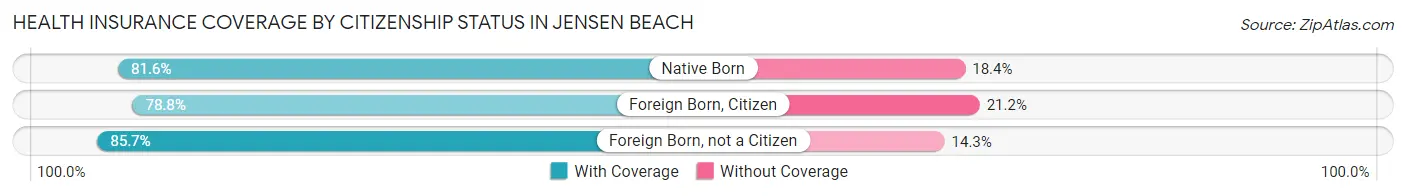
| Citizenship Status | With Coverage | Without Coverage |
| Native Born | 351 (81.6%) | 79 (18.4%) |
| Foreign Born, Citizen | 1,281 (78.8%) | 345 (21.2%) |
| Foreign Born, not a Citizen | 461 (85.7%) | 77 (14.3%) |
Health Insurance Coverage by Household Income in Jensen Beach
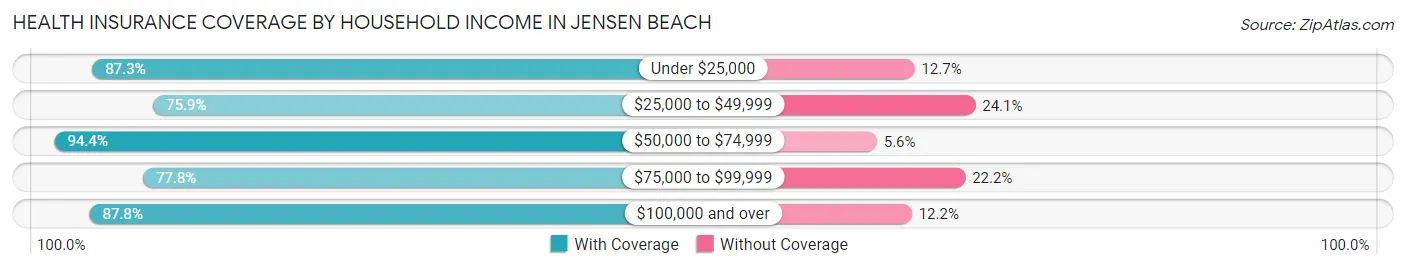
| Household Income | With Coverage | Without Coverage |
| Under $25,000 | 1,253 (87.3%) | 182 (12.7%) |
| $25,000 to $49,999 | 2,202 (75.9%) | 698 (24.1%) |
| $50,000 to $74,999 | 1,462 (94.4%) | 87 (5.6%) |
| $75,000 to $99,999 | 1,123 (77.8%) | 320 (22.2%) |
| $100,000 and over | 4,481 (87.8%) | 621 (12.2%) |
Public vs Private Health Insurance Coverage by Age in Jensen Beach
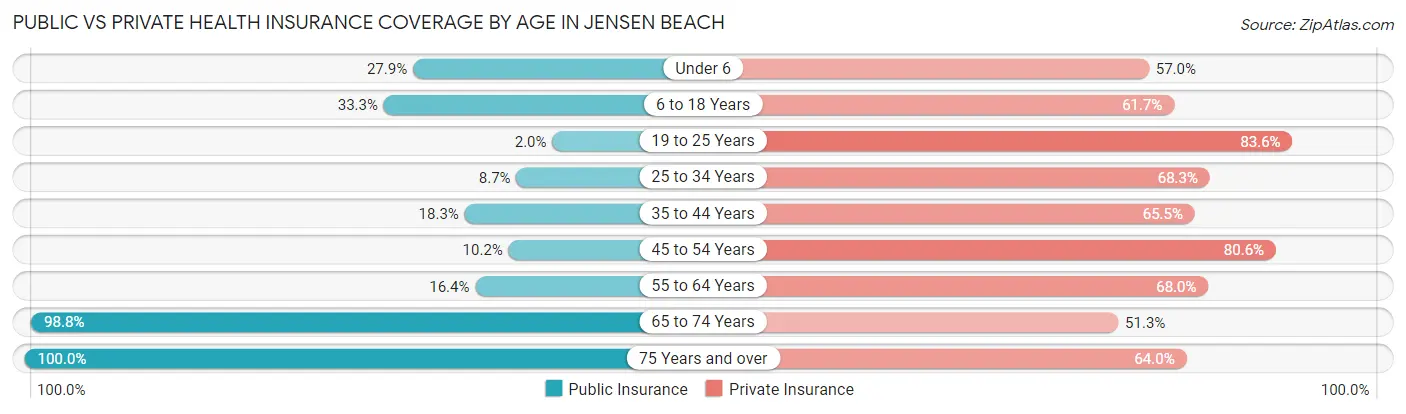
| Age Bracket | Public Insurance | Private Insurance |
| Under 6 | 120 (27.9%) | 245 (57.0%) |
| 6 to 18 Years | 542 (33.3%) | 1,003 (61.7%) |
| 19 to 25 Years | 11 (2.0%) | 450 (83.6%) |
| 25 to 34 Years | 103 (8.7%) | 808 (68.3%) |
| 35 to 44 Years | 271 (18.3%) | 969 (65.5%) |
| 45 to 54 Years | 129 (10.2%) | 1,024 (80.6%) |
| 55 to 64 Years | 402 (16.4%) | 1,672 (68.0%) |
| 65 to 74 Years | 1,706 (98.8%) | 886 (51.3%) |
| 75 Years and over | 1,768 (100.0%) | 1,131 (64.0%) |
| Total | 5,052 (40.5%) | 8,188 (65.6%) |
Disability Status by Sex by Age in Jensen Beach
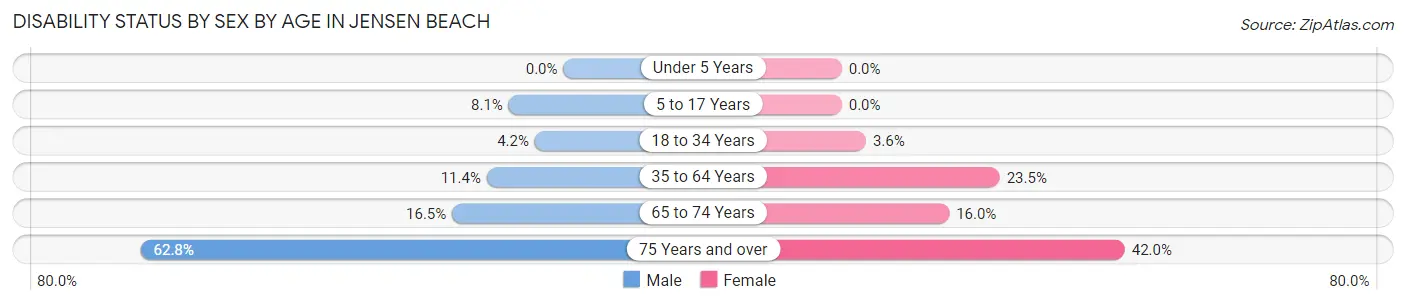
| Age Bracket | Male | Female |
| Under 5 Years | 0 (0.0%) | 0 (0.0%) |
| 5 to 17 Years | 69 (8.1%) | 0 (0.0%) |
| 18 to 34 Years | 35 (4.2%) | 34 (3.6%) |
| 35 to 64 Years | 321 (11.4%) | 560 (23.4%) |
| 65 to 74 Years | 131 (16.5%) | 149 (16.0%) |
| 75 Years and over | 381 (62.8%) | 488 (42.0%) |
Disability Class by Sex by Age in Jensen Beach
Disability Class: Hearing Difficulty
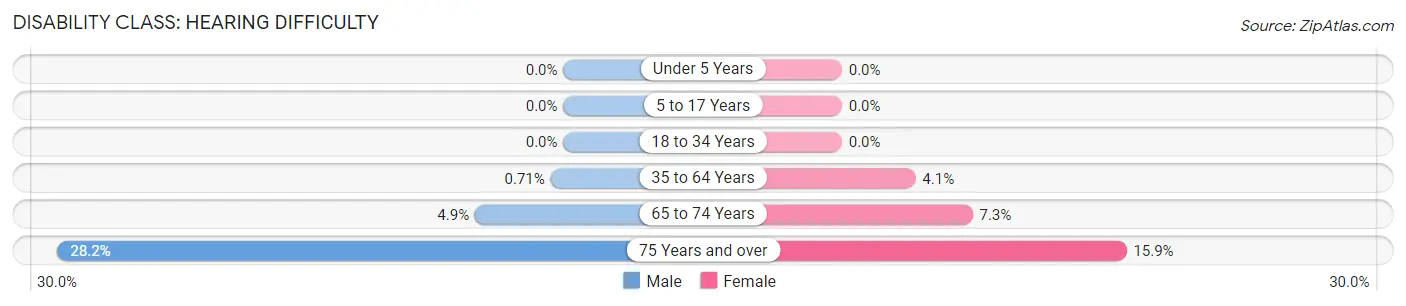
| Age Bracket | Male | Female |
| Under 5 Years | 0 (0.0%) | 0 (0.0%) |
| 5 to 17 Years | 0 (0.0%) | 0 (0.0%) |
| 18 to 34 Years | 0 (0.0%) | 0 (0.0%) |
| 35 to 64 Years | 20 (0.7%) | 98 (4.1%) |
| 65 to 74 Years | 39 (4.9%) | 68 (7.3%) |
| 75 Years and over | 171 (28.2%) | 184 (15.9%) |
Disability Class: Vision Difficulty
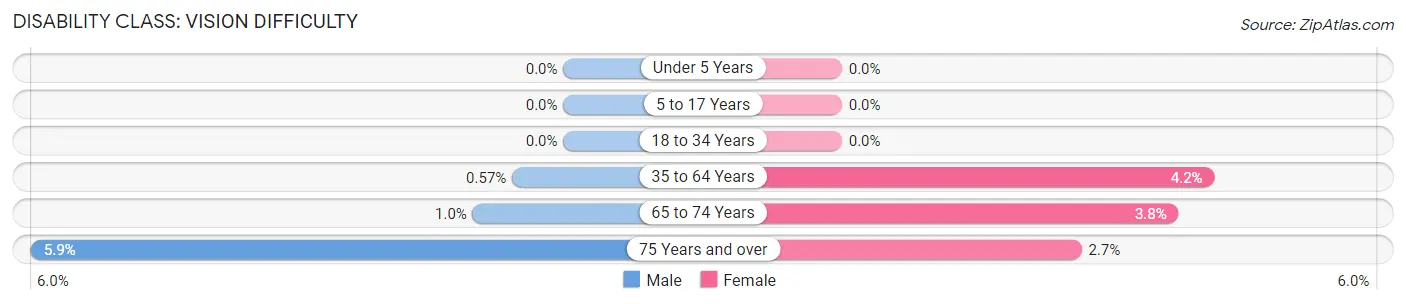
| Age Bracket | Male | Female |
| Under 5 Years | 0 (0.0%) | 0 (0.0%) |
| 5 to 17 Years | 0 (0.0%) | 0 (0.0%) |
| 18 to 34 Years | 0 (0.0%) | 0 (0.0%) |
| 35 to 64 Years | 16 (0.6%) | 99 (4.2%) |
| 65 to 74 Years | 8 (1.0%) | 35 (3.7%) |
| 75 Years and over | 36 (5.9%) | 31 (2.7%) |
Disability Class: Cognitive Difficulty
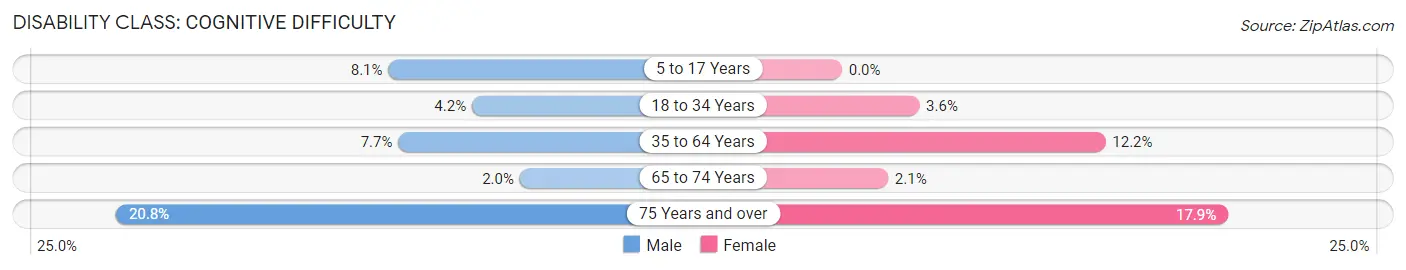
| Age Bracket | Male | Female |
| 5 to 17 Years | 69 (8.1%) | 0 (0.0%) |
| 18 to 34 Years | 35 (4.2%) | 34 (3.6%) |
| 35 to 64 Years | 216 (7.7%) | 292 (12.2%) |
| 65 to 74 Years | 16 (2.0%) | 20 (2.1%) |
| 75 Years and over | 126 (20.8%) | 208 (17.9%) |
Disability Class: Ambulatory Difficulty
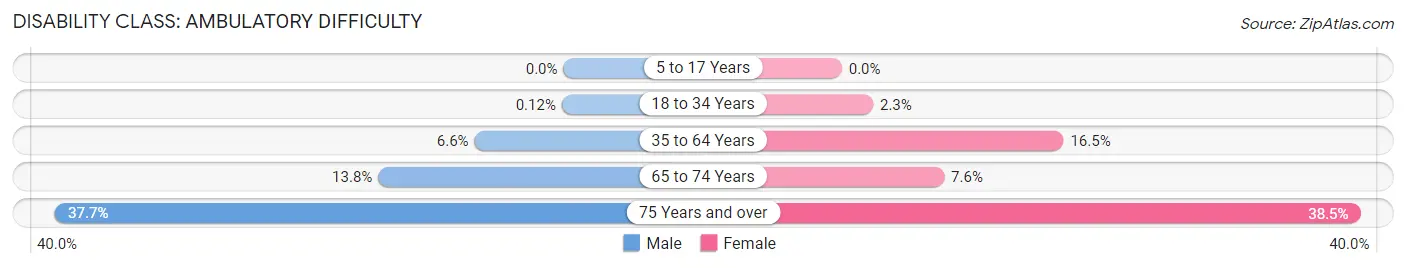
| Age Bracket | Male | Female |
| 5 to 17 Years | 0 (0.0%) | 0 (0.0%) |
| 18 to 34 Years | 1 (0.1%) | 22 (2.3%) |
| 35 to 64 Years | 186 (6.6%) | 393 (16.5%) |
| 65 to 74 Years | 109 (13.8%) | 71 (7.6%) |
| 75 Years and over | 229 (37.7%) | 447 (38.5%) |
Disability Class: Self-Care Difficulty
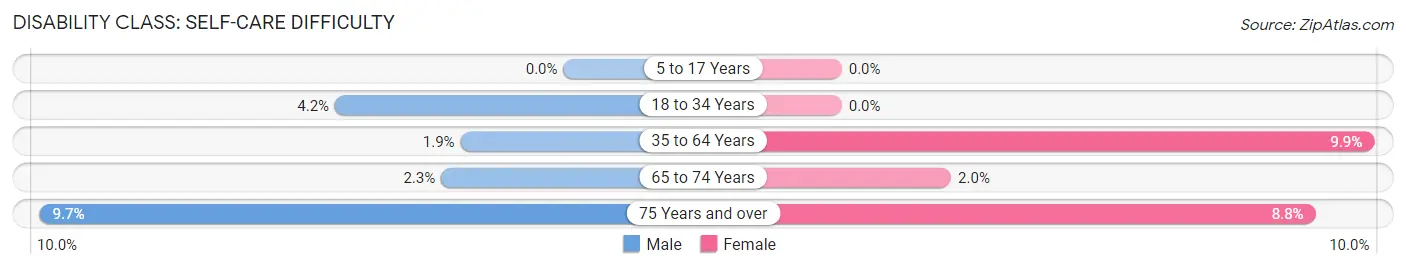
| Age Bracket | Male | Female |
| 5 to 17 Years | 0 (0.0%) | 0 (0.0%) |
| 18 to 34 Years | 35 (4.2%) | 0 (0.0%) |
| 35 to 64 Years | 54 (1.9%) | 236 (9.9%) |
| 65 to 74 Years | 18 (2.3%) | 19 (2.0%) |
| 75 Years and over | 59 (9.7%) | 102 (8.8%) |
Technology Access in Jensen Beach
Computing Device Access in Jensen Beach
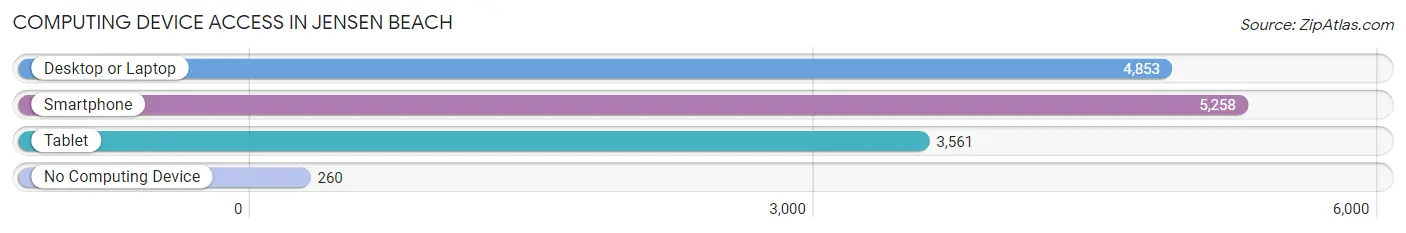
| Device Type | # Households | % Households |
| Desktop or Laptop | 4,853 | 82.6% |
| Smartphone | 5,258 | 89.5% |
| Tablet | 3,561 | 60.6% |
| No Computing Device | 260 | 4.4% |
| Total | 5,876 | 100.0% |
Internet Access in Jensen Beach
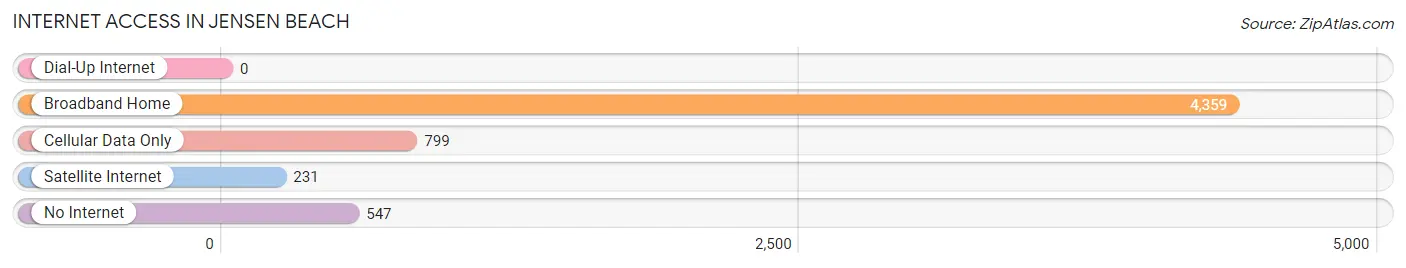
| Internet Type | # Households | % Households |
| Dial-Up Internet | 0 | 0.0% |
| Broadband Home | 4,359 | 74.2% |
| Cellular Data Only | 799 | 13.6% |
| Satellite Internet | 231 | 3.9% |
| No Internet | 547 | 9.3% |
| Total | 5,876 | 100.0% |
Jensen Beach Summary
Jensen Beach is a small town located in Martin County, Florida. It is situated on the east coast of the state, just north of Stuart and south of Port St. Lucie. The town is known for its beautiful beaches, fishing, and outdoor activities.
Geography
Jensen Beach is located on the east coast of Florida, just north of Stuart and south of Port St. Lucie. The town is situated on the Indian River Lagoon, which is part of the Intracoastal Waterway. The town is bordered by the Atlantic Ocean to the east and the St. Lucie River to the west. The town is located in a tropical climate, with hot and humid summers and mild winters.
History
Jensen Beach was first settled in the late 1800s by a group of settlers from Denmark. The town was named after the Danish settler, Hans Jensen, who was the first to settle in the area. The town was incorporated in 1925 and has since grown to become a popular tourist destination.
Economy
Jensen Beach is a popular tourist destination, and the town’s economy is largely based on tourism. The town is home to several resorts, hotels, and restaurants, as well as a variety of shops and boutiques. The town is also home to a number of marinas, which offer boat rentals and fishing charters.
Demographics
As of the 2010 census, the population of Jensen Beach was 11,707. The population is predominantly white (90.2%), with a small percentage of African Americans (3.2%), Hispanics (2.7%), and Asians (1.7%). The median household income is $45,845, and the median age is 44.
Jensen Beach is a small town with a rich history and a vibrant economy. The town is known for its beautiful beaches, fishing, and outdoor activities, and is a popular tourist destination. The town is home to a diverse population, and the economy is largely based on tourism.
Common Questions
What is Per Capita Income in Jensen Beach?
Per Capita income in Jensen Beach is $46,431.
What is the Median Family Income in Jensen Beach?
Median Family Income in Jensen Beach is $91,993.
What is the Median Household income in Jensen Beach?
Median Household Income in Jensen Beach is $62,699.
What is Income or Wage Gap in Jensen Beach?
Income or Wage Gap in Jensen Beach is 16.6%.
Women in Jensen Beach earn 83.4 cents for every dollar earned by a man.
What is Family Income Deficit in Jensen Beach?
Family Income Deficit in Jensen Beach is $5,151.
Families that are below poverty line in Jensen Beach earn $5,151 less on average than the poverty threshold level.
What is Inequality or Gini Index in Jensen Beach?
Inequality or Gini Index in Jensen Beach is 0.52.
What is the Total Population of Jensen Beach?
Total Population of Jensen Beach is 12,581.
What is the Total Male Population of Jensen Beach?
Total Male Population of Jensen Beach is 6,074.
What is the Total Female Population of Jensen Beach?
Total Female Population of Jensen Beach is 6,507.
What is the Ratio of Males per 100 Females in Jensen Beach?
There are 93.35 Males per 100 Females in Jensen Beach.
What is the Ratio of Females per 100 Males in Jensen Beach?
There are 107.13 Females per 100 Males in Jensen Beach.
What is the Median Population Age in Jensen Beach?
Median Population Age in Jensen Beach is 53.7 Years.
What is the Average Family Size in Jensen Beach
Average Family Size in Jensen Beach is 3.0 People.
What is the Average Household Size in Jensen Beach
Average Household Size in Jensen Beach is 2.1 People.
How Large is the Labor Force in Jensen Beach?
There are 5,571 People in the Labor Forcein in Jensen Beach.
What is the Percentage of People in the Labor Force in Jensen Beach?
50.6% of People are in the Labor Force in Jensen Beach.
What is the Unemployment Rate in Jensen Beach?
Unemployment Rate in Jensen Beach is 4.8%.