Indiantown, FL Map & Demographics
Indiantown Map
Indiantown Overview
$16,685
PER CAPITA INCOME
$45,757
AVG FAMILY INCOME
$47,627
AVG HOUSEHOLD INCOME
4.1%
WAGE / INCOME GAP [ % ]
95.9¢/ $1
WAGE / INCOME GAP [ $ ]
0.39
INEQUALITY / GINI INDEX
6,624
TOTAL POPULATION
3,378
MALE POPULATION
3,246
FEMALE POPULATION
104.07
MALES / 100 FEMALES
96.09
FEMALES / 100 MALES
31.3
MEDIAN AGE
3.9
AVG FAMILY SIZE
3.4
AVG HOUSEHOLD SIZE
2,700
LABOR FORCE [ PEOPLE ]
57.0%
PERCENT IN LABOR FORCE
3.2%
UNEMPLOYMENT RATE
Indiantown Zip Codes
Indiantown Area Codes
Income in Indiantown
Income Overview in Indiantown
Per Capita Income in Indiantown is $16,685, while median incomes of families and households are $45,757 and $47,627 respectively.
| Characteristic | Number | Measure |
| Per Capita Income | 6,624 | $16,685 |
| Median Family Income | 1,393 | $45,757 |
| Mean Family Income | 1,393 | $53,155 |
| Median Household Income | 1,940 | $47,627 |
| Mean Household Income | 1,940 | $54,336 |
| Income Deficit | 1,393 | $0 |
| Wage / Income Gap (%) | 6,624 | 4.10% |
| Wage / Income Gap ($) | 6,624 | 95.90¢ per $1 |
| Gini / Inequality Index | 6,624 | 0.39 |
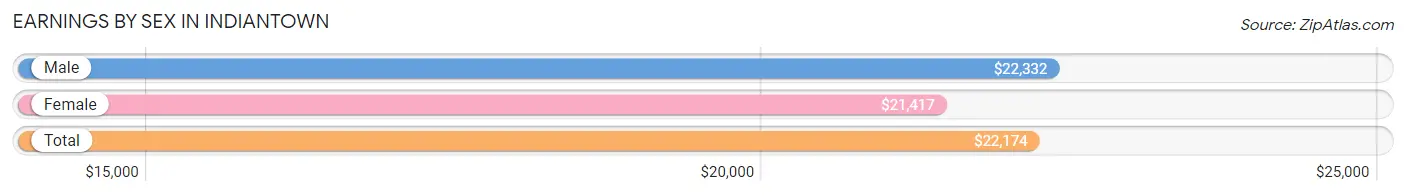
Earnings by Sex in Indiantown
Average Earnings in Indiantown are $22,174, $22,332 for men and $21,417 for women, a difference of 4.1%.
| Sex | Number | Average Earnings |
| Male | 1,529 (57.8%) | $22,332 |
| Female | 1,115 (42.2%) | $21,417 |
| Total | 2,644 (100.0%) | $22,174 |
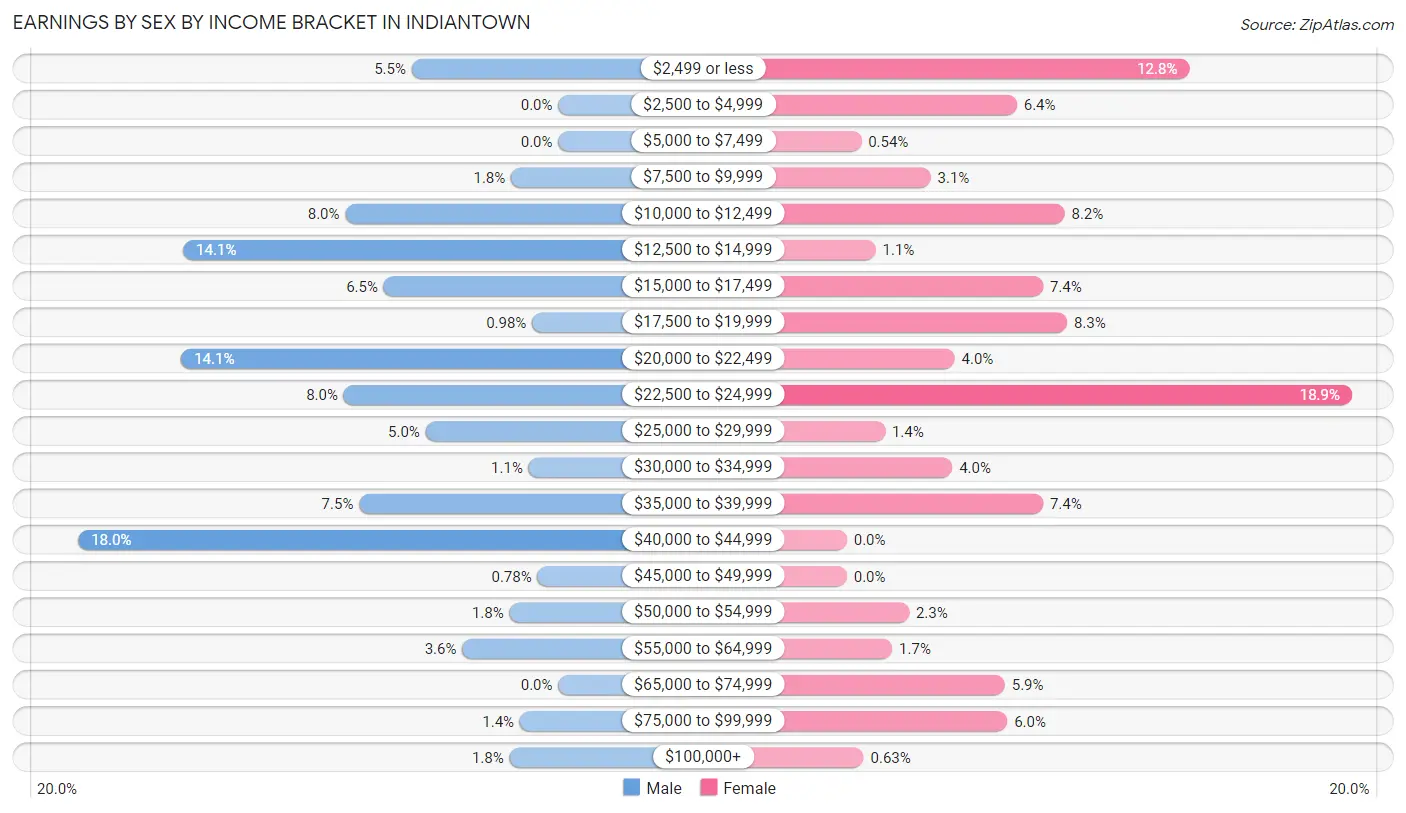
Earnings by Sex by Income Bracket in Indiantown
The most common earnings brackets in Indiantown are $40,000 to $44,999 for men (275 | 18.0%) and $22,500 to $24,999 for women (211 | 18.9%).
| Income | Male | Female |
| $2,499 or less | 84 (5.5%) | 143 (12.8%) |
| $2,500 to $4,999 | 0 (0.0%) | 71 (6.4%) |
| $5,000 to $7,499 | 0 (0.0%) | 6 (0.5%) |
| $7,500 to $9,999 | 27 (1.8%) | 35 (3.1%) |
| $10,000 to $12,499 | 122 (8.0%) | 91 (8.2%) |
| $12,500 to $14,999 | 215 (14.1%) | 12 (1.1%) |
| $15,000 to $17,499 | 100 (6.5%) | 82 (7.3%) |
| $17,500 to $19,999 | 15 (1.0%) | 92 (8.3%) |
| $20,000 to $22,499 | 216 (14.1%) | 45 (4.0%) |
| $22,500 to $24,999 | 123 (8.0%) | 211 (18.9%) |
| $25,000 to $29,999 | 76 (5.0%) | 16 (1.4%) |
| $30,000 to $34,999 | 17 (1.1%) | 44 (4.0%) |
| $35,000 to $39,999 | 114 (7.5%) | 82 (7.3%) |
| $40,000 to $44,999 | 275 (18.0%) | 0 (0.0%) |
| $45,000 to $49,999 | 12 (0.8%) | 0 (0.0%) |
| $50,000 to $54,999 | 28 (1.8%) | 26 (2.3%) |
| $55,000 to $64,999 | 55 (3.6%) | 19 (1.7%) |
| $65,000 to $74,999 | 0 (0.0%) | 66 (5.9%) |
| $75,000 to $99,999 | 22 (1.4%) | 67 (6.0%) |
| $100,000+ | 28 (1.8%) | 7 (0.6%) |
| Total | 1,529 (100.0%) | 1,115 (100.0%) |
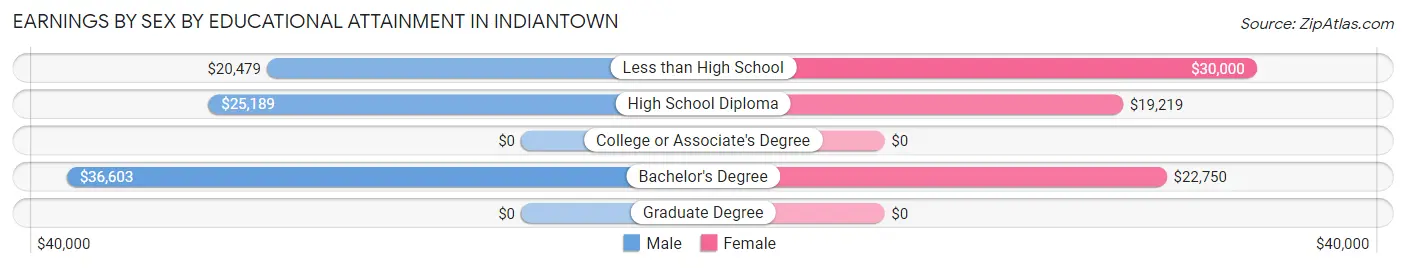
Earnings by Sex by Educational Attainment in Indiantown
Average earnings in Indiantown are $21,655 for men and $19,171 for women, a difference of 11.5%. Men with an educational attainment of bachelor's degree enjoy the highest average annual earnings of $36,603, while those with less than high school education earn the least with $20,479. Women with an educational attainment of less than high school earn the most with the average annual earnings of $30,000, while those with high school diploma education have the smallest earnings of $19,219.
| Educational Attainment | Male Income | Female Income |
| Less than High School | $20,479 | $30,000 |
| High School Diploma | $25,189 | $19,219 |
| College or Associate's Degree | - | - |
| Bachelor's Degree | $36,603 | $22,750 |
| Graduate Degree | - | - |
| Total | $21,655 | $19,171 |
Family Income in Indiantown
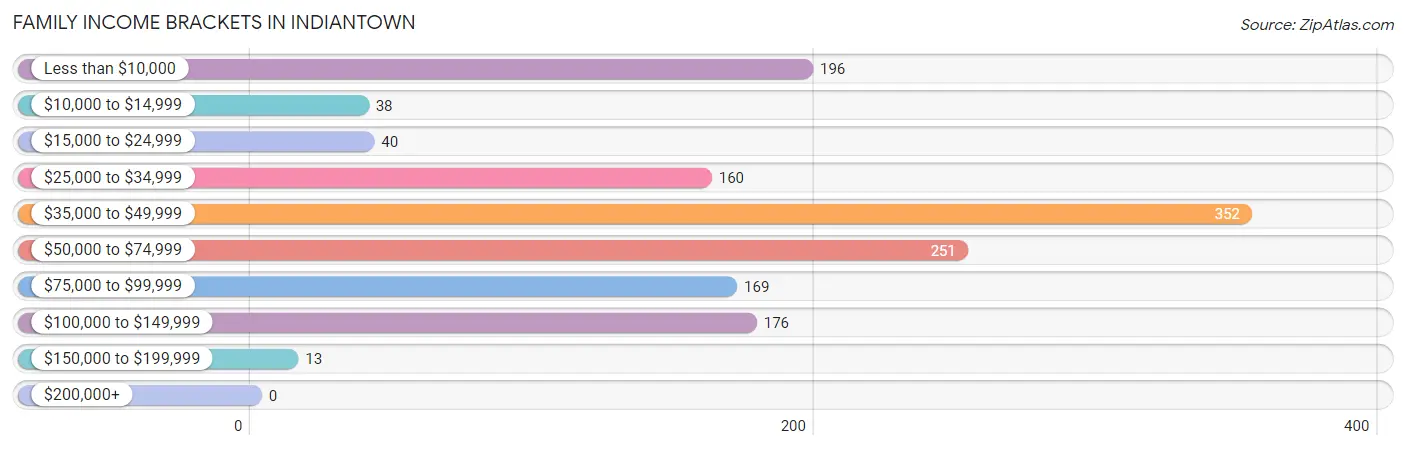
Family Income Brackets in Indiantown
According to the Indiantown family income data, there are 352 families falling into the $35,000 to $49,999 income range, which is the most common income bracket and makes up 25.3% of all families.
| Income Bracket | # Families | % Families |
| Less than $10,000 | 196 | 14.1% |
| $10,000 to $14,999 | 38 | 2.7% |
| $15,000 to $24,999 | 40 | 2.9% |
| $25,000 to $34,999 | 160 | 11.5% |
| $35,000 to $49,999 | 352 | 25.3% |
| $50,000 to $74,999 | 251 | 18.0% |
| $75,000 to $99,999 | 169 | 12.1% |
| $100,000 to $149,999 | 176 | 12.6% |
| $150,000 to $199,999 | 13 | 0.9% |
| $200,000+ | 0 | 0.0% |
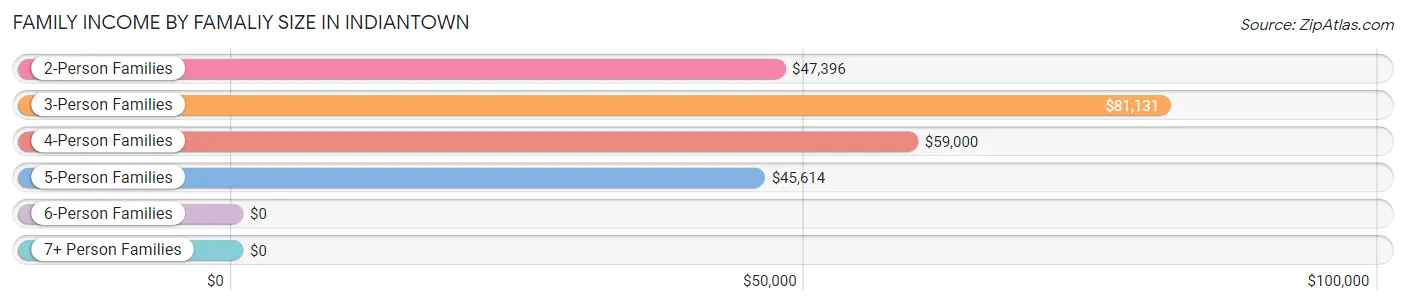
Family Income by Famaliy Size in Indiantown
3-person families (295 | 21.2%) account for the highest median family income in Indiantown with $81,131 per family, while 3-person families (295 | 21.2%) have the highest median income of $27,044 per family member.
| Income Bracket | # Families | Median Income |
| 2-Person Families | 523 (37.5%) | $47,396 |
| 3-Person Families | 295 (21.2%) | $81,131 |
| 4-Person Families | 186 (13.4%) | $59,000 |
| 5-Person Families | 109 (7.8%) | $45,614 |
| 6-Person Families | 196 (14.1%) | $0 |
| 7+ Person Families | 84 (6.0%) | $0 |
| Total | 1,393 (100.0%) | $45,757 |
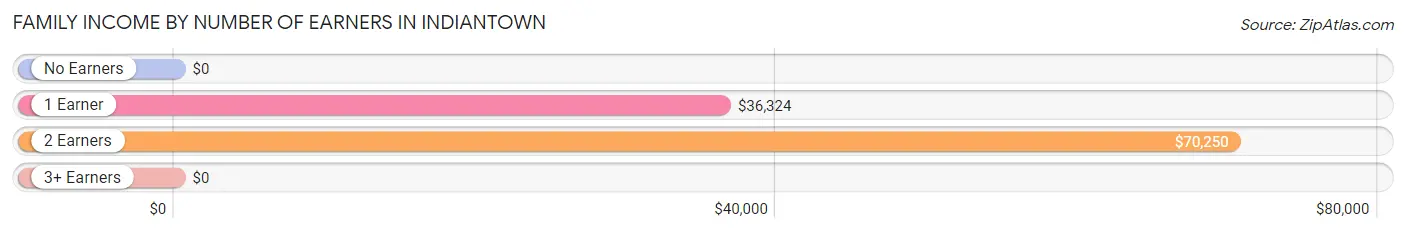
Family Income by Number of Earners in Indiantown
| Number of Earners | # Families | Median Income |
| No Earners | 242 (17.4%) | $0 |
| 1 Earner | 690 (49.5%) | $36,324 |
| 2 Earners | 391 (28.1%) | $70,250 |
| 3+ Earners | 70 (5.0%) | $0 |
| Total | 1,393 (100.0%) | $45,757 |
Household Income in Indiantown
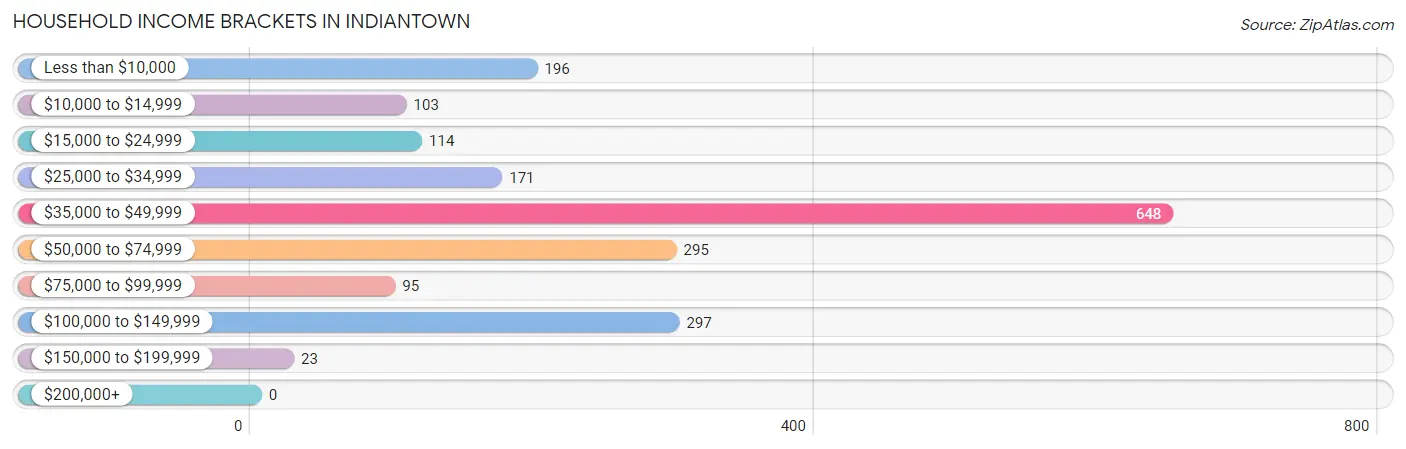
Household Income Brackets in Indiantown
With 648 households falling in the category, the $35,000 to $49,999 income range is the most frequent in Indiantown, accounting for 33.4% of all households.
| Income Bracket | # Households | % Households |
| Less than $10,000 | 196 | 10.1% |
| $10,000 to $14,999 | 103 | 5.3% |
| $15,000 to $24,999 | 114 | 5.9% |
| $25,000 to $34,999 | 171 | 8.8% |
| $35,000 to $49,999 | 648 | 33.4% |
| $50,000 to $74,999 | 295 | 15.2% |
| $75,000 to $99,999 | 95 | 4.9% |
| $100,000 to $149,999 | 297 | 15.3% |
| $150,000 to $199,999 | 23 | 1.2% |
| $200,000+ | 0 | 0.0% |
Household Income by Householder Age in Indiantown
The median household income in Indiantown is $47,627, with the highest median household income of $65,125 found in the 45 to 64 years age bracket for the primary householder. A total of 522 households (26.9%) fall into this category. Meanwhile, the 15 to 24 years age bracket for the primary householder has the lowest median household income of $0, with 48 households (2.5%) in this group.
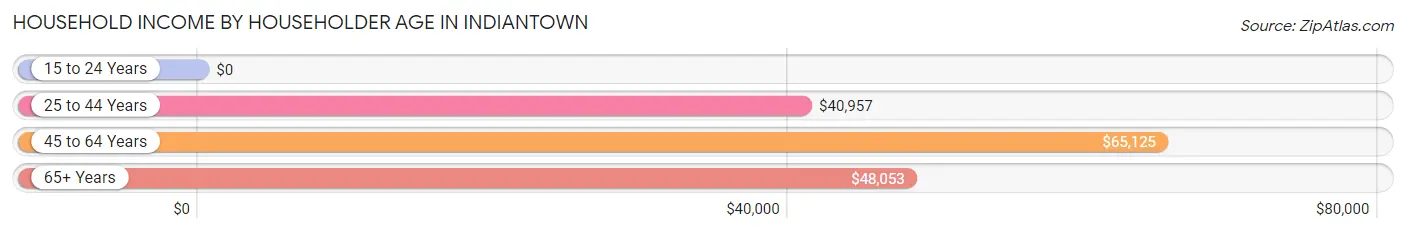
| Income Bracket | # Households | Median Income |
| 15 to 24 Years | 48 (2.5%) | $0 |
| 25 to 44 Years | 432 (22.3%) | $40,957 |
| 45 to 64 Years | 522 (26.9%) | $65,125 |
| 65+ Years | 938 (48.3%) | $48,053 |
| Total | 1,940 (100.0%) | $47,627 |
Poverty in Indiantown
Income Below Poverty by Sex and Age in Indiantown
With 27.1% poverty level for males and 38.6% for females among the residents of Indiantown, 5 year old males and under 5 year old females are the most vulnerable to poverty, with 50 males (100.0%) and 397 females (87.1%) in their respective age groups living below the poverty level.
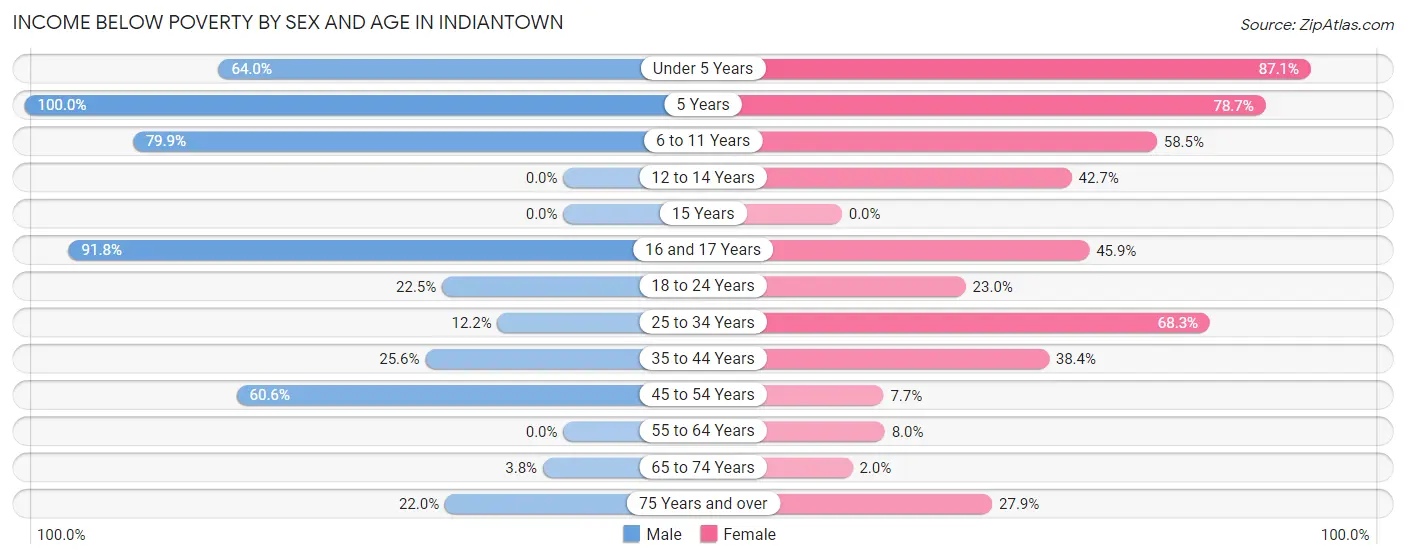
| Age Bracket | Male | Female |
| Under 5 Years | 32 (64.0%) | 397 (87.1%) |
| 5 Years | 50 (100.0%) | 70 (78.6%) |
| 6 to 11 Years | 211 (79.9%) | 69 (58.5%) |
| 12 to 14 Years | 0 (0.0%) | 180 (42.6%) |
| 15 Years | 0 (0.0%) | 0 (0.0%) |
| 16 and 17 Years | 101 (91.8%) | 45 (45.9%) |
| 18 to 24 Years | 72 (22.5%) | 83 (23.0%) |
| 25 to 34 Years | 69 (12.2%) | 207 (68.3%) |
| 35 to 44 Years | 145 (25.6%) | 73 (38.4%) |
| 45 to 54 Years | 151 (60.6%) | 16 (7.7%) |
| 55 to 64 Years | 0 (0.0%) | 22 (8.0%) |
| 65 to 74 Years | 11 (3.8%) | 8 (2.0%) |
| 75 Years and over | 67 (22.0%) | 77 (27.9%) |
| Total | 909 (27.1%) | 1,247 (38.6%) |
Income Above Poverty by Sex and Age in Indiantown
According to the poverty statistics in Indiantown, males aged 12 to 14 years and females aged 15 years are the age groups that are most secure financially, with 100.0% of males and 100.0% of females in these age groups living above the poverty line.
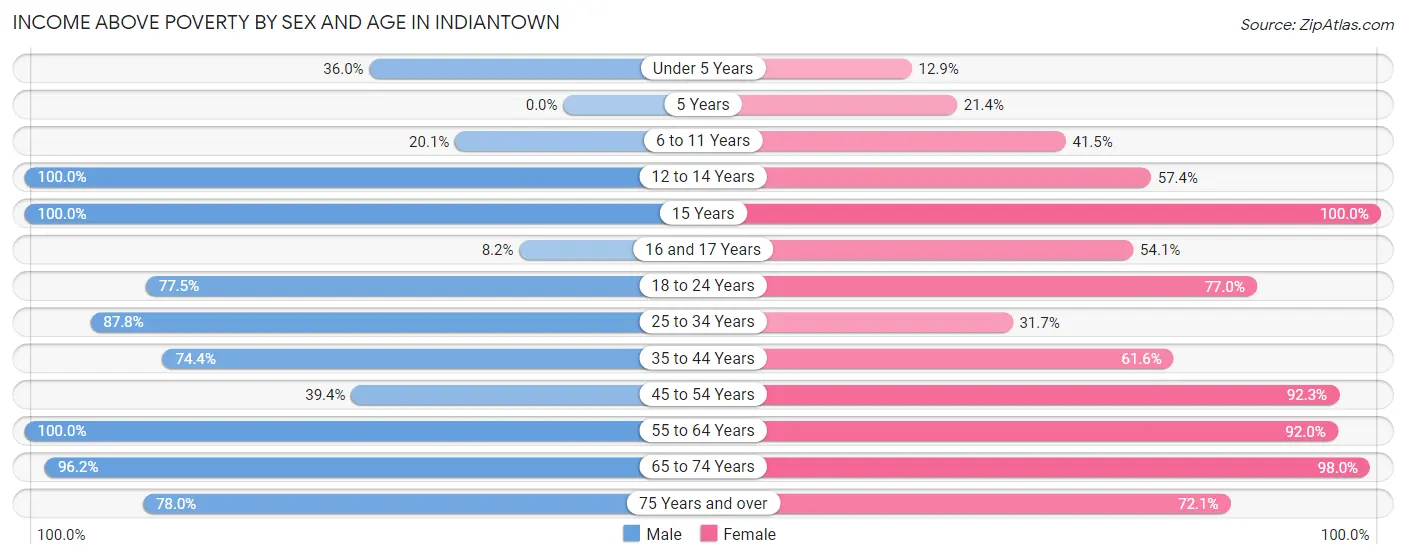
| Age Bracket | Male | Female |
| Under 5 Years | 18 (36.0%) | 59 (12.9%) |
| 5 Years | 0 (0.0%) | 19 (21.3%) |
| 6 to 11 Years | 53 (20.1%) | 49 (41.5%) |
| 12 to 14 Years | 246 (100.0%) | 242 (57.4%) |
| 15 Years | 121 (100.0%) | 34 (100.0%) |
| 16 and 17 Years | 9 (8.2%) | 53 (54.1%) |
| 18 to 24 Years | 248 (77.5%) | 278 (77.0%) |
| 25 to 34 Years | 496 (87.8%) | 96 (31.7%) |
| 35 to 44 Years | 421 (74.4%) | 117 (61.6%) |
| 45 to 54 Years | 98 (39.4%) | 191 (92.3%) |
| 55 to 64 Years | 216 (100.0%) | 254 (92.0%) |
| 65 to 74 Years | 279 (96.2%) | 396 (98.0%) |
| 75 Years and over | 238 (78.0%) | 199 (72.1%) |
| Total | 2,443 (72.9%) | 1,987 (61.4%) |
Income Below Poverty Among Married-Couple Families in Indiantown
The poverty statistics for married-couple families in Indiantown show that 19.1% or 128 of the total 671 families live below the poverty line. Families with 5 or more children have the highest poverty rate of 100.0%, comprising of 81 families. On the other hand, families with 3 or 4 children have the lowest poverty rate of 0.0%, which includes 0 families.
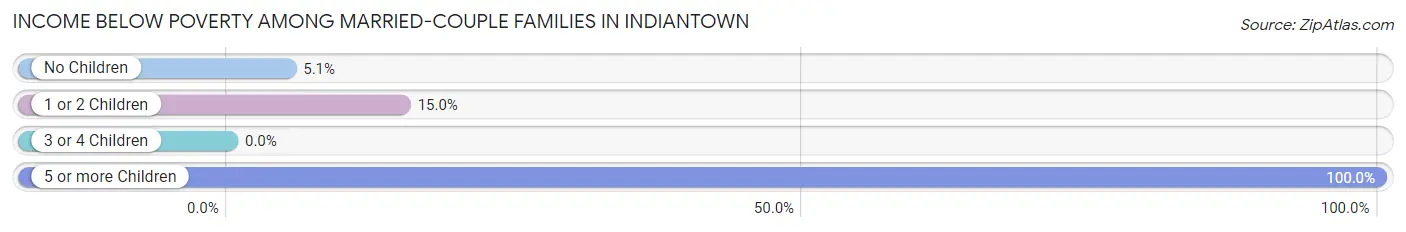
| Children | Above Poverty | Below Poverty |
| No Children | 393 (94.9%) | 21 (5.1%) |
| 1 or 2 Children | 147 (85.0%) | 26 (15.0%) |
| 3 or 4 Children | 3 (100.0%) | 0 (0.0%) |
| 5 or more Children | 0 (0.0%) | 81 (100.0%) |
| Total | 543 (80.9%) | 128 (19.1%) |
Income Below Poverty Among Single-Parent Households in Indiantown
According to the poverty data in Indiantown, 11.4% or 16 single-father households and 40.6% or 236 single-mother households are living below the poverty line. Among single-father households, those with 3 or 4 children have the highest poverty rate, with 16 households (28.6%) experiencing poverty. Likewise, among single-mother households, those with 5 or more children have the highest poverty rate, with 135 households (100.0%) falling below the poverty line.
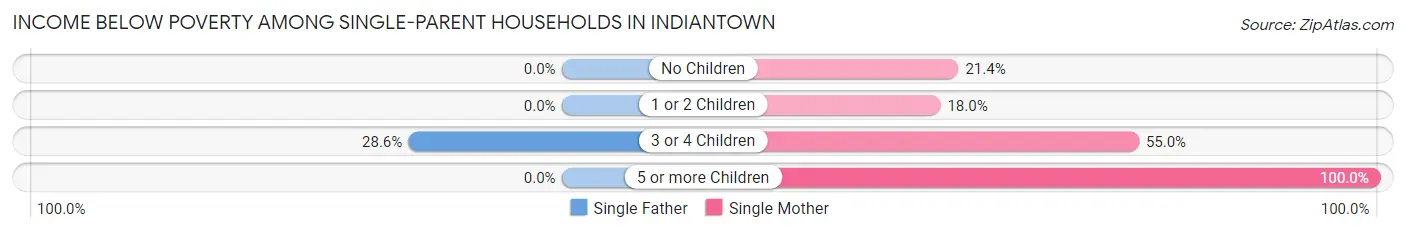
| Children | Single Father | Single Mother |
| No Children | 0 (0.0%) | 37 (21.4%) |
| 1 or 2 Children | 0 (0.0%) | 42 (18.0%) |
| 3 or 4 Children | 16 (28.6%) | 22 (55.0%) |
| 5 or more Children | 0 (0.0%) | 135 (100.0%) |
| Total | 16 (11.4%) | 236 (40.6%) |
Income Below Poverty Among Married-Couple vs Single-Parent Households in Indiantown
The poverty data for Indiantown shows that 128 of the married-couple family households (19.1%) and 252 of the single-parent households (34.9%) are living below the poverty level. Within the married-couple family households, those with 5 or more children have the highest poverty rate, with 81 households (100.0%) falling below the poverty line. Among the single-parent households, those with 5 or more children have the highest poverty rate, with 135 household (100.0%) living below poverty.
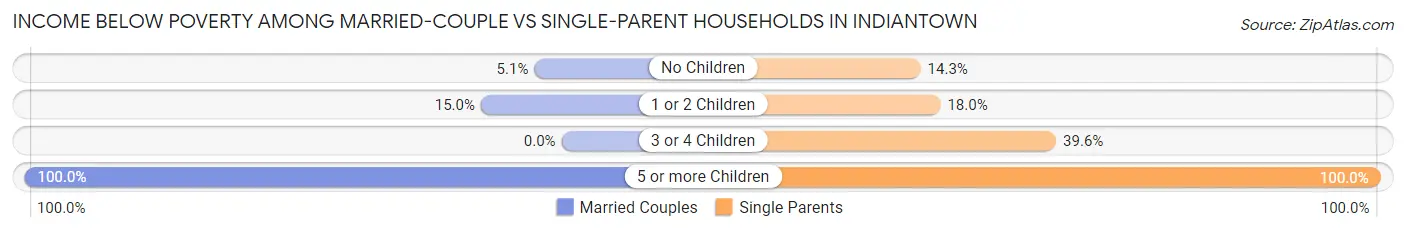
| Children | Married-Couple Families | Single-Parent Households |
| No Children | 21 (5.1%) | 37 (14.3%) |
| 1 or 2 Children | 26 (15.0%) | 42 (18.0%) |
| 3 or 4 Children | 0 (0.0%) | 38 (39.6%) |
| 5 or more Children | 81 (100.0%) | 135 (100.0%) |
| Total | 128 (19.1%) | 252 (34.9%) |
Race in Indiantown
The most populous races in Indiantown are Hispanic or Latino (3,782 | 57.1%), White / Caucasian (2,668 | 40.3%), and Black / African American (1,527 | 23.1%).
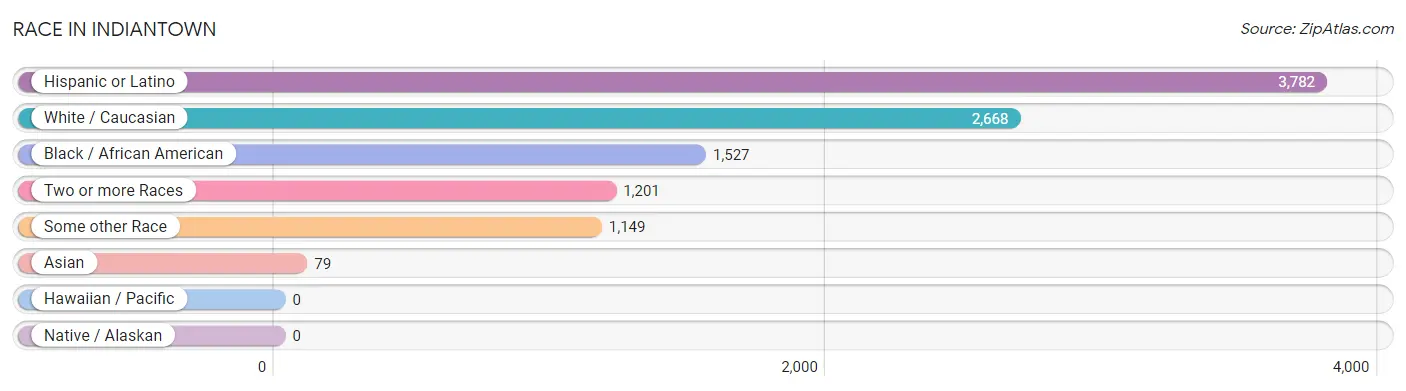
| Race | # Population | % Population |
| Asian | 79 | 1.2% |
| Black / African American | 1,527 | 23.1% |
| Hawaiian / Pacific | 0 | 0.0% |
| Hispanic or Latino | 3,782 | 57.1% |
| Native / Alaskan | 0 | 0.0% |
| White / Caucasian | 2,668 | 40.3% |
| Two or more Races | 1,201 | 18.1% |
| Some other Race | 1,149 | 17.3% |
| Total | 6,624 | 100.0% |
Ancestry in Indiantown
The most populous ancestries reported in Indiantown are Central American (1,698 | 25.6%), Guatemalan (1,474 | 22.3%), Mexican (1,287 | 19.4%), American (1,152 | 17.4%), and Puerto Rican (431 | 6.5%), together accounting for 91.2% of all Indiantown residents.
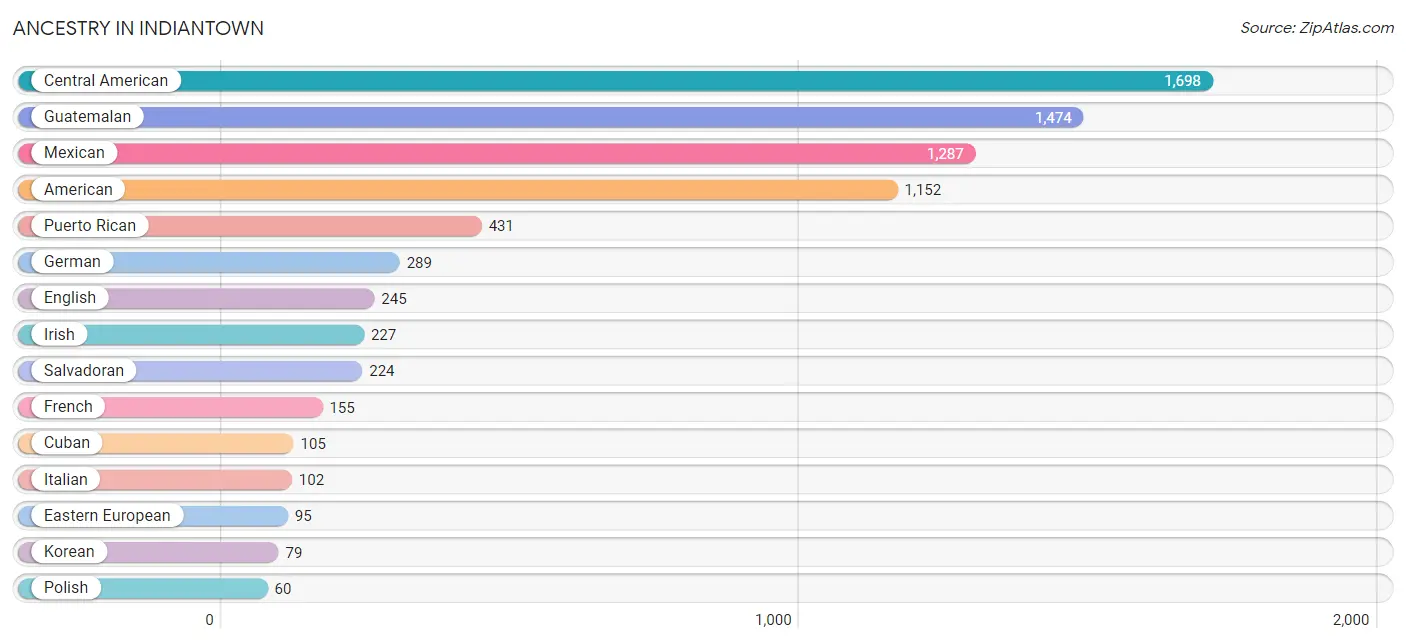
| Ancestry | # Population | % Population |
| American | 1,152 | 17.4% |
| British | 44 | 0.7% |
| Canadian | 12 | 0.2% |
| Central American | 1,698 | 25.6% |
| Colombian | 22 | 0.3% |
| Cuban | 105 | 1.6% |
| Czech | 10 | 0.2% |
| Eastern European | 95 | 1.4% |
| English | 245 | 3.7% |
| French | 155 | 2.3% |
| French Canadian | 9 | 0.1% |
| German | 289 | 4.4% |
| Guatemalan | 1,474 | 22.3% |
| Hungarian | 28 | 0.4% |
| Irish | 227 | 3.4% |
| Italian | 102 | 1.5% |
| Korean | 79 | 1.2% |
| Mexican | 1,287 | 19.4% |
| Mexican American Indian | 11 | 0.2% |
| Polish | 60 | 0.9% |
| Portuguese | 26 | 0.4% |
| Puerto Rican | 431 | 6.5% |
| Salvadoran | 224 | 3.4% |
| Scotch-Irish | 33 | 0.5% |
| Scottish | 34 | 0.5% |
| South American | 22 | 0.3% |
| Swedish | 16 | 0.2% | View All 27 Rows |
Immigrants in Indiantown
The most numerous immigrant groups reported in Indiantown came from Latin America (1,358 | 20.5%), Central America (1,245 | 18.8%), Guatemala (871 | 13.2%), Mexico (248 | 3.7%), and El Salvador (126 | 1.9%), together accounting for 58.1% of all Indiantown residents.
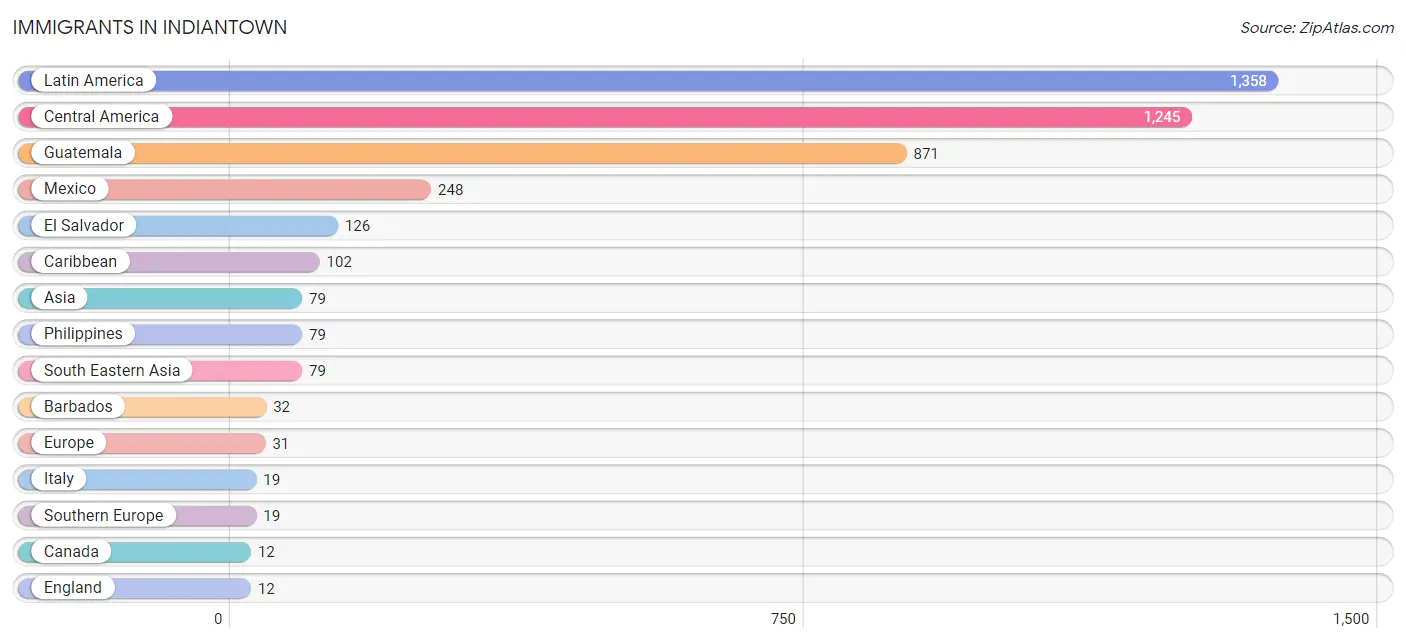
| Immigration Origin | # Population | % Population |
| Asia | 79 | 1.2% |
| Barbados | 32 | 0.5% |
| Canada | 12 | 0.2% |
| Caribbean | 102 | 1.5% |
| Central America | 1,245 | 18.8% |
| Colombia | 11 | 0.2% |
| El Salvador | 126 | 1.9% |
| England | 12 | 0.2% |
| Europe | 31 | 0.5% |
| Guatemala | 871 | 13.2% |
| Italy | 19 | 0.3% |
| Latin America | 1,358 | 20.5% |
| Mexico | 248 | 3.7% |
| Northern Europe | 12 | 0.2% |
| Philippines | 79 | 1.2% |
| South America | 11 | 0.2% |
| South Eastern Asia | 79 | 1.2% |
| Southern Europe | 19 | 0.3% | View All 18 Rows |
Sex and Age in Indiantown
Sex and Age in Indiantown
The most populous age groups in Indiantown are 40 to 44 Years (387 | 11.5%) for men and 10 to 14 Years (461 | 14.2%) for women.
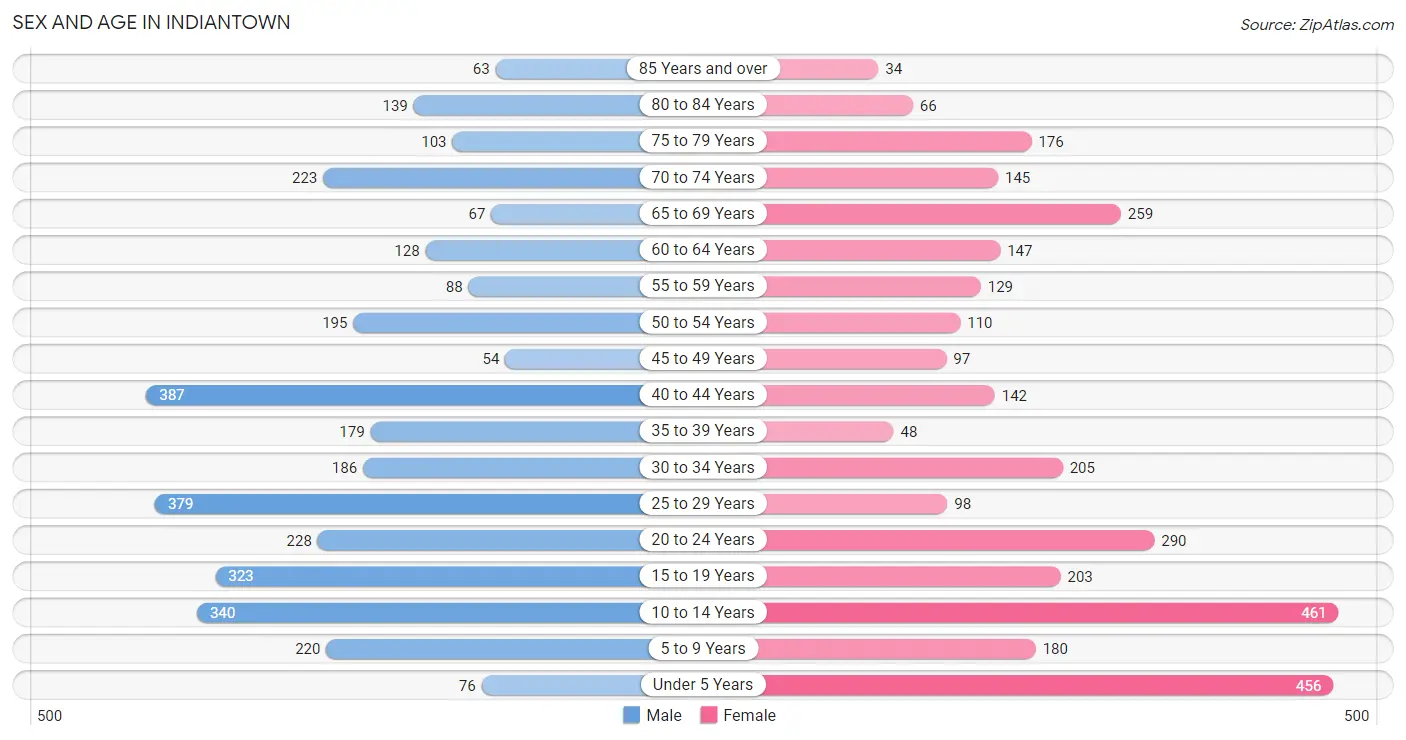
| Age Bracket | Male | Female |
| Under 5 Years | 76 (2.2%) | 456 (14.1%) |
| 5 to 9 Years | 220 (6.5%) | 180 (5.6%) |
| 10 to 14 Years | 340 (10.1%) | 461 (14.2%) |
| 15 to 19 Years | 323 (9.6%) | 203 (6.2%) |
| 20 to 24 Years | 228 (6.8%) | 290 (8.9%) |
| 25 to 29 Years | 379 (11.2%) | 98 (3.0%) |
| 30 to 34 Years | 186 (5.5%) | 205 (6.3%) |
| 35 to 39 Years | 179 (5.3%) | 48 (1.5%) |
| 40 to 44 Years | 387 (11.5%) | 142 (4.4%) |
| 45 to 49 Years | 54 (1.6%) | 97 (3.0%) |
| 50 to 54 Years | 195 (5.8%) | 110 (3.4%) |
| 55 to 59 Years | 88 (2.6%) | 129 (4.0%) |
| 60 to 64 Years | 128 (3.8%) | 147 (4.5%) |
| 65 to 69 Years | 67 (2.0%) | 259 (8.0%) |
| 70 to 74 Years | 223 (6.6%) | 145 (4.5%) |
| 75 to 79 Years | 103 (3.0%) | 176 (5.4%) |
| 80 to 84 Years | 139 (4.1%) | 66 (2.0%) |
| 85 Years and over | 63 (1.9%) | 34 (1.1%) |
| Total | 3,378 (100.0%) | 3,246 (100.0%) |
Families and Households in Indiantown
Median Family Size in Indiantown
The median family size in Indiantown is 3.89 persons per family, with single female/mother families (581 | 41.7%) accounting for the largest median family size of 3.98 persons per family. On the other hand, single male/father families (141 | 10.1%) represent the smallest median family size with 3.67 persons per family.
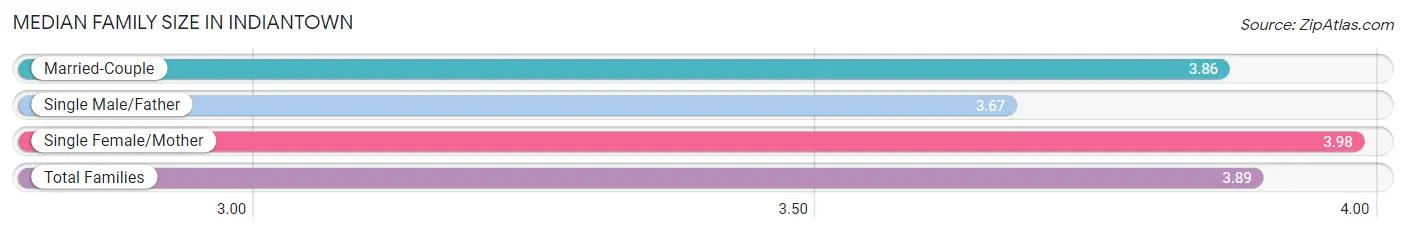
| Family Type | # Families | Family Size |
| Married-Couple | 671 (48.2%) | 3.86 |
| Single Male/Father | 141 (10.1%) | 3.67 |
| Single Female/Mother | 581 (41.7%) | 3.98 |
| Total Families | 1,393 (100.0%) | 3.89 |
Median Household Size in Indiantown
The median household size in Indiantown is 3.41 persons per household, with single female/mother households (581 | 29.9%) accounting for the largest median household size of 4.4 persons per household. non-family households (547 | 28.2%) represent the smallest median household size with 1.44 persons per household.
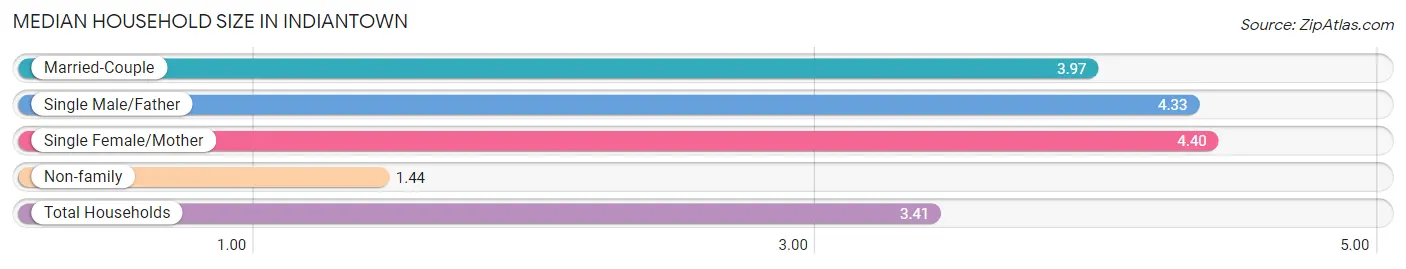
| Household Type | # Households | Household Size |
| Married-Couple | 671 (34.6%) | 3.97 |
| Single Male/Father | 141 (7.3%) | 4.33 |
| Single Female/Mother | 581 (29.9%) | 4.40 |
| Non-family | 547 (28.2%) | 1.44 |
| Total Households | 1,940 (100.0%) | 3.41 |
Household Size by Marriage Status in Indiantown
Out of a total of 1,940 households in Indiantown, 1,393 (71.8%) are family households, while 547 (28.2%) are nonfamily households. The most numerous type of family households are 2-person households, comprising 448, and the most common type of nonfamily households are 1-person households, comprising 491.
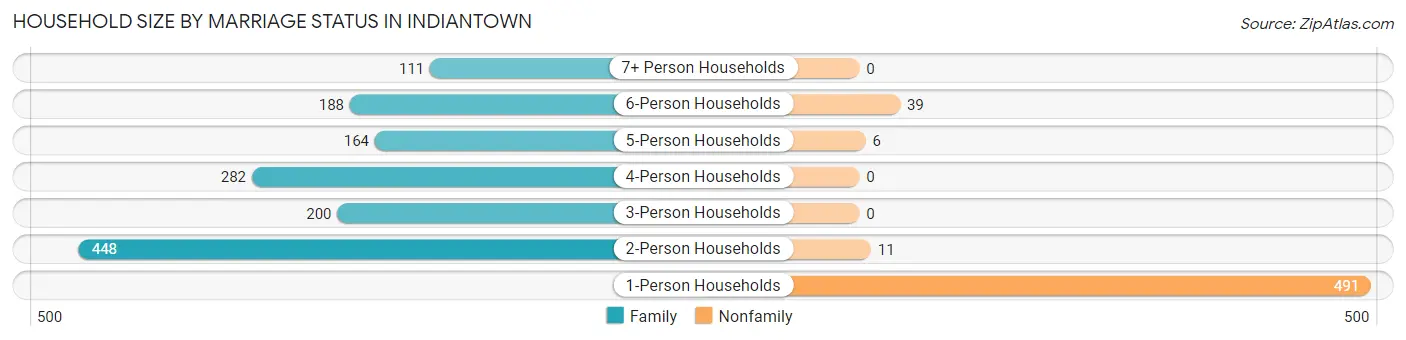
| Household Size | Family Households | Nonfamily Households |
| 1-Person Households | - | 491 (25.3%) |
| 2-Person Households | 448 (23.1%) | 11 (0.6%) |
| 3-Person Households | 200 (10.3%) | 0 (0.0%) |
| 4-Person Households | 282 (14.5%) | 0 (0.0%) |
| 5-Person Households | 164 (8.5%) | 6 (0.3%) |
| 6-Person Households | 188 (9.7%) | 39 (2.0%) |
| 7+ Person Households | 111 (5.7%) | 0 (0.0%) |
| Total | 1,393 (71.8%) | 547 (28.2%) |
Female Fertility in Indiantown
Fertility by Age in Indiantown
Average fertility rate in Indiantown is 65.0 births per 1,000 women. Women in the age bracket of 35 to 50 years have the highest fertility rate with 131.0 births per 1,000 women. Women in the age bracket of 35 to 50 years acount for 60.8% of all women with births.
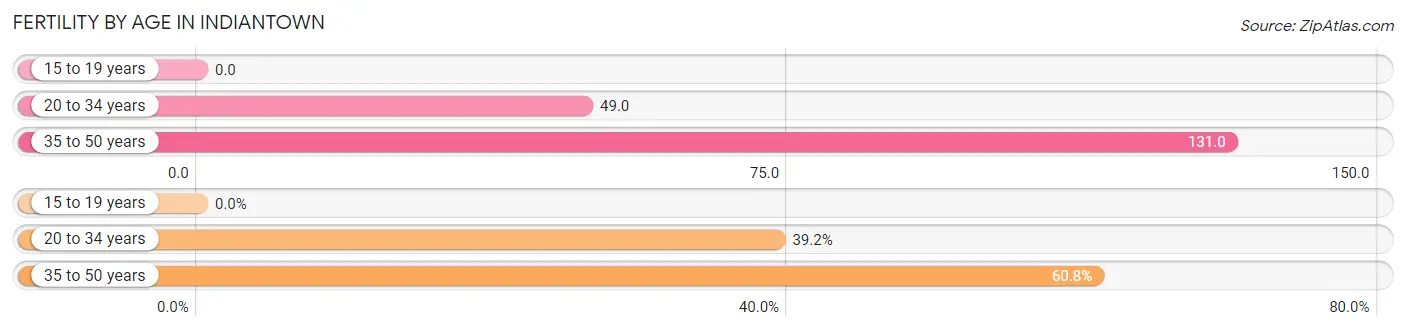
| Age Bracket | Women with Births | Births / 1,000 Women |
| 15 to 19 years | 0 (0.0%) | 0.0 |
| 20 to 34 years | 29 (39.2%) | 49.0 |
| 35 to 50 years | 45 (60.8%) | 131.0 |
| Total | 74 (100.0%) | 65.0 |
Fertility by Age by Marriage Status in Indiantown
81.1% of women with births (74) in Indiantown are married. The highest percentage of unmarried women with births falls into 20 to 34 years age bracket with 48.3% of them unmarried at the time of birth, while the lowest percentage of unmarried women with births belong to 35 to 50 years age bracket with 0.0% of them unmarried.
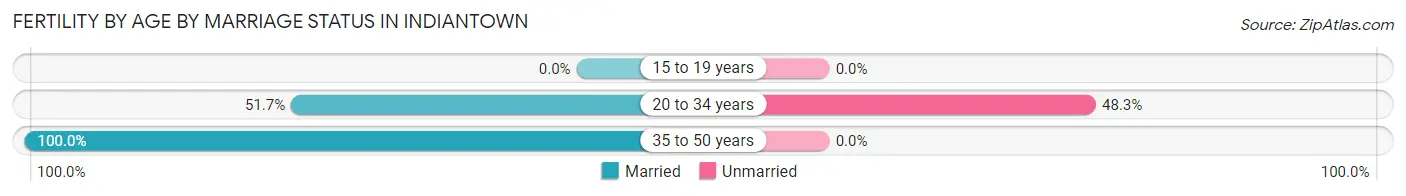
| Age Bracket | Married | Unmarried |
| 15 to 19 years | 0 (0.0%) | 0 (0.0%) |
| 20 to 34 years | 15 (51.7%) | 14 (48.3%) |
| 35 to 50 years | 45 (100.0%) | 0 (0.0%) |
| Total | 60 (81.1%) | 14 (18.9%) |
Fertility by Education in Indiantown
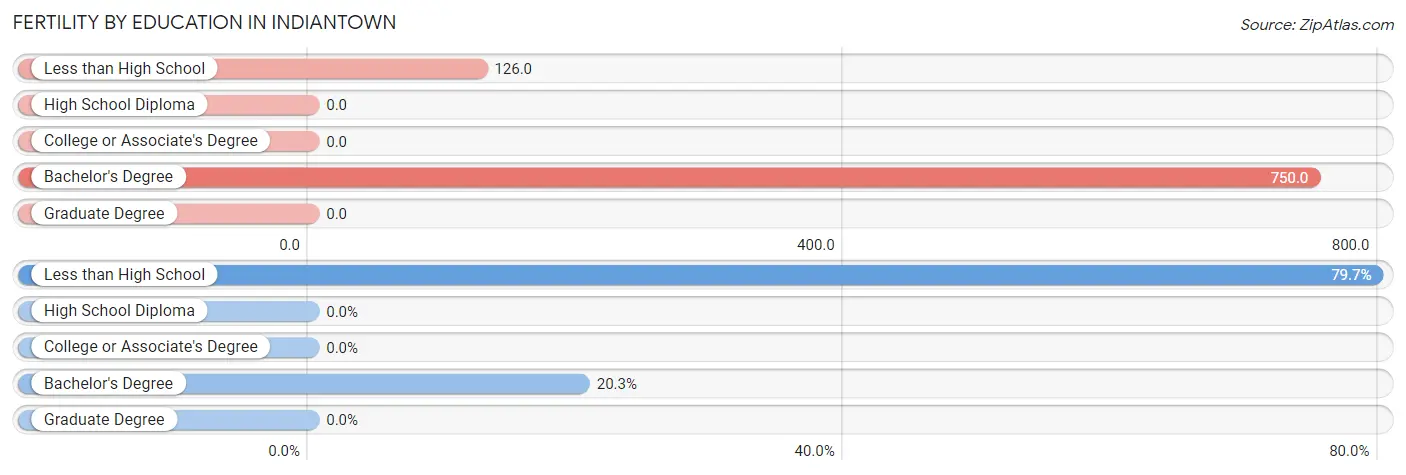
| Educational Attainment | Women with Births | Births / 1,000 Women |
| Less than High School | 59 (79.7%) | 126.0 |
| High School Diploma | 0 (0.0%) | 0.0 |
| College or Associate's Degree | 0 (0.0%) | 0.0 |
| Bachelor's Degree | 15 (20.3%) | 750.0 |
| Graduate Degree | 0 (0.0%) | 0.0 |
| Total | 74 (100.0%) | 65.0 |
Fertility by Education by Marriage Status in Indiantown
18.9% of women with births in Indiantown are unmarried. Women with the educational attainment of bachelor's degree are most likely to be married with 100.0% of them married at childbirth, while women with the educational attainment of less than high school are least likely to be married with 23.7% of them unmarried at childbirth.
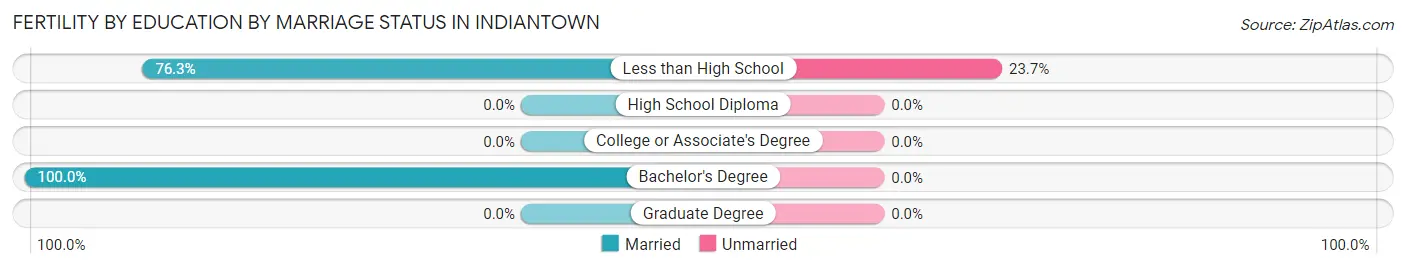
| Educational Attainment | Married | Unmarried |
| Less than High School | 45 (76.3%) | 14 (23.7%) |
| High School Diploma | 0 (0.0%) | 0 (0.0%) |
| College or Associate's Degree | 0 (0.0%) | 0 (0.0%) |
| Bachelor's Degree | 15 (100.0%) | 0 (0.0%) |
| Graduate Degree | 0 (0.0%) | 0 (0.0%) |
| Total | 60 (81.1%) | 14 (18.9%) |
Employment Characteristics in Indiantown
Employment by Class of Employer in Indiantown
Among the 2,586 employed individuals in Indiantown, private company employees (2,099 | 81.2%), self-employed (incorporated) (189 | 7.3%), and local government employees (122 | 4.7%) make up the most common classes of employment.
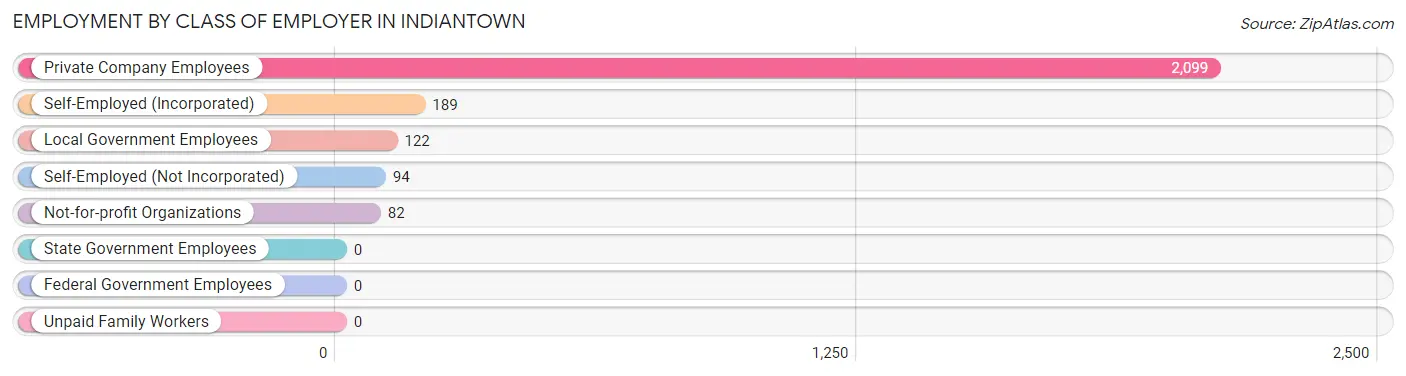
| Employer Class | # Employees | % Employees |
| Private Company Employees | 2,099 | 81.2% |
| Self-Employed (Incorporated) | 189 | 7.3% |
| Self-Employed (Not Incorporated) | 94 | 3.6% |
| Not-for-profit Organizations | 82 | 3.2% |
| Local Government Employees | 122 | 4.7% |
| State Government Employees | 0 | 0.0% |
| Federal Government Employees | 0 | 0.0% |
| Unpaid Family Workers | 0 | 0.0% |
| Total | 2,586 | 100.0% |
Employment Status by Age in Indiantown
According to the labor force statistics for Indiantown, out of the total population over 16 years of age (4,736), 57.0% or 2,700 individuals are in the labor force, with 3.2% or 86 of them unemployed. The age group with the highest labor force participation rate is 30 to 34 years, with 94.9% or 371 individuals in the labor force. Within the labor force, the 60 to 64 years age range has the highest percentage of unemployed individuals, with 19.7% or 15 of them being unemployed.
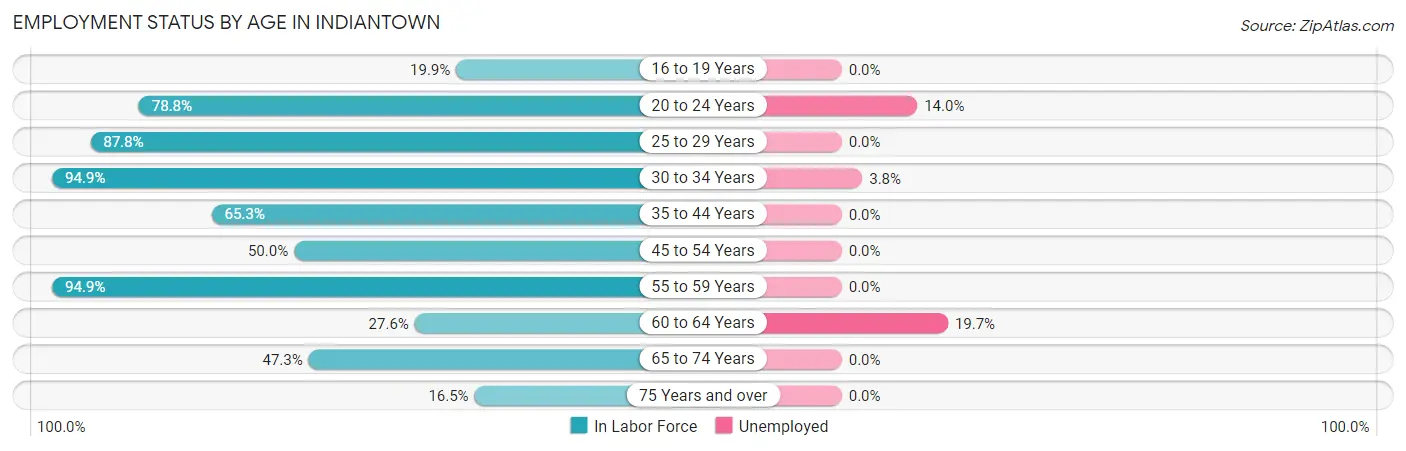
| Age Bracket | In Labor Force | Unemployed |
| 16 to 19 Years | 74 (19.9%) | 0 (0.0%) |
| 20 to 24 Years | 408 (78.8%) | 57 (14.0%) |
| 25 to 29 Years | 419 (87.8%) | 0 (0.0%) |
| 30 to 34 Years | 371 (94.9%) | 14 (3.8%) |
| 35 to 44 Years | 494 (65.3%) | 0 (0.0%) |
| 45 to 54 Years | 228 (50.0%) | 0 (0.0%) |
| 55 to 59 Years | 206 (94.9%) | 0 (0.0%) |
| 60 to 64 Years | 76 (27.6%) | 15 (19.7%) |
| 65 to 74 Years | 328 (47.3%) | 0 (0.0%) |
| 75 Years and over | 96 (16.5%) | 0 (0.0%) |
| Total | 2,700 (57.0%) | 86 (3.2%) |
Employment Status by Educational Attainment in Indiantown
According to labor force statistics for Indiantown, 69.8% of individuals (1,795) out of the total population between 25 and 64 years of age (2,572) are in the labor force, with 1.6% or 29 of them being unemployed. The group with the highest labor force participation rate are those with the educational attainment of high school diploma, with 87.2% or 547 individuals in the labor force. Within the labor force, individuals with high school diploma education have the highest percentage of unemployment, with 2.7% or 15 of them being unemployed.
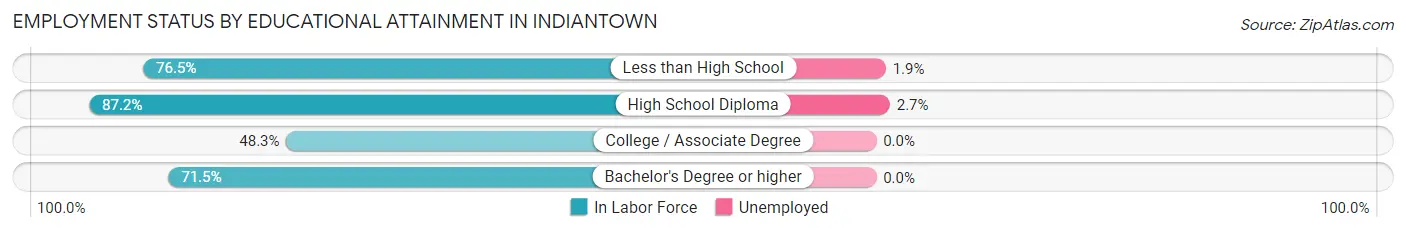
| Educational Attainment | In Labor Force | Unemployed |
| Less than High School | 739 (76.5%) | 18 (1.9%) |
| High School Diploma | 547 (87.2%) | 17 (2.7%) |
| College / Associate Degree | 400 (48.3%) | 0 (0.0%) |
| Bachelor's Degree or higher | 108 (71.5%) | 0 (0.0%) |
| Total | 1,795 (69.8%) | 41 (1.6%) |
Employment Occupations by Sex in Indiantown
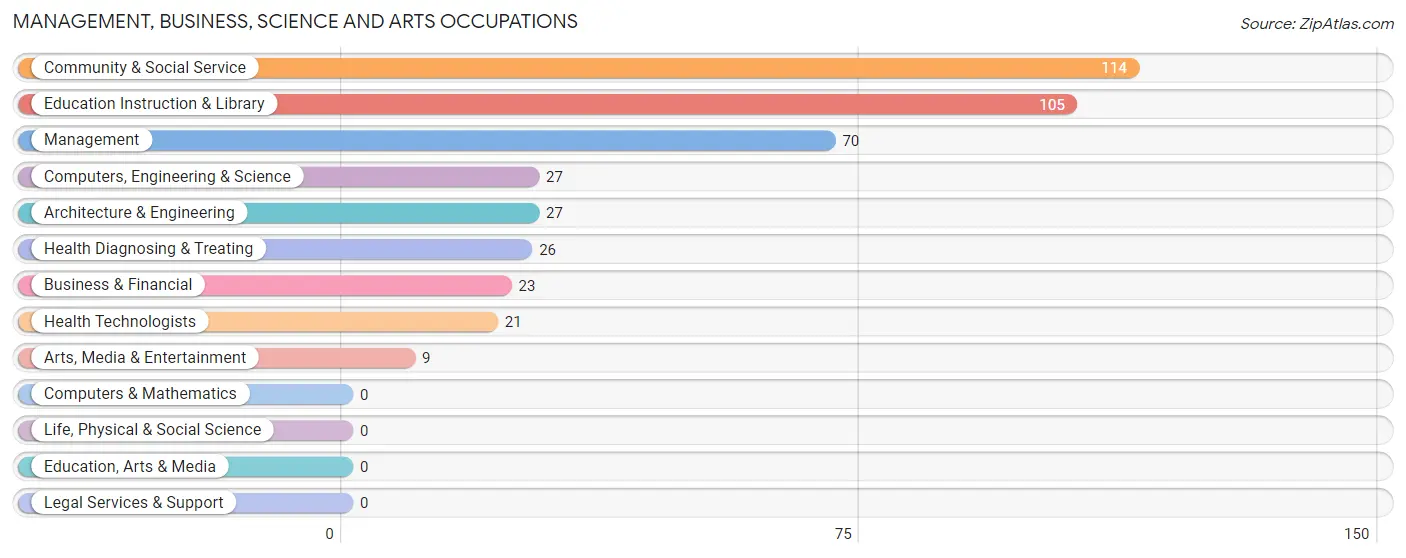
Management, Business, Science and Arts Occupations
The most common Management, Business, Science and Arts occupations in Indiantown are Community & Social Service (114 | 4.4%), Education Instruction & Library (105 | 4.0%), Management (70 | 2.7%), Computers, Engineering & Science (27 | 1.0%), and Architecture & Engineering (27 | 1.0%).
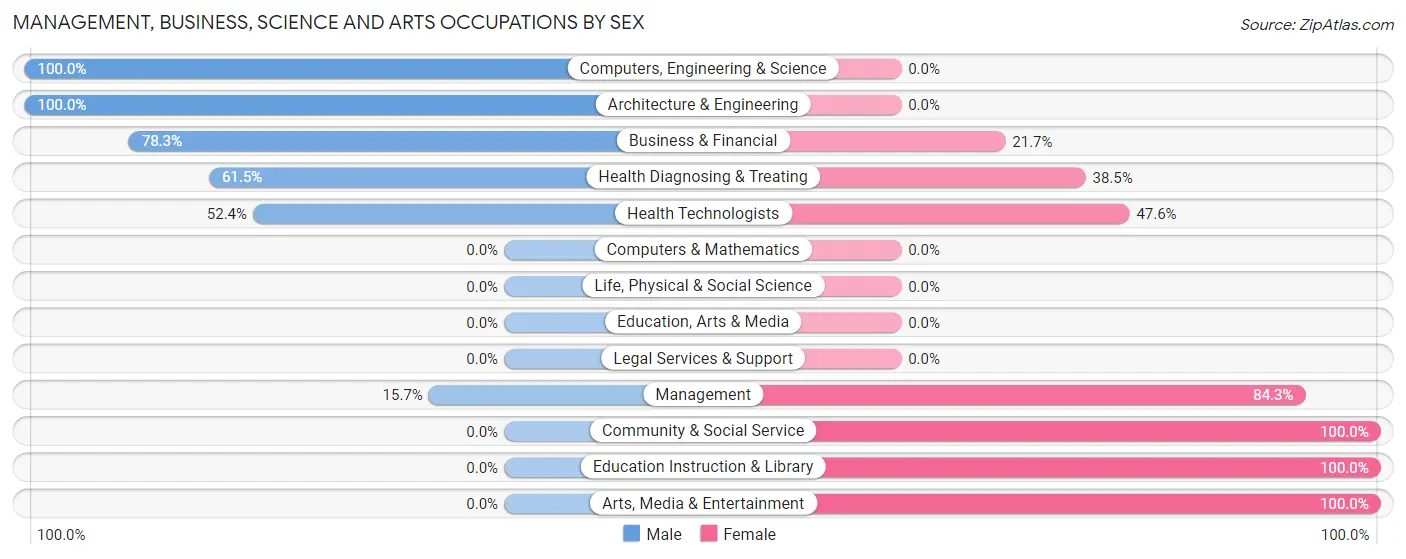
Management, Business, Science and Arts Occupations by Sex
Within the Management, Business, Science and Arts occupations in Indiantown, the most male-oriented occupations are Computers, Engineering & Science (100.0%), Architecture & Engineering (100.0%), and Business & Financial (78.3%), while the most female-oriented occupations are Community & Social Service (100.0%), Education Instruction & Library (100.0%), and Arts, Media & Entertainment (100.0%).
| Occupation | Male | Female |
| Management | 11 (15.7%) | 59 (84.3%) |
| Business & Financial | 18 (78.3%) | 5 (21.7%) |
| Computers, Engineering & Science | 27 (100.0%) | 0 (0.0%) |
| Computers & Mathematics | 0 (0.0%) | 0 (0.0%) |
| Architecture & Engineering | 27 (100.0%) | 0 (0.0%) |
| Life, Physical & Social Science | 0 (0.0%) | 0 (0.0%) |
| Community & Social Service | 0 (0.0%) | 114 (100.0%) |
| Education, Arts & Media | 0 (0.0%) | 0 (0.0%) |
| Legal Services & Support | 0 (0.0%) | 0 (0.0%) |
| Education Instruction & Library | 0 (0.0%) | 105 (100.0%) |
| Arts, Media & Entertainment | 0 (0.0%) | 9 (100.0%) |
| Health Diagnosing & Treating | 16 (61.5%) | 10 (38.5%) |
| Health Technologists | 11 (52.4%) | 10 (47.6%) |
| Total (Category) | 72 (27.7%) | 188 (72.3%) |
| Total (Overall) | 1,505 (57.6%) | 1,109 (42.4%) |
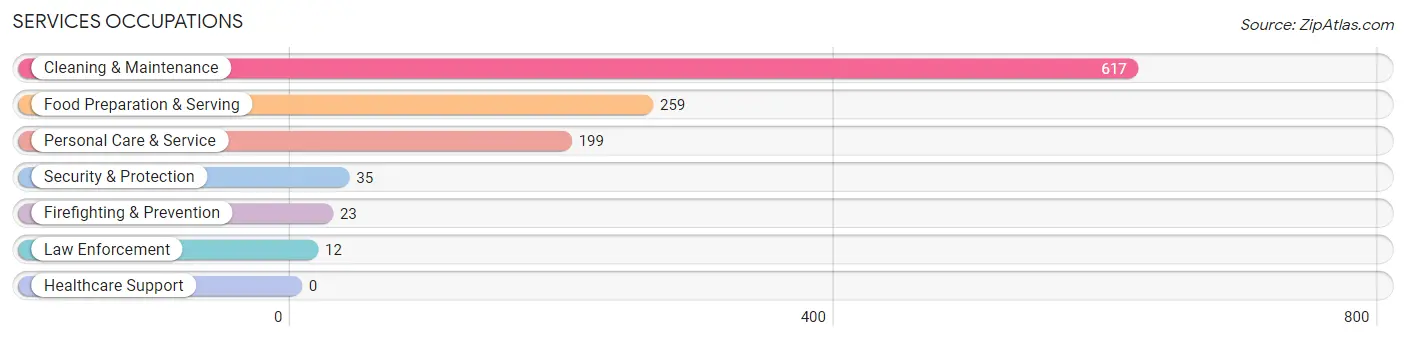
Services Occupations
The most common Services occupations in Indiantown are Cleaning & Maintenance (617 | 23.6%), Food Preparation & Serving (259 | 9.9%), Personal Care & Service (199 | 7.6%), Security & Protection (35 | 1.3%), and Firefighting & Prevention (23 | 0.9%).
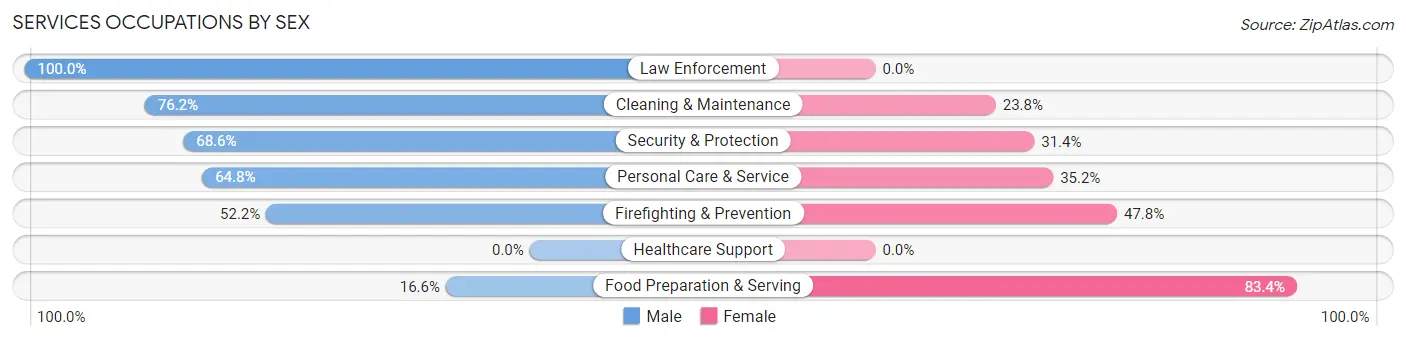
Services Occupations by Sex
Within the Services occupations in Indiantown, the most male-oriented occupations are Law Enforcement (100.0%), Cleaning & Maintenance (76.2%), and Security & Protection (68.6%), while the most female-oriented occupations are Food Preparation & Serving (83.4%), Firefighting & Prevention (47.8%), and Personal Care & Service (35.2%).
| Occupation | Male | Female |
| Healthcare Support | 0 (0.0%) | 0 (0.0%) |
| Security & Protection | 24 (68.6%) | 11 (31.4%) |
| Firefighting & Prevention | 12 (52.2%) | 11 (47.8%) |
| Law Enforcement | 12 (100.0%) | 0 (0.0%) |
| Food Preparation & Serving | 43 (16.6%) | 216 (83.4%) |
| Cleaning & Maintenance | 470 (76.2%) | 147 (23.8%) |
| Personal Care & Service | 129 (64.8%) | 70 (35.2%) |
| Total (Category) | 666 (60.0%) | 444 (40.0%) |
| Total (Overall) | 1,505 (57.6%) | 1,109 (42.4%) |
Sales and Office Occupations
The most common Sales and Office occupations in Indiantown are Sales & Related (494 | 18.9%), and Office & Administration (95 | 3.6%).
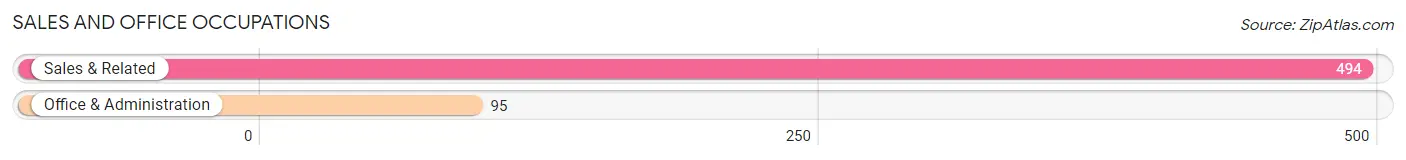
Sales and Office Occupations by Sex
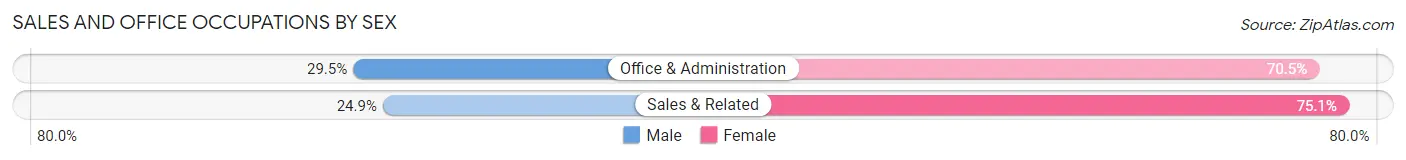
| Occupation | Male | Female |
| Sales & Related | 123 (24.9%) | 371 (75.1%) |
| Office & Administration | 28 (29.5%) | 67 (70.5%) |
| Total (Category) | 151 (25.6%) | 438 (74.4%) |
| Total (Overall) | 1,505 (57.6%) | 1,109 (42.4%) |
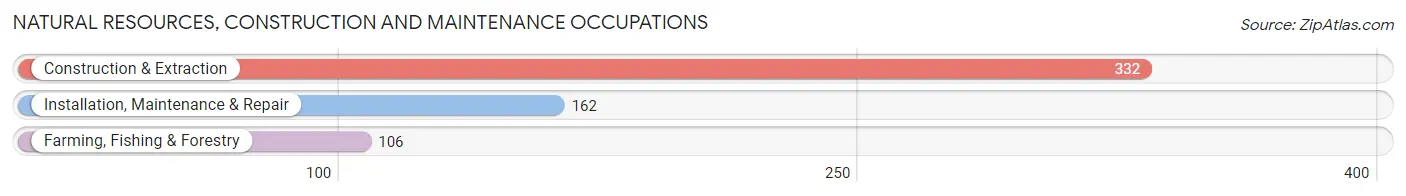
Natural Resources, Construction and Maintenance Occupations
The most common Natural Resources, Construction and Maintenance occupations in Indiantown are Construction & Extraction (332 | 12.7%), Installation, Maintenance & Repair (162 | 6.2%), and Farming, Fishing & Forestry (106 | 4.1%).
Natural Resources, Construction and Maintenance Occupations by Sex
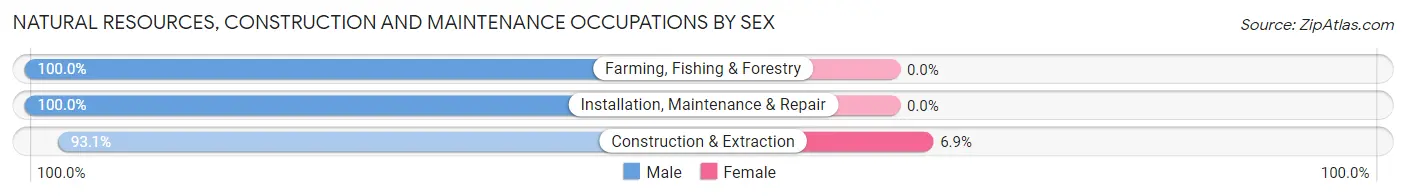
| Occupation | Male | Female |
| Farming, Fishing & Forestry | 106 (100.0%) | 0 (0.0%) |
| Construction & Extraction | 309 (93.1%) | 23 (6.9%) |
| Installation, Maintenance & Repair | 162 (100.0%) | 0 (0.0%) |
| Total (Category) | 577 (96.2%) | 23 (3.8%) |
| Total (Overall) | 1,505 (57.6%) | 1,109 (42.4%) |
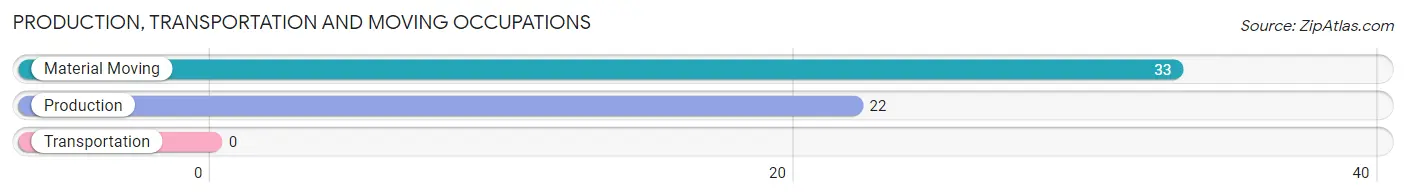
Production, Transportation and Moving Occupations
The most common Production, Transportation and Moving occupations in Indiantown are Material Moving (33 | 1.3%), and Production (22 | 0.8%).
Production, Transportation and Moving Occupations by Sex
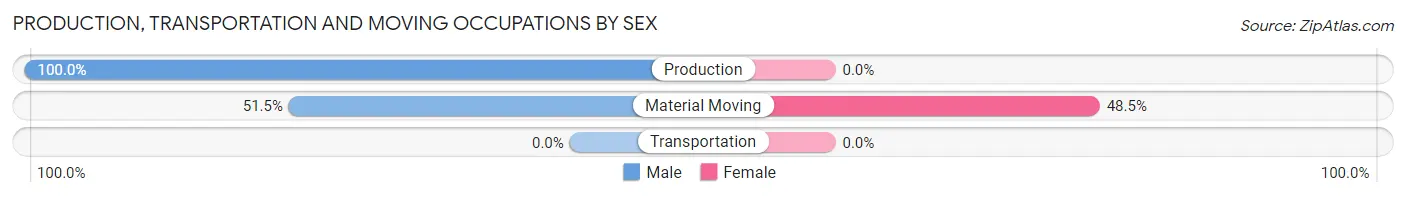
| Occupation | Male | Female |
| Production | 22 (100.0%) | 0 (0.0%) |
| Transportation | 0 (0.0%) | 0 (0.0%) |
| Material Moving | 17 (51.5%) | 16 (48.5%) |
| Total (Category) | 39 (70.9%) | 16 (29.1%) |
| Total (Overall) | 1,505 (57.6%) | 1,109 (42.4%) |
Employment Industries by Sex in Indiantown
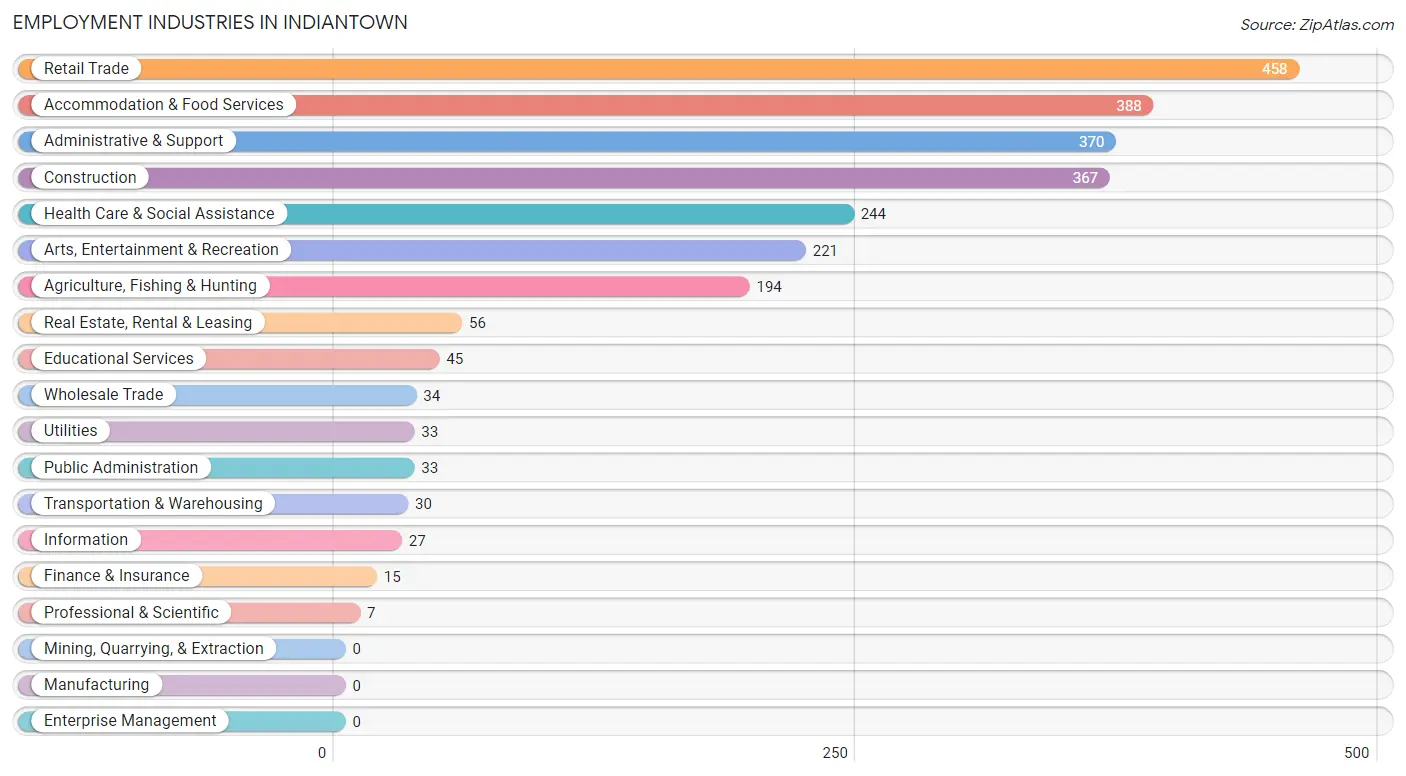
Employment Industries in Indiantown
The major employment industries in Indiantown include Retail Trade (458 | 17.5%), Accommodation & Food Services (388 | 14.8%), Administrative & Support (370 | 14.1%), Construction (367 | 14.0%), and Health Care & Social Assistance (244 | 9.3%).
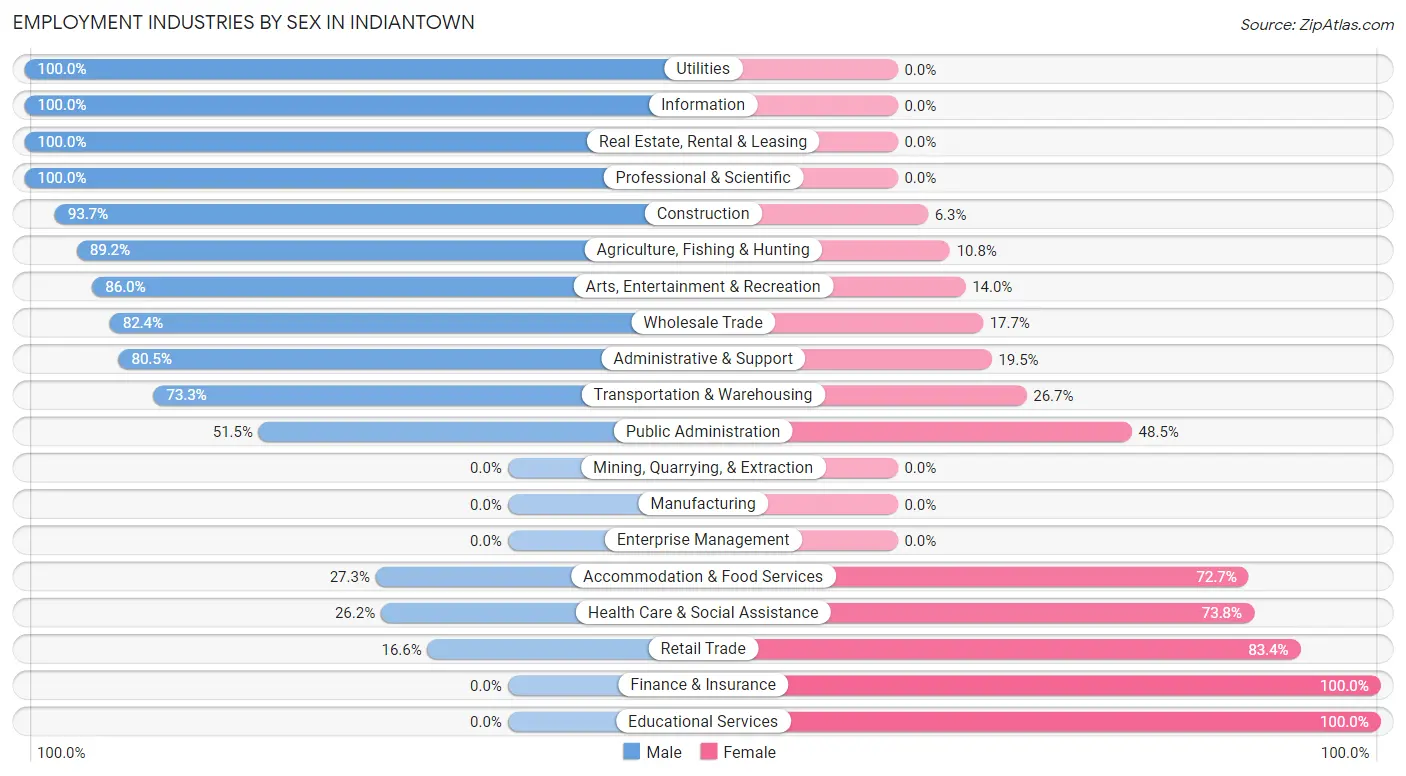
Employment Industries by Sex in Indiantown
The Indiantown industries that see more men than women are Utilities (100.0%), Information (100.0%), and Real Estate, Rental & Leasing (100.0%), whereas the industries that tend to have a higher number of women are Finance & Insurance (100.0%), Educational Services (100.0%), and Retail Trade (83.4%).
| Industry | Male | Female |
| Agriculture, Fishing & Hunting | 173 (89.2%) | 21 (10.8%) |
| Mining, Quarrying, & Extraction | 0 (0.0%) | 0 (0.0%) |
| Construction | 344 (93.7%) | 23 (6.3%) |
| Manufacturing | 0 (0.0%) | 0 (0.0%) |
| Wholesale Trade | 28 (82.4%) | 6 (17.6%) |
| Retail Trade | 76 (16.6%) | 382 (83.4%) |
| Transportation & Warehousing | 22 (73.3%) | 8 (26.7%) |
| Utilities | 33 (100.0%) | 0 (0.0%) |
| Information | 27 (100.0%) | 0 (0.0%) |
| Finance & Insurance | 0 (0.0%) | 15 (100.0%) |
| Real Estate, Rental & Leasing | 56 (100.0%) | 0 (0.0%) |
| Professional & Scientific | 7 (100.0%) | 0 (0.0%) |
| Enterprise Management | 0 (0.0%) | 0 (0.0%) |
| Administrative & Support | 298 (80.5%) | 72 (19.5%) |
| Educational Services | 0 (0.0%) | 45 (100.0%) |
| Health Care & Social Assistance | 64 (26.2%) | 180 (73.8%) |
| Arts, Entertainment & Recreation | 190 (86.0%) | 31 (14.0%) |
| Accommodation & Food Services | 106 (27.3%) | 282 (72.7%) |
| Public Administration | 17 (51.5%) | 16 (48.5%) |
| Total | 1,505 (57.6%) | 1,109 (42.4%) |
Education in Indiantown
School Enrollment in Indiantown
The most common levels of schooling among the 2,099 students in Indiantown are high school (595 | 28.3%), middle school (590 | 28.1%), and nursery / preschool (327 | 15.6%).
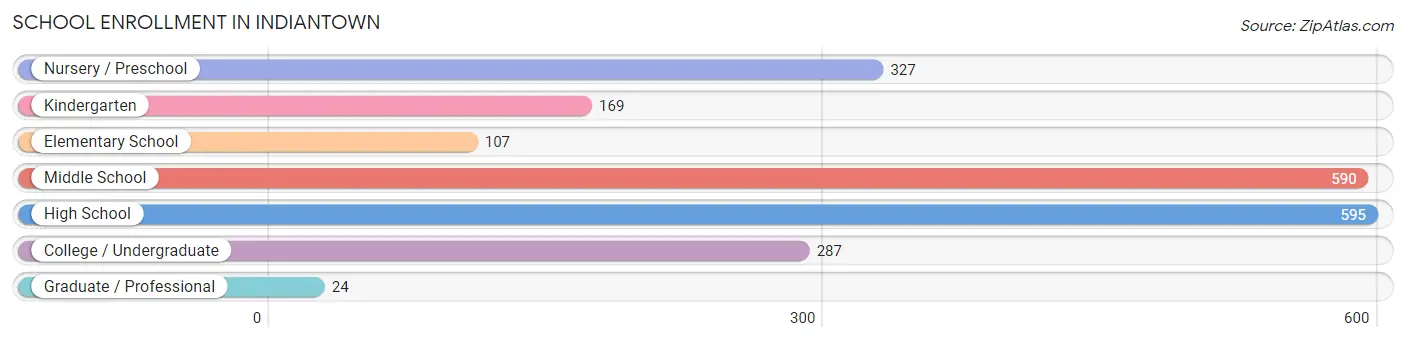
| School Level | # Students | % Students |
| Nursery / Preschool | 327 | 15.6% |
| Kindergarten | 169 | 8.1% |
| Elementary School | 107 | 5.1% |
| Middle School | 590 | 28.1% |
| High School | 595 | 28.3% |
| College / Undergraduate | 287 | 13.7% |
| Graduate / Professional | 24 | 1.1% |
| Total | 2,099 | 100.0% |
School Enrollment by Age by Funding Source in Indiantown
Out of a total of 2,099 students who are enrolled in schools in Indiantown, 38 (1.8%) attend a private institution, while the remaining 2,061 (98.2%) are enrolled in public schools. The age group of 3 to 4 year olds has the highest likelihood of being enrolled in private schools, with 26 (12.1% in the age bracket) enrolled. Conversely, the age group of 5 to 9 year old has the lowest likelihood of being enrolled in a private school, with 388 (100.0% in the age bracket) attending a public institution.
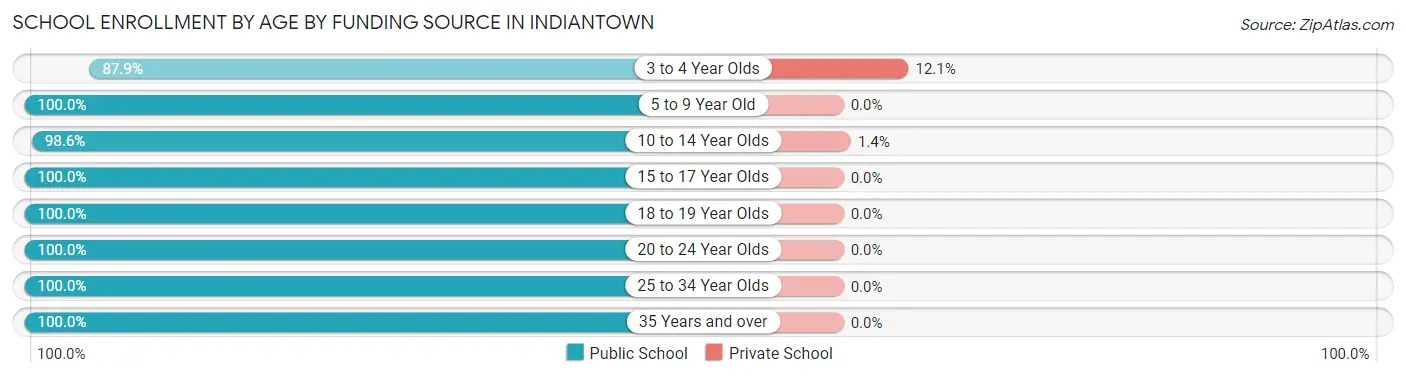
| Age Bracket | Public School | Private School |
| 3 to 4 Year Olds | 189 (87.9%) | 26 (12.1%) |
| 5 to 9 Year Old | 388 (100.0%) | 0 (0.0%) |
| 10 to 14 Year Olds | 790 (98.6%) | 11 (1.4%) |
| 15 to 17 Year Olds | 363 (100.0%) | 0 (0.0%) |
| 18 to 19 Year Olds | 44 (100.0%) | 0 (0.0%) |
| 20 to 24 Year Olds | 84 (100.0%) | 0 (0.0%) |
| 25 to 34 Year Olds | 181 (100.0%) | 0 (0.0%) |
| 35 Years and over | 23 (100.0%) | 0 (0.0%) |
| Total | 2,061 (98.2%) | 38 (1.8%) |
Educational Attainment by Field of Study in Indiantown
Business (84 | 34.2%), science & technology (80 | 32.5%), education (36 | 14.6%), engineering (15 | 6.1%), and arts & humanities (11 | 4.5%) are the most common fields of study among 246 individuals in Indiantown who have obtained a bachelor's degree or higher.
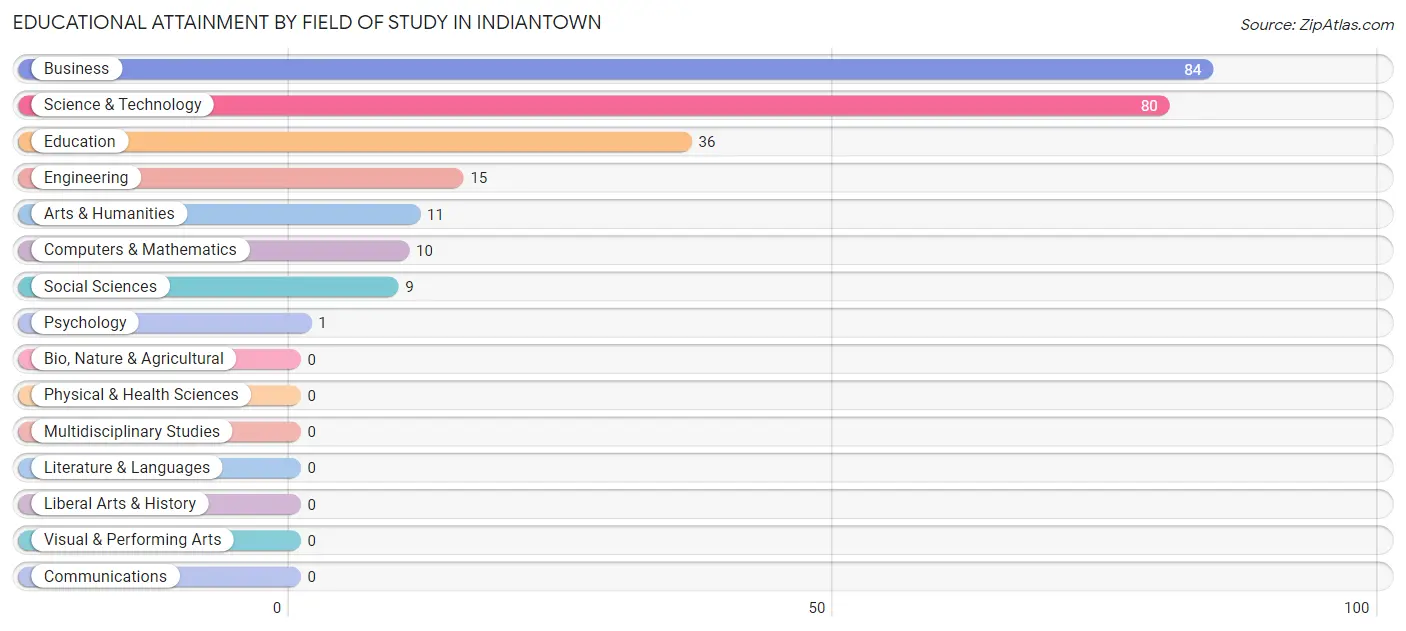
| Field of Study | # Graduates | % Graduates |
| Computers & Mathematics | 10 | 4.1% |
| Bio, Nature & Agricultural | 0 | 0.0% |
| Physical & Health Sciences | 0 | 0.0% |
| Psychology | 1 | 0.4% |
| Social Sciences | 9 | 3.7% |
| Engineering | 15 | 6.1% |
| Multidisciplinary Studies | 0 | 0.0% |
| Science & Technology | 80 | 32.5% |
| Business | 84 | 34.2% |
| Education | 36 | 14.6% |
| Literature & Languages | 0 | 0.0% |
| Liberal Arts & History | 0 | 0.0% |
| Visual & Performing Arts | 0 | 0.0% |
| Communications | 0 | 0.0% |
| Arts & Humanities | 11 | 4.5% |
| Total | 246 | 100.0% |
Transportation & Commute in Indiantown
Vehicle Availability by Sex in Indiantown
The most prevalent vehicle ownership categories in Indiantown are males with 2 vehicles (723, accounting for 48.9%) and females with 2 vehicles (617, making up 65.2%).
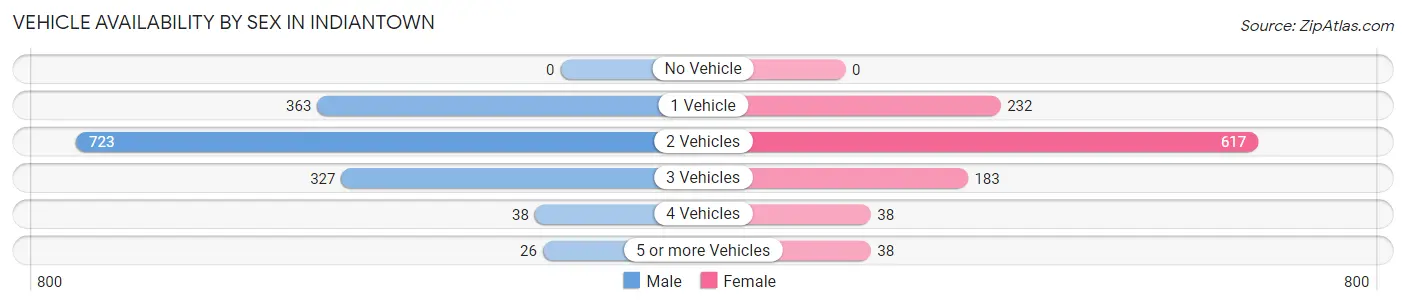
| Vehicles Available | Male | Female |
| No Vehicle | 0 (0.0%) | 0 (0.0%) |
| 1 Vehicle | 363 (24.6%) | 232 (20.9%) |
| 2 Vehicles | 723 (48.9%) | 617 (55.7%) |
| 3 Vehicles | 327 (22.1%) | 183 (16.5%) |
| 4 Vehicles | 38 (2.6%) | 38 (3.4%) |
| 5 or more Vehicles | 26 (1.8%) | 38 (3.4%) |
| Total | 1,477 (100.0%) | 1,108 (100.0%) |
Commute Time in Indiantown
The most frequently occuring commute durations in Indiantown are 45 to 59 minutes (465 commuters, 18.7%), 10 to 14 minutes (446 commuters, 17.9%), and 40 to 44 minutes (399 commuters, 16.0%).
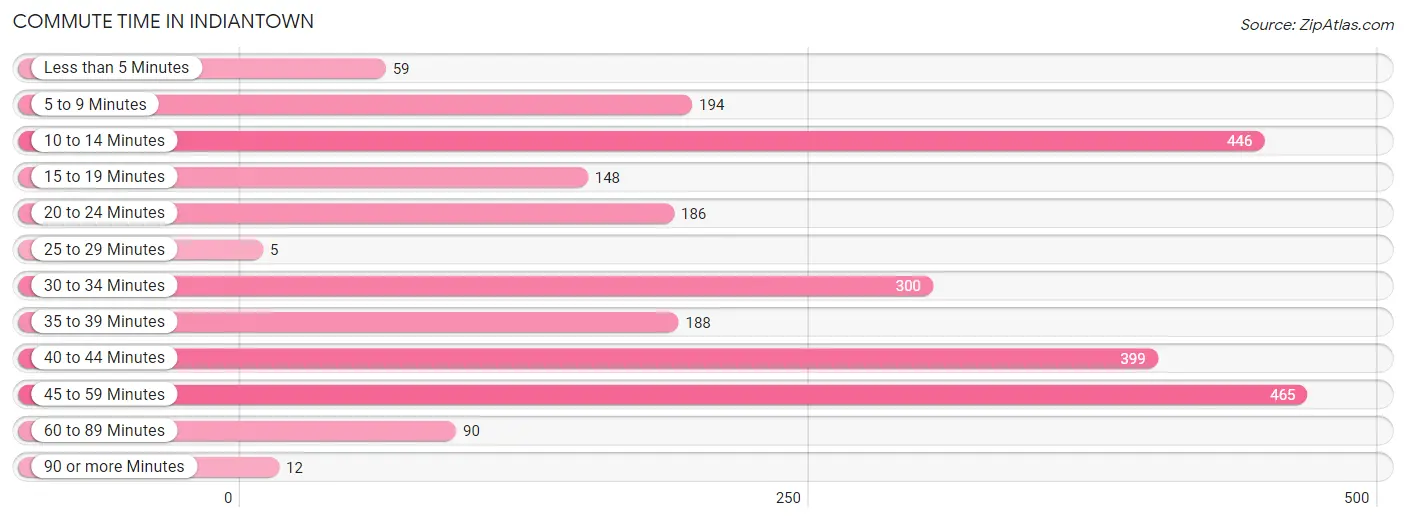
| Commute Time | # Commuters | % Commuters |
| Less than 5 Minutes | 59 | 2.4% |
| 5 to 9 Minutes | 194 | 7.8% |
| 10 to 14 Minutes | 446 | 17.9% |
| 15 to 19 Minutes | 148 | 5.9% |
| 20 to 24 Minutes | 186 | 7.5% |
| 25 to 29 Minutes | 5 | 0.2% |
| 30 to 34 Minutes | 300 | 12.0% |
| 35 to 39 Minutes | 188 | 7.5% |
| 40 to 44 Minutes | 399 | 16.0% |
| 45 to 59 Minutes | 465 | 18.7% |
| 60 to 89 Minutes | 90 | 3.6% |
| 90 or more Minutes | 12 | 0.5% |
Commute Time by Sex in Indiantown
The most common commute times in Indiantown are 40 to 44 minutes (399 commuters, 28.4%) for males and 10 to 14 minutes (397 commuters, 36.5%) for females.
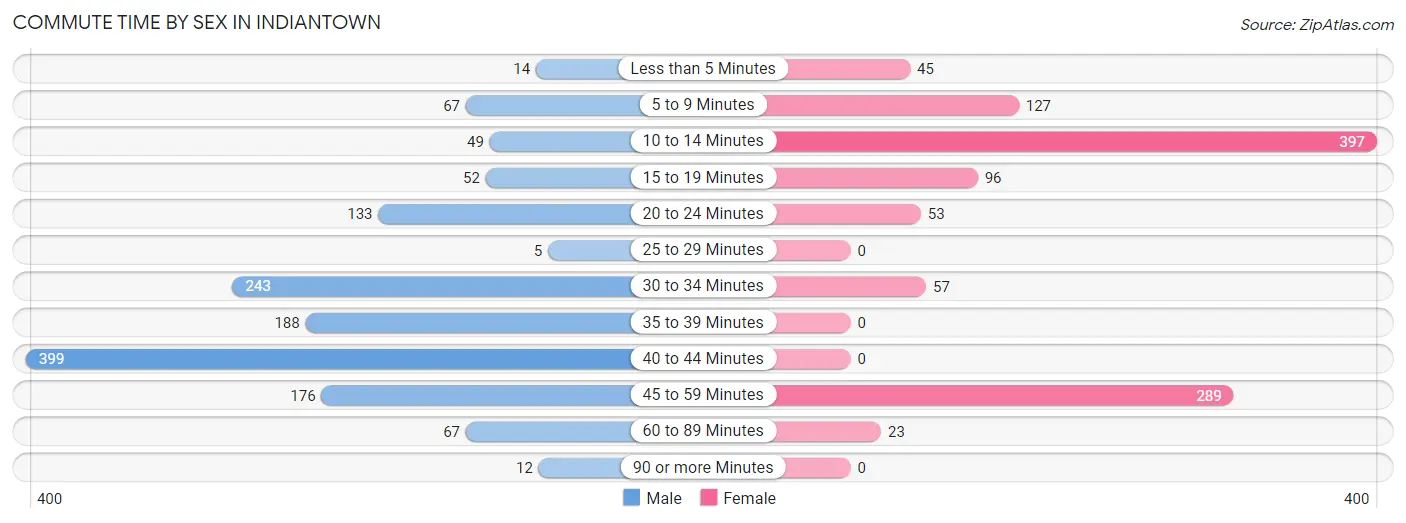
| Commute Time | Male | Female |
| Less than 5 Minutes | 14 (1.0%) | 45 (4.1%) |
| 5 to 9 Minutes | 67 (4.8%) | 127 (11.7%) |
| 10 to 14 Minutes | 49 (3.5%) | 397 (36.5%) |
| 15 to 19 Minutes | 52 (3.7%) | 96 (8.8%) |
| 20 to 24 Minutes | 133 (9.5%) | 53 (4.9%) |
| 25 to 29 Minutes | 5 (0.4%) | 0 (0.0%) |
| 30 to 34 Minutes | 243 (17.3%) | 57 (5.2%) |
| 35 to 39 Minutes | 188 (13.4%) | 0 (0.0%) |
| 40 to 44 Minutes | 399 (28.4%) | 0 (0.0%) |
| 45 to 59 Minutes | 176 (12.5%) | 289 (26.6%) |
| 60 to 89 Minutes | 67 (4.8%) | 23 (2.1%) |
| 90 or more Minutes | 12 (0.9%) | 0 (0.0%) |
Time of Departure to Work by Sex in Indiantown
The most frequent times of departure to work in Indiantown are 6:00 AM to 6:29 AM (291, 20.7%) for males and 8:30 AM to 8:59 AM (204, 18.8%) for females.
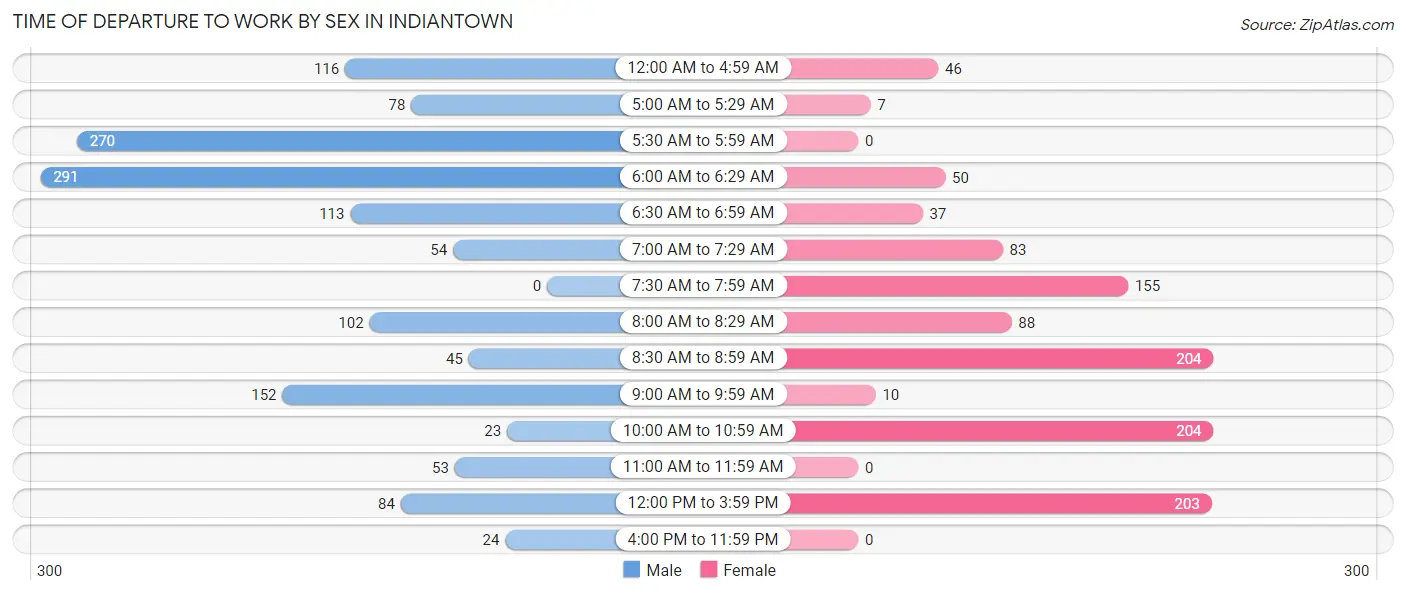
| Time of Departure | Male | Female |
| 12:00 AM to 4:59 AM | 116 (8.3%) | 46 (4.2%) |
| 5:00 AM to 5:29 AM | 78 (5.6%) | 7 (0.6%) |
| 5:30 AM to 5:59 AM | 270 (19.2%) | 0 (0.0%) |
| 6:00 AM to 6:29 AM | 291 (20.7%) | 50 (4.6%) |
| 6:30 AM to 6:59 AM | 113 (8.0%) | 37 (3.4%) |
| 7:00 AM to 7:29 AM | 54 (3.8%) | 83 (7.6%) |
| 7:30 AM to 7:59 AM | 0 (0.0%) | 155 (14.3%) |
| 8:00 AM to 8:29 AM | 102 (7.3%) | 88 (8.1%) |
| 8:30 AM to 8:59 AM | 45 (3.2%) | 204 (18.8%) |
| 9:00 AM to 9:59 AM | 152 (10.8%) | 10 (0.9%) |
| 10:00 AM to 10:59 AM | 23 (1.6%) | 204 (18.8%) |
| 11:00 AM to 11:59 AM | 53 (3.8%) | 0 (0.0%) |
| 12:00 PM to 3:59 PM | 84 (6.0%) | 203 (18.7%) |
| 4:00 PM to 11:59 PM | 24 (1.7%) | 0 (0.0%) |
| Total | 1,405 (100.0%) | 1,087 (100.0%) |
Housing Occupancy in Indiantown
Occupancy by Ownership in Indiantown
Of the total 1,940 dwellings in Indiantown, owner-occupied units account for 1,524 (78.6%), while renter-occupied units make up 416 (21.4%).
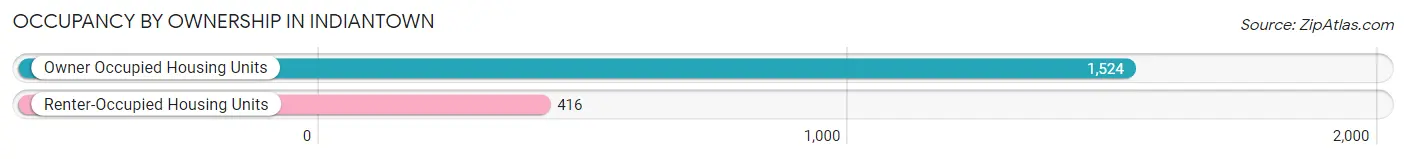
| Occupancy | # Housing Units | % Housing Units |
| Owner Occupied Housing Units | 1,524 | 78.6% |
| Renter-Occupied Housing Units | 416 | 21.4% |
| Total Occupied Housing Units | 1,940 | 100.0% |
Occupancy by Household Size in Indiantown
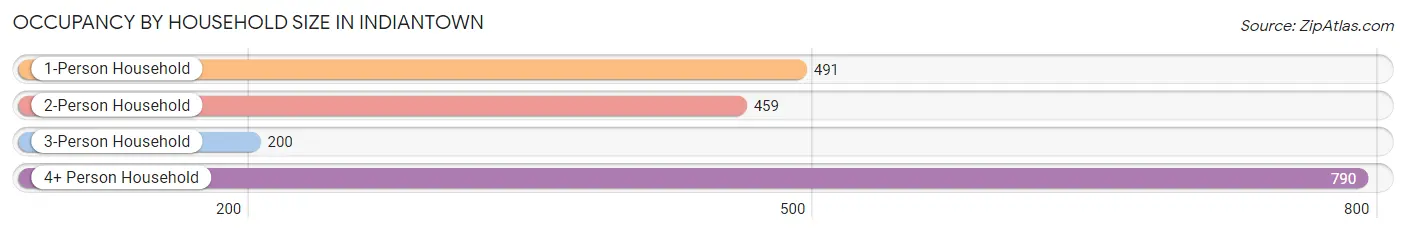
| Household Size | # Housing Units | % Housing Units |
| 1-Person Household | 491 | 25.3% |
| 2-Person Household | 459 | 23.7% |
| 3-Person Household | 200 | 10.3% |
| 4+ Person Household | 790 | 40.7% |
| Total Housing Units | 1,940 | 100.0% |
Occupancy by Ownership by Household Size in Indiantown
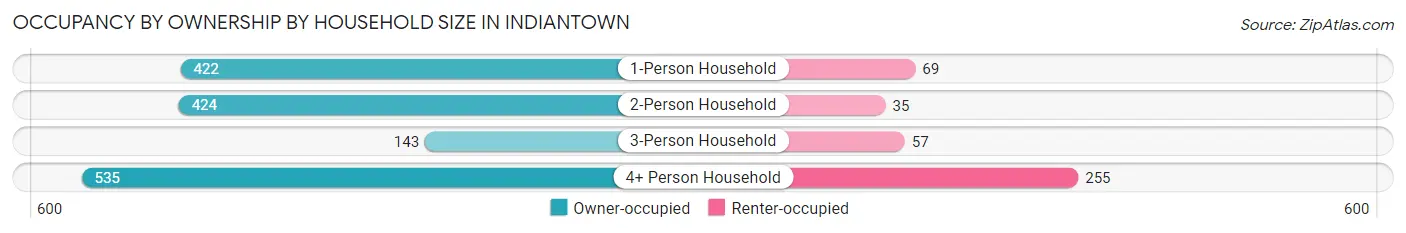
| Household Size | Owner-occupied | Renter-occupied |
| 1-Person Household | 422 (86.0%) | 69 (14.1%) |
| 2-Person Household | 424 (92.4%) | 35 (7.6%) |
| 3-Person Household | 143 (71.5%) | 57 (28.5%) |
| 4+ Person Household | 535 (67.7%) | 255 (32.3%) |
| Total Housing Units | 1,524 (78.6%) | 416 (21.4%) |
Occupancy by Educational Attainment in Indiantown
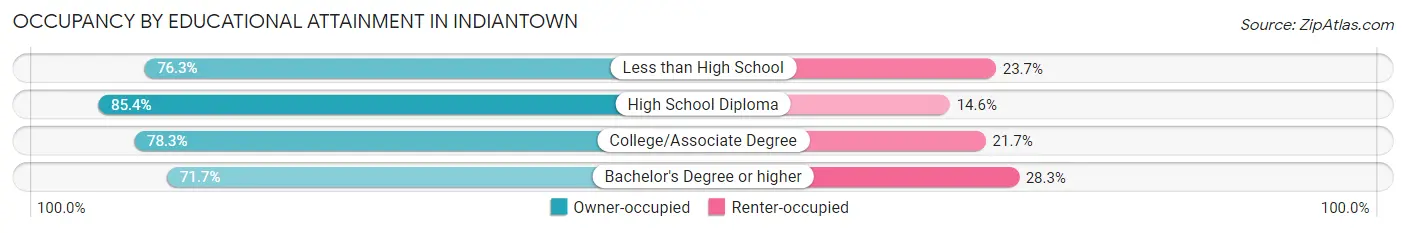
| Household Size | Owner-occupied | Renter-occupied |
| Less than High School | 463 (76.3%) | 144 (23.7%) |
| High School Diploma | 316 (85.4%) | 54 (14.6%) |
| College/Associate Degree | 646 (78.3%) | 179 (21.7%) |
| Bachelor's Degree or higher | 99 (71.7%) | 39 (28.3%) |
Occupancy by Age of Householder in Indiantown
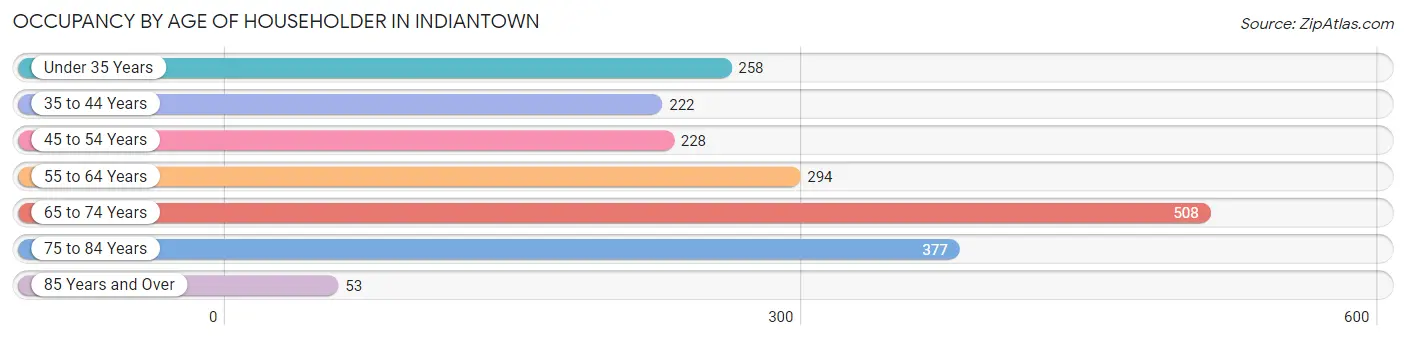
| Age Bracket | # Households | % Households |
| Under 35 Years | 258 | 13.3% |
| 35 to 44 Years | 222 | 11.4% |
| 45 to 54 Years | 228 | 11.7% |
| 55 to 64 Years | 294 | 15.1% |
| 65 to 74 Years | 508 | 26.2% |
| 75 to 84 Years | 377 | 19.4% |
| 85 Years and Over | 53 | 2.7% |
| Total | 1,940 | 100.0% |
Housing Finances in Indiantown
Median Income by Occupancy in Indiantown
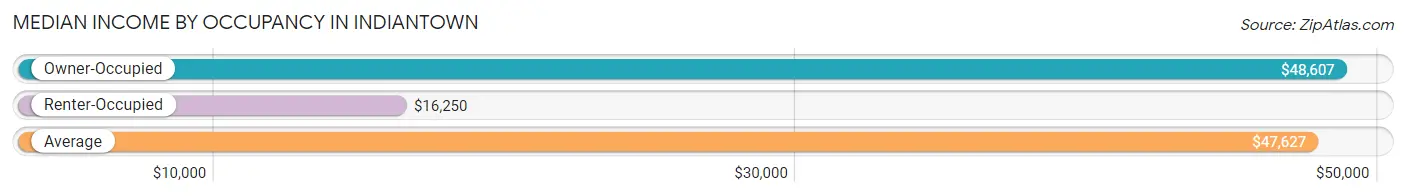
| Occupancy Type | # Households | Median Income |
| Owner-Occupied | 1,524 (78.6%) | $48,607 |
| Renter-Occupied | 416 (21.4%) | $16,250 |
| Average | 1,940 (100.0%) | $47,627 |
Occupancy by Householder Income Bracket in Indiantown
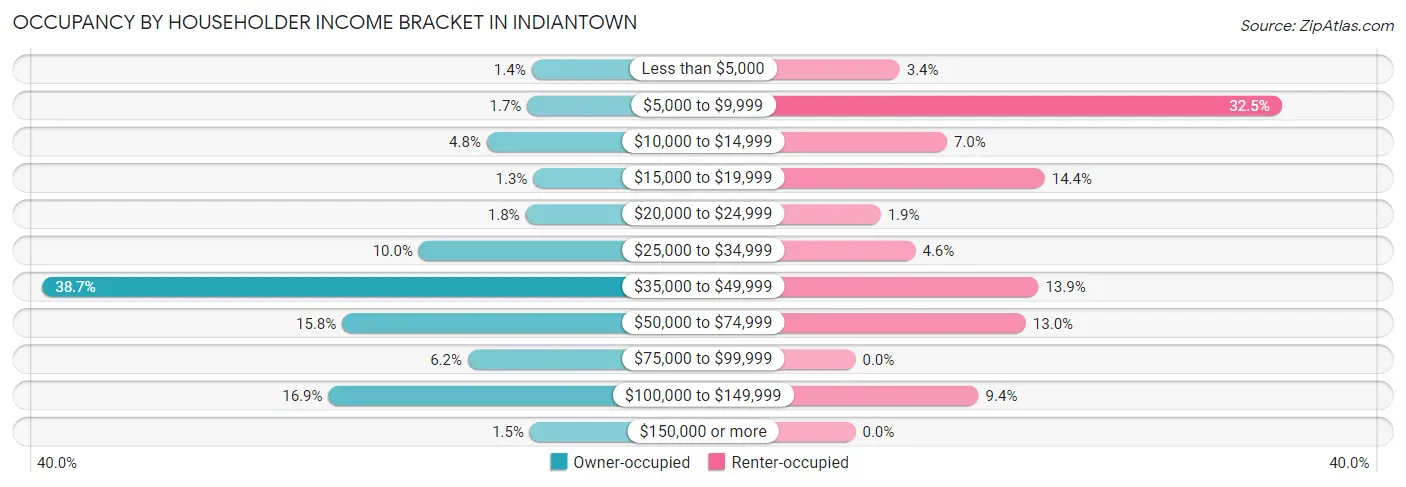
| Income Bracket | Owner-occupied | Renter-occupied |
| Less than $5,000 | 21 (1.4%) | 14 (3.4%) |
| $5,000 to $9,999 | 26 (1.7%) | 135 (32.5%) |
| $10,000 to $14,999 | 73 (4.8%) | 29 (7.0%) |
| $15,000 to $19,999 | 19 (1.3%) | 60 (14.4%) |
| $20,000 to $24,999 | 28 (1.8%) | 8 (1.9%) |
| $25,000 to $34,999 | 152 (10.0%) | 19 (4.6%) |
| $35,000 to $49,999 | 589 (38.7%) | 58 (13.9%) |
| $50,000 to $74,999 | 241 (15.8%) | 54 (13.0%) |
| $75,000 to $99,999 | 95 (6.2%) | 0 (0.0%) |
| $100,000 to $149,999 | 257 (16.9%) | 39 (9.4%) |
| $150,000 or more | 23 (1.5%) | 0 (0.0%) |
| Total | 1,524 (100.0%) | 416 (100.0%) |
Monthly Housing Cost Tiers in Indiantown
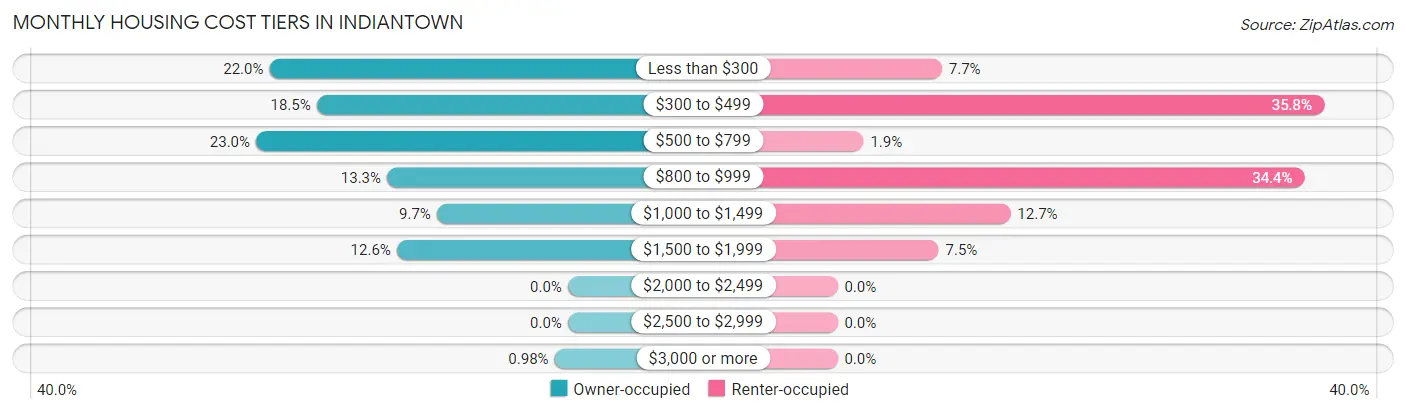
| Monthly Cost | Owner-occupied | Renter-occupied |
| Less than $300 | 335 (22.0%) | 32 (7.7%) |
| $300 to $499 | 282 (18.5%) | 149 (35.8%) |
| $500 to $799 | 350 (23.0%) | 8 (1.9%) |
| $800 to $999 | 203 (13.3%) | 143 (34.4%) |
| $1,000 to $1,499 | 147 (9.7%) | 53 (12.7%) |
| $1,500 to $1,999 | 192 (12.6%) | 31 (7.4%) |
| $2,000 to $2,499 | 0 (0.0%) | 0 (0.0%) |
| $2,500 to $2,999 | 0 (0.0%) | 0 (0.0%) |
| $3,000 or more | 15 (1.0%) | 0 (0.0%) |
| Total | 1,524 (100.0%) | 416 (100.0%) |
Physical Housing Characteristics in Indiantown
Housing Structures in Indiantown
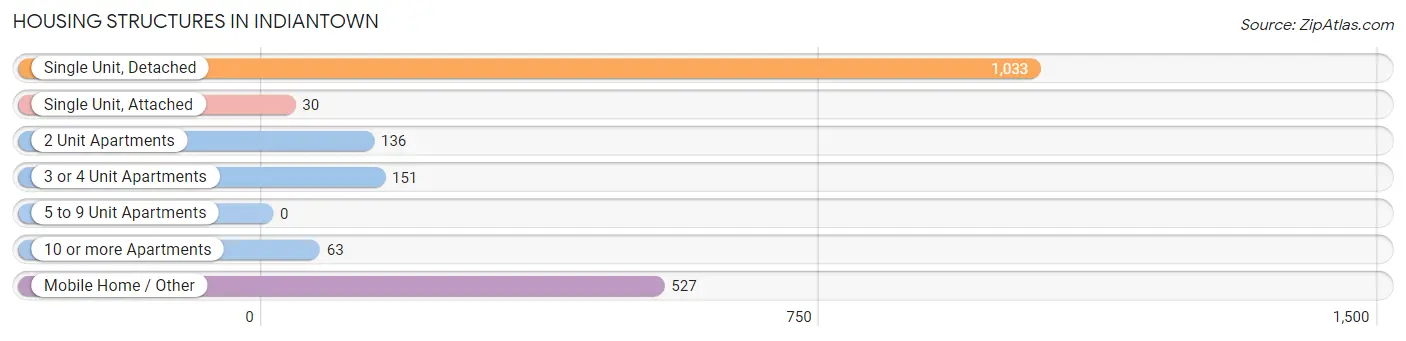
| Structure Type | # Housing Units | % Housing Units |
| Single Unit, Detached | 1,033 | 53.2% |
| Single Unit, Attached | 30 | 1.5% |
| 2 Unit Apartments | 136 | 7.0% |
| 3 or 4 Unit Apartments | 151 | 7.8% |
| 5 to 9 Unit Apartments | 0 | 0.0% |
| 10 or more Apartments | 63 | 3.3% |
| Mobile Home / Other | 527 | 27.2% |
| Total | 1,940 | 100.0% |
Housing Structures by Occupancy in Indiantown
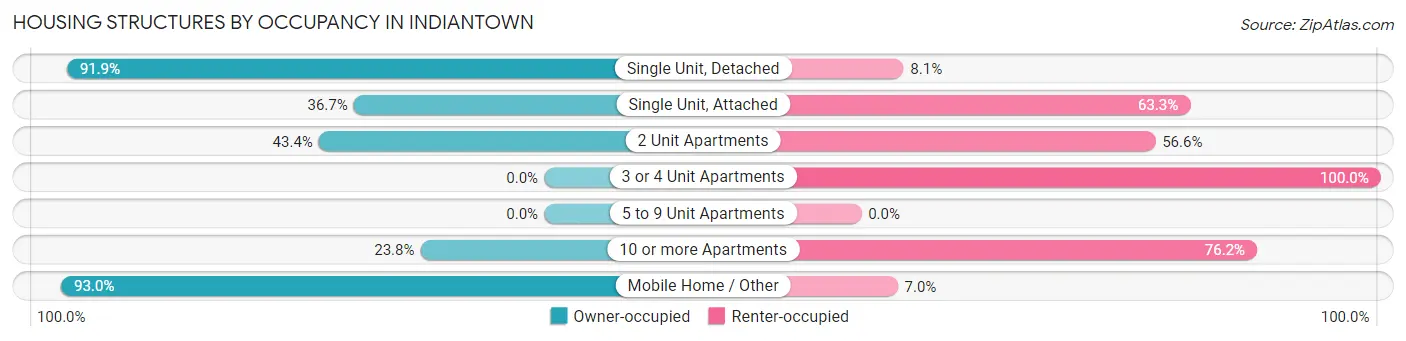
| Structure Type | Owner-occupied | Renter-occupied |
| Single Unit, Detached | 949 (91.9%) | 84 (8.1%) |
| Single Unit, Attached | 11 (36.7%) | 19 (63.3%) |
| 2 Unit Apartments | 59 (43.4%) | 77 (56.6%) |
| 3 or 4 Unit Apartments | 0 (0.0%) | 151 (100.0%) |
| 5 to 9 Unit Apartments | 0 (0.0%) | 0 (0.0%) |
| 10 or more Apartments | 15 (23.8%) | 48 (76.2%) |
| Mobile Home / Other | 490 (93.0%) | 37 (7.0%) |
| Total | 1,524 (78.6%) | 416 (21.4%) |
Housing Structures by Number of Rooms in Indiantown
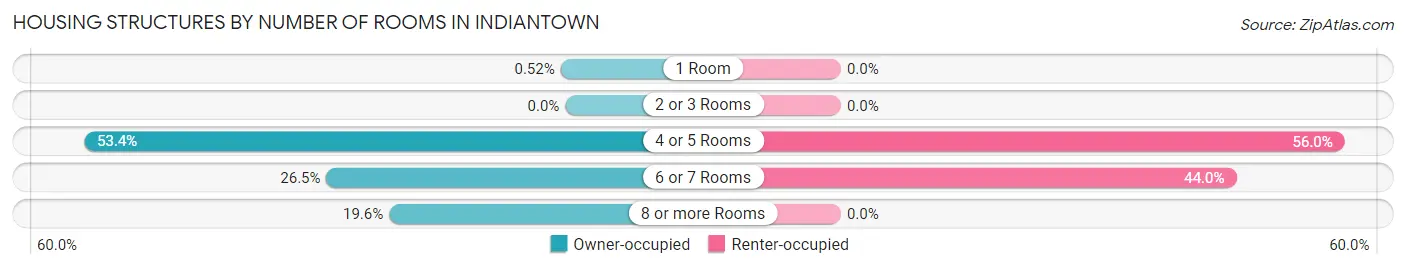
| Number of Rooms | Owner-occupied | Renter-occupied |
| 1 Room | 8 (0.5%) | 0 (0.0%) |
| 2 or 3 Rooms | 0 (0.0%) | 0 (0.0%) |
| 4 or 5 Rooms | 814 (53.4%) | 233 (56.0%) |
| 6 or 7 Rooms | 404 (26.5%) | 183 (44.0%) |
| 8 or more Rooms | 298 (19.6%) | 0 (0.0%) |
| Total | 1,524 (100.0%) | 416 (100.0%) |
Housing Structure by Heating Type in Indiantown
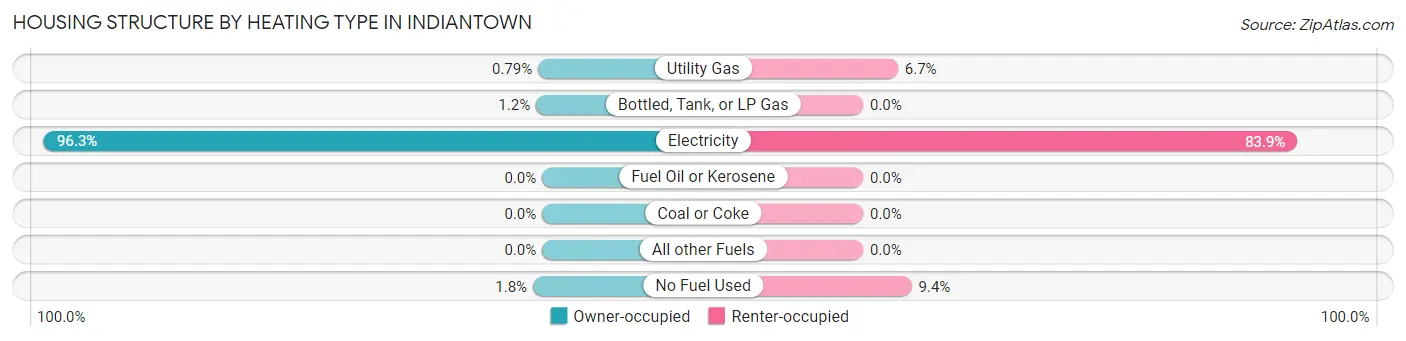
| Heating Type | Owner-occupied | Renter-occupied |
| Utility Gas | 12 (0.8%) | 28 (6.7%) |
| Bottled, Tank, or LP Gas | 18 (1.2%) | 0 (0.0%) |
| Electricity | 1,467 (96.3%) | 349 (83.9%) |
| Fuel Oil or Kerosene | 0 (0.0%) | 0 (0.0%) |
| Coal or Coke | 0 (0.0%) | 0 (0.0%) |
| All other Fuels | 0 (0.0%) | 0 (0.0%) |
| No Fuel Used | 27 (1.8%) | 39 (9.4%) |
| Total | 1,524 (100.0%) | 416 (100.0%) |
Household Vehicle Usage in Indiantown
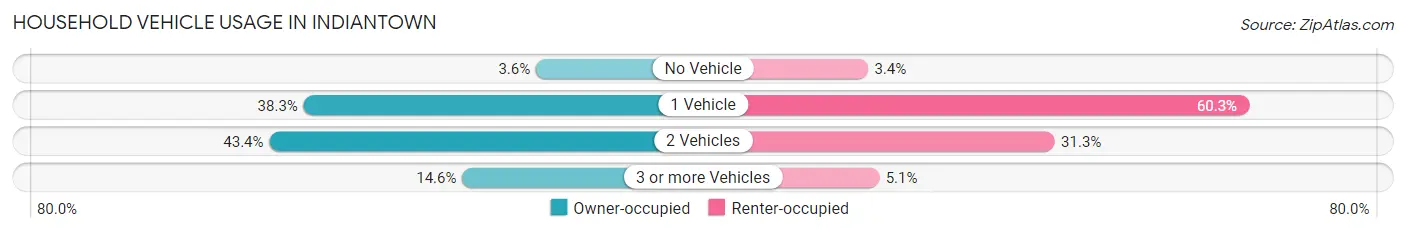
| Vehicles per Household | Owner-occupied | Renter-occupied |
| No Vehicle | 55 (3.6%) | 14 (3.4%) |
| 1 Vehicle | 584 (38.3%) | 251 (60.3%) |
| 2 Vehicles | 662 (43.4%) | 130 (31.2%) |
| 3 or more Vehicles | 223 (14.6%) | 21 (5.1%) |
| Total | 1,524 (100.0%) | 416 (100.0%) |
Real Estate & Mortgages in Indiantown
Real Estate and Mortgage Overview in Indiantown
| Characteristic | Without Mortgage | With Mortgage |
| Housing Units | 874 | 650 |
| Median Property Value | $81,800 | $177,900 |
| Median Household Income | $48,836 | $0 |
| Monthly Housing Costs | $381 | $15 |
| Real Estate Taxes | $545 | $116 |
Property Value by Mortgage Status in Indiantown
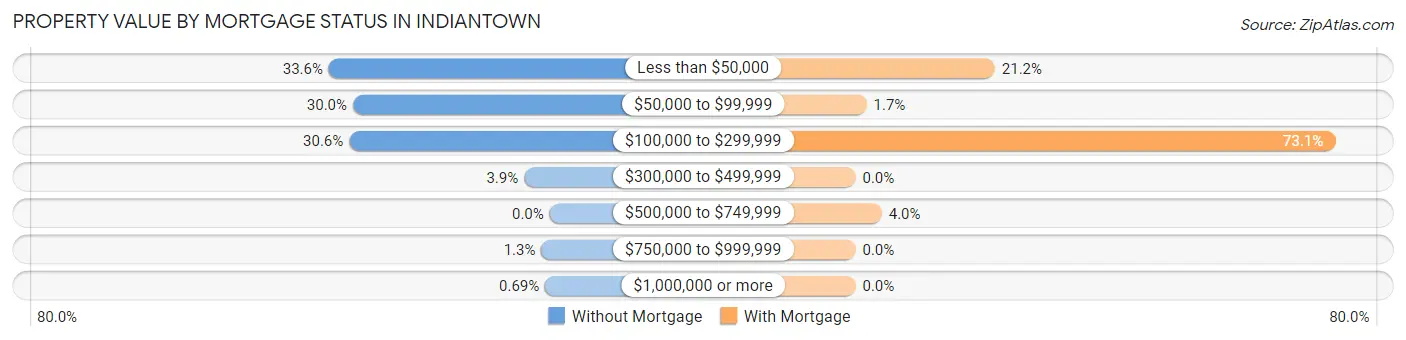
| Property Value | Without Mortgage | With Mortgage |
| Less than $50,000 | 294 (33.6%) | 138 (21.2%) |
| $50,000 to $99,999 | 262 (30.0%) | 11 (1.7%) |
| $100,000 to $299,999 | 267 (30.5%) | 475 (73.1%) |
| $300,000 to $499,999 | 34 (3.9%) | 0 (0.0%) |
| $500,000 to $749,999 | 0 (0.0%) | 26 (4.0%) |
| $750,000 to $999,999 | 11 (1.3%) | 0 (0.0%) |
| $1,000,000 or more | 6 (0.7%) | 0 (0.0%) |
| Total | 874 (100.0%) | 650 (100.0%) |
Household Income by Mortgage Status in Indiantown
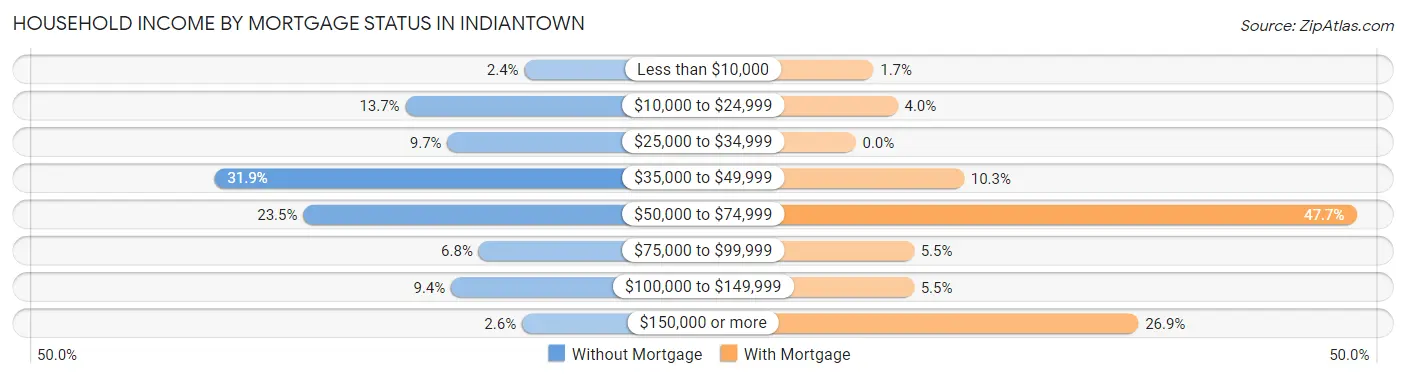
| Household Income | Without Mortgage | With Mortgage |
| Less than $10,000 | 21 (2.4%) | 11 (1.7%) |
| $10,000 to $24,999 | 120 (13.7%) | 26 (4.0%) |
| $25,000 to $34,999 | 85 (9.7%) | 0 (0.0%) |
| $35,000 to $49,999 | 279 (31.9%) | 67 (10.3%) |
| $50,000 to $74,999 | 205 (23.5%) | 310 (47.7%) |
| $75,000 to $99,999 | 59 (6.8%) | 36 (5.5%) |
| $100,000 to $149,999 | 82 (9.4%) | 36 (5.5%) |
| $150,000 or more | 23 (2.6%) | 175 (26.9%) |
| Total | 874 (100.0%) | 650 (100.0%) |
Property Value to Household Income Ratio in Indiantown
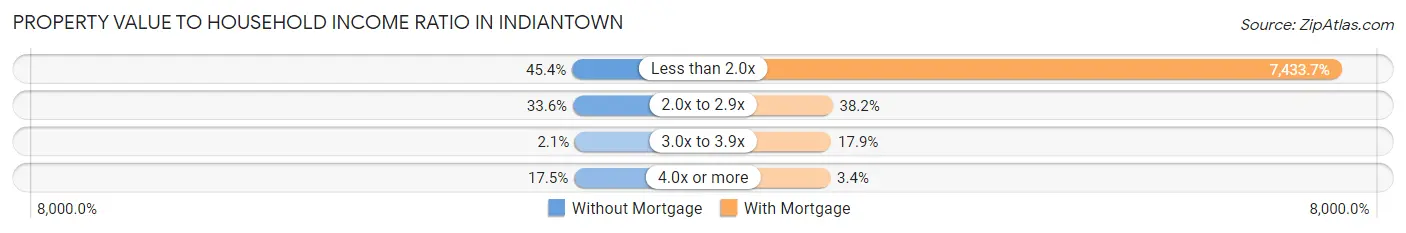
| Value-to-Income Ratio | Without Mortgage | With Mortgage |
| Less than 2.0x | 397 (45.4%) | 48,319 (7,433.7%) |
| 2.0x to 2.9x | 294 (33.6%) | 248 (38.2%) |
| 3.0x to 3.9x | 18 (2.1%) | 116 (17.8%) |
| 4.0x or more | 153 (17.5%) | 22 (3.4%) |
| Total | 874 (100.0%) | 650 (100.0%) |
Real Estate Taxes by Mortgage Status in Indiantown
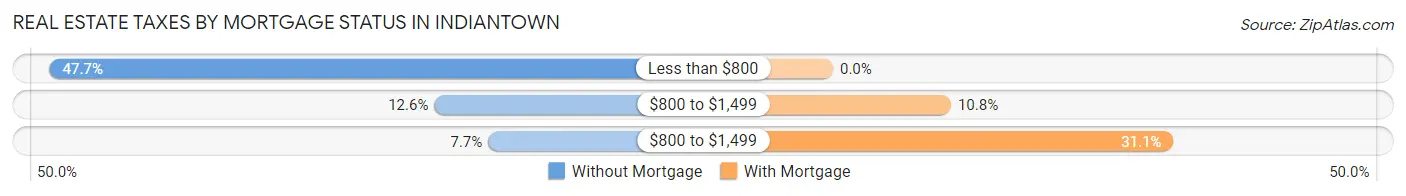
| Property Taxes | Without Mortgage | With Mortgage |
| Less than $800 | 417 (47.7%) | 0 (0.0%) |
| $800 to $1,499 | 110 (12.6%) | 70 (10.8%) |
| $800 to $1,499 | 67 (7.7%) | 202 (31.1%) |
| Total | 874 (100.0%) | 650 (100.0%) |
Health & Disability in Indiantown
Health Insurance Coverage by Age in Indiantown
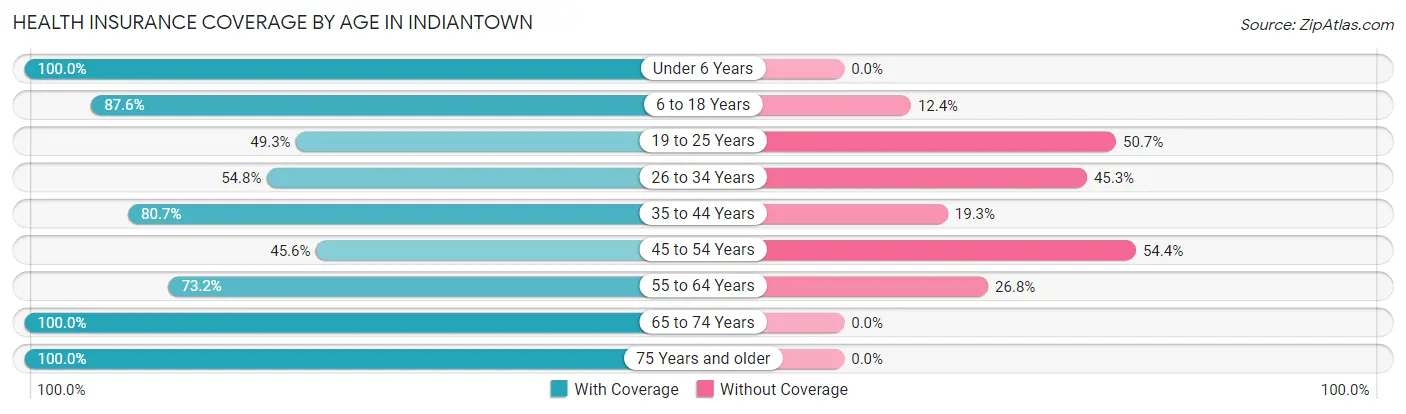
| Age Bracket | With Coverage | Without Coverage |
| Under 6 Years | 671 (100.0%) | 0 (0.0%) |
| 6 to 18 Years | 1,318 (87.6%) | 187 (12.4%) |
| 19 to 25 Years | 392 (49.3%) | 403 (50.7%) |
| 26 to 34 Years | 369 (54.7%) | 305 (45.3%) |
| 35 to 44 Years | 610 (80.7%) | 146 (19.3%) |
| 45 to 54 Years | 208 (45.6%) | 248 (54.4%) |
| 55 to 64 Years | 360 (73.2%) | 132 (26.8%) |
| 65 to 74 Years | 694 (100.0%) | 0 (0.0%) |
| 75 Years and older | 581 (100.0%) | 0 (0.0%) |
| Total | 5,203 (78.5%) | 1,421 (21.4%) |
Health Insurance Coverage by Citizenship Status in Indiantown
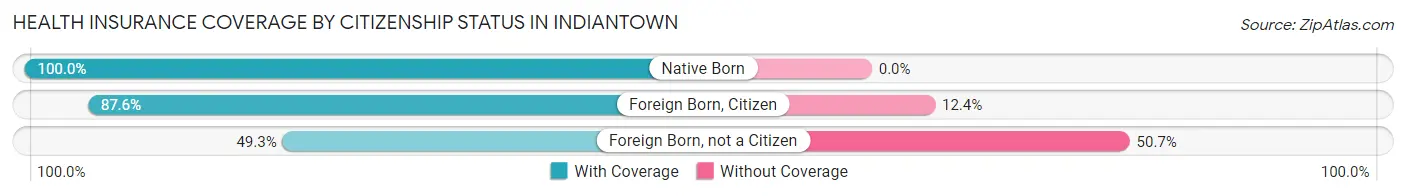
| Citizenship Status | With Coverage | Without Coverage |
| Native Born | 671 (100.0%) | 0 (0.0%) |
| Foreign Born, Citizen | 1,318 (87.6%) | 187 (12.4%) |
| Foreign Born, not a Citizen | 392 (49.3%) | 403 (50.7%) |
Health Insurance Coverage by Household Income in Indiantown
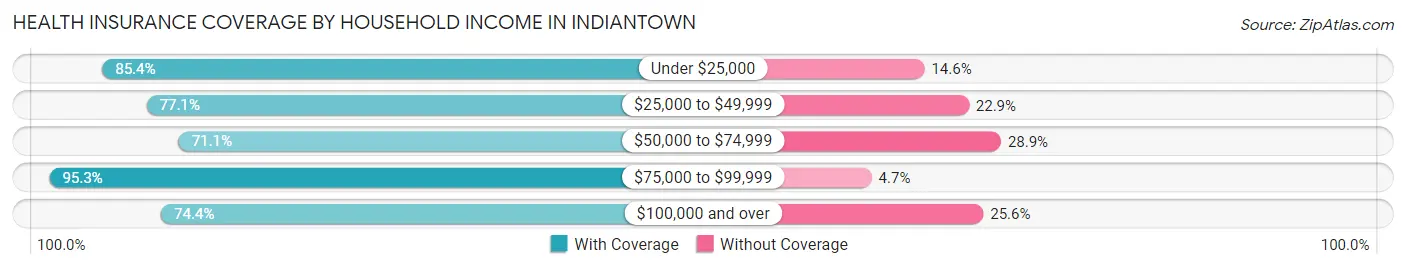
| Household Income | With Coverage | Without Coverage |
| Under $25,000 | 1,127 (85.4%) | 192 (14.6%) |
| $25,000 to $49,999 | 1,713 (77.1%) | 508 (22.9%) |
| $50,000 to $74,999 | 692 (71.1%) | 281 (28.9%) |
| $75,000 to $99,999 | 450 (95.3%) | 22 (4.7%) |
| $100,000 and over | 1,216 (74.4%) | 418 (25.6%) |
Public vs Private Health Insurance Coverage by Age in Indiantown
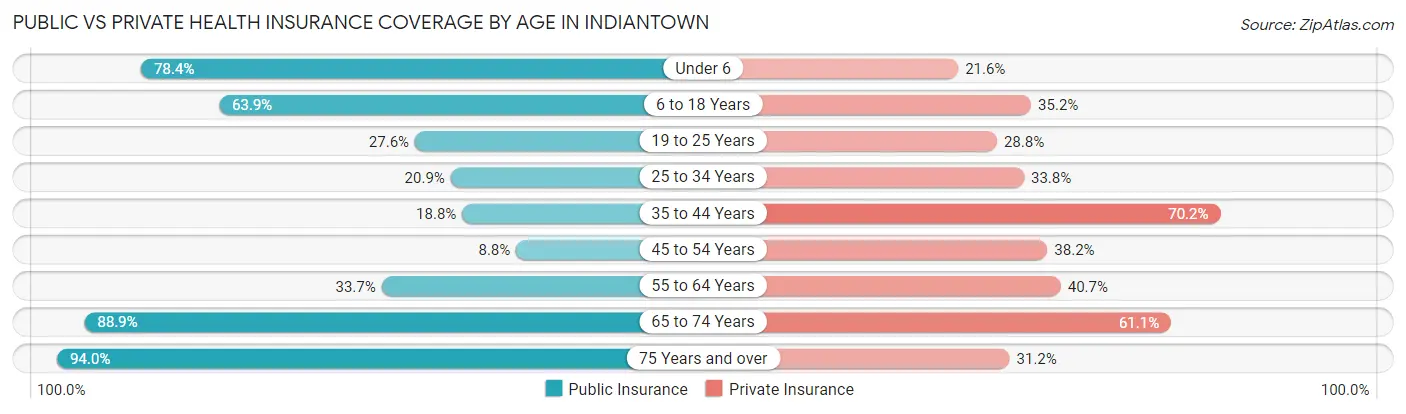
| Age Bracket | Public Insurance | Private Insurance |
| Under 6 | 526 (78.4%) | 145 (21.6%) |
| 6 to 18 Years | 962 (63.9%) | 529 (35.1%) |
| 19 to 25 Years | 219 (27.6%) | 229 (28.8%) |
| 25 to 34 Years | 141 (20.9%) | 228 (33.8%) |
| 35 to 44 Years | 142 (18.8%) | 531 (70.2%) |
| 45 to 54 Years | 40 (8.8%) | 174 (38.2%) |
| 55 to 64 Years | 166 (33.7%) | 200 (40.6%) |
| 65 to 74 Years | 617 (88.9%) | 424 (61.1%) |
| 75 Years and over | 546 (94.0%) | 181 (31.1%) |
| Total | 3,359 (50.7%) | 2,641 (39.9%) |
Disability Status by Sex by Age in Indiantown
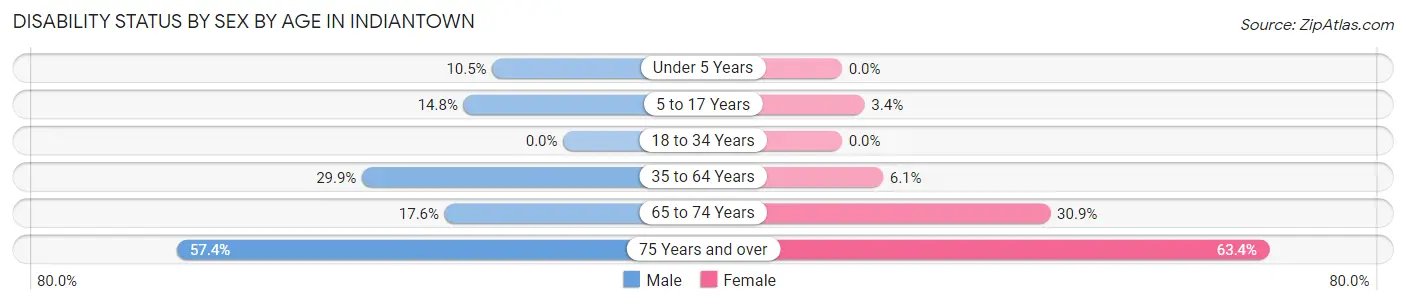
| Age Bracket | Male | Female |
| Under 5 Years | 8 (10.5%) | 0 (0.0%) |
| 5 to 17 Years | 117 (14.8%) | 26 (3.4%) |
| 18 to 34 Years | 0 (0.0%) | 0 (0.0%) |
| 35 to 64 Years | 308 (29.9%) | 41 (6.1%) |
| 65 to 74 Years | 51 (17.6%) | 125 (30.9%) |
| 75 Years and over | 175 (57.4%) | 175 (63.4%) |
Disability Class by Sex by Age in Indiantown
Disability Class: Hearing Difficulty
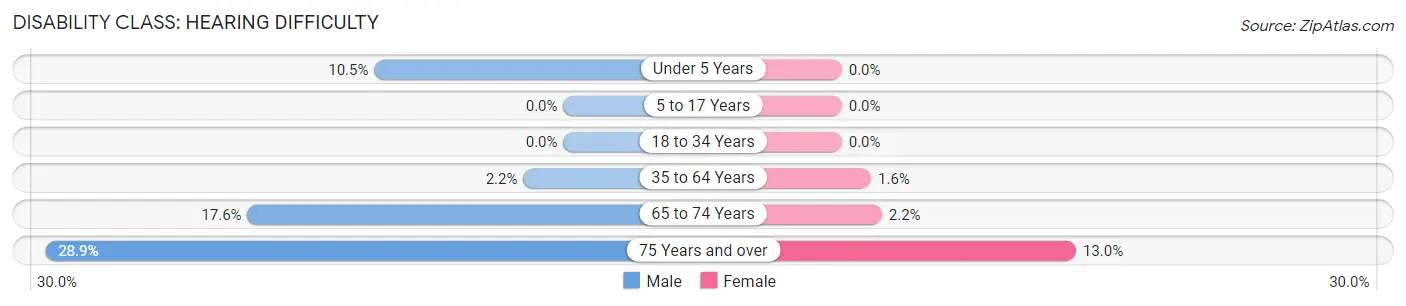
| Age Bracket | Male | Female |
| Under 5 Years | 8 (10.5%) | 0 (0.0%) |
| 5 to 17 Years | 0 (0.0%) | 0 (0.0%) |
| 18 to 34 Years | 0 (0.0%) | 0 (0.0%) |
| 35 to 64 Years | 23 (2.2%) | 11 (1.6%) |
| 65 to 74 Years | 51 (17.6%) | 9 (2.2%) |
| 75 Years and over | 88 (28.8%) | 36 (13.0%) |
Disability Class: Vision Difficulty
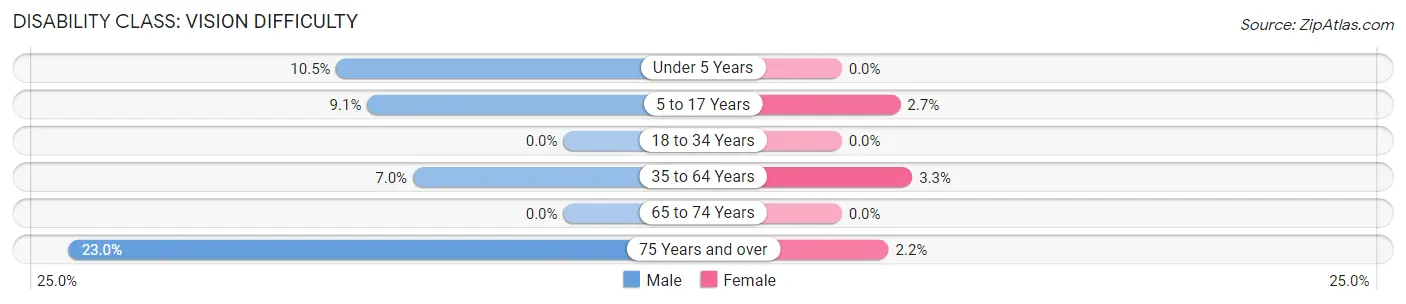
| Age Bracket | Male | Female |
| Under 5 Years | 8 (10.5%) | 0 (0.0%) |
| 5 to 17 Years | 72 (9.1%) | 21 (2.7%) |
| 18 to 34 Years | 0 (0.0%) | 0 (0.0%) |
| 35 to 64 Years | 72 (7.0%) | 22 (3.3%) |
| 65 to 74 Years | 0 (0.0%) | 0 (0.0%) |
| 75 Years and over | 70 (23.0%) | 6 (2.2%) |
Disability Class: Cognitive Difficulty
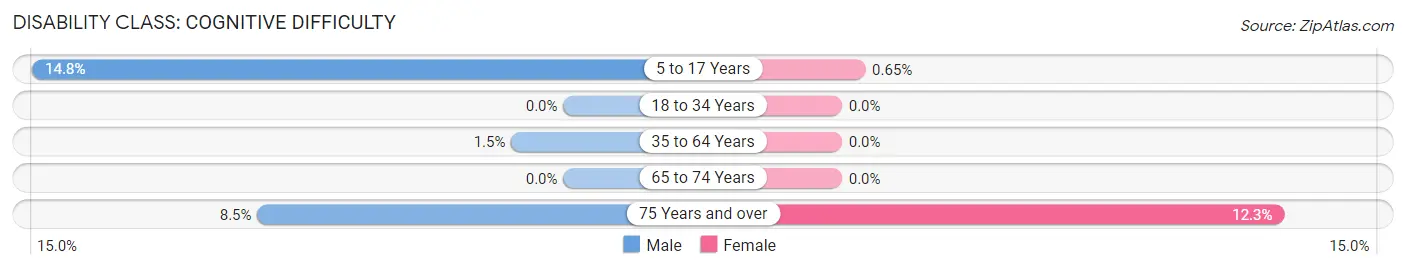
| Age Bracket | Male | Female |
| 5 to 17 Years | 117 (14.8%) | 5 (0.6%) |
| 18 to 34 Years | 0 (0.0%) | 0 (0.0%) |
| 35 to 64 Years | 15 (1.5%) | 0 (0.0%) |
| 65 to 74 Years | 0 (0.0%) | 0 (0.0%) |
| 75 Years and over | 26 (8.5%) | 34 (12.3%) |
Disability Class: Ambulatory Difficulty
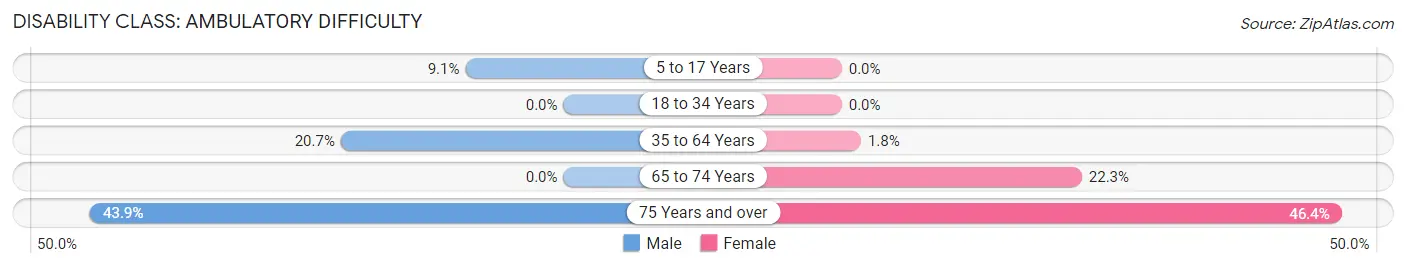
| Age Bracket | Male | Female |
| 5 to 17 Years | 72 (9.1%) | 0 (0.0%) |
| 18 to 34 Years | 0 (0.0%) | 0 (0.0%) |
| 35 to 64 Years | 213 (20.7%) | 12 (1.8%) |
| 65 to 74 Years | 0 (0.0%) | 90 (22.3%) |
| 75 Years and over | 134 (43.9%) | 128 (46.4%) |
Disability Class: Self-Care Difficulty
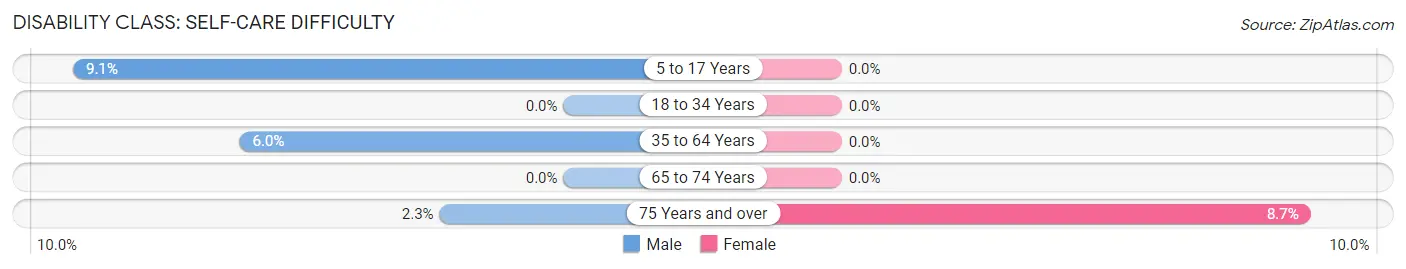
| Age Bracket | Male | Female |
| 5 to 17 Years | 72 (9.1%) | 0 (0.0%) |
| 18 to 34 Years | 0 (0.0%) | 0 (0.0%) |
| 35 to 64 Years | 62 (6.0%) | 0 (0.0%) |
| 65 to 74 Years | 0 (0.0%) | 0 (0.0%) |
| 75 Years and over | 7 (2.3%) | 24 (8.7%) |
Technology Access in Indiantown
Computing Device Access in Indiantown
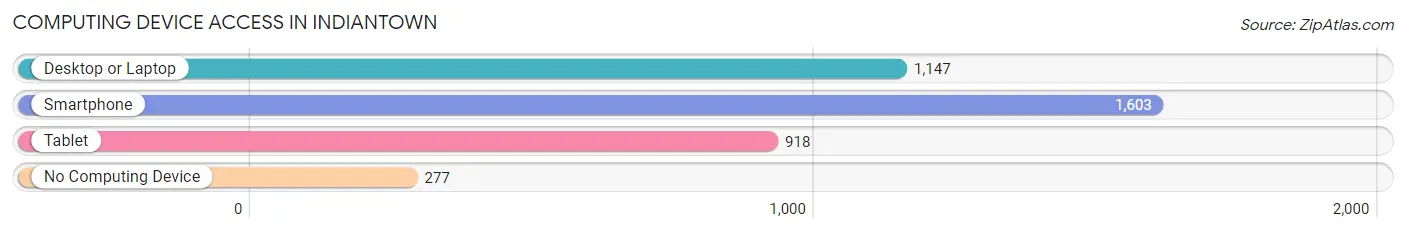
| Device Type | # Households | % Households |
| Desktop or Laptop | 1,147 | 59.1% |
| Smartphone | 1,603 | 82.6% |
| Tablet | 918 | 47.3% |
| No Computing Device | 277 | 14.3% |
| Total | 1,940 | 100.0% |
Internet Access in Indiantown
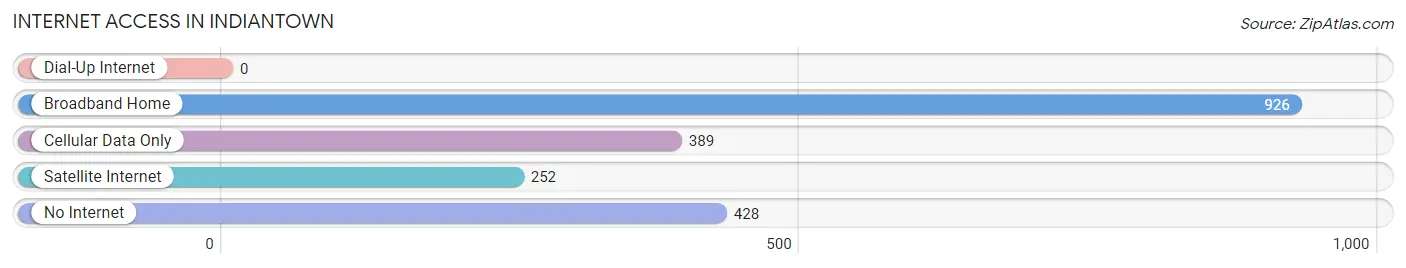
| Internet Type | # Households | % Households |
| Dial-Up Internet | 0 | 0.0% |
| Broadband Home | 926 | 47.7% |
| Cellular Data Only | 389 | 20.1% |
| Satellite Internet | 252 | 13.0% |
| No Internet | 428 | 22.1% |
| Total | 1,940 | 100.0% |
Indiantown Summary
Indiantown is a small unincorporated community located in Martin County, Florida, United States. It is located on the western shore of Lake Okeechobee, approximately 25 miles west of Stuart. The population was 5,971 at the 2010 census.
History
Indiantown was originally inhabited by the Seminole Indians, who were forced to relocate to the area in the early 19th century. The Seminoles were forced to move from their traditional homelands in the southeastern United States to the area now known as Indiantown. The Seminoles were forced to move to the area due to the Indian Removal Act of 1830, which was enacted by President Andrew Jackson. The Seminoles were forced to move to the area in order to make way for white settlers.
The area was first settled by white settlers in the late 19th century. The first settlers were mostly farmers and ranchers who were attracted to the area due to its fertile soil and abundant wildlife. The area was also attractive to settlers due to its proximity to Lake Okeechobee, which provided a source of fresh water and transportation.
In the early 20th century, the area began to develop as a small town. The town was officially incorporated in 1925 and was named after the Seminole Indians who had been forced to relocate to the area.
Geography
Indiantown is located in Martin County, Florida, approximately 25 miles west of Stuart. The town is situated on the western shore of Lake Okeechobee, which is the largest lake in the state of Florida. The town is located in a rural area and is surrounded by agricultural land.
The town has a total area of 4.2 square miles, all of which is land. The town is located at an elevation of 25 feet above sea level.
Economy
The economy of Indiantown is largely based on agriculture and tourism. The town is home to several large agricultural operations, including citrus groves, cattle ranches, and vegetable farms. The town is also home to several tourist attractions, including the Indiantown Marina, which offers boat rentals and fishing charters.
The town is also home to several businesses, including restaurants, retail stores, and service providers. The town is also home to several manufacturing companies, including a paper mill and a woodworking factory.
Demographics
As of the 2010 census, the population of Indiantown was 5,971. The racial makeup of the town was 79.3% White, 15.2% African American, 0.3% Native American, 0.7% Asian, 0.1% Pacific Islander, and 4.4% from other races. Hispanic or Latino of any race were 11.3% of the population.
The median income for a household in the town was $35,938, and the median income for a family was $41,938. The per capita income for the town was $17,938. About 17.3% of families and 20.2% of the population were below the poverty line, including 28.3% of those under age 18 and 11.2% of those age 65 or over.
Common Questions
What is Per Capita Income in Indiantown?
Per Capita income in Indiantown is $16,685.
What is the Median Family Income in Indiantown?
Median Family Income in Indiantown is $45,757.
What is the Median Household income in Indiantown?
Median Household Income in Indiantown is $47,627.
What is Income or Wage Gap in Indiantown?
Income or Wage Gap in Indiantown is 4.1%.
Women in Indiantown earn 95.9 cents for every dollar earned by a man.
What is Inequality or Gini Index in Indiantown?
Inequality or Gini Index in Indiantown is 0.39.
What is the Total Population of Indiantown?
Total Population of Indiantown is 6,624.
What is the Total Male Population of Indiantown?
Total Male Population of Indiantown is 3,378.
What is the Total Female Population of Indiantown?
Total Female Population of Indiantown is 3,246.
What is the Ratio of Males per 100 Females in Indiantown?
There are 104.07 Males per 100 Females in Indiantown.
What is the Ratio of Females per 100 Males in Indiantown?
There are 96.09 Females per 100 Males in Indiantown.
What is the Median Population Age in Indiantown?
Median Population Age in Indiantown is 31.3 Years.
What is the Average Family Size in Indiantown
Average Family Size in Indiantown is 3.9 People.
What is the Average Household Size in Indiantown
Average Household Size in Indiantown is 3.4 People.
How Large is the Labor Force in Indiantown?
There are 2,700 People in the Labor Forcein in Indiantown.
What is the Percentage of People in the Labor Force in Indiantown?
57.0% of People are in the Labor Force in Indiantown.
What is the Unemployment Rate in Indiantown?
Unemployment Rate in Indiantown is 3.2%.