Hobe Sound, FL Map & Demographics
Hobe Sound Map
Hobe Sound Overview
$42,522
PER CAPITA INCOME
$76,153
AVG FAMILY INCOME
$62,677
AVG HOUSEHOLD INCOME
24.6%
WAGE / INCOME GAP [ % ]
75.4¢/ $1
WAGE / INCOME GAP [ $ ]
$15,920
FAMILY INCOME DEFICIT
0.50
INEQUALITY / GINI INDEX
14,188
TOTAL POPULATION
7,246
MALE POPULATION
6,942
FEMALE POPULATION
104.38
MALES / 100 FEMALES
95.80
FEMALES / 100 MALES
56.2
MEDIAN AGE
2.9
AVG FAMILY SIZE
2.2
AVG HOUSEHOLD SIZE
6,514
LABOR FORCE [ PEOPLE ]
53.4%
PERCENT IN LABOR FORCE
5.3%
UNEMPLOYMENT RATE
Hobe Sound Zip Codes
Hobe Sound Area Codes
Income in Hobe Sound
Income Overview in Hobe Sound
Per Capita Income in Hobe Sound is $42,522, while median incomes of families and households are $76,153 and $62,677 respectively.
| Characteristic | Number | Measure |
| Per Capita Income | 14,188 | $42,522 |
| Median Family Income | 3,485 | $76,153 |
| Mean Family Income | 3,485 | $95,778 |
| Median Household Income | 6,234 | $62,677 |
| Mean Household Income | 6,234 | $93,407 |
| Income Deficit | 3,485 | $15,920 |
| Wage / Income Gap (%) | 14,188 | 24.58% |
| Wage / Income Gap ($) | 14,188 | 75.42¢ per $1 |
| Gini / Inequality Index | 14,188 | 0.50 |
Earnings by Sex in Hobe Sound
Average Earnings in Hobe Sound are $28,666, $34,913 for men and $26,332 for women, a difference of 24.6%.
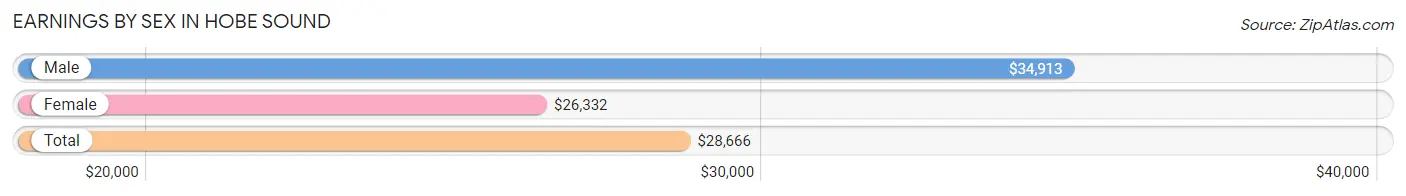
| Sex | Number | Average Earnings |
| Male | 3,497 (51.7%) | $34,913 |
| Female | 3,267 (48.3%) | $26,332 |
| Total | 6,764 (100.0%) | $28,666 |
Earnings by Sex by Income Bracket in Hobe Sound
The most common earnings brackets in Hobe Sound are $100,000+ for men (569 | 16.3%) and $25,000 to $29,999 for women (522 | 16.0%).
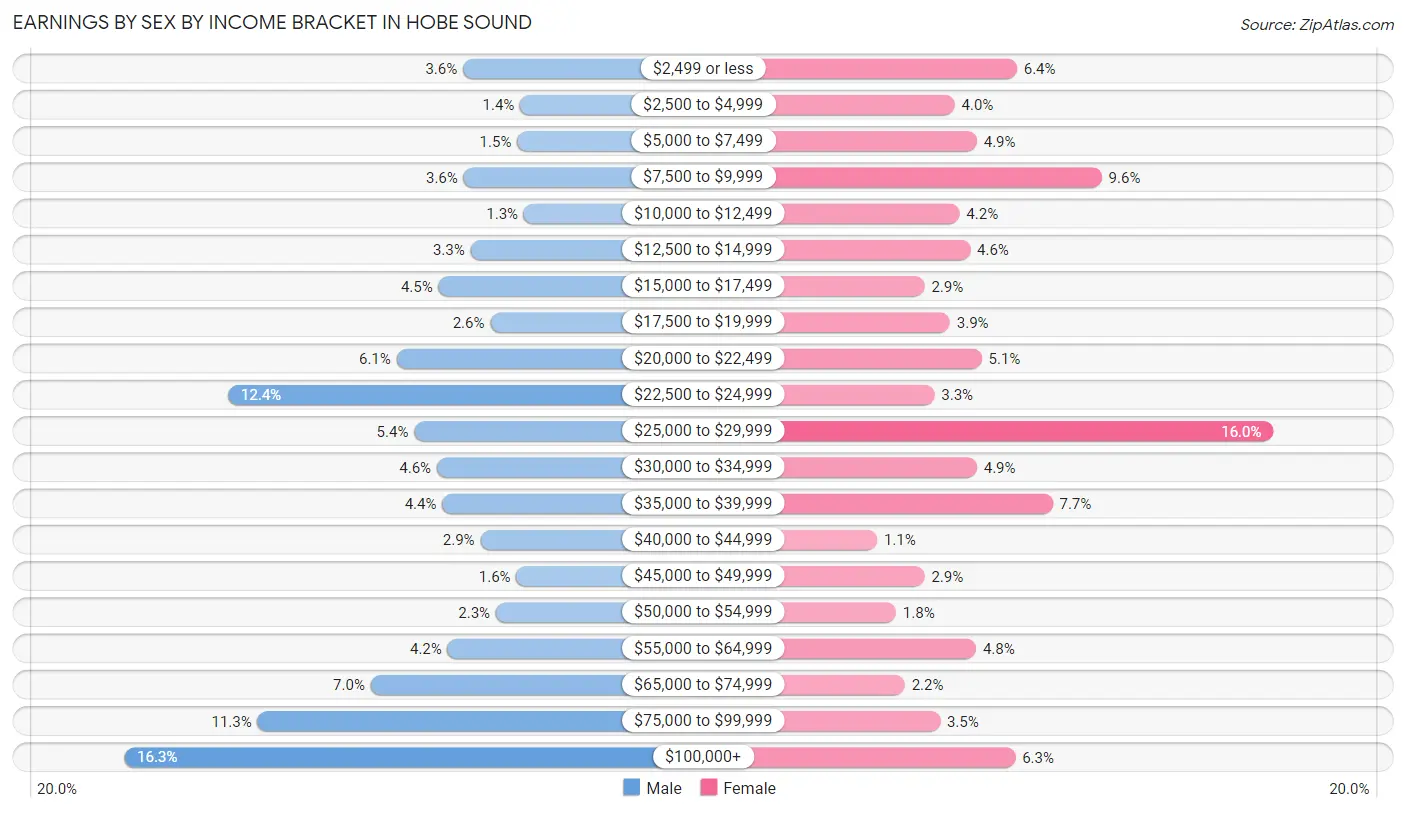
| Income | Male | Female |
| $2,499 or less | 125 (3.6%) | 208 (6.4%) |
| $2,500 to $4,999 | 50 (1.4%) | 132 (4.0%) |
| $5,000 to $7,499 | 54 (1.5%) | 159 (4.9%) |
| $7,500 to $9,999 | 124 (3.5%) | 312 (9.6%) |
| $10,000 to $12,499 | 45 (1.3%) | 138 (4.2%) |
| $12,500 to $14,999 | 115 (3.3%) | 151 (4.6%) |
| $15,000 to $17,499 | 157 (4.5%) | 95 (2.9%) |
| $17,500 to $19,999 | 89 (2.5%) | 126 (3.9%) |
| $20,000 to $22,499 | 212 (6.1%) | 165 (5.1%) |
| $22,500 to $24,999 | 433 (12.4%) | 107 (3.3%) |
| $25,000 to $29,999 | 189 (5.4%) | 522 (16.0%) |
| $30,000 to $34,999 | 159 (4.5%) | 159 (4.9%) |
| $35,000 to $39,999 | 152 (4.3%) | 252 (7.7%) |
| $40,000 to $44,999 | 102 (2.9%) | 37 (1.1%) |
| $45,000 to $49,999 | 55 (1.6%) | 95 (2.9%) |
| $50,000 to $54,999 | 82 (2.3%) | 60 (1.8%) |
| $55,000 to $64,999 | 145 (4.2%) | 158 (4.8%) |
| $65,000 to $74,999 | 246 (7.0%) | 71 (2.2%) |
| $75,000 to $99,999 | 394 (11.3%) | 114 (3.5%) |
| $100,000+ | 569 (16.3%) | 206 (6.3%) |
| Total | 3,497 (100.0%) | 3,267 (100.0%) |
Earnings by Sex by Educational Attainment in Hobe Sound
Average earnings in Hobe Sound are $43,469 for men and $27,747 for women, a difference of 36.2%. Men with an educational attainment of graduate degree enjoy the highest average annual earnings of $112,206, while those with less than high school education earn the least with $24,226. Women with an educational attainment of graduate degree earn the most with the average annual earnings of $95,417, while those with less than high school education have the smallest earnings of $16,429.
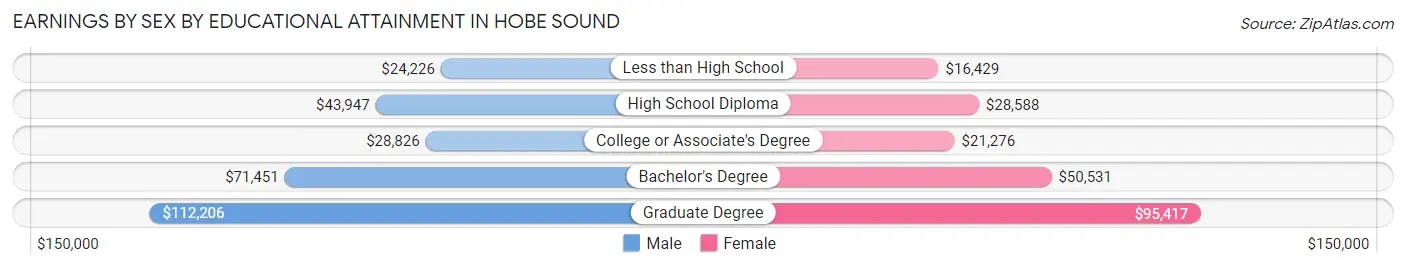
| Educational Attainment | Male Income | Female Income |
| Less than High School | $24,226 | $16,429 |
| High School Diploma | $43,947 | $28,588 |
| College or Associate's Degree | $28,826 | $21,276 |
| Bachelor's Degree | $71,451 | $50,531 |
| Graduate Degree | $112,206 | $95,417 |
| Total | $43,469 | $27,747 |
Family Income in Hobe Sound
Family Income Brackets in Hobe Sound
According to the Hobe Sound family income data, there are 721 families falling into the $50,000 to $74,999 income range, which is the most common income bracket and makes up 20.7% of all families. Conversely, the $10,000 to $14,999 income bracket is the least frequent group with only 17 families (0.5%) belonging to this category.
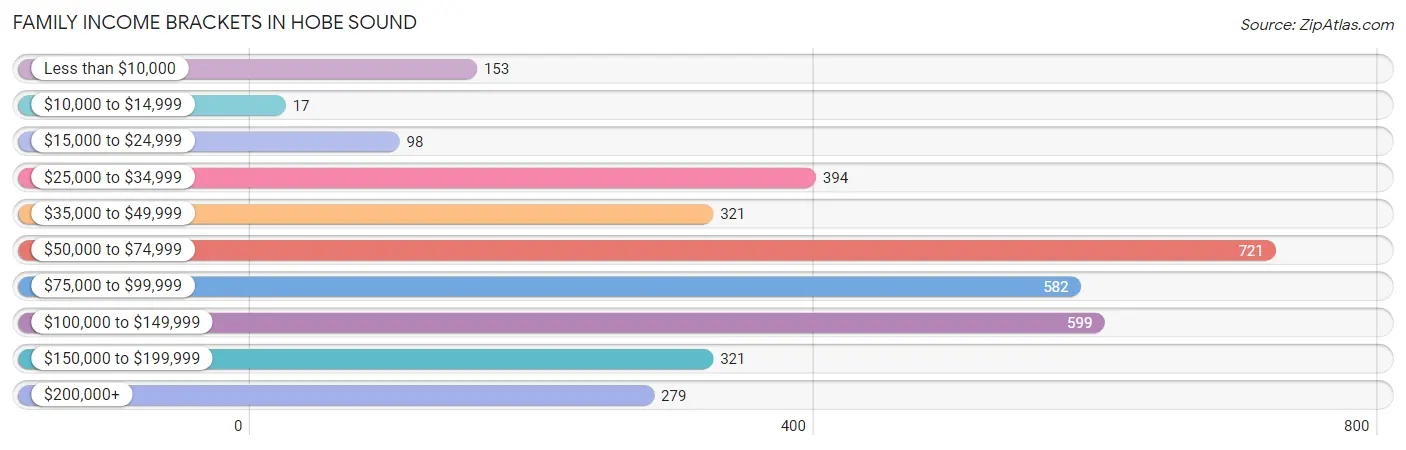
| Income Bracket | # Families | % Families |
| Less than $10,000 | 153 | 4.4% |
| $10,000 to $14,999 | 17 | 0.5% |
| $15,000 to $24,999 | 98 | 2.8% |
| $25,000 to $34,999 | 394 | 11.3% |
| $35,000 to $49,999 | 321 | 9.2% |
| $50,000 to $74,999 | 721 | 20.7% |
| $75,000 to $99,999 | 582 | 16.7% |
| $100,000 to $149,999 | 599 | 17.2% |
| $150,000 to $199,999 | 321 | 9.2% |
| $200,000+ | 279 | 8.0% |
Family Income by Famaliy Size in Hobe Sound
5-person families (155 | 4.4%) account for the highest median family income in Hobe Sound with $92,762 per family, while 2-person families (2,329 | 66.8%) have the highest median income of $37,040 per family member.
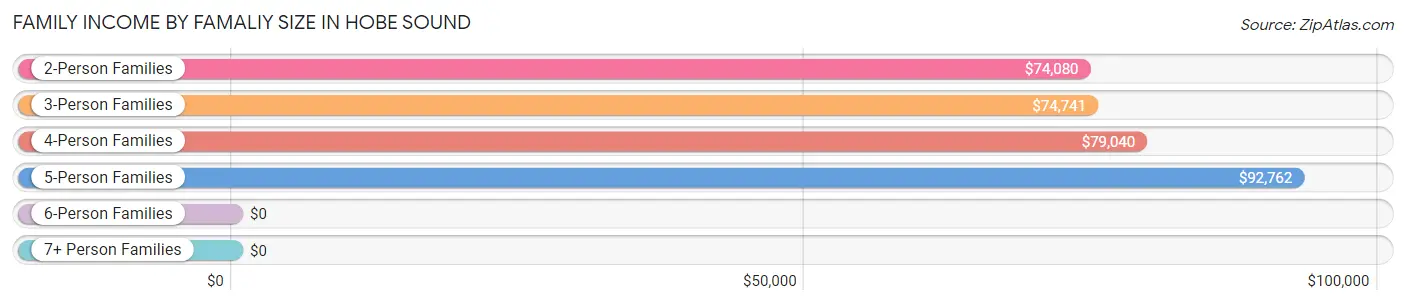
| Income Bracket | # Families | Median Income |
| 2-Person Families | 2,329 (66.8%) | $74,080 |
| 3-Person Families | 584 (16.8%) | $74,741 |
| 4-Person Families | 349 (10.0%) | $79,040 |
| 5-Person Families | 155 (4.4%) | $92,762 |
| 6-Person Families | 54 (1.5%) | $0 |
| 7+ Person Families | 14 (0.4%) | $0 |
| Total | 3,485 (100.0%) | $76,153 |
Family Income by Number of Earners in Hobe Sound
The median family income in Hobe Sound is $76,153, with families comprising 3+ earners (180) having the highest median family income of $123,864, while families with 1 earner (1,349) have the lowest median family income of $52,880, accounting for 5.2% and 38.7% of families, respectively.
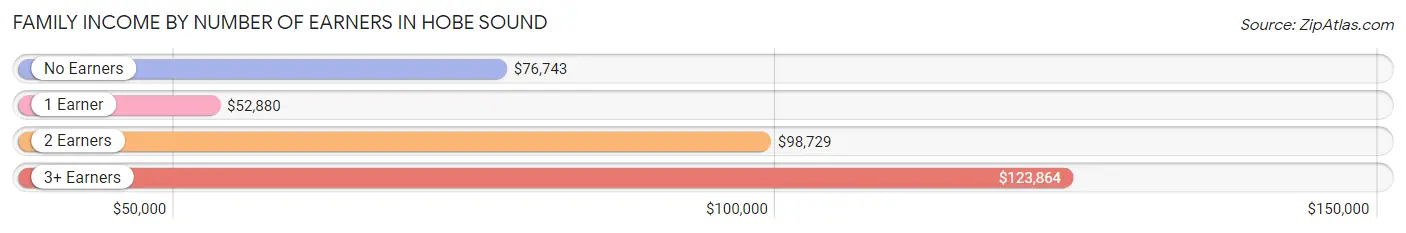
| Number of Earners | # Families | Median Income |
| No Earners | 785 (22.5%) | $76,743 |
| 1 Earner | 1,349 (38.7%) | $52,880 |
| 2 Earners | 1,171 (33.6%) | $98,729 |
| 3+ Earners | 180 (5.2%) | $123,864 |
| Total | 3,485 (100.0%) | $76,153 |
Household Income in Hobe Sound
Household Income Brackets in Hobe Sound
With 1,054 households falling in the category, the $50,000 to $74,999 income range is the most frequent in Hobe Sound, accounting for 16.9% of all households. In contrast, only 106 households (1.7%) fall into the $10,000 to $14,999 income bracket, making it the least populous group.
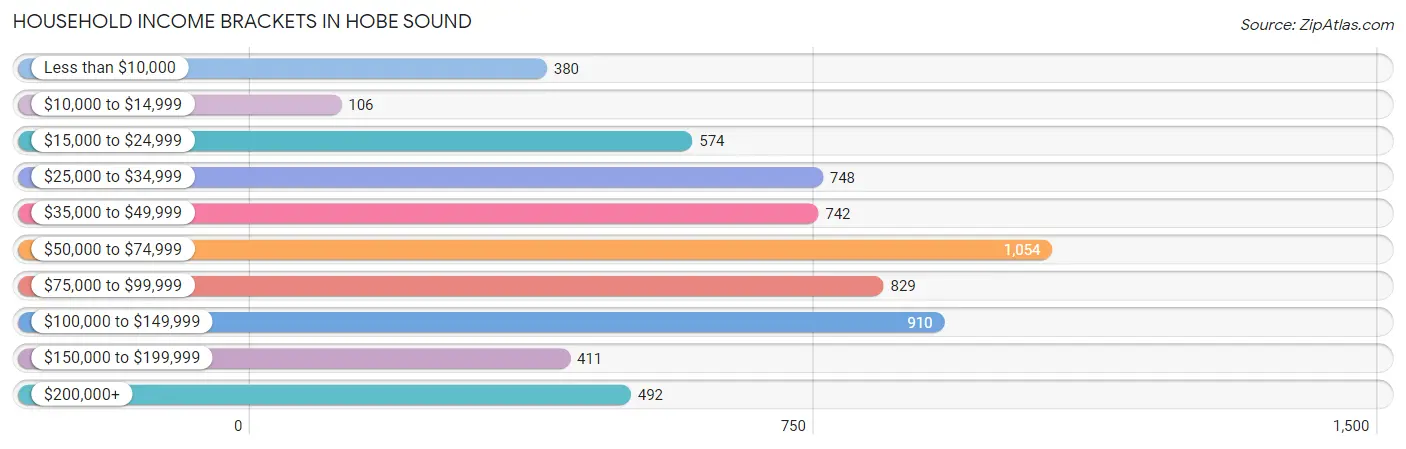
| Income Bracket | # Households | % Households |
| Less than $10,000 | 380 | 6.1% |
| $10,000 to $14,999 | 106 | 1.7% |
| $15,000 to $24,999 | 574 | 9.2% |
| $25,000 to $34,999 | 748 | 12.0% |
| $35,000 to $49,999 | 742 | 11.9% |
| $50,000 to $74,999 | 1,054 | 16.9% |
| $75,000 to $99,999 | 829 | 13.3% |
| $100,000 to $149,999 | 910 | 14.6% |
| $150,000 to $199,999 | 411 | 6.6% |
| $200,000+ | 492 | 7.9% |
Household Income by Householder Age in Hobe Sound
The median household income in Hobe Sound is $62,677, with the highest median household income of $94,025 found in the 45 to 64 years age bracket for the primary householder. A total of 2,217 households (35.6%) fall into this category. Meanwhile, the 15 to 24 years age bracket for the primary householder has the lowest median household income of $6,023, with 59 households (0.9%) in this group.
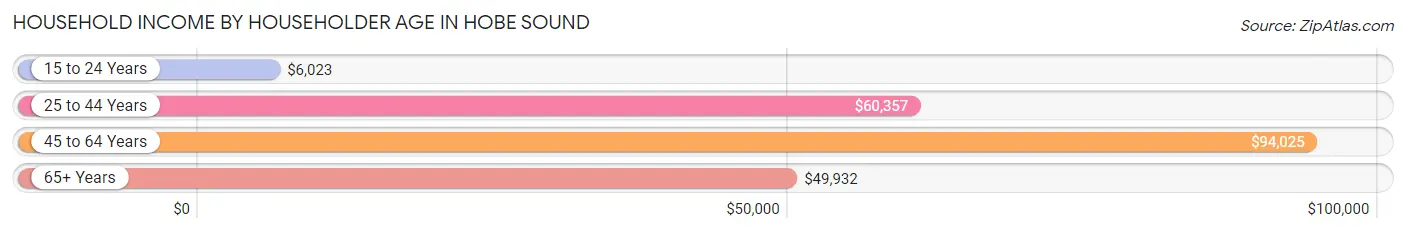
| Income Bracket | # Households | Median Income |
| 15 to 24 Years | 59 (0.9%) | $6,023 |
| 25 to 44 Years | 1,108 (17.8%) | $60,357 |
| 45 to 64 Years | 2,217 (35.6%) | $94,025 |
| 65+ Years | 2,850 (45.7%) | $49,932 |
| Total | 6,234 (100.0%) | $62,677 |
Poverty in Hobe Sound
Income Below Poverty by Sex and Age in Hobe Sound
With 10.7% poverty level for males and 11.5% for females among the residents of Hobe Sound, 6 to 11 year old males and 15 year old females are the most vulnerable to poverty, with 107 males (20.9%) and 41 females (68.3%) in their respective age groups living below the poverty level.
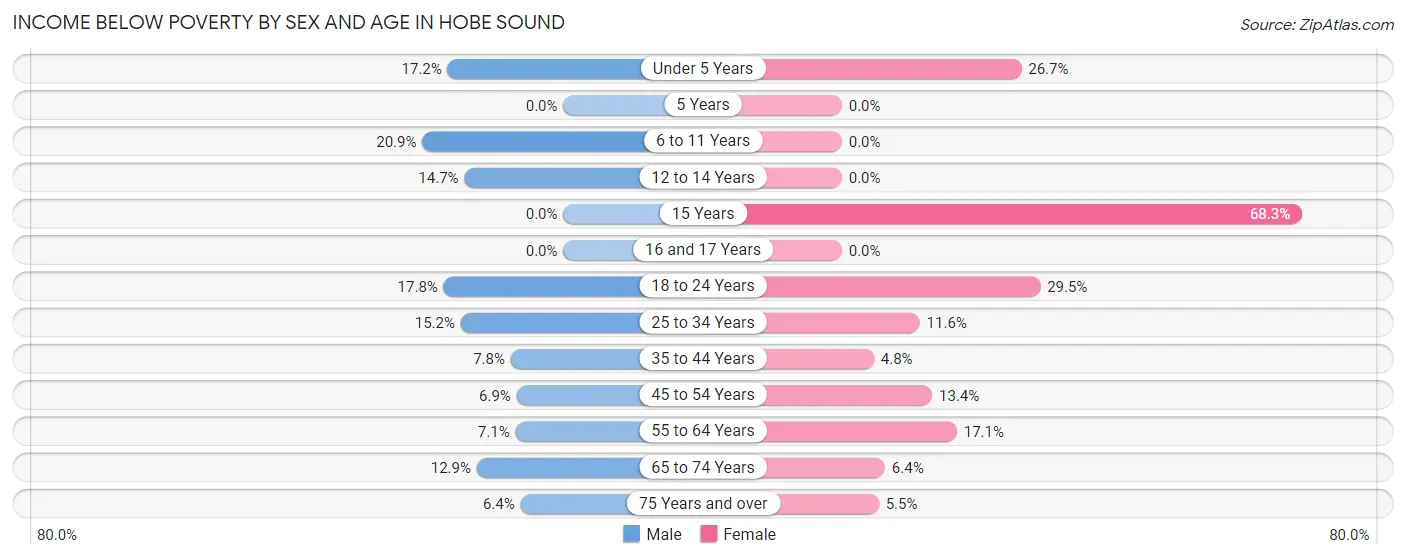
| Age Bracket | Male | Female |
| Under 5 Years | 77 (17.2%) | 89 (26.7%) |
| 5 Years | 0 (0.0%) | 0 (0.0%) |
| 6 to 11 Years | 107 (20.9%) | 0 (0.0%) |
| 12 to 14 Years | 21 (14.7%) | 0 (0.0%) |
| 15 Years | 0 (0.0%) | 41 (68.3%) |
| 16 and 17 Years | 0 (0.0%) | 0 (0.0%) |
| 18 to 24 Years | 83 (17.8%) | 71 (29.5%) |
| 25 to 34 Years | 69 (15.2%) | 72 (11.6%) |
| 35 to 44 Years | 75 (7.8%) | 29 (4.8%) |
| 45 to 54 Years | 39 (6.9%) | 87 (13.4%) |
| 55 to 64 Years | 94 (7.1%) | 254 (17.1%) |
| 65 to 74 Years | 133 (12.9%) | 81 (6.4%) |
| 75 Years and over | 73 (6.4%) | 56 (5.5%) |
| Total | 771 (10.7%) | 780 (11.5%) |
Income Above Poverty by Sex and Age in Hobe Sound
According to the poverty statistics in Hobe Sound, males aged 5 years and females aged 5 years are the age groups that are most secure financially, with 100.0% of males and 100.0% of females in these age groups living above the poverty line.
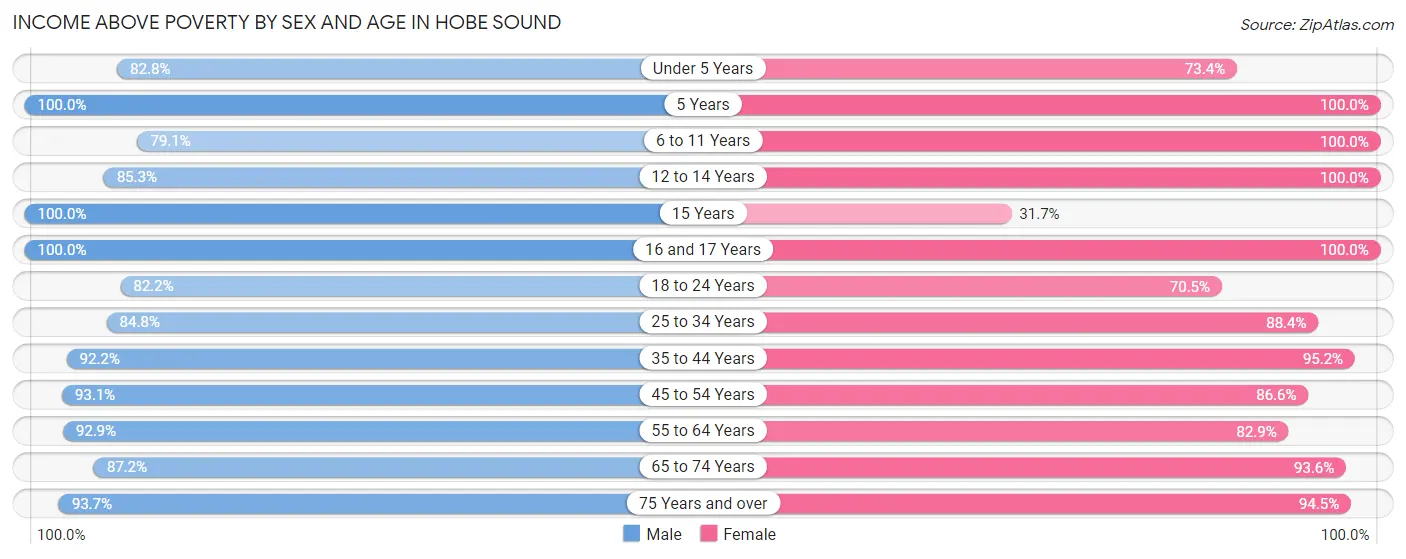
| Age Bracket | Male | Female |
| Under 5 Years | 371 (82.8%) | 245 (73.4%) |
| 5 Years | 59 (100.0%) | 39 (100.0%) |
| 6 to 11 Years | 404 (79.1%) | 307 (100.0%) |
| 12 to 14 Years | 122 (85.3%) | 79 (100.0%) |
| 15 Years | 9 (100.0%) | 19 (31.7%) |
| 16 and 17 Years | 56 (100.0%) | 58 (100.0%) |
| 18 to 24 Years | 384 (82.2%) | 170 (70.5%) |
| 25 to 34 Years | 384 (84.8%) | 551 (88.4%) |
| 35 to 44 Years | 887 (92.2%) | 580 (95.2%) |
| 45 to 54 Years | 524 (93.1%) | 562 (86.6%) |
| 55 to 64 Years | 1,228 (92.9%) | 1,233 (82.9%) |
| 65 to 74 Years | 902 (87.2%) | 1,184 (93.6%) |
| 75 Years and over | 1,076 (93.6%) | 966 (94.5%) |
| Total | 6,406 (89.3%) | 5,993 (88.5%) |
Income Below Poverty Among Married-Couple Families in Hobe Sound
The poverty statistics for married-couple families in Hobe Sound show that 2.6% or 72 of the total 2,800 families live below the poverty line. Families with 3 or 4 children have the highest poverty rate of 24.4%, comprising of 29 families. On the other hand, families with 5 or more children have the lowest poverty rate of 0.0%, which includes 0 families.
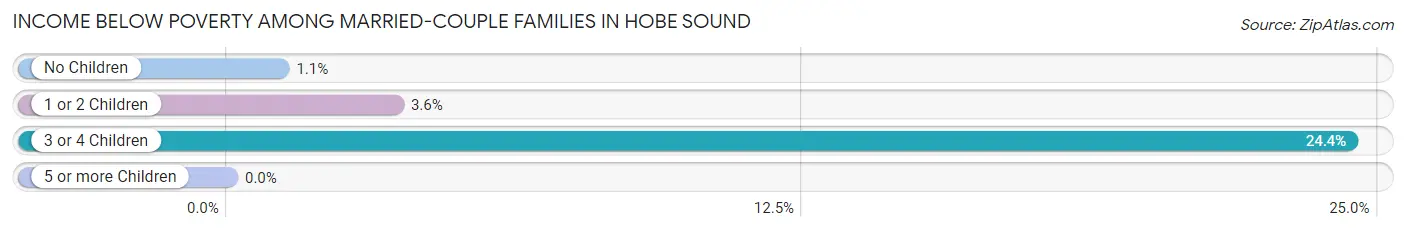
| Children | Above Poverty | Below Poverty |
| No Children | 2,117 (98.9%) | 24 (1.1%) |
| 1 or 2 Children | 507 (96.4%) | 19 (3.6%) |
| 3 or 4 Children | 90 (75.6%) | 29 (24.4%) |
| 5 or more Children | 14 (100.0%) | 0 (0.0%) |
| Total | 2,728 (97.4%) | 72 (2.6%) |
Income Below Poverty Among Single-Parent Households in Hobe Sound
According to the poverty data in Hobe Sound, 24.5% or 88 single-father households and 14.7% or 48 single-mother households are living below the poverty line. Among single-father households, those with no children have the highest poverty rate, with 55 households (28.8%) experiencing poverty. Likewise, among single-mother households, those with 1 or 2 children have the highest poverty rate, with 36 households (24.2%) falling below the poverty line.
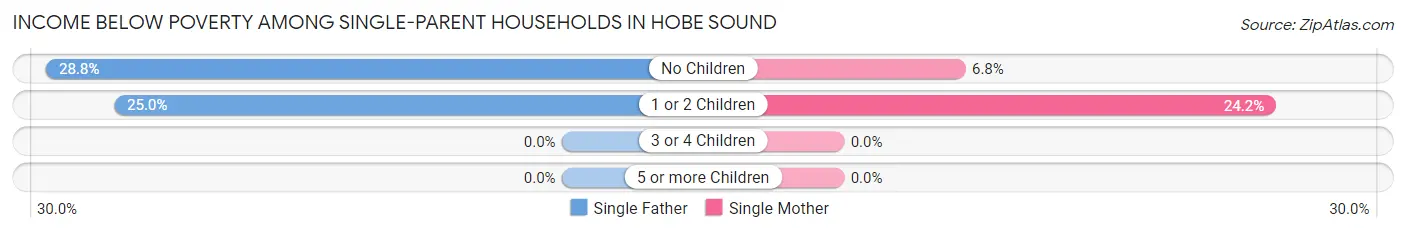
| Children | Single Father | Single Mother |
| No Children | 55 (28.8%) | 12 (6.8%) |
| 1 or 2 Children | 33 (25.0%) | 36 (24.2%) |
| 3 or 4 Children | 0 (0.0%) | 0 (0.0%) |
| 5 or more Children | 0 (0.0%) | 0 (0.0%) |
| Total | 88 (24.5%) | 48 (14.7%) |
Income Below Poverty Among Married-Couple vs Single-Parent Households in Hobe Sound
The poverty data for Hobe Sound shows that 72 of the married-couple family households (2.6%) and 136 of the single-parent households (19.9%) are living below the poverty level. Within the married-couple family households, those with 3 or 4 children have the highest poverty rate, with 29 households (24.4%) falling below the poverty line. Among the single-parent households, those with 1 or 2 children have the highest poverty rate, with 69 household (24.6%) living below poverty.
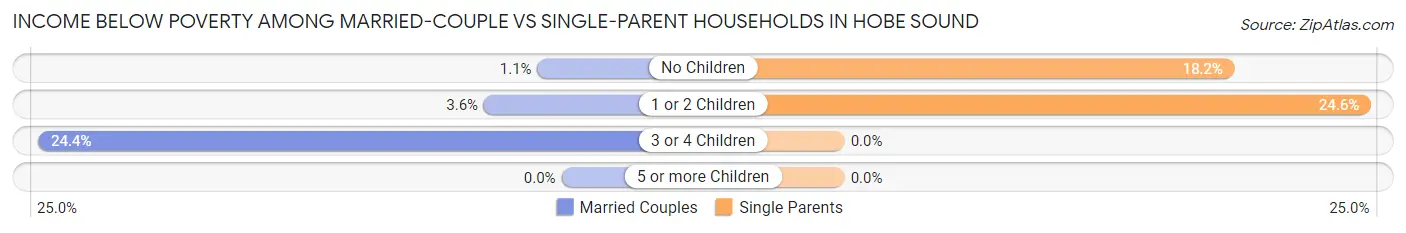
| Children | Married-Couple Families | Single-Parent Households |
| No Children | 24 (1.1%) | 67 (18.2%) |
| 1 or 2 Children | 19 (3.6%) | 69 (24.6%) |
| 3 or 4 Children | 29 (24.4%) | 0 (0.0%) |
| 5 or more Children | 0 (0.0%) | 0 (0.0%) |
| Total | 72 (2.6%) | 136 (19.9%) |
Race in Hobe Sound
The most populous races in Hobe Sound are White / Caucasian (12,545 | 88.4%), Hispanic or Latino (1,540 | 10.8%), and Two or more Races (899 | 6.3%).
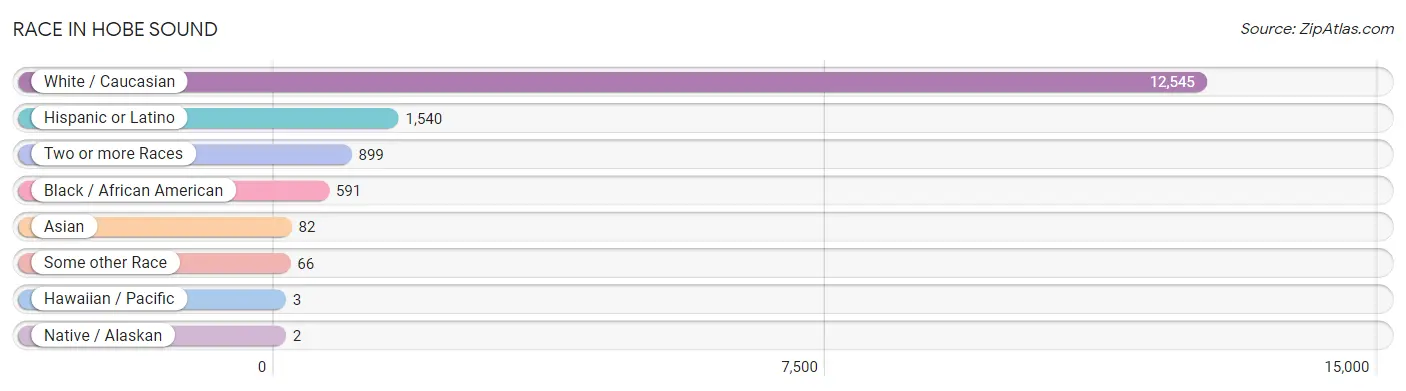
| Race | # Population | % Population |
| Asian | 82 | 0.6% |
| Black / African American | 591 | 4.2% |
| Hawaiian / Pacific | 3 | 0.0% |
| Hispanic or Latino | 1,540 | 10.8% |
| Native / Alaskan | 2 | 0.0% |
| White / Caucasian | 12,545 | 88.4% |
| Two or more Races | 899 | 6.3% |
| Some other Race | 66 | 0.5% |
| Total | 14,188 | 100.0% |
Ancestry in Hobe Sound
The most populous ancestries reported in Hobe Sound are German (2,860 | 20.2%), Irish (2,607 | 18.4%), English (1,500 | 10.6%), Italian (1,155 | 8.1%), and American (898 | 6.3%), together accounting for 63.6% of all Hobe Sound residents.
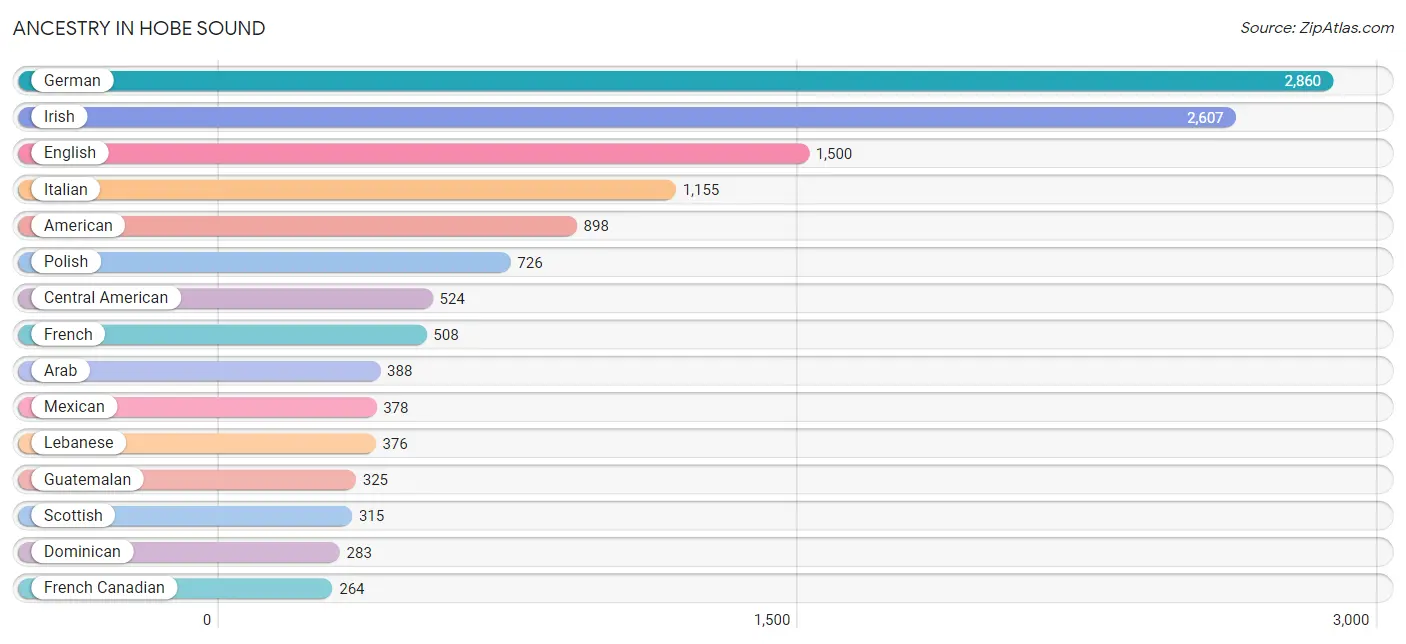
| Ancestry | # Population | % Population |
| African | 2 | 0.0% |
| American | 898 | 6.3% |
| Arab | 388 | 2.7% |
| Austrian | 107 | 0.7% |
| Belgian | 7 | 0.1% |
| Belizean | 15 | 0.1% |
| British | 72 | 0.5% |
| British West Indian | 2 | 0.0% |
| Canadian | 7 | 0.1% |
| Central American | 524 | 3.7% |
| Cherokee | 43 | 0.3% |
| Colombian | 40 | 0.3% |
| Croatian | 10 | 0.1% |
| Cuban | 63 | 0.4% |
| Czechoslovakian | 10 | 0.1% |
| Danish | 37 | 0.3% |
| Dominican | 283 | 2.0% |
| Dutch | 148 | 1.0% |
| Eastern European | 25 | 0.2% |
| Egyptian | 12 | 0.1% |
| English | 1,500 | 10.6% |
| European | 176 | 1.2% |
| Finnish | 14 | 0.1% |
| French | 508 | 3.6% |
| French Canadian | 264 | 1.9% |
| German | 2,860 | 20.2% |
| Greek | 8 | 0.1% |
| Guatemalan | 325 | 2.3% |
| Honduran | 159 | 1.1% |
| Hungarian | 8 | 0.1% |
| Irish | 2,607 | 18.4% |
| Italian | 1,155 | 8.1% |
| Korean | 18 | 0.1% |
| Lebanese | 376 | 2.6% |
| Lithuanian | 10 | 0.1% |
| Mexican | 378 | 2.7% |
| Navajo | 7 | 0.1% |
| Nicaraguan | 19 | 0.1% |
| Northern European | 11 | 0.1% |
| Norwegian | 157 | 1.1% |
| Pima | 2 | 0.0% |
| Polish | 726 | 5.1% |
| Portuguese | 16 | 0.1% |
| Puerto Rican | 225 | 1.6% |
| Romanian | 14 | 0.1% |
| Russian | 172 | 1.2% |
| Salvadoran | 21 | 0.2% |
| Scandinavian | 29 | 0.2% |
| Scotch-Irish | 176 | 1.2% |
| Scottish | 315 | 2.2% |
| Slovak | 46 | 0.3% |
| South American | 40 | 0.3% |
| Subsaharan African | 2 | 0.0% |
| Swedish | 151 | 1.1% |
| Swiss | 10 | 0.1% |
| Thai | 82 | 0.6% |
| Tohono O'Odham | 27 | 0.2% |
| Ukrainian | 49 | 0.4% |
| Welsh | 92 | 0.6% |
| West Indian | 2 | 0.0% | View All 60 Rows |
Immigrants in Hobe Sound
The most numerous immigrant groups reported in Hobe Sound came from Latin America (696 | 4.9%), Central America (501 | 3.5%), Mexico (200 | 1.4%), Europe (198 | 1.4%), and Canada (193 | 1.4%), together accounting for 12.6% of all Hobe Sound residents.
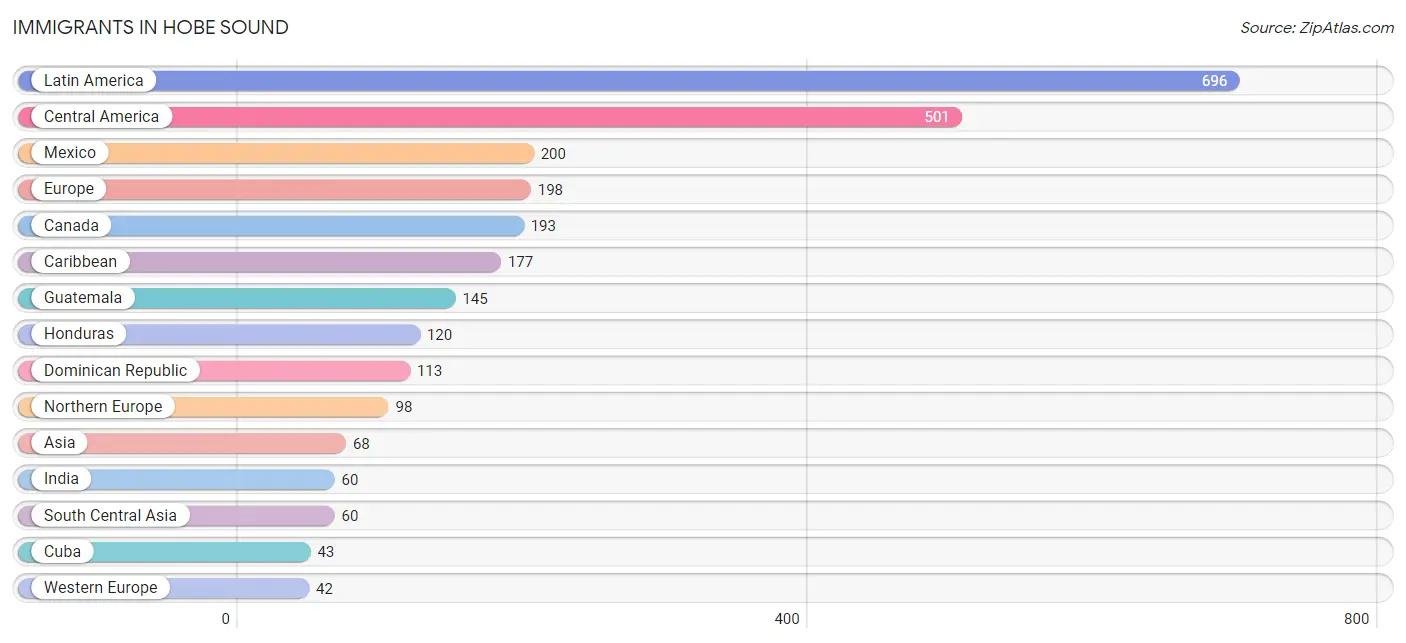
| Immigration Origin | # Population | % Population |
| Asia | 68 | 0.5% |
| Bahamas | 2 | 0.0% |
| Belize | 15 | 0.1% |
| Canada | 193 | 1.4% |
| Caribbean | 177 | 1.3% |
| Central America | 501 | 3.5% |
| Cuba | 43 | 0.3% |
| Denmark | 12 | 0.1% |
| Dominican Republic | 113 | 0.8% |
| Eastern Europe | 39 | 0.3% |
| El Salvador | 21 | 0.2% |
| England | 31 | 0.2% |
| Europe | 198 | 1.4% |
| Germany | 24 | 0.2% |
| Guatemala | 145 | 1.0% |
| Honduras | 120 | 0.9% |
| India | 60 | 0.4% |
| Italy | 19 | 0.1% |
| Jamaica | 17 | 0.1% |
| Latin America | 696 | 4.9% |
| Lithuania | 32 | 0.2% |
| Mexico | 200 | 1.4% |
| Netherlands | 18 | 0.1% |
| Northern Europe | 98 | 0.7% |
| Peru | 18 | 0.1% |
| Philippines | 8 | 0.1% |
| Scotland | 19 | 0.1% |
| South America | 18 | 0.1% |
| South Central Asia | 60 | 0.4% |
| South Eastern Asia | 8 | 0.1% |
| Southern Europe | 19 | 0.1% |
| Ukraine | 7 | 0.1% |
| Western Europe | 42 | 0.3% | View All 33 Rows |
Sex and Age in Hobe Sound
Sex and Age in Hobe Sound
The most populous age groups in Hobe Sound are 55 to 59 Years (694 | 9.6%) for men and 65 to 69 Years (787 | 11.3%) for women.
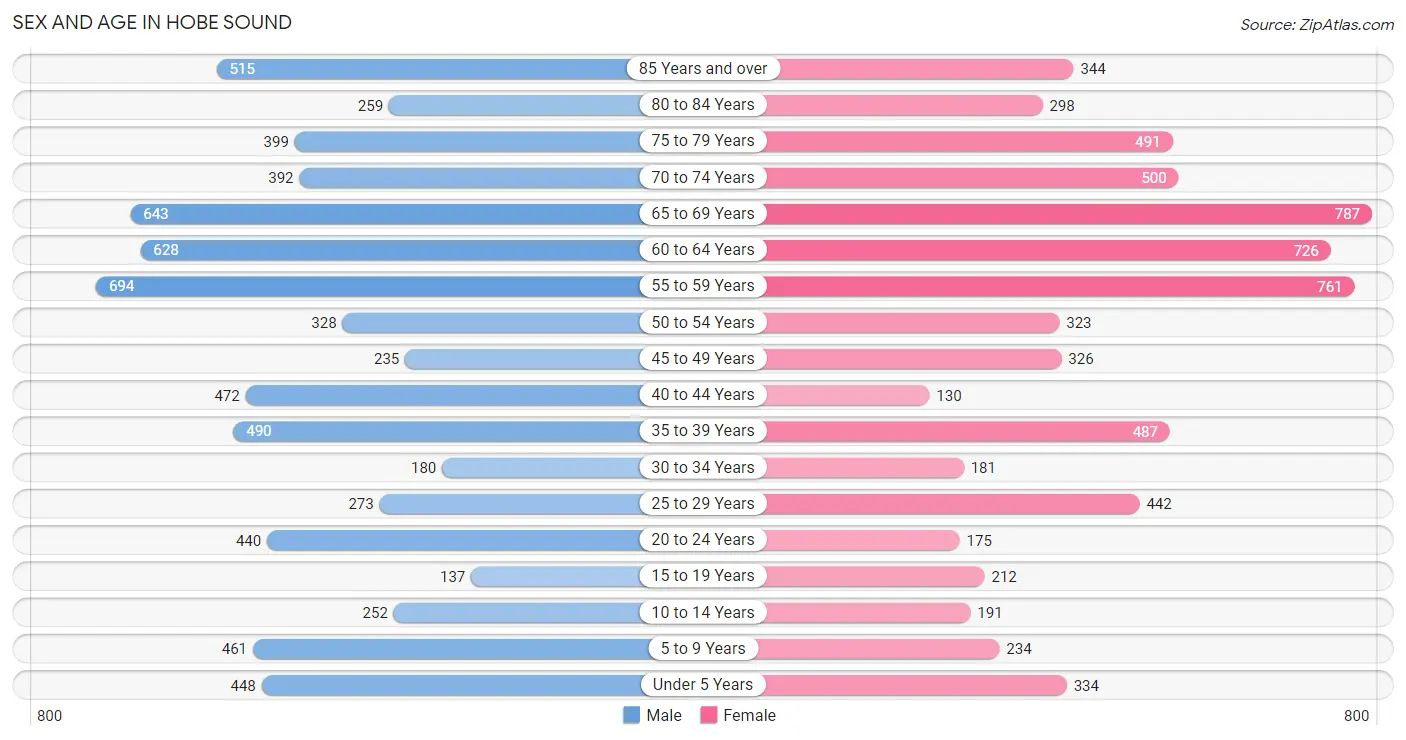
| Age Bracket | Male | Female |
| Under 5 Years | 448 (6.2%) | 334 (4.8%) |
| 5 to 9 Years | 461 (6.4%) | 234 (3.4%) |
| 10 to 14 Years | 252 (3.5%) | 191 (2.8%) |
| 15 to 19 Years | 137 (1.9%) | 212 (3.0%) |
| 20 to 24 Years | 440 (6.1%) | 175 (2.5%) |
| 25 to 29 Years | 273 (3.8%) | 442 (6.4%) |
| 30 to 34 Years | 180 (2.5%) | 181 (2.6%) |
| 35 to 39 Years | 490 (6.8%) | 487 (7.0%) |
| 40 to 44 Years | 472 (6.5%) | 130 (1.9%) |
| 45 to 49 Years | 235 (3.2%) | 326 (4.7%) |
| 50 to 54 Years | 328 (4.5%) | 323 (4.6%) |
| 55 to 59 Years | 694 (9.6%) | 761 (11.0%) |
| 60 to 64 Years | 628 (8.7%) | 726 (10.5%) |
| 65 to 69 Years | 643 (8.9%) | 787 (11.3%) |
| 70 to 74 Years | 392 (5.4%) | 500 (7.2%) |
| 75 to 79 Years | 399 (5.5%) | 491 (7.1%) |
| 80 to 84 Years | 259 (3.6%) | 298 (4.3%) |
| 85 Years and over | 515 (7.1%) | 344 (5.0%) |
| Total | 7,246 (100.0%) | 6,942 (100.0%) |
Families and Households in Hobe Sound
Median Family Size in Hobe Sound
The median family size in Hobe Sound is 2.86 persons per family, with single male/father families (359 | 10.3%) accounting for the largest median family size of 3.02 persons per family. On the other hand, single female/mother families (326 | 9.3%) represent the smallest median family size with 2.76 persons per family.
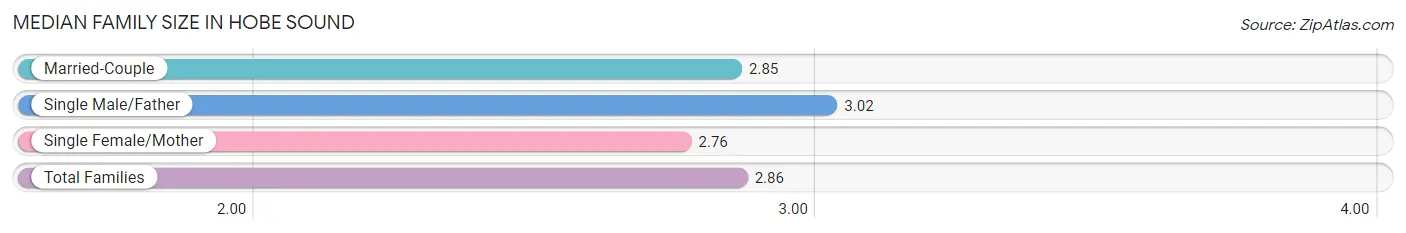
| Family Type | # Families | Family Size |
| Married-Couple | 2,800 (80.3%) | 2.85 |
| Single Male/Father | 359 (10.3%) | 3.02 |
| Single Female/Mother | 326 (9.3%) | 2.76 |
| Total Families | 3,485 (100.0%) | 2.86 |
Median Household Size in Hobe Sound
The median household size in Hobe Sound is 2.23 persons per household, with single male/father households (359 | 5.8%) accounting for the largest median household size of 3.34 persons per household. non-family households (2,749 | 44.1%) represent the smallest median household size with 1.24 persons per household.
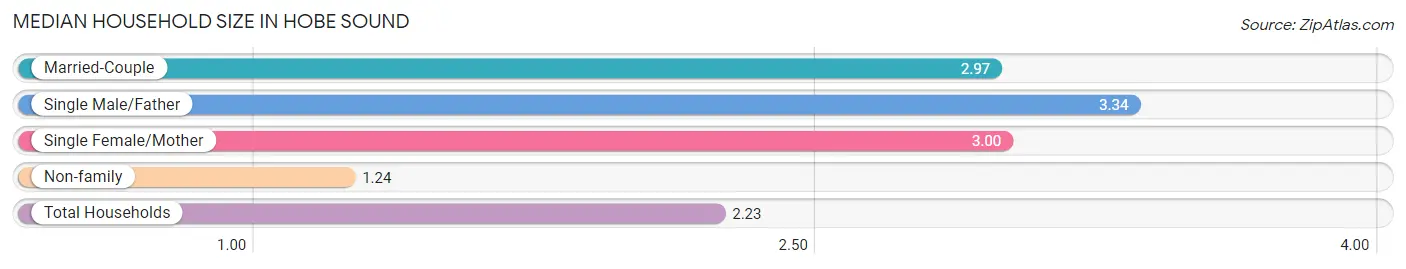
| Household Type | # Households | Household Size |
| Married-Couple | 2,800 (44.9%) | 2.97 |
| Single Male/Father | 359 (5.8%) | 3.34 |
| Single Female/Mother | 326 (5.2%) | 3.00 |
| Non-family | 2,749 (44.1%) | 1.24 |
| Total Households | 6,234 (100.0%) | 2.23 |
Household Size by Marriage Status in Hobe Sound
Out of a total of 6,234 households in Hobe Sound, 3,485 (55.9%) are family households, while 2,749 (44.1%) are nonfamily households. The most numerous type of family households are 2-person households, comprising 2,188, and the most common type of nonfamily households are 1-person households, comprising 2,257.
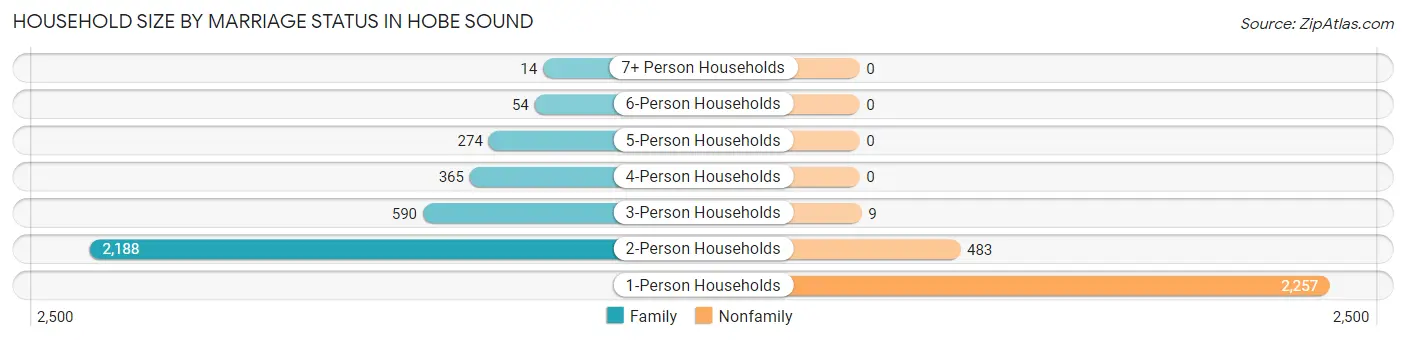
| Household Size | Family Households | Nonfamily Households |
| 1-Person Households | - | 2,257 (36.2%) |
| 2-Person Households | 2,188 (35.1%) | 483 (7.7%) |
| 3-Person Households | 590 (9.5%) | 9 (0.1%) |
| 4-Person Households | 365 (5.9%) | 0 (0.0%) |
| 5-Person Households | 274 (4.4%) | 0 (0.0%) |
| 6-Person Households | 54 (0.9%) | 0 (0.0%) |
| 7+ Person Households | 14 (0.2%) | 0 (0.0%) |
| Total | 3,485 (55.9%) | 2,749 (44.1%) |
Female Fertility in Hobe Sound
Fertility by Age in Hobe Sound
Average fertility rate in Hobe Sound is 23.0 births per 1,000 women. Women in the age bracket of 20 to 34 years have the highest fertility rate with 31.0 births per 1,000 women. Women in the age bracket of 20 to 34 years acount for 53.2% of all women with births.
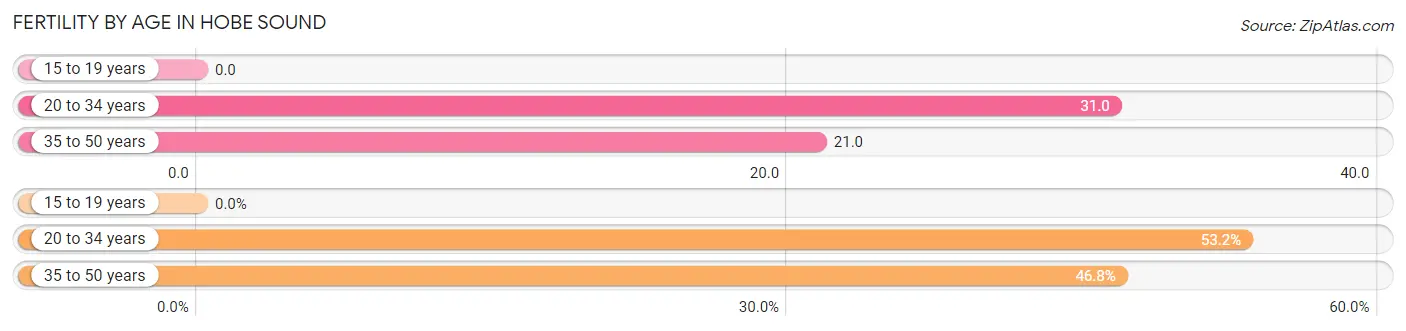
| Age Bracket | Women with Births | Births / 1,000 Women |
| 15 to 19 years | 0 (0.0%) | 0.0 |
| 20 to 34 years | 25 (53.2%) | 31.0 |
| 35 to 50 years | 22 (46.8%) | 21.0 |
| Total | 47 (100.0%) | 23.0 |
Fertility by Age by Marriage Status in Hobe Sound
80.9% of women with births (47) in Hobe Sound are married. The highest percentage of unmarried women with births falls into 35 to 50 years age bracket with 40.9% of them unmarried at the time of birth, while the lowest percentage of unmarried women with births belong to 20 to 34 years age bracket with 0.0% of them unmarried.
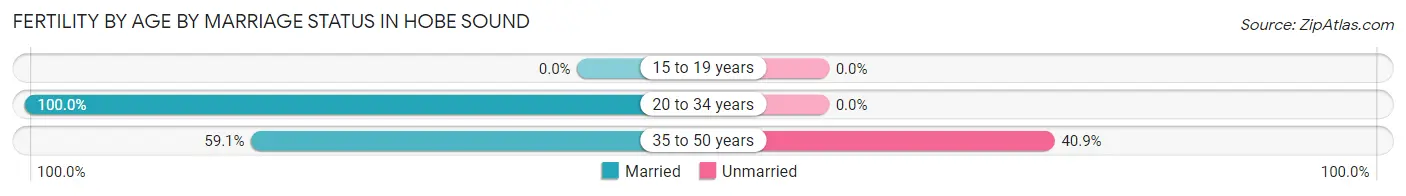
| Age Bracket | Married | Unmarried |
| 15 to 19 years | 0 (0.0%) | 0 (0.0%) |
| 20 to 34 years | 25 (100.0%) | 0 (0.0%) |
| 35 to 50 years | 13 (59.1%) | 9 (40.9%) |
| Total | 38 (80.8%) | 9 (19.2%) |
Fertility by Education in Hobe Sound
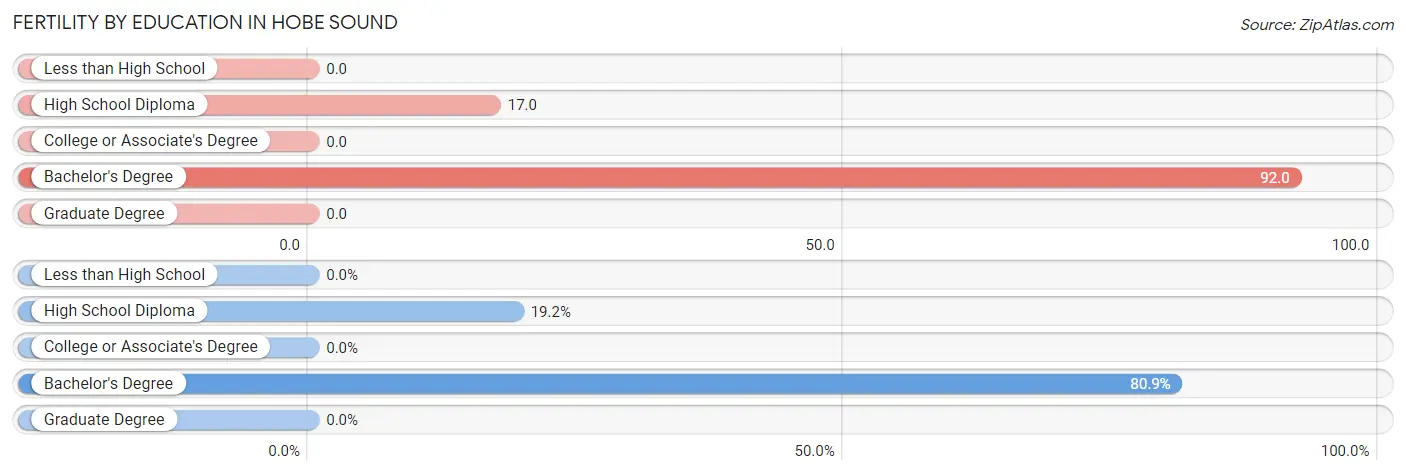
| Educational Attainment | Women with Births | Births / 1,000 Women |
| Less than High School | 0 (0.0%) | 0.0 |
| High School Diploma | 9 (19.2%) | 17.0 |
| College or Associate's Degree | 0 (0.0%) | 0.0 |
| Bachelor's Degree | 38 (80.8%) | 92.0 |
| Graduate Degree | 0 (0.0%) | 0.0 |
| Total | 47 (100.0%) | 23.0 |
Fertility by Education by Marriage Status in Hobe Sound
19.2% of women with births in Hobe Sound are unmarried. Women with the educational attainment of bachelor's degree are most likely to be married with 100.0% of them married at childbirth, while women with the educational attainment of high school diploma are least likely to be married with 100.0% of them unmarried at childbirth.
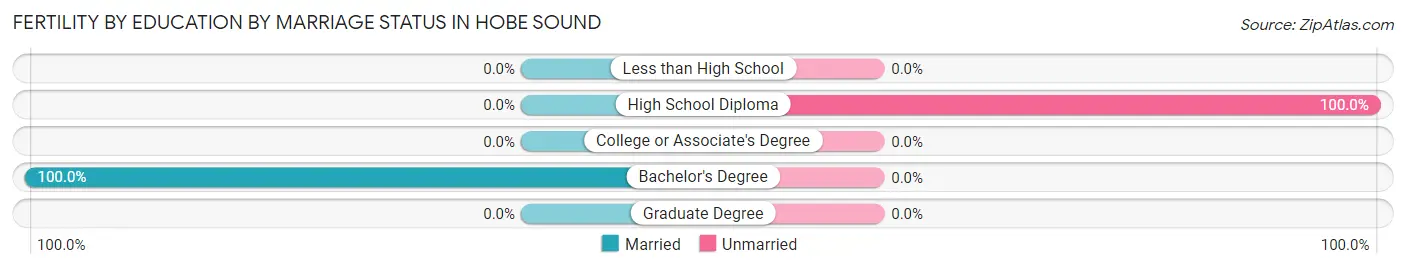
| Educational Attainment | Married | Unmarried |
| Less than High School | 0 (0.0%) | 0 (0.0%) |
| High School Diploma | 0 (0.0%) | 9 (100.0%) |
| College or Associate's Degree | 0 (0.0%) | 0 (0.0%) |
| Bachelor's Degree | 38 (100.0%) | 0 (0.0%) |
| Graduate Degree | 0 (0.0%) | 0 (0.0%) |
| Total | 38 (80.8%) | 9 (19.2%) |
Employment Characteristics in Hobe Sound
Employment by Class of Employer in Hobe Sound
Among the 6,135 employed individuals in Hobe Sound, private company employees (3,902 | 63.6%), self-employed (not incorporated) (680 | 11.1%), and self-employed (incorporated) (595 | 9.7%) make up the most common classes of employment.
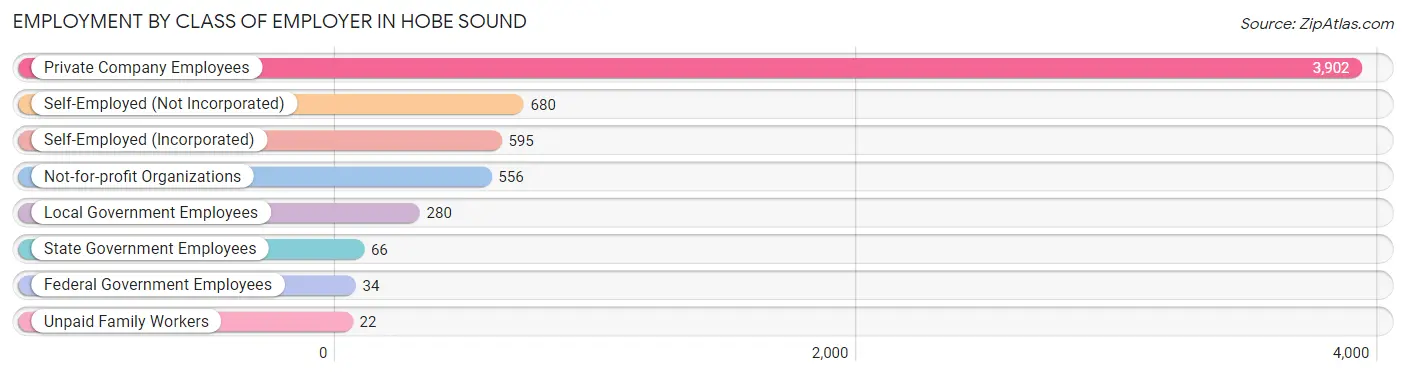
| Employer Class | # Employees | % Employees |
| Private Company Employees | 3,902 | 63.6% |
| Self-Employed (Incorporated) | 595 | 9.7% |
| Self-Employed (Not Incorporated) | 680 | 11.1% |
| Not-for-profit Organizations | 556 | 9.1% |
| Local Government Employees | 280 | 4.6% |
| State Government Employees | 66 | 1.1% |
| Federal Government Employees | 34 | 0.5% |
| Unpaid Family Workers | 22 | 0.4% |
| Total | 6,135 | 100.0% |
Employment Status by Age in Hobe Sound
According to the labor force statistics for Hobe Sound, out of the total population over 16 years of age (12,199), 53.4% or 6,514 individuals are in the labor force, with 5.3% or 345 of them unemployed. The age group with the highest labor force participation rate is 25 to 29 years, with 91.6% or 655 individuals in the labor force. Within the labor force, the 20 to 24 years age range has the highest percentage of unemployed individuals, with 23.1% or 112 of them being unemployed.
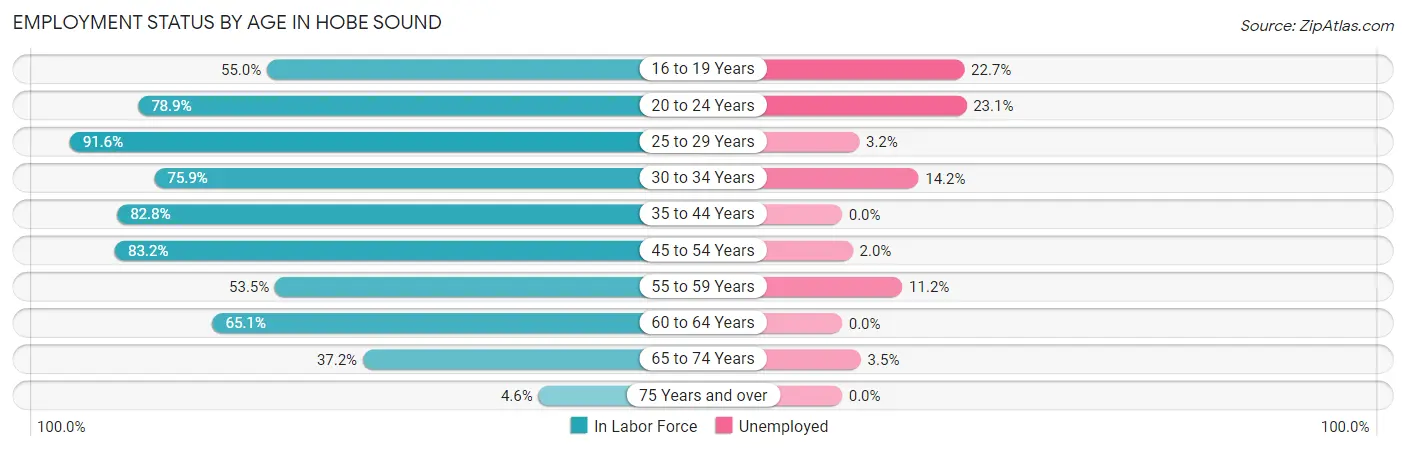
| Age Bracket | In Labor Force | Unemployed |
| 16 to 19 Years | 154 (55.0%) | 35 (22.7%) |
| 20 to 24 Years | 485 (78.9%) | 112 (23.1%) |
| 25 to 29 Years | 655 (91.6%) | 21 (3.2%) |
| 30 to 34 Years | 274 (75.9%) | 39 (14.2%) |
| 35 to 44 Years | 1,307 (82.8%) | 0 (0.0%) |
| 45 to 54 Years | 1,008 (83.2%) | 20 (2.0%) |
| 55 to 59 Years | 778 (53.5%) | 87 (11.2%) |
| 60 to 64 Years | 881 (65.1%) | 0 (0.0%) |
| 65 to 74 Years | 864 (37.2%) | 30 (3.5%) |
| 75 Years and over | 106 (4.6%) | 0 (0.0%) |
| Total | 6,514 (53.4%) | 345 (5.3%) |
Employment Status by Educational Attainment in Hobe Sound
According to labor force statistics for Hobe Sound, 73.5% of individuals (4,907) out of the total population between 25 and 64 years of age (6,676) are in the labor force, with 3.4% or 167 of them being unemployed. The group with the highest labor force participation rate are those with the educational attainment of bachelor's degree or higher, with 76.4% or 1,413 individuals in the labor force. Within the labor force, individuals with college / associate degree education have the highest percentage of unemployment, with 6.0% or 91 of them being unemployed.
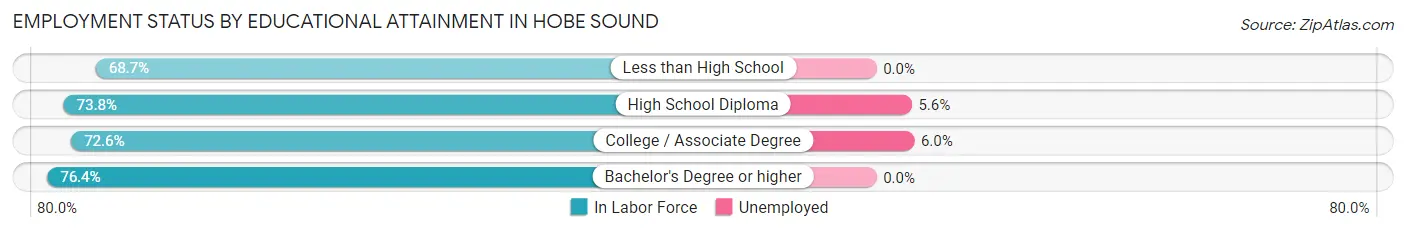
| Educational Attainment | In Labor Force | Unemployed |
| Less than High School | 620 (68.7%) | 0 (0.0%) |
| High School Diploma | 1,362 (73.8%) | 103 (5.6%) |
| College / Associate Degree | 1,509 (72.6%) | 125 (6.0%) |
| Bachelor's Degree or higher | 1,413 (76.4%) | 0 (0.0%) |
| Total | 4,907 (73.5%) | 227 (3.4%) |
Employment Occupations by Sex in Hobe Sound
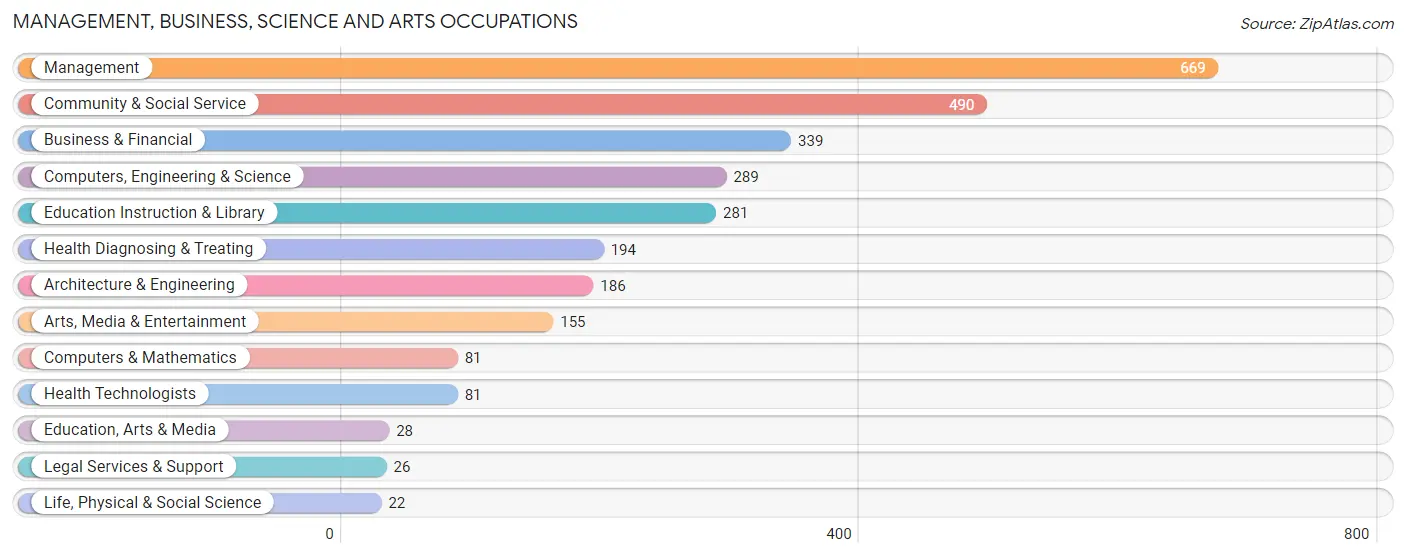
Management, Business, Science and Arts Occupations
The most common Management, Business, Science and Arts occupations in Hobe Sound are Management (669 | 10.9%), Community & Social Service (490 | 8.0%), Business & Financial (339 | 5.5%), Computers, Engineering & Science (289 | 4.7%), and Education Instruction & Library (281 | 4.6%).
Management, Business, Science and Arts Occupations by Sex
Within the Management, Business, Science and Arts occupations in Hobe Sound, the most male-oriented occupations are Computers & Mathematics (63.0%), Education, Arts & Media (60.7%), and Business & Financial (56.0%), while the most female-oriented occupations are Life, Physical & Social Science (100.0%), Legal Services & Support (100.0%), and Health Technologists (100.0%).
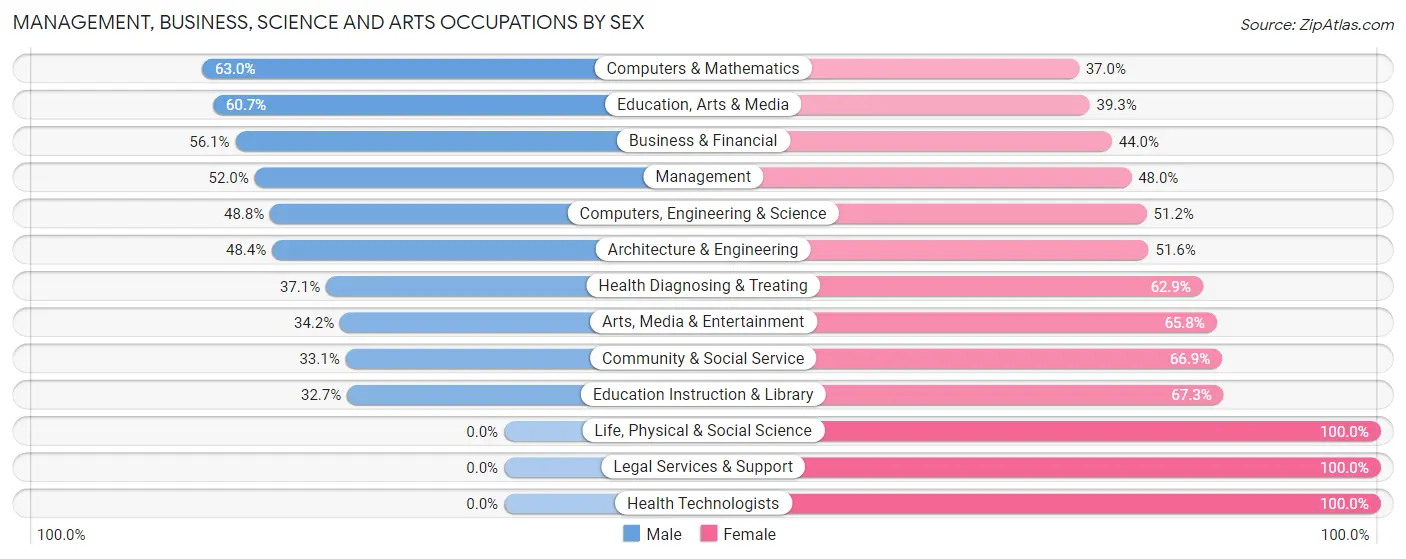
| Occupation | Male | Female |
| Management | 348 (52.0%) | 321 (48.0%) |
| Business & Financial | 190 (56.0%) | 149 (44.0%) |
| Computers, Engineering & Science | 141 (48.8%) | 148 (51.2%) |
| Computers & Mathematics | 51 (63.0%) | 30 (37.0%) |
| Architecture & Engineering | 90 (48.4%) | 96 (51.6%) |
| Life, Physical & Social Science | 0 (0.0%) | 22 (100.0%) |
| Community & Social Service | 162 (33.1%) | 328 (66.9%) |
| Education, Arts & Media | 17 (60.7%) | 11 (39.3%) |
| Legal Services & Support | 0 (0.0%) | 26 (100.0%) |
| Education Instruction & Library | 92 (32.7%) | 189 (67.3%) |
| Arts, Media & Entertainment | 53 (34.2%) | 102 (65.8%) |
| Health Diagnosing & Treating | 72 (37.1%) | 122 (62.9%) |
| Health Technologists | 0 (0.0%) | 81 (100.0%) |
| Total (Category) | 913 (46.1%) | 1,068 (53.9%) |
| Total (Overall) | 3,194 (51.8%) | 2,967 (48.2%) |
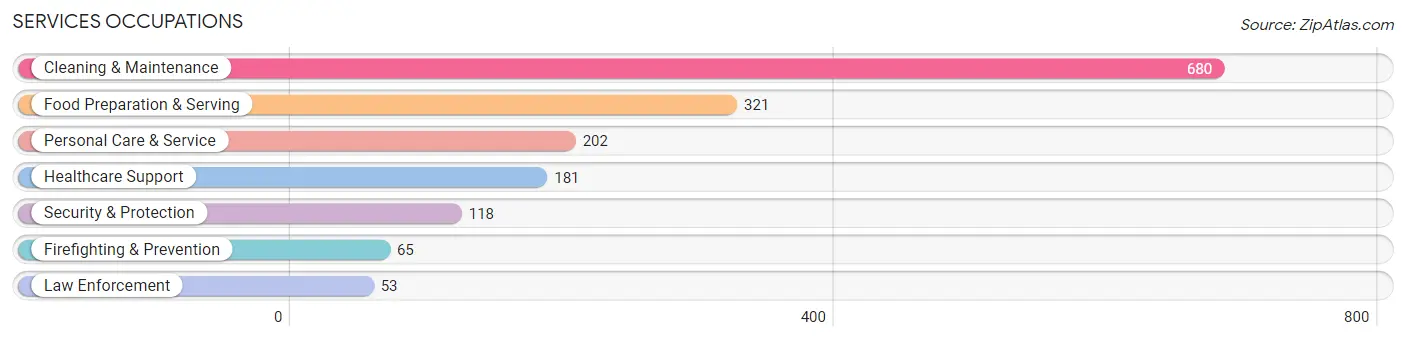
Services Occupations
The most common Services occupations in Hobe Sound are Cleaning & Maintenance (680 | 11.0%), Food Preparation & Serving (321 | 5.2%), Personal Care & Service (202 | 3.3%), Healthcare Support (181 | 2.9%), and Security & Protection (118 | 1.9%).
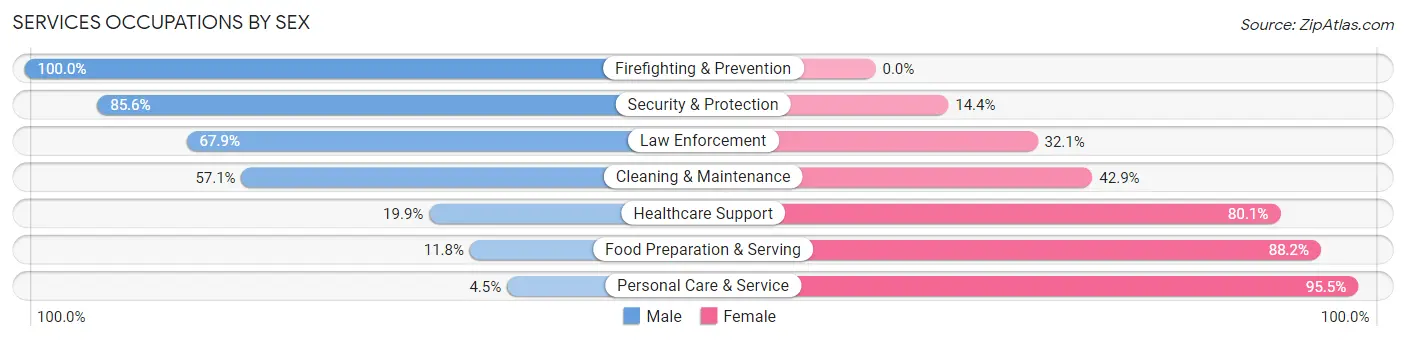
Services Occupations by Sex
Within the Services occupations in Hobe Sound, the most male-oriented occupations are Firefighting & Prevention (100.0%), Security & Protection (85.6%), and Law Enforcement (67.9%), while the most female-oriented occupations are Personal Care & Service (95.5%), Food Preparation & Serving (88.2%), and Healthcare Support (80.1%).
| Occupation | Male | Female |
| Healthcare Support | 36 (19.9%) | 145 (80.1%) |
| Security & Protection | 101 (85.6%) | 17 (14.4%) |
| Firefighting & Prevention | 65 (100.0%) | 0 (0.0%) |
| Law Enforcement | 36 (67.9%) | 17 (32.1%) |
| Food Preparation & Serving | 38 (11.8%) | 283 (88.2%) |
| Cleaning & Maintenance | 388 (57.1%) | 292 (42.9%) |
| Personal Care & Service | 9 (4.5%) | 193 (95.5%) |
| Total (Category) | 572 (38.1%) | 930 (61.9%) |
| Total (Overall) | 3,194 (51.8%) | 2,967 (48.2%) |
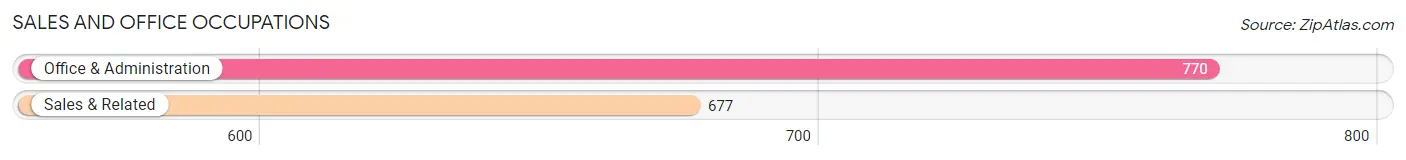
Sales and Office Occupations
The most common Sales and Office occupations in Hobe Sound are Office & Administration (770 | 12.5%), and Sales & Related (677 | 11.0%).
Sales and Office Occupations by Sex
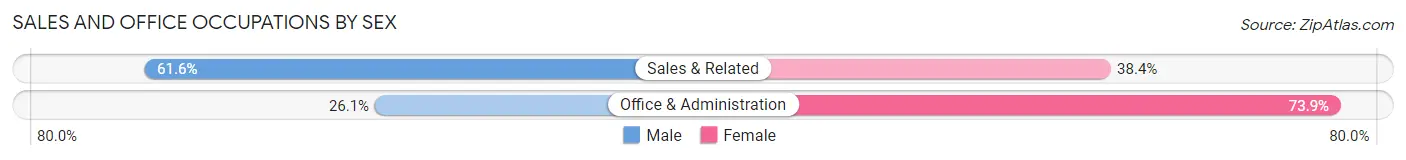
| Occupation | Male | Female |
| Sales & Related | 417 (61.6%) | 260 (38.4%) |
| Office & Administration | 201 (26.1%) | 569 (73.9%) |
| Total (Category) | 618 (42.7%) | 829 (57.3%) |
| Total (Overall) | 3,194 (51.8%) | 2,967 (48.2%) |
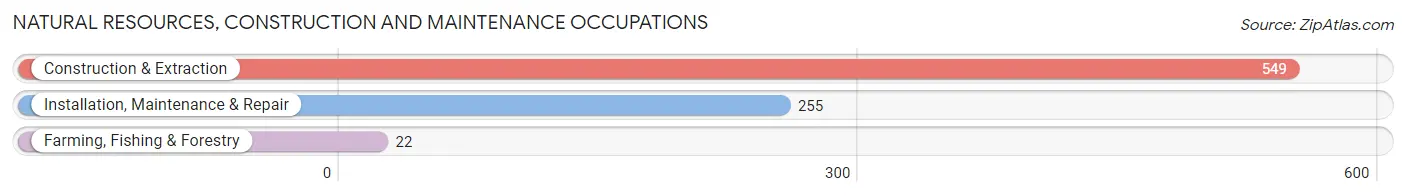
Natural Resources, Construction and Maintenance Occupations
The most common Natural Resources, Construction and Maintenance occupations in Hobe Sound are Construction & Extraction (549 | 8.9%), Installation, Maintenance & Repair (255 | 4.1%), and Farming, Fishing & Forestry (22 | 0.4%).
Natural Resources, Construction and Maintenance Occupations by Sex
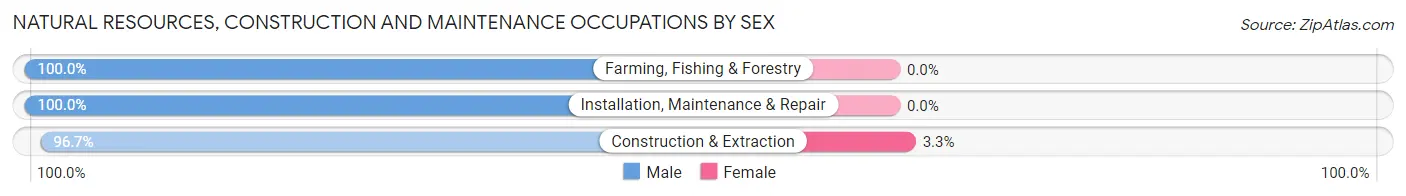
| Occupation | Male | Female |
| Farming, Fishing & Forestry | 22 (100.0%) | 0 (0.0%) |
| Construction & Extraction | 531 (96.7%) | 18 (3.3%) |
| Installation, Maintenance & Repair | 255 (100.0%) | 0 (0.0%) |
| Total (Category) | 808 (97.8%) | 18 (2.2%) |
| Total (Overall) | 3,194 (51.8%) | 2,967 (48.2%) |
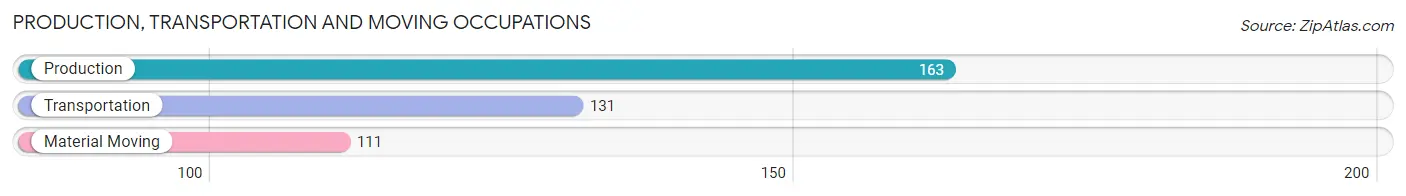
Production, Transportation and Moving Occupations
The most common Production, Transportation and Moving occupations in Hobe Sound are Production (163 | 2.6%), Transportation (131 | 2.1%), and Material Moving (111 | 1.8%).
Production, Transportation and Moving Occupations by Sex
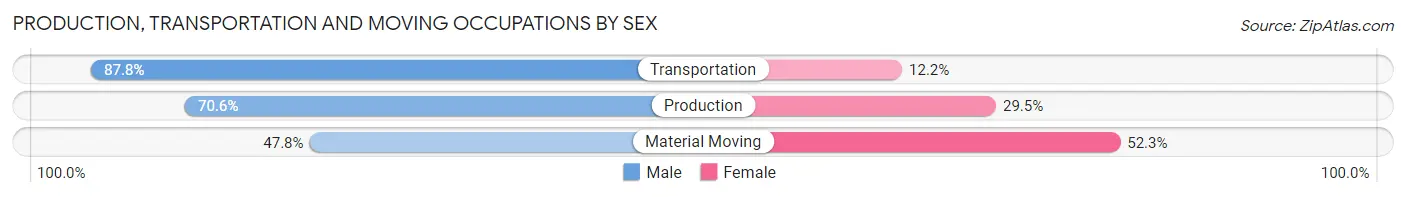
| Occupation | Male | Female |
| Production | 115 (70.6%) | 48 (29.4%) |
| Transportation | 115 (87.8%) | 16 (12.2%) |
| Material Moving | 53 (47.7%) | 58 (52.2%) |
| Total (Category) | 283 (69.9%) | 122 (30.1%) |
| Total (Overall) | 3,194 (51.8%) | 2,967 (48.2%) |
Employment Industries by Sex in Hobe Sound
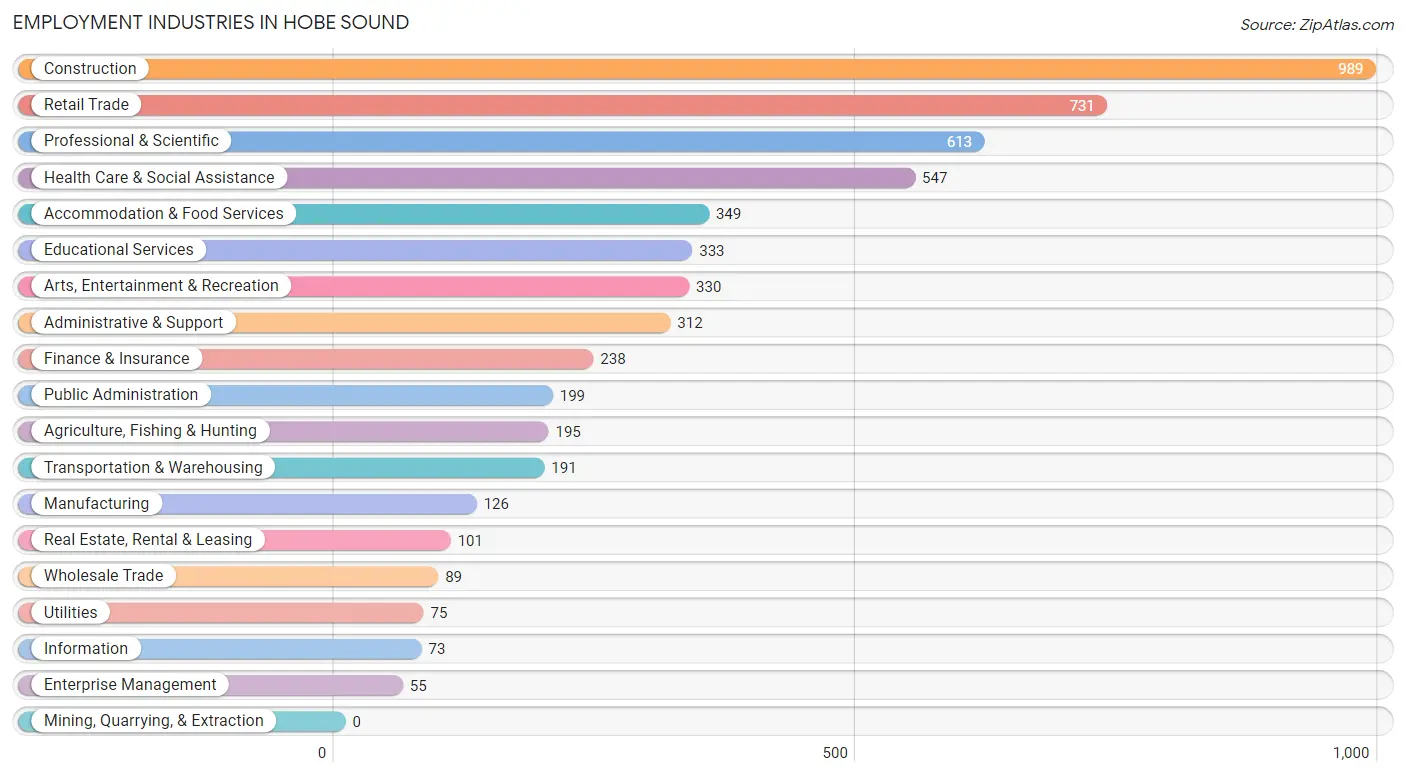
Employment Industries in Hobe Sound
The major employment industries in Hobe Sound include Construction (989 | 16.1%), Retail Trade (731 | 11.9%), Professional & Scientific (613 | 10.0%), Health Care & Social Assistance (547 | 8.9%), and Accommodation & Food Services (349 | 5.7%).
Employment Industries by Sex in Hobe Sound
The Hobe Sound industries that see more men than women are Agriculture, Fishing & Hunting (100.0%), Wholesale Trade (100.0%), and Enterprise Management (100.0%), whereas the industries that tend to have a higher number of women are Accommodation & Food Services (86.3%), Health Care & Social Assistance (71.3%), and Educational Services (67.0%).
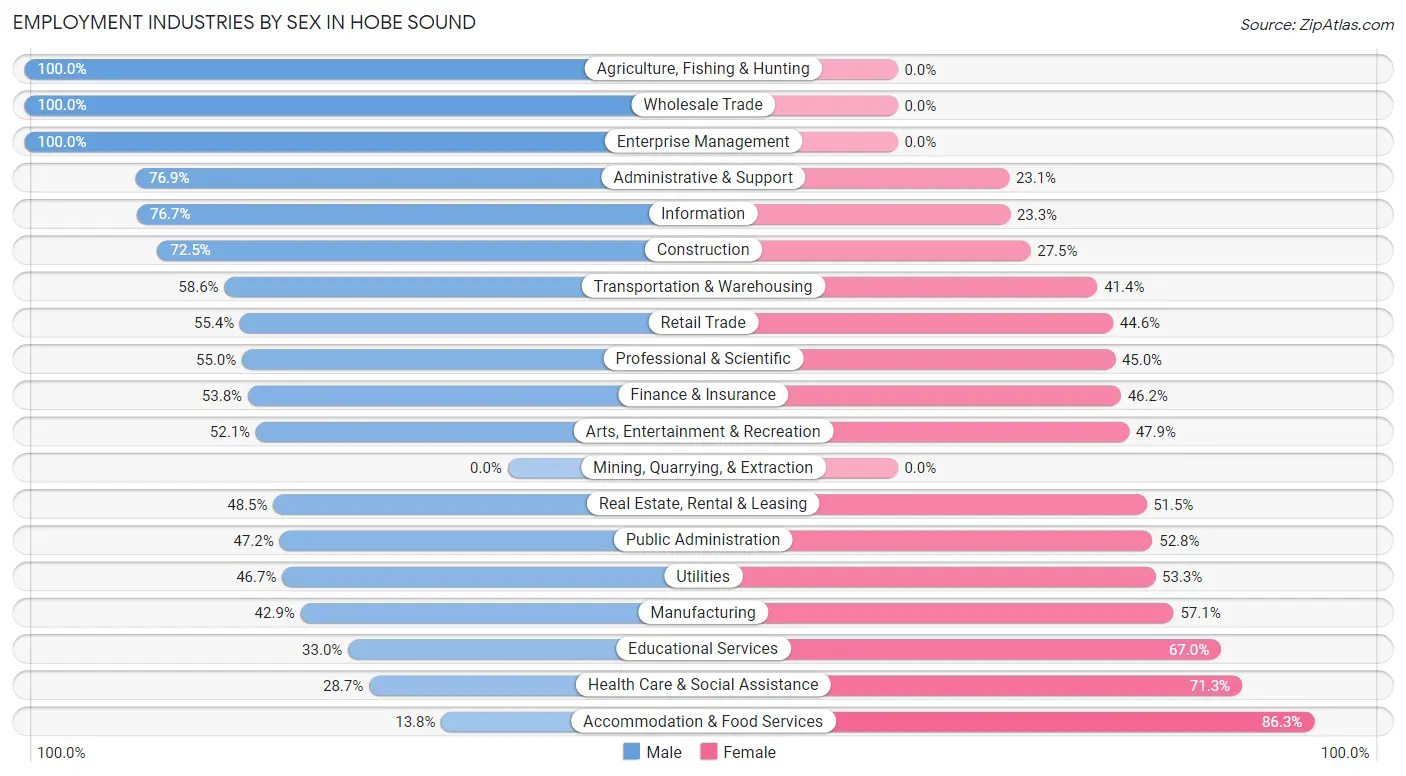
| Industry | Male | Female |
| Agriculture, Fishing & Hunting | 195 (100.0%) | 0 (0.0%) |
| Mining, Quarrying, & Extraction | 0 (0.0%) | 0 (0.0%) |
| Construction | 717 (72.5%) | 272 (27.5%) |
| Manufacturing | 54 (42.9%) | 72 (57.1%) |
| Wholesale Trade | 89 (100.0%) | 0 (0.0%) |
| Retail Trade | 405 (55.4%) | 326 (44.6%) |
| Transportation & Warehousing | 112 (58.6%) | 79 (41.4%) |
| Utilities | 35 (46.7%) | 40 (53.3%) |
| Information | 56 (76.7%) | 17 (23.3%) |
| Finance & Insurance | 128 (53.8%) | 110 (46.2%) |
| Real Estate, Rental & Leasing | 49 (48.5%) | 52 (51.5%) |
| Professional & Scientific | 337 (55.0%) | 276 (45.0%) |
| Enterprise Management | 55 (100.0%) | 0 (0.0%) |
| Administrative & Support | 240 (76.9%) | 72 (23.1%) |
| Educational Services | 110 (33.0%) | 223 (67.0%) |
| Health Care & Social Assistance | 157 (28.7%) | 390 (71.3%) |
| Arts, Entertainment & Recreation | 172 (52.1%) | 158 (47.9%) |
| Accommodation & Food Services | 48 (13.8%) | 301 (86.3%) |
| Public Administration | 94 (47.2%) | 105 (52.8%) |
| Total | 3,194 (51.8%) | 2,967 (48.2%) |
Education in Hobe Sound
School Enrollment in Hobe Sound
The most common levels of schooling among the 1,647 students in Hobe Sound are elementary school (406 | 24.6%), middle school (312 | 18.9%), and college / undergraduate (290 | 17.6%).
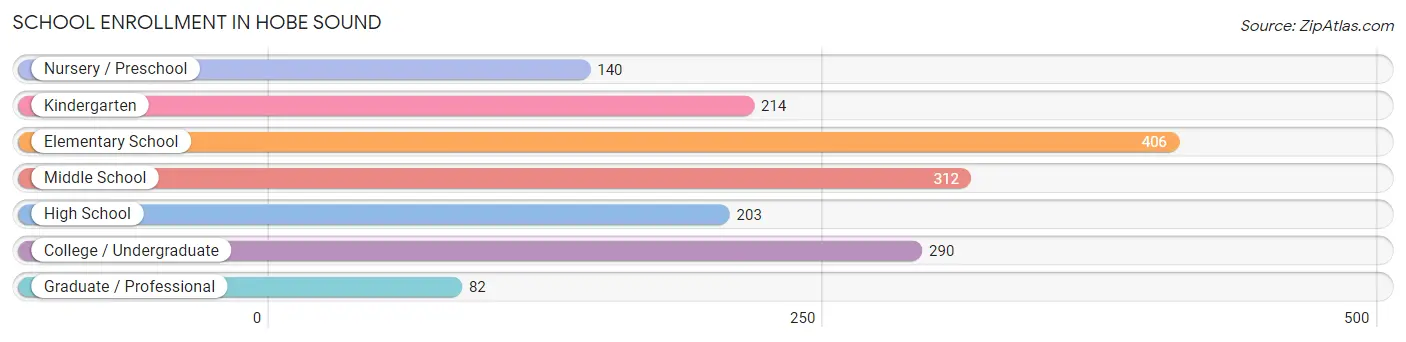
| School Level | # Students | % Students |
| Nursery / Preschool | 140 | 8.5% |
| Kindergarten | 214 | 13.0% |
| Elementary School | 406 | 24.6% |
| Middle School | 312 | 18.9% |
| High School | 203 | 12.3% |
| College / Undergraduate | 290 | 17.6% |
| Graduate / Professional | 82 | 5.0% |
| Total | 1,647 | 100.0% |
School Enrollment by Age by Funding Source in Hobe Sound
Out of a total of 1,647 students who are enrolled in schools in Hobe Sound, 524 (31.8%) attend a private institution, while the remaining 1,123 (68.2%) are enrolled in public schools. The age group of 3 to 4 year olds has the highest likelihood of being enrolled in private schools, with 71 (89.9% in the age bracket) enrolled. Conversely, the age group of 5 to 9 year old has the lowest likelihood of being enrolled in a private school, with 543 (83.3% in the age bracket) attending a public institution.
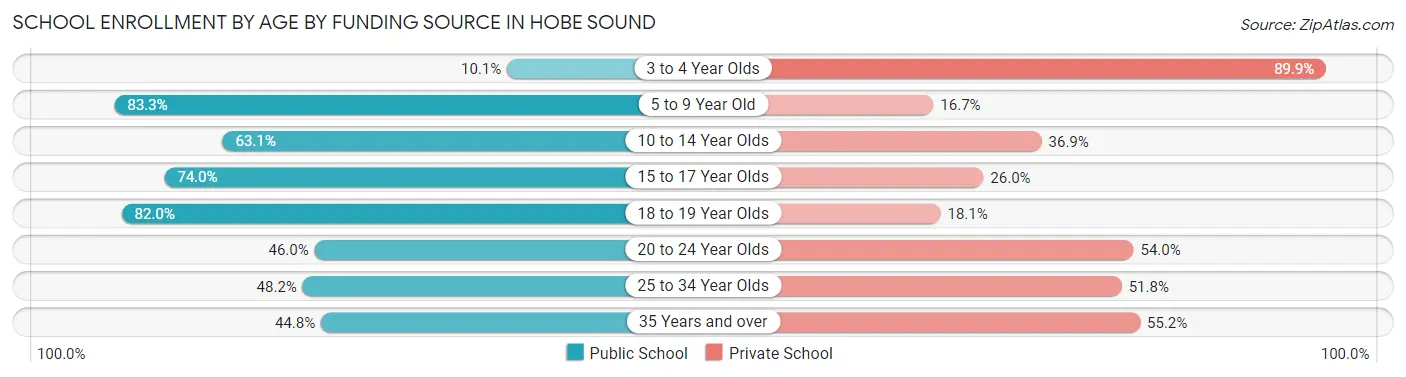
| Age Bracket | Public School | Private School |
| 3 to 4 Year Olds | 8 (10.1%) | 71 (89.9%) |
| 5 to 9 Year Old | 543 (83.3%) | 109 (16.7%) |
| 10 to 14 Year Olds | 226 (63.1%) | 132 (36.9%) |
| 15 to 17 Year Olds | 108 (74.0%) | 38 (26.0%) |
| 18 to 19 Year Olds | 109 (82.0%) | 24 (18.0%) |
| 20 to 24 Year Olds | 46 (46.0%) | 54 (54.0%) |
| 25 to 34 Year Olds | 54 (48.2%) | 58 (51.8%) |
| 35 Years and over | 30 (44.8%) | 37 (55.2%) |
| Total | 1,123 (68.2%) | 524 (31.8%) |
Educational Attainment by Field of Study in Hobe Sound
Business (749 | 23.2%), education (414 | 12.8%), science & technology (287 | 8.9%), engineering (255 | 7.9%), and social sciences (248 | 7.7%) are the most common fields of study among 3,229 individuals in Hobe Sound who have obtained a bachelor's degree or higher.
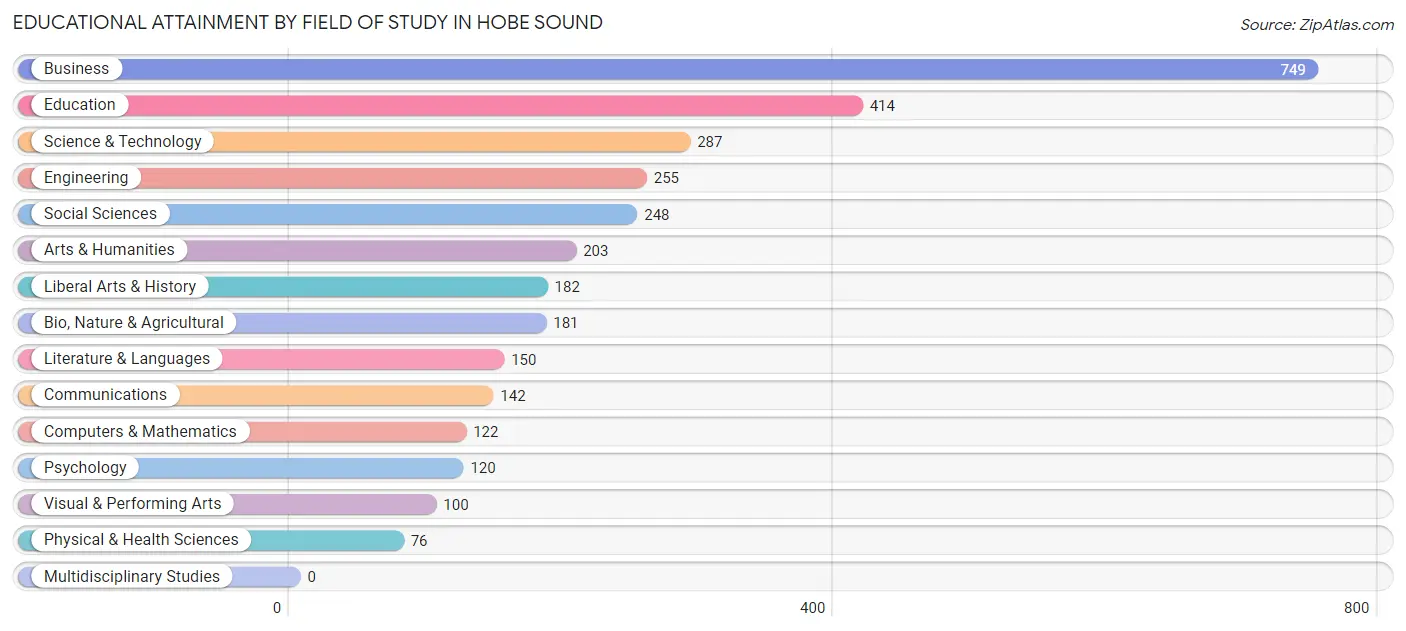
| Field of Study | # Graduates | % Graduates |
| Computers & Mathematics | 122 | 3.8% |
| Bio, Nature & Agricultural | 181 | 5.6% |
| Physical & Health Sciences | 76 | 2.4% |
| Psychology | 120 | 3.7% |
| Social Sciences | 248 | 7.7% |
| Engineering | 255 | 7.9% |
| Multidisciplinary Studies | 0 | 0.0% |
| Science & Technology | 287 | 8.9% |
| Business | 749 | 23.2% |
| Education | 414 | 12.8% |
| Literature & Languages | 150 | 4.6% |
| Liberal Arts & History | 182 | 5.6% |
| Visual & Performing Arts | 100 | 3.1% |
| Communications | 142 | 4.4% |
| Arts & Humanities | 203 | 6.3% |
| Total | 3,229 | 100.0% |
Transportation & Commute in Hobe Sound
Vehicle Availability by Sex in Hobe Sound
The most prevalent vehicle ownership categories in Hobe Sound are males with 2 vehicles (1,423, accounting for 45.0%) and females with 2 vehicles (1,331, making up 48.4%).
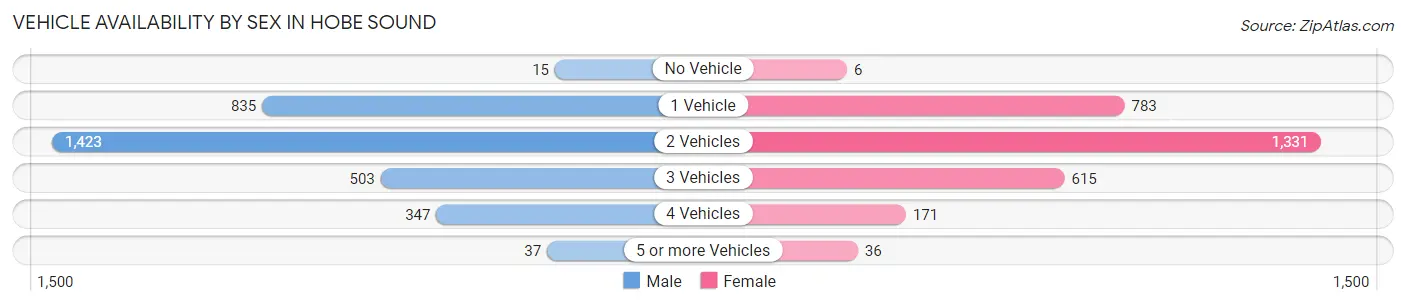
| Vehicles Available | Male | Female |
| No Vehicle | 15 (0.5%) | 6 (0.2%) |
| 1 Vehicle | 835 (26.4%) | 783 (26.6%) |
| 2 Vehicles | 1,423 (45.0%) | 1,331 (45.2%) |
| 3 Vehicles | 503 (15.9%) | 615 (20.9%) |
| 4 Vehicles | 347 (11.0%) | 171 (5.8%) |
| 5 or more Vehicles | 37 (1.2%) | 36 (1.2%) |
| Total | 3,160 (100.0%) | 2,942 (100.0%) |
Commute Time in Hobe Sound
The most frequently occuring commute durations in Hobe Sound are 30 to 34 minutes (917 commuters, 17.6%), 15 to 19 minutes (783 commuters, 15.0%), and 20 to 24 minutes (749 commuters, 14.4%).
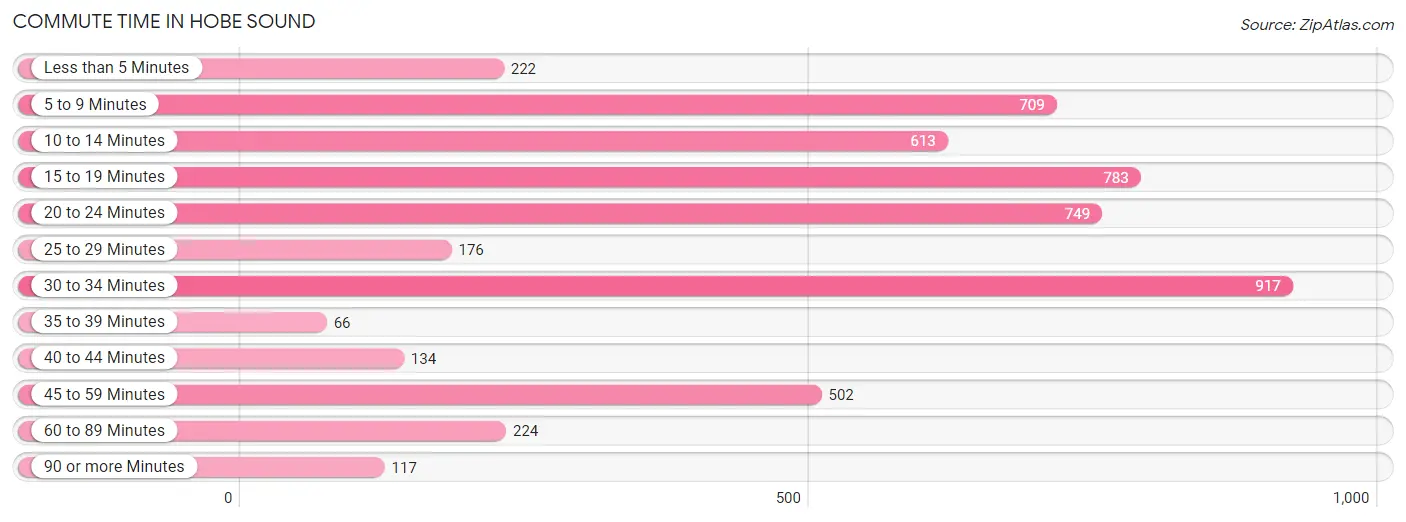
| Commute Time | # Commuters | % Commuters |
| Less than 5 Minutes | 222 | 4.3% |
| 5 to 9 Minutes | 709 | 13.6% |
| 10 to 14 Minutes | 613 | 11.8% |
| 15 to 19 Minutes | 783 | 15.0% |
| 20 to 24 Minutes | 749 | 14.4% |
| 25 to 29 Minutes | 176 | 3.4% |
| 30 to 34 Minutes | 917 | 17.6% |
| 35 to 39 Minutes | 66 | 1.3% |
| 40 to 44 Minutes | 134 | 2.6% |
| 45 to 59 Minutes | 502 | 9.6% |
| 60 to 89 Minutes | 224 | 4.3% |
| 90 or more Minutes | 117 | 2.2% |
Commute Time by Sex in Hobe Sound
The most common commute times in Hobe Sound are 30 to 34 minutes (479 commuters, 17.4%) for males and 5 to 9 minutes (454 commuters, 18.5%) for females.
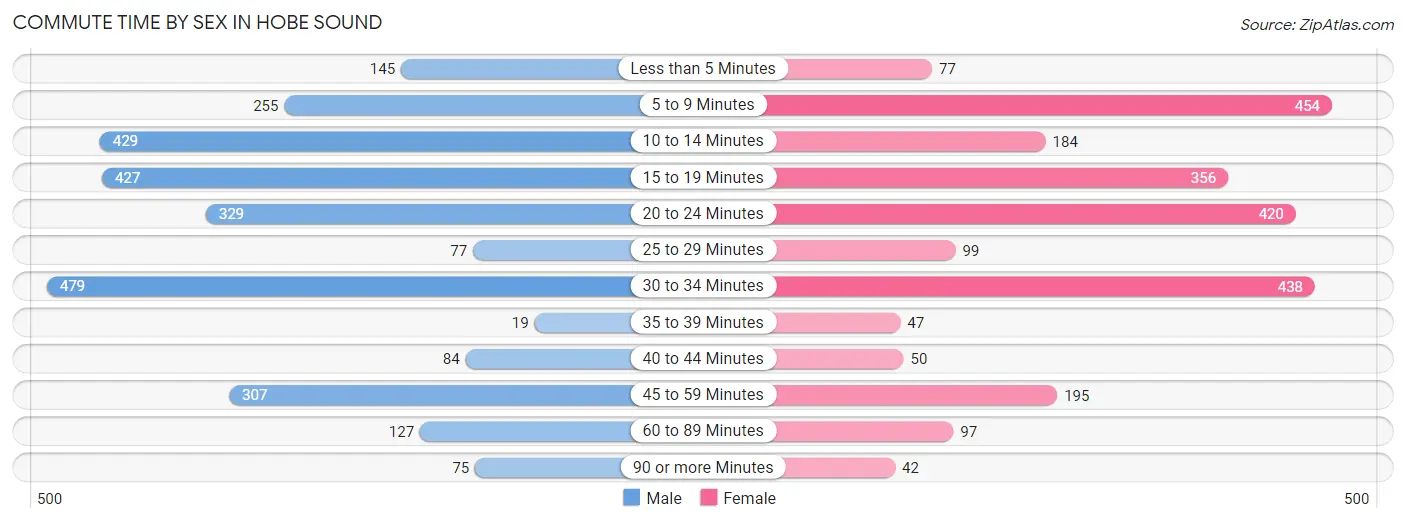
| Commute Time | Male | Female |
| Less than 5 Minutes | 145 (5.3%) | 77 (3.1%) |
| 5 to 9 Minutes | 255 (9.3%) | 454 (18.5%) |
| 10 to 14 Minutes | 429 (15.6%) | 184 (7.5%) |
| 15 to 19 Minutes | 427 (15.5%) | 356 (14.5%) |
| 20 to 24 Minutes | 329 (11.9%) | 420 (17.1%) |
| 25 to 29 Minutes | 77 (2.8%) | 99 (4.0%) |
| 30 to 34 Minutes | 479 (17.4%) | 438 (17.8%) |
| 35 to 39 Minutes | 19 (0.7%) | 47 (1.9%) |
| 40 to 44 Minutes | 84 (3.0%) | 50 (2.0%) |
| 45 to 59 Minutes | 307 (11.2%) | 195 (7.9%) |
| 60 to 89 Minutes | 127 (4.6%) | 97 (3.9%) |
| 90 or more Minutes | 75 (2.7%) | 42 (1.7%) |
Time of Departure to Work by Sex in Hobe Sound
The most frequent times of departure to work in Hobe Sound are 6:30 AM to 6:59 AM (634, 23.0%) for males and 8:00 AM to 8:29 AM (498, 20.3%) for females.
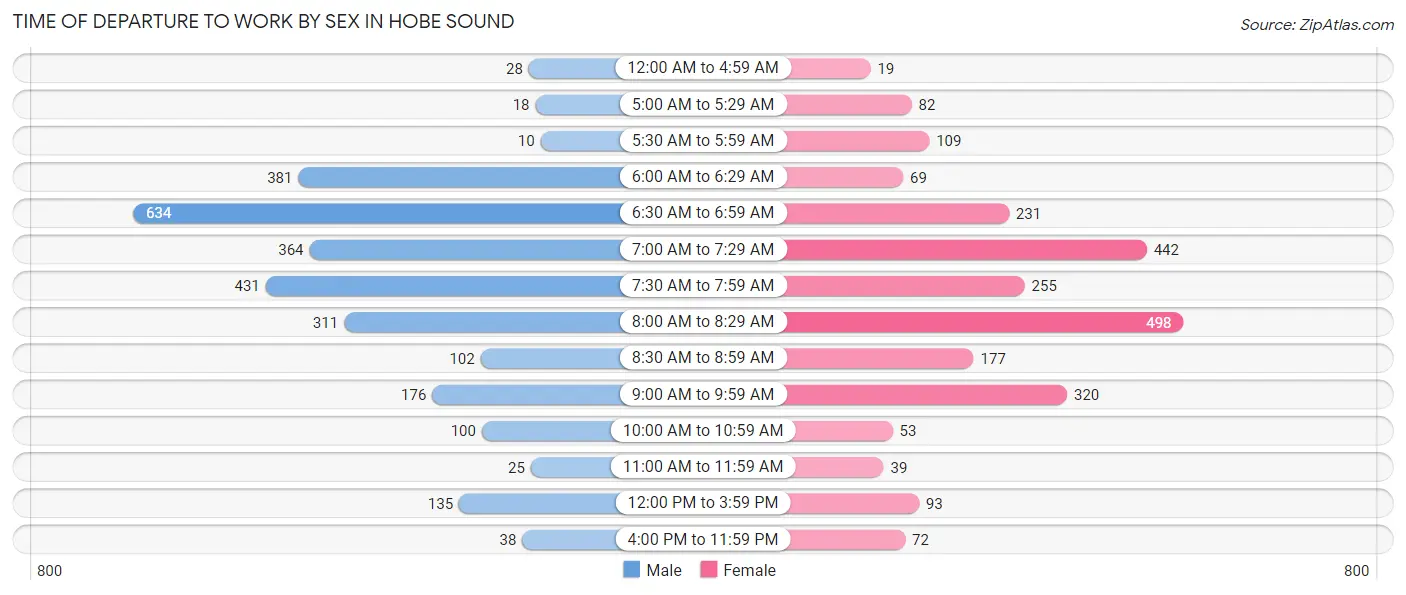
| Time of Departure | Male | Female |
| 12:00 AM to 4:59 AM | 28 (1.0%) | 19 (0.8%) |
| 5:00 AM to 5:29 AM | 18 (0.6%) | 82 (3.3%) |
| 5:30 AM to 5:59 AM | 10 (0.4%) | 109 (4.4%) |
| 6:00 AM to 6:29 AM | 381 (13.8%) | 69 (2.8%) |
| 6:30 AM to 6:59 AM | 634 (23.0%) | 231 (9.4%) |
| 7:00 AM to 7:29 AM | 364 (13.2%) | 442 (18.0%) |
| 7:30 AM to 7:59 AM | 431 (15.7%) | 255 (10.4%) |
| 8:00 AM to 8:29 AM | 311 (11.3%) | 498 (20.3%) |
| 8:30 AM to 8:59 AM | 102 (3.7%) | 177 (7.2%) |
| 9:00 AM to 9:59 AM | 176 (6.4%) | 320 (13.0%) |
| 10:00 AM to 10:59 AM | 100 (3.6%) | 53 (2.2%) |
| 11:00 AM to 11:59 AM | 25 (0.9%) | 39 (1.6%) |
| 12:00 PM to 3:59 PM | 135 (4.9%) | 93 (3.8%) |
| 4:00 PM to 11:59 PM | 38 (1.4%) | 72 (2.9%) |
| Total | 2,753 (100.0%) | 2,459 (100.0%) |
Housing Occupancy in Hobe Sound
Occupancy by Ownership in Hobe Sound
Of the total 6,234 dwellings in Hobe Sound, owner-occupied units account for 4,864 (78.0%), while renter-occupied units make up 1,370 (22.0%).
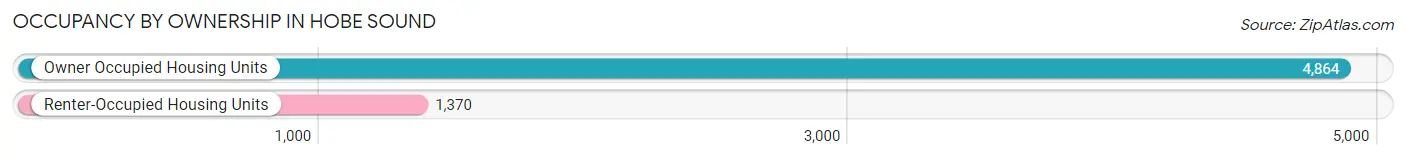
| Occupancy | # Housing Units | % Housing Units |
| Owner Occupied Housing Units | 4,864 | 78.0% |
| Renter-Occupied Housing Units | 1,370 | 22.0% |
| Total Occupied Housing Units | 6,234 | 100.0% |
Occupancy by Household Size in Hobe Sound
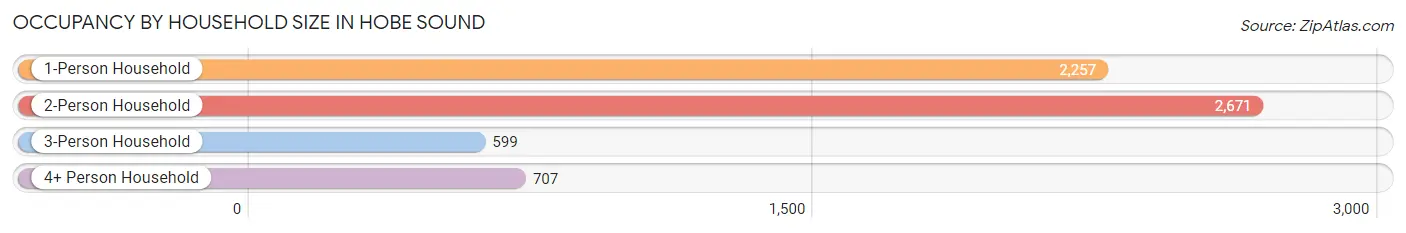
| Household Size | # Housing Units | % Housing Units |
| 1-Person Household | 2,257 | 36.2% |
| 2-Person Household | 2,671 | 42.8% |
| 3-Person Household | 599 | 9.6% |
| 4+ Person Household | 707 | 11.3% |
| Total Housing Units | 6,234 | 100.0% |
Occupancy by Ownership by Household Size in Hobe Sound
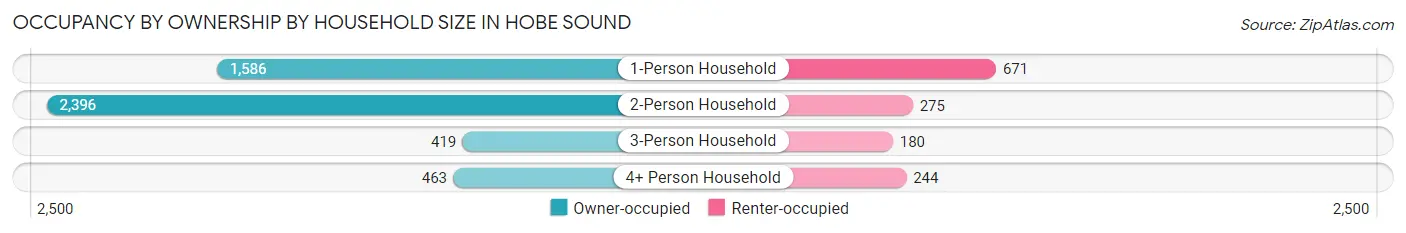
| Household Size | Owner-occupied | Renter-occupied |
| 1-Person Household | 1,586 (70.3%) | 671 (29.7%) |
| 2-Person Household | 2,396 (89.7%) | 275 (10.3%) |
| 3-Person Household | 419 (70.0%) | 180 (30.0%) |
| 4+ Person Household | 463 (65.5%) | 244 (34.5%) |
| Total Housing Units | 4,864 (78.0%) | 1,370 (22.0%) |
Occupancy by Educational Attainment in Hobe Sound
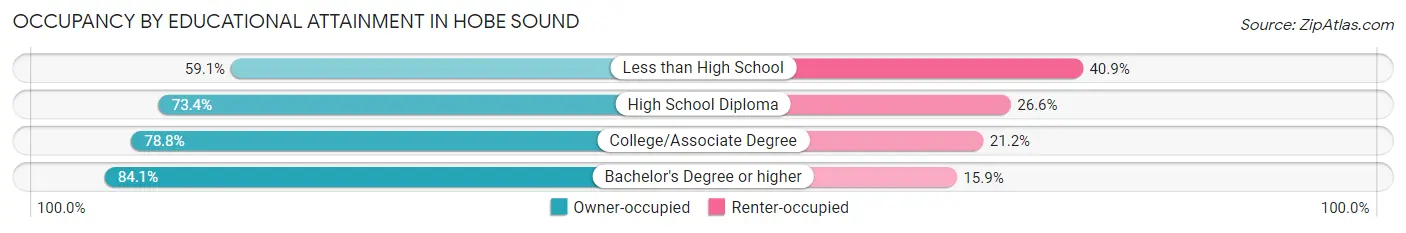
| Household Size | Owner-occupied | Renter-occupied |
| Less than High School | 224 (59.1%) | 155 (40.9%) |
| High School Diploma | 1,114 (73.4%) | 404 (26.6%) |
| College/Associate Degree | 1,815 (78.8%) | 487 (21.2%) |
| Bachelor's Degree or higher | 1,711 (84.1%) | 324 (15.9%) |
Occupancy by Age of Householder in Hobe Sound
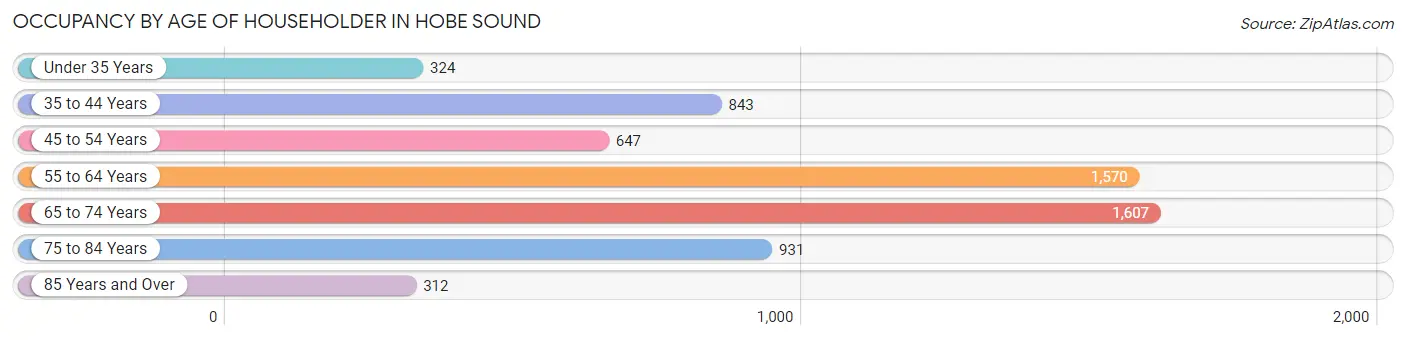
| Age Bracket | # Households | % Households |
| Under 35 Years | 324 | 5.2% |
| 35 to 44 Years | 843 | 13.5% |
| 45 to 54 Years | 647 | 10.4% |
| 55 to 64 Years | 1,570 | 25.2% |
| 65 to 74 Years | 1,607 | 25.8% |
| 75 to 84 Years | 931 | 14.9% |
| 85 Years and Over | 312 | 5.0% |
| Total | 6,234 | 100.0% |
Housing Finances in Hobe Sound
Median Income by Occupancy in Hobe Sound
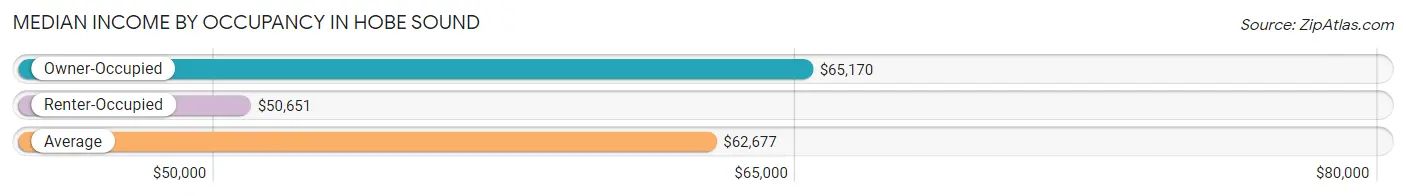
| Occupancy Type | # Households | Median Income |
| Owner-Occupied | 4,864 (78.0%) | $65,170 |
| Renter-Occupied | 1,370 (22.0%) | $50,651 |
| Average | 6,234 (100.0%) | $62,677 |
Occupancy by Householder Income Bracket in Hobe Sound
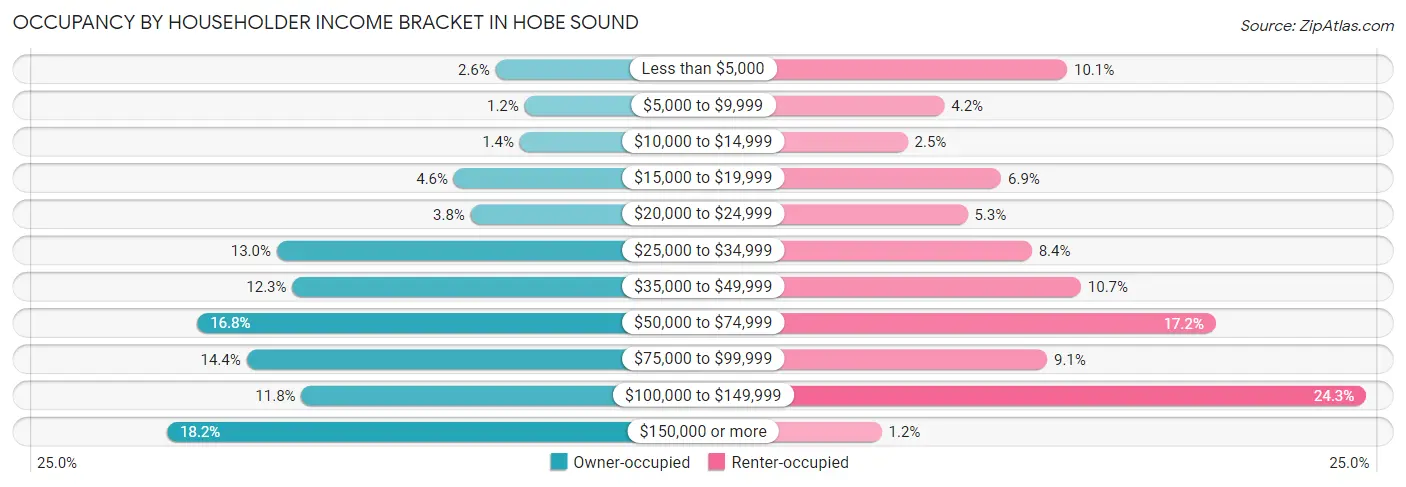
| Income Bracket | Owner-occupied | Renter-occupied |
| Less than $5,000 | 125 (2.6%) | 138 (10.1%) |
| $5,000 to $9,999 | 58 (1.2%) | 58 (4.2%) |
| $10,000 to $14,999 | 69 (1.4%) | 34 (2.5%) |
| $15,000 to $19,999 | 222 (4.6%) | 95 (6.9%) |
| $20,000 to $24,999 | 183 (3.8%) | 73 (5.3%) |
| $25,000 to $34,999 | 632 (13.0%) | 115 (8.4%) |
| $35,000 to $49,999 | 596 (12.2%) | 147 (10.7%) |
| $50,000 to $74,999 | 816 (16.8%) | 235 (17.2%) |
| $75,000 to $99,999 | 702 (14.4%) | 125 (9.1%) |
| $100,000 to $149,999 | 575 (11.8%) | 333 (24.3%) |
| $150,000 or more | 886 (18.2%) | 17 (1.2%) |
| Total | 4,864 (100.0%) | 1,370 (100.0%) |
Monthly Housing Cost Tiers in Hobe Sound
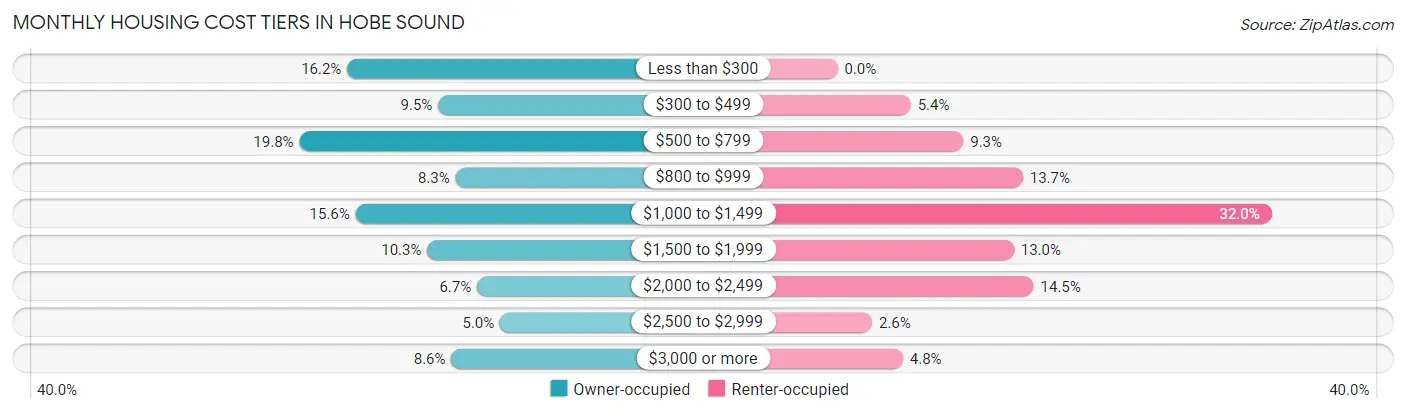
| Monthly Cost | Owner-occupied | Renter-occupied |
| Less than $300 | 790 (16.2%) | 0 (0.0%) |
| $300 to $499 | 464 (9.5%) | 74 (5.4%) |
| $500 to $799 | 961 (19.8%) | 127 (9.3%) |
| $800 to $999 | 402 (8.3%) | 187 (13.7%) |
| $1,000 to $1,499 | 760 (15.6%) | 438 (32.0%) |
| $1,500 to $1,999 | 503 (10.3%) | 178 (13.0%) |
| $2,000 to $2,499 | 325 (6.7%) | 198 (14.4%) |
| $2,500 to $2,999 | 242 (5.0%) | 35 (2.5%) |
| $3,000 or more | 417 (8.6%) | 66 (4.8%) |
| Total | 4,864 (100.0%) | 1,370 (100.0%) |
Physical Housing Characteristics in Hobe Sound
Housing Structures in Hobe Sound
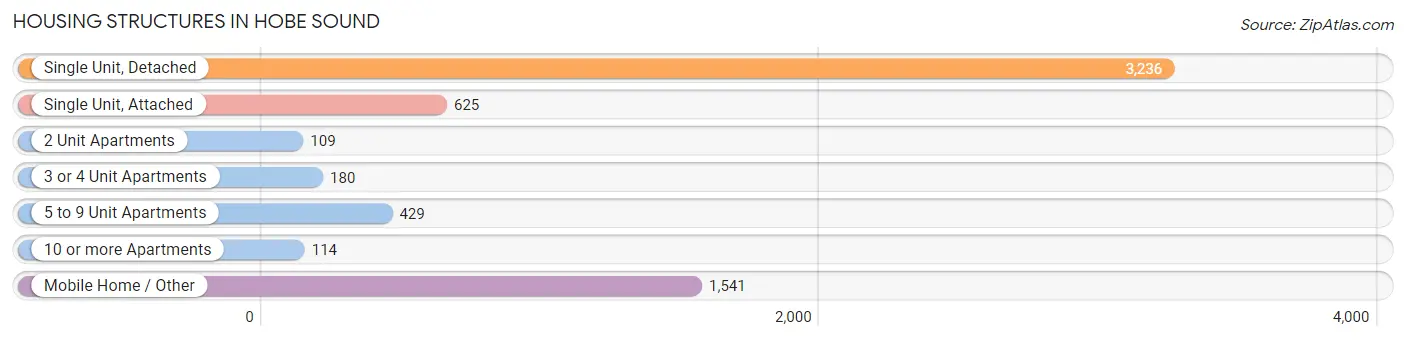
| Structure Type | # Housing Units | % Housing Units |
| Single Unit, Detached | 3,236 | 51.9% |
| Single Unit, Attached | 625 | 10.0% |
| 2 Unit Apartments | 109 | 1.8% |
| 3 or 4 Unit Apartments | 180 | 2.9% |
| 5 to 9 Unit Apartments | 429 | 6.9% |
| 10 or more Apartments | 114 | 1.8% |
| Mobile Home / Other | 1,541 | 24.7% |
| Total | 6,234 | 100.0% |
Housing Structures by Occupancy in Hobe Sound
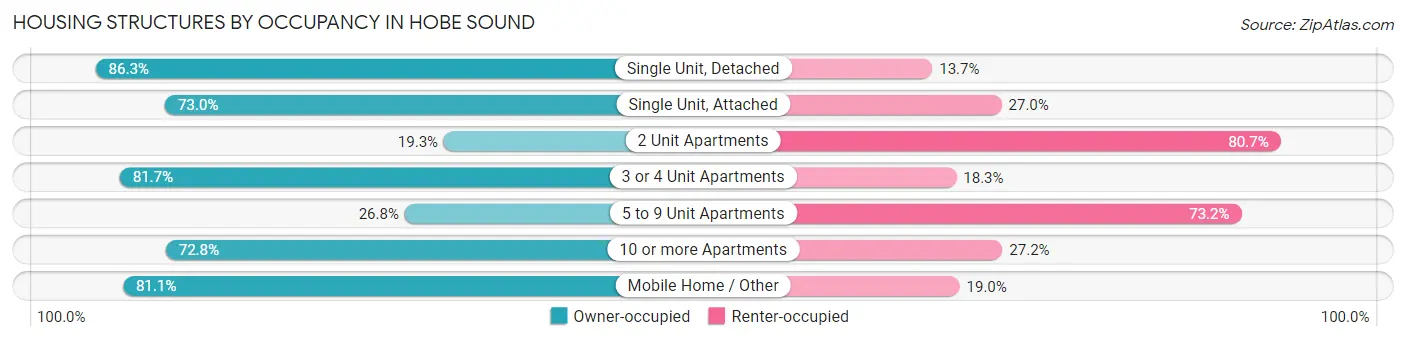
| Structure Type | Owner-occupied | Renter-occupied |
| Single Unit, Detached | 2,793 (86.3%) | 443 (13.7%) |
| Single Unit, Attached | 456 (73.0%) | 169 (27.0%) |
| 2 Unit Apartments | 21 (19.3%) | 88 (80.7%) |
| 3 or 4 Unit Apartments | 147 (81.7%) | 33 (18.3%) |
| 5 to 9 Unit Apartments | 115 (26.8%) | 314 (73.2%) |
| 10 or more Apartments | 83 (72.8%) | 31 (27.2%) |
| Mobile Home / Other | 1,249 (81.0%) | 292 (19.0%) |
| Total | 4,864 (78.0%) | 1,370 (22.0%) |
Housing Structures by Number of Rooms in Hobe Sound
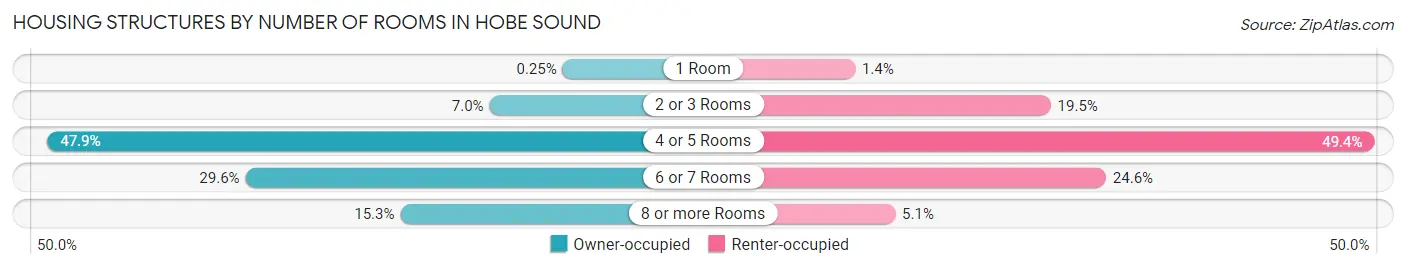
| Number of Rooms | Owner-occupied | Renter-occupied |
| 1 Room | 12 (0.3%) | 19 (1.4%) |
| 2 or 3 Rooms | 341 (7.0%) | 267 (19.5%) |
| 4 or 5 Rooms | 2,330 (47.9%) | 677 (49.4%) |
| 6 or 7 Rooms | 1,439 (29.6%) | 337 (24.6%) |
| 8 or more Rooms | 742 (15.2%) | 70 (5.1%) |
| Total | 4,864 (100.0%) | 1,370 (100.0%) |
Housing Structure by Heating Type in Hobe Sound
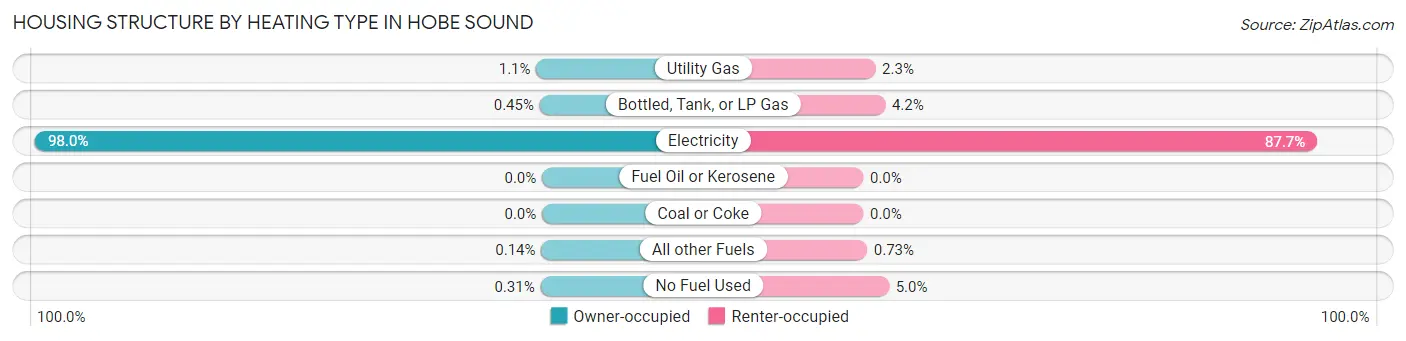
| Heating Type | Owner-occupied | Renter-occupied |
| Utility Gas | 54 (1.1%) | 32 (2.3%) |
| Bottled, Tank, or LP Gas | 22 (0.4%) | 58 (4.2%) |
| Electricity | 4,766 (98.0%) | 1,202 (87.7%) |
| Fuel Oil or Kerosene | 0 (0.0%) | 0 (0.0%) |
| Coal or Coke | 0 (0.0%) | 0 (0.0%) |
| All other Fuels | 7 (0.1%) | 10 (0.7%) |
| No Fuel Used | 15 (0.3%) | 68 (5.0%) |
| Total | 4,864 (100.0%) | 1,370 (100.0%) |
Household Vehicle Usage in Hobe Sound
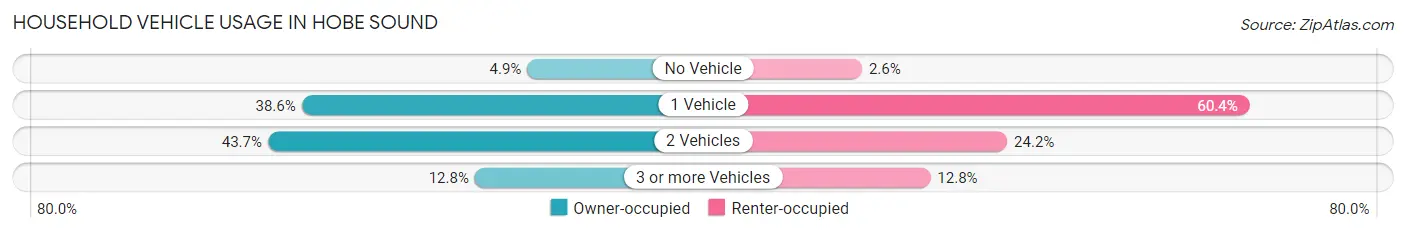
| Vehicles per Household | Owner-occupied | Renter-occupied |
| No Vehicle | 240 (4.9%) | 35 (2.5%) |
| 1 Vehicle | 1,879 (38.6%) | 828 (60.4%) |
| 2 Vehicles | 2,124 (43.7%) | 332 (24.2%) |
| 3 or more Vehicles | 621 (12.8%) | 175 (12.8%) |
| Total | 4,864 (100.0%) | 1,370 (100.0%) |
Real Estate & Mortgages in Hobe Sound
Real Estate and Mortgage Overview in Hobe Sound
| Characteristic | Without Mortgage | With Mortgage |
| Housing Units | 2,822 | 2,042 |
| Median Property Value | $213,800 | $400,000 |
| Median Household Income | $53,542 | $526 |
| Monthly Housing Costs | $570 | $405 |
| Real Estate Taxes | $2,067 | $75 |
Property Value by Mortgage Status in Hobe Sound
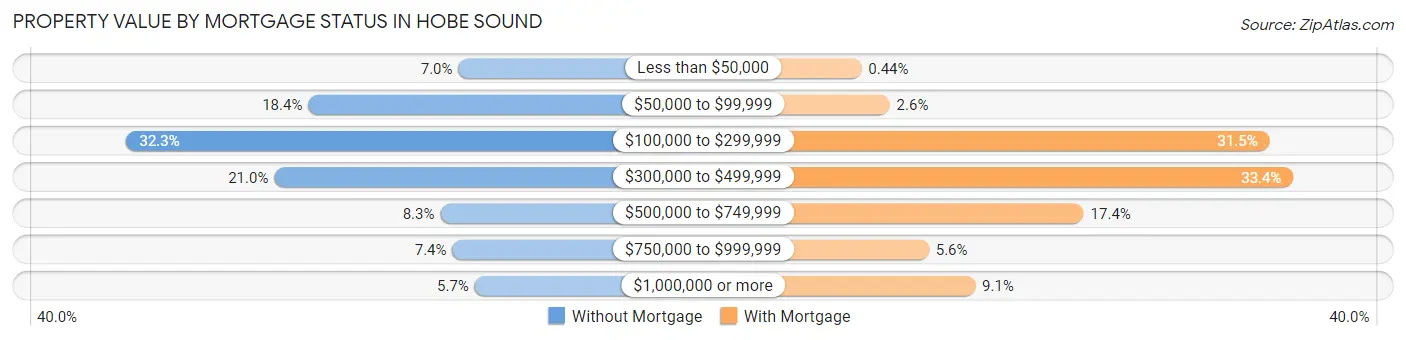
| Property Value | Without Mortgage | With Mortgage |
| Less than $50,000 | 196 (7.0%) | 9 (0.4%) |
| $50,000 to $99,999 | 519 (18.4%) | 53 (2.6%) |
| $100,000 to $299,999 | 910 (32.3%) | 644 (31.5%) |
| $300,000 to $499,999 | 592 (21.0%) | 681 (33.4%) |
| $500,000 to $749,999 | 235 (8.3%) | 355 (17.4%) |
| $750,000 to $999,999 | 209 (7.4%) | 114 (5.6%) |
| $1,000,000 or more | 161 (5.7%) | 186 (9.1%) |
| Total | 2,822 (100.0%) | 2,042 (100.0%) |
Household Income by Mortgage Status in Hobe Sound
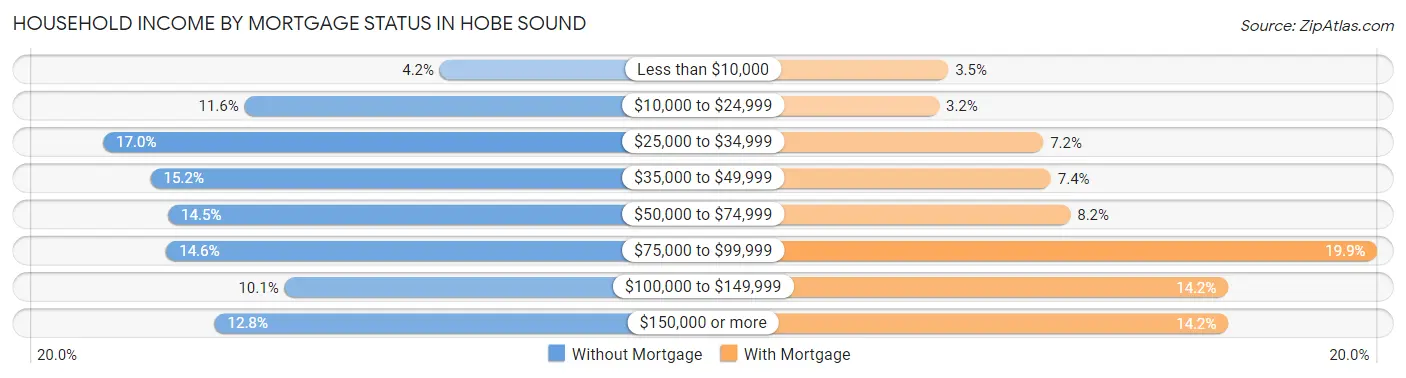
| Household Income | Without Mortgage | With Mortgage |
| Less than $10,000 | 118 (4.2%) | 72 (3.5%) |
| $10,000 to $24,999 | 328 (11.6%) | 65 (3.2%) |
| $25,000 to $34,999 | 480 (17.0%) | 146 (7.1%) |
| $35,000 to $49,999 | 429 (15.2%) | 152 (7.4%) |
| $50,000 to $74,999 | 410 (14.5%) | 167 (8.2%) |
| $75,000 to $99,999 | 412 (14.6%) | 406 (19.9%) |
| $100,000 to $149,999 | 285 (10.1%) | 290 (14.2%) |
| $150,000 or more | 360 (12.8%) | 290 (14.2%) |
| Total | 2,822 (100.0%) | 2,042 (100.0%) |
Property Value to Household Income Ratio in Hobe Sound
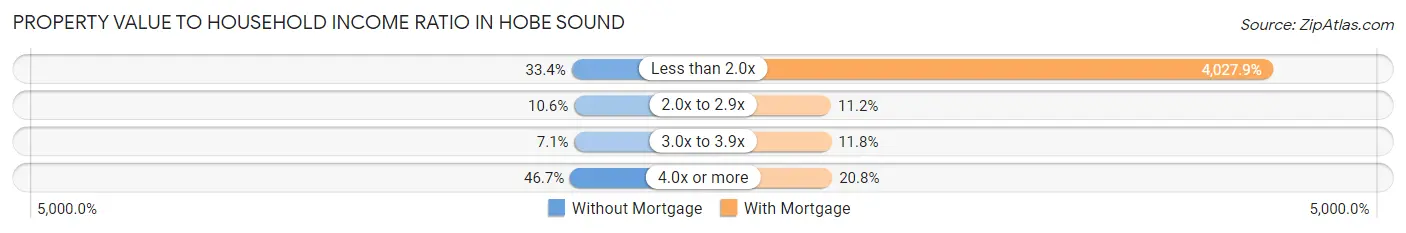
| Value-to-Income Ratio | Without Mortgage | With Mortgage |
| Less than 2.0x | 943 (33.4%) | 82,250 (4,027.9%) |
| 2.0x to 2.9x | 299 (10.6%) | 229 (11.2%) |
| 3.0x to 3.9x | 199 (7.0%) | 240 (11.7%) |
| 4.0x or more | 1,317 (46.7%) | 425 (20.8%) |
| Total | 2,822 (100.0%) | 2,042 (100.0%) |
Real Estate Taxes by Mortgage Status in Hobe Sound
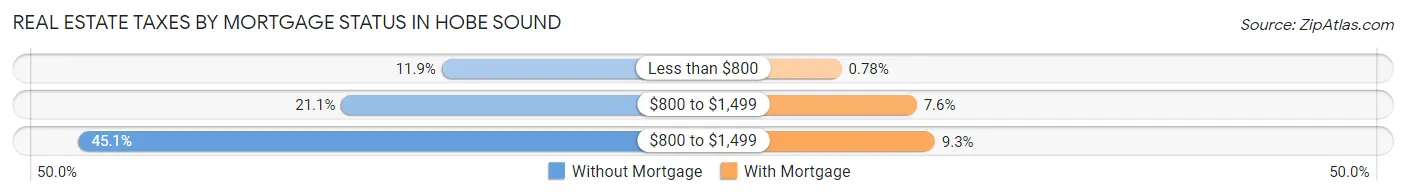
| Property Taxes | Without Mortgage | With Mortgage |
| Less than $800 | 336 (11.9%) | 16 (0.8%) |
| $800 to $1,499 | 595 (21.1%) | 156 (7.6%) |
| $800 to $1,499 | 1,272 (45.1%) | 190 (9.3%) |
| Total | 2,822 (100.0%) | 2,042 (100.0%) |
Health & Disability in Hobe Sound
Health Insurance Coverage by Age in Hobe Sound
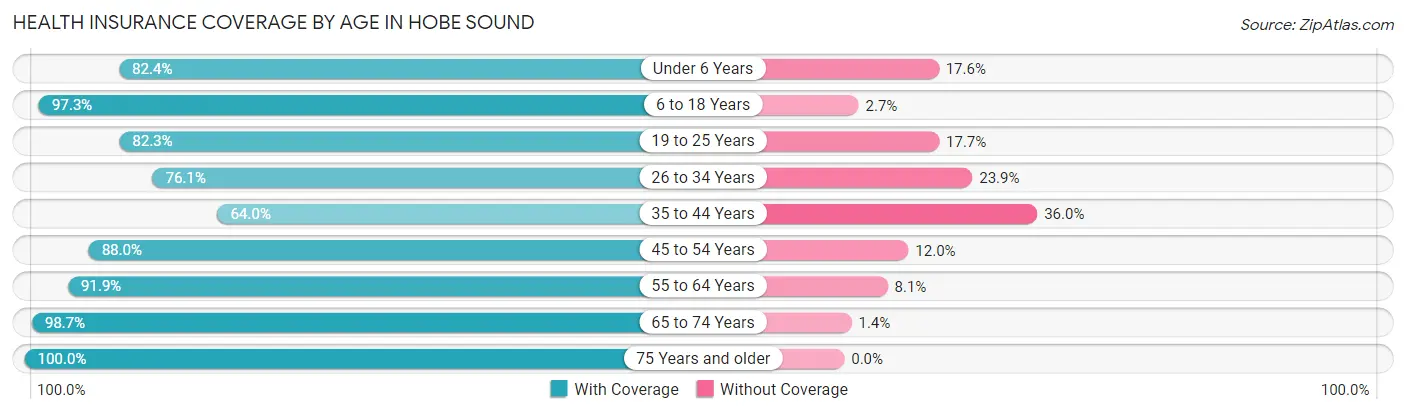
| Age Bracket | With Coverage | Without Coverage |
| Under 6 Years | 725 (82.4%) | 155 (17.6%) |
| 6 to 18 Years | 1,274 (97.3%) | 35 (2.7%) |
| 19 to 25 Years | 768 (82.3%) | 165 (17.7%) |
| 26 to 34 Years | 638 (76.1%) | 200 (23.9%) |
| 35 to 44 Years | 1,000 (64.0%) | 562 (36.0%) |
| 45 to 54 Years | 1,067 (88.0%) | 145 (12.0%) |
| 55 to 64 Years | 2,582 (91.9%) | 227 (8.1%) |
| 65 to 74 Years | 2,269 (98.7%) | 31 (1.3%) |
| 75 Years and older | 2,171 (100.0%) | 0 (0.0%) |
| Total | 12,494 (89.1%) | 1,520 (10.8%) |
Health Insurance Coverage by Citizenship Status in Hobe Sound
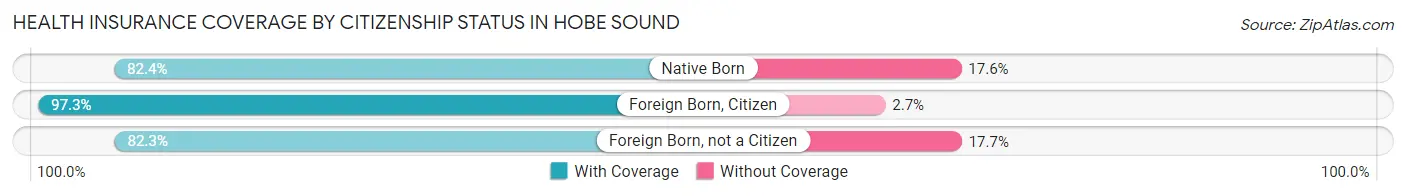
| Citizenship Status | With Coverage | Without Coverage |
| Native Born | 725 (82.4%) | 155 (17.6%) |
| Foreign Born, Citizen | 1,274 (97.3%) | 35 (2.7%) |
| Foreign Born, not a Citizen | 768 (82.3%) | 165 (17.7%) |
Health Insurance Coverage by Household Income in Hobe Sound
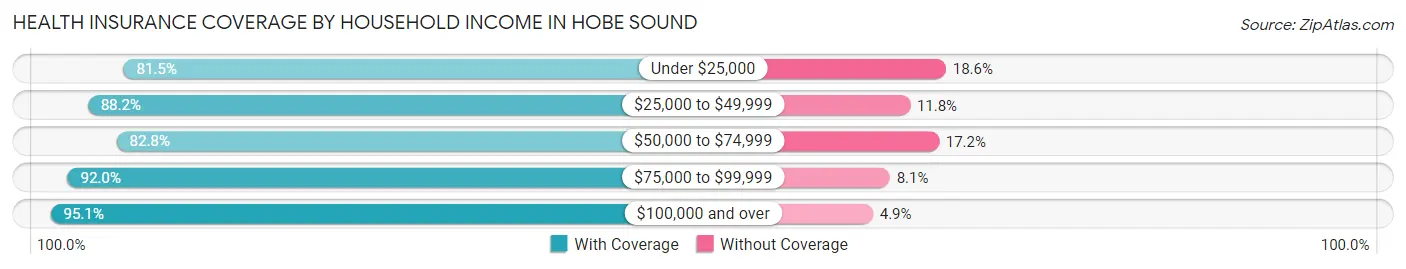
| Household Income | With Coverage | Without Coverage |
| Under $25,000 | 1,374 (81.5%) | 313 (18.5%) |
| $25,000 to $49,999 | 2,333 (88.2%) | 313 (11.8%) |
| $50,000 to $74,999 | 2,146 (82.8%) | 447 (17.2%) |
| $75,000 to $99,999 | 1,941 (91.9%) | 170 (8.1%) |
| $100,000 and over | 4,608 (95.1%) | 236 (4.9%) |
Public vs Private Health Insurance Coverage by Age in Hobe Sound
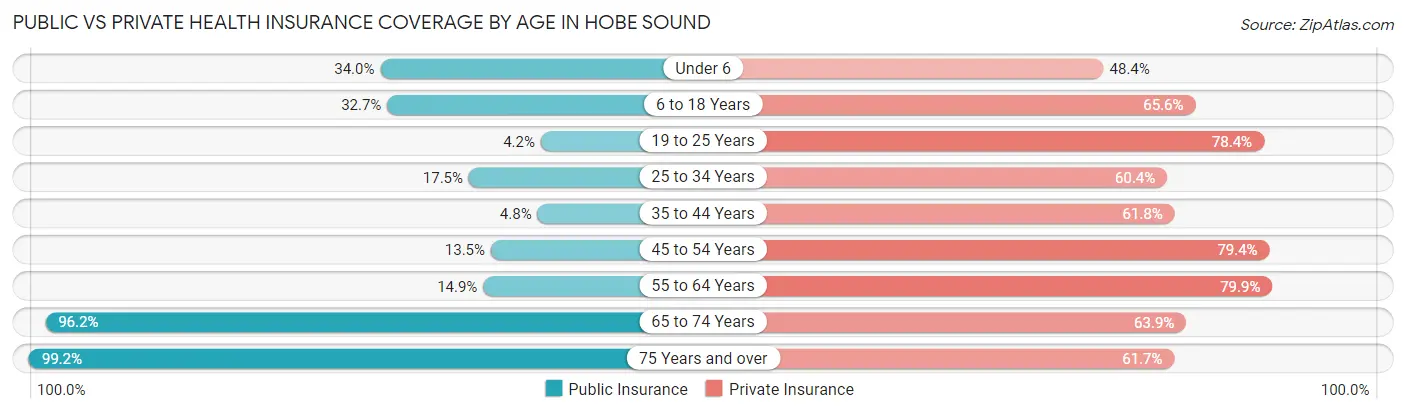
| Age Bracket | Public Insurance | Private Insurance |
| Under 6 | 299 (34.0%) | 426 (48.4%) |
| 6 to 18 Years | 428 (32.7%) | 859 (65.6%) |
| 19 to 25 Years | 39 (4.2%) | 731 (78.3%) |
| 25 to 34 Years | 147 (17.5%) | 506 (60.4%) |
| 35 to 44 Years | 75 (4.8%) | 965 (61.8%) |
| 45 to 54 Years | 163 (13.5%) | 962 (79.4%) |
| 55 to 64 Years | 418 (14.9%) | 2,244 (79.9%) |
| 65 to 74 Years | 2,212 (96.2%) | 1,470 (63.9%) |
| 75 Years and over | 2,154 (99.2%) | 1,340 (61.7%) |
| Total | 5,935 (42.3%) | 9,503 (67.8%) |
Disability Status by Sex by Age in Hobe Sound
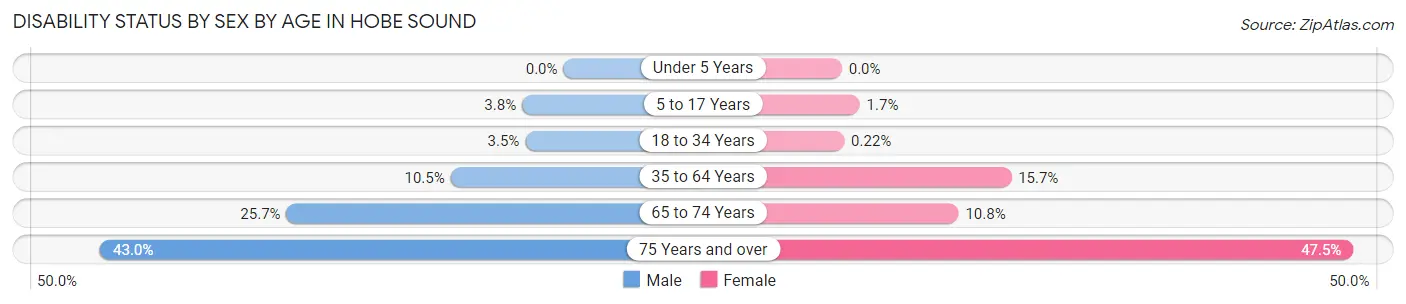
| Age Bracket | Male | Female |
| Under 5 Years | 0 (0.0%) | 0 (0.0%) |
| 5 to 17 Years | 30 (3.8%) | 9 (1.7%) |
| 18 to 34 Years | 34 (3.5%) | 2 (0.2%) |
| 35 to 64 Years | 298 (10.5%) | 430 (15.7%) |
| 65 to 74 Years | 266 (25.7%) | 137 (10.8%) |
| 75 Years and over | 494 (43.0%) | 485 (47.5%) |
Disability Class by Sex by Age in Hobe Sound
Disability Class: Hearing Difficulty
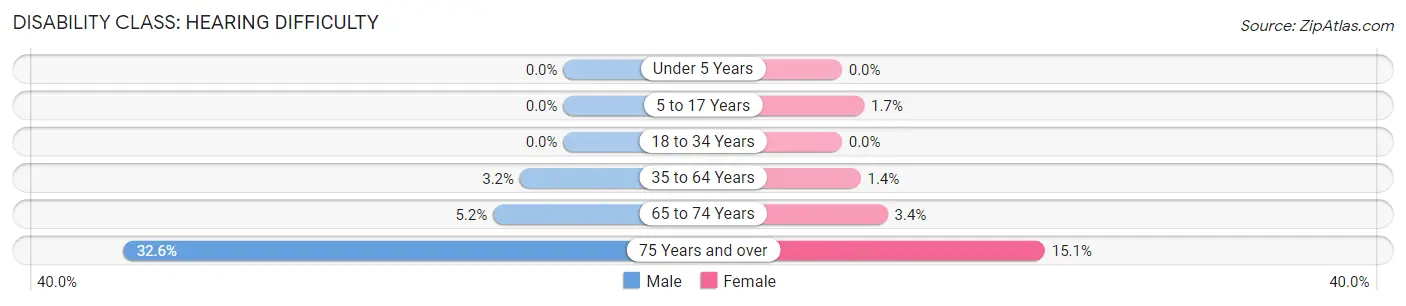
| Age Bracket | Male | Female |
| Under 5 Years | 0 (0.0%) | 0 (0.0%) |
| 5 to 17 Years | 0 (0.0%) | 9 (1.7%) |
| 18 to 34 Years | 0 (0.0%) | 0 (0.0%) |
| 35 to 64 Years | 92 (3.2%) | 38 (1.4%) |
| 65 to 74 Years | 54 (5.2%) | 43 (3.4%) |
| 75 Years and over | 375 (32.6%) | 154 (15.1%) |
Disability Class: Vision Difficulty
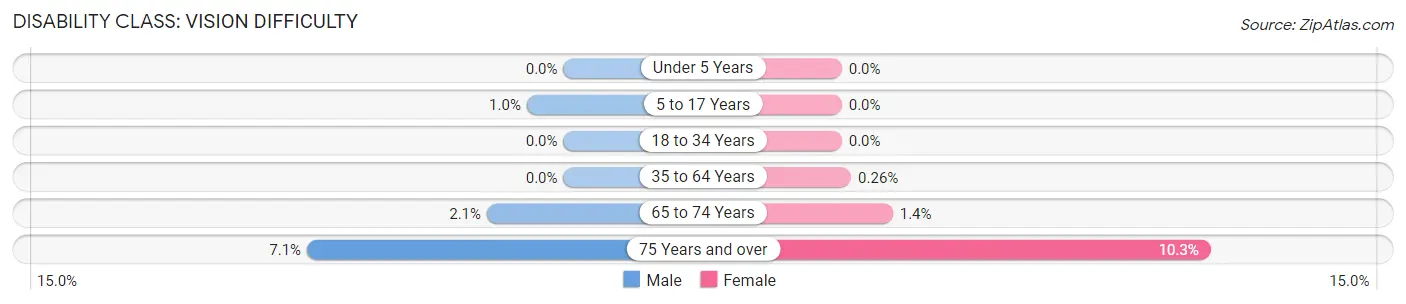
| Age Bracket | Male | Female |
| Under 5 Years | 0 (0.0%) | 0 (0.0%) |
| 5 to 17 Years | 8 (1.0%) | 0 (0.0%) |
| 18 to 34 Years | 0 (0.0%) | 0 (0.0%) |
| 35 to 64 Years | 0 (0.0%) | 7 (0.3%) |
| 65 to 74 Years | 22 (2.1%) | 18 (1.4%) |
| 75 Years and over | 82 (7.1%) | 105 (10.3%) |
Disability Class: Cognitive Difficulty
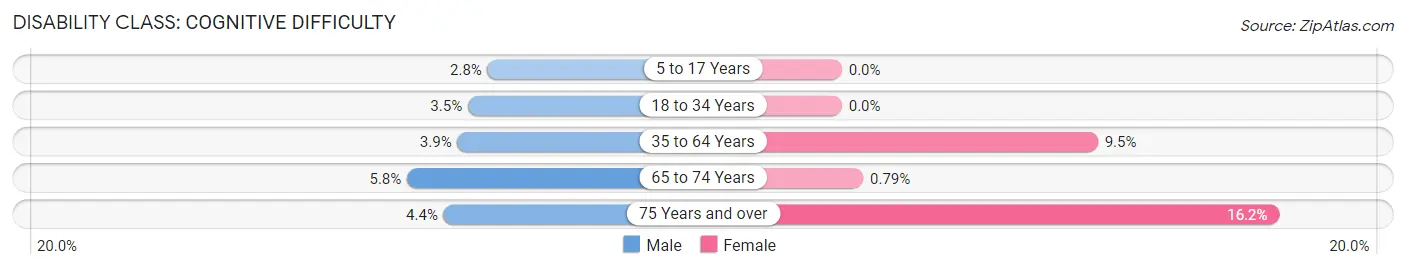
| Age Bracket | Male | Female |
| 5 to 17 Years | 22 (2.8%) | 0 (0.0%) |
| 18 to 34 Years | 34 (3.5%) | 0 (0.0%) |
| 35 to 64 Years | 112 (3.9%) | 260 (9.5%) |
| 65 to 74 Years | 60 (5.8%) | 10 (0.8%) |
| 75 Years and over | 51 (4.4%) | 166 (16.2%) |
Disability Class: Ambulatory Difficulty
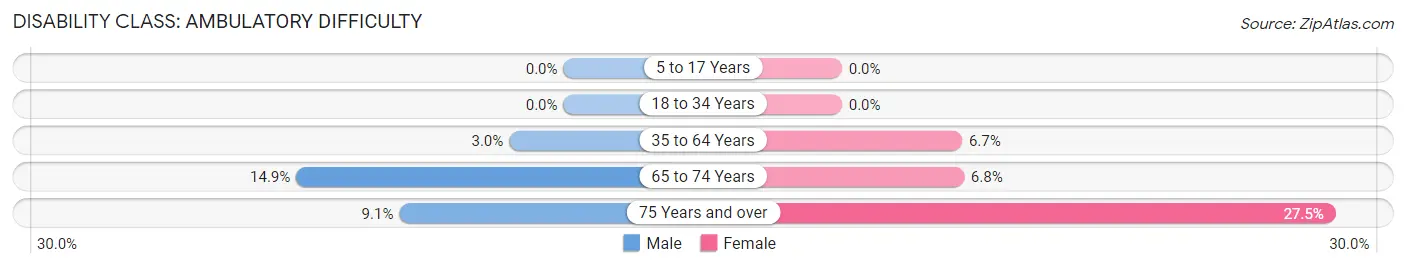
| Age Bracket | Male | Female |
| 5 to 17 Years | 0 (0.0%) | 0 (0.0%) |
| 18 to 34 Years | 0 (0.0%) | 0 (0.0%) |
| 35 to 64 Years | 86 (3.0%) | 183 (6.7%) |
| 65 to 74 Years | 154 (14.9%) | 86 (6.8%) |
| 75 Years and over | 105 (9.1%) | 281 (27.5%) |
Disability Class: Self-Care Difficulty
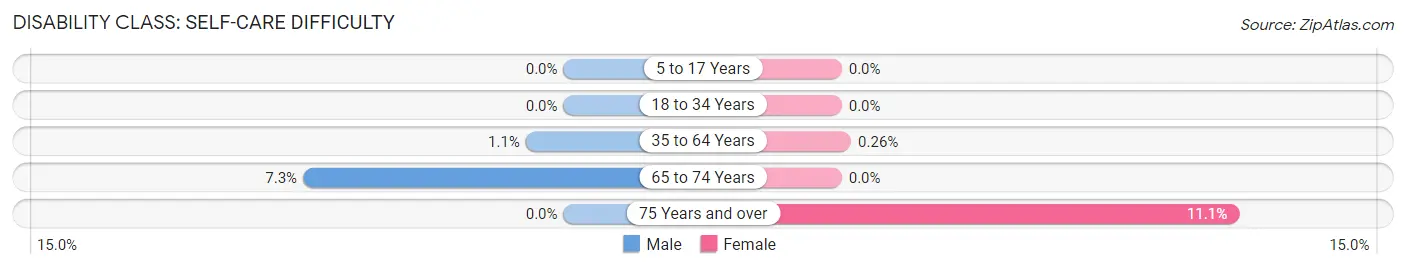
| Age Bracket | Male | Female |
| 5 to 17 Years | 0 (0.0%) | 0 (0.0%) |
| 18 to 34 Years | 0 (0.0%) | 0 (0.0%) |
| 35 to 64 Years | 30 (1.1%) | 7 (0.3%) |
| 65 to 74 Years | 75 (7.2%) | 0 (0.0%) |
| 75 Years and over | 0 (0.0%) | 113 (11.1%) |
Technology Access in Hobe Sound
Computing Device Access in Hobe Sound
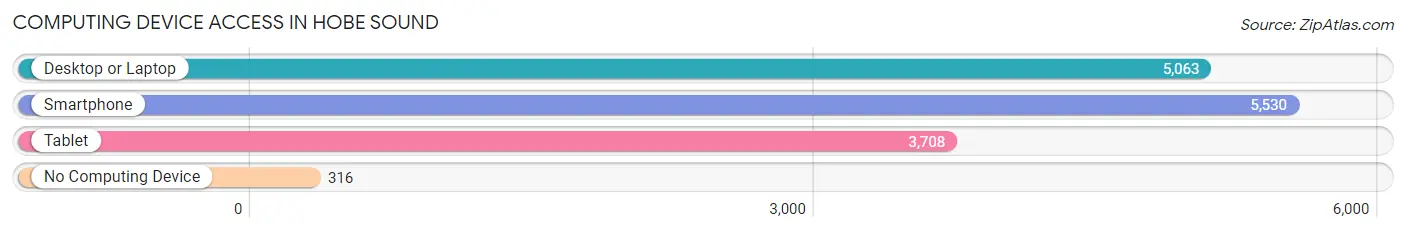
| Device Type | # Households | % Households |
| Desktop or Laptop | 5,063 | 81.2% |
| Smartphone | 5,530 | 88.7% |
| Tablet | 3,708 | 59.5% |
| No Computing Device | 316 | 5.1% |
| Total | 6,234 | 100.0% |
Internet Access in Hobe Sound
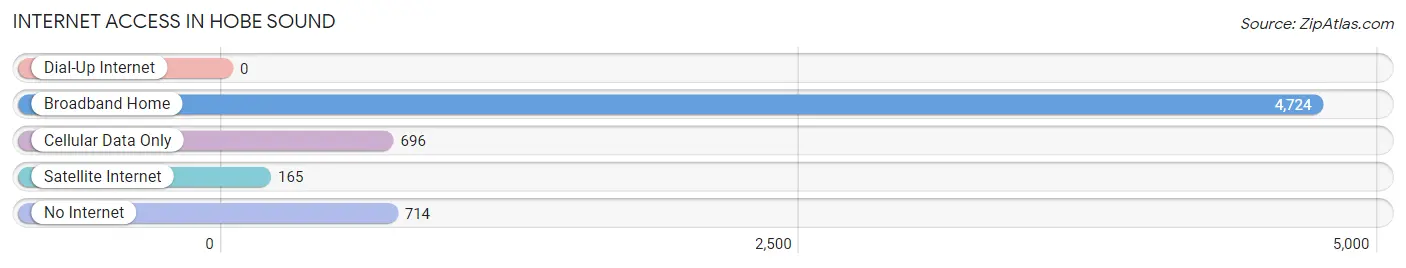
| Internet Type | # Households | % Households |
| Dial-Up Internet | 0 | 0.0% |
| Broadband Home | 4,724 | 75.8% |
| Cellular Data Only | 696 | 11.2% |
| Satellite Internet | 165 | 2.6% |
| No Internet | 714 | 11.5% |
| Total | 6,234 | 100.0% |
Hobe Sound Summary
Hobe Sound is a small unincorporated community located in Martin County, Florida, United States. It is located on the Atlantic Coast, just north of Jupiter Island. The population was 11,521 at the 2010 census.
History
Hobe Sound was originally inhabited by the Jaega and Ais Indians. The name "Hobe" is derived from the Spanish word "jove", meaning "high" or "tall". The area was first settled by Europeans in the late 19th century. The first post office was established in 1887.
In the early 20th century, Hobe Sound became a popular destination for wealthy northerners looking to escape the cold winters. The area was developed with large estates and luxurious homes. The area was also known for its citrus groves and fishing industry.
In the 1950s, the area began to experience rapid growth as more people moved to the area. The population increased from 1,000 in 1950 to 11,521 in 2010.
Geography
Hobe Sound is located at 27°11'N 80°10'W (27.1833, -80.1667). It is located on the Atlantic Coast, just north of Jupiter Island. The area is mostly flat, with an elevation of just 10 feet (3 m).
The climate in Hobe Sound is subtropical, with hot, humid summers and mild, dry winters. The average temperature is 75°F (24°C).
Economy
Hobe Sound's economy is largely based on tourism and real estate. The area is home to several resorts and golf courses, as well as a number of marinas and boatyards. The area is also known for its fishing industry, with several charter fishing companies operating in the area.
Demographics
As of the 2010 census, there were 11,521 people, 4,845 households, and 3,072 families residing in Hobe Sound. The population density was 1,092.3 people per square mile (421.7/km2). The racial makeup of the town was 94.2% White, 2.2% African American, 0.3% Native American, 0.9% Asian, 0.1% Pacific Islander, 1.2% from other races, and 1.2% from two or more races. Hispanic or Latino of any race were 5.2% of the population.
The median income for a household in Hobe Sound was $50,945, and the median income for a family was $60,945. Males had a median income of $41,945 versus $30,945 for females. The per capita income for the town was $27,945. About 4.2% of families and 6.2% of the population were below the poverty line, including 8.2% of those under age 18 and 4.2% of those age 65 or over.
Common Questions
What is Per Capita Income in Hobe Sound?
Per Capita income in Hobe Sound is $42,522.
What is the Median Family Income in Hobe Sound?
Median Family Income in Hobe Sound is $76,153.
What is the Median Household income in Hobe Sound?
Median Household Income in Hobe Sound is $62,677.
What is Income or Wage Gap in Hobe Sound?
Income or Wage Gap in Hobe Sound is 24.6%.
Women in Hobe Sound earn 75.4 cents for every dollar earned by a man.
What is Family Income Deficit in Hobe Sound?
Family Income Deficit in Hobe Sound is $15,920.
Families that are below poverty line in Hobe Sound earn $15,920 less on average than the poverty threshold level.
What is Inequality or Gini Index in Hobe Sound?
Inequality or Gini Index in Hobe Sound is 0.50.
What is the Total Population of Hobe Sound?
Total Population of Hobe Sound is 14,188.
What is the Total Male Population of Hobe Sound?
Total Male Population of Hobe Sound is 7,246.
What is the Total Female Population of Hobe Sound?
Total Female Population of Hobe Sound is 6,942.
What is the Ratio of Males per 100 Females in Hobe Sound?
There are 104.38 Males per 100 Females in Hobe Sound.
What is the Ratio of Females per 100 Males in Hobe Sound?
There are 95.80 Females per 100 Males in Hobe Sound.
What is the Median Population Age in Hobe Sound?
Median Population Age in Hobe Sound is 56.2 Years.
What is the Average Family Size in Hobe Sound
Average Family Size in Hobe Sound is 2.9 People.
What is the Average Household Size in Hobe Sound
Average Household Size in Hobe Sound is 2.2 People.
How Large is the Labor Force in Hobe Sound?
There are 6,514 People in the Labor Forcein in Hobe Sound.
What is the Percentage of People in the Labor Force in Hobe Sound?
53.4% of People are in the Labor Force in Hobe Sound.
What is the Unemployment Rate in Hobe Sound?
Unemployment Rate in Hobe Sound is 5.3%.