Greenwood, FL Map & Demographics
Greenwood Map
Greenwood Overview
$22,302
PER CAPITA INCOME
$54,688
AVG FAMILY INCOME
$56,250
AVG HOUSEHOLD INCOME
4.4%
WAGE / INCOME GAP [ % ]
95.6¢/ $1
WAGE / INCOME GAP [ $ ]
0.35
INEQUALITY / GINI INDEX
713
TOTAL POPULATION
385
MALE POPULATION
328
FEMALE POPULATION
117.38
MALES / 100 FEMALES
85.19
FEMALES / 100 MALES
39.6
MEDIAN AGE
3.8
AVG FAMILY SIZE
3.4
AVG HOUSEHOLD SIZE
300
LABOR FORCE [ PEOPLE ]
51.0%
PERCENT IN LABOR FORCE
1.0%
UNEMPLOYMENT RATE
Greenwood Zip Codes
Greenwood Area Codes
Income in Greenwood
Income Overview in Greenwood
Per Capita Income in Greenwood is $22,302, while median incomes of families and households are $54,688 and $56,250 respectively.
| Characteristic | Number | Measure |
| Per Capita Income | 713 | $22,302 |
| Median Family Income | 167 | $54,688 |
| Mean Family Income | 167 | $65,228 |
| Median Household Income | 212 | $56,250 |
| Mean Household Income | 212 | $65,111 |
| Income Deficit | 167 | $0 |
| Wage / Income Gap (%) | 713 | 4.40% |
| Wage / Income Gap ($) | 713 | 95.60¢ per $1 |
| Gini / Inequality Index | 713 | 0.35 |
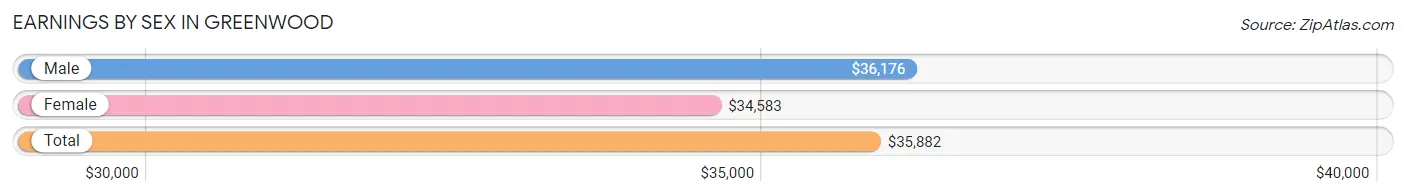
Earnings by Sex in Greenwood
Average Earnings in Greenwood are $35,882, $36,176 for men and $34,583 for women, a difference of 4.4%.
| Sex | Number | Average Earnings |
| Male | 168 (53.8%) | $36,176 |
| Female | 144 (46.2%) | $34,583 |
| Total | 312 (100.0%) | $35,882 |
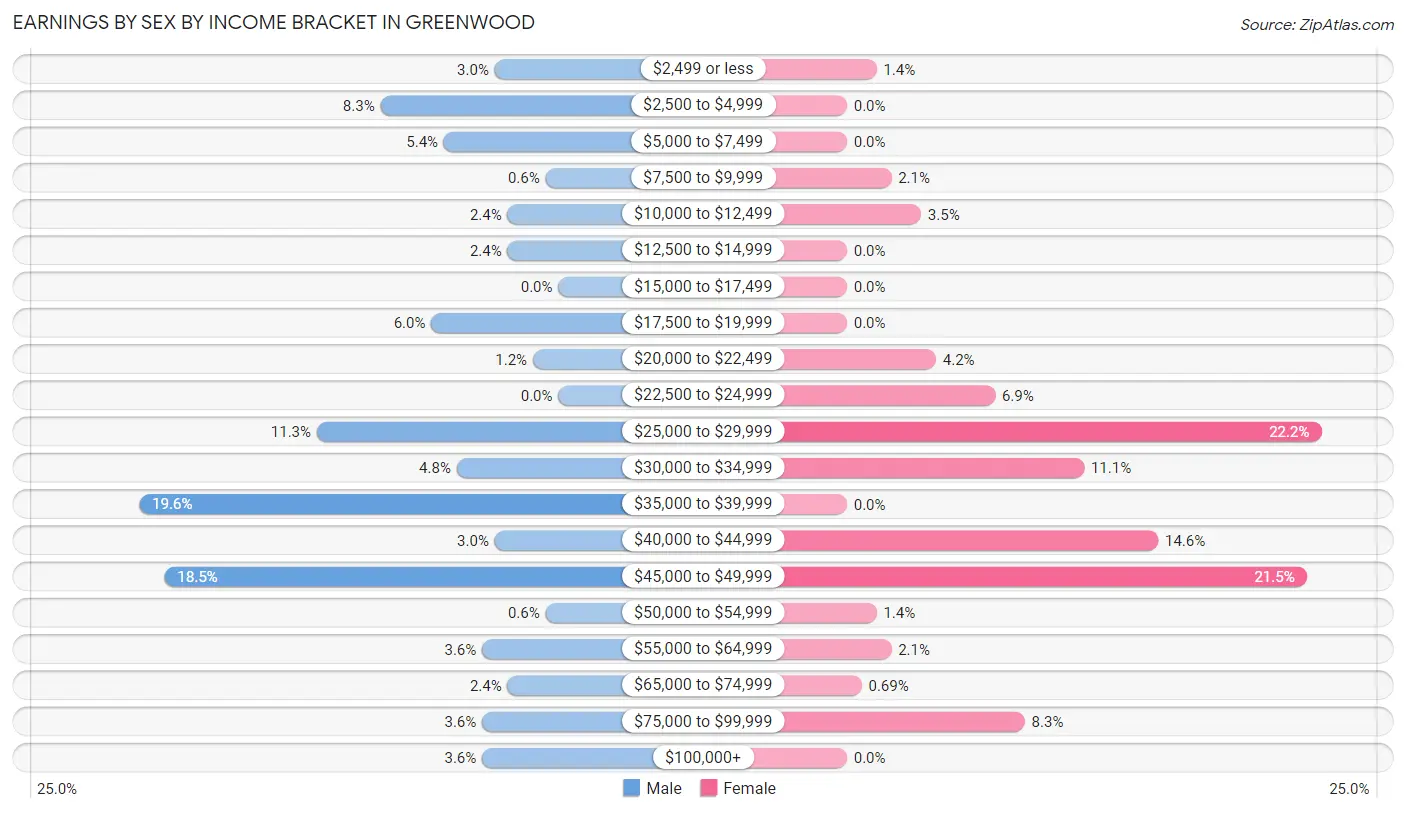
Earnings by Sex by Income Bracket in Greenwood
The most common earnings brackets in Greenwood are $35,000 to $39,999 for men (33 | 19.6%) and $25,000 to $29,999 for women (32 | 22.2%).
| Income | Male | Female |
| $2,499 or less | 5 (3.0%) | 2 (1.4%) |
| $2,500 to $4,999 | 14 (8.3%) | 0 (0.0%) |
| $5,000 to $7,499 | 9 (5.4%) | 0 (0.0%) |
| $7,500 to $9,999 | 1 (0.6%) | 3 (2.1%) |
| $10,000 to $12,499 | 4 (2.4%) | 5 (3.5%) |
| $12,500 to $14,999 | 4 (2.4%) | 0 (0.0%) |
| $15,000 to $17,499 | 0 (0.0%) | 0 (0.0%) |
| $17,500 to $19,999 | 10 (5.9%) | 0 (0.0%) |
| $20,000 to $22,499 | 2 (1.2%) | 6 (4.2%) |
| $22,500 to $24,999 | 0 (0.0%) | 10 (6.9%) |
| $25,000 to $29,999 | 19 (11.3%) | 32 (22.2%) |
| $30,000 to $34,999 | 8 (4.8%) | 16 (11.1%) |
| $35,000 to $39,999 | 33 (19.6%) | 0 (0.0%) |
| $40,000 to $44,999 | 5 (3.0%) | 21 (14.6%) |
| $45,000 to $49,999 | 31 (18.4%) | 31 (21.5%) |
| $50,000 to $54,999 | 1 (0.6%) | 2 (1.4%) |
| $55,000 to $64,999 | 6 (3.6%) | 3 (2.1%) |
| $65,000 to $74,999 | 4 (2.4%) | 1 (0.7%) |
| $75,000 to $99,999 | 6 (3.6%) | 12 (8.3%) |
| $100,000+ | 6 (3.6%) | 0 (0.0%) |
| Total | 168 (100.0%) | 144 (100.0%) |
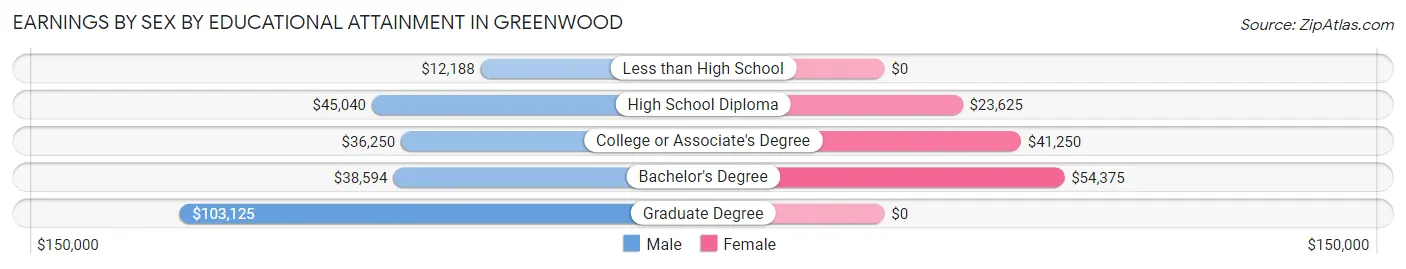
Earnings by Sex by Educational Attainment in Greenwood
Average earnings in Greenwood are $38,984 for men and $43,359 for women, a difference of 10.1%. Men with an educational attainment of graduate degree enjoy the highest average annual earnings of $103,125, while those with less than high school education earn the least with $12,188. Women with an educational attainment of bachelor's degree earn the most with the average annual earnings of $54,375, while those with high school diploma education have the smallest earnings of $23,625.
| Educational Attainment | Male Income | Female Income |
| Less than High School | $12,188 | $0 |
| High School Diploma | $45,040 | $23,625 |
| College or Associate's Degree | $36,250 | $41,250 |
| Bachelor's Degree | $38,594 | $54,375 |
| Graduate Degree | $103,125 | $0 |
| Total | $38,984 | $43,359 |
Family Income in Greenwood
Family Income Brackets in Greenwood
According to the Greenwood family income data, there are 31 families falling into the $100,000 to $149,999 income range, which is the most common income bracket and makes up 18.6% of all families.
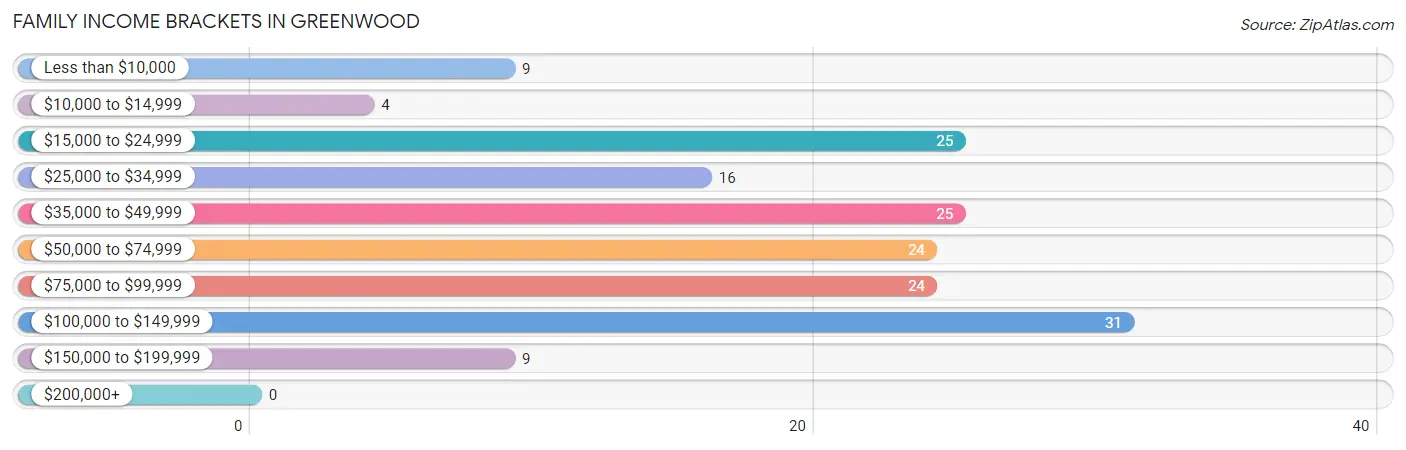
| Income Bracket | # Families | % Families |
| Less than $10,000 | 9 | 5.4% |
| $10,000 to $14,999 | 4 | 2.4% |
| $15,000 to $24,999 | 25 | 15.0% |
| $25,000 to $34,999 | 16 | 9.6% |
| $35,000 to $49,999 | 25 | 15.0% |
| $50,000 to $74,999 | 24 | 14.4% |
| $75,000 to $99,999 | 24 | 14.4% |
| $100,000 to $149,999 | 31 | 18.6% |
| $150,000 to $199,999 | 9 | 5.4% |
| $200,000+ | 0 | 0.0% |
Family Income by Famaliy Size in Greenwood
5-person families (22 | 13.2%) account for the highest median family income in Greenwood with $109,167 per family, while 2-person families (75 | 44.9%) have the highest median income of $23,490 per family member.
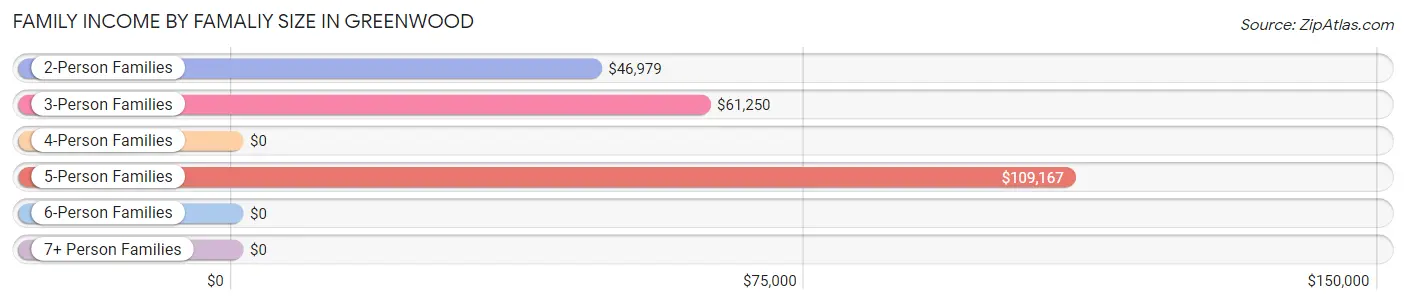
| Income Bracket | # Families | Median Income |
| 2-Person Families | 75 (44.9%) | $46,979 |
| 3-Person Families | 44 (26.4%) | $61,250 |
| 4-Person Families | 21 (12.6%) | $0 |
| 5-Person Families | 22 (13.2%) | $109,167 |
| 6-Person Families | 0 (0.0%) | $0 |
| 7+ Person Families | 5 (3.0%) | $0 |
| Total | 167 (100.0%) | $54,688 |
Family Income by Number of Earners in Greenwood
The median family income in Greenwood is $54,688, with families comprising 3+ earners (38) having the highest median family income of $140,000, while families with no earners (40) have the lowest median family income of $23,125, accounting for 22.8% and 23.9% of families, respectively.
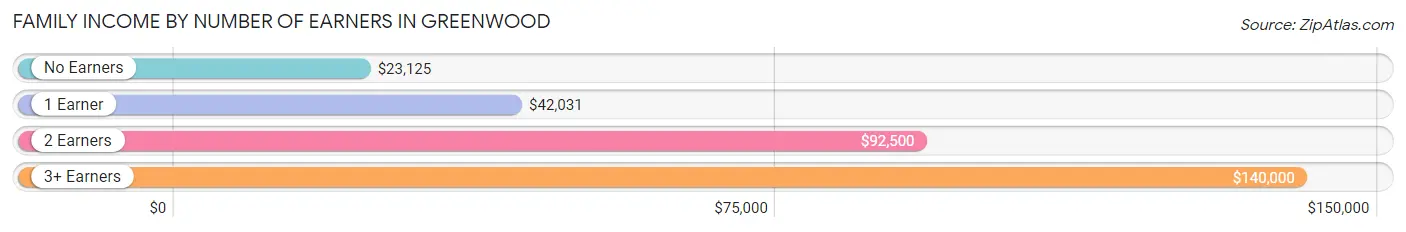
| Number of Earners | # Families | Median Income |
| No Earners | 40 (23.9%) | $23,125 |
| 1 Earner | 69 (41.3%) | $42,031 |
| 2 Earners | 20 (12.0%) | $92,500 |
| 3+ Earners | 38 (22.8%) | $140,000 |
| Total | 167 (100.0%) | $54,688 |
Household Income in Greenwood
Household Income Brackets in Greenwood
With 44 households falling in the category, the $50,000 to $74,999 income range is the most frequent in Greenwood, accounting for 20.7% of all households.
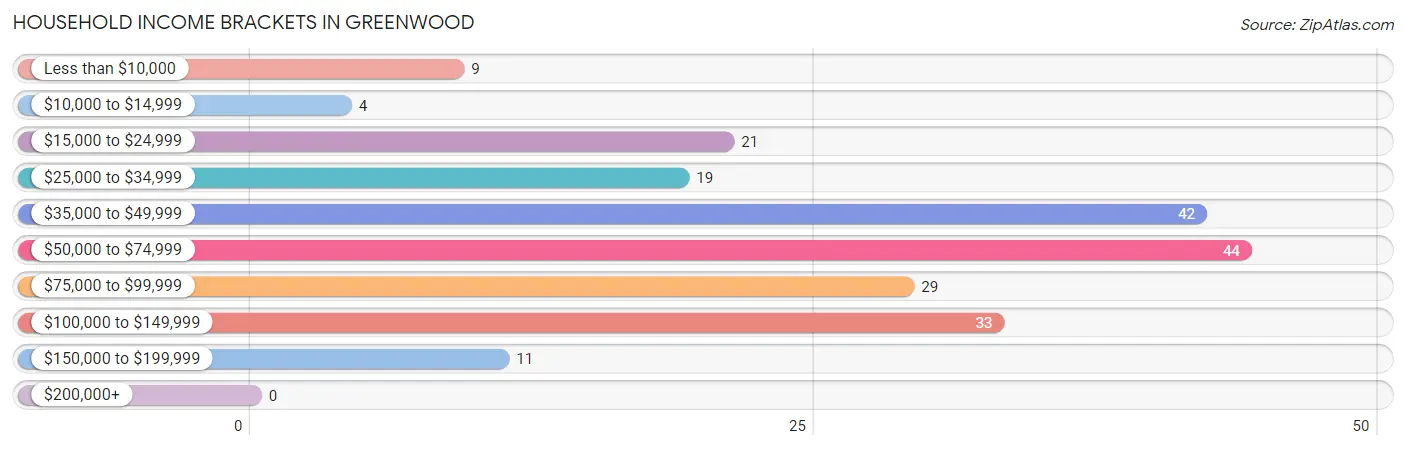
| Income Bracket | # Households | % Households |
| Less than $10,000 | 9 | 4.2% |
| $10,000 to $14,999 | 4 | 1.9% |
| $15,000 to $24,999 | 21 | 9.9% |
| $25,000 to $34,999 | 19 | 9.0% |
| $35,000 to $49,999 | 42 | 19.8% |
| $50,000 to $74,999 | 44 | 20.8% |
| $75,000 to $99,999 | 29 | 13.7% |
| $100,000 to $149,999 | 33 | 15.6% |
| $150,000 to $199,999 | 11 | 5.2% |
| $200,000+ | 0 | 0.0% |
Household Income by Householder Age in Greenwood
The median household income in Greenwood is $56,250, with the highest median household income of $64,583 found in the 45 to 64 years age bracket for the primary householder. A total of 77 households (36.3%) fall into this category. Meanwhile, the 15 to 24 years age bracket for the primary householder has the lowest median household income of $0, with 3 households (1.4%) in this group.
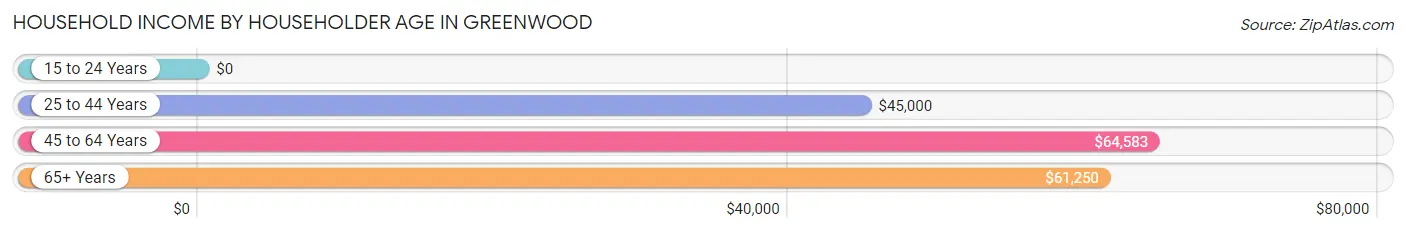
| Income Bracket | # Households | Median Income |
| 15 to 24 Years | 3 (1.4%) | $0 |
| 25 to 44 Years | 64 (30.2%) | $45,000 |
| 45 to 64 Years | 77 (36.3%) | $64,583 |
| 65+ Years | 68 (32.1%) | $61,250 |
| Total | 212 (100.0%) | $56,250 |
Poverty in Greenwood
Income Below Poverty by Sex and Age in Greenwood
With 21.8% poverty level for males and 26.7% for females among the residents of Greenwood, 5 year old males and 6 to 11 year old females are the most vulnerable to poverty, with 7 males (100.0%) and 23 females (71.9%) in their respective age groups living below the poverty level.
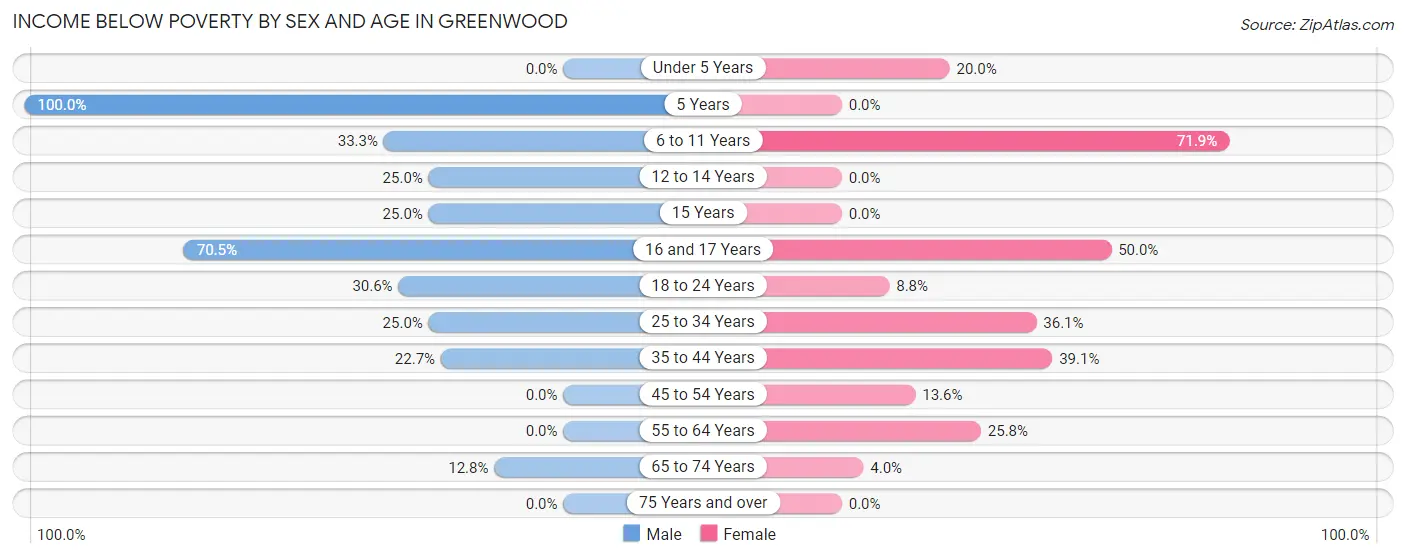
| Age Bracket | Male | Female |
| Under 5 Years | 0 (0.0%) | 5 (20.0%) |
| 5 Years | 7 (100.0%) | 0 (0.0%) |
| 6 to 11 Years | 8 (33.3%) | 23 (71.9%) |
| 12 to 14 Years | 4 (25.0%) | 0 (0.0%) |
| 15 Years | 2 (25.0%) | 0 (0.0%) |
| 16 and 17 Years | 31 (70.5%) | 2 (50.0%) |
| 18 to 24 Years | 15 (30.6%) | 3 (8.8%) |
| 25 to 34 Years | 7 (25.0%) | 13 (36.1%) |
| 35 to 44 Years | 5 (22.7%) | 25 (39.1%) |
| 45 to 54 Years | 0 (0.0%) | 6 (13.6%) |
| 55 to 64 Years | 0 (0.0%) | 8 (25.8%) |
| 65 to 74 Years | 5 (12.8%) | 1 (4.0%) |
| 75 Years and over | 0 (0.0%) | 0 (0.0%) |
| Total | 84 (21.8%) | 86 (26.7%) |
Income Above Poverty by Sex and Age in Greenwood
According to the poverty statistics in Greenwood, males aged under 5 years and females aged 12 to 14 years are the age groups that are most secure financially, with 100.0% of males and 100.0% of females in these age groups living above the poverty line.
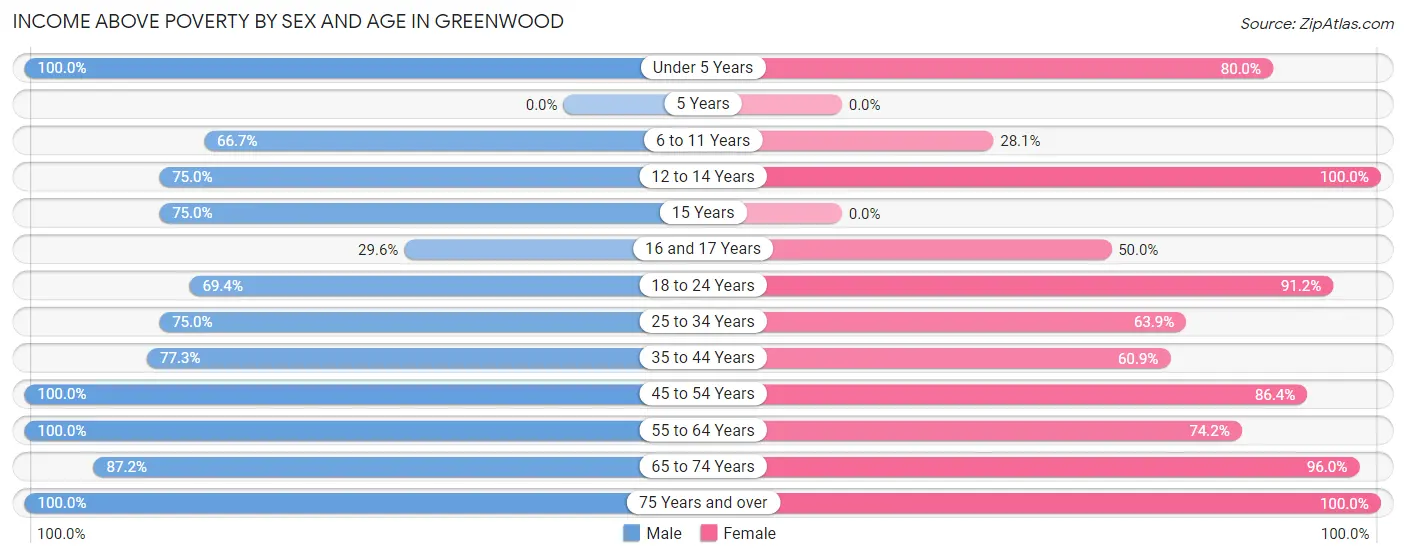
| Age Bracket | Male | Female |
| Under 5 Years | 3 (100.0%) | 20 (80.0%) |
| 5 Years | 0 (0.0%) | 0 (0.0%) |
| 6 to 11 Years | 16 (66.7%) | 9 (28.1%) |
| 12 to 14 Years | 12 (75.0%) | 4 (100.0%) |
| 15 Years | 6 (75.0%) | 0 (0.0%) |
| 16 and 17 Years | 13 (29.5%) | 2 (50.0%) |
| 18 to 24 Years | 34 (69.4%) | 31 (91.2%) |
| 25 to 34 Years | 21 (75.0%) | 23 (63.9%) |
| 35 to 44 Years | 17 (77.3%) | 39 (60.9%) |
| 45 to 54 Years | 38 (100.0%) | 38 (86.4%) |
| 55 to 64 Years | 90 (100.0%) | 23 (74.2%) |
| 65 to 74 Years | 34 (87.2%) | 24 (96.0%) |
| 75 Years and over | 17 (100.0%) | 23 (100.0%) |
| Total | 301 (78.2%) | 236 (73.3%) |
Income Below Poverty Among Married-Couple Families in Greenwood
The poverty statistics for married-couple families in Greenwood show that 3.8% or 3 of the total 78 families live below the poverty line. Families with no children have the highest poverty rate of 6.0%, comprising of 3 families. On the other hand, families with 1 or 2 children have the lowest poverty rate of 0.0%, which includes 0 families.
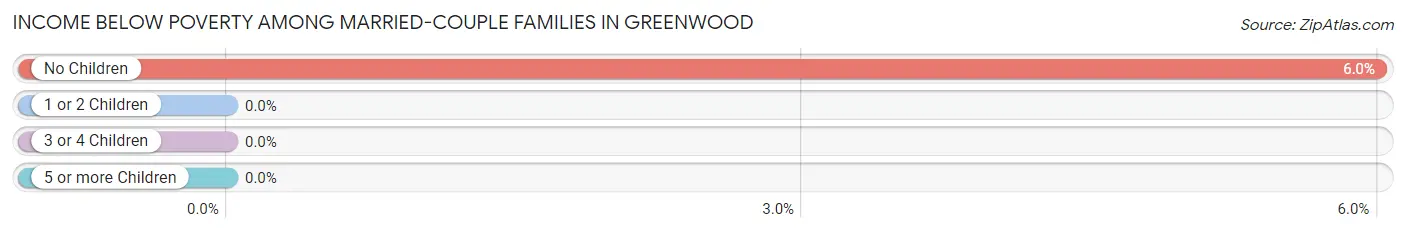
| Children | Above Poverty | Below Poverty |
| No Children | 47 (94.0%) | 3 (6.0%) |
| 1 or 2 Children | 23 (100.0%) | 0 (0.0%) |
| 3 or 4 Children | 5 (100.0%) | 0 (0.0%) |
| 5 or more Children | 0 (0.0%) | 0 (0.0%) |
| Total | 75 (96.2%) | 3 (3.8%) |
Income Below Poverty Among Single-Parent Households in Greenwood
According to the poverty data in Greenwood, 50.0% or 15 single-father households and 45.8% or 27 single-mother households are living below the poverty line. Among single-father households, those with 1 or 2 children have the highest poverty rate, with 15 households (100.0%) experiencing poverty. Likewise, among single-mother households, those with 3 or 4 children have the highest poverty rate, with 12 households (70.6%) falling below the poverty line.
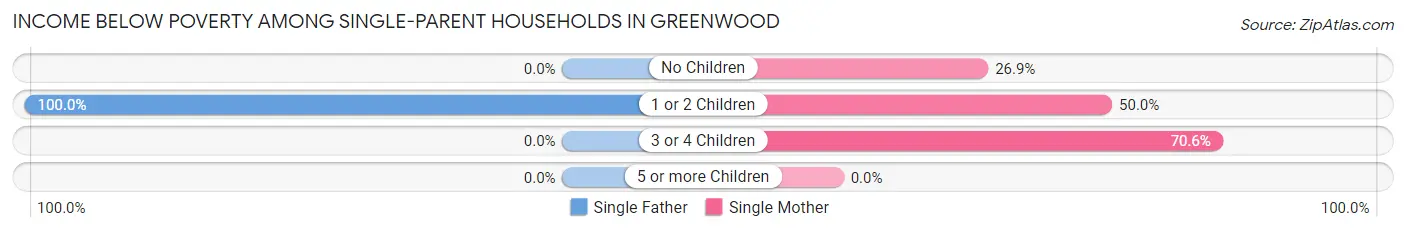
| Children | Single Father | Single Mother |
| No Children | 0 (0.0%) | 7 (26.9%) |
| 1 or 2 Children | 15 (100.0%) | 8 (50.0%) |
| 3 or 4 Children | 0 (0.0%) | 12 (70.6%) |
| 5 or more Children | 0 (0.0%) | 0 (0.0%) |
| Total | 15 (50.0%) | 27 (45.8%) |
Income Below Poverty Among Married-Couple vs Single-Parent Households in Greenwood
The poverty data for Greenwood shows that 3 of the married-couple family households (3.8%) and 42 of the single-parent households (47.2%) are living below the poverty level. Within the married-couple family households, those with no children have the highest poverty rate, with 3 households (6.0%) falling below the poverty line. Among the single-parent households, those with 1 or 2 children have the highest poverty rate, with 23 household (74.2%) living below poverty.
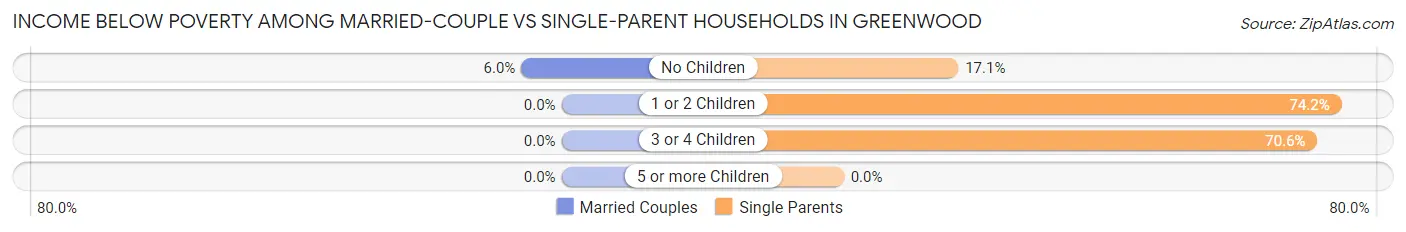
| Children | Married-Couple Families | Single-Parent Households |
| No Children | 3 (6.0%) | 7 (17.1%) |
| 1 or 2 Children | 0 (0.0%) | 23 (74.2%) |
| 3 or 4 Children | 0 (0.0%) | 12 (70.6%) |
| 5 or more Children | 0 (0.0%) | 0 (0.0%) |
| Total | 3 (3.8%) | 42 (47.2%) |
Race in Greenwood
The most populous races in Greenwood are White / Caucasian (463 | 64.9%), Black / African American (208 | 29.2%), and Hispanic or Latino (59 | 8.3%).
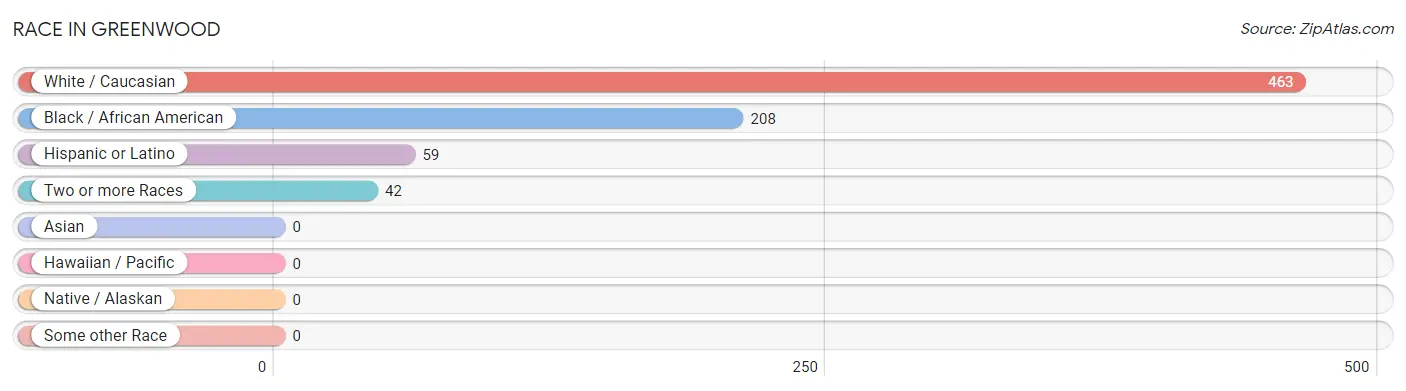
| Race | # Population | % Population |
| Asian | 0 | 0.0% |
| Black / African American | 208 | 29.2% |
| Hawaiian / Pacific | 0 | 0.0% |
| Hispanic or Latino | 59 | 8.3% |
| Native / Alaskan | 0 | 0.0% |
| White / Caucasian | 463 | 64.9% |
| Two or more Races | 42 | 5.9% |
| Some other Race | 0 | 0.0% |
| Total | 713 | 100.0% |
Ancestry in Greenwood
The most populous ancestries reported in Greenwood are American (122 | 17.1%), Irish (59 | 8.3%), Mexican (54 | 7.6%), English (39 | 5.5%), and Scottish (36 | 5.1%), together accounting for 43.5% of all Greenwood residents.
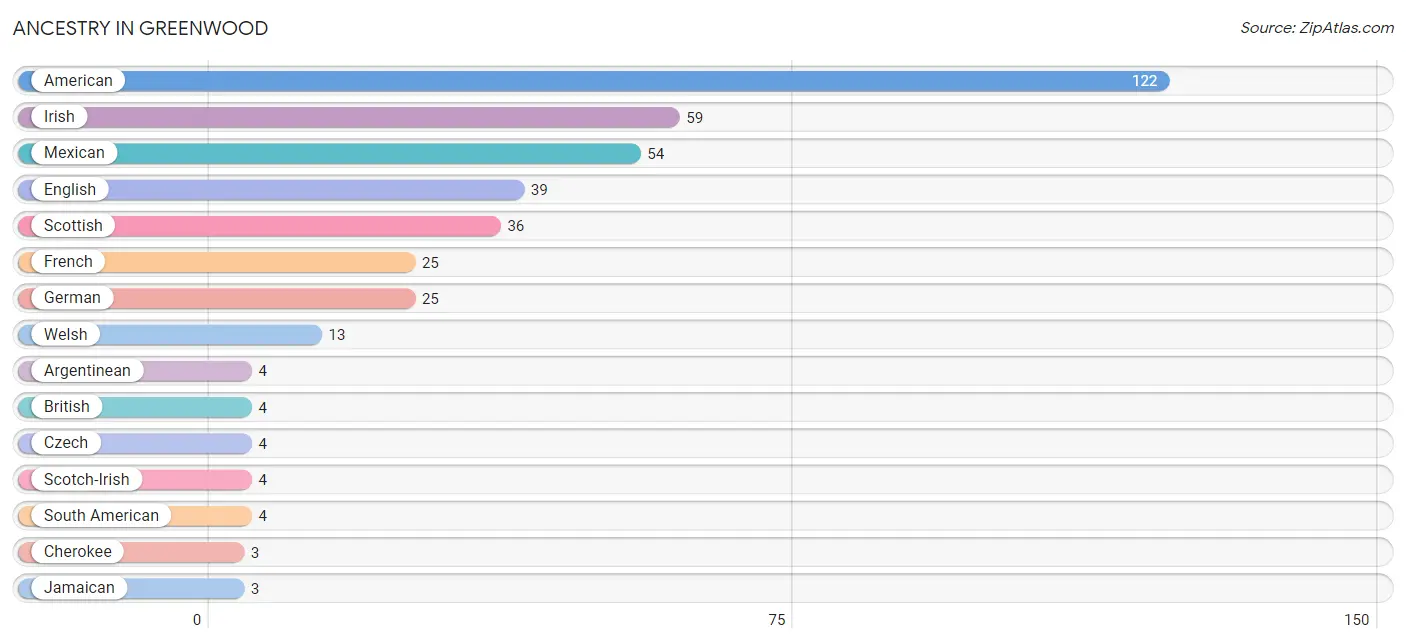
| Ancestry | # Population | % Population |
| American | 122 | 17.1% |
| Argentinean | 4 | 0.6% |
| British | 4 | 0.6% |
| Cherokee | 3 | 0.4% |
| Creek | 1 | 0.1% |
| Cuban | 1 | 0.1% |
| Czech | 4 | 0.6% |
| English | 39 | 5.5% |
| European | 2 | 0.3% |
| French | 25 | 3.5% |
| French Canadian | 1 | 0.1% |
| German | 25 | 3.5% |
| Irish | 59 | 8.3% |
| Israeli | 1 | 0.1% |
| Italian | 2 | 0.3% |
| Jamaican | 3 | 0.4% |
| Mexican | 54 | 7.6% |
| Scotch-Irish | 4 | 0.6% |
| Scottish | 36 | 5.1% |
| South American | 4 | 0.6% |
| Welsh | 13 | 1.8% | View All 21 Rows |
Immigrants in Greenwood
The most numerous immigrant groups reported in Greenwood came from Latin America (15 | 2.1%), Central America (11 | 1.5%), Mexico (11 | 1.5%), Argentina (4 | 0.6%), and South America (4 | 0.6%), together accounting for 6.3% of all Greenwood residents.
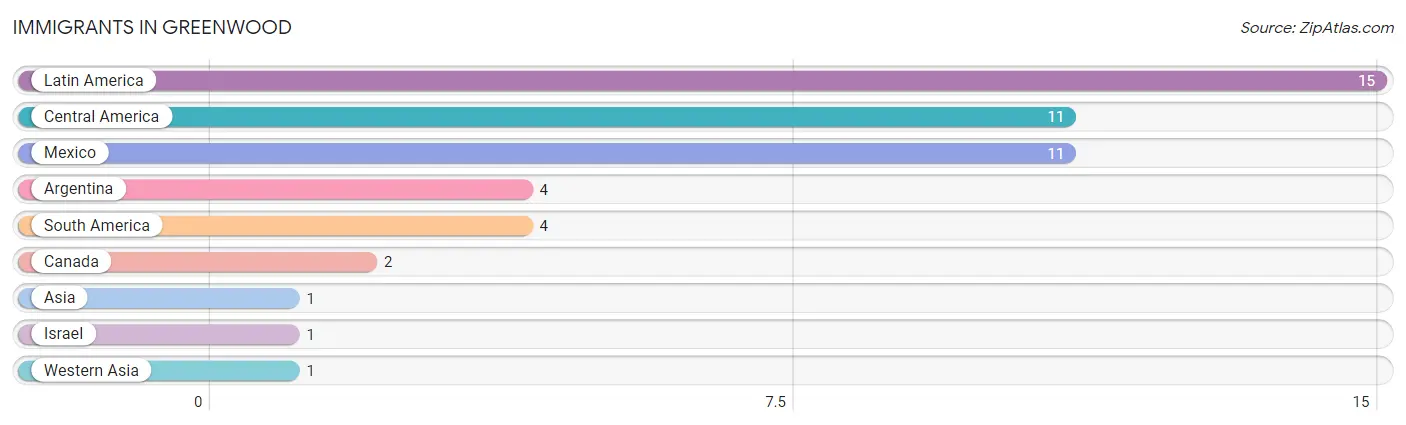
| Immigration Origin | # Population | % Population |
| Argentina | 4 | 0.6% |
| Asia | 1 | 0.1% |
| Canada | 2 | 0.3% |
| Central America | 11 | 1.5% |
| Israel | 1 | 0.1% |
| Latin America | 15 | 2.1% |
| Mexico | 11 | 1.5% |
| South America | 4 | 0.6% |
| Western Asia | 1 | 0.1% | View All 9 Rows |
Sex and Age in Greenwood
Sex and Age in Greenwood
The most populous age groups in Greenwood are 15 to 19 Years (68 | 17.7%) for men and 50 to 54 Years (33 | 10.1%) for women.
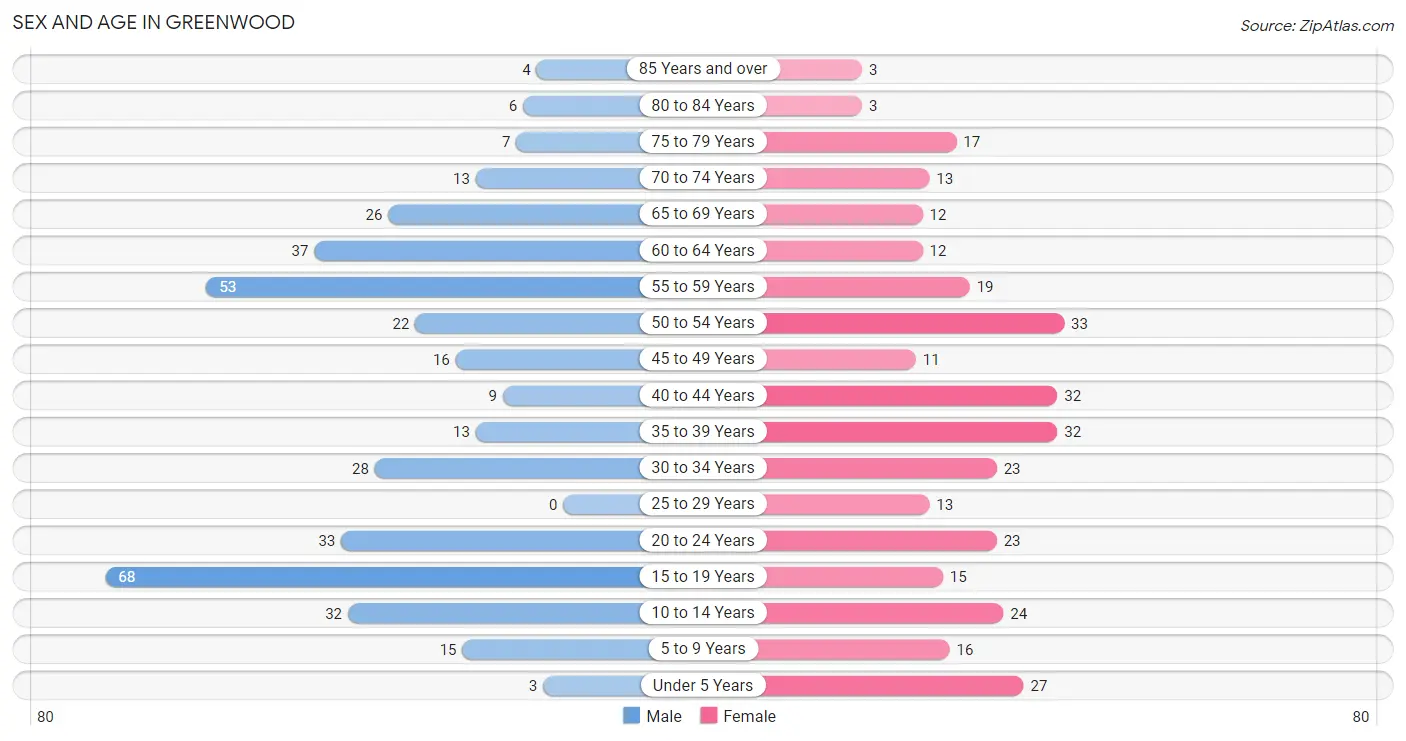
| Age Bracket | Male | Female |
| Under 5 Years | 3 (0.8%) | 27 (8.2%) |
| 5 to 9 Years | 15 (3.9%) | 16 (4.9%) |
| 10 to 14 Years | 32 (8.3%) | 24 (7.3%) |
| 15 to 19 Years | 68 (17.7%) | 15 (4.6%) |
| 20 to 24 Years | 33 (8.6%) | 23 (7.0%) |
| 25 to 29 Years | 0 (0.0%) | 13 (4.0%) |
| 30 to 34 Years | 28 (7.3%) | 23 (7.0%) |
| 35 to 39 Years | 13 (3.4%) | 32 (9.8%) |
| 40 to 44 Years | 9 (2.3%) | 32 (9.8%) |
| 45 to 49 Years | 16 (4.2%) | 11 (3.4%) |
| 50 to 54 Years | 22 (5.7%) | 33 (10.1%) |
| 55 to 59 Years | 53 (13.8%) | 19 (5.8%) |
| 60 to 64 Years | 37 (9.6%) | 12 (3.7%) |
| 65 to 69 Years | 26 (6.8%) | 12 (3.7%) |
| 70 to 74 Years | 13 (3.4%) | 13 (4.0%) |
| 75 to 79 Years | 7 (1.8%) | 17 (5.2%) |
| 80 to 84 Years | 6 (1.6%) | 3 (0.9%) |
| 85 Years and over | 4 (1.0%) | 3 (0.9%) |
| Total | 385 (100.0%) | 328 (100.0%) |
Families and Households in Greenwood
Median Family Size in Greenwood
The median family size in Greenwood is 3.76 persons per family, with single female/mother families (59 | 35.3%) accounting for the largest median family size of 4.46 persons per family. On the other hand, single male/father families (30 | 18.0%) represent the smallest median family size with 2.47 persons per family.
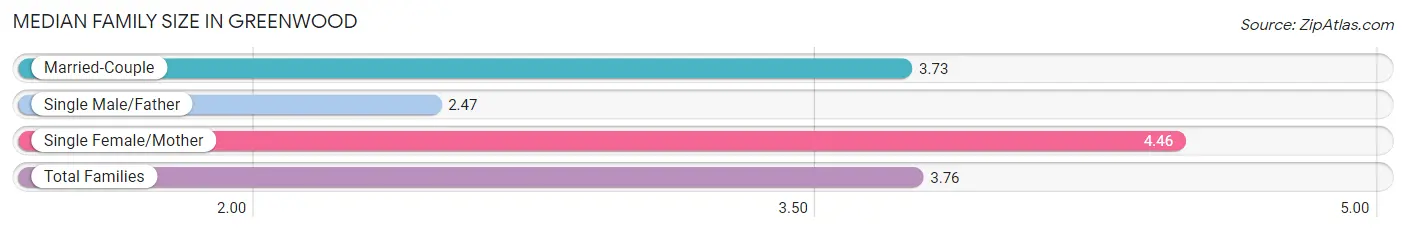
| Family Type | # Families | Family Size |
| Married-Couple | 78 (46.7%) | 3.73 |
| Single Male/Father | 30 (18.0%) | 2.47 |
| Single Female/Mother | 59 (35.3%) | 4.46 |
| Total Families | 167 (100.0%) | 3.76 |
Median Household Size in Greenwood
The median household size in Greenwood is 3.36 persons per household, with single female/mother households (59 | 27.8%) accounting for the largest median household size of 4.81 persons per household. non-family households (45 | 21.2%) represent the smallest median household size with 1.16 persons per household.
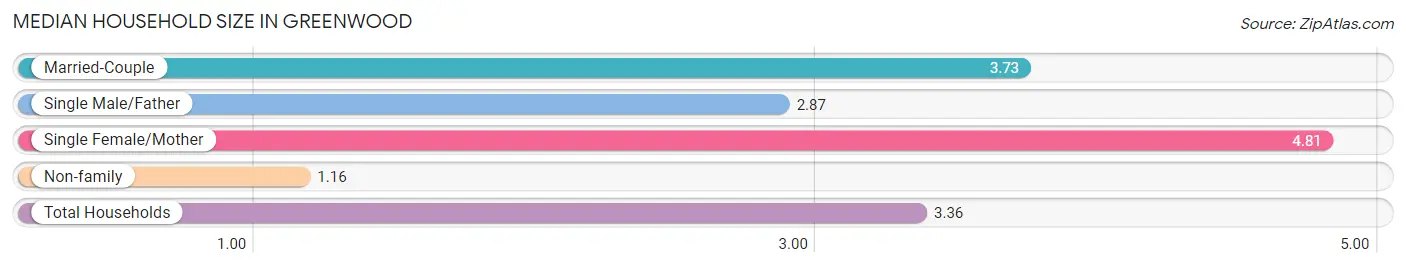
| Household Type | # Households | Household Size |
| Married-Couple | 78 (36.8%) | 3.73 |
| Single Male/Father | 30 (14.1%) | 2.87 |
| Single Female/Mother | 59 (27.8%) | 4.81 |
| Non-family | 45 (21.2%) | 1.16 |
| Total Households | 212 (100.0%) | 3.36 |
Household Size by Marriage Status in Greenwood
Out of a total of 212 households in Greenwood, 167 (78.8%) are family households, while 45 (21.2%) are nonfamily households. The most numerous type of family households are 2-person households, comprising 75, and the most common type of nonfamily households are 1-person households, comprising 41.
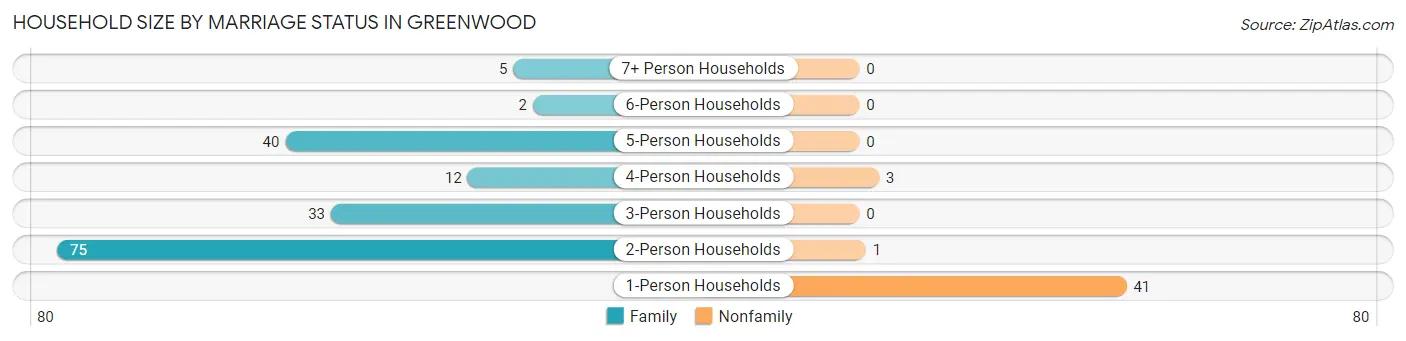
| Household Size | Family Households | Nonfamily Households |
| 1-Person Households | - | 41 (19.3%) |
| 2-Person Households | 75 (35.4%) | 1 (0.5%) |
| 3-Person Households | 33 (15.6%) | 0 (0.0%) |
| 4-Person Households | 12 (5.7%) | 3 (1.4%) |
| 5-Person Households | 40 (18.9%) | 0 (0.0%) |
| 6-Person Households | 2 (0.9%) | 0 (0.0%) |
| 7+ Person Households | 5 (2.4%) | 0 (0.0%) |
| Total | 167 (78.8%) | 45 (21.2%) |
Female Fertility in Greenwood
Fertility by Age in Greenwood
Average fertility rate in Greenwood is 20.0 births per 1,000 women. Women in the age bracket of 20 to 34 years have the highest fertility rate with 51.0 births per 1,000 women. Women in the age bracket of 20 to 34 years acount for 100.0% of all women with births.
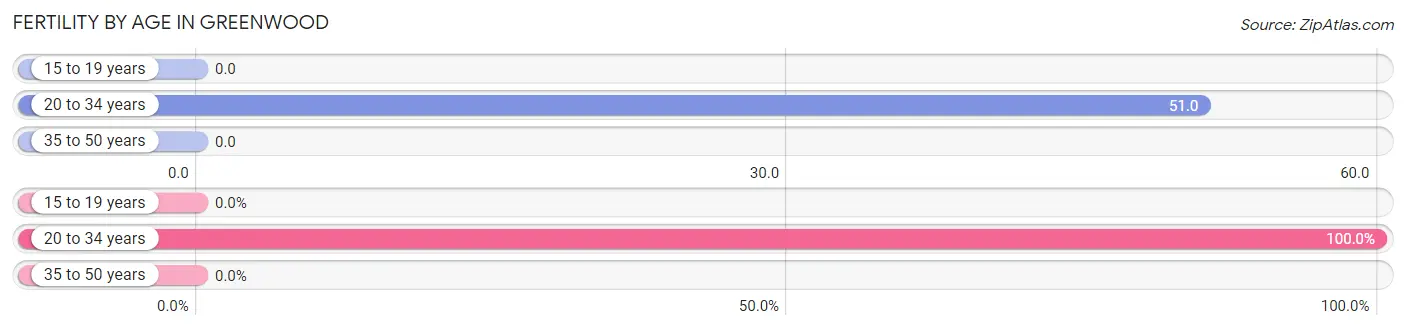
| Age Bracket | Women with Births | Births / 1,000 Women |
| 15 to 19 years | 0 (0.0%) | 0.0 |
| 20 to 34 years | 3 (100.0%) | 51.0 |
| 35 to 50 years | 0 (0.0%) | 0.0 |
| Total | 3 (100.0%) | 20.0 |
Fertility by Age by Marriage Status in Greenwood
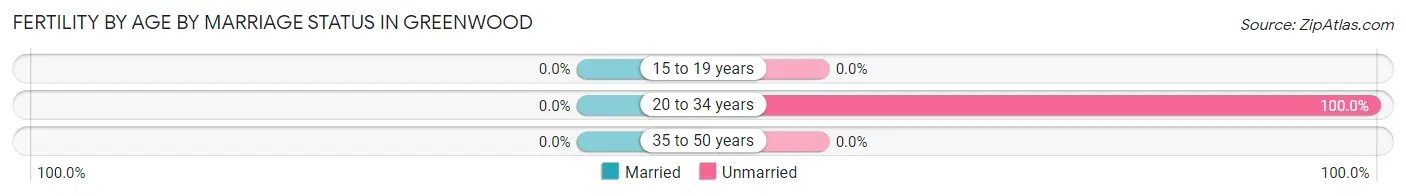
| Age Bracket | Married | Unmarried |
| 15 to 19 years | 0 (0.0%) | 0 (0.0%) |
| 20 to 34 years | 0 (0.0%) | 3 (100.0%) |
| 35 to 50 years | 0 (0.0%) | 0 (0.0%) |
| Total | 0 (0.0%) | 3 (100.0%) |
Fertility by Education in Greenwood
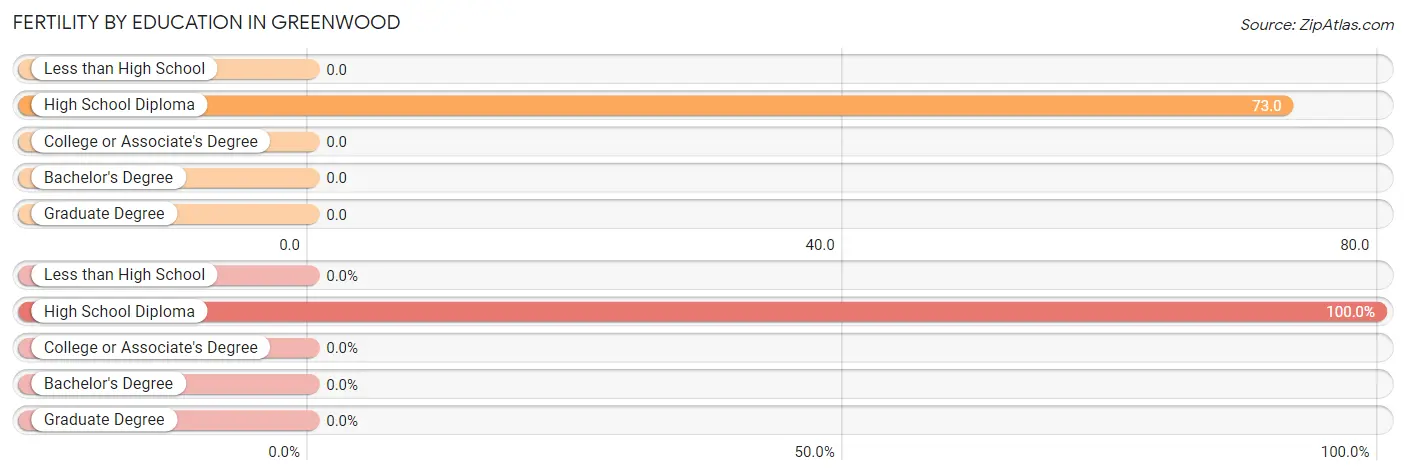
| Educational Attainment | Women with Births | Births / 1,000 Women |
| Less than High School | 0 (0.0%) | 0.0 |
| High School Diploma | 3 (100.0%) | 73.0 |
| College or Associate's Degree | 0 (0.0%) | 0.0 |
| Bachelor's Degree | 0 (0.0%) | 0.0 |
| Graduate Degree | 0 (0.0%) | 0.0 |
| Total | 3 (100.0%) | 20.0 |
Fertility by Education by Marriage Status in Greenwood
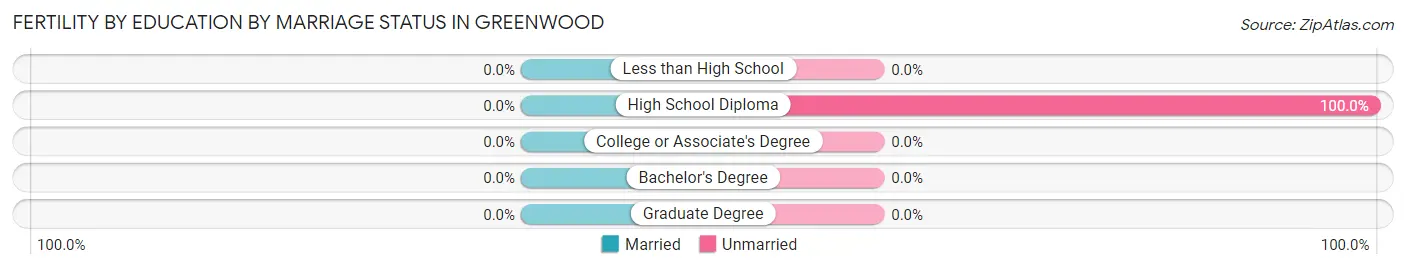
| Educational Attainment | Married | Unmarried |
| Less than High School | 0 (0.0%) | 0 (0.0%) |
| High School Diploma | 0 (0.0%) | 3 (100.0%) |
| College or Associate's Degree | 0 (0.0%) | 0 (0.0%) |
| Bachelor's Degree | 0 (0.0%) | 0 (0.0%) |
| Graduate Degree | 0 (0.0%) | 0 (0.0%) |
| Total | 0 (0.0%) | 3 (100.0%) |
Employment Characteristics in Greenwood
Employment by Class of Employer in Greenwood
Among the 297 employed individuals in Greenwood, private company employees (121 | 40.7%), state government employees (120 | 40.4%), and local government employees (47 | 15.8%) make up the most common classes of employment.
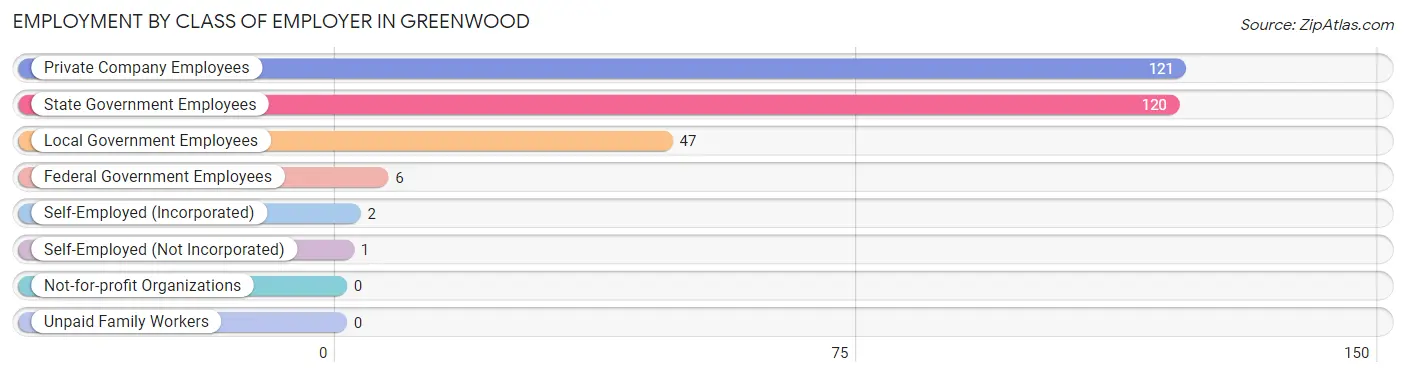
| Employer Class | # Employees | % Employees |
| Private Company Employees | 121 | 40.7% |
| Self-Employed (Incorporated) | 2 | 0.7% |
| Self-Employed (Not Incorporated) | 1 | 0.3% |
| Not-for-profit Organizations | 0 | 0.0% |
| Local Government Employees | 47 | 15.8% |
| State Government Employees | 120 | 40.4% |
| Federal Government Employees | 6 | 2.0% |
| Unpaid Family Workers | 0 | 0.0% |
| Total | 297 | 100.0% |
Employment Status by Age in Greenwood
According to the labor force statistics for Greenwood, out of the total population over 16 years of age (588), 51.0% or 300 individuals are in the labor force, with 1.0% or 3 of them unemployed. The age group with the highest labor force participation rate is 55 to 59 years, with 98.6% or 71 individuals in the labor force. Within the labor force, the 16 to 19 years age range has the highest percentage of unemployed individuals, with 13.6% or 3 of them being unemployed.
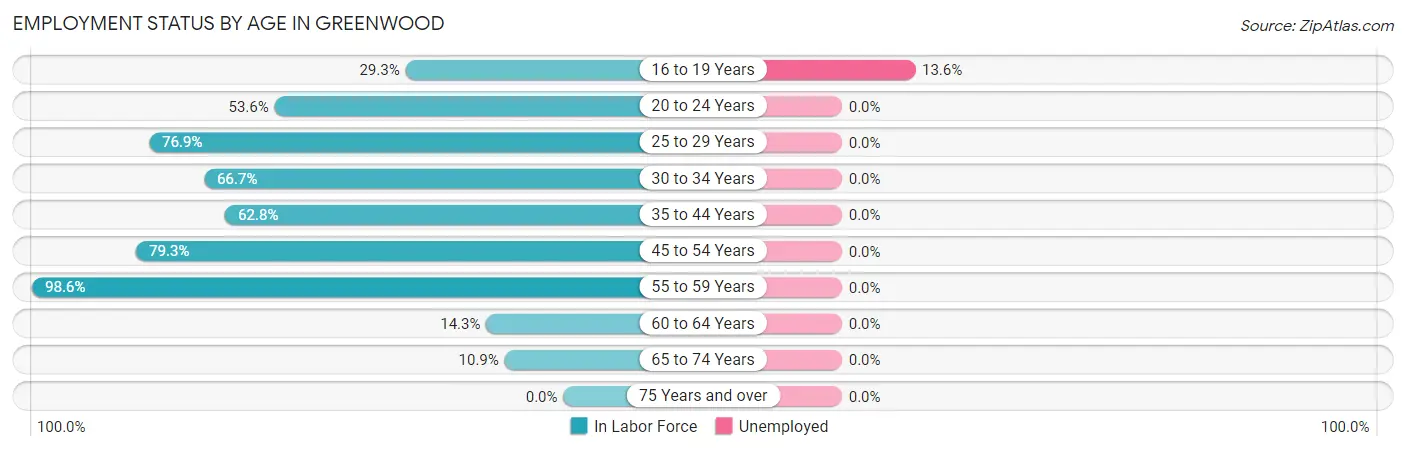
| Age Bracket | In Labor Force | Unemployed |
| 16 to 19 Years | 22 (29.3%) | 3 (13.6%) |
| 20 to 24 Years | 30 (53.6%) | 0 (0.0%) |
| 25 to 29 Years | 10 (76.9%) | 0 (0.0%) |
| 30 to 34 Years | 34 (66.7%) | 0 (0.0%) |
| 35 to 44 Years | 54 (62.8%) | 0 (0.0%) |
| 45 to 54 Years | 65 (79.3%) | 0 (0.0%) |
| 55 to 59 Years | 71 (98.6%) | 0 (0.0%) |
| 60 to 64 Years | 7 (14.3%) | 0 (0.0%) |
| 65 to 74 Years | 7 (10.9%) | 0 (0.0%) |
| 75 Years and over | 0 (0.0%) | 0 (0.0%) |
| Total | 300 (51.0%) | 3 (1.0%) |
Employment Status by Educational Attainment in Greenwood
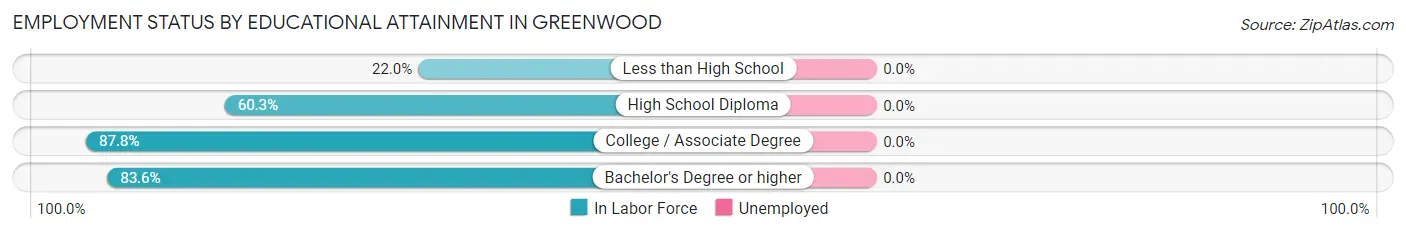
| Educational Attainment | In Labor Force | Unemployed |
| Less than High School | 9 (22.0%) | 0 (0.0%) |
| High School Diploma | 85 (60.3%) | 0 (0.0%) |
| College / Associate Degree | 86 (87.8%) | 0 (0.0%) |
| Bachelor's Degree or higher | 61 (83.6%) | 0 (0.0%) |
| Total | 241 (68.3%) | 0 (0.0%) |
Employment Occupations by Sex in Greenwood
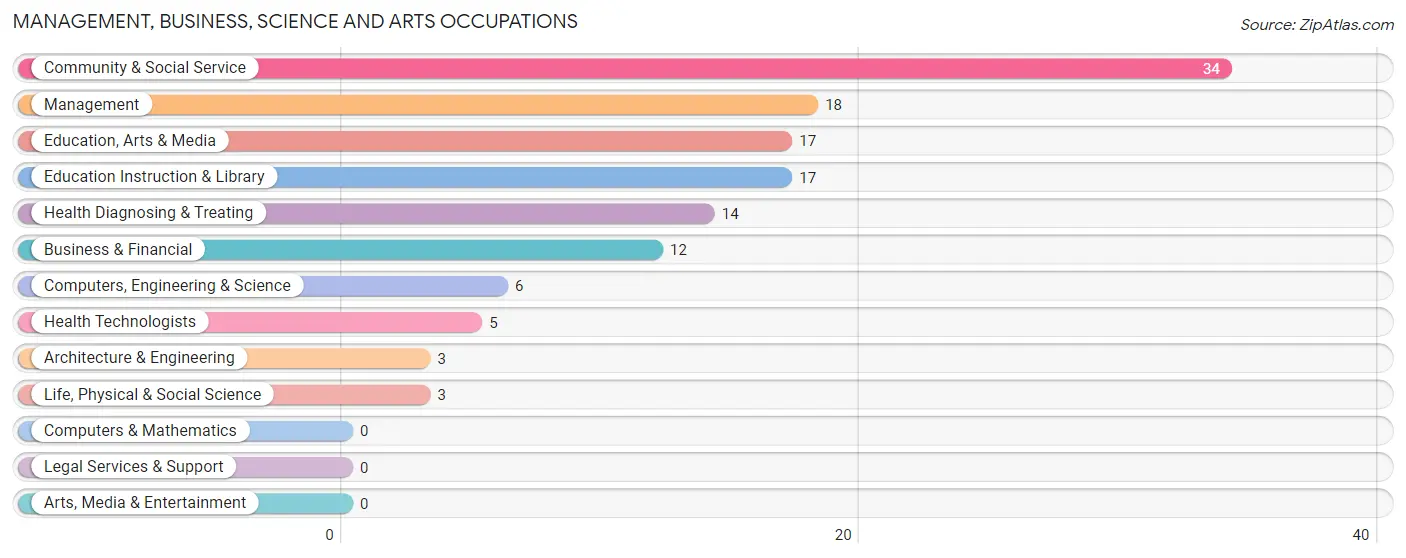
Management, Business, Science and Arts Occupations
The most common Management, Business, Science and Arts occupations in Greenwood are Community & Social Service (34 | 11.5%), Management (18 | 6.1%), Education, Arts & Media (17 | 5.7%), Education Instruction & Library (17 | 5.7%), and Health Diagnosing & Treating (14 | 4.7%).
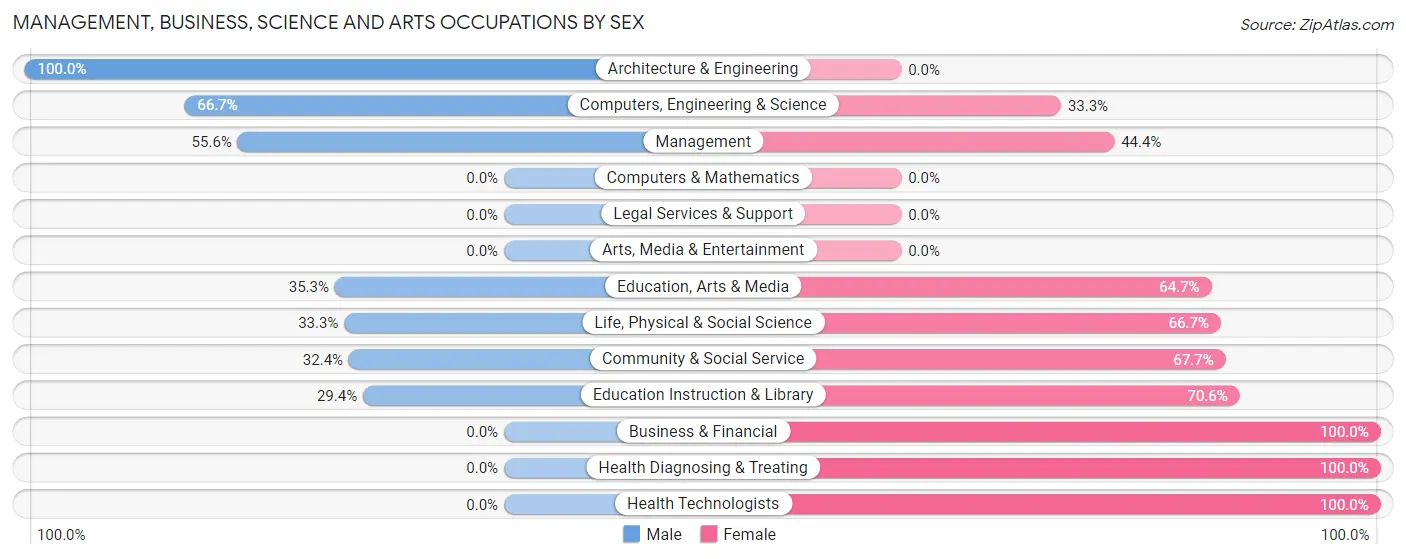
Management, Business, Science and Arts Occupations by Sex
Within the Management, Business, Science and Arts occupations in Greenwood, the most male-oriented occupations are Architecture & Engineering (100.0%), Computers, Engineering & Science (66.7%), and Management (55.6%), while the most female-oriented occupations are Business & Financial (100.0%), Health Diagnosing & Treating (100.0%), and Health Technologists (100.0%).
| Occupation | Male | Female |
| Management | 10 (55.6%) | 8 (44.4%) |
| Business & Financial | 0 (0.0%) | 12 (100.0%) |
| Computers, Engineering & Science | 4 (66.7%) | 2 (33.3%) |
| Computers & Mathematics | 0 (0.0%) | 0 (0.0%) |
| Architecture & Engineering | 3 (100.0%) | 0 (0.0%) |
| Life, Physical & Social Science | 1 (33.3%) | 2 (66.7%) |
| Community & Social Service | 11 (32.4%) | 23 (67.6%) |
| Education, Arts & Media | 6 (35.3%) | 11 (64.7%) |
| Legal Services & Support | 0 (0.0%) | 0 (0.0%) |
| Education Instruction & Library | 5 (29.4%) | 12 (70.6%) |
| Arts, Media & Entertainment | 0 (0.0%) | 0 (0.0%) |
| Health Diagnosing & Treating | 0 (0.0%) | 14 (100.0%) |
| Health Technologists | 0 (0.0%) | 5 (100.0%) |
| Total (Category) | 25 (29.8%) | 59 (70.2%) |
| Total (Overall) | 155 (52.2%) | 142 (47.8%) |
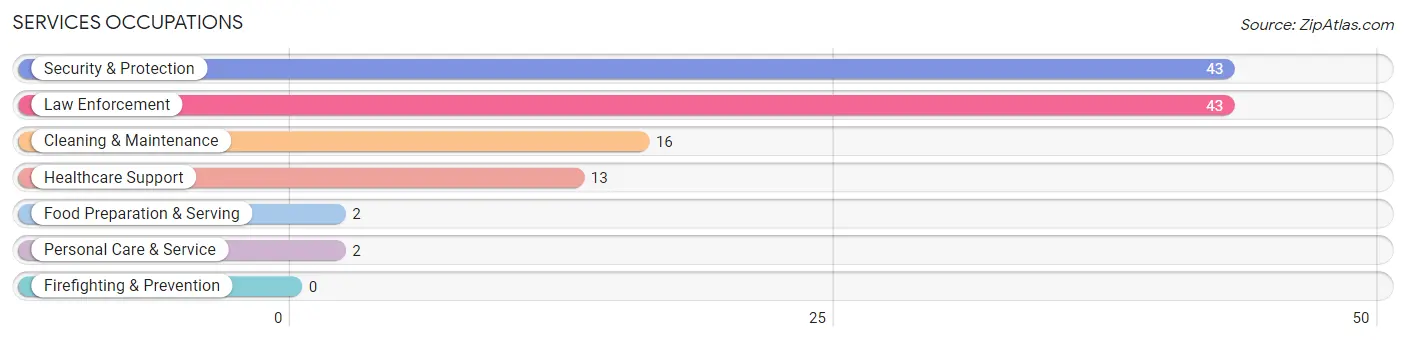
Services Occupations
The most common Services occupations in Greenwood are Security & Protection (43 | 14.5%), Law Enforcement (43 | 14.5%), Cleaning & Maintenance (16 | 5.4%), Healthcare Support (13 | 4.4%), and Food Preparation & Serving (2 | 0.7%).
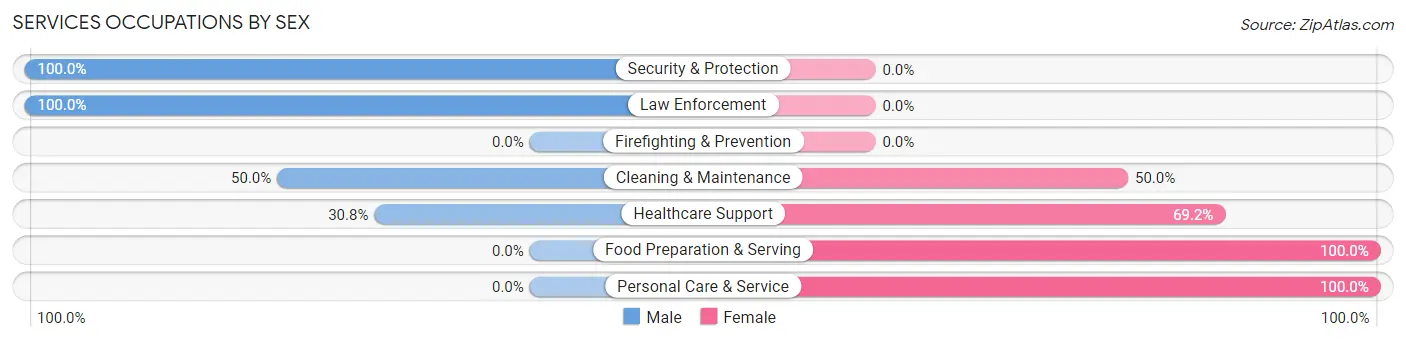
Services Occupations by Sex
Within the Services occupations in Greenwood, the most male-oriented occupations are Security & Protection (100.0%), Law Enforcement (100.0%), and Cleaning & Maintenance (50.0%), while the most female-oriented occupations are Food Preparation & Serving (100.0%), Personal Care & Service (100.0%), and Healthcare Support (69.2%).
| Occupation | Male | Female |
| Healthcare Support | 4 (30.8%) | 9 (69.2%) |
| Security & Protection | 43 (100.0%) | 0 (0.0%) |
| Firefighting & Prevention | 0 (0.0%) | 0 (0.0%) |
| Law Enforcement | 43 (100.0%) | 0 (0.0%) |
| Food Preparation & Serving | 0 (0.0%) | 2 (100.0%) |
| Cleaning & Maintenance | 8 (50.0%) | 8 (50.0%) |
| Personal Care & Service | 0 (0.0%) | 2 (100.0%) |
| Total (Category) | 55 (72.4%) | 21 (27.6%) |
| Total (Overall) | 155 (52.2%) | 142 (47.8%) |
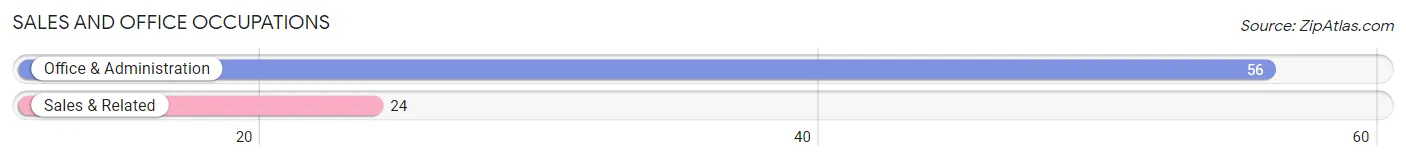
Sales and Office Occupations
The most common Sales and Office occupations in Greenwood are Office & Administration (56 | 18.9%), and Sales & Related (24 | 8.1%).
Sales and Office Occupations by Sex
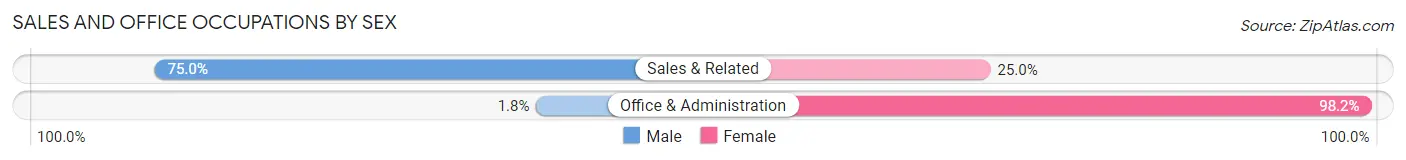
| Occupation | Male | Female |
| Sales & Related | 18 (75.0%) | 6 (25.0%) |
| Office & Administration | 1 (1.8%) | 55 (98.2%) |
| Total (Category) | 19 (23.7%) | 61 (76.2%) |
| Total (Overall) | 155 (52.2%) | 142 (47.8%) |
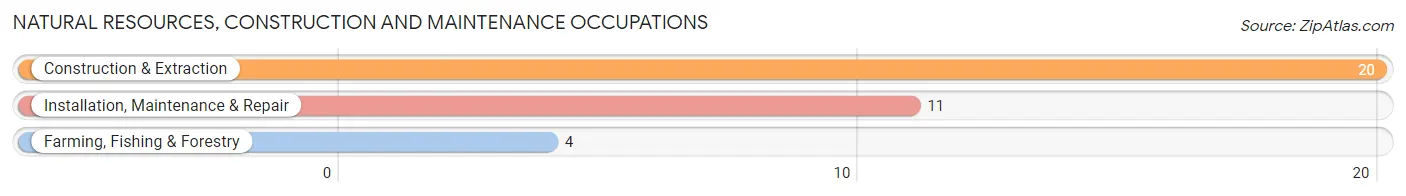
Natural Resources, Construction and Maintenance Occupations
The most common Natural Resources, Construction and Maintenance occupations in Greenwood are Construction & Extraction (20 | 6.7%), Installation, Maintenance & Repair (11 | 3.7%), and Farming, Fishing & Forestry (4 | 1.3%).
Natural Resources, Construction and Maintenance Occupations by Sex
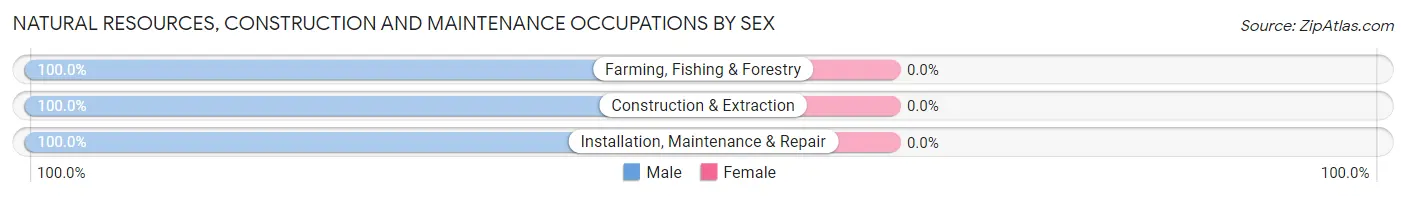
| Occupation | Male | Female |
| Farming, Fishing & Forestry | 4 (100.0%) | 0 (0.0%) |
| Construction & Extraction | 20 (100.0%) | 0 (0.0%) |
| Installation, Maintenance & Repair | 11 (100.0%) | 0 (0.0%) |
| Total (Category) | 35 (100.0%) | 0 (0.0%) |
| Total (Overall) | 155 (52.2%) | 142 (47.8%) |
Production, Transportation and Moving Occupations
The most common Production, Transportation and Moving occupations in Greenwood are Transportation (11 | 3.7%), and Material Moving (11 | 3.7%).

Production, Transportation and Moving Occupations by Sex
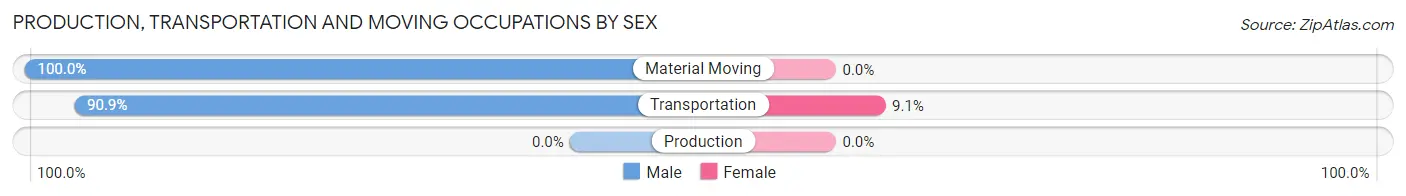
| Occupation | Male | Female |
| Production | 0 (0.0%) | 0 (0.0%) |
| Transportation | 10 (90.9%) | 1 (9.1%) |
| Material Moving | 11 (100.0%) | 0 (0.0%) |
| Total (Category) | 21 (95.5%) | 1 (4.5%) |
| Total (Overall) | 155 (52.2%) | 142 (47.8%) |
Employment Industries by Sex in Greenwood
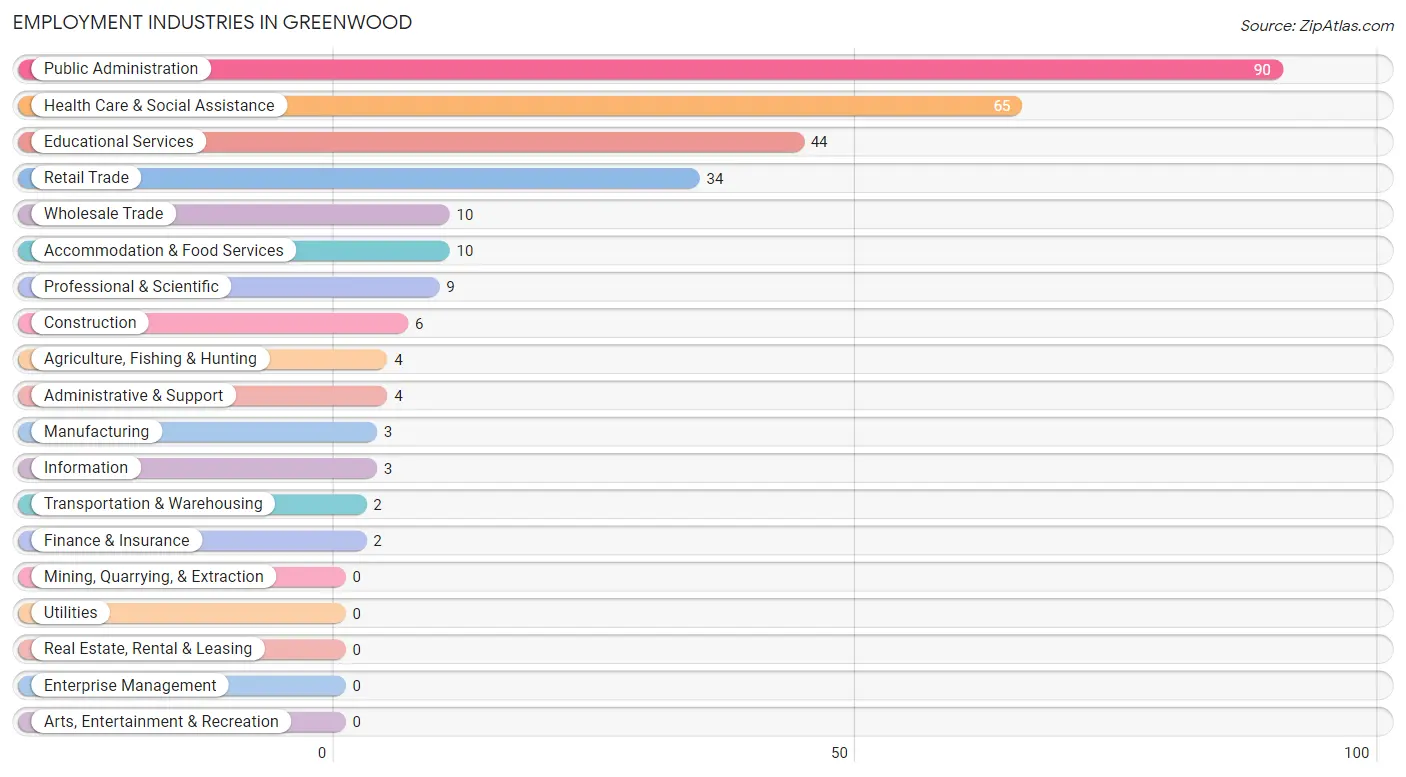
Employment Industries in Greenwood
The major employment industries in Greenwood include Public Administration (90 | 30.3%), Health Care & Social Assistance (65 | 21.9%), Educational Services (44 | 14.8%), Retail Trade (34 | 11.5%), and Wholesale Trade (10 | 3.4%).
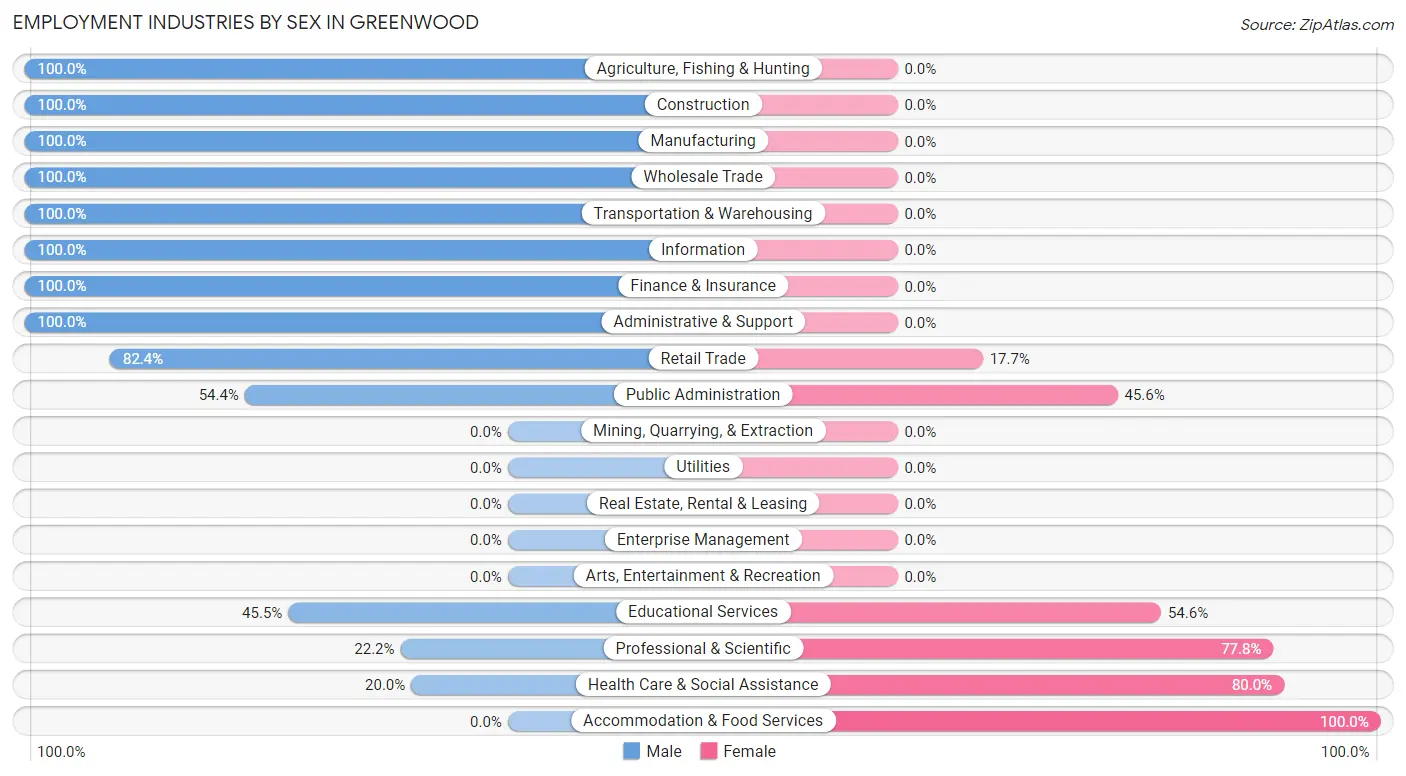
Employment Industries by Sex in Greenwood
The Greenwood industries that see more men than women are Agriculture, Fishing & Hunting (100.0%), Construction (100.0%), and Manufacturing (100.0%), whereas the industries that tend to have a higher number of women are Accommodation & Food Services (100.0%), Health Care & Social Assistance (80.0%), and Professional & Scientific (77.8%).
| Industry | Male | Female |
| Agriculture, Fishing & Hunting | 4 (100.0%) | 0 (0.0%) |
| Mining, Quarrying, & Extraction | 0 (0.0%) | 0 (0.0%) |
| Construction | 6 (100.0%) | 0 (0.0%) |
| Manufacturing | 3 (100.0%) | 0 (0.0%) |
| Wholesale Trade | 10 (100.0%) | 0 (0.0%) |
| Retail Trade | 28 (82.4%) | 6 (17.6%) |
| Transportation & Warehousing | 2 (100.0%) | 0 (0.0%) |
| Utilities | 0 (0.0%) | 0 (0.0%) |
| Information | 3 (100.0%) | 0 (0.0%) |
| Finance & Insurance | 2 (100.0%) | 0 (0.0%) |
| Real Estate, Rental & Leasing | 0 (0.0%) | 0 (0.0%) |
| Professional & Scientific | 2 (22.2%) | 7 (77.8%) |
| Enterprise Management | 0 (0.0%) | 0 (0.0%) |
| Administrative & Support | 4 (100.0%) | 0 (0.0%) |
| Educational Services | 20 (45.5%) | 24 (54.5%) |
| Health Care & Social Assistance | 13 (20.0%) | 52 (80.0%) |
| Arts, Entertainment & Recreation | 0 (0.0%) | 0 (0.0%) |
| Accommodation & Food Services | 0 (0.0%) | 10 (100.0%) |
| Public Administration | 49 (54.4%) | 41 (45.6%) |
| Total | 155 (52.2%) | 142 (47.8%) |
Education in Greenwood
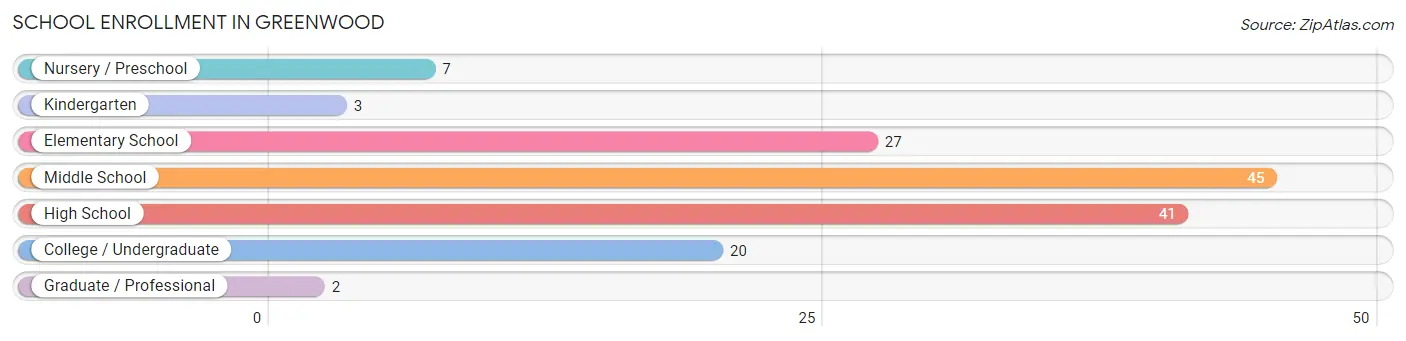
School Enrollment in Greenwood
The most common levels of schooling among the 145 students in Greenwood are middle school (45 | 31.0%), high school (41 | 28.3%), and elementary school (27 | 18.6%).
| School Level | # Students | % Students |
| Nursery / Preschool | 7 | 4.8% |
| Kindergarten | 3 | 2.1% |
| Elementary School | 27 | 18.6% |
| Middle School | 45 | 31.0% |
| High School | 41 | 28.3% |
| College / Undergraduate | 20 | 13.8% |
| Graduate / Professional | 2 | 1.4% |
| Total | 145 | 100.0% |
School Enrollment by Age by Funding Source in Greenwood
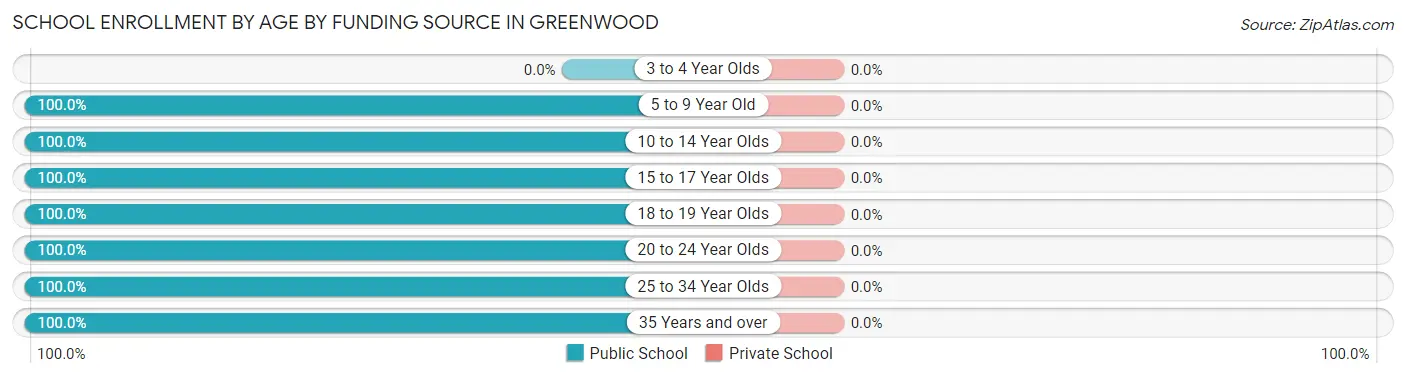
| Age Bracket | Public School | Private School |
| 3 to 4 Year Olds | 0 (0.0%) | 0 (0.0%) |
| 5 to 9 Year Old | 31 (100.0%) | 0 (0.0%) |
| 10 to 14 Year Olds | 56 (100.0%) | 0 (0.0%) |
| 15 to 17 Year Olds | 21 (100.0%) | 0 (0.0%) |
| 18 to 19 Year Olds | 2 (100.0%) | 0 (0.0%) |
| 20 to 24 Year Olds | 23 (100.0%) | 0 (0.0%) |
| 25 to 34 Year Olds | 10 (100.0%) | 0 (0.0%) |
| 35 Years and over | 2 (100.0%) | 0 (0.0%) |
| Total | 145 (100.0%) | 0 (0.0%) |
Educational Attainment by Field of Study in Greenwood
Business (38 | 36.5%), arts & humanities (18 | 17.3%), engineering (14 | 13.5%), bio, nature & agricultural (11 | 10.6%), and education (11 | 10.6%) are the most common fields of study among 104 individuals in Greenwood who have obtained a bachelor's degree or higher.
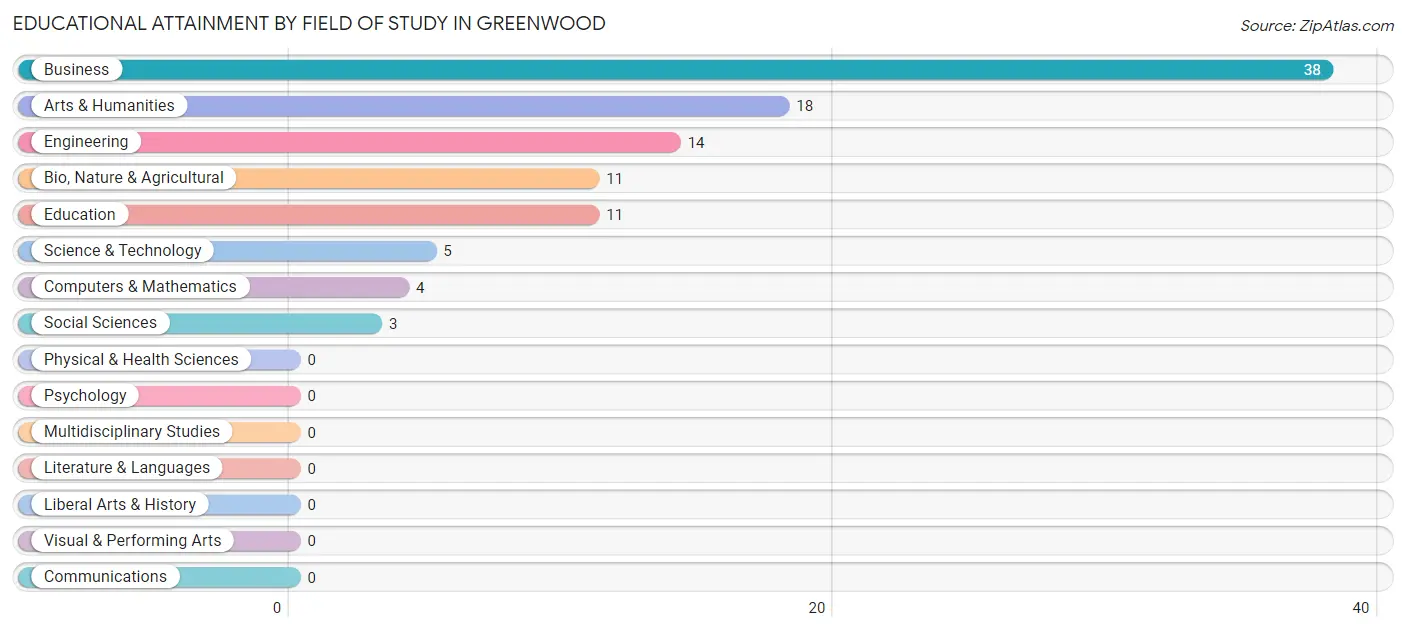
| Field of Study | # Graduates | % Graduates |
| Computers & Mathematics | 4 | 3.8% |
| Bio, Nature & Agricultural | 11 | 10.6% |
| Physical & Health Sciences | 0 | 0.0% |
| Psychology | 0 | 0.0% |
| Social Sciences | 3 | 2.9% |
| Engineering | 14 | 13.5% |
| Multidisciplinary Studies | 0 | 0.0% |
| Science & Technology | 5 | 4.8% |
| Business | 38 | 36.5% |
| Education | 11 | 10.6% |
| Literature & Languages | 0 | 0.0% |
| Liberal Arts & History | 0 | 0.0% |
| Visual & Performing Arts | 0 | 0.0% |
| Communications | 0 | 0.0% |
| Arts & Humanities | 18 | 17.3% |
| Total | 104 | 100.0% |
Transportation & Commute in Greenwood
Vehicle Availability by Sex in Greenwood
The most prevalent vehicle ownership categories in Greenwood are males with 1 vehicle (49, accounting for 31.6%) and females with 1 vehicle (33, making up 34.5%).
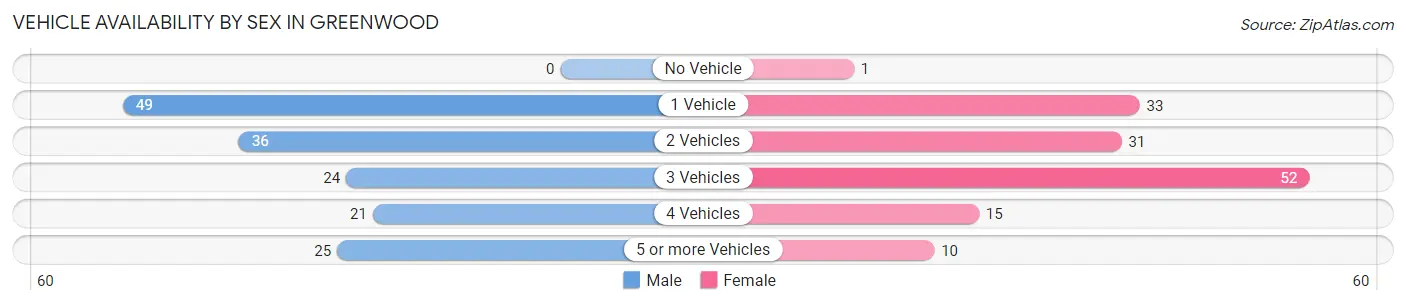
| Vehicles Available | Male | Female |
| No Vehicle | 0 (0.0%) | 1 (0.7%) |
| 1 Vehicle | 49 (31.6%) | 33 (23.2%) |
| 2 Vehicles | 36 (23.2%) | 31 (21.8%) |
| 3 Vehicles | 24 (15.5%) | 52 (36.6%) |
| 4 Vehicles | 21 (13.6%) | 15 (10.6%) |
| 5 or more Vehicles | 25 (16.1%) | 10 (7.0%) |
| Total | 155 (100.0%) | 142 (100.0%) |
Commute Time in Greenwood
The most frequently occuring commute durations in Greenwood are 30 to 34 minutes (121 commuters, 42.3%), 10 to 14 minutes (33 commuters, 11.5%), and 60 to 89 minutes (24 commuters, 8.4%).
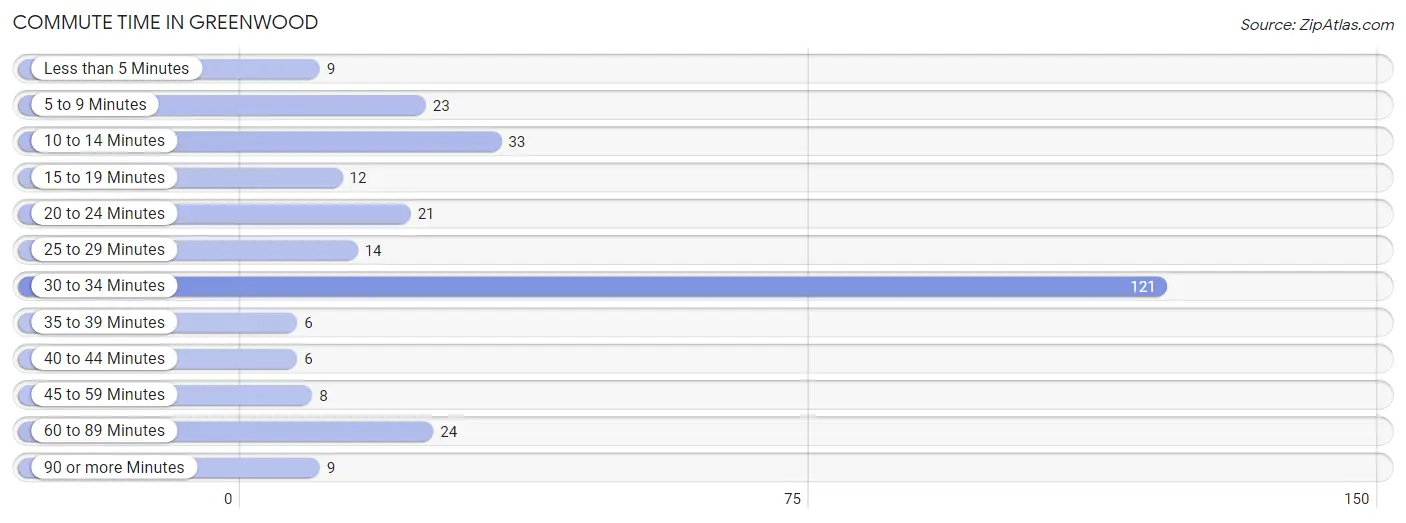
| Commute Time | # Commuters | % Commuters |
| Less than 5 Minutes | 9 | 3.2% |
| 5 to 9 Minutes | 23 | 8.0% |
| 10 to 14 Minutes | 33 | 11.5% |
| 15 to 19 Minutes | 12 | 4.2% |
| 20 to 24 Minutes | 21 | 7.3% |
| 25 to 29 Minutes | 14 | 4.9% |
| 30 to 34 Minutes | 121 | 42.3% |
| 35 to 39 Minutes | 6 | 2.1% |
| 40 to 44 Minutes | 6 | 2.1% |
| 45 to 59 Minutes | 8 | 2.8% |
| 60 to 89 Minutes | 24 | 8.4% |
| 90 or more Minutes | 9 | 3.2% |
Commute Time by Sex in Greenwood
The most common commute times in Greenwood are 30 to 34 minutes (55 commuters, 36.4%) for males and 30 to 34 minutes (66 commuters, 48.9%) for females.
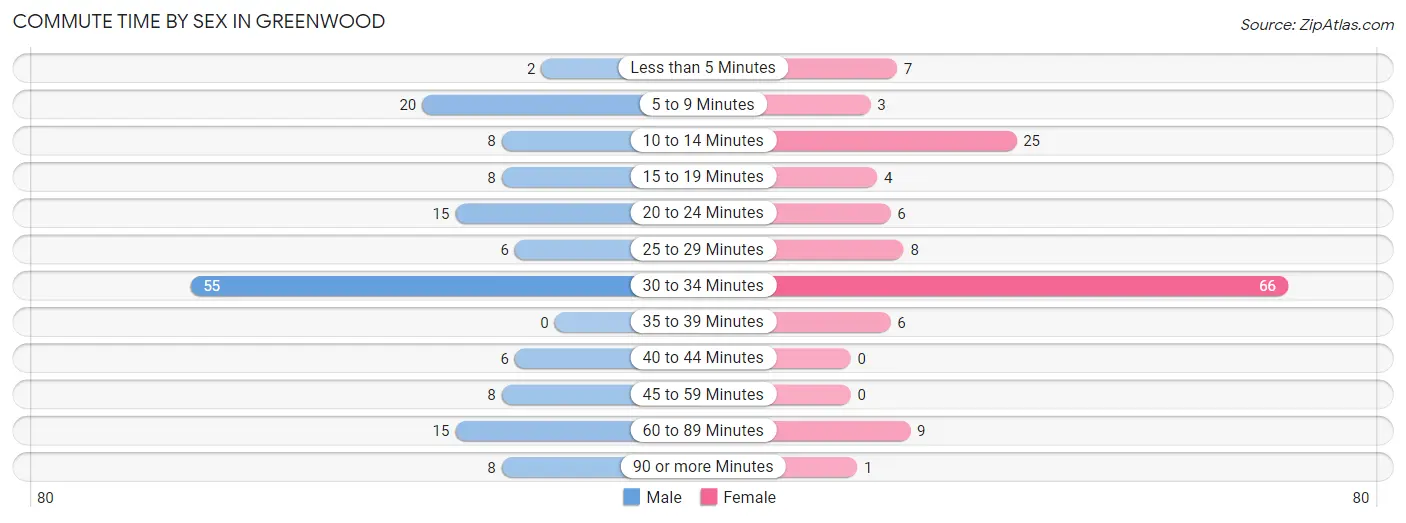
| Commute Time | Male | Female |
| Less than 5 Minutes | 2 (1.3%) | 7 (5.2%) |
| 5 to 9 Minutes | 20 (13.3%) | 3 (2.2%) |
| 10 to 14 Minutes | 8 (5.3%) | 25 (18.5%) |
| 15 to 19 Minutes | 8 (5.3%) | 4 (3.0%) |
| 20 to 24 Minutes | 15 (9.9%) | 6 (4.4%) |
| 25 to 29 Minutes | 6 (4.0%) | 8 (5.9%) |
| 30 to 34 Minutes | 55 (36.4%) | 66 (48.9%) |
| 35 to 39 Minutes | 0 (0.0%) | 6 (4.4%) |
| 40 to 44 Minutes | 6 (4.0%) | 0 (0.0%) |
| 45 to 59 Minutes | 8 (5.3%) | 0 (0.0%) |
| 60 to 89 Minutes | 15 (9.9%) | 9 (6.7%) |
| 90 or more Minutes | 8 (5.3%) | 1 (0.7%) |
Time of Departure to Work by Sex in Greenwood
The most frequent times of departure to work in Greenwood are 6:00 AM to 6:29 AM (51, 33.8%) for males and 6:00 AM to 6:29 AM (53, 39.3%) for females.
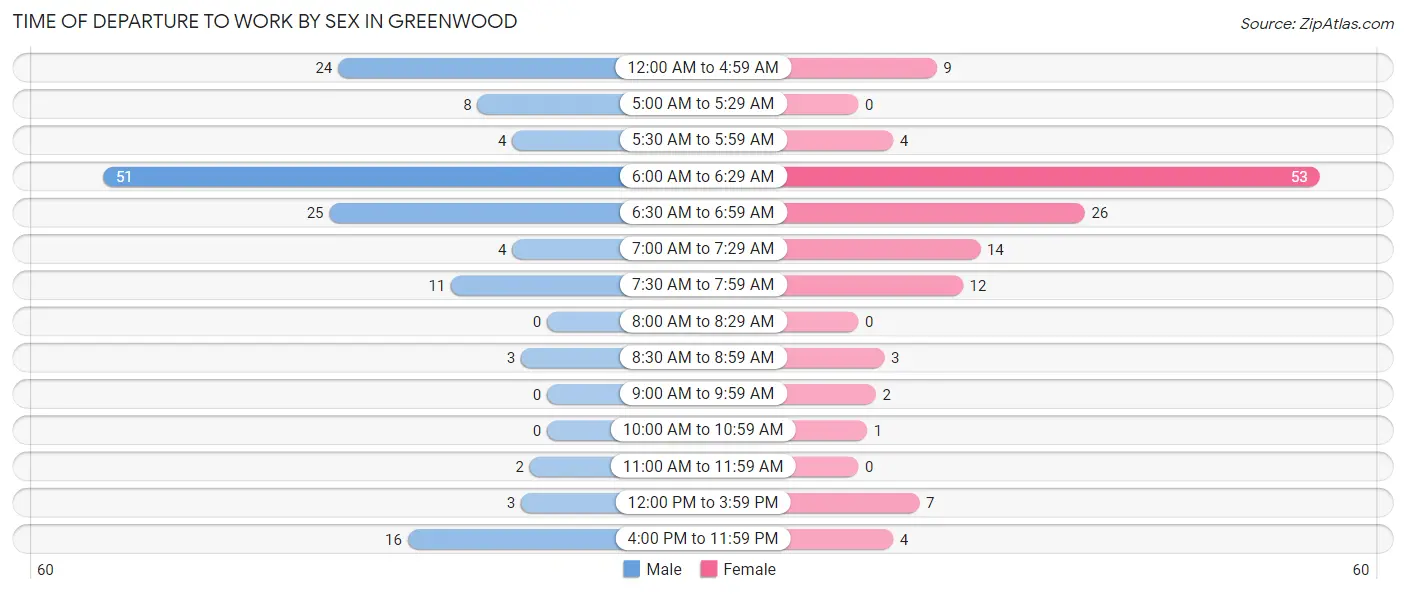
| Time of Departure | Male | Female |
| 12:00 AM to 4:59 AM | 24 (15.9%) | 9 (6.7%) |
| 5:00 AM to 5:29 AM | 8 (5.3%) | 0 (0.0%) |
| 5:30 AM to 5:59 AM | 4 (2.6%) | 4 (3.0%) |
| 6:00 AM to 6:29 AM | 51 (33.8%) | 53 (39.3%) |
| 6:30 AM to 6:59 AM | 25 (16.6%) | 26 (19.3%) |
| 7:00 AM to 7:29 AM | 4 (2.6%) | 14 (10.4%) |
| 7:30 AM to 7:59 AM | 11 (7.3%) | 12 (8.9%) |
| 8:00 AM to 8:29 AM | 0 (0.0%) | 0 (0.0%) |
| 8:30 AM to 8:59 AM | 3 (2.0%) | 3 (2.2%) |
| 9:00 AM to 9:59 AM | 0 (0.0%) | 2 (1.5%) |
| 10:00 AM to 10:59 AM | 0 (0.0%) | 1 (0.7%) |
| 11:00 AM to 11:59 AM | 2 (1.3%) | 0 (0.0%) |
| 12:00 PM to 3:59 PM | 3 (2.0%) | 7 (5.2%) |
| 4:00 PM to 11:59 PM | 16 (10.6%) | 4 (3.0%) |
| Total | 151 (100.0%) | 135 (100.0%) |
Housing Occupancy in Greenwood
Occupancy by Ownership in Greenwood
Of the total 212 dwellings in Greenwood, owner-occupied units account for 158 (74.5%), while renter-occupied units make up 54 (25.5%).
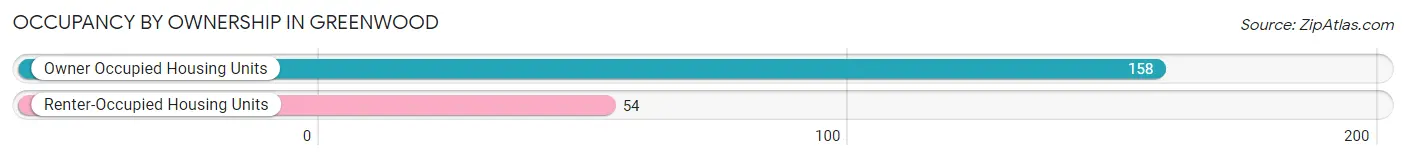
| Occupancy | # Housing Units | % Housing Units |
| Owner Occupied Housing Units | 158 | 74.5% |
| Renter-Occupied Housing Units | 54 | 25.5% |
| Total Occupied Housing Units | 212 | 100.0% |
Occupancy by Household Size in Greenwood
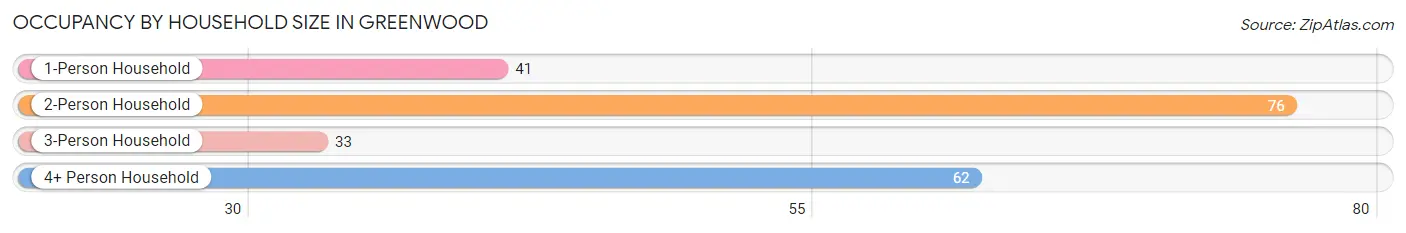
| Household Size | # Housing Units | % Housing Units |
| 1-Person Household | 41 | 19.3% |
| 2-Person Household | 76 | 35.8% |
| 3-Person Household | 33 | 15.6% |
| 4+ Person Household | 62 | 29.2% |
| Total Housing Units | 212 | 100.0% |
Occupancy by Ownership by Household Size in Greenwood
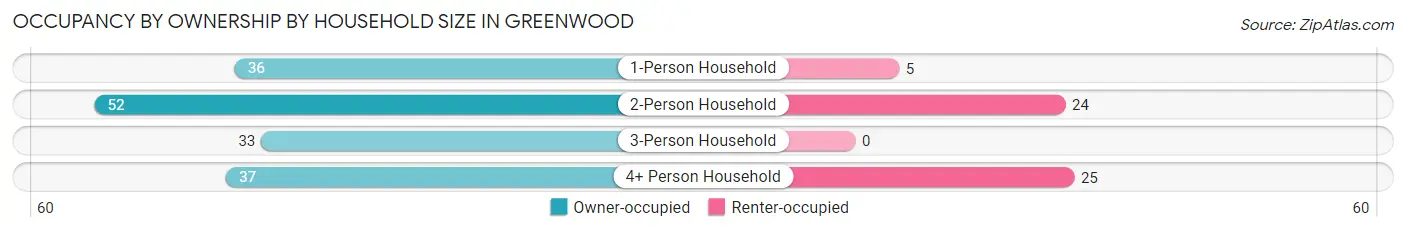
| Household Size | Owner-occupied | Renter-occupied |
| 1-Person Household | 36 (87.8%) | 5 (12.2%) |
| 2-Person Household | 52 (68.4%) | 24 (31.6%) |
| 3-Person Household | 33 (100.0%) | 0 (0.0%) |
| 4+ Person Household | 37 (59.7%) | 25 (40.3%) |
| Total Housing Units | 158 (74.5%) | 54 (25.5%) |
Occupancy by Educational Attainment in Greenwood
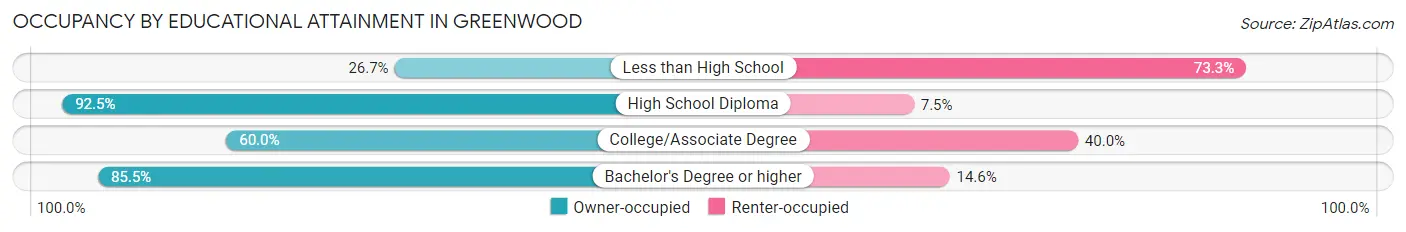
| Household Size | Owner-occupied | Renter-occupied |
| Less than High School | 4 (26.7%) | 11 (73.3%) |
| High School Diploma | 62 (92.5%) | 5 (7.5%) |
| College/Associate Degree | 45 (60.0%) | 30 (40.0%) |
| Bachelor's Degree or higher | 47 (85.5%) | 8 (14.5%) |
Occupancy by Age of Householder in Greenwood
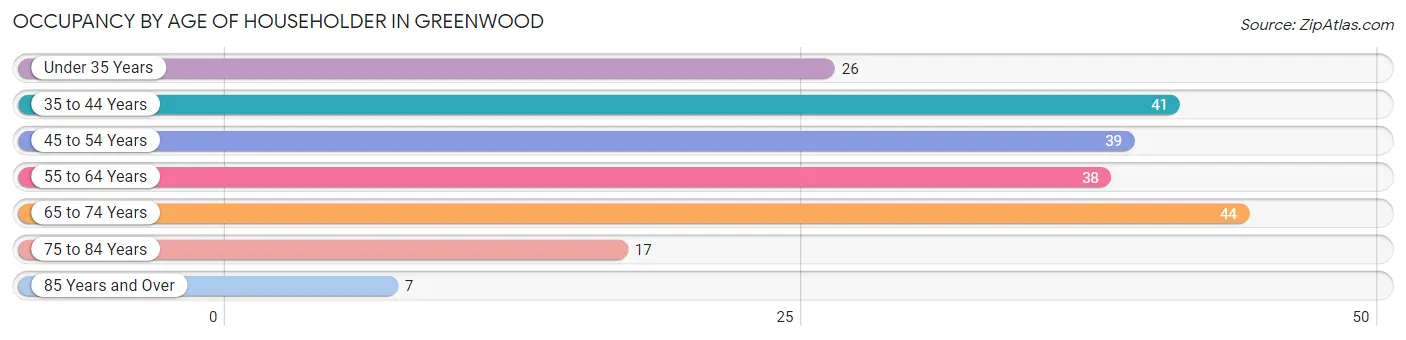
| Age Bracket | # Households | % Households |
| Under 35 Years | 26 | 12.3% |
| 35 to 44 Years | 41 | 19.3% |
| 45 to 54 Years | 39 | 18.4% |
| 55 to 64 Years | 38 | 17.9% |
| 65 to 74 Years | 44 | 20.7% |
| 75 to 84 Years | 17 | 8.0% |
| 85 Years and Over | 7 | 3.3% |
| Total | 212 | 100.0% |
Housing Finances in Greenwood
Median Income by Occupancy in Greenwood
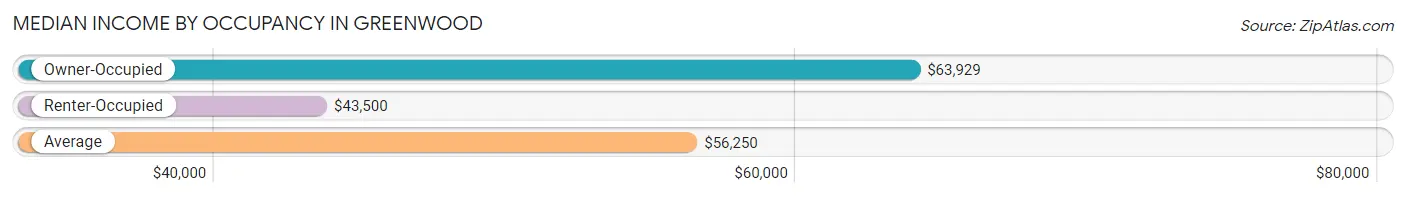
| Occupancy Type | # Households | Median Income |
| Owner-Occupied | 158 (74.5%) | $63,929 |
| Renter-Occupied | 54 (25.5%) | $43,500 |
| Average | 212 (100.0%) | $56,250 |
Occupancy by Householder Income Bracket in Greenwood
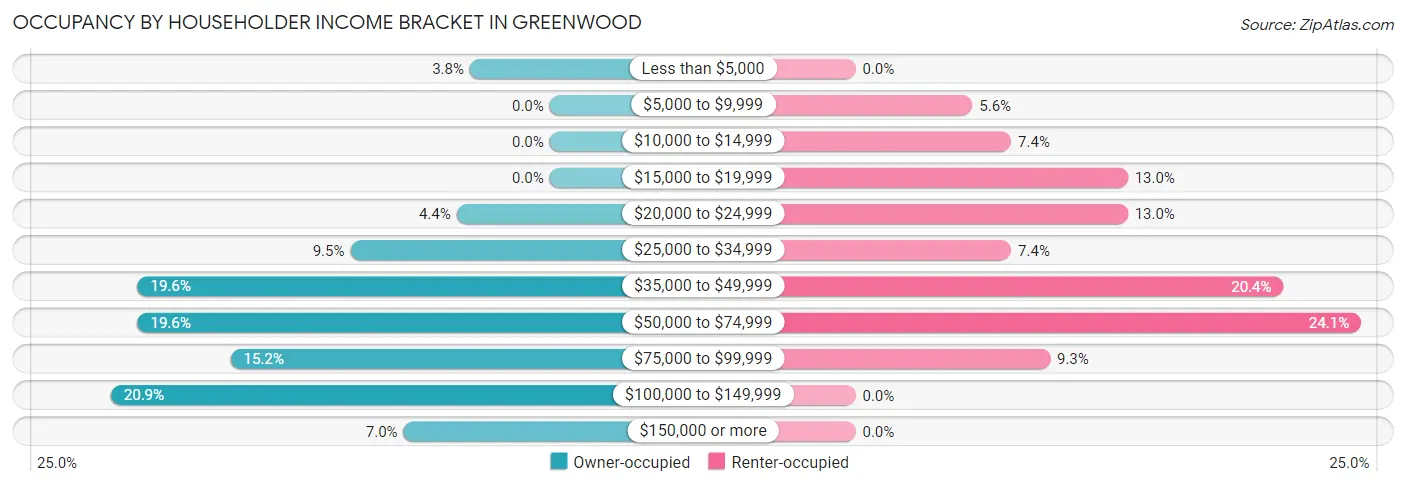
| Income Bracket | Owner-occupied | Renter-occupied |
| Less than $5,000 | 6 (3.8%) | 0 (0.0%) |
| $5,000 to $9,999 | 0 (0.0%) | 3 (5.6%) |
| $10,000 to $14,999 | 0 (0.0%) | 4 (7.4%) |
| $15,000 to $19,999 | 0 (0.0%) | 7 (13.0%) |
| $20,000 to $24,999 | 7 (4.4%) | 7 (13.0%) |
| $25,000 to $34,999 | 15 (9.5%) | 4 (7.4%) |
| $35,000 to $49,999 | 31 (19.6%) | 11 (20.4%) |
| $50,000 to $74,999 | 31 (19.6%) | 13 (24.1%) |
| $75,000 to $99,999 | 24 (15.2%) | 5 (9.3%) |
| $100,000 to $149,999 | 33 (20.9%) | 0 (0.0%) |
| $150,000 or more | 11 (7.0%) | 0 (0.0%) |
| Total | 158 (100.0%) | 54 (100.0%) |
Monthly Housing Cost Tiers in Greenwood
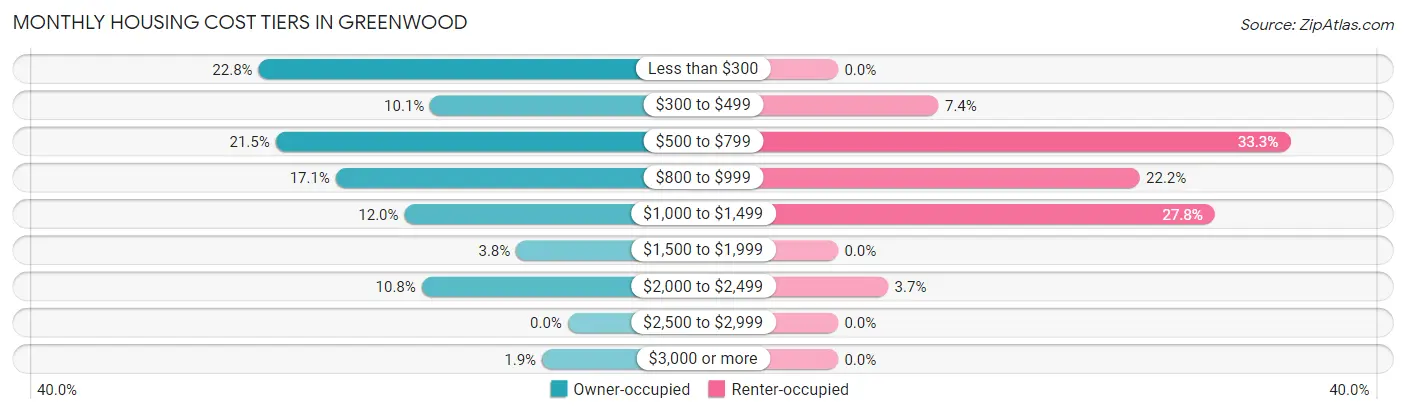
| Monthly Cost | Owner-occupied | Renter-occupied |
| Less than $300 | 36 (22.8%) | 0 (0.0%) |
| $300 to $499 | 16 (10.1%) | 4 (7.4%) |
| $500 to $799 | 34 (21.5%) | 18 (33.3%) |
| $800 to $999 | 27 (17.1%) | 12 (22.2%) |
| $1,000 to $1,499 | 19 (12.0%) | 15 (27.8%) |
| $1,500 to $1,999 | 6 (3.8%) | 0 (0.0%) |
| $2,000 to $2,499 | 17 (10.8%) | 2 (3.7%) |
| $2,500 to $2,999 | 0 (0.0%) | 0 (0.0%) |
| $3,000 or more | 3 (1.9%) | 0 (0.0%) |
| Total | 158 (100.0%) | 54 (100.0%) |
Physical Housing Characteristics in Greenwood
Housing Structures in Greenwood
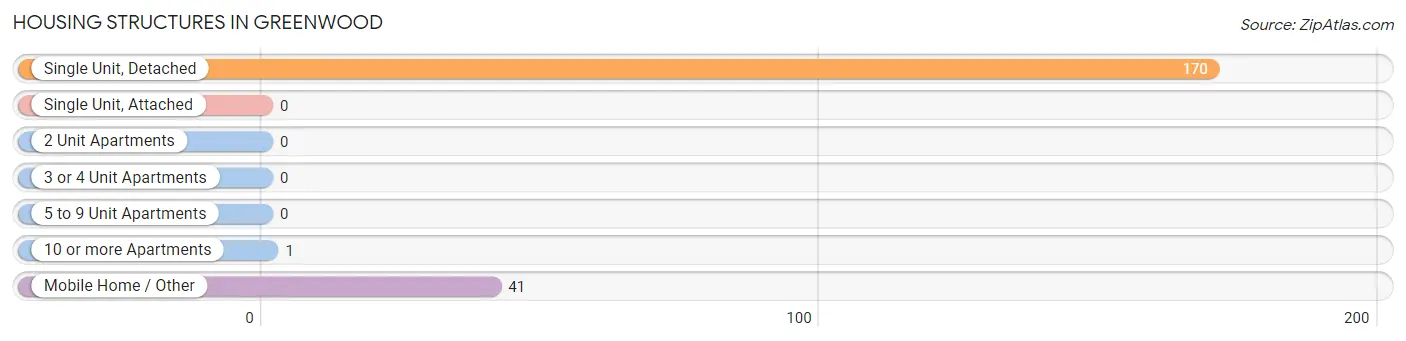
| Structure Type | # Housing Units | % Housing Units |
| Single Unit, Detached | 170 | 80.2% |
| Single Unit, Attached | 0 | 0.0% |
| 2 Unit Apartments | 0 | 0.0% |
| 3 or 4 Unit Apartments | 0 | 0.0% |
| 5 to 9 Unit Apartments | 0 | 0.0% |
| 10 or more Apartments | 1 | 0.5% |
| Mobile Home / Other | 41 | 19.3% |
| Total | 212 | 100.0% |
Housing Structures by Occupancy in Greenwood
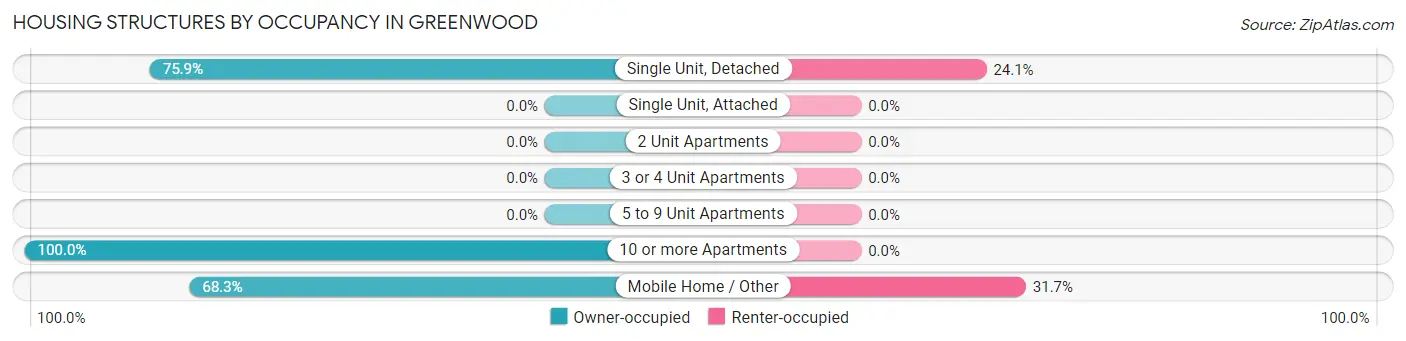
| Structure Type | Owner-occupied | Renter-occupied |
| Single Unit, Detached | 129 (75.9%) | 41 (24.1%) |
| Single Unit, Attached | 0 (0.0%) | 0 (0.0%) |
| 2 Unit Apartments | 0 (0.0%) | 0 (0.0%) |
| 3 or 4 Unit Apartments | 0 (0.0%) | 0 (0.0%) |
| 5 to 9 Unit Apartments | 0 (0.0%) | 0 (0.0%) |
| 10 or more Apartments | 1 (100.0%) | 0 (0.0%) |
| Mobile Home / Other | 28 (68.3%) | 13 (31.7%) |
| Total | 158 (74.5%) | 54 (25.5%) |
Housing Structures by Number of Rooms in Greenwood
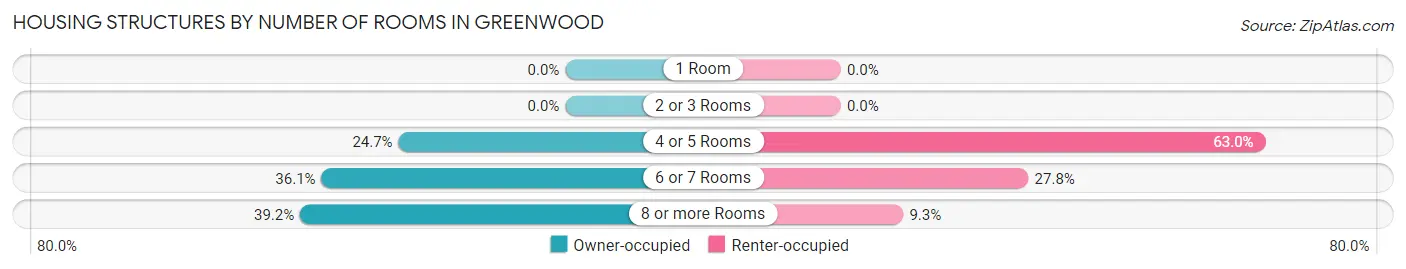
| Number of Rooms | Owner-occupied | Renter-occupied |
| 1 Room | 0 (0.0%) | 0 (0.0%) |
| 2 or 3 Rooms | 0 (0.0%) | 0 (0.0%) |
| 4 or 5 Rooms | 39 (24.7%) | 34 (63.0%) |
| 6 or 7 Rooms | 57 (36.1%) | 15 (27.8%) |
| 8 or more Rooms | 62 (39.2%) | 5 (9.3%) |
| Total | 158 (100.0%) | 54 (100.0%) |
Housing Structure by Heating Type in Greenwood
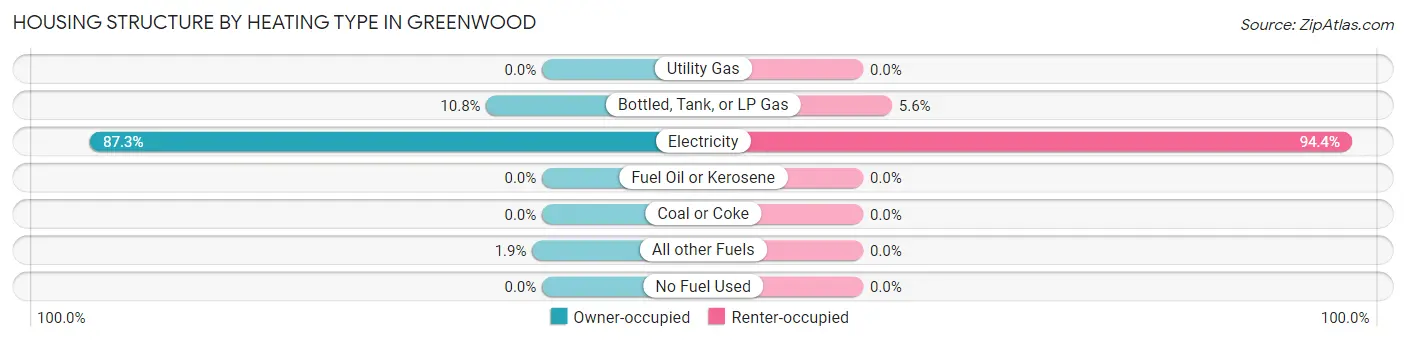
| Heating Type | Owner-occupied | Renter-occupied |
| Utility Gas | 0 (0.0%) | 0 (0.0%) |
| Bottled, Tank, or LP Gas | 17 (10.8%) | 3 (5.6%) |
| Electricity | 138 (87.3%) | 51 (94.4%) |
| Fuel Oil or Kerosene | 0 (0.0%) | 0 (0.0%) |
| Coal or Coke | 0 (0.0%) | 0 (0.0%) |
| All other Fuels | 3 (1.9%) | 0 (0.0%) |
| No Fuel Used | 0 (0.0%) | 0 (0.0%) |
| Total | 158 (100.0%) | 54 (100.0%) |
Household Vehicle Usage in Greenwood
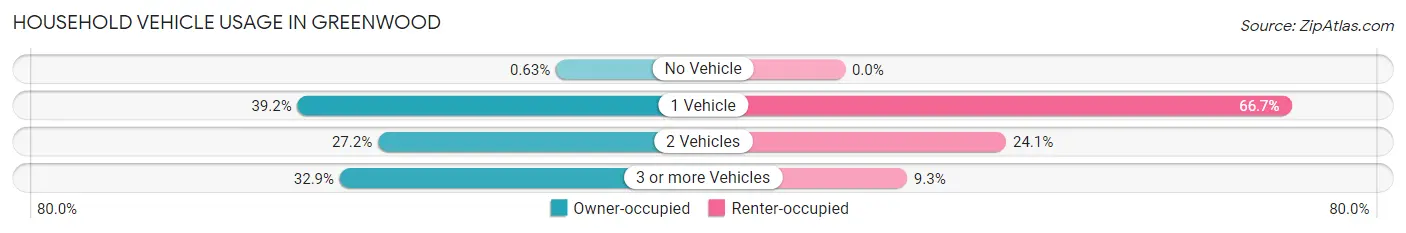
| Vehicles per Household | Owner-occupied | Renter-occupied |
| No Vehicle | 1 (0.6%) | 0 (0.0%) |
| 1 Vehicle | 62 (39.2%) | 36 (66.7%) |
| 2 Vehicles | 43 (27.2%) | 13 (24.1%) |
| 3 or more Vehicles | 52 (32.9%) | 5 (9.3%) |
| Total | 158 (100.0%) | 54 (100.0%) |
Real Estate & Mortgages in Greenwood
Real Estate and Mortgage Overview in Greenwood
| Characteristic | Without Mortgage | With Mortgage |
| Housing Units | 83 | 75 |
| Median Property Value | $67,700 | $108,900 |
| Median Household Income | $58,750 | $3 |
| Monthly Housing Costs | $339 | $3 |
| Real Estate Taxes | $288 | $11 |
Property Value by Mortgage Status in Greenwood
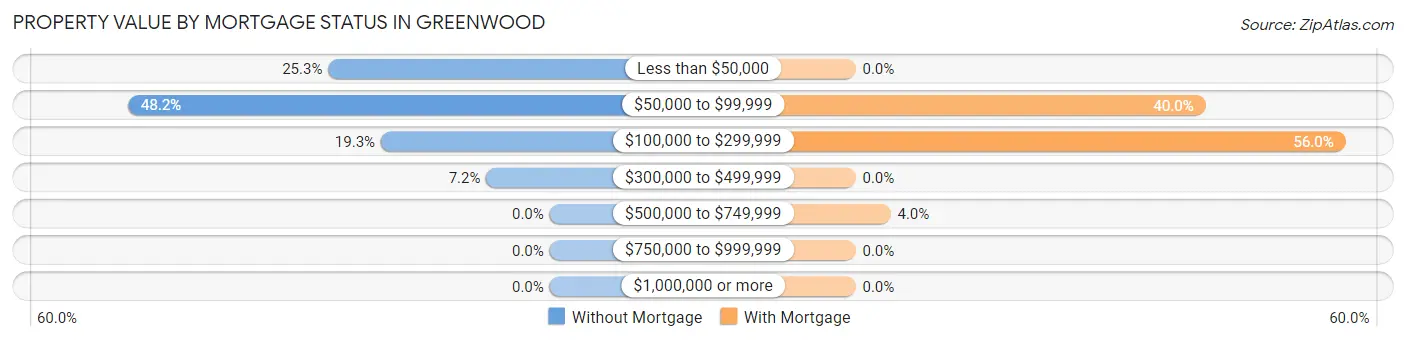
| Property Value | Without Mortgage | With Mortgage |
| Less than $50,000 | 21 (25.3%) | 0 (0.0%) |
| $50,000 to $99,999 | 40 (48.2%) | 30 (40.0%) |
| $100,000 to $299,999 | 16 (19.3%) | 42 (56.0%) |
| $300,000 to $499,999 | 6 (7.2%) | 0 (0.0%) |
| $500,000 to $749,999 | 0 (0.0%) | 3 (4.0%) |
| $750,000 to $999,999 | 0 (0.0%) | 0 (0.0%) |
| $1,000,000 or more | 0 (0.0%) | 0 (0.0%) |
| Total | 83 (100.0%) | 75 (100.0%) |
Household Income by Mortgage Status in Greenwood
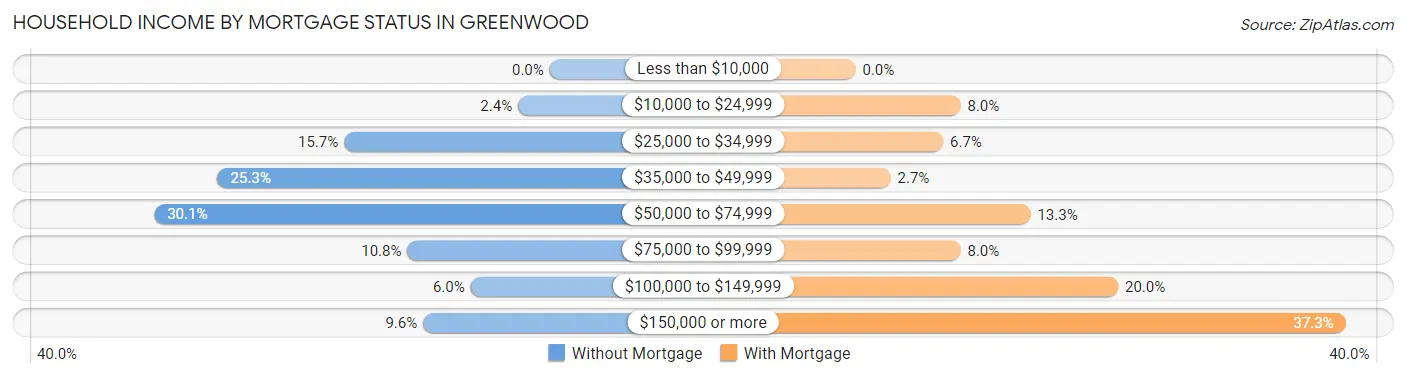
| Household Income | Without Mortgage | With Mortgage |
| Less than $10,000 | 0 (0.0%) | 0 (0.0%) |
| $10,000 to $24,999 | 2 (2.4%) | 6 (8.0%) |
| $25,000 to $34,999 | 13 (15.7%) | 5 (6.7%) |
| $35,000 to $49,999 | 21 (25.3%) | 2 (2.7%) |
| $50,000 to $74,999 | 25 (30.1%) | 10 (13.3%) |
| $75,000 to $99,999 | 9 (10.8%) | 6 (8.0%) |
| $100,000 to $149,999 | 5 (6.0%) | 15 (20.0%) |
| $150,000 or more | 8 (9.6%) | 28 (37.3%) |
| Total | 83 (100.0%) | 75 (100.0%) |
Property Value to Household Income Ratio in Greenwood
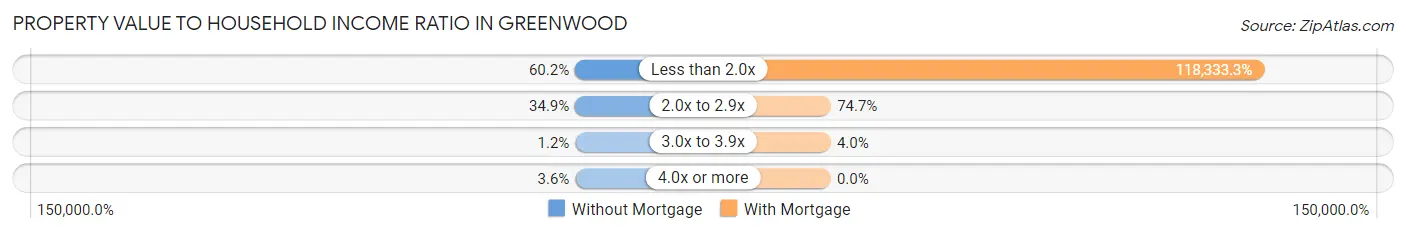
| Value-to-Income Ratio | Without Mortgage | With Mortgage |
| Less than 2.0x | 50 (60.2%) | 88,750 (118,333.3%) |
| 2.0x to 2.9x | 29 (34.9%) | 56 (74.7%) |
| 3.0x to 3.9x | 1 (1.2%) | 3 (4.0%) |
| 4.0x or more | 3 (3.6%) | 0 (0.0%) |
| Total | 83 (100.0%) | 75 (100.0%) |
Real Estate Taxes by Mortgage Status in Greenwood
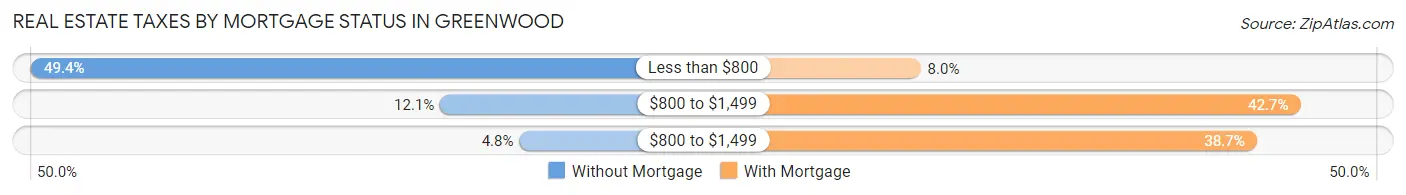
| Property Taxes | Without Mortgage | With Mortgage |
| Less than $800 | 41 (49.4%) | 6 (8.0%) |
| $800 to $1,499 | 10 (12.0%) | 32 (42.7%) |
| $800 to $1,499 | 4 (4.8%) | 29 (38.7%) |
| Total | 83 (100.0%) | 75 (100.0%) |
Health & Disability in Greenwood
Health Insurance Coverage by Age in Greenwood
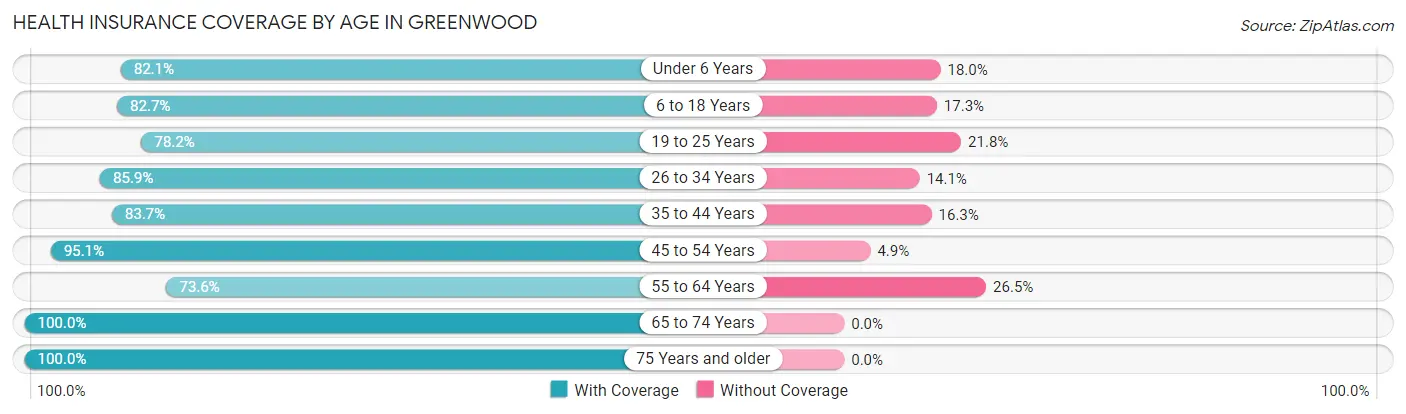
| Age Bracket | With Coverage | Without Coverage |
| Under 6 Years | 32 (82.1%) | 7 (17.9%) |
| 6 to 18 Years | 115 (82.7%) | 24 (17.3%) |
| 19 to 25 Years | 61 (78.2%) | 17 (21.8%) |
| 26 to 34 Years | 55 (85.9%) | 9 (14.1%) |
| 35 to 44 Years | 72 (83.7%) | 14 (16.3%) |
| 45 to 54 Years | 78 (95.1%) | 4 (4.9%) |
| 55 to 64 Years | 89 (73.6%) | 32 (26.5%) |
| 65 to 74 Years | 64 (100.0%) | 0 (0.0%) |
| 75 Years and older | 40 (100.0%) | 0 (0.0%) |
| Total | 606 (85.0%) | 107 (15.0%) |
Health Insurance Coverage by Citizenship Status in Greenwood
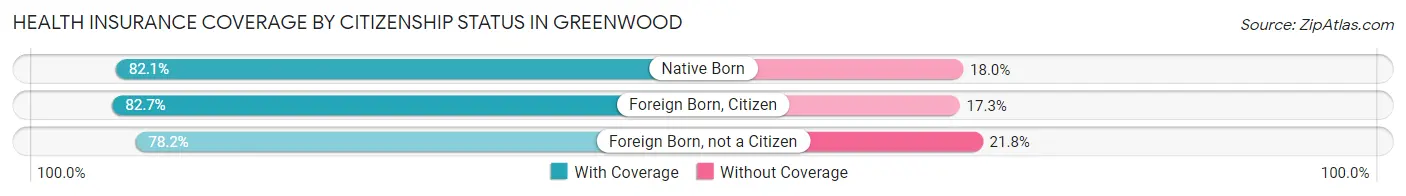
| Citizenship Status | With Coverage | Without Coverage |
| Native Born | 32 (82.1%) | 7 (17.9%) |
| Foreign Born, Citizen | 115 (82.7%) | 24 (17.3%) |
| Foreign Born, not a Citizen | 61 (78.2%) | 17 (21.8%) |
Health Insurance Coverage by Household Income in Greenwood
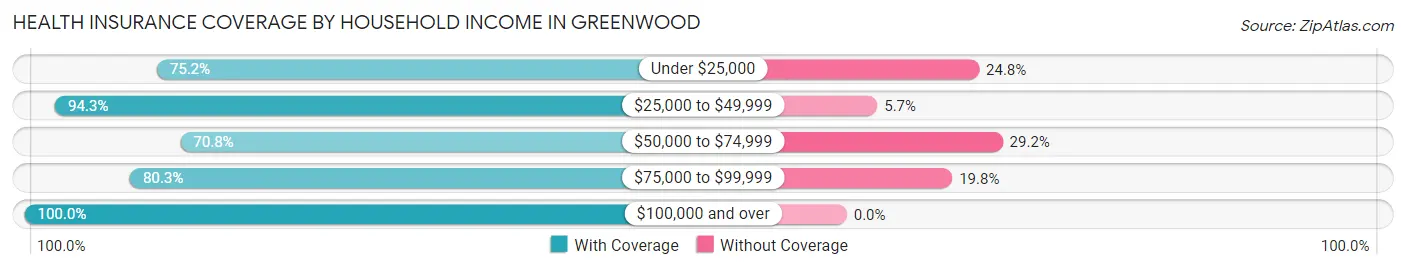
| Household Income | With Coverage | Without Coverage |
| Under $25,000 | 91 (75.2%) | 30 (24.8%) |
| $25,000 to $49,999 | 99 (94.3%) | 6 (5.7%) |
| $50,000 to $74,999 | 97 (70.8%) | 40 (29.2%) |
| $75,000 to $99,999 | 126 (80.2%) | 31 (19.8%) |
| $100,000 and over | 193 (100.0%) | 0 (0.0%) |
Public vs Private Health Insurance Coverage by Age in Greenwood
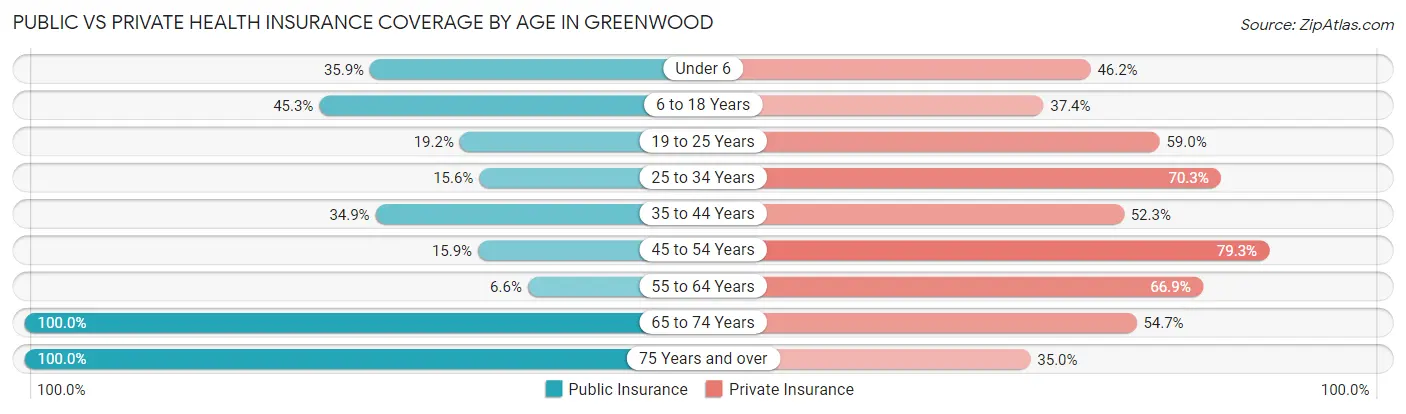
| Age Bracket | Public Insurance | Private Insurance |
| Under 6 | 14 (35.9%) | 18 (46.2%) |
| 6 to 18 Years | 63 (45.3%) | 52 (37.4%) |
| 19 to 25 Years | 15 (19.2%) | 46 (59.0%) |
| 25 to 34 Years | 10 (15.6%) | 45 (70.3%) |
| 35 to 44 Years | 30 (34.9%) | 45 (52.3%) |
| 45 to 54 Years | 13 (15.9%) | 65 (79.3%) |
| 55 to 64 Years | 8 (6.6%) | 81 (66.9%) |
| 65 to 74 Years | 64 (100.0%) | 35 (54.7%) |
| 75 Years and over | 40 (100.0%) | 14 (35.0%) |
| Total | 257 (36.0%) | 401 (56.2%) |
Disability Status by Sex by Age in Greenwood
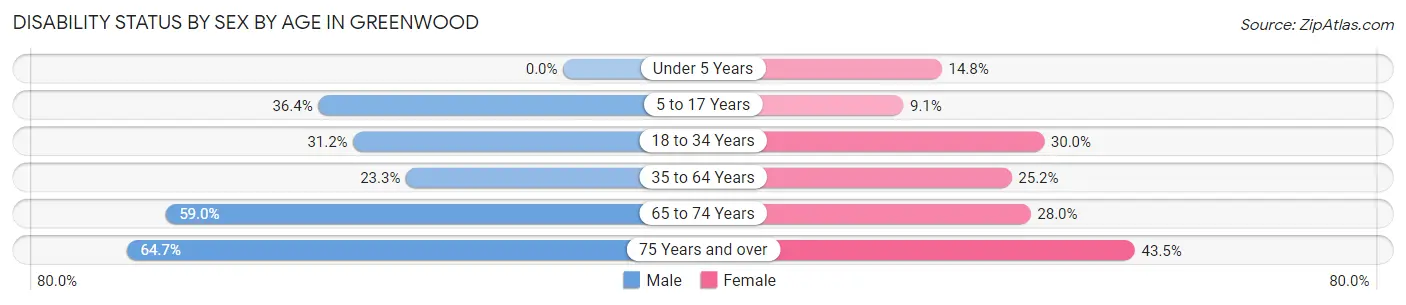
| Age Bracket | Male | Female |
| Under 5 Years | 0 (0.0%) | 4 (14.8%) |
| 5 to 17 Years | 36 (36.4%) | 4 (9.1%) |
| 18 to 34 Years | 24 (31.2%) | 21 (30.0%) |
| 35 to 64 Years | 35 (23.3%) | 35 (25.2%) |
| 65 to 74 Years | 23 (59.0%) | 7 (28.0%) |
| 75 Years and over | 11 (64.7%) | 10 (43.5%) |
Disability Class by Sex by Age in Greenwood
Disability Class: Hearing Difficulty
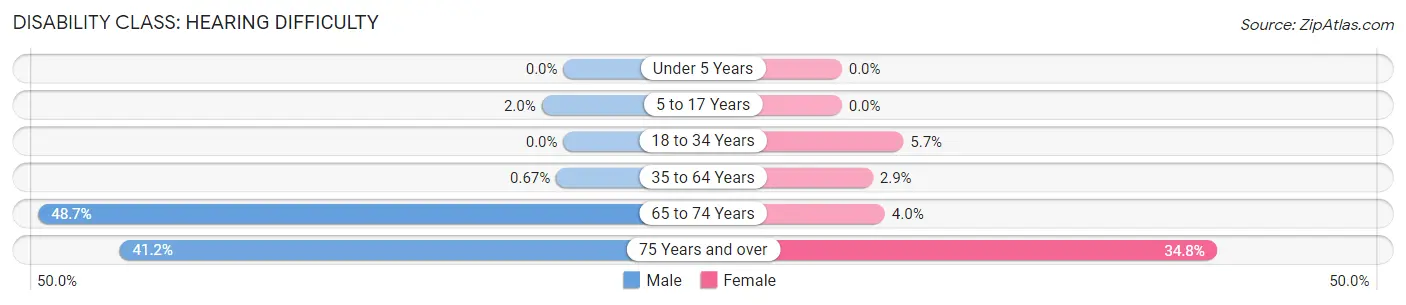
| Age Bracket | Male | Female |
| Under 5 Years | 0 (0.0%) | 0 (0.0%) |
| 5 to 17 Years | 2 (2.0%) | 0 (0.0%) |
| 18 to 34 Years | 0 (0.0%) | 4 (5.7%) |
| 35 to 64 Years | 1 (0.7%) | 4 (2.9%) |
| 65 to 74 Years | 19 (48.7%) | 1 (4.0%) |
| 75 Years and over | 7 (41.2%) | 8 (34.8%) |
Disability Class: Vision Difficulty
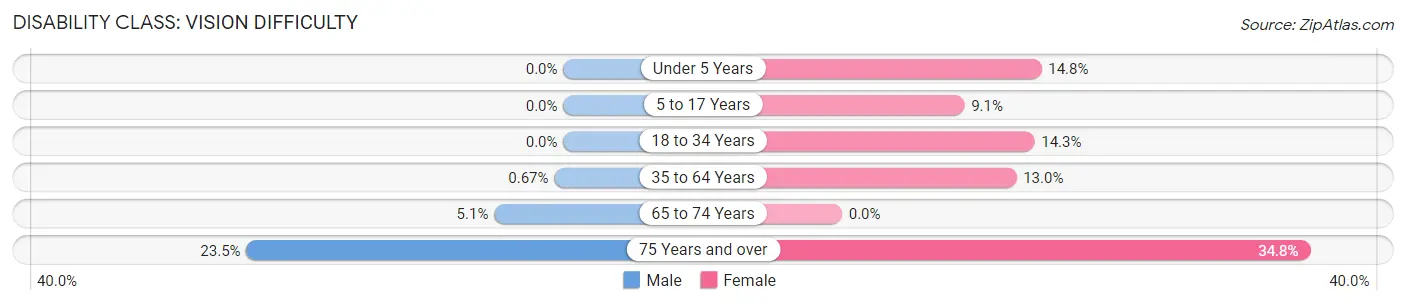
| Age Bracket | Male | Female |
| Under 5 Years | 0 (0.0%) | 4 (14.8%) |
| 5 to 17 Years | 0 (0.0%) | 4 (9.1%) |
| 18 to 34 Years | 0 (0.0%) | 10 (14.3%) |
| 35 to 64 Years | 1 (0.7%) | 18 (13.0%) |
| 65 to 74 Years | 2 (5.1%) | 0 (0.0%) |
| 75 Years and over | 4 (23.5%) | 8 (34.8%) |
Disability Class: Cognitive Difficulty
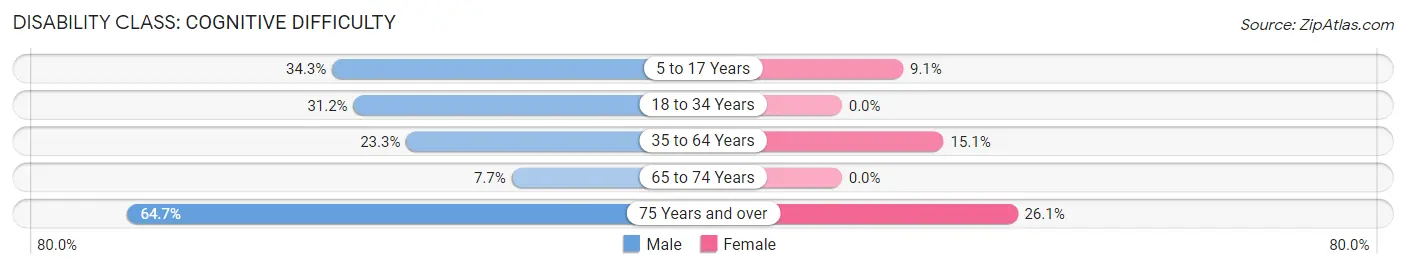
| Age Bracket | Male | Female |
| 5 to 17 Years | 34 (34.3%) | 4 (9.1%) |
| 18 to 34 Years | 24 (31.2%) | 0 (0.0%) |
| 35 to 64 Years | 35 (23.3%) | 21 (15.1%) |
| 65 to 74 Years | 3 (7.7%) | 0 (0.0%) |
| 75 Years and over | 11 (64.7%) | 6 (26.1%) |
Disability Class: Ambulatory Difficulty
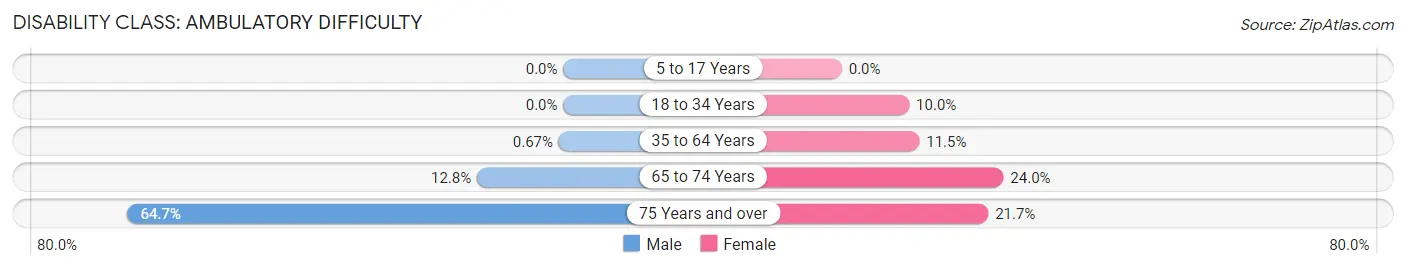
| Age Bracket | Male | Female |
| 5 to 17 Years | 0 (0.0%) | 0 (0.0%) |
| 18 to 34 Years | 0 (0.0%) | 7 (10.0%) |
| 35 to 64 Years | 1 (0.7%) | 16 (11.5%) |
| 65 to 74 Years | 5 (12.8%) | 6 (24.0%) |
| 75 Years and over | 11 (64.7%) | 5 (21.7%) |
Disability Class: Self-Care Difficulty
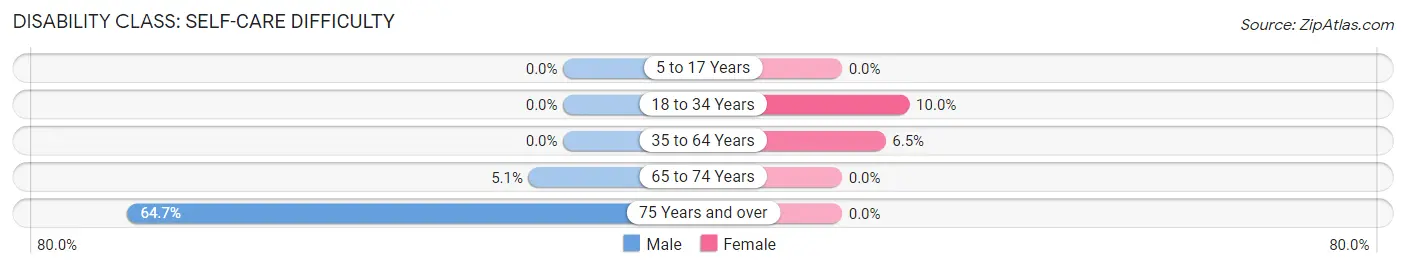
| Age Bracket | Male | Female |
| 5 to 17 Years | 0 (0.0%) | 0 (0.0%) |
| 18 to 34 Years | 0 (0.0%) | 7 (10.0%) |
| 35 to 64 Years | 0 (0.0%) | 9 (6.5%) |
| 65 to 74 Years | 2 (5.1%) | 0 (0.0%) |
| 75 Years and over | 11 (64.7%) | 0 (0.0%) |
Technology Access in Greenwood
Computing Device Access in Greenwood
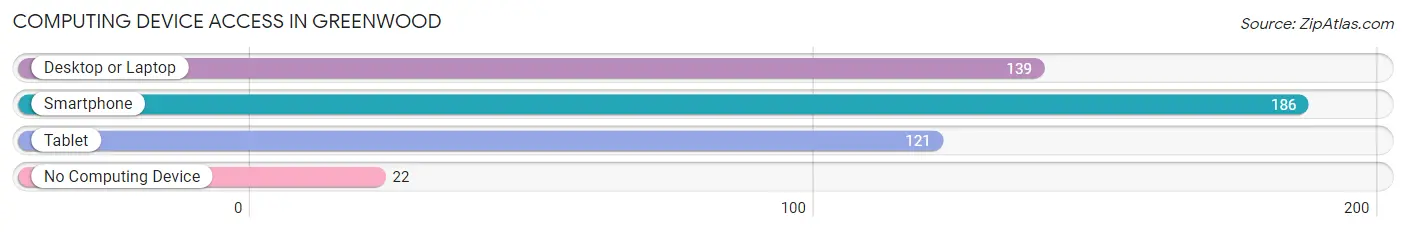
| Device Type | # Households | % Households |
| Desktop or Laptop | 139 | 65.6% |
| Smartphone | 186 | 87.7% |
| Tablet | 121 | 57.1% |
| No Computing Device | 22 | 10.4% |
| Total | 212 | 100.0% |
Internet Access in Greenwood
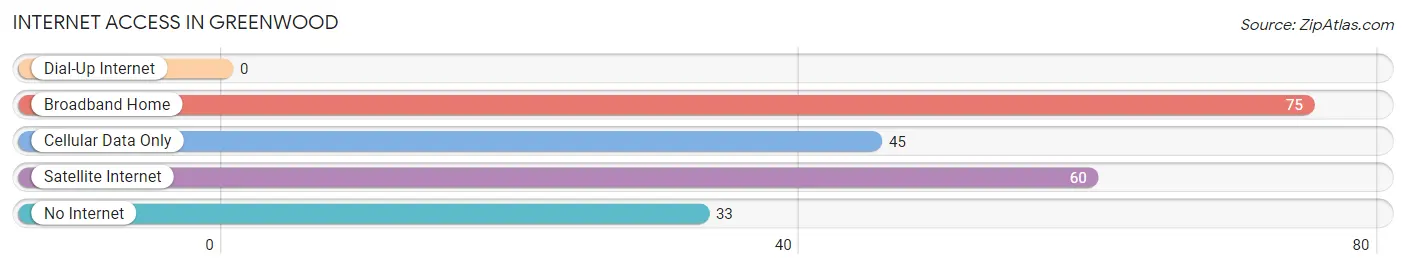
| Internet Type | # Households | % Households |
| Dial-Up Internet | 0 | 0.0% |
| Broadband Home | 75 | 35.4% |
| Cellular Data Only | 45 | 21.2% |
| Satellite Internet | 60 | 28.3% |
| No Internet | 33 | 15.6% |
| Total | 212 | 100.0% |
Greenwood Summary
Greenwood is a small town located in Jackson County, Florida. It is situated in the panhandle region of the state, approximately 20 miles east of Marianna. The town was founded in 1845 and was named after the Greenwood Plantation, which was owned by the prominent local family of the same name. The town has a population of approximately 1,000 people and is known for its rural charm and friendly atmosphere.
Geography
Greenwood is located in the panhandle region of Florida, approximately 20 miles east of Marianna. The town is situated on the banks of the Chipola River, which is a tributary of the Apalachicola River. The town is surrounded by rolling hills and lush forests, making it a popular destination for outdoor activities such as fishing, hunting, and camping. The town is also home to several small lakes, including Lake Greenwood, which is a popular spot for swimming and boating.
Economy
Greenwood’s economy is largely based on agriculture and forestry. The town is home to several large farms, which produce a variety of crops such as corn, soybeans, and cotton. The town is also home to several timber companies, which harvest the surrounding forests for lumber. In addition to agriculture and forestry, Greenwood is also home to several small businesses, including restaurants, retail stores, and service providers.
Demographics
As of the 2010 census, Greenwood had a population of 1,000 people. The town is predominantly white, with approximately 90% of the population identifying as such. The remaining 10% of the population is made up of African Americans, Hispanics, and other ethnicities. The median household income in Greenwood is $35,000, and the median age is 38 years old.
History
Greenwood was founded in 1845 by the prominent local family of the same name. The town was named after the Greenwood Plantation, which was owned by the family. The town quickly grew and became a popular destination for settlers, who were attracted to the area’s fertile soil and abundant natural resources. In the late 19th century, Greenwood became a hub for the timber industry, and the town’s population continued to grow. In the early 20th century, Greenwood was home to several large farms, which produced a variety of crops. The town’s economy has remained largely agricultural and forestry-based since then.
Conclusion
Greenwood is a small town located in Jackson County, Florida. It is situated in the panhandle region of the state, approximately 20 miles east of Marianna. The town was founded in 1845 and was named after the Greenwood Plantation, which was owned by the prominent local family of the same name. The town has a population of approximately 1,000 people and is known for its rural charm and friendly atmosphere. The town’s economy is largely based on agriculture and forestry, and the town is home to several large farms and timber companies. The town is predominantly white, with approximately 90% of the population identifying as such. The median household income in Greenwood is $35,000, and the median age is 38 years old.
Common Questions
What is Per Capita Income in Greenwood?
Per Capita income in Greenwood is $22,302.
What is the Median Family Income in Greenwood?
Median Family Income in Greenwood is $54,688.
What is the Median Household income in Greenwood?
Median Household Income in Greenwood is $56,250.
What is Income or Wage Gap in Greenwood?
Income or Wage Gap in Greenwood is 4.4%.
Women in Greenwood earn 95.6 cents for every dollar earned by a man.
What is Inequality or Gini Index in Greenwood?
Inequality or Gini Index in Greenwood is 0.35.
What is the Total Population of Greenwood?
Total Population of Greenwood is 713.
What is the Total Male Population of Greenwood?
Total Male Population of Greenwood is 385.
What is the Total Female Population of Greenwood?
Total Female Population of Greenwood is 328.
What is the Ratio of Males per 100 Females in Greenwood?
There are 117.38 Males per 100 Females in Greenwood.
What is the Ratio of Females per 100 Males in Greenwood?
There are 85.19 Females per 100 Males in Greenwood.
What is the Median Population Age in Greenwood?
Median Population Age in Greenwood is 39.6 Years.
What is the Average Family Size in Greenwood
Average Family Size in Greenwood is 3.8 People.
What is the Average Household Size in Greenwood
Average Household Size in Greenwood is 3.4 People.
How Large is the Labor Force in Greenwood?
There are 300 People in the Labor Forcein in Greenwood.
What is the Percentage of People in the Labor Force in Greenwood?
51.0% of People are in the Labor Force in Greenwood.
What is the Unemployment Rate in Greenwood?
Unemployment Rate in Greenwood is 1.0%.