Greensboro, FL Map & Demographics
Greensboro Map
Greensboro Overview
$15,493
PER CAPITA INCOME
$44,362
AVG FAMILY INCOME
$43,342
AVG HOUSEHOLD INCOME
20.6%
WAGE / INCOME GAP [ % ]
79.4¢/ $1
WAGE / INCOME GAP [ $ ]
0.35
INEQUALITY / GINI INDEX
762
TOTAL POPULATION
332
MALE POPULATION
430
FEMALE POPULATION
77.21
MALES / 100 FEMALES
129.52
FEMALES / 100 MALES
37.3
MEDIAN AGE
2.9
AVG FAMILY SIZE
2.6
AVG HOUSEHOLD SIZE
264
LABOR FORCE [ PEOPLE ]
46.8%
PERCENT IN LABOR FORCE
Greensboro Zip Codes
Greensboro Area Codes
Income in Greensboro
Income Overview in Greensboro
Per Capita Income in Greensboro is $15,493, while median incomes of families and households are $44,362 and $43,342 respectively.
| Characteristic | Number | Measure |
| Per Capita Income | 762 | $15,493 |
| Median Family Income | 239 | $44,362 |
| Mean Family Income | 239 | $49,374 |
| Median Household Income | 293 | $43,342 |
| Mean Household Income | 293 | $43,888 |
| Income Deficit | 239 | $0 |
| Wage / Income Gap (%) | 762 | 20.64% |
| Wage / Income Gap ($) | 762 | 79.36¢ per $1 |
| Gini / Inequality Index | 762 | 0.35 |
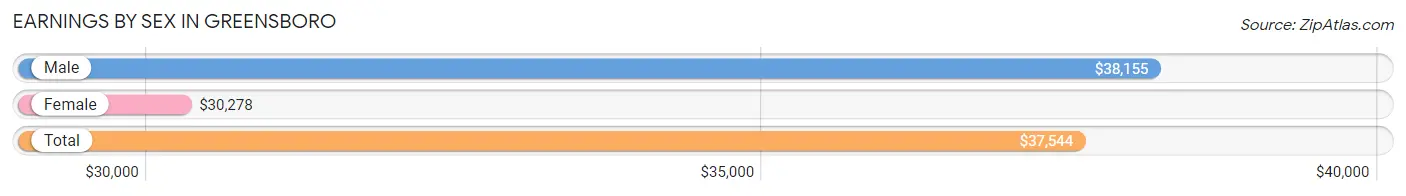
Earnings by Sex in Greensboro
Average Earnings in Greensboro are $37,544, $38,155 for men and $30,278 for women, a difference of 20.6%.
| Sex | Number | Average Earnings |
| Male | 145 (52.7%) | $38,155 |
| Female | 130 (47.3%) | $30,278 |
| Total | 275 (100.0%) | $37,544 |
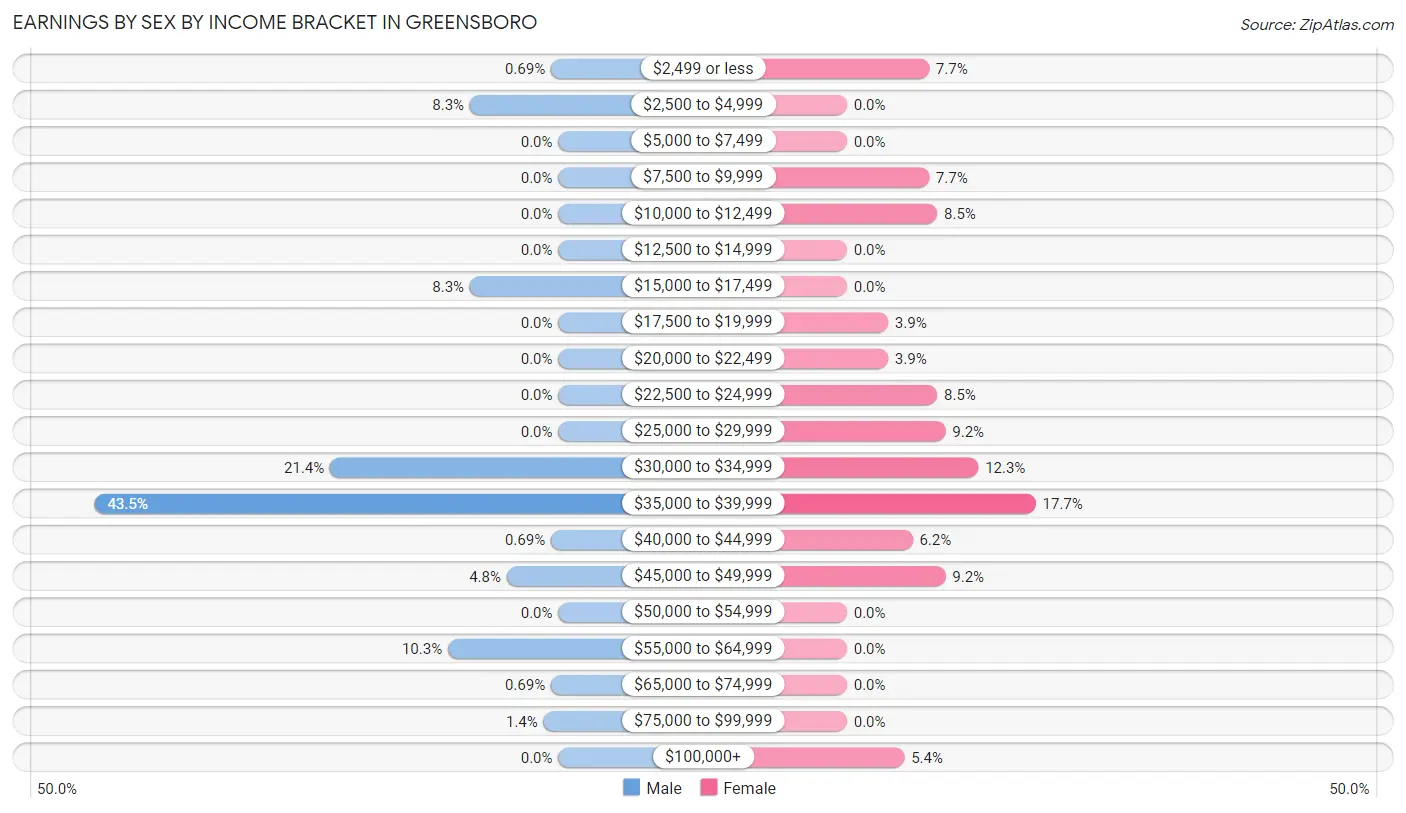
Earnings by Sex by Income Bracket in Greensboro
The most common earnings brackets in Greensboro are $35,000 to $39,999 for men (63 | 43.4%) and $35,000 to $39,999 for women (23 | 17.7%).
| Income | Male | Female |
| $2,499 or less | 1 (0.7%) | 10 (7.7%) |
| $2,500 to $4,999 | 12 (8.3%) | 0 (0.0%) |
| $5,000 to $7,499 | 0 (0.0%) | 0 (0.0%) |
| $7,500 to $9,999 | 0 (0.0%) | 10 (7.7%) |
| $10,000 to $12,499 | 0 (0.0%) | 11 (8.5%) |
| $12,500 to $14,999 | 0 (0.0%) | 0 (0.0%) |
| $15,000 to $17,499 | 12 (8.3%) | 0 (0.0%) |
| $17,500 to $19,999 | 0 (0.0%) | 5 (3.8%) |
| $20,000 to $22,499 | 0 (0.0%) | 5 (3.8%) |
| $22,500 to $24,999 | 0 (0.0%) | 11 (8.5%) |
| $25,000 to $29,999 | 0 (0.0%) | 12 (9.2%) |
| $30,000 to $34,999 | 31 (21.4%) | 16 (12.3%) |
| $35,000 to $39,999 | 63 (43.4%) | 23 (17.7%) |
| $40,000 to $44,999 | 1 (0.7%) | 8 (6.1%) |
| $45,000 to $49,999 | 7 (4.8%) | 12 (9.2%) |
| $50,000 to $54,999 | 0 (0.0%) | 0 (0.0%) |
| $55,000 to $64,999 | 15 (10.3%) | 0 (0.0%) |
| $65,000 to $74,999 | 1 (0.7%) | 0 (0.0%) |
| $75,000 to $99,999 | 2 (1.4%) | 0 (0.0%) |
| $100,000+ | 0 (0.0%) | 7 (5.4%) |
| Total | 145 (100.0%) | 130 (100.0%) |
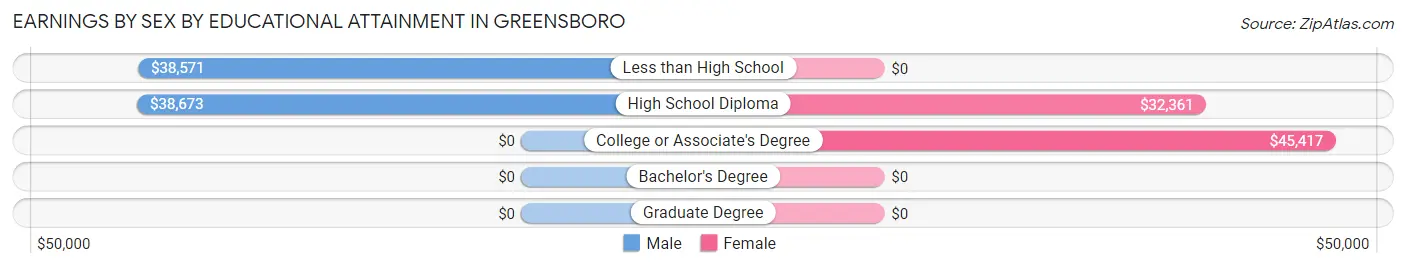
Earnings by Sex by Educational Attainment in Greensboro
Average earnings in Greensboro are $38,651 for men and $26,354 for women, a difference of 31.8%. Men with an educational attainment of high school diploma enjoy the highest average annual earnings of $38,673, while those with less than high school education earn the least with $38,571. Women with an educational attainment of college or associate's degree earn the most with the average annual earnings of $45,417, while those with high school diploma education have the smallest earnings of $32,361.
| Educational Attainment | Male Income | Female Income |
| Less than High School | $38,571 | $0 |
| High School Diploma | $38,673 | $32,361 |
| College or Associate's Degree | - | - |
| Bachelor's Degree | - | - |
| Graduate Degree | - | - |
| Total | $38,651 | $26,354 |
Family Income in Greensboro
Family Income Brackets in Greensboro
According to the Greensboro family income data, there are 90 families falling into the $35,000 to $49,999 income range, which is the most common income bracket and makes up 37.7% of all families.
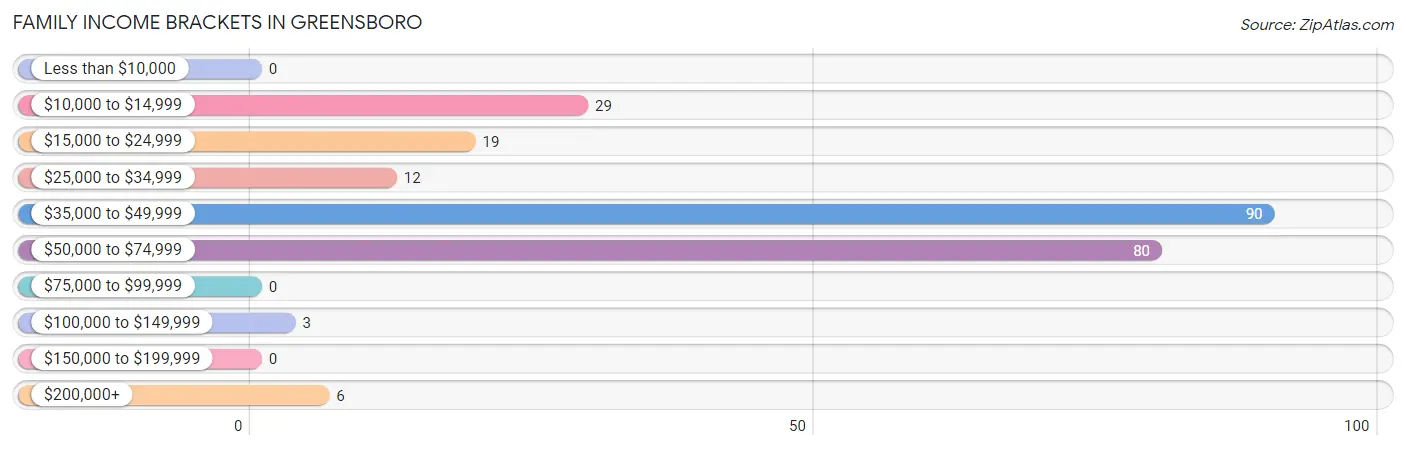
| Income Bracket | # Families | % Families |
| Less than $10,000 | 0 | 0.0% |
| $10,000 to $14,999 | 29 | 12.1% |
| $15,000 to $24,999 | 19 | 7.9% |
| $25,000 to $34,999 | 12 | 5.0% |
| $35,000 to $49,999 | 90 | 37.7% |
| $50,000 to $74,999 | 80 | 33.5% |
| $75,000 to $99,999 | 0 | 0.0% |
| $100,000 to $149,999 | 3 | 1.3% |
| $150,000 to $199,999 | 0 | 0.0% |
| $200,000+ | 6 | 2.5% |
Family Income by Famaliy Size in Greensboro
4-person families (50 | 20.9%) account for the highest median family income in Greensboro with $56,048 per family, while 2-person families (86 | 36.0%) have the highest median income of $19,239 per family member.
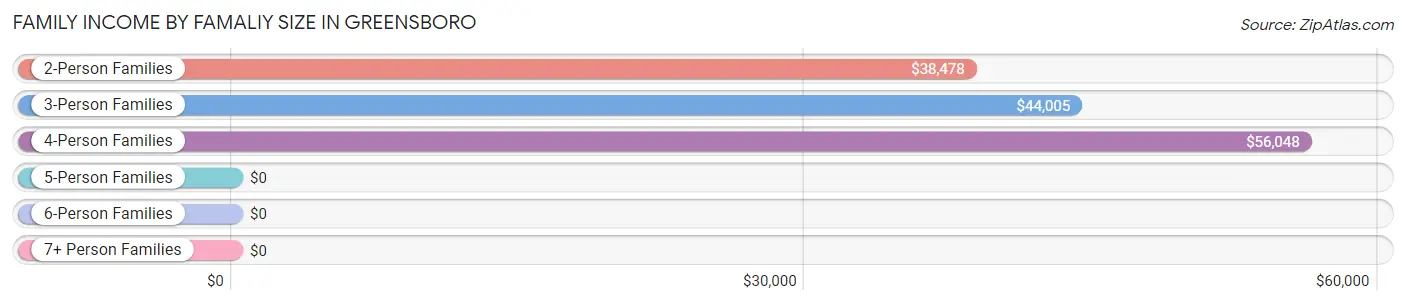
| Income Bracket | # Families | Median Income |
| 2-Person Families | 86 (36.0%) | $38,478 |
| 3-Person Families | 87 (36.4%) | $44,005 |
| 4-Person Families | 50 (20.9%) | $56,048 |
| 5-Person Families | 13 (5.4%) | $0 |
| 6-Person Families | 0 (0.0%) | $0 |
| 7+ Person Families | 3 (1.3%) | $0 |
| Total | 239 (100.0%) | $44,362 |
Family Income by Number of Earners in Greensboro
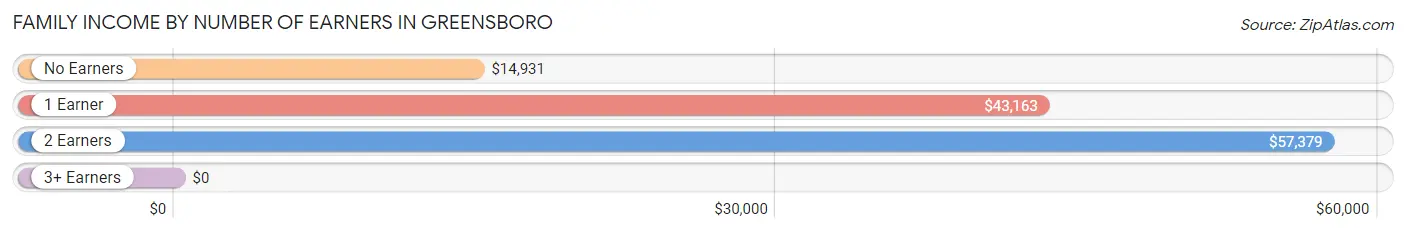
| Number of Earners | # Families | Median Income |
| No Earners | 35 (14.6%) | $14,931 |
| 1 Earner | 130 (54.4%) | $43,163 |
| 2 Earners | 67 (28.0%) | $57,379 |
| 3+ Earners | 7 (2.9%) | $0 |
| Total | 239 (100.0%) | $44,362 |
Household Income in Greensboro
Household Income Brackets in Greensboro
With 97 households falling in the category, the $35,000 to $49,999 income range is the most frequent in Greensboro, accounting for 33.1% of all households.
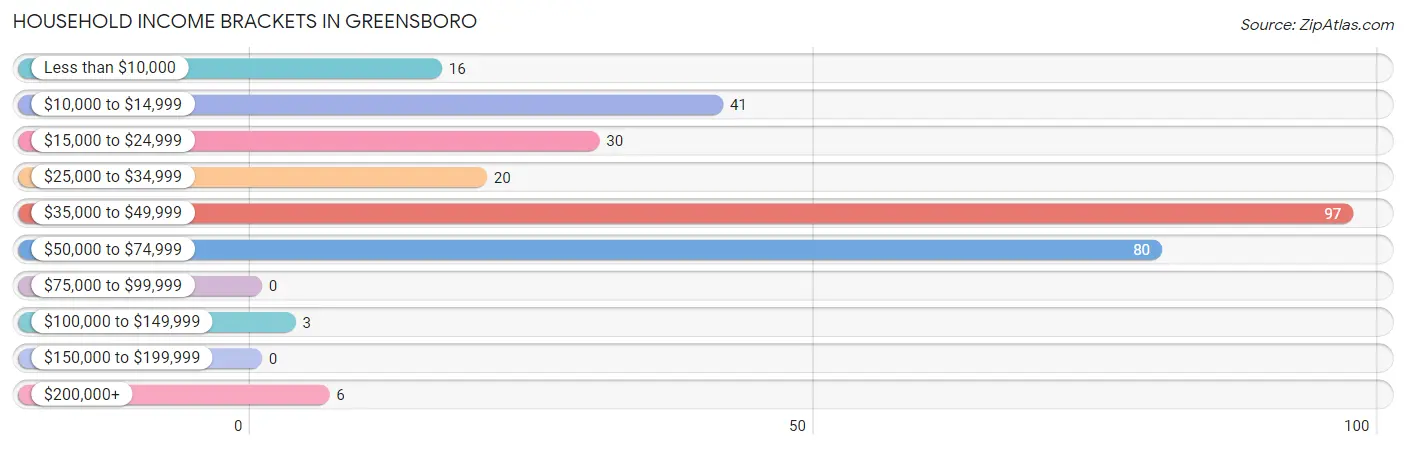
| Income Bracket | # Households | % Households |
| Less than $10,000 | 16 | 5.5% |
| $10,000 to $14,999 | 41 | 14.0% |
| $15,000 to $24,999 | 30 | 10.2% |
| $25,000 to $34,999 | 20 | 6.8% |
| $35,000 to $49,999 | 97 | 33.1% |
| $50,000 to $74,999 | 80 | 27.3% |
| $75,000 to $99,999 | 0 | 0.0% |
| $100,000 to $149,999 | 3 | 1.0% |
| $150,000 to $199,999 | 0 | 0.0% |
| $200,000+ | 6 | 2.0% |
Household Income by Householder Age in Greensboro
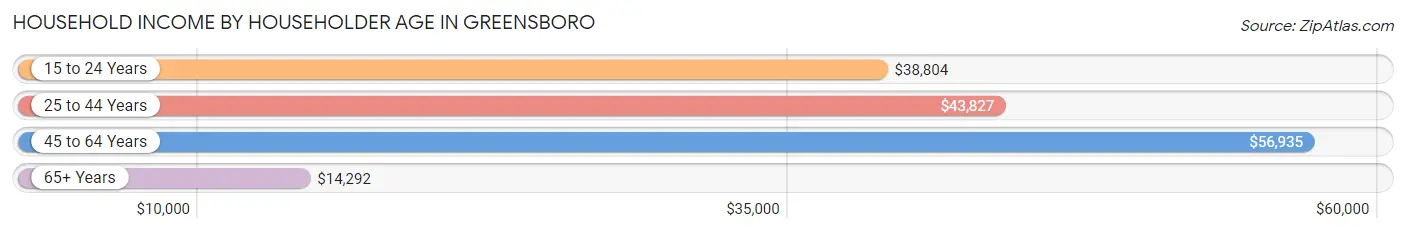
The median household income in Greensboro is $43,342, with the highest median household income of $56,935 found in the 45 to 64 years age bracket for the primary householder. A total of 96 households (32.8%) fall into this category. Meanwhile, the 65+ years age bracket for the primary householder has the lowest median household income of $14,292, with 59 households (20.1%) in this group.
| Income Bracket | # Households | Median Income |
| 15 to 24 Years | 26 (8.9%) | $38,804 |
| 25 to 44 Years | 112 (38.2%) | $43,827 |
| 45 to 64 Years | 96 (32.8%) | $56,935 |
| 65+ Years | 59 (20.1%) | $14,292 |
| Total | 293 (100.0%) | $43,342 |
Poverty in Greensboro
Income Below Poverty by Sex and Age in Greensboro
With 20.8% poverty level for males and 30.7% for females among the residents of Greensboro, 16 and 17 year old males and under 5 year old females are the most vulnerable to poverty, with 1 males (100.0%) and 4 females (100.0%) in their respective age groups living below the poverty level.
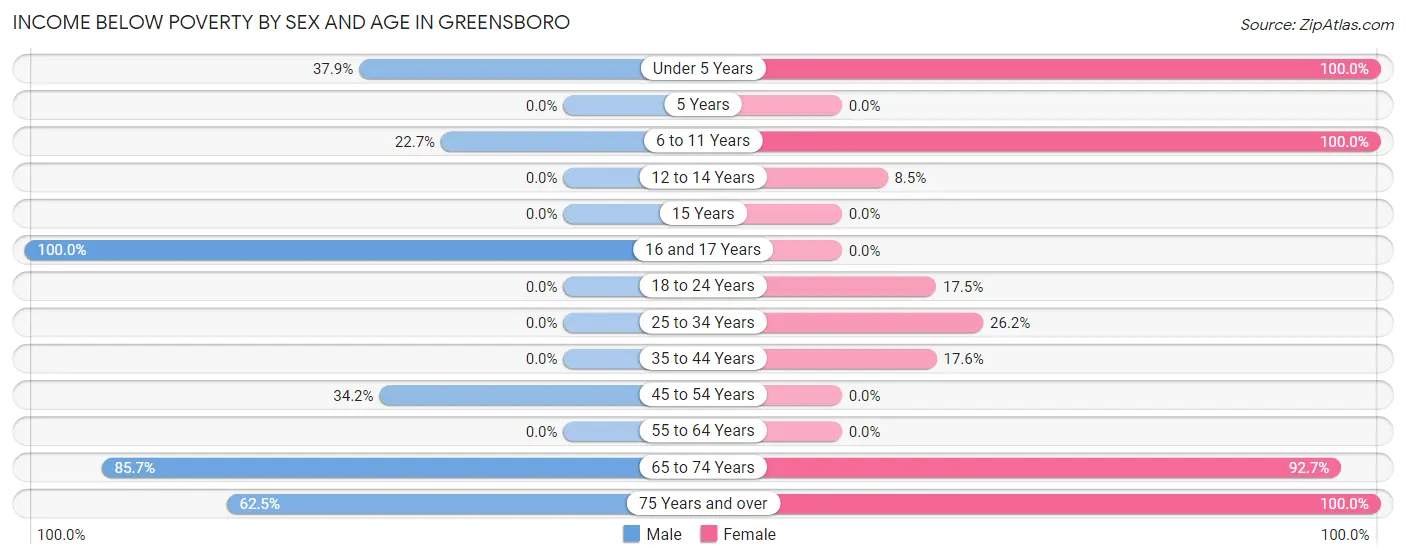
| Age Bracket | Male | Female |
| Under 5 Years | 11 (37.9%) | 4 (100.0%) |
| 5 Years | 0 (0.0%) | 0 (0.0%) |
| 6 to 11 Years | 15 (22.7%) | 29 (100.0%) |
| 12 to 14 Years | 0 (0.0%) | 5 (8.5%) |
| 15 Years | 0 (0.0%) | 0 (0.0%) |
| 16 and 17 Years | 1 (100.0%) | 0 (0.0%) |
| 18 to 24 Years | 0 (0.0%) | 7 (17.5%) |
| 25 to 34 Years | 0 (0.0%) | 16 (26.2%) |
| 35 to 44 Years | 0 (0.0%) | 19 (17.6%) |
| 45 to 54 Years | 14 (34.2%) | 0 (0.0%) |
| 55 to 64 Years | 0 (0.0%) | 0 (0.0%) |
| 65 to 74 Years | 18 (85.7%) | 38 (92.7%) |
| 75 Years and over | 10 (62.5%) | 14 (100.0%) |
| Total | 69 (20.8%) | 132 (30.7%) |
Income Above Poverty by Sex and Age in Greensboro
According to the poverty statistics in Greensboro, males aged 15 years and females aged 15 years are the age groups that are most secure financially, with 100.0% of males and 100.0% of females in these age groups living above the poverty line.
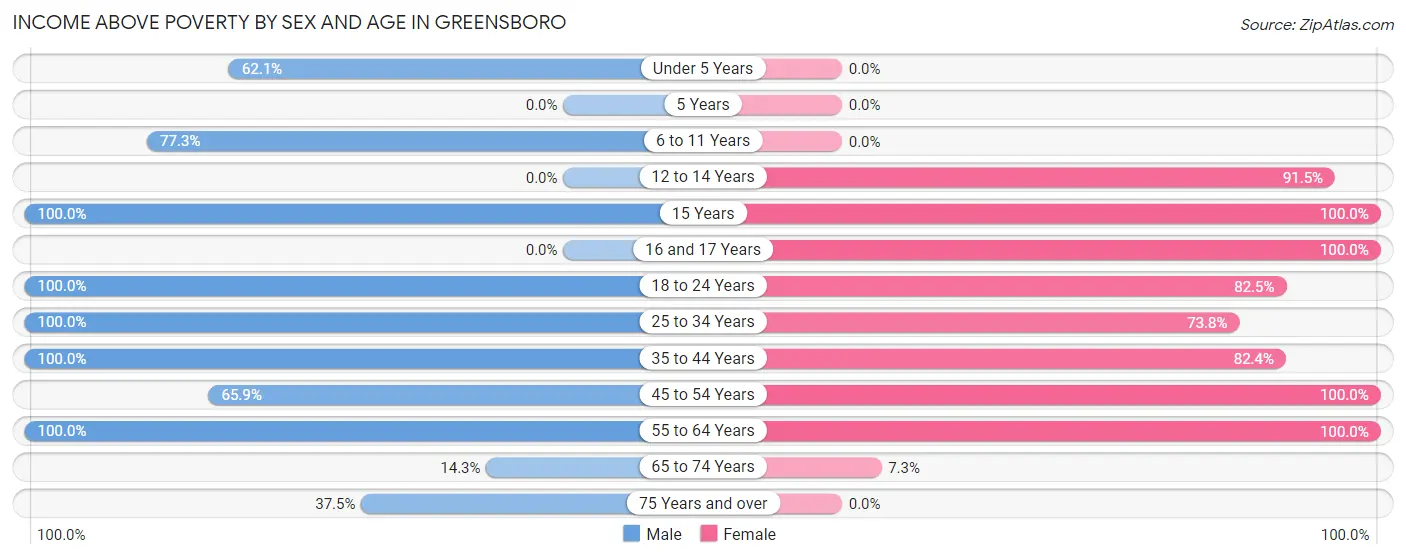
| Age Bracket | Male | Female |
| Under 5 Years | 18 (62.1%) | 0 (0.0%) |
| 5 Years | 0 (0.0%) | 0 (0.0%) |
| 6 to 11 Years | 51 (77.3%) | 0 (0.0%) |
| 12 to 14 Years | 0 (0.0%) | 54 (91.5%) |
| 15 Years | 2 (100.0%) | 9 (100.0%) |
| 16 and 17 Years | 0 (0.0%) | 22 (100.0%) |
| 18 to 24 Years | 24 (100.0%) | 33 (82.5%) |
| 25 to 34 Years | 11 (100.0%) | 45 (73.8%) |
| 35 to 44 Years | 73 (100.0%) | 89 (82.4%) |
| 45 to 54 Years | 27 (65.8%) | 24 (100.0%) |
| 55 to 64 Years | 48 (100.0%) | 19 (100.0%) |
| 65 to 74 Years | 3 (14.3%) | 3 (7.3%) |
| 75 Years and over | 6 (37.5%) | 0 (0.0%) |
| Total | 263 (79.2%) | 298 (69.3%) |
Income Below Poverty Among Married-Couple Families in Greensboro
The poverty statistics for married-couple families in Greensboro show that 15.8% or 25 of the total 158 families live below the poverty line. Families with 5 or more children have the highest poverty rate of 100.0%, comprising of 3 families. On the other hand, families with 1 or 2 children have the lowest poverty rate of 0.0%, which includes 0 families.
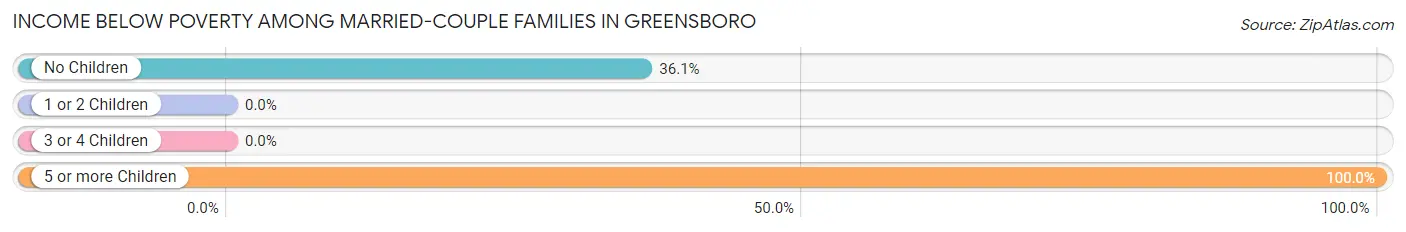
| Children | Above Poverty | Below Poverty |
| No Children | 39 (63.9%) | 22 (36.1%) |
| 1 or 2 Children | 94 (100.0%) | 0 (0.0%) |
| 3 or 4 Children | 0 (0.0%) | 0 (0.0%) |
| 5 or more Children | 0 (0.0%) | 3 (100.0%) |
| Total | 133 (84.2%) | 25 (15.8%) |
Income Below Poverty Among Single-Parent Households in Greensboro
According to the poverty data in Greensboro, 33.3% or 1 single-father households and 32.1% or 25 single-mother households are living below the poverty line. Among single-father households, those with 1 or 2 children have the highest poverty rate, with 1 households (33.3%) experiencing poverty. Likewise, among single-mother households, those with 3 or 4 children have the highest poverty rate, with 11 households (100.0%) falling below the poverty line.
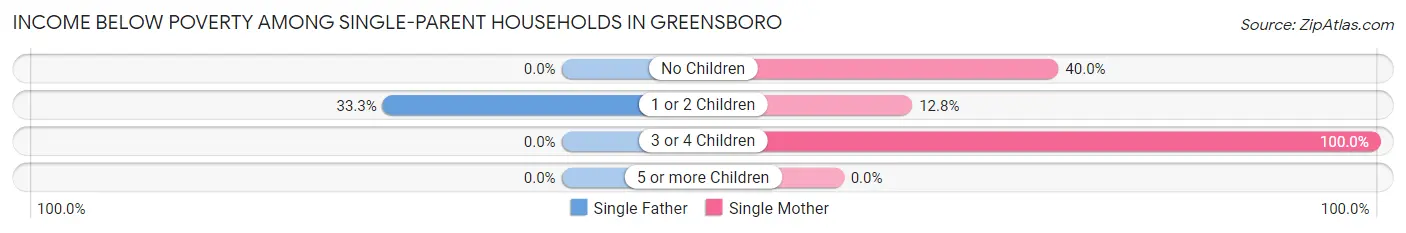
| Children | Single Father | Single Mother |
| No Children | 0 (0.0%) | 8 (40.0%) |
| 1 or 2 Children | 1 (33.3%) | 6 (12.8%) |
| 3 or 4 Children | 0 (0.0%) | 11 (100.0%) |
| 5 or more Children | 0 (0.0%) | 0 (0.0%) |
| Total | 1 (33.3%) | 25 (32.1%) |
Income Below Poverty Among Married-Couple vs Single-Parent Households in Greensboro
The poverty data for Greensboro shows that 25 of the married-couple family households (15.8%) and 26 of the single-parent households (32.1%) are living below the poverty level. Within the married-couple family households, those with 5 or more children have the highest poverty rate, with 3 households (100.0%) falling below the poverty line. Among the single-parent households, those with 3 or 4 children have the highest poverty rate, with 11 household (100.0%) living below poverty.
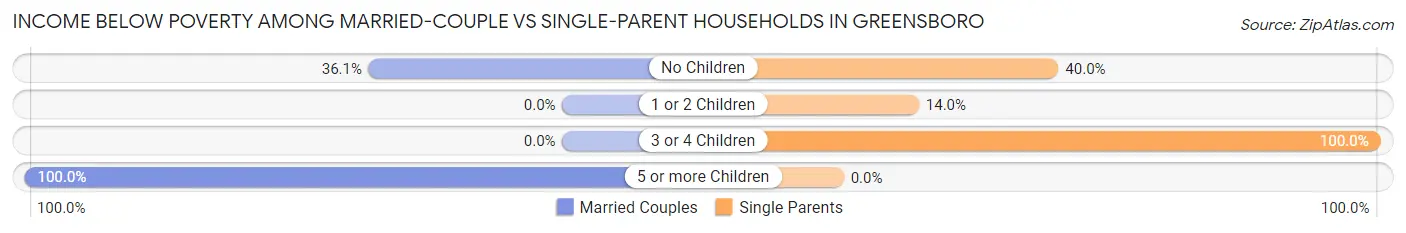
| Children | Married-Couple Families | Single-Parent Households |
| No Children | 22 (36.1%) | 8 (40.0%) |
| 1 or 2 Children | 0 (0.0%) | 7 (14.0%) |
| 3 or 4 Children | 0 (0.0%) | 11 (100.0%) |
| 5 or more Children | 3 (100.0%) | 0 (0.0%) |
| Total | 25 (15.8%) | 26 (32.1%) |
Race in Greensboro
The most populous races in Greensboro are Hispanic or Latino (419 | 55.0%), Two or more Races (270 | 35.4%), and White / Caucasian (269 | 35.3%).
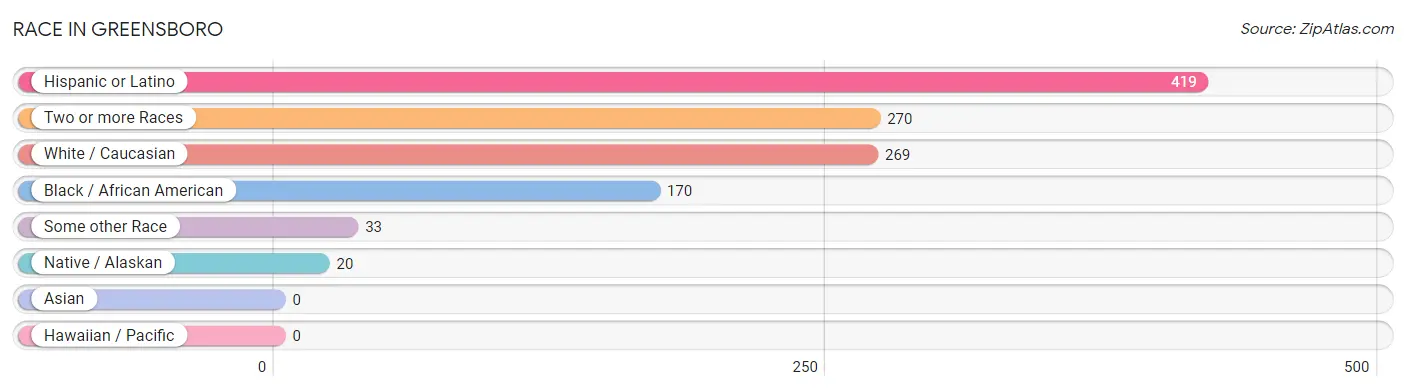
| Race | # Population | % Population |
| Asian | 0 | 0.0% |
| Black / African American | 170 | 22.3% |
| Hawaiian / Pacific | 0 | 0.0% |
| Hispanic or Latino | 419 | 55.0% |
| Native / Alaskan | 20 | 2.6% |
| White / Caucasian | 269 | 35.3% |
| Two or more Races | 270 | 35.4% |
| Some other Race | 33 | 4.3% |
| Total | 762 | 100.0% |
Ancestry in Greensboro
The most populous ancestries reported in Greensboro are Mexican (210 | 27.6%), Central American (159 | 20.9%), Guatemalan (92 | 12.1%), Irish (76 | 10.0%), and Salvadoran (67 | 8.8%), together accounting for 79.3% of all Greensboro residents.
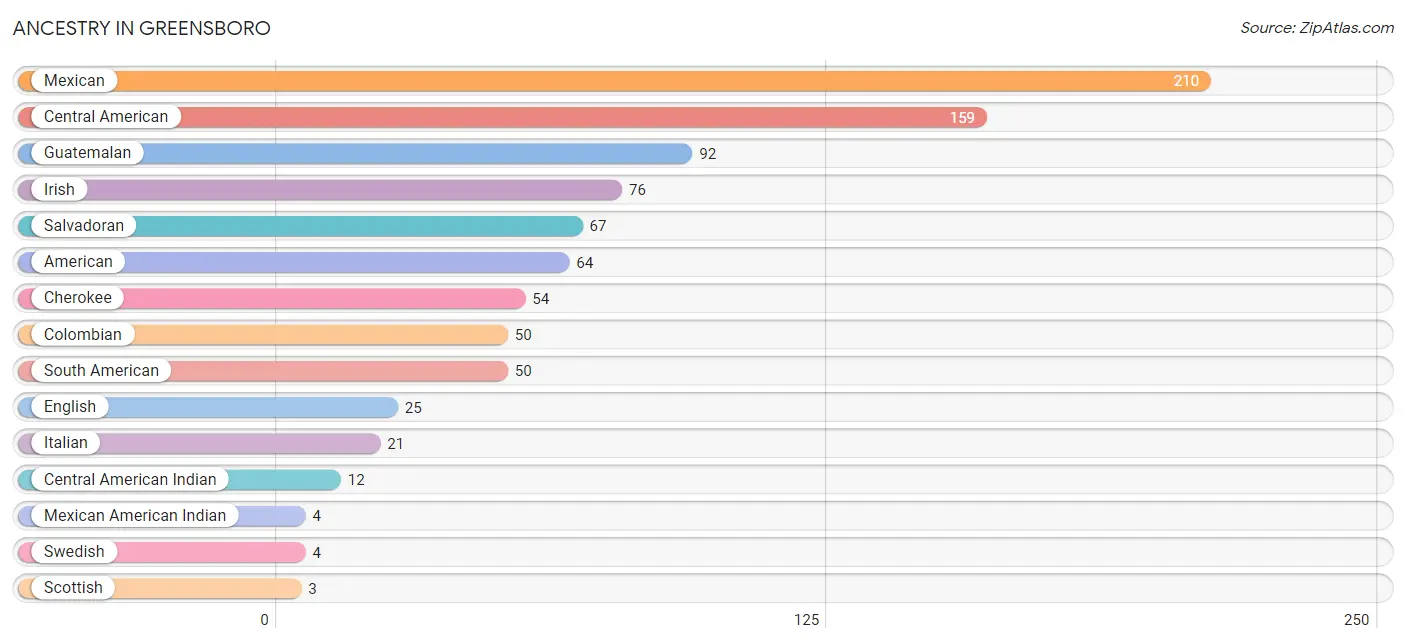
| Ancestry | # Population | % Population |
| American | 64 | 8.4% |
| Central American | 159 | 20.9% |
| Central American Indian | 12 | 1.6% |
| Cherokee | 54 | 7.1% |
| Colombian | 50 | 6.6% |
| English | 25 | 3.3% |
| Guatemalan | 92 | 12.1% |
| Irish | 76 | 10.0% |
| Italian | 21 | 2.8% |
| Mexican | 210 | 27.6% |
| Mexican American Indian | 4 | 0.5% |
| Salvadoran | 67 | 8.8% |
| Scottish | 3 | 0.4% |
| South American | 50 | 6.6% |
| Swedish | 4 | 0.5% | View All 15 Rows |
Immigrants in Greensboro
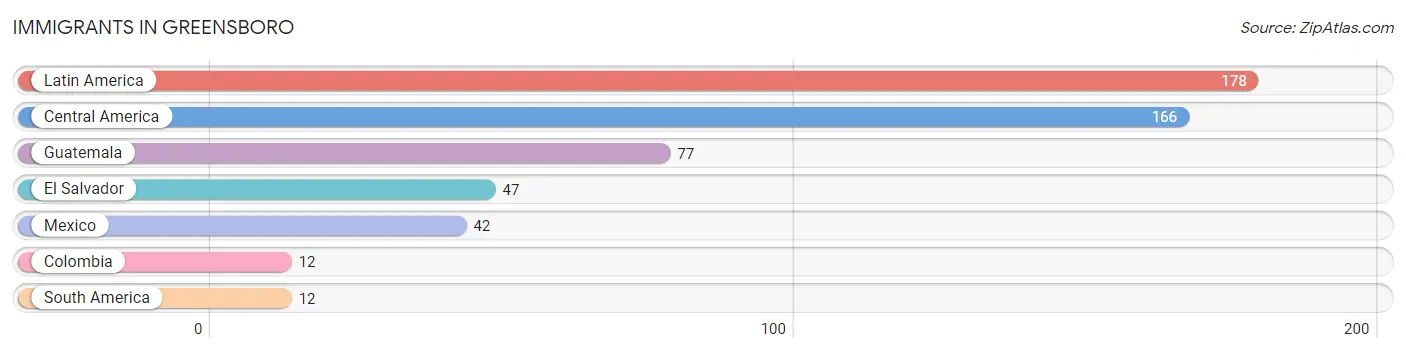
The most numerous immigrant groups reported in Greensboro came from Latin America (178 | 23.4%), Central America (166 | 21.8%), Guatemala (77 | 10.1%), El Salvador (47 | 6.2%), and Mexico (42 | 5.5%), together accounting for 66.9% of all Greensboro residents.
| Immigration Origin | # Population | % Population |
| Central America | 166 | 21.8% |
| Colombia | 12 | 1.6% |
| El Salvador | 47 | 6.2% |
| Guatemala | 77 | 10.1% |
| Latin America | 178 | 23.4% |
| Mexico | 42 | 5.5% |
| South America | 12 | 1.6% | View All 7 Rows |
Sex and Age in Greensboro
Sex and Age in Greensboro
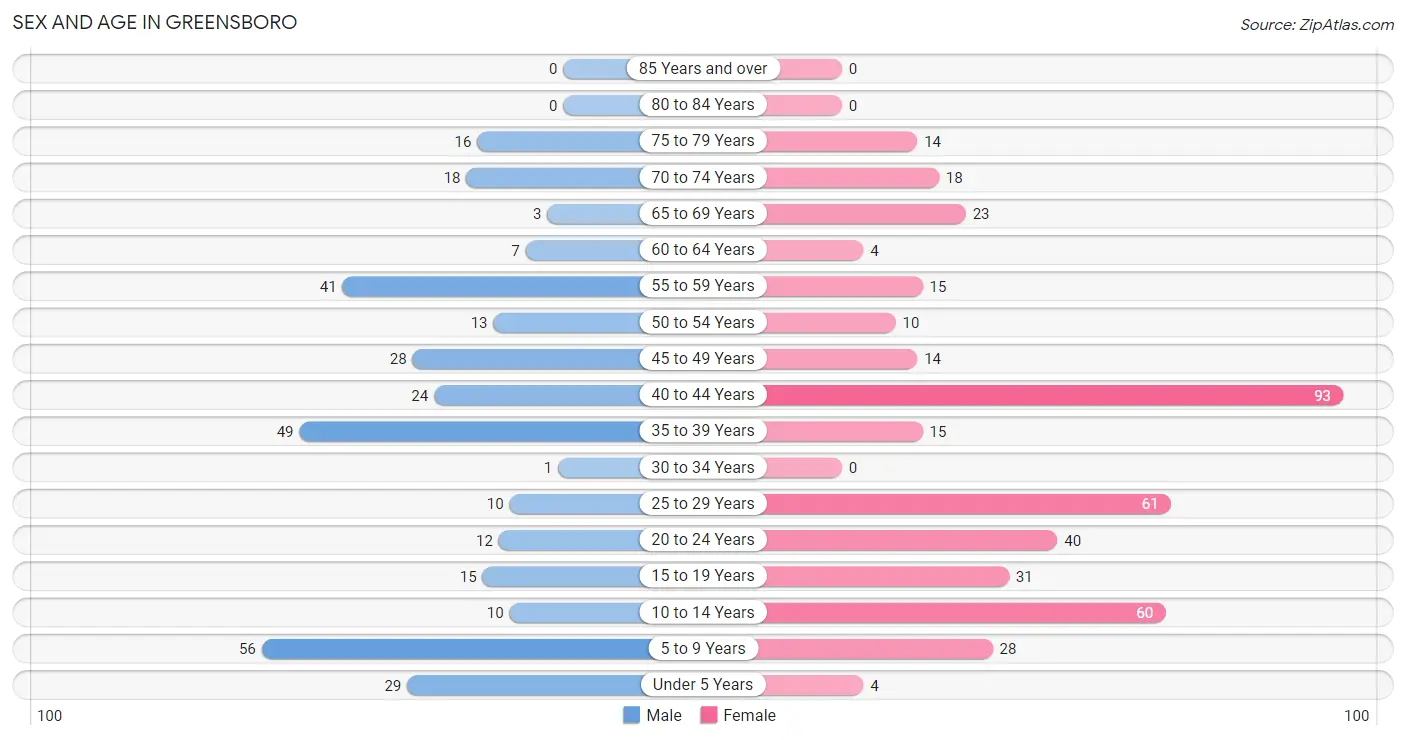
The most populous age groups in Greensboro are 5 to 9 Years (56 | 16.9%) for men and 40 to 44 Years (93 | 21.6%) for women.
| Age Bracket | Male | Female |
| Under 5 Years | 29 (8.7%) | 4 (0.9%) |
| 5 to 9 Years | 56 (16.9%) | 28 (6.5%) |
| 10 to 14 Years | 10 (3.0%) | 60 (14.0%) |
| 15 to 19 Years | 15 (4.5%) | 31 (7.2%) |
| 20 to 24 Years | 12 (3.6%) | 40 (9.3%) |
| 25 to 29 Years | 10 (3.0%) | 61 (14.2%) |
| 30 to 34 Years | 1 (0.3%) | 0 (0.0%) |
| 35 to 39 Years | 49 (14.8%) | 15 (3.5%) |
| 40 to 44 Years | 24 (7.2%) | 93 (21.6%) |
| 45 to 49 Years | 28 (8.4%) | 14 (3.3%) |
| 50 to 54 Years | 13 (3.9%) | 10 (2.3%) |
| 55 to 59 Years | 41 (12.3%) | 15 (3.5%) |
| 60 to 64 Years | 7 (2.1%) | 4 (0.9%) |
| 65 to 69 Years | 3 (0.9%) | 23 (5.3%) |
| 70 to 74 Years | 18 (5.4%) | 18 (4.2%) |
| 75 to 79 Years | 16 (4.8%) | 14 (3.3%) |
| 80 to 84 Years | 0 (0.0%) | 0 (0.0%) |
| 85 Years and over | 0 (0.0%) | 0 (0.0%) |
| Total | 332 (100.0%) | 430 (100.0%) |
Families and Households in Greensboro
Median Family Size in Greensboro
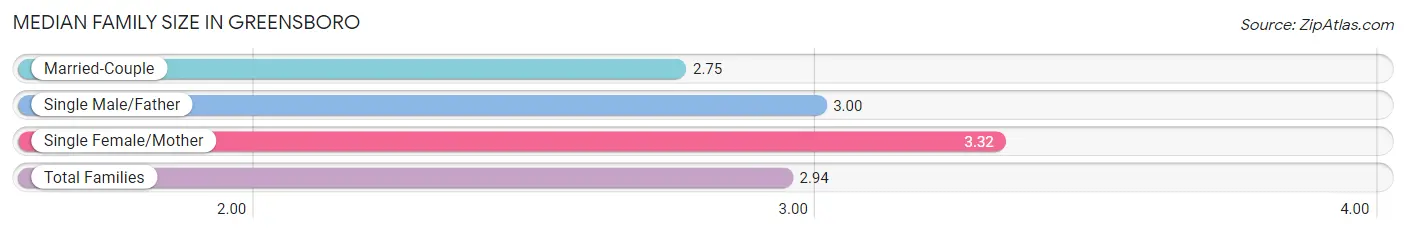
The median family size in Greensboro is 2.94 persons per family, with single female/mother families (78 | 32.6%) accounting for the largest median family size of 3.32 persons per family. On the other hand, married-couple families (158 | 66.1%) represent the smallest median family size with 2.75 persons per family.
| Family Type | # Families | Family Size |
| Married-Couple | 158 (66.1%) | 2.75 |
| Single Male/Father | 3 (1.3%) | 3.00 |
| Single Female/Mother | 78 (32.6%) | 3.32 |
| Total Families | 239 (100.0%) | 2.94 |
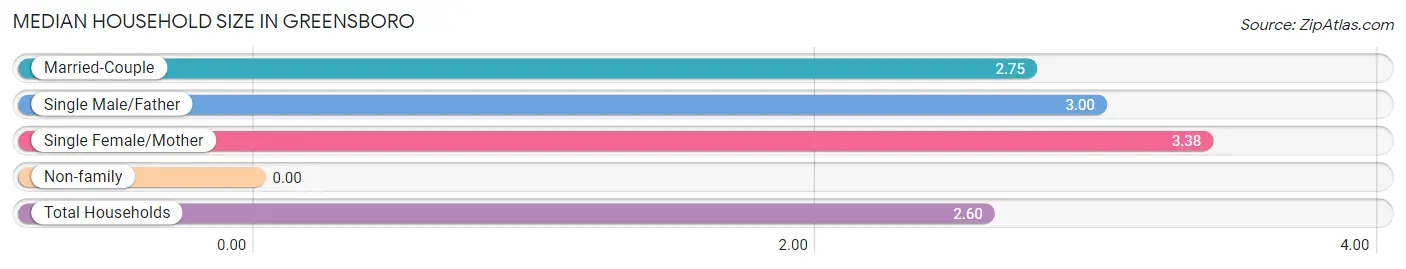
Median Household Size in Greensboro
| Household Type | # Households | Household Size |
| Married-Couple | 158 (53.9%) | 2.75 |
| Single Male/Father | 3 (1.0%) | 3.00 |
| Single Female/Mother | 78 (26.6%) | 3.38 |
| Non-family | 54 (18.4%) | - |
| Total Households | 293 (100.0%) | 2.60 |
Household Size by Marriage Status in Greensboro
Out of a total of 293 households in Greensboro, 239 (81.6%) are family households, while 54 (18.4%) are nonfamily households. The most numerous type of family households are 3-person households, comprising 87, and the most common type of nonfamily households are 1-person households, comprising 54.
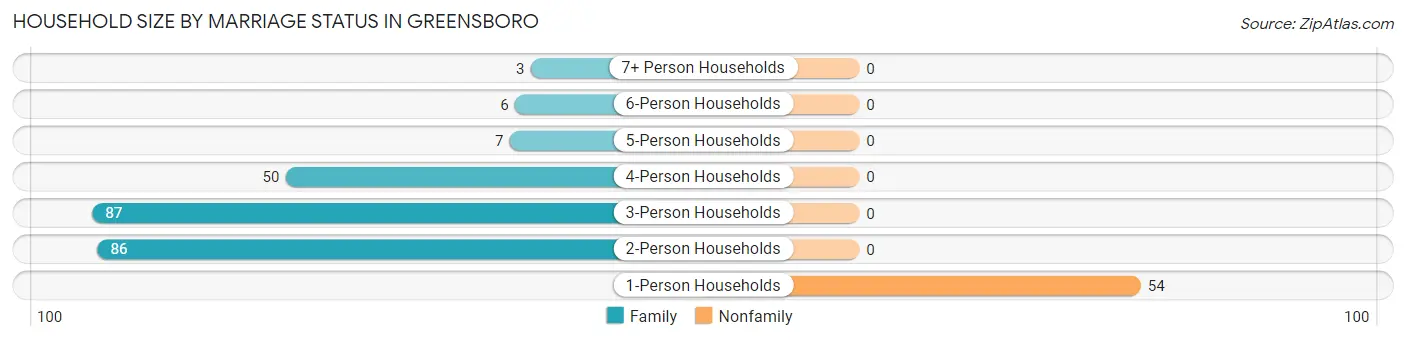
| Household Size | Family Households | Nonfamily Households |
| 1-Person Households | - | 54 (18.4%) |
| 2-Person Households | 86 (29.3%) | 0 (0.0%) |
| 3-Person Households | 87 (29.7%) | 0 (0.0%) |
| 4-Person Households | 50 (17.1%) | 0 (0.0%) |
| 5-Person Households | 7 (2.4%) | 0 (0.0%) |
| 6-Person Households | 6 (2.1%) | 0 (0.0%) |
| 7+ Person Households | 3 (1.0%) | 0 (0.0%) |
| Total | 239 (81.6%) | 54 (18.4%) |
Female Fertility in Greensboro
Fertility by Age in Greensboro
Average fertility rate in Greensboro is 20.0 births per 1,000 women. Women in the age bracket of 20 to 34 years have the highest fertility rate with 50.0 births per 1,000 women. Women in the age bracket of 20 to 34 years acount for 100.0% of all women with births.
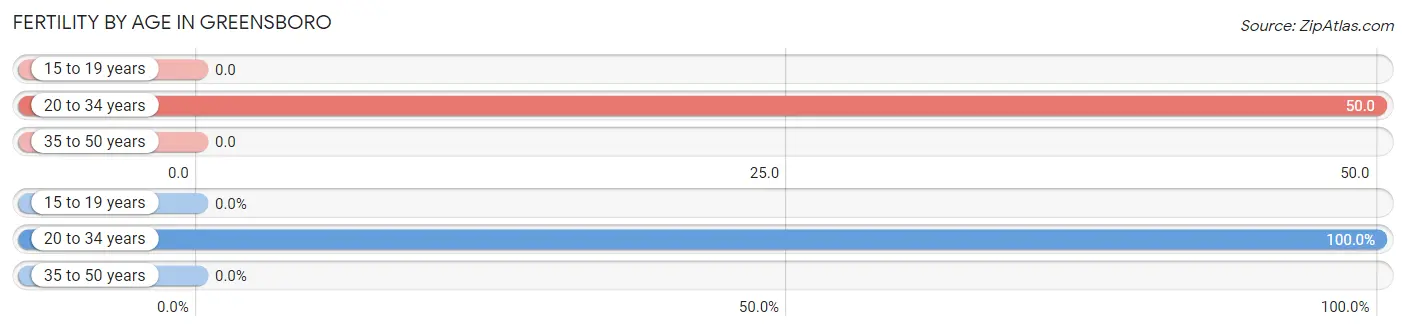
| Age Bracket | Women with Births | Births / 1,000 Women |
| 15 to 19 years | 0 (0.0%) | 0.0 |
| 20 to 34 years | 5 (100.0%) | 50.0 |
| 35 to 50 years | 0 (0.0%) | 0.0 |
| Total | 5 (100.0%) | 20.0 |
Fertility by Age by Marriage Status in Greensboro
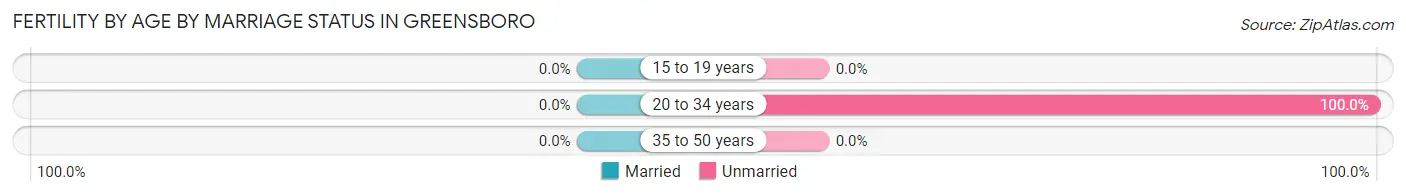
| Age Bracket | Married | Unmarried |
| 15 to 19 years | 0 (0.0%) | 0 (0.0%) |
| 20 to 34 years | 0 (0.0%) | 5 (100.0%) |
| 35 to 50 years | 0 (0.0%) | 0 (0.0%) |
| Total | 0 (0.0%) | 5 (100.0%) |
Fertility by Education in Greensboro
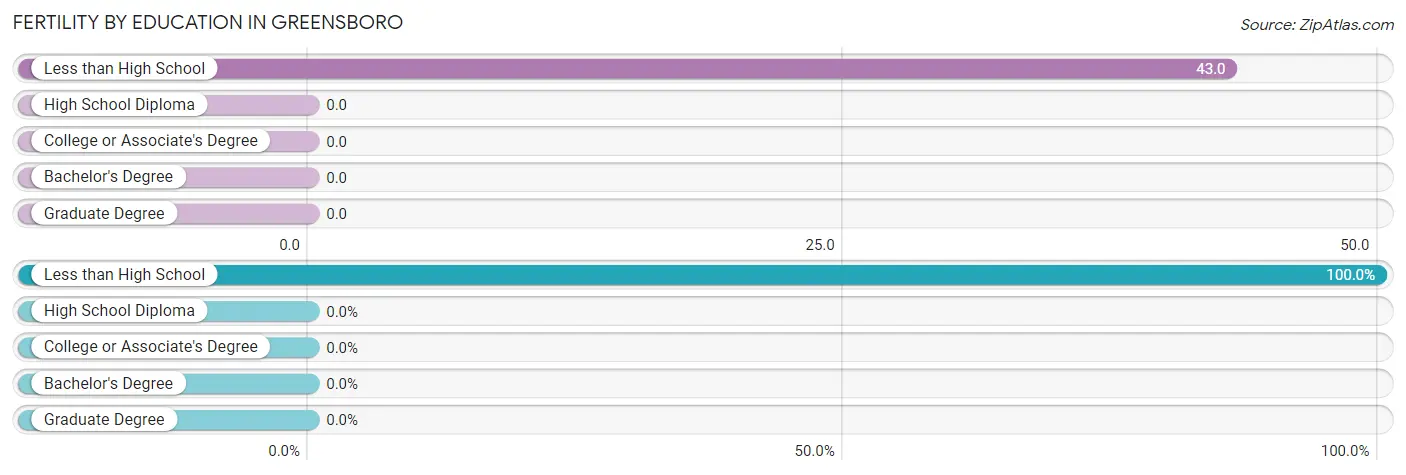
| Educational Attainment | Women with Births | Births / 1,000 Women |
| Less than High School | 5 (100.0%) | 43.0 |
| High School Diploma | 0 (0.0%) | 0.0 |
| College or Associate's Degree | 0 (0.0%) | 0.0 |
| Bachelor's Degree | 0 (0.0%) | 0.0 |
| Graduate Degree | 0 (0.0%) | 0.0 |
| Total | 5 (100.0%) | 20.0 |
Fertility by Education by Marriage Status in Greensboro
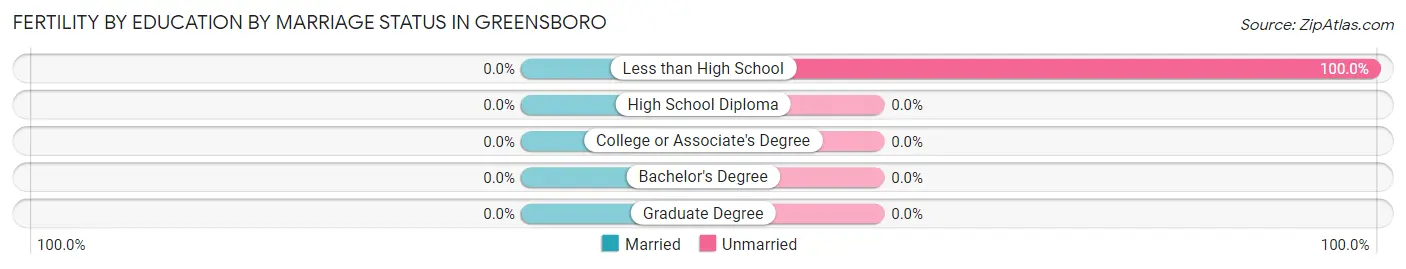
| Educational Attainment | Married | Unmarried |
| Less than High School | 0 (0.0%) | 5 (100.0%) |
| High School Diploma | 0 (0.0%) | 0 (0.0%) |
| College or Associate's Degree | 0 (0.0%) | 0 (0.0%) |
| Bachelor's Degree | 0 (0.0%) | 0 (0.0%) |
| Graduate Degree | 0 (0.0%) | 0 (0.0%) |
| Total | 0 (0.0%) | 5 (100.0%) |
Employment Characteristics in Greensboro
Employment by Class of Employer in Greensboro
Among the 264 employed individuals in Greensboro, private company employees (186 | 70.5%), local government employees (43 | 16.3%), and state government employees (23 | 8.7%) make up the most common classes of employment.
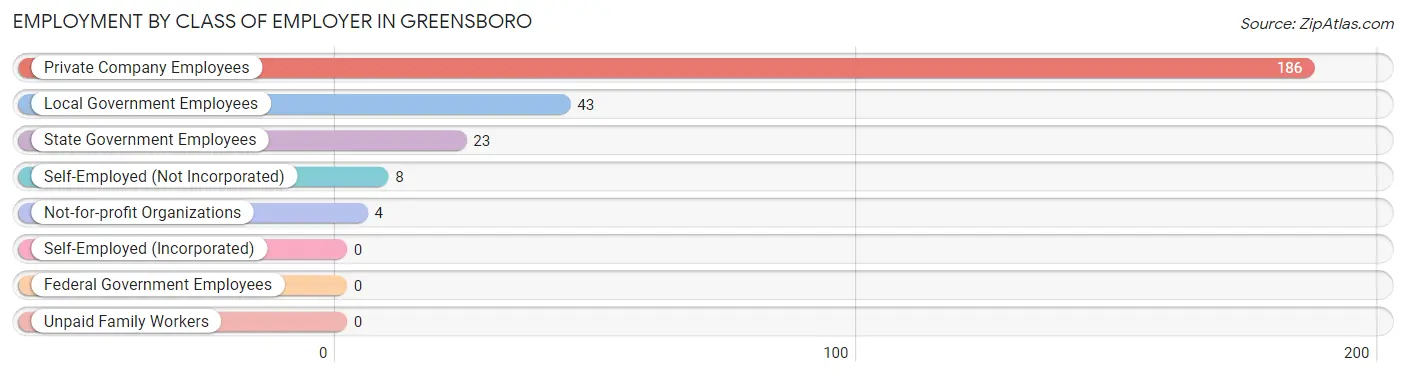
| Employer Class | # Employees | % Employees |
| Private Company Employees | 186 | 70.5% |
| Self-Employed (Incorporated) | 0 | 0.0% |
| Self-Employed (Not Incorporated) | 8 | 3.0% |
| Not-for-profit Organizations | 4 | 1.5% |
| Local Government Employees | 43 | 16.3% |
| State Government Employees | 23 | 8.7% |
| Federal Government Employees | 0 | 0.0% |
| Unpaid Family Workers | 0 | 0.0% |
| Total | 264 | 100.0% |
Employment Status by Age in Greensboro
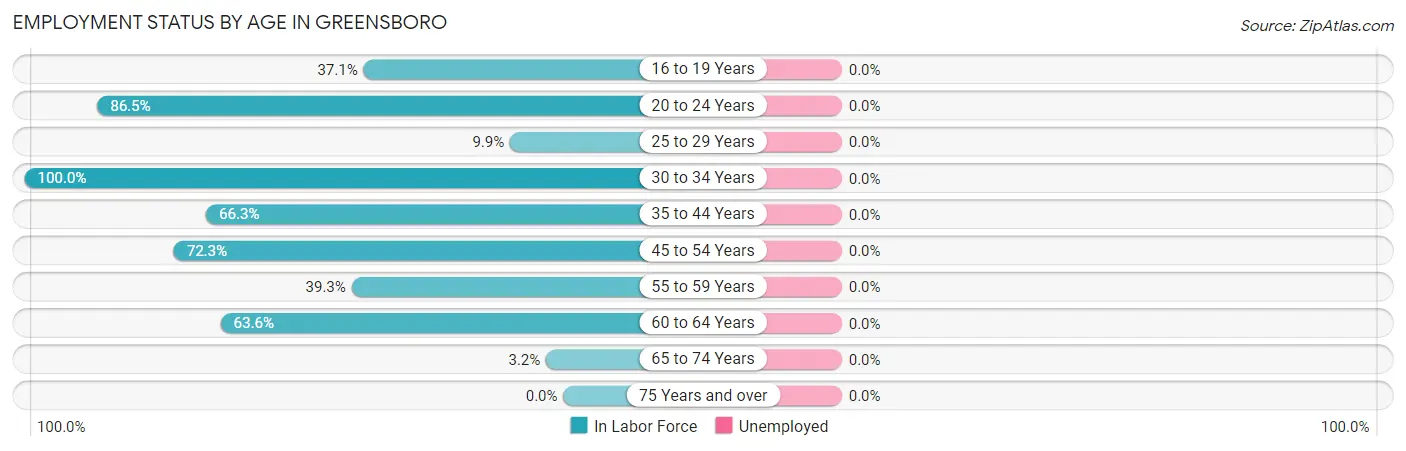
| Age Bracket | In Labor Force | Unemployed |
| 16 to 19 Years | 13 (37.1%) | 0 (0.0%) |
| 20 to 24 Years | 45 (86.5%) | 0 (0.0%) |
| 25 to 29 Years | 7 (9.9%) | 0 (0.0%) |
| 30 to 34 Years | 1 (100.0%) | 0 (0.0%) |
| 35 to 44 Years | 120 (66.3%) | 0 (0.0%) |
| 45 to 54 Years | 47 (72.3%) | 0 (0.0%) |
| 55 to 59 Years | 22 (39.3%) | 0 (0.0%) |
| 60 to 64 Years | 7 (63.6%) | 0 (0.0%) |
| 65 to 74 Years | 2 (3.2%) | 0 (0.0%) |
| 75 Years and over | 0 (0.0%) | 0 (0.0%) |
| Total | 264 (46.8%) | 0 (0.0%) |
Employment Status by Educational Attainment in Greensboro
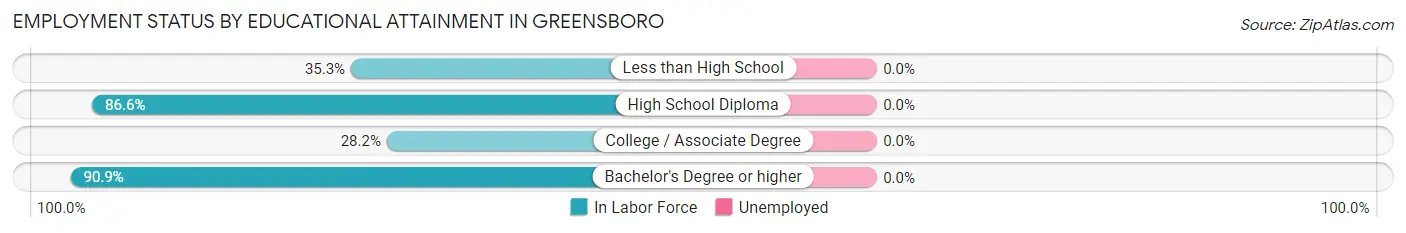
| Educational Attainment | In Labor Force | Unemployed |
| Less than High School | 61 (35.3%) | 0 (0.0%) |
| High School Diploma | 103 (86.6%) | 0 (0.0%) |
| College / Associate Degree | 20 (28.2%) | 0 (0.0%) |
| Bachelor's Degree or higher | 20 (90.9%) | 0 (0.0%) |
| Total | 204 (53.0%) | 0 (0.0%) |
Employment Occupations by Sex in Greensboro
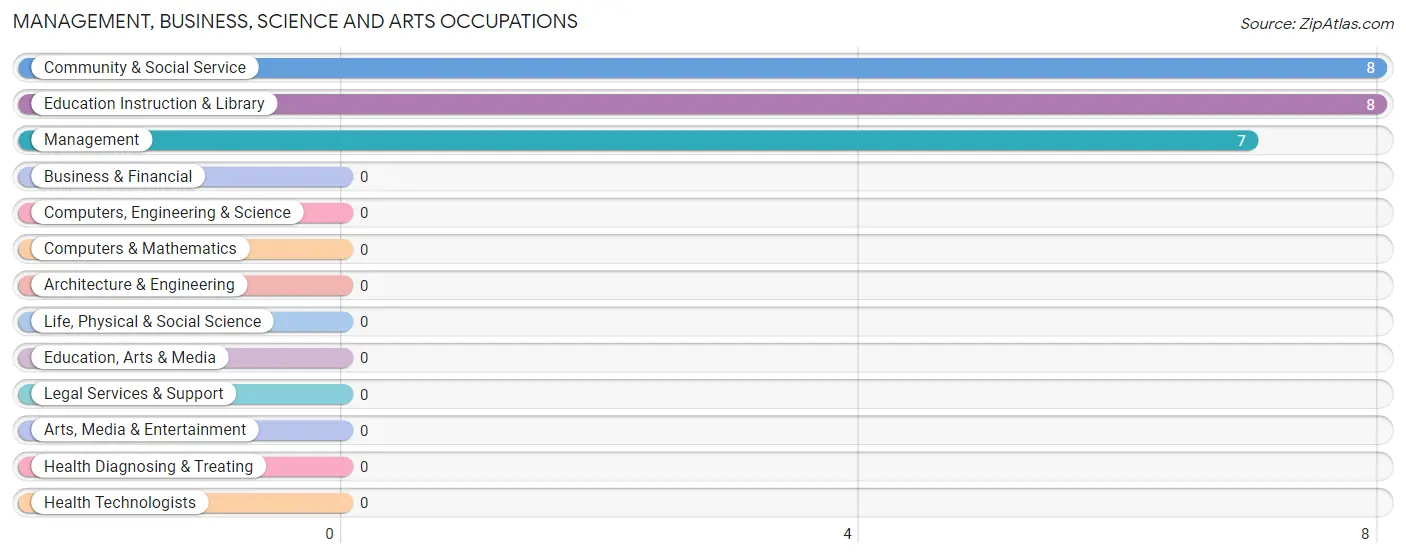
Management, Business, Science and Arts Occupations
The most common Management, Business, Science and Arts occupations in Greensboro are Community & Social Service (8 | 3.0%), Education Instruction & Library (8 | 3.0%), and Management (7 | 2.6%).
Management, Business, Science and Arts Occupations by Sex
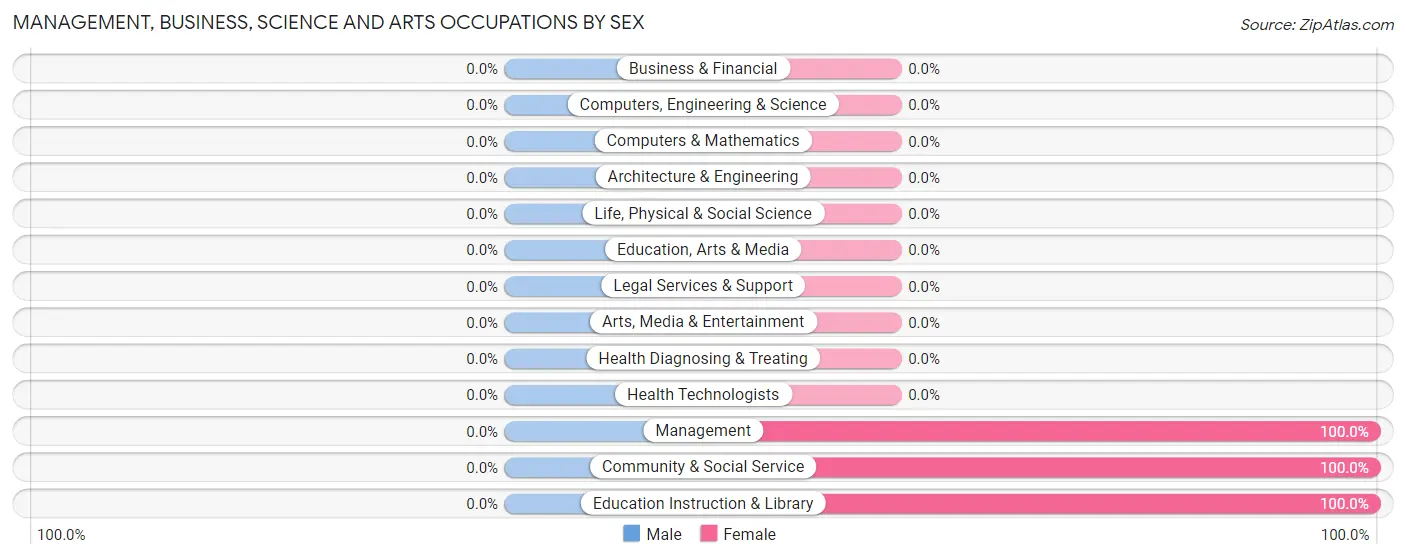
| Occupation | Male | Female |
| Management | 0 (0.0%) | 7 (100.0%) |
| Business & Financial | 0 (0.0%) | 0 (0.0%) |
| Computers, Engineering & Science | 0 (0.0%) | 0 (0.0%) |
| Computers & Mathematics | 0 (0.0%) | 0 (0.0%) |
| Architecture & Engineering | 0 (0.0%) | 0 (0.0%) |
| Life, Physical & Social Science | 0 (0.0%) | 0 (0.0%) |
| Community & Social Service | 0 (0.0%) | 8 (100.0%) |
| Education, Arts & Media | 0 (0.0%) | 0 (0.0%) |
| Legal Services & Support | 0 (0.0%) | 0 (0.0%) |
| Education Instruction & Library | 0 (0.0%) | 8 (100.0%) |
| Arts, Media & Entertainment | 0 (0.0%) | 0 (0.0%) |
| Health Diagnosing & Treating | 0 (0.0%) | 0 (0.0%) |
| Health Technologists | 0 (0.0%) | 0 (0.0%) |
| Total (Category) | 0 (0.0%) | 15 (100.0%) |
| Total (Overall) | 145 (54.9%) | 119 (45.1%) |
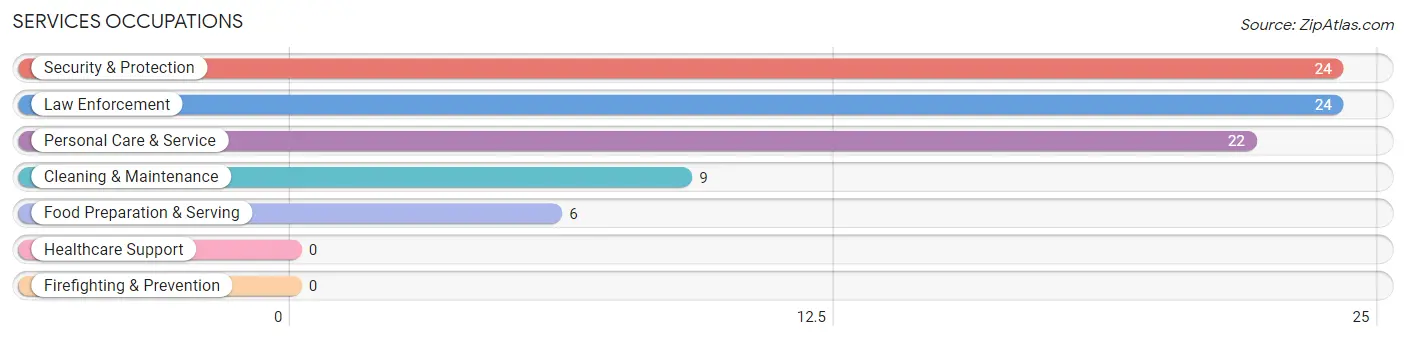
Services Occupations
The most common Services occupations in Greensboro are Security & Protection (24 | 9.1%), Law Enforcement (24 | 9.1%), Personal Care & Service (22 | 8.3%), Cleaning & Maintenance (9 | 3.4%), and Food Preparation & Serving (6 | 2.3%).
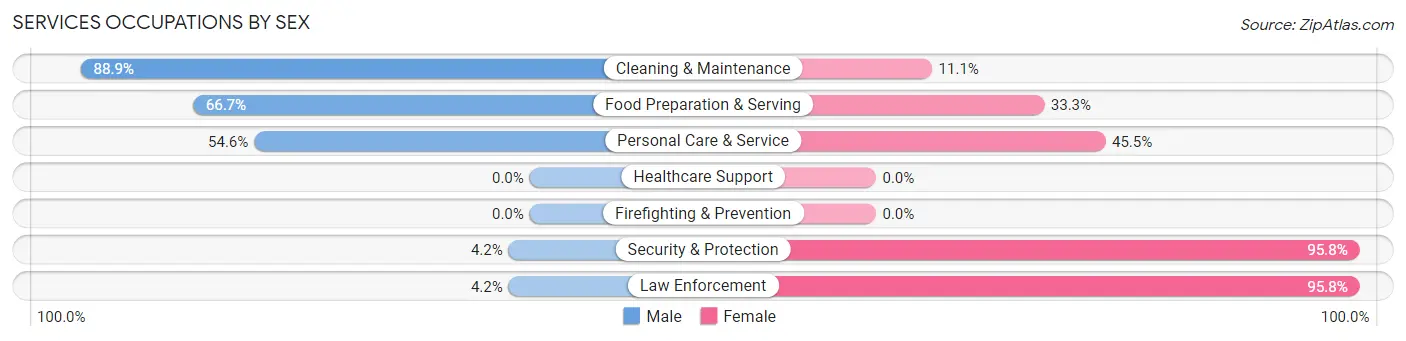
Services Occupations by Sex
Within the Services occupations in Greensboro, the most male-oriented occupations are Cleaning & Maintenance (88.9%), Food Preparation & Serving (66.7%), and Personal Care & Service (54.5%), while the most female-oriented occupations are Security & Protection (95.8%), Law Enforcement (95.8%), and Personal Care & Service (45.5%).
| Occupation | Male | Female |
| Healthcare Support | 0 (0.0%) | 0 (0.0%) |
| Security & Protection | 1 (4.2%) | 23 (95.8%) |
| Firefighting & Prevention | 0 (0.0%) | 0 (0.0%) |
| Law Enforcement | 1 (4.2%) | 23 (95.8%) |
| Food Preparation & Serving | 4 (66.7%) | 2 (33.3%) |
| Cleaning & Maintenance | 8 (88.9%) | 1 (11.1%) |
| Personal Care & Service | 12 (54.5%) | 10 (45.5%) |
| Total (Category) | 25 (41.0%) | 36 (59.0%) |
| Total (Overall) | 145 (54.9%) | 119 (45.1%) |
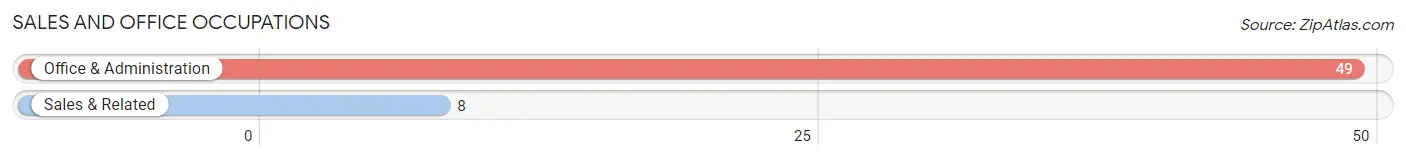
Sales and Office Occupations
The most common Sales and Office occupations in Greensboro are Office & Administration (49 | 18.6%), and Sales & Related (8 | 3.0%).
Sales and Office Occupations by Sex
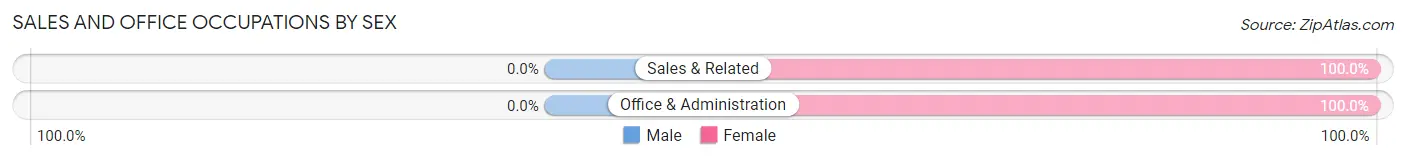
| Occupation | Male | Female |
| Sales & Related | 0 (0.0%) | 8 (100.0%) |
| Office & Administration | 0 (0.0%) | 49 (100.0%) |
| Total (Category) | 0 (0.0%) | 57 (100.0%) |
| Total (Overall) | 145 (54.9%) | 119 (45.1%) |
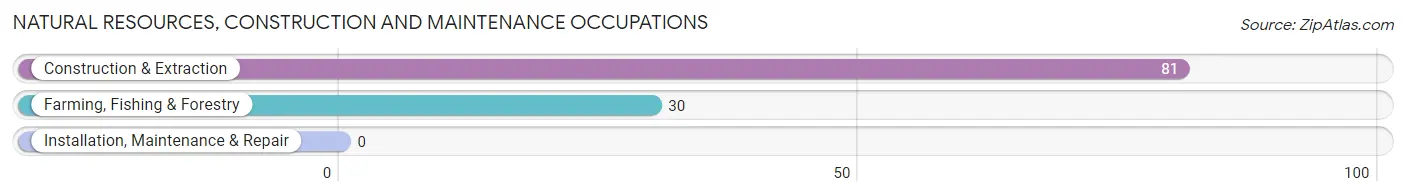
Natural Resources, Construction and Maintenance Occupations
The most common Natural Resources, Construction and Maintenance occupations in Greensboro are Construction & Extraction (81 | 30.7%), and Farming, Fishing & Forestry (30 | 11.4%).
Natural Resources, Construction and Maintenance Occupations by Sex
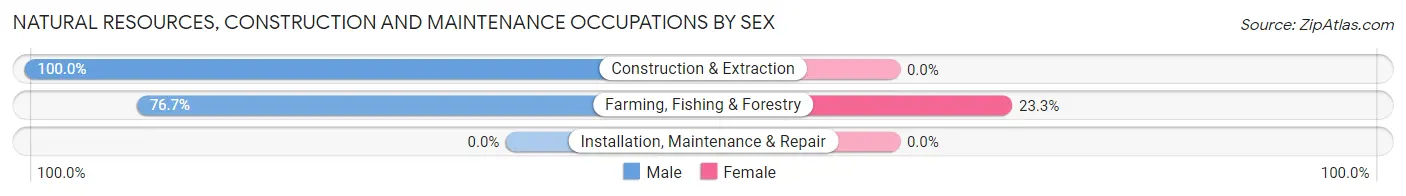
| Occupation | Male | Female |
| Farming, Fishing & Forestry | 23 (76.7%) | 7 (23.3%) |
| Construction & Extraction | 81 (100.0%) | 0 (0.0%) |
| Installation, Maintenance & Repair | 0 (0.0%) | 0 (0.0%) |
| Total (Category) | 104 (93.7%) | 7 (6.3%) |
| Total (Overall) | 145 (54.9%) | 119 (45.1%) |
Production, Transportation and Moving Occupations
The most common Production, Transportation and Moving occupations in Greensboro are Transportation (14 | 5.3%), and Production (6 | 2.3%).
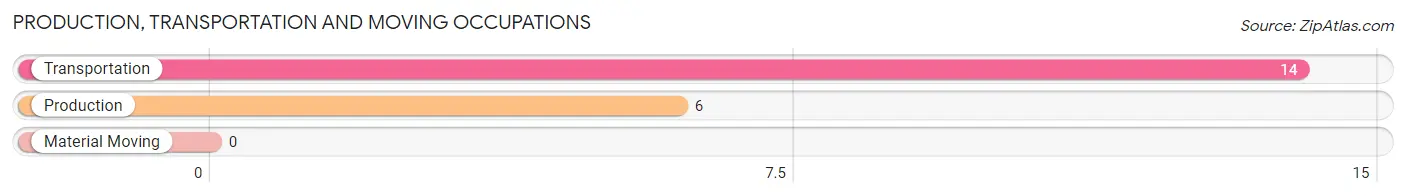
Production, Transportation and Moving Occupations by Sex
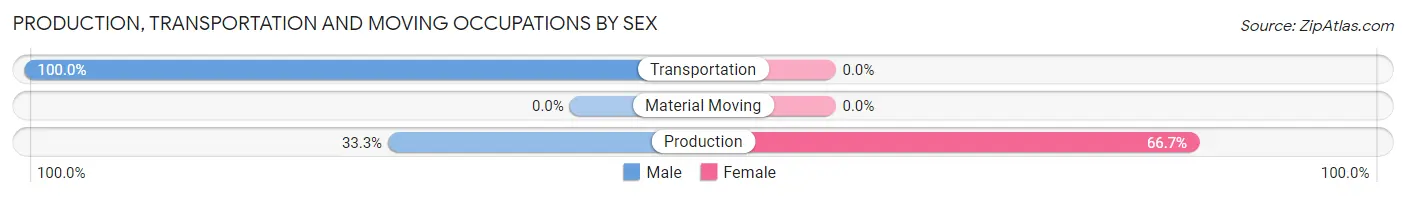
| Occupation | Male | Female |
| Production | 2 (33.3%) | 4 (66.7%) |
| Transportation | 14 (100.0%) | 0 (0.0%) |
| Material Moving | 0 (0.0%) | 0 (0.0%) |
| Total (Category) | 16 (80.0%) | 4 (20.0%) |
| Total (Overall) | 145 (54.9%) | 119 (45.1%) |
Employment Industries by Sex in Greensboro
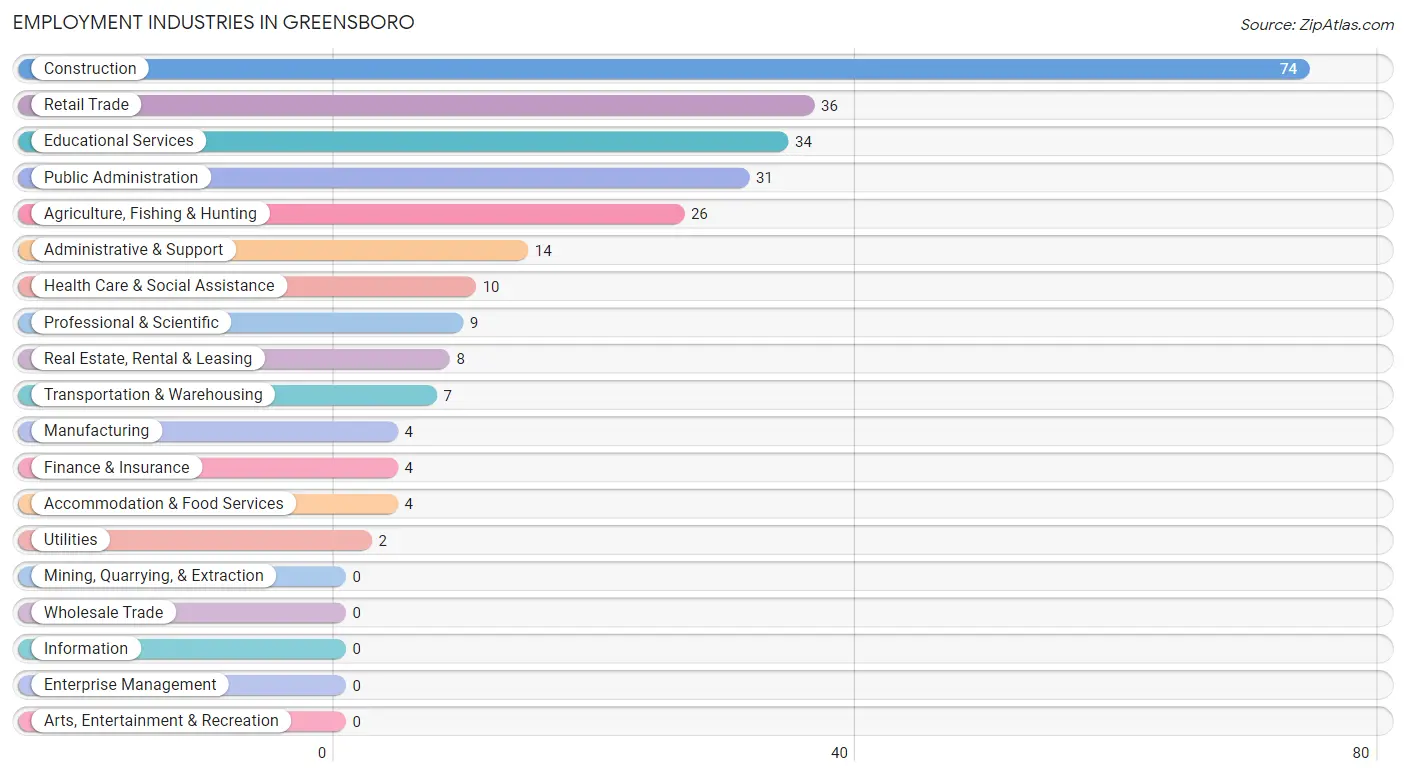
Employment Industries in Greensboro
The major employment industries in Greensboro include Construction (74 | 28.0%), Retail Trade (36 | 13.6%), Educational Services (34 | 12.9%), Public Administration (31 | 11.7%), and Agriculture, Fishing & Hunting (26 | 9.9%).
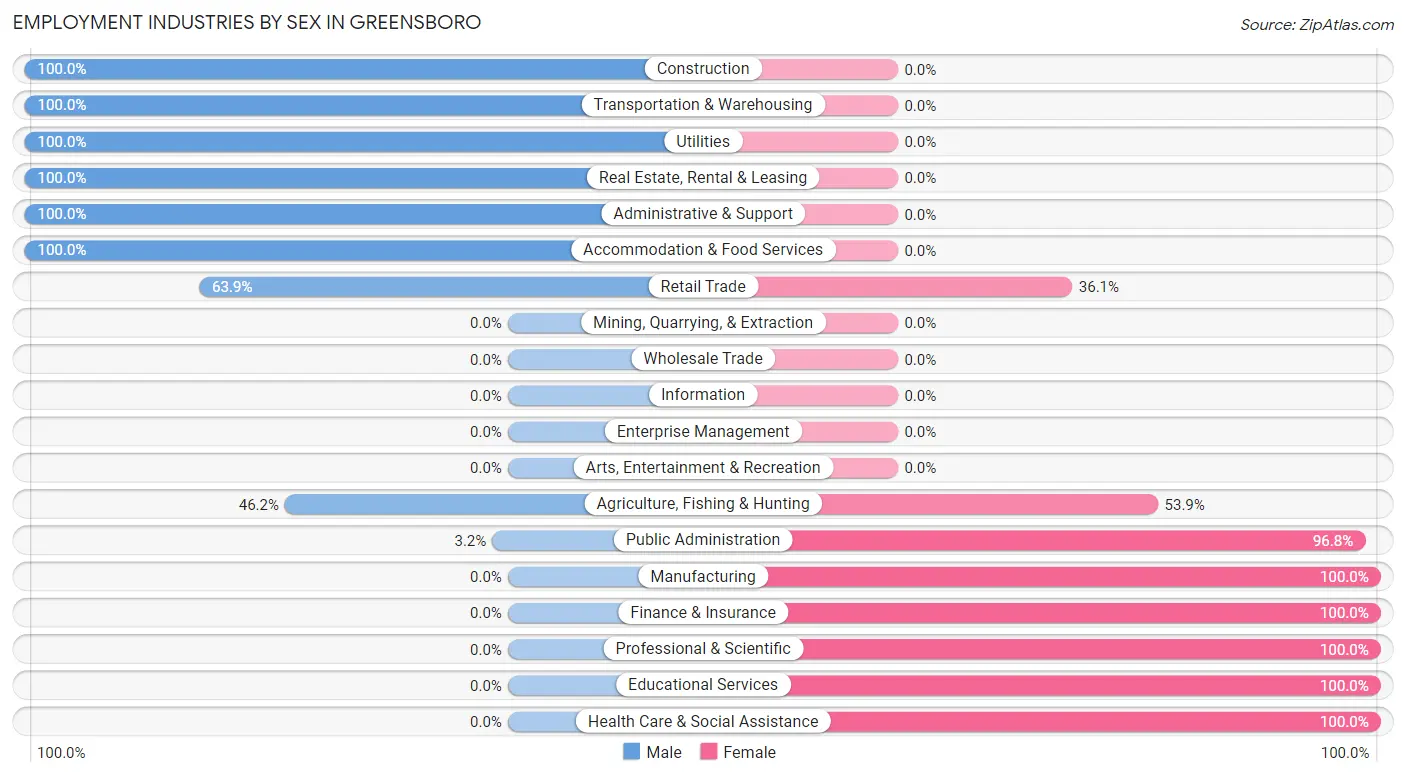
Employment Industries by Sex in Greensboro
The Greensboro industries that see more men than women are Construction (100.0%), Transportation & Warehousing (100.0%), and Utilities (100.0%), whereas the industries that tend to have a higher number of women are Manufacturing (100.0%), Finance & Insurance (100.0%), and Professional & Scientific (100.0%).
| Industry | Male | Female |
| Agriculture, Fishing & Hunting | 12 (46.2%) | 14 (53.8%) |
| Mining, Quarrying, & Extraction | 0 (0.0%) | 0 (0.0%) |
| Construction | 74 (100.0%) | 0 (0.0%) |
| Manufacturing | 0 (0.0%) | 4 (100.0%) |
| Wholesale Trade | 0 (0.0%) | 0 (0.0%) |
| Retail Trade | 23 (63.9%) | 13 (36.1%) |
| Transportation & Warehousing | 7 (100.0%) | 0 (0.0%) |
| Utilities | 2 (100.0%) | 0 (0.0%) |
| Information | 0 (0.0%) | 0 (0.0%) |
| Finance & Insurance | 0 (0.0%) | 4 (100.0%) |
| Real Estate, Rental & Leasing | 8 (100.0%) | 0 (0.0%) |
| Professional & Scientific | 0 (0.0%) | 9 (100.0%) |
| Enterprise Management | 0 (0.0%) | 0 (0.0%) |
| Administrative & Support | 14 (100.0%) | 0 (0.0%) |
| Educational Services | 0 (0.0%) | 34 (100.0%) |
| Health Care & Social Assistance | 0 (0.0%) | 10 (100.0%) |
| Arts, Entertainment & Recreation | 0 (0.0%) | 0 (0.0%) |
| Accommodation & Food Services | 4 (100.0%) | 0 (0.0%) |
| Public Administration | 1 (3.2%) | 30 (96.8%) |
| Total | 145 (54.9%) | 119 (45.1%) |
Education in Greensboro
School Enrollment in Greensboro
The most common levels of schooling among the 234 students in Greensboro are elementary school (75 | 32.1%), middle school (71 | 30.3%), and college / undergraduate (50 | 21.4%).
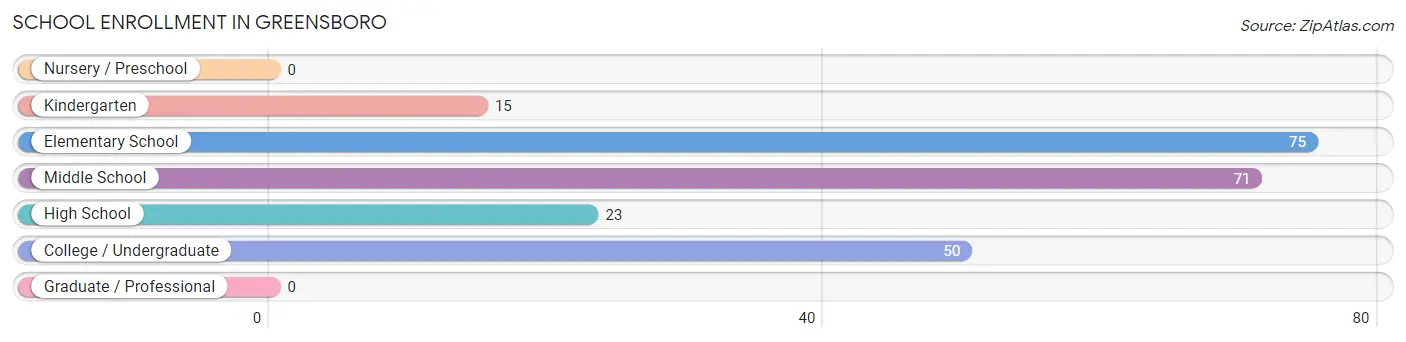
| School Level | # Students | % Students |
| Nursery / Preschool | 0 | 0.0% |
| Kindergarten | 15 | 6.4% |
| Elementary School | 75 | 32.1% |
| Middle School | 71 | 30.3% |
| High School | 23 | 9.8% |
| College / Undergraduate | 50 | 21.4% |
| Graduate / Professional | 0 | 0.0% |
| Total | 234 | 100.0% |
School Enrollment by Age by Funding Source in Greensboro
Out of a total of 234 students who are enrolled in schools in Greensboro, 81 (34.6%) attend a private institution, while the remaining 153 (65.4%) are enrolled in public schools. The age group of 10 to 14 year olds has the highest likelihood of being enrolled in private schools, with 39 (55.7% in the age bracket) enrolled. Conversely, the age group of 18 to 19 year olds has the lowest likelihood of being enrolled in a private school, with 12 (100.0% in the age bracket) attending a public institution.
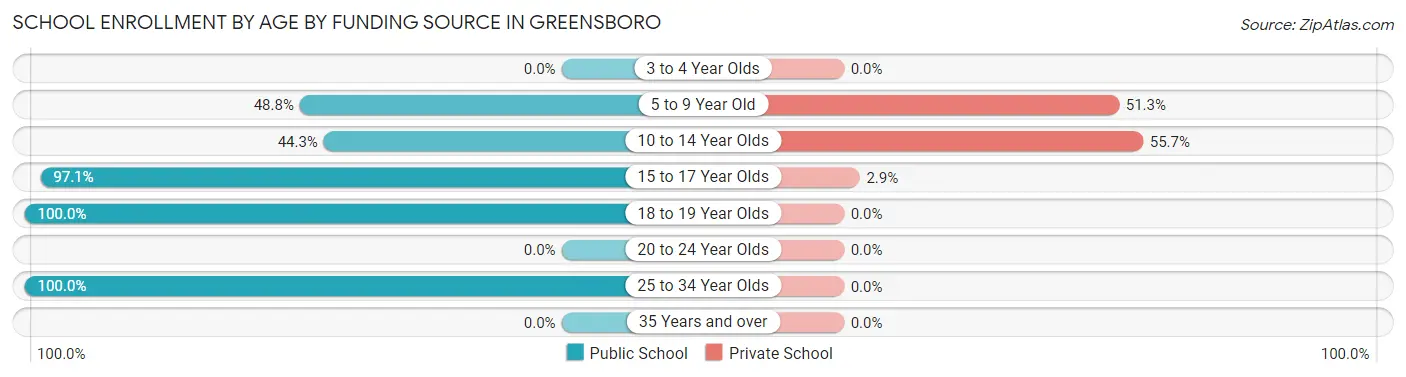
| Age Bracket | Public School | Private School |
| 3 to 4 Year Olds | 0 (0.0%) | 0 (0.0%) |
| 5 to 9 Year Old | 39 (48.7%) | 41 (51.2%) |
| 10 to 14 Year Olds | 31 (44.3%) | 39 (55.7%) |
| 15 to 17 Year Olds | 33 (97.1%) | 1 (2.9%) |
| 18 to 19 Year Olds | 12 (100.0%) | 0 (0.0%) |
| 20 to 24 Year Olds | 0 (0.0%) | 0 (0.0%) |
| 25 to 34 Year Olds | 38 (100.0%) | 0 (0.0%) |
| 35 Years and over | 0 (0.0%) | 0 (0.0%) |
| Total | 153 (65.4%) | 81 (34.6%) |
Educational Attainment by Field of Study in Greensboro
Bio, nature & agricultural (12 | 42.9%), computers & mathematics (8 | 28.6%), social sciences (6 | 21.4%), and arts & humanities (2 | 7.1%) are the most common fields of study among 28 individuals in Greensboro who have obtained a bachelor's degree or higher.
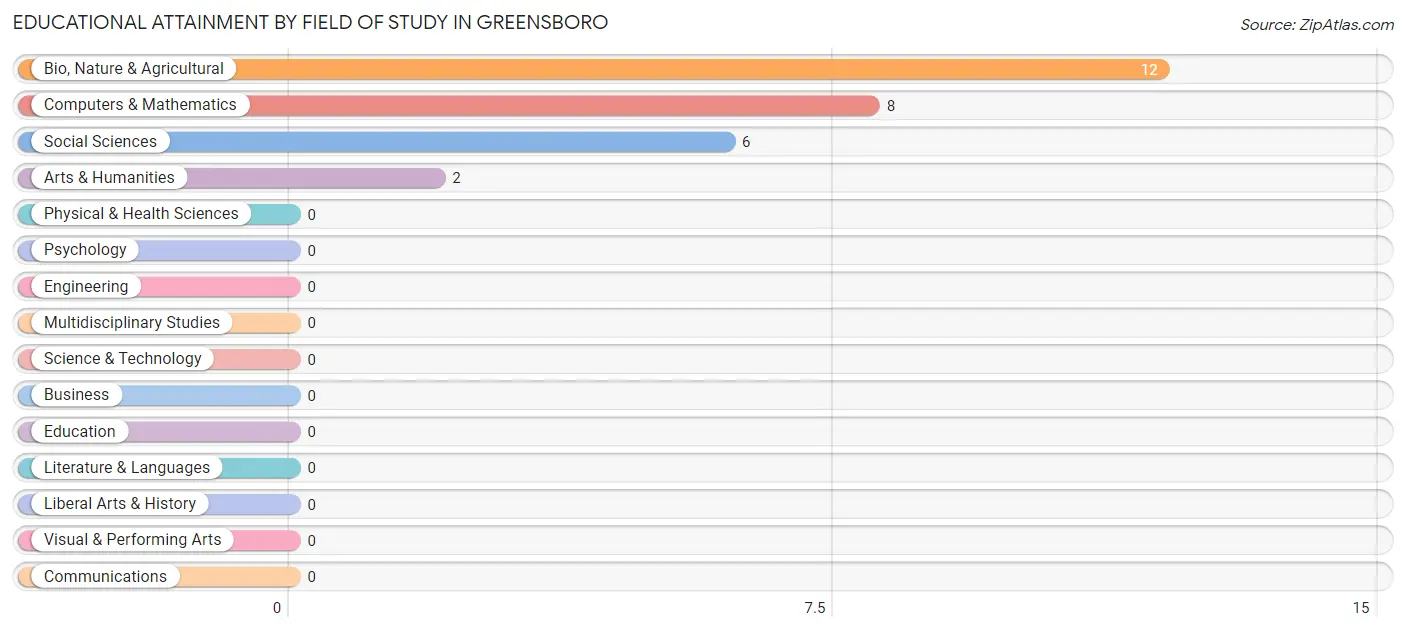
| Field of Study | # Graduates | % Graduates |
| Computers & Mathematics | 8 | 28.6% |
| Bio, Nature & Agricultural | 12 | 42.9% |
| Physical & Health Sciences | 0 | 0.0% |
| Psychology | 0 | 0.0% |
| Social Sciences | 6 | 21.4% |
| Engineering | 0 | 0.0% |
| Multidisciplinary Studies | 0 | 0.0% |
| Science & Technology | 0 | 0.0% |
| Business | 0 | 0.0% |
| Education | 0 | 0.0% |
| Literature & Languages | 0 | 0.0% |
| Liberal Arts & History | 0 | 0.0% |
| Visual & Performing Arts | 0 | 0.0% |
| Communications | 0 | 0.0% |
| Arts & Humanities | 2 | 7.1% |
| Total | 28 | 100.0% |
Transportation & Commute in Greensboro
Vehicle Availability by Sex in Greensboro
The most prevalent vehicle ownership categories in Greensboro are males with 1 vehicle (50, accounting for 34.5%) and females with 1 vehicle (51, making up 42.0%).
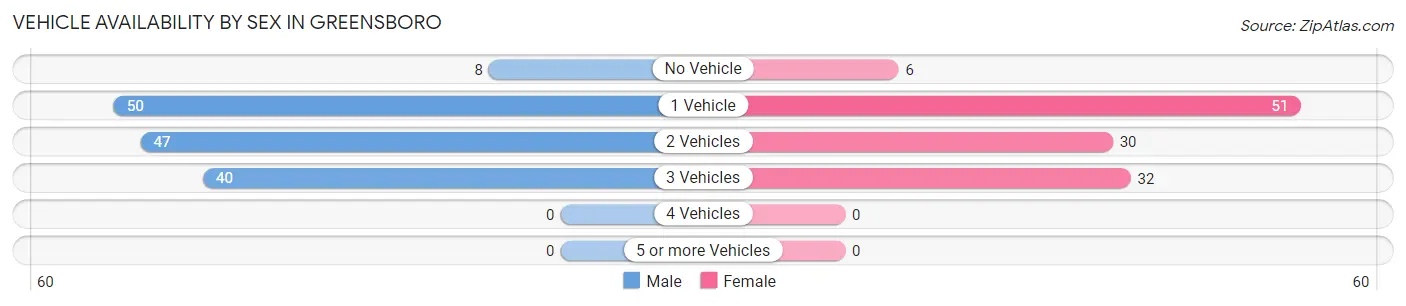
| Vehicles Available | Male | Female |
| No Vehicle | 8 (5.5%) | 6 (5.0%) |
| 1 Vehicle | 50 (34.5%) | 51 (42.9%) |
| 2 Vehicles | 47 (32.4%) | 30 (25.2%) |
| 3 Vehicles | 40 (27.6%) | 32 (26.9%) |
| 4 Vehicles | 0 (0.0%) | 0 (0.0%) |
| 5 or more Vehicles | 0 (0.0%) | 0 (0.0%) |
| Total | 145 (100.0%) | 119 (100.0%) |
Commute Time in Greensboro
The most frequently occuring commute durations in Greensboro are 40 to 44 minutes (50 commuters, 18.9%), 20 to 24 minutes (39 commuters, 14.8%), and 45 to 59 minutes (33 commuters, 12.5%).
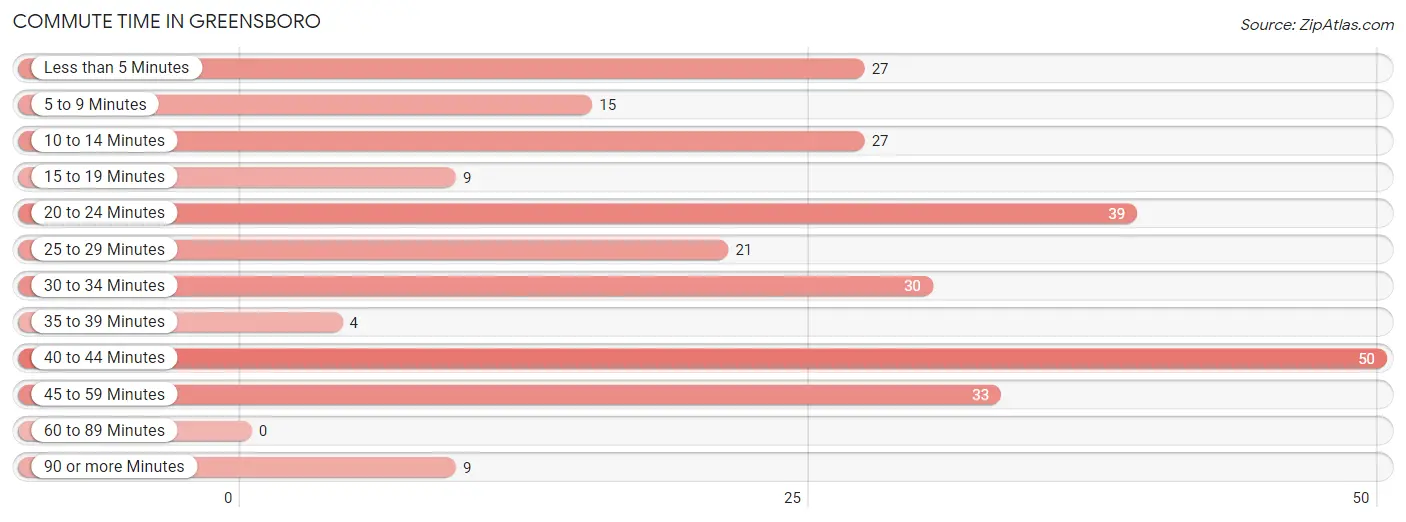
| Commute Time | # Commuters | % Commuters |
| Less than 5 Minutes | 27 | 10.2% |
| 5 to 9 Minutes | 15 | 5.7% |
| 10 to 14 Minutes | 27 | 10.2% |
| 15 to 19 Minutes | 9 | 3.4% |
| 20 to 24 Minutes | 39 | 14.8% |
| 25 to 29 Minutes | 21 | 8.0% |
| 30 to 34 Minutes | 30 | 11.4% |
| 35 to 39 Minutes | 4 | 1.5% |
| 40 to 44 Minutes | 50 | 18.9% |
| 45 to 59 Minutes | 33 | 12.5% |
| 60 to 89 Minutes | 0 | 0.0% |
| 90 or more Minutes | 9 | 3.4% |
Commute Time by Sex in Greensboro
The most common commute times in Greensboro are 40 to 44 minutes (49 commuters, 33.8%) for males and 45 to 59 minutes (33 commuters, 27.7%) for females.
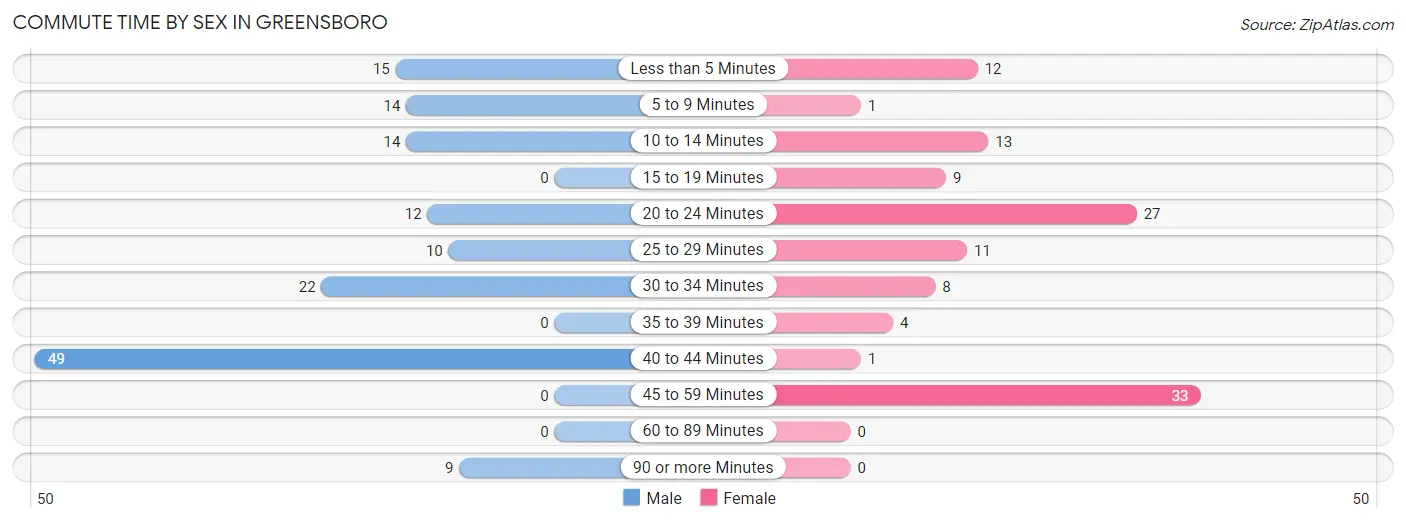
| Commute Time | Male | Female |
| Less than 5 Minutes | 15 (10.3%) | 12 (10.1%) |
| 5 to 9 Minutes | 14 (9.7%) | 1 (0.8%) |
| 10 to 14 Minutes | 14 (9.7%) | 13 (10.9%) |
| 15 to 19 Minutes | 0 (0.0%) | 9 (7.6%) |
| 20 to 24 Minutes | 12 (8.3%) | 27 (22.7%) |
| 25 to 29 Minutes | 10 (6.9%) | 11 (9.2%) |
| 30 to 34 Minutes | 22 (15.2%) | 8 (6.7%) |
| 35 to 39 Minutes | 0 (0.0%) | 4 (3.4%) |
| 40 to 44 Minutes | 49 (33.8%) | 1 (0.8%) |
| 45 to 59 Minutes | 0 (0.0%) | 33 (27.7%) |
| 60 to 89 Minutes | 0 (0.0%) | 0 (0.0%) |
| 90 or more Minutes | 9 (6.2%) | 0 (0.0%) |
Time of Departure to Work by Sex in Greensboro
The most frequent times of departure to work in Greensboro are 6:30 AM to 6:59 AM (84, 57.9%) for males and 7:30 AM to 7:59 AM (62, 52.1%) for females.
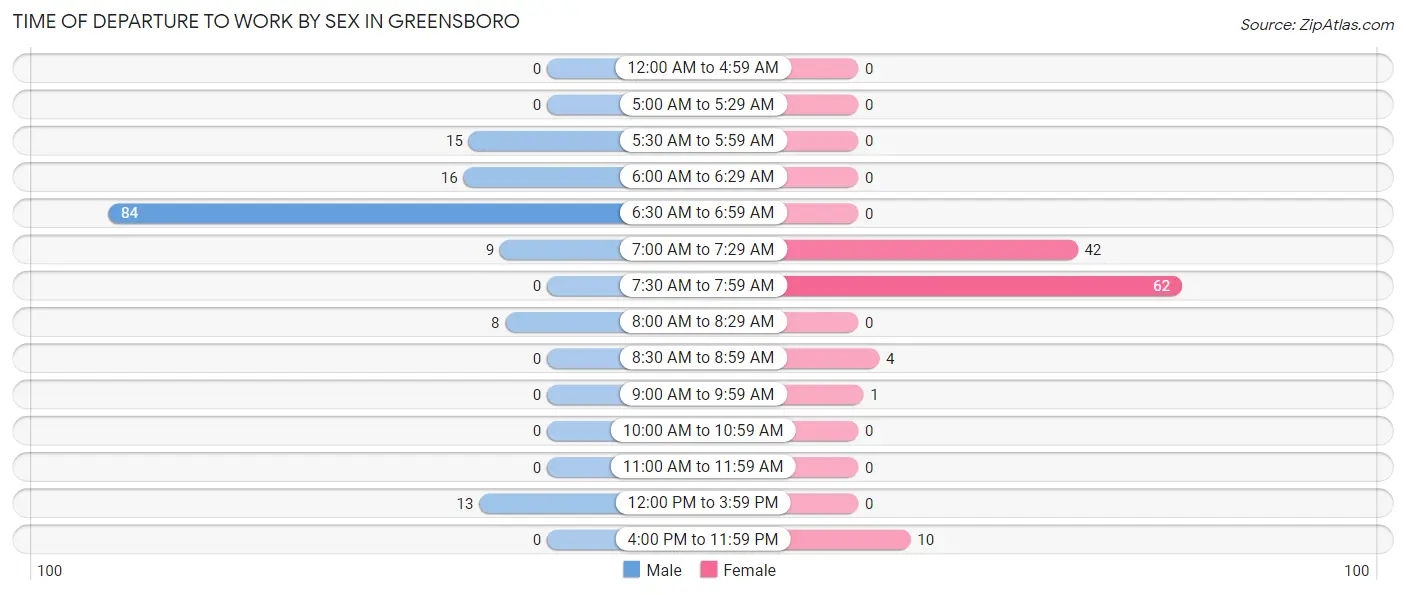
| Time of Departure | Male | Female |
| 12:00 AM to 4:59 AM | 0 (0.0%) | 0 (0.0%) |
| 5:00 AM to 5:29 AM | 0 (0.0%) | 0 (0.0%) |
| 5:30 AM to 5:59 AM | 15 (10.3%) | 0 (0.0%) |
| 6:00 AM to 6:29 AM | 16 (11.0%) | 0 (0.0%) |
| 6:30 AM to 6:59 AM | 84 (57.9%) | 0 (0.0%) |
| 7:00 AM to 7:29 AM | 9 (6.2%) | 42 (35.3%) |
| 7:30 AM to 7:59 AM | 0 (0.0%) | 62 (52.1%) |
| 8:00 AM to 8:29 AM | 8 (5.5%) | 0 (0.0%) |
| 8:30 AM to 8:59 AM | 0 (0.0%) | 4 (3.4%) |
| 9:00 AM to 9:59 AM | 0 (0.0%) | 1 (0.8%) |
| 10:00 AM to 10:59 AM | 0 (0.0%) | 0 (0.0%) |
| 11:00 AM to 11:59 AM | 0 (0.0%) | 0 (0.0%) |
| 12:00 PM to 3:59 PM | 13 (9.0%) | 0 (0.0%) |
| 4:00 PM to 11:59 PM | 0 (0.0%) | 10 (8.4%) |
| Total | 145 (100.0%) | 119 (100.0%) |
Housing Occupancy in Greensboro
Occupancy by Ownership in Greensboro
Of the total 293 dwellings in Greensboro, owner-occupied units account for 106 (36.2%), while renter-occupied units make up 187 (63.8%).
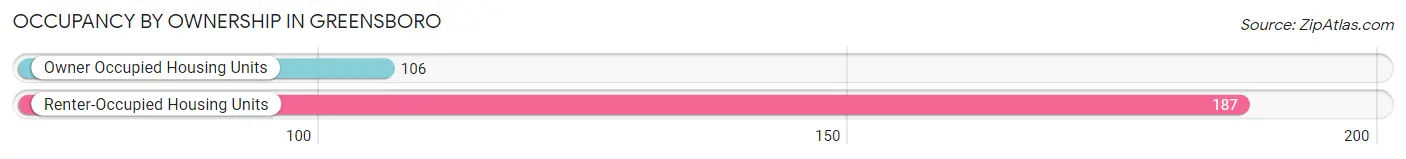
| Occupancy | # Housing Units | % Housing Units |
| Owner Occupied Housing Units | 106 | 36.2% |
| Renter-Occupied Housing Units | 187 | 63.8% |
| Total Occupied Housing Units | 293 | 100.0% |
Occupancy by Household Size in Greensboro
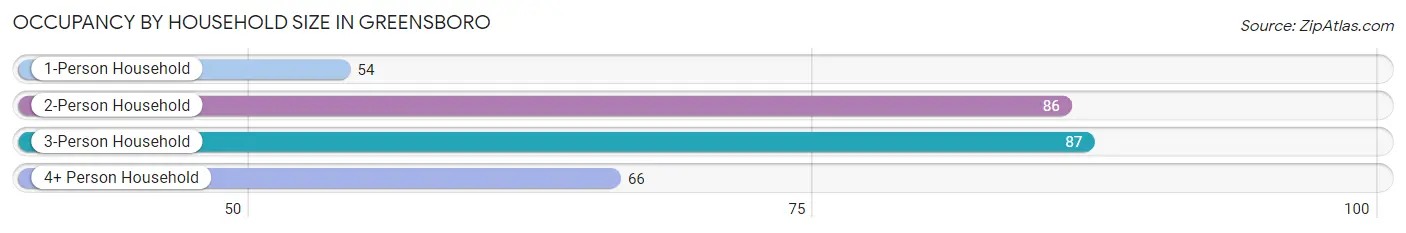
| Household Size | # Housing Units | % Housing Units |
| 1-Person Household | 54 | 18.4% |
| 2-Person Household | 86 | 29.3% |
| 3-Person Household | 87 | 29.7% |
| 4+ Person Household | 66 | 22.5% |
| Total Housing Units | 293 | 100.0% |
Occupancy by Ownership by Household Size in Greensboro
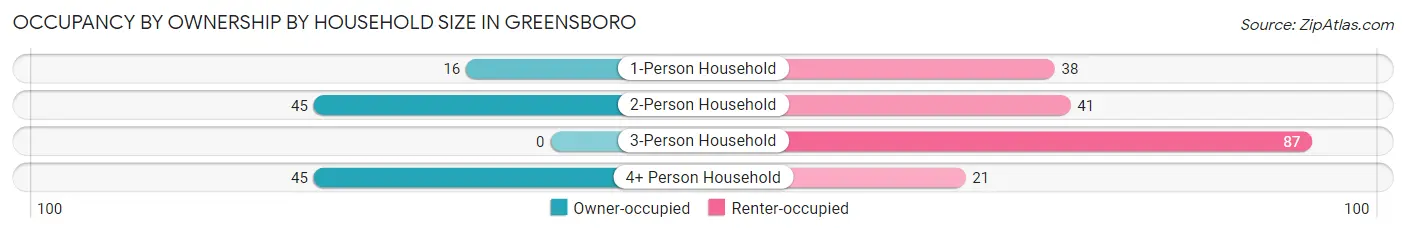
| Household Size | Owner-occupied | Renter-occupied |
| 1-Person Household | 16 (29.6%) | 38 (70.4%) |
| 2-Person Household | 45 (52.3%) | 41 (47.7%) |
| 3-Person Household | 0 (0.0%) | 87 (100.0%) |
| 4+ Person Household | 45 (68.2%) | 21 (31.8%) |
| Total Housing Units | 106 (36.2%) | 187 (63.8%) |
Occupancy by Educational Attainment in Greensboro
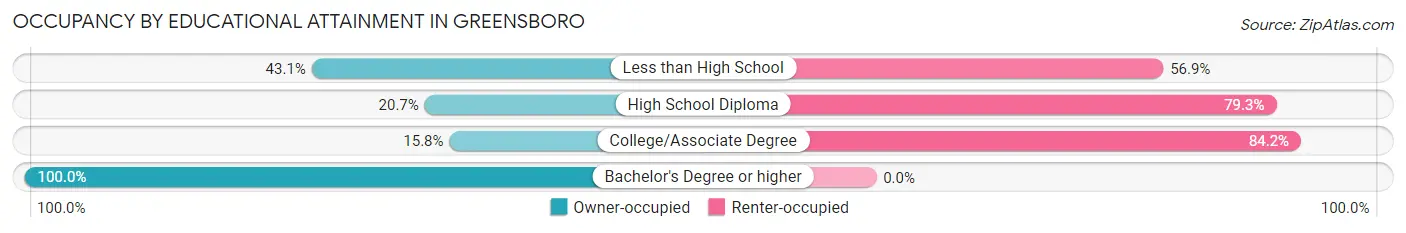
| Household Size | Owner-occupied | Renter-occupied |
| Less than High School | 53 (43.1%) | 70 (56.9%) |
| High School Diploma | 18 (20.7%) | 69 (79.3%) |
| College/Associate Degree | 9 (15.8%) | 48 (84.2%) |
| Bachelor's Degree or higher | 26 (100.0%) | 0 (0.0%) |
Occupancy by Age of Householder in Greensboro
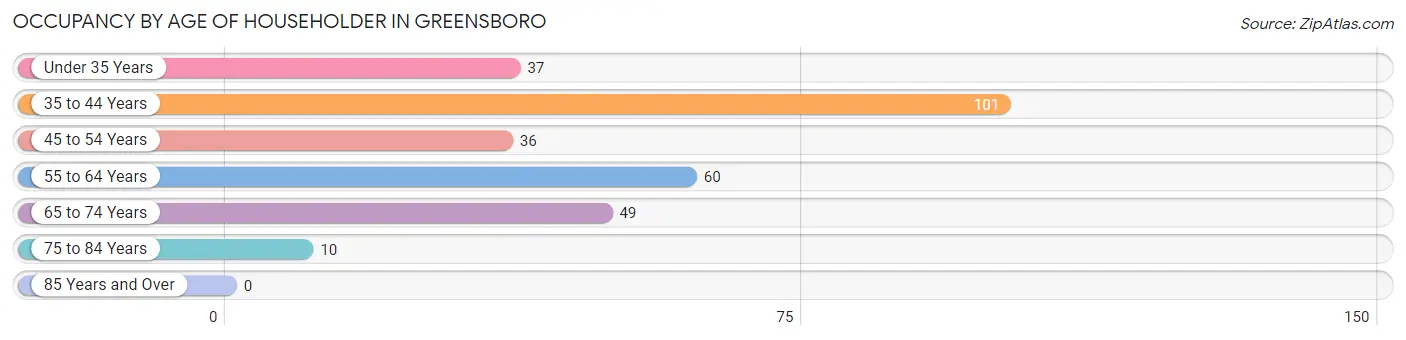
| Age Bracket | # Households | % Households |
| Under 35 Years | 37 | 12.6% |
| 35 to 44 Years | 101 | 34.5% |
| 45 to 54 Years | 36 | 12.3% |
| 55 to 64 Years | 60 | 20.5% |
| 65 to 74 Years | 49 | 16.7% |
| 75 to 84 Years | 10 | 3.4% |
| 85 Years and Over | 0 | 0.0% |
| Total | 293 | 100.0% |
Housing Finances in Greensboro
Median Income by Occupancy in Greensboro
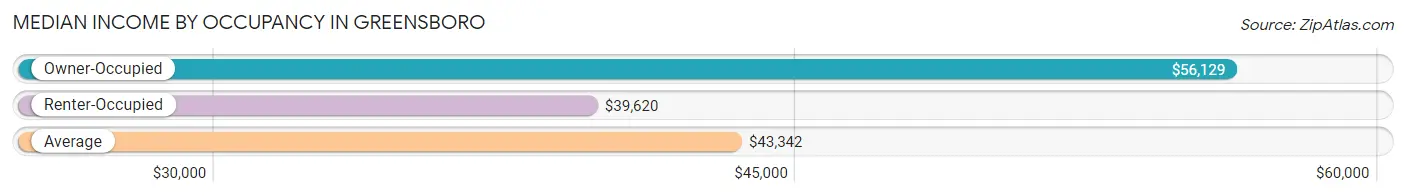
| Occupancy Type | # Households | Median Income |
| Owner-Occupied | 106 (36.2%) | $56,129 |
| Renter-Occupied | 187 (63.8%) | $39,620 |
| Average | 293 (100.0%) | $43,342 |
Occupancy by Householder Income Bracket in Greensboro
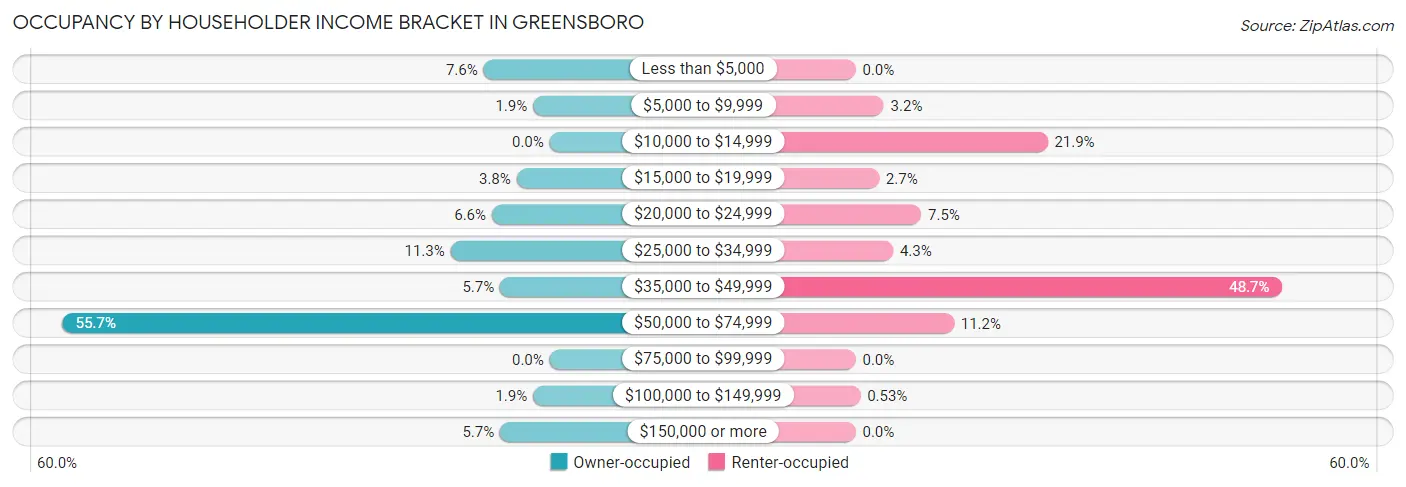
| Income Bracket | Owner-occupied | Renter-occupied |
| Less than $5,000 | 8 (7.5%) | 0 (0.0%) |
| $5,000 to $9,999 | 2 (1.9%) | 6 (3.2%) |
| $10,000 to $14,999 | 0 (0.0%) | 41 (21.9%) |
| $15,000 to $19,999 | 4 (3.8%) | 5 (2.7%) |
| $20,000 to $24,999 | 7 (6.6%) | 14 (7.5%) |
| $25,000 to $34,999 | 12 (11.3%) | 8 (4.3%) |
| $35,000 to $49,999 | 6 (5.7%) | 91 (48.7%) |
| $50,000 to $74,999 | 59 (55.7%) | 21 (11.2%) |
| $75,000 to $99,999 | 0 (0.0%) | 0 (0.0%) |
| $100,000 to $149,999 | 2 (1.9%) | 1 (0.5%) |
| $150,000 or more | 6 (5.7%) | 0 (0.0%) |
| Total | 106 (100.0%) | 187 (100.0%) |
Monthly Housing Cost Tiers in Greensboro
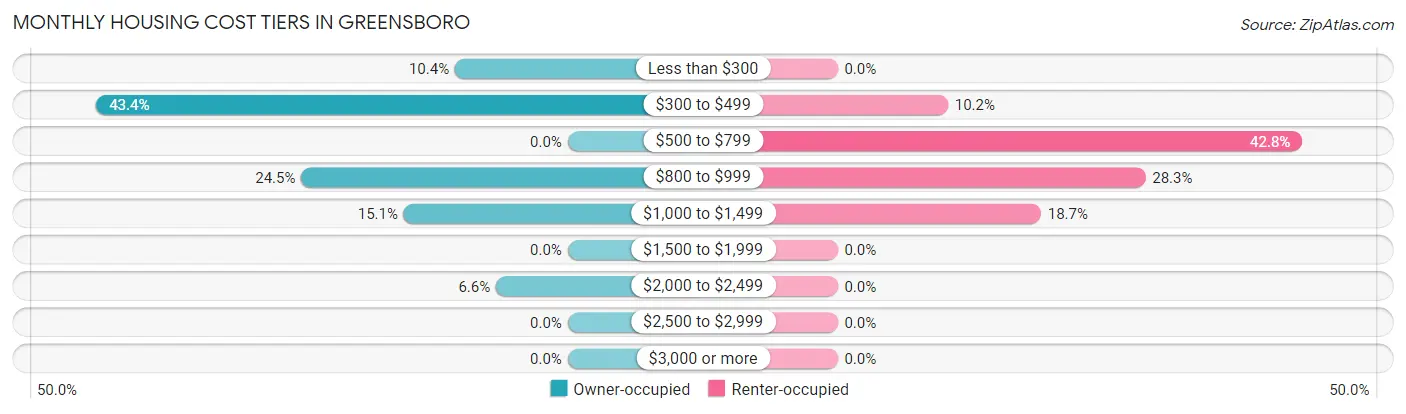
| Monthly Cost | Owner-occupied | Renter-occupied |
| Less than $300 | 11 (10.4%) | 0 (0.0%) |
| $300 to $499 | 46 (43.4%) | 19 (10.2%) |
| $500 to $799 | 0 (0.0%) | 80 (42.8%) |
| $800 to $999 | 26 (24.5%) | 53 (28.3%) |
| $1,000 to $1,499 | 16 (15.1%) | 35 (18.7%) |
| $1,500 to $1,999 | 0 (0.0%) | 0 (0.0%) |
| $2,000 to $2,499 | 7 (6.6%) | 0 (0.0%) |
| $2,500 to $2,999 | 0 (0.0%) | 0 (0.0%) |
| $3,000 or more | 0 (0.0%) | 0 (0.0%) |
| Total | 106 (100.0%) | 187 (100.0%) |
Physical Housing Characteristics in Greensboro
Housing Structures in Greensboro
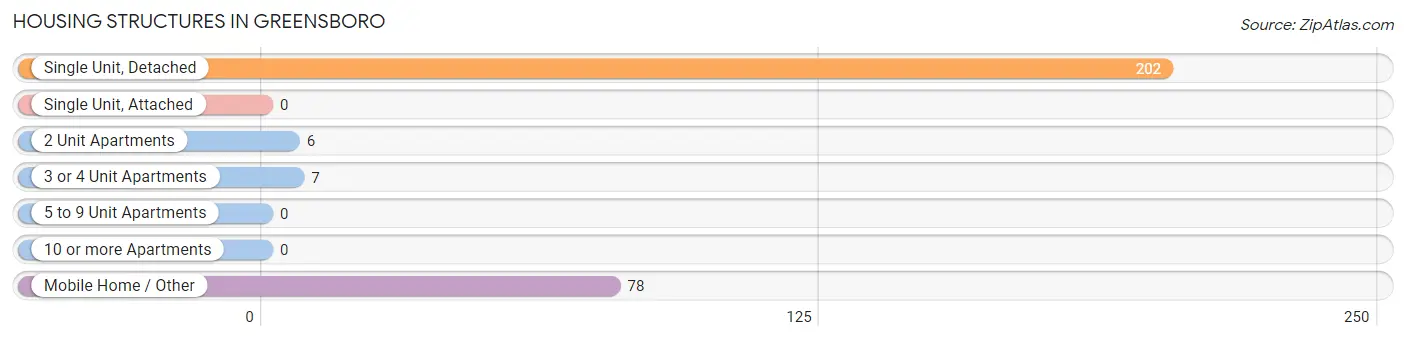
| Structure Type | # Housing Units | % Housing Units |
| Single Unit, Detached | 202 | 68.9% |
| Single Unit, Attached | 0 | 0.0% |
| 2 Unit Apartments | 6 | 2.1% |
| 3 or 4 Unit Apartments | 7 | 2.4% |
| 5 to 9 Unit Apartments | 0 | 0.0% |
| 10 or more Apartments | 0 | 0.0% |
| Mobile Home / Other | 78 | 26.6% |
| Total | 293 | 100.0% |
Housing Structures by Occupancy in Greensboro
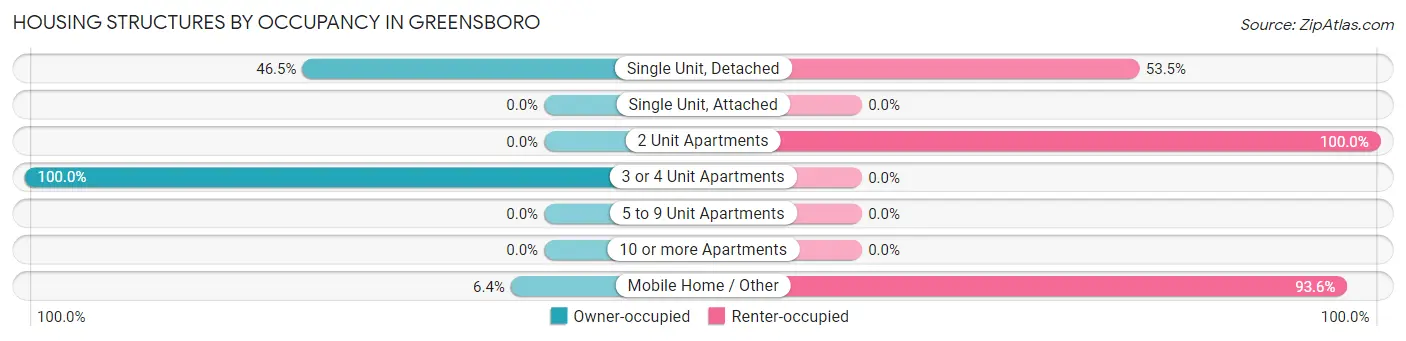
| Structure Type | Owner-occupied | Renter-occupied |
| Single Unit, Detached | 94 (46.5%) | 108 (53.5%) |
| Single Unit, Attached | 0 (0.0%) | 0 (0.0%) |
| 2 Unit Apartments | 0 (0.0%) | 6 (100.0%) |
| 3 or 4 Unit Apartments | 7 (100.0%) | 0 (0.0%) |
| 5 to 9 Unit Apartments | 0 (0.0%) | 0 (0.0%) |
| 10 or more Apartments | 0 (0.0%) | 0 (0.0%) |
| Mobile Home / Other | 5 (6.4%) | 73 (93.6%) |
| Total | 106 (36.2%) | 187 (63.8%) |
Housing Structures by Number of Rooms in Greensboro
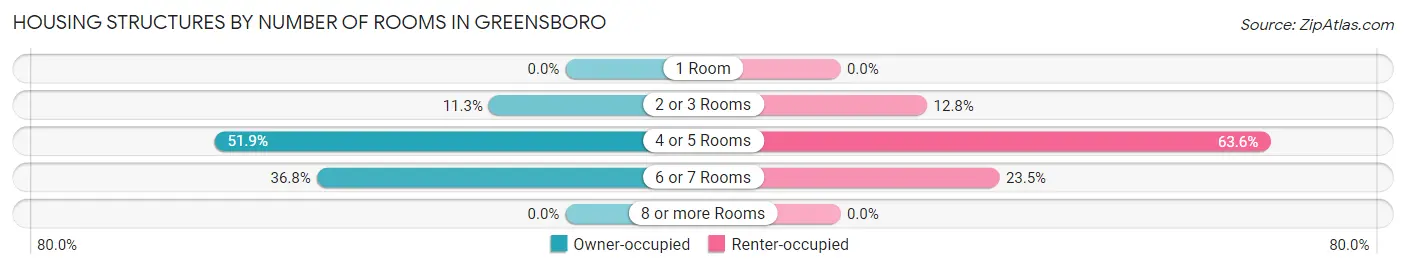
| Number of Rooms | Owner-occupied | Renter-occupied |
| 1 Room | 0 (0.0%) | 0 (0.0%) |
| 2 or 3 Rooms | 12 (11.3%) | 24 (12.8%) |
| 4 or 5 Rooms | 55 (51.9%) | 119 (63.6%) |
| 6 or 7 Rooms | 39 (36.8%) | 44 (23.5%) |
| 8 or more Rooms | 0 (0.0%) | 0 (0.0%) |
| Total | 106 (100.0%) | 187 (100.0%) |
Housing Structure by Heating Type in Greensboro
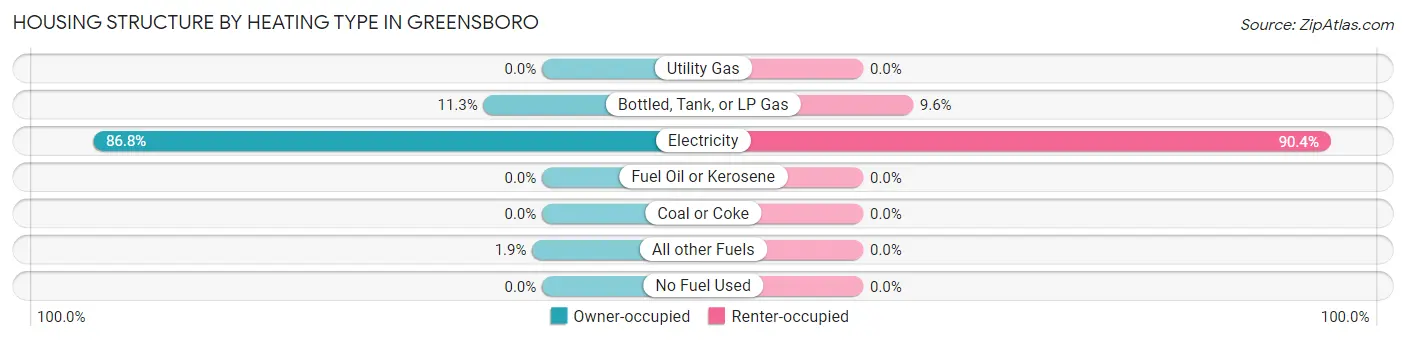
| Heating Type | Owner-occupied | Renter-occupied |
| Utility Gas | 0 (0.0%) | 0 (0.0%) |
| Bottled, Tank, or LP Gas | 12 (11.3%) | 18 (9.6%) |
| Electricity | 92 (86.8%) | 169 (90.4%) |
| Fuel Oil or Kerosene | 0 (0.0%) | 0 (0.0%) |
| Coal or Coke | 0 (0.0%) | 0 (0.0%) |
| All other Fuels | 2 (1.9%) | 0 (0.0%) |
| No Fuel Used | 0 (0.0%) | 0 (0.0%) |
| Total | 106 (100.0%) | 187 (100.0%) |
Household Vehicle Usage in Greensboro
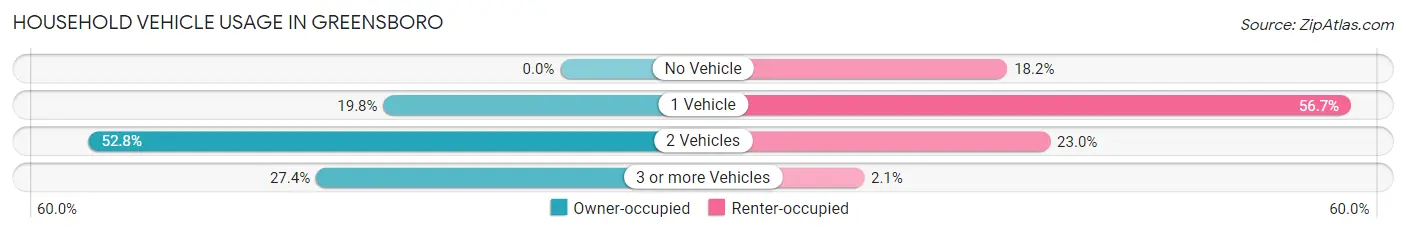
| Vehicles per Household | Owner-occupied | Renter-occupied |
| No Vehicle | 0 (0.0%) | 34 (18.2%) |
| 1 Vehicle | 21 (19.8%) | 106 (56.7%) |
| 2 Vehicles | 56 (52.8%) | 43 (23.0%) |
| 3 or more Vehicles | 29 (27.4%) | 4 (2.1%) |
| Total | 106 (100.0%) | 187 (100.0%) |
Real Estate & Mortgages in Greensboro
Real Estate and Mortgage Overview in Greensboro
| Characteristic | Without Mortgage | With Mortgage |
| Housing Units | 51 | 55 |
| Median Property Value | $154,400 | $133,200 |
| Median Household Income | $55,605 | $6 |
| Monthly Housing Costs | $418 | $0 |
| Real Estate Taxes | $853 | $22 |
Property Value by Mortgage Status in Greensboro
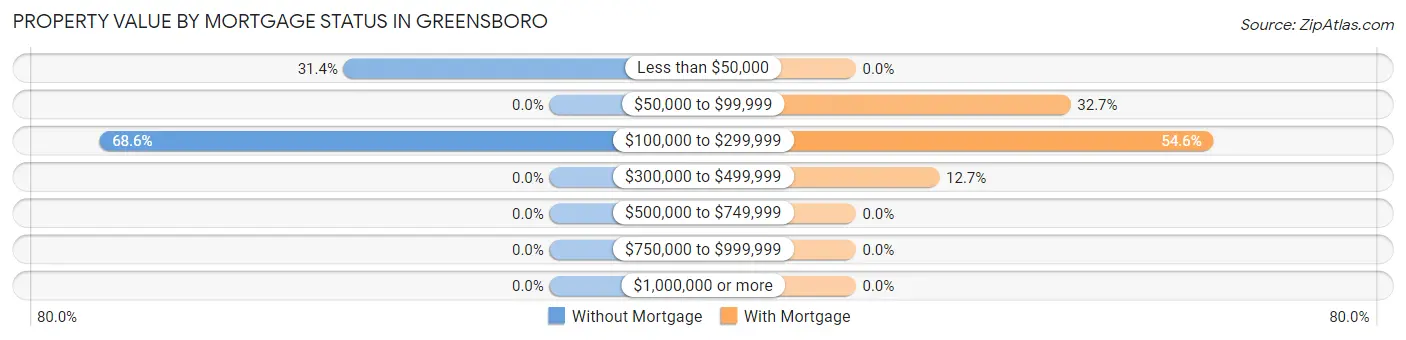
| Property Value | Without Mortgage | With Mortgage |
| Less than $50,000 | 16 (31.4%) | 0 (0.0%) |
| $50,000 to $99,999 | 0 (0.0%) | 18 (32.7%) |
| $100,000 to $299,999 | 35 (68.6%) | 30 (54.5%) |
| $300,000 to $499,999 | 0 (0.0%) | 7 (12.7%) |
| $500,000 to $749,999 | 0 (0.0%) | 0 (0.0%) |
| $750,000 to $999,999 | 0 (0.0%) | 0 (0.0%) |
| $1,000,000 or more | 0 (0.0%) | 0 (0.0%) |
| Total | 51 (100.0%) | 55 (100.0%) |
Household Income by Mortgage Status in Greensboro
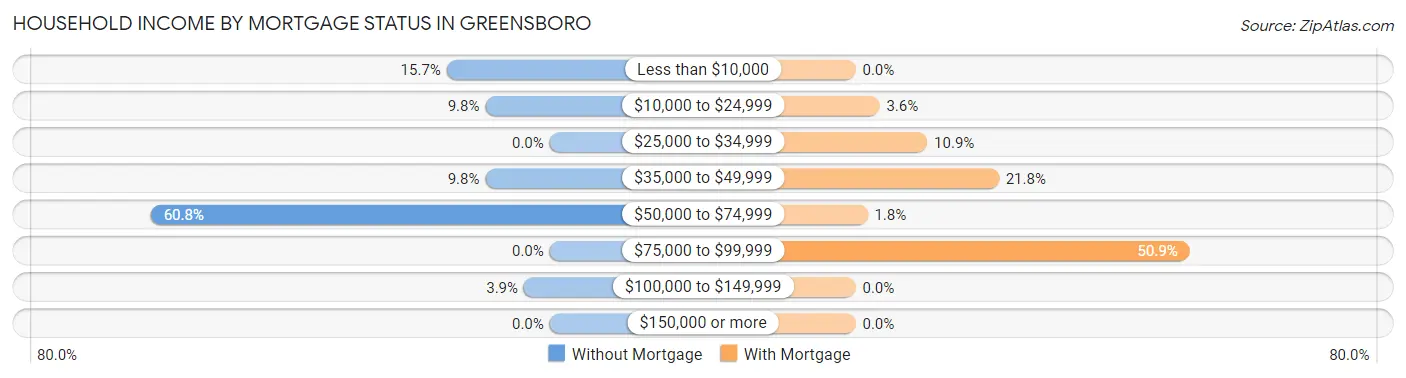
| Household Income | Without Mortgage | With Mortgage |
| Less than $10,000 | 8 (15.7%) | 0 (0.0%) |
| $10,000 to $24,999 | 5 (9.8%) | 2 (3.6%) |
| $25,000 to $34,999 | 0 (0.0%) | 6 (10.9%) |
| $35,000 to $49,999 | 5 (9.8%) | 12 (21.8%) |
| $50,000 to $74,999 | 31 (60.8%) | 1 (1.8%) |
| $75,000 to $99,999 | 0 (0.0%) | 28 (50.9%) |
| $100,000 to $149,999 | 2 (3.9%) | 0 (0.0%) |
| $150,000 or more | 0 (0.0%) | 0 (0.0%) |
| Total | 51 (100.0%) | 55 (100.0%) |
Property Value to Household Income Ratio in Greensboro
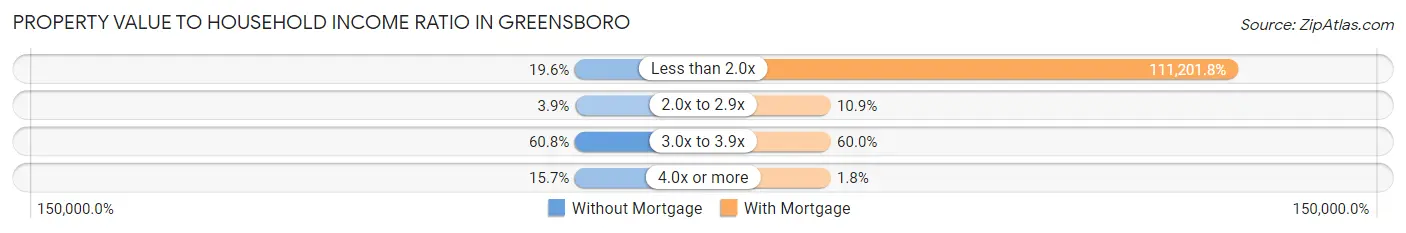
| Value-to-Income Ratio | Without Mortgage | With Mortgage |
| Less than 2.0x | 10 (19.6%) | 61,161 (111,201.8%) |
| 2.0x to 2.9x | 2 (3.9%) | 6 (10.9%) |
| 3.0x to 3.9x | 31 (60.8%) | 33 (60.0%) |
| 4.0x or more | 8 (15.7%) | 1 (1.8%) |
| Total | 51 (100.0%) | 55 (100.0%) |
Real Estate Taxes by Mortgage Status in Greensboro
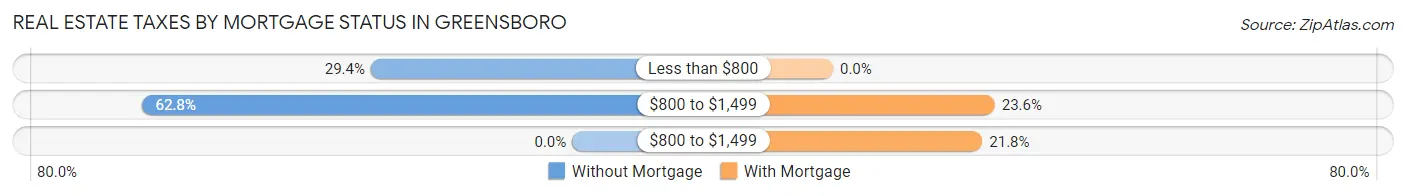
| Property Taxes | Without Mortgage | With Mortgage |
| Less than $800 | 15 (29.4%) | 0 (0.0%) |
| $800 to $1,499 | 32 (62.7%) | 13 (23.6%) |
| $800 to $1,499 | 0 (0.0%) | 12 (21.8%) |
| Total | 51 (100.0%) | 55 (100.0%) |
Health & Disability in Greensboro
Health Insurance Coverage by Age in Greensboro
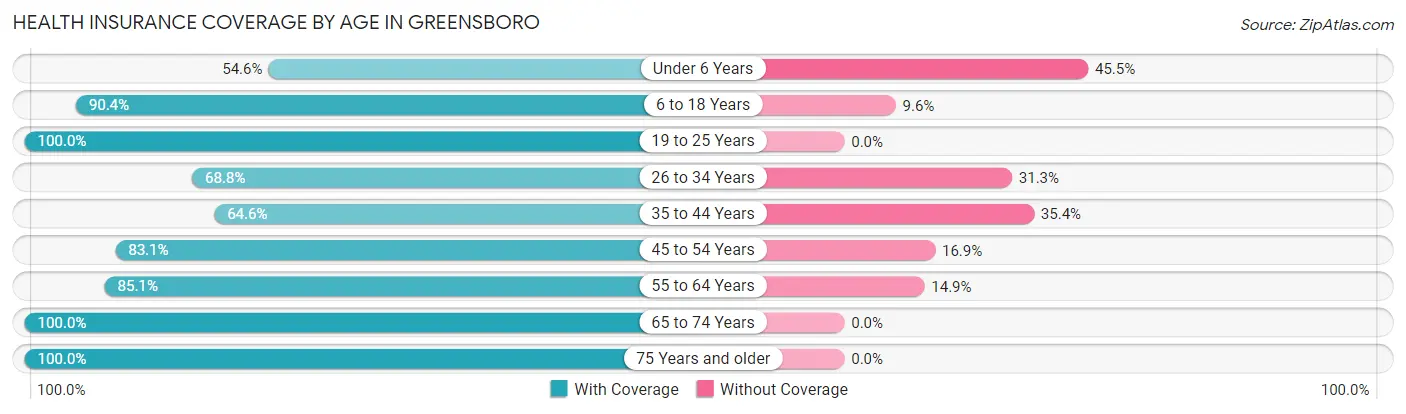
| Age Bracket | With Coverage | Without Coverage |
| Under 6 Years | 18 (54.5%) | 15 (45.5%) |
| 6 to 18 Years | 170 (90.4%) | 18 (9.6%) |
| 19 to 25 Years | 120 (100.0%) | 0 (0.0%) |
| 26 to 34 Years | 11 (68.8%) | 5 (31.2%) |
| 35 to 44 Years | 117 (64.6%) | 64 (35.4%) |
| 45 to 54 Years | 54 (83.1%) | 11 (16.9%) |
| 55 to 64 Years | 57 (85.1%) | 10 (14.9%) |
| 65 to 74 Years | 62 (100.0%) | 0 (0.0%) |
| 75 Years and older | 30 (100.0%) | 0 (0.0%) |
| Total | 639 (83.9%) | 123 (16.1%) |
Health Insurance Coverage by Citizenship Status in Greensboro
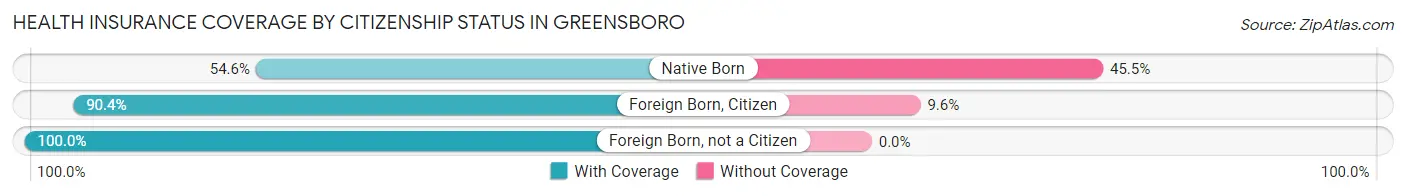
| Citizenship Status | With Coverage | Without Coverage |
| Native Born | 18 (54.5%) | 15 (45.5%) |
| Foreign Born, Citizen | 170 (90.4%) | 18 (9.6%) |
| Foreign Born, not a Citizen | 120 (100.0%) | 0 (0.0%) |
Health Insurance Coverage by Household Income in Greensboro
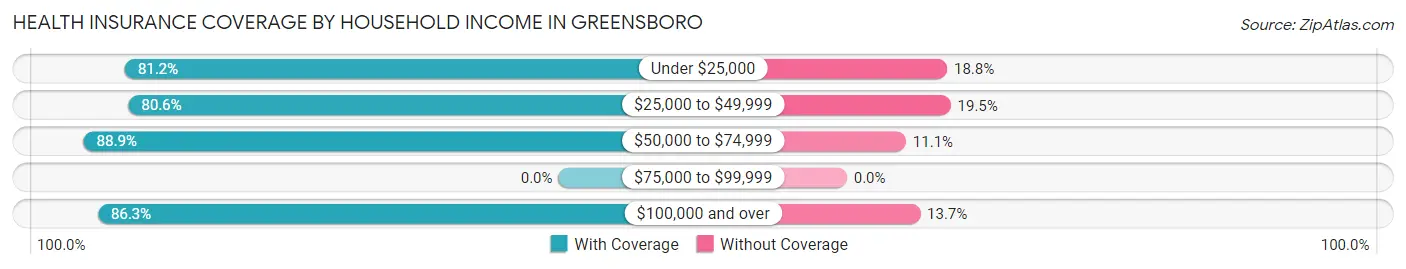
| Household Income | With Coverage | Without Coverage |
| Under $25,000 | 134 (81.2%) | 31 (18.8%) |
| $25,000 to $49,999 | 236 (80.5%) | 57 (19.5%) |
| $50,000 to $74,999 | 225 (88.9%) | 28 (11.1%) |
| $75,000 to $99,999 | 0 (0.0%) | 0 (0.0%) |
| $100,000 and over | 44 (86.3%) | 7 (13.7%) |
Public vs Private Health Insurance Coverage by Age in Greensboro
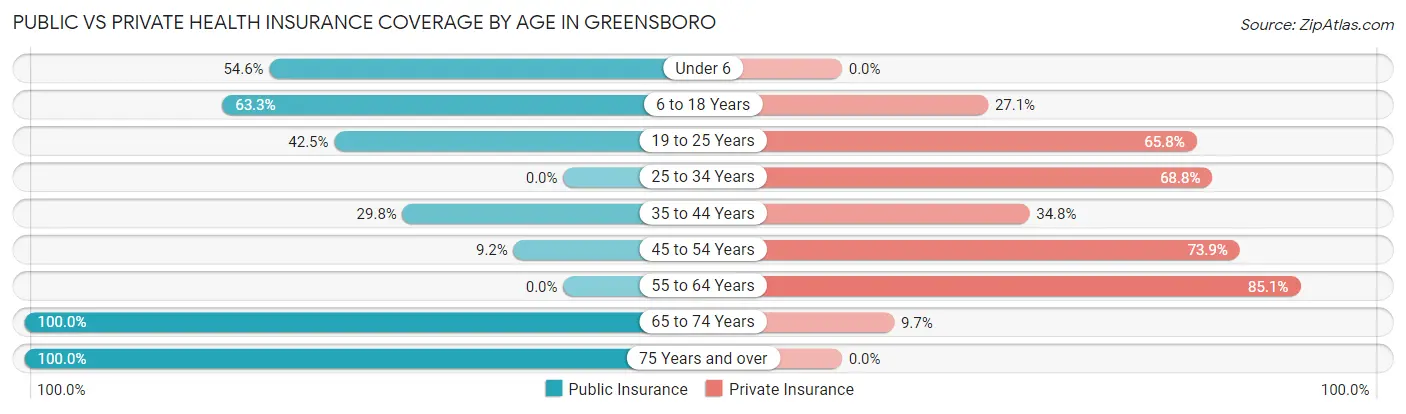
| Age Bracket | Public Insurance | Private Insurance |
| Under 6 | 18 (54.5%) | 0 (0.0%) |
| 6 to 18 Years | 119 (63.3%) | 51 (27.1%) |
| 19 to 25 Years | 51 (42.5%) | 79 (65.8%) |
| 25 to 34 Years | 0 (0.0%) | 11 (68.8%) |
| 35 to 44 Years | 54 (29.8%) | 63 (34.8%) |
| 45 to 54 Years | 6 (9.2%) | 48 (73.9%) |
| 55 to 64 Years | 0 (0.0%) | 57 (85.1%) |
| 65 to 74 Years | 62 (100.0%) | 6 (9.7%) |
| 75 Years and over | 30 (100.0%) | 0 (0.0%) |
| Total | 340 (44.6%) | 315 (41.3%) |
Disability Status by Sex by Age in Greensboro
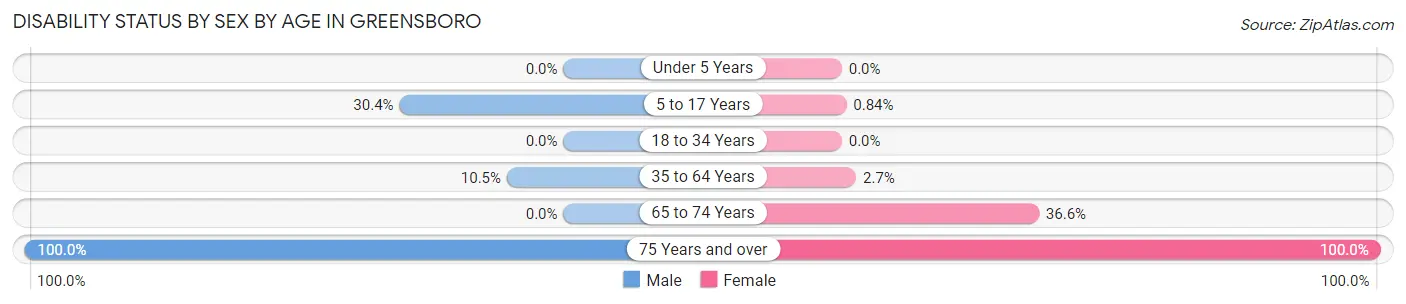
| Age Bracket | Male | Female |
| Under 5 Years | 0 (0.0%) | 0 (0.0%) |
| 5 to 17 Years | 21 (30.4%) | 1 (0.8%) |
| 18 to 34 Years | 0 (0.0%) | 0 (0.0%) |
| 35 to 64 Years | 17 (10.5%) | 4 (2.6%) |
| 65 to 74 Years | 0 (0.0%) | 15 (36.6%) |
| 75 Years and over | 16 (100.0%) | 14 (100.0%) |
Disability Class by Sex by Age in Greensboro
Disability Class: Hearing Difficulty
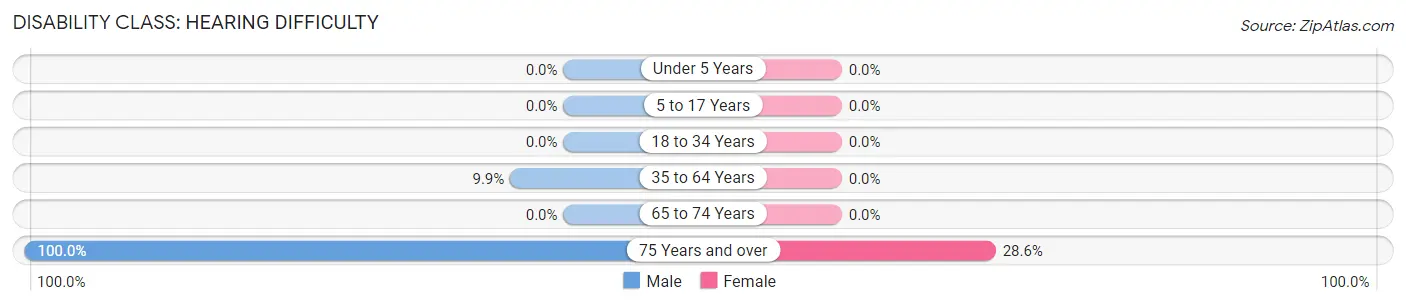
| Age Bracket | Male | Female |
| Under 5 Years | 0 (0.0%) | 0 (0.0%) |
| 5 to 17 Years | 0 (0.0%) | 0 (0.0%) |
| 18 to 34 Years | 0 (0.0%) | 0 (0.0%) |
| 35 to 64 Years | 16 (9.9%) | 0 (0.0%) |
| 65 to 74 Years | 0 (0.0%) | 0 (0.0%) |
| 75 Years and over | 16 (100.0%) | 4 (28.6%) |
Disability Class: Vision Difficulty
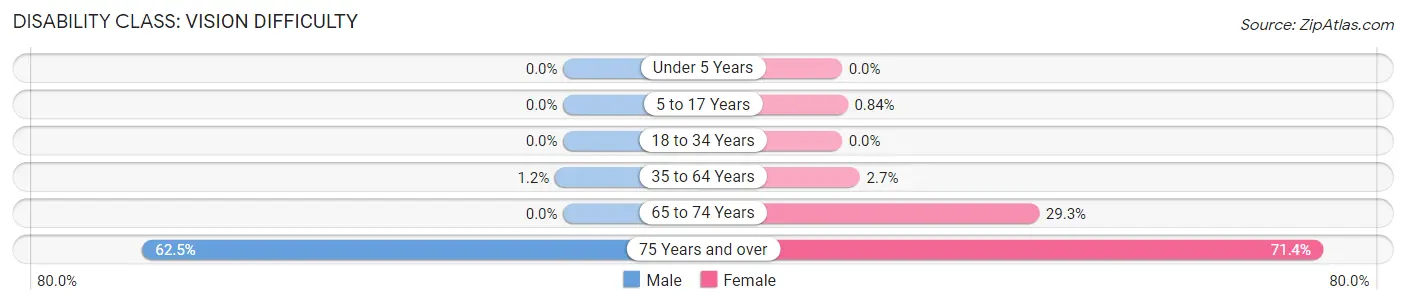
| Age Bracket | Male | Female |
| Under 5 Years | 0 (0.0%) | 0 (0.0%) |
| 5 to 17 Years | 0 (0.0%) | 1 (0.8%) |
| 18 to 34 Years | 0 (0.0%) | 0 (0.0%) |
| 35 to 64 Years | 2 (1.2%) | 4 (2.6%) |
| 65 to 74 Years | 0 (0.0%) | 12 (29.3%) |
| 75 Years and over | 10 (62.5%) | 10 (71.4%) |
Disability Class: Cognitive Difficulty
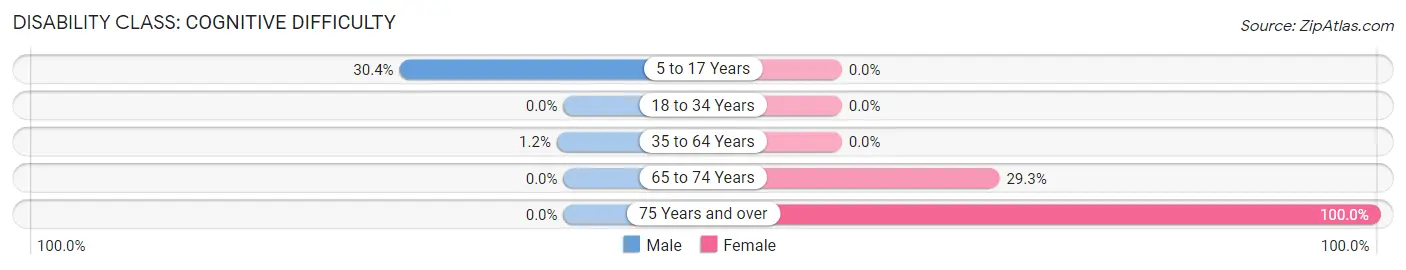
| Age Bracket | Male | Female |
| 5 to 17 Years | 21 (30.4%) | 0 (0.0%) |
| 18 to 34 Years | 0 (0.0%) | 0 (0.0%) |
| 35 to 64 Years | 2 (1.2%) | 0 (0.0%) |
| 65 to 74 Years | 0 (0.0%) | 12 (29.3%) |
| 75 Years and over | 0 (0.0%) | 14 (100.0%) |
Disability Class: Ambulatory Difficulty
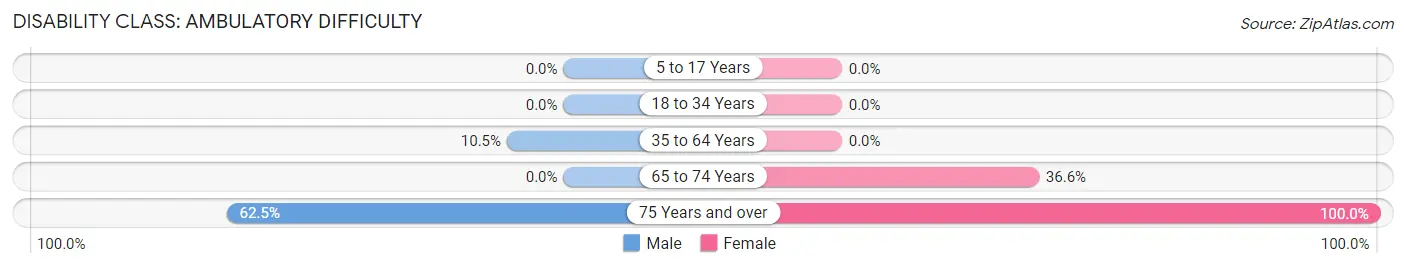
| Age Bracket | Male | Female |
| 5 to 17 Years | 0 (0.0%) | 0 (0.0%) |
| 18 to 34 Years | 0 (0.0%) | 0 (0.0%) |
| 35 to 64 Years | 17 (10.5%) | 0 (0.0%) |
| 65 to 74 Years | 0 (0.0%) | 15 (36.6%) |
| 75 Years and over | 10 (62.5%) | 14 (100.0%) |
Disability Class: Self-Care Difficulty
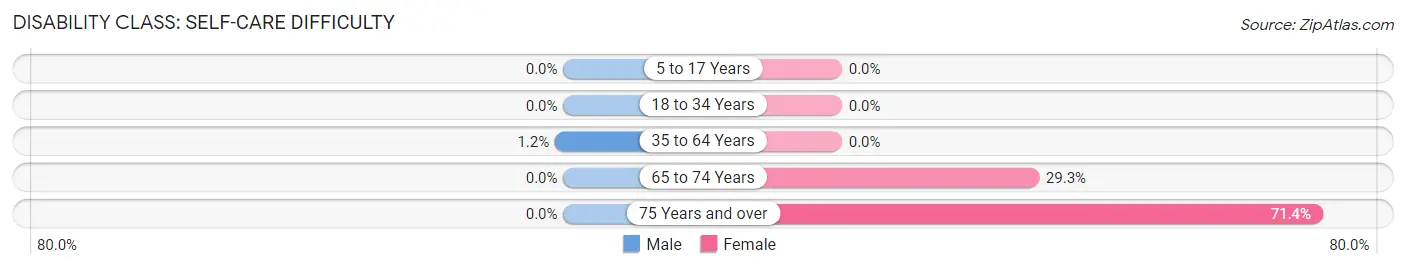
| Age Bracket | Male | Female |
| 5 to 17 Years | 0 (0.0%) | 0 (0.0%) |
| 18 to 34 Years | 0 (0.0%) | 0 (0.0%) |
| 35 to 64 Years | 2 (1.2%) | 0 (0.0%) |
| 65 to 74 Years | 0 (0.0%) | 12 (29.3%) |
| 75 Years and over | 0 (0.0%) | 10 (71.4%) |
Technology Access in Greensboro
Computing Device Access in Greensboro
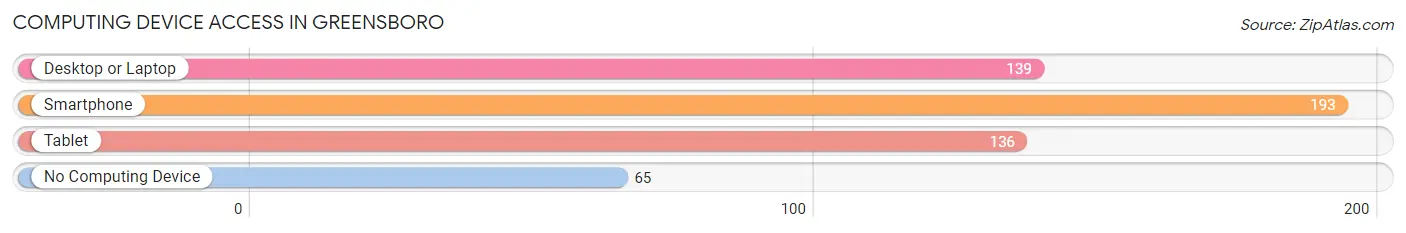
| Device Type | # Households | % Households |
| Desktop or Laptop | 139 | 47.4% |
| Smartphone | 193 | 65.9% |
| Tablet | 136 | 46.4% |
| No Computing Device | 65 | 22.2% |
| Total | 293 | 100.0% |
Internet Access in Greensboro
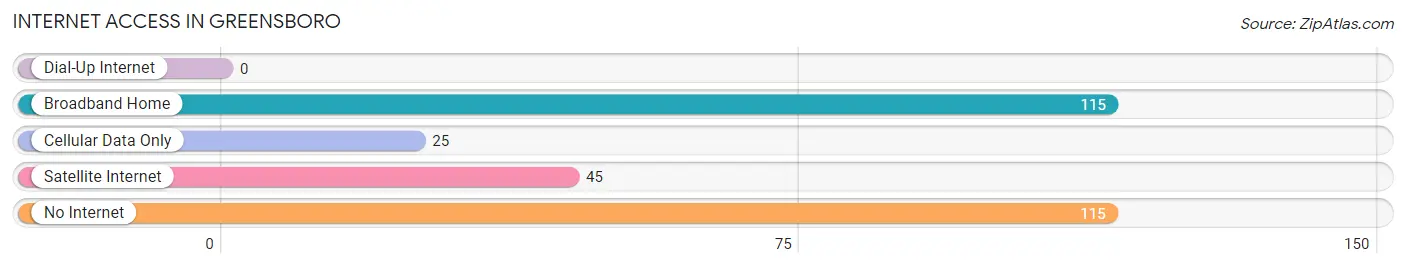
| Internet Type | # Households | % Households |
| Dial-Up Internet | 0 | 0.0% |
| Broadband Home | 115 | 39.3% |
| Cellular Data Only | 25 | 8.5% |
| Satellite Internet | 45 | 15.4% |
| No Internet | 115 | 39.3% |
| Total | 293 | 100.0% |
Greensboro Summary
Greensboro is a small town located in the state of Florida in the United States. It is situated in the western part of the state, in the panhandle region, and is part of the Gadsden County. The town has a population of around 1,000 people and is located about 20 miles east of Tallahassee, the state capital.
Geography
Greensboro is located in the western part of the Florida panhandle, in Gadsden County. The town is situated on the banks of the Ochlockonee River, which flows southward into the Gulf of Mexico. The town is surrounded by a number of small lakes, including Lake Talquin, Lake Jackson, and Lake Seminole. The town is located in a rural area, with the nearest major city being Tallahassee, which is about 20 miles away.
The town has a total area of 1.2 square miles, all of which is land. The town is located at an elevation of around 100 feet above sea level. The climate in the area is classified as humid subtropical, with hot, humid summers and mild winters.
History
Greensboro was founded in 1825 by settlers from Georgia. The town was named after General Nathanael Greene, a Revolutionary War hero. The town was originally a small farming community, and the main crops grown in the area were cotton and corn.
In the late 19th century, the town began to grow and develop, and by the early 20th century, it had become a thriving community. The town was home to a number of businesses, including a sawmill, a gristmill, and a cotton gin.
In the mid-20th century, the town began to decline, as many of the businesses closed down. The town was also affected by the Great Depression, and many of the residents left in search of work. In the late 20th century, the town began to experience a resurgence, as new businesses opened up and the population began to grow again.
Economy
Greensboro is a small town, and the economy is largely based on agriculture and tourism. The town is home to a number of farms, which produce a variety of crops, including corn, cotton, and soybeans. The town is also home to a number of small businesses, including restaurants, shops, and other services.
The town is also a popular tourist destination, as it is located close to a number of attractions, including the Apalachicola National Forest, the Ochlockonee River State Park, and the St. Marks National Wildlife Refuge.
Demographics
Greensboro has a population of around 1,000 people, according to the 2010 census. The town is predominantly white, with around 85% of the population being white. The remaining 15% of the population is made up of African Americans, Hispanics, and other races.
The median household income in the town is around $30,000, and the median home value is around $90,000. The town has a high poverty rate, with around 25% of the population living below the poverty line.
Conclusion
Greensboro is a small town located in the western part of the Florida panhandle. The town has a population of around 1,000 people and is largely based on agriculture and tourism. The town is predominantly white, with around 85% of the population being white. The median household income in the town is around $30,000, and the median home value is around $90,000. The town has a high poverty rate, with around 25% of the population living below the poverty line.
Common Questions
What is Per Capita Income in Greensboro?
Per Capita income in Greensboro is $15,493.
What is the Median Family Income in Greensboro?
Median Family Income in Greensboro is $44,362.
What is the Median Household income in Greensboro?
Median Household Income in Greensboro is $43,342.
What is Income or Wage Gap in Greensboro?
Income or Wage Gap in Greensboro is 20.6%.
Women in Greensboro earn 79.4 cents for every dollar earned by a man.
What is Inequality or Gini Index in Greensboro?
Inequality or Gini Index in Greensboro is 0.35.
What is the Total Population of Greensboro?
Total Population of Greensboro is 762.
What is the Total Male Population of Greensboro?
Total Male Population of Greensboro is 332.
What is the Total Female Population of Greensboro?
Total Female Population of Greensboro is 430.
What is the Ratio of Males per 100 Females in Greensboro?
There are 77.21 Males per 100 Females in Greensboro.
What is the Ratio of Females per 100 Males in Greensboro?
There are 129.52 Females per 100 Males in Greensboro.
What is the Median Population Age in Greensboro?
Median Population Age in Greensboro is 37.3 Years.
What is the Average Family Size in Greensboro
Average Family Size in Greensboro is 2.9 People.
What is the Average Household Size in Greensboro
Average Household Size in Greensboro is 2.6 People.
How Large is the Labor Force in Greensboro?
There are 264 People in the Labor Forcein in Greensboro.
What is the Percentage of People in the Labor Force in Greensboro?
46.8% of People are in the Labor Force in Greensboro.