Grand Ridge, FL Map & Demographics
Grand Ridge Map
Grand Ridge Overview
$24,454
PER CAPITA INCOME
$51,250
AVG FAMILY INCOME
$37,065
AVG HOUSEHOLD INCOME
4.4%
WAGE / INCOME GAP [ % ]
95.6¢/ $1
WAGE / INCOME GAP [ $ ]
$14,060
FAMILY INCOME DEFICIT
0.46
INEQUALITY / GINI INDEX
824
TOTAL POPULATION
324
MALE POPULATION
500
FEMALE POPULATION
64.80
MALES / 100 FEMALES
154.32
FEMALES / 100 MALES
39.8
MEDIAN AGE
3.2
AVG FAMILY SIZE
2.5
AVG HOUSEHOLD SIZE
394
LABOR FORCE [ PEOPLE ]
55.0%
PERCENT IN LABOR FORCE
2.3%
UNEMPLOYMENT RATE
Grand Ridge Zip Codes
Grand Ridge Area Codes
Income in Grand Ridge
Income Overview in Grand Ridge
Per Capita Income in Grand Ridge is $24,454, while median incomes of families and households are $51,250 and $37,065 respectively.
| Characteristic | Number | Measure |
| Per Capita Income | 824 | $24,454 |
| Median Family Income | 200 | $51,250 |
| Mean Family Income | 200 | $72,200 |
| Median Household Income | 326 | $37,065 |
| Mean Household Income | 326 | $58,119 |
| Income Deficit | 200 | $14,060 |
| Wage / Income Gap (%) | 824 | 4.44% |
| Wage / Income Gap ($) | 824 | 95.56¢ per $1 |
| Gini / Inequality Index | 824 | 0.46 |
Earnings by Sex in Grand Ridge
Average Earnings in Grand Ridge are $30,583, $31,042 for men and $29,665 for women, a difference of 4.4%.
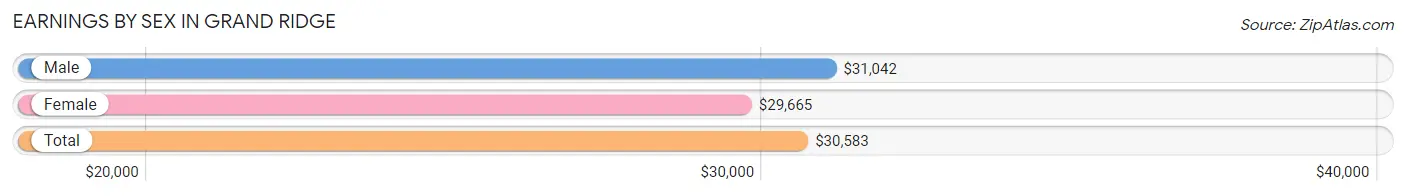
| Sex | Number | Average Earnings |
| Male | 199 (50.2%) | $31,042 |
| Female | 197 (49.7%) | $29,665 |
| Total | 396 (100.0%) | $30,583 |
Earnings by Sex by Income Bracket in Grand Ridge
The most common earnings brackets in Grand Ridge are $30,000 to $34,999 for men (56 | 28.1%) and $25,000 to $29,999 for women (48 | 24.4%).
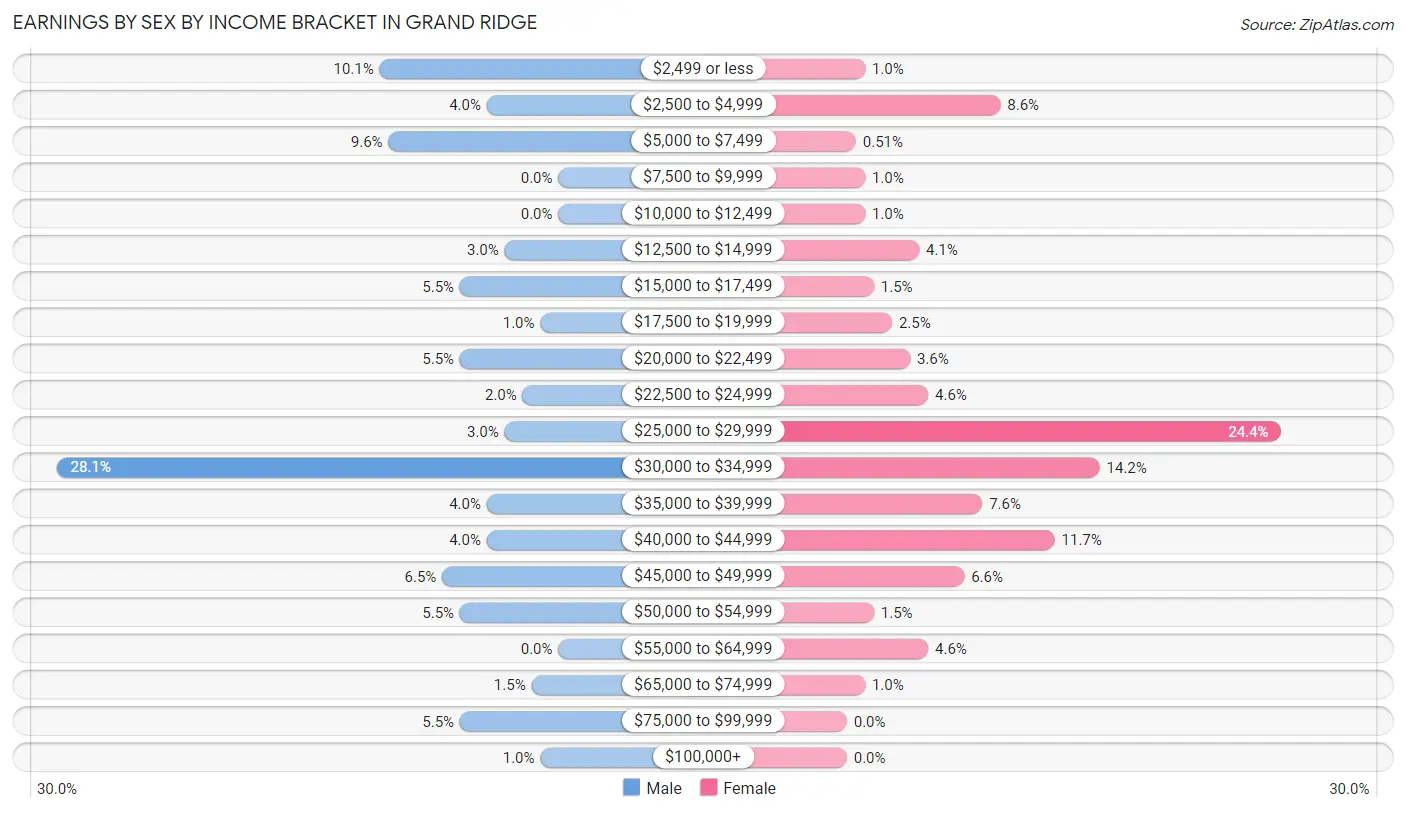
| Income | Male | Female |
| $2,499 or less | 20 (10.1%) | 2 (1.0%) |
| $2,500 to $4,999 | 8 (4.0%) | 17 (8.6%) |
| $5,000 to $7,499 | 19 (9.6%) | 1 (0.5%) |
| $7,500 to $9,999 | 0 (0.0%) | 2 (1.0%) |
| $10,000 to $12,499 | 0 (0.0%) | 2 (1.0%) |
| $12,500 to $14,999 | 6 (3.0%) | 8 (4.1%) |
| $15,000 to $17,499 | 11 (5.5%) | 3 (1.5%) |
| $17,500 to $19,999 | 2 (1.0%) | 5 (2.5%) |
| $20,000 to $22,499 | 11 (5.5%) | 7 (3.5%) |
| $22,500 to $24,999 | 4 (2.0%) | 9 (4.6%) |
| $25,000 to $29,999 | 6 (3.0%) | 48 (24.4%) |
| $30,000 to $34,999 | 56 (28.1%) | 28 (14.2%) |
| $35,000 to $39,999 | 8 (4.0%) | 15 (7.6%) |
| $40,000 to $44,999 | 8 (4.0%) | 23 (11.7%) |
| $45,000 to $49,999 | 13 (6.5%) | 13 (6.6%) |
| $50,000 to $54,999 | 11 (5.5%) | 3 (1.5%) |
| $55,000 to $64,999 | 0 (0.0%) | 9 (4.6%) |
| $65,000 to $74,999 | 3 (1.5%) | 2 (1.0%) |
| $75,000 to $99,999 | 11 (5.5%) | 0 (0.0%) |
| $100,000+ | 2 (1.0%) | 0 (0.0%) |
| Total | 199 (100.0%) | 197 (100.0%) |
Earnings by Sex by Educational Attainment in Grand Ridge
Average earnings in Grand Ridge are $31,625 for men and $32,723 for women, a difference of 3.4%. Men with an educational attainment of college or associate's degree enjoy the highest average annual earnings of $34,565, while those with less than high school education earn the least with $2,499. Women with an educational attainment of graduate degree earn the most with the average annual earnings of $47,083, while those with less than high school education have the smallest earnings of $23,125.
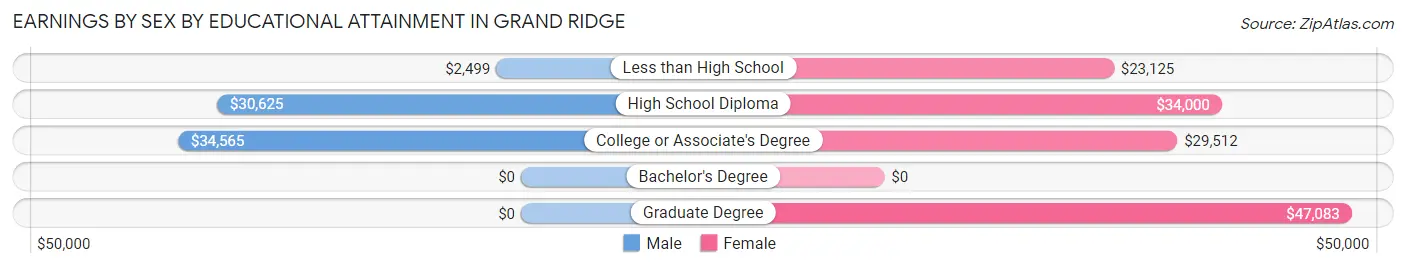
| Educational Attainment | Male Income | Female Income |
| Less than High School | $2,499 | $23,125 |
| High School Diploma | $30,625 | $34,000 |
| College or Associate's Degree | $34,565 | $29,512 |
| Bachelor's Degree | - | - |
| Graduate Degree | - | - |
| Total | $31,625 | $32,723 |
Family Income in Grand Ridge
Family Income Brackets in Grand Ridge
According to the Grand Ridge family income data, there are 41 families falling into the $50,000 to $74,999 income range, which is the most common income bracket and makes up 20.5% of all families. Conversely, the $200,000+ income bracket is the least frequent group with only 2 families (1.0%) belonging to this category.
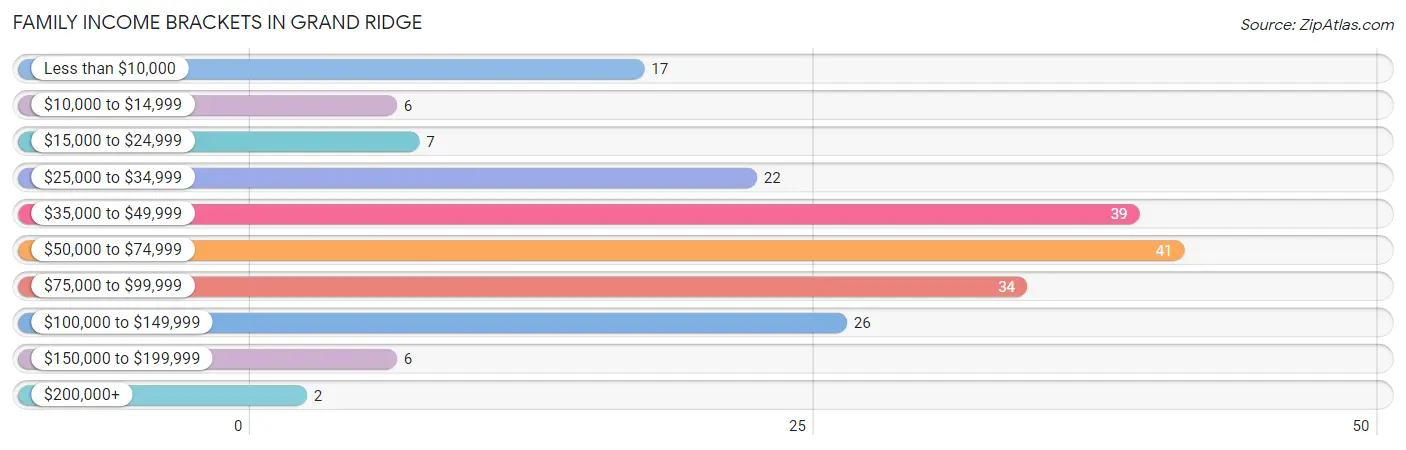
| Income Bracket | # Families | % Families |
| Less than $10,000 | 17 | 8.5% |
| $10,000 to $14,999 | 6 | 3.0% |
| $15,000 to $24,999 | 7 | 3.5% |
| $25,000 to $34,999 | 22 | 11.0% |
| $35,000 to $49,999 | 39 | 19.5% |
| $50,000 to $74,999 | 41 | 20.5% |
| $75,000 to $99,999 | 34 | 17.0% |
| $100,000 to $149,999 | 26 | 13.0% |
| $150,000 to $199,999 | 6 | 3.0% |
| $200,000+ | 2 | 1.0% |
Family Income by Famaliy Size in Grand Ridge
4-person families (30 | 15.0%) account for the highest median family income in Grand Ridge with $73,750 per family, while 2-person families (93 | 46.5%) have the highest median income of $18,560 per family member.
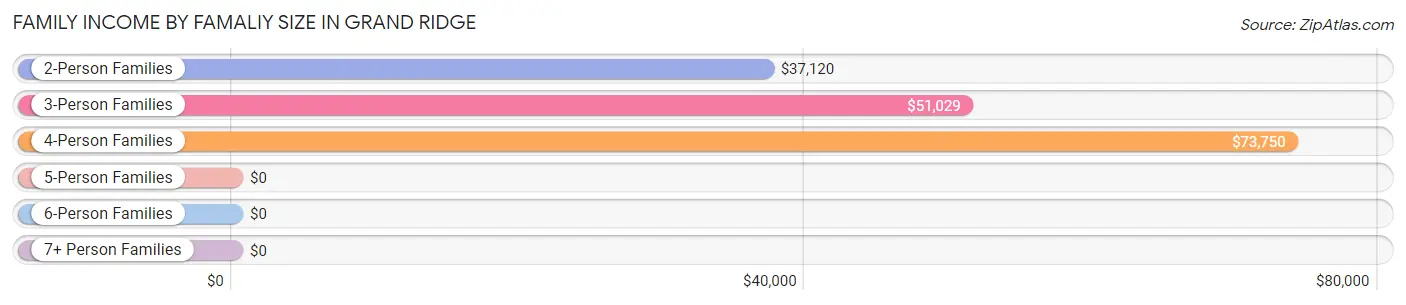
| Income Bracket | # Families | Median Income |
| 2-Person Families | 93 (46.5%) | $37,120 |
| 3-Person Families | 52 (26.0%) | $51,029 |
| 4-Person Families | 30 (15.0%) | $73,750 |
| 5-Person Families | 16 (8.0%) | $0 |
| 6-Person Families | 9 (4.5%) | $0 |
| 7+ Person Families | 0 (0.0%) | $0 |
| Total | 200 (100.0%) | $51,250 |
Family Income by Number of Earners in Grand Ridge
The median family income in Grand Ridge is $51,250, with families comprising 3+ earners (16) having the highest median family income of $89,643, while families with 1 earner (65) have the lowest median family income of $41,875, accounting for 8.0% and 32.5% of families, respectively.
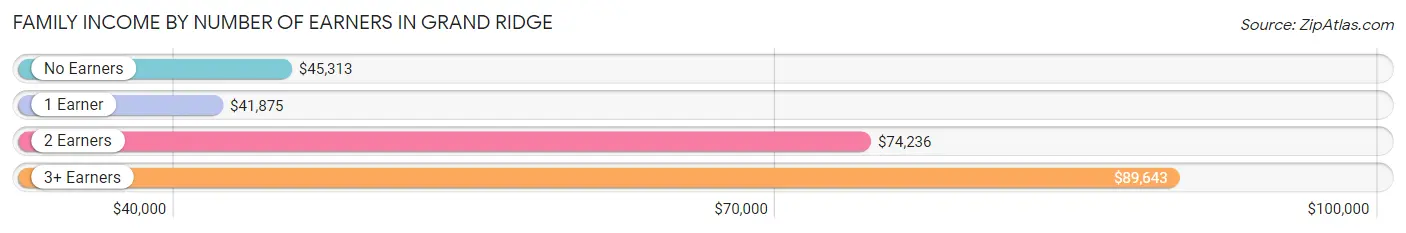
| Number of Earners | # Families | Median Income |
| No Earners | 50 (25.0%) | $45,313 |
| 1 Earner | 65 (32.5%) | $41,875 |
| 2 Earners | 69 (34.5%) | $74,236 |
| 3+ Earners | 16 (8.0%) | $89,643 |
| Total | 200 (100.0%) | $51,250 |
Household Income in Grand Ridge
Household Income Brackets in Grand Ridge
With 62 households falling in the category, the $75,000 to $99,999 income range is the most frequent in Grand Ridge, accounting for 19.0% of all households. In contrast, only 2 households (0.6%) fall into the $200,000+ income bracket, making it the least populous group.
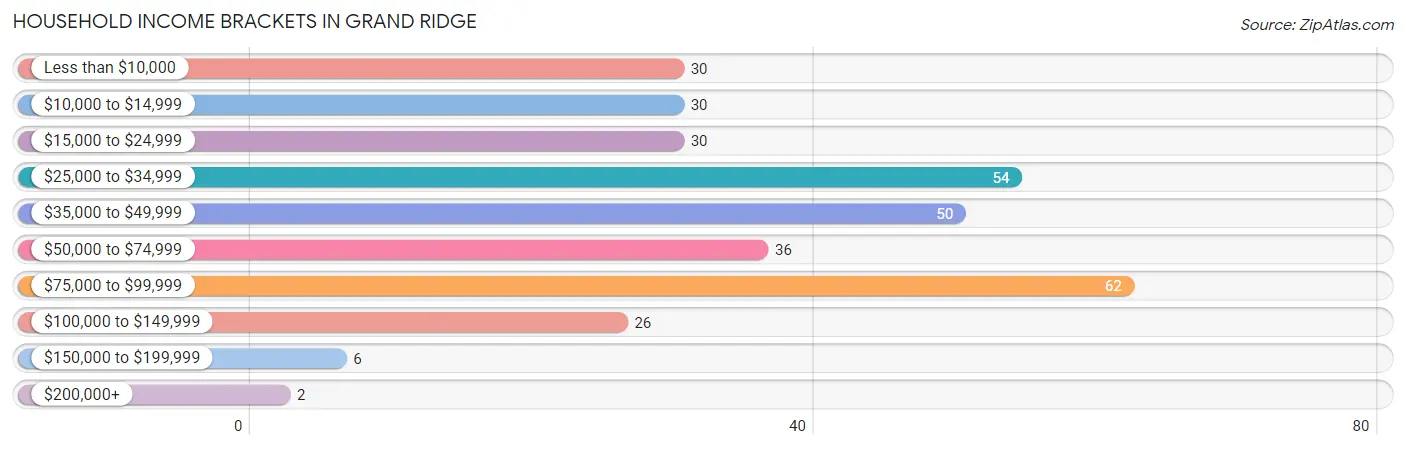
| Income Bracket | # Households | % Households |
| Less than $10,000 | 30 | 9.2% |
| $10,000 to $14,999 | 30 | 9.2% |
| $15,000 to $24,999 | 30 | 9.2% |
| $25,000 to $34,999 | 54 | 16.6% |
| $35,000 to $49,999 | 50 | 15.3% |
| $50,000 to $74,999 | 36 | 11.0% |
| $75,000 to $99,999 | 62 | 19.0% |
| $100,000 to $149,999 | 26 | 8.0% |
| $150,000 to $199,999 | 6 | 1.8% |
| $200,000+ | 2 | 0.6% |
Household Income by Householder Age in Grand Ridge
The median household income in Grand Ridge is $37,065, with the highest median household income of $37,125 found in the 25 to 44 years age bracket for the primary householder. A total of 90 households (27.6%) fall into this category. Meanwhile, the 15 to 24 years age bracket for the primary householder has the lowest median household income of $0, with 11 households (3.4%) in this group.
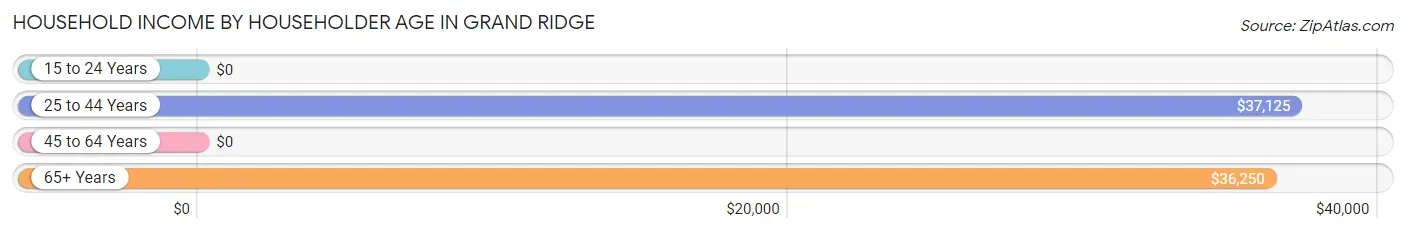
| Income Bracket | # Households | Median Income |
| 15 to 24 Years | 11 (3.4%) | $0 |
| 25 to 44 Years | 90 (27.6%) | $37,125 |
| 45 to 64 Years | 106 (32.5%) | $0 |
| 65+ Years | 119 (36.5%) | $36,250 |
| Total | 326 (100.0%) | $37,065 |
Poverty in Grand Ridge
Income Below Poverty by Sex and Age in Grand Ridge
With 16.1% poverty level for males and 22.0% for females among the residents of Grand Ridge, 6 to 11 year old males and 15 year old females are the most vulnerable to poverty, with 4 males (100.0%) and 5 females (71.4%) in their respective age groups living below the poverty level.
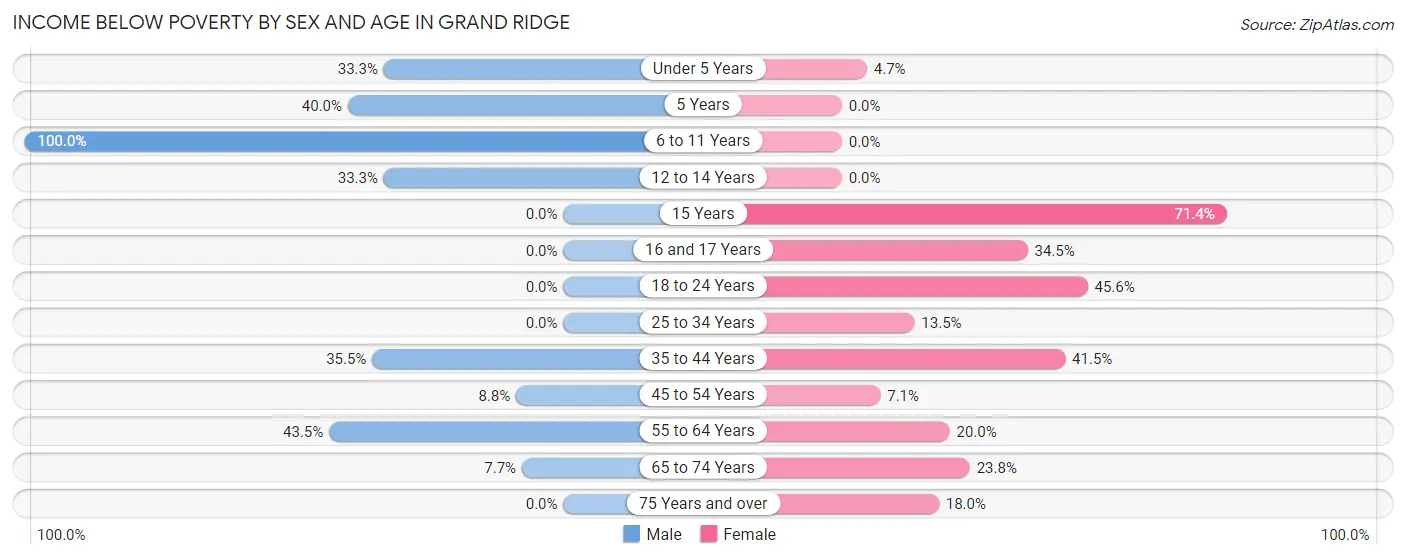
| Age Bracket | Male | Female |
| Under 5 Years | 5 (33.3%) | 2 (4.6%) |
| 5 Years | 2 (40.0%) | 0 (0.0%) |
| 6 to 11 Years | 4 (100.0%) | 0 (0.0%) |
| 12 to 14 Years | 2 (33.3%) | 0 (0.0%) |
| 15 Years | 0 (0.0%) | 5 (71.4%) |
| 16 and 17 Years | 0 (0.0%) | 10 (34.5%) |
| 18 to 24 Years | 0 (0.0%) | 26 (45.6%) |
| 25 to 34 Years | 0 (0.0%) | 12 (13.5%) |
| 35 to 44 Years | 11 (35.5%) | 17 (41.5%) |
| 45 to 54 Years | 5 (8.8%) | 3 (7.1%) |
| 55 to 64 Years | 20 (43.5%) | 7 (20.0%) |
| 65 to 74 Years | 3 (7.7%) | 19 (23.7%) |
| 75 Years and over | 0 (0.0%) | 9 (18.0%) |
| Total | 52 (16.1%) | 110 (22.0%) |
Income Above Poverty by Sex and Age in Grand Ridge
According to the poverty statistics in Grand Ridge, males aged 18 to 24 years and females aged 5 years are the age groups that are most secure financially, with 100.0% of males and 100.0% of females in these age groups living above the poverty line.
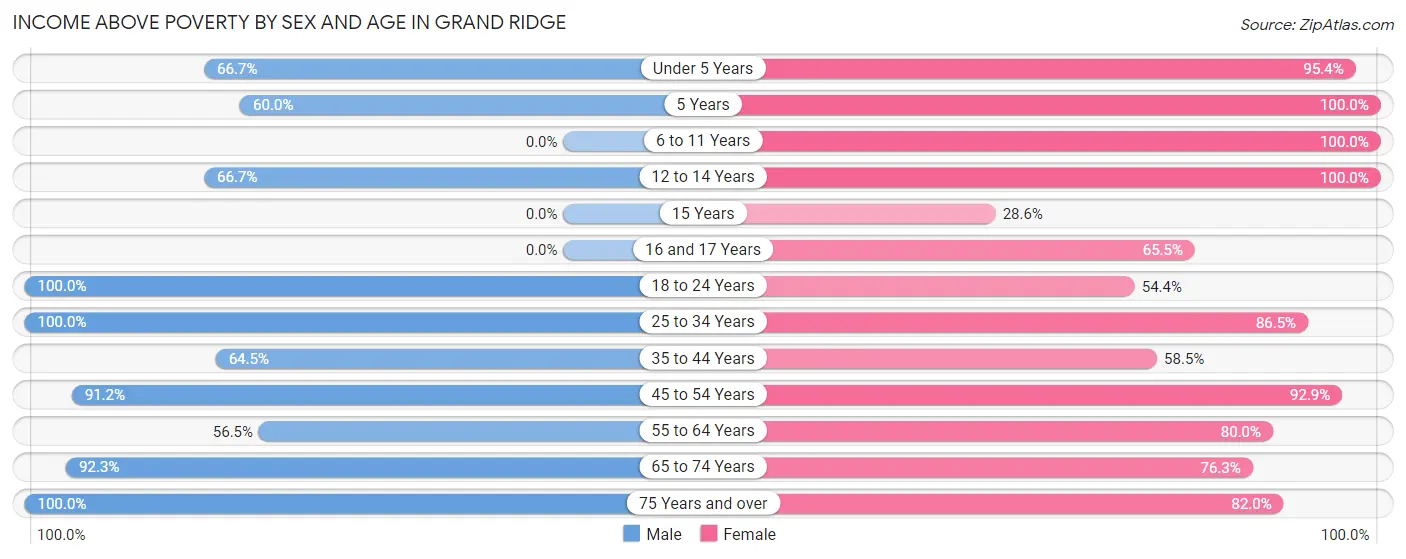
| Age Bracket | Male | Female |
| Under 5 Years | 10 (66.7%) | 41 (95.4%) |
| 5 Years | 3 (60.0%) | 6 (100.0%) |
| 6 to 11 Years | 0 (0.0%) | 12 (100.0%) |
| 12 to 14 Years | 4 (66.7%) | 9 (100.0%) |
| 15 Years | 0 (0.0%) | 2 (28.6%) |
| 16 and 17 Years | 0 (0.0%) | 19 (65.5%) |
| 18 to 24 Years | 34 (100.0%) | 31 (54.4%) |
| 25 to 34 Years | 73 (100.0%) | 77 (86.5%) |
| 35 to 44 Years | 20 (64.5%) | 24 (58.5%) |
| 45 to 54 Years | 52 (91.2%) | 39 (92.9%) |
| 55 to 64 Years | 26 (56.5%) | 28 (80.0%) |
| 65 to 74 Years | 36 (92.3%) | 61 (76.2%) |
| 75 Years and over | 14 (100.0%) | 41 (82.0%) |
| Total | 272 (84.0%) | 390 (78.0%) |
Income Below Poverty Among Married-Couple Families in Grand Ridge
The poverty statistics for married-couple families in Grand Ridge show that 10.6% or 15 of the total 142 families live below the poverty line. Families with 1 or 2 children have the highest poverty rate of 18.8%, comprising of 9 families. On the other hand, families with 3 or 4 children have the lowest poverty rate of 0.0%, which includes 0 families.
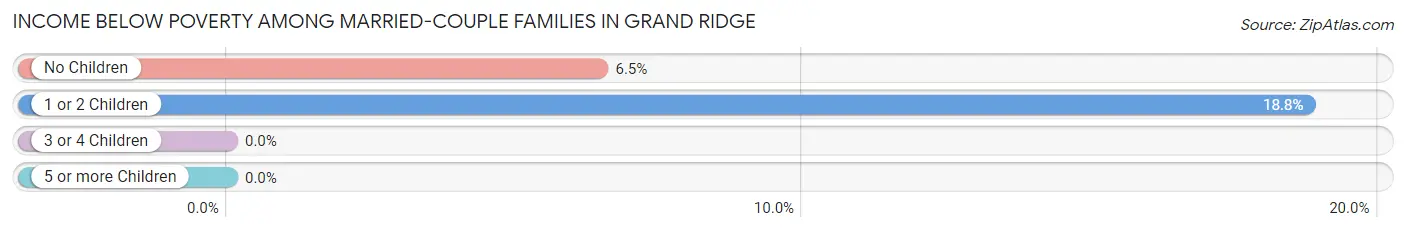
| Children | Above Poverty | Below Poverty |
| No Children | 87 (93.5%) | 6 (6.5%) |
| 1 or 2 Children | 39 (81.2%) | 9 (18.8%) |
| 3 or 4 Children | 1 (100.0%) | 0 (0.0%) |
| 5 or more Children | 0 (0.0%) | 0 (0.0%) |
| Total | 127 (89.4%) | 15 (10.6%) |
Income Below Poverty Among Single-Parent Households in Grand Ridge
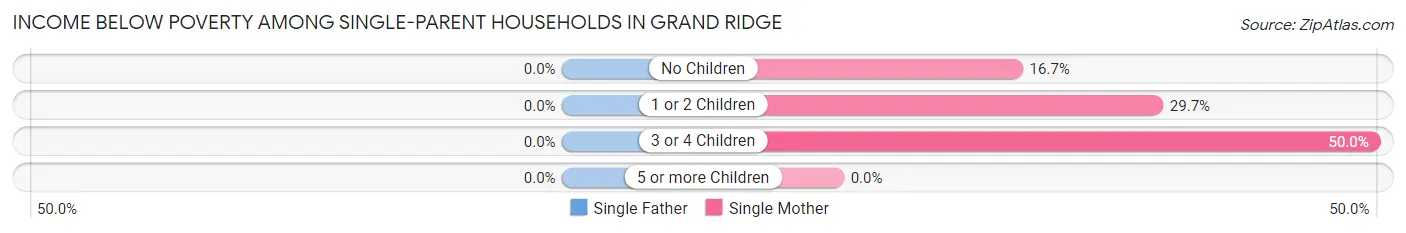
| Children | Single Father | Single Mother |
| No Children | 0 (0.0%) | 2 (16.7%) |
| 1 or 2 Children | 0 (0.0%) | 11 (29.7%) |
| 3 or 4 Children | 0 (0.0%) | 2 (50.0%) |
| 5 or more Children | 0 (0.0%) | 0 (0.0%) |
| Total | 0 (0.0%) | 15 (28.3%) |
Income Below Poverty Among Married-Couple vs Single-Parent Households in Grand Ridge
The poverty data for Grand Ridge shows that 15 of the married-couple family households (10.6%) and 15 of the single-parent households (25.9%) are living below the poverty level. Within the married-couple family households, those with 1 or 2 children have the highest poverty rate, with 9 households (18.8%) falling below the poverty line. Among the single-parent households, those with 3 or 4 children have the highest poverty rate, with 2 household (50.0%) living below poverty.
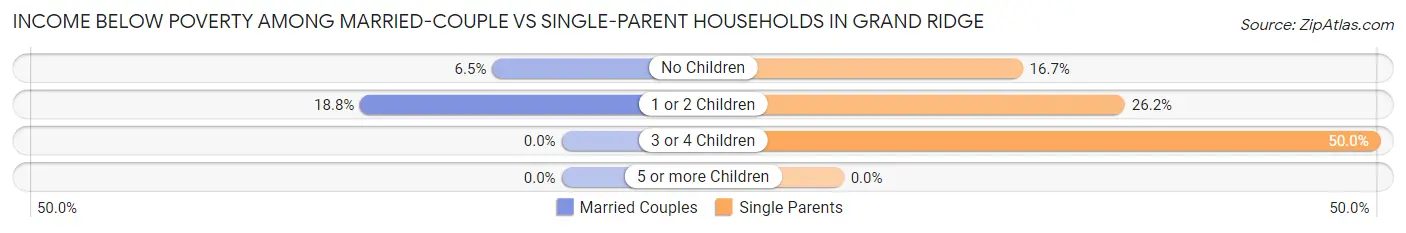
| Children | Married-Couple Families | Single-Parent Households |
| No Children | 6 (6.5%) | 2 (16.7%) |
| 1 or 2 Children | 9 (18.8%) | 11 (26.2%) |
| 3 or 4 Children | 0 (0.0%) | 2 (50.0%) |
| 5 or more Children | 0 (0.0%) | 0 (0.0%) |
| Total | 15 (10.6%) | 15 (25.9%) |
Race in Grand Ridge
The most populous races in Grand Ridge are White / Caucasian (660 | 80.1%), Black / African American (123 | 14.9%), and Native / Alaskan (16 | 1.9%).
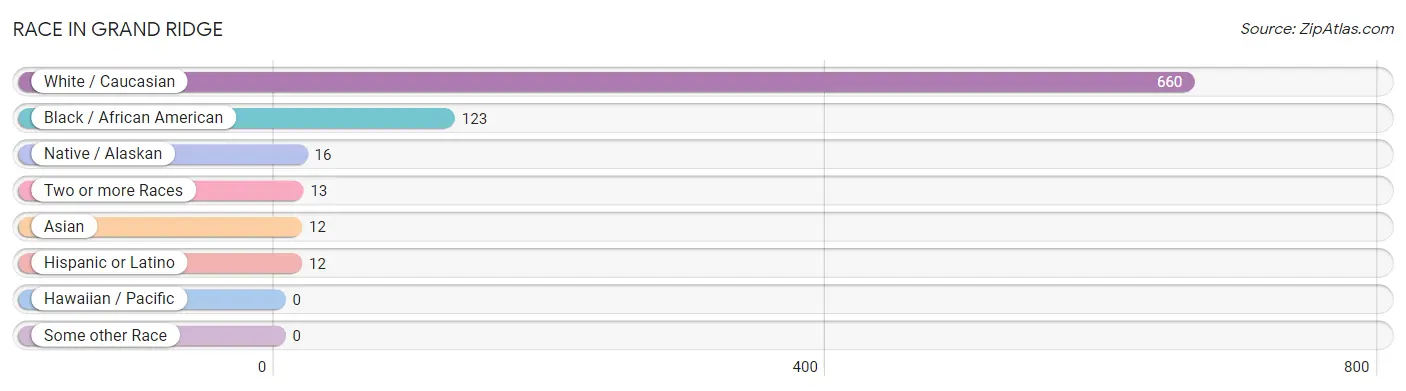
| Race | # Population | % Population |
| Asian | 12 | 1.5% |
| Black / African American | 123 | 14.9% |
| Hawaiian / Pacific | 0 | 0.0% |
| Hispanic or Latino | 12 | 1.5% |
| Native / Alaskan | 16 | 1.9% |
| White / Caucasian | 660 | 80.1% |
| Two or more Races | 13 | 1.6% |
| Some other Race | 0 | 0.0% |
| Total | 824 | 100.0% |
Ancestry in Grand Ridge
The most populous ancestries reported in Grand Ridge are American (309 | 37.5%), English (40 | 4.9%), German (19 | 2.3%), Irish (18 | 2.2%), and Creek (16 | 1.9%), together accounting for 48.8% of all Grand Ridge residents.
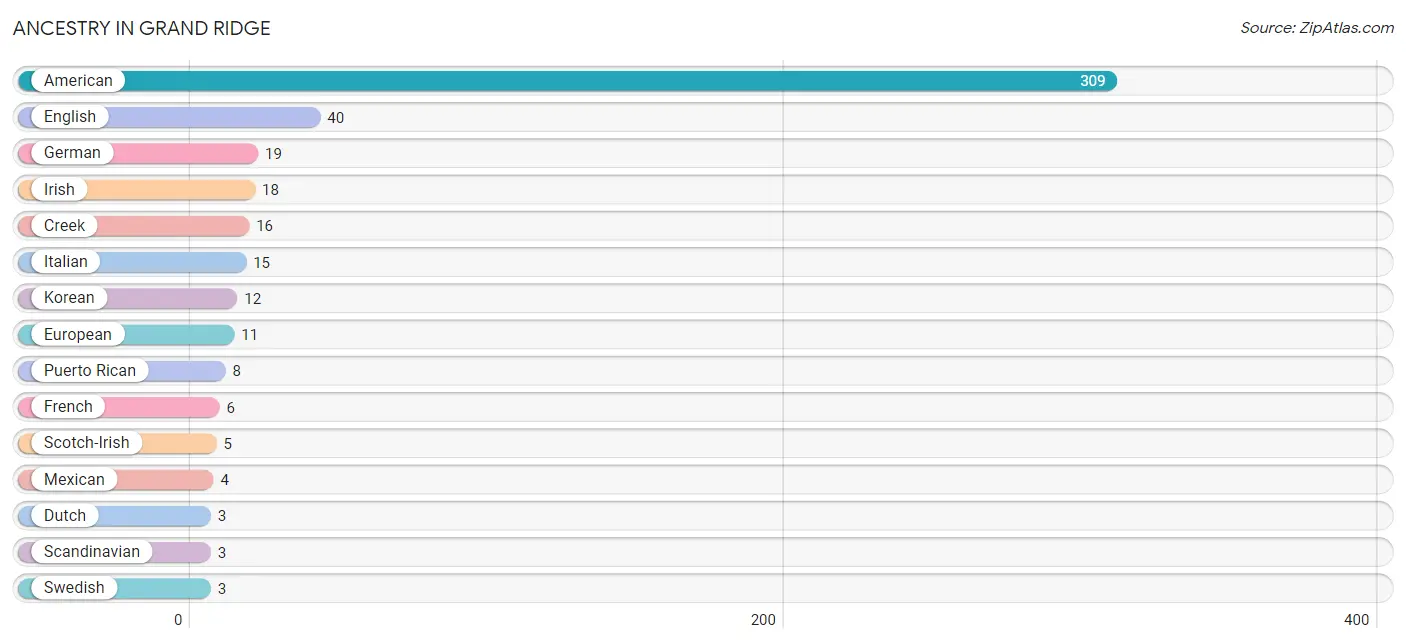
| Ancestry | # Population | % Population |
| American | 309 | 37.5% |
| Belgian | 2 | 0.2% |
| Creek | 16 | 1.9% |
| Dutch | 3 | 0.4% |
| English | 40 | 4.9% |
| European | 11 | 1.3% |
| French | 6 | 0.7% |
| German | 19 | 2.3% |
| Irish | 18 | 2.2% |
| Italian | 15 | 1.8% |
| Korean | 12 | 1.5% |
| Lithuanian | 2 | 0.2% |
| Mexican | 4 | 0.5% |
| Polish | 2 | 0.2% |
| Puerto Rican | 8 | 1.0% |
| Scandinavian | 3 | 0.4% |
| Scotch-Irish | 5 | 0.6% |
| Scottish | 2 | 0.2% |
| Swedish | 3 | 0.4% |
| Thai | 2 | 0.2% | View All 20 Rows |
Immigrants in Grand Ridge
The most numerous immigrant groups reported in Grand Ridge came from Europe (7 | 0.9%), Western Europe (7 | 0.9%), Belgium (5 | 0.6%), Asia (3 | 0.4%), and Philippines (3 | 0.4%), together accounting for 3.0% of all Grand Ridge residents.
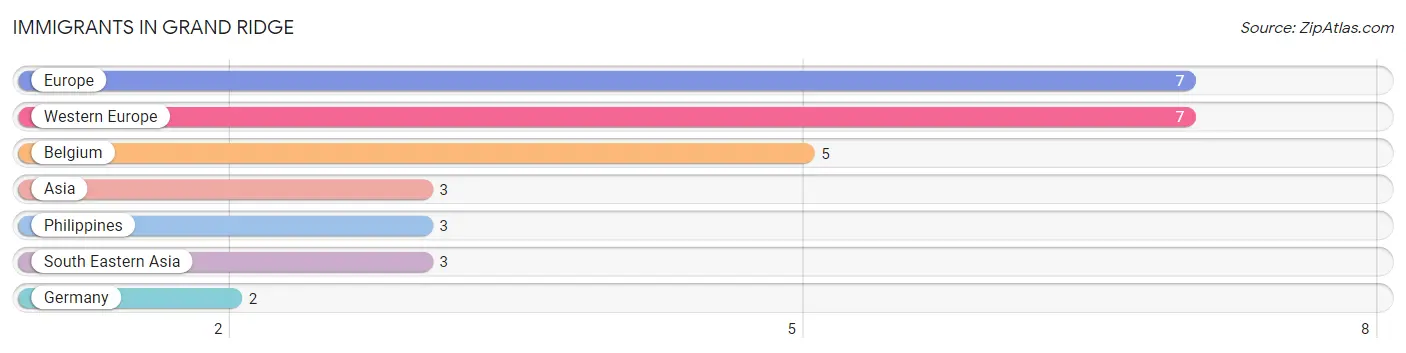
| Immigration Origin | # Population | % Population |
| Asia | 3 | 0.4% |
| Belgium | 5 | 0.6% |
| Europe | 7 | 0.9% |
| Germany | 2 | 0.2% |
| Philippines | 3 | 0.4% |
| South Eastern Asia | 3 | 0.4% |
| Western Europe | 7 | 0.9% | View All 7 Rows |
Sex and Age in Grand Ridge
Sex and Age in Grand Ridge
The most populous age groups in Grand Ridge are 25 to 29 Years (66 | 20.4%) for men and 15 to 19 Years (68 | 13.6%) for women.
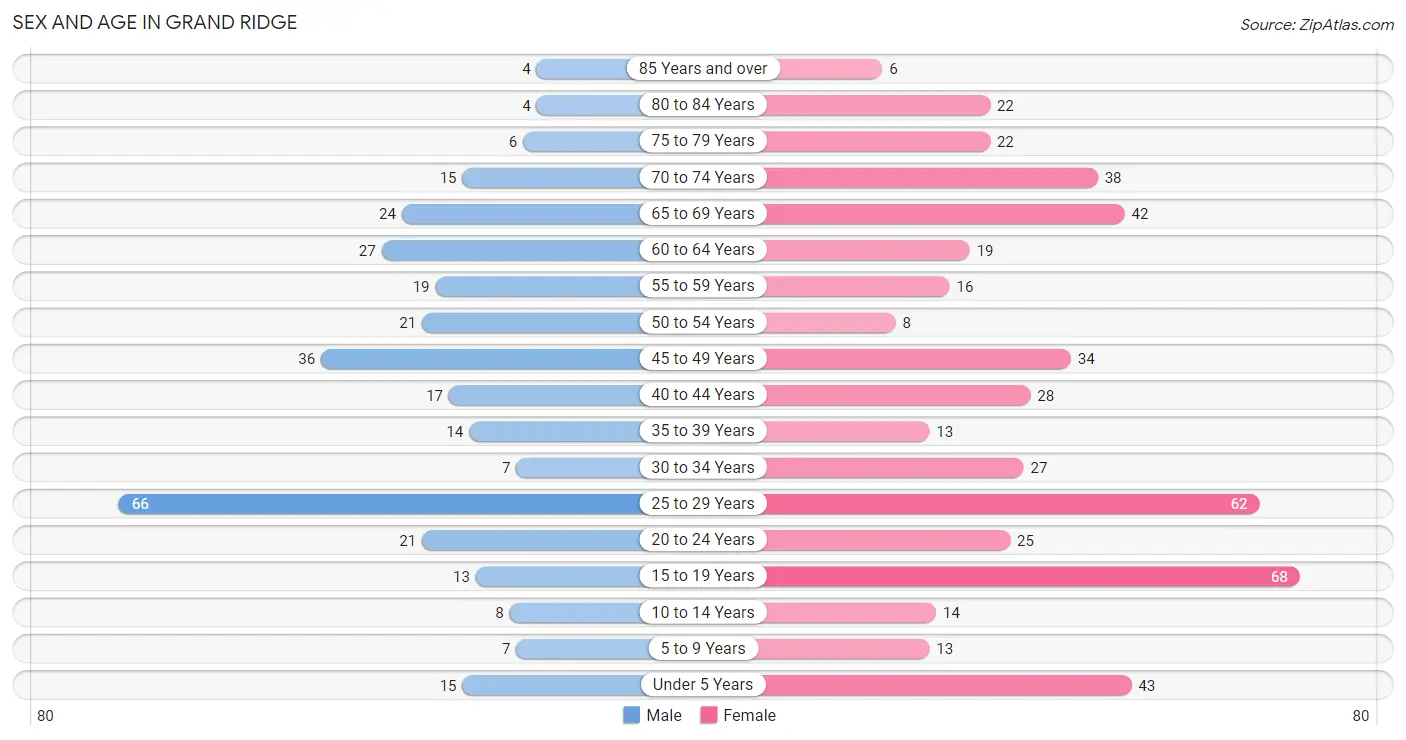
| Age Bracket | Male | Female |
| Under 5 Years | 15 (4.6%) | 43 (8.6%) |
| 5 to 9 Years | 7 (2.2%) | 13 (2.6%) |
| 10 to 14 Years | 8 (2.5%) | 14 (2.8%) |
| 15 to 19 Years | 13 (4.0%) | 68 (13.6%) |
| 20 to 24 Years | 21 (6.5%) | 25 (5.0%) |
| 25 to 29 Years | 66 (20.4%) | 62 (12.4%) |
| 30 to 34 Years | 7 (2.2%) | 27 (5.4%) |
| 35 to 39 Years | 14 (4.3%) | 13 (2.6%) |
| 40 to 44 Years | 17 (5.2%) | 28 (5.6%) |
| 45 to 49 Years | 36 (11.1%) | 34 (6.8%) |
| 50 to 54 Years | 21 (6.5%) | 8 (1.6%) |
| 55 to 59 Years | 19 (5.9%) | 16 (3.2%) |
| 60 to 64 Years | 27 (8.3%) | 19 (3.8%) |
| 65 to 69 Years | 24 (7.4%) | 42 (8.4%) |
| 70 to 74 Years | 15 (4.6%) | 38 (7.6%) |
| 75 to 79 Years | 6 (1.8%) | 22 (4.4%) |
| 80 to 84 Years | 4 (1.2%) | 22 (4.4%) |
| 85 Years and over | 4 (1.2%) | 6 (1.2%) |
| Total | 324 (100.0%) | 500 (100.0%) |
Families and Households in Grand Ridge
Median Family Size in Grand Ridge
The median family size in Grand Ridge is 3.16 persons per family, with single male/father families (5 | 2.5%) accounting for the largest median family size of 3.8 persons per family. On the other hand, single female/mother families (53 | 26.5%) represent the smallest median family size with 3.11 persons per family.
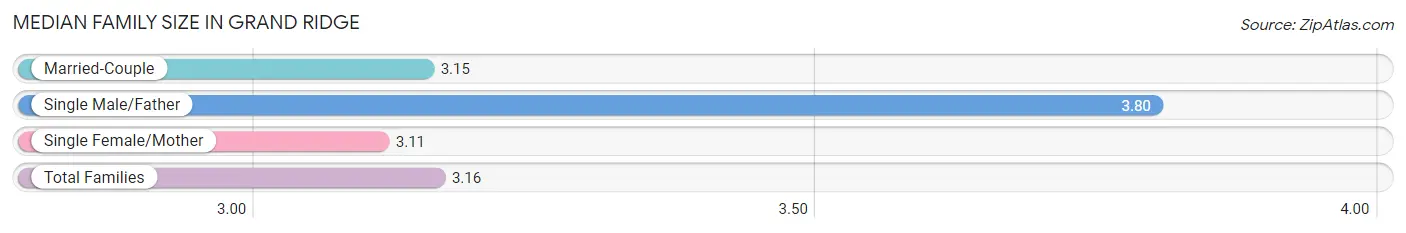
| Family Type | # Families | Family Size |
| Married-Couple | 142 (71.0%) | 3.15 |
| Single Male/Father | 5 (2.5%) | 3.80 |
| Single Female/Mother | 53 (26.5%) | 3.11 |
| Total Families | 200 (100.0%) | 3.16 |
Median Household Size in Grand Ridge
The median household size in Grand Ridge is 2.53 persons per household, with single female/mother households (53 | 16.3%) accounting for the largest median household size of 3.83 persons per household. non-family households (126 | 38.7%) represent the smallest median household size with 1.16 persons per household.
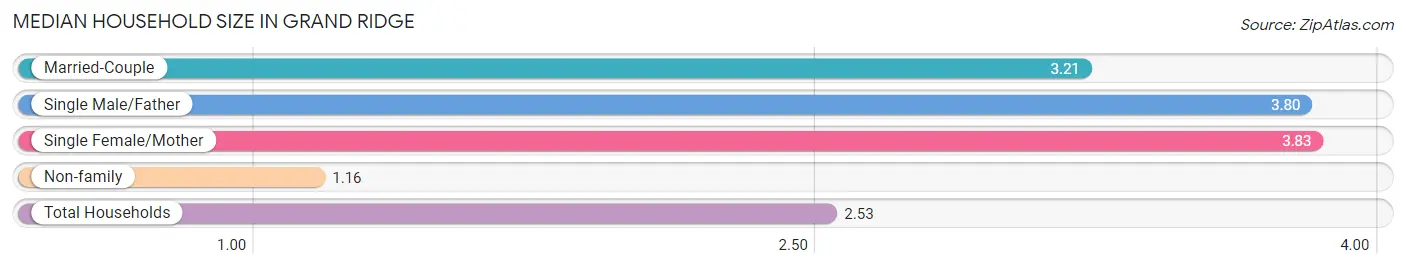
| Household Type | # Households | Household Size |
| Married-Couple | 142 (43.6%) | 3.21 |
| Single Male/Father | 5 (1.5%) | 3.80 |
| Single Female/Mother | 53 (16.3%) | 3.83 |
| Non-family | 126 (38.7%) | 1.16 |
| Total Households | 326 (100.0%) | 2.53 |
Household Size by Marriage Status in Grand Ridge
Out of a total of 326 households in Grand Ridge, 200 (61.4%) are family households, while 126 (38.7%) are nonfamily households. The most numerous type of family households are 2-person households, comprising 93, and the most common type of nonfamily households are 1-person households, comprising 104.
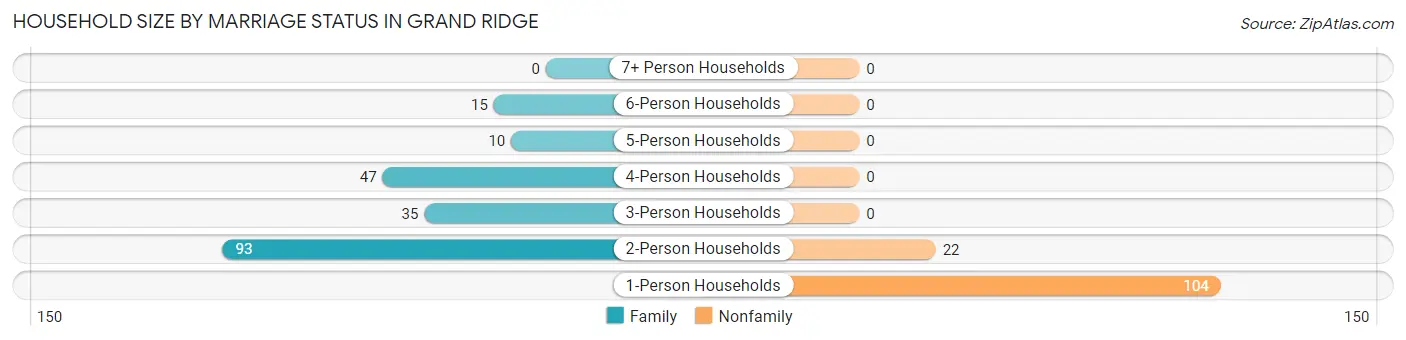
| Household Size | Family Households | Nonfamily Households |
| 1-Person Households | - | 104 (31.9%) |
| 2-Person Households | 93 (28.5%) | 22 (6.8%) |
| 3-Person Households | 35 (10.7%) | 0 (0.0%) |
| 4-Person Households | 47 (14.4%) | 0 (0.0%) |
| 5-Person Households | 10 (3.1%) | 0 (0.0%) |
| 6-Person Households | 15 (4.6%) | 0 (0.0%) |
| 7+ Person Households | 0 (0.0%) | 0 (0.0%) |
| Total | 200 (61.4%) | 126 (38.7%) |
Female Fertility in Grand Ridge
Fertility by Age in Grand Ridge
Average fertility rate in Grand Ridge is 175.0 births per 1,000 women. Women in the age bracket of 20 to 34 years have the highest fertility rate with 360.0 births per 1,000 women. Women in the age bracket of 20 to 34 years acount for 91.1% of all women with births.
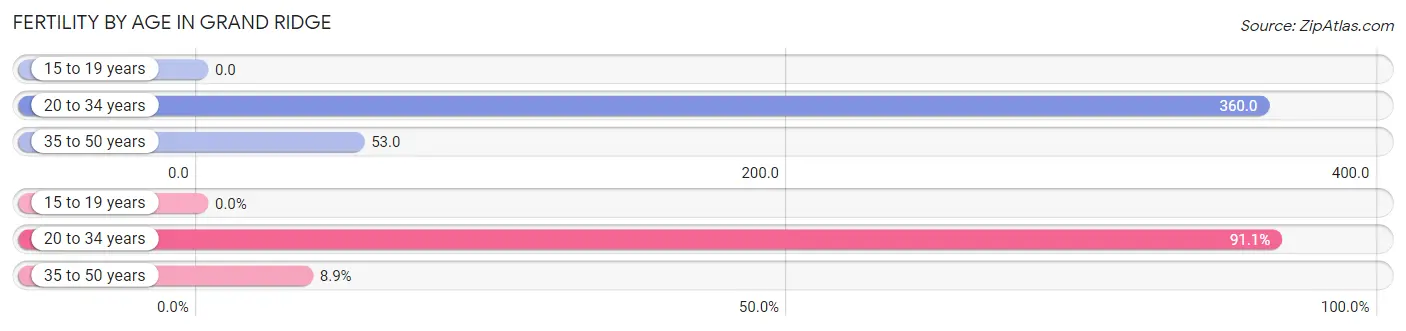
| Age Bracket | Women with Births | Births / 1,000 Women |
| 15 to 19 years | 0 (0.0%) | 0.0 |
| 20 to 34 years | 41 (91.1%) | 360.0 |
| 35 to 50 years | 4 (8.9%) | 53.0 |
| Total | 45 (100.0%) | 175.0 |
Fertility by Age by Marriage Status in Grand Ridge
11.1% of women with births (45) in Grand Ridge are married. The highest percentage of unmarried women with births falls into 20 to 34 years age bracket with 97.6% of them unmarried at the time of birth, while the lowest percentage of unmarried women with births belong to 35 to 50 years age bracket with 0.0% of them unmarried.
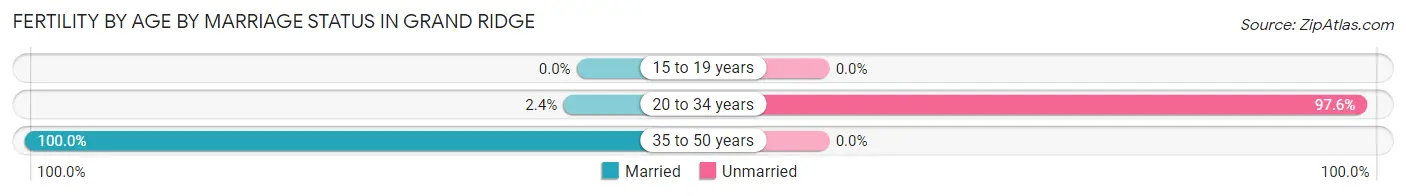
| Age Bracket | Married | Unmarried |
| 15 to 19 years | 0 (0.0%) | 0 (0.0%) |
| 20 to 34 years | 1 (2.4%) | 40 (97.6%) |
| 35 to 50 years | 4 (100.0%) | 0 (0.0%) |
| Total | 5 (11.1%) | 40 (88.9%) |
Fertility by Education in Grand Ridge
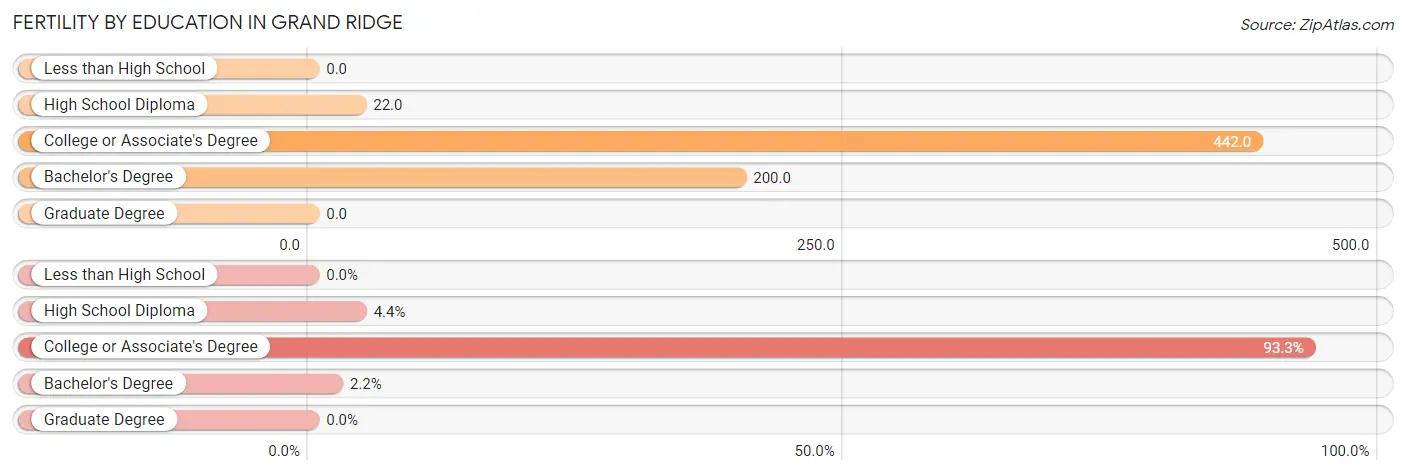
| Educational Attainment | Women with Births | Births / 1,000 Women |
| Less than High School | 0 (0.0%) | 0.0 |
| High School Diploma | 2 (4.4%) | 22.0 |
| College or Associate's Degree | 42 (93.3%) | 442.0 |
| Bachelor's Degree | 1 (2.2%) | 200.0 |
| Graduate Degree | 0 (0.0%) | 0.0 |
| Total | 45 (100.0%) | 175.0 |
Fertility by Education by Marriage Status in Grand Ridge
88.9% of women with births in Grand Ridge are unmarried. Women with the educational attainment of bachelor's degree are most likely to be married with 100.0% of them married at childbirth, while women with the educational attainment of high school diploma are least likely to be married with 100.0% of them unmarried at childbirth.
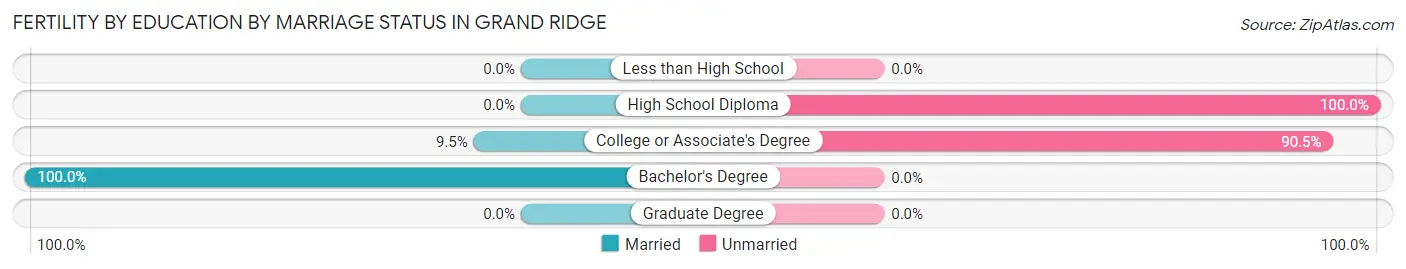
| Educational Attainment | Married | Unmarried |
| Less than High School | 0 (0.0%) | 0 (0.0%) |
| High School Diploma | 0 (0.0%) | 2 (100.0%) |
| College or Associate's Degree | 4 (9.5%) | 38 (90.5%) |
| Bachelor's Degree | 1 (100.0%) | 0 (0.0%) |
| Graduate Degree | 0 (0.0%) | 0 (0.0%) |
| Total | 5 (11.1%) | 40 (88.9%) |
Employment Characteristics in Grand Ridge
Employment by Class of Employer in Grand Ridge
Among the 382 employed individuals in Grand Ridge, private company employees (202 | 52.9%), state government employees (79 | 20.7%), and federal government employees (31 | 8.1%) make up the most common classes of employment.
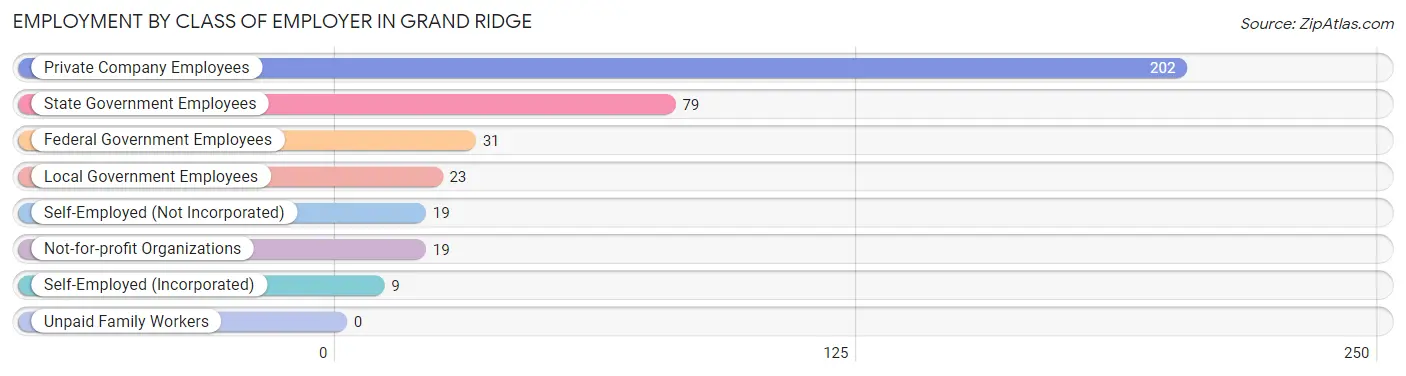
| Employer Class | # Employees | % Employees |
| Private Company Employees | 202 | 52.9% |
| Self-Employed (Incorporated) | 9 | 2.4% |
| Self-Employed (Not Incorporated) | 19 | 5.0% |
| Not-for-profit Organizations | 19 | 5.0% |
| Local Government Employees | 23 | 6.0% |
| State Government Employees | 79 | 20.7% |
| Federal Government Employees | 31 | 8.1% |
| Unpaid Family Workers | 0 | 0.0% |
| Total | 382 | 100.0% |
Employment Status by Age in Grand Ridge
According to the labor force statistics for Grand Ridge, out of the total population over 16 years of age (717), 55.0% or 394 individuals are in the labor force, with 2.3% or 9 of them unemployed. The age group with the highest labor force participation rate is 30 to 34 years, with 100.0% or 34 individuals in the labor force. Within the labor force, the 60 to 64 years age range has the highest percentage of unemployed individuals, with 25.0% or 7 of them being unemployed.
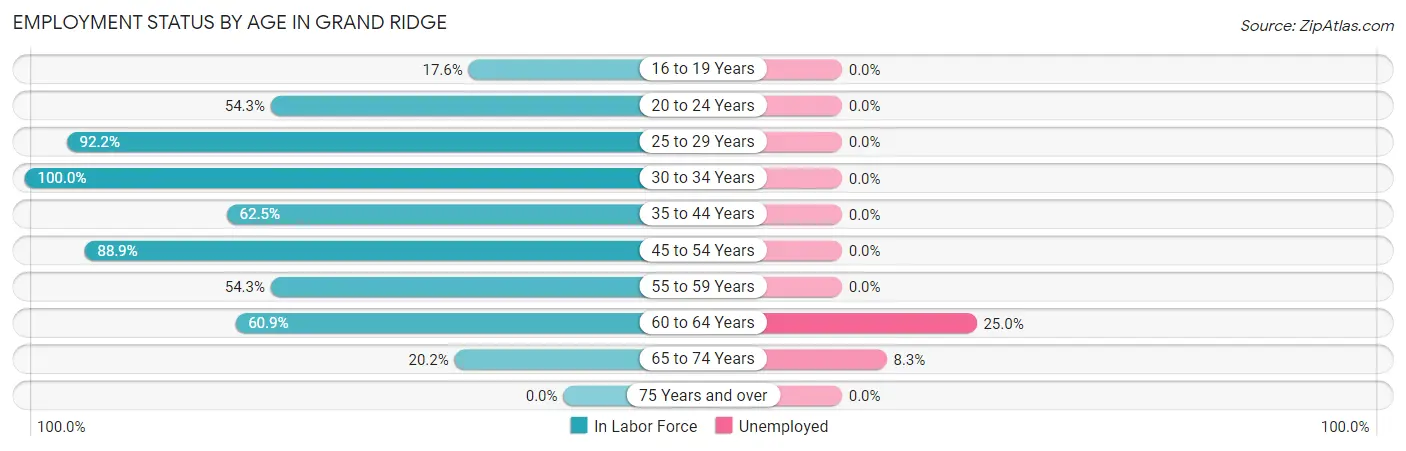
| Age Bracket | In Labor Force | Unemployed |
| 16 to 19 Years | 13 (17.6%) | 0 (0.0%) |
| 20 to 24 Years | 25 (54.3%) | 0 (0.0%) |
| 25 to 29 Years | 118 (92.2%) | 0 (0.0%) |
| 30 to 34 Years | 34 (100.0%) | 0 (0.0%) |
| 35 to 44 Years | 45 (62.5%) | 0 (0.0%) |
| 45 to 54 Years | 88 (88.9%) | 0 (0.0%) |
| 55 to 59 Years | 19 (54.3%) | 0 (0.0%) |
| 60 to 64 Years | 28 (60.9%) | 7 (25.0%) |
| 65 to 74 Years | 24 (20.2%) | 2 (8.3%) |
| 75 Years and over | 0 (0.0%) | 0 (0.0%) |
| Total | 394 (55.0%) | 9 (2.3%) |
Employment Status by Educational Attainment in Grand Ridge
According to labor force statistics for Grand Ridge, 80.2% of individuals (332) out of the total population between 25 and 64 years of age (414) are in the labor force, with 2.1% or 7 of them being unemployed. The group with the highest labor force participation rate are those with the educational attainment of college / associate degree, with 85.1% or 137 individuals in the labor force. Within the labor force, individuals with high school diploma education have the highest percentage of unemployment, with 5.2% or 7 of them being unemployed.
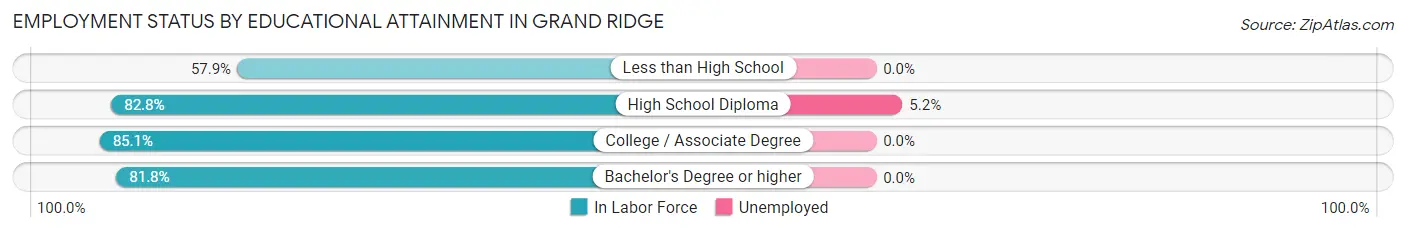
| Educational Attainment | In Labor Force | Unemployed |
| Less than High School | 33 (57.9%) | 0 (0.0%) |
| High School Diploma | 135 (82.8%) | 8 (5.2%) |
| College / Associate Degree | 137 (85.1%) | 0 (0.0%) |
| Bachelor's Degree or higher | 27 (81.8%) | 0 (0.0%) |
| Total | 332 (80.2%) | 9 (2.1%) |
Employment Occupations by Sex in Grand Ridge
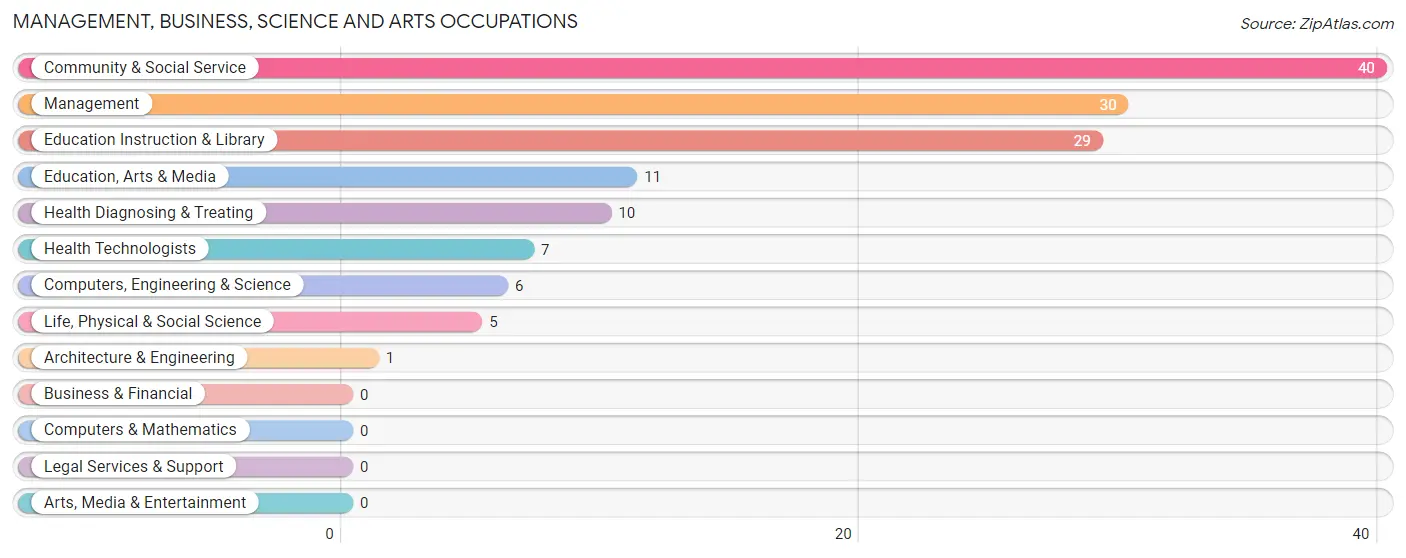
Management, Business, Science and Arts Occupations
The most common Management, Business, Science and Arts occupations in Grand Ridge are Community & Social Service (40 | 10.4%), Management (30 | 7.8%), Education Instruction & Library (29 | 7.5%), Education, Arts & Media (11 | 2.9%), and Health Diagnosing & Treating (10 | 2.6%).
Management, Business, Science and Arts Occupations by Sex
Within the Management, Business, Science and Arts occupations in Grand Ridge, the most male-oriented occupations are Computers, Engineering & Science (100.0%), Architecture & Engineering (100.0%), and Life, Physical & Social Science (100.0%), while the most female-oriented occupations are Education Instruction & Library (100.0%), Health Technologists (100.0%), and Community & Social Service (87.5%).
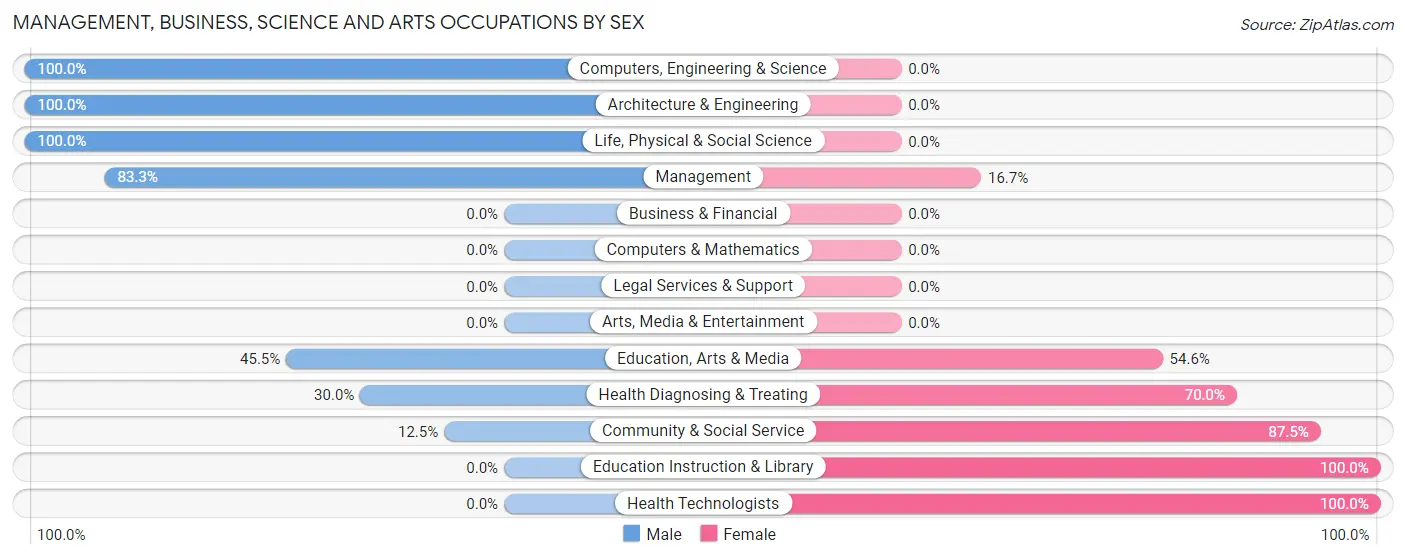
| Occupation | Male | Female |
| Management | 25 (83.3%) | 5 (16.7%) |
| Business & Financial | 0 (0.0%) | 0 (0.0%) |
| Computers, Engineering & Science | 6 (100.0%) | 0 (0.0%) |
| Computers & Mathematics | 0 (0.0%) | 0 (0.0%) |
| Architecture & Engineering | 1 (100.0%) | 0 (0.0%) |
| Life, Physical & Social Science | 5 (100.0%) | 0 (0.0%) |
| Community & Social Service | 5 (12.5%) | 35 (87.5%) |
| Education, Arts & Media | 5 (45.5%) | 6 (54.5%) |
| Legal Services & Support | 0 (0.0%) | 0 (0.0%) |
| Education Instruction & Library | 0 (0.0%) | 29 (100.0%) |
| Arts, Media & Entertainment | 0 (0.0%) | 0 (0.0%) |
| Health Diagnosing & Treating | 3 (30.0%) | 7 (70.0%) |
| Health Technologists | 0 (0.0%) | 7 (100.0%) |
| Total (Category) | 39 (45.4%) | 47 (54.6%) |
| Total (Overall) | 196 (50.9%) | 189 (49.1%) |
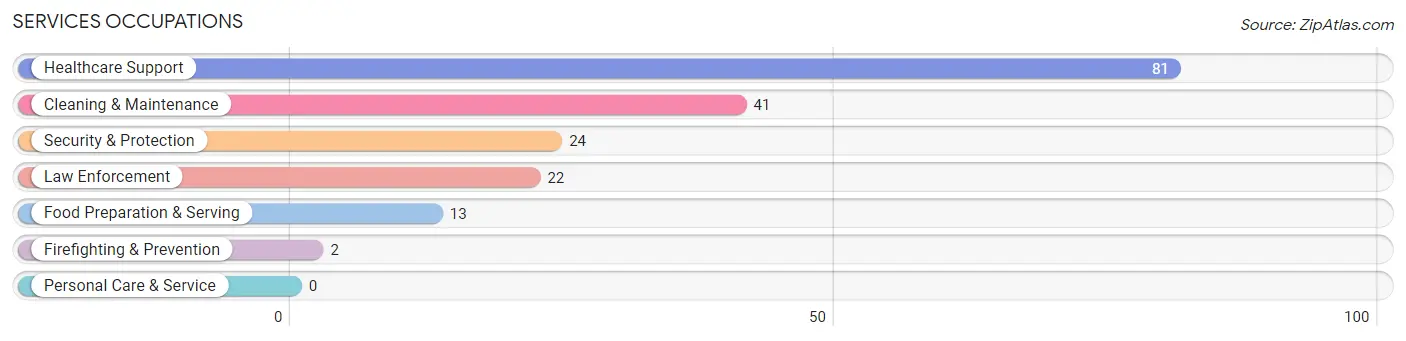
Services Occupations
The most common Services occupations in Grand Ridge are Healthcare Support (81 | 21.0%), Cleaning & Maintenance (41 | 10.6%), Security & Protection (24 | 6.2%), Law Enforcement (22 | 5.7%), and Food Preparation & Serving (13 | 3.4%).
Services Occupations by Sex
Within the Services occupations in Grand Ridge, the most male-oriented occupations are Firefighting & Prevention (100.0%), Cleaning & Maintenance (85.4%), and Security & Protection (62.5%), while the most female-oriented occupations are Healthcare Support (100.0%), Food Preparation & Serving (76.9%), and Law Enforcement (40.9%).
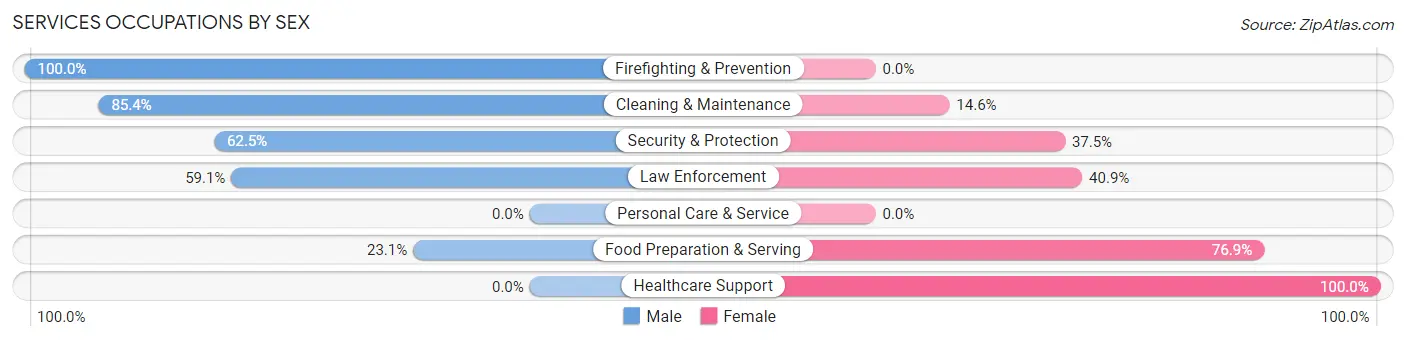
| Occupation | Male | Female |
| Healthcare Support | 0 (0.0%) | 81 (100.0%) |
| Security & Protection | 15 (62.5%) | 9 (37.5%) |
| Firefighting & Prevention | 2 (100.0%) | 0 (0.0%) |
| Law Enforcement | 13 (59.1%) | 9 (40.9%) |
| Food Preparation & Serving | 3 (23.1%) | 10 (76.9%) |
| Cleaning & Maintenance | 35 (85.4%) | 6 (14.6%) |
| Personal Care & Service | 0 (0.0%) | 0 (0.0%) |
| Total (Category) | 53 (33.3%) | 106 (66.7%) |
| Total (Overall) | 196 (50.9%) | 189 (49.1%) |
Sales and Office Occupations
The most common Sales and Office occupations in Grand Ridge are Office & Administration (55 | 14.3%), and Sales & Related (47 | 12.2%).

Sales and Office Occupations by Sex

| Occupation | Male | Female |
| Sales & Related | 45 (95.7%) | 2 (4.3%) |
| Office & Administration | 26 (47.3%) | 29 (52.7%) |
| Total (Category) | 71 (69.6%) | 31 (30.4%) |
| Total (Overall) | 196 (50.9%) | 189 (49.1%) |
Natural Resources, Construction and Maintenance Occupations
The most common Natural Resources, Construction and Maintenance occupations in Grand Ridge are Construction & Extraction (12 | 3.1%), and Installation, Maintenance & Repair (8 | 2.1%).

Natural Resources, Construction and Maintenance Occupations by Sex

| Occupation | Male | Female |
| Farming, Fishing & Forestry | 0 (0.0%) | 0 (0.0%) |
| Construction & Extraction | 12 (100.0%) | 0 (0.0%) |
| Installation, Maintenance & Repair | 8 (100.0%) | 0 (0.0%) |
| Total (Category) | 20 (100.0%) | 0 (0.0%) |
| Total (Overall) | 196 (50.9%) | 189 (49.1%) |
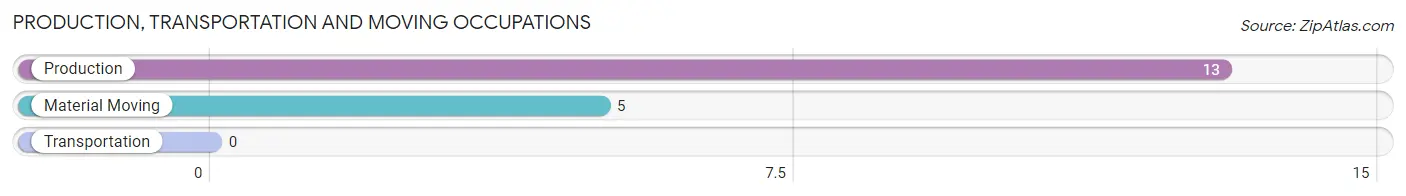
Production, Transportation and Moving Occupations
The most common Production, Transportation and Moving occupations in Grand Ridge are Production (13 | 3.4%), and Material Moving (5 | 1.3%).
Production, Transportation and Moving Occupations by Sex
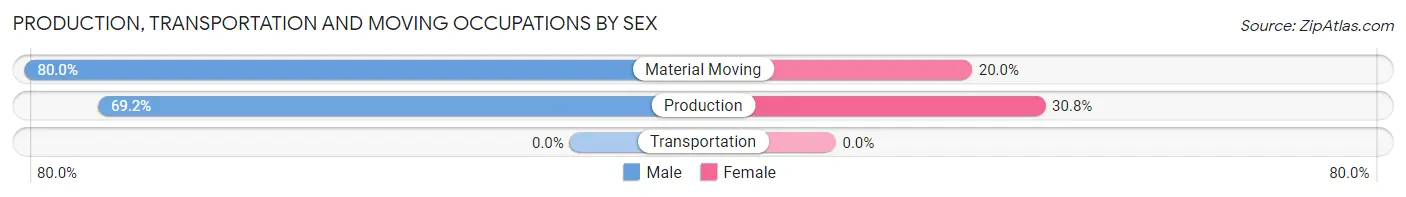
| Occupation | Male | Female |
| Production | 9 (69.2%) | 4 (30.8%) |
| Transportation | 0 (0.0%) | 0 (0.0%) |
| Material Moving | 4 (80.0%) | 1 (20.0%) |
| Total (Category) | 13 (72.2%) | 5 (27.8%) |
| Total (Overall) | 196 (50.9%) | 189 (49.1%) |
Employment Industries by Sex in Grand Ridge
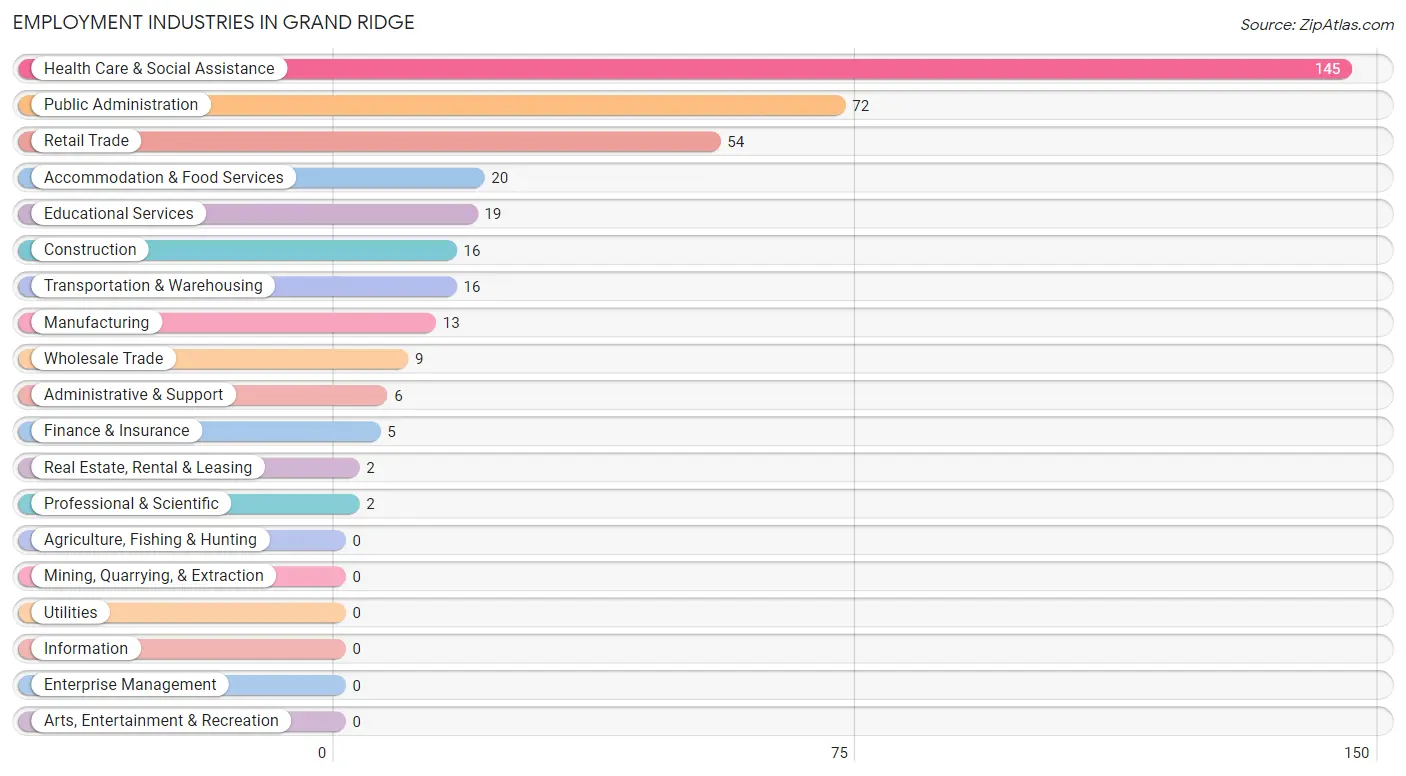
Employment Industries in Grand Ridge
The major employment industries in Grand Ridge include Health Care & Social Assistance (145 | 37.7%), Public Administration (72 | 18.7%), Retail Trade (54 | 14.0%), Accommodation & Food Services (20 | 5.2%), and Educational Services (19 | 4.9%).
Employment Industries by Sex in Grand Ridge
The Grand Ridge industries that see more men than women are Construction (100.0%), Manufacturing (100.0%), and Wholesale Trade (100.0%), whereas the industries that tend to have a higher number of women are Finance & Insurance (100.0%), Real Estate, Rental & Leasing (100.0%), and Professional & Scientific (100.0%).
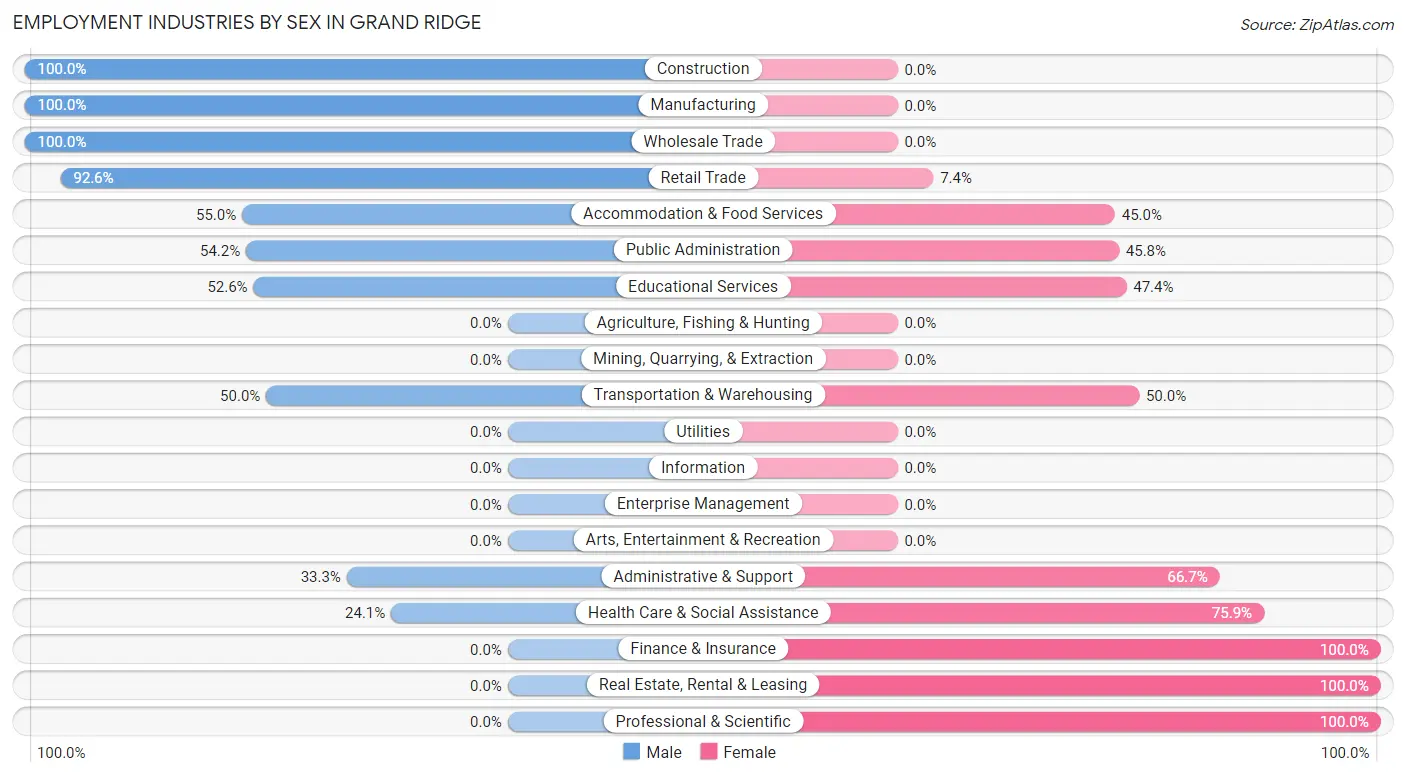
| Industry | Male | Female |
| Agriculture, Fishing & Hunting | 0 (0.0%) | 0 (0.0%) |
| Mining, Quarrying, & Extraction | 0 (0.0%) | 0 (0.0%) |
| Construction | 16 (100.0%) | 0 (0.0%) |
| Manufacturing | 13 (100.0%) | 0 (0.0%) |
| Wholesale Trade | 9 (100.0%) | 0 (0.0%) |
| Retail Trade | 50 (92.6%) | 4 (7.4%) |
| Transportation & Warehousing | 8 (50.0%) | 8 (50.0%) |
| Utilities | 0 (0.0%) | 0 (0.0%) |
| Information | 0 (0.0%) | 0 (0.0%) |
| Finance & Insurance | 0 (0.0%) | 5 (100.0%) |
| Real Estate, Rental & Leasing | 0 (0.0%) | 2 (100.0%) |
| Professional & Scientific | 0 (0.0%) | 2 (100.0%) |
| Enterprise Management | 0 (0.0%) | 0 (0.0%) |
| Administrative & Support | 2 (33.3%) | 4 (66.7%) |
| Educational Services | 10 (52.6%) | 9 (47.4%) |
| Health Care & Social Assistance | 35 (24.1%) | 110 (75.9%) |
| Arts, Entertainment & Recreation | 0 (0.0%) | 0 (0.0%) |
| Accommodation & Food Services | 11 (55.0%) | 9 (45.0%) |
| Public Administration | 39 (54.2%) | 33 (45.8%) |
| Total | 196 (50.9%) | 189 (49.1%) |
Education in Grand Ridge
School Enrollment in Grand Ridge
The most common levels of schooling among the 151 students in Grand Ridge are high school (64 | 42.4%), college / undergraduate (50 | 33.1%), and middle school (15 | 9.9%).
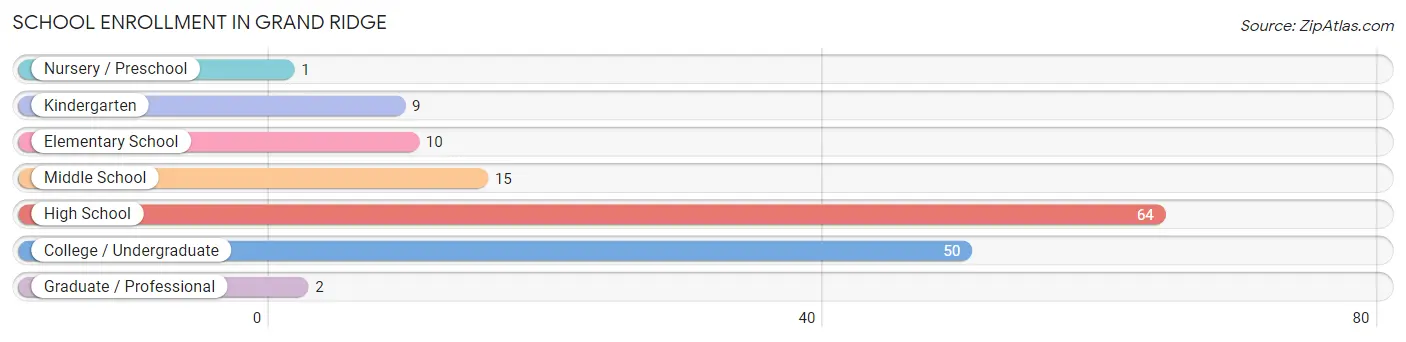
| School Level | # Students | % Students |
| Nursery / Preschool | 1 | 0.7% |
| Kindergarten | 9 | 6.0% |
| Elementary School | 10 | 6.6% |
| Middle School | 15 | 9.9% |
| High School | 64 | 42.4% |
| College / Undergraduate | 50 | 33.1% |
| Graduate / Professional | 2 | 1.3% |
| Total | 151 | 100.0% |
School Enrollment by Age by Funding Source in Grand Ridge
Out of a total of 151 students who are enrolled in schools in Grand Ridge, 9 (6.0%) attend a private institution, while the remaining 142 (94.0%) are enrolled in public schools. The age group of 3 to 4 year olds has the highest likelihood of being enrolled in private schools, with 1 (100.0% in the age bracket) enrolled. Conversely, the age group of 10 to 14 year olds has the lowest likelihood of being enrolled in a private school, with 22 (100.0% in the age bracket) attending a public institution.
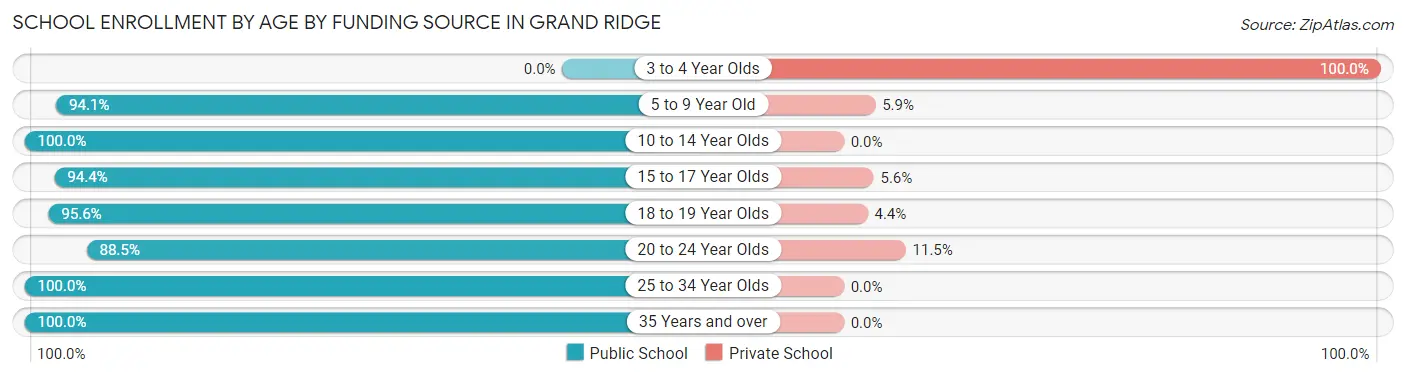
| Age Bracket | Public School | Private School |
| 3 to 4 Year Olds | 0 (0.0%) | 1 (100.0%) |
| 5 to 9 Year Old | 16 (94.1%) | 1 (5.9%) |
| 10 to 14 Year Olds | 22 (100.0%) | 0 (0.0%) |
| 15 to 17 Year Olds | 34 (94.4%) | 2 (5.6%) |
| 18 to 19 Year Olds | 43 (95.6%) | 2 (4.4%) |
| 20 to 24 Year Olds | 23 (88.5%) | 3 (11.5%) |
| 25 to 34 Year Olds | 2 (100.0%) | 0 (0.0%) |
| 35 Years and over | 2 (100.0%) | 0 (0.0%) |
| Total | 142 (94.0%) | 9 (6.0%) |
Educational Attainment by Field of Study in Grand Ridge
Business (10 | 19.2%), education (9 | 17.3%), science & technology (8 | 15.4%), bio, nature & agricultural (7 | 13.5%), and literature & languages (6 | 11.5%) are the most common fields of study among 52 individuals in Grand Ridge who have obtained a bachelor's degree or higher.
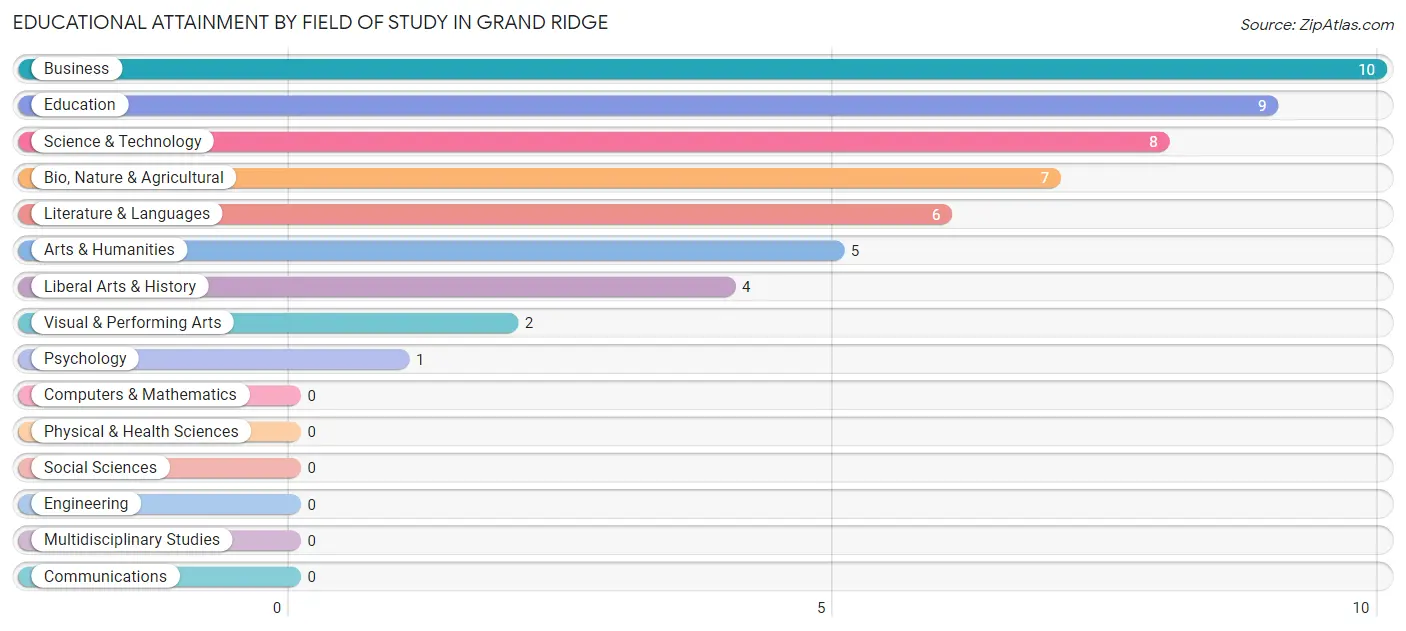
| Field of Study | # Graduates | % Graduates |
| Computers & Mathematics | 0 | 0.0% |
| Bio, Nature & Agricultural | 7 | 13.5% |
| Physical & Health Sciences | 0 | 0.0% |
| Psychology | 1 | 1.9% |
| Social Sciences | 0 | 0.0% |
| Engineering | 0 | 0.0% |
| Multidisciplinary Studies | 0 | 0.0% |
| Science & Technology | 8 | 15.4% |
| Business | 10 | 19.2% |
| Education | 9 | 17.3% |
| Literature & Languages | 6 | 11.5% |
| Liberal Arts & History | 4 | 7.7% |
| Visual & Performing Arts | 2 | 3.8% |
| Communications | 0 | 0.0% |
| Arts & Humanities | 5 | 9.6% |
| Total | 52 | 100.0% |
Transportation & Commute in Grand Ridge
Vehicle Availability by Sex in Grand Ridge
The most prevalent vehicle ownership categories in Grand Ridge are males with 2 vehicles (85, accounting for 44.0%) and females with 2 vehicles (84, making up 45.0%).
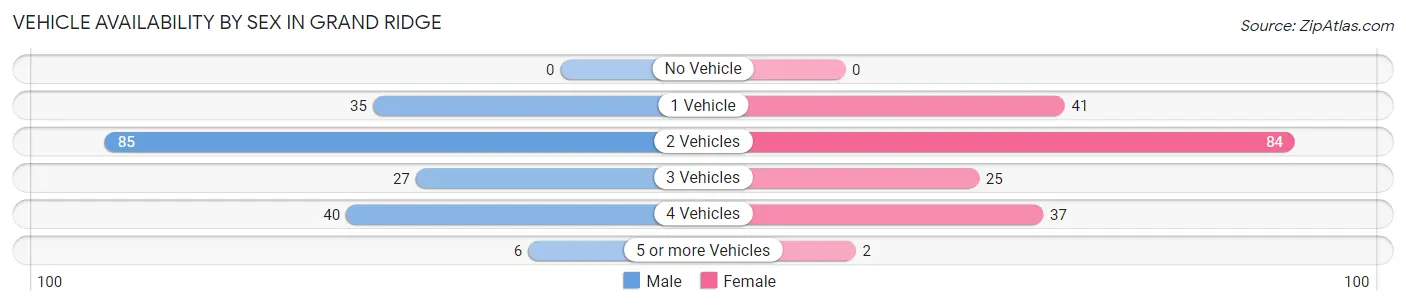
| Vehicles Available | Male | Female |
| No Vehicle | 0 (0.0%) | 0 (0.0%) |
| 1 Vehicle | 35 (18.1%) | 41 (21.7%) |
| 2 Vehicles | 85 (44.0%) | 84 (44.4%) |
| 3 Vehicles | 27 (14.0%) | 25 (13.2%) |
| 4 Vehicles | 40 (20.7%) | 37 (19.6%) |
| 5 or more Vehicles | 6 (3.1%) | 2 (1.1%) |
| Total | 193 (100.0%) | 189 (100.0%) |
Commute Time in Grand Ridge
The most frequently occuring commute durations in Grand Ridge are 30 to 34 minutes (155 commuters, 43.1%), 20 to 24 minutes (72 commuters, 20.0%), and 15 to 19 minutes (32 commuters, 8.9%).
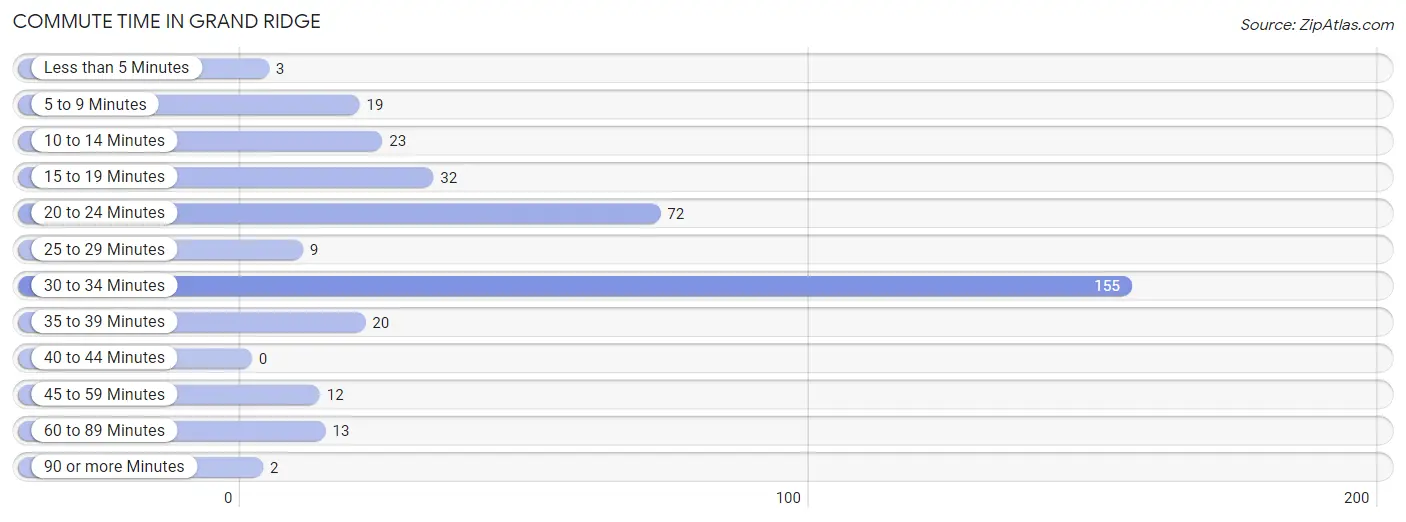
| Commute Time | # Commuters | % Commuters |
| Less than 5 Minutes | 3 | 0.8% |
| 5 to 9 Minutes | 19 | 5.3% |
| 10 to 14 Minutes | 23 | 6.4% |
| 15 to 19 Minutes | 32 | 8.9% |
| 20 to 24 Minutes | 72 | 20.0% |
| 25 to 29 Minutes | 9 | 2.5% |
| 30 to 34 Minutes | 155 | 43.1% |
| 35 to 39 Minutes | 20 | 5.6% |
| 40 to 44 Minutes | 0 | 0.0% |
| 45 to 59 Minutes | 12 | 3.3% |
| 60 to 89 Minutes | 13 | 3.6% |
| 90 or more Minutes | 2 | 0.6% |
Commute Time by Sex in Grand Ridge
The most common commute times in Grand Ridge are 30 to 34 minutes (56 commuters, 32.4%) for males and 30 to 34 minutes (99 commuters, 52.9%) for females.
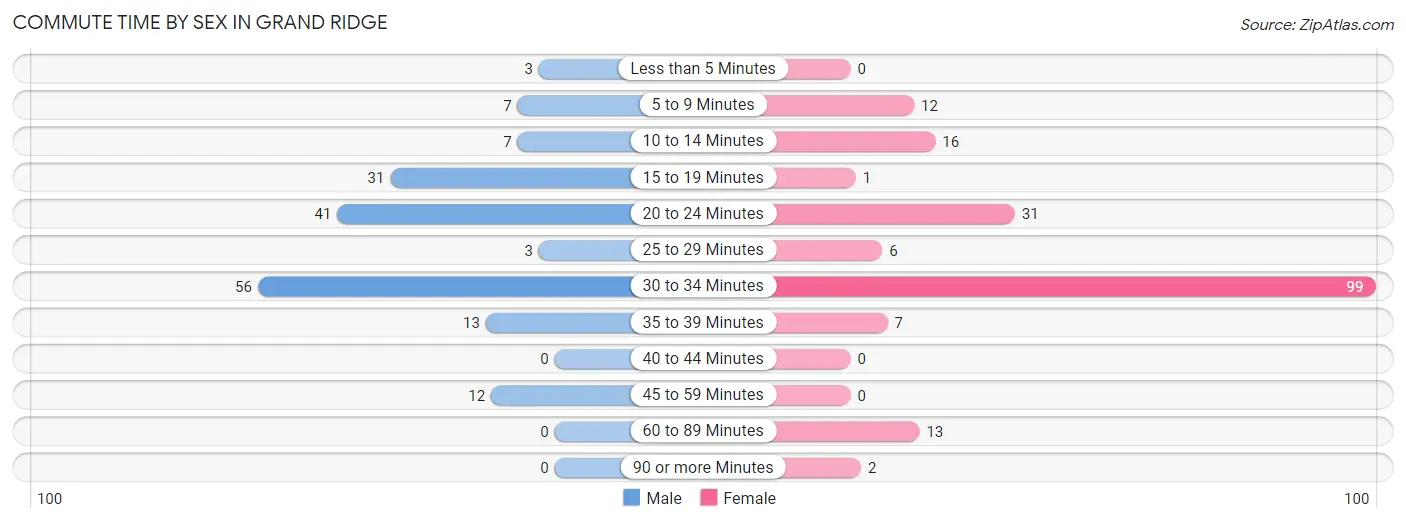
| Commute Time | Male | Female |
| Less than 5 Minutes | 3 (1.7%) | 0 (0.0%) |
| 5 to 9 Minutes | 7 (4.1%) | 12 (6.4%) |
| 10 to 14 Minutes | 7 (4.1%) | 16 (8.6%) |
| 15 to 19 Minutes | 31 (17.9%) | 1 (0.5%) |
| 20 to 24 Minutes | 41 (23.7%) | 31 (16.6%) |
| 25 to 29 Minutes | 3 (1.7%) | 6 (3.2%) |
| 30 to 34 Minutes | 56 (32.4%) | 99 (52.9%) |
| 35 to 39 Minutes | 13 (7.5%) | 7 (3.7%) |
| 40 to 44 Minutes | 0 (0.0%) | 0 (0.0%) |
| 45 to 59 Minutes | 12 (6.9%) | 0 (0.0%) |
| 60 to 89 Minutes | 0 (0.0%) | 13 (7.0%) |
| 90 or more Minutes | 0 (0.0%) | 2 (1.1%) |
Time of Departure to Work by Sex in Grand Ridge
The most frequent times of departure to work in Grand Ridge are 6:00 AM to 6:29 AM (42, 24.3%) for males and 6:00 AM to 6:29 AM (83, 44.4%) for females.
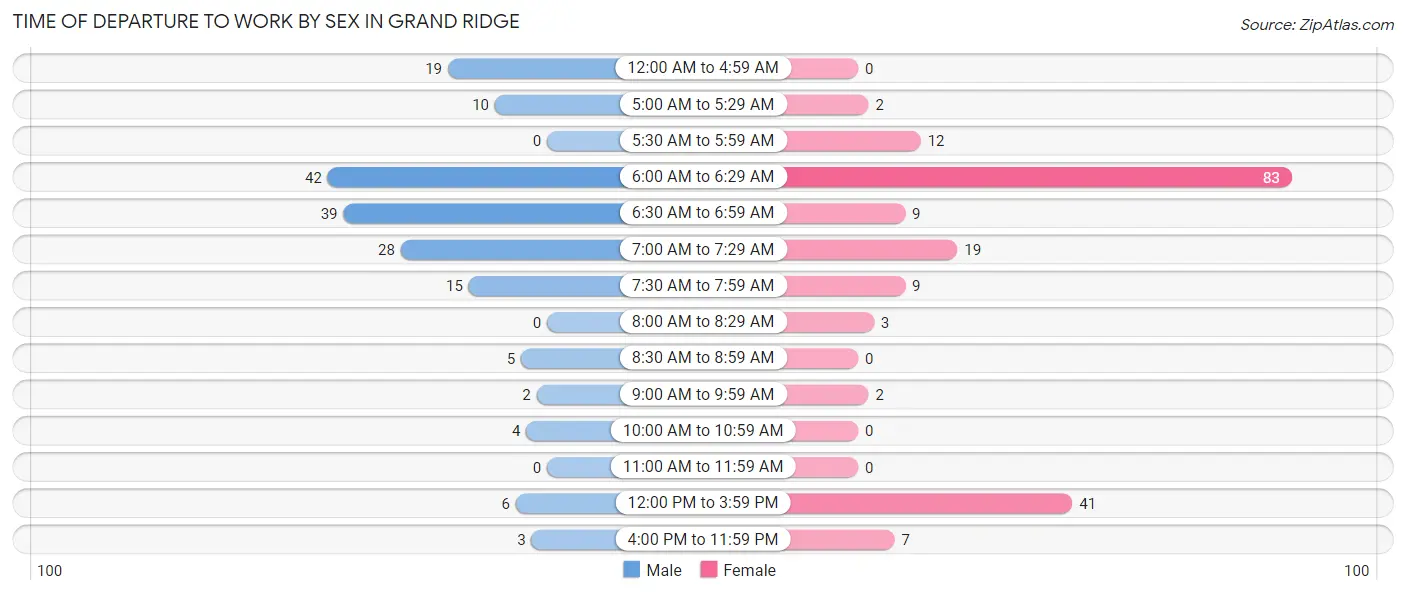
| Time of Departure | Male | Female |
| 12:00 AM to 4:59 AM | 19 (11.0%) | 0 (0.0%) |
| 5:00 AM to 5:29 AM | 10 (5.8%) | 2 (1.1%) |
| 5:30 AM to 5:59 AM | 0 (0.0%) | 12 (6.4%) |
| 6:00 AM to 6:29 AM | 42 (24.3%) | 83 (44.4%) |
| 6:30 AM to 6:59 AM | 39 (22.5%) | 9 (4.8%) |
| 7:00 AM to 7:29 AM | 28 (16.2%) | 19 (10.2%) |
| 7:30 AM to 7:59 AM | 15 (8.7%) | 9 (4.8%) |
| 8:00 AM to 8:29 AM | 0 (0.0%) | 3 (1.6%) |
| 8:30 AM to 8:59 AM | 5 (2.9%) | 0 (0.0%) |
| 9:00 AM to 9:59 AM | 2 (1.2%) | 2 (1.1%) |
| 10:00 AM to 10:59 AM | 4 (2.3%) | 0 (0.0%) |
| 11:00 AM to 11:59 AM | 0 (0.0%) | 0 (0.0%) |
| 12:00 PM to 3:59 PM | 6 (3.5%) | 41 (21.9%) |
| 4:00 PM to 11:59 PM | 3 (1.7%) | 7 (3.7%) |
| Total | 173 (100.0%) | 187 (100.0%) |
Housing Occupancy in Grand Ridge
Occupancy by Ownership in Grand Ridge
Of the total 326 dwellings in Grand Ridge, owner-occupied units account for 227 (69.6%), while renter-occupied units make up 99 (30.4%).
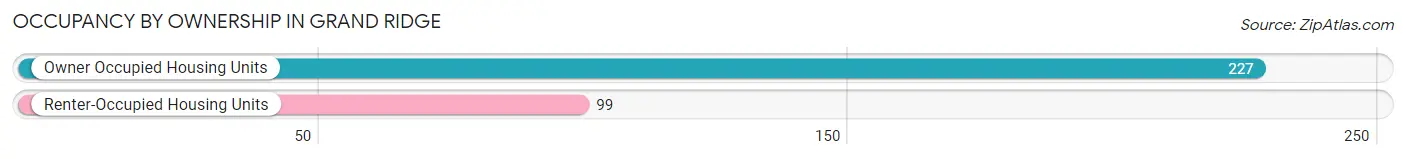
| Occupancy | # Housing Units | % Housing Units |
| Owner Occupied Housing Units | 227 | 69.6% |
| Renter-Occupied Housing Units | 99 | 30.4% |
| Total Occupied Housing Units | 326 | 100.0% |
Occupancy by Household Size in Grand Ridge
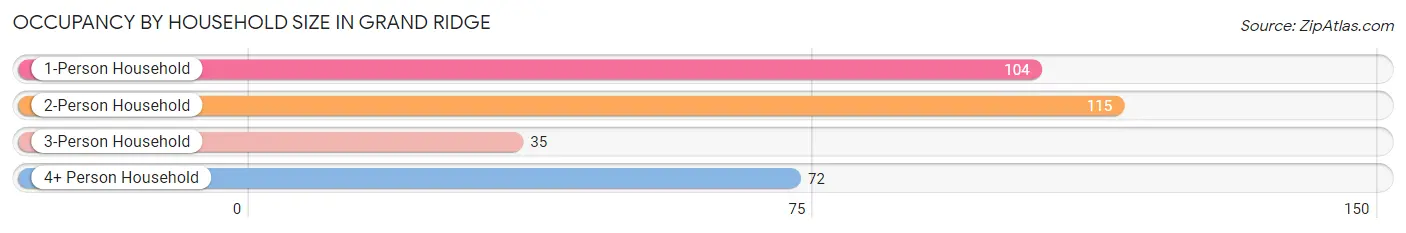
| Household Size | # Housing Units | % Housing Units |
| 1-Person Household | 104 | 31.9% |
| 2-Person Household | 115 | 35.3% |
| 3-Person Household | 35 | 10.7% |
| 4+ Person Household | 72 | 22.1% |
| Total Housing Units | 326 | 100.0% |
Occupancy by Ownership by Household Size in Grand Ridge
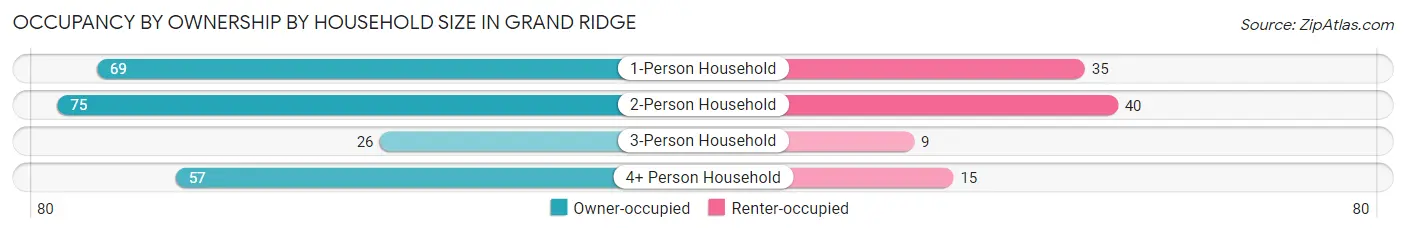
| Household Size | Owner-occupied | Renter-occupied |
| 1-Person Household | 69 (66.3%) | 35 (33.7%) |
| 2-Person Household | 75 (65.2%) | 40 (34.8%) |
| 3-Person Household | 26 (74.3%) | 9 (25.7%) |
| 4+ Person Household | 57 (79.2%) | 15 (20.8%) |
| Total Housing Units | 227 (69.6%) | 99 (30.4%) |
Occupancy by Educational Attainment in Grand Ridge
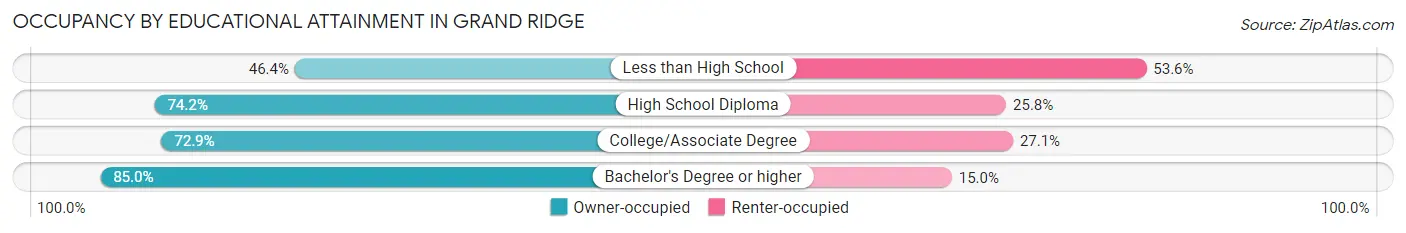
| Household Size | Owner-occupied | Renter-occupied |
| Less than High School | 26 (46.4%) | 30 (53.6%) |
| High School Diploma | 98 (74.2%) | 34 (25.8%) |
| College/Associate Degree | 86 (72.9%) | 32 (27.1%) |
| Bachelor's Degree or higher | 17 (85.0%) | 3 (15.0%) |
Occupancy by Age of Householder in Grand Ridge
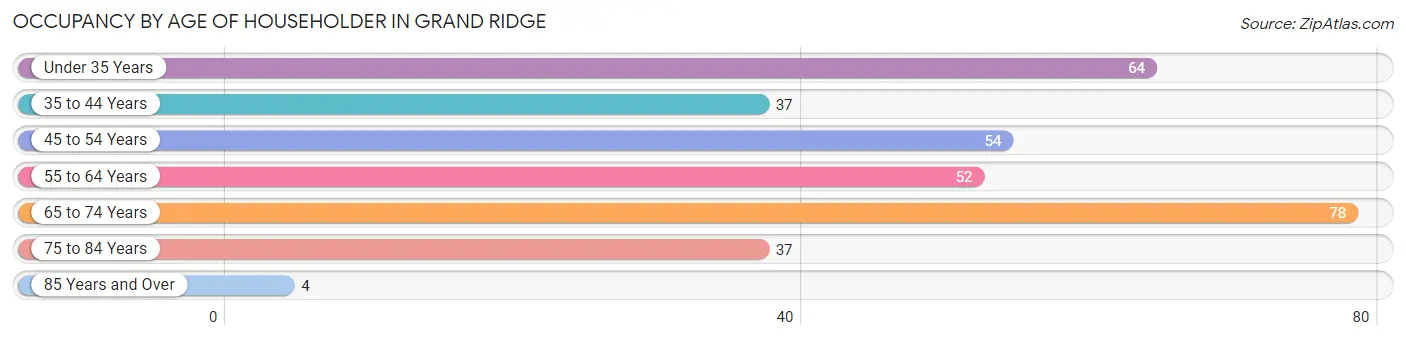
| Age Bracket | # Households | % Households |
| Under 35 Years | 64 | 19.6% |
| 35 to 44 Years | 37 | 11.4% |
| 45 to 54 Years | 54 | 16.6% |
| 55 to 64 Years | 52 | 16.0% |
| 65 to 74 Years | 78 | 23.9% |
| 75 to 84 Years | 37 | 11.4% |
| 85 Years and Over | 4 | 1.2% |
| Total | 326 | 100.0% |
Housing Finances in Grand Ridge
Median Income by Occupancy in Grand Ridge
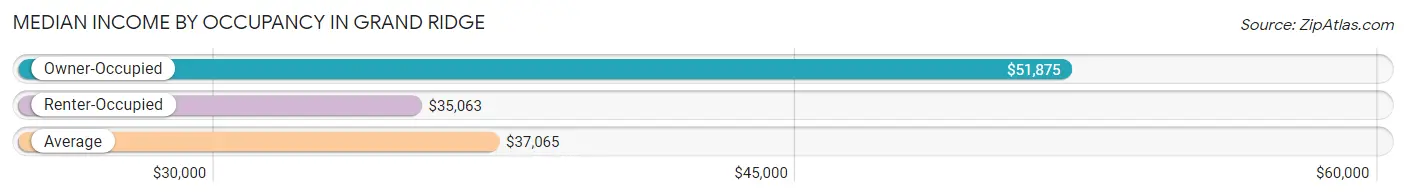
| Occupancy Type | # Households | Median Income |
| Owner-Occupied | 227 (69.6%) | $51,875 |
| Renter-Occupied | 99 (30.4%) | $35,063 |
| Average | 326 (100.0%) | $37,065 |
Occupancy by Householder Income Bracket in Grand Ridge
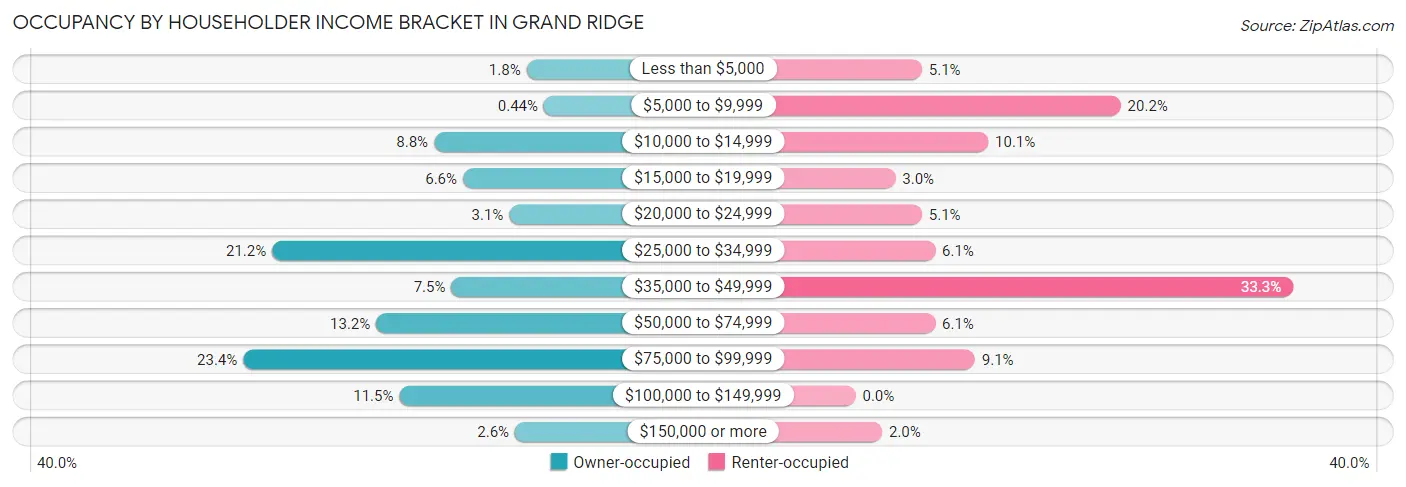
| Income Bracket | Owner-occupied | Renter-occupied |
| Less than $5,000 | 4 (1.8%) | 5 (5.1%) |
| $5,000 to $9,999 | 1 (0.4%) | 20 (20.2%) |
| $10,000 to $14,999 | 20 (8.8%) | 10 (10.1%) |
| $15,000 to $19,999 | 15 (6.6%) | 3 (3.0%) |
| $20,000 to $24,999 | 7 (3.1%) | 5 (5.1%) |
| $25,000 to $34,999 | 48 (21.1%) | 6 (6.1%) |
| $35,000 to $49,999 | 17 (7.5%) | 33 (33.3%) |
| $50,000 to $74,999 | 30 (13.2%) | 6 (6.1%) |
| $75,000 to $99,999 | 53 (23.4%) | 9 (9.1%) |
| $100,000 to $149,999 | 26 (11.5%) | 0 (0.0%) |
| $150,000 or more | 6 (2.6%) | 2 (2.0%) |
| Total | 227 (100.0%) | 99 (100.0%) |
Monthly Housing Cost Tiers in Grand Ridge
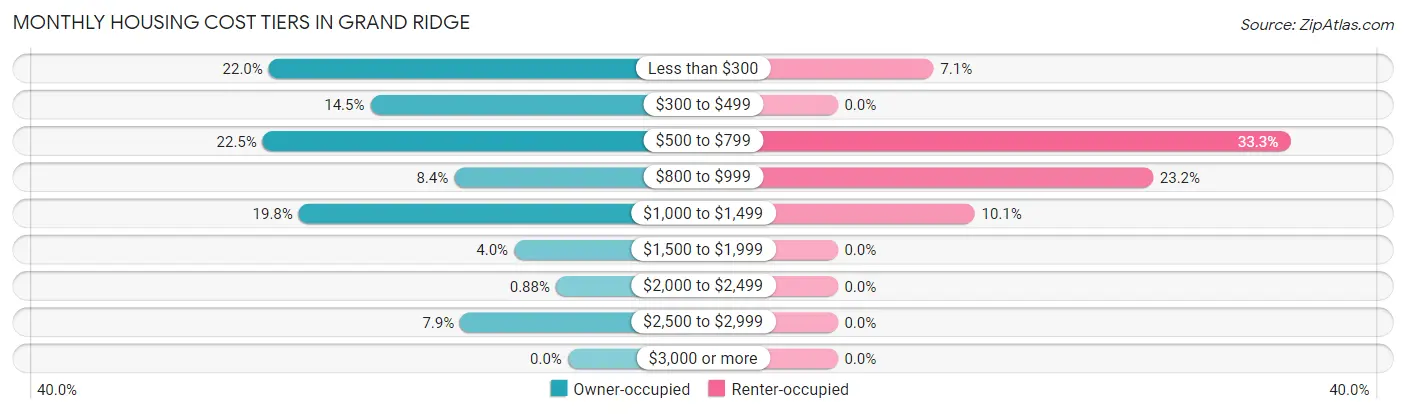
| Monthly Cost | Owner-occupied | Renter-occupied |
| Less than $300 | 50 (22.0%) | 7 (7.1%) |
| $300 to $499 | 33 (14.5%) | 0 (0.0%) |
| $500 to $799 | 51 (22.5%) | 33 (33.3%) |
| $800 to $999 | 19 (8.4%) | 23 (23.2%) |
| $1,000 to $1,499 | 45 (19.8%) | 10 (10.1%) |
| $1,500 to $1,999 | 9 (4.0%) | 0 (0.0%) |
| $2,000 to $2,499 | 2 (0.9%) | 0 (0.0%) |
| $2,500 to $2,999 | 18 (7.9%) | 0 (0.0%) |
| $3,000 or more | 0 (0.0%) | 0 (0.0%) |
| Total | 227 (100.0%) | 99 (100.0%) |
Physical Housing Characteristics in Grand Ridge
Housing Structures in Grand Ridge
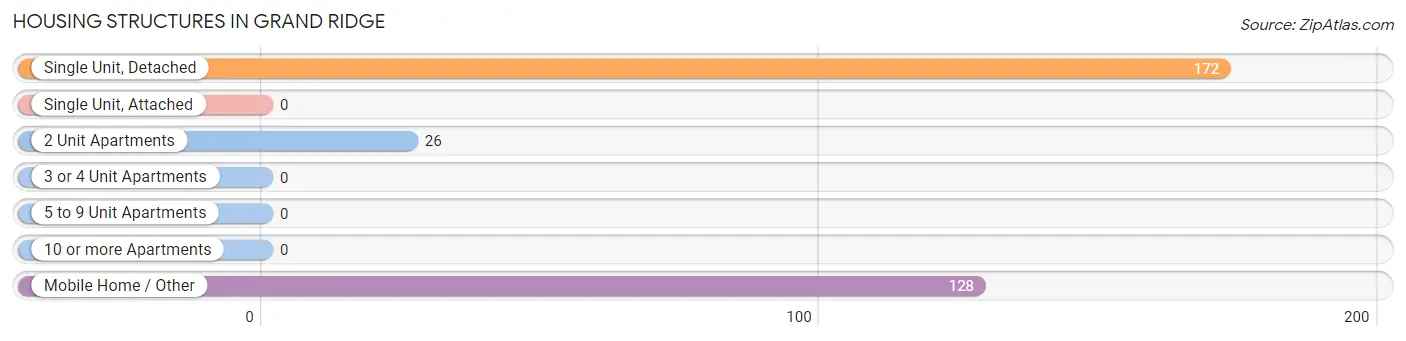
| Structure Type | # Housing Units | % Housing Units |
| Single Unit, Detached | 172 | 52.8% |
| Single Unit, Attached | 0 | 0.0% |
| 2 Unit Apartments | 26 | 8.0% |
| 3 or 4 Unit Apartments | 0 | 0.0% |
| 5 to 9 Unit Apartments | 0 | 0.0% |
| 10 or more Apartments | 0 | 0.0% |
| Mobile Home / Other | 128 | 39.3% |
| Total | 326 | 100.0% |
Housing Structures by Occupancy in Grand Ridge
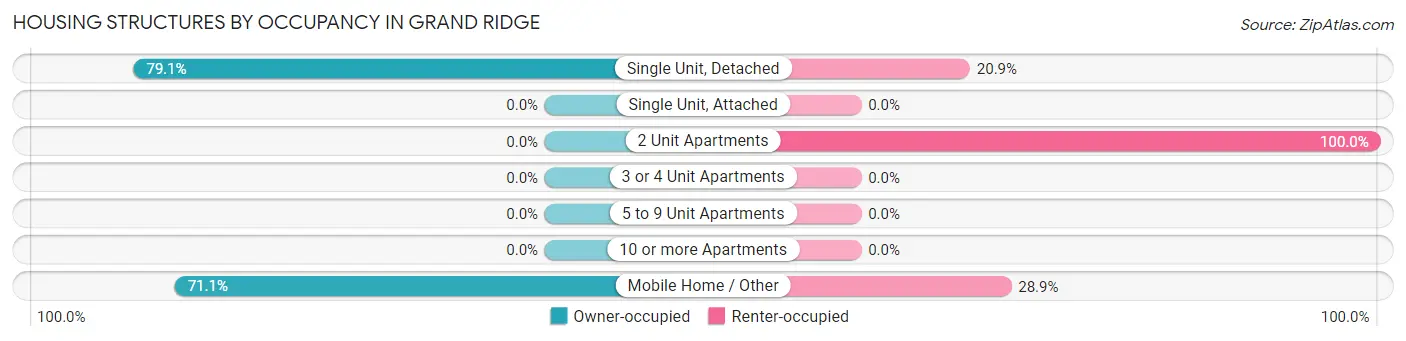
| Structure Type | Owner-occupied | Renter-occupied |
| Single Unit, Detached | 136 (79.1%) | 36 (20.9%) |
| Single Unit, Attached | 0 (0.0%) | 0 (0.0%) |
| 2 Unit Apartments | 0 (0.0%) | 26 (100.0%) |
| 3 or 4 Unit Apartments | 0 (0.0%) | 0 (0.0%) |
| 5 to 9 Unit Apartments | 0 (0.0%) | 0 (0.0%) |
| 10 or more Apartments | 0 (0.0%) | 0 (0.0%) |
| Mobile Home / Other | 91 (71.1%) | 37 (28.9%) |
| Total | 227 (69.6%) | 99 (30.4%) |
Housing Structures by Number of Rooms in Grand Ridge
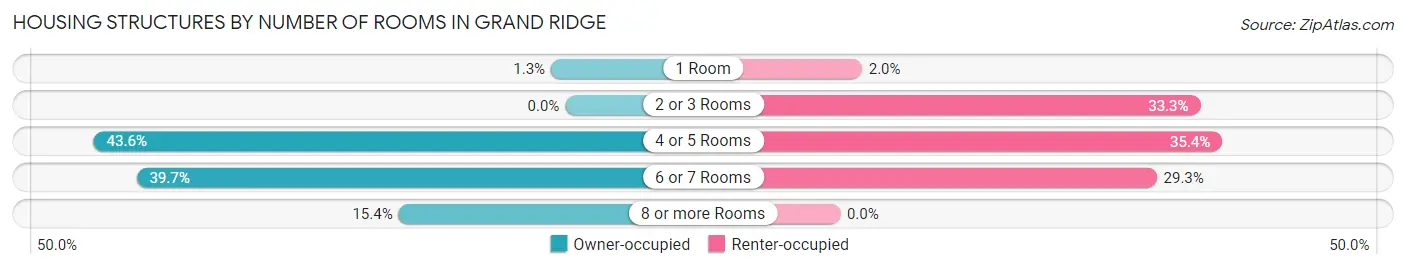
| Number of Rooms | Owner-occupied | Renter-occupied |
| 1 Room | 3 (1.3%) | 2 (2.0%) |
| 2 or 3 Rooms | 0 (0.0%) | 33 (33.3%) |
| 4 or 5 Rooms | 99 (43.6%) | 35 (35.3%) |
| 6 or 7 Rooms | 90 (39.7%) | 29 (29.3%) |
| 8 or more Rooms | 35 (15.4%) | 0 (0.0%) |
| Total | 227 (100.0%) | 99 (100.0%) |
Housing Structure by Heating Type in Grand Ridge
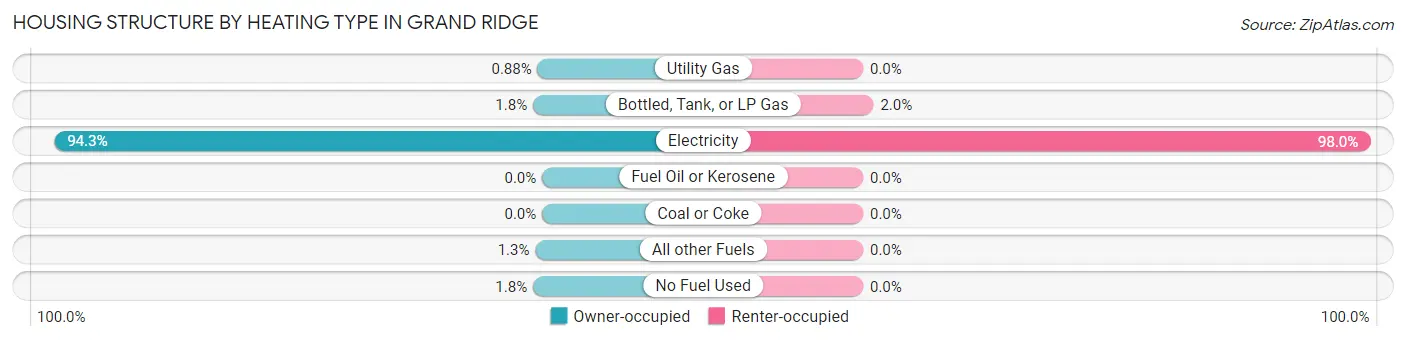
| Heating Type | Owner-occupied | Renter-occupied |
| Utility Gas | 2 (0.9%) | 0 (0.0%) |
| Bottled, Tank, or LP Gas | 4 (1.8%) | 2 (2.0%) |
| Electricity | 214 (94.3%) | 97 (98.0%) |
| Fuel Oil or Kerosene | 0 (0.0%) | 0 (0.0%) |
| Coal or Coke | 0 (0.0%) | 0 (0.0%) |
| All other Fuels | 3 (1.3%) | 0 (0.0%) |
| No Fuel Used | 4 (1.8%) | 0 (0.0%) |
| Total | 227 (100.0%) | 99 (100.0%) |
Household Vehicle Usage in Grand Ridge
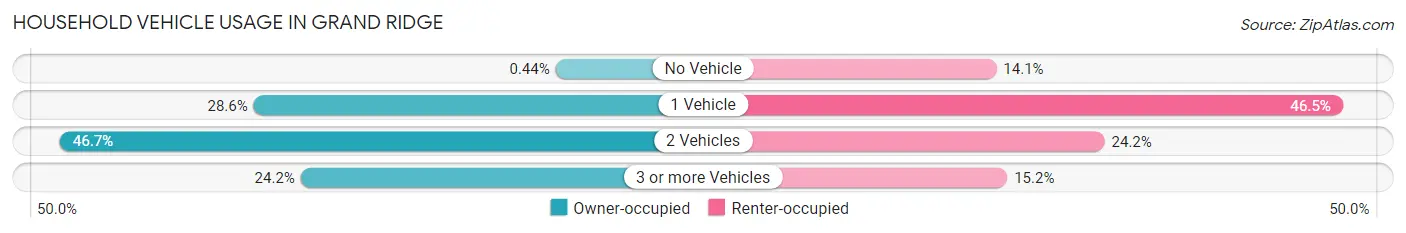
| Vehicles per Household | Owner-occupied | Renter-occupied |
| No Vehicle | 1 (0.4%) | 14 (14.1%) |
| 1 Vehicle | 65 (28.6%) | 46 (46.5%) |
| 2 Vehicles | 106 (46.7%) | 24 (24.2%) |
| 3 or more Vehicles | 55 (24.2%) | 15 (15.1%) |
| Total | 227 (100.0%) | 99 (100.0%) |
Real Estate & Mortgages in Grand Ridge
Real Estate and Mortgage Overview in Grand Ridge
| Characteristic | Without Mortgage | With Mortgage |
| Housing Units | 105 | 122 |
| Median Property Value | $63,500 | $118,800 |
| Median Household Income | $45,313 | $3 |
| Monthly Housing Costs | $314 | $0 |
| Real Estate Taxes | $355 | $26 |
Property Value by Mortgage Status in Grand Ridge
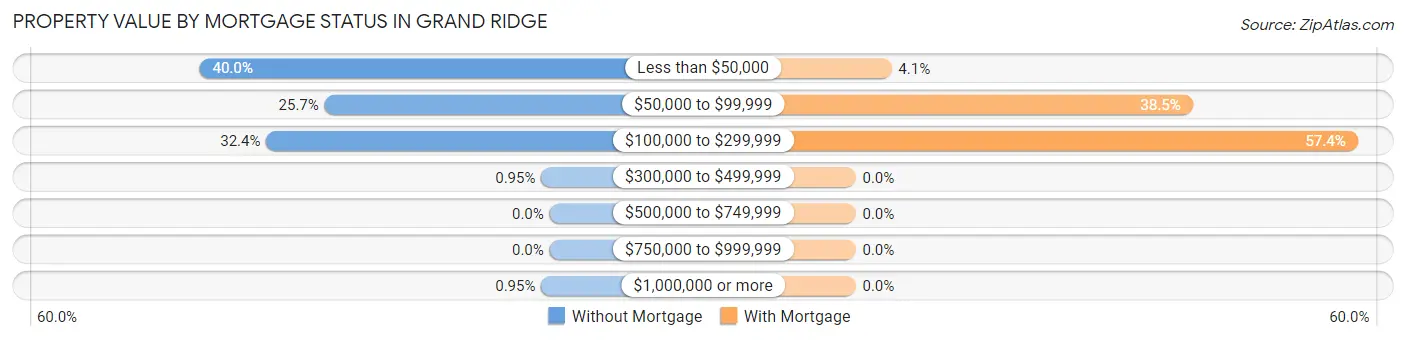
| Property Value | Without Mortgage | With Mortgage |
| Less than $50,000 | 42 (40.0%) | 5 (4.1%) |
| $50,000 to $99,999 | 27 (25.7%) | 47 (38.5%) |
| $100,000 to $299,999 | 34 (32.4%) | 70 (57.4%) |
| $300,000 to $499,999 | 1 (0.9%) | 0 (0.0%) |
| $500,000 to $749,999 | 0 (0.0%) | 0 (0.0%) |
| $750,000 to $999,999 | 0 (0.0%) | 0 (0.0%) |
| $1,000,000 or more | 1 (0.9%) | 0 (0.0%) |
| Total | 105 (100.0%) | 122 (100.0%) |
Household Income by Mortgage Status in Grand Ridge
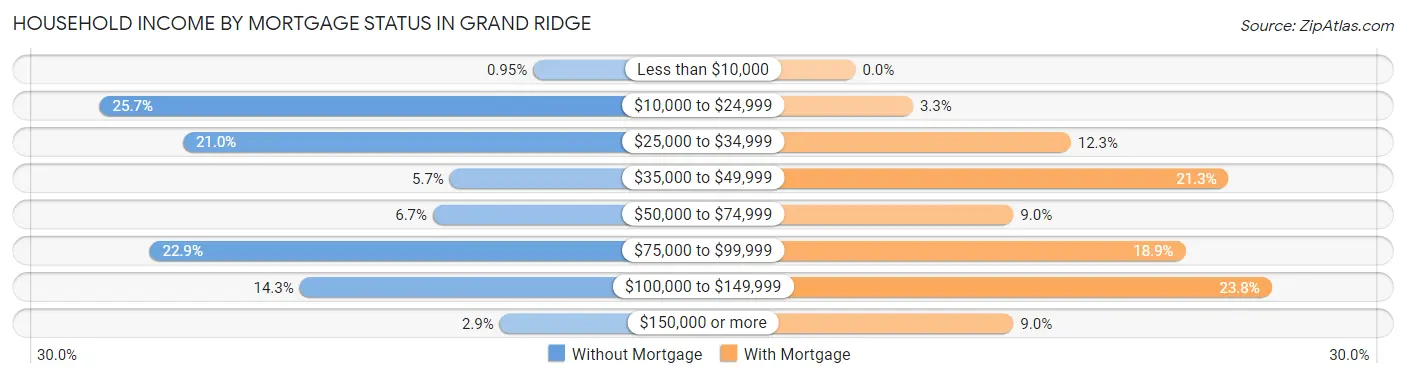
| Household Income | Without Mortgage | With Mortgage |
| Less than $10,000 | 1 (0.9%) | 0 (0.0%) |
| $10,000 to $24,999 | 27 (25.7%) | 4 (3.3%) |
| $25,000 to $34,999 | 22 (20.9%) | 15 (12.3%) |
| $35,000 to $49,999 | 6 (5.7%) | 26 (21.3%) |
| $50,000 to $74,999 | 7 (6.7%) | 11 (9.0%) |
| $75,000 to $99,999 | 24 (22.9%) | 23 (18.9%) |
| $100,000 to $149,999 | 15 (14.3%) | 29 (23.8%) |
| $150,000 or more | 3 (2.9%) | 11 (9.0%) |
| Total | 105 (100.0%) | 122 (100.0%) |
Property Value to Household Income Ratio in Grand Ridge
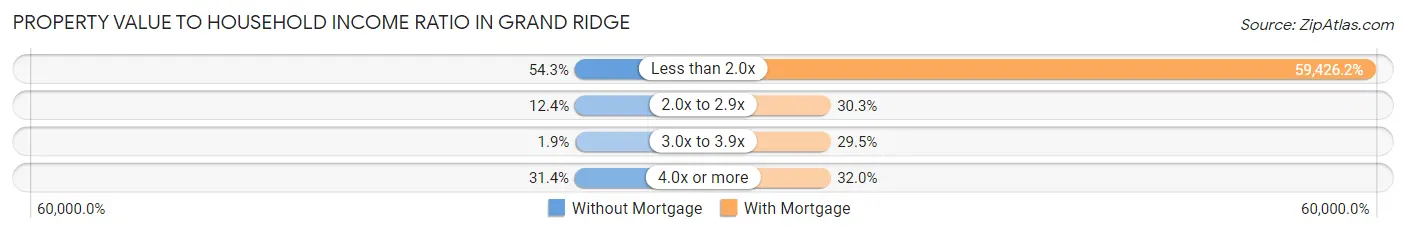
| Value-to-Income Ratio | Without Mortgage | With Mortgage |
| Less than 2.0x | 57 (54.3%) | 72,500 (59,426.2%) |
| 2.0x to 2.9x | 13 (12.4%) | 37 (30.3%) |
| 3.0x to 3.9x | 2 (1.9%) | 36 (29.5%) |
| 4.0x or more | 33 (31.4%) | 39 (32.0%) |
| Total | 105 (100.0%) | 122 (100.0%) |
Real Estate Taxes by Mortgage Status in Grand Ridge
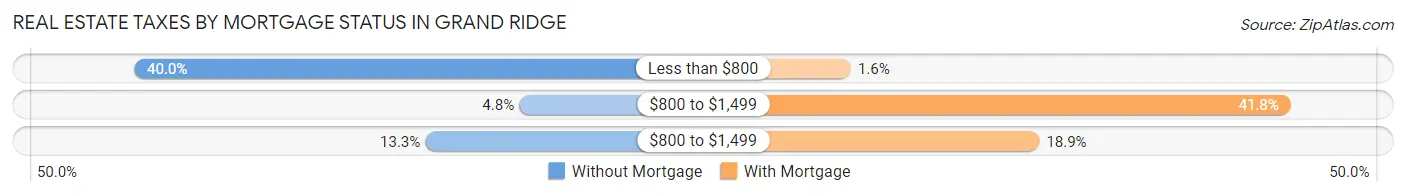
| Property Taxes | Without Mortgage | With Mortgage |
| Less than $800 | 42 (40.0%) | 2 (1.6%) |
| $800 to $1,499 | 5 (4.8%) | 51 (41.8%) |
| $800 to $1,499 | 14 (13.3%) | 23 (18.9%) |
| Total | 105 (100.0%) | 122 (100.0%) |
Health & Disability in Grand Ridge
Health Insurance Coverage by Age in Grand Ridge
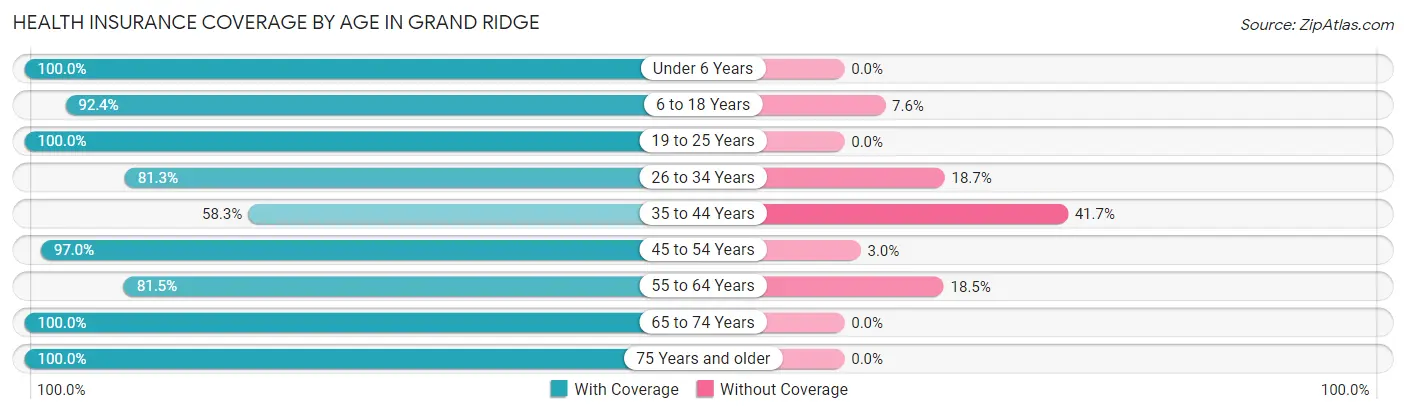
| Age Bracket | With Coverage | Without Coverage |
| Under 6 Years | 69 (100.0%) | 0 (0.0%) |
| 6 to 18 Years | 85 (92.4%) | 7 (7.6%) |
| 19 to 25 Years | 121 (100.0%) | 0 (0.0%) |
| 26 to 34 Years | 87 (81.3%) | 20 (18.7%) |
| 35 to 44 Years | 42 (58.3%) | 30 (41.7%) |
| 45 to 54 Years | 96 (97.0%) | 3 (3.0%) |
| 55 to 64 Years | 66 (81.5%) | 15 (18.5%) |
| 65 to 74 Years | 119 (100.0%) | 0 (0.0%) |
| 75 Years and older | 64 (100.0%) | 0 (0.0%) |
| Total | 749 (90.9%) | 75 (9.1%) |
Health Insurance Coverage by Citizenship Status in Grand Ridge
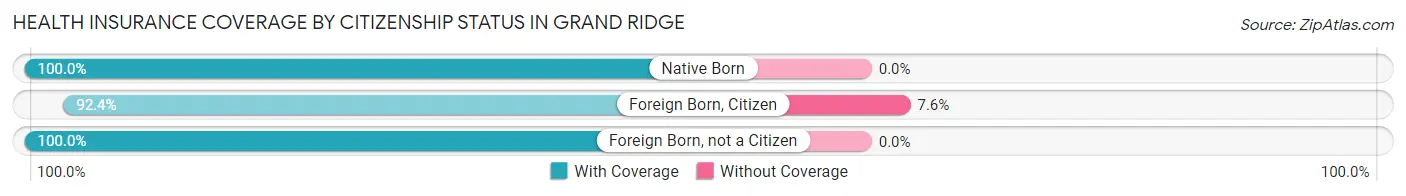
| Citizenship Status | With Coverage | Without Coverage |
| Native Born | 69 (100.0%) | 0 (0.0%) |
| Foreign Born, Citizen | 85 (92.4%) | 7 (7.6%) |
| Foreign Born, not a Citizen | 121 (100.0%) | 0 (0.0%) |
Health Insurance Coverage by Household Income in Grand Ridge
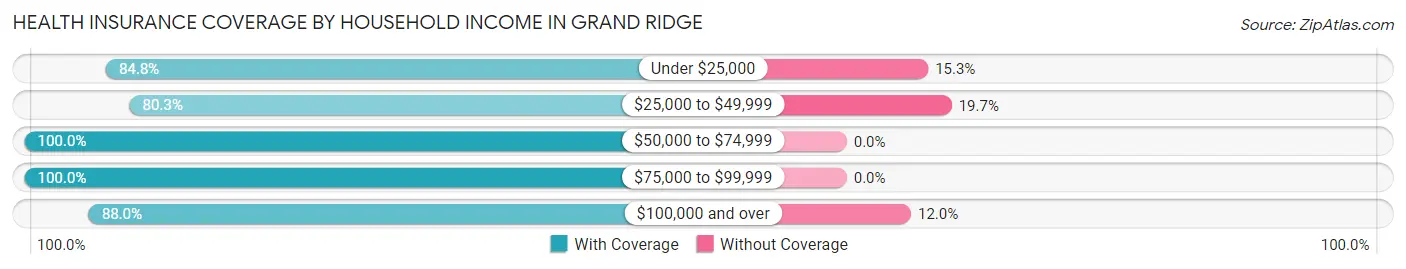
| Household Income | With Coverage | Without Coverage |
| Under $25,000 | 150 (84.8%) | 27 (15.2%) |
| $25,000 to $49,999 | 143 (80.3%) | 35 (19.7%) |
| $50,000 to $74,999 | 111 (100.0%) | 0 (0.0%) |
| $75,000 to $99,999 | 250 (100.0%) | 0 (0.0%) |
| $100,000 and over | 95 (88.0%) | 13 (12.0%) |
Public vs Private Health Insurance Coverage by Age in Grand Ridge

| Age Bracket | Public Insurance | Private Insurance |
| Under 6 | 29 (42.0%) | 40 (58.0%) |
| 6 to 18 Years | 25 (27.2%) | 62 (67.4%) |
| 19 to 25 Years | 30 (24.8%) | 91 (75.2%) |
| 25 to 34 Years | 2 (1.9%) | 85 (79.4%) |
| 35 to 44 Years | 17 (23.6%) | 28 (38.9%) |
| 45 to 54 Years | 21 (21.2%) | 79 (79.8%) |
| 55 to 64 Years | 25 (30.9%) | 52 (64.2%) |
| 65 to 74 Years | 119 (100.0%) | 37 (31.1%) |
| 75 Years and over | 64 (100.0%) | 31 (48.4%) |
| Total | 332 (40.3%) | 505 (61.3%) |
Disability Status by Sex by Age in Grand Ridge
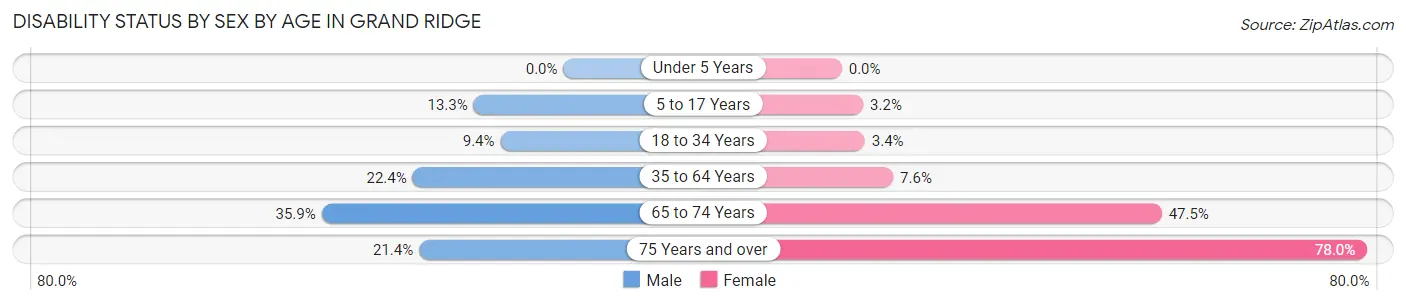
| Age Bracket | Male | Female |
| Under 5 Years | 0 (0.0%) | 0 (0.0%) |
| 5 to 17 Years | 2 (13.3%) | 2 (3.2%) |
| 18 to 34 Years | 10 (9.3%) | 5 (3.4%) |
| 35 to 64 Years | 30 (22.4%) | 9 (7.6%) |
| 65 to 74 Years | 14 (35.9%) | 38 (47.5%) |
| 75 Years and over | 3 (21.4%) | 39 (78.0%) |
Disability Class by Sex by Age in Grand Ridge
Disability Class: Hearing Difficulty
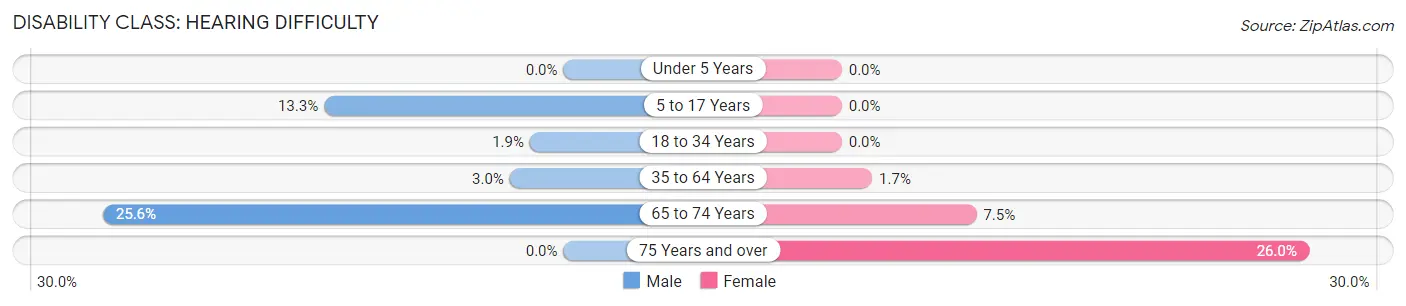
| Age Bracket | Male | Female |
| Under 5 Years | 0 (0.0%) | 0 (0.0%) |
| 5 to 17 Years | 2 (13.3%) | 0 (0.0%) |
| 18 to 34 Years | 2 (1.9%) | 0 (0.0%) |
| 35 to 64 Years | 4 (3.0%) | 2 (1.7%) |
| 65 to 74 Years | 10 (25.6%) | 6 (7.5%) |
| 75 Years and over | 0 (0.0%) | 13 (26.0%) |
Disability Class: Vision Difficulty
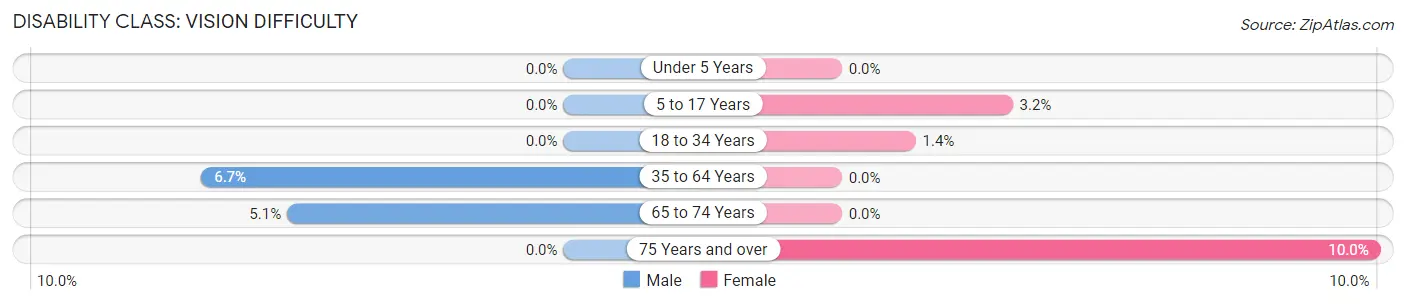
| Age Bracket | Male | Female |
| Under 5 Years | 0 (0.0%) | 0 (0.0%) |
| 5 to 17 Years | 0 (0.0%) | 2 (3.2%) |
| 18 to 34 Years | 0 (0.0%) | 2 (1.4%) |
| 35 to 64 Years | 9 (6.7%) | 0 (0.0%) |
| 65 to 74 Years | 2 (5.1%) | 0 (0.0%) |
| 75 Years and over | 0 (0.0%) | 5 (10.0%) |
Disability Class: Cognitive Difficulty
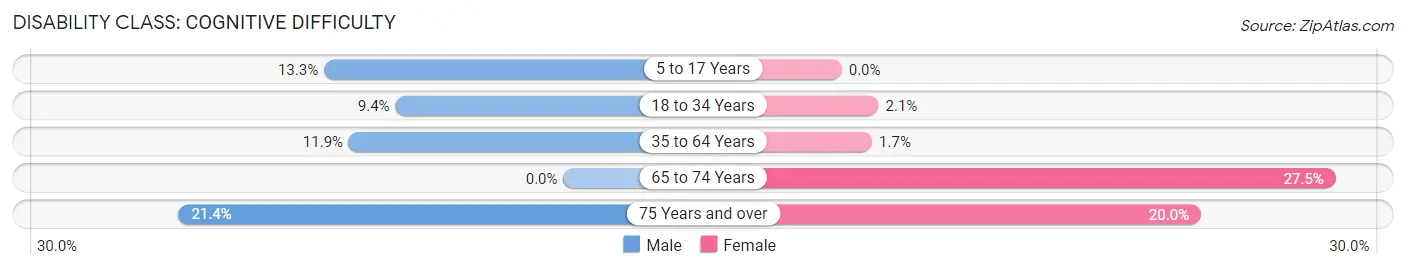
| Age Bracket | Male | Female |
| 5 to 17 Years | 2 (13.3%) | 0 (0.0%) |
| 18 to 34 Years | 10 (9.3%) | 3 (2.1%) |
| 35 to 64 Years | 16 (11.9%) | 2 (1.7%) |
| 65 to 74 Years | 0 (0.0%) | 22 (27.5%) |
| 75 Years and over | 3 (21.4%) | 10 (20.0%) |
Disability Class: Ambulatory Difficulty
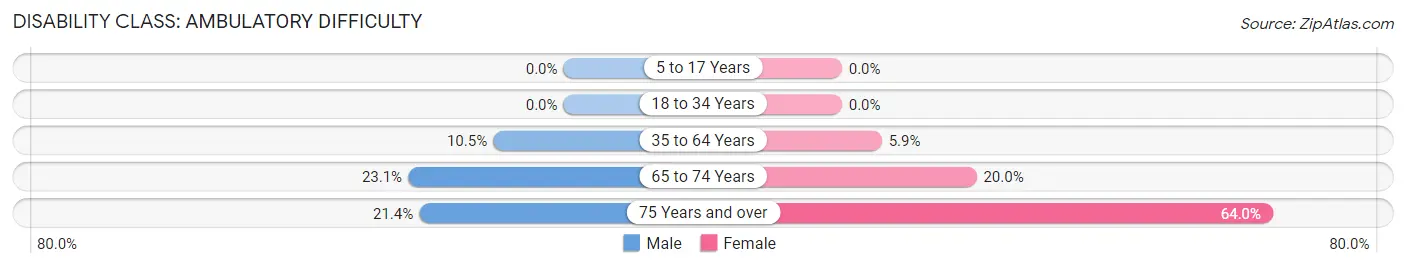
| Age Bracket | Male | Female |
| 5 to 17 Years | 0 (0.0%) | 0 (0.0%) |
| 18 to 34 Years | 0 (0.0%) | 0 (0.0%) |
| 35 to 64 Years | 14 (10.4%) | 7 (5.9%) |
| 65 to 74 Years | 9 (23.1%) | 16 (20.0%) |
| 75 Years and over | 3 (21.4%) | 32 (64.0%) |
Disability Class: Self-Care Difficulty
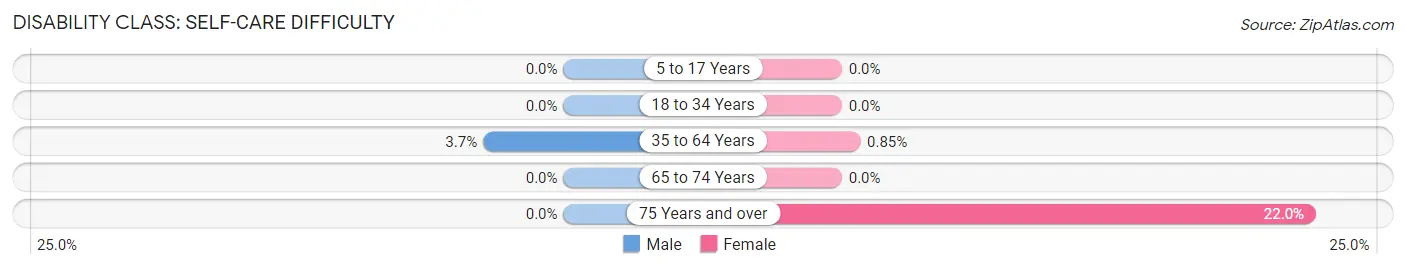
| Age Bracket | Male | Female |
| 5 to 17 Years | 0 (0.0%) | 0 (0.0%) |
| 18 to 34 Years | 0 (0.0%) | 0 (0.0%) |
| 35 to 64 Years | 5 (3.7%) | 1 (0.9%) |
| 65 to 74 Years | 0 (0.0%) | 0 (0.0%) |
| 75 Years and over | 0 (0.0%) | 11 (22.0%) |
Technology Access in Grand Ridge
Computing Device Access in Grand Ridge
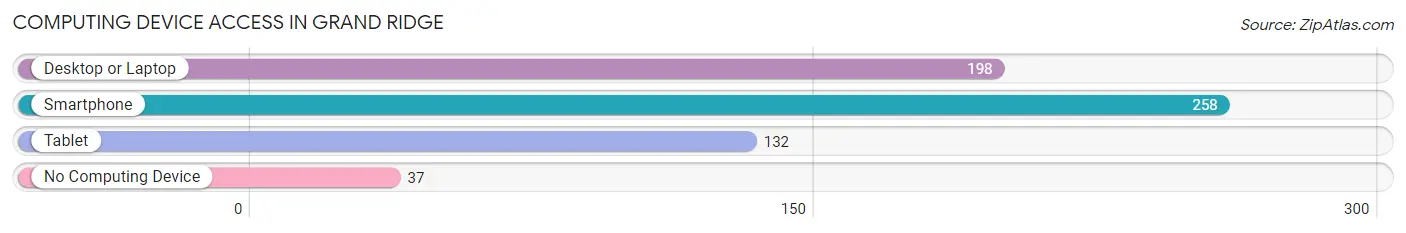
| Device Type | # Households | % Households |
| Desktop or Laptop | 198 | 60.7% |
| Smartphone | 258 | 79.1% |
| Tablet | 132 | 40.5% |
| No Computing Device | 37 | 11.4% |
| Total | 326 | 100.0% |
Internet Access in Grand Ridge
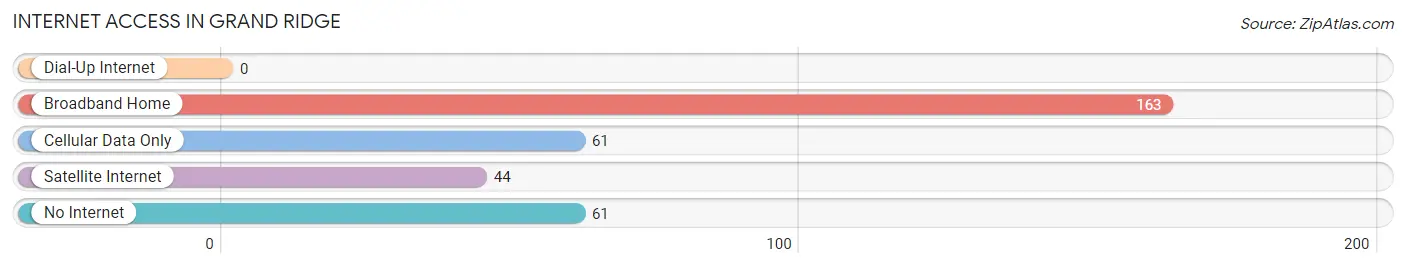
| Internet Type | # Households | % Households |
| Dial-Up Internet | 0 | 0.0% |
| Broadband Home | 163 | 50.0% |
| Cellular Data Only | 61 | 18.7% |
| Satellite Internet | 44 | 13.5% |
| No Internet | 61 | 18.7% |
| Total | 326 | 100.0% |
Grand Ridge Summary
History
The small town of Grand Ridge, Florida is located in Jackson County, in the panhandle of the state. It was founded in 1884 by the Reverend J.W. Johnson, who was a minister and a farmer. He named the town after the nearby Grand Ridge, which is a ridge of sand hills that runs through the area. The town was originally a farming community, and the main crops were cotton, corn, and peanuts.
In the early 1900s, the town began to grow and develop. The first post office was established in 1906, and the first bank opened in 1908. The town also had a hotel, a general store, and a sawmill. In the 1920s, the town was connected to the rest of the state by the railroad, and the population began to grow.
In the 1950s, the town began to experience a decline in population as people moved away to larger cities. However, in the late 1970s, the town began to experience a resurgence in population as people moved back to the area. Today, Grand Ridge is a small, rural town with a population of about 1,000 people.
Geography
Grand Ridge is located in the panhandle of Florida, in Jackson County. It is situated on the banks of the Chipola River, which is a tributary of the Apalachicola River. The town is surrounded by rolling hills and is located about 20 miles from the Gulf of Mexico. The town is located in a humid subtropical climate, with hot, humid summers and mild winters.
The town is located near several state parks, including the Florida Caverns State Park, the Apalachicola National Forest, and the St. Marks National Wildlife Refuge. The town is also located near several lakes, including Lake Seminole, Lake Talquin, and Lake Jackson.
Economy
The economy of Grand Ridge is largely based on agriculture. The town is home to several farms, which produce cotton, corn, peanuts, and other crops. The town is also home to several small businesses, including restaurants, retail stores, and service providers.
The town is also home to several manufacturing companies, including a paper mill and a furniture factory. The town is also home to several logging companies, which harvest timber from the nearby forests.
Demographics
As of the 2010 census, the population of Grand Ridge was 1,039. The racial makeup of the town was 79.3% White, 17.2% African American, 0.7% Native American, 0.3% Asian, 0.1% Pacific Islander, and 2.4% from other races. Hispanic or Latino of any race were 3.2% of the population.
The median household income in Grand Ridge was $30,938, and the median family income was $37,813. The per capita income was $15,945. About 17.2% of the population was below the poverty line.
Common Questions
What is Per Capita Income in Grand Ridge?
Per Capita income in Grand Ridge is $24,454.
What is the Median Family Income in Grand Ridge?
Median Family Income in Grand Ridge is $51,250.
What is the Median Household income in Grand Ridge?
Median Household Income in Grand Ridge is $37,065.
What is Income or Wage Gap in Grand Ridge?
Income or Wage Gap in Grand Ridge is 4.4%.
Women in Grand Ridge earn 95.6 cents for every dollar earned by a man.
What is Family Income Deficit in Grand Ridge?
Family Income Deficit in Grand Ridge is $14,060.
Families that are below poverty line in Grand Ridge earn $14,060 less on average than the poverty threshold level.
What is Inequality or Gini Index in Grand Ridge?
Inequality or Gini Index in Grand Ridge is 0.46.
What is the Total Population of Grand Ridge?
Total Population of Grand Ridge is 824.
What is the Total Male Population of Grand Ridge?
Total Male Population of Grand Ridge is 324.
What is the Total Female Population of Grand Ridge?
Total Female Population of Grand Ridge is 500.
What is the Ratio of Males per 100 Females in Grand Ridge?
There are 64.80 Males per 100 Females in Grand Ridge.
What is the Ratio of Females per 100 Males in Grand Ridge?
There are 154.32 Females per 100 Males in Grand Ridge.
What is the Median Population Age in Grand Ridge?
Median Population Age in Grand Ridge is 39.8 Years.
What is the Average Family Size in Grand Ridge
Average Family Size in Grand Ridge is 3.2 People.
What is the Average Household Size in Grand Ridge
Average Household Size in Grand Ridge is 2.5 People.
How Large is the Labor Force in Grand Ridge?
There are 394 People in the Labor Forcein in Grand Ridge.
What is the Percentage of People in the Labor Force in Grand Ridge?
55.0% of People are in the Labor Force in Grand Ridge.
What is the Unemployment Rate in Grand Ridge?
Unemployment Rate in Grand Ridge is 2.3%.