Graceville, FL Map & Demographics
Graceville Map
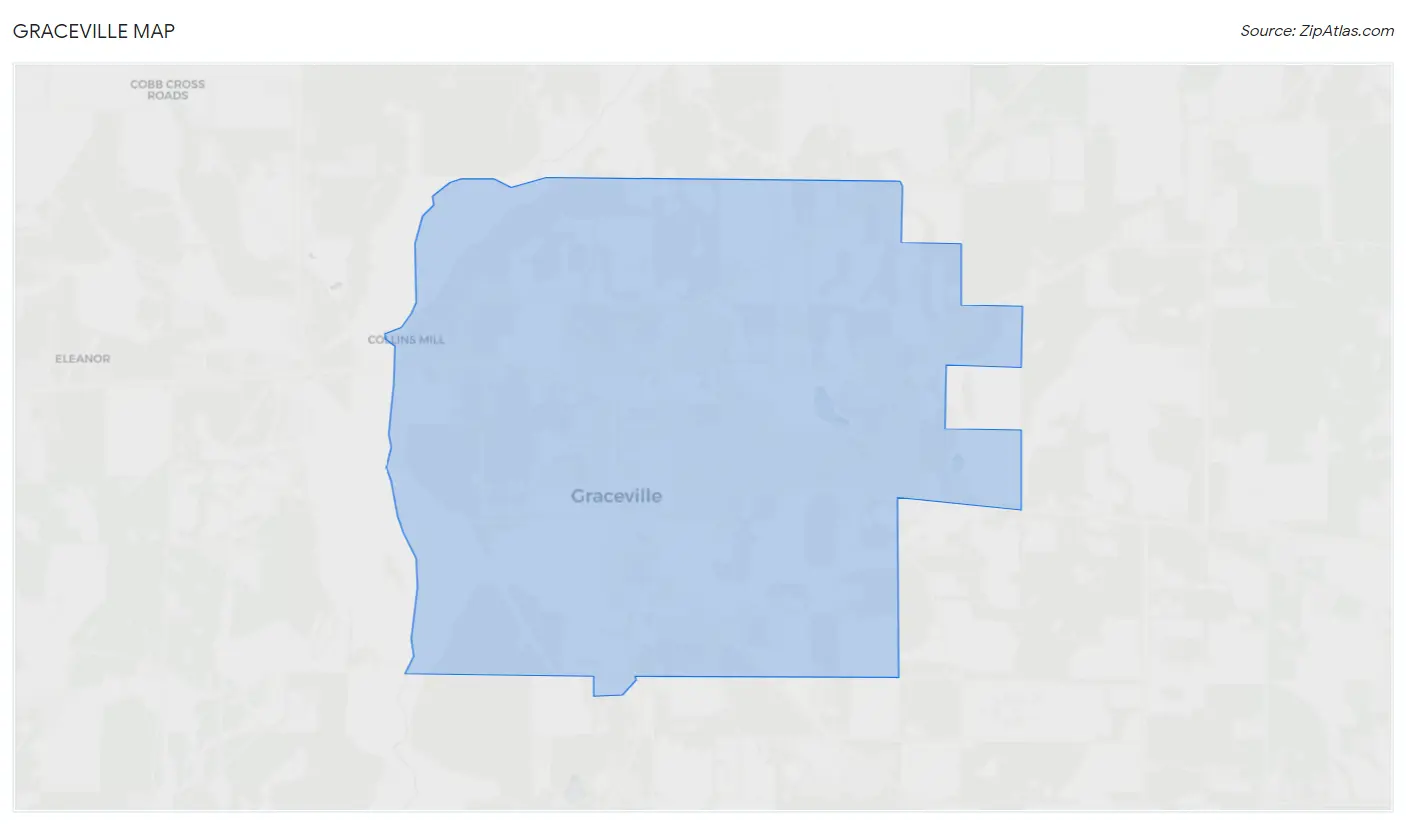
Graceville Overview
$26,964
PER CAPITA INCOME
$55,690
AVG FAMILY INCOME
$36,625
AVG HOUSEHOLD INCOME
11.5%
WAGE / INCOME GAP [ % ]
88.5¢/ $1
WAGE / INCOME GAP [ $ ]
0.57
INEQUALITY / GINI INDEX
2,717
TOTAL POPULATION
1,390
MALE POPULATION
1,327
FEMALE POPULATION
104.75
MALES / 100 FEMALES
95.47
FEMALES / 100 MALES
31.7
MEDIAN AGE
2.8
AVG FAMILY SIZE
2.2
AVG HOUSEHOLD SIZE
1,291
LABOR FORCE [ PEOPLE ]
53.7%
PERCENT IN LABOR FORCE
4.9%
UNEMPLOYMENT RATE
Graceville Zip Codes
Graceville Area Codes
Income in Graceville
Income Overview in Graceville
Per Capita Income in Graceville is $26,964, while median incomes of families and households are $55,690 and $36,625 respectively.
| Characteristic | Number | Measure |
| Per Capita Income | 2,717 | $26,964 |
| Median Family Income | 540 | $55,690 |
| Mean Family Income | 540 | $94,071 |
| Median Household Income | 895 | $36,625 |
| Mean Household Income | 895 | $72,502 |
| Income Deficit | 540 | $0 |
| Wage / Income Gap (%) | 2,717 | 11.52% |
| Wage / Income Gap ($) | 2,717 | 88.48¢ per $1 |
| Gini / Inequality Index | 2,717 | 0.57 |
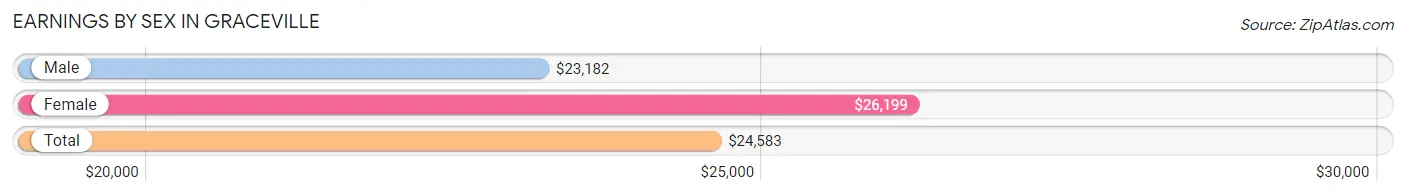
Earnings by Sex in Graceville
Average Earnings in Graceville are $24,583, $23,182 for men and $26,199 for women, a difference of 11.5%.
| Sex | Number | Average Earnings |
| Male | 726 (54.3%) | $23,182 |
| Female | 610 (45.7%) | $26,199 |
| Total | 1,336 (100.0%) | $24,583 |
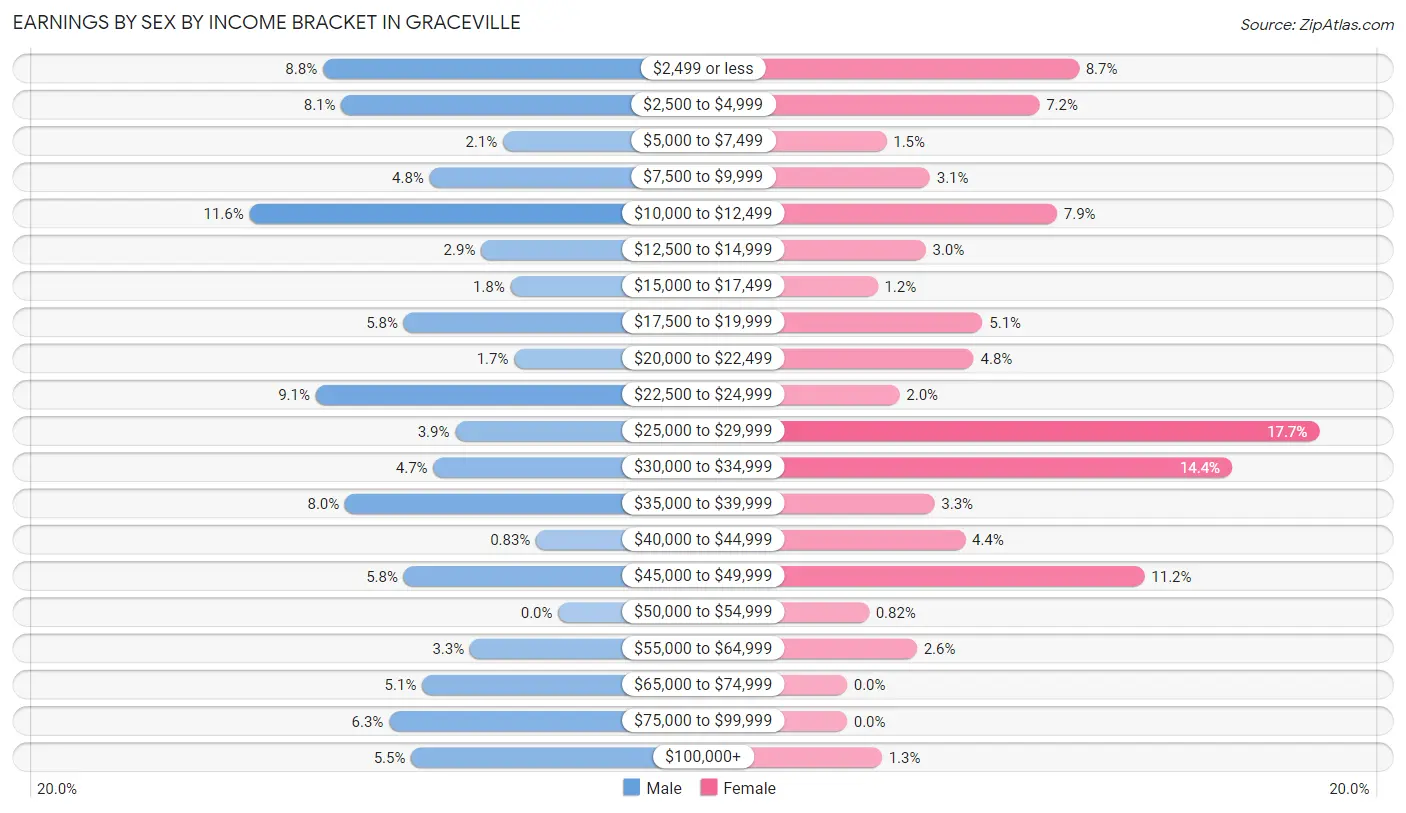
Earnings by Sex by Income Bracket in Graceville
The most common earnings brackets in Graceville are $10,000 to $12,499 for men (84 | 11.6%) and $25,000 to $29,999 for women (108 | 17.7%).
| Income | Male | Female |
| $2,499 or less | 64 (8.8%) | 53 (8.7%) |
| $2,500 to $4,999 | 59 (8.1%) | 44 (7.2%) |
| $5,000 to $7,499 | 15 (2.1%) | 9 (1.5%) |
| $7,500 to $9,999 | 35 (4.8%) | 19 (3.1%) |
| $10,000 to $12,499 | 84 (11.6%) | 48 (7.9%) |
| $12,500 to $14,999 | 21 (2.9%) | 18 (2.9%) |
| $15,000 to $17,499 | 13 (1.8%) | 7 (1.1%) |
| $17,500 to $19,999 | 42 (5.8%) | 31 (5.1%) |
| $20,000 to $22,499 | 12 (1.7%) | 29 (4.8%) |
| $22,500 to $24,999 | 66 (9.1%) | 12 (2.0%) |
| $25,000 to $29,999 | 28 (3.9%) | 108 (17.7%) |
| $30,000 to $34,999 | 34 (4.7%) | 88 (14.4%) |
| $35,000 to $39,999 | 58 (8.0%) | 20 (3.3%) |
| $40,000 to $44,999 | 6 (0.8%) | 27 (4.4%) |
| $45,000 to $49,999 | 42 (5.8%) | 68 (11.2%) |
| $50,000 to $54,999 | 0 (0.0%) | 5 (0.8%) |
| $55,000 to $64,999 | 24 (3.3%) | 16 (2.6%) |
| $65,000 to $74,999 | 37 (5.1%) | 0 (0.0%) |
| $75,000 to $99,999 | 46 (6.3%) | 0 (0.0%) |
| $100,000+ | 40 (5.5%) | 8 (1.3%) |
| Total | 726 (100.0%) | 610 (100.0%) |
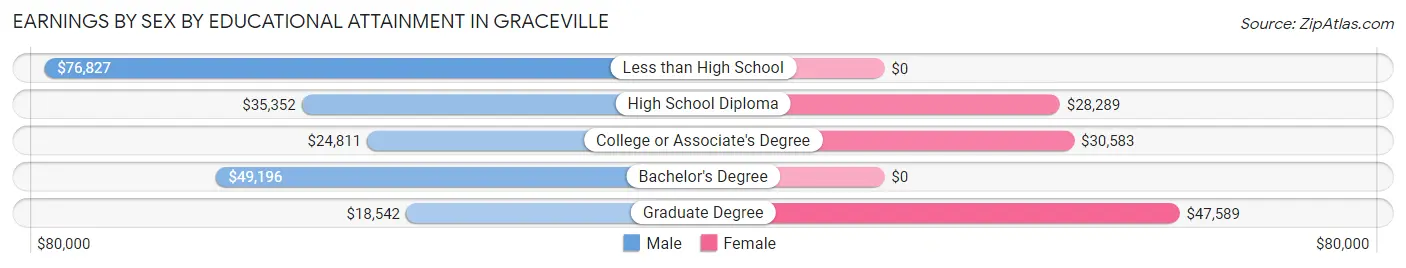
Earnings by Sex by Educational Attainment in Graceville
Average earnings in Graceville are $35,612 for men and $30,503 for women, a difference of 14.3%. Men with an educational attainment of less than high school enjoy the highest average annual earnings of $76,827, while those with graduate degree education earn the least with $18,542. Women with an educational attainment of graduate degree earn the most with the average annual earnings of $47,589, while those with high school diploma education have the smallest earnings of $28,289.
| Educational Attainment | Male Income | Female Income |
| Less than High School | $76,827 | $0 |
| High School Diploma | $35,352 | $28,289 |
| College or Associate's Degree | $24,811 | $30,583 |
| Bachelor's Degree | $49,196 | $0 |
| Graduate Degree | $18,542 | $47,589 |
| Total | $35,612 | $30,503 |
Family Income in Graceville
Family Income Brackets in Graceville
According to the Graceville family income data, there are 135 families falling into the $100,000 to $149,999 income range, which is the most common income bracket and makes up 25.0% of all families. Conversely, the $200,000+ income bracket is the least frequent group with only 15 families (2.8%) belonging to this category.
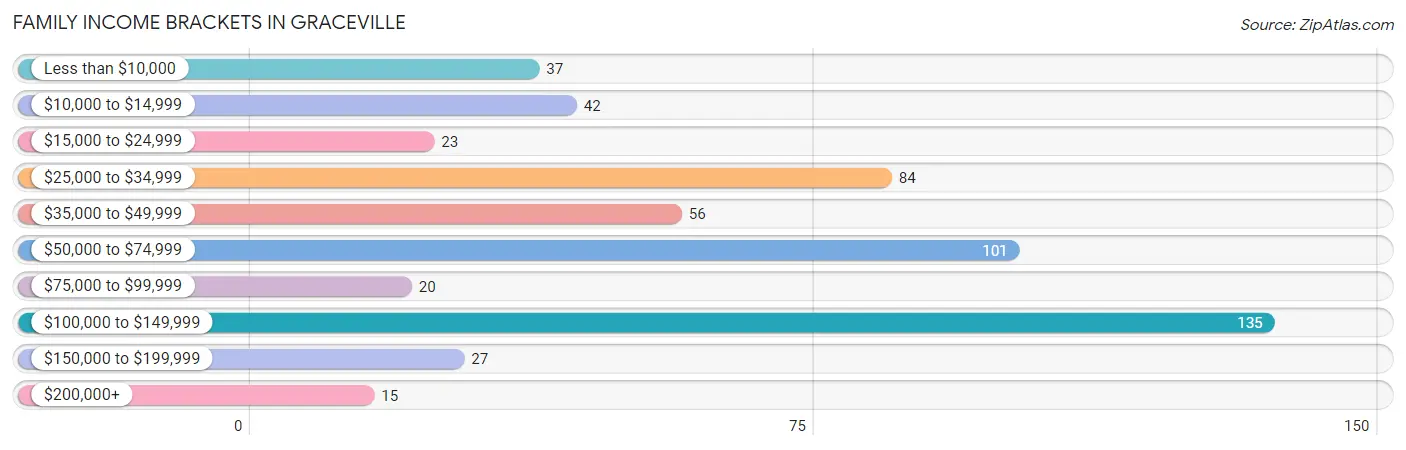
| Income Bracket | # Families | % Families |
| Less than $10,000 | 37 | 6.9% |
| $10,000 to $14,999 | 42 | 7.8% |
| $15,000 to $24,999 | 23 | 4.3% |
| $25,000 to $34,999 | 84 | 15.6% |
| $35,000 to $49,999 | 56 | 10.4% |
| $50,000 to $74,999 | 101 | 18.7% |
| $75,000 to $99,999 | 20 | 3.7% |
| $100,000 to $149,999 | 135 | 25.0% |
| $150,000 to $199,999 | 27 | 5.0% |
| $200,000+ | 15 | 2.8% |
Family Income by Famaliy Size in Graceville
2-person families (354 | 65.6%) account for the highest median family income in Graceville with $65,789 per family, while 2-person families (354 | 65.6%) have the highest median income of $32,894 per family member.
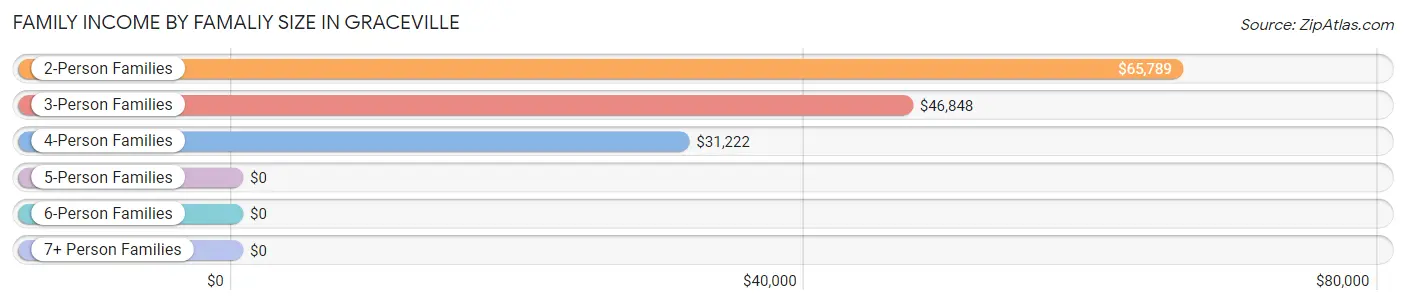
| Income Bracket | # Families | Median Income |
| 2-Person Families | 354 (65.6%) | $65,789 |
| 3-Person Families | 84 (15.6%) | $46,848 |
| 4-Person Families | 73 (13.5%) | $31,222 |
| 5-Person Families | 15 (2.8%) | $0 |
| 6-Person Families | 10 (1.8%) | $0 |
| 7+ Person Families | 4 (0.7%) | $0 |
| Total | 540 (100.0%) | $55,690 |
Family Income by Number of Earners in Graceville
The median family income in Graceville is $55,690, with families comprising 3+ earners (21) having the highest median family income of $154,375, while families with no earners (97) have the lowest median family income of $27,625, accounting for 3.9% and 18.0% of families, respectively.
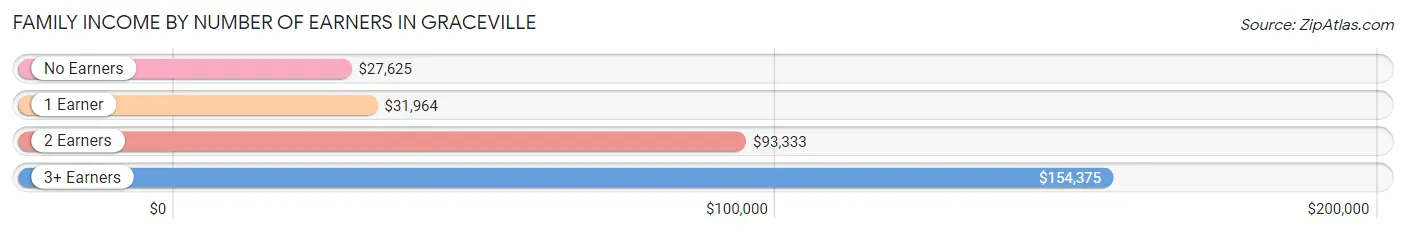
| Number of Earners | # Families | Median Income |
| No Earners | 97 (18.0%) | $27,625 |
| 1 Earner | 190 (35.2%) | $31,964 |
| 2 Earners | 232 (43.0%) | $93,333 |
| 3+ Earners | 21 (3.9%) | $154,375 |
| Total | 540 (100.0%) | $55,690 |
Household Income in Graceville
Household Income Brackets in Graceville
With 185 households falling in the category, the $25,000 to $34,999 income range is the most frequent in Graceville, accounting for 20.7% of all households. In contrast, only 15 households (1.7%) fall into the $200,000+ income bracket, making it the least populous group.
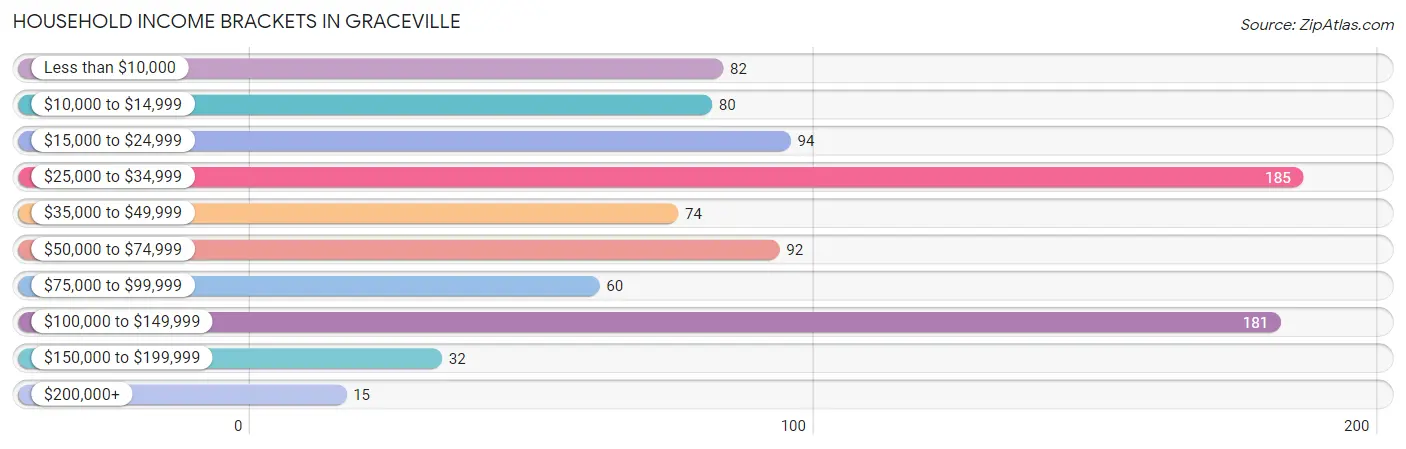
| Income Bracket | # Households | % Households |
| Less than $10,000 | 82 | 9.2% |
| $10,000 to $14,999 | 80 | 8.9% |
| $15,000 to $24,999 | 94 | 10.5% |
| $25,000 to $34,999 | 185 | 20.7% |
| $35,000 to $49,999 | 74 | 8.3% |
| $50,000 to $74,999 | 92 | 10.3% |
| $75,000 to $99,999 | 60 | 6.7% |
| $100,000 to $149,999 | 181 | 20.2% |
| $150,000 to $199,999 | 32 | 3.6% |
| $200,000+ | 15 | 1.7% |
Household Income by Householder Age in Graceville
The median household income in Graceville is $36,625, with the highest median household income of $56,250 found in the 15 to 24 years age bracket for the primary householder. A total of 30 households (3.4%) fall into this category. Meanwhile, the 45 to 64 years age bracket for the primary householder has the lowest median household income of $0, with 209 households (23.4%) in this group.
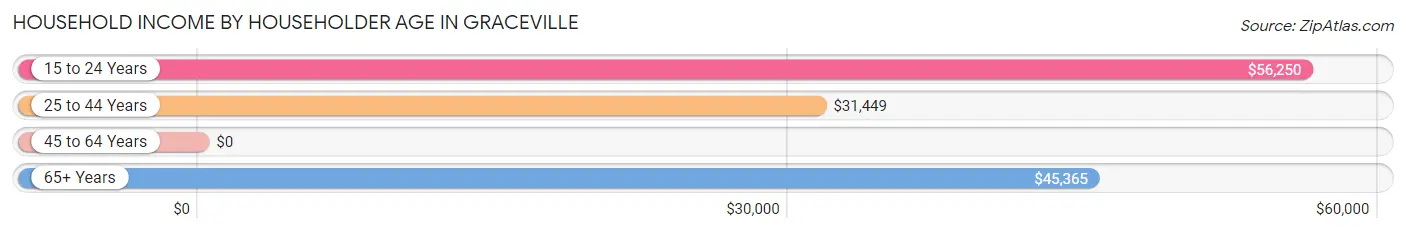
| Income Bracket | # Households | Median Income |
| 15 to 24 Years | 30 (3.4%) | $56,250 |
| 25 to 44 Years | 335 (37.4%) | $31,449 |
| 45 to 64 Years | 209 (23.4%) | $0 |
| 65+ Years | 321 (35.9%) | $45,365 |
| Total | 895 (100.0%) | $36,625 |
Poverty in Graceville
Income Below Poverty by Sex and Age in Graceville
With 17.0% poverty level for males and 23.8% for females among the residents of Graceville, 15 year old males and 16 and 17 year old females are the most vulnerable to poverty, with 5 males (100.0%) and 17 females (100.0%) in their respective age groups living below the poverty level.
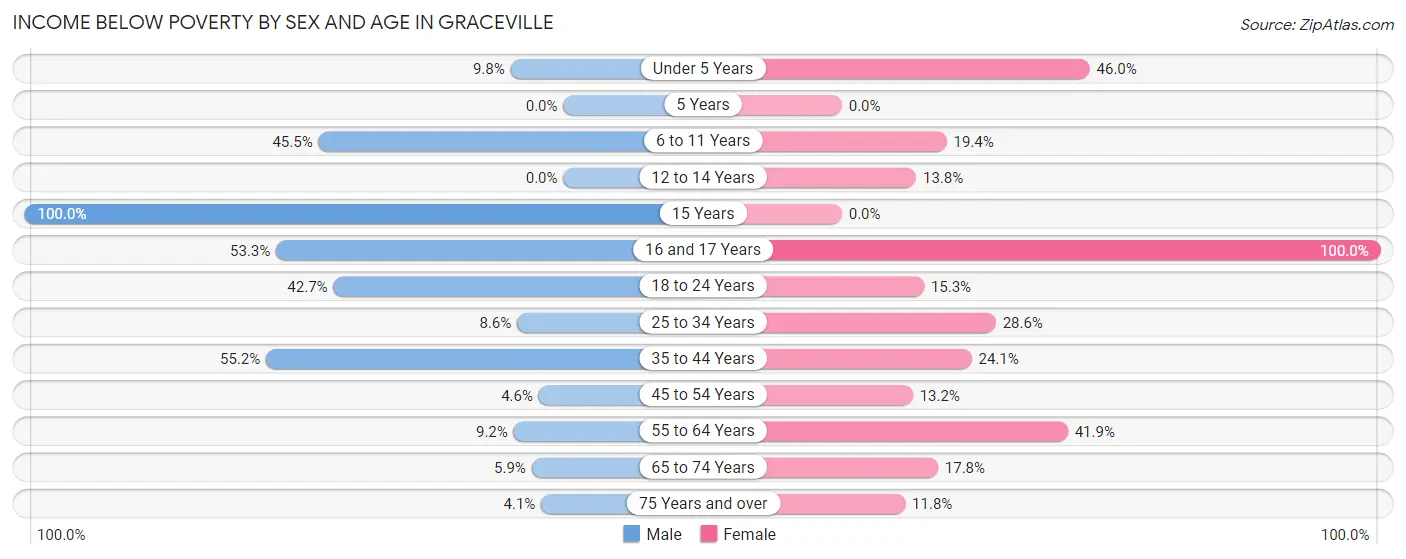
| Age Bracket | Male | Female |
| Under 5 Years | 5 (9.8%) | 23 (46.0%) |
| 5 Years | 0 (0.0%) | 0 (0.0%) |
| 6 to 11 Years | 25 (45.5%) | 7 (19.4%) |
| 12 to 14 Years | 0 (0.0%) | 8 (13.8%) |
| 15 Years | 5 (100.0%) | 0 (0.0%) |
| 16 and 17 Years | 8 (53.3%) | 17 (100.0%) |
| 18 to 24 Years | 35 (42.7%) | 9 (15.2%) |
| 25 to 34 Years | 23 (8.6%) | 42 (28.6%) |
| 35 to 44 Years | 48 (55.2%) | 33 (24.1%) |
| 45 to 54 Years | 6 (4.5%) | 15 (13.2%) |
| 55 to 64 Years | 6 (9.2%) | 39 (41.9%) |
| 65 to 74 Years | 6 (5.9%) | 23 (17.8%) |
| 75 Years and over | 4 (4.1%) | 14 (11.8%) |
| Total | 171 (17.0%) | 230 (23.8%) |
Income Above Poverty by Sex and Age in Graceville
According to the poverty statistics in Graceville, males aged 5 years and females aged 5 years are the age groups that are most secure financially, with 100.0% of males and 100.0% of females in these age groups living above the poverty line.
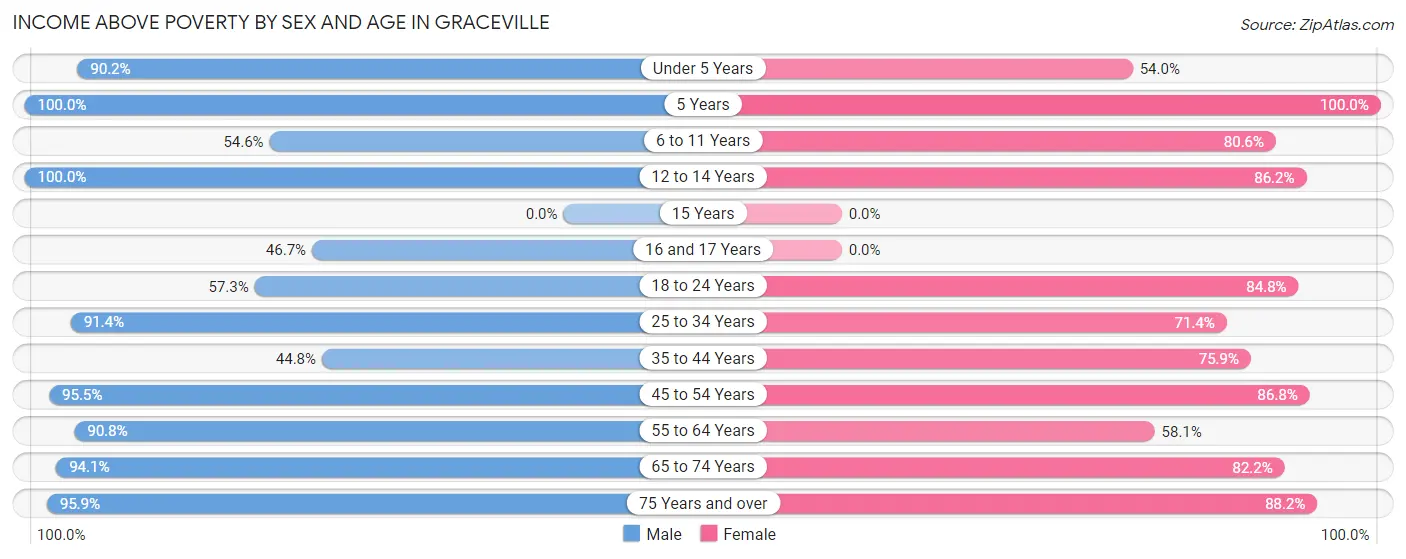
| Age Bracket | Male | Female |
| Under 5 Years | 46 (90.2%) | 27 (54.0%) |
| 5 Years | 39 (100.0%) | 7 (100.0%) |
| 6 to 11 Years | 30 (54.5%) | 29 (80.6%) |
| 12 to 14 Years | 11 (100.0%) | 50 (86.2%) |
| 15 Years | 0 (0.0%) | 0 (0.0%) |
| 16 and 17 Years | 7 (46.7%) | 0 (0.0%) |
| 18 to 24 Years | 47 (57.3%) | 50 (84.8%) |
| 25 to 34 Years | 245 (91.4%) | 105 (71.4%) |
| 35 to 44 Years | 39 (44.8%) | 104 (75.9%) |
| 45 to 54 Years | 126 (95.5%) | 99 (86.8%) |
| 55 to 64 Years | 59 (90.8%) | 54 (58.1%) |
| 65 to 74 Years | 96 (94.1%) | 106 (82.2%) |
| 75 Years and over | 93 (95.9%) | 105 (88.2%) |
| Total | 838 (83.1%) | 736 (76.2%) |
Income Below Poverty Among Married-Couple Families in Graceville
The poverty statistics for married-couple families in Graceville show that 4.9% or 15 of the total 305 families live below the poverty line. Families with 3 or 4 children have the highest poverty rate of 69.2%, comprising of 9 families. On the other hand, families with 1 or 2 children have the lowest poverty rate of 0.0%, which includes 0 families.
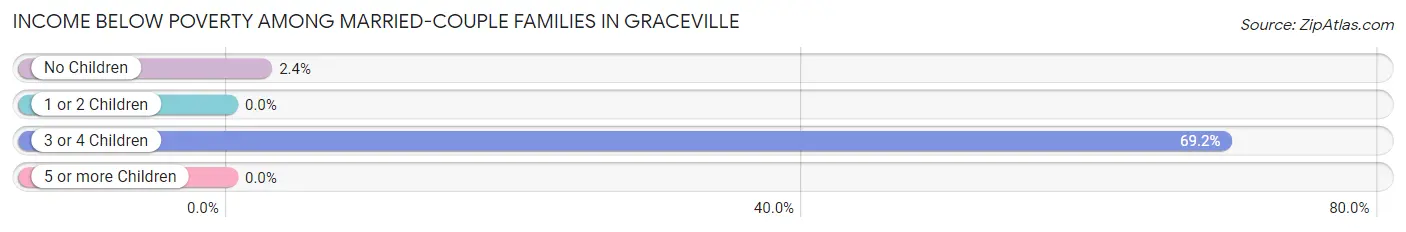
| Children | Above Poverty | Below Poverty |
| No Children | 246 (97.6%) | 6 (2.4%) |
| 1 or 2 Children | 40 (100.0%) | 0 (0.0%) |
| 3 or 4 Children | 4 (30.8%) | 9 (69.2%) |
| 5 or more Children | 0 (0.0%) | 0 (0.0%) |
| Total | 290 (95.1%) | 15 (4.9%) |
Income Below Poverty Among Single-Parent Households in Graceville
According to the poverty data in Graceville, 20.5% or 8 single-father households and 40.3% or 79 single-mother households are living below the poverty line. Among single-father households, those with 1 or 2 children have the highest poverty rate, with 8 households (36.4%) experiencing poverty. Likewise, among single-mother households, those with 1 or 2 children have the highest poverty rate, with 39 households (61.9%) falling below the poverty line.
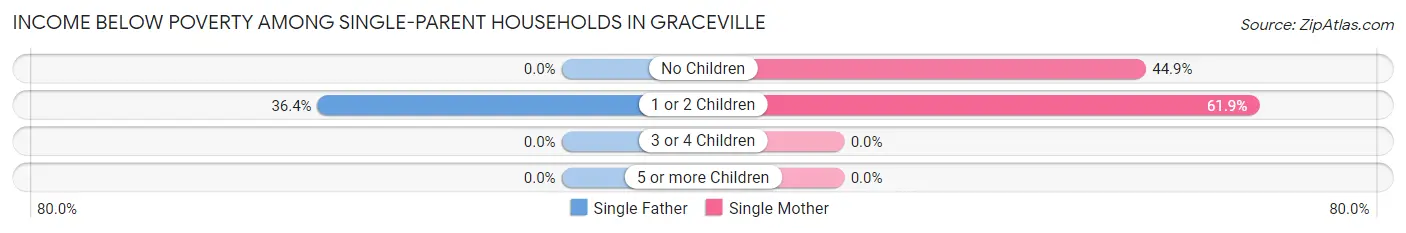
| Children | Single Father | Single Mother |
| No Children | 0 (0.0%) | 40 (44.9%) |
| 1 or 2 Children | 8 (36.4%) | 39 (61.9%) |
| 3 or 4 Children | 0 (0.0%) | 0 (0.0%) |
| 5 or more Children | 0 (0.0%) | 0 (0.0%) |
| Total | 8 (20.5%) | 79 (40.3%) |
Income Below Poverty Among Married-Couple vs Single-Parent Households in Graceville
The poverty data for Graceville shows that 15 of the married-couple family households (4.9%) and 87 of the single-parent households (37.0%) are living below the poverty level. Within the married-couple family households, those with 3 or 4 children have the highest poverty rate, with 9 households (69.2%) falling below the poverty line. Among the single-parent households, those with 1 or 2 children have the highest poverty rate, with 47 household (55.3%) living below poverty.
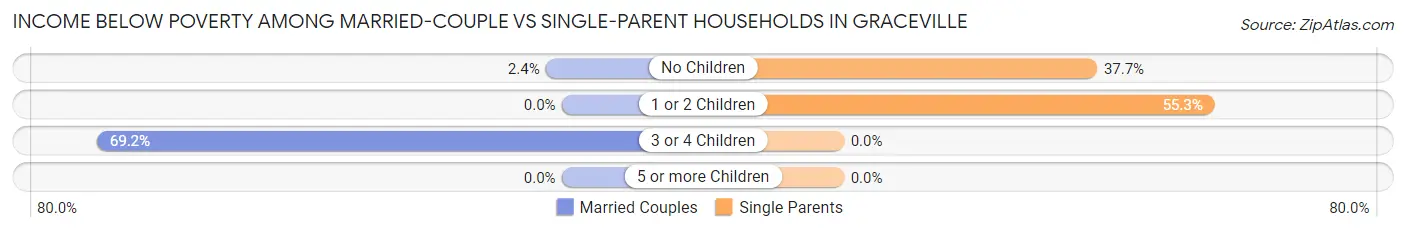
| Children | Married-Couple Families | Single-Parent Households |
| No Children | 6 (2.4%) | 40 (37.7%) |
| 1 or 2 Children | 0 (0.0%) | 47 (55.3%) |
| 3 or 4 Children | 9 (69.2%) | 0 (0.0%) |
| 5 or more Children | 0 (0.0%) | 0 (0.0%) |
| Total | 15 (4.9%) | 87 (37.0%) |
Race in Graceville
The most populous races in Graceville are White / Caucasian (1,926 | 70.9%), Black / African American (700 | 25.8%), and Hispanic or Latino (140 | 5.1%).
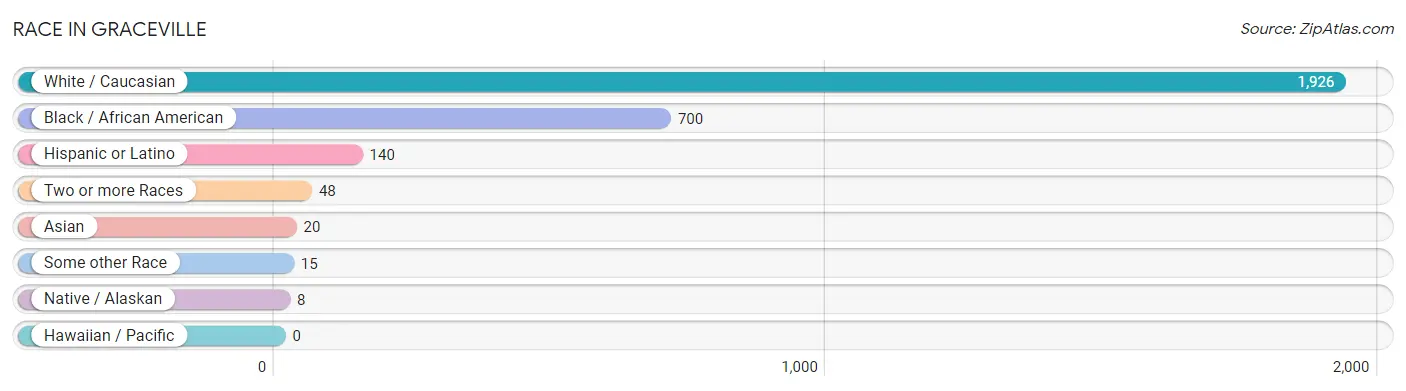
| Race | # Population | % Population |
| Asian | 20 | 0.7% |
| Black / African American | 700 | 25.8% |
| Hawaiian / Pacific | 0 | 0.0% |
| Hispanic or Latino | 140 | 5.1% |
| Native / Alaskan | 8 | 0.3% |
| White / Caucasian | 1,926 | 70.9% |
| Two or more Races | 48 | 1.8% |
| Some other Race | 15 | 0.5% |
| Total | 2,717 | 100.0% |
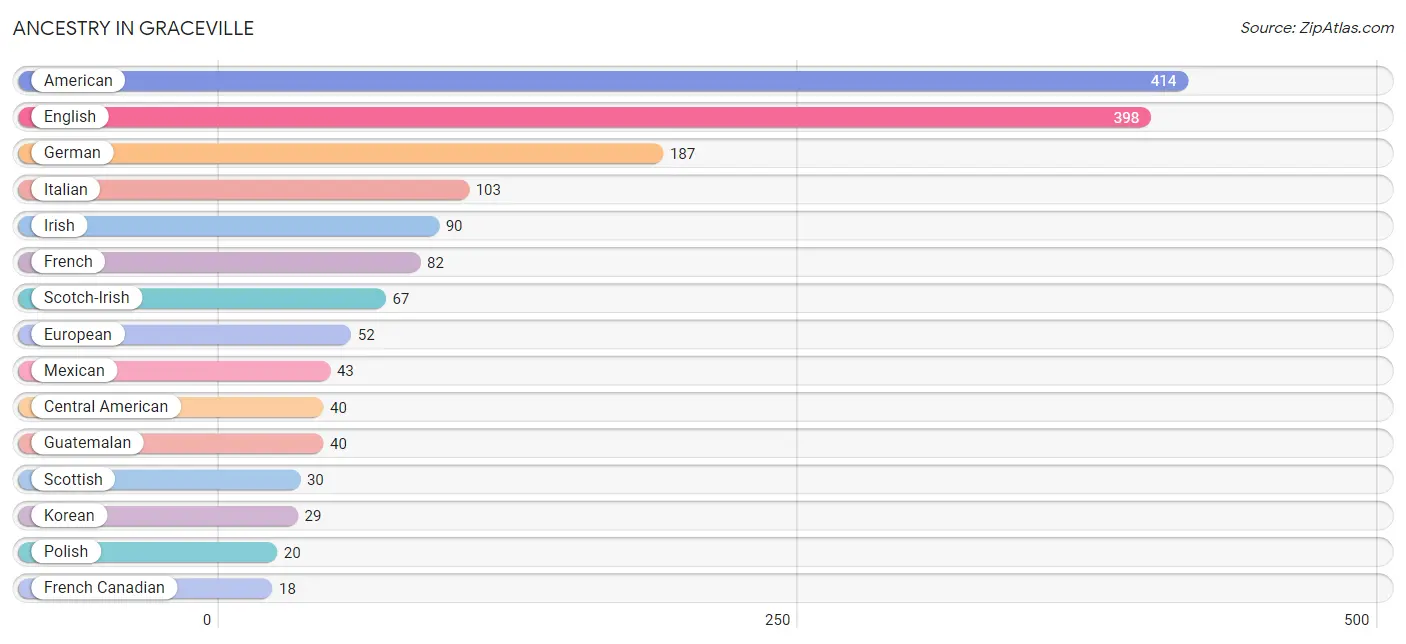
Ancestry in Graceville
The most populous ancestries reported in Graceville are American (414 | 15.2%), English (398 | 14.6%), German (187 | 6.9%), Italian (103 | 3.8%), and Irish (90 | 3.3%), together accounting for 43.9% of all Graceville residents.
| Ancestry | # Population | % Population |
| American | 414 | 15.2% |
| British West Indian | 9 | 0.3% |
| Canadian | 6 | 0.2% |
| Central American | 40 | 1.5% |
| Cherokee | 10 | 0.4% |
| Creek | 10 | 0.4% |
| Cuban | 9 | 0.3% |
| Dutch | 4 | 0.2% |
| English | 398 | 14.6% |
| European | 52 | 1.9% |
| French | 82 | 3.0% |
| French Canadian | 18 | 0.7% |
| German | 187 | 6.9% |
| Guatemalan | 40 | 1.5% |
| Hungarian | 10 | 0.4% |
| Irish | 90 | 3.3% |
| Italian | 103 | 3.8% |
| Korean | 29 | 1.1% |
| Mexican | 43 | 1.6% |
| Polish | 20 | 0.7% |
| Puerto Rican | 15 | 0.5% |
| Scotch-Irish | 67 | 2.5% |
| Scottish | 30 | 1.1% |
| Spanish | 10 | 0.4% |
| Swedish | 4 | 0.2% |
| Thai | 13 | 0.5% | View All 26 Rows |
Immigrants in Graceville
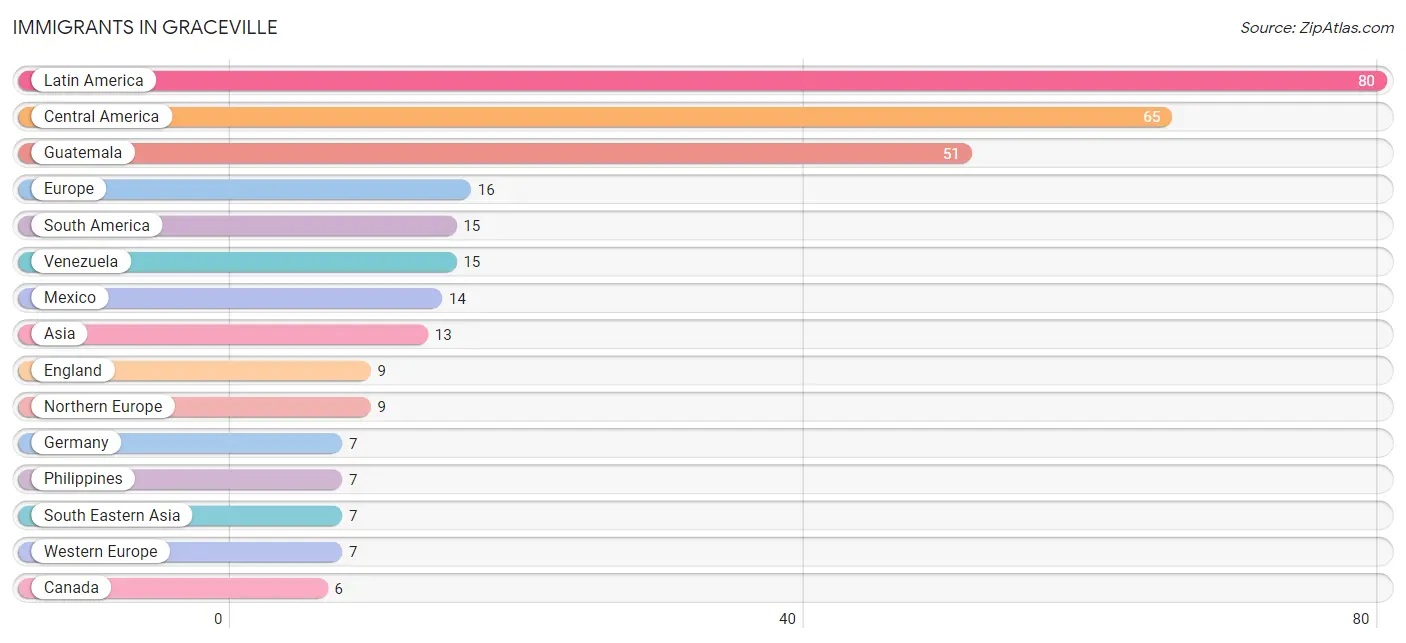
The most numerous immigrant groups reported in Graceville came from Latin America (80 | 2.9%), Central America (65 | 2.4%), Guatemala (51 | 1.9%), Europe (16 | 0.6%), and South America (15 | 0.5%), together accounting for 8.4% of all Graceville residents.
| Immigration Origin | # Population | % Population |
| Asia | 13 | 0.5% |
| Canada | 6 | 0.2% |
| Central America | 65 | 2.4% |
| England | 9 | 0.3% |
| Europe | 16 | 0.6% |
| Germany | 7 | 0.3% |
| Guatemala | 51 | 1.9% |
| India | 6 | 0.2% |
| Latin America | 80 | 2.9% |
| Mexico | 14 | 0.5% |
| Northern Europe | 9 | 0.3% |
| Philippines | 7 | 0.3% |
| South America | 15 | 0.5% |
| South Central Asia | 6 | 0.2% |
| South Eastern Asia | 7 | 0.3% |
| Venezuela | 15 | 0.5% |
| Western Europe | 7 | 0.3% | View All 17 Rows |
Sex and Age in Graceville
Sex and Age in Graceville
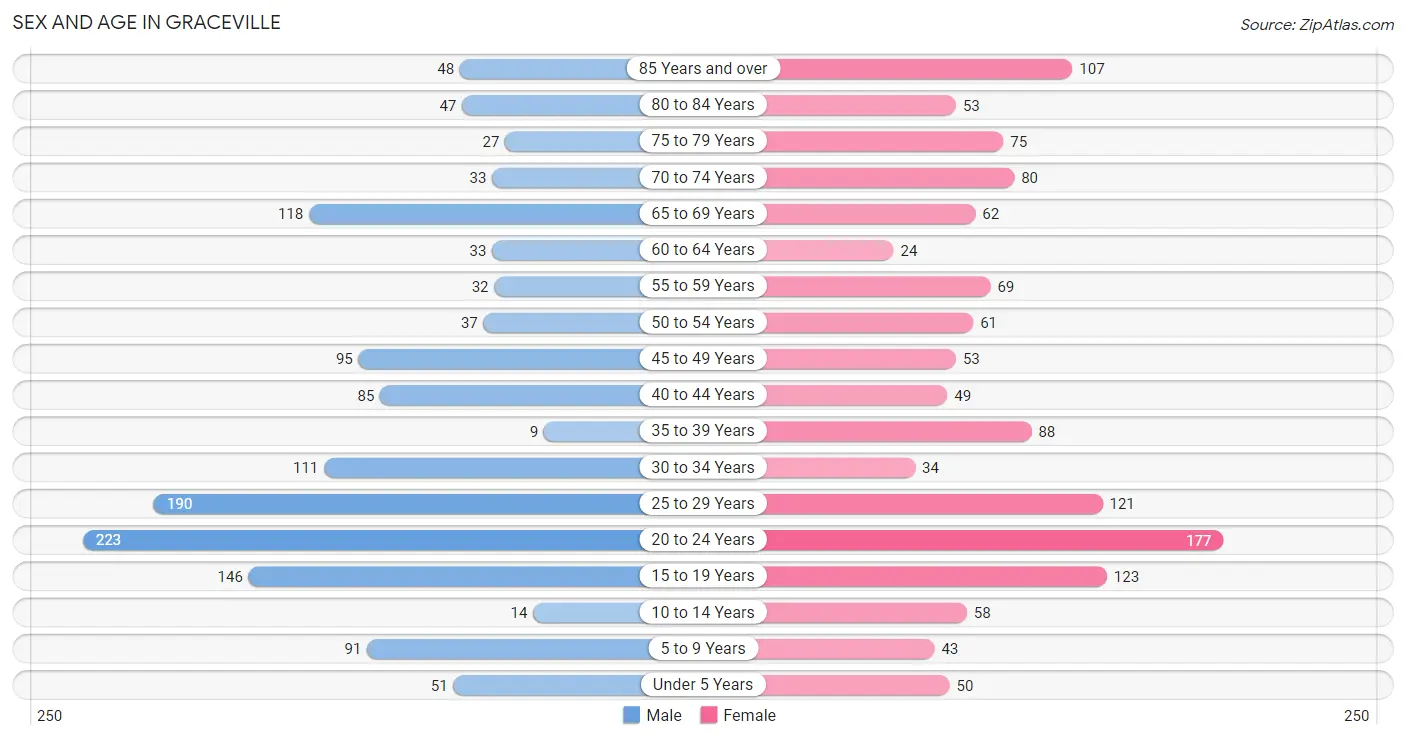
The most populous age groups in Graceville are 20 to 24 Years (223 | 16.0%) for men and 20 to 24 Years (177 | 13.3%) for women.
| Age Bracket | Male | Female |
| Under 5 Years | 51 (3.7%) | 50 (3.8%) |
| 5 to 9 Years | 91 (6.6%) | 43 (3.2%) |
| 10 to 14 Years | 14 (1.0%) | 58 (4.4%) |
| 15 to 19 Years | 146 (10.5%) | 123 (9.3%) |
| 20 to 24 Years | 223 (16.0%) | 177 (13.3%) |
| 25 to 29 Years | 190 (13.7%) | 121 (9.1%) |
| 30 to 34 Years | 111 (8.0%) | 34 (2.6%) |
| 35 to 39 Years | 9 (0.6%) | 88 (6.6%) |
| 40 to 44 Years | 85 (6.1%) | 49 (3.7%) |
| 45 to 49 Years | 95 (6.8%) | 53 (4.0%) |
| 50 to 54 Years | 37 (2.7%) | 61 (4.6%) |
| 55 to 59 Years | 32 (2.3%) | 69 (5.2%) |
| 60 to 64 Years | 33 (2.4%) | 24 (1.8%) |
| 65 to 69 Years | 118 (8.5%) | 62 (4.7%) |
| 70 to 74 Years | 33 (2.4%) | 80 (6.0%) |
| 75 to 79 Years | 27 (1.9%) | 75 (5.7%) |
| 80 to 84 Years | 47 (3.4%) | 53 (4.0%) |
| 85 Years and over | 48 (3.5%) | 107 (8.1%) |
| Total | 1,390 (100.0%) | 1,327 (100.0%) |
Families and Households in Graceville
Median Family Size in Graceville
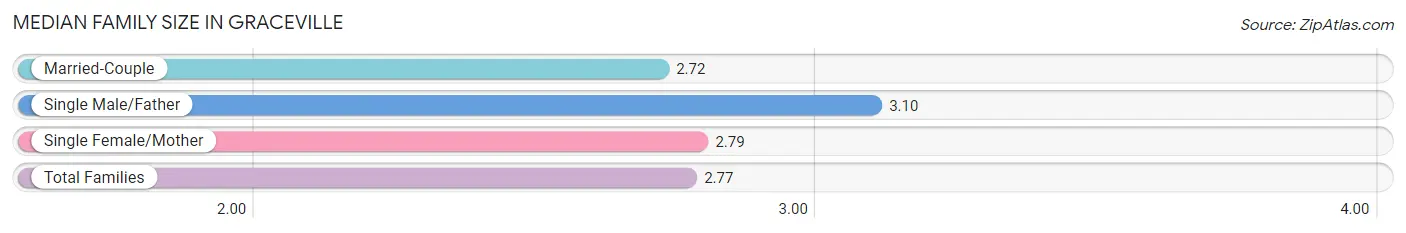
The median family size in Graceville is 2.77 persons per family, with single male/father families (39 | 7.2%) accounting for the largest median family size of 3.1 persons per family. On the other hand, married-couple families (305 | 56.5%) represent the smallest median family size with 2.72 persons per family.
| Family Type | # Families | Family Size |
| Married-Couple | 305 (56.5%) | 2.72 |
| Single Male/Father | 39 (7.2%) | 3.10 |
| Single Female/Mother | 196 (36.3%) | 2.79 |
| Total Families | 540 (100.0%) | 2.77 |
Median Household Size in Graceville
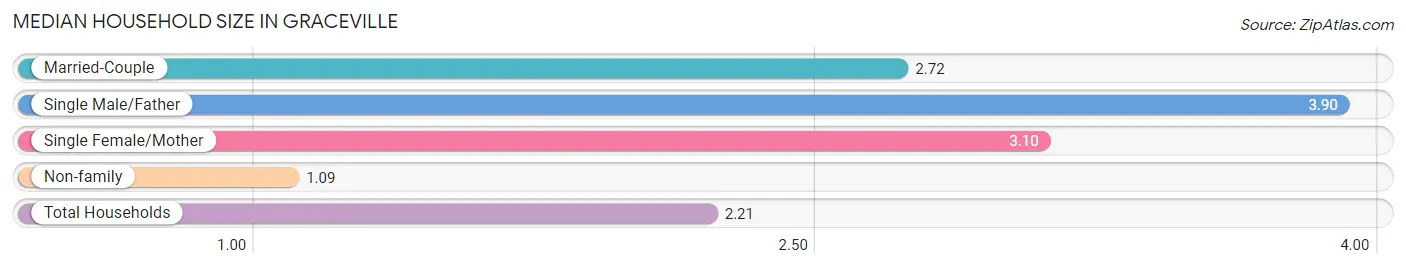
The median household size in Graceville is 2.21 persons per household, with single male/father households (39 | 4.4%) accounting for the largest median household size of 3.9 persons per household. non-family households (355 | 39.7%) represent the smallest median household size with 1.09 persons per household.
| Household Type | # Households | Household Size |
| Married-Couple | 305 (34.1%) | 2.72 |
| Single Male/Father | 39 (4.4%) | 3.90 |
| Single Female/Mother | 196 (21.9%) | 3.10 |
| Non-family | 355 (39.7%) | 1.09 |
| Total Households | 895 (100.0%) | 2.21 |
Household Size by Marriage Status in Graceville
Out of a total of 895 households in Graceville, 540 (60.3%) are family households, while 355 (39.7%) are nonfamily households. The most numerous type of family households are 2-person households, comprising 302, and the most common type of nonfamily households are 1-person households, comprising 284.
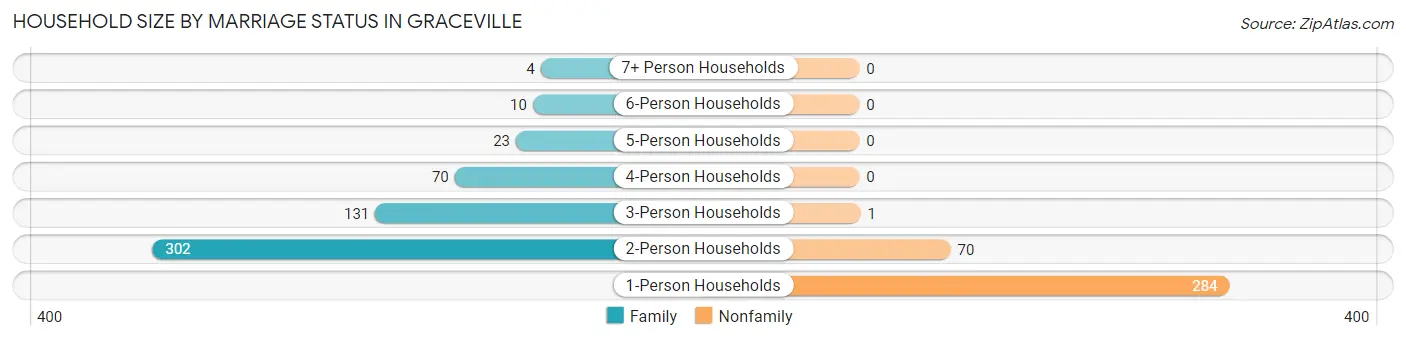
| Household Size | Family Households | Nonfamily Households |
| 1-Person Households | - | 284 (31.7%) |
| 2-Person Households | 302 (33.7%) | 70 (7.8%) |
| 3-Person Households | 131 (14.6%) | 1 (0.1%) |
| 4-Person Households | 70 (7.8%) | 0 (0.0%) |
| 5-Person Households | 23 (2.6%) | 0 (0.0%) |
| 6-Person Households | 10 (1.1%) | 0 (0.0%) |
| 7+ Person Households | 4 (0.4%) | 0 (0.0%) |
| Total | 540 (60.3%) | 355 (39.7%) |
Female Fertility in Graceville
Fertility by Age in Graceville
Average fertility rate in Graceville is 68.0 births per 1,000 women. Women in the age bracket of 35 to 50 years have the highest fertility rate with 226.0 births per 1,000 women. Women in the age bracket of 35 to 50 years acount for 100.0% of all women with births.
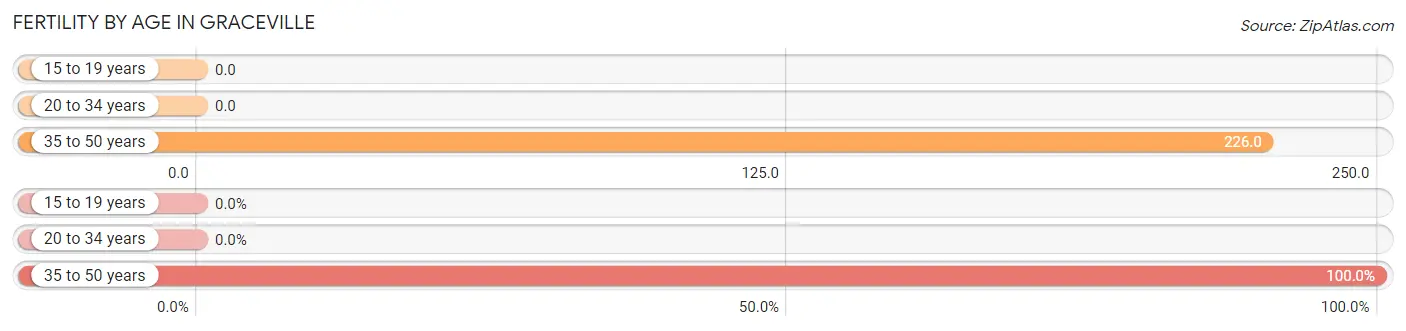
| Age Bracket | Women with Births | Births / 1,000 Women |
| 15 to 19 years | 0 (0.0%) | 0.0 |
| 20 to 34 years | 0 (0.0%) | 0.0 |
| 35 to 50 years | 44 (100.0%) | 226.0 |
| Total | 44 (100.0%) | 68.0 |
Fertility by Age by Marriage Status in Graceville
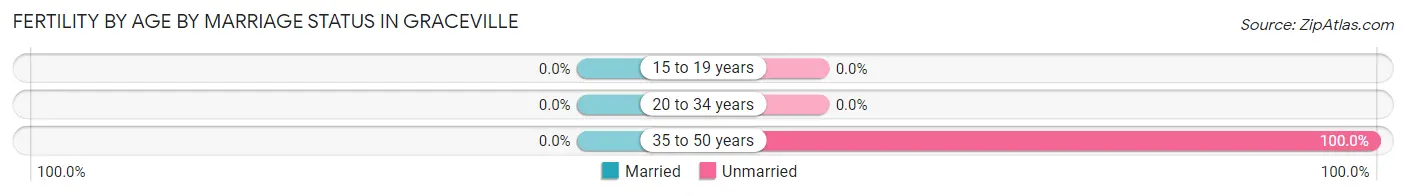
| Age Bracket | Married | Unmarried |
| 15 to 19 years | 0 (0.0%) | 0 (0.0%) |
| 20 to 34 years | 0 (0.0%) | 0 (0.0%) |
| 35 to 50 years | 0 (0.0%) | 44 (100.0%) |
| Total | 0 (0.0%) | 44 (100.0%) |
Fertility by Education in Graceville
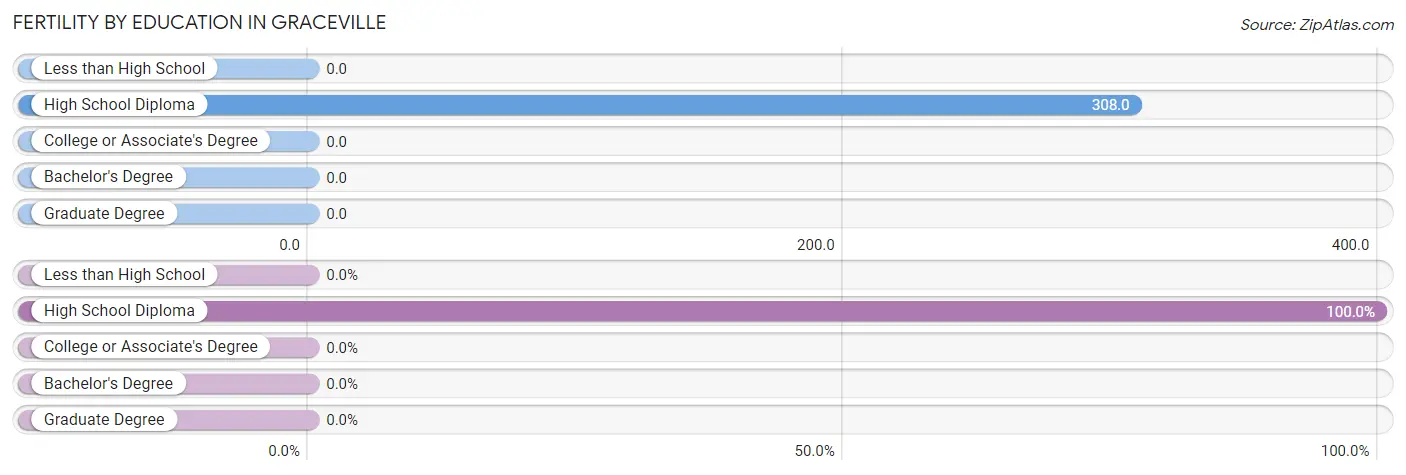
| Educational Attainment | Women with Births | Births / 1,000 Women |
| Less than High School | 0 (0.0%) | 0.0 |
| High School Diploma | 44 (100.0%) | 308.0 |
| College or Associate's Degree | 0 (0.0%) | 0.0 |
| Bachelor's Degree | 0 (0.0%) | 0.0 |
| Graduate Degree | 0 (0.0%) | 0.0 |
| Total | 44 (100.0%) | 68.0 |
Fertility by Education by Marriage Status in Graceville
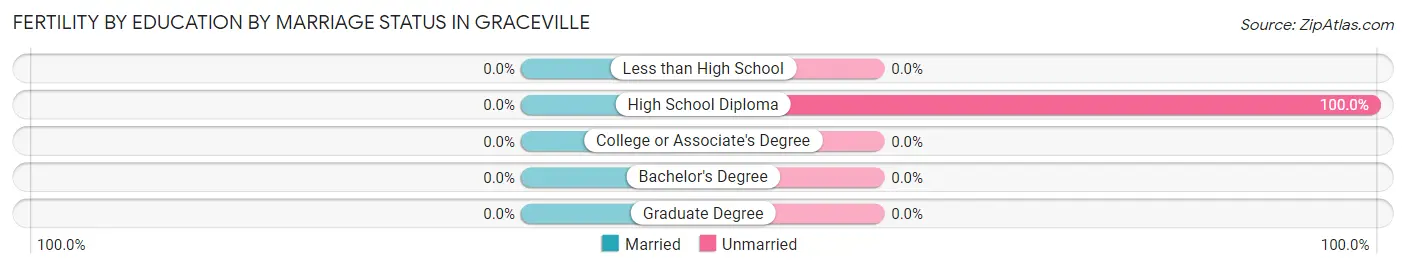
| Educational Attainment | Married | Unmarried |
| Less than High School | 0 (0.0%) | 0 (0.0%) |
| High School Diploma | 0 (0.0%) | 44 (100.0%) |
| College or Associate's Degree | 0 (0.0%) | 0 (0.0%) |
| Bachelor's Degree | 0 (0.0%) | 0 (0.0%) |
| Graduate Degree | 0 (0.0%) | 0 (0.0%) |
| Total | 0 (0.0%) | 44 (100.0%) |
Employment Characteristics in Graceville
Employment by Class of Employer in Graceville
Among the 1,197 employed individuals in Graceville, private company employees (715 | 59.7%), not-for-profit organizations (189 | 15.8%), and state government employees (179 | 14.9%) make up the most common classes of employment.
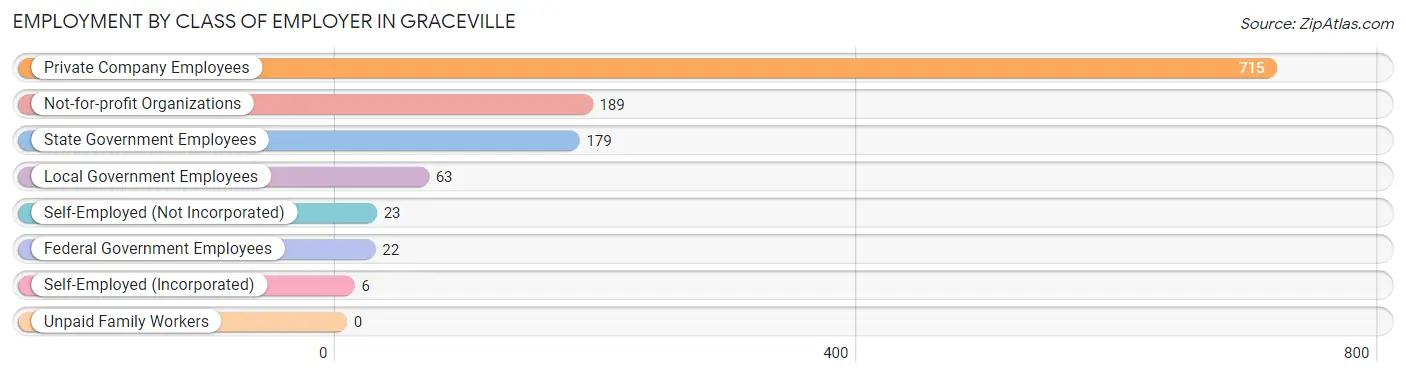
| Employer Class | # Employees | % Employees |
| Private Company Employees | 715 | 59.7% |
| Self-Employed (Incorporated) | 6 | 0.5% |
| Self-Employed (Not Incorporated) | 23 | 1.9% |
| Not-for-profit Organizations | 189 | 15.8% |
| Local Government Employees | 63 | 5.3% |
| State Government Employees | 179 | 14.9% |
| Federal Government Employees | 22 | 1.8% |
| Unpaid Family Workers | 0 | 0.0% |
| Total | 1,197 | 100.0% |
Employment Status by Age in Graceville
According to the labor force statistics for Graceville, out of the total population over 16 years of age (2,405), 53.7% or 1,291 individuals are in the labor force, with 4.9% or 63 of them unemployed. The age group with the highest labor force participation rate is 20 to 24 years, with 93.3% or 373 individuals in the labor force. Within the labor force, the 30 to 34 years age range has the highest percentage of unemployed individuals, with 27.8% or 35 of them being unemployed.
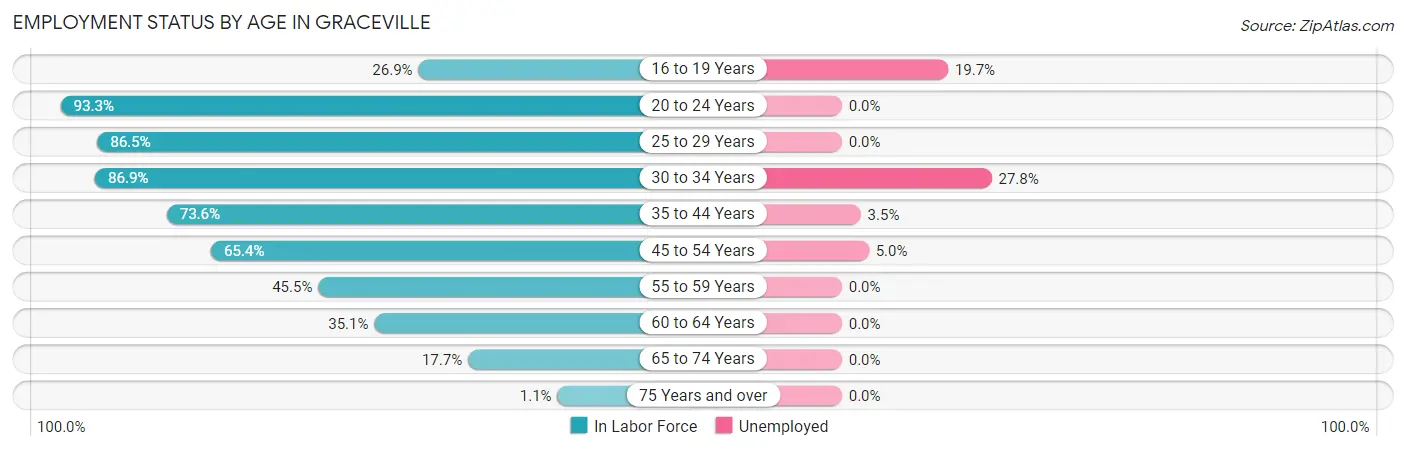
| Age Bracket | In Labor Force | Unemployed |
| 16 to 19 Years | 71 (26.9%) | 14 (19.7%) |
| 20 to 24 Years | 373 (93.3%) | 0 (0.0%) |
| 25 to 29 Years | 269 (86.5%) | 0 (0.0%) |
| 30 to 34 Years | 126 (86.9%) | 35 (27.8%) |
| 35 to 44 Years | 170 (73.6%) | 6 (3.5%) |
| 45 to 54 Years | 161 (65.4%) | 8 (5.0%) |
| 55 to 59 Years | 46 (45.5%) | 0 (0.0%) |
| 60 to 64 Years | 20 (35.1%) | 0 (0.0%) |
| 65 to 74 Years | 52 (17.7%) | 0 (0.0%) |
| 75 Years and over | 4 (1.1%) | 0 (0.0%) |
| Total | 1,291 (53.7%) | 63 (4.9%) |
Employment Status by Educational Attainment in Graceville
According to labor force statistics for Graceville, 72.6% of individuals (792) out of the total population between 25 and 64 years of age (1,091) are in the labor force, with 6.2% or 49 of them being unemployed. The group with the highest labor force participation rate are those with the educational attainment of bachelor's degree or higher, with 80.9% or 144 individuals in the labor force. Within the labor force, individuals with less than high school education have the highest percentage of unemployment, with 16.0% or 17 of them being unemployed.
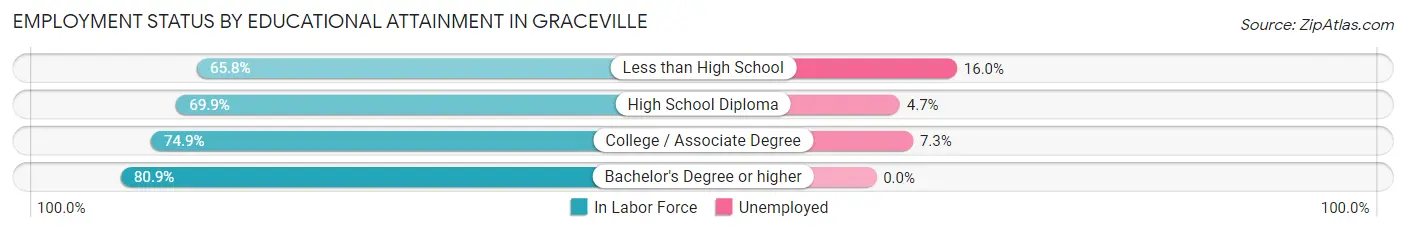
| Educational Attainment | In Labor Force | Unemployed |
| Less than High School | 106 (65.8%) | 26 (16.0%) |
| High School Diploma | 297 (69.9%) | 20 (4.7%) |
| College / Associate Degree | 245 (74.9%) | 24 (7.3%) |
| Bachelor's Degree or higher | 144 (80.9%) | 0 (0.0%) |
| Total | 792 (72.6%) | 68 (6.2%) |
Employment Occupations by Sex in Graceville
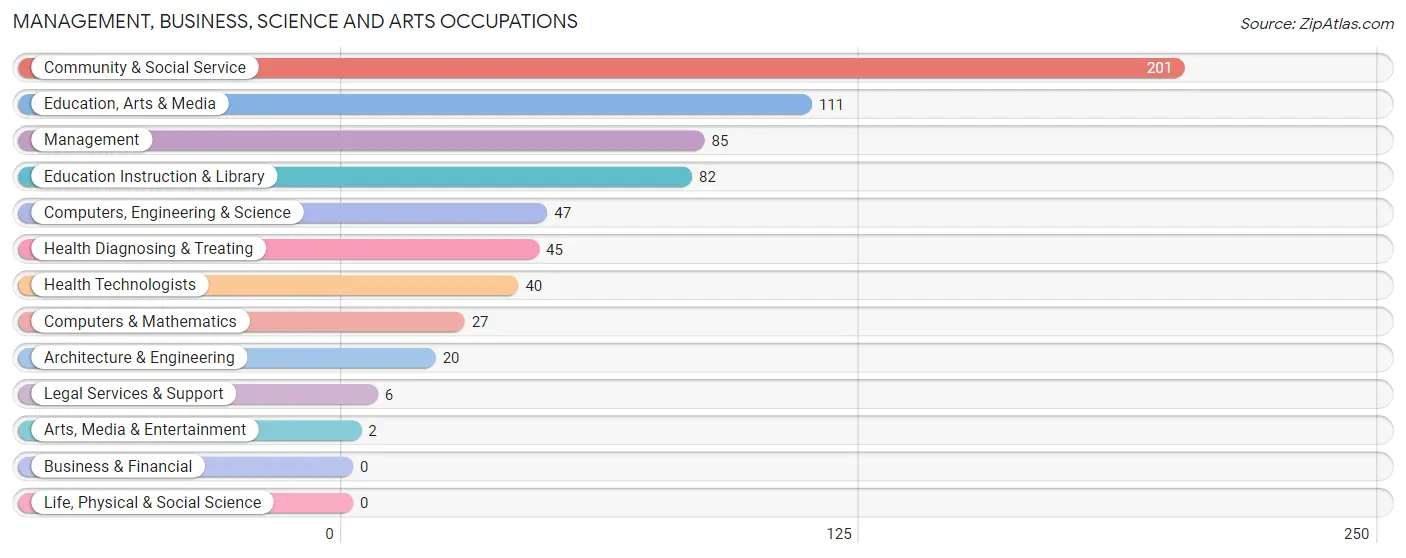
Management, Business, Science and Arts Occupations
The most common Management, Business, Science and Arts occupations in Graceville are Community & Social Service (201 | 16.4%), Education, Arts & Media (111 | 9.0%), Management (85 | 6.9%), Education Instruction & Library (82 | 6.7%), and Computers, Engineering & Science (47 | 3.8%).
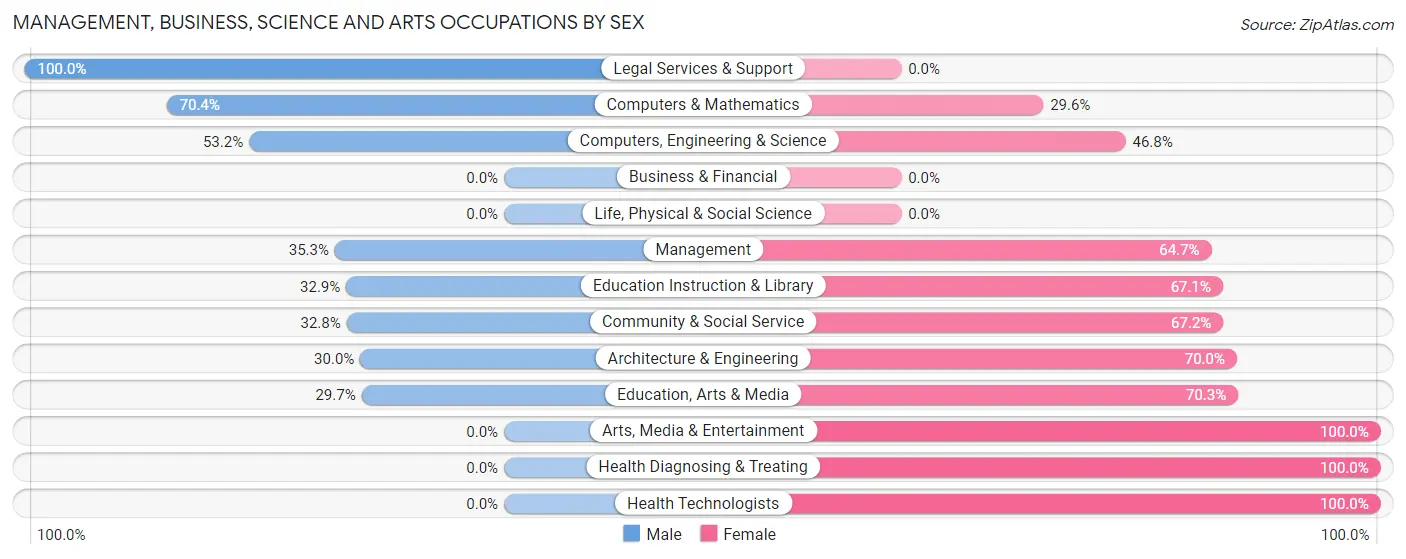
Management, Business, Science and Arts Occupations by Sex
Within the Management, Business, Science and Arts occupations in Graceville, the most male-oriented occupations are Legal Services & Support (100.0%), Computers & Mathematics (70.4%), and Computers, Engineering & Science (53.2%), while the most female-oriented occupations are Arts, Media & Entertainment (100.0%), Health Diagnosing & Treating (100.0%), and Health Technologists (100.0%).
| Occupation | Male | Female |
| Management | 30 (35.3%) | 55 (64.7%) |
| Business & Financial | 0 (0.0%) | 0 (0.0%) |
| Computers, Engineering & Science | 25 (53.2%) | 22 (46.8%) |
| Computers & Mathematics | 19 (70.4%) | 8 (29.6%) |
| Architecture & Engineering | 6 (30.0%) | 14 (70.0%) |
| Life, Physical & Social Science | 0 (0.0%) | 0 (0.0%) |
| Community & Social Service | 66 (32.8%) | 135 (67.2%) |
| Education, Arts & Media | 33 (29.7%) | 78 (70.3%) |
| Legal Services & Support | 6 (100.0%) | 0 (0.0%) |
| Education Instruction & Library | 27 (32.9%) | 55 (67.1%) |
| Arts, Media & Entertainment | 0 (0.0%) | 2 (100.0%) |
| Health Diagnosing & Treating | 0 (0.0%) | 45 (100.0%) |
| Health Technologists | 0 (0.0%) | 40 (100.0%) |
| Total (Category) | 121 (32.0%) | 257 (68.0%) |
| Total (Overall) | 685 (55.7%) | 544 (44.3%) |
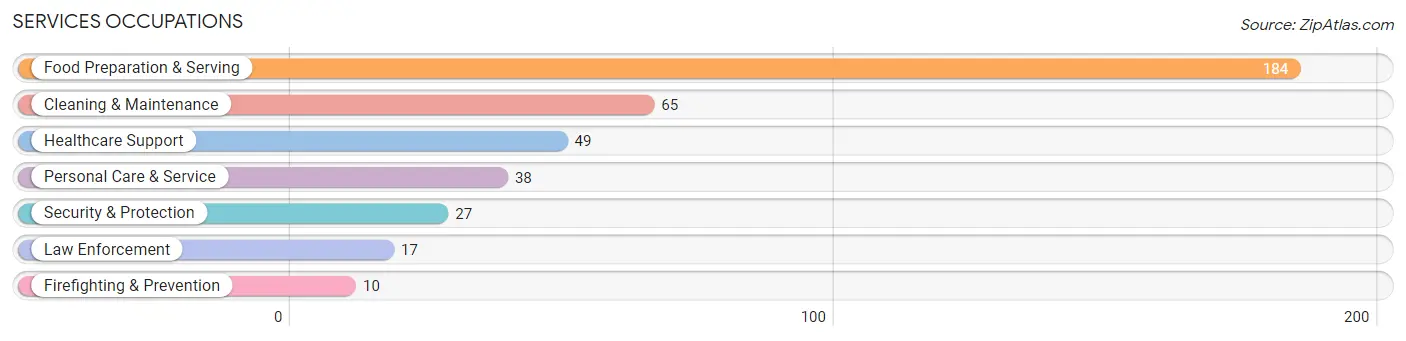
Services Occupations
The most common Services occupations in Graceville are Food Preparation & Serving (184 | 15.0%), Cleaning & Maintenance (65 | 5.3%), Healthcare Support (49 | 4.0%), Personal Care & Service (38 | 3.1%), and Security & Protection (27 | 2.2%).
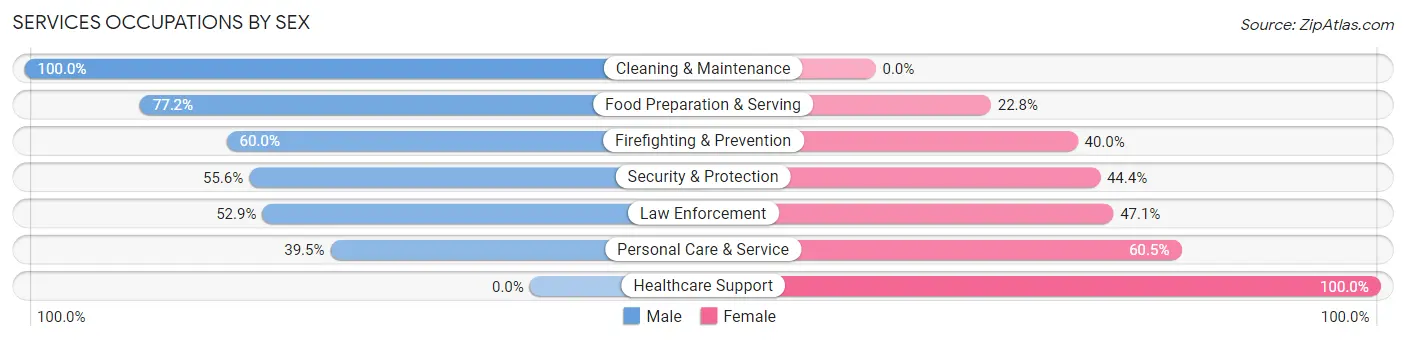
Services Occupations by Sex
Within the Services occupations in Graceville, the most male-oriented occupations are Cleaning & Maintenance (100.0%), Food Preparation & Serving (77.2%), and Firefighting & Prevention (60.0%), while the most female-oriented occupations are Healthcare Support (100.0%), Personal Care & Service (60.5%), and Law Enforcement (47.1%).
| Occupation | Male | Female |
| Healthcare Support | 0 (0.0%) | 49 (100.0%) |
| Security & Protection | 15 (55.6%) | 12 (44.4%) |
| Firefighting & Prevention | 6 (60.0%) | 4 (40.0%) |
| Law Enforcement | 9 (52.9%) | 8 (47.1%) |
| Food Preparation & Serving | 142 (77.2%) | 42 (22.8%) |
| Cleaning & Maintenance | 65 (100.0%) | 0 (0.0%) |
| Personal Care & Service | 15 (39.5%) | 23 (60.5%) |
| Total (Category) | 237 (65.3%) | 126 (34.7%) |
| Total (Overall) | 685 (55.7%) | 544 (44.3%) |
Sales and Office Occupations
The most common Sales and Office occupations in Graceville are Office & Administration (133 | 10.8%), and Sales & Related (40 | 3.3%).

Sales and Office Occupations by Sex
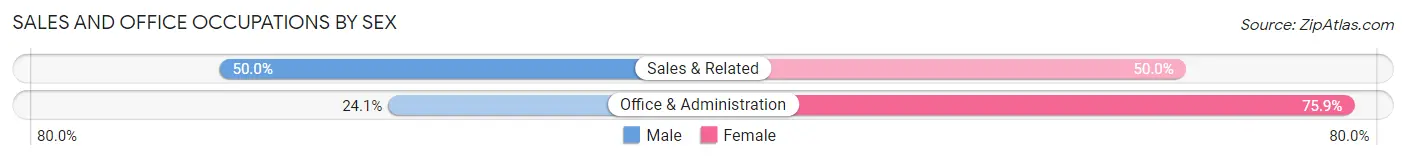
| Occupation | Male | Female |
| Sales & Related | 20 (50.0%) | 20 (50.0%) |
| Office & Administration | 32 (24.1%) | 101 (75.9%) |
| Total (Category) | 52 (30.1%) | 121 (69.9%) |
| Total (Overall) | 685 (55.7%) | 544 (44.3%) |
Natural Resources, Construction and Maintenance Occupations
The most common Natural Resources, Construction and Maintenance occupations in Graceville are Construction & Extraction (122 | 9.9%), and Installation, Maintenance & Repair (22 | 1.8%).

Natural Resources, Construction and Maintenance Occupations by Sex

| Occupation | Male | Female |
| Farming, Fishing & Forestry | 0 (0.0%) | 0 (0.0%) |
| Construction & Extraction | 91 (74.6%) | 31 (25.4%) |
| Installation, Maintenance & Repair | 22 (100.0%) | 0 (0.0%) |
| Total (Category) | 113 (78.5%) | 31 (21.5%) |
| Total (Overall) | 685 (55.7%) | 544 (44.3%) |
Production, Transportation and Moving Occupations
The most common Production, Transportation and Moving occupations in Graceville are Production (86 | 7.0%), Transportation (65 | 5.3%), and Material Moving (20 | 1.6%).
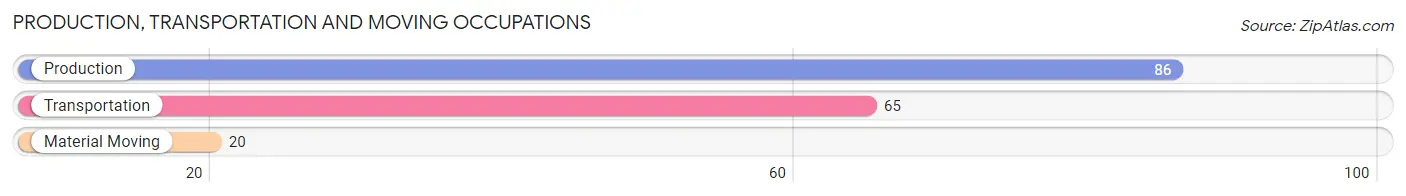
Production, Transportation and Moving Occupations by Sex

| Occupation | Male | Female |
| Production | 86 (100.0%) | 0 (0.0%) |
| Transportation | 65 (100.0%) | 0 (0.0%) |
| Material Moving | 11 (55.0%) | 9 (45.0%) |
| Total (Category) | 162 (94.7%) | 9 (5.3%) |
| Total (Overall) | 685 (55.7%) | 544 (44.3%) |
Employment Industries by Sex in Graceville
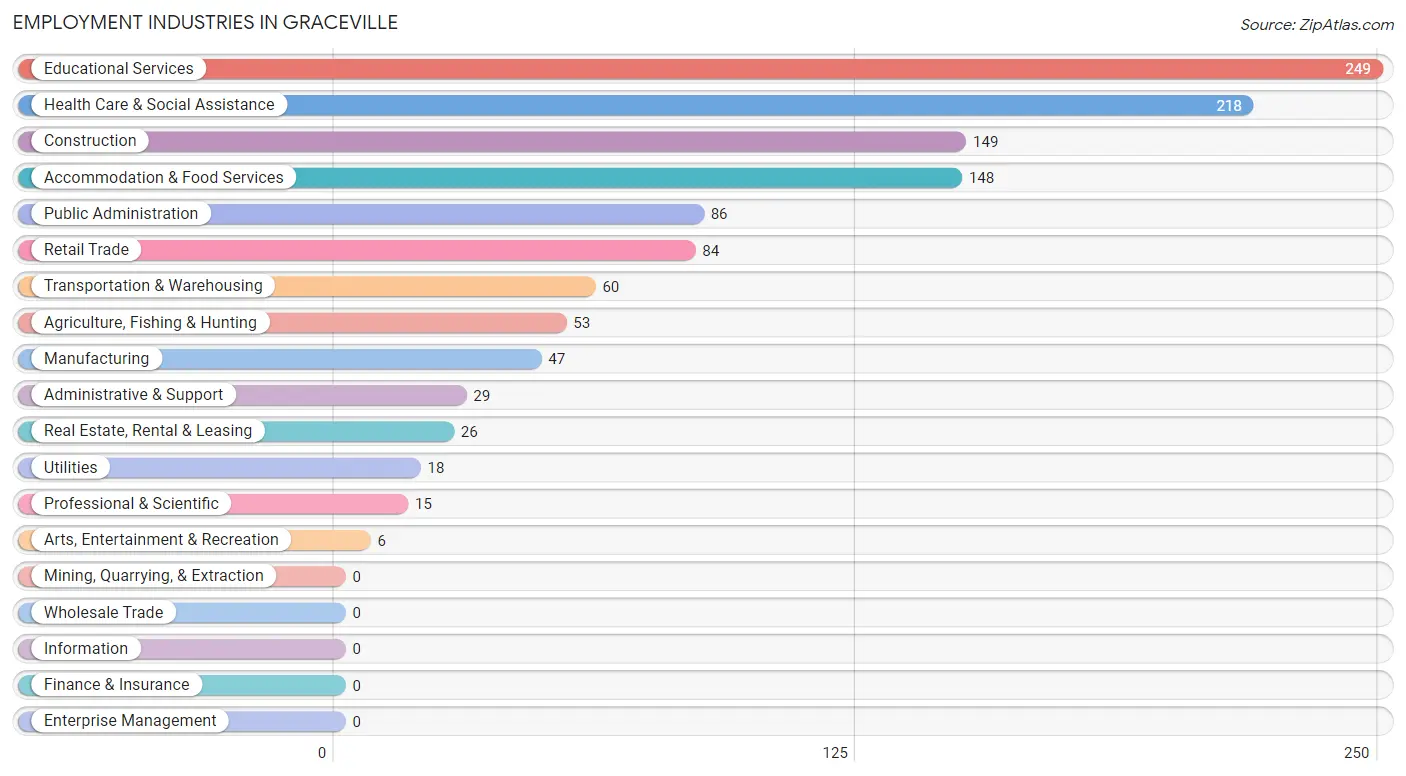
Employment Industries in Graceville
The major employment industries in Graceville include Educational Services (249 | 20.3%), Health Care & Social Assistance (218 | 17.7%), Construction (149 | 12.1%), Accommodation & Food Services (148 | 12.0%), and Public Administration (86 | 7.0%).
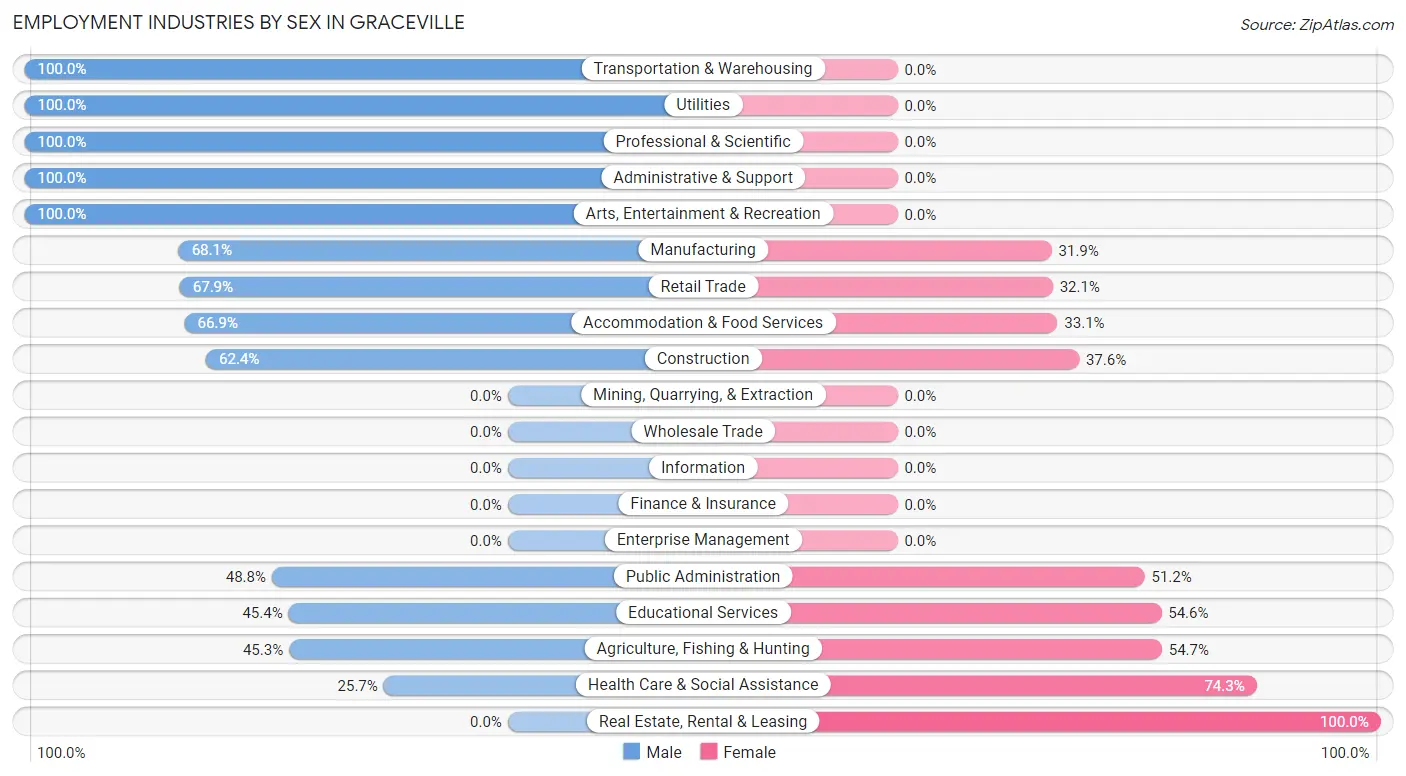
Employment Industries by Sex in Graceville
The Graceville industries that see more men than women are Transportation & Warehousing (100.0%), Utilities (100.0%), and Professional & Scientific (100.0%), whereas the industries that tend to have a higher number of women are Real Estate, Rental & Leasing (100.0%), Health Care & Social Assistance (74.3%), and Agriculture, Fishing & Hunting (54.7%).
| Industry | Male | Female |
| Agriculture, Fishing & Hunting | 24 (45.3%) | 29 (54.7%) |
| Mining, Quarrying, & Extraction | 0 (0.0%) | 0 (0.0%) |
| Construction | 93 (62.4%) | 56 (37.6%) |
| Manufacturing | 32 (68.1%) | 15 (31.9%) |
| Wholesale Trade | 0 (0.0%) | 0 (0.0%) |
| Retail Trade | 57 (67.9%) | 27 (32.1%) |
| Transportation & Warehousing | 60 (100.0%) | 0 (0.0%) |
| Utilities | 18 (100.0%) | 0 (0.0%) |
| Information | 0 (0.0%) | 0 (0.0%) |
| Finance & Insurance | 0 (0.0%) | 0 (0.0%) |
| Real Estate, Rental & Leasing | 0 (0.0%) | 26 (100.0%) |
| Professional & Scientific | 15 (100.0%) | 0 (0.0%) |
| Enterprise Management | 0 (0.0%) | 0 (0.0%) |
| Administrative & Support | 29 (100.0%) | 0 (0.0%) |
| Educational Services | 113 (45.4%) | 136 (54.6%) |
| Health Care & Social Assistance | 56 (25.7%) | 162 (74.3%) |
| Arts, Entertainment & Recreation | 6 (100.0%) | 0 (0.0%) |
| Accommodation & Food Services | 99 (66.9%) | 49 (33.1%) |
| Public Administration | 42 (48.8%) | 44 (51.2%) |
| Total | 685 (55.7%) | 544 (44.3%) |
Education in Graceville
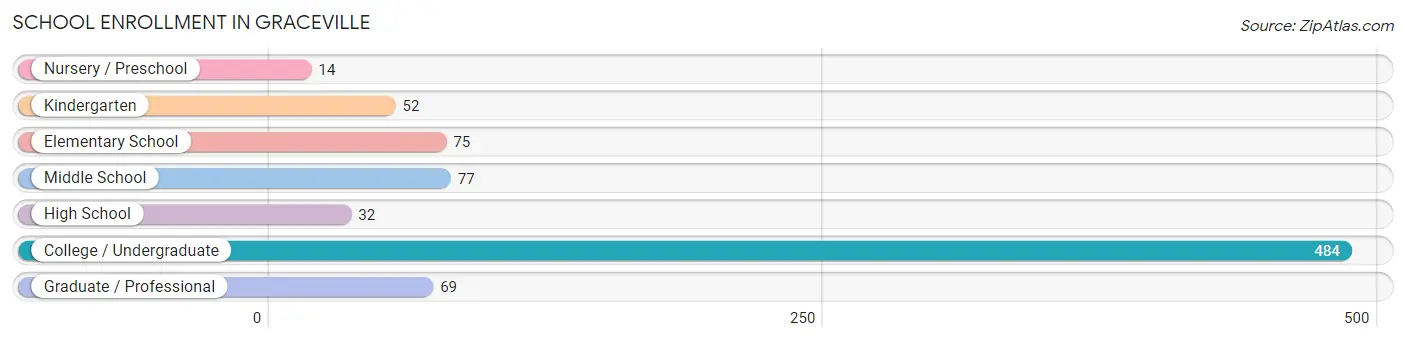
School Enrollment in Graceville
The most common levels of schooling among the 803 students in Graceville are college / undergraduate (484 | 60.3%), middle school (77 | 9.6%), and elementary school (75 | 9.3%).
| School Level | # Students | % Students |
| Nursery / Preschool | 14 | 1.7% |
| Kindergarten | 52 | 6.5% |
| Elementary School | 75 | 9.3% |
| Middle School | 77 | 9.6% |
| High School | 32 | 4.0% |
| College / Undergraduate | 484 | 60.3% |
| Graduate / Professional | 69 | 8.6% |
| Total | 803 | 100.0% |
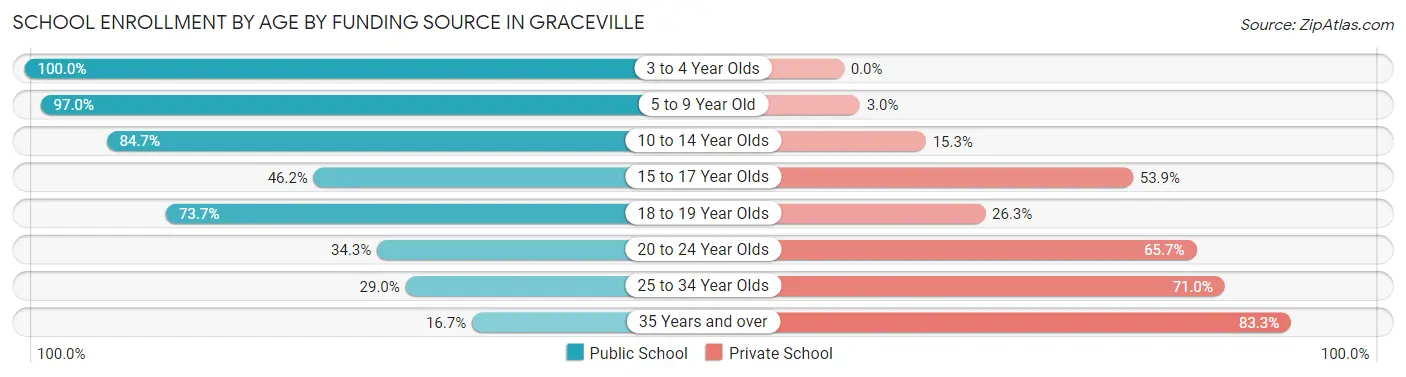
School Enrollment by Age by Funding Source in Graceville
Out of a total of 803 students who are enrolled in schools in Graceville, 329 (41.0%) attend a private institution, while the remaining 474 (59.0%) are enrolled in public schools. The age group of 35 years and over has the highest likelihood of being enrolled in private schools, with 20 (83.3% in the age bracket) enrolled. Conversely, the age group of 3 to 4 year olds has the lowest likelihood of being enrolled in a private school, with 7 (100.0% in the age bracket) attending a public institution.
| Age Bracket | Public School | Private School |
| 3 to 4 Year Olds | 7 (100.0%) | 0 (0.0%) |
| 5 to 9 Year Old | 130 (97.0%) | 4 (3.0%) |
| 10 to 14 Year Olds | 61 (84.7%) | 11 (15.3%) |
| 15 to 17 Year Olds | 24 (46.2%) | 28 (53.8%) |
| 18 to 19 Year Olds | 137 (73.7%) | 49 (26.3%) |
| 20 to 24 Year Olds | 102 (34.3%) | 195 (65.7%) |
| 25 to 34 Year Olds | 9 (29.0%) | 22 (71.0%) |
| 35 Years and over | 4 (16.7%) | 20 (83.3%) |
| Total | 474 (59.0%) | 329 (41.0%) |
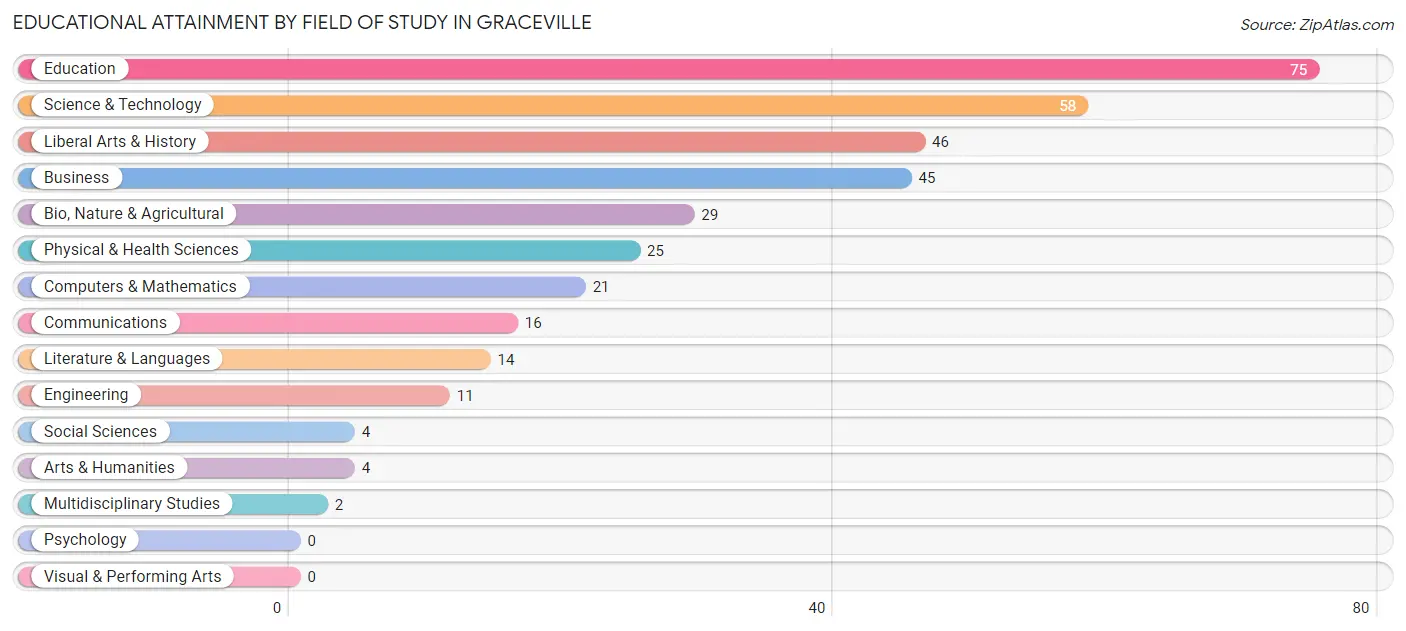
Educational Attainment by Field of Study in Graceville
Education (75 | 21.4%), science & technology (58 | 16.6%), liberal arts & history (46 | 13.1%), business (45 | 12.9%), and bio, nature & agricultural (29 | 8.3%) are the most common fields of study among 350 individuals in Graceville who have obtained a bachelor's degree or higher.
| Field of Study | # Graduates | % Graduates |
| Computers & Mathematics | 21 | 6.0% |
| Bio, Nature & Agricultural | 29 | 8.3% |
| Physical & Health Sciences | 25 | 7.1% |
| Psychology | 0 | 0.0% |
| Social Sciences | 4 | 1.1% |
| Engineering | 11 | 3.1% |
| Multidisciplinary Studies | 2 | 0.6% |
| Science & Technology | 58 | 16.6% |
| Business | 45 | 12.9% |
| Education | 75 | 21.4% |
| Literature & Languages | 14 | 4.0% |
| Liberal Arts & History | 46 | 13.1% |
| Visual & Performing Arts | 0 | 0.0% |
| Communications | 16 | 4.6% |
| Arts & Humanities | 4 | 1.1% |
| Total | 350 | 100.0% |
Transportation & Commute in Graceville
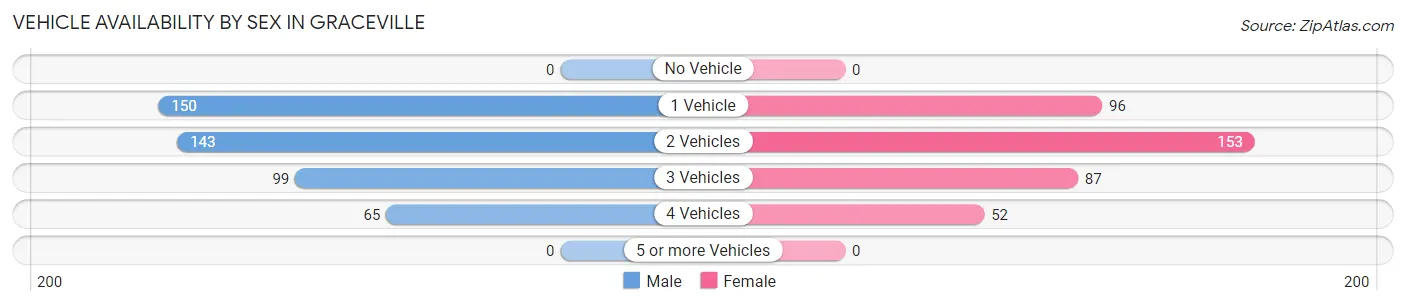
Vehicle Availability by Sex in Graceville
The most prevalent vehicle ownership categories in Graceville are males with 1 vehicle (150, accounting for 32.8%) and females with 1 vehicle (96, making up 38.7%).
| Vehicles Available | Male | Female |
| No Vehicle | 0 (0.0%) | 0 (0.0%) |
| 1 Vehicle | 150 (32.8%) | 96 (24.7%) |
| 2 Vehicles | 143 (31.3%) | 153 (39.4%) |
| 3 Vehicles | 99 (21.7%) | 87 (22.4%) |
| 4 Vehicles | 65 (14.2%) | 52 (13.4%) |
| 5 or more Vehicles | 0 (0.0%) | 0 (0.0%) |
| Total | 457 (100.0%) | 388 (100.0%) |
Commute Time in Graceville
The most frequently occuring commute durations in Graceville are 30 to 34 minutes (262 commuters, 24.2%), 15 to 19 minutes (146 commuters, 13.5%), and 5 to 9 minutes (111 commuters, 10.3%).
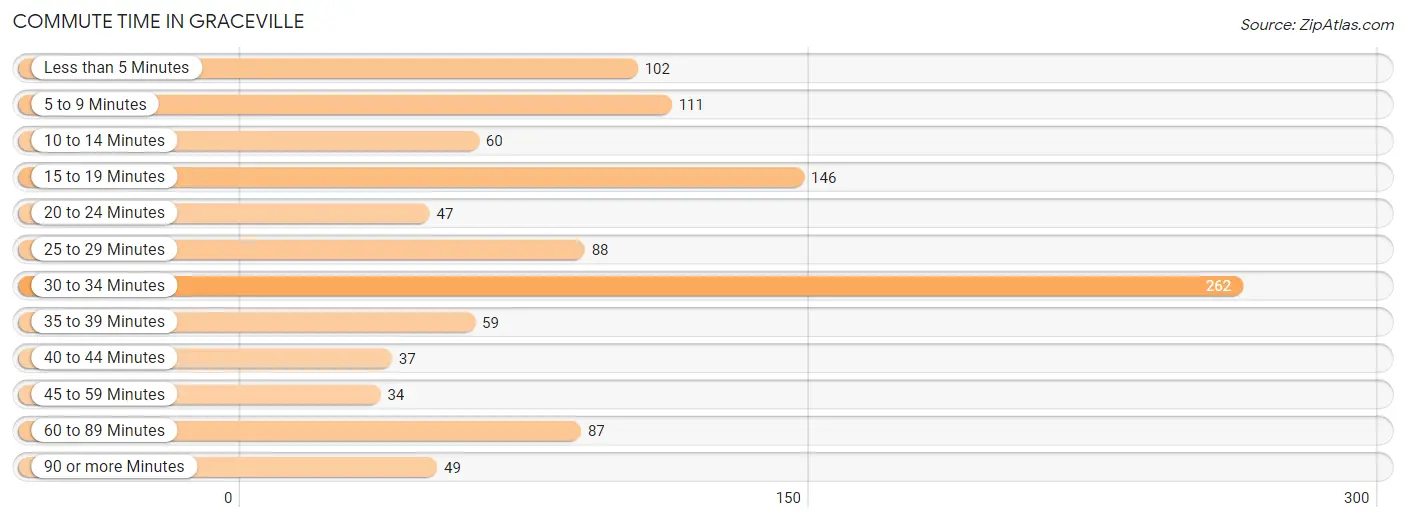
| Commute Time | # Commuters | % Commuters |
| Less than 5 Minutes | 102 | 9.4% |
| 5 to 9 Minutes | 111 | 10.3% |
| 10 to 14 Minutes | 60 | 5.6% |
| 15 to 19 Minutes | 146 | 13.5% |
| 20 to 24 Minutes | 47 | 4.3% |
| 25 to 29 Minutes | 88 | 8.1% |
| 30 to 34 Minutes | 262 | 24.2% |
| 35 to 39 Minutes | 59 | 5.4% |
| 40 to 44 Minutes | 37 | 3.4% |
| 45 to 59 Minutes | 34 | 3.1% |
| 60 to 89 Minutes | 87 | 8.0% |
| 90 or more Minutes | 49 | 4.5% |
Commute Time by Sex in Graceville
The most common commute times in Graceville are 30 to 34 minutes (205 commuters, 34.7%) for males and 25 to 29 minutes (86 commuters, 17.5%) for females.
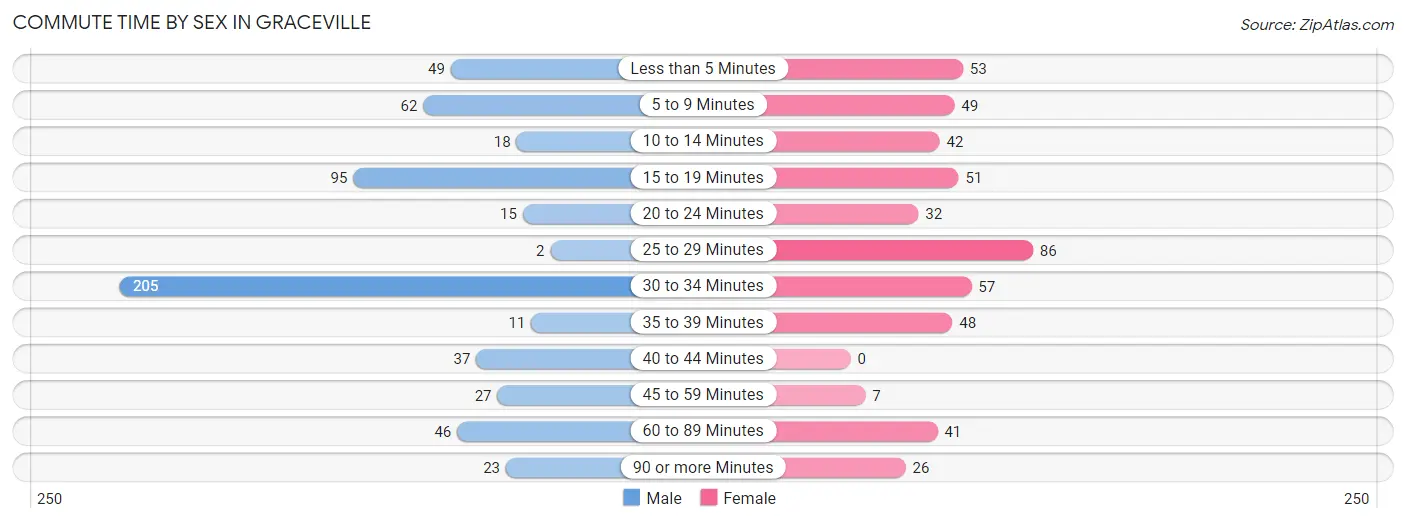
| Commute Time | Male | Female |
| Less than 5 Minutes | 49 (8.3%) | 53 (10.8%) |
| 5 to 9 Minutes | 62 (10.5%) | 49 (10.0%) |
| 10 to 14 Minutes | 18 (3.0%) | 42 (8.5%) |
| 15 to 19 Minutes | 95 (16.1%) | 51 (10.4%) |
| 20 to 24 Minutes | 15 (2.5%) | 32 (6.5%) |
| 25 to 29 Minutes | 2 (0.3%) | 86 (17.5%) |
| 30 to 34 Minutes | 205 (34.7%) | 57 (11.6%) |
| 35 to 39 Minutes | 11 (1.9%) | 48 (9.8%) |
| 40 to 44 Minutes | 37 (6.3%) | 0 (0.0%) |
| 45 to 59 Minutes | 27 (4.6%) | 7 (1.4%) |
| 60 to 89 Minutes | 46 (7.8%) | 41 (8.3%) |
| 90 or more Minutes | 23 (3.9%) | 26 (5.3%) |
Time of Departure to Work by Sex in Graceville
The most frequent times of departure to work in Graceville are 5:30 AM to 5:59 AM (104, 17.6%) for males and 7:00 AM to 7:29 AM (104, 21.1%) for females.
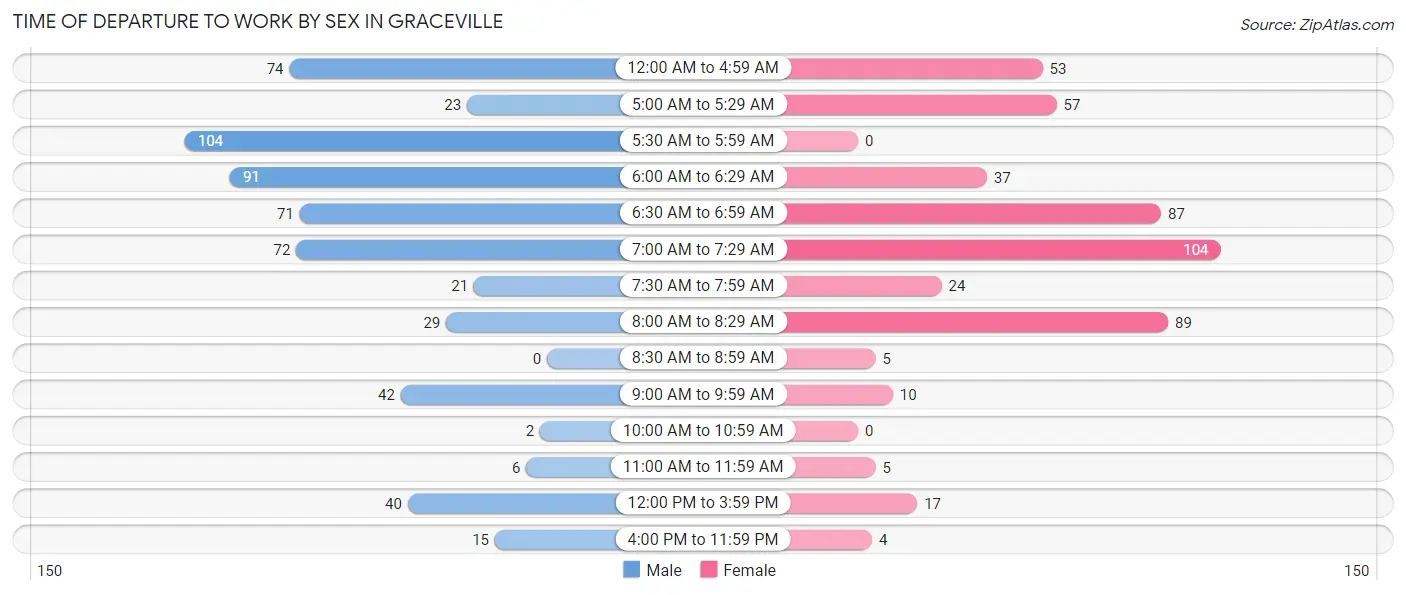
| Time of Departure | Male | Female |
| 12:00 AM to 4:59 AM | 74 (12.5%) | 53 (10.8%) |
| 5:00 AM to 5:29 AM | 23 (3.9%) | 57 (11.6%) |
| 5:30 AM to 5:59 AM | 104 (17.6%) | 0 (0.0%) |
| 6:00 AM to 6:29 AM | 91 (15.4%) | 37 (7.5%) |
| 6:30 AM to 6:59 AM | 71 (12.0%) | 87 (17.7%) |
| 7:00 AM to 7:29 AM | 72 (12.2%) | 104 (21.1%) |
| 7:30 AM to 7:59 AM | 21 (3.6%) | 24 (4.9%) |
| 8:00 AM to 8:29 AM | 29 (4.9%) | 89 (18.1%) |
| 8:30 AM to 8:59 AM | 0 (0.0%) | 5 (1.0%) |
| 9:00 AM to 9:59 AM | 42 (7.1%) | 10 (2.0%) |
| 10:00 AM to 10:59 AM | 2 (0.3%) | 0 (0.0%) |
| 11:00 AM to 11:59 AM | 6 (1.0%) | 5 (1.0%) |
| 12:00 PM to 3:59 PM | 40 (6.8%) | 17 (3.5%) |
| 4:00 PM to 11:59 PM | 15 (2.5%) | 4 (0.8%) |
| Total | 590 (100.0%) | 492 (100.0%) |
Housing Occupancy in Graceville
Occupancy by Ownership in Graceville
Of the total 895 dwellings in Graceville, owner-occupied units account for 421 (47.0%), while renter-occupied units make up 474 (53.0%).
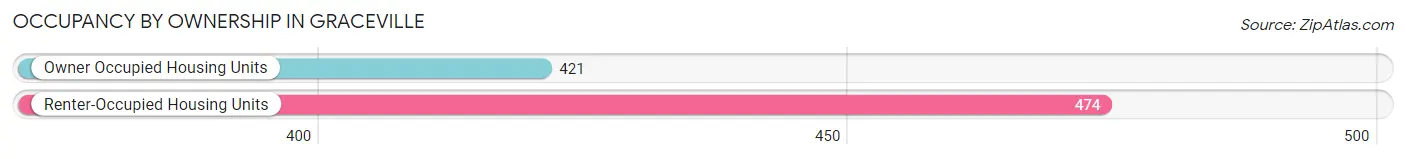
| Occupancy | # Housing Units | % Housing Units |
| Owner Occupied Housing Units | 421 | 47.0% |
| Renter-Occupied Housing Units | 474 | 53.0% |
| Total Occupied Housing Units | 895 | 100.0% |
Occupancy by Household Size in Graceville
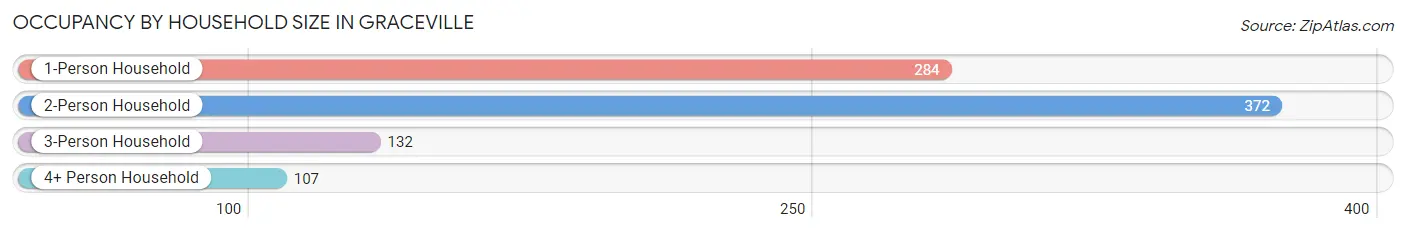
| Household Size | # Housing Units | % Housing Units |
| 1-Person Household | 284 | 31.7% |
| 2-Person Household | 372 | 41.6% |
| 3-Person Household | 132 | 14.7% |
| 4+ Person Household | 107 | 12.0% |
| Total Housing Units | 895 | 100.0% |
Occupancy by Ownership by Household Size in Graceville

| Household Size | Owner-occupied | Renter-occupied |
| 1-Person Household | 162 (57.0%) | 122 (43.0%) |
| 2-Person Household | 154 (41.4%) | 218 (58.6%) |
| 3-Person Household | 70 (53.0%) | 62 (47.0%) |
| 4+ Person Household | 35 (32.7%) | 72 (67.3%) |
| Total Housing Units | 421 (47.0%) | 474 (53.0%) |
Occupancy by Educational Attainment in Graceville
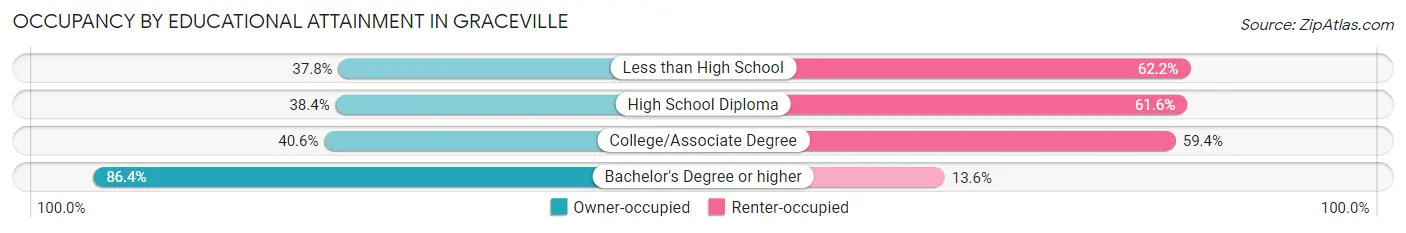
| Household Size | Owner-occupied | Renter-occupied |
| Less than High School | 34 (37.8%) | 56 (62.2%) |
| High School Diploma | 122 (38.4%) | 196 (61.6%) |
| College/Associate Degree | 138 (40.6%) | 202 (59.4%) |
| Bachelor's Degree or higher | 127 (86.4%) | 20 (13.6%) |
Occupancy by Age of Householder in Graceville
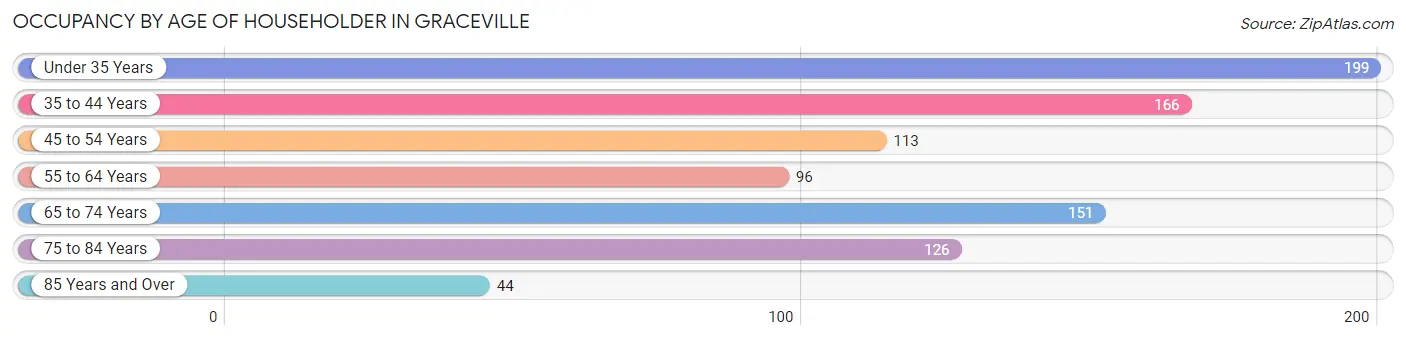
| Age Bracket | # Households | % Households |
| Under 35 Years | 199 | 22.2% |
| 35 to 44 Years | 166 | 18.5% |
| 45 to 54 Years | 113 | 12.6% |
| 55 to 64 Years | 96 | 10.7% |
| 65 to 74 Years | 151 | 16.9% |
| 75 to 84 Years | 126 | 14.1% |
| 85 Years and Over | 44 | 4.9% |
| Total | 895 | 100.0% |
Housing Finances in Graceville
Median Income by Occupancy in Graceville
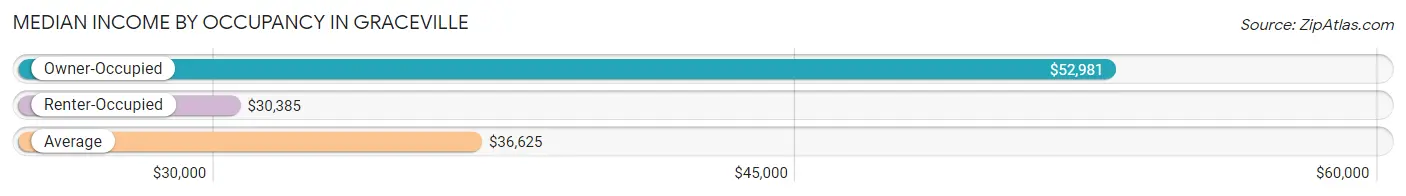
| Occupancy Type | # Households | Median Income |
| Owner-Occupied | 421 (47.0%) | $52,981 |
| Renter-Occupied | 474 (53.0%) | $30,385 |
| Average | 895 (100.0%) | $36,625 |
Occupancy by Householder Income Bracket in Graceville
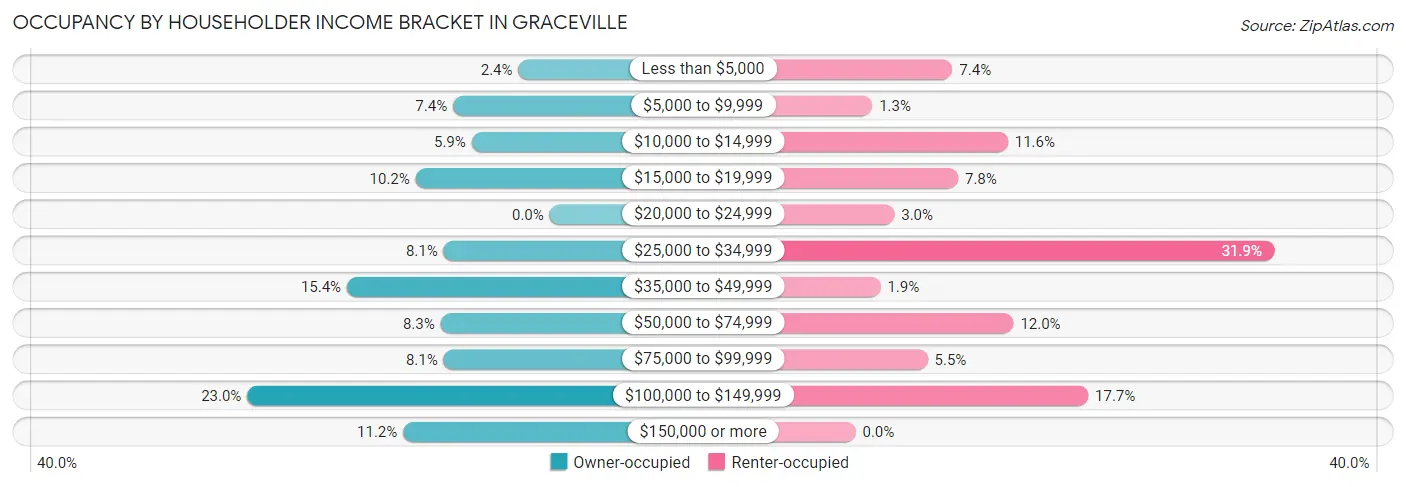
| Income Bracket | Owner-occupied | Renter-occupied |
| Less than $5,000 | 10 (2.4%) | 35 (7.4%) |
| $5,000 to $9,999 | 31 (7.4%) | 6 (1.3%) |
| $10,000 to $14,999 | 25 (5.9%) | 55 (11.6%) |
| $15,000 to $19,999 | 43 (10.2%) | 37 (7.8%) |
| $20,000 to $24,999 | 0 (0.0%) | 14 (2.9%) |
| $25,000 to $34,999 | 34 (8.1%) | 151 (31.9%) |
| $35,000 to $49,999 | 65 (15.4%) | 9 (1.9%) |
| $50,000 to $74,999 | 35 (8.3%) | 57 (12.0%) |
| $75,000 to $99,999 | 34 (8.1%) | 26 (5.5%) |
| $100,000 to $149,999 | 97 (23.0%) | 84 (17.7%) |
| $150,000 or more | 47 (11.2%) | 0 (0.0%) |
| Total | 421 (100.0%) | 474 (100.0%) |
Monthly Housing Cost Tiers in Graceville
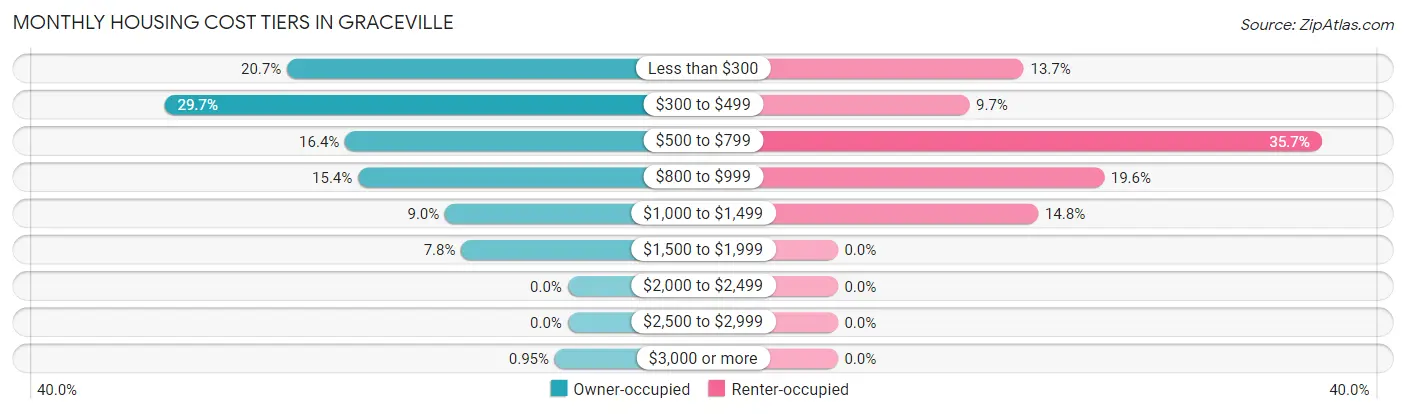
| Monthly Cost | Owner-occupied | Renter-occupied |
| Less than $300 | 87 (20.7%) | 65 (13.7%) |
| $300 to $499 | 125 (29.7%) | 46 (9.7%) |
| $500 to $799 | 69 (16.4%) | 169 (35.6%) |
| $800 to $999 | 65 (15.4%) | 93 (19.6%) |
| $1,000 to $1,499 | 38 (9.0%) | 70 (14.8%) |
| $1,500 to $1,999 | 33 (7.8%) | 0 (0.0%) |
| $2,000 to $2,499 | 0 (0.0%) | 0 (0.0%) |
| $2,500 to $2,999 | 0 (0.0%) | 0 (0.0%) |
| $3,000 or more | 4 (0.9%) | 0 (0.0%) |
| Total | 421 (100.0%) | 474 (100.0%) |
Physical Housing Characteristics in Graceville
Housing Structures in Graceville
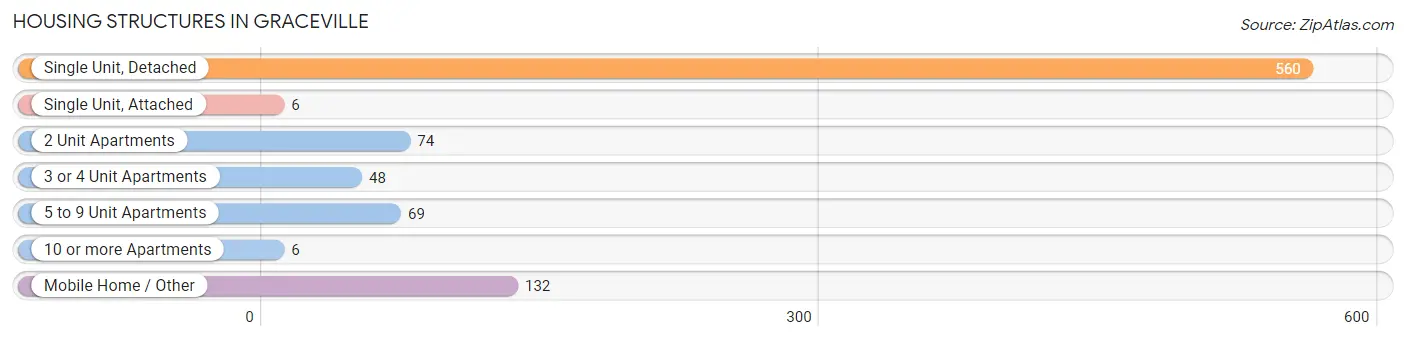
| Structure Type | # Housing Units | % Housing Units |
| Single Unit, Detached | 560 | 62.6% |
| Single Unit, Attached | 6 | 0.7% |
| 2 Unit Apartments | 74 | 8.3% |
| 3 or 4 Unit Apartments | 48 | 5.4% |
| 5 to 9 Unit Apartments | 69 | 7.7% |
| 10 or more Apartments | 6 | 0.7% |
| Mobile Home / Other | 132 | 14.7% |
| Total | 895 | 100.0% |
Housing Structures by Occupancy in Graceville
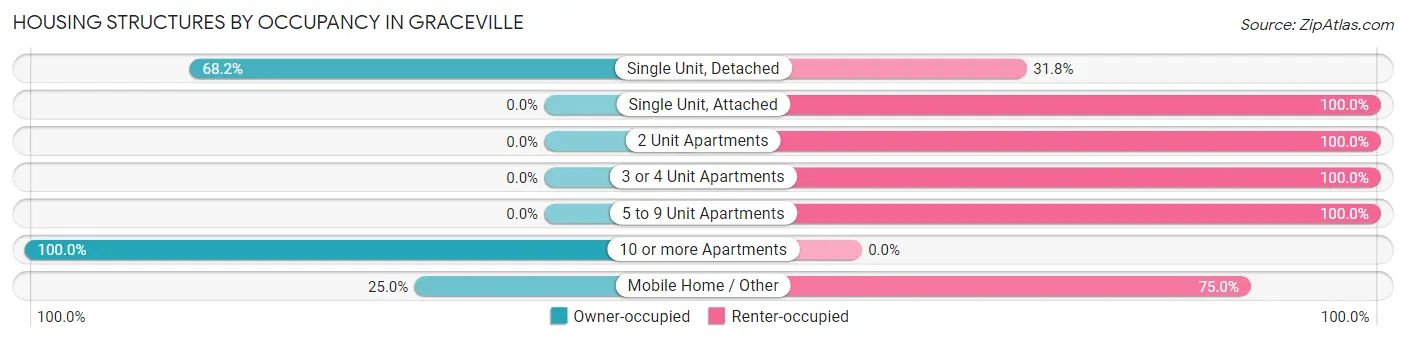
| Structure Type | Owner-occupied | Renter-occupied |
| Single Unit, Detached | 382 (68.2%) | 178 (31.8%) |
| Single Unit, Attached | 0 (0.0%) | 6 (100.0%) |
| 2 Unit Apartments | 0 (0.0%) | 74 (100.0%) |
| 3 or 4 Unit Apartments | 0 (0.0%) | 48 (100.0%) |
| 5 to 9 Unit Apartments | 0 (0.0%) | 69 (100.0%) |
| 10 or more Apartments | 6 (100.0%) | 0 (0.0%) |
| Mobile Home / Other | 33 (25.0%) | 99 (75.0%) |
| Total | 421 (47.0%) | 474 (53.0%) |
Housing Structures by Number of Rooms in Graceville
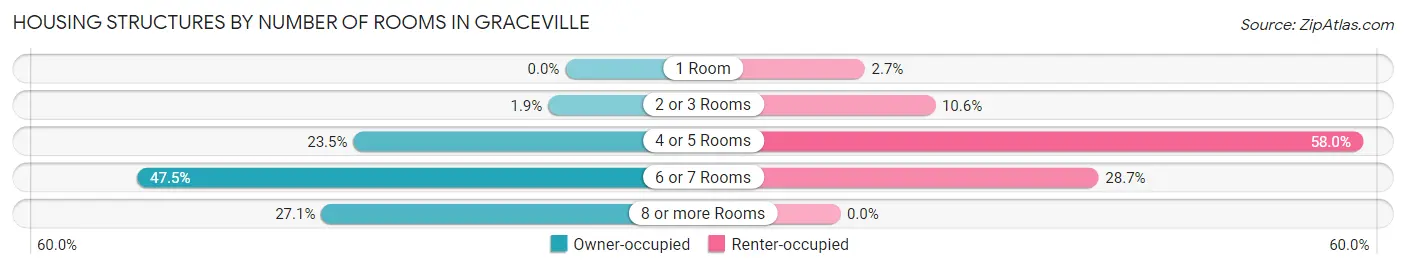
| Number of Rooms | Owner-occupied | Renter-occupied |
| 1 Room | 0 (0.0%) | 13 (2.7%) |
| 2 or 3 Rooms | 8 (1.9%) | 50 (10.5%) |
| 4 or 5 Rooms | 99 (23.5%) | 275 (58.0%) |
| 6 or 7 Rooms | 200 (47.5%) | 136 (28.7%) |
| 8 or more Rooms | 114 (27.1%) | 0 (0.0%) |
| Total | 421 (100.0%) | 474 (100.0%) |
Housing Structure by Heating Type in Graceville
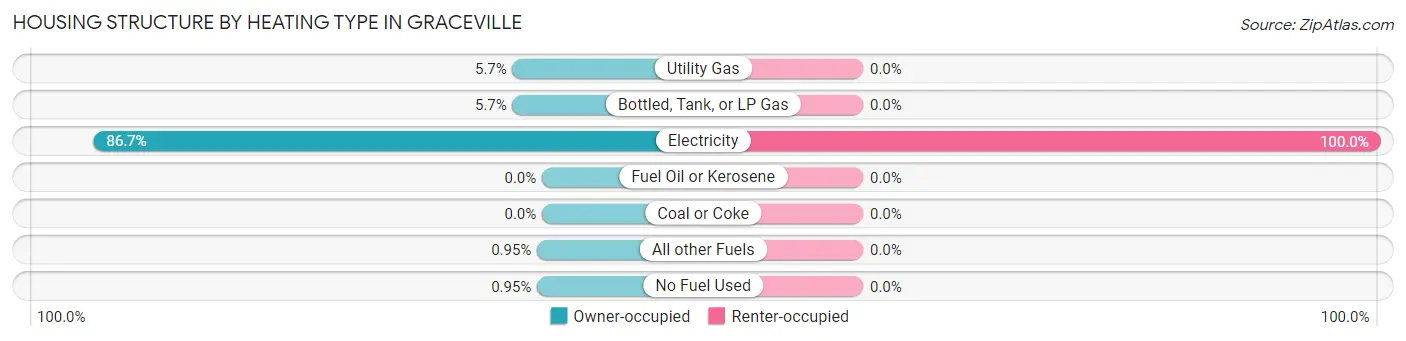
| Heating Type | Owner-occupied | Renter-occupied |
| Utility Gas | 24 (5.7%) | 0 (0.0%) |
| Bottled, Tank, or LP Gas | 24 (5.7%) | 0 (0.0%) |
| Electricity | 365 (86.7%) | 474 (100.0%) |
| Fuel Oil or Kerosene | 0 (0.0%) | 0 (0.0%) |
| Coal or Coke | 0 (0.0%) | 0 (0.0%) |
| All other Fuels | 4 (0.9%) | 0 (0.0%) |
| No Fuel Used | 4 (0.9%) | 0 (0.0%) |
| Total | 421 (100.0%) | 474 (100.0%) |
Household Vehicle Usage in Graceville
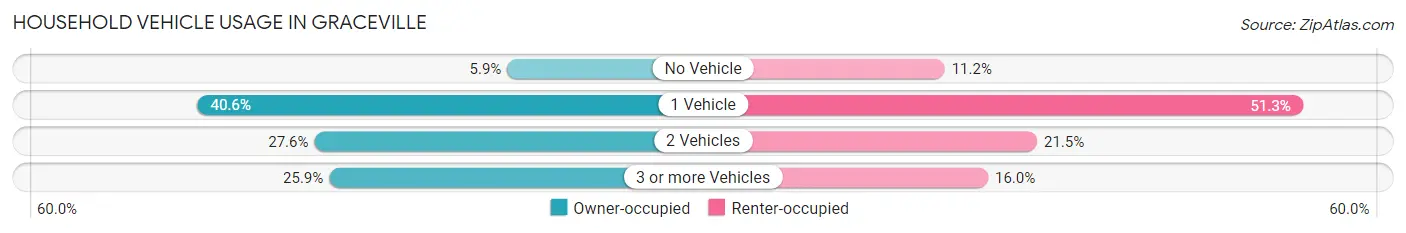
| Vehicles per Household | Owner-occupied | Renter-occupied |
| No Vehicle | 25 (5.9%) | 53 (11.2%) |
| 1 Vehicle | 171 (40.6%) | 243 (51.3%) |
| 2 Vehicles | 116 (27.6%) | 102 (21.5%) |
| 3 or more Vehicles | 109 (25.9%) | 76 (16.0%) |
| Total | 421 (100.0%) | 474 (100.0%) |
Real Estate & Mortgages in Graceville
Real Estate and Mortgage Overview in Graceville
| Characteristic | Without Mortgage | With Mortgage |
| Housing Units | 282 | 139 |
| Median Property Value | $71,900 | $116,500 |
| Median Household Income | $46,944 | $28 |
| Monthly Housing Costs | $385 | $4 |
| Real Estate Taxes | $475 | $20 |
Property Value by Mortgage Status in Graceville
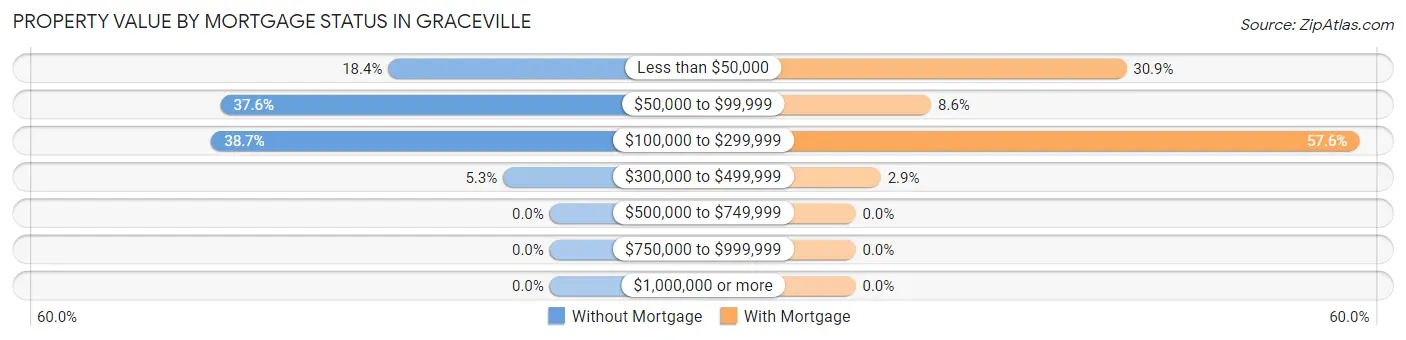
| Property Value | Without Mortgage | With Mortgage |
| Less than $50,000 | 52 (18.4%) | 43 (30.9%) |
| $50,000 to $99,999 | 106 (37.6%) | 12 (8.6%) |
| $100,000 to $299,999 | 109 (38.7%) | 80 (57.6%) |
| $300,000 to $499,999 | 15 (5.3%) | 4 (2.9%) |
| $500,000 to $749,999 | 0 (0.0%) | 0 (0.0%) |
| $750,000 to $999,999 | 0 (0.0%) | 0 (0.0%) |
| $1,000,000 or more | 0 (0.0%) | 0 (0.0%) |
| Total | 282 (100.0%) | 139 (100.0%) |
Household Income by Mortgage Status in Graceville
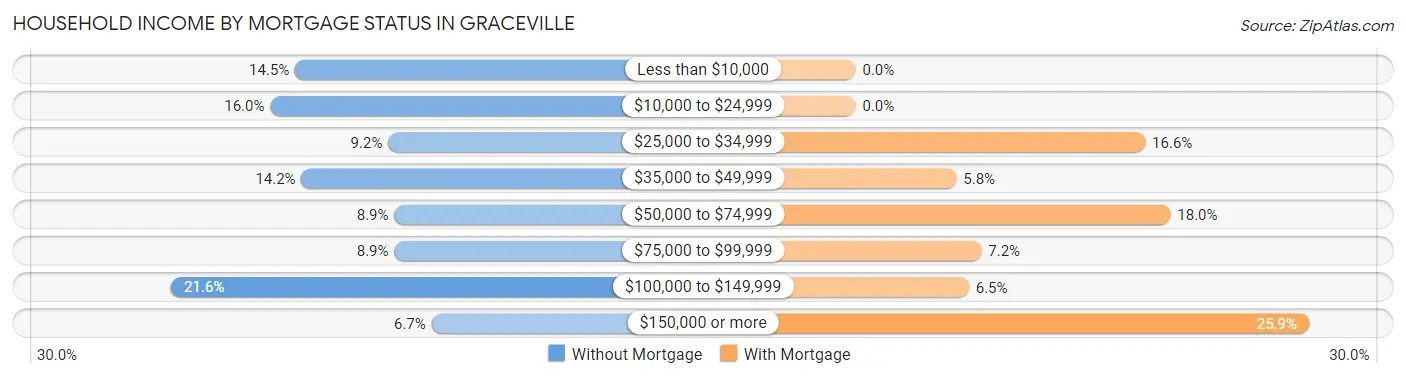
| Household Income | Without Mortgage | With Mortgage |
| Less than $10,000 | 41 (14.5%) | 0 (0.0%) |
| $10,000 to $24,999 | 45 (16.0%) | 0 (0.0%) |
| $25,000 to $34,999 | 26 (9.2%) | 23 (16.6%) |
| $35,000 to $49,999 | 40 (14.2%) | 8 (5.8%) |
| $50,000 to $74,999 | 25 (8.9%) | 25 (18.0%) |
| $75,000 to $99,999 | 25 (8.9%) | 10 (7.2%) |
| $100,000 to $149,999 | 61 (21.6%) | 9 (6.5%) |
| $150,000 or more | 19 (6.7%) | 36 (25.9%) |
| Total | 282 (100.0%) | 139 (100.0%) |
Property Value to Household Income Ratio in Graceville
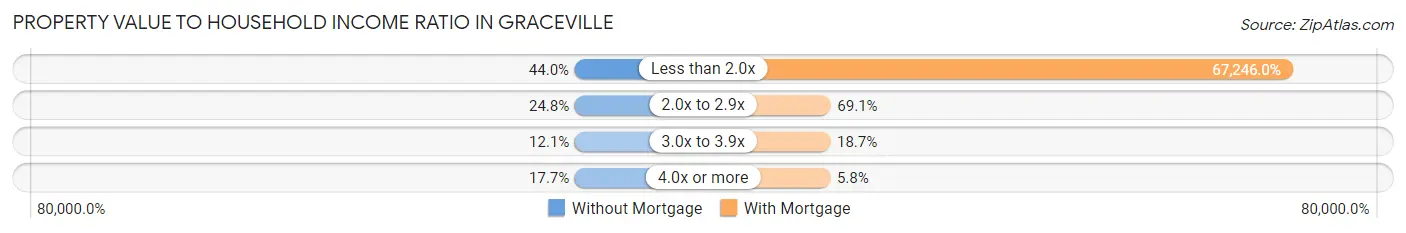
| Value-to-Income Ratio | Without Mortgage | With Mortgage |
| Less than 2.0x | 124 (44.0%) | 93,472 (67,246.0%) |
| 2.0x to 2.9x | 70 (24.8%) | 96 (69.1%) |
| 3.0x to 3.9x | 34 (12.1%) | 26 (18.7%) |
| 4.0x or more | 50 (17.7%) | 8 (5.8%) |
| Total | 282 (100.0%) | 139 (100.0%) |
Real Estate Taxes by Mortgage Status in Graceville

| Property Taxes | Without Mortgage | With Mortgage |
| Less than $800 | 168 (59.6%) | 0 (0.0%) |
| $800 to $1,499 | 24 (8.5%) | 51 (36.7%) |
| $800 to $1,499 | 21 (7.4%) | 37 (26.6%) |
| Total | 282 (100.0%) | 139 (100.0%) |
Health & Disability in Graceville
Health Insurance Coverage by Age in Graceville
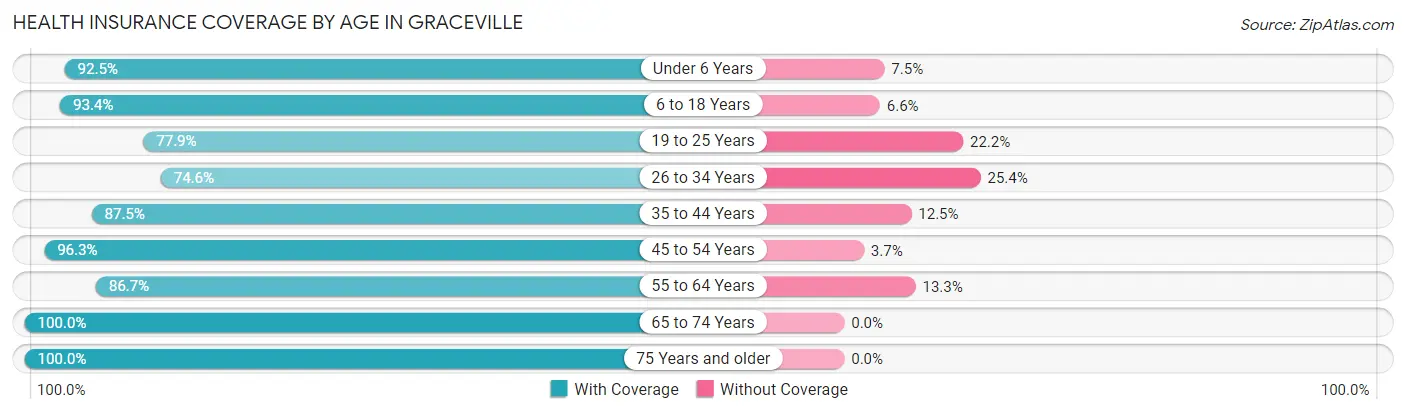
| Age Bracket | With Coverage | Without Coverage |
| Under 6 Years | 136 (92.5%) | 11 (7.5%) |
| 6 to 18 Years | 310 (93.4%) | 22 (6.6%) |
| 19 to 25 Years | 457 (77.8%) | 130 (22.2%) |
| 26 to 34 Years | 273 (74.6%) | 93 (25.4%) |
| 35 to 44 Years | 196 (87.5%) | 28 (12.5%) |
| 45 to 54 Years | 237 (96.3%) | 9 (3.7%) |
| 55 to 64 Years | 137 (86.7%) | 21 (13.3%) |
| 65 to 74 Years | 231 (100.0%) | 0 (0.0%) |
| 75 Years and older | 216 (100.0%) | 0 (0.0%) |
| Total | 2,193 (87.5%) | 314 (12.5%) |
Health Insurance Coverage by Citizenship Status in Graceville
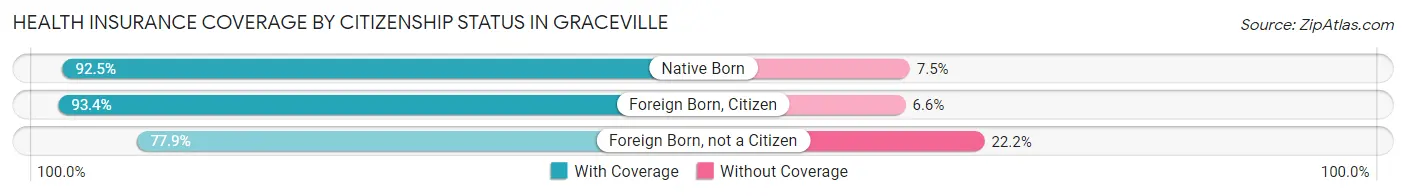
| Citizenship Status | With Coverage | Without Coverage |
| Native Born | 136 (92.5%) | 11 (7.5%) |
| Foreign Born, Citizen | 310 (93.4%) | 22 (6.6%) |
| Foreign Born, not a Citizen | 457 (77.8%) | 130 (22.2%) |
Health Insurance Coverage by Household Income in Graceville
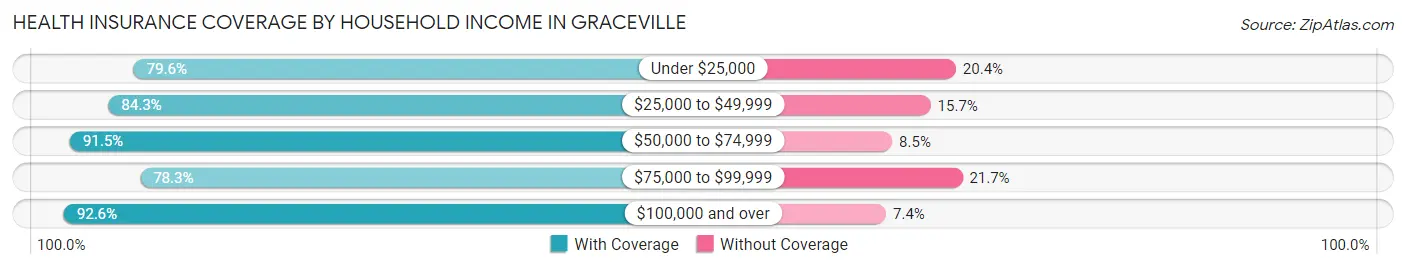
| Household Income | With Coverage | Without Coverage |
| Under $25,000 | 327 (79.6%) | 84 (20.4%) |
| $25,000 to $49,999 | 483 (84.3%) | 90 (15.7%) |
| $50,000 to $74,999 | 183 (91.5%) | 17 (8.5%) |
| $75,000 to $99,999 | 141 (78.3%) | 39 (21.7%) |
| $100,000 and over | 566 (92.6%) | 45 (7.4%) |
Public vs Private Health Insurance Coverage by Age in Graceville
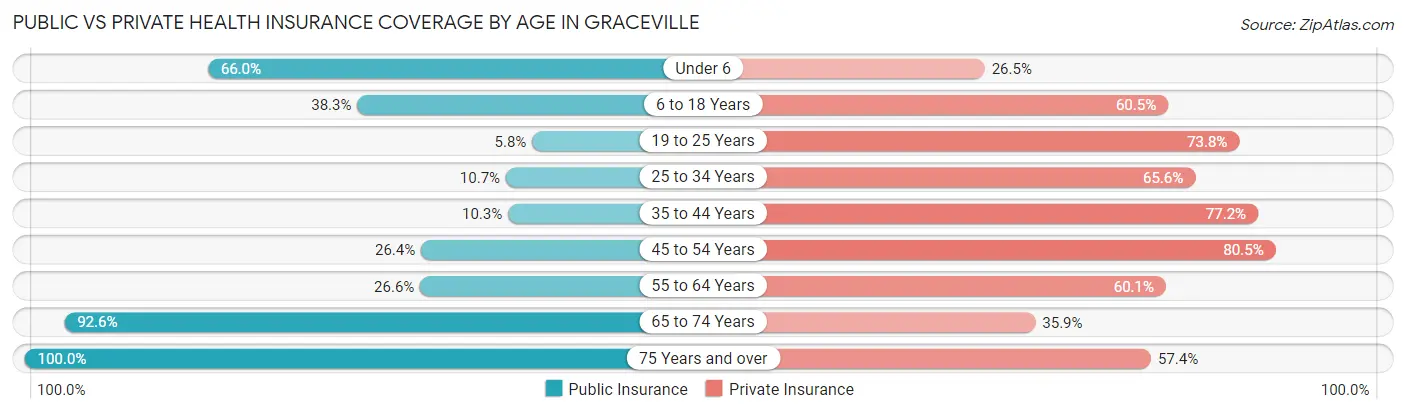
| Age Bracket | Public Insurance | Private Insurance |
| Under 6 | 97 (66.0%) | 39 (26.5%) |
| 6 to 18 Years | 127 (38.3%) | 201 (60.5%) |
| 19 to 25 Years | 34 (5.8%) | 433 (73.8%) |
| 25 to 34 Years | 39 (10.7%) | 240 (65.6%) |
| 35 to 44 Years | 23 (10.3%) | 173 (77.2%) |
| 45 to 54 Years | 65 (26.4%) | 198 (80.5%) |
| 55 to 64 Years | 42 (26.6%) | 95 (60.1%) |
| 65 to 74 Years | 214 (92.6%) | 83 (35.9%) |
| 75 Years and over | 216 (100.0%) | 124 (57.4%) |
| Total | 857 (34.2%) | 1,586 (63.3%) |
Disability Status by Sex by Age in Graceville
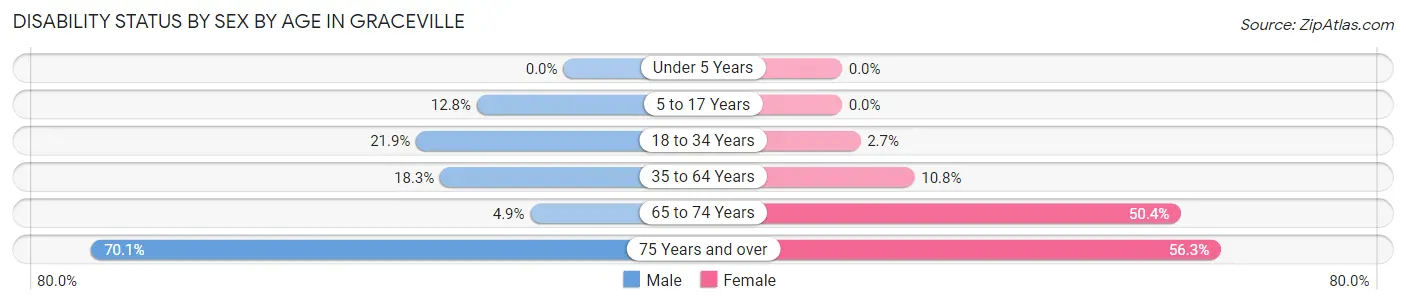
| Age Bracket | Male | Female |
| Under 5 Years | 0 (0.0%) | 0 (0.0%) |
| 5 to 17 Years | 19 (12.8%) | 0 (0.0%) |
| 18 to 34 Years | 137 (21.8%) | 12 (2.7%) |
| 35 to 64 Years | 52 (18.3%) | 37 (10.8%) |
| 65 to 74 Years | 5 (4.9%) | 65 (50.4%) |
| 75 Years and over | 68 (70.1%) | 67 (56.3%) |
Disability Class by Sex by Age in Graceville
Disability Class: Hearing Difficulty
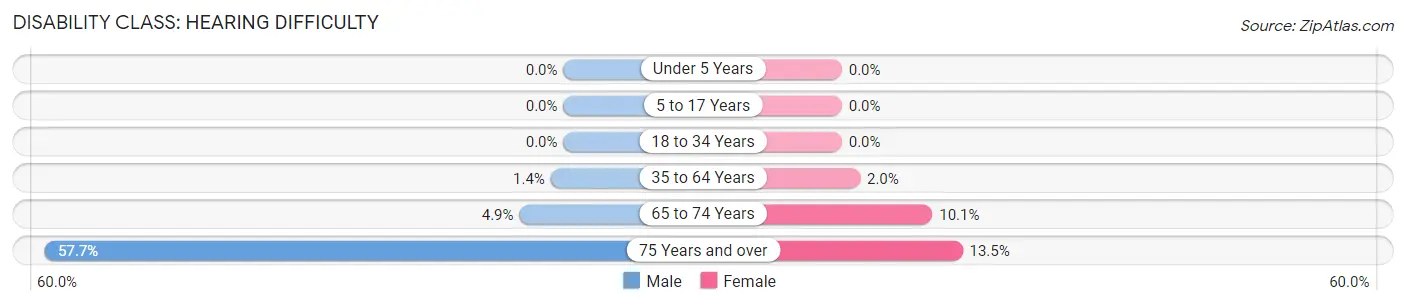
| Age Bracket | Male | Female |
| Under 5 Years | 0 (0.0%) | 0 (0.0%) |
| 5 to 17 Years | 0 (0.0%) | 0 (0.0%) |
| 18 to 34 Years | 0 (0.0%) | 0 (0.0%) |
| 35 to 64 Years | 4 (1.4%) | 7 (2.0%) |
| 65 to 74 Years | 5 (4.9%) | 13 (10.1%) |
| 75 Years and over | 56 (57.7%) | 16 (13.5%) |
Disability Class: Vision Difficulty
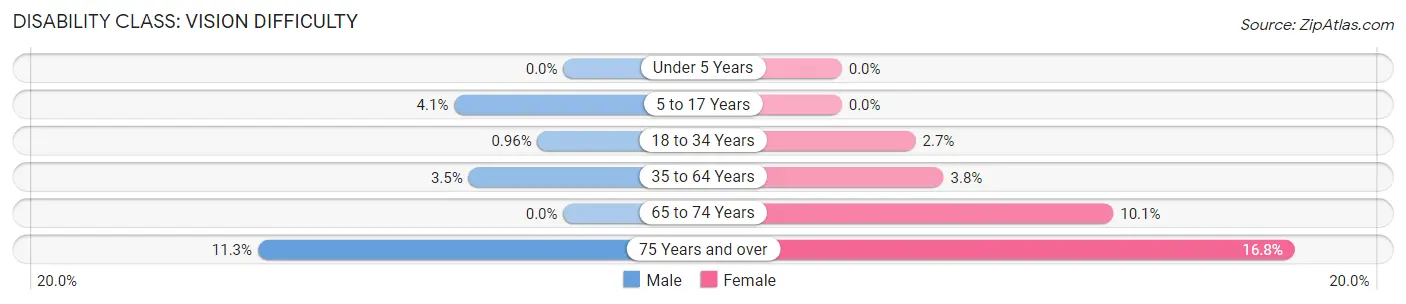
| Age Bracket | Male | Female |
| Under 5 Years | 0 (0.0%) | 0 (0.0%) |
| 5 to 17 Years | 6 (4.1%) | 0 (0.0%) |
| 18 to 34 Years | 6 (1.0%) | 12 (2.7%) |
| 35 to 64 Years | 10 (3.5%) | 13 (3.8%) |
| 65 to 74 Years | 0 (0.0%) | 13 (10.1%) |
| 75 Years and over | 11 (11.3%) | 20 (16.8%) |
Disability Class: Cognitive Difficulty
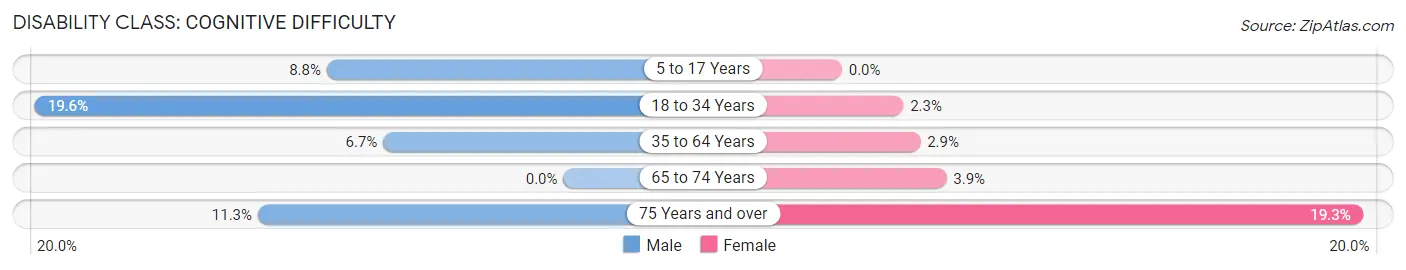
| Age Bracket | Male | Female |
| 5 to 17 Years | 13 (8.8%) | 0 (0.0%) |
| 18 to 34 Years | 123 (19.6%) | 10 (2.3%) |
| 35 to 64 Years | 19 (6.7%) | 10 (2.9%) |
| 65 to 74 Years | 0 (0.0%) | 5 (3.9%) |
| 75 Years and over | 11 (11.3%) | 23 (19.3%) |
Disability Class: Ambulatory Difficulty
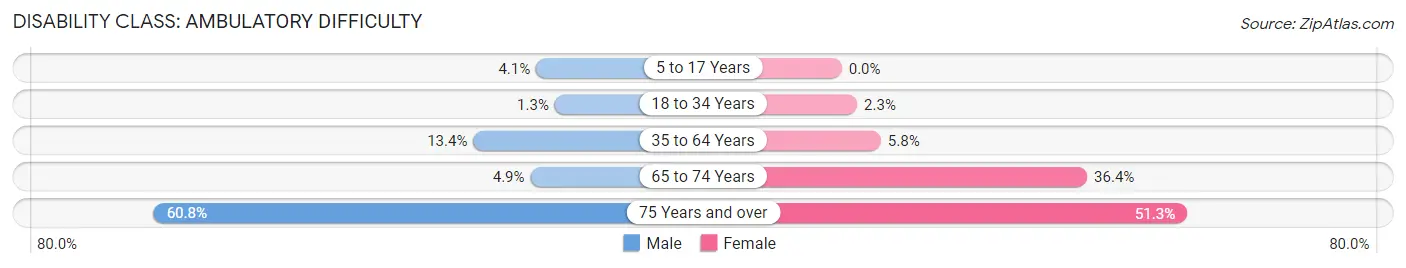
| Age Bracket | Male | Female |
| 5 to 17 Years | 6 (4.1%) | 0 (0.0%) |
| 18 to 34 Years | 8 (1.3%) | 10 (2.3%) |
| 35 to 64 Years | 38 (13.4%) | 20 (5.8%) |
| 65 to 74 Years | 5 (4.9%) | 47 (36.4%) |
| 75 Years and over | 59 (60.8%) | 61 (51.3%) |
Disability Class: Self-Care Difficulty
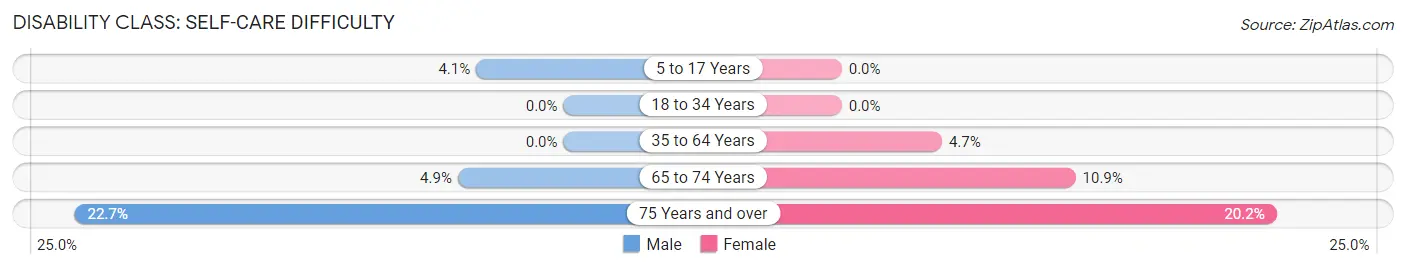
| Age Bracket | Male | Female |
| 5 to 17 Years | 6 (4.1%) | 0 (0.0%) |
| 18 to 34 Years | 0 (0.0%) | 0 (0.0%) |
| 35 to 64 Years | 0 (0.0%) | 16 (4.6%) |
| 65 to 74 Years | 5 (4.9%) | 14 (10.8%) |
| 75 Years and over | 22 (22.7%) | 24 (20.2%) |
Technology Access in Graceville
Computing Device Access in Graceville
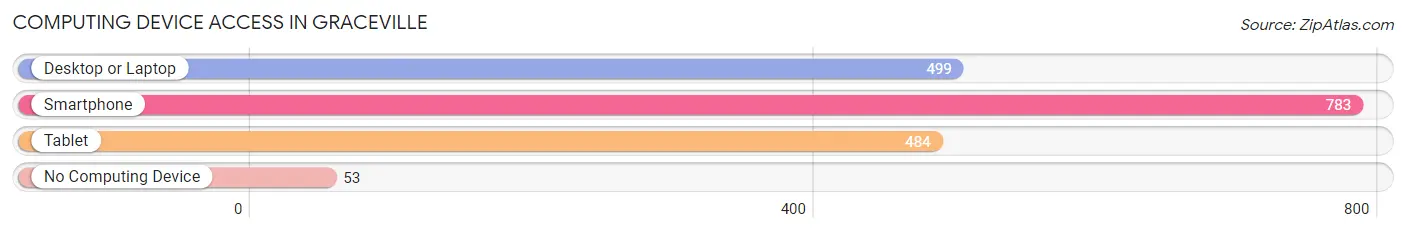
| Device Type | # Households | % Households |
| Desktop or Laptop | 499 | 55.7% |
| Smartphone | 783 | 87.5% |
| Tablet | 484 | 54.1% |
| No Computing Device | 53 | 5.9% |
| Total | 895 | 100.0% |
Internet Access in Graceville
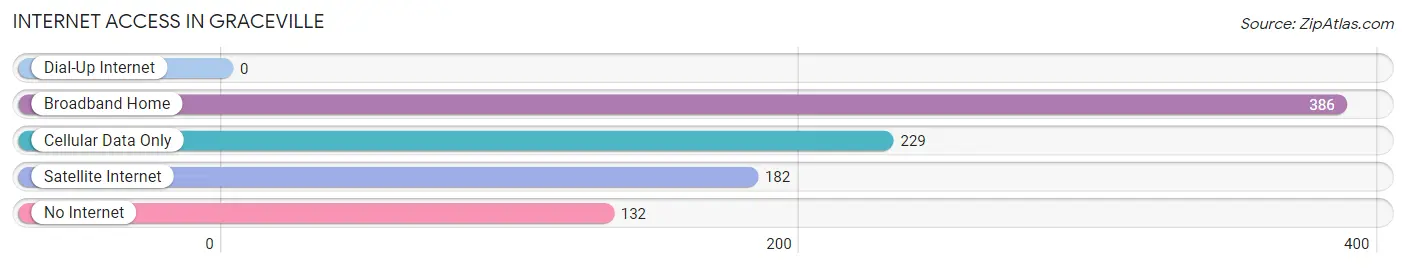
| Internet Type | # Households | % Households |
| Dial-Up Internet | 0 | 0.0% |
| Broadband Home | 386 | 43.1% |
| Cellular Data Only | 229 | 25.6% |
| Satellite Internet | 182 | 20.3% |
| No Internet | 132 | 14.7% |
| Total | 895 | 100.0% |
Graceville Summary
Graceville is a small town located in Jackson County, Florida. It is situated in the Florida Panhandle, approximately 20 miles north of the state capital, Tallahassee. The town was founded in 1884 and is named after the daughter of the first postmaster, Grace McVay. As of the 2010 census, the population of Graceville was 2,192.
Geography
Graceville is located at 30°45'N 85°30'W. It is situated in the Florida Panhandle, approximately 20 miles north of the state capital, Tallahassee. The town is located in Jackson County, which is bordered by Washington County to the west, Holmes County to the east, and Calhoun County to the south. The town is situated on the banks of the Choctawhatchee River, which flows through the area. The town is located in a rural area, with the nearest major city being Dothan, Alabama, which is approximately 40 miles to the north.
Climate
Graceville has a humid subtropical climate, with hot, humid summers and mild winters. The average temperature in the summer months is around 90°F, with temperatures occasionally reaching the low 100s. The average temperature in the winter months is around 50°F, with temperatures occasionally dropping into the low 30s. The area receives an average of 54 inches of precipitation per year, with most of the precipitation occurring in the summer months.
Economy
Graceville’s economy is largely based on agriculture. The town is home to several farms, which produce a variety of crops, including cotton, peanuts, corn, and soybeans. The town is also home to several manufacturing companies, which produce a variety of products, including furniture, clothing, and paper products. The town is also home to several retail stores, which sell a variety of goods, including groceries, clothing, and home goods.
Demographics
As of the 2010 census, the population of Graceville was 2,192. The racial makeup of the town was 79.2% White, 17.7% African American, 0.3% Native American, 0.7% Asian, 0.1% Pacific Islander, 0.7% from other races, and 1.2% from two or more races. Hispanic or Latino of any race were 2.2% of the population.
The median income for a household in the town was $30,938, and the median income for a family was $37,917. The per capita income for the town was $15,945. About 17.2% of families and 20.3% of the population were below the poverty line, including 28.2% of those under age 18 and 16.2% of those age 65 or over.
Conclusion
Graceville is a small town located in Jackson County, Florida. It is situated in the Florida Panhandle, approximately 20 miles north of the state capital, Tallahassee. The town was founded in 1884 and is named after the daughter of the first postmaster, Grace McVay. As of the 2010 census, the population of Graceville was 2,192. The town has a humid subtropical climate, with hot, humid summers and mild winters. The economy of Graceville is largely based on agriculture, with several farms producing a variety of crops. The town is also home to several manufacturing companies and retail stores. The racial makeup of the town was 79.2% White, 17.7% African American, 0.3% Native American, 0.7% Asian, 0.1% Pacific Islander, 0.7% from other races, and 1.2% from two or more races. The median income for a household in the town was $30,938, and the median income for a family was $37,917. About 17.2% of families and 20.3% of the population were below the poverty line.
Common Questions
What is Per Capita Income in Graceville?
Per Capita income in Graceville is $26,964.
What is the Median Family Income in Graceville?
Median Family Income in Graceville is $55,690.
What is the Median Household income in Graceville?
Median Household Income in Graceville is $36,625.
What is Income or Wage Gap in Graceville?
Income or Wage Gap in Graceville is 11.5%.
Women in Graceville earn 88.5 cents for every dollar earned by a man.
What is Inequality or Gini Index in Graceville?
Inequality or Gini Index in Graceville is 0.57.
What is the Total Population of Graceville?
Total Population of Graceville is 2,717.
What is the Total Male Population of Graceville?
Total Male Population of Graceville is 1,390.
What is the Total Female Population of Graceville?
Total Female Population of Graceville is 1,327.
What is the Ratio of Males per 100 Females in Graceville?
There are 104.75 Males per 100 Females in Graceville.
What is the Ratio of Females per 100 Males in Graceville?
There are 95.47 Females per 100 Males in Graceville.
What is the Median Population Age in Graceville?
Median Population Age in Graceville is 31.7 Years.
What is the Average Family Size in Graceville
Average Family Size in Graceville is 2.8 People.
What is the Average Household Size in Graceville
Average Household Size in Graceville is 2.2 People.
How Large is the Labor Force in Graceville?
There are 1,291 People in the Labor Forcein in Graceville.
What is the Percentage of People in the Labor Force in Graceville?
53.7% of People are in the Labor Force in Graceville.
What is the Unemployment Rate in Graceville?
Unemployment Rate in Graceville is 4.9%.