Geneva, FL Map & Demographics
Geneva Map
Geneva Overview
$52,210
PER CAPITA INCOME
$142,109
AVG FAMILY INCOME
$140,094
AVG HOUSEHOLD INCOME
35.2%
WAGE / INCOME GAP [ % ]
64.8¢/ $1
WAGE / INCOME GAP [ $ ]
0.38
INEQUALITY / GINI INDEX
3,247
TOTAL POPULATION
1,665
MALE POPULATION
1,582
FEMALE POPULATION
105.25
MALES / 100 FEMALES
95.02
FEMALES / 100 MALES
43.4
MEDIAN AGE
3.6
AVG FAMILY SIZE
3.0
AVG HOUSEHOLD SIZE
1,905
LABOR FORCE [ PEOPLE ]
71.3%
PERCENT IN LABOR FORCE
0.9%
UNEMPLOYMENT RATE
Geneva Zip Codes
Income in Geneva
Income Overview in Geneva
Per Capita Income in Geneva is $52,210, while median incomes of families and households are $142,109 and $140,094 respectively.
| Characteristic | Number | Measure |
| Per Capita Income | 3,247 | $52,210 |
| Median Family Income | 823 | $142,109 |
| Mean Family Income | 823 | $180,745 |
| Median Household Income | 1,072 | $140,094 |
| Mean Household Income | 1,072 | $158,452 |
| Income Deficit | 823 | $0 |
| Wage / Income Gap (%) | 3,247 | 35.17% |
| Wage / Income Gap ($) | 3,247 | 64.83¢ per $1 |
| Gini / Inequality Index | 3,247 | 0.38 |
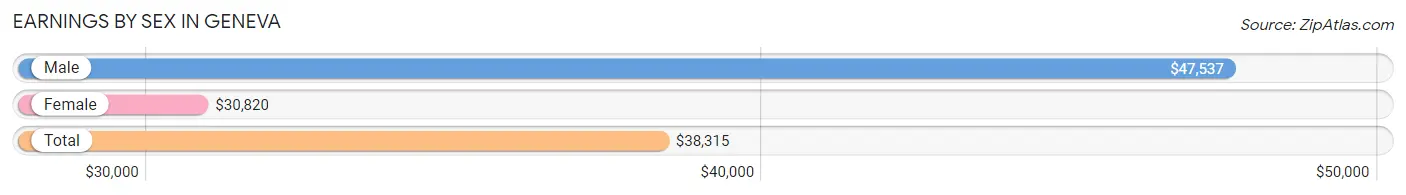
Earnings by Sex in Geneva
Average Earnings in Geneva are $38,315, $47,537 for men and $30,820 for women, a difference of 35.2%.
| Sex | Number | Average Earnings |
| Male | 1,119 (58.7%) | $47,537 |
| Female | 787 (41.3%) | $30,820 |
| Total | 1,906 (100.0%) | $38,315 |
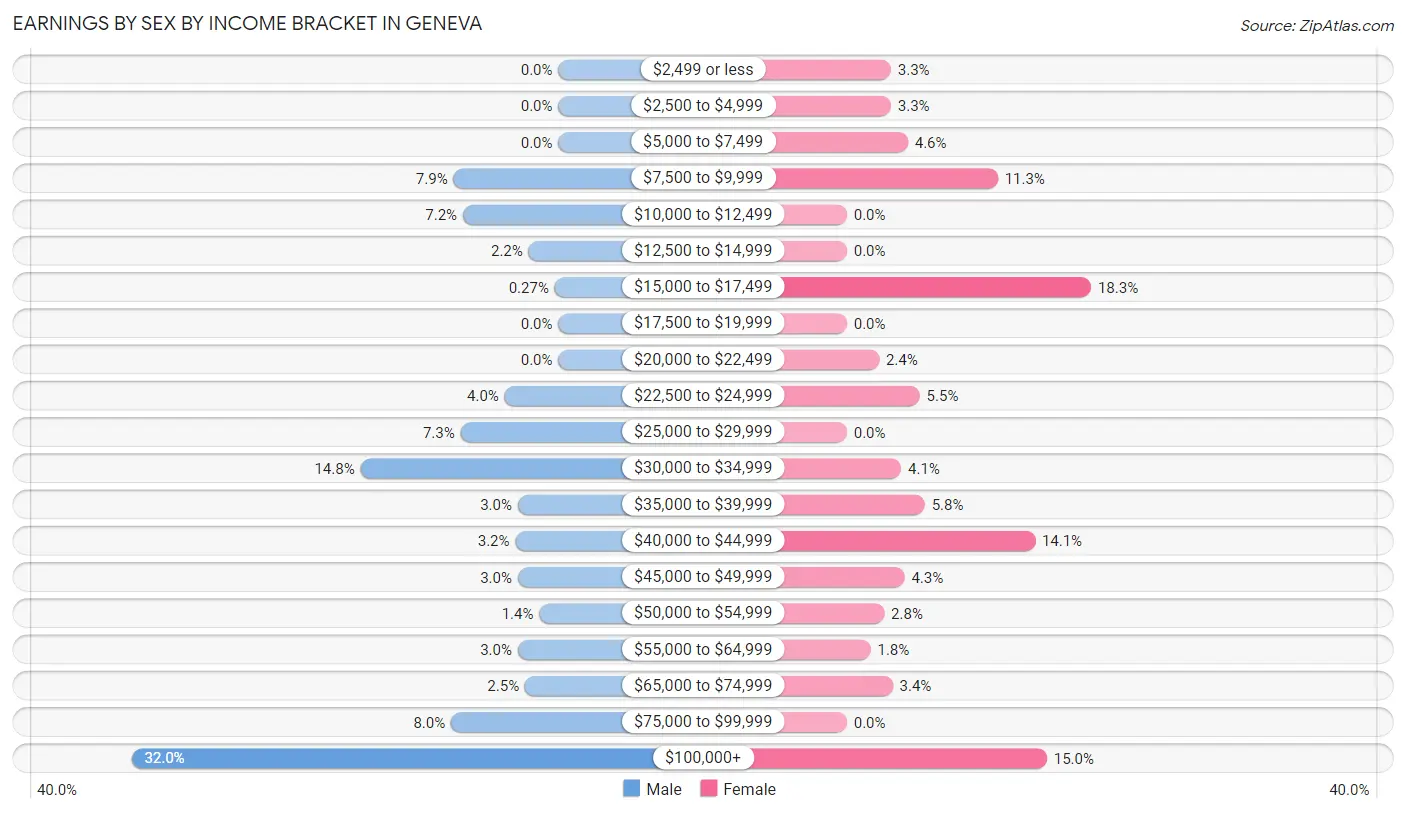
Earnings by Sex by Income Bracket in Geneva
The most common earnings brackets in Geneva are $100,000+ for men (358 | 32.0%) and $15,000 to $17,499 for women (144 | 18.3%).
| Income | Male | Female |
| $2,499 or less | 0 (0.0%) | 26 (3.3%) |
| $2,500 to $4,999 | 0 (0.0%) | 26 (3.3%) |
| $5,000 to $7,499 | 0 (0.0%) | 36 (4.6%) |
| $7,500 to $9,999 | 88 (7.9%) | 89 (11.3%) |
| $10,000 to $12,499 | 80 (7.1%) | 0 (0.0%) |
| $12,500 to $14,999 | 25 (2.2%) | 0 (0.0%) |
| $15,000 to $17,499 | 3 (0.3%) | 144 (18.3%) |
| $17,500 to $19,999 | 0 (0.0%) | 0 (0.0%) |
| $20,000 to $22,499 | 0 (0.0%) | 19 (2.4%) |
| $22,500 to $24,999 | 45 (4.0%) | 43 (5.5%) |
| $25,000 to $29,999 | 82 (7.3%) | 0 (0.0%) |
| $30,000 to $34,999 | 166 (14.8%) | 32 (4.1%) |
| $35,000 to $39,999 | 34 (3.0%) | 46 (5.8%) |
| $40,000 to $44,999 | 36 (3.2%) | 111 (14.1%) |
| $45,000 to $49,999 | 34 (3.0%) | 34 (4.3%) |
| $50,000 to $54,999 | 16 (1.4%) | 22 (2.8%) |
| $55,000 to $64,999 | 34 (3.0%) | 14 (1.8%) |
| $65,000 to $74,999 | 28 (2.5%) | 27 (3.4%) |
| $75,000 to $99,999 | 90 (8.0%) | 0 (0.0%) |
| $100,000+ | 358 (32.0%) | 118 (15.0%) |
| Total | 1,119 (100.0%) | 787 (100.0%) |
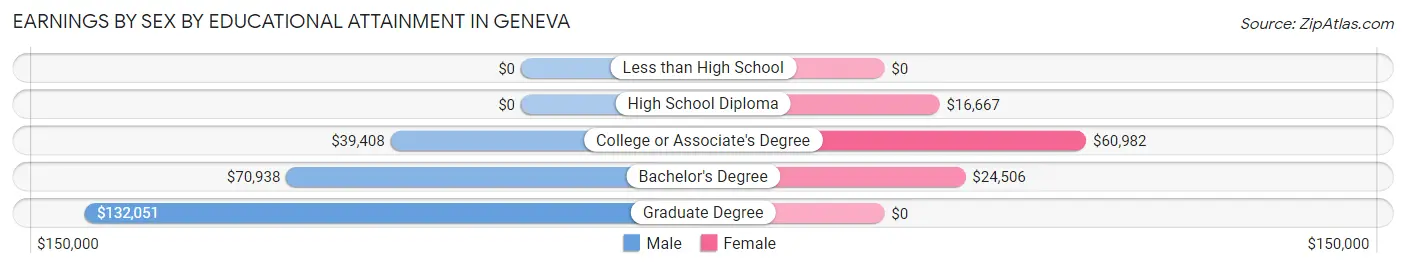
Earnings by Sex by Educational Attainment in Geneva
Average earnings in Geneva are $70,781 for men and $39,074 for women, a difference of 44.8%. Men with an educational attainment of graduate degree enjoy the highest average annual earnings of $132,051, while those with college or associate's degree education earn the least with $39,408. Women with an educational attainment of college or associate's degree earn the most with the average annual earnings of $60,982, while those with high school diploma education have the smallest earnings of $16,667.
| Educational Attainment | Male Income | Female Income |
| Less than High School | - | - |
| High School Diploma | - | - |
| College or Associate's Degree | $39,408 | $60,982 |
| Bachelor's Degree | $70,938 | $24,506 |
| Graduate Degree | $132,051 | $0 |
| Total | $70,781 | $39,074 |
Family Income in Geneva
Family Income Brackets in Geneva
According to the Geneva family income data, there are 263 families falling into the $200,000+ income range, which is the most common income bracket and makes up 32.0% of all families.
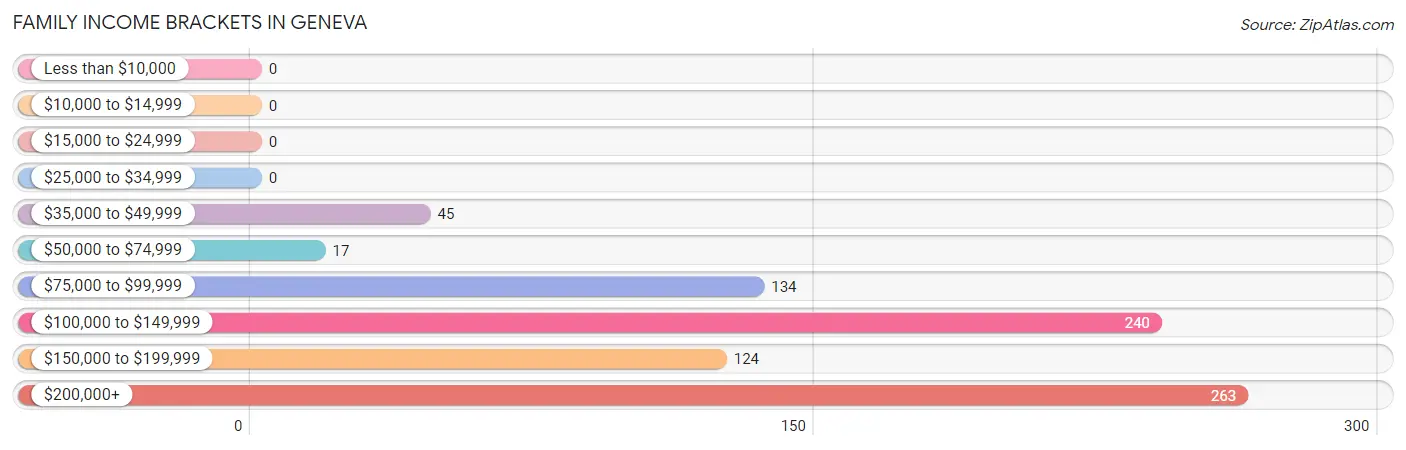
| Income Bracket | # Families | % Families |
| Less than $10,000 | 0 | 0.0% |
| $10,000 to $14,999 | 0 | 0.0% |
| $15,000 to $24,999 | 0 | 0.0% |
| $25,000 to $34,999 | 0 | 0.0% |
| $35,000 to $49,999 | 45 | 5.5% |
| $50,000 to $74,999 | 17 | 2.1% |
| $75,000 to $99,999 | 134 | 16.3% |
| $100,000 to $149,999 | 240 | 29.2% |
| $150,000 to $199,999 | 124 | 15.1% |
| $200,000+ | 263 | 32.0% |
Family Income by Famaliy Size in Geneva
4-person families (163 | 19.8%) account for the highest median family income in Geneva with $143,646 per family, while 3-person families (211 | 25.6%) have the highest median income of $47,151 per family member.
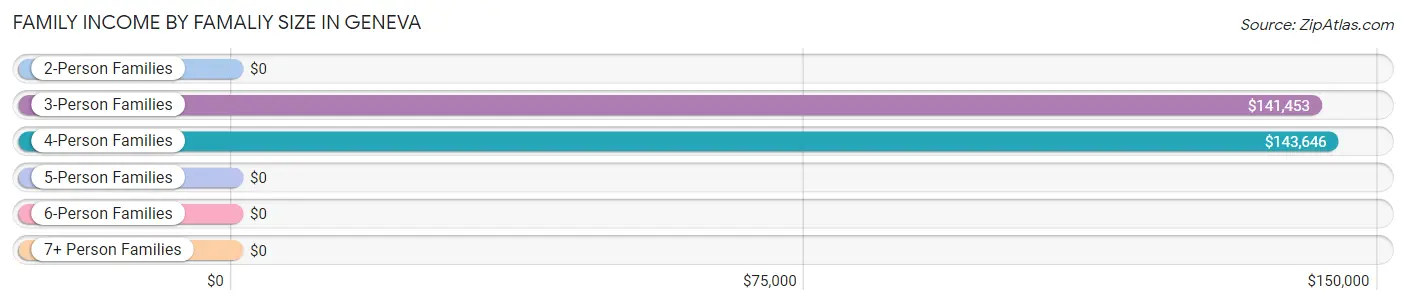
| Income Bracket | # Families | Median Income |
| 2-Person Families | 207 (25.2%) | $0 |
| 3-Person Families | 211 (25.6%) | $141,453 |
| 4-Person Families | 163 (19.8%) | $143,646 |
| 5-Person Families | 169 (20.5%) | $0 |
| 6-Person Families | 73 (8.9%) | $0 |
| 7+ Person Families | 0 (0.0%) | $0 |
| Total | 823 (100.0%) | $142,109 |
Family Income by Number of Earners in Geneva
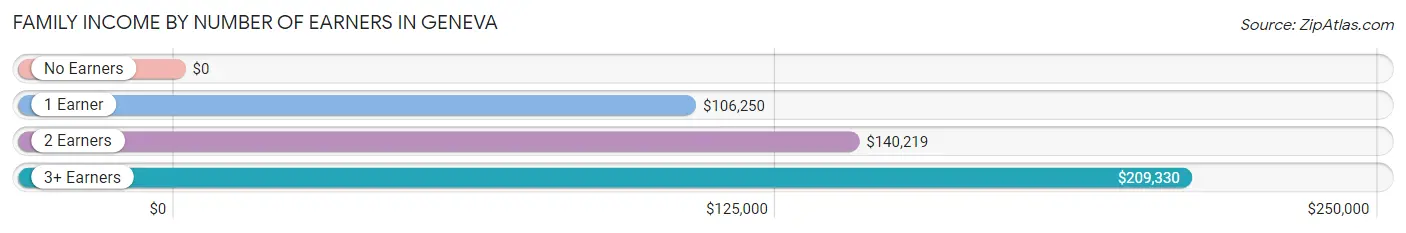
| Number of Earners | # Families | Median Income |
| No Earners | 108 (13.1%) | $0 |
| 1 Earner | 104 (12.6%) | $106,250 |
| 2 Earners | 382 (46.4%) | $140,219 |
| 3+ Earners | 229 (27.8%) | $209,330 |
| Total | 823 (100.0%) | $142,109 |
Household Income in Geneva
Household Income Brackets in Geneva
With 288 households falling in the category, the $200,000+ income range is the most frequent in Geneva, accounting for 26.9% of all households. In contrast, only 9 households (0.8%) fall into the $15,000 to $24,999 income bracket, making it the least populous group.
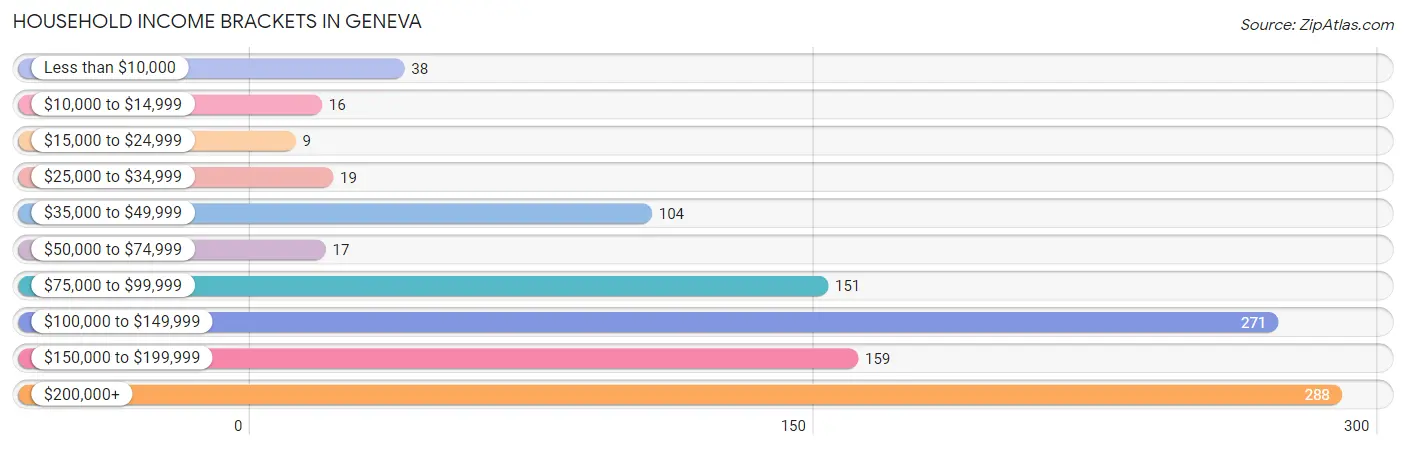
| Income Bracket | # Households | % Households |
| Less than $10,000 | 38 | 3.5% |
| $10,000 to $14,999 | 16 | 1.5% |
| $15,000 to $24,999 | 9 | 0.8% |
| $25,000 to $34,999 | 19 | 1.8% |
| $35,000 to $49,999 | 104 | 9.7% |
| $50,000 to $74,999 | 17 | 1.6% |
| $75,000 to $99,999 | 151 | 14.1% |
| $100,000 to $149,999 | 271 | 25.3% |
| $150,000 to $199,999 | 159 | 14.8% |
| $200,000+ | 288 | 26.9% |
Household Income by Householder Age in Geneva
The median household income in Geneva is $140,094, with the highest median household income of $142,469 found in the 45 to 64 years age bracket for the primary householder. A total of 412 households (38.4%) fall into this category.
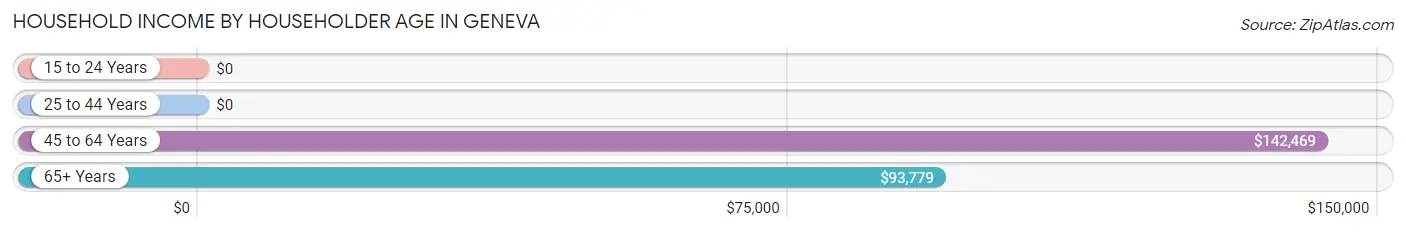
| Income Bracket | # Households | Median Income |
| 15 to 24 Years | 0 (0.0%) | $0 |
| 25 to 44 Years | 292 (27.2%) | $0 |
| 45 to 64 Years | 412 (38.4%) | $142,469 |
| 65+ Years | 368 (34.3%) | $93,779 |
| Total | 1,072 (100.0%) | $140,094 |
Poverty in Geneva
Income Below Poverty by Sex and Age in Geneva
With 1.1% poverty level for males and 2.3% for females among the residents of Geneva, 65 to 74 year old males and 55 to 64 year old females are the most vulnerable to poverty, with 18 males (6.9%) and 20 females (9.5%) in their respective age groups living below the poverty level.
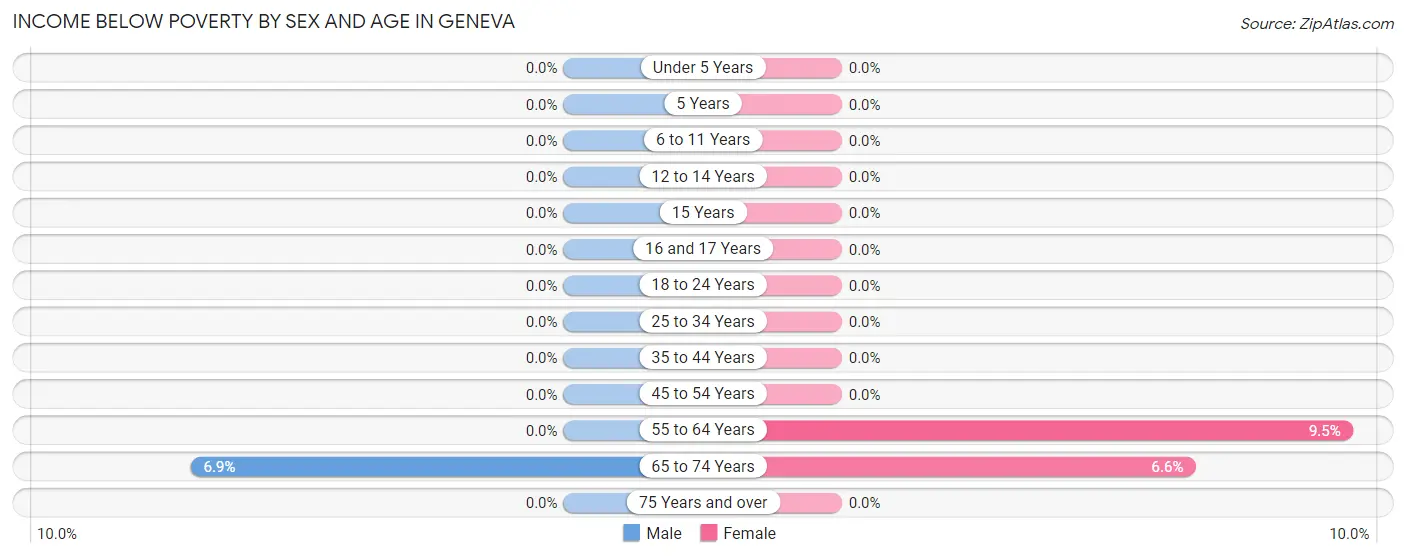
| Age Bracket | Male | Female |
| Under 5 Years | 0 (0.0%) | 0 (0.0%) |
| 5 Years | 0 (0.0%) | 0 (0.0%) |
| 6 to 11 Years | 0 (0.0%) | 0 (0.0%) |
| 12 to 14 Years | 0 (0.0%) | 0 (0.0%) |
| 15 Years | 0 (0.0%) | 0 (0.0%) |
| 16 and 17 Years | 0 (0.0%) | 0 (0.0%) |
| 18 to 24 Years | 0 (0.0%) | 0 (0.0%) |
| 25 to 34 Years | 0 (0.0%) | 0 (0.0%) |
| 35 to 44 Years | 0 (0.0%) | 0 (0.0%) |
| 45 to 54 Years | 0 (0.0%) | 0 (0.0%) |
| 55 to 64 Years | 0 (0.0%) | 20 (9.5%) |
| 65 to 74 Years | 18 (6.9%) | 16 (6.6%) |
| 75 Years and over | 0 (0.0%) | 0 (0.0%) |
| Total | 18 (1.1%) | 36 (2.3%) |
Income Above Poverty by Sex and Age in Geneva
According to the poverty statistics in Geneva, males aged under 5 years and females aged under 5 years are the age groups that are most secure financially, with 100.0% of males and 100.0% of females in these age groups living above the poverty line.
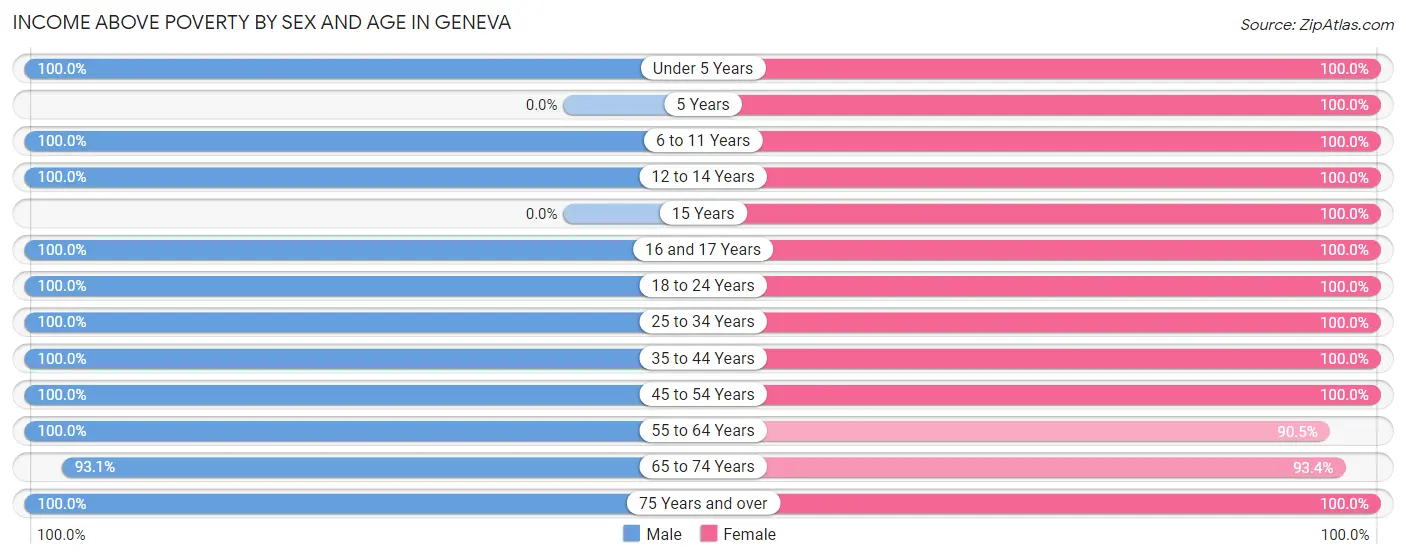
| Age Bracket | Male | Female |
| Under 5 Years | 82 (100.0%) | 20 (100.0%) |
| 5 Years | 0 (0.0%) | 59 (100.0%) |
| 6 to 11 Years | 86 (100.0%) | 215 (100.0%) |
| 12 to 14 Years | 75 (100.0%) | 24 (100.0%) |
| 15 Years | 0 (0.0%) | 14 (100.0%) |
| 16 and 17 Years | 47 (100.0%) | 44 (100.0%) |
| 18 to 24 Years | 201 (100.0%) | 89 (100.0%) |
| 25 to 34 Years | 222 (100.0%) | 174 (100.0%) |
| 35 to 44 Years | 228 (100.0%) | 244 (100.0%) |
| 45 to 54 Years | 215 (100.0%) | 178 (100.0%) |
| 55 to 64 Years | 201 (100.0%) | 191 (90.5%) |
| 65 to 74 Years | 242 (93.1%) | 228 (93.4%) |
| 75 Years and over | 48 (100.0%) | 66 (100.0%) |
| Total | 1,647 (98.9%) | 1,546 (97.7%) |
Income Below Poverty Among Married-Couple Families in Geneva
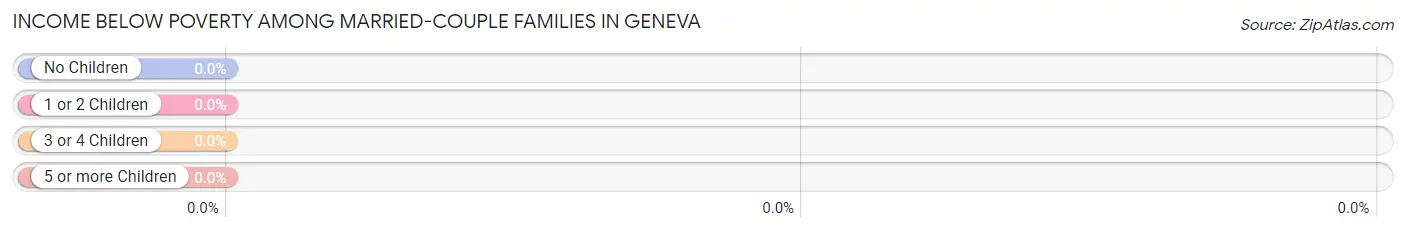
| Children | Above Poverty | Below Poverty |
| No Children | 436 (100.0%) | 0 (0.0%) |
| 1 or 2 Children | 304 (100.0%) | 0 (0.0%) |
| 3 or 4 Children | 44 (100.0%) | 0 (0.0%) |
| 5 or more Children | 0 (0.0%) | 0 (0.0%) |
| Total | 784 (100.0%) | 0 (0.0%) |
Income Below Poverty Among Single-Parent Households in Geneva
| Children | Single Father | Single Mother |
| No Children | 0 (0.0%) | 0 (0.0%) |
| 1 or 2 Children | 0 (0.0%) | 0 (0.0%) |
| 3 or 4 Children | 0 (0.0%) | 0 (0.0%) |
| 5 or more Children | 0 (0.0%) | 0 (0.0%) |
| Total | 0 (0.0%) | 0 (0.0%) |
Income Below Poverty Among Married-Couple vs Single-Parent Households in Geneva
| Children | Married-Couple Families | Single-Parent Households |
| No Children | 0 (0.0%) | 0 (0.0%) |
| 1 or 2 Children | 0 (0.0%) | 0 (0.0%) |
| 3 or 4 Children | 0 (0.0%) | 0 (0.0%) |
| 5 or more Children | 0 (0.0%) | 0 (0.0%) |
| Total | 0 (0.0%) | 0 (0.0%) |
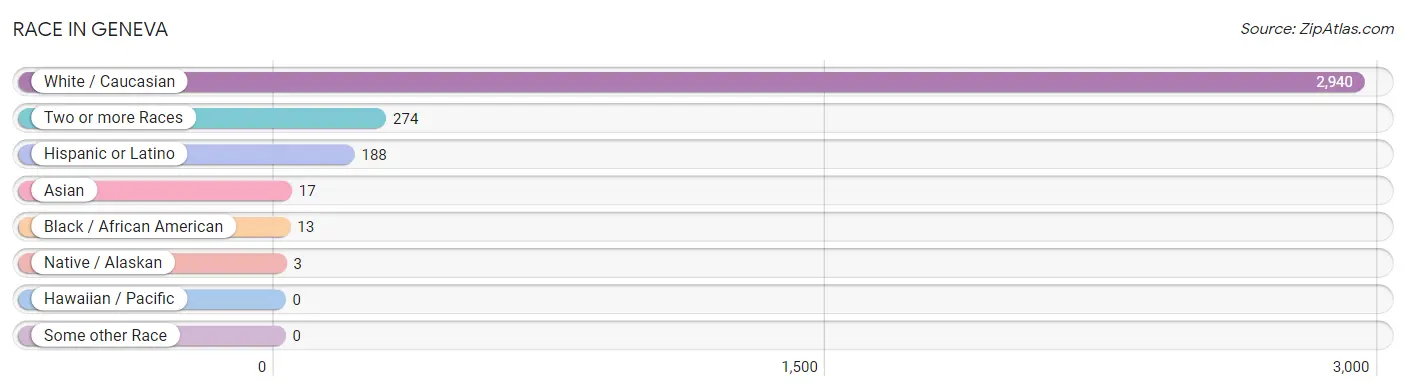
Race in Geneva
The most populous races in Geneva are White / Caucasian (2,940 | 90.5%), Two or more Races (274 | 8.4%), and Hispanic or Latino (188 | 5.8%).
| Race | # Population | % Population |
| Asian | 17 | 0.5% |
| Black / African American | 13 | 0.4% |
| Hawaiian / Pacific | 0 | 0.0% |
| Hispanic or Latino | 188 | 5.8% |
| Native / Alaskan | 3 | 0.1% |
| White / Caucasian | 2,940 | 90.5% |
| Two or more Races | 274 | 8.4% |
| Some other Race | 0 | 0.0% |
| Total | 3,247 | 100.0% |
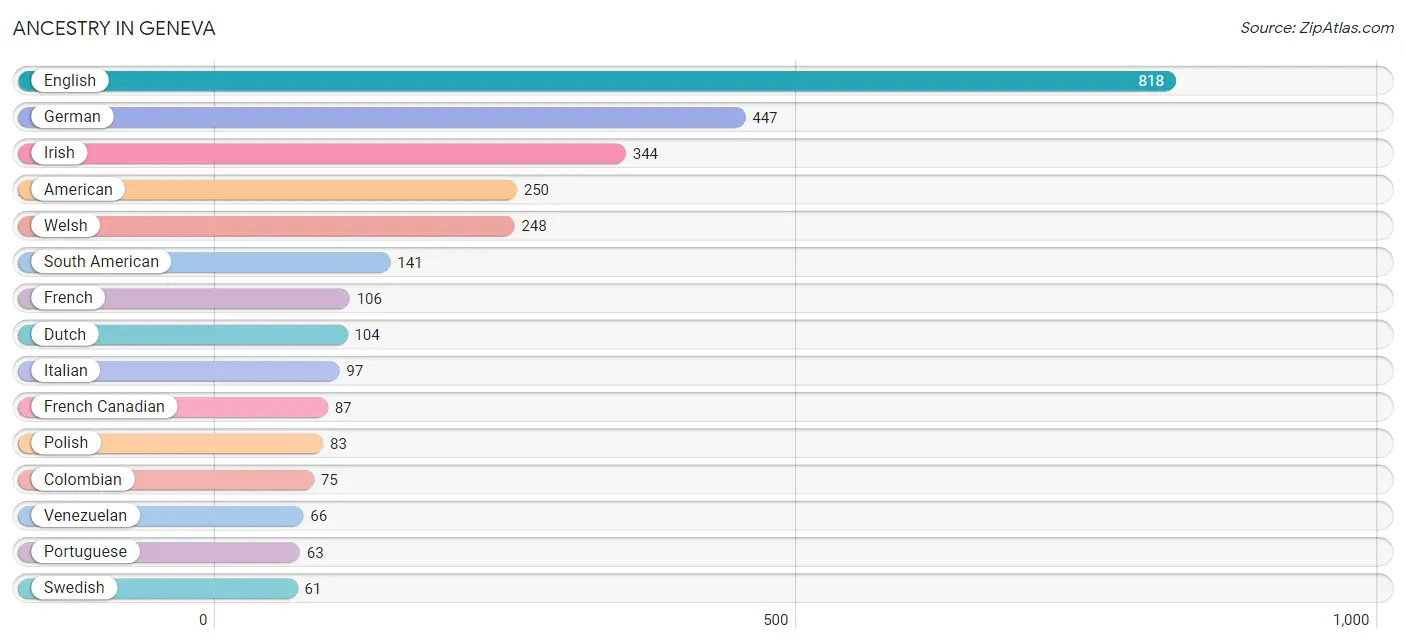
Ancestry in Geneva
The most populous ancestries reported in Geneva are English (818 | 25.2%), German (447 | 13.8%), Irish (344 | 10.6%), American (250 | 7.7%), and Welsh (248 | 7.6%), together accounting for 64.9% of all Geneva residents.
| Ancestry | # Population | % Population |
| American | 250 | 7.7% |
| Bahamian | 52 | 1.6% |
| Colombian | 75 | 2.3% |
| Dutch | 104 | 3.2% |
| English | 818 | 25.2% |
| European | 37 | 1.1% |
| Finnish | 28 | 0.9% |
| French | 106 | 3.3% |
| French Canadian | 87 | 2.7% |
| German | 447 | 13.8% |
| Indian (Asian) | 17 | 0.5% |
| Irish | 344 | 10.6% |
| Italian | 97 | 3.0% |
| Navajo | 27 | 0.8% |
| Polish | 83 | 2.6% |
| Portuguese | 63 | 1.9% |
| Puerto Rican | 47 | 1.5% |
| Russian | 30 | 0.9% |
| Scandinavian | 42 | 1.3% |
| Scotch-Irish | 17 | 0.5% |
| Scottish | 56 | 1.7% |
| South American | 141 | 4.3% |
| Swedish | 61 | 1.9% |
| Venezuelan | 66 | 2.0% |
| Welsh | 248 | 7.6% | View All 25 Rows |
Immigrants in Geneva
The most numerous immigrant groups reported in Geneva came from Latin America (118 | 3.6%), South America (91 | 2.8%), Venezuela (66 | 2.0%), Canada (43 | 1.3%), and Bahamas (27 | 0.8%), together accounting for 10.6% of all Geneva residents.
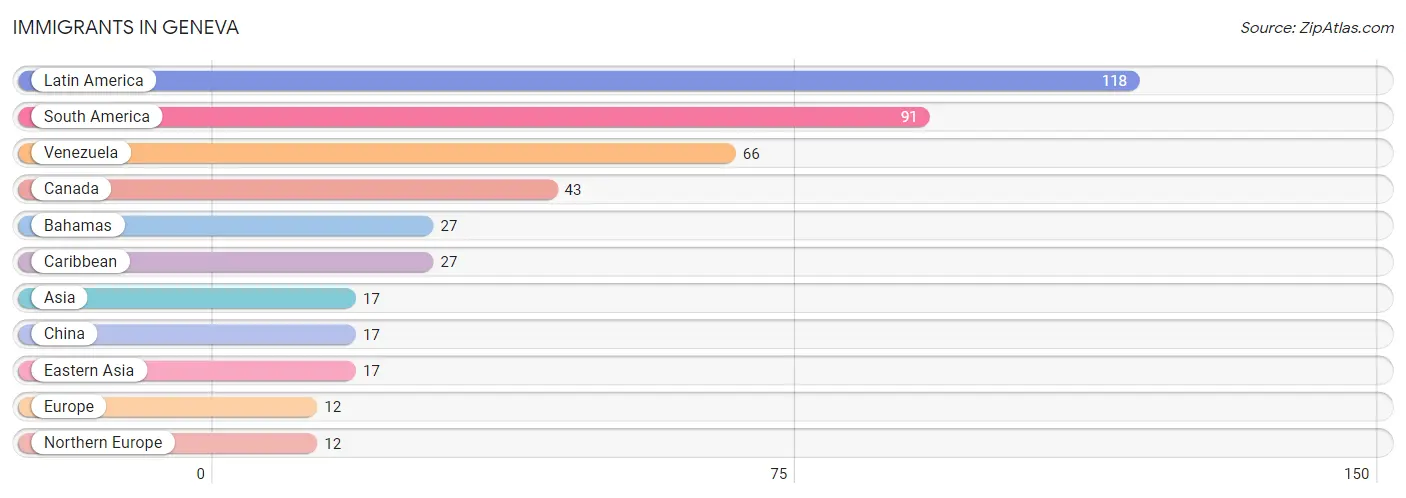
| Immigration Origin | # Population | % Population |
| Asia | 17 | 0.5% |
| Bahamas | 27 | 0.8% |
| Canada | 43 | 1.3% |
| Caribbean | 27 | 0.8% |
| China | 17 | 0.5% |
| Eastern Asia | 17 | 0.5% |
| Europe | 12 | 0.4% |
| Latin America | 118 | 3.6% |
| Northern Europe | 12 | 0.4% |
| South America | 91 | 2.8% |
| Venezuela | 66 | 2.0% | View All 11 Rows |
Sex and Age in Geneva
Sex and Age in Geneva
The most populous age groups in Geneva are 65 to 69 Years (243 | 14.6%) for men and 5 to 9 Years (222 | 14.0%) for women.
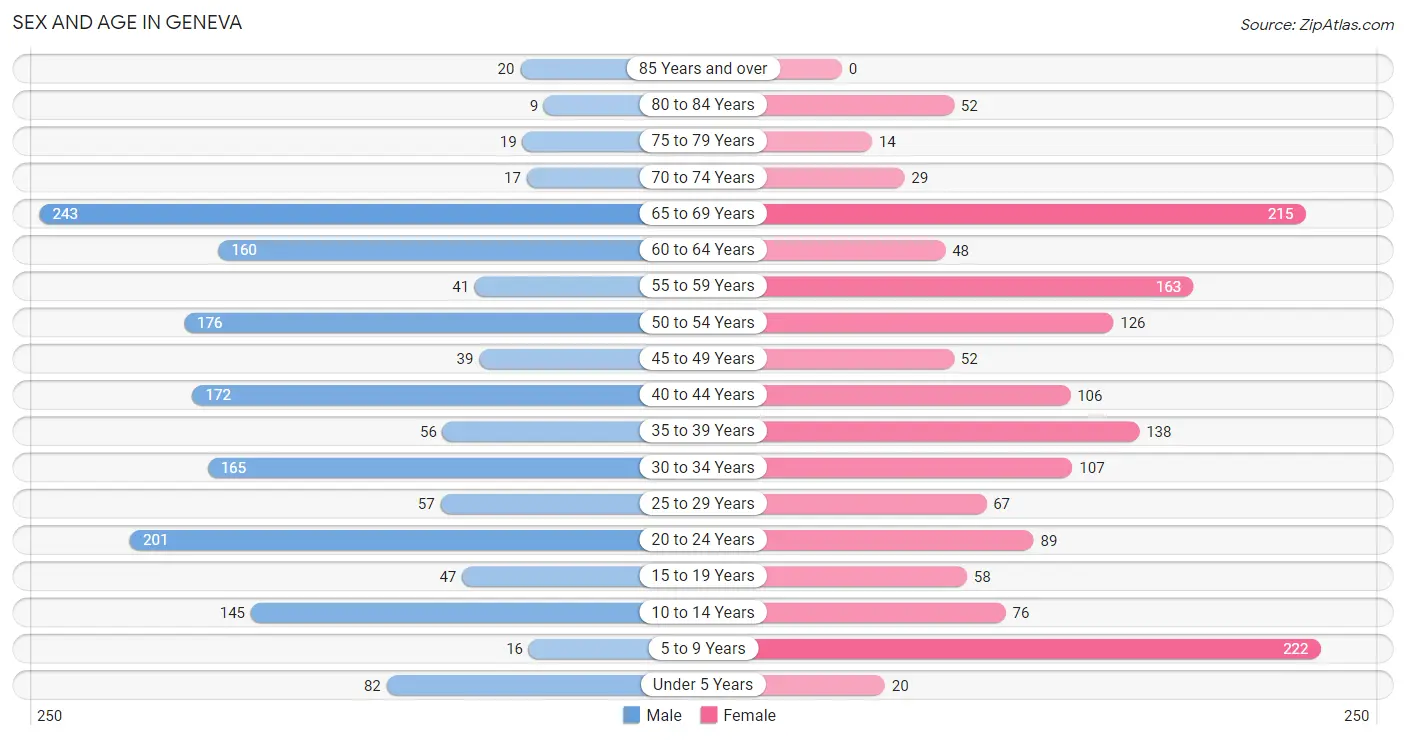
| Age Bracket | Male | Female |
| Under 5 Years | 82 (4.9%) | 20 (1.3%) |
| 5 to 9 Years | 16 (1.0%) | 222 (14.0%) |
| 10 to 14 Years | 145 (8.7%) | 76 (4.8%) |
| 15 to 19 Years | 47 (2.8%) | 58 (3.7%) |
| 20 to 24 Years | 201 (12.1%) | 89 (5.6%) |
| 25 to 29 Years | 57 (3.4%) | 67 (4.2%) |
| 30 to 34 Years | 165 (9.9%) | 107 (6.8%) |
| 35 to 39 Years | 56 (3.4%) | 138 (8.7%) |
| 40 to 44 Years | 172 (10.3%) | 106 (6.7%) |
| 45 to 49 Years | 39 (2.3%) | 52 (3.3%) |
| 50 to 54 Years | 176 (10.6%) | 126 (8.0%) |
| 55 to 59 Years | 41 (2.5%) | 163 (10.3%) |
| 60 to 64 Years | 160 (9.6%) | 48 (3.0%) |
| 65 to 69 Years | 243 (14.6%) | 215 (13.6%) |
| 70 to 74 Years | 17 (1.0%) | 29 (1.8%) |
| 75 to 79 Years | 19 (1.1%) | 14 (0.9%) |
| 80 to 84 Years | 9 (0.5%) | 52 (3.3%) |
| 85 Years and over | 20 (1.2%) | 0 (0.0%) |
| Total | 1,665 (100.0%) | 1,582 (100.0%) |
Families and Households in Geneva
Median Family Size in Geneva
The median family size in Geneva is 3.63 persons per family, with married-couple families (784 | 95.3%) accounting for the largest median family size of 3.69 persons per family. On the other hand, single male/father families (25 | 3.0%) represent the smallest median family size with 1.96 persons per family.
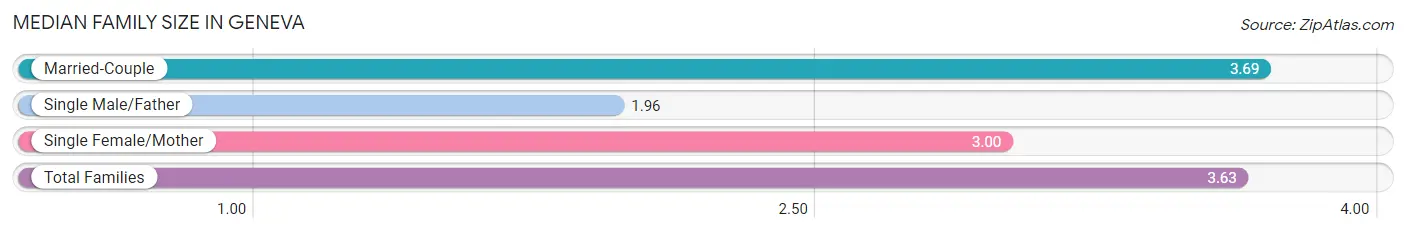
| Family Type | # Families | Family Size |
| Married-Couple | 784 (95.3%) | 3.69 |
| Single Male/Father | 25 (3.0%) | 1.96 |
| Single Female/Mother | 14 (1.7%) | 3.00 |
| Total Families | 823 (100.0%) | 3.63 |
Median Household Size in Geneva
The median household size in Geneva is 3.03 persons per household, with married-couple households (784 | 73.1%) accounting for the largest median household size of 3.69 persons per household. non-family households (249 | 23.2%) represent the smallest median household size with 1.05 persons per household.
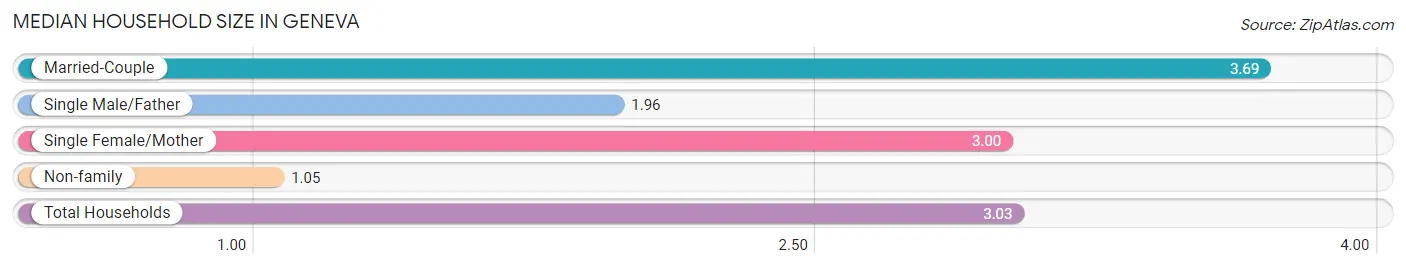
| Household Type | # Households | Household Size |
| Married-Couple | 784 (73.1%) | 3.69 |
| Single Male/Father | 25 (2.3%) | 1.96 |
| Single Female/Mother | 14 (1.3%) | 3.00 |
| Non-family | 249 (23.2%) | 1.05 |
| Total Households | 1,072 (100.0%) | 3.03 |
Household Size by Marriage Status in Geneva
Out of a total of 1,072 households in Geneva, 823 (76.8%) are family households, while 249 (23.2%) are nonfamily households. The most numerous type of family households are 3-person households, comprising 211, and the most common type of nonfamily households are 1-person households, comprising 237.
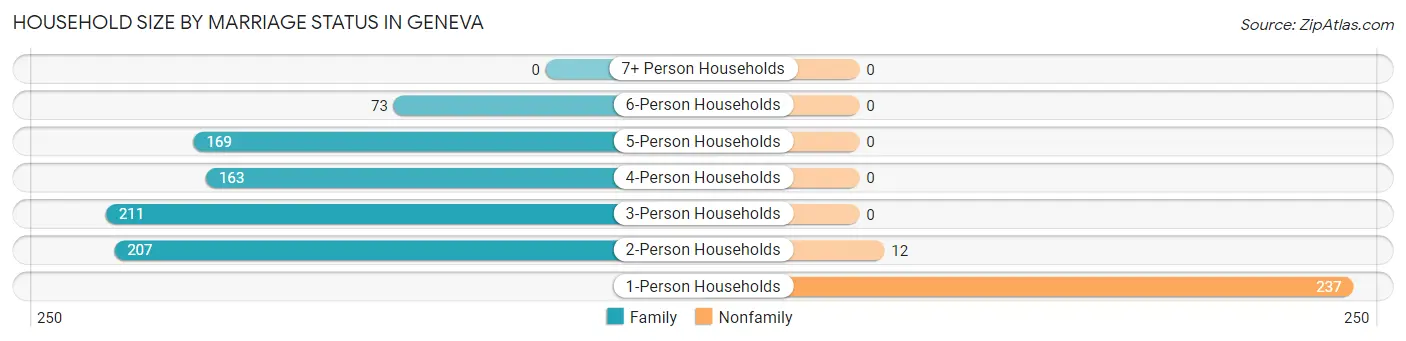
| Household Size | Family Households | Nonfamily Households |
| 1-Person Households | - | 237 (22.1%) |
| 2-Person Households | 207 (19.3%) | 12 (1.1%) |
| 3-Person Households | 211 (19.7%) | 0 (0.0%) |
| 4-Person Households | 163 (15.2%) | 0 (0.0%) |
| 5-Person Households | 169 (15.8%) | 0 (0.0%) |
| 6-Person Households | 73 (6.8%) | 0 (0.0%) |
| 7+ Person Households | 0 (0.0%) | 0 (0.0%) |
| Total | 823 (76.8%) | 249 (23.2%) |
Female Fertility in Geneva
Fertility by Age in Geneva
Average fertility rate in Geneva is 26.0 births per 1,000 women. Women in the age bracket of 20 to 34 years have the highest fertility rate with 61.0 births per 1,000 women. Women in the age bracket of 20 to 34 years acount for 100.0% of all women with births.
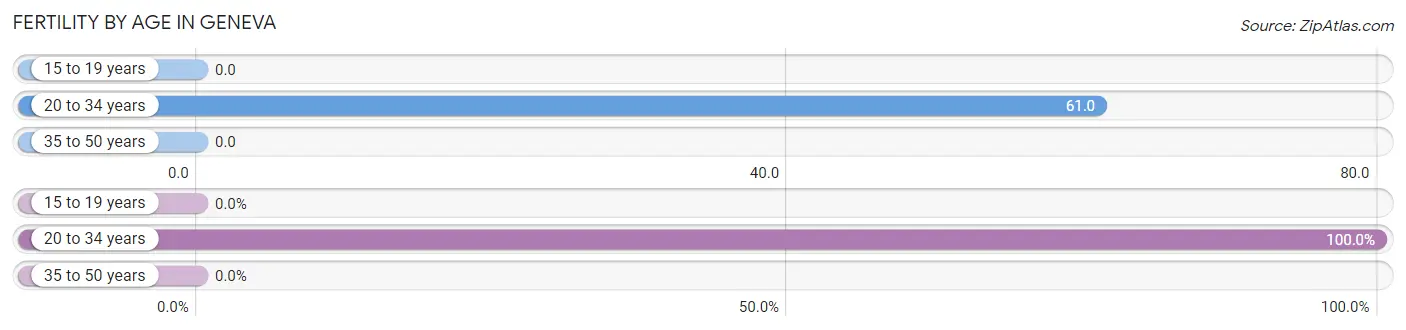
| Age Bracket | Women with Births | Births / 1,000 Women |
| 15 to 19 years | 0 (0.0%) | 0.0 |
| 20 to 34 years | 16 (100.0%) | 61.0 |
| 35 to 50 years | 0 (0.0%) | 0.0 |
| Total | 16 (100.0%) | 26.0 |
Fertility by Age by Marriage Status in Geneva
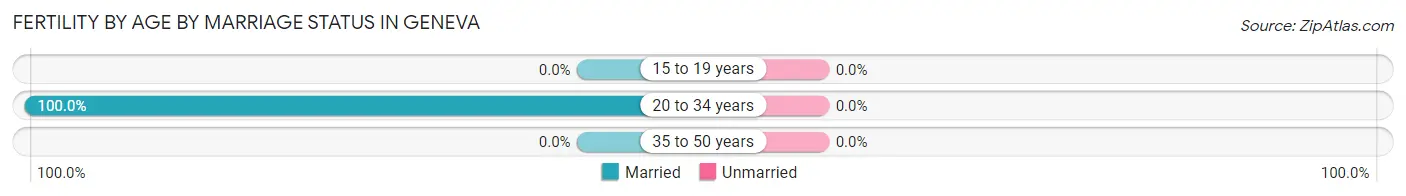
| Age Bracket | Married | Unmarried |
| 15 to 19 years | 0 (0.0%) | 0 (0.0%) |
| 20 to 34 years | 16 (100.0%) | 0 (0.0%) |
| 35 to 50 years | 0 (0.0%) | 0 (0.0%) |
| Total | 16 (100.0%) | 0 (0.0%) |
Fertility by Education in Geneva
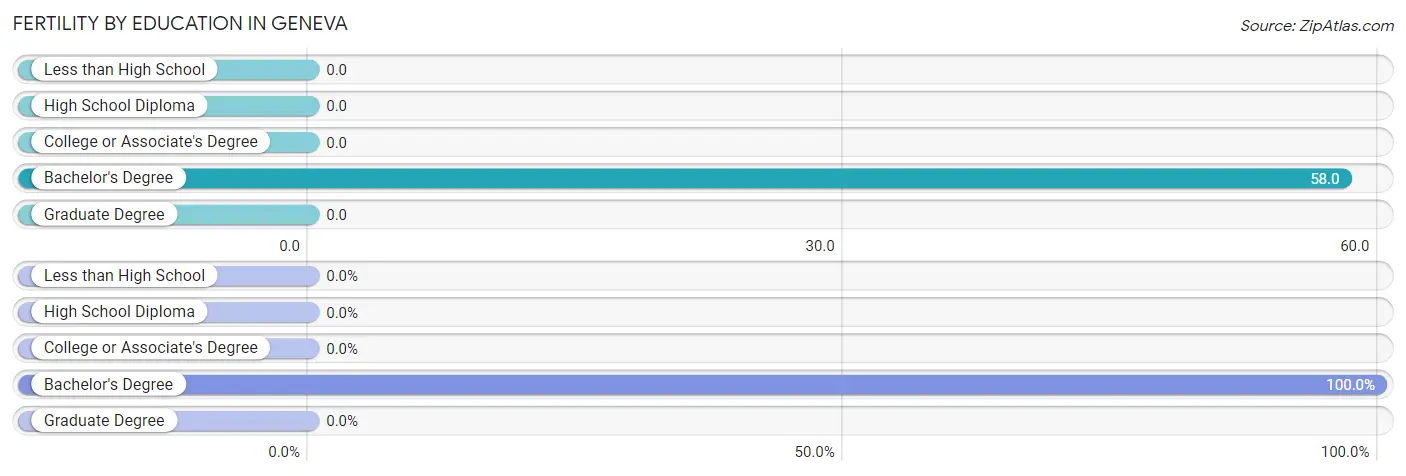
| Educational Attainment | Women with Births | Births / 1,000 Women |
| Less than High School | 0 (0.0%) | 0.0 |
| High School Diploma | 0 (0.0%) | 0.0 |
| College or Associate's Degree | 0 (0.0%) | 0.0 |
| Bachelor's Degree | 16 (100.0%) | 58.0 |
| Graduate Degree | 0 (0.0%) | 0.0 |
| Total | 16 (100.0%) | 26.0 |
Fertility by Education by Marriage Status in Geneva
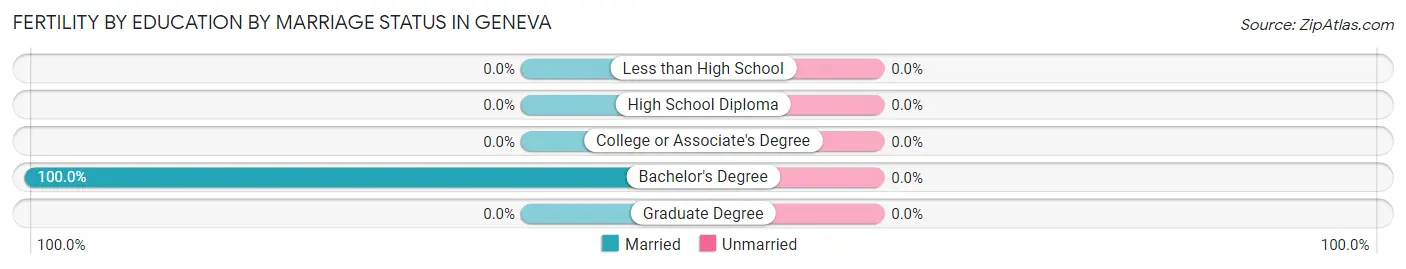
| Educational Attainment | Married | Unmarried |
| Less than High School | 0 (0.0%) | 0 (0.0%) |
| High School Diploma | 0 (0.0%) | 0 (0.0%) |
| College or Associate's Degree | 0 (0.0%) | 0 (0.0%) |
| Bachelor's Degree | 16 (100.0%) | 0 (0.0%) |
| Graduate Degree | 0 (0.0%) | 0 (0.0%) |
| Total | 16 (100.0%) | 0 (0.0%) |
Employment Characteristics in Geneva
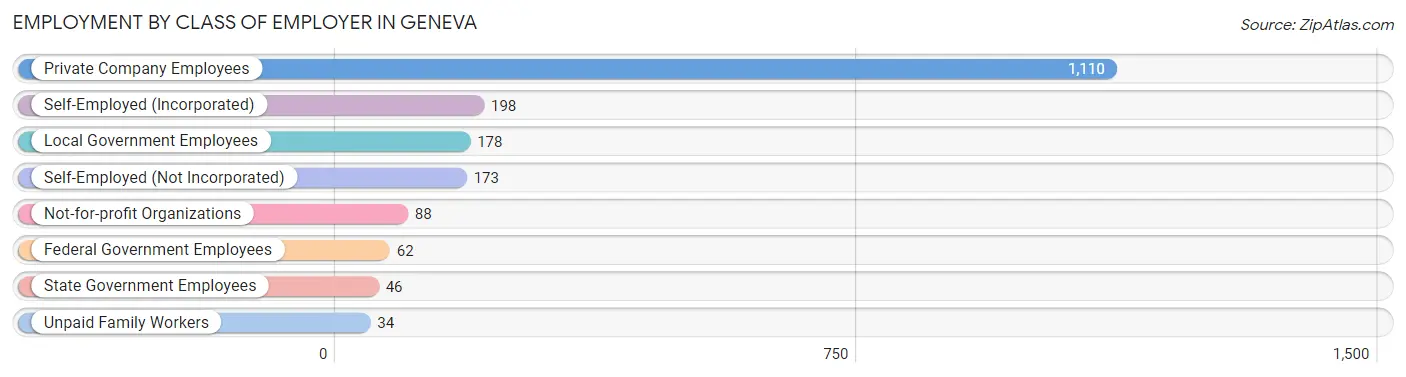
Employment by Class of Employer in Geneva
Among the 1,889 employed individuals in Geneva, private company employees (1,110 | 58.8%), self-employed (incorporated) (198 | 10.5%), and local government employees (178 | 9.4%) make up the most common classes of employment.
| Employer Class | # Employees | % Employees |
| Private Company Employees | 1,110 | 58.8% |
| Self-Employed (Incorporated) | 198 | 10.5% |
| Self-Employed (Not Incorporated) | 173 | 9.2% |
| Not-for-profit Organizations | 88 | 4.7% |
| Local Government Employees | 178 | 9.4% |
| State Government Employees | 46 | 2.4% |
| Federal Government Employees | 62 | 3.3% |
| Unpaid Family Workers | 34 | 1.8% |
| Total | 1,889 | 100.0% |
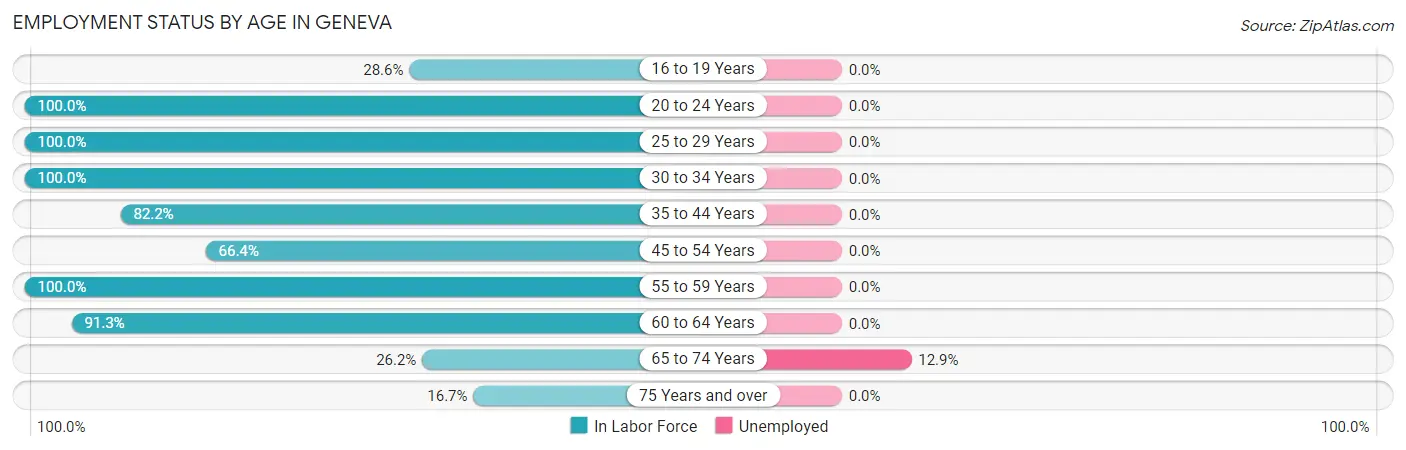
Employment Status by Age in Geneva
According to the labor force statistics for Geneva, out of the total population over 16 years of age (2,672), 71.3% or 1,905 individuals are in the labor force, with 0.9% or 17 of them unemployed. The age group with the highest labor force participation rate is 20 to 24 years, with 100.0% or 290 individuals in the labor force. Within the labor force, the 65 to 74 years age range has the highest percentage of unemployed individuals, with 12.9% or 17 of them being unemployed.
| Age Bracket | In Labor Force | Unemployed |
| 16 to 19 Years | 26 (28.6%) | 0 (0.0%) |
| 20 to 24 Years | 290 (100.0%) | 0 (0.0%) |
| 25 to 29 Years | 124 (100.0%) | 0 (0.0%) |
| 30 to 34 Years | 272 (100.0%) | 0 (0.0%) |
| 35 to 44 Years | 388 (82.2%) | 0 (0.0%) |
| 45 to 54 Years | 261 (66.4%) | 0 (0.0%) |
| 55 to 59 Years | 204 (100.0%) | 0 (0.0%) |
| 60 to 64 Years | 190 (91.3%) | 0 (0.0%) |
| 65 to 74 Years | 132 (26.2%) | 17 (12.9%) |
| 75 Years and over | 19 (16.7%) | 0 (0.0%) |
| Total | 1,905 (71.3%) | 17 (0.9%) |
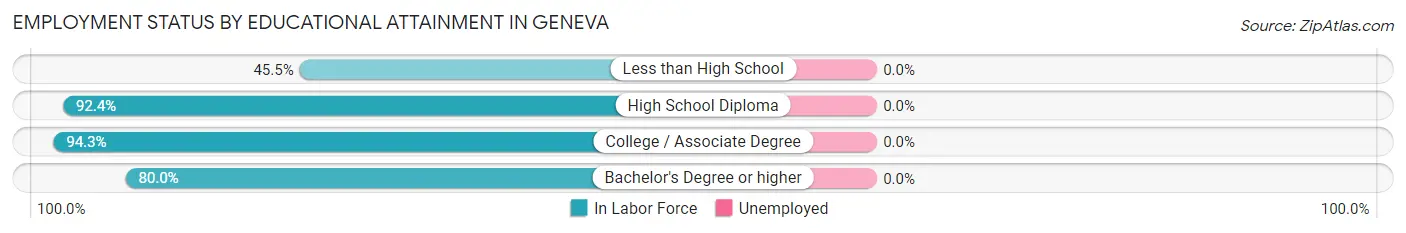
Employment Status by Educational Attainment in Geneva
| Educational Attainment | In Labor Force | Unemployed |
| Less than High School | 15 (45.5%) | 0 (0.0%) |
| High School Diploma | 327 (92.4%) | 0 (0.0%) |
| College / Associate Degree | 449 (94.3%) | 0 (0.0%) |
| Bachelor's Degree or higher | 648 (80.0%) | 0 (0.0%) |
| Total | 1,439 (86.0%) | 0 (0.0%) |
Employment Occupations by Sex in Geneva
Management, Business, Science and Arts Occupations
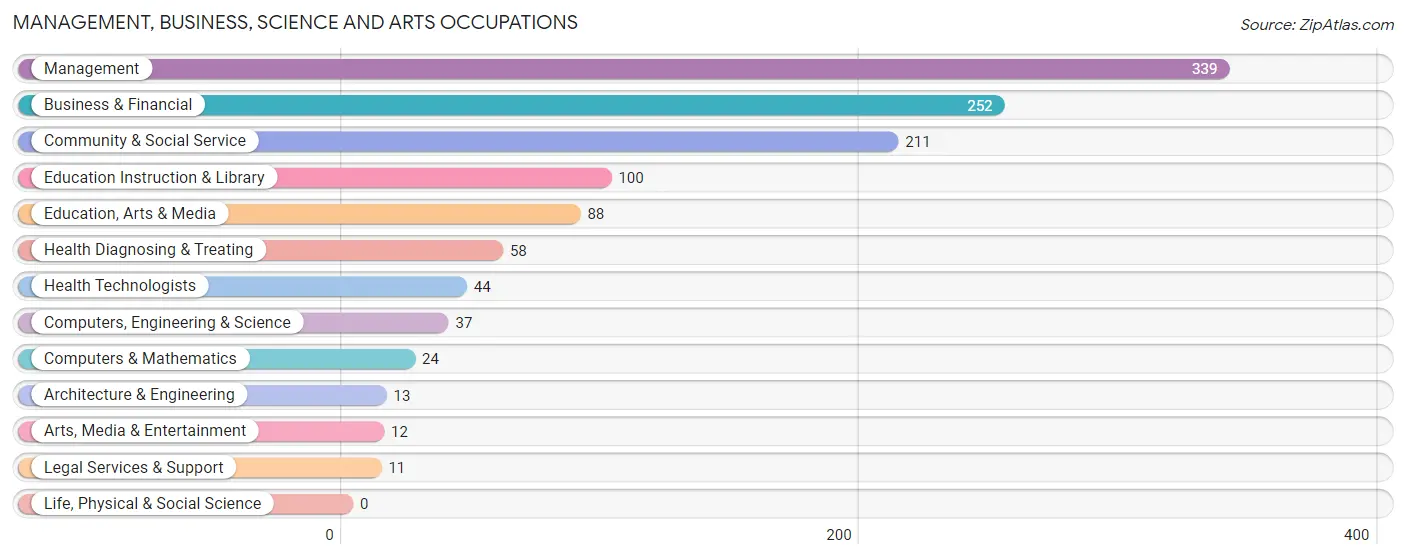
The most common Management, Business, Science and Arts occupations in Geneva are Management (339 | 17.9%), Business & Financial (252 | 13.3%), Community & Social Service (211 | 11.2%), Education Instruction & Library (100 | 5.3%), and Education, Arts & Media (88 | 4.7%).
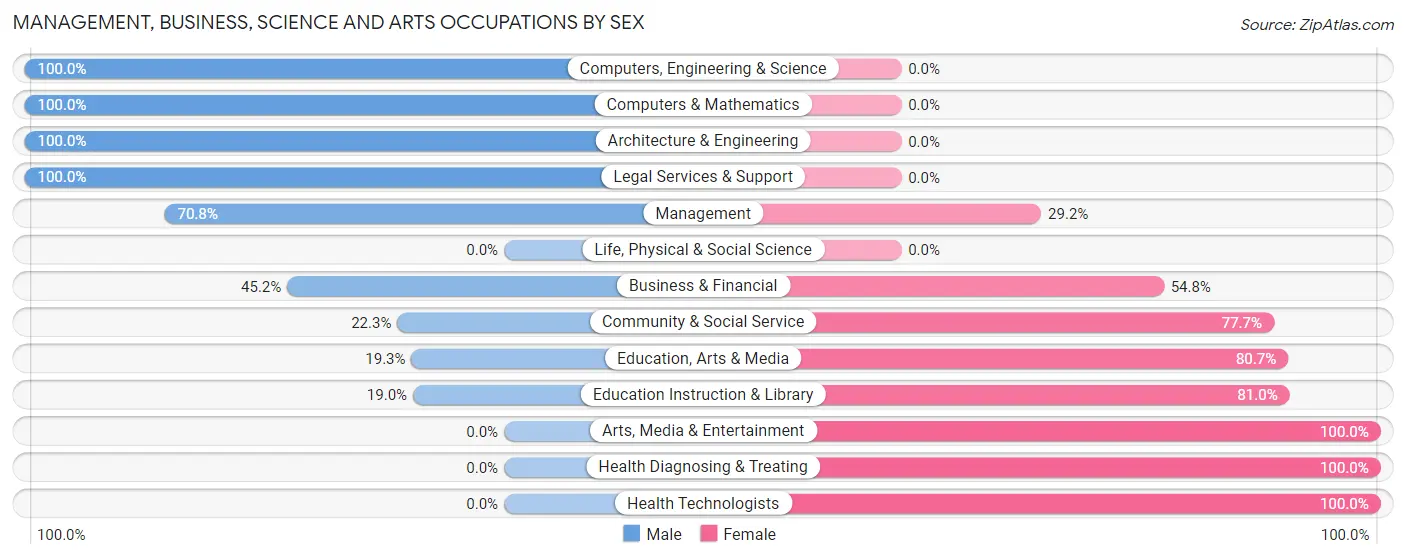
Management, Business, Science and Arts Occupations by Sex
Within the Management, Business, Science and Arts occupations in Geneva, the most male-oriented occupations are Computers, Engineering & Science (100.0%), Computers & Mathematics (100.0%), and Architecture & Engineering (100.0%), while the most female-oriented occupations are Arts, Media & Entertainment (100.0%), Health Diagnosing & Treating (100.0%), and Health Technologists (100.0%).
| Occupation | Male | Female |
| Management | 240 (70.8%) | 99 (29.2%) |
| Business & Financial | 114 (45.2%) | 138 (54.8%) |
| Computers, Engineering & Science | 37 (100.0%) | 0 (0.0%) |
| Computers & Mathematics | 24 (100.0%) | 0 (0.0%) |
| Architecture & Engineering | 13 (100.0%) | 0 (0.0%) |
| Life, Physical & Social Science | 0 (0.0%) | 0 (0.0%) |
| Community & Social Service | 47 (22.3%) | 164 (77.7%) |
| Education, Arts & Media | 17 (19.3%) | 71 (80.7%) |
| Legal Services & Support | 11 (100.0%) | 0 (0.0%) |
| Education Instruction & Library | 19 (19.0%) | 81 (81.0%) |
| Arts, Media & Entertainment | 0 (0.0%) | 12 (100.0%) |
| Health Diagnosing & Treating | 0 (0.0%) | 58 (100.0%) |
| Health Technologists | 0 (0.0%) | 44 (100.0%) |
| Total (Category) | 438 (48.8%) | 459 (51.2%) |
| Total (Overall) | 1,102 (58.3%) | 787 (41.7%) |
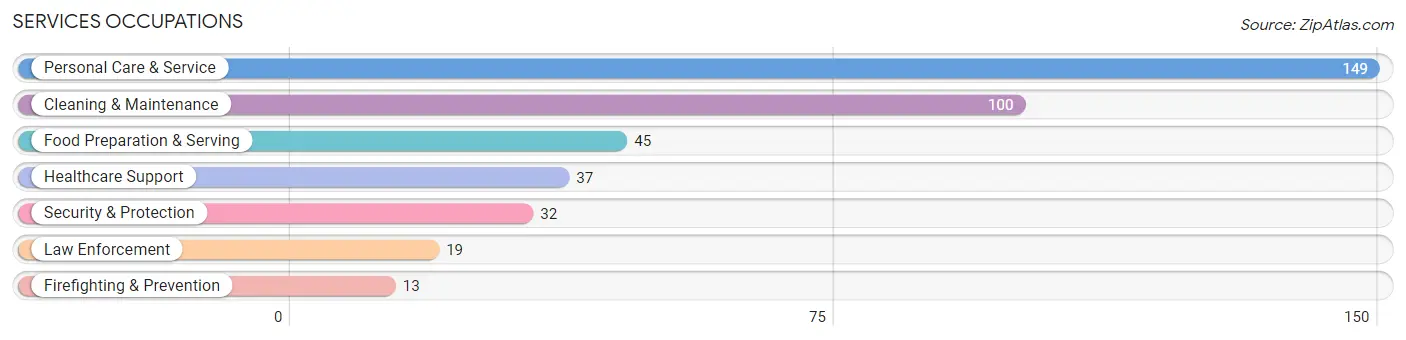
Services Occupations
The most common Services occupations in Geneva are Personal Care & Service (149 | 7.9%), Cleaning & Maintenance (100 | 5.3%), Food Preparation & Serving (45 | 2.4%), Healthcare Support (37 | 2.0%), and Security & Protection (32 | 1.7%).
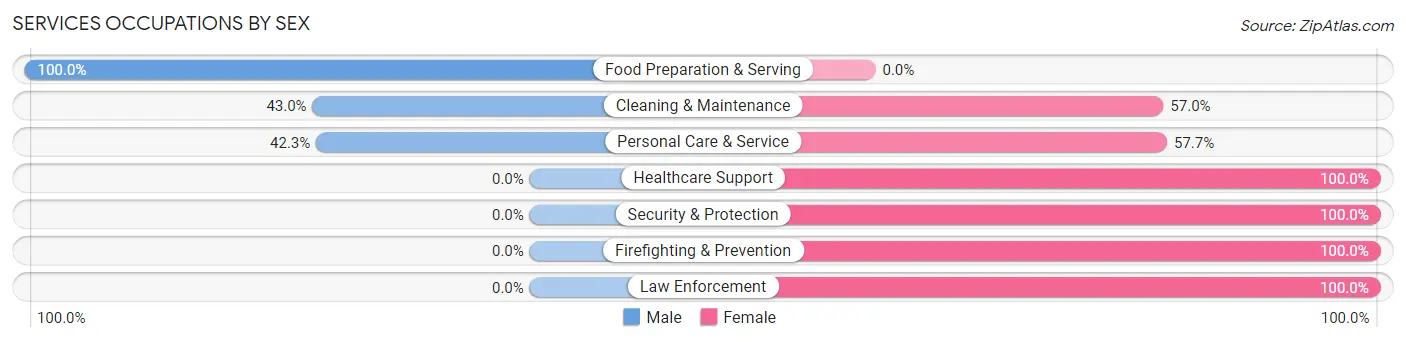
Services Occupations by Sex
Within the Services occupations in Geneva, the most male-oriented occupations are Food Preparation & Serving (100.0%), Cleaning & Maintenance (43.0%), and Personal Care & Service (42.3%), while the most female-oriented occupations are Healthcare Support (100.0%), Security & Protection (100.0%), and Firefighting & Prevention (100.0%).
| Occupation | Male | Female |
| Healthcare Support | 0 (0.0%) | 37 (100.0%) |
| Security & Protection | 0 (0.0%) | 32 (100.0%) |
| Firefighting & Prevention | 0 (0.0%) | 13 (100.0%) |
| Law Enforcement | 0 (0.0%) | 19 (100.0%) |
| Food Preparation & Serving | 45 (100.0%) | 0 (0.0%) |
| Cleaning & Maintenance | 43 (43.0%) | 57 (57.0%) |
| Personal Care & Service | 63 (42.3%) | 86 (57.7%) |
| Total (Category) | 151 (41.6%) | 212 (58.4%) |
| Total (Overall) | 1,102 (58.3%) | 787 (41.7%) |
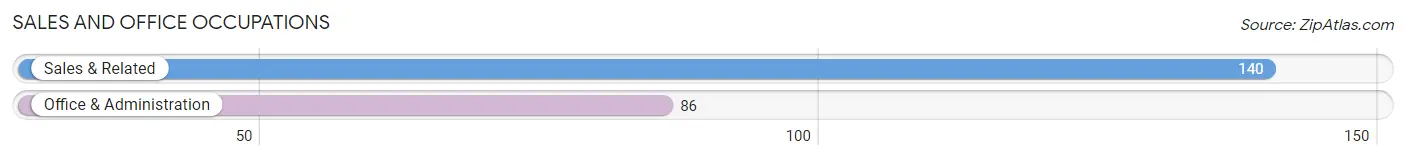
Sales and Office Occupations
The most common Sales and Office occupations in Geneva are Sales & Related (140 | 7.4%), and Office & Administration (86 | 4.5%).
Sales and Office Occupations by Sex
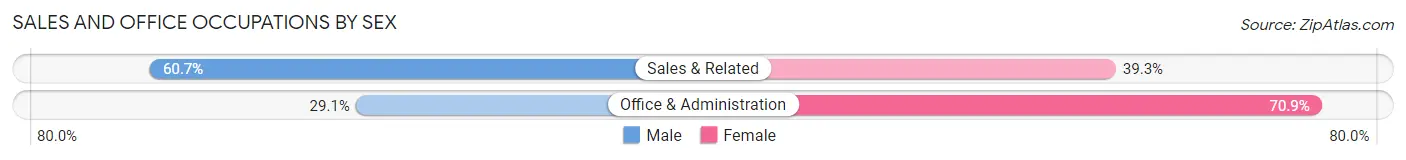
| Occupation | Male | Female |
| Sales & Related | 85 (60.7%) | 55 (39.3%) |
| Office & Administration | 25 (29.1%) | 61 (70.9%) |
| Total (Category) | 110 (48.7%) | 116 (51.3%) |
| Total (Overall) | 1,102 (58.3%) | 787 (41.7%) |
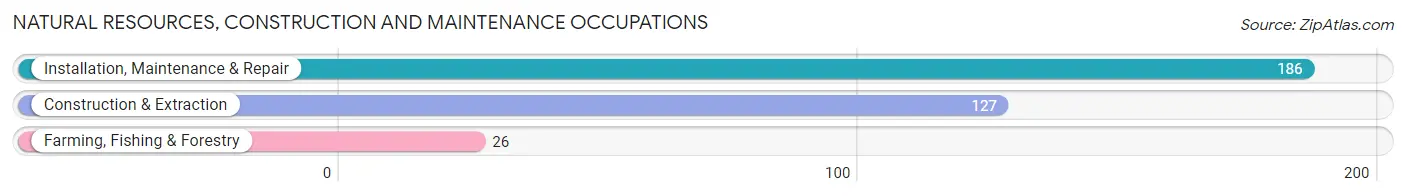
Natural Resources, Construction and Maintenance Occupations
The most common Natural Resources, Construction and Maintenance occupations in Geneva are Installation, Maintenance & Repair (186 | 9.9%), Construction & Extraction (127 | 6.7%), and Farming, Fishing & Forestry (26 | 1.4%).
Natural Resources, Construction and Maintenance Occupations by Sex
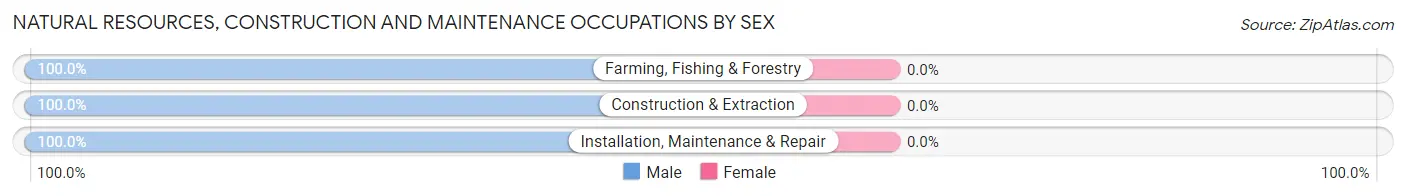
| Occupation | Male | Female |
| Farming, Fishing & Forestry | 26 (100.0%) | 0 (0.0%) |
| Construction & Extraction | 127 (100.0%) | 0 (0.0%) |
| Installation, Maintenance & Repair | 186 (100.0%) | 0 (0.0%) |
| Total (Category) | 339 (100.0%) | 0 (0.0%) |
| Total (Overall) | 1,102 (58.3%) | 787 (41.7%) |
Production, Transportation and Moving Occupations
The most common Production, Transportation and Moving occupations in Geneva are Material Moving (39 | 2.1%), and Production (25 | 1.3%).
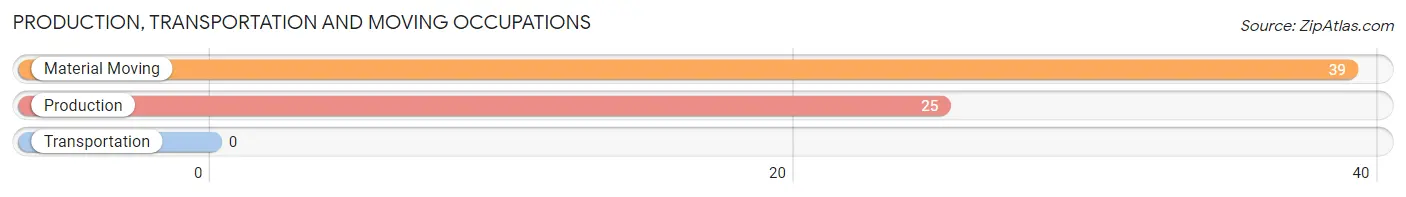
Production, Transportation and Moving Occupations by Sex
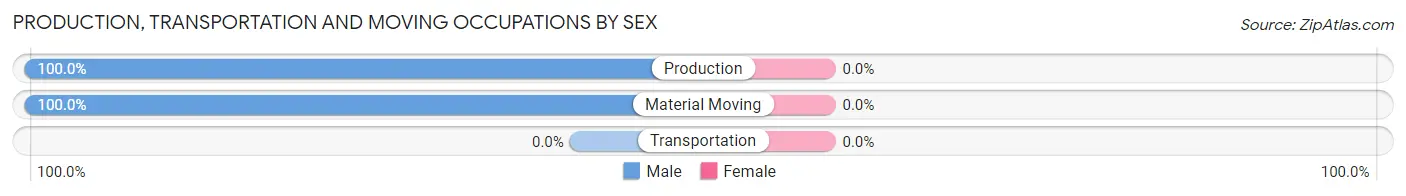
| Occupation | Male | Female |
| Production | 25 (100.0%) | 0 (0.0%) |
| Transportation | 0 (0.0%) | 0 (0.0%) |
| Material Moving | 39 (100.0%) | 0 (0.0%) |
| Total (Category) | 64 (100.0%) | 0 (0.0%) |
| Total (Overall) | 1,102 (58.3%) | 787 (41.7%) |
Employment Industries by Sex in Geneva
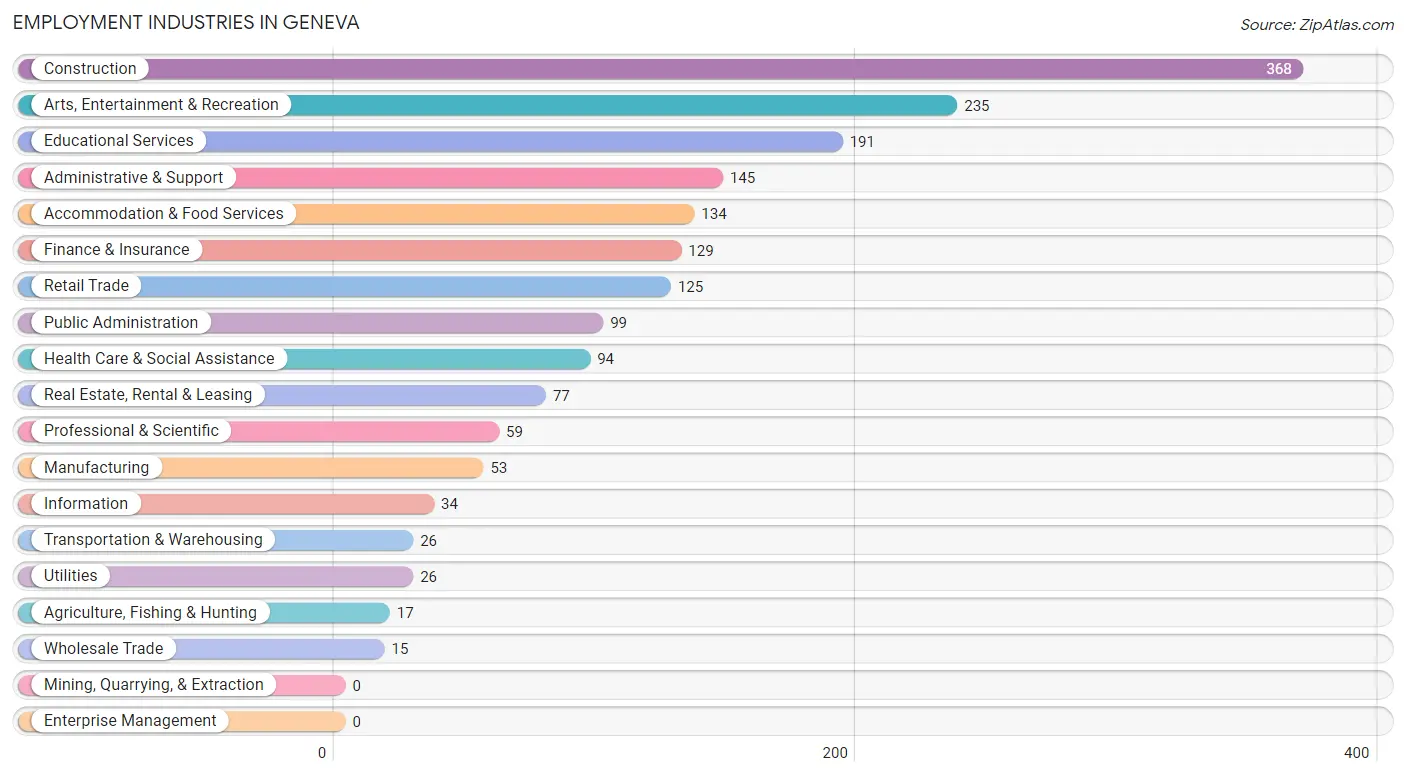
Employment Industries in Geneva
The major employment industries in Geneva include Construction (368 | 19.5%), Arts, Entertainment & Recreation (235 | 12.4%), Educational Services (191 | 10.1%), Administrative & Support (145 | 7.7%), and Accommodation & Food Services (134 | 7.1%).
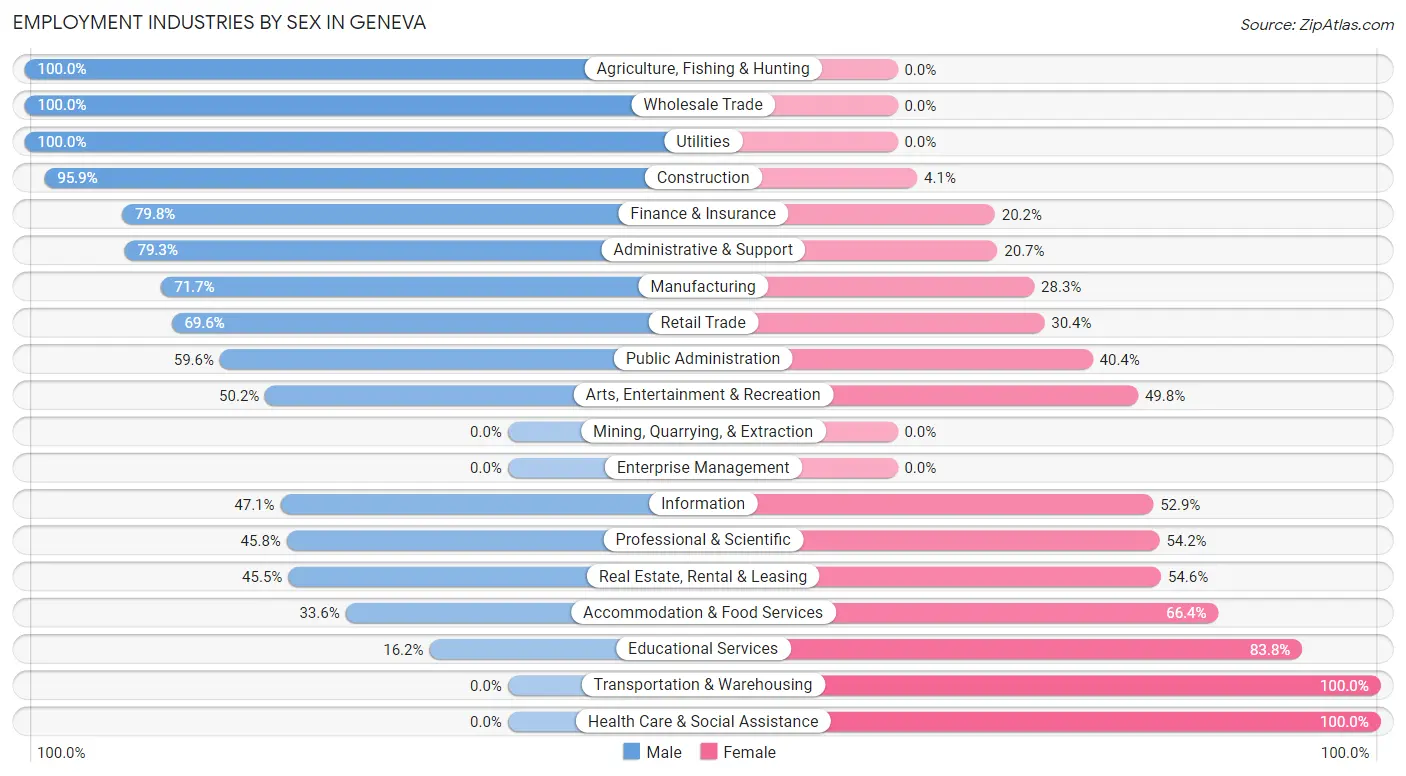
Employment Industries by Sex in Geneva
The Geneva industries that see more men than women are Agriculture, Fishing & Hunting (100.0%), Wholesale Trade (100.0%), and Utilities (100.0%), whereas the industries that tend to have a higher number of women are Transportation & Warehousing (100.0%), Health Care & Social Assistance (100.0%), and Educational Services (83.8%).
| Industry | Male | Female |
| Agriculture, Fishing & Hunting | 17 (100.0%) | 0 (0.0%) |
| Mining, Quarrying, & Extraction | 0 (0.0%) | 0 (0.0%) |
| Construction | 353 (95.9%) | 15 (4.1%) |
| Manufacturing | 38 (71.7%) | 15 (28.3%) |
| Wholesale Trade | 15 (100.0%) | 0 (0.0%) |
| Retail Trade | 87 (69.6%) | 38 (30.4%) |
| Transportation & Warehousing | 0 (0.0%) | 26 (100.0%) |
| Utilities | 26 (100.0%) | 0 (0.0%) |
| Information | 16 (47.1%) | 18 (52.9%) |
| Finance & Insurance | 103 (79.8%) | 26 (20.2%) |
| Real Estate, Rental & Leasing | 35 (45.5%) | 42 (54.5%) |
| Professional & Scientific | 27 (45.8%) | 32 (54.2%) |
| Enterprise Management | 0 (0.0%) | 0 (0.0%) |
| Administrative & Support | 115 (79.3%) | 30 (20.7%) |
| Educational Services | 31 (16.2%) | 160 (83.8%) |
| Health Care & Social Assistance | 0 (0.0%) | 94 (100.0%) |
| Arts, Entertainment & Recreation | 118 (50.2%) | 117 (49.8%) |
| Accommodation & Food Services | 45 (33.6%) | 89 (66.4%) |
| Public Administration | 59 (59.6%) | 40 (40.4%) |
| Total | 1,102 (58.3%) | 787 (41.7%) |
Education in Geneva
School Enrollment in Geneva
The most common levels of schooling among the 909 students in Geneva are elementary school (193 | 21.2%), college / undergraduate (180 | 19.8%), and middle school (156 | 17.2%).
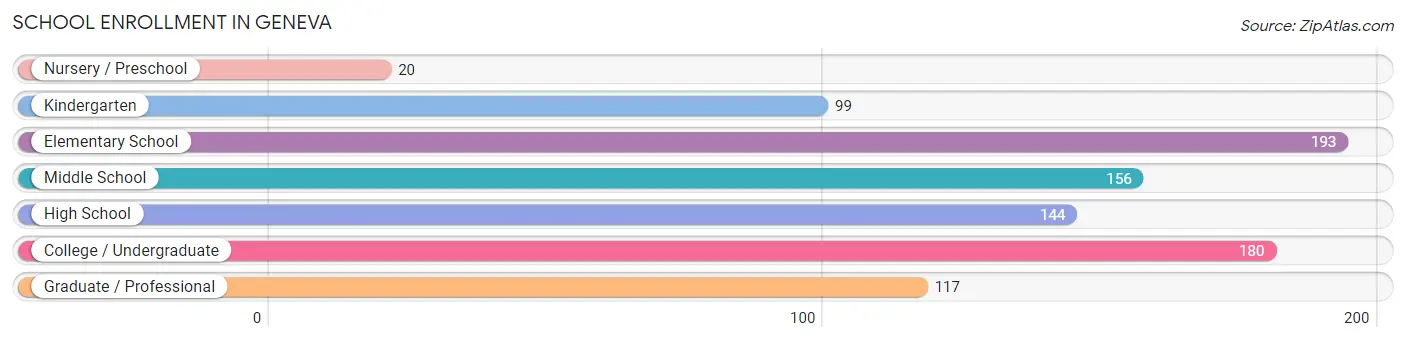
| School Level | # Students | % Students |
| Nursery / Preschool | 20 | 2.2% |
| Kindergarten | 99 | 10.9% |
| Elementary School | 193 | 21.2% |
| Middle School | 156 | 17.2% |
| High School | 144 | 15.8% |
| College / Undergraduate | 180 | 19.8% |
| Graduate / Professional | 117 | 12.9% |
| Total | 909 | 100.0% |
School Enrollment by Age by Funding Source in Geneva
Out of a total of 909 students who are enrolled in schools in Geneva, 144 (15.8%) attend a private institution, while the remaining 765 (84.2%) are enrolled in public schools. The age group of 3 to 4 year olds has the highest likelihood of being enrolled in private schools, with 20 (100.0% in the age bracket) enrolled. Conversely, the age group of 15 to 17 year olds has the lowest likelihood of being enrolled in a private school, with 105 (100.0% in the age bracket) attending a public institution.
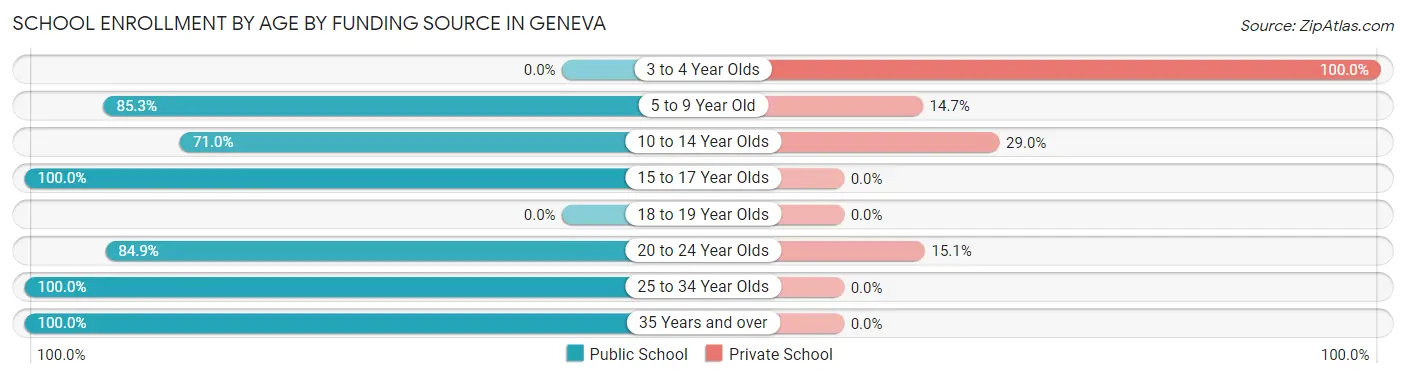
| Age Bracket | Public School | Private School |
| 3 to 4 Year Olds | 0 (0.0%) | 20 (100.0%) |
| 5 to 9 Year Old | 203 (85.3%) | 35 (14.7%) |
| 10 to 14 Year Olds | 157 (71.0%) | 64 (29.0%) |
| 15 to 17 Year Olds | 105 (100.0%) | 0 (0.0%) |
| 18 to 19 Year Olds | 0 (0.0%) | 0 (0.0%) |
| 20 to 24 Year Olds | 141 (84.9%) | 25 (15.1%) |
| 25 to 34 Year Olds | 103 (100.0%) | 0 (0.0%) |
| 35 Years and over | 56 (100.0%) | 0 (0.0%) |
| Total | 765 (84.2%) | 144 (15.8%) |
Educational Attainment by Field of Study in Geneva
Business (319 | 29.6%), education (162 | 15.1%), visual & performing arts (140 | 13.0%), communications (109 | 10.1%), and arts & humanities (68 | 6.3%) are the most common fields of study among 1,076 individuals in Geneva who have obtained a bachelor's degree or higher.
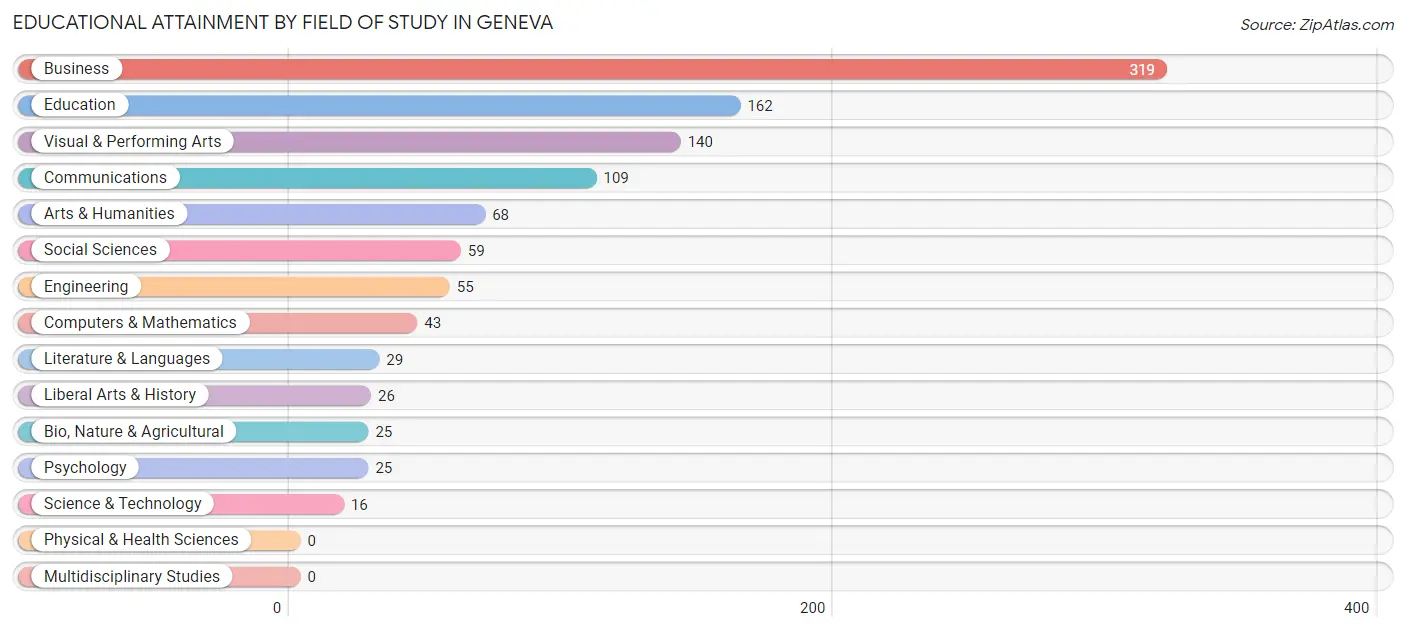
| Field of Study | # Graduates | % Graduates |
| Computers & Mathematics | 43 | 4.0% |
| Bio, Nature & Agricultural | 25 | 2.3% |
| Physical & Health Sciences | 0 | 0.0% |
| Psychology | 25 | 2.3% |
| Social Sciences | 59 | 5.5% |
| Engineering | 55 | 5.1% |
| Multidisciplinary Studies | 0 | 0.0% |
| Science & Technology | 16 | 1.5% |
| Business | 319 | 29.6% |
| Education | 162 | 15.1% |
| Literature & Languages | 29 | 2.7% |
| Liberal Arts & History | 26 | 2.4% |
| Visual & Performing Arts | 140 | 13.0% |
| Communications | 109 | 10.1% |
| Arts & Humanities | 68 | 6.3% |
| Total | 1,076 | 100.0% |
Transportation & Commute in Geneva
Vehicle Availability by Sex in Geneva
The most prevalent vehicle ownership categories in Geneva are males with 3 vehicles (518, accounting for 47.0%) and females with 3 vehicles (291, making up 65.8%).
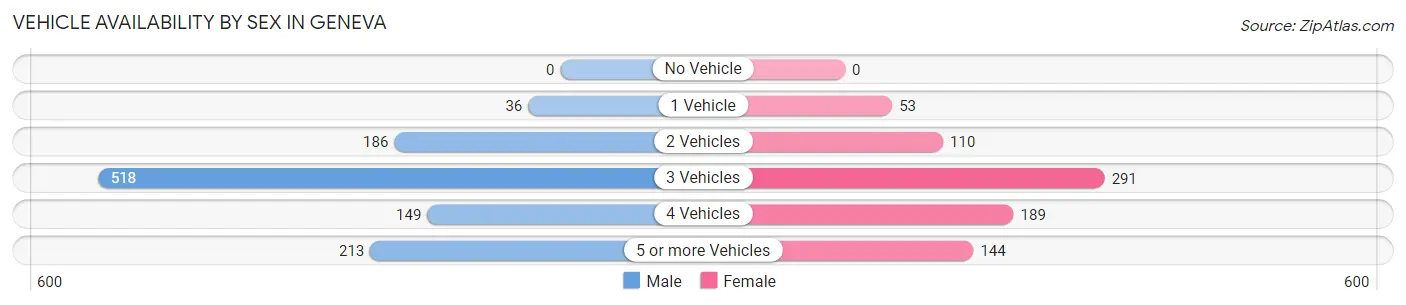
| Vehicles Available | Male | Female |
| No Vehicle | 0 (0.0%) | 0 (0.0%) |
| 1 Vehicle | 36 (3.3%) | 53 (6.7%) |
| 2 Vehicles | 186 (16.9%) | 110 (14.0%) |
| 3 Vehicles | 518 (47.0%) | 291 (37.0%) |
| 4 Vehicles | 149 (13.5%) | 189 (24.0%) |
| 5 or more Vehicles | 213 (19.3%) | 144 (18.3%) |
| Total | 1,102 (100.0%) | 787 (100.0%) |
Commute Time in Geneva
The most frequently occuring commute durations in Geneva are 45 to 59 minutes (378 commuters, 27.0%), 90 or more minutes (184 commuters, 13.1%), and 25 to 29 minutes (164 commuters, 11.7%).
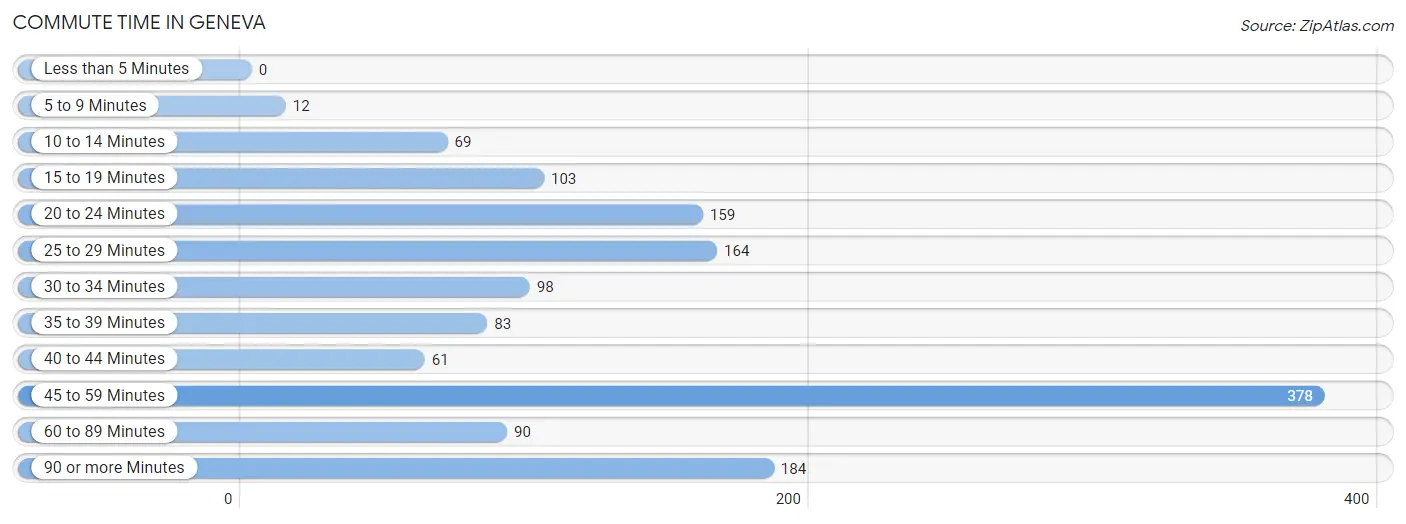
| Commute Time | # Commuters | % Commuters |
| Less than 5 Minutes | 0 | 0.0% |
| 5 to 9 Minutes | 12 | 0.9% |
| 10 to 14 Minutes | 69 | 4.9% |
| 15 to 19 Minutes | 103 | 7.3% |
| 20 to 24 Minutes | 159 | 11.4% |
| 25 to 29 Minutes | 164 | 11.7% |
| 30 to 34 Minutes | 98 | 7.0% |
| 35 to 39 Minutes | 83 | 5.9% |
| 40 to 44 Minutes | 61 | 4.3% |
| 45 to 59 Minutes | 378 | 27.0% |
| 60 to 89 Minutes | 90 | 6.4% |
| 90 or more Minutes | 184 | 13.1% |
Commute Time by Sex in Geneva
The most common commute times in Geneva are 45 to 59 minutes (194 commuters, 23.5%) for males and 45 to 59 minutes (184 commuters, 31.9%) for females.
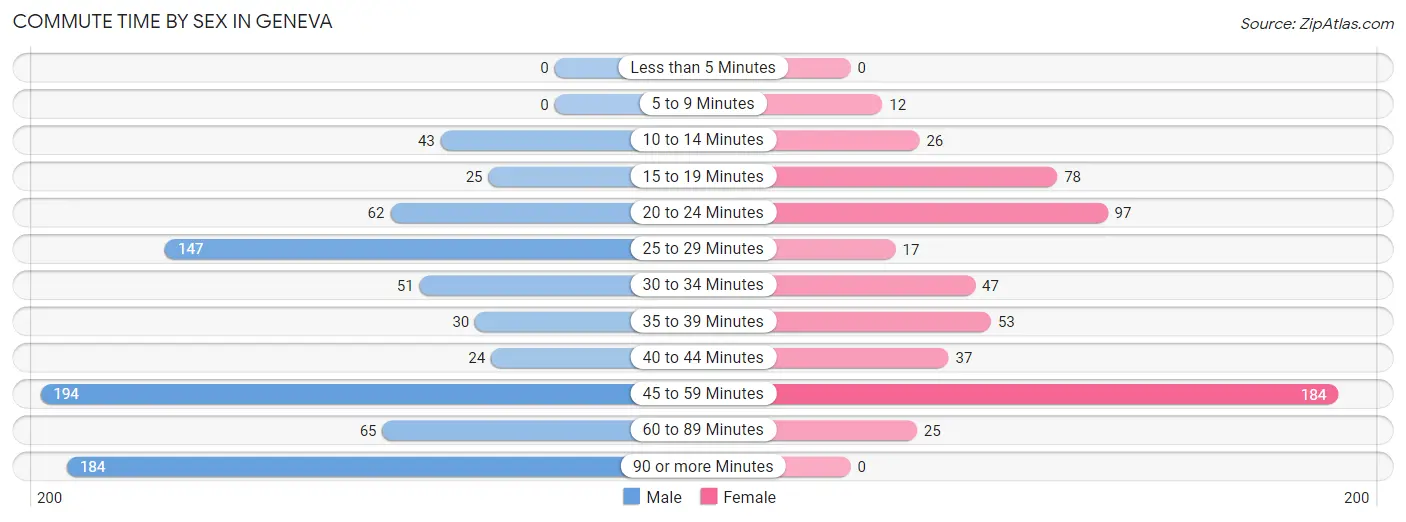
| Commute Time | Male | Female |
| Less than 5 Minutes | 0 (0.0%) | 0 (0.0%) |
| 5 to 9 Minutes | 0 (0.0%) | 12 (2.1%) |
| 10 to 14 Minutes | 43 (5.2%) | 26 (4.5%) |
| 15 to 19 Minutes | 25 (3.0%) | 78 (13.5%) |
| 20 to 24 Minutes | 62 (7.5%) | 97 (16.8%) |
| 25 to 29 Minutes | 147 (17.8%) | 17 (2.9%) |
| 30 to 34 Minutes | 51 (6.2%) | 47 (8.2%) |
| 35 to 39 Minutes | 30 (3.6%) | 53 (9.2%) |
| 40 to 44 Minutes | 24 (2.9%) | 37 (6.4%) |
| 45 to 59 Minutes | 194 (23.5%) | 184 (31.9%) |
| 60 to 89 Minutes | 65 (7.9%) | 25 (4.3%) |
| 90 or more Minutes | 184 (22.3%) | 0 (0.0%) |
Time of Departure to Work by Sex in Geneva
The most frequent times of departure to work in Geneva are 12:00 AM to 4:59 AM (209, 25.3%) for males and 8:00 AM to 8:29 AM (192, 33.3%) for females.
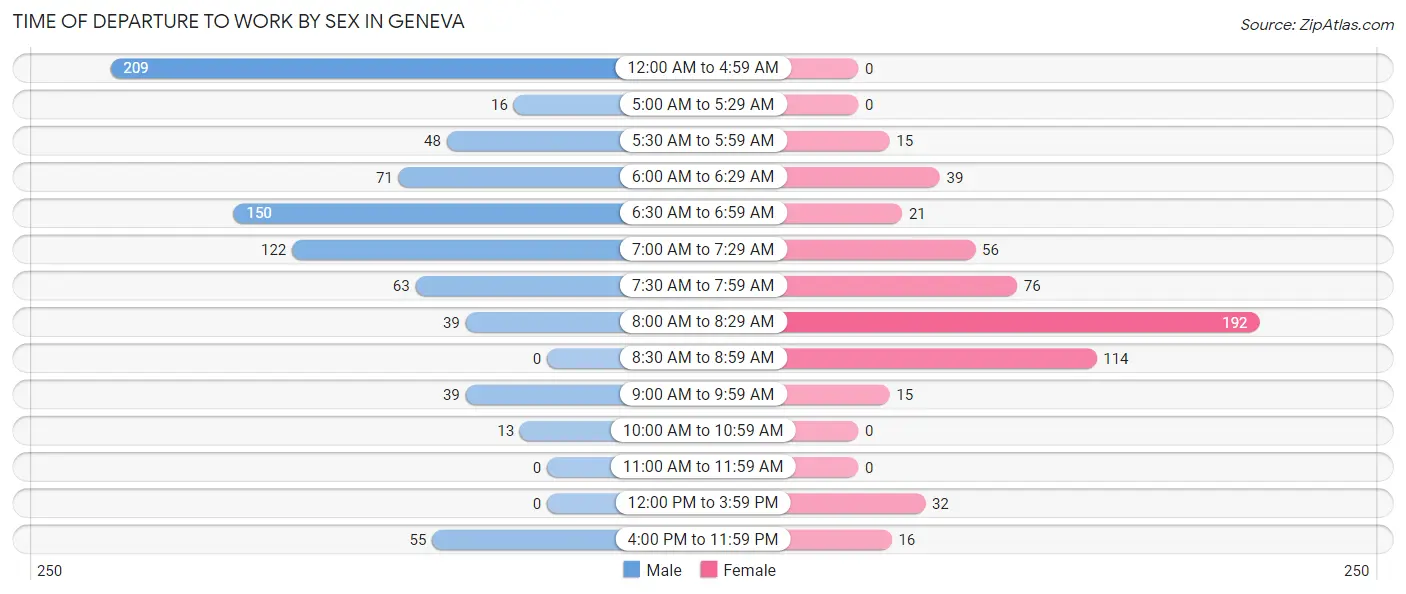
| Time of Departure | Male | Female |
| 12:00 AM to 4:59 AM | 209 (25.3%) | 0 (0.0%) |
| 5:00 AM to 5:29 AM | 16 (1.9%) | 0 (0.0%) |
| 5:30 AM to 5:59 AM | 48 (5.8%) | 15 (2.6%) |
| 6:00 AM to 6:29 AM | 71 (8.6%) | 39 (6.8%) |
| 6:30 AM to 6:59 AM | 150 (18.2%) | 21 (3.6%) |
| 7:00 AM to 7:29 AM | 122 (14.8%) | 56 (9.7%) |
| 7:30 AM to 7:59 AM | 63 (7.6%) | 76 (13.2%) |
| 8:00 AM to 8:29 AM | 39 (4.7%) | 192 (33.3%) |
| 8:30 AM to 8:59 AM | 0 (0.0%) | 114 (19.8%) |
| 9:00 AM to 9:59 AM | 39 (4.7%) | 15 (2.6%) |
| 10:00 AM to 10:59 AM | 13 (1.6%) | 0 (0.0%) |
| 11:00 AM to 11:59 AM | 0 (0.0%) | 0 (0.0%) |
| 12:00 PM to 3:59 PM | 0 (0.0%) | 32 (5.6%) |
| 4:00 PM to 11:59 PM | 55 (6.7%) | 16 (2.8%) |
| Total | 825 (100.0%) | 576 (100.0%) |
Housing Occupancy in Geneva
Occupancy by Ownership in Geneva
Of the total 1,072 dwellings in Geneva, owner-occupied units account for 1,031 (96.2%), while renter-occupied units make up 41 (3.8%).
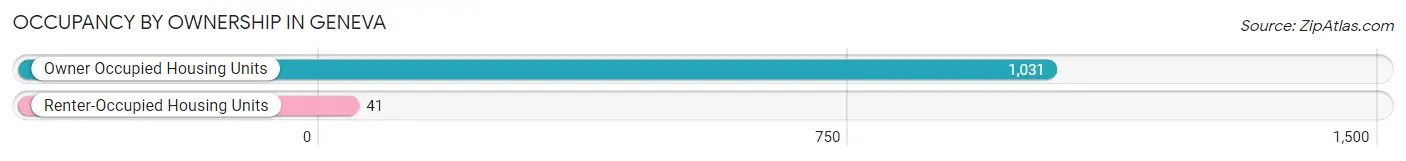
| Occupancy | # Housing Units | % Housing Units |
| Owner Occupied Housing Units | 1,031 | 96.2% |
| Renter-Occupied Housing Units | 41 | 3.8% |
| Total Occupied Housing Units | 1,072 | 100.0% |
Occupancy by Household Size in Geneva
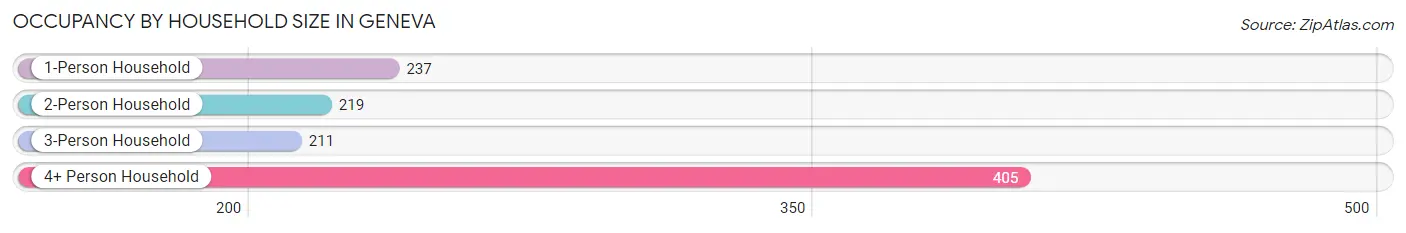
| Household Size | # Housing Units | % Housing Units |
| 1-Person Household | 237 | 22.1% |
| 2-Person Household | 219 | 20.4% |
| 3-Person Household | 211 | 19.7% |
| 4+ Person Household | 405 | 37.8% |
| Total Housing Units | 1,072 | 100.0% |
Occupancy by Ownership by Household Size in Geneva
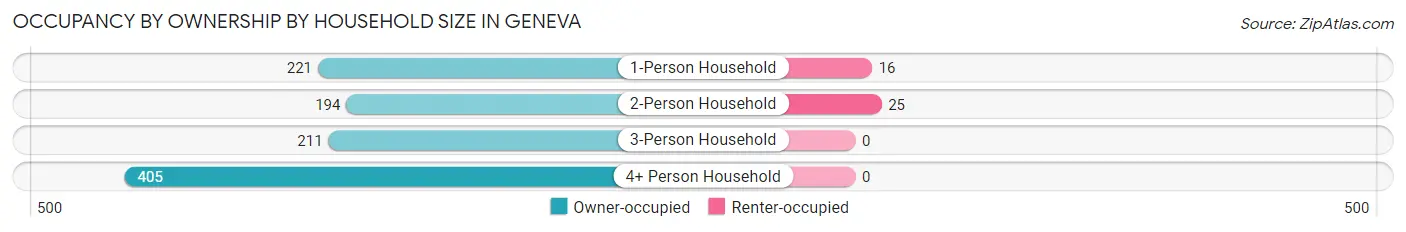
| Household Size | Owner-occupied | Renter-occupied |
| 1-Person Household | 221 (93.2%) | 16 (6.8%) |
| 2-Person Household | 194 (88.6%) | 25 (11.4%) |
| 3-Person Household | 211 (100.0%) | 0 (0.0%) |
| 4+ Person Household | 405 (100.0%) | 0 (0.0%) |
| Total Housing Units | 1,031 (96.2%) | 41 (3.8%) |
Occupancy by Educational Attainment in Geneva
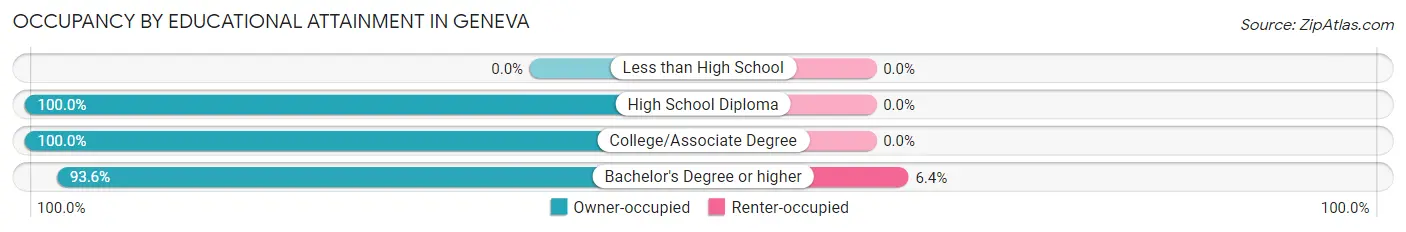
| Household Size | Owner-occupied | Renter-occupied |
| Less than High School | 0 (0.0%) | 0 (0.0%) |
| High School Diploma | 159 (100.0%) | 0 (0.0%) |
| College/Associate Degree | 272 (100.0%) | 0 (0.0%) |
| Bachelor's Degree or higher | 600 (93.6%) | 41 (6.4%) |
Occupancy by Age of Householder in Geneva
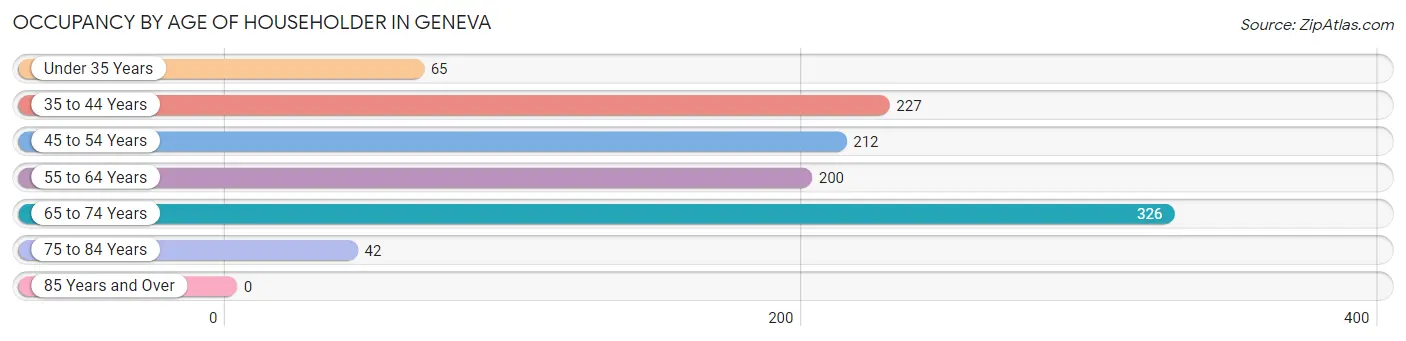
| Age Bracket | # Households | % Households |
| Under 35 Years | 65 | 6.1% |
| 35 to 44 Years | 227 | 21.2% |
| 45 to 54 Years | 212 | 19.8% |
| 55 to 64 Years | 200 | 18.7% |
| 65 to 74 Years | 326 | 30.4% |
| 75 to 84 Years | 42 | 3.9% |
| 85 Years and Over | 0 | 0.0% |
| Total | 1,072 | 100.0% |
Housing Finances in Geneva
Median Income by Occupancy in Geneva
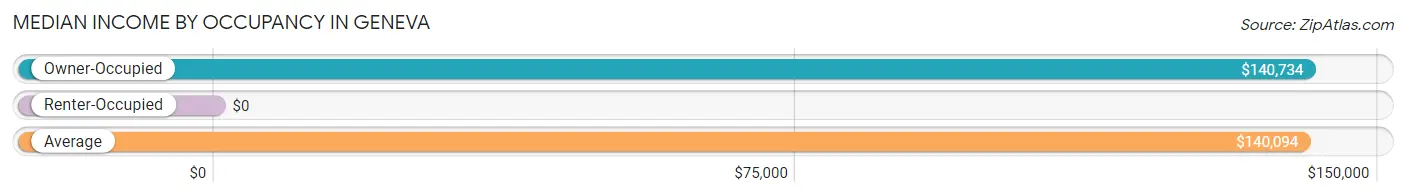
| Occupancy Type | # Households | Median Income |
| Owner-Occupied | 1,031 (96.2%) | $140,734 |
| Renter-Occupied | 41 (3.8%) | $0 |
| Average | 1,072 (100.0%) | $140,094 |
Occupancy by Householder Income Bracket in Geneva
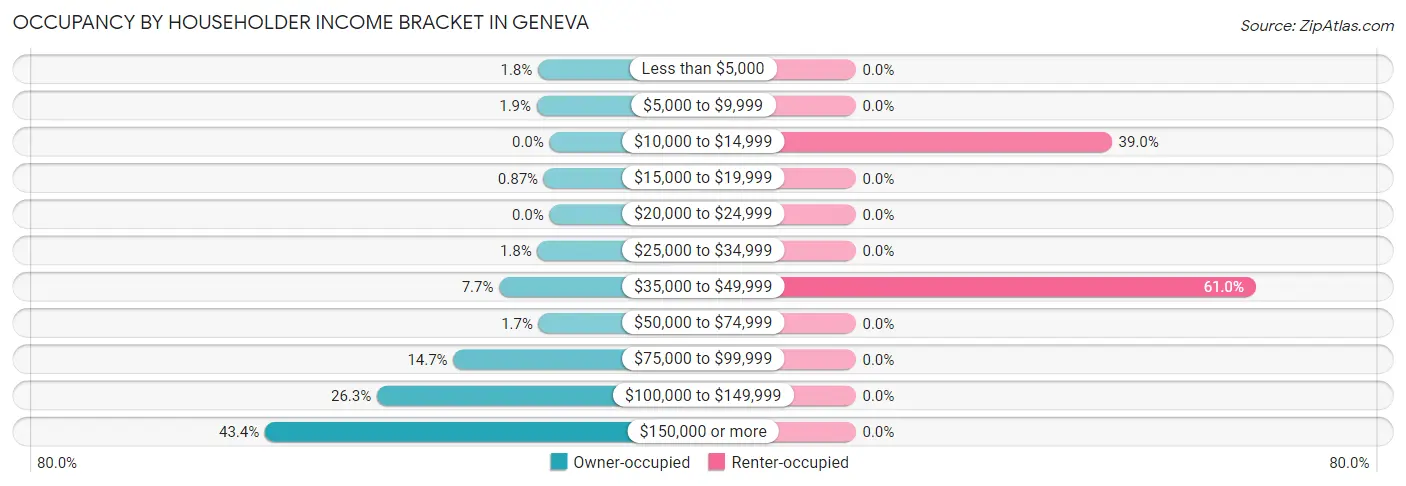
| Income Bracket | Owner-occupied | Renter-occupied |
| Less than $5,000 | 18 (1.8%) | 0 (0.0%) |
| $5,000 to $9,999 | 20 (1.9%) | 0 (0.0%) |
| $10,000 to $14,999 | 0 (0.0%) | 16 (39.0%) |
| $15,000 to $19,999 | 9 (0.9%) | 0 (0.0%) |
| $20,000 to $24,999 | 0 (0.0%) | 0 (0.0%) |
| $25,000 to $34,999 | 19 (1.8%) | 0 (0.0%) |
| $35,000 to $49,999 | 79 (7.7%) | 25 (61.0%) |
| $50,000 to $74,999 | 17 (1.7%) | 0 (0.0%) |
| $75,000 to $99,999 | 151 (14.6%) | 0 (0.0%) |
| $100,000 to $149,999 | 271 (26.3%) | 0 (0.0%) |
| $150,000 or more | 447 (43.4%) | 0 (0.0%) |
| Total | 1,031 (100.0%) | 41 (100.0%) |
Monthly Housing Cost Tiers in Geneva
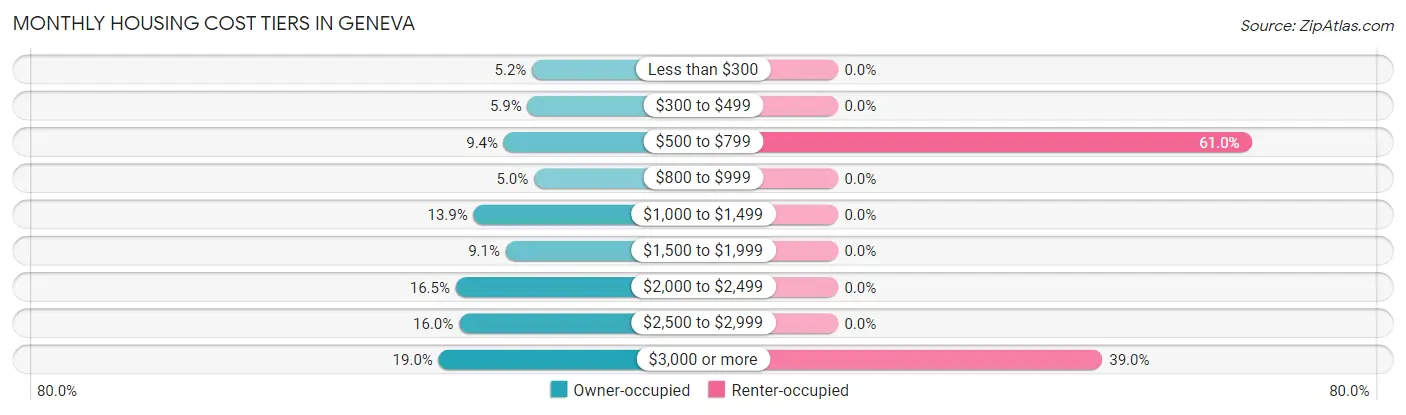
| Monthly Cost | Owner-occupied | Renter-occupied |
| Less than $300 | 54 (5.2%) | 0 (0.0%) |
| $300 to $499 | 61 (5.9%) | 0 (0.0%) |
| $500 to $799 | 97 (9.4%) | 25 (61.0%) |
| $800 to $999 | 51 (5.0%) | 0 (0.0%) |
| $1,000 to $1,499 | 143 (13.9%) | 0 (0.0%) |
| $1,500 to $1,999 | 94 (9.1%) | 0 (0.0%) |
| $2,000 to $2,499 | 170 (16.5%) | 0 (0.0%) |
| $2,500 to $2,999 | 165 (16.0%) | 0 (0.0%) |
| $3,000 or more | 196 (19.0%) | 16 (39.0%) |
| Total | 1,031 (100.0%) | 41 (100.0%) |
Physical Housing Characteristics in Geneva
Housing Structures in Geneva
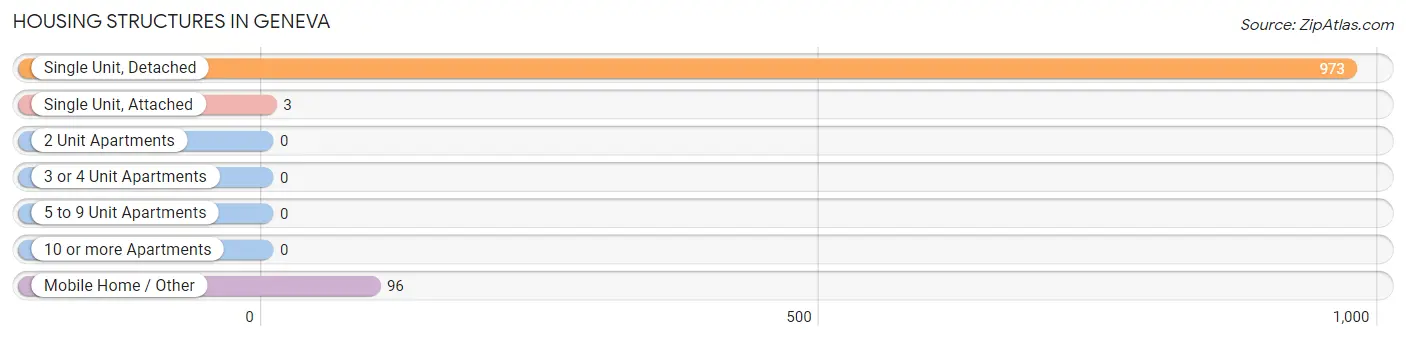
| Structure Type | # Housing Units | % Housing Units |
| Single Unit, Detached | 973 | 90.8% |
| Single Unit, Attached | 3 | 0.3% |
| 2 Unit Apartments | 0 | 0.0% |
| 3 or 4 Unit Apartments | 0 | 0.0% |
| 5 to 9 Unit Apartments | 0 | 0.0% |
| 10 or more Apartments | 0 | 0.0% |
| Mobile Home / Other | 96 | 9.0% |
| Total | 1,072 | 100.0% |
Housing Structures by Occupancy in Geneva
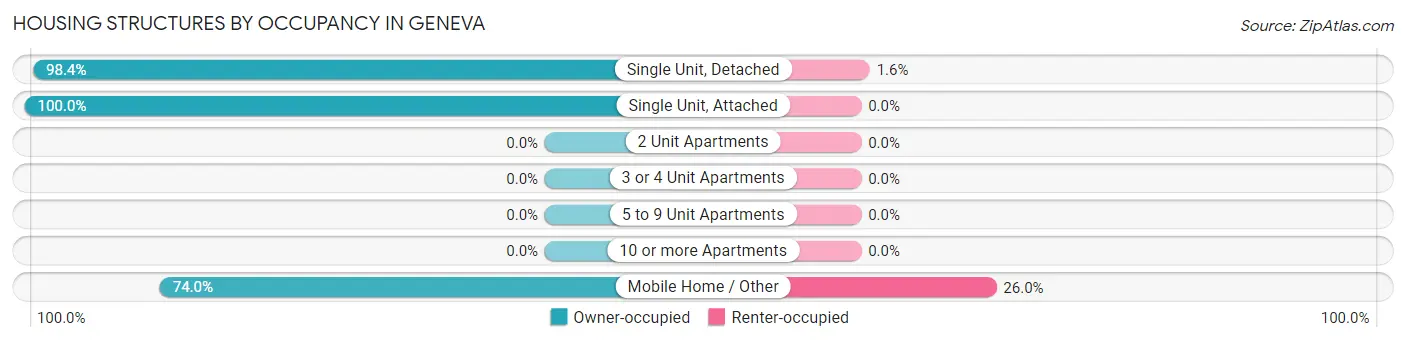
| Structure Type | Owner-occupied | Renter-occupied |
| Single Unit, Detached | 957 (98.4%) | 16 (1.6%) |
| Single Unit, Attached | 3 (100.0%) | 0 (0.0%) |
| 2 Unit Apartments | 0 (0.0%) | 0 (0.0%) |
| 3 or 4 Unit Apartments | 0 (0.0%) | 0 (0.0%) |
| 5 to 9 Unit Apartments | 0 (0.0%) | 0 (0.0%) |
| 10 or more Apartments | 0 (0.0%) | 0 (0.0%) |
| Mobile Home / Other | 71 (74.0%) | 25 (26.0%) |
| Total | 1,031 (96.2%) | 41 (3.8%) |
Housing Structures by Number of Rooms in Geneva
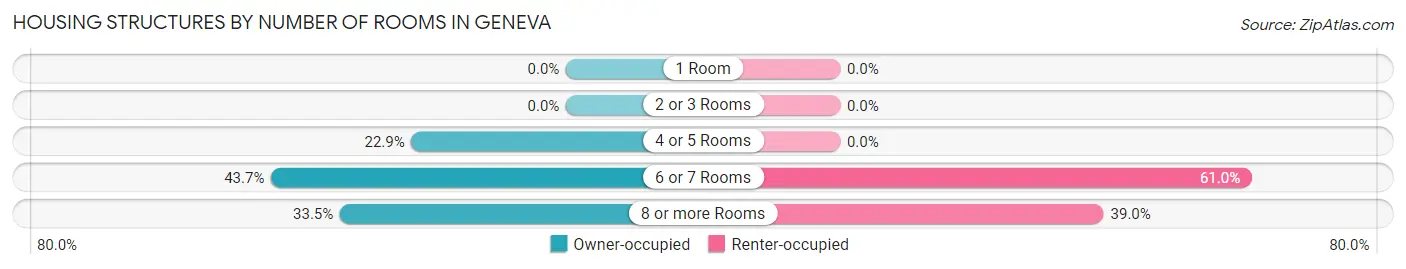
| Number of Rooms | Owner-occupied | Renter-occupied |
| 1 Room | 0 (0.0%) | 0 (0.0%) |
| 2 or 3 Rooms | 0 (0.0%) | 0 (0.0%) |
| 4 or 5 Rooms | 236 (22.9%) | 0 (0.0%) |
| 6 or 7 Rooms | 450 (43.6%) | 25 (61.0%) |
| 8 or more Rooms | 345 (33.5%) | 16 (39.0%) |
| Total | 1,031 (100.0%) | 41 (100.0%) |
Housing Structure by Heating Type in Geneva
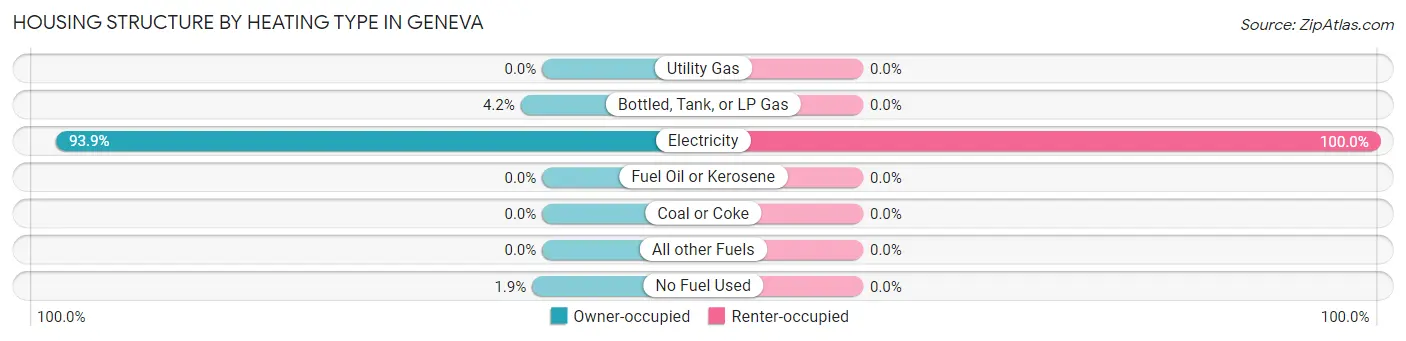
| Heating Type | Owner-occupied | Renter-occupied |
| Utility Gas | 0 (0.0%) | 0 (0.0%) |
| Bottled, Tank, or LP Gas | 43 (4.2%) | 0 (0.0%) |
| Electricity | 968 (93.9%) | 41 (100.0%) |
| Fuel Oil or Kerosene | 0 (0.0%) | 0 (0.0%) |
| Coal or Coke | 0 (0.0%) | 0 (0.0%) |
| All other Fuels | 0 (0.0%) | 0 (0.0%) |
| No Fuel Used | 20 (1.9%) | 0 (0.0%) |
| Total | 1,031 (100.0%) | 41 (100.0%) |
Household Vehicle Usage in Geneva
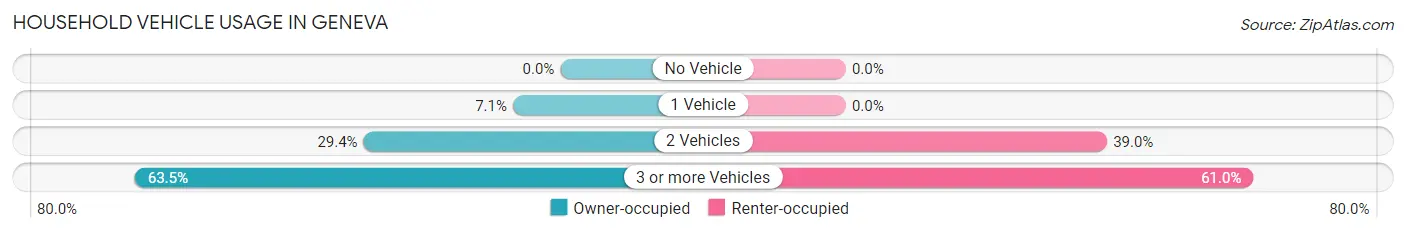
| Vehicles per Household | Owner-occupied | Renter-occupied |
| No Vehicle | 0 (0.0%) | 0 (0.0%) |
| 1 Vehicle | 73 (7.1%) | 0 (0.0%) |
| 2 Vehicles | 303 (29.4%) | 16 (39.0%) |
| 3 or more Vehicles | 655 (63.5%) | 25 (61.0%) |
| Total | 1,031 (100.0%) | 41 (100.0%) |
Real Estate & Mortgages in Geneva
Real Estate and Mortgage Overview in Geneva
| Characteristic | Without Mortgage | With Mortgage |
| Housing Units | 279 | 752 |
| Median Property Value | $336,600 | $561,500 |
| Median Household Income | $161,681 | $272 |
| Monthly Housing Costs | $618 | $196 |
| Real Estate Taxes | $2,633 | $99 |
Property Value by Mortgage Status in Geneva
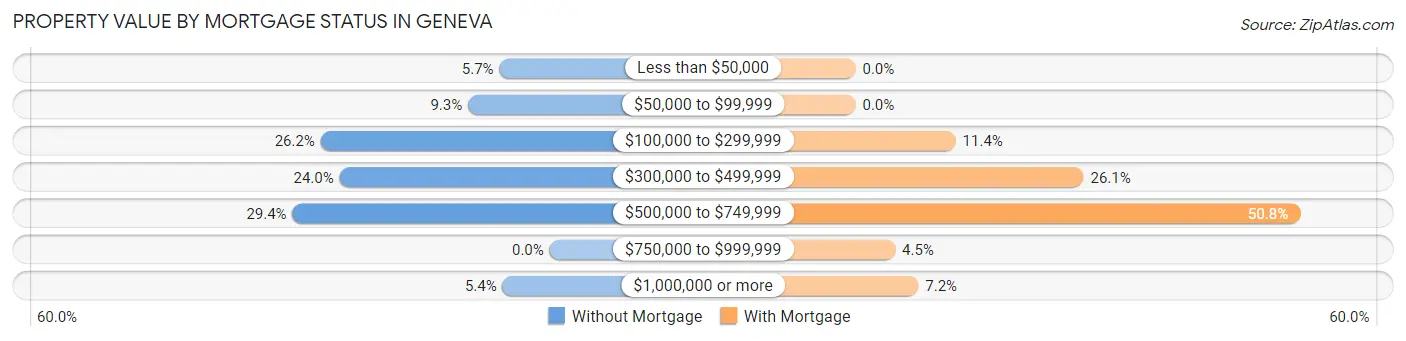
| Property Value | Without Mortgage | With Mortgage |
| Less than $50,000 | 16 (5.7%) | 0 (0.0%) |
| $50,000 to $99,999 | 26 (9.3%) | 0 (0.0%) |
| $100,000 to $299,999 | 73 (26.2%) | 86 (11.4%) |
| $300,000 to $499,999 | 67 (24.0%) | 196 (26.1%) |
| $500,000 to $749,999 | 82 (29.4%) | 382 (50.8%) |
| $750,000 to $999,999 | 0 (0.0%) | 34 (4.5%) |
| $1,000,000 or more | 15 (5.4%) | 54 (7.2%) |
| Total | 279 (100.0%) | 752 (100.0%) |
Household Income by Mortgage Status in Geneva
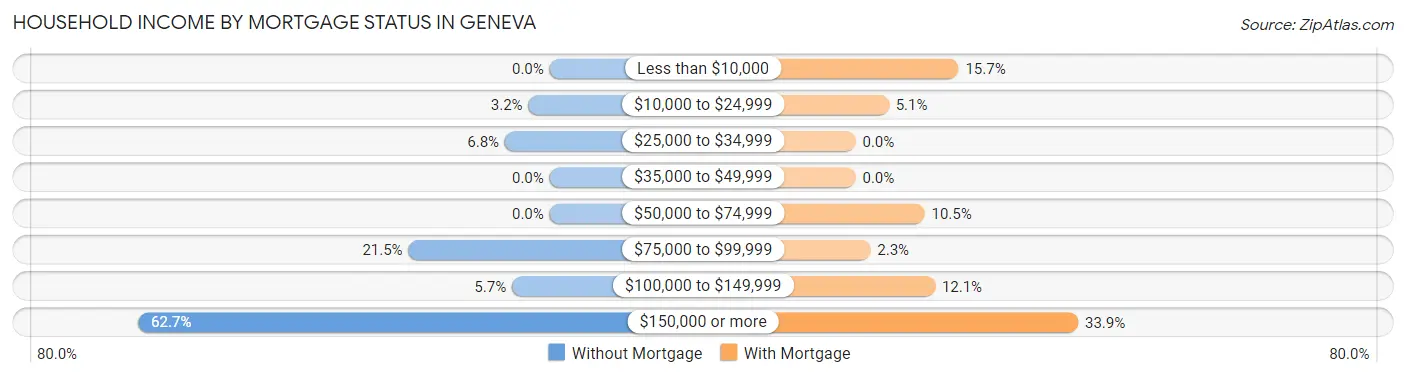
| Household Income | Without Mortgage | With Mortgage |
| Less than $10,000 | 0 (0.0%) | 118 (15.7%) |
| $10,000 to $24,999 | 9 (3.2%) | 38 (5.1%) |
| $25,000 to $34,999 | 19 (6.8%) | 0 (0.0%) |
| $35,000 to $49,999 | 0 (0.0%) | 0 (0.0%) |
| $50,000 to $74,999 | 0 (0.0%) | 79 (10.5%) |
| $75,000 to $99,999 | 60 (21.5%) | 17 (2.3%) |
| $100,000 to $149,999 | 16 (5.7%) | 91 (12.1%) |
| $150,000 or more | 175 (62.7%) | 255 (33.9%) |
| Total | 279 (100.0%) | 752 (100.0%) |
Property Value to Household Income Ratio in Geneva
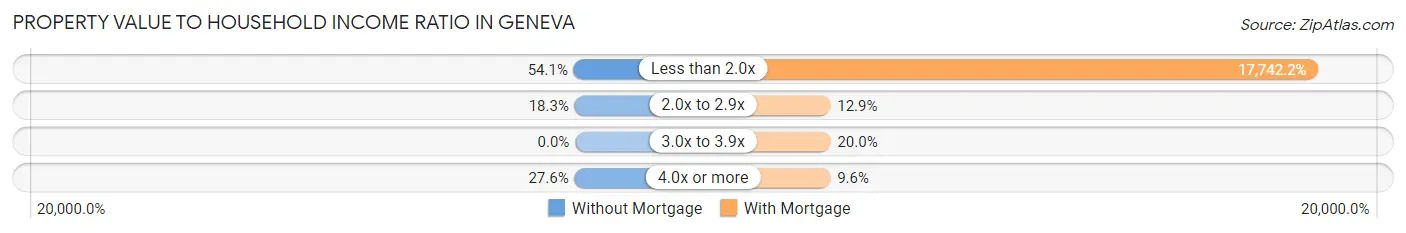
| Value-to-Income Ratio | Without Mortgage | With Mortgage |
| Less than 2.0x | 151 (54.1%) | 133,421 (17,742.2%) |
| 2.0x to 2.9x | 51 (18.3%) | 97 (12.9%) |
| 3.0x to 3.9x | 0 (0.0%) | 150 (20.0%) |
| 4.0x or more | 77 (27.6%) | 72 (9.6%) |
| Total | 279 (100.0%) | 752 (100.0%) |
Real Estate Taxes by Mortgage Status in Geneva
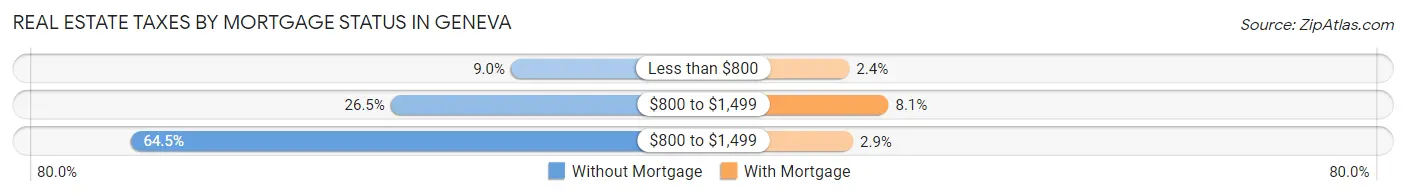
| Property Taxes | Without Mortgage | With Mortgage |
| Less than $800 | 25 (9.0%) | 18 (2.4%) |
| $800 to $1,499 | 74 (26.5%) | 61 (8.1%) |
| $800 to $1,499 | 180 (64.5%) | 22 (2.9%) |
| Total | 279 (100.0%) | 752 (100.0%) |
Health & Disability in Geneva
Health Insurance Coverage by Age in Geneva
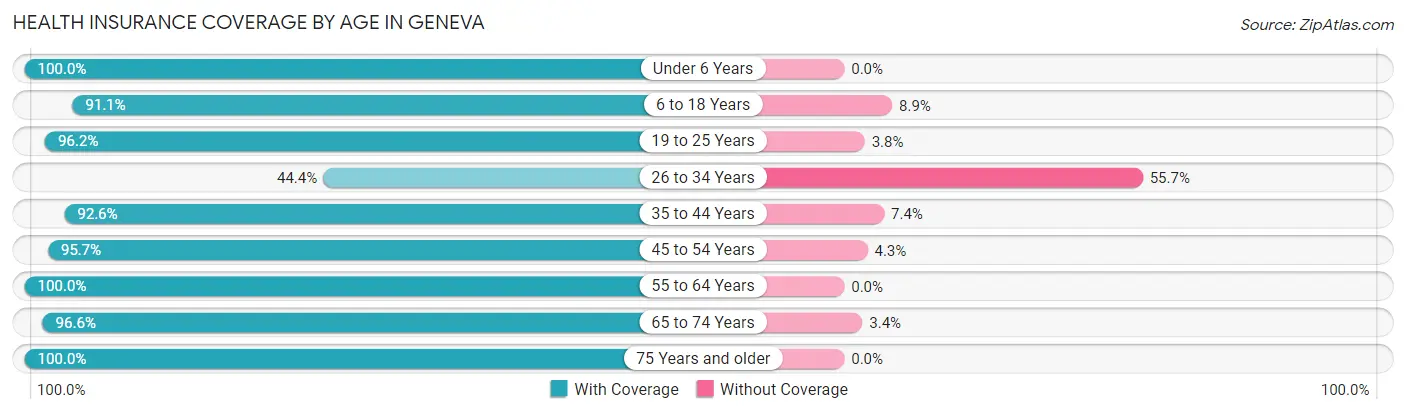
| Age Bracket | With Coverage | Without Coverage |
| Under 6 Years | 161 (100.0%) | 0 (0.0%) |
| 6 to 18 Years | 460 (91.1%) | 45 (8.9%) |
| 19 to 25 Years | 328 (96.2%) | 13 (3.8%) |
| 26 to 34 Years | 153 (44.4%) | 192 (55.6%) |
| 35 to 44 Years | 437 (92.6%) | 35 (7.4%) |
| 45 to 54 Years | 376 (95.7%) | 17 (4.3%) |
| 55 to 64 Years | 412 (100.0%) | 0 (0.0%) |
| 65 to 74 Years | 487 (96.6%) | 17 (3.4%) |
| 75 Years and older | 114 (100.0%) | 0 (0.0%) |
| Total | 2,928 (90.2%) | 319 (9.8%) |
Health Insurance Coverage by Citizenship Status in Geneva
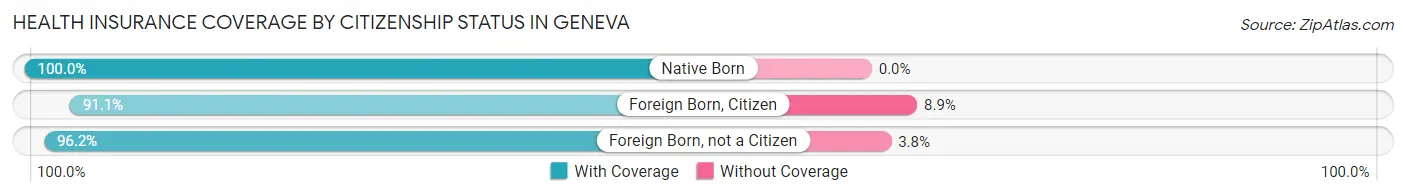
| Citizenship Status | With Coverage | Without Coverage |
| Native Born | 161 (100.0%) | 0 (0.0%) |
| Foreign Born, Citizen | 460 (91.1%) | 45 (8.9%) |
| Foreign Born, not a Citizen | 328 (96.2%) | 13 (3.8%) |
Health Insurance Coverage by Household Income in Geneva
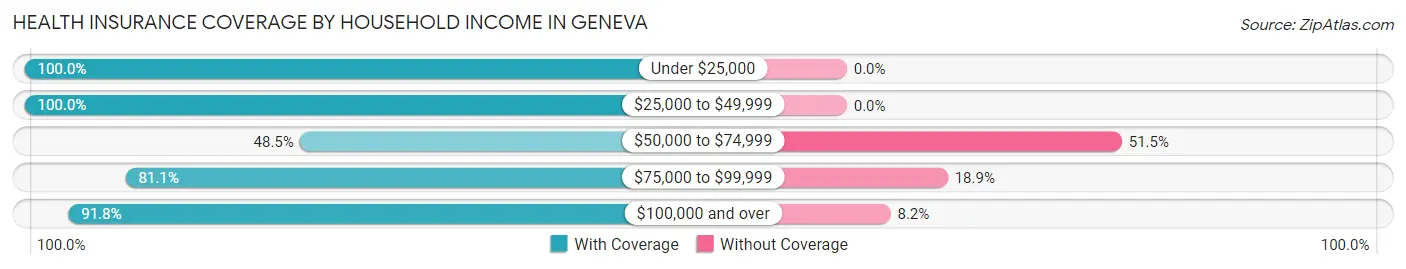
| Household Income | With Coverage | Without Coverage |
| Under $25,000 | 63 (100.0%) | 0 (0.0%) |
| $25,000 to $49,999 | 194 (100.0%) | 0 (0.0%) |
| $50,000 to $74,999 | 32 (48.5%) | 34 (51.5%) |
| $75,000 to $99,999 | 343 (81.1%) | 80 (18.9%) |
| $100,000 and over | 2,296 (91.8%) | 205 (8.2%) |
Public vs Private Health Insurance Coverage by Age in Geneva
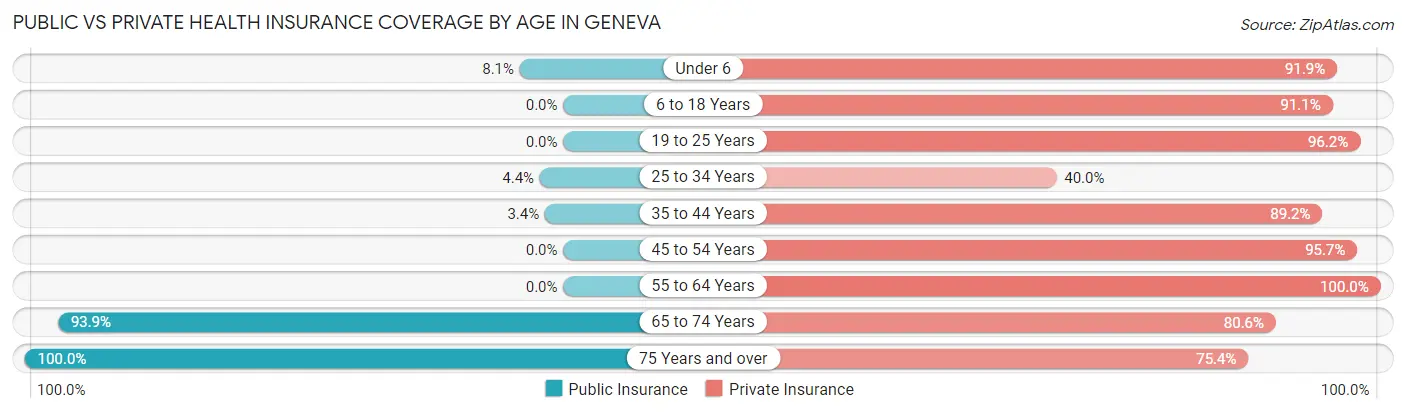
| Age Bracket | Public Insurance | Private Insurance |
| Under 6 | 13 (8.1%) | 148 (91.9%) |
| 6 to 18 Years | 0 (0.0%) | 460 (91.1%) |
| 19 to 25 Years | 0 (0.0%) | 328 (96.2%) |
| 25 to 34 Years | 15 (4.3%) | 138 (40.0%) |
| 35 to 44 Years | 16 (3.4%) | 421 (89.2%) |
| 45 to 54 Years | 0 (0.0%) | 376 (95.7%) |
| 55 to 64 Years | 0 (0.0%) | 412 (100.0%) |
| 65 to 74 Years | 473 (93.9%) | 406 (80.6%) |
| 75 Years and over | 114 (100.0%) | 86 (75.4%) |
| Total | 631 (19.4%) | 2,775 (85.5%) |
Disability Status by Sex by Age in Geneva
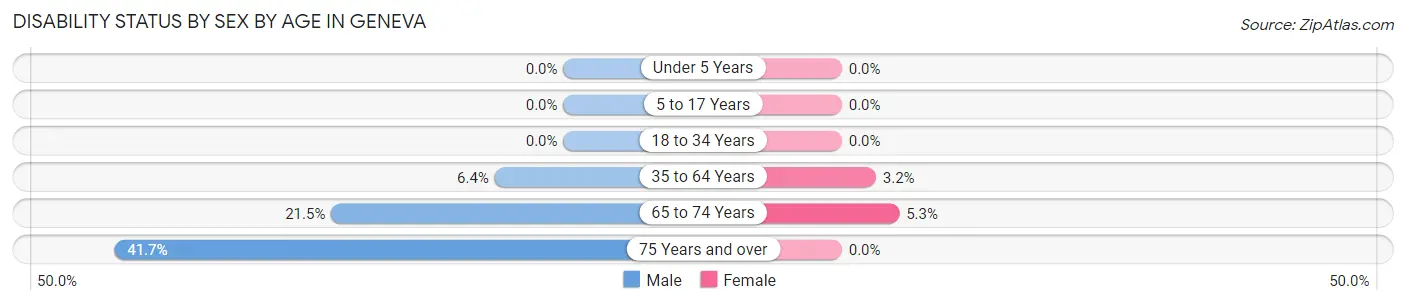
| Age Bracket | Male | Female |
| Under 5 Years | 0 (0.0%) | 0 (0.0%) |
| 5 to 17 Years | 0 (0.0%) | 0 (0.0%) |
| 18 to 34 Years | 0 (0.0%) | 0 (0.0%) |
| 35 to 64 Years | 41 (6.4%) | 20 (3.2%) |
| 65 to 74 Years | 56 (21.5%) | 13 (5.3%) |
| 75 Years and over | 20 (41.7%) | 0 (0.0%) |
Disability Class by Sex by Age in Geneva
Disability Class: Hearing Difficulty
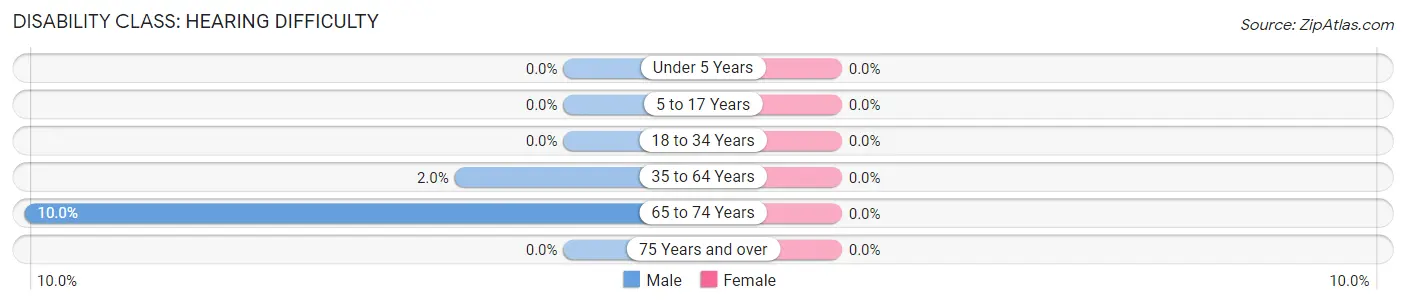
| Age Bracket | Male | Female |
| Under 5 Years | 0 (0.0%) | 0 (0.0%) |
| 5 to 17 Years | 0 (0.0%) | 0 (0.0%) |
| 18 to 34 Years | 0 (0.0%) | 0 (0.0%) |
| 35 to 64 Years | 13 (2.0%) | 0 (0.0%) |
| 65 to 74 Years | 26 (10.0%) | 0 (0.0%) |
| 75 Years and over | 0 (0.0%) | 0 (0.0%) |
Disability Class: Vision Difficulty
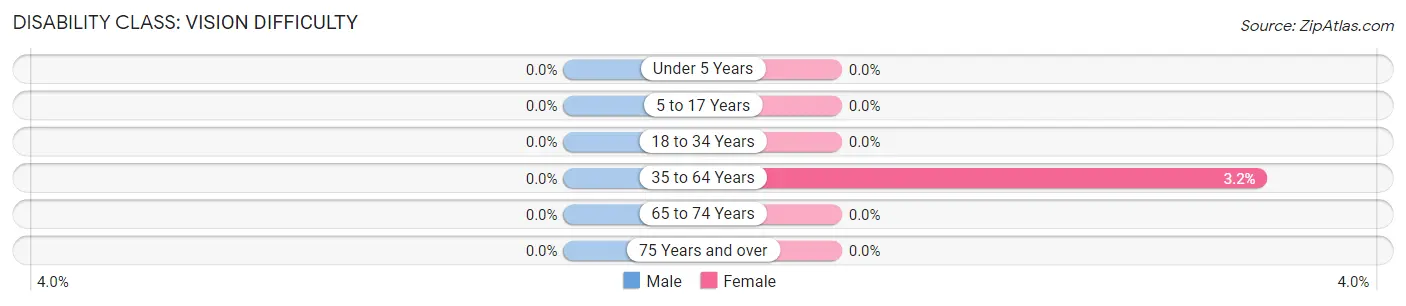
| Age Bracket | Male | Female |
| Under 5 Years | 0 (0.0%) | 0 (0.0%) |
| 5 to 17 Years | 0 (0.0%) | 0 (0.0%) |
| 18 to 34 Years | 0 (0.0%) | 0 (0.0%) |
| 35 to 64 Years | 0 (0.0%) | 20 (3.2%) |
| 65 to 74 Years | 0 (0.0%) | 0 (0.0%) |
| 75 Years and over | 0 (0.0%) | 0 (0.0%) |
Disability Class: Cognitive Difficulty
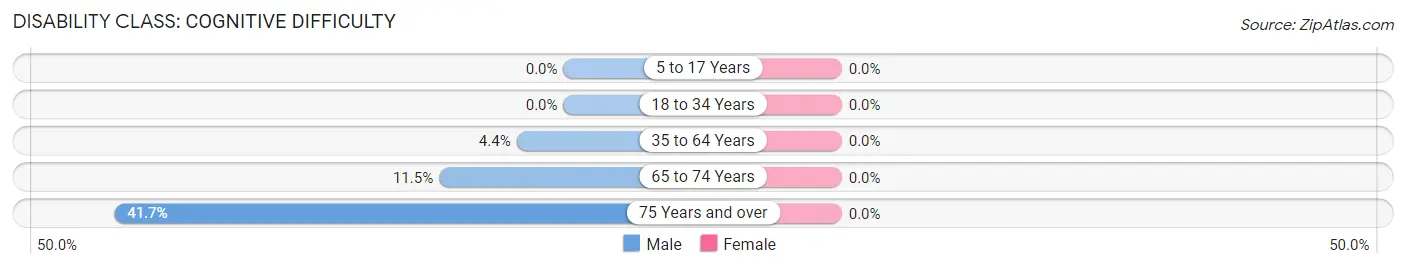
| Age Bracket | Male | Female |
| 5 to 17 Years | 0 (0.0%) | 0 (0.0%) |
| 18 to 34 Years | 0 (0.0%) | 0 (0.0%) |
| 35 to 64 Years | 28 (4.3%) | 0 (0.0%) |
| 65 to 74 Years | 30 (11.5%) | 0 (0.0%) |
| 75 Years and over | 20 (41.7%) | 0 (0.0%) |
Disability Class: Ambulatory Difficulty
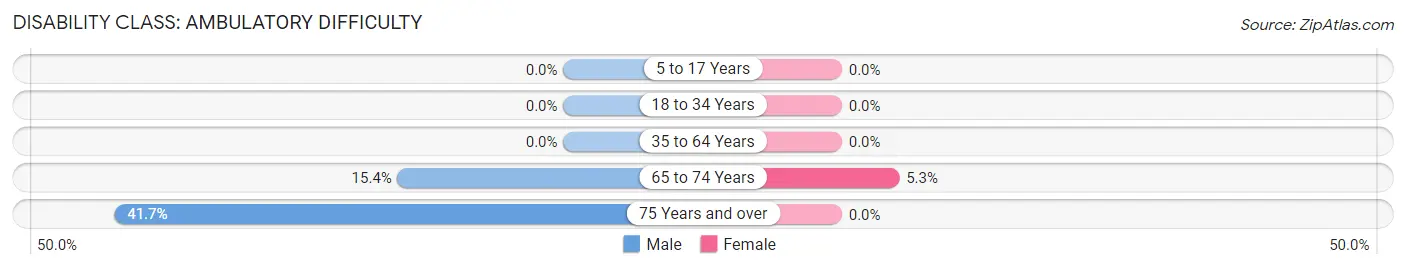
| Age Bracket | Male | Female |
| 5 to 17 Years | 0 (0.0%) | 0 (0.0%) |
| 18 to 34 Years | 0 (0.0%) | 0 (0.0%) |
| 35 to 64 Years | 0 (0.0%) | 0 (0.0%) |
| 65 to 74 Years | 40 (15.4%) | 13 (5.3%) |
| 75 Years and over | 20 (41.7%) | 0 (0.0%) |
Disability Class: Self-Care Difficulty
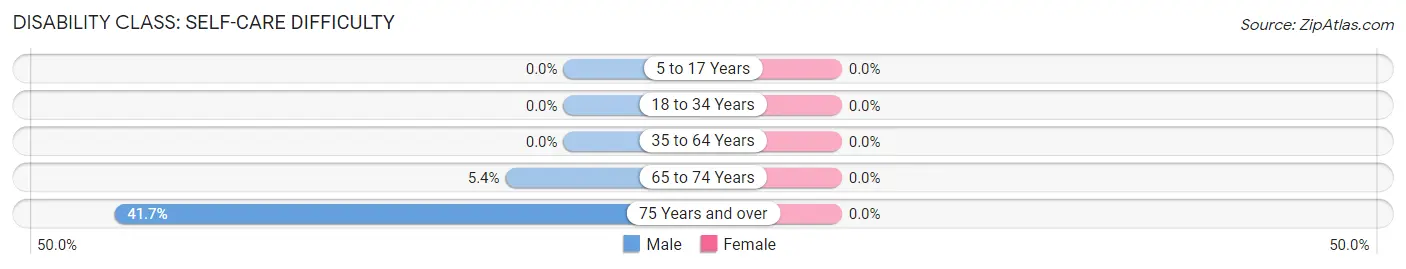
| Age Bracket | Male | Female |
| 5 to 17 Years | 0 (0.0%) | 0 (0.0%) |
| 18 to 34 Years | 0 (0.0%) | 0 (0.0%) |
| 35 to 64 Years | 0 (0.0%) | 0 (0.0%) |
| 65 to 74 Years | 14 (5.4%) | 0 (0.0%) |
| 75 Years and over | 20 (41.7%) | 0 (0.0%) |
Technology Access in Geneva
Computing Device Access in Geneva
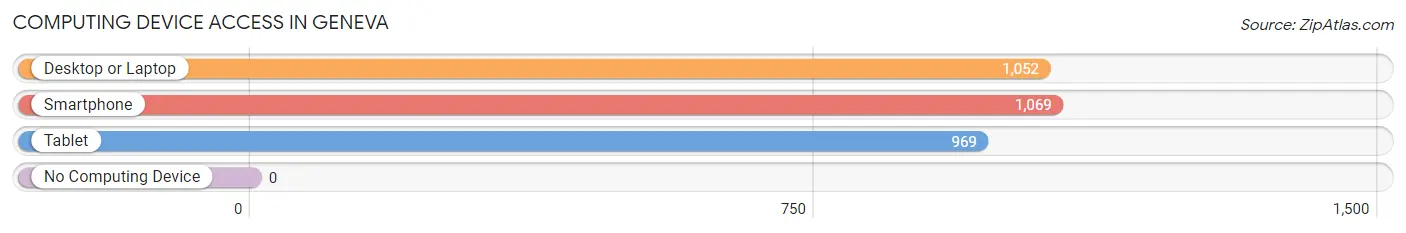
| Device Type | # Households | % Households |
| Desktop or Laptop | 1,052 | 98.1% |
| Smartphone | 1,069 | 99.7% |
| Tablet | 969 | 90.4% |
| No Computing Device | 0 | 0.0% |
| Total | 1,072 | 100.0% |
Internet Access in Geneva
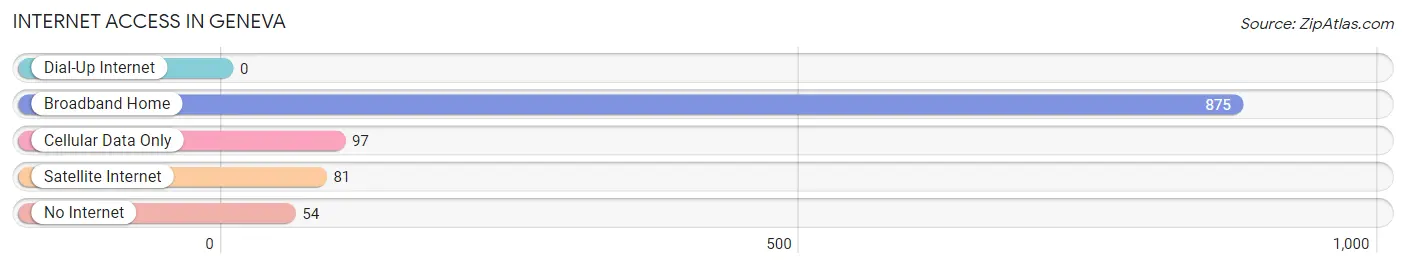
| Internet Type | # Households | % Households |
| Dial-Up Internet | 0 | 0.0% |
| Broadband Home | 875 | 81.6% |
| Cellular Data Only | 97 | 9.0% |
| Satellite Internet | 81 | 7.6% |
| No Internet | 54 | 5.0% |
| Total | 1,072 | 100.0% |
Geneva Summary
Geneva is a small town located in Seminole County, Florida. It is situated on the banks of the St. Johns River, about 25 miles northeast of Orlando. The town has a population of approximately 1,500 people and covers an area of 1.2 square miles.
History
Geneva was first settled in the late 1800s by a group of settlers from Geneva, New York. The town was originally known as Geneva Station, as it was a stop on the Sanford and Indian River Railroad. The town was officially incorporated in 1925 and was named after the city of Geneva, New York.
Geography
Geneva is located in the central part of Seminole County, Florida. It is situated on the banks of the St. Johns River, about 25 miles northeast of Orlando. The town has a total area of 1.2 square miles, all of which is land. The terrain is mostly flat, with some rolling hills. The climate is humid subtropical, with hot, humid summers and mild winters.
Economy
Geneva’s economy is largely based on agriculture and tourism. The town is home to several farms, which produce a variety of crops, including citrus fruits, vegetables, and hay. Tourism is also an important part of the local economy, as the town is located near several popular attractions, such as the Kennedy Space Center and the Daytona International Speedway.
Demographics
As of the 2010 census, Geneva had a population of 1,500 people. The racial makeup of the town was 94.7% White, 1.3% African American, 0.7% Native American, 0.7% Asian, 0.3% from other races, and 2.0% from two or more races. The median household income was $41,250, and the median family income was $50,000. The per capita income was $20,000.
Geneva is a small town with a rich history and a diverse economy. It is a great place to live, work, and visit, and is a great example of the beauty and charm of small-town Florida.
Common Questions
What is Per Capita Income in Geneva?
Per Capita income in Geneva is $52,210.
What is the Median Family Income in Geneva?
Median Family Income in Geneva is $142,109.
What is the Median Household income in Geneva?
Median Household Income in Geneva is $140,094.
What is Income or Wage Gap in Geneva?
Income or Wage Gap in Geneva is 35.2%.
Women in Geneva earn 64.8 cents for every dollar earned by a man.
What is Inequality or Gini Index in Geneva?
Inequality or Gini Index in Geneva is 0.38.
What is the Total Population of Geneva?
Total Population of Geneva is 3,247.
What is the Total Male Population of Geneva?
Total Male Population of Geneva is 1,665.
What is the Total Female Population of Geneva?
Total Female Population of Geneva is 1,582.
What is the Ratio of Males per 100 Females in Geneva?
There are 105.25 Males per 100 Females in Geneva.
What is the Ratio of Females per 100 Males in Geneva?
There are 95.02 Females per 100 Males in Geneva.
What is the Median Population Age in Geneva?
Median Population Age in Geneva is 43.4 Years.
What is the Average Family Size in Geneva
Average Family Size in Geneva is 3.6 People.
What is the Average Household Size in Geneva
Average Household Size in Geneva is 3.0 People.
How Large is the Labor Force in Geneva?
There are 1,905 People in the Labor Forcein in Geneva.
What is the Percentage of People in the Labor Force in Geneva?
71.3% of People are in the Labor Force in Geneva.
What is the Unemployment Rate in Geneva?
Unemployment Rate in Geneva is 0.9%.