Frostproof, FL Map & Demographics
Frostproof Map
Frostproof Overview
$22,995
PER CAPITA INCOME
$53,145
AVG FAMILY INCOME
$43,487
AVG HOUSEHOLD INCOME
27.2%
WAGE / INCOME GAP [ % ]
72.8¢/ $1
WAGE / INCOME GAP [ $ ]
0.38
INEQUALITY / GINI INDEX
2,946
TOTAL POPULATION
1,297
MALE POPULATION
1,649
FEMALE POPULATION
78.65
MALES / 100 FEMALES
127.14
FEMALES / 100 MALES
49.8
MEDIAN AGE
3.0
AVG FAMILY SIZE
2.5
AVG HOUSEHOLD SIZE
1,040
LABOR FORCE [ PEOPLE ]
44.4%
PERCENT IN LABOR FORCE
8.2%
UNEMPLOYMENT RATE
Frostproof Zip Codes
Frostproof Area Codes
Income in Frostproof
Income Overview in Frostproof
Per Capita Income in Frostproof is $22,995, while median incomes of families and households are $53,145 and $43,487 respectively.
| Characteristic | Number | Measure |
| Per Capita Income | 2,946 | $22,995 |
| Median Family Income | 824 | $53,145 |
| Mean Family Income | 824 | $63,698 |
| Median Household Income | 1,151 | $43,487 |
| Mean Household Income | 1,151 | $57,093 |
| Income Deficit | 824 | $0 |
| Wage / Income Gap (%) | 2,946 | 27.20% |
| Wage / Income Gap ($) | 2,946 | 72.80¢ per $1 |
| Gini / Inequality Index | 2,946 | 0.38 |
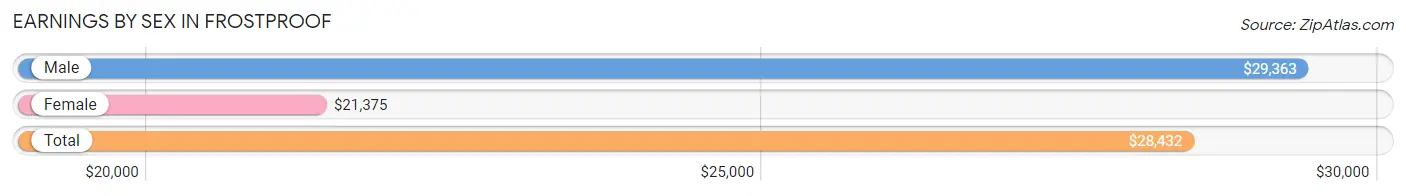
Earnings by Sex in Frostproof
Average Earnings in Frostproof are $28,432, $29,363 for men and $21,375 for women, a difference of 27.2%.
| Sex | Number | Average Earnings |
| Male | 483 (47.7%) | $29,363 |
| Female | 529 (52.3%) | $21,375 |
| Total | 1,012 (100.0%) | $28,432 |
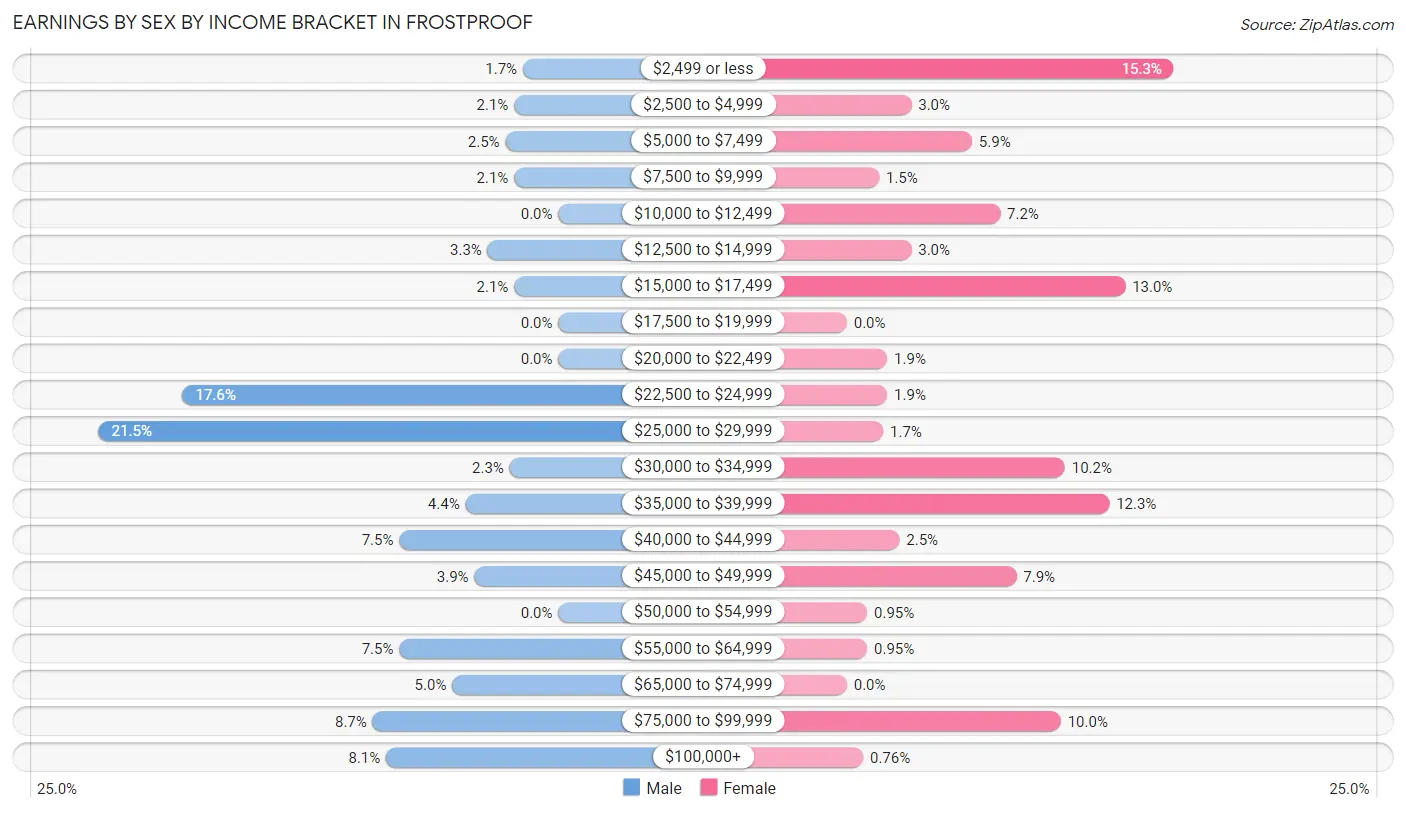
Earnings by Sex by Income Bracket in Frostproof
The most common earnings brackets in Frostproof are $25,000 to $29,999 for men (104 | 21.5%) and $2,499 or less for women (81 | 15.3%).
| Income | Male | Female |
| $2,499 or less | 8 (1.7%) | 81 (15.3%) |
| $2,500 to $4,999 | 10 (2.1%) | 16 (3.0%) |
| $5,000 to $7,499 | 12 (2.5%) | 31 (5.9%) |
| $7,500 to $9,999 | 10 (2.1%) | 8 (1.5%) |
| $10,000 to $12,499 | 0 (0.0%) | 38 (7.2%) |
| $12,500 to $14,999 | 16 (3.3%) | 16 (3.0%) |
| $15,000 to $17,499 | 10 (2.1%) | 69 (13.0%) |
| $17,500 to $19,999 | 0 (0.0%) | 0 (0.0%) |
| $20,000 to $22,499 | 0 (0.0%) | 10 (1.9%) |
| $22,500 to $24,999 | 85 (17.6%) | 10 (1.9%) |
| $25,000 to $29,999 | 104 (21.5%) | 9 (1.7%) |
| $30,000 to $34,999 | 11 (2.3%) | 54 (10.2%) |
| $35,000 to $39,999 | 21 (4.3%) | 65 (12.3%) |
| $40,000 to $44,999 | 36 (7.4%) | 13 (2.5%) |
| $45,000 to $49,999 | 19 (3.9%) | 42 (7.9%) |
| $50,000 to $54,999 | 0 (0.0%) | 5 (0.9%) |
| $55,000 to $64,999 | 36 (7.4%) | 5 (0.9%) |
| $65,000 to $74,999 | 24 (5.0%) | 0 (0.0%) |
| $75,000 to $99,999 | 42 (8.7%) | 53 (10.0%) |
| $100,000+ | 39 (8.1%) | 4 (0.8%) |
| Total | 483 (100.0%) | 529 (100.0%) |
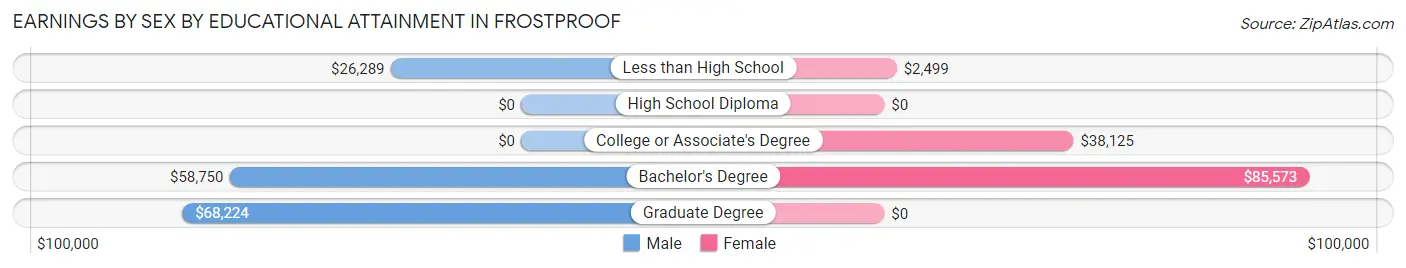
Earnings by Sex by Educational Attainment in Frostproof
Average earnings in Frostproof are $33,750 for men and $28,958 for women, a difference of 14.2%. Men with an educational attainment of graduate degree enjoy the highest average annual earnings of $68,224, while those with less than high school education earn the least with $26,289. Women with an educational attainment of bachelor's degree earn the most with the average annual earnings of $85,573, while those with less than high school education have the smallest earnings of $2,499.
| Educational Attainment | Male Income | Female Income |
| Less than High School | $26,289 | $2,499 |
| High School Diploma | - | - |
| College or Associate's Degree | - | - |
| Bachelor's Degree | $58,750 | $85,573 |
| Graduate Degree | $68,224 | $0 |
| Total | $33,750 | $28,958 |
Family Income in Frostproof
Family Income Brackets in Frostproof
According to the Frostproof family income data, there are 163 families falling into the $100,000 to $149,999 income range, which is the most common income bracket and makes up 19.8% of all families.
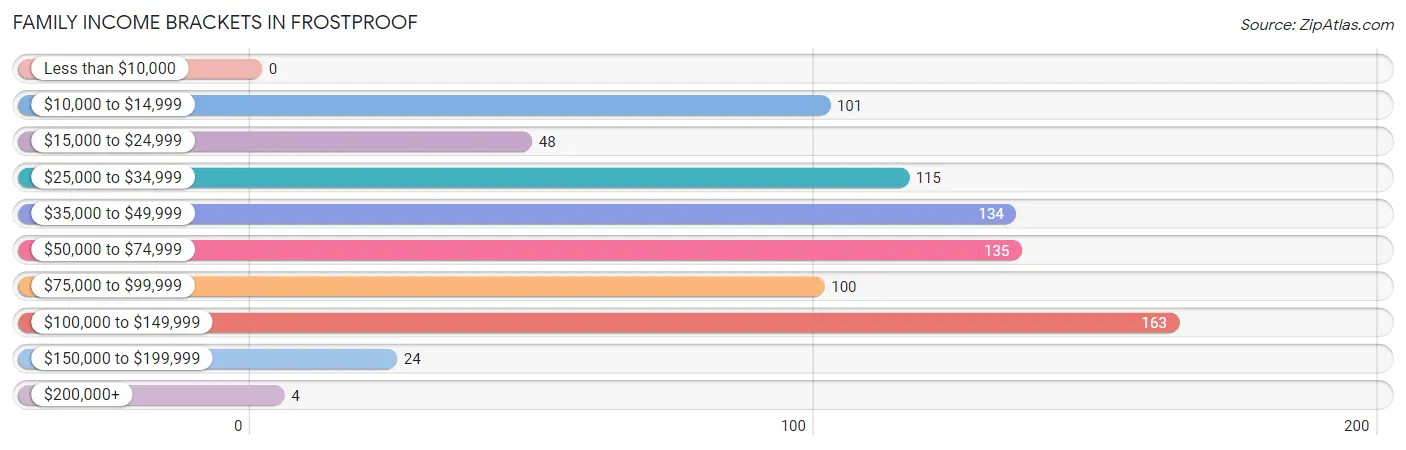
| Income Bracket | # Families | % Families |
| Less than $10,000 | 0 | 0.0% |
| $10,000 to $14,999 | 101 | 12.3% |
| $15,000 to $24,999 | 48 | 5.8% |
| $25,000 to $34,999 | 115 | 14.0% |
| $35,000 to $49,999 | 134 | 16.3% |
| $50,000 to $74,999 | 135 | 16.4% |
| $75,000 to $99,999 | 100 | 12.1% |
| $100,000 to $149,999 | 163 | 19.8% |
| $150,000 to $199,999 | 24 | 2.9% |
| $200,000+ | 4 | 0.5% |
Family Income by Famaliy Size in Frostproof
5-person families (71 | 8.6%) account for the highest median family income in Frostproof with $103,355 per family, while 2-person families (453 | 55.0%) have the highest median income of $26,292 per family member.
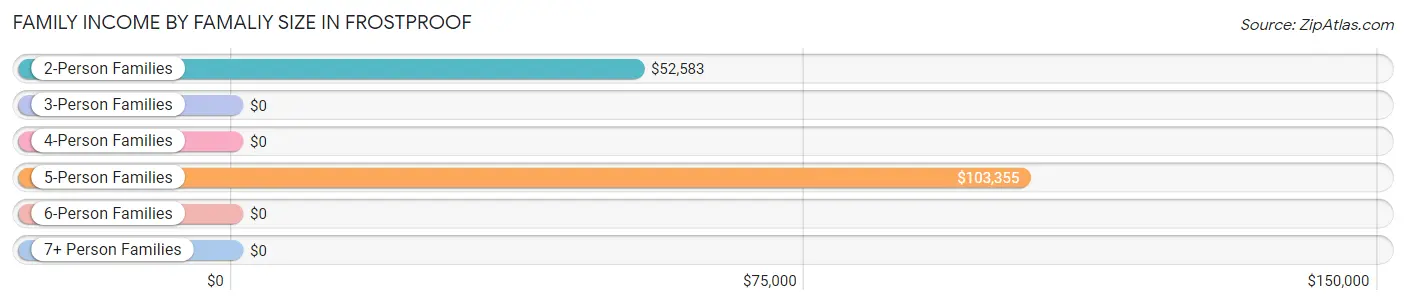
| Income Bracket | # Families | Median Income |
| 2-Person Families | 453 (55.0%) | $52,583 |
| 3-Person Families | 203 (24.6%) | $0 |
| 4-Person Families | 89 (10.8%) | $0 |
| 5-Person Families | 71 (8.6%) | $103,355 |
| 6-Person Families | 7 (0.9%) | $0 |
| 7+ Person Families | 1 (0.1%) | $0 |
| Total | 824 (100.0%) | $53,145 |
Family Income by Number of Earners in Frostproof
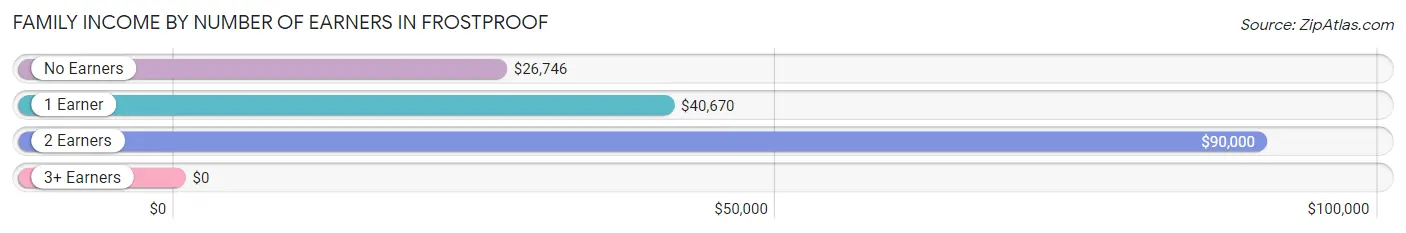
| Number of Earners | # Families | Median Income |
| No Earners | 305 (37.0%) | $26,746 |
| 1 Earner | 277 (33.6%) | $40,670 |
| 2 Earners | 224 (27.2%) | $90,000 |
| 3+ Earners | 18 (2.2%) | $0 |
| Total | 824 (100.0%) | $53,145 |
Household Income in Frostproof
Household Income Brackets in Frostproof
With 294 households falling in the category, the $25,000 to $34,999 income range is the most frequent in Frostproof, accounting for 25.5% of all households. In contrast, only 3 households (0.3%) fall into the $200,000+ income bracket, making it the least populous group.
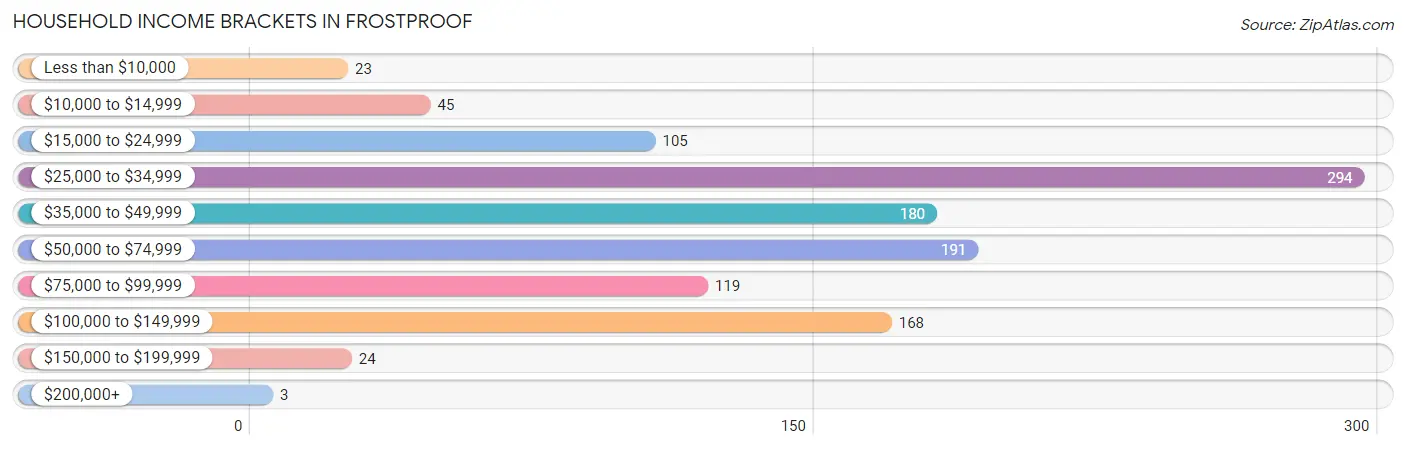
| Income Bracket | # Households | % Households |
| Less than $10,000 | 23 | 2.0% |
| $10,000 to $14,999 | 45 | 3.9% |
| $15,000 to $24,999 | 105 | 9.1% |
| $25,000 to $34,999 | 294 | 25.5% |
| $35,000 to $49,999 | 180 | 15.6% |
| $50,000 to $74,999 | 191 | 16.6% |
| $75,000 to $99,999 | 119 | 10.3% |
| $100,000 to $149,999 | 168 | 14.6% |
| $150,000 to $199,999 | 24 | 2.1% |
| $200,000+ | 3 | 0.3% |
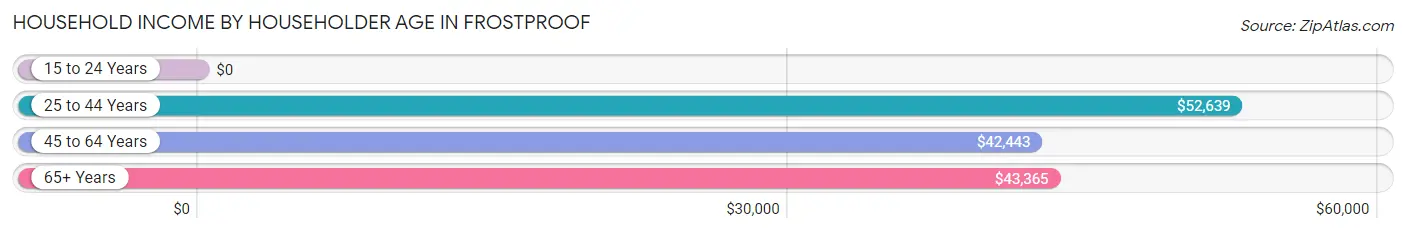
Household Income by Householder Age in Frostproof
The median household income in Frostproof is $43,487, with the highest median household income of $52,639 found in the 25 to 44 years age bracket for the primary householder. A total of 231 households (20.1%) fall into this category. Meanwhile, the 15 to 24 years age bracket for the primary householder has the lowest median household income of $0, with 12 households (1.0%) in this group.
| Income Bracket | # Households | Median Income |
| 15 to 24 Years | 12 (1.0%) | $0 |
| 25 to 44 Years | 231 (20.1%) | $52,639 |
| 45 to 64 Years | 411 (35.7%) | $42,443 |
| 65+ Years | 497 (43.2%) | $43,365 |
| Total | 1,151 (100.0%) | $43,487 |
Poverty in Frostproof
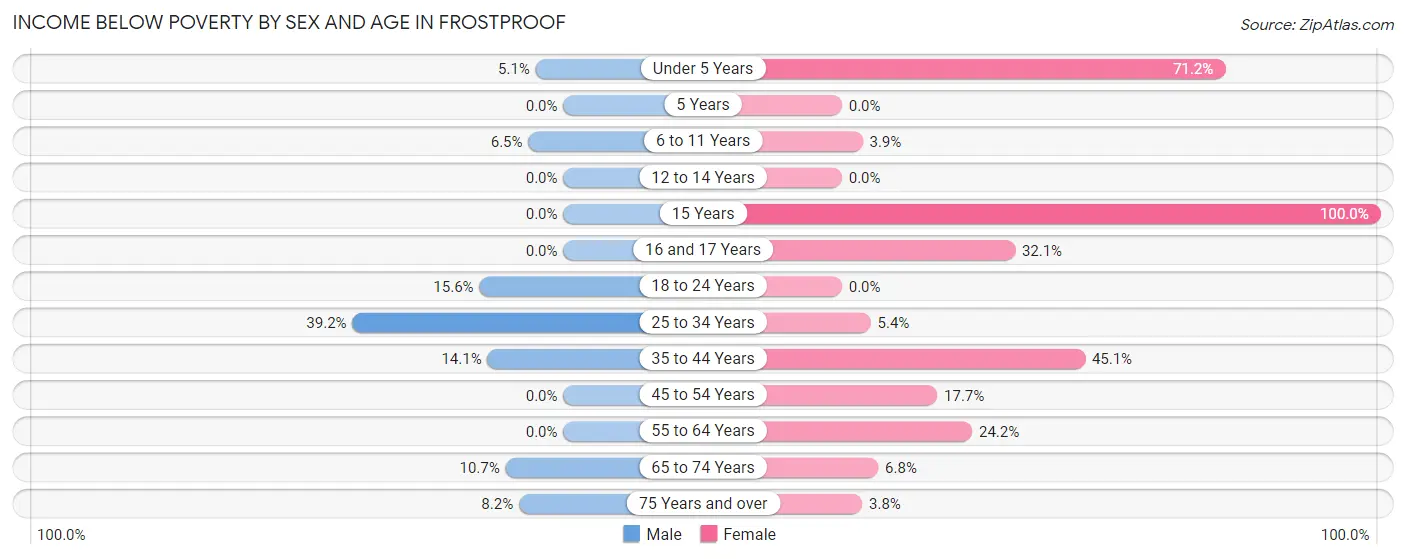
Income Below Poverty by Sex and Age in Frostproof
With 11.4% poverty level for males and 25.6% for females among the residents of Frostproof, 25 to 34 year old males and 15 year old females are the most vulnerable to poverty, with 74 males (39.2%) and 53 females (100.0%) in their respective age groups living below the poverty level.
| Age Bracket | Male | Female |
| Under 5 Years | 2 (5.1%) | 190 (71.2%) |
| 5 Years | 0 (0.0%) | 0 (0.0%) |
| 6 to 11 Years | 5 (6.5%) | 2 (3.8%) |
| 12 to 14 Years | 0 (0.0%) | 0 (0.0%) |
| 15 Years | 0 (0.0%) | 53 (100.0%) |
| 16 and 17 Years | 0 (0.0%) | 9 (32.1%) |
| 18 to 24 Years | 12 (15.6%) | 0 (0.0%) |
| 25 to 34 Years | 74 (39.2%) | 10 (5.3%) |
| 35 to 44 Years | 10 (14.1%) | 51 (45.1%) |
| 45 to 54 Years | 0 (0.0%) | 23 (17.7%) |
| 55 to 64 Years | 0 (0.0%) | 59 (24.2%) |
| 65 to 74 Years | 19 (10.7%) | 17 (6.8%) |
| 75 Years and over | 26 (8.2%) | 6 (3.8%) |
| Total | 148 (11.4%) | 420 (25.6%) |
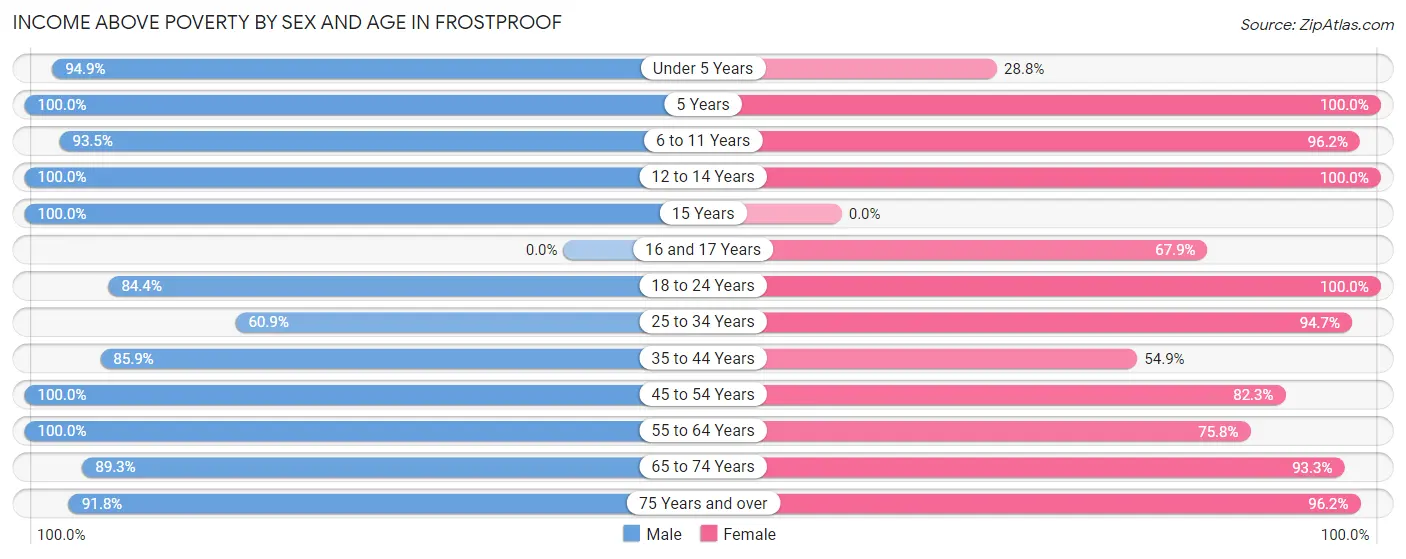
Income Above Poverty by Sex and Age in Frostproof
According to the poverty statistics in Frostproof, males aged 5 years and females aged 5 years are the age groups that are most secure financially, with 100.0% of males and 100.0% of females in these age groups living above the poverty line.
| Age Bracket | Male | Female |
| Under 5 Years | 37 (94.9%) | 77 (28.8%) |
| 5 Years | 30 (100.0%) | 6 (100.0%) |
| 6 to 11 Years | 72 (93.5%) | 50 (96.2%) |
| 12 to 14 Years | 7 (100.0%) | 32 (100.0%) |
| 15 Years | 33 (100.0%) | 0 (0.0%) |
| 16 and 17 Years | 0 (0.0%) | 19 (67.9%) |
| 18 to 24 Years | 65 (84.4%) | 119 (100.0%) |
| 25 to 34 Years | 115 (60.9%) | 177 (94.7%) |
| 35 to 44 Years | 61 (85.9%) | 62 (54.9%) |
| 45 to 54 Years | 105 (100.0%) | 107 (82.3%) |
| 55 to 64 Years | 176 (100.0%) | 185 (75.8%) |
| 65 to 74 Years | 158 (89.3%) | 235 (93.2%) |
| 75 Years and over | 290 (91.8%) | 153 (96.2%) |
| Total | 1,149 (88.6%) | 1,222 (74.4%) |
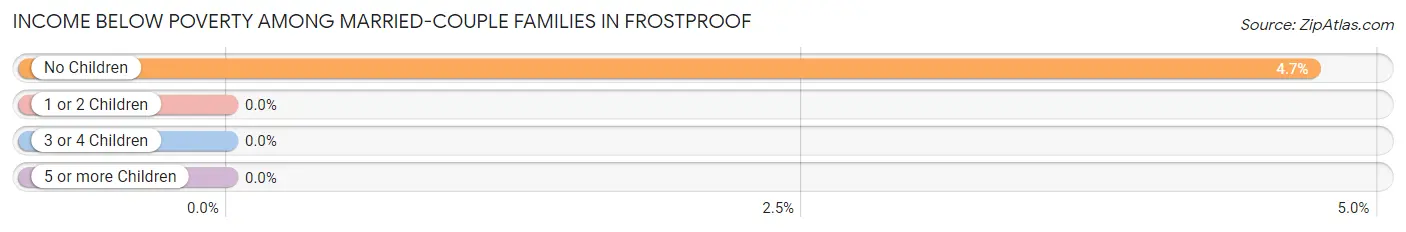
Income Below Poverty Among Married-Couple Families in Frostproof
The poverty statistics for married-couple families in Frostproof show that 3.5% or 17 of the total 493 families live below the poverty line. Families with no children have the highest poverty rate of 4.7%, comprising of 17 families. On the other hand, families with 1 or 2 children have the lowest poverty rate of 0.0%, which includes 0 families.
| Children | Above Poverty | Below Poverty |
| No Children | 344 (95.3%) | 17 (4.7%) |
| 1 or 2 Children | 118 (100.0%) | 0 (0.0%) |
| 3 or 4 Children | 14 (100.0%) | 0 (0.0%) |
| 5 or more Children | 0 (0.0%) | 0 (0.0%) |
| Total | 476 (96.6%) | 17 (3.5%) |
Income Below Poverty Among Single-Parent Households in Frostproof
According to the poverty data in Frostproof, 39.6% or 74 single-father households and 34.7% or 50 single-mother households are living below the poverty line. Among single-father households, those with 1 or 2 children have the highest poverty rate, with 74 households (90.2%) experiencing poverty. Likewise, among single-mother households, those with 5 or more children have the highest poverty rate, with 3 households (100.0%) falling below the poverty line.
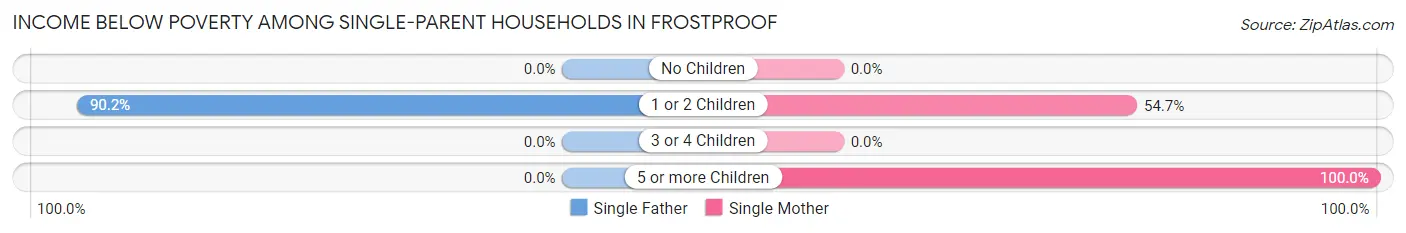
| Children | Single Father | Single Mother |
| No Children | 0 (0.0%) | 0 (0.0%) |
| 1 or 2 Children | 74 (90.2%) | 47 (54.6%) |
| 3 or 4 Children | 0 (0.0%) | 0 (0.0%) |
| 5 or more Children | 0 (0.0%) | 3 (100.0%) |
| Total | 74 (39.6%) | 50 (34.7%) |
Income Below Poverty Among Married-Couple vs Single-Parent Households in Frostproof
The poverty data for Frostproof shows that 17 of the married-couple family households (3.5%) and 124 of the single-parent households (37.5%) are living below the poverty level. Within the married-couple family households, those with no children have the highest poverty rate, with 17 households (4.7%) falling below the poverty line. Among the single-parent households, those with 5 or more children have the highest poverty rate, with 3 household (100.0%) living below poverty.
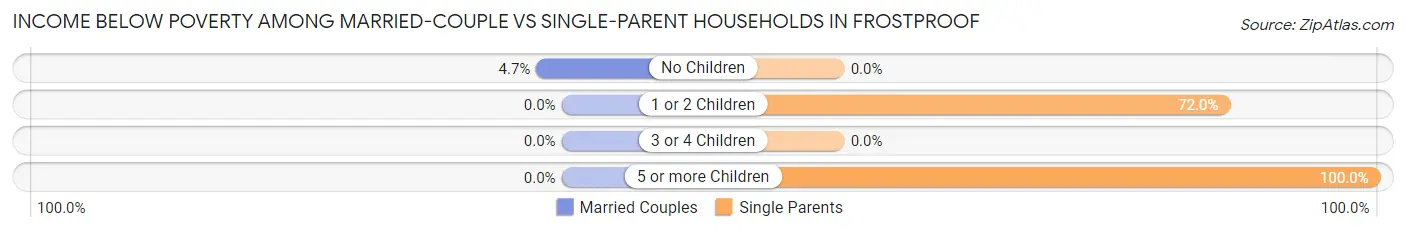
| Children | Married-Couple Families | Single-Parent Households |
| No Children | 17 (4.7%) | 0 (0.0%) |
| 1 or 2 Children | 0 (0.0%) | 121 (72.0%) |
| 3 or 4 Children | 0 (0.0%) | 0 (0.0%) |
| 5 or more Children | 0 (0.0%) | 3 (100.0%) |
| Total | 17 (3.5%) | 124 (37.5%) |
Race in Frostproof
The most populous races in Frostproof are White / Caucasian (2,087 | 70.8%), Hispanic or Latino (738 | 25.1%), and Some other Race (349 | 11.8%).
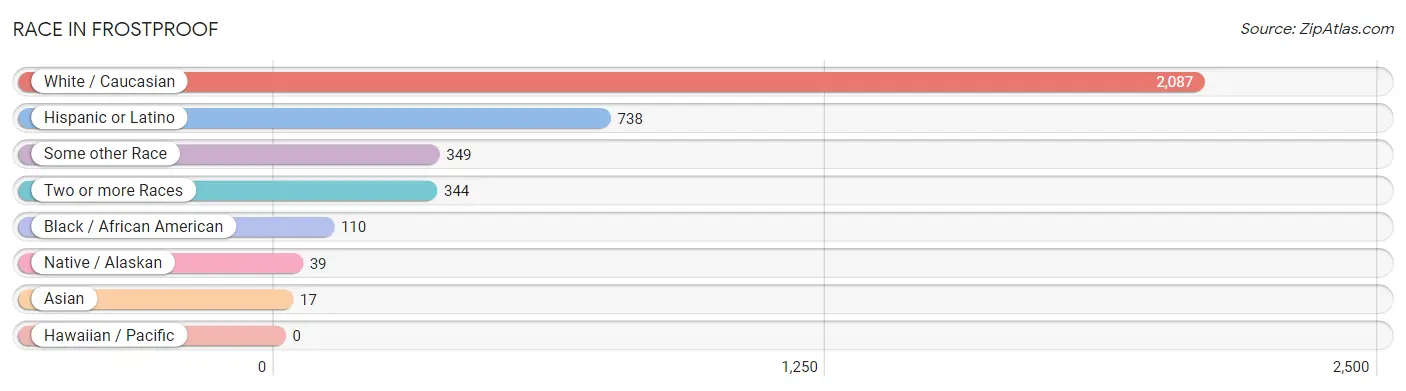
| Race | # Population | % Population |
| Asian | 17 | 0.6% |
| Black / African American | 110 | 3.7% |
| Hawaiian / Pacific | 0 | 0.0% |
| Hispanic or Latino | 738 | 25.1% |
| Native / Alaskan | 39 | 1.3% |
| White / Caucasian | 2,087 | 70.8% |
| Two or more Races | 344 | 11.7% |
| Some other Race | 349 | 11.8% |
| Total | 2,946 | 100.0% |
Ancestry in Frostproof
The most populous ancestries reported in Frostproof are Puerto Rican (383 | 13.0%), American (368 | 12.5%), Mexican (298 | 10.1%), English (294 | 10.0%), and Scottish (242 | 8.2%), together accounting for 53.8% of all Frostproof residents.
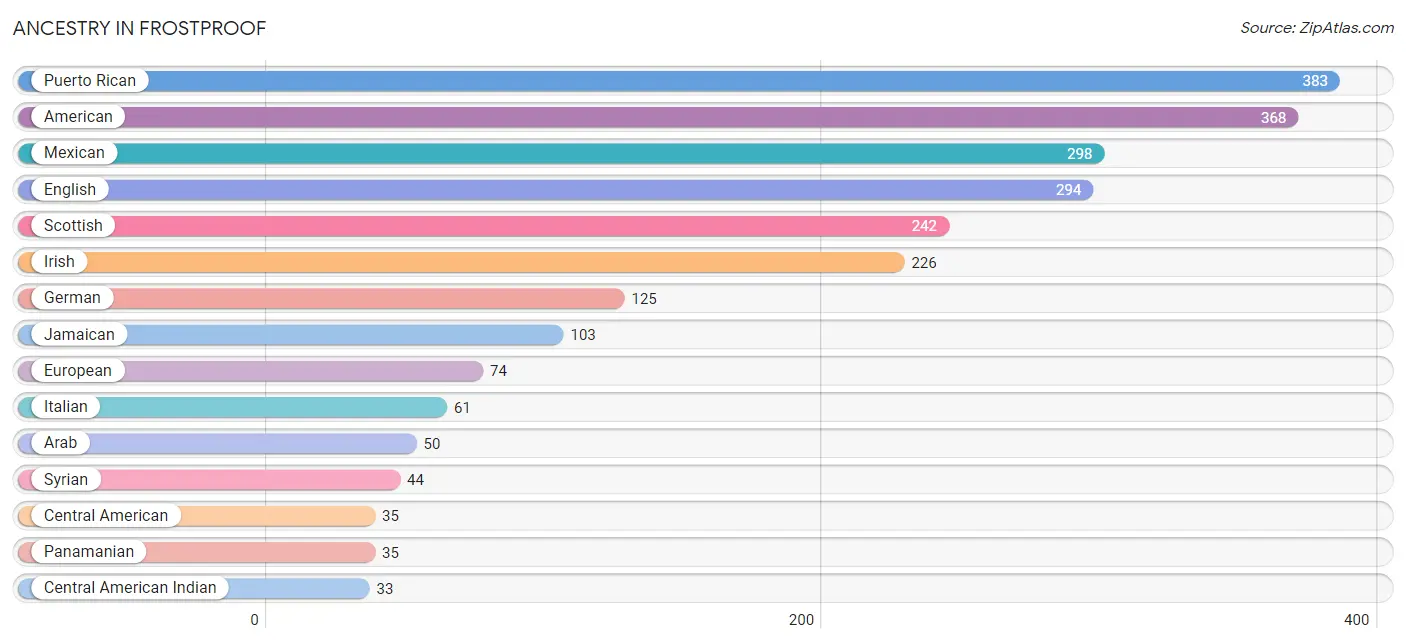
| Ancestry | # Population | % Population |
| American | 368 | 12.5% |
| Arab | 50 | 1.7% |
| Blackfeet | 16 | 0.5% |
| British | 10 | 0.3% |
| Central American | 35 | 1.2% |
| Central American Indian | 33 | 1.1% |
| Cherokee | 23 | 0.8% |
| Choctaw | 6 | 0.2% |
| Creek | 8 | 0.3% |
| Dominican | 14 | 0.5% |
| Dutch | 30 | 1.0% |
| English | 294 | 10.0% |
| European | 74 | 2.5% |
| French | 15 | 0.5% |
| German | 125 | 4.2% |
| Haitian | 5 | 0.2% |
| Hungarian | 9 | 0.3% |
| Irish | 226 | 7.7% |
| Italian | 61 | 2.1% |
| Jamaican | 103 | 3.5% |
| Korean | 17 | 0.6% |
| Maltese | 1 | 0.0% |
| Mexican | 298 | 10.1% |
| Northern European | 4 | 0.1% |
| Panamanian | 35 | 1.2% |
| Peruvian | 8 | 0.3% |
| Puerto Rican | 383 | 13.0% |
| Russian | 24 | 0.8% |
| Scotch-Irish | 26 | 0.9% |
| Scottish | 242 | 8.2% |
| South American | 8 | 0.3% |
| Syrian | 44 | 1.5% | View All 32 Rows |
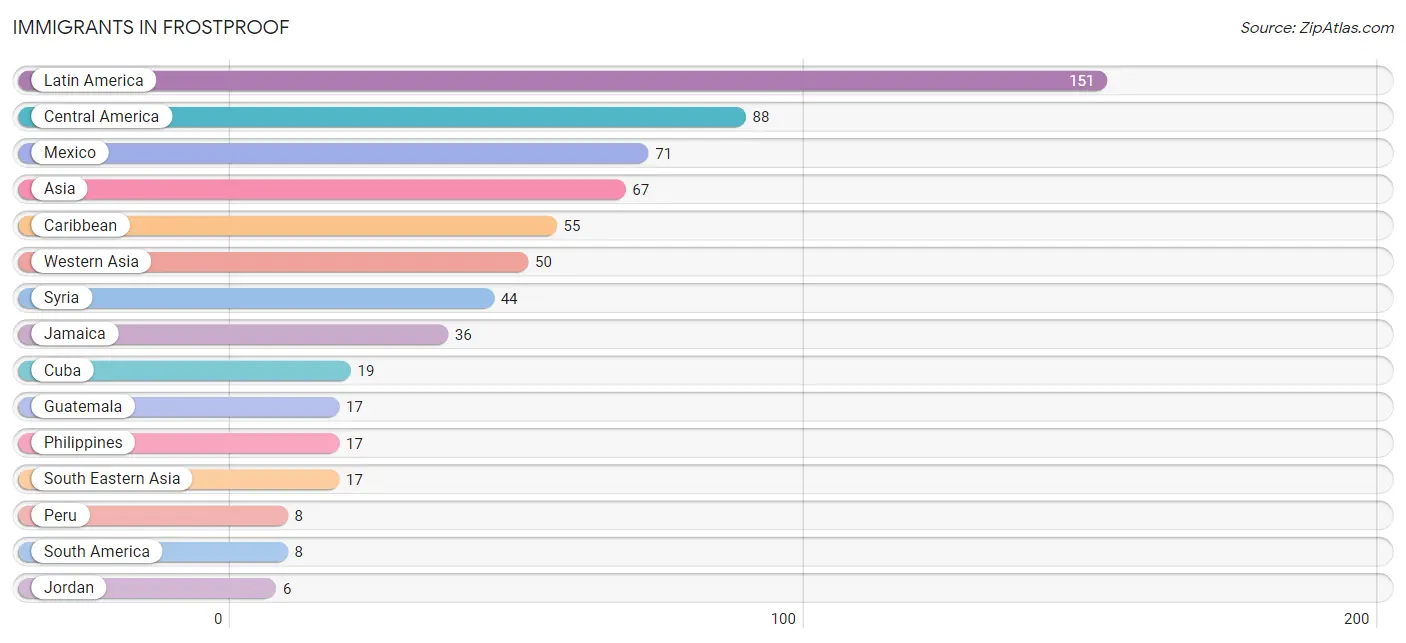
Immigrants in Frostproof
The most numerous immigrant groups reported in Frostproof came from Latin America (151 | 5.1%), Central America (88 | 3.0%), Mexico (71 | 2.4%), Asia (67 | 2.3%), and Caribbean (55 | 1.9%), together accounting for 14.7% of all Frostproof residents.
| Immigration Origin | # Population | % Population |
| Asia | 67 | 2.3% |
| Caribbean | 55 | 1.9% |
| Central America | 88 | 3.0% |
| Cuba | 19 | 0.6% |
| Guatemala | 17 | 0.6% |
| Jamaica | 36 | 1.2% |
| Jordan | 6 | 0.2% |
| Latin America | 151 | 5.1% |
| Mexico | 71 | 2.4% |
| Peru | 8 | 0.3% |
| Philippines | 17 | 0.6% |
| South America | 8 | 0.3% |
| South Eastern Asia | 17 | 0.6% |
| Syria | 44 | 1.5% |
| Western Asia | 50 | 1.7% | View All 15 Rows |
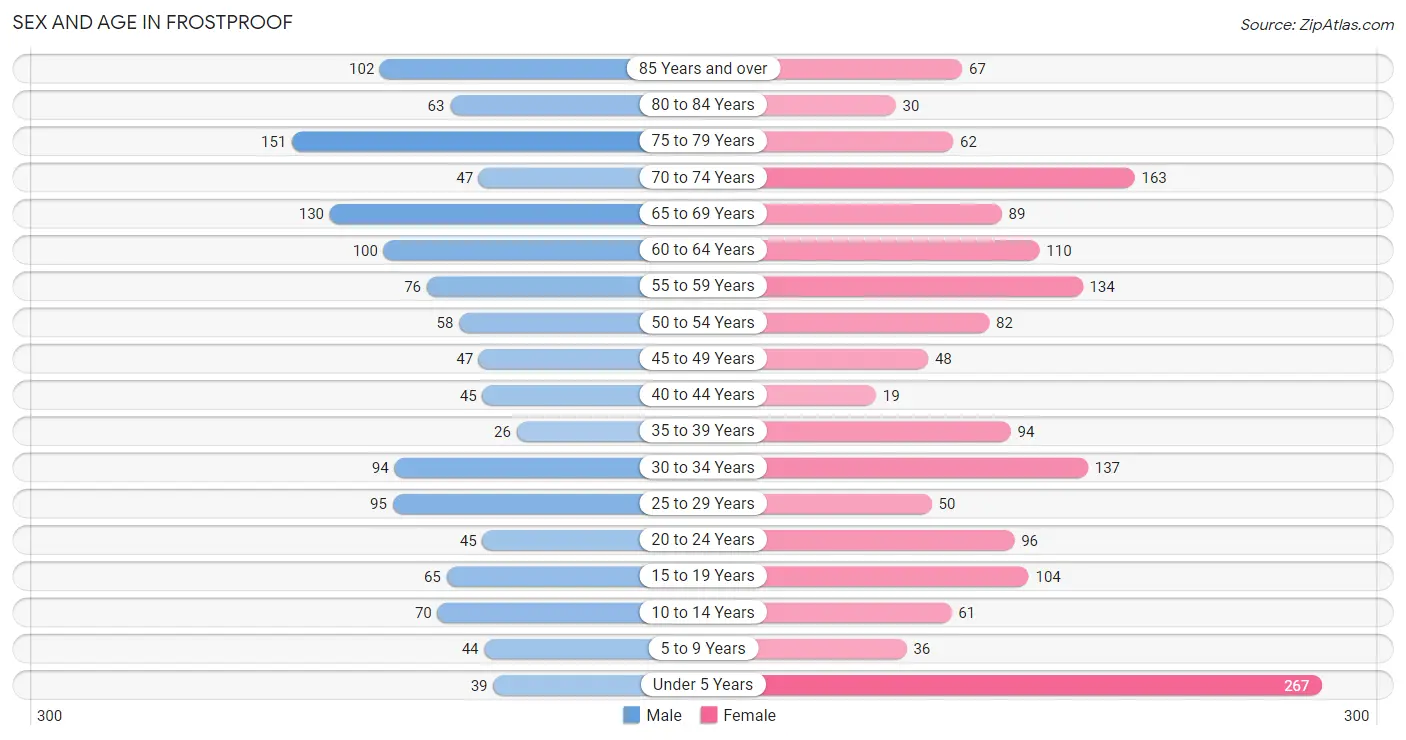
Sex and Age in Frostproof
Sex and Age in Frostproof
The most populous age groups in Frostproof are 75 to 79 Years (151 | 11.6%) for men and Under 5 Years (267 | 16.2%) for women.
| Age Bracket | Male | Female |
| Under 5 Years | 39 (3.0%) | 267 (16.2%) |
| 5 to 9 Years | 44 (3.4%) | 36 (2.2%) |
| 10 to 14 Years | 70 (5.4%) | 61 (3.7%) |
| 15 to 19 Years | 65 (5.0%) | 104 (6.3%) |
| 20 to 24 Years | 45 (3.5%) | 96 (5.8%) |
| 25 to 29 Years | 95 (7.3%) | 50 (3.0%) |
| 30 to 34 Years | 94 (7.2%) | 137 (8.3%) |
| 35 to 39 Years | 26 (2.0%) | 94 (5.7%) |
| 40 to 44 Years | 45 (3.5%) | 19 (1.1%) |
| 45 to 49 Years | 47 (3.6%) | 48 (2.9%) |
| 50 to 54 Years | 58 (4.5%) | 82 (5.0%) |
| 55 to 59 Years | 76 (5.9%) | 134 (8.1%) |
| 60 to 64 Years | 100 (7.7%) | 110 (6.7%) |
| 65 to 69 Years | 130 (10.0%) | 89 (5.4%) |
| 70 to 74 Years | 47 (3.6%) | 163 (9.9%) |
| 75 to 79 Years | 151 (11.6%) | 62 (3.8%) |
| 80 to 84 Years | 63 (4.9%) | 30 (1.8%) |
| 85 Years and over | 102 (7.9%) | 67 (4.1%) |
| Total | 1,297 (100.0%) | 1,649 (100.0%) |
Families and Households in Frostproof
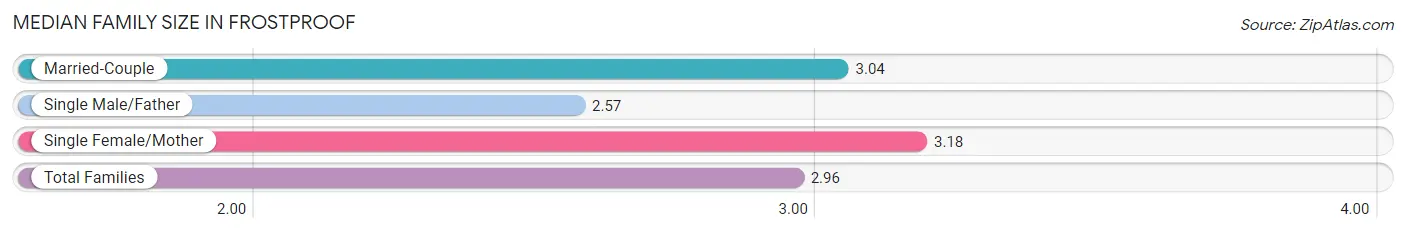
Median Family Size in Frostproof
The median family size in Frostproof is 2.96 persons per family, with single female/mother families (144 | 17.5%) accounting for the largest median family size of 3.18 persons per family. On the other hand, single male/father families (187 | 22.7%) represent the smallest median family size with 2.57 persons per family.
| Family Type | # Families | Family Size |
| Married-Couple | 493 (59.8%) | 3.04 |
| Single Male/Father | 187 (22.7%) | 2.57 |
| Single Female/Mother | 144 (17.5%) | 3.18 |
| Total Families | 824 (100.0%) | 2.96 |
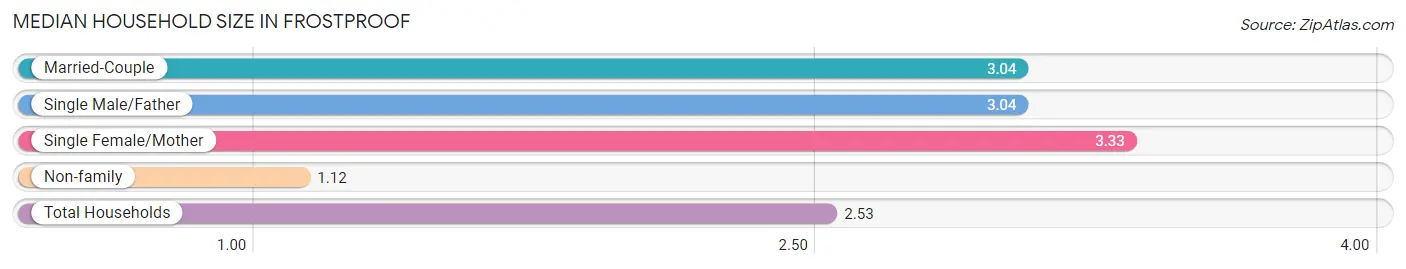
Median Household Size in Frostproof
The median household size in Frostproof is 2.53 persons per household, with single female/mother households (144 | 12.5%) accounting for the largest median household size of 3.33 persons per household. non-family households (327 | 28.4%) represent the smallest median household size with 1.12 persons per household.
| Household Type | # Households | Household Size |
| Married-Couple | 493 (42.8%) | 3.04 |
| Single Male/Father | 187 (16.3%) | 3.04 |
| Single Female/Mother | 144 (12.5%) | 3.33 |
| Non-family | 327 (28.4%) | 1.12 |
| Total Households | 1,151 (100.0%) | 2.53 |
Household Size by Marriage Status in Frostproof
Out of a total of 1,151 households in Frostproof, 824 (71.6%) are family households, while 327 (28.4%) are nonfamily households. The most numerous type of family households are 2-person households, comprising 442, and the most common type of nonfamily households are 1-person households, comprising 296.
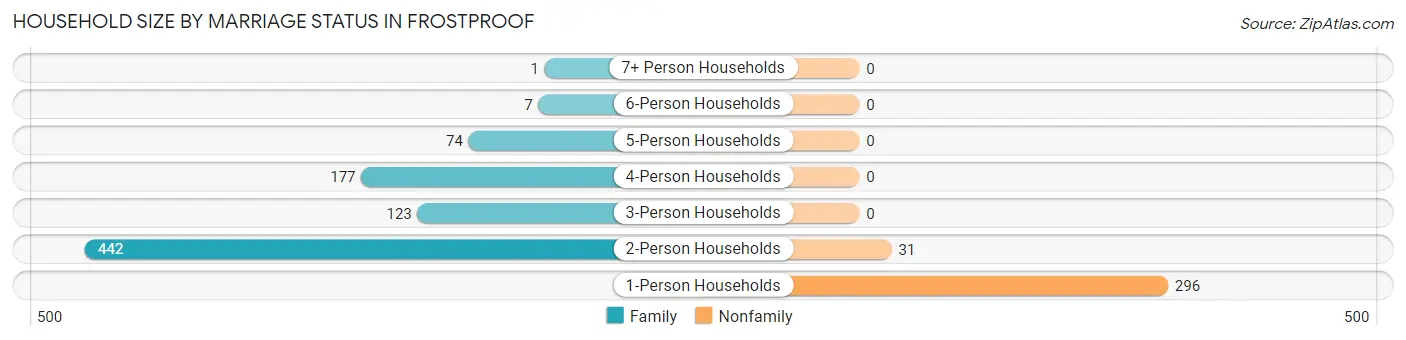
| Household Size | Family Households | Nonfamily Households |
| 1-Person Households | - | 296 (25.7%) |
| 2-Person Households | 442 (38.4%) | 31 (2.7%) |
| 3-Person Households | 123 (10.7%) | 0 (0.0%) |
| 4-Person Households | 177 (15.4%) | 0 (0.0%) |
| 5-Person Households | 74 (6.4%) | 0 (0.0%) |
| 6-Person Households | 7 (0.6%) | 0 (0.0%) |
| 7+ Person Households | 1 (0.1%) | 0 (0.0%) |
| Total | 824 (71.6%) | 327 (28.4%) |
Female Fertility in Frostproof
Fertility by Age in Frostproof
Average fertility rate in Frostproof is 44.0 births per 1,000 women. Women in the age bracket of 15 to 19 years have the highest fertility rate with 115.0 births per 1,000 women. Women in the age bracket of 15 to 19 years acount for 50.0% of all women with births.
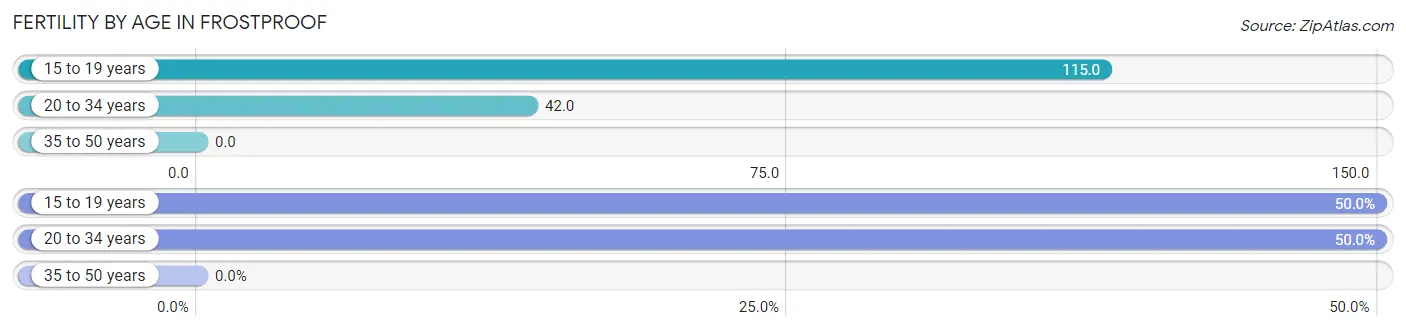
| Age Bracket | Women with Births | Births / 1,000 Women |
| 15 to 19 years | 12 (50.0%) | 115.0 |
| 20 to 34 years | 12 (50.0%) | 42.0 |
| 35 to 50 years | 0 (0.0%) | 0.0 |
| Total | 24 (100.0%) | 44.0 |
Fertility by Age by Marriage Status in Frostproof
37.5% of women with births (24) in Frostproof are married. The highest percentage of unmarried women with births falls into 15 to 19 years age bracket with 100.0% of them unmarried at the time of birth, while the lowest percentage of unmarried women with births belong to 20 to 34 years age bracket with 25.0% of them unmarried.
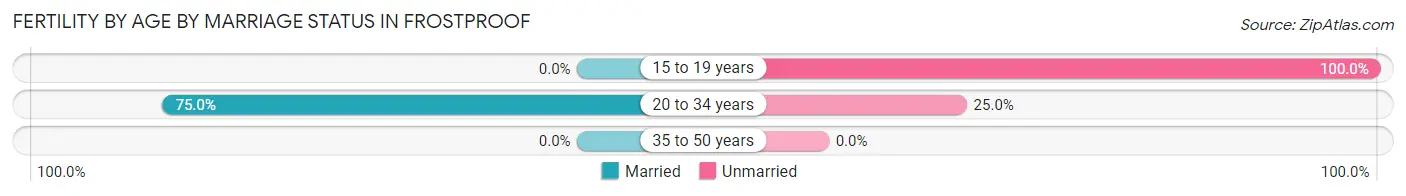
| Age Bracket | Married | Unmarried |
| 15 to 19 years | 0 (0.0%) | 12 (100.0%) |
| 20 to 34 years | 9 (75.0%) | 3 (25.0%) |
| 35 to 50 years | 0 (0.0%) | 0 (0.0%) |
| Total | 9 (37.5%) | 15 (62.5%) |
Fertility by Education in Frostproof
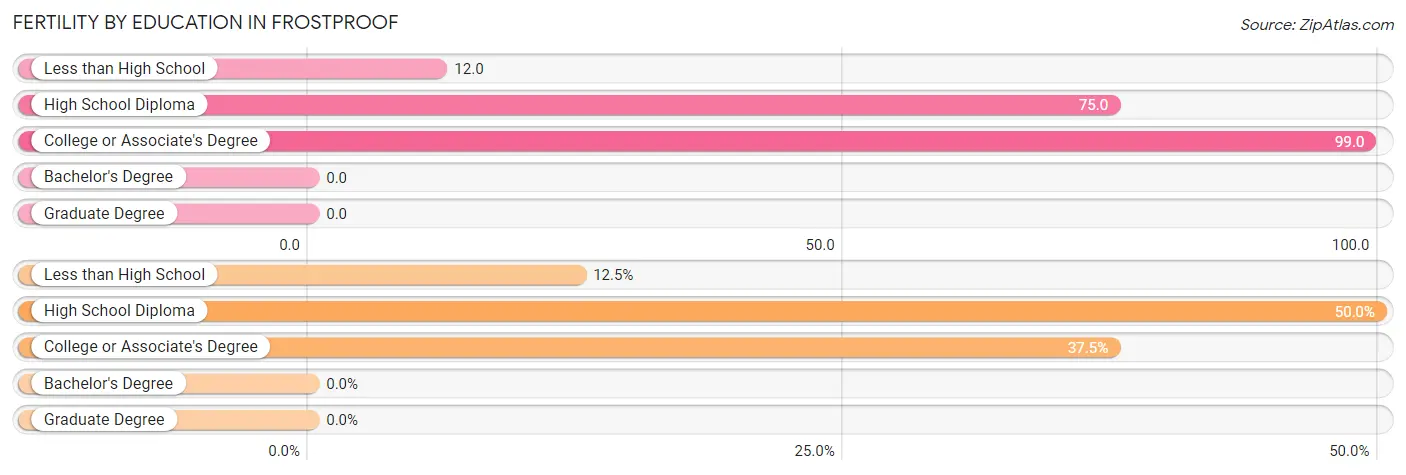
| Educational Attainment | Women with Births | Births / 1,000 Women |
| Less than High School | 3 (12.5%) | 12.0 |
| High School Diploma | 12 (50.0%) | 75.0 |
| College or Associate's Degree | 9 (37.5%) | 99.0 |
| Bachelor's Degree | 0 (0.0%) | 0.0 |
| Graduate Degree | 0 (0.0%) | 0.0 |
| Total | 24 (100.0%) | 44.0 |
Fertility by Education by Marriage Status in Frostproof
62.5% of women with births in Frostproof are unmarried. Women with the educational attainment of college or associate's degree are most likely to be married with 100.0% of them married at childbirth, while women with the educational attainment of less than high school are least likely to be married with 100.0% of them unmarried at childbirth.
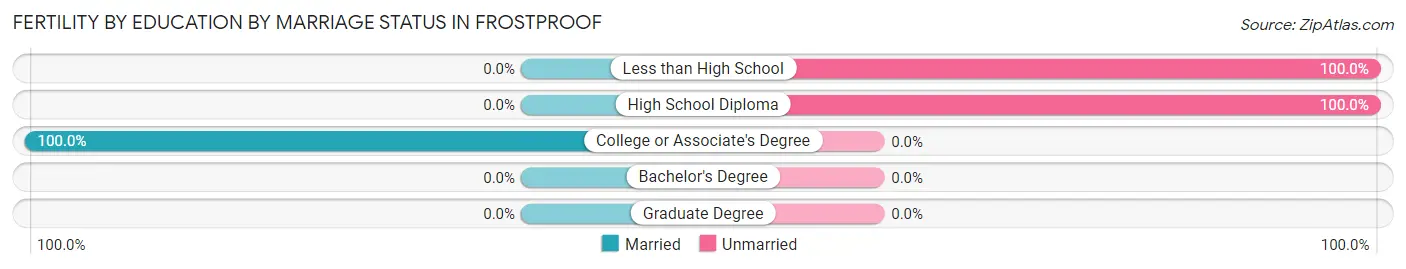
| Educational Attainment | Married | Unmarried |
| Less than High School | 0 (0.0%) | 3 (100.0%) |
| High School Diploma | 0 (0.0%) | 12 (100.0%) |
| College or Associate's Degree | 9 (100.0%) | 0 (0.0%) |
| Bachelor's Degree | 0 (0.0%) | 0 (0.0%) |
| Graduate Degree | 0 (0.0%) | 0 (0.0%) |
| Total | 9 (37.5%) | 15 (62.5%) |
Employment Characteristics in Frostproof
Employment by Class of Employer in Frostproof
Among the 949 employed individuals in Frostproof, private company employees (796 | 83.9%), state government employees (54 | 5.7%), and local government employees (39 | 4.1%) make up the most common classes of employment.
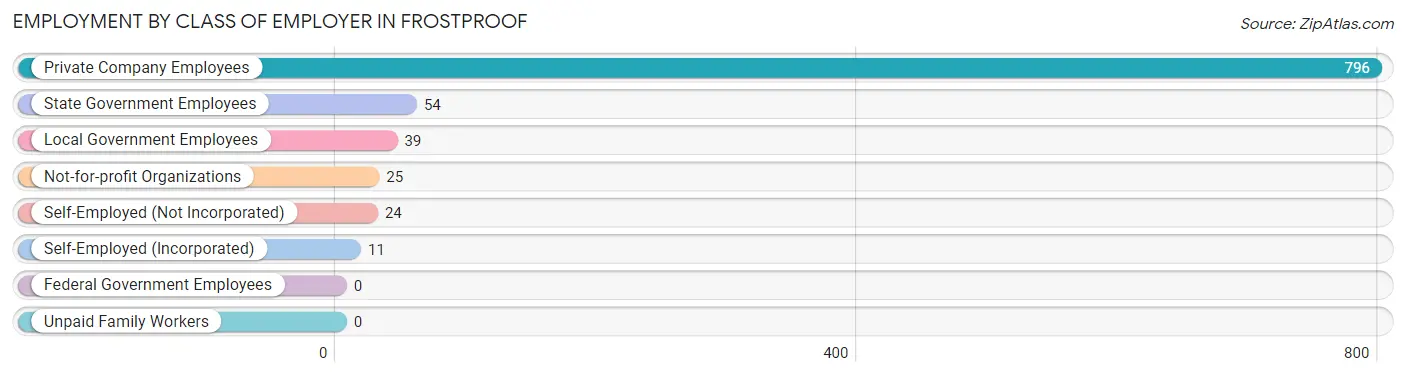
| Employer Class | # Employees | % Employees |
| Private Company Employees | 796 | 83.9% |
| Self-Employed (Incorporated) | 11 | 1.2% |
| Self-Employed (Not Incorporated) | 24 | 2.5% |
| Not-for-profit Organizations | 25 | 2.6% |
| Local Government Employees | 39 | 4.1% |
| State Government Employees | 54 | 5.7% |
| Federal Government Employees | 0 | 0.0% |
| Unpaid Family Workers | 0 | 0.0% |
| Total | 949 | 100.0% |
Employment Status by Age in Frostproof
According to the labor force statistics for Frostproof, out of the total population over 16 years of age (2,343), 44.4% or 1,040 individuals are in the labor force, with 8.2% or 85 of them unemployed. The age group with the highest labor force participation rate is 20 to 24 years, with 98.6% or 139 individuals in the labor force. Within the labor force, the 75 years and over age range has the highest percentage of unemployed individuals, with 58.6% or 17 of them being unemployed.
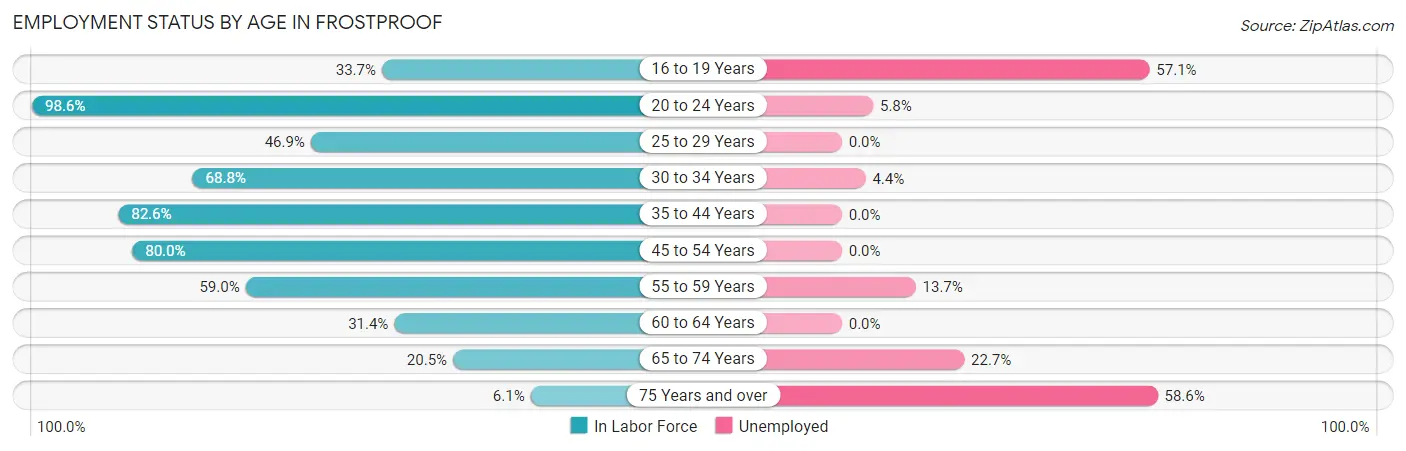
| Age Bracket | In Labor Force | Unemployed |
| 16 to 19 Years | 28 (33.7%) | 16 (57.1%) |
| 20 to 24 Years | 139 (98.6%) | 8 (5.8%) |
| 25 to 29 Years | 68 (46.9%) | 0 (0.0%) |
| 30 to 34 Years | 159 (68.8%) | 7 (4.4%) |
| 35 to 44 Years | 152 (82.6%) | 0 (0.0%) |
| 45 to 54 Years | 188 (80.0%) | 0 (0.0%) |
| 55 to 59 Years | 124 (59.0%) | 17 (13.7%) |
| 60 to 64 Years | 66 (31.4%) | 0 (0.0%) |
| 65 to 74 Years | 88 (20.5%) | 20 (22.7%) |
| 75 Years and over | 29 (6.1%) | 17 (58.6%) |
| Total | 1,040 (44.4%) | 85 (8.2%) |
Employment Status by Educational Attainment in Frostproof
According to labor force statistics for Frostproof, 62.3% of individuals (757) out of the total population between 25 and 64 years of age (1,215) are in the labor force, with 3.2% or 24 of them being unemployed. The group with the highest labor force participation rate are those with the educational attainment of bachelor's degree or higher, with 89.3% or 100 individuals in the labor force. Within the labor force, individuals with college / associate degree education have the highest percentage of unemployment, with 5.7% or 17 of them being unemployed.
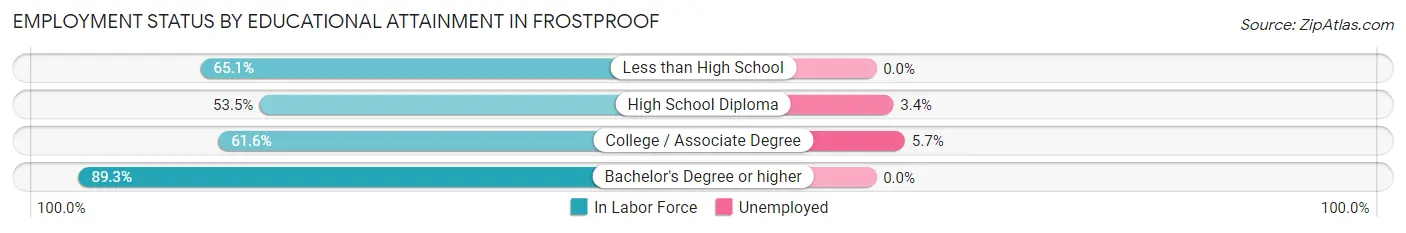
| Educational Attainment | In Labor Force | Unemployed |
| Less than High School | 153 (65.1%) | 0 (0.0%) |
| High School Diploma | 204 (53.5%) | 13 (3.4%) |
| College / Associate Degree | 300 (61.6%) | 28 (5.7%) |
| Bachelor's Degree or higher | 100 (89.3%) | 0 (0.0%) |
| Total | 757 (62.3%) | 39 (3.2%) |
Employment Occupations by Sex in Frostproof
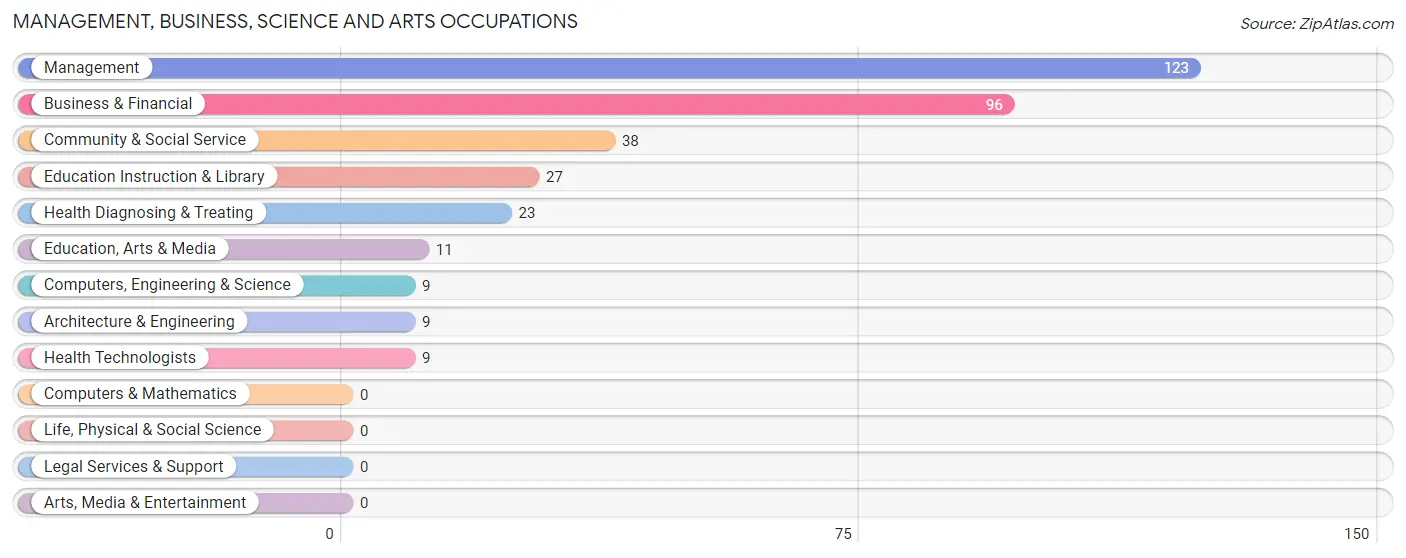
Management, Business, Science and Arts Occupations
The most common Management, Business, Science and Arts occupations in Frostproof are Management (123 | 12.9%), Business & Financial (96 | 10.0%), Community & Social Service (38 | 4.0%), Education Instruction & Library (27 | 2.8%), and Health Diagnosing & Treating (23 | 2.4%).
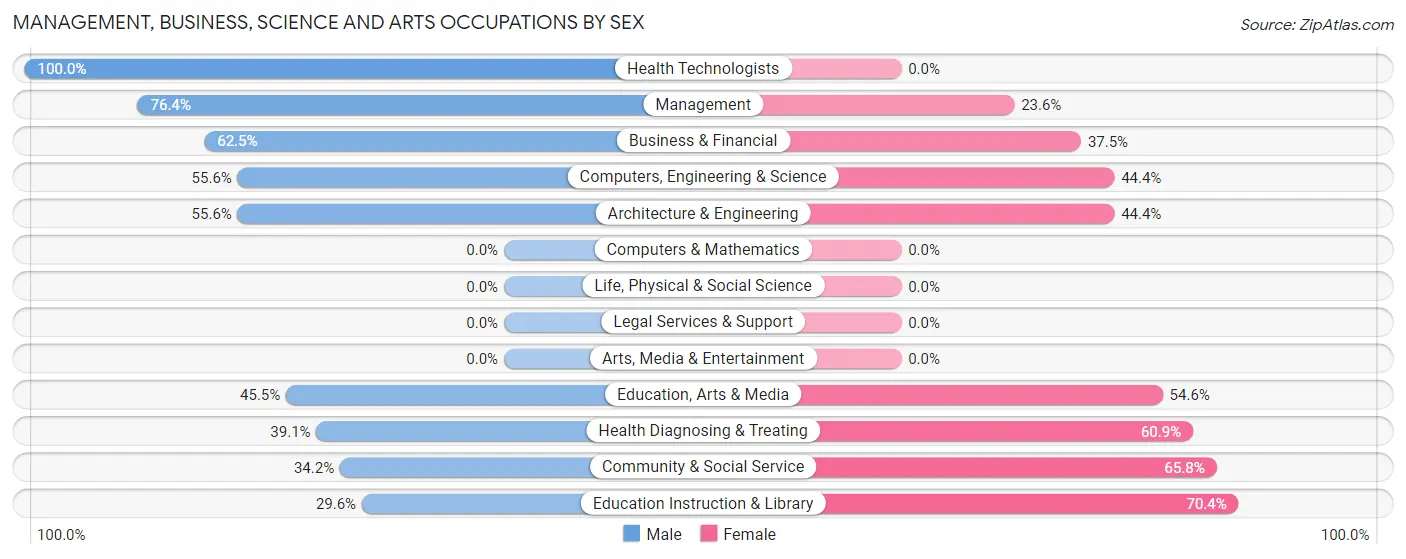
Management, Business, Science and Arts Occupations by Sex
Within the Management, Business, Science and Arts occupations in Frostproof, the most male-oriented occupations are Health Technologists (100.0%), Management (76.4%), and Business & Financial (62.5%), while the most female-oriented occupations are Education Instruction & Library (70.4%), Community & Social Service (65.8%), and Health Diagnosing & Treating (60.9%).
| Occupation | Male | Female |
| Management | 94 (76.4%) | 29 (23.6%) |
| Business & Financial | 60 (62.5%) | 36 (37.5%) |
| Computers, Engineering & Science | 5 (55.6%) | 4 (44.4%) |
| Computers & Mathematics | 0 (0.0%) | 0 (0.0%) |
| Architecture & Engineering | 5 (55.6%) | 4 (44.4%) |
| Life, Physical & Social Science | 0 (0.0%) | 0 (0.0%) |
| Community & Social Service | 13 (34.2%) | 25 (65.8%) |
| Education, Arts & Media | 5 (45.5%) | 6 (54.5%) |
| Legal Services & Support | 0 (0.0%) | 0 (0.0%) |
| Education Instruction & Library | 8 (29.6%) | 19 (70.4%) |
| Arts, Media & Entertainment | 0 (0.0%) | 0 (0.0%) |
| Health Diagnosing & Treating | 9 (39.1%) | 14 (60.9%) |
| Health Technologists | 9 (100.0%) | 0 (0.0%) |
| Total (Category) | 181 (62.6%) | 108 (37.4%) |
| Total (Overall) | 471 (49.3%) | 485 (50.7%) |
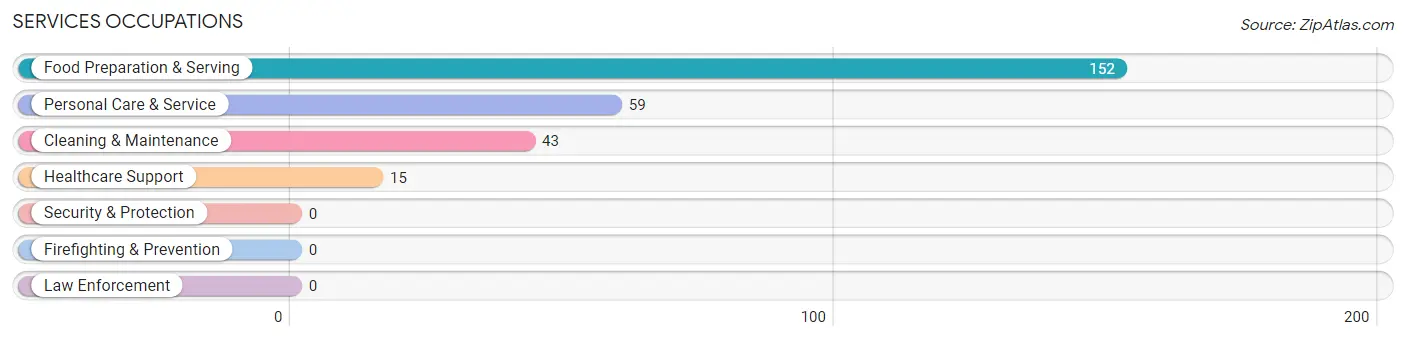
Services Occupations
The most common Services occupations in Frostproof are Food Preparation & Serving (152 | 15.9%), Personal Care & Service (59 | 6.2%), Cleaning & Maintenance (43 | 4.5%), and Healthcare Support (15 | 1.6%).
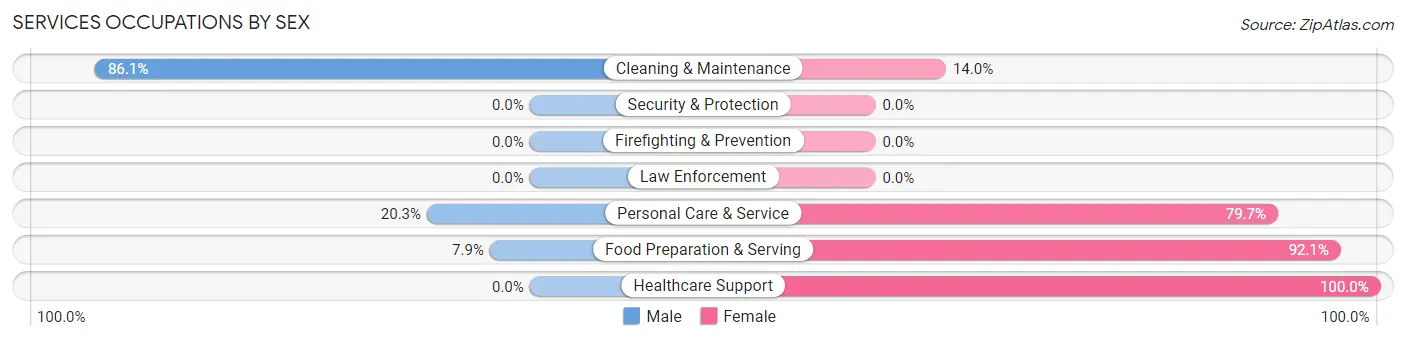
Services Occupations by Sex
Within the Services occupations in Frostproof, the most male-oriented occupations are Cleaning & Maintenance (86.1%), Personal Care & Service (20.3%), and Food Preparation & Serving (7.9%), while the most female-oriented occupations are Healthcare Support (100.0%), Food Preparation & Serving (92.1%), and Personal Care & Service (79.7%).
| Occupation | Male | Female |
| Healthcare Support | 0 (0.0%) | 15 (100.0%) |
| Security & Protection | 0 (0.0%) | 0 (0.0%) |
| Firefighting & Prevention | 0 (0.0%) | 0 (0.0%) |
| Law Enforcement | 0 (0.0%) | 0 (0.0%) |
| Food Preparation & Serving | 12 (7.9%) | 140 (92.1%) |
| Cleaning & Maintenance | 37 (86.1%) | 6 (14.0%) |
| Personal Care & Service | 12 (20.3%) | 47 (79.7%) |
| Total (Category) | 61 (22.7%) | 208 (77.3%) |
| Total (Overall) | 471 (49.3%) | 485 (50.7%) |
Sales and Office Occupations
The most common Sales and Office occupations in Frostproof are Office & Administration (164 | 17.2%), and Sales & Related (54 | 5.7%).
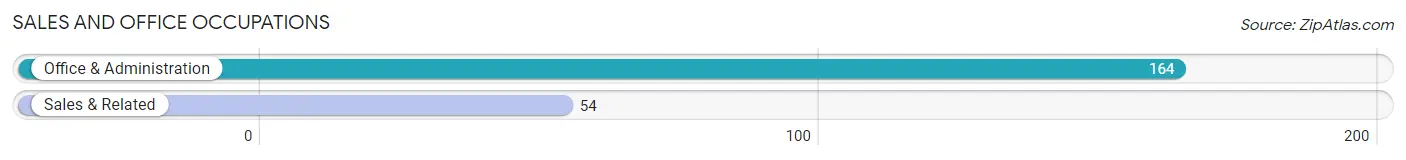
Sales and Office Occupations by Sex
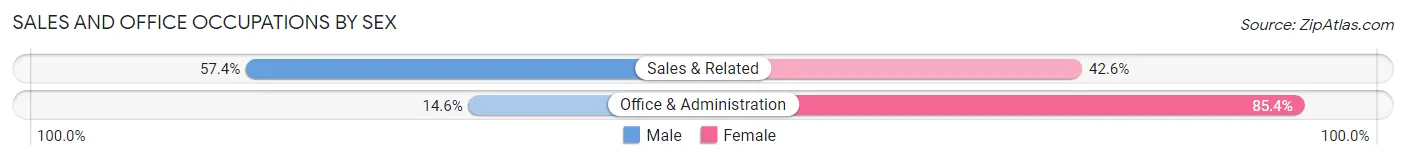
| Occupation | Male | Female |
| Sales & Related | 31 (57.4%) | 23 (42.6%) |
| Office & Administration | 24 (14.6%) | 140 (85.4%) |
| Total (Category) | 55 (25.2%) | 163 (74.8%) |
| Total (Overall) | 471 (49.3%) | 485 (50.7%) |
Natural Resources, Construction and Maintenance Occupations
The most common Natural Resources, Construction and Maintenance occupations in Frostproof are Farming, Fishing & Forestry (64 | 6.7%), Construction & Extraction (54 | 5.7%), and Installation, Maintenance & Repair (7 | 0.7%).
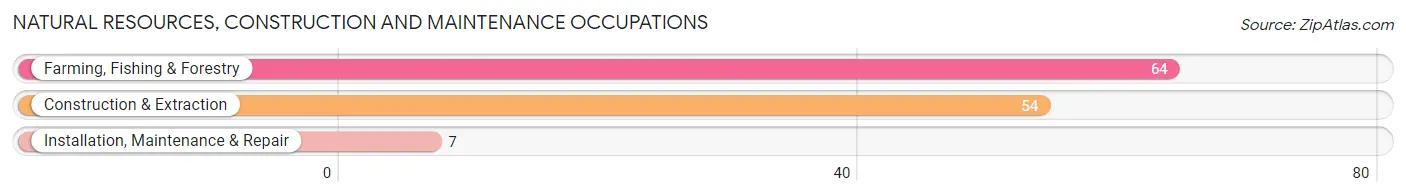
Natural Resources, Construction and Maintenance Occupations by Sex
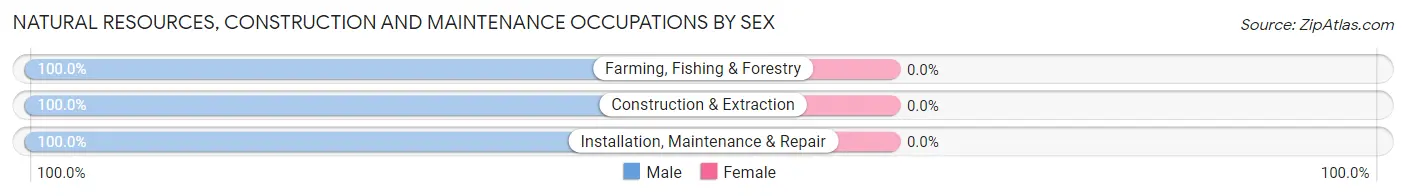
| Occupation | Male | Female |
| Farming, Fishing & Forestry | 64 (100.0%) | 0 (0.0%) |
| Construction & Extraction | 54 (100.0%) | 0 (0.0%) |
| Installation, Maintenance & Repair | 7 (100.0%) | 0 (0.0%) |
| Total (Category) | 125 (100.0%) | 0 (0.0%) |
| Total (Overall) | 471 (49.3%) | 485 (50.7%) |
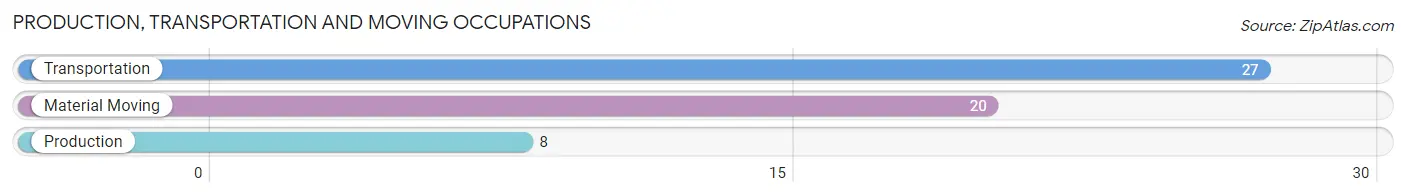
Production, Transportation and Moving Occupations
The most common Production, Transportation and Moving occupations in Frostproof are Transportation (27 | 2.8%), Material Moving (20 | 2.1%), and Production (8 | 0.8%).
Production, Transportation and Moving Occupations by Sex
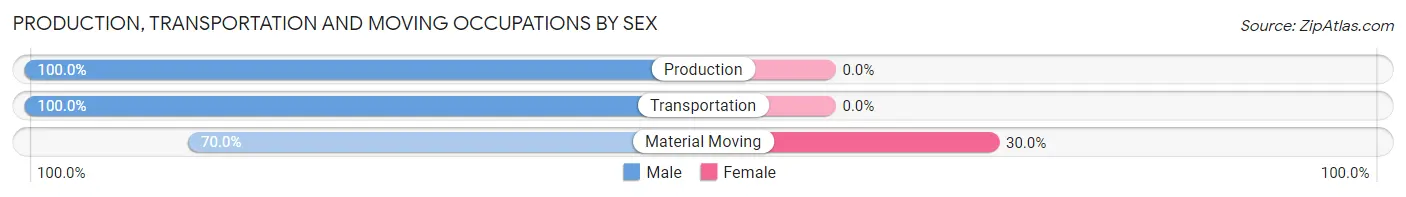
| Occupation | Male | Female |
| Production | 8 (100.0%) | 0 (0.0%) |
| Transportation | 27 (100.0%) | 0 (0.0%) |
| Material Moving | 14 (70.0%) | 6 (30.0%) |
| Total (Category) | 49 (89.1%) | 6 (10.9%) |
| Total (Overall) | 471 (49.3%) | 485 (50.7%) |
Employment Industries by Sex in Frostproof
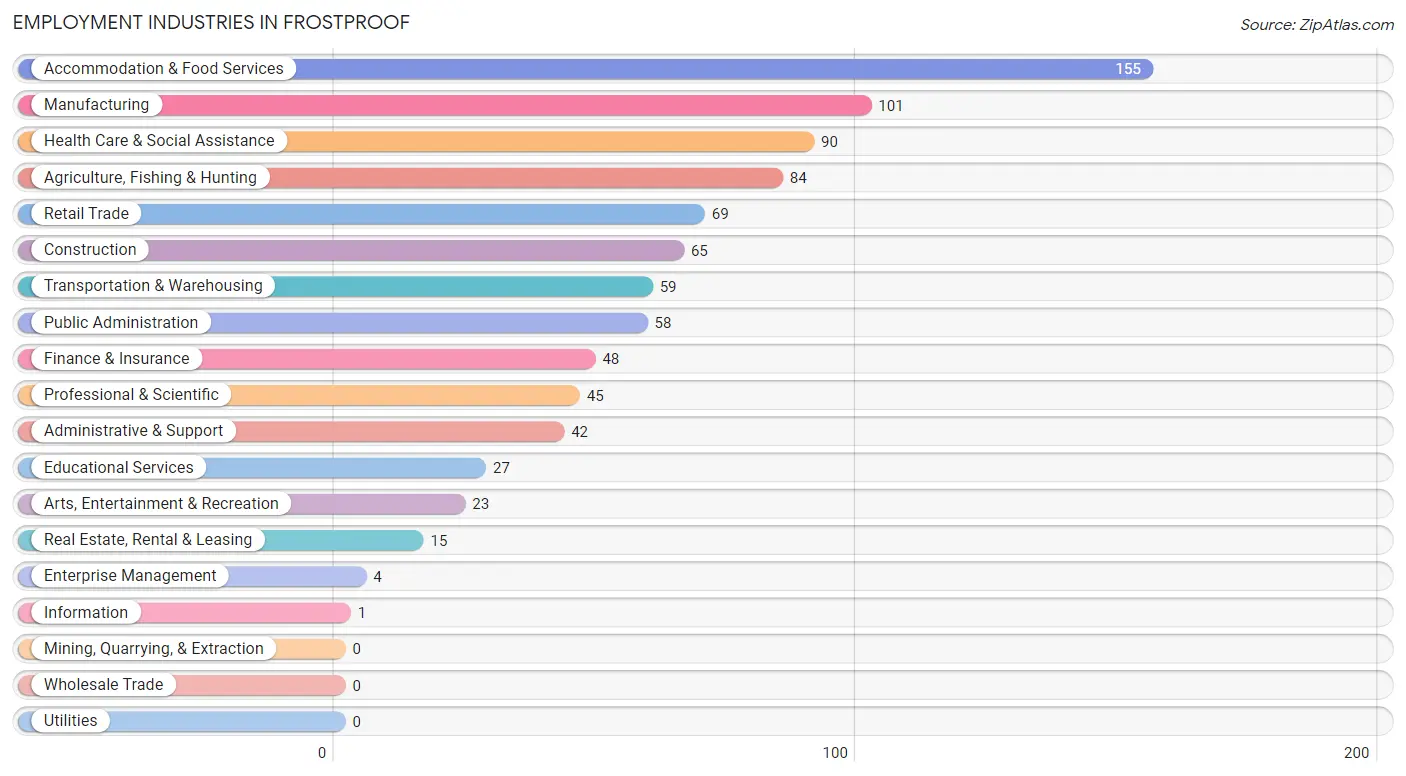
Employment Industries in Frostproof
The major employment industries in Frostproof include Accommodation & Food Services (155 | 16.2%), Manufacturing (101 | 10.6%), Health Care & Social Assistance (90 | 9.4%), Agriculture, Fishing & Hunting (84 | 8.8%), and Retail Trade (69 | 7.2%).
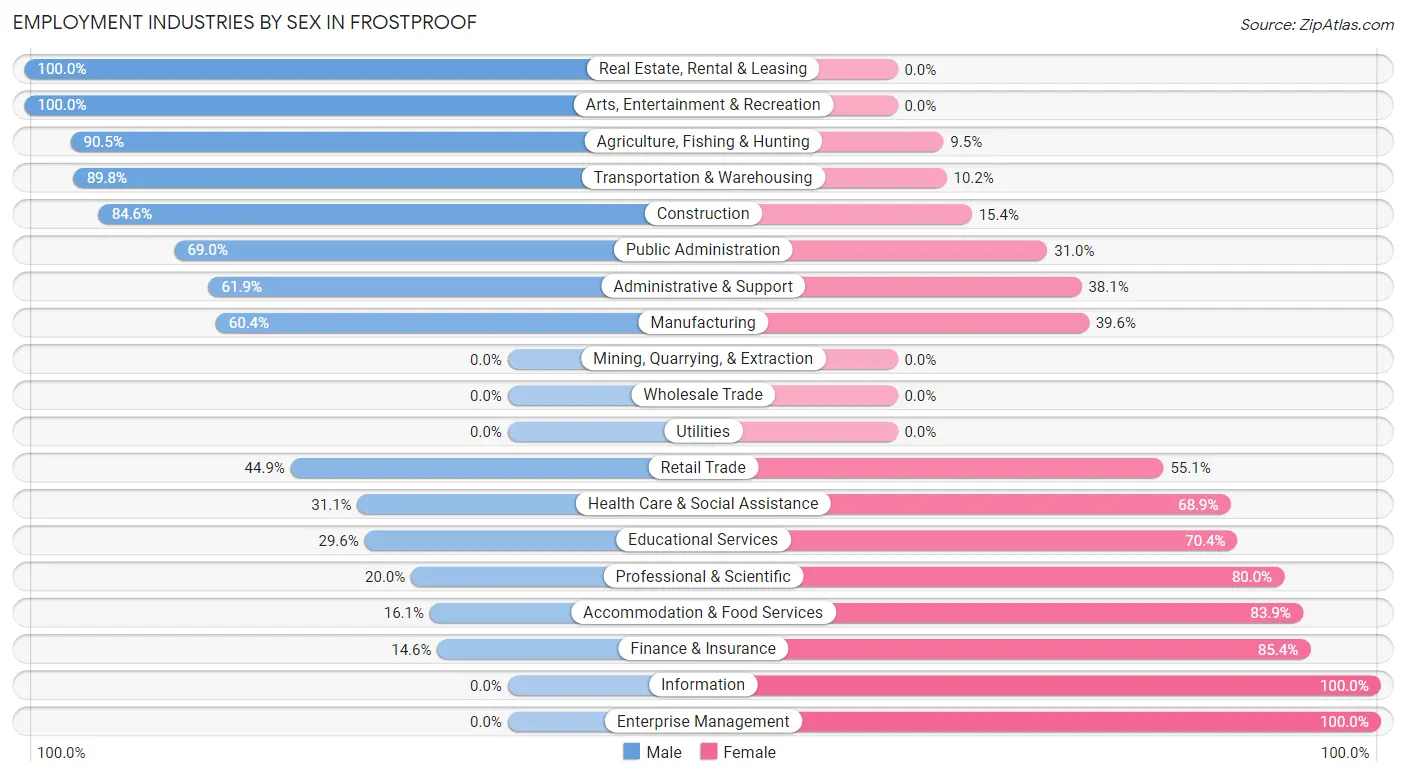
Employment Industries by Sex in Frostproof
The Frostproof industries that see more men than women are Real Estate, Rental & Leasing (100.0%), Arts, Entertainment & Recreation (100.0%), and Agriculture, Fishing & Hunting (90.5%), whereas the industries that tend to have a higher number of women are Information (100.0%), Enterprise Management (100.0%), and Finance & Insurance (85.4%).
| Industry | Male | Female |
| Agriculture, Fishing & Hunting | 76 (90.5%) | 8 (9.5%) |
| Mining, Quarrying, & Extraction | 0 (0.0%) | 0 (0.0%) |
| Construction | 55 (84.6%) | 10 (15.4%) |
| Manufacturing | 61 (60.4%) | 40 (39.6%) |
| Wholesale Trade | 0 (0.0%) | 0 (0.0%) |
| Retail Trade | 31 (44.9%) | 38 (55.1%) |
| Transportation & Warehousing | 53 (89.8%) | 6 (10.2%) |
| Utilities | 0 (0.0%) | 0 (0.0%) |
| Information | 0 (0.0%) | 1 (100.0%) |
| Finance & Insurance | 7 (14.6%) | 41 (85.4%) |
| Real Estate, Rental & Leasing | 15 (100.0%) | 0 (0.0%) |
| Professional & Scientific | 9 (20.0%) | 36 (80.0%) |
| Enterprise Management | 0 (0.0%) | 4 (100.0%) |
| Administrative & Support | 26 (61.9%) | 16 (38.1%) |
| Educational Services | 8 (29.6%) | 19 (70.4%) |
| Health Care & Social Assistance | 28 (31.1%) | 62 (68.9%) |
| Arts, Entertainment & Recreation | 23 (100.0%) | 0 (0.0%) |
| Accommodation & Food Services | 25 (16.1%) | 130 (83.9%) |
| Public Administration | 40 (69.0%) | 18 (31.0%) |
| Total | 471 (49.3%) | 485 (50.7%) |
Education in Frostproof
School Enrollment in Frostproof
The most common levels of schooling among the 365 students in Frostproof are middle school (129 | 35.3%), high school (102 | 28.0%), and college / undergraduate (59 | 16.2%).
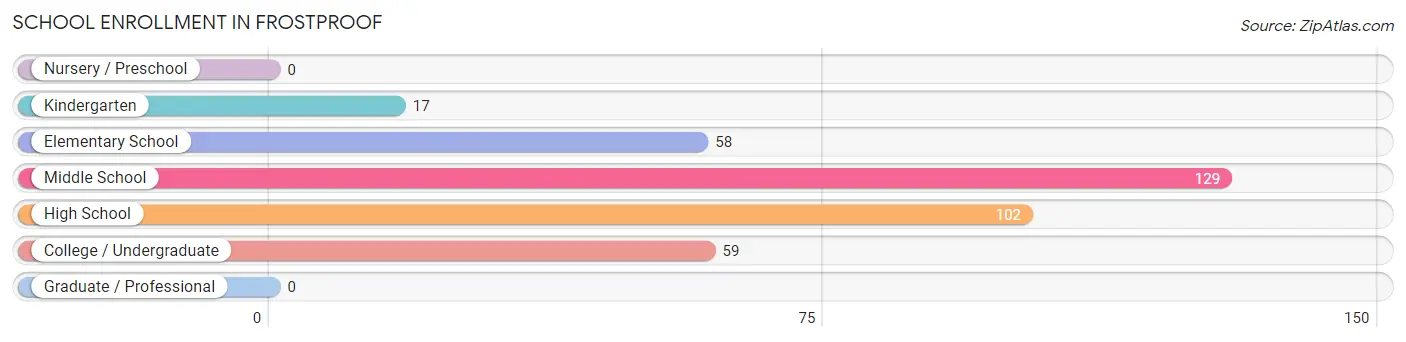
| School Level | # Students | % Students |
| Nursery / Preschool | 0 | 0.0% |
| Kindergarten | 17 | 4.7% |
| Elementary School | 58 | 15.9% |
| Middle School | 129 | 35.3% |
| High School | 102 | 28.0% |
| College / Undergraduate | 59 | 16.2% |
| Graduate / Professional | 0 | 0.0% |
| Total | 365 | 100.0% |
School Enrollment by Age by Funding Source in Frostproof
Out of a total of 365 students who are enrolled in schools in Frostproof, 40 (11.0%) attend a private institution, while the remaining 325 (89.0%) are enrolled in public schools. The age group of 15 to 17 year olds has the highest likelihood of being enrolled in private schools, with 31 (27.7% in the age bracket) enrolled. Conversely, the age group of 5 to 9 year old has the lowest likelihood of being enrolled in a private school, with 54 (100.0% in the age bracket) attending a public institution.
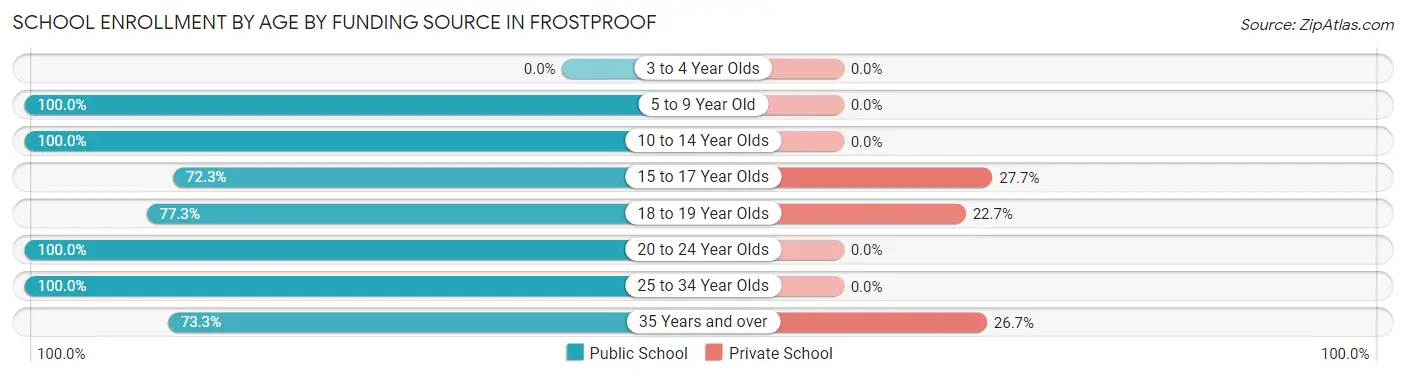
| Age Bracket | Public School | Private School |
| 3 to 4 Year Olds | 0 (0.0%) | 0 (0.0%) |
| 5 to 9 Year Old | 54 (100.0%) | 0 (0.0%) |
| 10 to 14 Year Olds | 131 (100.0%) | 0 (0.0%) |
| 15 to 17 Year Olds | 81 (72.3%) | 31 (27.7%) |
| 18 to 19 Year Olds | 17 (77.3%) | 5 (22.7%) |
| 20 to 24 Year Olds | 8 (100.0%) | 0 (0.0%) |
| 25 to 34 Year Olds | 23 (100.0%) | 0 (0.0%) |
| 35 Years and over | 11 (73.3%) | 4 (26.7%) |
| Total | 325 (89.0%) | 40 (11.0%) |
Educational Attainment by Field of Study in Frostproof
Education (73 | 29.4%), business (64 | 25.8%), communications (29 | 11.7%), engineering (19 | 7.7%), and liberal arts & history (12 | 4.8%) are the most common fields of study among 248 individuals in Frostproof who have obtained a bachelor's degree or higher.
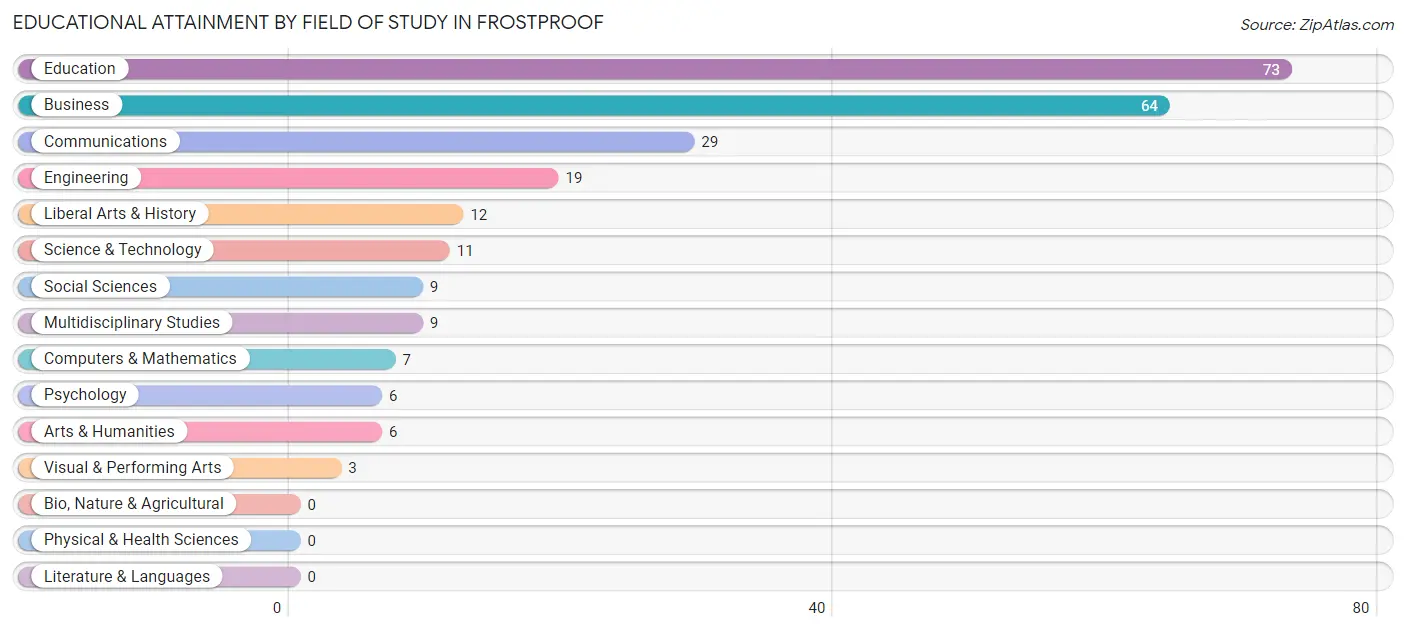
| Field of Study | # Graduates | % Graduates |
| Computers & Mathematics | 7 | 2.8% |
| Bio, Nature & Agricultural | 0 | 0.0% |
| Physical & Health Sciences | 0 | 0.0% |
| Psychology | 6 | 2.4% |
| Social Sciences | 9 | 3.6% |
| Engineering | 19 | 7.7% |
| Multidisciplinary Studies | 9 | 3.6% |
| Science & Technology | 11 | 4.4% |
| Business | 64 | 25.8% |
| Education | 73 | 29.4% |
| Literature & Languages | 0 | 0.0% |
| Liberal Arts & History | 12 | 4.8% |
| Visual & Performing Arts | 3 | 1.2% |
| Communications | 29 | 11.7% |
| Arts & Humanities | 6 | 2.4% |
| Total | 248 | 100.0% |
Transportation & Commute in Frostproof
Vehicle Availability by Sex in Frostproof
The most prevalent vehicle ownership categories in Frostproof are males with 2 vehicles (286, accounting for 61.6%) and females with 2 vehicles (210, making up 59.0%).
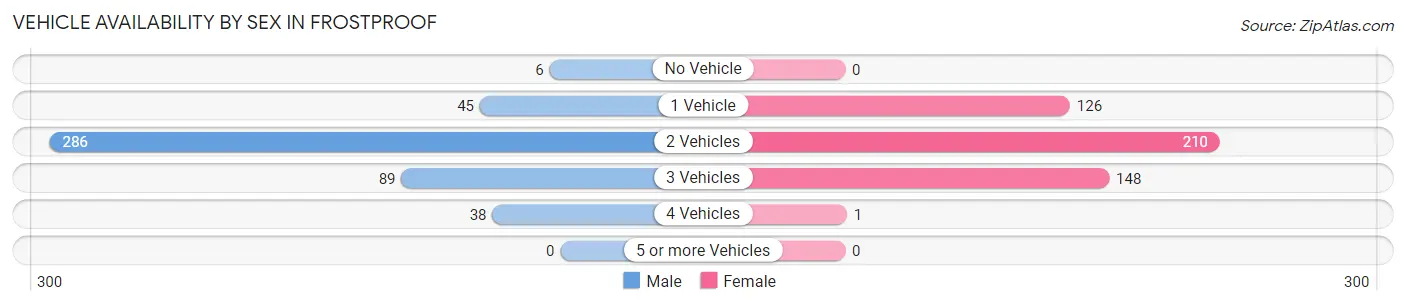
| Vehicles Available | Male | Female |
| No Vehicle | 6 (1.3%) | 0 (0.0%) |
| 1 Vehicle | 45 (9.7%) | 126 (26.0%) |
| 2 Vehicles | 286 (61.6%) | 210 (43.3%) |
| 3 Vehicles | 89 (19.2%) | 148 (30.5%) |
| 4 Vehicles | 38 (8.2%) | 1 (0.2%) |
| 5 or more Vehicles | 0 (0.0%) | 0 (0.0%) |
| Total | 464 (100.0%) | 485 (100.0%) |
Commute Time in Frostproof
The most frequently occuring commute durations in Frostproof are 15 to 19 minutes (212 commuters, 25.0%), less than 5 minutes (97 commuters, 11.4%), and 5 to 9 minutes (94 commuters, 11.1%).
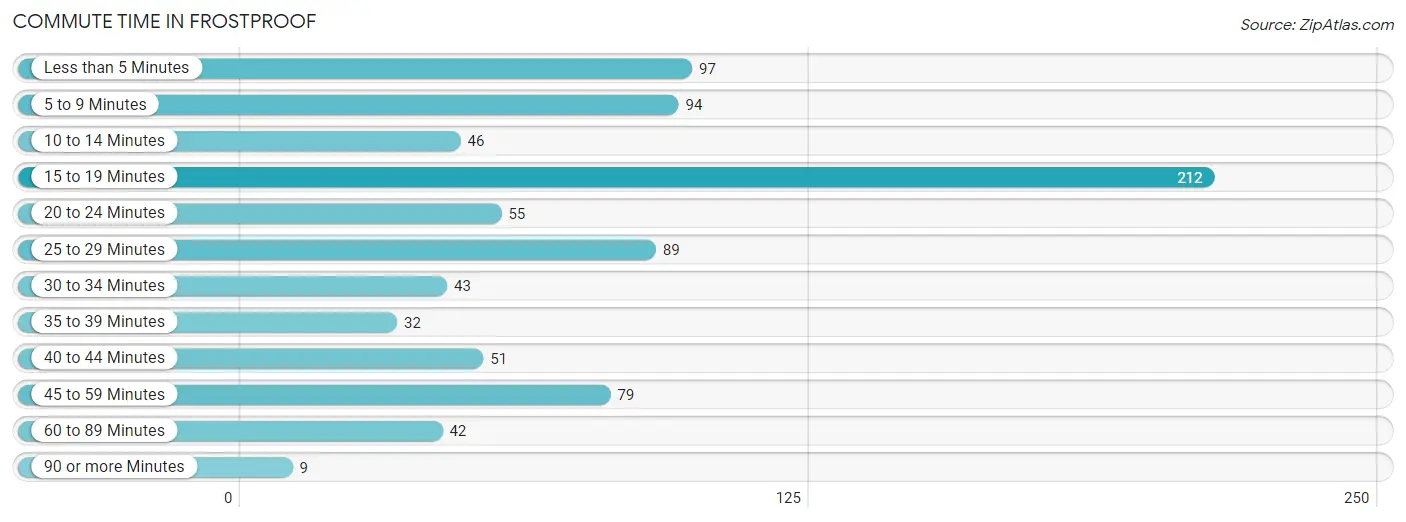
| Commute Time | # Commuters | % Commuters |
| Less than 5 Minutes | 97 | 11.4% |
| 5 to 9 Minutes | 94 | 11.1% |
| 10 to 14 Minutes | 46 | 5.4% |
| 15 to 19 Minutes | 212 | 25.0% |
| 20 to 24 Minutes | 55 | 6.5% |
| 25 to 29 Minutes | 89 | 10.5% |
| 30 to 34 Minutes | 43 | 5.1% |
| 35 to 39 Minutes | 32 | 3.8% |
| 40 to 44 Minutes | 51 | 6.0% |
| 45 to 59 Minutes | 79 | 9.3% |
| 60 to 89 Minutes | 42 | 5.0% |
| 90 or more Minutes | 9 | 1.1% |
Commute Time by Sex in Frostproof
The most common commute times in Frostproof are less than 5 minutes (83 commuters, 18.6%) for males and 15 to 19 minutes (163 commuters, 40.5%) for females.
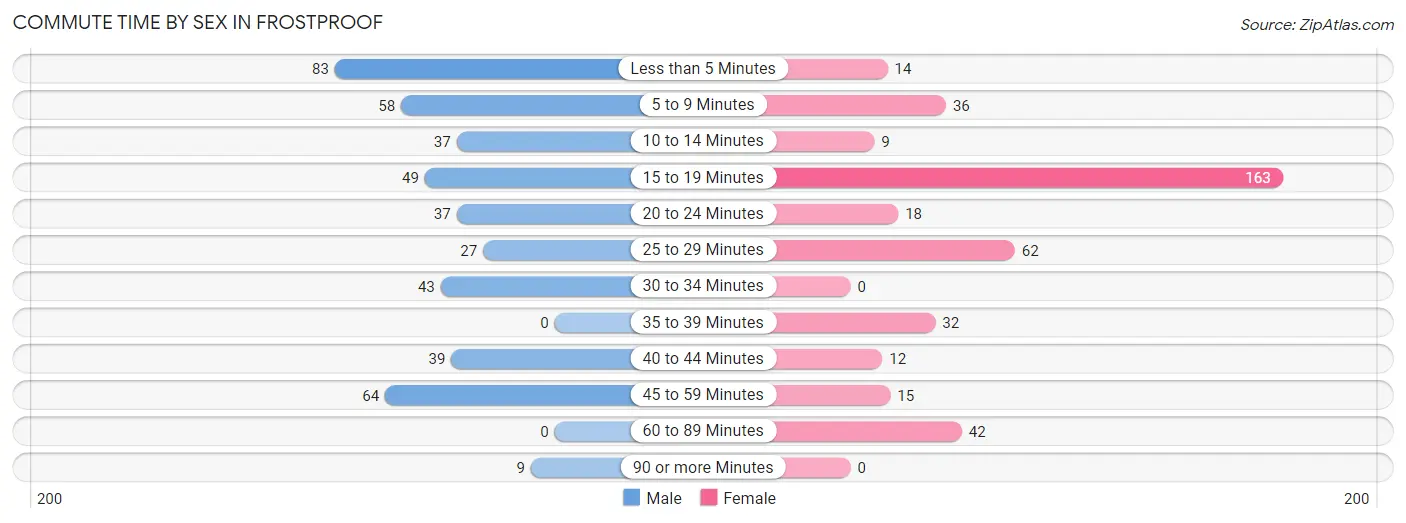
| Commute Time | Male | Female |
| Less than 5 Minutes | 83 (18.6%) | 14 (3.5%) |
| 5 to 9 Minutes | 58 (13.0%) | 36 (8.9%) |
| 10 to 14 Minutes | 37 (8.3%) | 9 (2.2%) |
| 15 to 19 Minutes | 49 (11.0%) | 163 (40.5%) |
| 20 to 24 Minutes | 37 (8.3%) | 18 (4.5%) |
| 25 to 29 Minutes | 27 (6.0%) | 62 (15.4%) |
| 30 to 34 Minutes | 43 (9.6%) | 0 (0.0%) |
| 35 to 39 Minutes | 0 (0.0%) | 32 (7.9%) |
| 40 to 44 Minutes | 39 (8.7%) | 12 (3.0%) |
| 45 to 59 Minutes | 64 (14.3%) | 15 (3.7%) |
| 60 to 89 Minutes | 0 (0.0%) | 42 (10.4%) |
| 90 or more Minutes | 9 (2.0%) | 0 (0.0%) |
Time of Departure to Work by Sex in Frostproof
The most frequent times of departure to work in Frostproof are 7:00 AM to 7:29 AM (119, 26.7%) for males and 7:30 AM to 7:59 AM (89, 22.1%) for females.
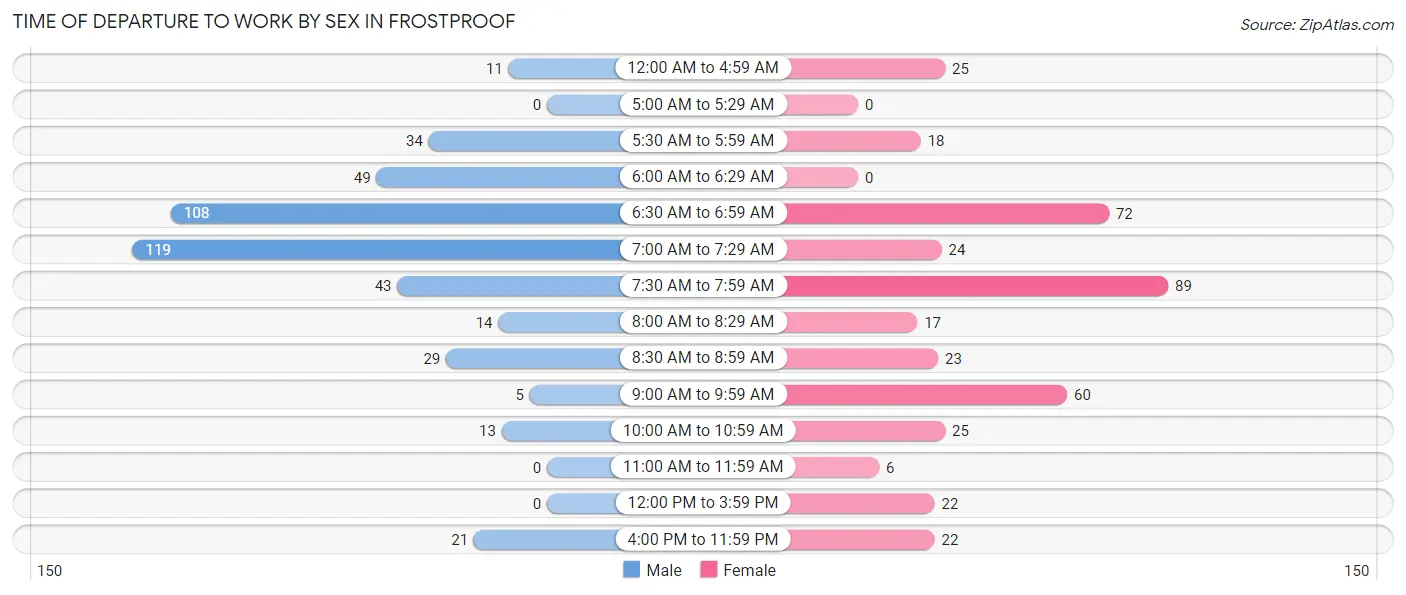
| Time of Departure | Male | Female |
| 12:00 AM to 4:59 AM | 11 (2.5%) | 25 (6.2%) |
| 5:00 AM to 5:29 AM | 0 (0.0%) | 0 (0.0%) |
| 5:30 AM to 5:59 AM | 34 (7.6%) | 18 (4.5%) |
| 6:00 AM to 6:29 AM | 49 (11.0%) | 0 (0.0%) |
| 6:30 AM to 6:59 AM | 108 (24.2%) | 72 (17.9%) |
| 7:00 AM to 7:29 AM | 119 (26.7%) | 24 (6.0%) |
| 7:30 AM to 7:59 AM | 43 (9.6%) | 89 (22.1%) |
| 8:00 AM to 8:29 AM | 14 (3.1%) | 17 (4.2%) |
| 8:30 AM to 8:59 AM | 29 (6.5%) | 23 (5.7%) |
| 9:00 AM to 9:59 AM | 5 (1.1%) | 60 (14.9%) |
| 10:00 AM to 10:59 AM | 13 (2.9%) | 25 (6.2%) |
| 11:00 AM to 11:59 AM | 0 (0.0%) | 6 (1.5%) |
| 12:00 PM to 3:59 PM | 0 (0.0%) | 22 (5.5%) |
| 4:00 PM to 11:59 PM | 21 (4.7%) | 22 (5.5%) |
| Total | 446 (100.0%) | 403 (100.0%) |
Housing Occupancy in Frostproof
Occupancy by Ownership in Frostproof
Of the total 1,151 dwellings in Frostproof, owner-occupied units account for 799 (69.4%), while renter-occupied units make up 352 (30.6%).
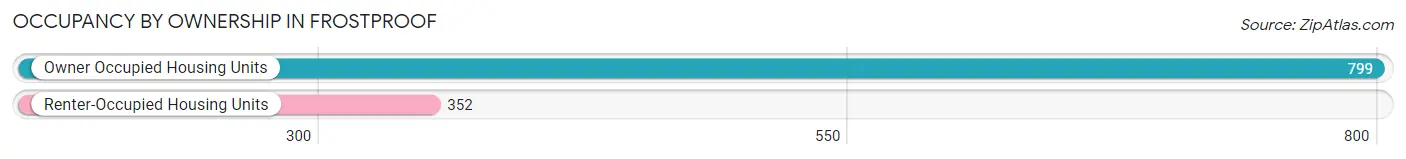
| Occupancy | # Housing Units | % Housing Units |
| Owner Occupied Housing Units | 799 | 69.4% |
| Renter-Occupied Housing Units | 352 | 30.6% |
| Total Occupied Housing Units | 1,151 | 100.0% |
Occupancy by Household Size in Frostproof
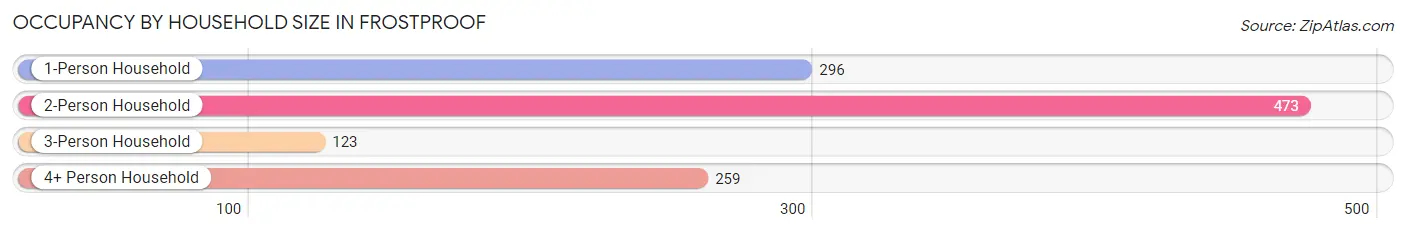
| Household Size | # Housing Units | % Housing Units |
| 1-Person Household | 296 | 25.7% |
| 2-Person Household | 473 | 41.1% |
| 3-Person Household | 123 | 10.7% |
| 4+ Person Household | 259 | 22.5% |
| Total Housing Units | 1,151 | 100.0% |
Occupancy by Ownership by Household Size in Frostproof
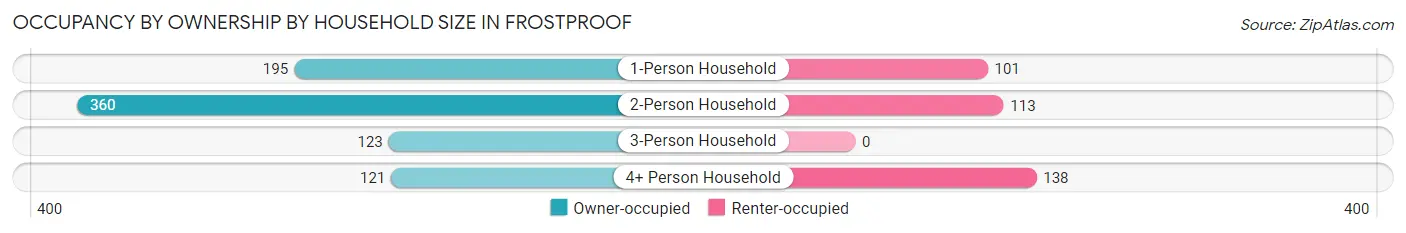
| Household Size | Owner-occupied | Renter-occupied |
| 1-Person Household | 195 (65.9%) | 101 (34.1%) |
| 2-Person Household | 360 (76.1%) | 113 (23.9%) |
| 3-Person Household | 123 (100.0%) | 0 (0.0%) |
| 4+ Person Household | 121 (46.7%) | 138 (53.3%) |
| Total Housing Units | 799 (69.4%) | 352 (30.6%) |
Occupancy by Educational Attainment in Frostproof
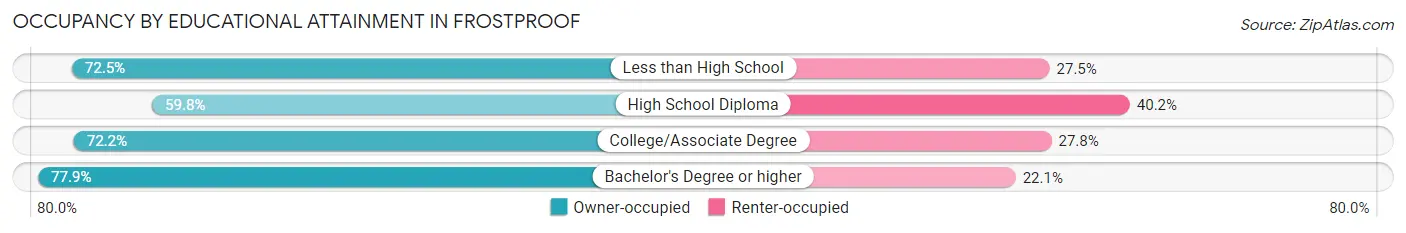
| Household Size | Owner-occupied | Renter-occupied |
| Less than High School | 224 (72.5%) | 85 (27.5%) |
| High School Diploma | 196 (59.8%) | 132 (40.2%) |
| College/Associate Degree | 270 (72.2%) | 104 (27.8%) |
| Bachelor's Degree or higher | 109 (77.9%) | 31 (22.1%) |
Occupancy by Age of Householder in Frostproof
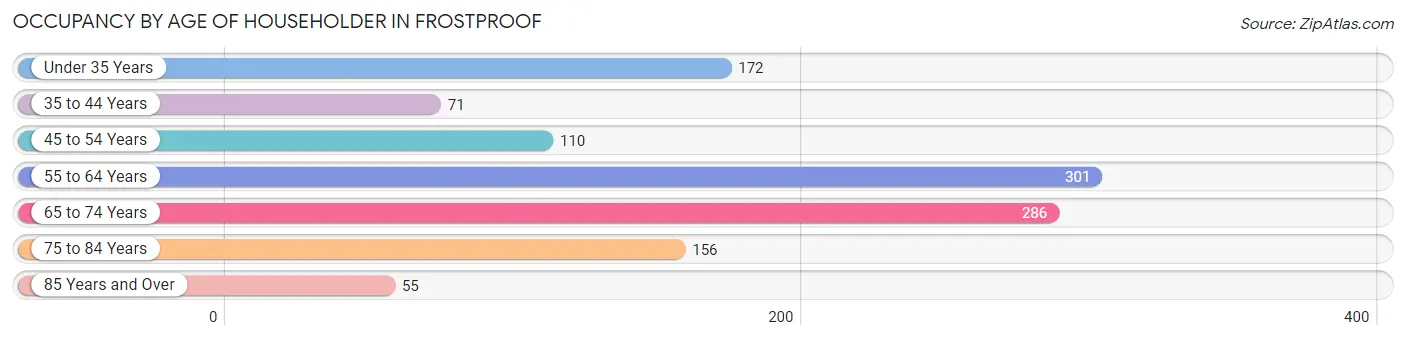
| Age Bracket | # Households | % Households |
| Under 35 Years | 172 | 14.9% |
| 35 to 44 Years | 71 | 6.2% |
| 45 to 54 Years | 110 | 9.6% |
| 55 to 64 Years | 301 | 26.2% |
| 65 to 74 Years | 286 | 24.8% |
| 75 to 84 Years | 156 | 13.6% |
| 85 Years and Over | 55 | 4.8% |
| Total | 1,151 | 100.0% |
Housing Finances in Frostproof
Median Income by Occupancy in Frostproof
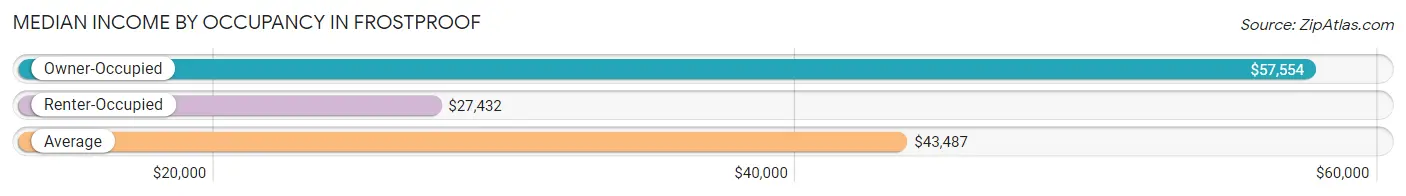
| Occupancy Type | # Households | Median Income |
| Owner-Occupied | 799 (69.4%) | $57,554 |
| Renter-Occupied | 352 (30.6%) | $27,432 |
| Average | 1,151 (100.0%) | $43,487 |
Occupancy by Householder Income Bracket in Frostproof
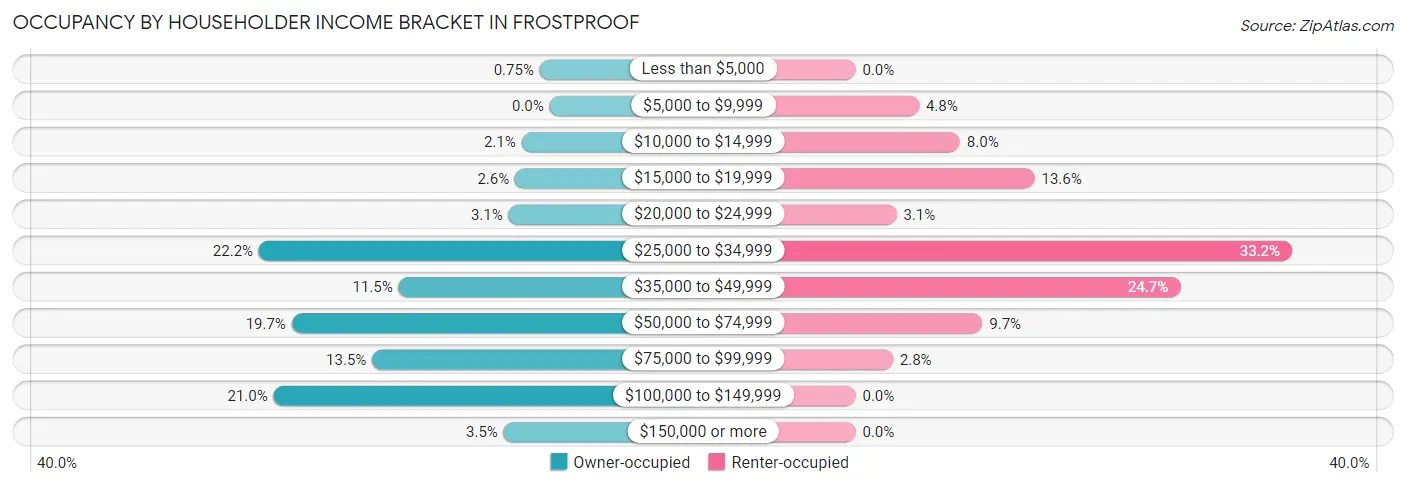
| Income Bracket | Owner-occupied | Renter-occupied |
| Less than $5,000 | 6 (0.7%) | 0 (0.0%) |
| $5,000 to $9,999 | 0 (0.0%) | 17 (4.8%) |
| $10,000 to $14,999 | 17 (2.1%) | 28 (8.0%) |
| $15,000 to $19,999 | 21 (2.6%) | 48 (13.6%) |
| $20,000 to $24,999 | 25 (3.1%) | 11 (3.1%) |
| $25,000 to $34,999 | 177 (22.2%) | 117 (33.2%) |
| $35,000 to $49,999 | 92 (11.5%) | 87 (24.7%) |
| $50,000 to $74,999 | 157 (19.7%) | 34 (9.7%) |
| $75,000 to $99,999 | 108 (13.5%) | 10 (2.8%) |
| $100,000 to $149,999 | 168 (21.0%) | 0 (0.0%) |
| $150,000 or more | 28 (3.5%) | 0 (0.0%) |
| Total | 799 (100.0%) | 352 (100.0%) |
Monthly Housing Cost Tiers in Frostproof
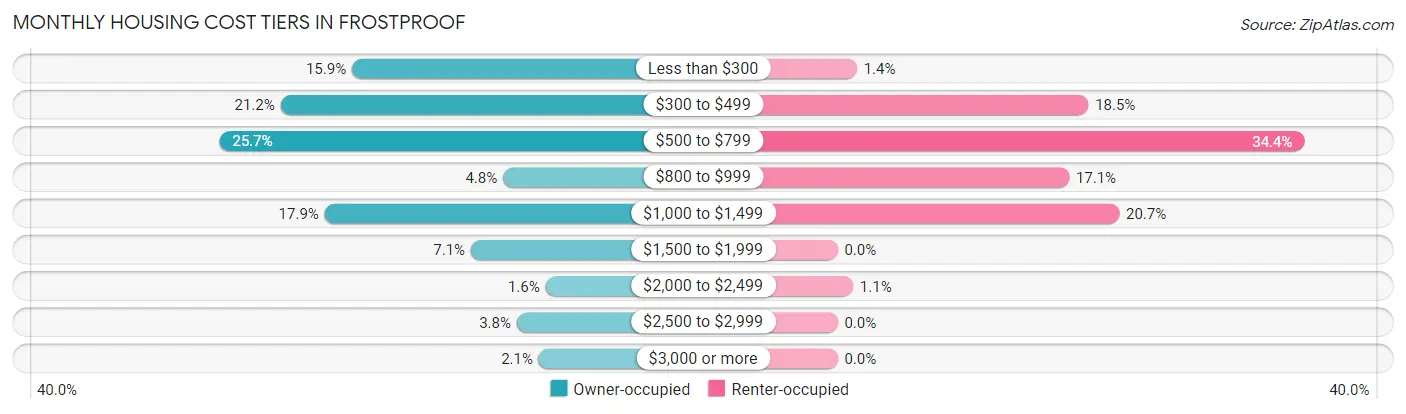
| Monthly Cost | Owner-occupied | Renter-occupied |
| Less than $300 | 127 (15.9%) | 5 (1.4%) |
| $300 to $499 | 169 (21.1%) | 65 (18.5%) |
| $500 to $799 | 205 (25.7%) | 121 (34.4%) |
| $800 to $999 | 38 (4.8%) | 60 (17.1%) |
| $1,000 to $1,499 | 143 (17.9%) | 73 (20.7%) |
| $1,500 to $1,999 | 57 (7.1%) | 0 (0.0%) |
| $2,000 to $2,499 | 13 (1.6%) | 4 (1.1%) |
| $2,500 to $2,999 | 30 (3.7%) | 0 (0.0%) |
| $3,000 or more | 17 (2.1%) | 0 (0.0%) |
| Total | 799 (100.0%) | 352 (100.0%) |
Physical Housing Characteristics in Frostproof
Housing Structures in Frostproof
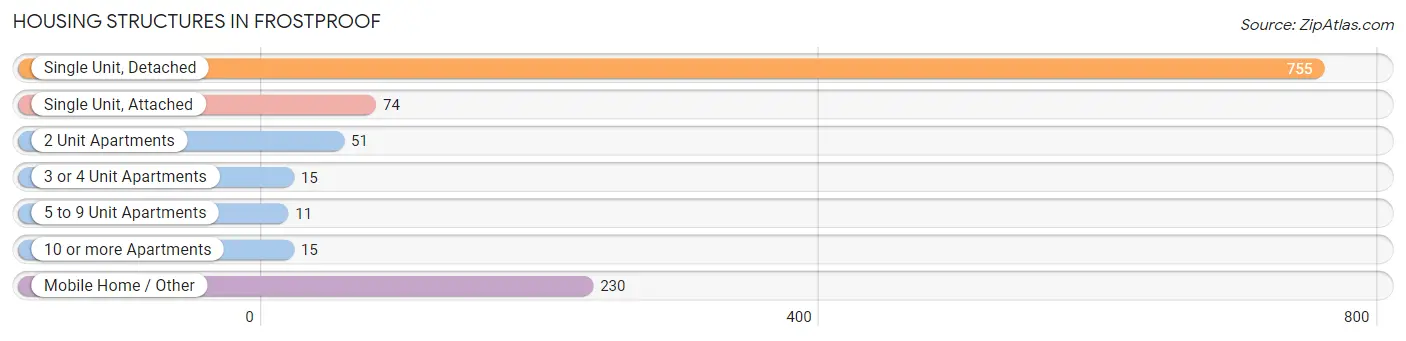
| Structure Type | # Housing Units | % Housing Units |
| Single Unit, Detached | 755 | 65.6% |
| Single Unit, Attached | 74 | 6.4% |
| 2 Unit Apartments | 51 | 4.4% |
| 3 or 4 Unit Apartments | 15 | 1.3% |
| 5 to 9 Unit Apartments | 11 | 1.0% |
| 10 or more Apartments | 15 | 1.3% |
| Mobile Home / Other | 230 | 20.0% |
| Total | 1,151 | 100.0% |
Housing Structures by Occupancy in Frostproof
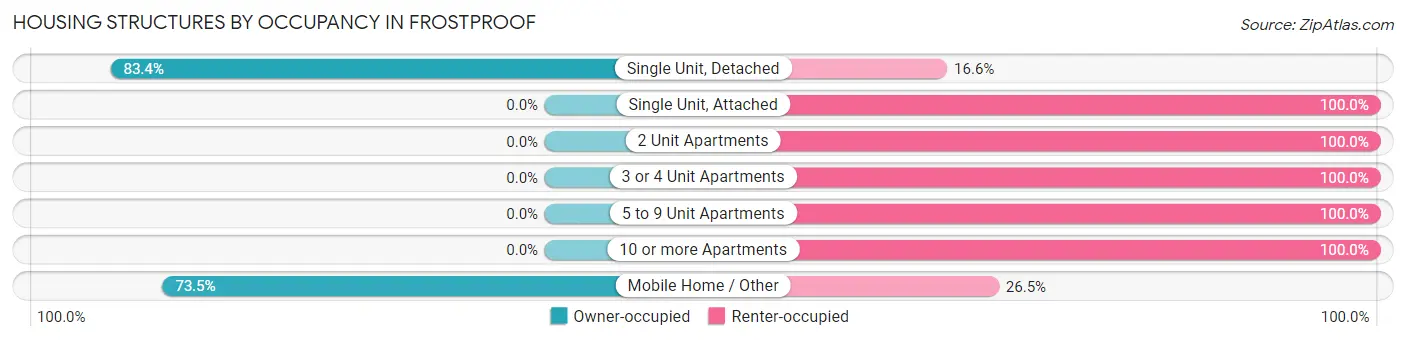
| Structure Type | Owner-occupied | Renter-occupied |
| Single Unit, Detached | 630 (83.4%) | 125 (16.6%) |
| Single Unit, Attached | 0 (0.0%) | 74 (100.0%) |
| 2 Unit Apartments | 0 (0.0%) | 51 (100.0%) |
| 3 or 4 Unit Apartments | 0 (0.0%) | 15 (100.0%) |
| 5 to 9 Unit Apartments | 0 (0.0%) | 11 (100.0%) |
| 10 or more Apartments | 0 (0.0%) | 15 (100.0%) |
| Mobile Home / Other | 169 (73.5%) | 61 (26.5%) |
| Total | 799 (69.4%) | 352 (30.6%) |
Housing Structures by Number of Rooms in Frostproof
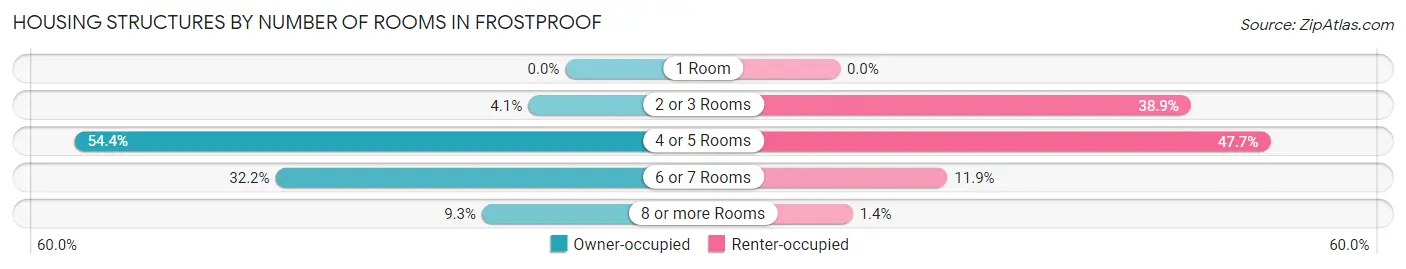
| Number of Rooms | Owner-occupied | Renter-occupied |
| 1 Room | 0 (0.0%) | 0 (0.0%) |
| 2 or 3 Rooms | 33 (4.1%) | 137 (38.9%) |
| 4 or 5 Rooms | 435 (54.4%) | 168 (47.7%) |
| 6 or 7 Rooms | 257 (32.2%) | 42 (11.9%) |
| 8 or more Rooms | 74 (9.3%) | 5 (1.4%) |
| Total | 799 (100.0%) | 352 (100.0%) |
Housing Structure by Heating Type in Frostproof
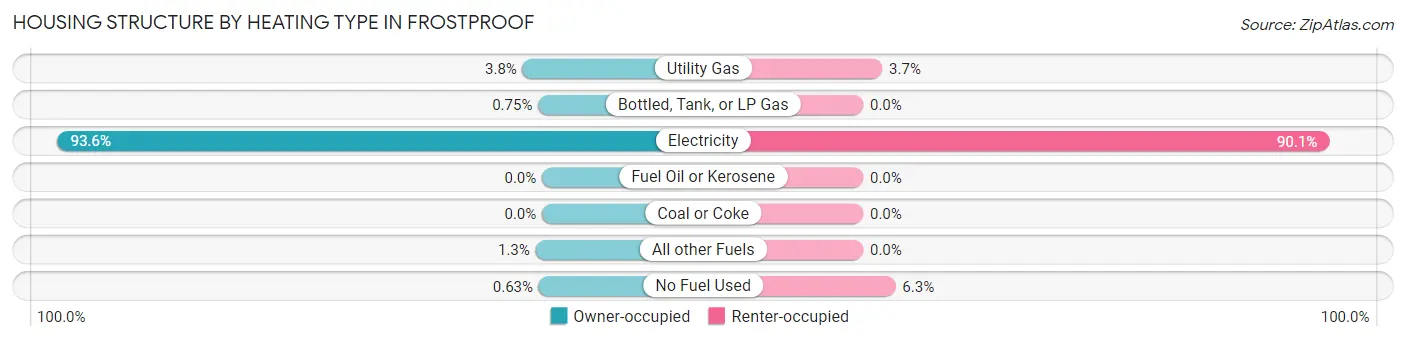
| Heating Type | Owner-occupied | Renter-occupied |
| Utility Gas | 30 (3.7%) | 13 (3.7%) |
| Bottled, Tank, or LP Gas | 6 (0.7%) | 0 (0.0%) |
| Electricity | 748 (93.6%) | 317 (90.1%) |
| Fuel Oil or Kerosene | 0 (0.0%) | 0 (0.0%) |
| Coal or Coke | 0 (0.0%) | 0 (0.0%) |
| All other Fuels | 10 (1.3%) | 0 (0.0%) |
| No Fuel Used | 5 (0.6%) | 22 (6.2%) |
| Total | 799 (100.0%) | 352 (100.0%) |
Household Vehicle Usage in Frostproof
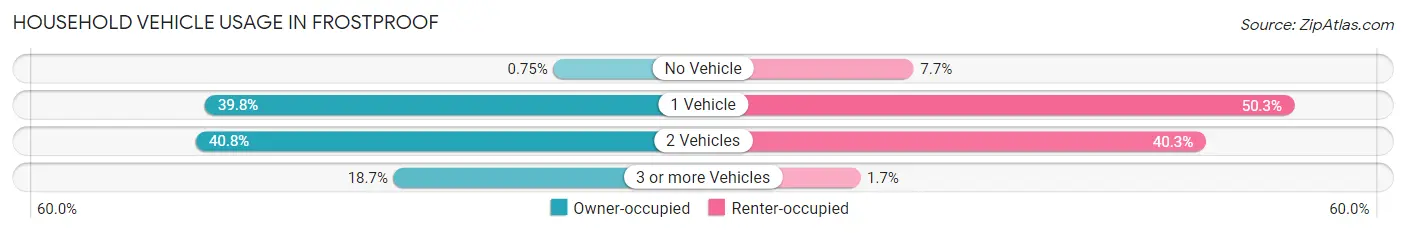
| Vehicles per Household | Owner-occupied | Renter-occupied |
| No Vehicle | 6 (0.7%) | 27 (7.7%) |
| 1 Vehicle | 318 (39.8%) | 177 (50.3%) |
| 2 Vehicles | 326 (40.8%) | 142 (40.3%) |
| 3 or more Vehicles | 149 (18.6%) | 6 (1.7%) |
| Total | 799 (100.0%) | 352 (100.0%) |
Real Estate & Mortgages in Frostproof
Real Estate and Mortgage Overview in Frostproof
| Characteristic | Without Mortgage | With Mortgage |
| Housing Units | 476 | 323 |
| Median Property Value | $81,500 | $190,100 |
| Median Household Income | $45,900 | $24 |
| Monthly Housing Costs | $453 | $17 |
| Real Estate Taxes | $704 | $0 |
Property Value by Mortgage Status in Frostproof
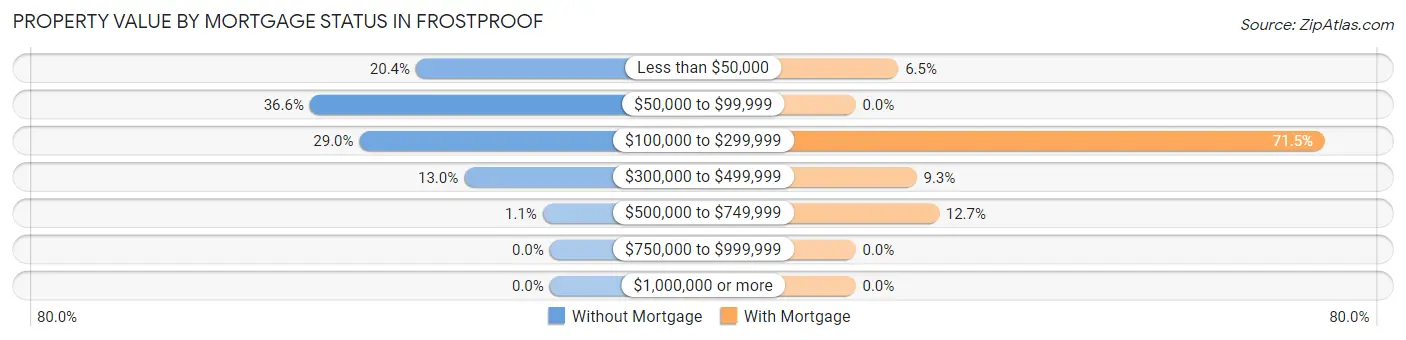
| Property Value | Without Mortgage | With Mortgage |
| Less than $50,000 | 97 (20.4%) | 21 (6.5%) |
| $50,000 to $99,999 | 174 (36.5%) | 0 (0.0%) |
| $100,000 to $299,999 | 138 (29.0%) | 231 (71.5%) |
| $300,000 to $499,999 | 62 (13.0%) | 30 (9.3%) |
| $500,000 to $749,999 | 5 (1.1%) | 41 (12.7%) |
| $750,000 to $999,999 | 0 (0.0%) | 0 (0.0%) |
| $1,000,000 or more | 0 (0.0%) | 0 (0.0%) |
| Total | 476 (100.0%) | 323 (100.0%) |
Household Income by Mortgage Status in Frostproof
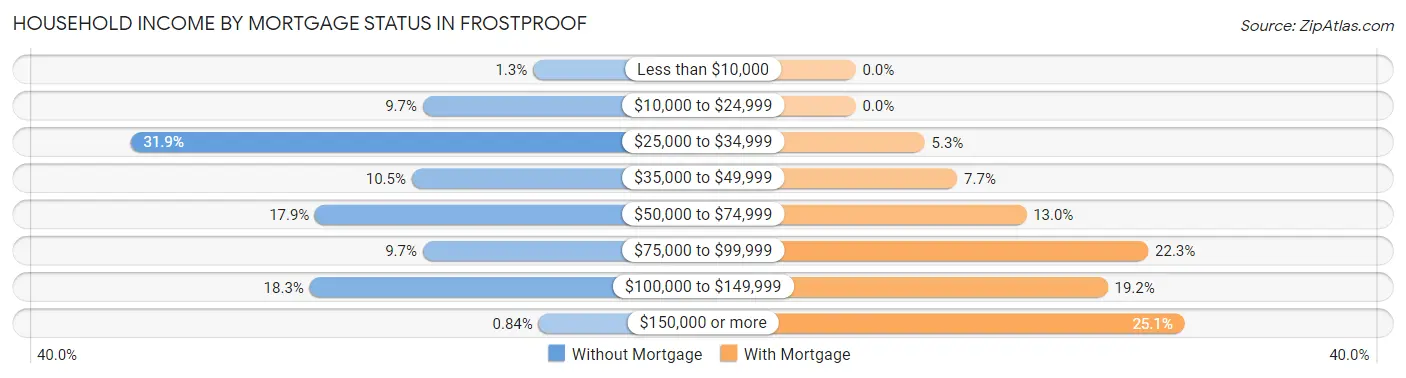
| Household Income | Without Mortgage | With Mortgage |
| Less than $10,000 | 6 (1.3%) | 0 (0.0%) |
| $10,000 to $24,999 | 46 (9.7%) | 0 (0.0%) |
| $25,000 to $34,999 | 152 (31.9%) | 17 (5.3%) |
| $35,000 to $49,999 | 50 (10.5%) | 25 (7.7%) |
| $50,000 to $74,999 | 85 (17.9%) | 42 (13.0%) |
| $75,000 to $99,999 | 46 (9.7%) | 72 (22.3%) |
| $100,000 to $149,999 | 87 (18.3%) | 62 (19.2%) |
| $150,000 or more | 4 (0.8%) | 81 (25.1%) |
| Total | 476 (100.0%) | 323 (100.0%) |
Property Value to Household Income Ratio in Frostproof
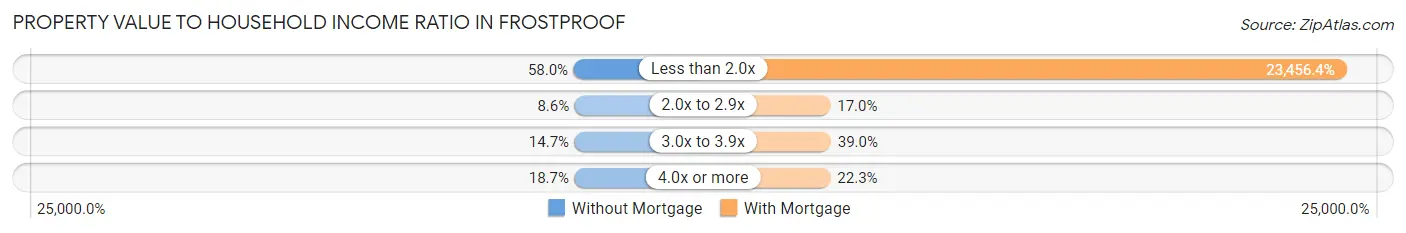
| Value-to-Income Ratio | Without Mortgage | With Mortgage |
| Less than 2.0x | 276 (58.0%) | 75,764 (23,456.4%) |
| 2.0x to 2.9x | 41 (8.6%) | 55 (17.0%) |
| 3.0x to 3.9x | 70 (14.7%) | 126 (39.0%) |
| 4.0x or more | 89 (18.7%) | 72 (22.3%) |
| Total | 476 (100.0%) | 323 (100.0%) |
Real Estate Taxes by Mortgage Status in Frostproof
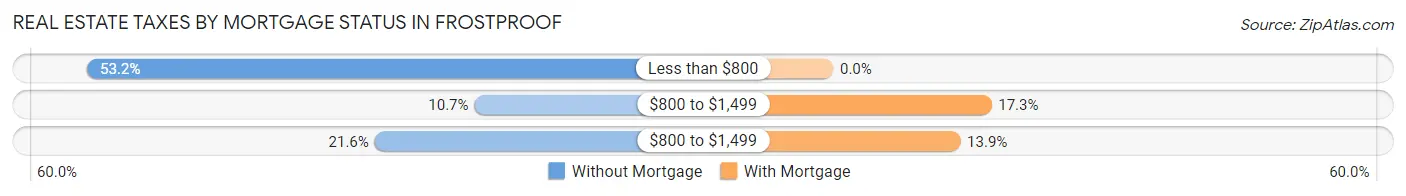
| Property Taxes | Without Mortgage | With Mortgage |
| Less than $800 | 253 (53.1%) | 0 (0.0%) |
| $800 to $1,499 | 51 (10.7%) | 56 (17.3%) |
| $800 to $1,499 | 103 (21.6%) | 45 (13.9%) |
| Total | 476 (100.0%) | 323 (100.0%) |
Health & Disability in Frostproof
Health Insurance Coverage by Age in Frostproof
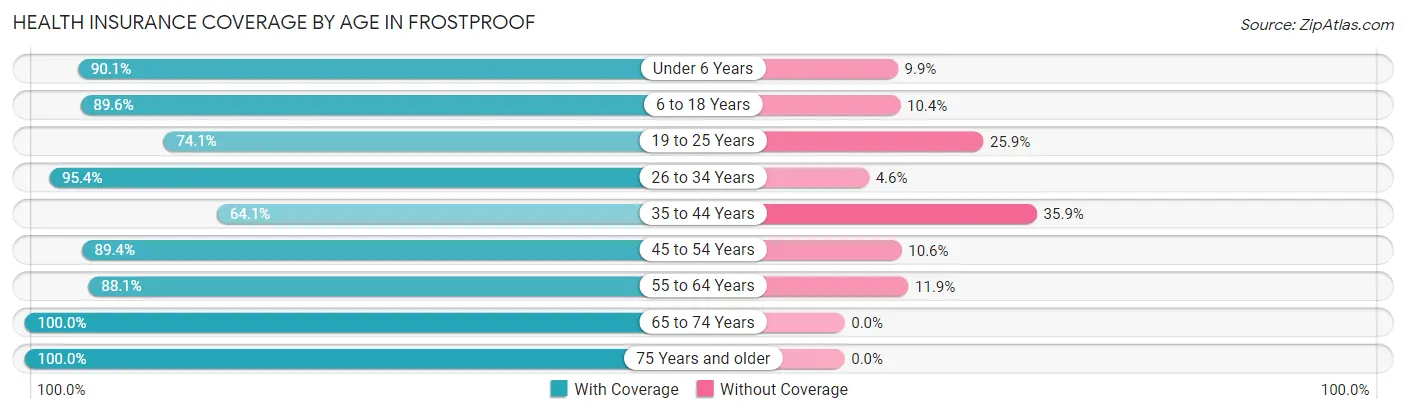
| Age Bracket | With Coverage | Without Coverage |
| Under 6 Years | 308 (90.1%) | 34 (9.9%) |
| 6 to 18 Years | 276 (89.6%) | 32 (10.4%) |
| 19 to 25 Years | 166 (74.1%) | 58 (25.9%) |
| 26 to 34 Years | 314 (95.4%) | 15 (4.6%) |
| 35 to 44 Years | 118 (64.1%) | 66 (35.9%) |
| 45 to 54 Years | 210 (89.4%) | 25 (10.6%) |
| 55 to 64 Years | 370 (88.1%) | 50 (11.9%) |
| 65 to 74 Years | 429 (100.0%) | 0 (0.0%) |
| 75 Years and older | 475 (100.0%) | 0 (0.0%) |
| Total | 2,666 (90.5%) | 280 (9.5%) |
Health Insurance Coverage by Citizenship Status in Frostproof
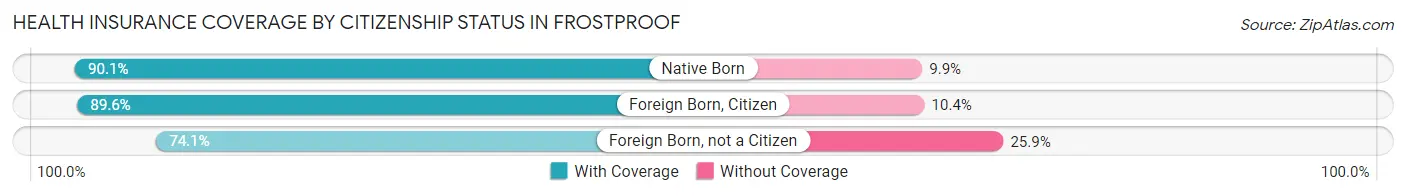
| Citizenship Status | With Coverage | Without Coverage |
| Native Born | 308 (90.1%) | 34 (9.9%) |
| Foreign Born, Citizen | 276 (89.6%) | 32 (10.4%) |
| Foreign Born, not a Citizen | 166 (74.1%) | 58 (25.9%) |
Health Insurance Coverage by Household Income in Frostproof
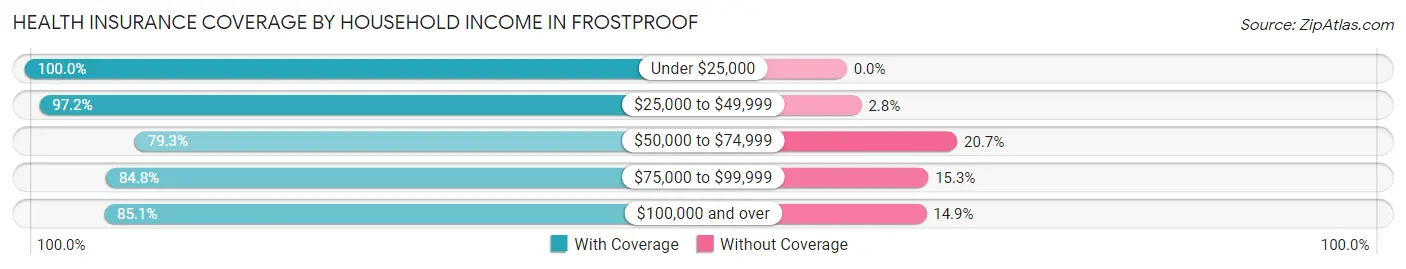
| Household Income | With Coverage | Without Coverage |
| Under $25,000 | 373 (100.0%) | 0 (0.0%) |
| $25,000 to $49,999 | 1,021 (97.2%) | 29 (2.8%) |
| $50,000 to $74,999 | 384 (79.3%) | 100 (20.7%) |
| $75,000 to $99,999 | 289 (84.8%) | 52 (15.2%) |
| $100,000 and over | 566 (85.1%) | 99 (14.9%) |
Public vs Private Health Insurance Coverage by Age in Frostproof
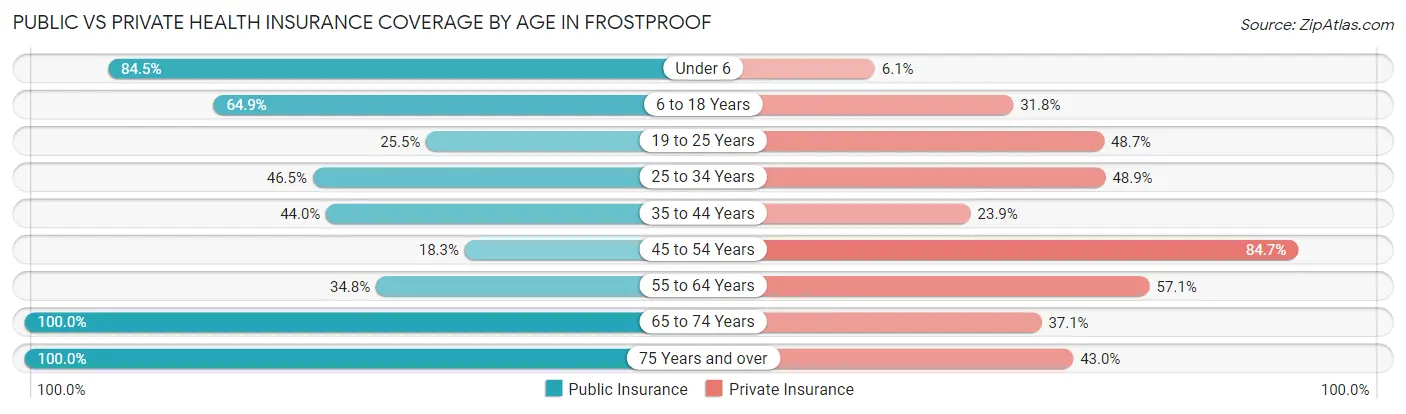
| Age Bracket | Public Insurance | Private Insurance |
| Under 6 | 289 (84.5%) | 21 (6.1%) |
| 6 to 18 Years | 200 (64.9%) | 98 (31.8%) |
| 19 to 25 Years | 57 (25.5%) | 109 (48.7%) |
| 25 to 34 Years | 153 (46.5%) | 161 (48.9%) |
| 35 to 44 Years | 81 (44.0%) | 44 (23.9%) |
| 45 to 54 Years | 43 (18.3%) | 199 (84.7%) |
| 55 to 64 Years | 146 (34.8%) | 240 (57.1%) |
| 65 to 74 Years | 429 (100.0%) | 159 (37.1%) |
| 75 Years and over | 475 (100.0%) | 204 (42.9%) |
| Total | 1,873 (63.6%) | 1,235 (41.9%) |
Disability Status by Sex by Age in Frostproof
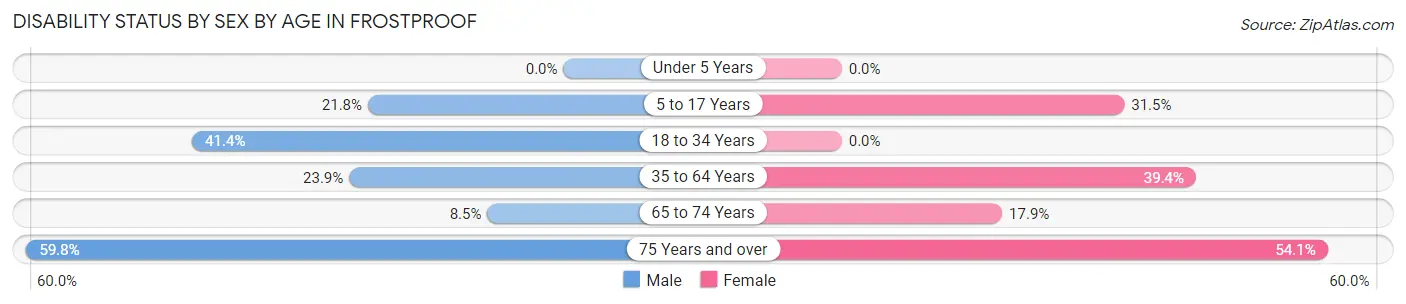
| Age Bracket | Male | Female |
| Under 5 Years | 0 (0.0%) | 0 (0.0%) |
| 5 to 17 Years | 32 (21.8%) | 56 (31.5%) |
| 18 to 34 Years | 110 (41.3%) | 0 (0.0%) |
| 35 to 64 Years | 84 (23.9%) | 192 (39.4%) |
| 65 to 74 Years | 15 (8.5%) | 45 (17.9%) |
| 75 Years and over | 189 (59.8%) | 86 (54.1%) |
Disability Class by Sex by Age in Frostproof
Disability Class: Hearing Difficulty
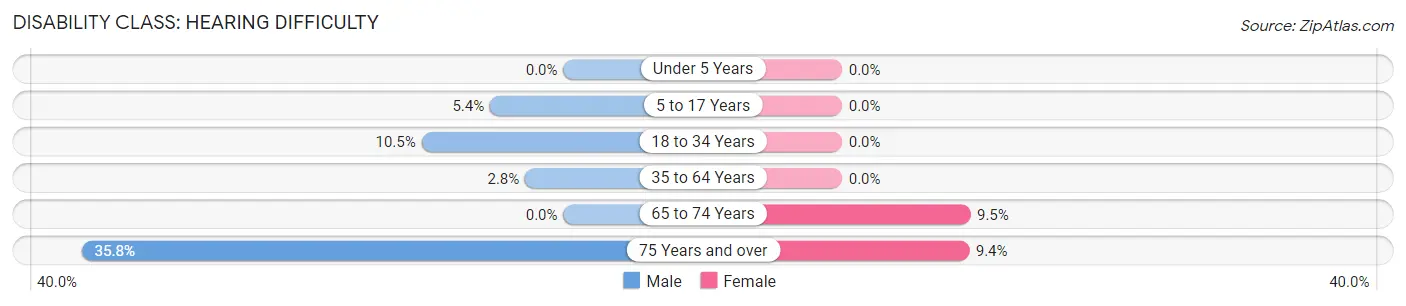
| Age Bracket | Male | Female |
| Under 5 Years | 0 (0.0%) | 0 (0.0%) |
| 5 to 17 Years | 8 (5.4%) | 0 (0.0%) |
| 18 to 34 Years | 28 (10.5%) | 0 (0.0%) |
| 35 to 64 Years | 10 (2.8%) | 0 (0.0%) |
| 65 to 74 Years | 0 (0.0%) | 24 (9.5%) |
| 75 Years and over | 113 (35.8%) | 15 (9.4%) |
Disability Class: Vision Difficulty
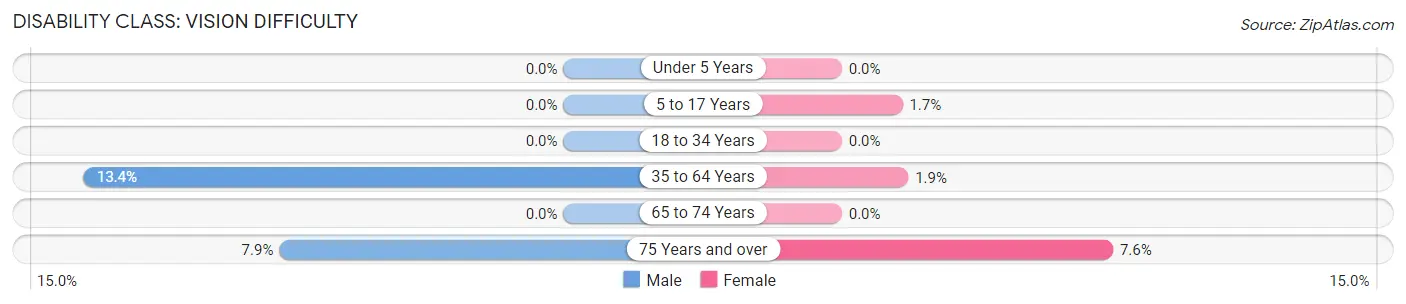
| Age Bracket | Male | Female |
| Under 5 Years | 0 (0.0%) | 0 (0.0%) |
| 5 to 17 Years | 0 (0.0%) | 3 (1.7%) |
| 18 to 34 Years | 0 (0.0%) | 0 (0.0%) |
| 35 to 64 Years | 47 (13.4%) | 9 (1.8%) |
| 65 to 74 Years | 0 (0.0%) | 0 (0.0%) |
| 75 Years and over | 25 (7.9%) | 12 (7.5%) |
Disability Class: Cognitive Difficulty
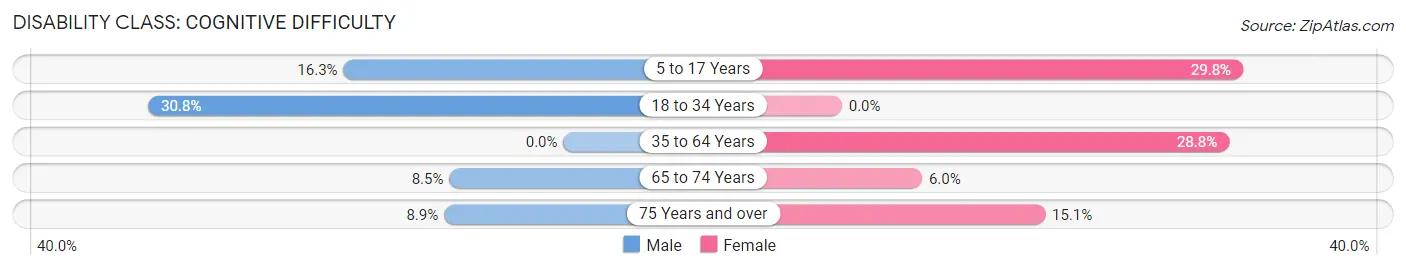
| Age Bracket | Male | Female |
| 5 to 17 Years | 24 (16.3%) | 53 (29.8%) |
| 18 to 34 Years | 82 (30.8%) | 0 (0.0%) |
| 35 to 64 Years | 0 (0.0%) | 140 (28.7%) |
| 65 to 74 Years | 15 (8.5%) | 15 (5.9%) |
| 75 Years and over | 28 (8.9%) | 24 (15.1%) |
Disability Class: Ambulatory Difficulty
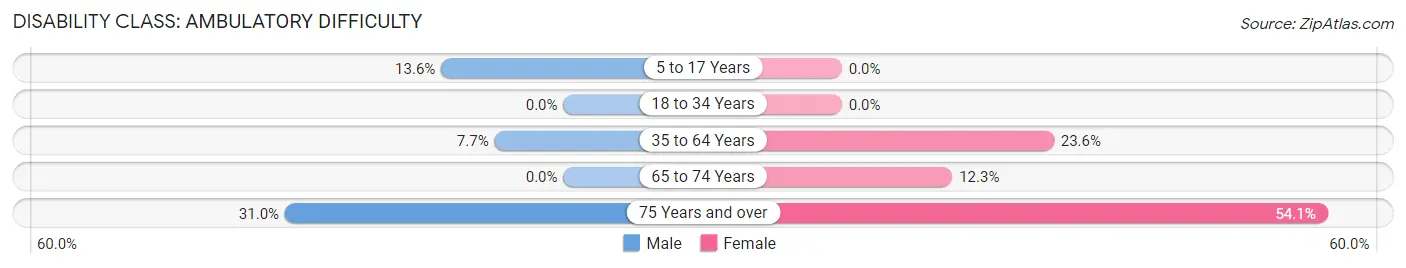
| Age Bracket | Male | Female |
| 5 to 17 Years | 20 (13.6%) | 0 (0.0%) |
| 18 to 34 Years | 0 (0.0%) | 0 (0.0%) |
| 35 to 64 Years | 27 (7.7%) | 115 (23.6%) |
| 65 to 74 Years | 0 (0.0%) | 31 (12.3%) |
| 75 Years and over | 98 (31.0%) | 86 (54.1%) |
Disability Class: Self-Care Difficulty
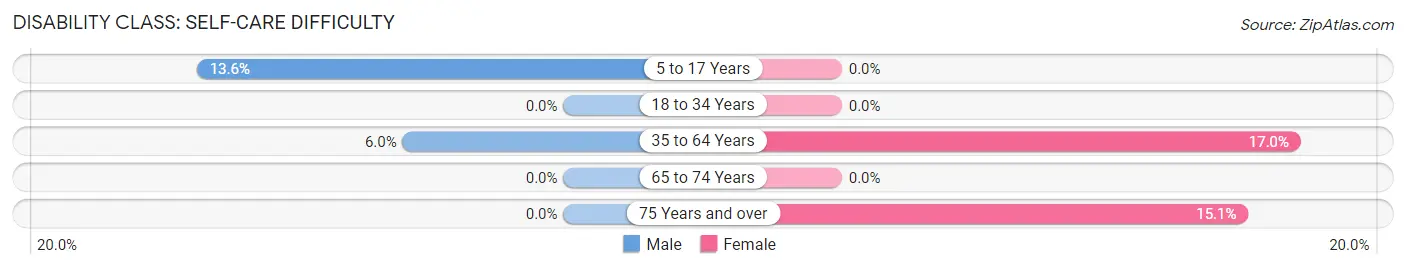
| Age Bracket | Male | Female |
| 5 to 17 Years | 20 (13.6%) | 0 (0.0%) |
| 18 to 34 Years | 0 (0.0%) | 0 (0.0%) |
| 35 to 64 Years | 21 (6.0%) | 83 (17.0%) |
| 65 to 74 Years | 0 (0.0%) | 0 (0.0%) |
| 75 Years and over | 0 (0.0%) | 24 (15.1%) |
Technology Access in Frostproof
Computing Device Access in Frostproof
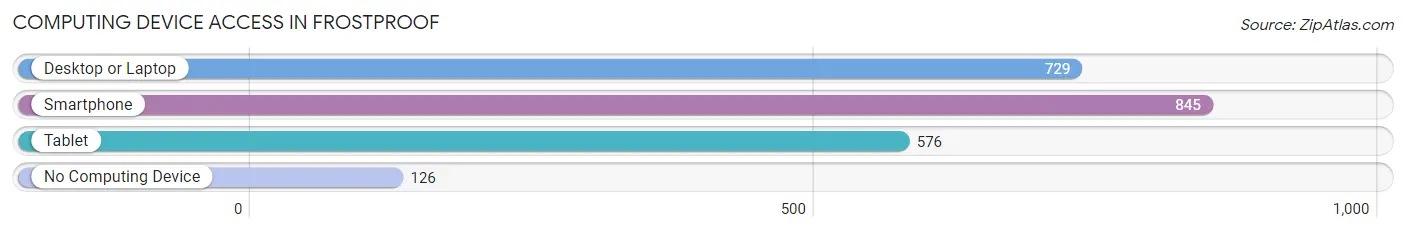
| Device Type | # Households | % Households |
| Desktop or Laptop | 729 | 63.3% |
| Smartphone | 845 | 73.4% |
| Tablet | 576 | 50.0% |
| No Computing Device | 126 | 11.0% |
| Total | 1,151 | 100.0% |
Internet Access in Frostproof
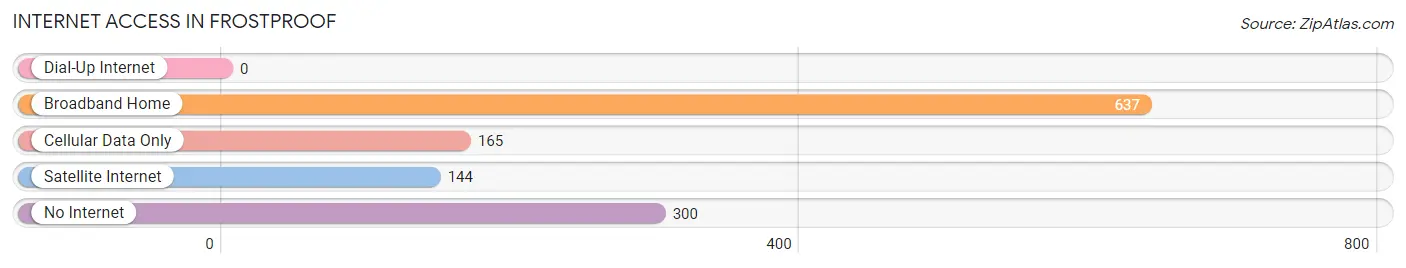
| Internet Type | # Households | % Households |
| Dial-Up Internet | 0 | 0.0% |
| Broadband Home | 637 | 55.3% |
| Cellular Data Only | 165 | 14.3% |
| Satellite Internet | 144 | 12.5% |
| No Internet | 300 | 26.1% |
| Total | 1,151 | 100.0% |
Frostproof Summary
Frostproof is a small city located in Polk County, Florida. It is situated in the center of the state, approximately 50 miles east of Tampa and 50 miles southwest of Orlando. The city is located on the shores of Lake Reedy, a large lake that is part of the Kissimmee Chain of Lakes. The city has a population of approximately 3,000 people and is part of the Lakeland-Winter Haven Metropolitan Statistical Area.
History
Frostproof was founded in 1891 by a group of settlers from Kentucky and Tennessee. The city was named after the fact that the area was known for its cold winters and frosty temperatures. The settlers were attracted to the area due to its fertile soil and abundant wildlife. The city was incorporated in 1925 and has remained relatively small since then.
Geography
Frostproof is located in central Florida, approximately 50 miles east of Tampa and 50 miles southwest of Orlando. The city is situated on the shores of Lake Reedy, a large lake that is part of the Kissimmee Chain of Lakes. The city is surrounded by citrus groves and is home to several parks, including Lake Reedy Park and the Frostproof Nature Park. The city is also home to several lakes, including Lake Clinch, Lake Arbuckle, and Lake Reedy.
Economy
Frostproof’s economy is largely based on agriculture and tourism. The city is home to several citrus groves, which produce oranges, grapefruits, and tangerines. The city is also home to several tourist attractions, including the Frostproof Nature Park and the Lake Reedy Park. The city is also home to several businesses, including restaurants, retail stores, and service providers.
Demographics
As of the 2010 census, Frostproof had a population of 3,044. The racial makeup of the city was 79.2% White, 15.3% African American, 0.3% Native American, 0.7% Asian, 0.1% Pacific Islander, and 4.4% from two or more races. The median household income was $31,944 and the median family income was $37,917. The per capita income was $15,945.
Frostproof is a small city with a rich history and a diverse economy. The city is home to several parks and lakes, as well as a variety of businesses. The city is also home to a diverse population, with a mix of races and ethnicities. Frostproof is a great place to live and work, and is a great place to visit for those looking for a unique experience in central Florida.
Common Questions
What is Per Capita Income in Frostproof?
Per Capita income in Frostproof is $22,995.
What is the Median Family Income in Frostproof?
Median Family Income in Frostproof is $53,145.
What is the Median Household income in Frostproof?
Median Household Income in Frostproof is $43,487.
What is Income or Wage Gap in Frostproof?
Income or Wage Gap in Frostproof is 27.2%.
Women in Frostproof earn 72.8 cents for every dollar earned by a man.
What is Inequality or Gini Index in Frostproof?
Inequality or Gini Index in Frostproof is 0.38.
What is the Total Population of Frostproof?
Total Population of Frostproof is 2,946.
What is the Total Male Population of Frostproof?
Total Male Population of Frostproof is 1,297.
What is the Total Female Population of Frostproof?
Total Female Population of Frostproof is 1,649.
What is the Ratio of Males per 100 Females in Frostproof?
There are 78.65 Males per 100 Females in Frostproof.
What is the Ratio of Females per 100 Males in Frostproof?
There are 127.14 Females per 100 Males in Frostproof.
What is the Median Population Age in Frostproof?
Median Population Age in Frostproof is 49.8 Years.
What is the Average Family Size in Frostproof
Average Family Size in Frostproof is 3.0 People.
What is the Average Household Size in Frostproof
Average Household Size in Frostproof is 2.5 People.
How Large is the Labor Force in Frostproof?
There are 1,040 People in the Labor Forcein in Frostproof.
What is the Percentage of People in the Labor Force in Frostproof?
44.4% of People are in the Labor Force in Frostproof.
What is the Unemployment Rate in Frostproof?
Unemployment Rate in Frostproof is 8.2%.