Fort Myers Shores, FL Map & Demographics
Fort Myers Shores Map
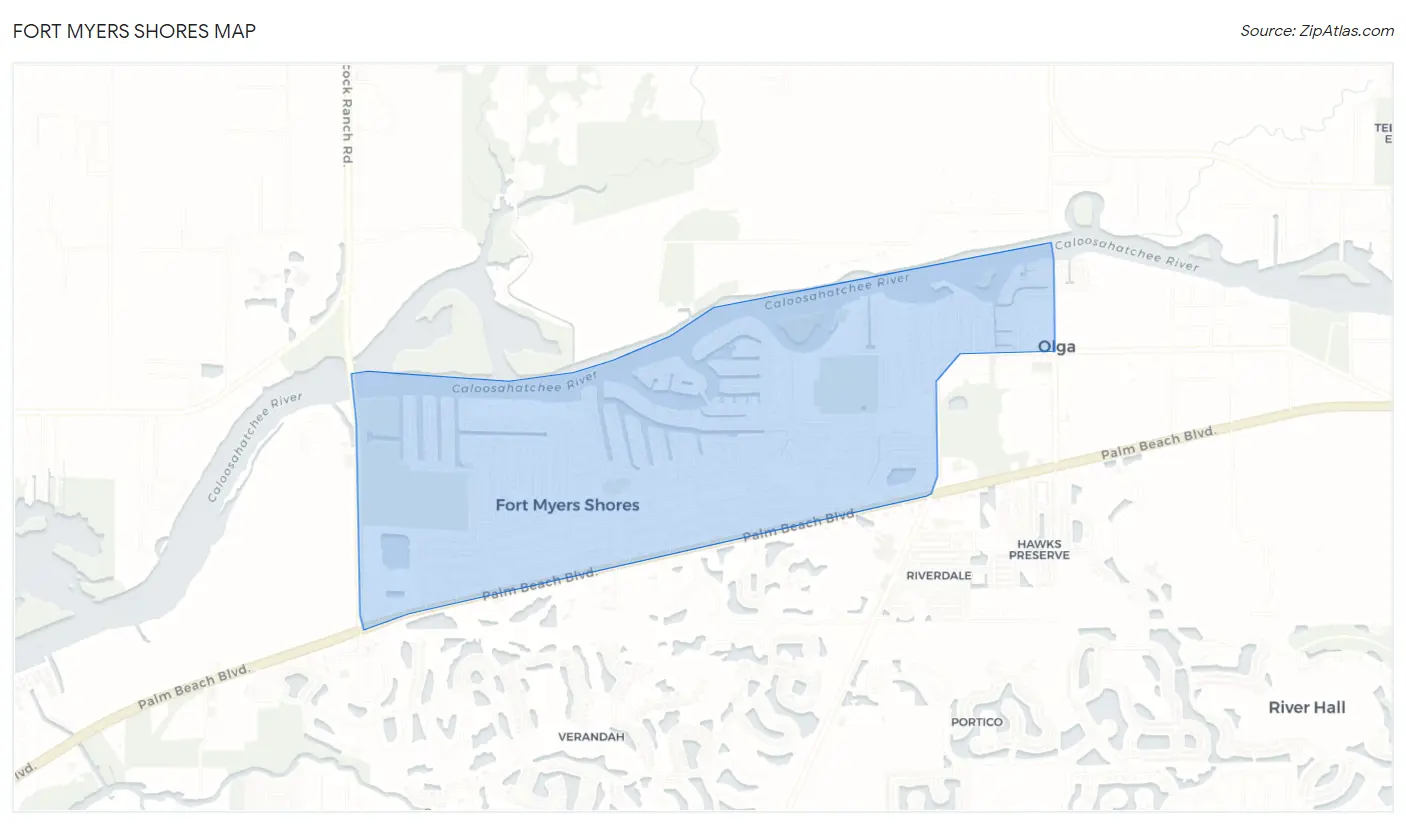
Fort Myers Shores Overview
$32,457
PER CAPITA INCOME
$63,750
AVG FAMILY INCOME
$66,034
AVG HOUSEHOLD INCOME
37.7%
WAGE / INCOME GAP [ % ]
62.3¢/ $1
WAGE / INCOME GAP [ $ ]
0.45
INEQUALITY / GINI INDEX
5,990
TOTAL POPULATION
3,165
MALE POPULATION
2,825
FEMALE POPULATION
112.04
MALES / 100 FEMALES
89.26
FEMALES / 100 MALES
40.1
MEDIAN AGE
3.3
AVG FAMILY SIZE
2.6
AVG HOUSEHOLD SIZE
3,023
LABOR FORCE [ PEOPLE ]
59.7%
PERCENT IN LABOR FORCE
7.9%
UNEMPLOYMENT RATE
Income in Fort Myers Shores
Income Overview in Fort Myers Shores
Per Capita Income in Fort Myers Shores is $32,457, while median incomes of families and households are $63,750 and $66,034 respectively.
| Characteristic | Number | Measure |
| Per Capita Income | 5,990 | $32,457 |
| Median Family Income | 1,486 | $63,750 |
| Mean Family Income | 1,486 | $83,556 |
| Median Household Income | 2,305 | $66,034 |
| Mean Household Income | 2,305 | $78,595 |
| Income Deficit | 1,486 | $0 |
| Wage / Income Gap (%) | 5,990 | 37.75% |
| Wage / Income Gap ($) | 5,990 | 62.25¢ per $1 |
| Gini / Inequality Index | 5,990 | 0.45 |
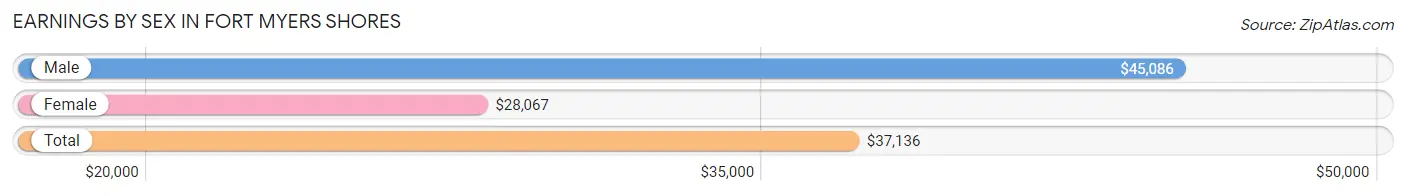
Earnings by Sex in Fort Myers Shores
Average Earnings in Fort Myers Shores are $37,136, $45,086 for men and $28,067 for women, a difference of 37.8%.
| Sex | Number | Average Earnings |
| Male | 1,675 (57.7%) | $45,086 |
| Female | 1,230 (42.3%) | $28,067 |
| Total | 2,905 (100.0%) | $37,136 |
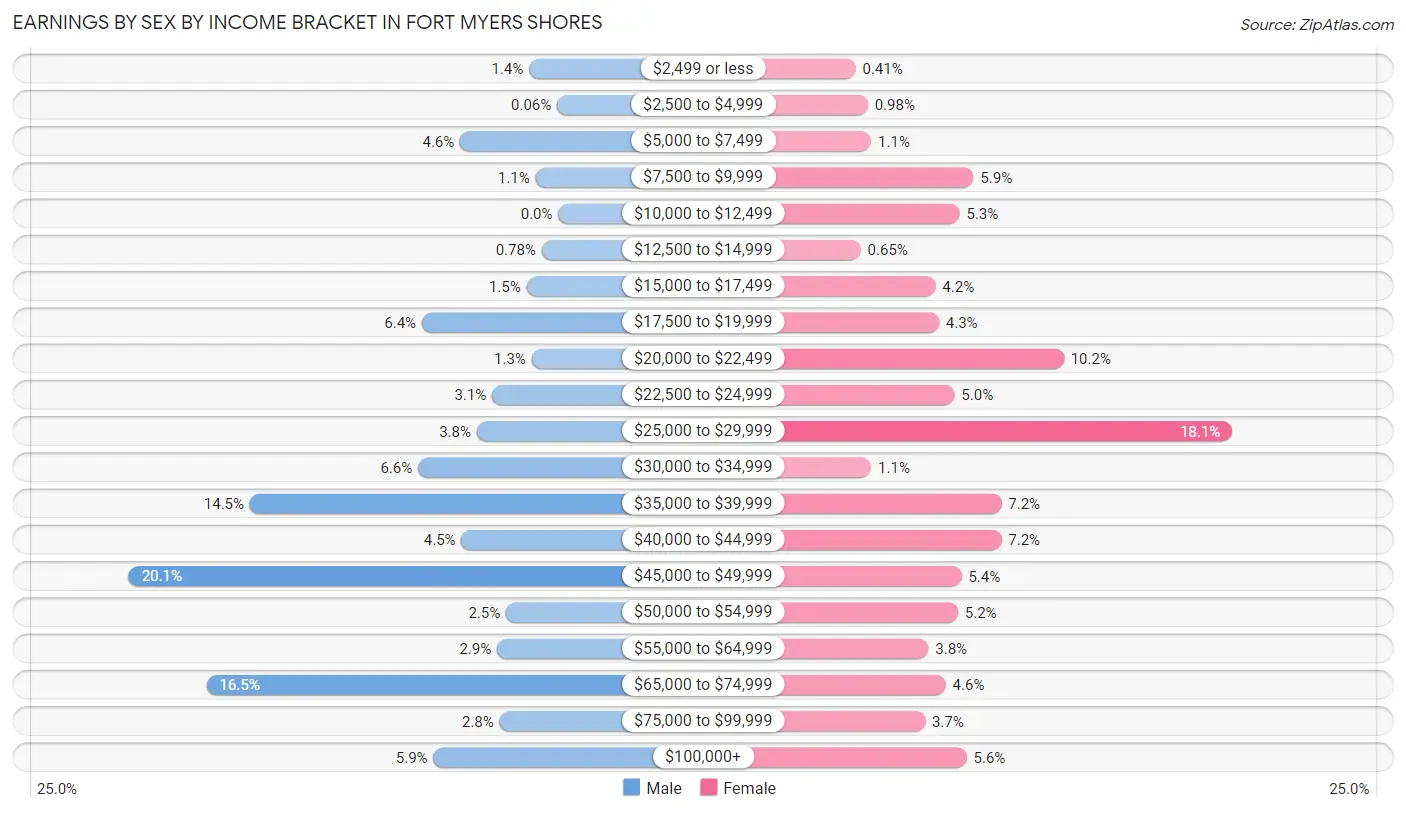
Earnings by Sex by Income Bracket in Fort Myers Shores
The most common earnings brackets in Fort Myers Shores are $45,000 to $49,999 for men (337 | 20.1%) and $25,000 to $29,999 for women (222 | 18.0%).
| Income | Male | Female |
| $2,499 or less | 23 (1.4%) | 5 (0.4%) |
| $2,500 to $4,999 | 1 (0.1%) | 12 (1.0%) |
| $5,000 to $7,499 | 77 (4.6%) | 14 (1.1%) |
| $7,500 to $9,999 | 18 (1.1%) | 73 (5.9%) |
| $10,000 to $12,499 | 0 (0.0%) | 65 (5.3%) |
| $12,500 to $14,999 | 13 (0.8%) | 8 (0.6%) |
| $15,000 to $17,499 | 25 (1.5%) | 51 (4.2%) |
| $17,500 to $19,999 | 107 (6.4%) | 53 (4.3%) |
| $20,000 to $22,499 | 21 (1.3%) | 125 (10.2%) |
| $22,500 to $24,999 | 52 (3.1%) | 62 (5.0%) |
| $25,000 to $29,999 | 64 (3.8%) | 222 (18.0%) |
| $30,000 to $34,999 | 110 (6.6%) | 14 (1.1%) |
| $35,000 to $39,999 | 242 (14.4%) | 89 (7.2%) |
| $40,000 to $44,999 | 76 (4.5%) | 89 (7.2%) |
| $45,000 to $49,999 | 337 (20.1%) | 66 (5.4%) |
| $50,000 to $54,999 | 41 (2.5%) | 64 (5.2%) |
| $55,000 to $64,999 | 48 (2.9%) | 47 (3.8%) |
| $65,000 to $74,999 | 276 (16.5%) | 57 (4.6%) |
| $75,000 to $99,999 | 46 (2.8%) | 45 (3.7%) |
| $100,000+ | 98 (5.9%) | 69 (5.6%) |
| Total | 1,675 (100.0%) | 1,230 (100.0%) |
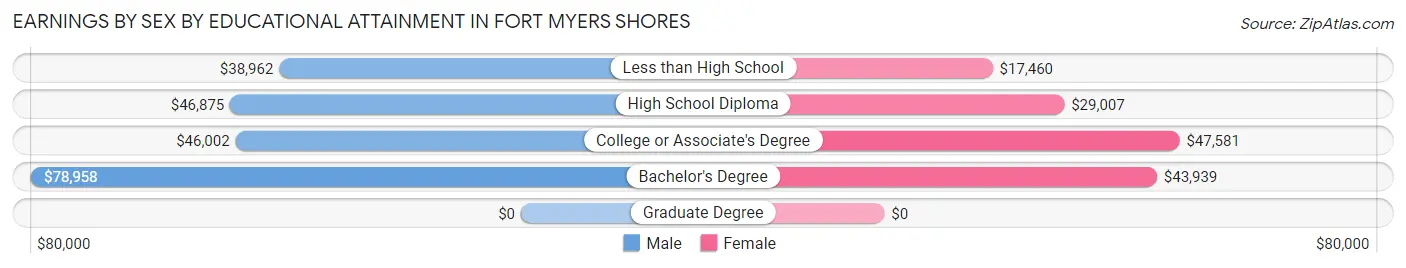
Earnings by Sex by Educational Attainment in Fort Myers Shores
Average earnings in Fort Myers Shores are $45,640 for men and $35,309 for women, a difference of 22.6%. Men with an educational attainment of bachelor's degree enjoy the highest average annual earnings of $78,958, while those with less than high school education earn the least with $38,962. Women with an educational attainment of college or associate's degree earn the most with the average annual earnings of $47,581, while those with less than high school education have the smallest earnings of $17,460.
| Educational Attainment | Male Income | Female Income |
| Less than High School | $38,962 | $17,460 |
| High School Diploma | $46,875 | $29,007 |
| College or Associate's Degree | $46,002 | $47,581 |
| Bachelor's Degree | $78,958 | $43,939 |
| Graduate Degree | - | - |
| Total | $45,640 | $35,309 |
Family Income in Fort Myers Shores
Family Income Brackets in Fort Myers Shores
According to the Fort Myers Shores family income data, there are 342 families falling into the $50,000 to $74,999 income range, which is the most common income bracket and makes up 23.0% of all families. Conversely, the $150,000 to $199,999 income bracket is the least frequent group with only 28 families (1.9%) belonging to this category.
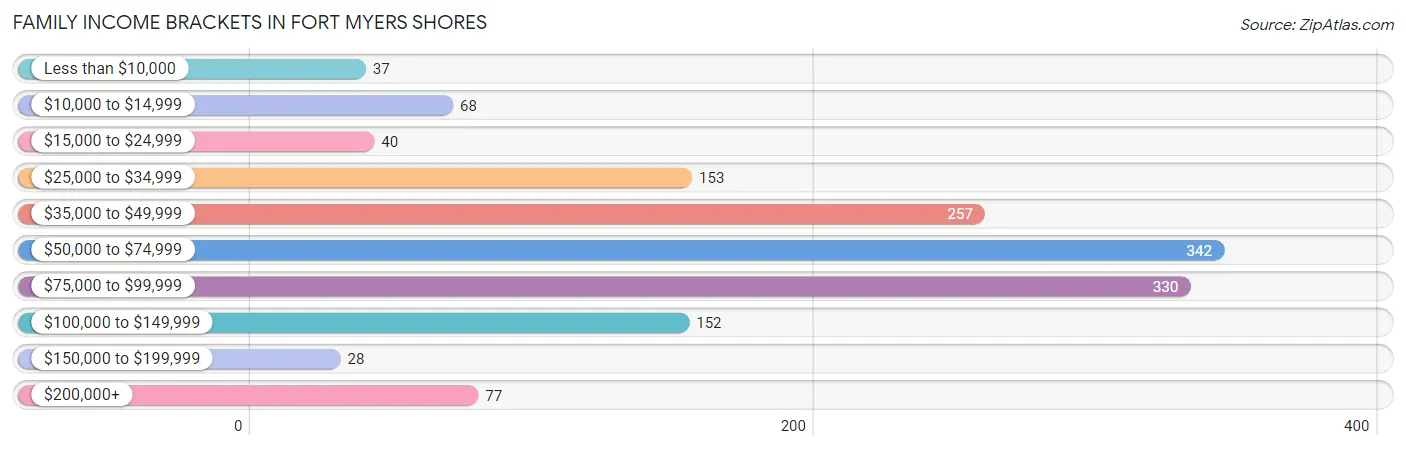
| Income Bracket | # Families | % Families |
| Less than $10,000 | 37 | 2.5% |
| $10,000 to $14,999 | 68 | 4.6% |
| $15,000 to $24,999 | 40 | 2.7% |
| $25,000 to $34,999 | 153 | 10.3% |
| $35,000 to $49,999 | 257 | 17.3% |
| $50,000 to $74,999 | 342 | 23.0% |
| $75,000 to $99,999 | 330 | 22.2% |
| $100,000 to $149,999 | 152 | 10.2% |
| $150,000 to $199,999 | 28 | 1.9% |
| $200,000+ | 77 | 5.2% |
Family Income by Famaliy Size in Fort Myers Shores
7+ person families (43 | 2.9%) account for the highest median family income in Fort Myers Shores with $86,250 per family, while 2-person families (820 | 55.2%) have the highest median income of $33,928 per family member.
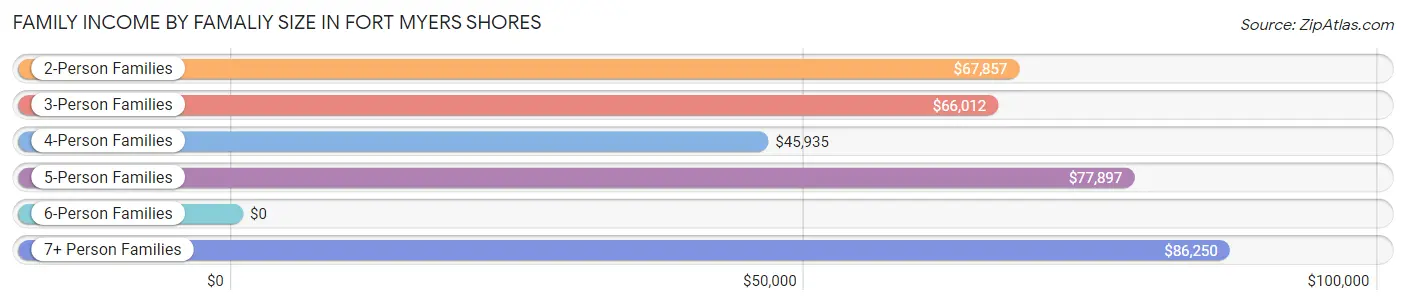
| Income Bracket | # Families | Median Income |
| 2-Person Families | 820 (55.2%) | $67,857 |
| 3-Person Families | 255 (17.2%) | $66,012 |
| 4-Person Families | 262 (17.6%) | $45,935 |
| 5-Person Families | 106 (7.1%) | $77,897 |
| 6-Person Families | 0 (0.0%) | $0 |
| 7+ Person Families | 43 (2.9%) | $86,250 |
| Total | 1,486 (100.0%) | $63,750 |
Family Income by Number of Earners in Fort Myers Shores
The median family income in Fort Myers Shores is $63,750, with families comprising 2 earners (476) having the highest median family income of $83,133, while families with no earners (200) have the lowest median family income of $36,389, accounting for 32.0% and 13.5% of families, respectively.
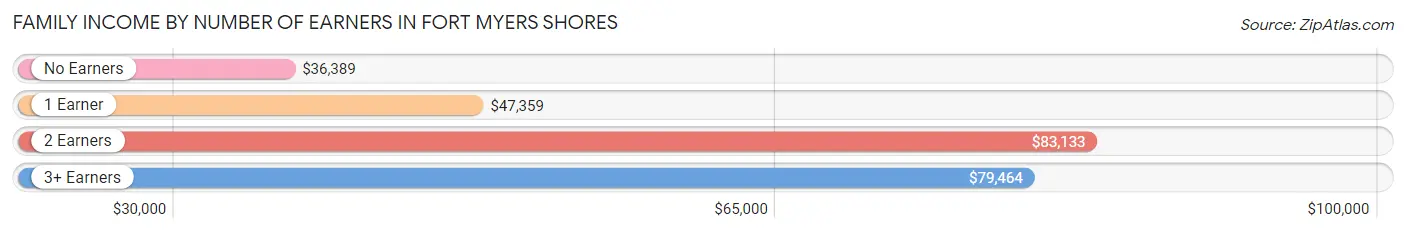
| Number of Earners | # Families | Median Income |
| No Earners | 200 (13.5%) | $36,389 |
| 1 Earner | 711 (47.8%) | $47,359 |
| 2 Earners | 476 (32.0%) | $83,133 |
| 3+ Earners | 99 (6.7%) | $79,464 |
| Total | 1,486 (100.0%) | $63,750 |
Household Income in Fort Myers Shores
Household Income Brackets in Fort Myers Shores
With 576 households falling in the category, the $50,000 to $74,999 income range is the most frequent in Fort Myers Shores, accounting for 25.0% of all households. In contrast, only 23 households (1.0%) fall into the $150,000 to $199,999 income bracket, making it the least populous group.
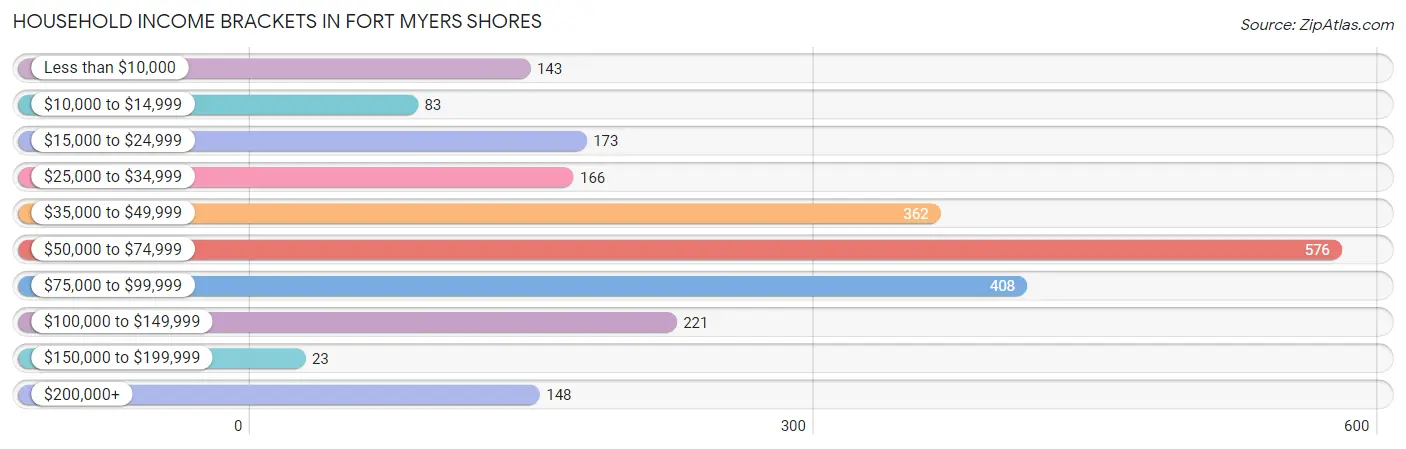
| Income Bracket | # Households | % Households |
| Less than $10,000 | 143 | 6.2% |
| $10,000 to $14,999 | 83 | 3.6% |
| $15,000 to $24,999 | 173 | 7.5% |
| $25,000 to $34,999 | 166 | 7.2% |
| $35,000 to $49,999 | 362 | 15.7% |
| $50,000 to $74,999 | 576 | 25.0% |
| $75,000 to $99,999 | 408 | 17.7% |
| $100,000 to $149,999 | 221 | 9.6% |
| $150,000 to $199,999 | 23 | 1.0% |
| $200,000+ | 148 | 6.4% |
Household Income by Householder Age in Fort Myers Shores
The median household income in Fort Myers Shores is $66,034, with the highest median household income of $73,502 found in the 25 to 44 years age bracket for the primary householder. A total of 866 households (37.6%) fall into this category.
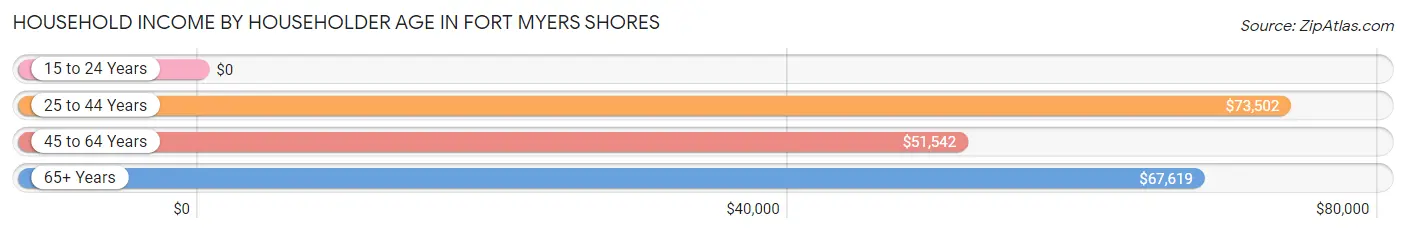
| Income Bracket | # Households | Median Income |
| 15 to 24 Years | 0 (0.0%) | $0 |
| 25 to 44 Years | 866 (37.6%) | $73,502 |
| 45 to 64 Years | 857 (37.2%) | $51,542 |
| 65+ Years | 582 (25.3%) | $67,619 |
| Total | 2,305 (100.0%) | $66,034 |
Poverty in Fort Myers Shores
Income Below Poverty by Sex and Age in Fort Myers Shores
With 9.5% poverty level for males and 10.7% for females among the residents of Fort Myers Shores, under 5 year old males and under 5 year old females are the most vulnerable to poverty, with 20 males (44.4%) and 29 females (58.0%) in their respective age groups living below the poverty level.
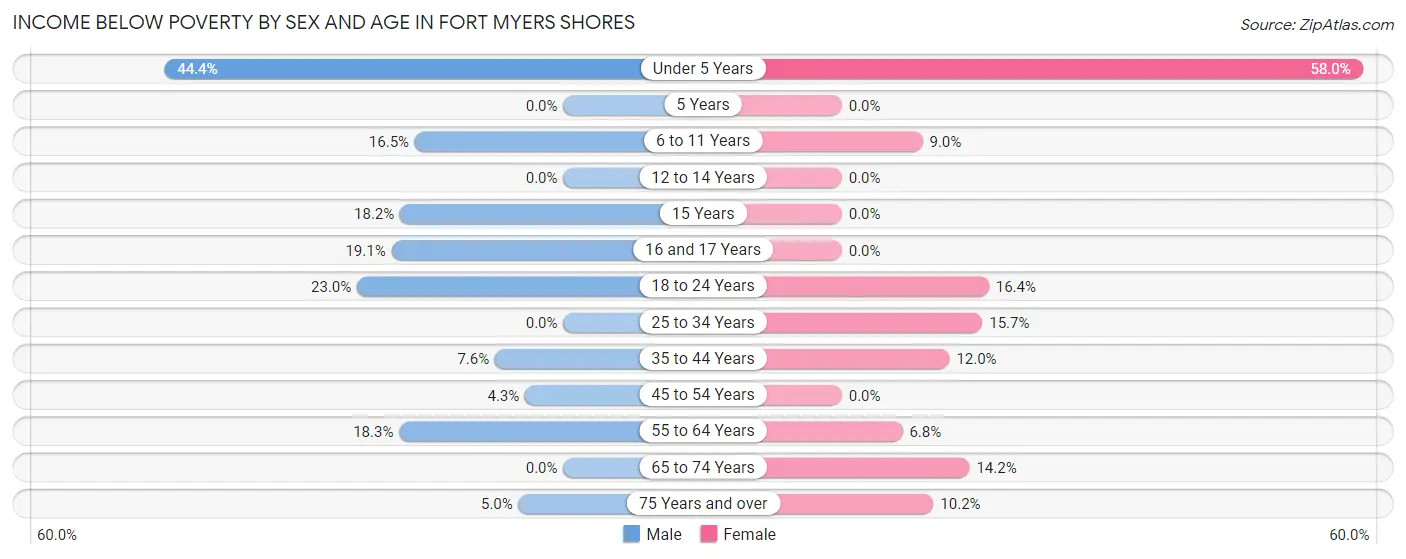
| Age Bracket | Male | Female |
| Under 5 Years | 20 (44.4%) | 29 (58.0%) |
| 5 Years | 0 (0.0%) | 0 (0.0%) |
| 6 to 11 Years | 20 (16.5%) | 25 (9.0%) |
| 12 to 14 Years | 0 (0.0%) | 0 (0.0%) |
| 15 Years | 10 (18.2%) | 0 (0.0%) |
| 16 and 17 Years | 31 (19.1%) | 0 (0.0%) |
| 18 to 24 Years | 51 (23.0%) | 56 (16.4%) |
| 25 to 34 Years | 0 (0.0%) | 49 (15.7%) |
| 35 to 44 Years | 45 (7.6%) | 53 (12.0%) |
| 45 to 54 Years | 20 (4.3%) | 0 (0.0%) |
| 55 to 64 Years | 89 (18.3%) | 23 (6.8%) |
| 65 to 74 Years | 0 (0.0%) | 32 (14.2%) |
| 75 Years and over | 12 (5.0%) | 35 (10.2%) |
| Total | 298 (9.5%) | 302 (10.7%) |
Income Above Poverty by Sex and Age in Fort Myers Shores
According to the poverty statistics in Fort Myers Shores, males aged 5 years and females aged 5 years are the age groups that are most secure financially, with 100.0% of males and 100.0% of females in these age groups living above the poverty line.
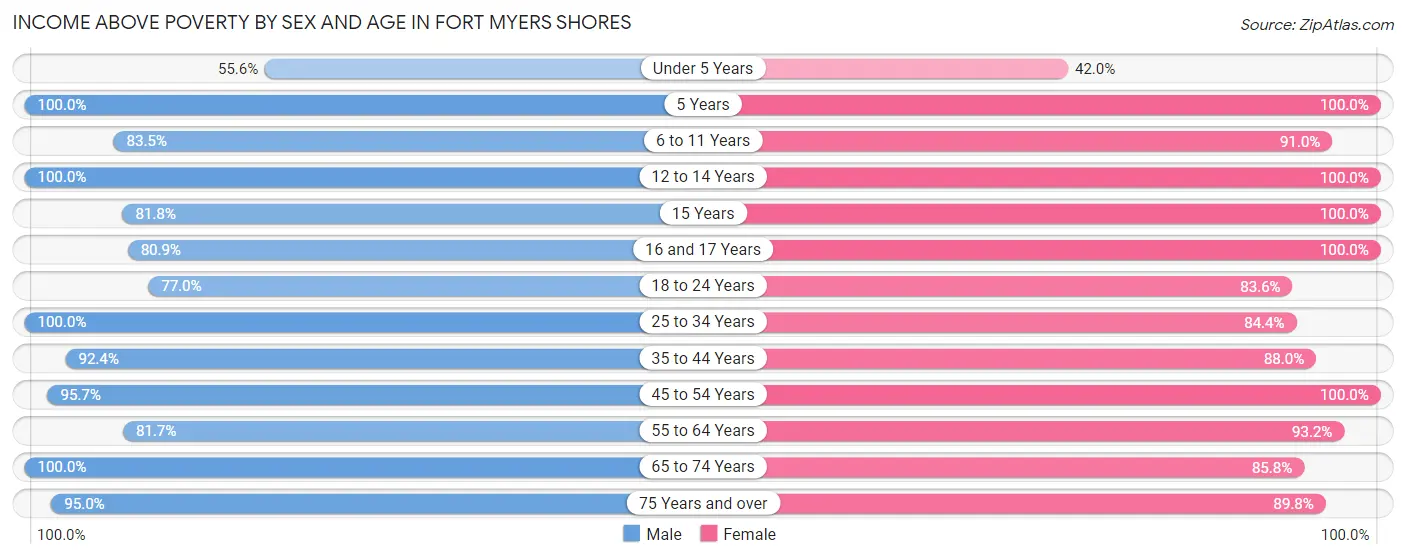
| Age Bracket | Male | Female |
| Under 5 Years | 25 (55.6%) | 21 (42.0%) |
| 5 Years | 14 (100.0%) | 83 (100.0%) |
| 6 to 11 Years | 101 (83.5%) | 253 (91.0%) |
| 12 to 14 Years | 155 (100.0%) | 103 (100.0%) |
| 15 Years | 45 (81.8%) | 6 (100.0%) |
| 16 and 17 Years | 131 (80.9%) | 64 (100.0%) |
| 18 to 24 Years | 171 (77.0%) | 286 (83.6%) |
| 25 to 34 Years | 331 (100.0%) | 264 (84.4%) |
| 35 to 44 Years | 546 (92.4%) | 389 (88.0%) |
| 45 to 54 Years | 450 (95.7%) | 236 (100.0%) |
| 55 to 64 Years | 398 (81.7%) | 317 (93.2%) |
| 65 to 74 Years | 254 (100.0%) | 193 (85.8%) |
| 75 Years and over | 229 (95.0%) | 308 (89.8%) |
| Total | 2,850 (90.5%) | 2,523 (89.3%) |
Income Below Poverty Among Married-Couple Families in Fort Myers Shores
The poverty statistics for married-couple families in Fort Myers Shores show that 5.8% or 58 of the total 1,006 families live below the poverty line. Families with 1 or 2 children have the highest poverty rate of 7.1%, comprising of 27 families. On the other hand, families with 5 or more children have the lowest poverty rate of 0.0%, which includes 0 families.
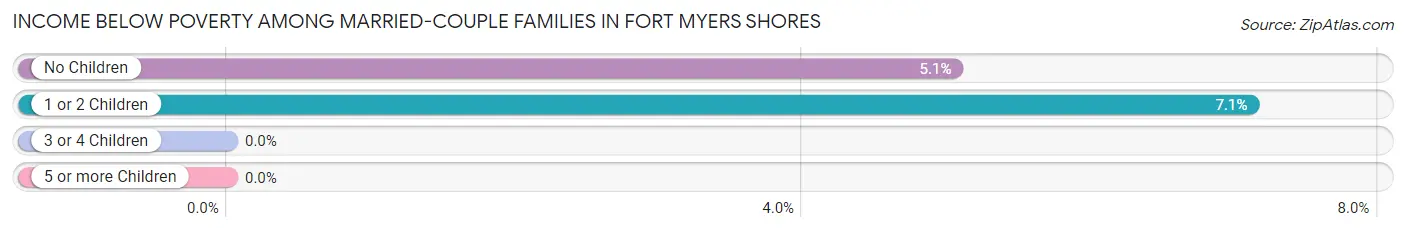
| Children | Above Poverty | Below Poverty |
| No Children | 583 (95.0%) | 31 (5.1%) |
| 1 or 2 Children | 353 (92.9%) | 27 (7.1%) |
| 3 or 4 Children | 0 (0.0%) | 0 (0.0%) |
| 5 or more Children | 12 (100.0%) | 0 (0.0%) |
| Total | 948 (94.2%) | 58 (5.8%) |
Income Below Poverty Among Single-Parent Households in Fort Myers Shores
According to the poverty data in Fort Myers Shores, 10.0% or 18 single-father households and 19.3% or 58 single-mother households are living below the poverty line. Among single-father households, those with 1 or 2 children have the highest poverty rate, with 18 households (17.6%) experiencing poverty. Likewise, among single-mother households, those with 3 or 4 children have the highest poverty rate, with 9 households (100.0%) falling below the poverty line.
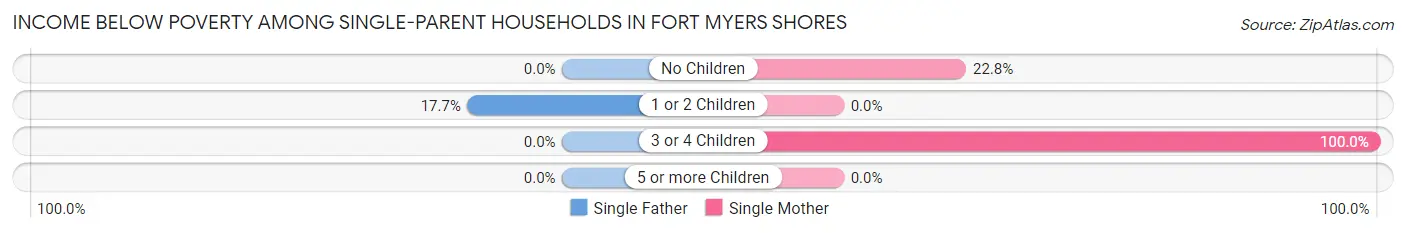
| Children | Single Father | Single Mother |
| No Children | 0 (0.0%) | 49 (22.8%) |
| 1 or 2 Children | 18 (17.6%) | 0 (0.0%) |
| 3 or 4 Children | 0 (0.0%) | 9 (100.0%) |
| 5 or more Children | 0 (0.0%) | 0 (0.0%) |
| Total | 18 (10.0%) | 58 (19.3%) |
Income Below Poverty Among Married-Couple vs Single-Parent Households in Fort Myers Shores
The poverty data for Fort Myers Shores shows that 58 of the married-couple family households (5.8%) and 76 of the single-parent households (15.8%) are living below the poverty level. Within the married-couple family households, those with 1 or 2 children have the highest poverty rate, with 27 households (7.1%) falling below the poverty line. Among the single-parent households, those with 3 or 4 children have the highest poverty rate, with 9 household (100.0%) living below poverty.
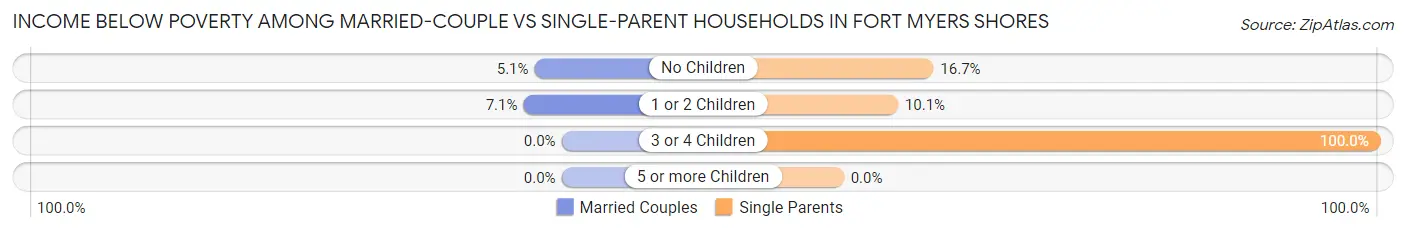
| Children | Married-Couple Families | Single-Parent Households |
| No Children | 31 (5.1%) | 49 (16.7%) |
| 1 or 2 Children | 27 (7.1%) | 18 (10.1%) |
| 3 or 4 Children | 0 (0.0%) | 9 (100.0%) |
| 5 or more Children | 0 (0.0%) | 0 (0.0%) |
| Total | 58 (5.8%) | 76 (15.8%) |
Race in Fort Myers Shores
The most populous races in Fort Myers Shores are White / Caucasian (4,420 | 73.8%), Hispanic or Latino (1,684 | 28.1%), and Two or more Races (1,023 | 17.1%).
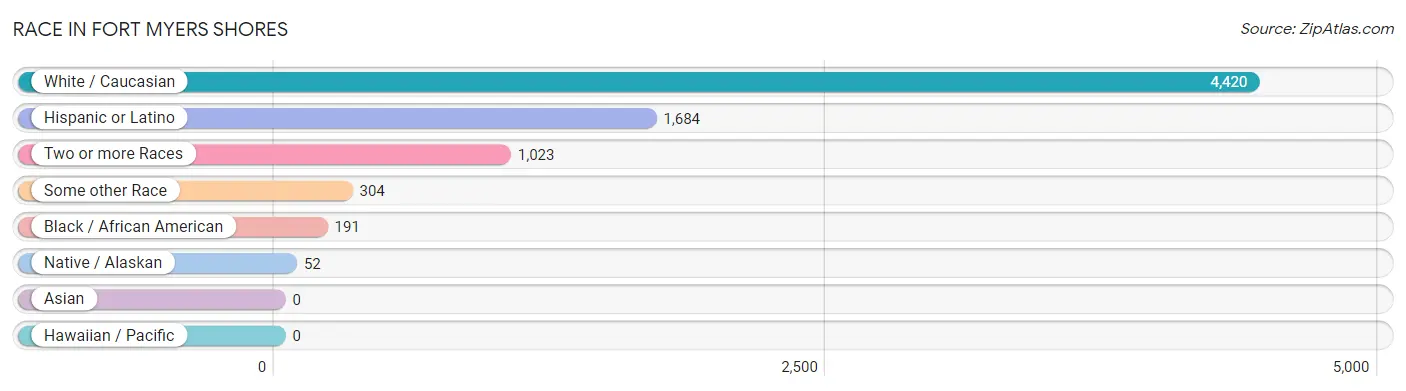
| Race | # Population | % Population |
| Asian | 0 | 0.0% |
| Black / African American | 191 | 3.2% |
| Hawaiian / Pacific | 0 | 0.0% |
| Hispanic or Latino | 1,684 | 28.1% |
| Native / Alaskan | 52 | 0.9% |
| White / Caucasian | 4,420 | 73.8% |
| Two or more Races | 1,023 | 17.1% |
| Some other Race | 304 | 5.1% |
| Total | 5,990 | 100.0% |
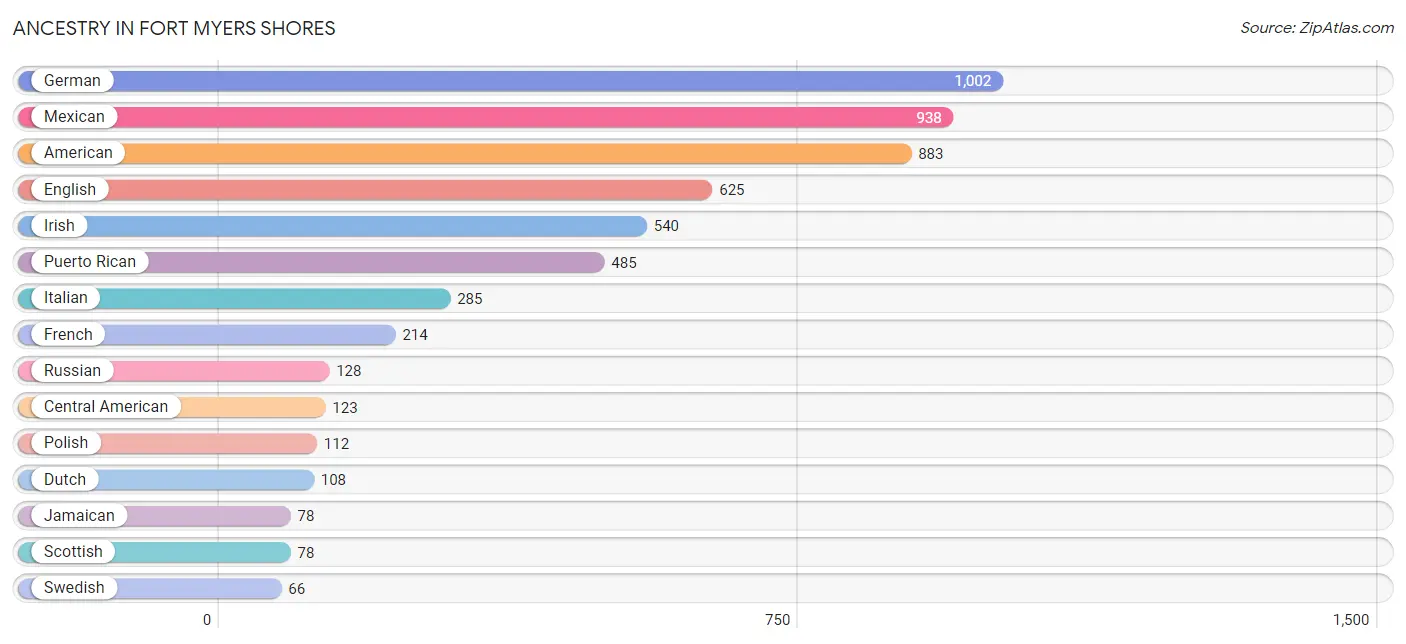
Ancestry in Fort Myers Shores
The most populous ancestries reported in Fort Myers Shores are German (1,002 | 16.7%), Mexican (938 | 15.7%), American (883 | 14.7%), English (625 | 10.4%), and Irish (540 | 9.0%), together accounting for 66.6% of all Fort Myers Shores residents.
| Ancestry | # Population | % Population |
| American | 883 | 14.7% |
| Arab | 12 | 0.2% |
| British | 54 | 0.9% |
| Central American | 123 | 2.1% |
| Central American Indian | 52 | 0.9% |
| Cherokee | 13 | 0.2% |
| Colombian | 34 | 0.6% |
| Costa Rican | 11 | 0.2% |
| Cuban | 26 | 0.4% |
| Danish | 24 | 0.4% |
| Dominican | 6 | 0.1% |
| Dutch | 108 | 1.8% |
| Eastern European | 20 | 0.3% |
| English | 625 | 10.4% |
| European | 41 | 0.7% |
| French | 214 | 3.6% |
| German | 1,002 | 16.7% |
| Guatemalan | 59 | 1.0% |
| Indian (Asian) | 17 | 0.3% |
| Irish | 540 | 9.0% |
| Italian | 285 | 4.8% |
| Jamaican | 78 | 1.3% |
| Lebanese | 12 | 0.2% |
| Mexican | 938 | 15.7% |
| Norwegian | 25 | 0.4% |
| Polish | 112 | 1.9% |
| Puerto Rican | 485 | 8.1% |
| Romanian | 19 | 0.3% |
| Russian | 128 | 2.1% |
| Salvadoran | 53 | 0.9% |
| Scottish | 78 | 1.3% |
| Slovak | 4 | 0.1% |
| South American | 41 | 0.7% |
| Spaniard | 13 | 0.2% |
| Swedish | 66 | 1.1% |
| Venezuelan | 7 | 0.1% |
| West Indian | 10 | 0.2% | View All 37 Rows |
Immigrants in Fort Myers Shores
The most numerous immigrant groups reported in Fort Myers Shores came from Latin America (813 | 13.6%), Central America (628 | 10.5%), Mexico (393 | 6.6%), El Salvador (119 | 2.0%), and Caribbean (116 | 1.9%), together accounting for 34.5% of all Fort Myers Shores residents.
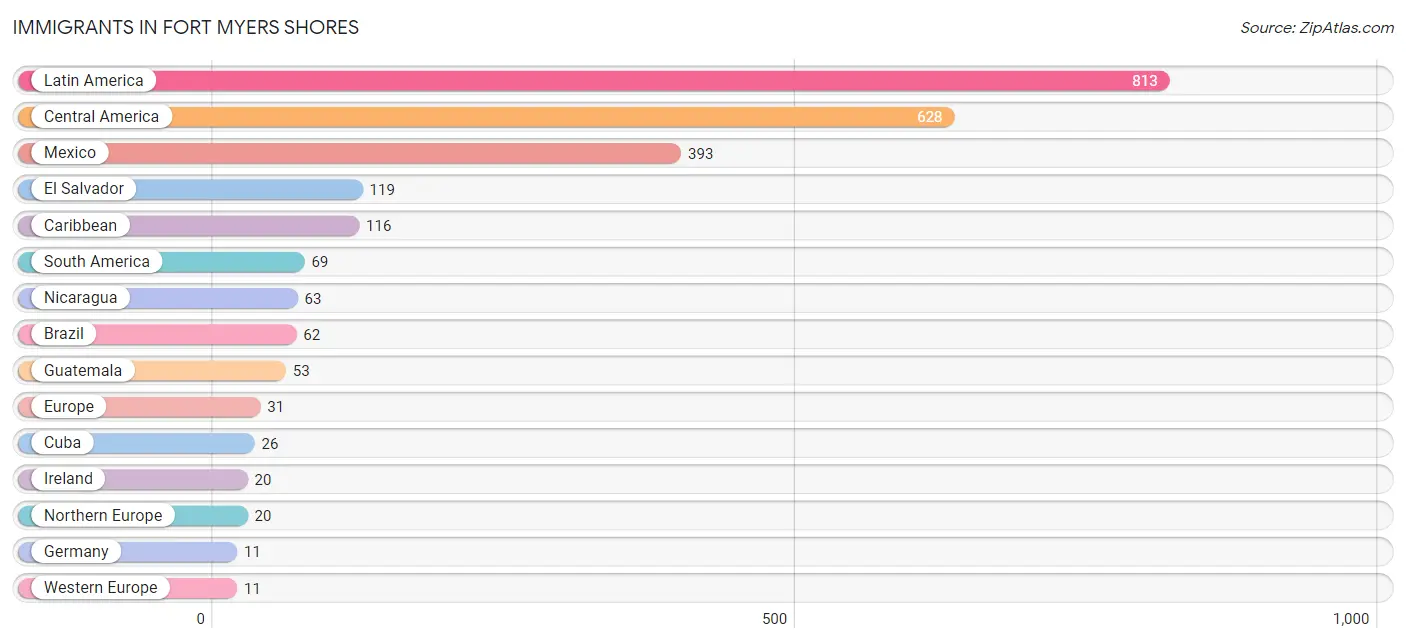
| Immigration Origin | # Population | % Population |
| Brazil | 62 | 1.0% |
| Caribbean | 116 | 1.9% |
| Central America | 628 | 10.5% |
| Cuba | 26 | 0.4% |
| El Salvador | 119 | 2.0% |
| Europe | 31 | 0.5% |
| Germany | 11 | 0.2% |
| Guatemala | 53 | 0.9% |
| Ireland | 20 | 0.3% |
| Jamaica | 2 | 0.0% |
| Latin America | 813 | 13.6% |
| Mexico | 393 | 6.6% |
| Nicaragua | 63 | 1.1% |
| Northern Europe | 20 | 0.3% |
| South America | 69 | 1.1% |
| Venezuela | 7 | 0.1% |
| Western Europe | 11 | 0.2% | View All 17 Rows |
Sex and Age in Fort Myers Shores
Sex and Age in Fort Myers Shores
The most populous age groups in Fort Myers Shores are 35 to 39 Years (347 | 11.0%) for men and 5 to 9 Years (309 | 10.9%) for women.
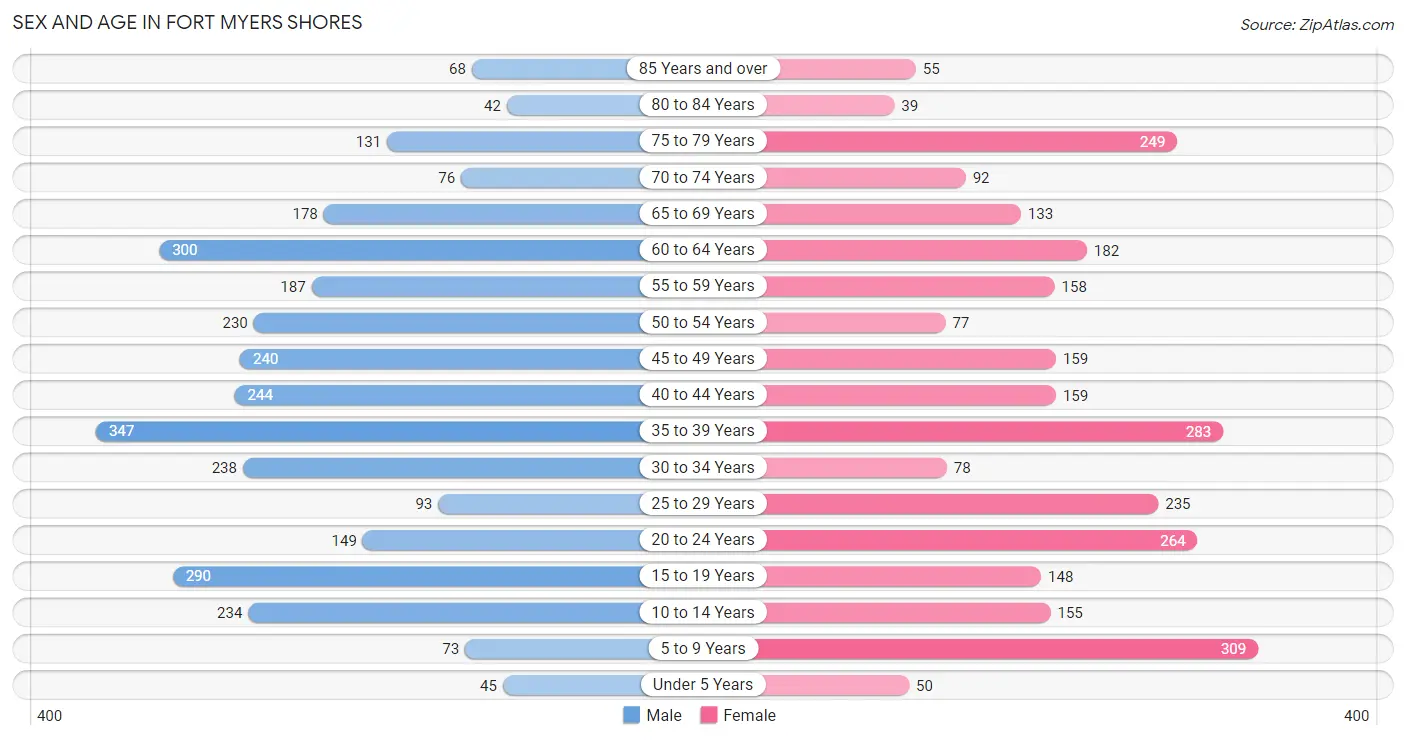
| Age Bracket | Male | Female |
| Under 5 Years | 45 (1.4%) | 50 (1.8%) |
| 5 to 9 Years | 73 (2.3%) | 309 (10.9%) |
| 10 to 14 Years | 234 (7.4%) | 155 (5.5%) |
| 15 to 19 Years | 290 (9.2%) | 148 (5.2%) |
| 20 to 24 Years | 149 (4.7%) | 264 (9.3%) |
| 25 to 29 Years | 93 (2.9%) | 235 (8.3%) |
| 30 to 34 Years | 238 (7.5%) | 78 (2.8%) |
| 35 to 39 Years | 347 (11.0%) | 283 (10.0%) |
| 40 to 44 Years | 244 (7.7%) | 159 (5.6%) |
| 45 to 49 Years | 240 (7.6%) | 159 (5.6%) |
| 50 to 54 Years | 230 (7.3%) | 77 (2.7%) |
| 55 to 59 Years | 187 (5.9%) | 158 (5.6%) |
| 60 to 64 Years | 300 (9.5%) | 182 (6.4%) |
| 65 to 69 Years | 178 (5.6%) | 133 (4.7%) |
| 70 to 74 Years | 76 (2.4%) | 92 (3.3%) |
| 75 to 79 Years | 131 (4.1%) | 249 (8.8%) |
| 80 to 84 Years | 42 (1.3%) | 39 (1.4%) |
| 85 Years and over | 68 (2.1%) | 55 (1.9%) |
| Total | 3,165 (100.0%) | 2,825 (100.0%) |
Families and Households in Fort Myers Shores
Median Family Size in Fort Myers Shores
The median family size in Fort Myers Shores is 3.26 persons per family, with married-couple families (1,006 | 67.7%) accounting for the largest median family size of 3.41 persons per family. On the other hand, single male/father families (180 | 12.1%) represent the smallest median family size with 2.64 persons per family.
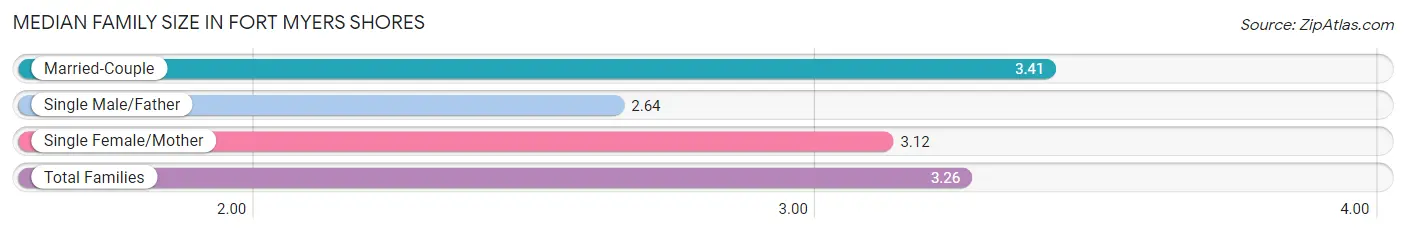
| Family Type | # Families | Family Size |
| Married-Couple | 1,006 (67.7%) | 3.41 |
| Single Male/Father | 180 (12.1%) | 2.64 |
| Single Female/Mother | 300 (20.2%) | 3.12 |
| Total Families | 1,486 (100.0%) | 3.26 |
Median Household Size in Fort Myers Shores
The median household size in Fort Myers Shores is 2.59 persons per household, with married-couple households (1,006 | 43.6%) accounting for the largest median household size of 3.5 persons per household. non-family households (819 | 35.5%) represent the smallest median household size with 1.13 persons per household.
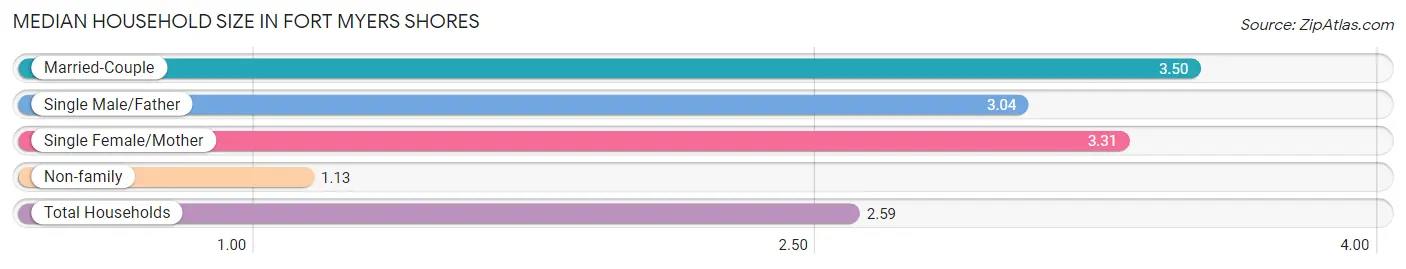
| Household Type | # Households | Household Size |
| Married-Couple | 1,006 (43.6%) | 3.50 |
| Single Male/Father | 180 (7.8%) | 3.04 |
| Single Female/Mother | 300 (13.0%) | 3.31 |
| Non-family | 819 (35.5%) | 1.13 |
| Total Households | 2,305 (100.0%) | 2.59 |
Household Size by Marriage Status in Fort Myers Shores
Out of a total of 2,305 households in Fort Myers Shores, 1,486 (64.5%) are family households, while 819 (35.5%) are nonfamily households. The most numerous type of family households are 2-person households, comprising 754, and the most common type of nonfamily households are 1-person households, comprising 727.
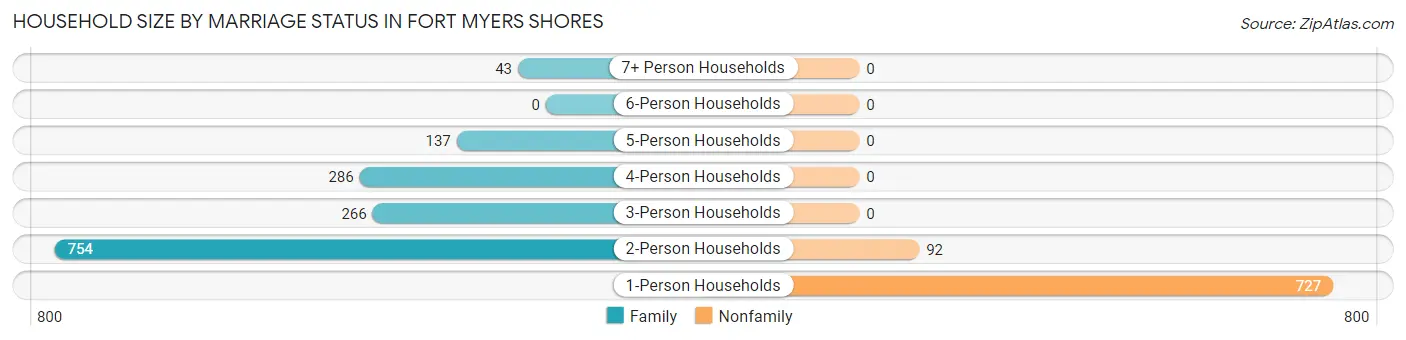
| Household Size | Family Households | Nonfamily Households |
| 1-Person Households | - | 727 (31.5%) |
| 2-Person Households | 754 (32.7%) | 92 (4.0%) |
| 3-Person Households | 266 (11.5%) | 0 (0.0%) |
| 4-Person Households | 286 (12.4%) | 0 (0.0%) |
| 5-Person Households | 137 (5.9%) | 0 (0.0%) |
| 6-Person Households | 0 (0.0%) | 0 (0.0%) |
| 7+ Person Households | 43 (1.9%) | 0 (0.0%) |
| Total | 1,486 (64.5%) | 819 (35.5%) |
Female Fertility in Fort Myers Shores
Fertility by Age in Fort Myers Shores
| Age Bracket | Women with Births | Births / 1,000 Women |
| 15 to 19 years | 0 (0.0%) | 0.0 |
| 20 to 34 years | 0 (0.0%) | 0.0 |
| 35 to 50 years | 0 (0.0%) | 0.0 |
| Total | 0 (0.0%) | 0.0 |
Fertility by Age by Marriage Status in Fort Myers Shores
| Age Bracket | Married | Unmarried |
| 15 to 19 years | 0 (0.0%) | 0 (0.0%) |
| 20 to 34 years | 0 (0.0%) | 0 (0.0%) |
| 35 to 50 years | 0 (0.0%) | 0 (0.0%) |
| Total | 0 (0.0%) | 0 (0.0%) |
Fertility by Education in Fort Myers Shores
| Educational Attainment | Women with Births | Births / 1,000 Women |
| Less than High School | 0 (0.0%) | 0.0 |
| High School Diploma | 0 (0.0%) | 0.0 |
| College or Associate's Degree | 0 (0.0%) | 0.0 |
| Bachelor's Degree | 0 (0.0%) | 0.0 |
| Graduate Degree | 0 (0.0%) | 0.0 |
| Total | 0 (0.0%) | 0.0 |
Fertility by Education by Marriage Status in Fort Myers Shores
| Educational Attainment | Married | Unmarried |
| Less than High School | 0 (0.0%) | 0 (0.0%) |
| High School Diploma | 0 (0.0%) | 0 (0.0%) |
| College or Associate's Degree | 0 (0.0%) | 0 (0.0%) |
| Bachelor's Degree | 0 (0.0%) | 0 (0.0%) |
| Graduate Degree | 0 (0.0%) | 0 (0.0%) |
| Total | 0 (0.0%) | 0 (0.0%) |
Employment Characteristics in Fort Myers Shores
Employment by Class of Employer in Fort Myers Shores
Among the 2,722 employed individuals in Fort Myers Shores, private company employees (2,117 | 77.8%), self-employed (not incorporated) (202 | 7.4%), and not-for-profit organizations (187 | 6.9%) make up the most common classes of employment.
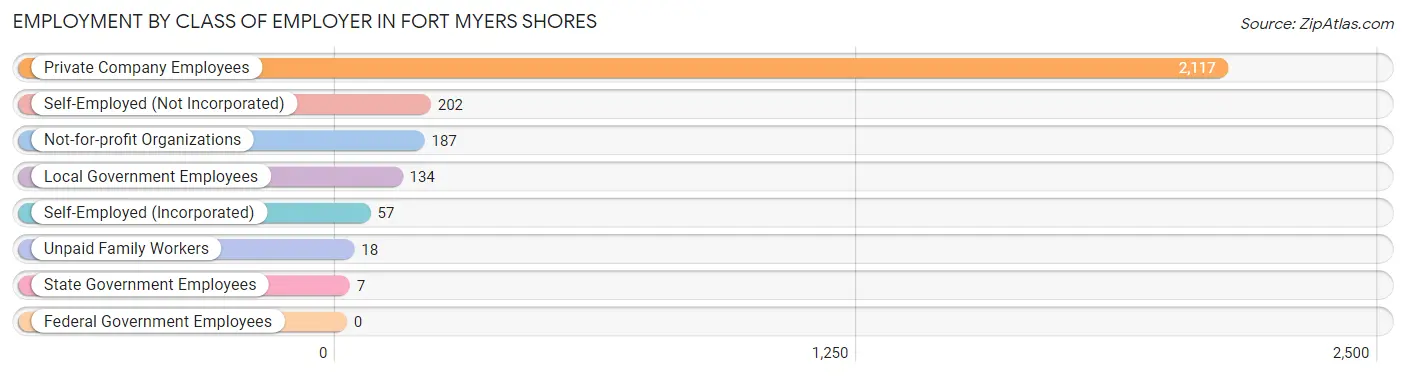
| Employer Class | # Employees | % Employees |
| Private Company Employees | 2,117 | 77.8% |
| Self-Employed (Incorporated) | 57 | 2.1% |
| Self-Employed (Not Incorporated) | 202 | 7.4% |
| Not-for-profit Organizations | 187 | 6.9% |
| Local Government Employees | 134 | 4.9% |
| State Government Employees | 7 | 0.3% |
| Federal Government Employees | 0 | 0.0% |
| Unpaid Family Workers | 18 | 0.7% |
| Total | 2,722 | 100.0% |
Employment Status by Age in Fort Myers Shores
According to the labor force statistics for Fort Myers Shores, out of the total population over 16 years of age (5,063), 59.7% or 3,023 individuals are in the labor force, with 7.9% or 239 of them unemployed. The age group with the highest labor force participation rate is 25 to 29 years, with 100.0% or 328 individuals in the labor force. Within the labor force, the 20 to 24 years age range has the highest percentage of unemployed individuals, with 31.9% or 109 of them being unemployed.
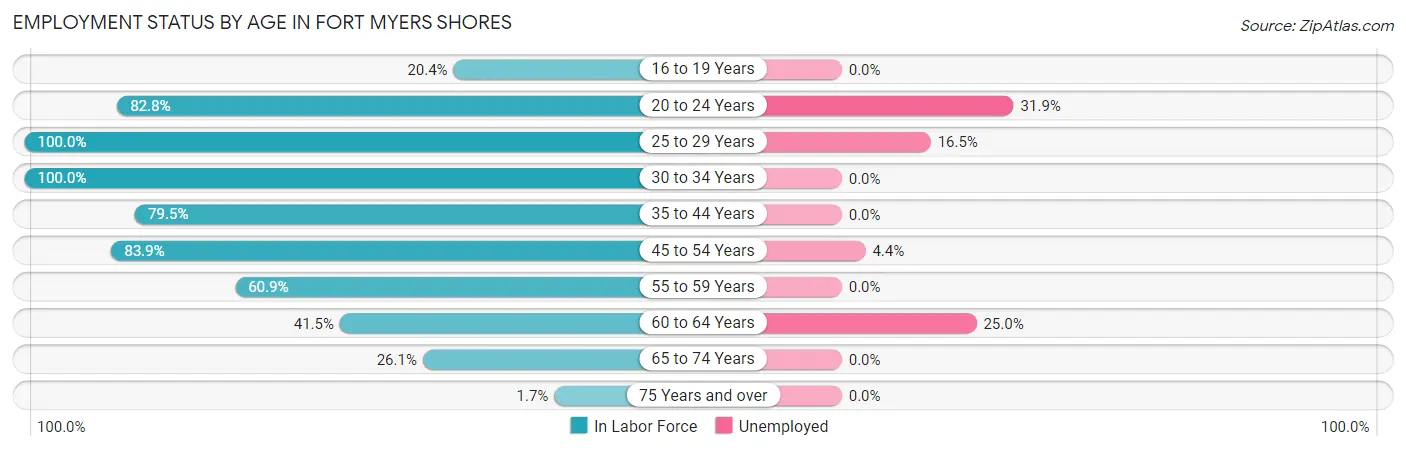
| Age Bracket | In Labor Force | Unemployed |
| 16 to 19 Years | 77 (20.4%) | 0 (0.0%) |
| 20 to 24 Years | 342 (82.8%) | 109 (31.9%) |
| 25 to 29 Years | 328 (100.0%) | 54 (16.5%) |
| 30 to 34 Years | 316 (100.0%) | 0 (0.0%) |
| 35 to 44 Years | 821 (79.5%) | 0 (0.0%) |
| 45 to 54 Years | 592 (83.9%) | 26 (4.4%) |
| 55 to 59 Years | 210 (60.9%) | 0 (0.0%) |
| 60 to 64 Years | 200 (41.5%) | 50 (25.0%) |
| 65 to 74 Years | 125 (26.1%) | 0 (0.0%) |
| 75 Years and over | 10 (1.7%) | 0 (0.0%) |
| Total | 3,023 (59.7%) | 239 (7.9%) |
Employment Status by Educational Attainment in Fort Myers Shores
According to labor force statistics for Fort Myers Shores, 76.9% of individuals (2,468) out of the total population between 25 and 64 years of age (3,210) are in the labor force, with 5.3% or 131 of them being unemployed. The group with the highest labor force participation rate are those with the educational attainment of bachelor's degree or higher, with 81.9% or 325 individuals in the labor force. Within the labor force, individuals with college / associate degree education have the highest percentage of unemployment, with 8.1% or 54 of them being unemployed.
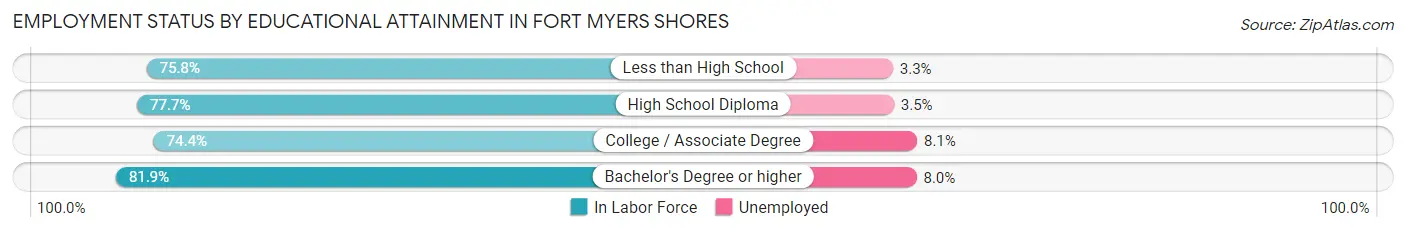
| Educational Attainment | In Labor Force | Unemployed |
| Less than High School | 553 (75.8%) | 24 (3.3%) |
| High School Diploma | 918 (77.7%) | 41 (3.5%) |
| College / Associate Degree | 670 (74.4%) | 73 (8.1%) |
| Bachelor's Degree or higher | 325 (81.9%) | 32 (8.0%) |
| Total | 2,468 (76.9%) | 170 (5.3%) |
Employment Occupations by Sex in Fort Myers Shores
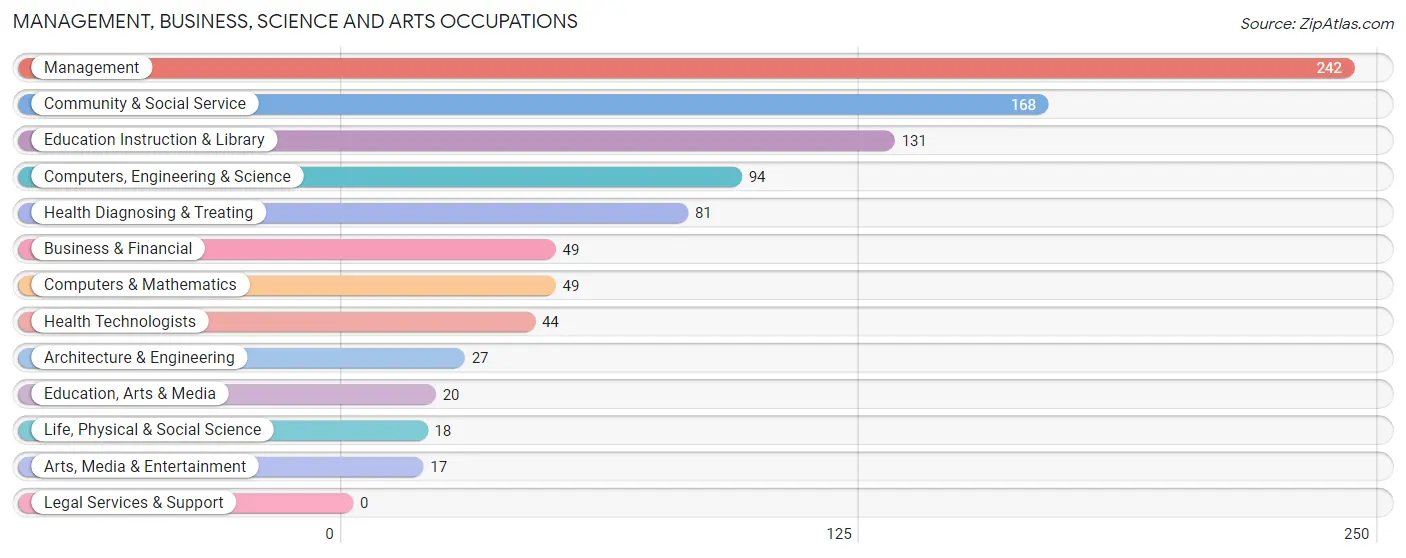
Management, Business, Science and Arts Occupations
The most common Management, Business, Science and Arts occupations in Fort Myers Shores are Management (242 | 8.7%), Community & Social Service (168 | 6.0%), Education Instruction & Library (131 | 4.7%), Computers, Engineering & Science (94 | 3.4%), and Health Diagnosing & Treating (81 | 2.9%).
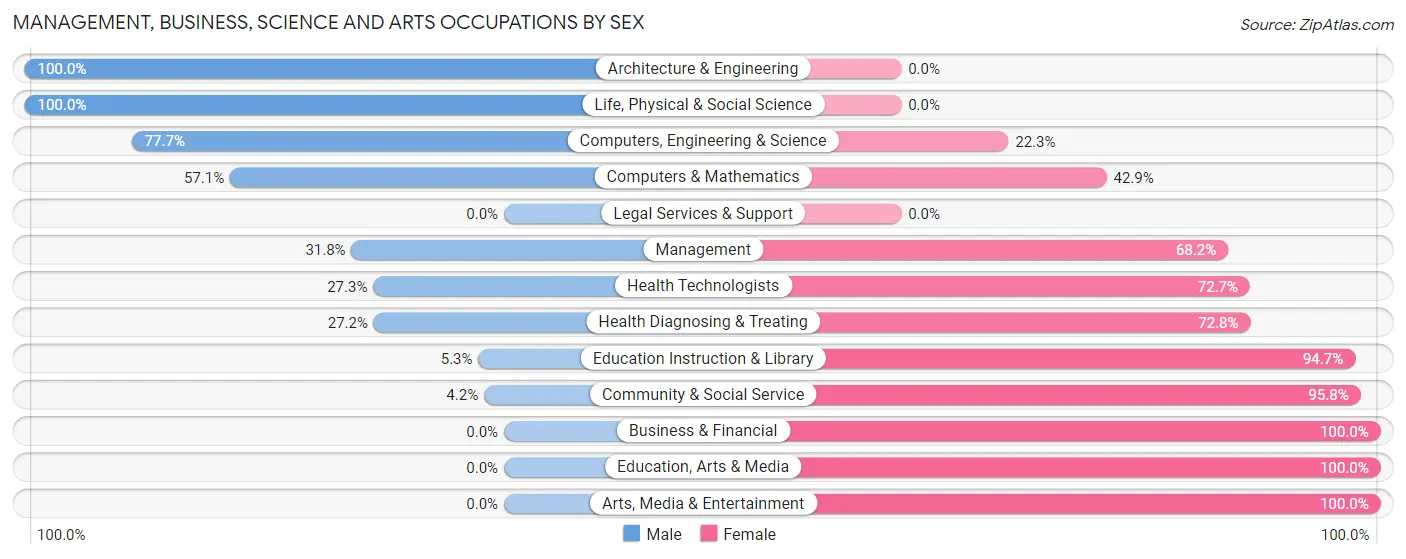
Management, Business, Science and Arts Occupations by Sex
Within the Management, Business, Science and Arts occupations in Fort Myers Shores, the most male-oriented occupations are Architecture & Engineering (100.0%), Life, Physical & Social Science (100.0%), and Computers, Engineering & Science (77.7%), while the most female-oriented occupations are Business & Financial (100.0%), Education, Arts & Media (100.0%), and Arts, Media & Entertainment (100.0%).
| Occupation | Male | Female |
| Management | 77 (31.8%) | 165 (68.2%) |
| Business & Financial | 0 (0.0%) | 49 (100.0%) |
| Computers, Engineering & Science | 73 (77.7%) | 21 (22.3%) |
| Computers & Mathematics | 28 (57.1%) | 21 (42.9%) |
| Architecture & Engineering | 27 (100.0%) | 0 (0.0%) |
| Life, Physical & Social Science | 18 (100.0%) | 0 (0.0%) |
| Community & Social Service | 7 (4.2%) | 161 (95.8%) |
| Education, Arts & Media | 0 (0.0%) | 20 (100.0%) |
| Legal Services & Support | 0 (0.0%) | 0 (0.0%) |
| Education Instruction & Library | 7 (5.3%) | 124 (94.7%) |
| Arts, Media & Entertainment | 0 (0.0%) | 17 (100.0%) |
| Health Diagnosing & Treating | 22 (27.2%) | 59 (72.8%) |
| Health Technologists | 12 (27.3%) | 32 (72.7%) |
| Total (Category) | 179 (28.2%) | 455 (71.8%) |
| Total (Overall) | 1,656 (59.5%) | 1,126 (40.5%) |
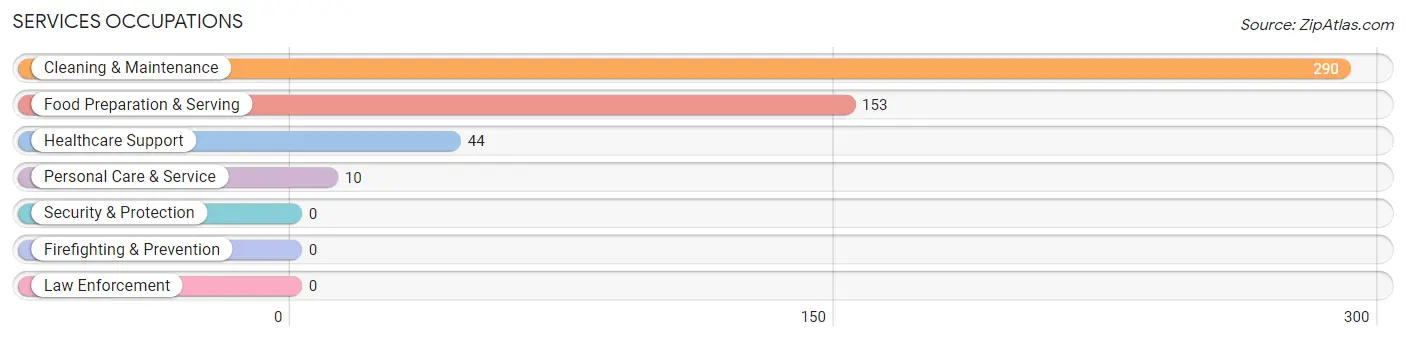
Services Occupations
The most common Services occupations in Fort Myers Shores are Cleaning & Maintenance (290 | 10.4%), Food Preparation & Serving (153 | 5.5%), Healthcare Support (44 | 1.6%), and Personal Care & Service (10 | 0.4%).
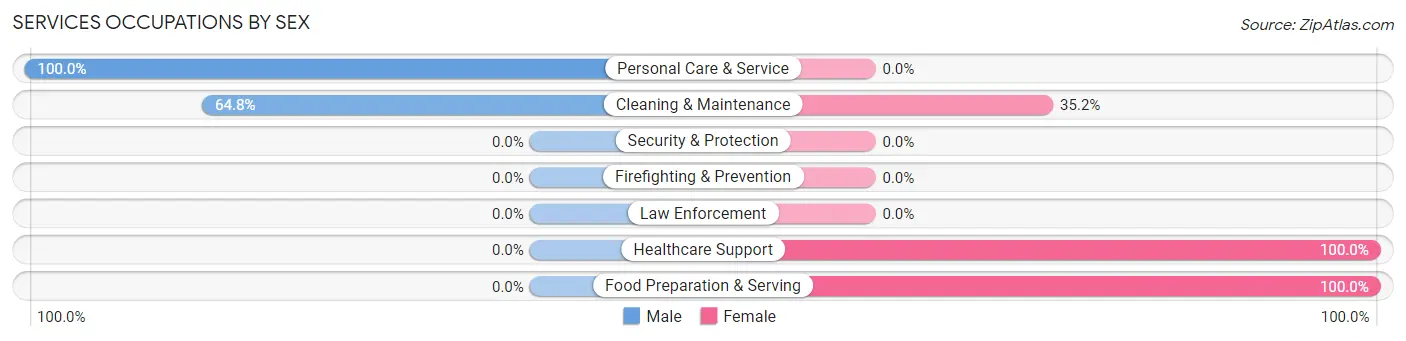
Services Occupations by Sex
Within the Services occupations in Fort Myers Shores, the most male-oriented occupations are Personal Care & Service (100.0%), and Cleaning & Maintenance (64.8%), while the most female-oriented occupations are Healthcare Support (100.0%), Food Preparation & Serving (100.0%), and Cleaning & Maintenance (35.2%).
| Occupation | Male | Female |
| Healthcare Support | 0 (0.0%) | 44 (100.0%) |
| Security & Protection | 0 (0.0%) | 0 (0.0%) |
| Firefighting & Prevention | 0 (0.0%) | 0 (0.0%) |
| Law Enforcement | 0 (0.0%) | 0 (0.0%) |
| Food Preparation & Serving | 0 (0.0%) | 153 (100.0%) |
| Cleaning & Maintenance | 188 (64.8%) | 102 (35.2%) |
| Personal Care & Service | 10 (100.0%) | 0 (0.0%) |
| Total (Category) | 198 (39.8%) | 299 (60.2%) |
| Total (Overall) | 1,656 (59.5%) | 1,126 (40.5%) |
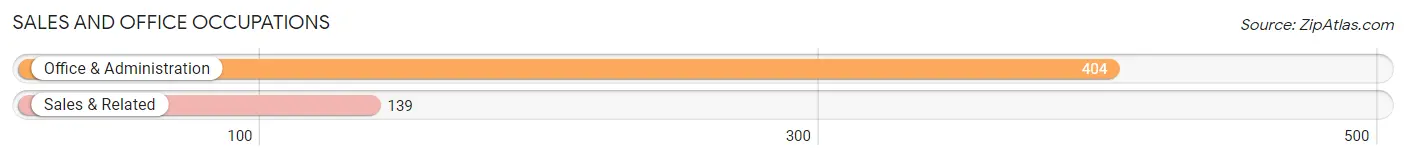
Sales and Office Occupations
The most common Sales and Office occupations in Fort Myers Shores are Office & Administration (404 | 14.5%), and Sales & Related (139 | 5.0%).
Sales and Office Occupations by Sex
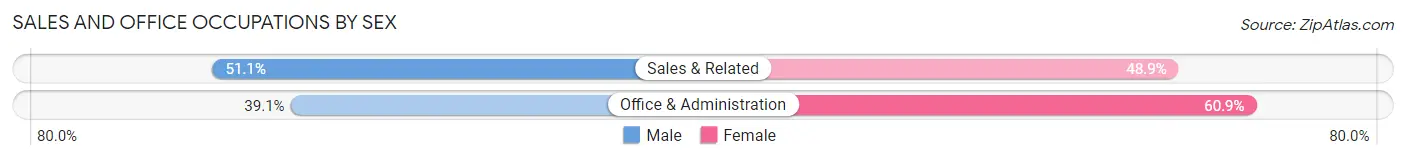
| Occupation | Male | Female |
| Sales & Related | 71 (51.1%) | 68 (48.9%) |
| Office & Administration | 158 (39.1%) | 246 (60.9%) |
| Total (Category) | 229 (42.2%) | 314 (57.8%) |
| Total (Overall) | 1,656 (59.5%) | 1,126 (40.5%) |
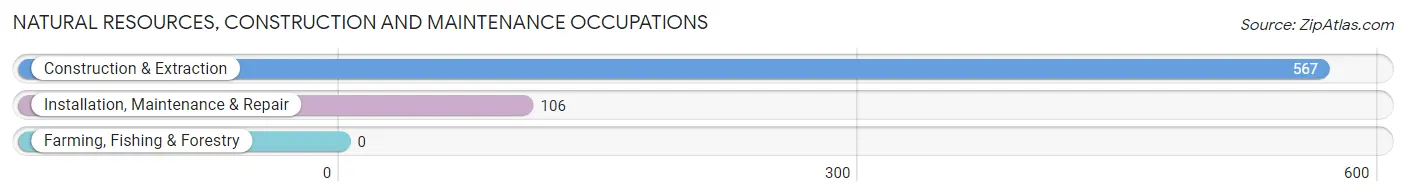
Natural Resources, Construction and Maintenance Occupations
The most common Natural Resources, Construction and Maintenance occupations in Fort Myers Shores are Construction & Extraction (567 | 20.4%), and Installation, Maintenance & Repair (106 | 3.8%).
Natural Resources, Construction and Maintenance Occupations by Sex
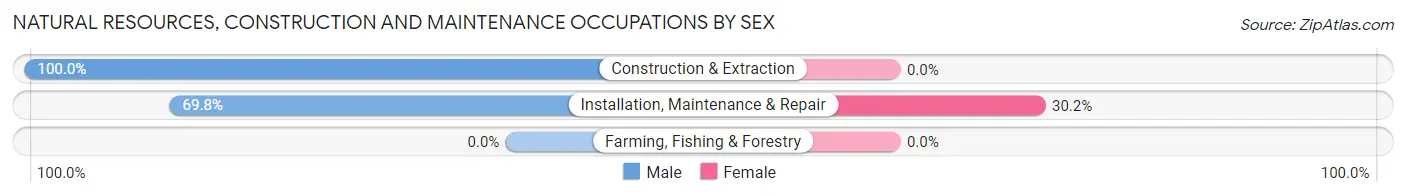
| Occupation | Male | Female |
| Farming, Fishing & Forestry | 0 (0.0%) | 0 (0.0%) |
| Construction & Extraction | 567 (100.0%) | 0 (0.0%) |
| Installation, Maintenance & Repair | 74 (69.8%) | 32 (30.2%) |
| Total (Category) | 641 (95.3%) | 32 (4.8%) |
| Total (Overall) | 1,656 (59.5%) | 1,126 (40.5%) |
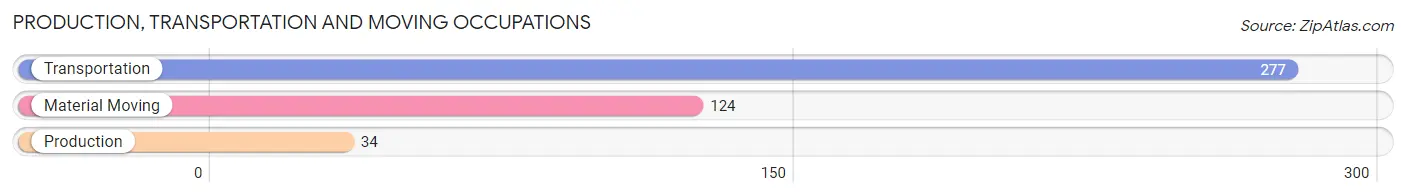
Production, Transportation and Moving Occupations
The most common Production, Transportation and Moving occupations in Fort Myers Shores are Transportation (277 | 10.0%), Material Moving (124 | 4.5%), and Production (34 | 1.2%).
Production, Transportation and Moving Occupations by Sex
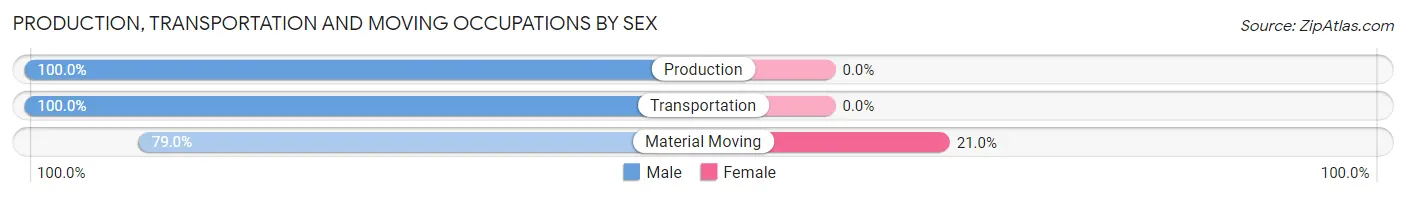
| Occupation | Male | Female |
| Production | 34 (100.0%) | 0 (0.0%) |
| Transportation | 277 (100.0%) | 0 (0.0%) |
| Material Moving | 98 (79.0%) | 26 (21.0%) |
| Total (Category) | 409 (94.0%) | 26 (6.0%) |
| Total (Overall) | 1,656 (59.5%) | 1,126 (40.5%) |
Employment Industries by Sex in Fort Myers Shores
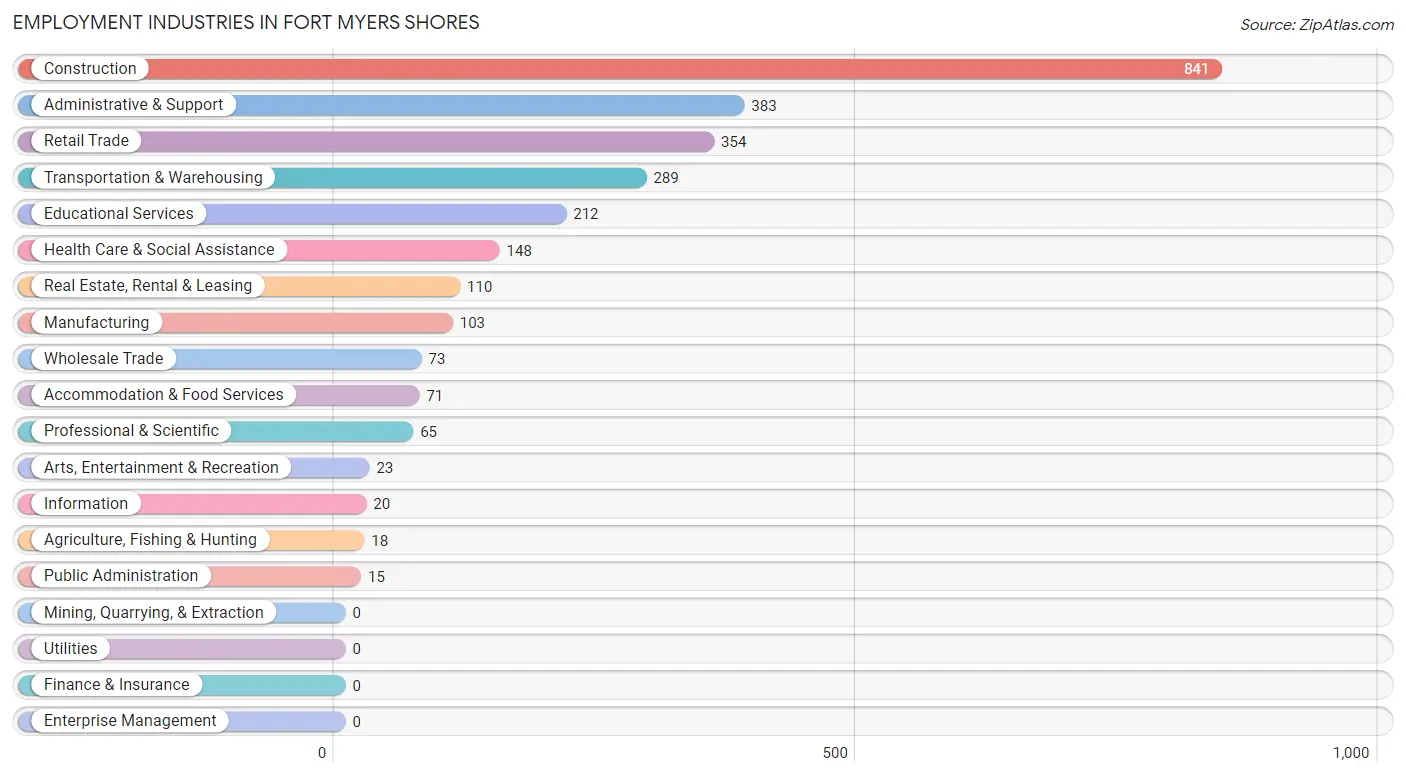
Employment Industries in Fort Myers Shores
The major employment industries in Fort Myers Shores include Construction (841 | 30.2%), Administrative & Support (383 | 13.8%), Retail Trade (354 | 12.7%), Transportation & Warehousing (289 | 10.4%), and Educational Services (212 | 7.6%).
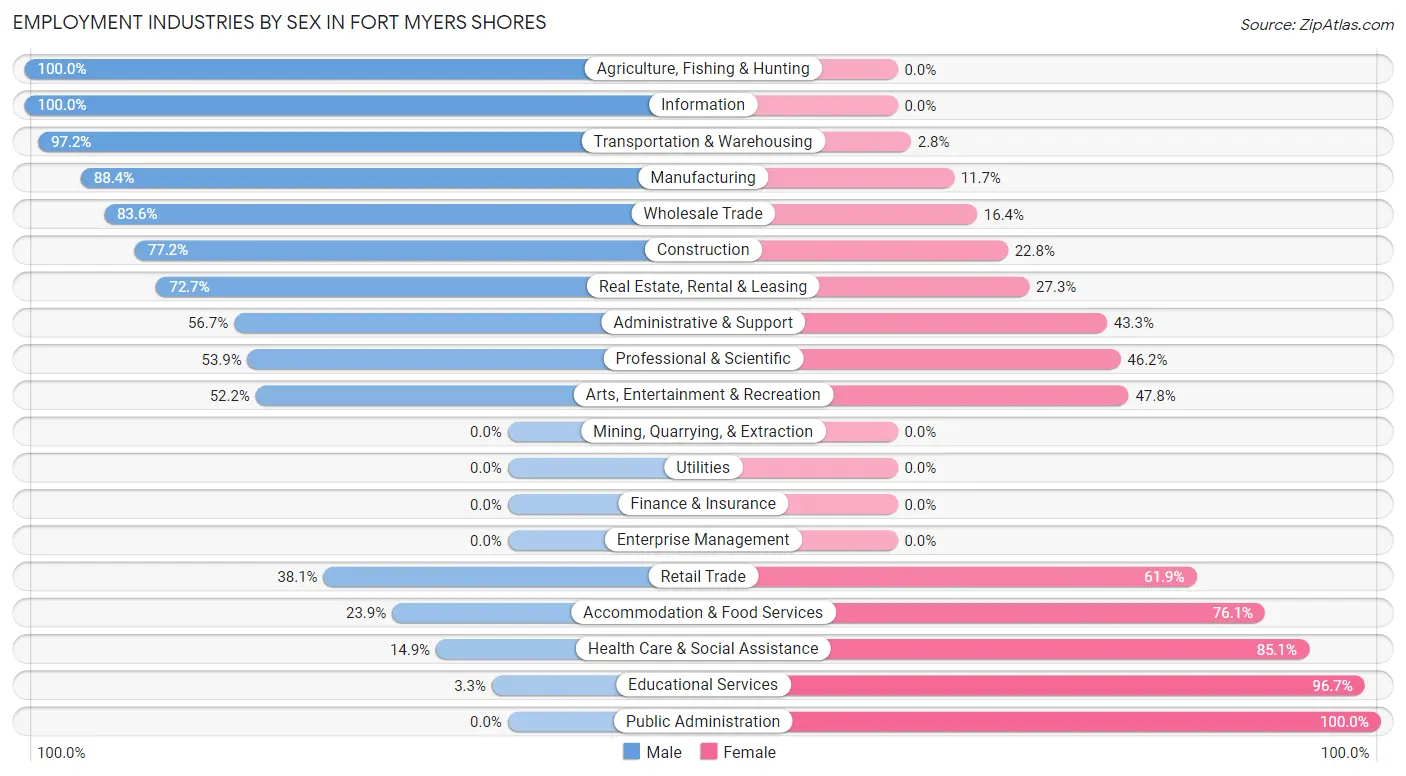
Employment Industries by Sex in Fort Myers Shores
The Fort Myers Shores industries that see more men than women are Agriculture, Fishing & Hunting (100.0%), Information (100.0%), and Transportation & Warehousing (97.2%), whereas the industries that tend to have a higher number of women are Public Administration (100.0%), Educational Services (96.7%), and Health Care & Social Assistance (85.1%).
| Industry | Male | Female |
| Agriculture, Fishing & Hunting | 18 (100.0%) | 0 (0.0%) |
| Mining, Quarrying, & Extraction | 0 (0.0%) | 0 (0.0%) |
| Construction | 649 (77.2%) | 192 (22.8%) |
| Manufacturing | 91 (88.3%) | 12 (11.7%) |
| Wholesale Trade | 61 (83.6%) | 12 (16.4%) |
| Retail Trade | 135 (38.1%) | 219 (61.9%) |
| Transportation & Warehousing | 281 (97.2%) | 8 (2.8%) |
| Utilities | 0 (0.0%) | 0 (0.0%) |
| Information | 20 (100.0%) | 0 (0.0%) |
| Finance & Insurance | 0 (0.0%) | 0 (0.0%) |
| Real Estate, Rental & Leasing | 80 (72.7%) | 30 (27.3%) |
| Professional & Scientific | 35 (53.8%) | 30 (46.2%) |
| Enterprise Management | 0 (0.0%) | 0 (0.0%) |
| Administrative & Support | 217 (56.7%) | 166 (43.3%) |
| Educational Services | 7 (3.3%) | 205 (96.7%) |
| Health Care & Social Assistance | 22 (14.9%) | 126 (85.1%) |
| Arts, Entertainment & Recreation | 12 (52.2%) | 11 (47.8%) |
| Accommodation & Food Services | 17 (23.9%) | 54 (76.1%) |
| Public Administration | 0 (0.0%) | 15 (100.0%) |
| Total | 1,656 (59.5%) | 1,126 (40.5%) |
Education in Fort Myers Shores
School Enrollment in Fort Myers Shores
The most common levels of schooling among the 1,510 students in Fort Myers Shores are high school (580 | 38.4%), elementary school (358 | 23.7%), and middle school (232 | 15.4%).
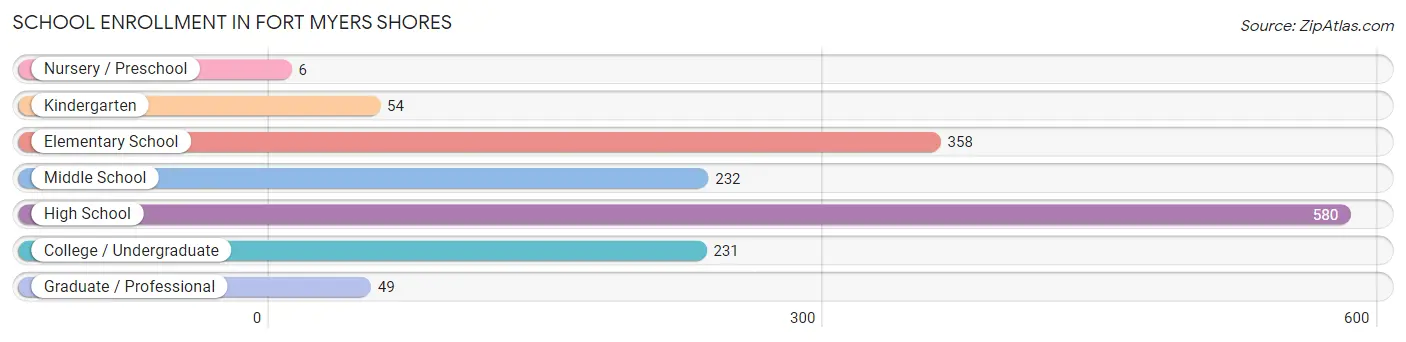
| School Level | # Students | % Students |
| Nursery / Preschool | 6 | 0.4% |
| Kindergarten | 54 | 3.6% |
| Elementary School | 358 | 23.7% |
| Middle School | 232 | 15.4% |
| High School | 580 | 38.4% |
| College / Undergraduate | 231 | 15.3% |
| Graduate / Professional | 49 | 3.3% |
| Total | 1,510 | 100.0% |
School Enrollment by Age by Funding Source in Fort Myers Shores
Out of a total of 1,510 students who are enrolled in schools in Fort Myers Shores, 156 (10.3%) attend a private institution, while the remaining 1,354 (89.7%) are enrolled in public schools. The age group of 35 years and over has the highest likelihood of being enrolled in private schools, with 10 (100.0% in the age bracket) enrolled. Conversely, the age group of 3 to 4 year olds has the lowest likelihood of being enrolled in a private school, with 6 (100.0% in the age bracket) attending a public institution.
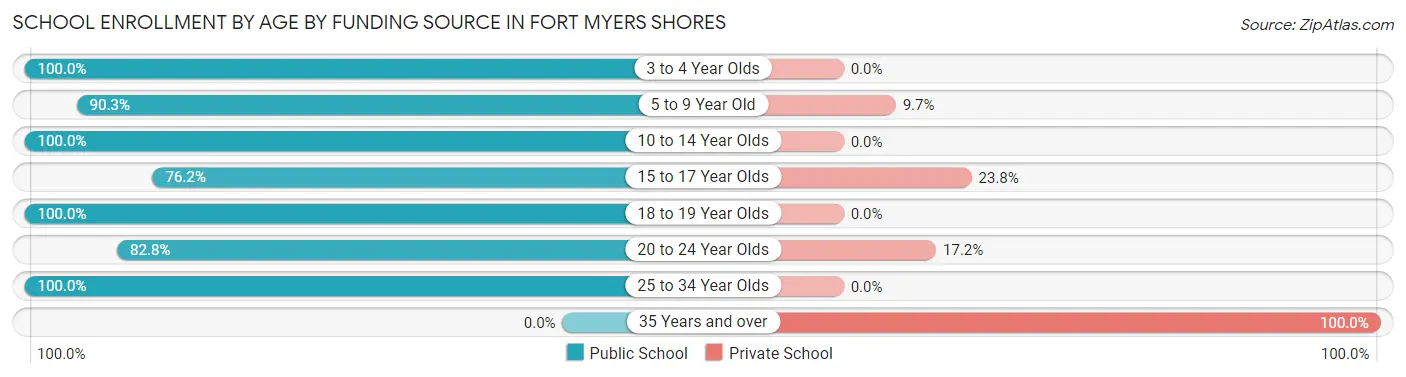
| Age Bracket | Public School | Private School |
| 3 to 4 Year Olds | 6 (100.0%) | 0 (0.0%) |
| 5 to 9 Year Old | 345 (90.3%) | 37 (9.7%) |
| 10 to 14 Year Olds | 389 (100.0%) | 0 (0.0%) |
| 15 to 17 Year Olds | 195 (76.2%) | 61 (23.8%) |
| 18 to 19 Year Olds | 67 (100.0%) | 0 (0.0%) |
| 20 to 24 Year Olds | 226 (82.8%) | 47 (17.2%) |
| 25 to 34 Year Olds | 127 (100.0%) | 0 (0.0%) |
| 35 Years and over | 0 (0.0%) | 10 (100.0%) |
| Total | 1,354 (89.7%) | 156 (10.3%) |
Educational Attainment by Field of Study in Fort Myers Shores
Business (129 | 20.6%), visual & performing arts (108 | 17.2%), engineering (76 | 12.1%), liberal arts & history (71 | 11.3%), and education (62 | 9.9%) are the most common fields of study among 626 individuals in Fort Myers Shores who have obtained a bachelor's degree or higher.
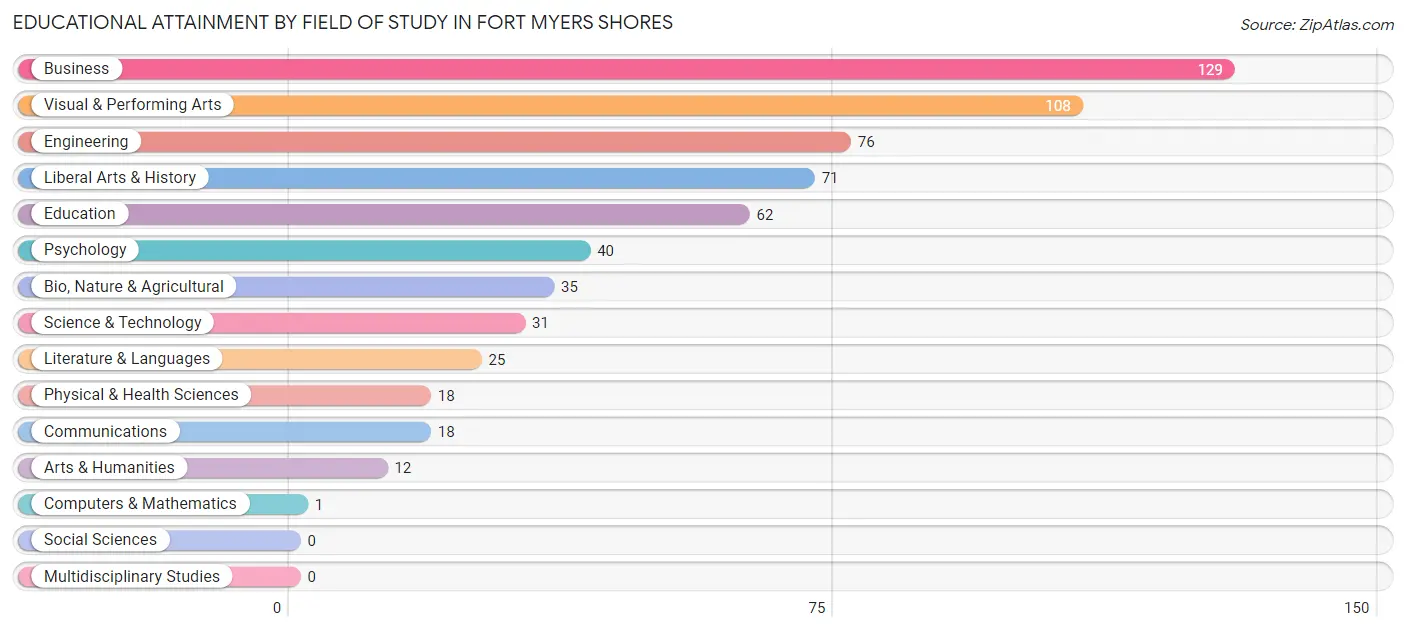
| Field of Study | # Graduates | % Graduates |
| Computers & Mathematics | 1 | 0.2% |
| Bio, Nature & Agricultural | 35 | 5.6% |
| Physical & Health Sciences | 18 | 2.9% |
| Psychology | 40 | 6.4% |
| Social Sciences | 0 | 0.0% |
| Engineering | 76 | 12.1% |
| Multidisciplinary Studies | 0 | 0.0% |
| Science & Technology | 31 | 5.0% |
| Business | 129 | 20.6% |
| Education | 62 | 9.9% |
| Literature & Languages | 25 | 4.0% |
| Liberal Arts & History | 71 | 11.3% |
| Visual & Performing Arts | 108 | 17.2% |
| Communications | 18 | 2.9% |
| Arts & Humanities | 12 | 1.9% |
| Total | 626 | 100.0% |
Transportation & Commute in Fort Myers Shores
Vehicle Availability by Sex in Fort Myers Shores
The most prevalent vehicle ownership categories in Fort Myers Shores are males with 2 vehicles (702, accounting for 44.0%) and females with 2 vehicles (469, making up 62.3%).
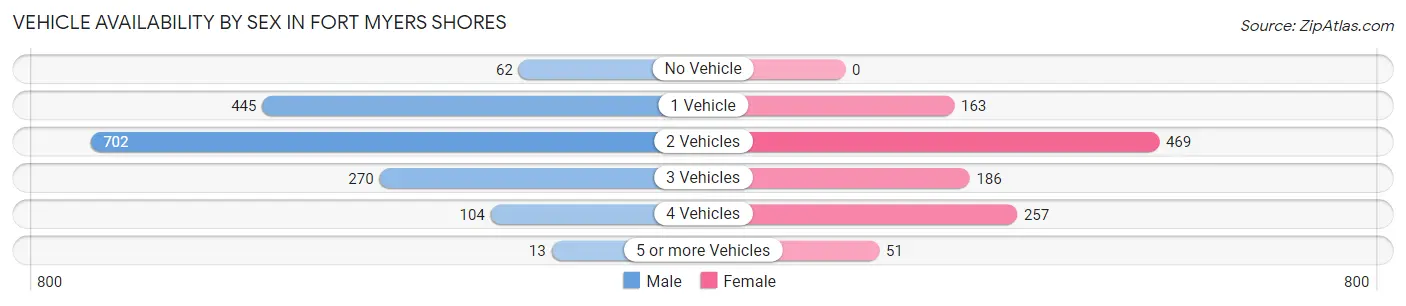
| Vehicles Available | Male | Female |
| No Vehicle | 62 (3.9%) | 0 (0.0%) |
| 1 Vehicle | 445 (27.9%) | 163 (14.5%) |
| 2 Vehicles | 702 (44.0%) | 469 (41.6%) |
| 3 Vehicles | 270 (16.9%) | 186 (16.5%) |
| 4 Vehicles | 104 (6.5%) | 257 (22.8%) |
| 5 or more Vehicles | 13 (0.8%) | 51 (4.5%) |
| Total | 1,596 (100.0%) | 1,126 (100.0%) |
Commute Time in Fort Myers Shores
The most frequently occuring commute durations in Fort Myers Shores are 30 to 34 minutes (863 commuters, 35.7%), 25 to 29 minutes (326 commuters, 13.5%), and 15 to 19 minutes (278 commuters, 11.5%).
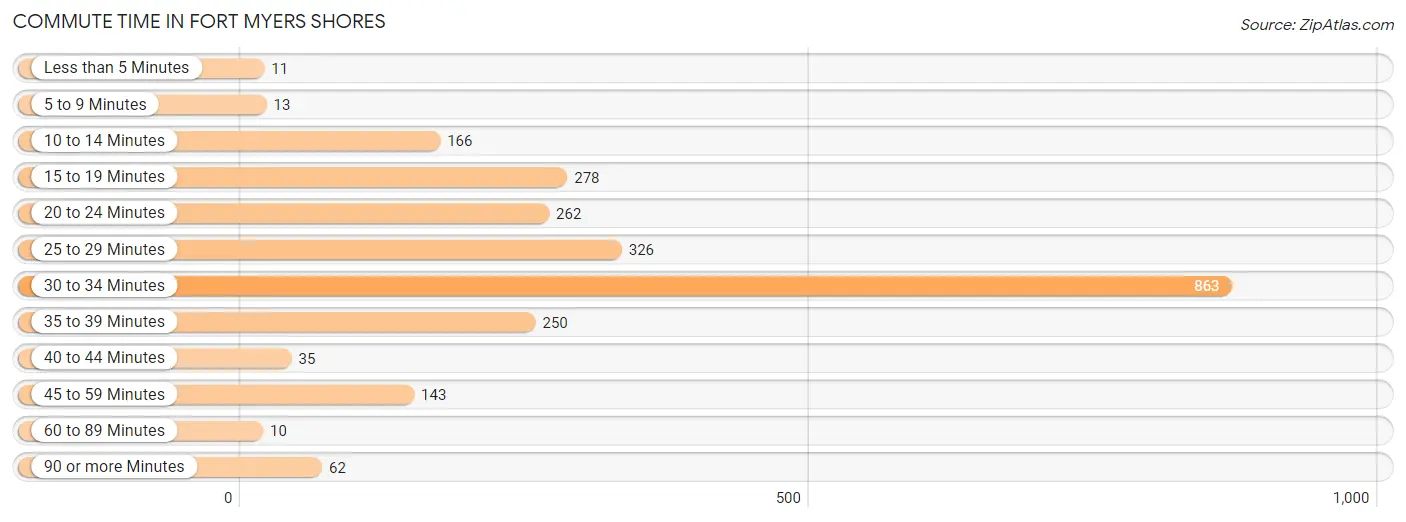
| Commute Time | # Commuters | % Commuters |
| Less than 5 Minutes | 11 | 0.4% |
| 5 to 9 Minutes | 13 | 0.5% |
| 10 to 14 Minutes | 166 | 6.9% |
| 15 to 19 Minutes | 278 | 11.5% |
| 20 to 24 Minutes | 262 | 10.8% |
| 25 to 29 Minutes | 326 | 13.5% |
| 30 to 34 Minutes | 863 | 35.7% |
| 35 to 39 Minutes | 250 | 10.3% |
| 40 to 44 Minutes | 35 | 1.5% |
| 45 to 59 Minutes | 143 | 5.9% |
| 60 to 89 Minutes | 10 | 0.4% |
| 90 or more Minutes | 62 | 2.6% |
Commute Time by Sex in Fort Myers Shores
The most common commute times in Fort Myers Shores are 30 to 34 minutes (380 commuters, 27.6%) for males and 30 to 34 minutes (483 commuters, 46.4%) for females.
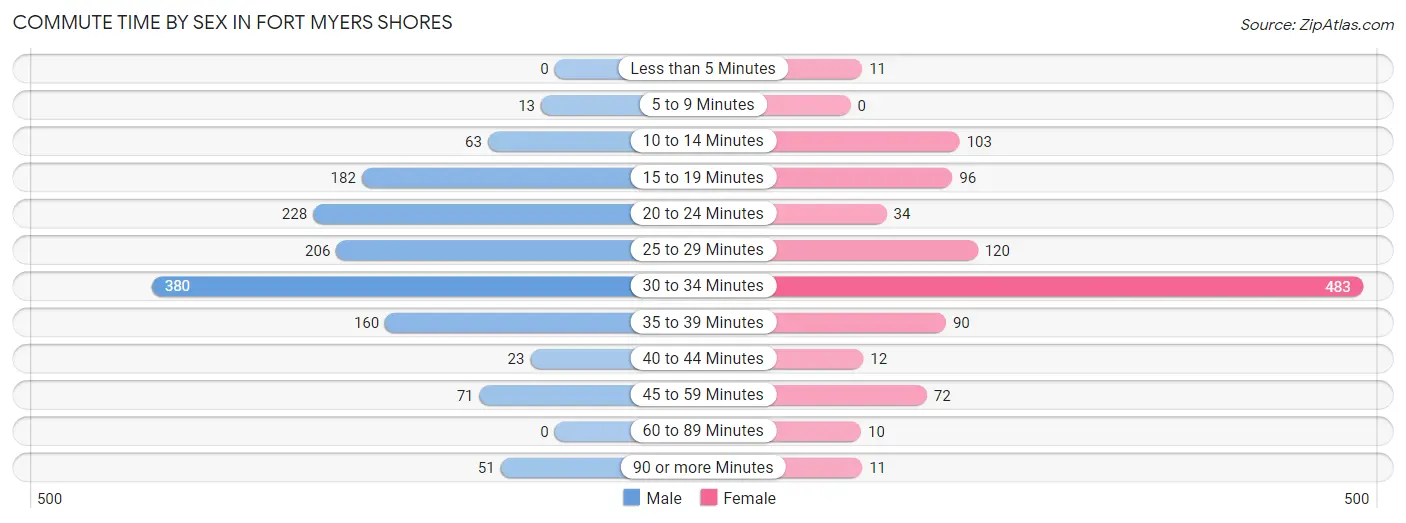
| Commute Time | Male | Female |
| Less than 5 Minutes | 0 (0.0%) | 11 (1.1%) |
| 5 to 9 Minutes | 13 (0.9%) | 0 (0.0%) |
| 10 to 14 Minutes | 63 (4.6%) | 103 (9.9%) |
| 15 to 19 Minutes | 182 (13.2%) | 96 (9.2%) |
| 20 to 24 Minutes | 228 (16.6%) | 34 (3.3%) |
| 25 to 29 Minutes | 206 (15.0%) | 120 (11.5%) |
| 30 to 34 Minutes | 380 (27.6%) | 483 (46.4%) |
| 35 to 39 Minutes | 160 (11.6%) | 90 (8.6%) |
| 40 to 44 Minutes | 23 (1.7%) | 12 (1.1%) |
| 45 to 59 Minutes | 71 (5.2%) | 72 (6.9%) |
| 60 to 89 Minutes | 0 (0.0%) | 10 (1.0%) |
| 90 or more Minutes | 51 (3.7%) | 11 (1.1%) |
Time of Departure to Work by Sex in Fort Myers Shores
The most frequent times of departure to work in Fort Myers Shores are 8:00 AM to 8:29 AM (369, 26.8%) for males and 8:00 AM to 8:29 AM (243, 23.3%) for females.
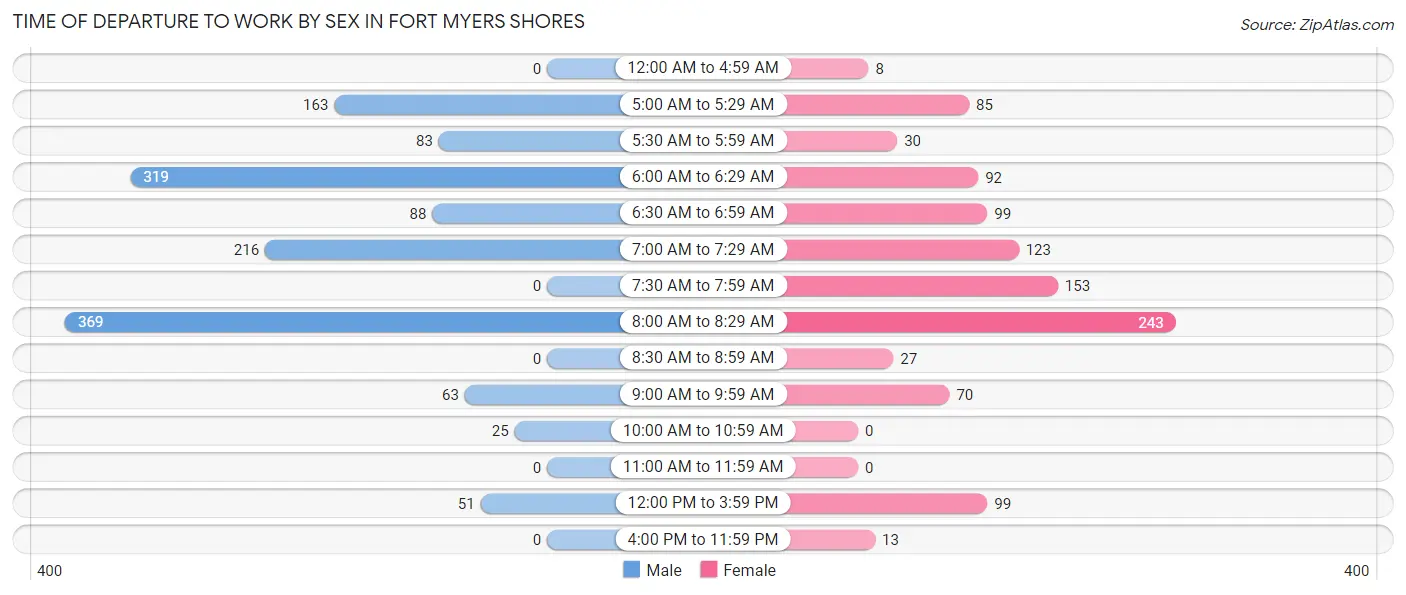
| Time of Departure | Male | Female |
| 12:00 AM to 4:59 AM | 0 (0.0%) | 8 (0.8%) |
| 5:00 AM to 5:29 AM | 163 (11.8%) | 85 (8.2%) |
| 5:30 AM to 5:59 AM | 83 (6.0%) | 30 (2.9%) |
| 6:00 AM to 6:29 AM | 319 (23.2%) | 92 (8.8%) |
| 6:30 AM to 6:59 AM | 88 (6.4%) | 99 (9.5%) |
| 7:00 AM to 7:29 AM | 216 (15.7%) | 123 (11.8%) |
| 7:30 AM to 7:59 AM | 0 (0.0%) | 153 (14.7%) |
| 8:00 AM to 8:29 AM | 369 (26.8%) | 243 (23.3%) |
| 8:30 AM to 8:59 AM | 0 (0.0%) | 27 (2.6%) |
| 9:00 AM to 9:59 AM | 63 (4.6%) | 70 (6.7%) |
| 10:00 AM to 10:59 AM | 25 (1.8%) | 0 (0.0%) |
| 11:00 AM to 11:59 AM | 0 (0.0%) | 0 (0.0%) |
| 12:00 PM to 3:59 PM | 51 (3.7%) | 99 (9.5%) |
| 4:00 PM to 11:59 PM | 0 (0.0%) | 13 (1.3%) |
| Total | 1,377 (100.0%) | 1,042 (100.0%) |
Housing Occupancy in Fort Myers Shores
Occupancy by Ownership in Fort Myers Shores
Of the total 2,305 dwellings in Fort Myers Shores, owner-occupied units account for 1,291 (56.0%), while renter-occupied units make up 1,014 (44.0%).
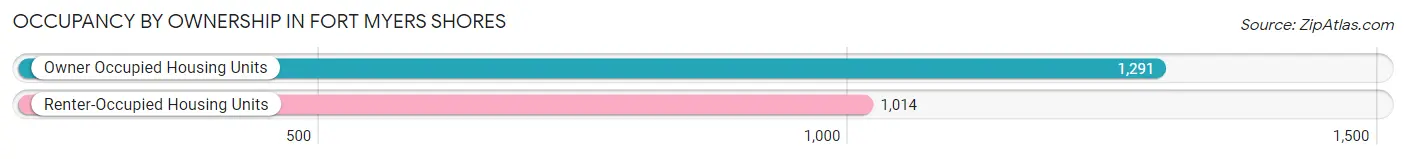
| Occupancy | # Housing Units | % Housing Units |
| Owner Occupied Housing Units | 1,291 | 56.0% |
| Renter-Occupied Housing Units | 1,014 | 44.0% |
| Total Occupied Housing Units | 2,305 | 100.0% |
Occupancy by Household Size in Fort Myers Shores
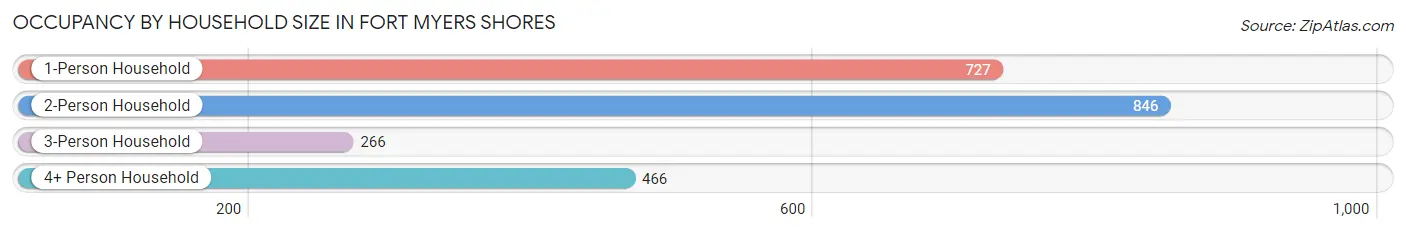
| Household Size | # Housing Units | % Housing Units |
| 1-Person Household | 727 | 31.5% |
| 2-Person Household | 846 | 36.7% |
| 3-Person Household | 266 | 11.5% |
| 4+ Person Household | 466 | 20.2% |
| Total Housing Units | 2,305 | 100.0% |
Occupancy by Ownership by Household Size in Fort Myers Shores
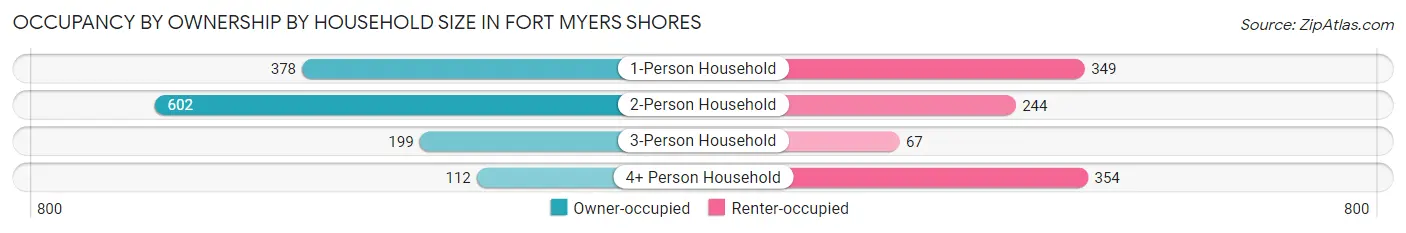
| Household Size | Owner-occupied | Renter-occupied |
| 1-Person Household | 378 (52.0%) | 349 (48.0%) |
| 2-Person Household | 602 (71.2%) | 244 (28.8%) |
| 3-Person Household | 199 (74.8%) | 67 (25.2%) |
| 4+ Person Household | 112 (24.0%) | 354 (76.0%) |
| Total Housing Units | 1,291 (56.0%) | 1,014 (44.0%) |
Occupancy by Educational Attainment in Fort Myers Shores
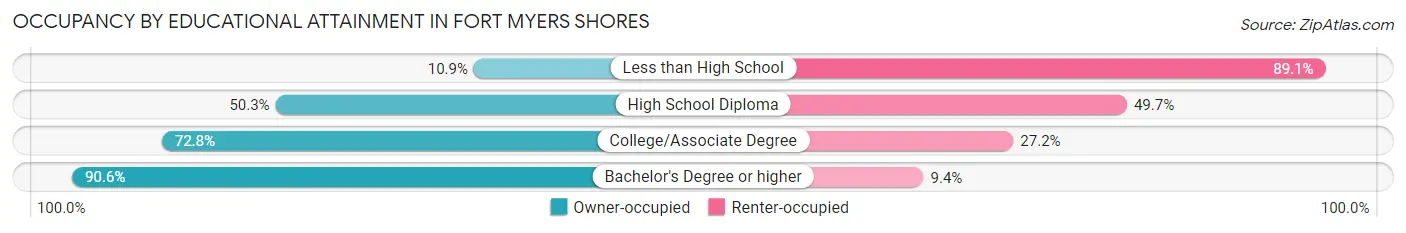
| Household Size | Owner-occupied | Renter-occupied |
| Less than High School | 50 (10.9%) | 407 (89.1%) |
| High School Diploma | 372 (50.3%) | 368 (49.7%) |
| College/Associate Degree | 551 (72.8%) | 206 (27.2%) |
| Bachelor's Degree or higher | 318 (90.6%) | 33 (9.4%) |
Occupancy by Age of Householder in Fort Myers Shores
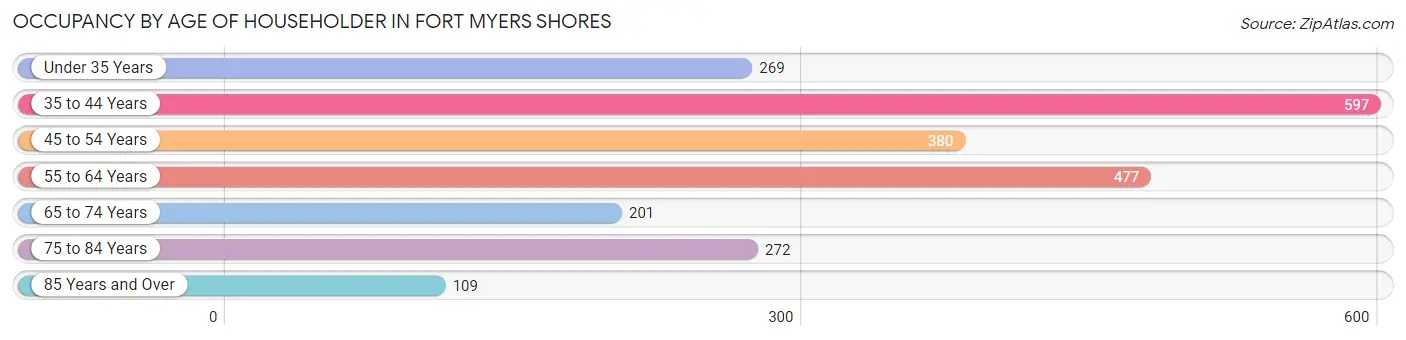
| Age Bracket | # Households | % Households |
| Under 35 Years | 269 | 11.7% |
| 35 to 44 Years | 597 | 25.9% |
| 45 to 54 Years | 380 | 16.5% |
| 55 to 64 Years | 477 | 20.7% |
| 65 to 74 Years | 201 | 8.7% |
| 75 to 84 Years | 272 | 11.8% |
| 85 Years and Over | 109 | 4.7% |
| Total | 2,305 | 100.0% |
Housing Finances in Fort Myers Shores
Median Income by Occupancy in Fort Myers Shores
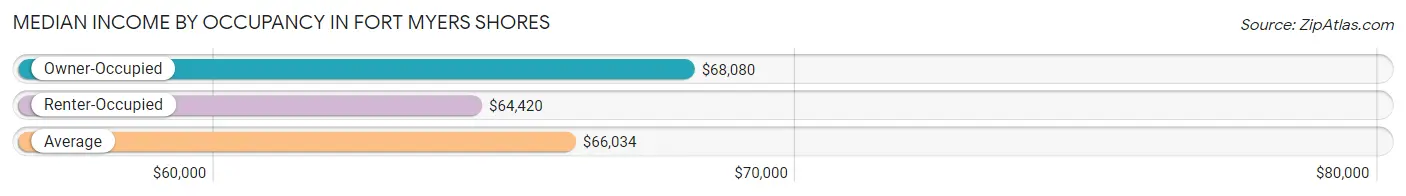
| Occupancy Type | # Households | Median Income |
| Owner-Occupied | 1,291 (56.0%) | $68,080 |
| Renter-Occupied | 1,014 (44.0%) | $64,420 |
| Average | 2,305 (100.0%) | $66,034 |
Occupancy by Householder Income Bracket in Fort Myers Shores
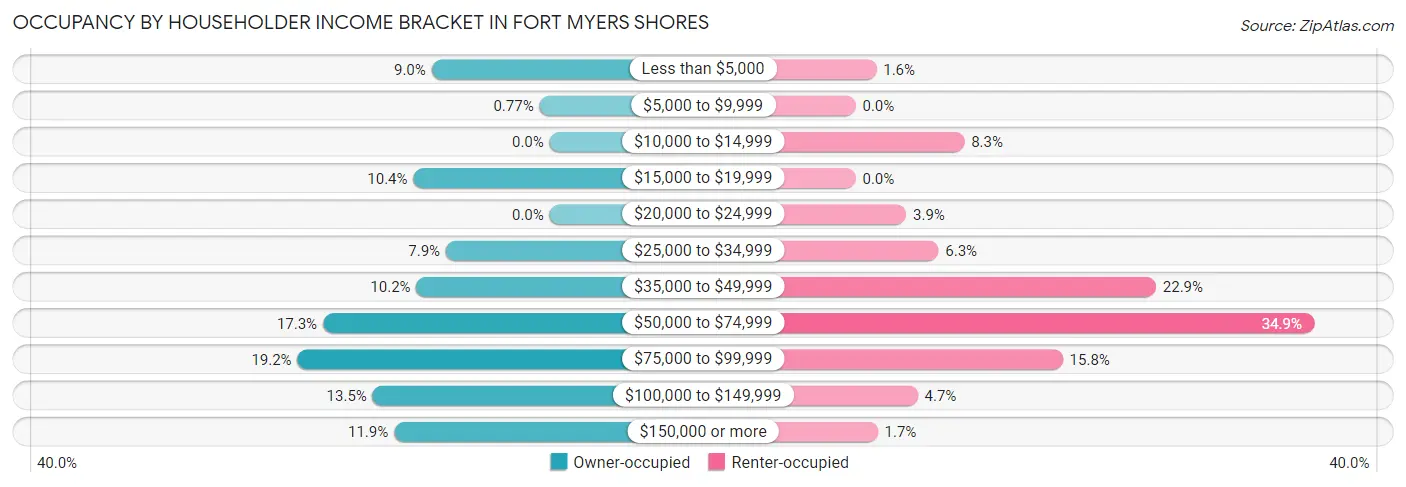
| Income Bracket | Owner-occupied | Renter-occupied |
| Less than $5,000 | 116 (9.0%) | 16 (1.6%) |
| $5,000 to $9,999 | 10 (0.8%) | 0 (0.0%) |
| $10,000 to $14,999 | 0 (0.0%) | 84 (8.3%) |
| $15,000 to $19,999 | 134 (10.4%) | 0 (0.0%) |
| $20,000 to $24,999 | 0 (0.0%) | 39 (3.8%) |
| $25,000 to $34,999 | 102 (7.9%) | 64 (6.3%) |
| $35,000 to $49,999 | 131 (10.2%) | 232 (22.9%) |
| $50,000 to $74,999 | 223 (17.3%) | 354 (34.9%) |
| $75,000 to $99,999 | 248 (19.2%) | 160 (15.8%) |
| $100,000 to $149,999 | 174 (13.5%) | 48 (4.7%) |
| $150,000 or more | 153 (11.8%) | 17 (1.7%) |
| Total | 1,291 (100.0%) | 1,014 (100.0%) |
Monthly Housing Cost Tiers in Fort Myers Shores
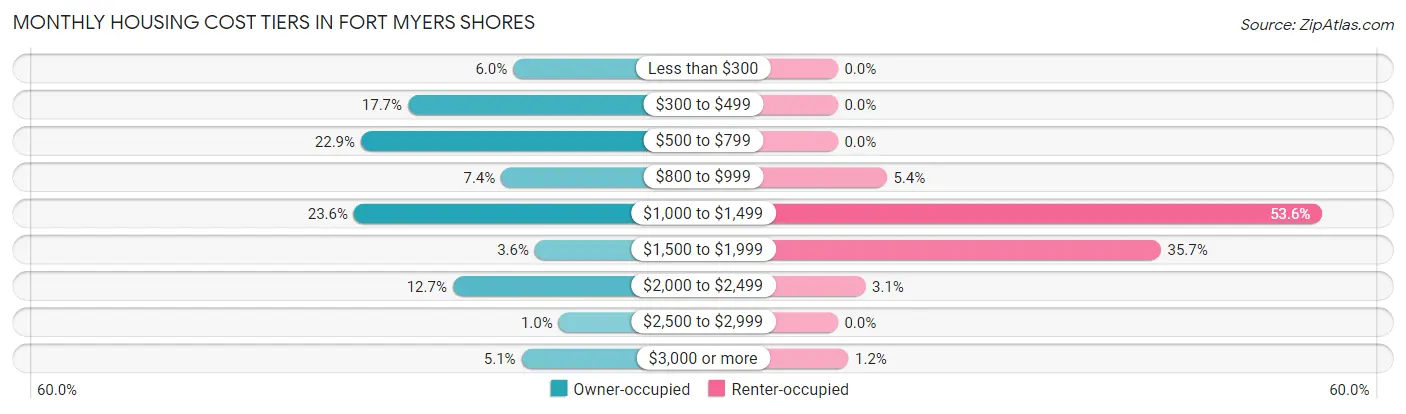
| Monthly Cost | Owner-occupied | Renter-occupied |
| Less than $300 | 78 (6.0%) | 0 (0.0%) |
| $300 to $499 | 228 (17.7%) | 0 (0.0%) |
| $500 to $799 | 295 (22.9%) | 0 (0.0%) |
| $800 to $999 | 95 (7.4%) | 55 (5.4%) |
| $1,000 to $1,499 | 305 (23.6%) | 543 (53.5%) |
| $1,500 to $1,999 | 47 (3.6%) | 362 (35.7%) |
| $2,000 to $2,499 | 164 (12.7%) | 31 (3.1%) |
| $2,500 to $2,999 | 13 (1.0%) | 0 (0.0%) |
| $3,000 or more | 66 (5.1%) | 12 (1.2%) |
| Total | 1,291 (100.0%) | 1,014 (100.0%) |
Physical Housing Characteristics in Fort Myers Shores
Housing Structures in Fort Myers Shores
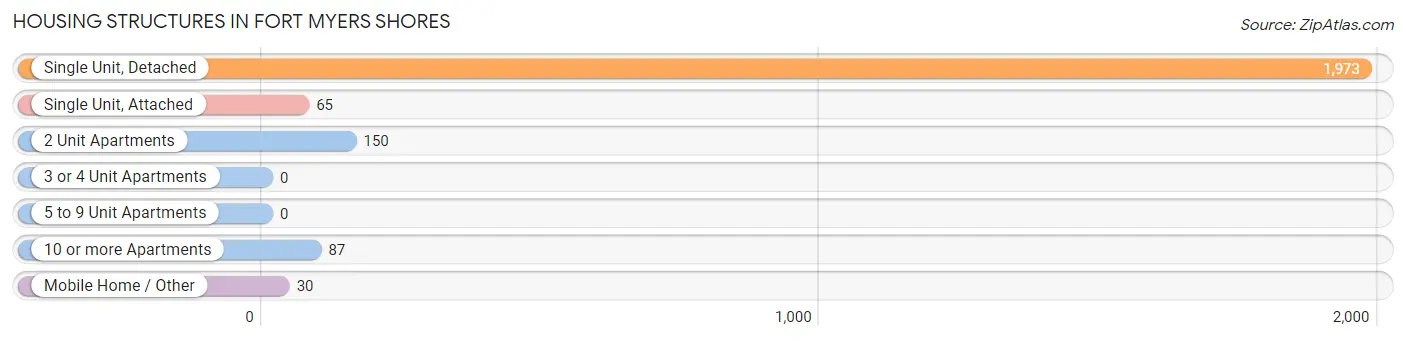
| Structure Type | # Housing Units | % Housing Units |
| Single Unit, Detached | 1,973 | 85.6% |
| Single Unit, Attached | 65 | 2.8% |
| 2 Unit Apartments | 150 | 6.5% |
| 3 or 4 Unit Apartments | 0 | 0.0% |
| 5 to 9 Unit Apartments | 0 | 0.0% |
| 10 or more Apartments | 87 | 3.8% |
| Mobile Home / Other | 30 | 1.3% |
| Total | 2,305 | 100.0% |
Housing Structures by Occupancy in Fort Myers Shores
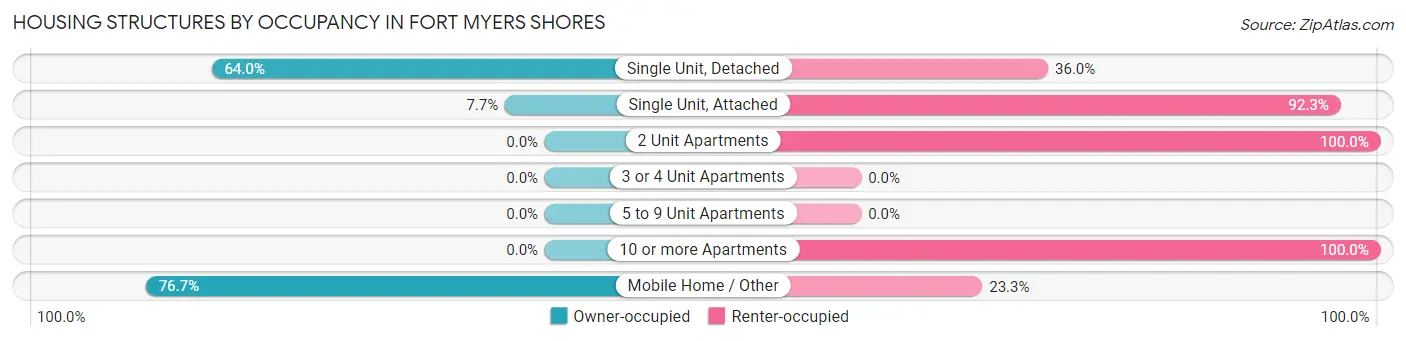
| Structure Type | Owner-occupied | Renter-occupied |
| Single Unit, Detached | 1,263 (64.0%) | 710 (36.0%) |
| Single Unit, Attached | 5 (7.7%) | 60 (92.3%) |
| 2 Unit Apartments | 0 (0.0%) | 150 (100.0%) |
| 3 or 4 Unit Apartments | 0 (0.0%) | 0 (0.0%) |
| 5 to 9 Unit Apartments | 0 (0.0%) | 0 (0.0%) |
| 10 or more Apartments | 0 (0.0%) | 87 (100.0%) |
| Mobile Home / Other | 23 (76.7%) | 7 (23.3%) |
| Total | 1,291 (56.0%) | 1,014 (44.0%) |
Housing Structures by Number of Rooms in Fort Myers Shores
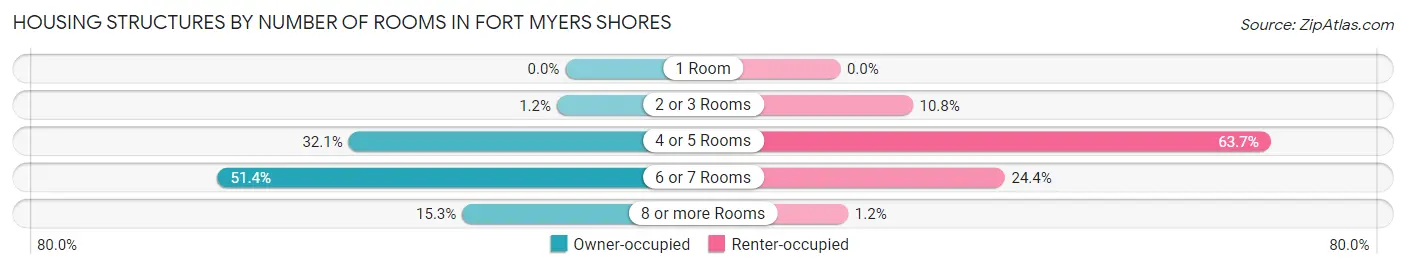
| Number of Rooms | Owner-occupied | Renter-occupied |
| 1 Room | 0 (0.0%) | 0 (0.0%) |
| 2 or 3 Rooms | 16 (1.2%) | 109 (10.7%) |
| 4 or 5 Rooms | 414 (32.1%) | 646 (63.7%) |
| 6 or 7 Rooms | 664 (51.4%) | 247 (24.4%) |
| 8 or more Rooms | 197 (15.3%) | 12 (1.2%) |
| Total | 1,291 (100.0%) | 1,014 (100.0%) |
Housing Structure by Heating Type in Fort Myers Shores
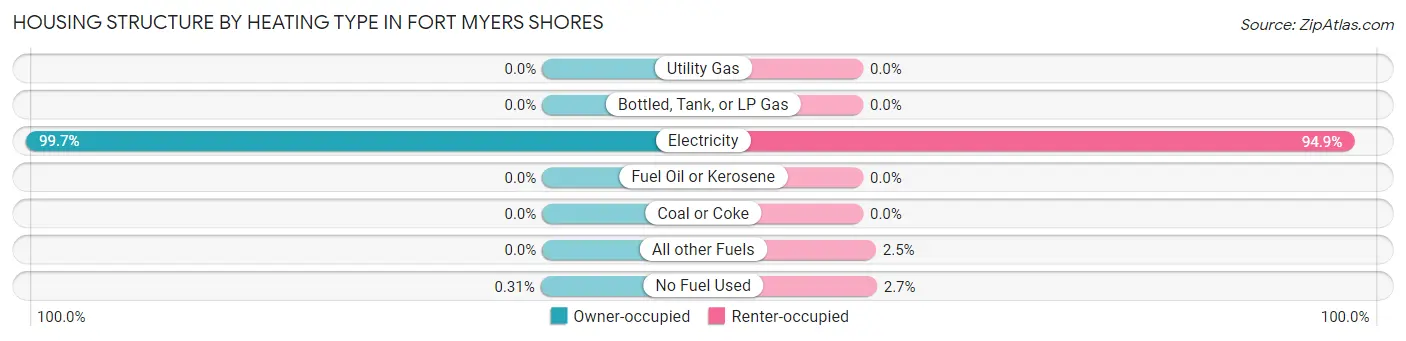
| Heating Type | Owner-occupied | Renter-occupied |
| Utility Gas | 0 (0.0%) | 0 (0.0%) |
| Bottled, Tank, or LP Gas | 0 (0.0%) | 0 (0.0%) |
| Electricity | 1,287 (99.7%) | 962 (94.9%) |
| Fuel Oil or Kerosene | 0 (0.0%) | 0 (0.0%) |
| Coal or Coke | 0 (0.0%) | 0 (0.0%) |
| All other Fuels | 0 (0.0%) | 25 (2.5%) |
| No Fuel Used | 4 (0.3%) | 27 (2.7%) |
| Total | 1,291 (100.0%) | 1,014 (100.0%) |
Household Vehicle Usage in Fort Myers Shores
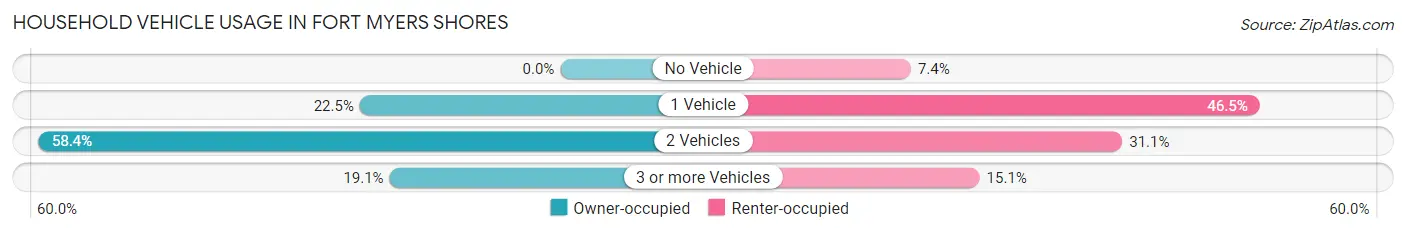
| Vehicles per Household | Owner-occupied | Renter-occupied |
| No Vehicle | 0 (0.0%) | 75 (7.4%) |
| 1 Vehicle | 290 (22.5%) | 471 (46.5%) |
| 2 Vehicles | 754 (58.4%) | 315 (31.1%) |
| 3 or more Vehicles | 247 (19.1%) | 153 (15.1%) |
| Total | 1,291 (100.0%) | 1,014 (100.0%) |
Real Estate & Mortgages in Fort Myers Shores
Real Estate and Mortgage Overview in Fort Myers Shores
| Characteristic | Without Mortgage | With Mortgage |
| Housing Units | 493 | 798 |
| Median Property Value | $215,300 | $200,600 |
| Median Household Income | $46,406 | $70 |
| Monthly Housing Costs | $422 | $66 |
| Real Estate Taxes | - | - |
Property Value by Mortgage Status in Fort Myers Shores
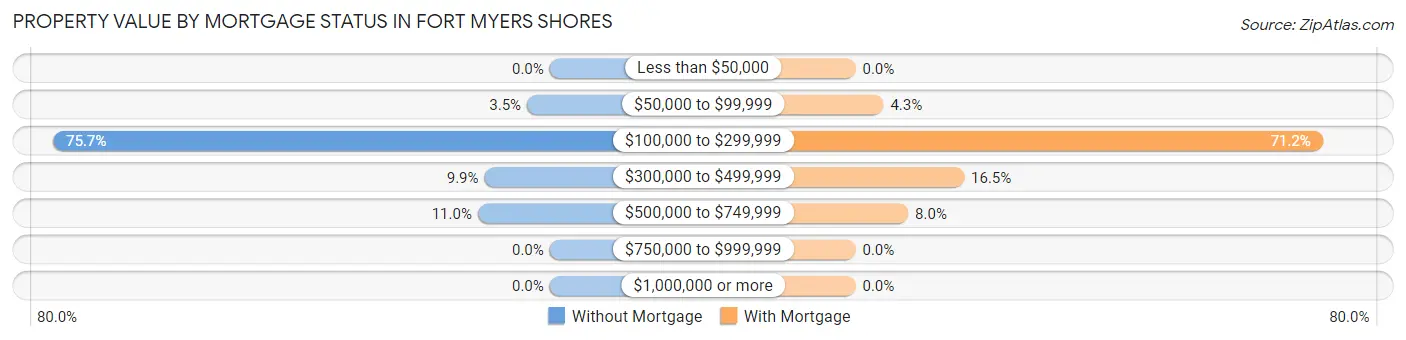
| Property Value | Without Mortgage | With Mortgage |
| Less than $50,000 | 0 (0.0%) | 0 (0.0%) |
| $50,000 to $99,999 | 17 (3.5%) | 34 (4.3%) |
| $100,000 to $299,999 | 373 (75.7%) | 568 (71.2%) |
| $300,000 to $499,999 | 49 (9.9%) | 132 (16.5%) |
| $500,000 to $749,999 | 54 (11.0%) | 64 (8.0%) |
| $750,000 to $999,999 | 0 (0.0%) | 0 (0.0%) |
| $1,000,000 or more | 0 (0.0%) | 0 (0.0%) |
| Total | 493 (100.0%) | 798 (100.0%) |
Household Income by Mortgage Status in Fort Myers Shores
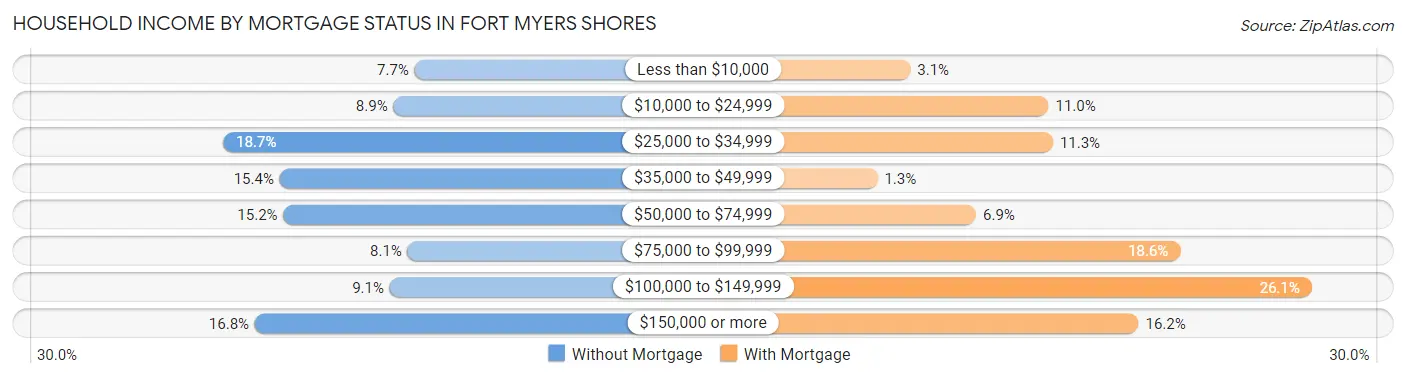
| Household Income | Without Mortgage | With Mortgage |
| Less than $10,000 | 38 (7.7%) | 25 (3.1%) |
| $10,000 to $24,999 | 44 (8.9%) | 88 (11.0%) |
| $25,000 to $34,999 | 92 (18.7%) | 90 (11.3%) |
| $35,000 to $49,999 | 76 (15.4%) | 10 (1.3%) |
| $50,000 to $74,999 | 75 (15.2%) | 55 (6.9%) |
| $75,000 to $99,999 | 40 (8.1%) | 148 (18.5%) |
| $100,000 to $149,999 | 45 (9.1%) | 208 (26.1%) |
| $150,000 or more | 83 (16.8%) | 129 (16.2%) |
| Total | 493 (100.0%) | 798 (100.0%) |
Property Value to Household Income Ratio in Fort Myers Shores
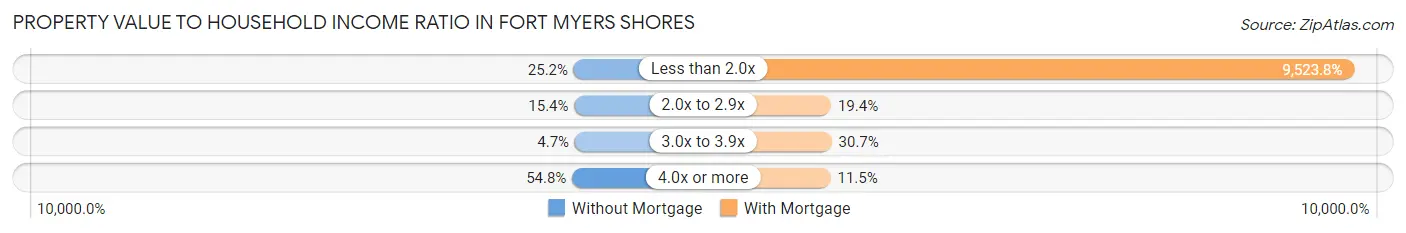
| Value-to-Income Ratio | Without Mortgage | With Mortgage |
| Less than 2.0x | 124 (25.2%) | 76,000 (9,523.8%) |
| 2.0x to 2.9x | 76 (15.4%) | 155 (19.4%) |
| 3.0x to 3.9x | 23 (4.7%) | 245 (30.7%) |
| 4.0x or more | 270 (54.8%) | 92 (11.5%) |
| Total | 493 (100.0%) | 798 (100.0%) |
Real Estate Taxes by Mortgage Status in Fort Myers Shores
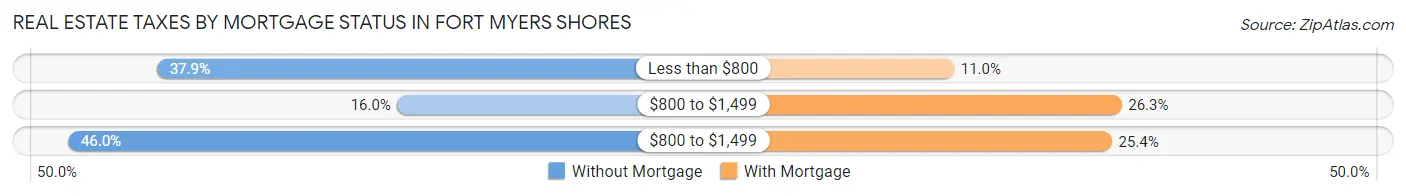
| Property Taxes | Without Mortgage | With Mortgage |
| Less than $800 | 187 (37.9%) | 88 (11.0%) |
| $800 to $1,499 | 79 (16.0%) | 210 (26.3%) |
| $800 to $1,499 | 227 (46.0%) | 203 (25.4%) |
| Total | 493 (100.0%) | 798 (100.0%) |
Health & Disability in Fort Myers Shores
Health Insurance Coverage by Age in Fort Myers Shores
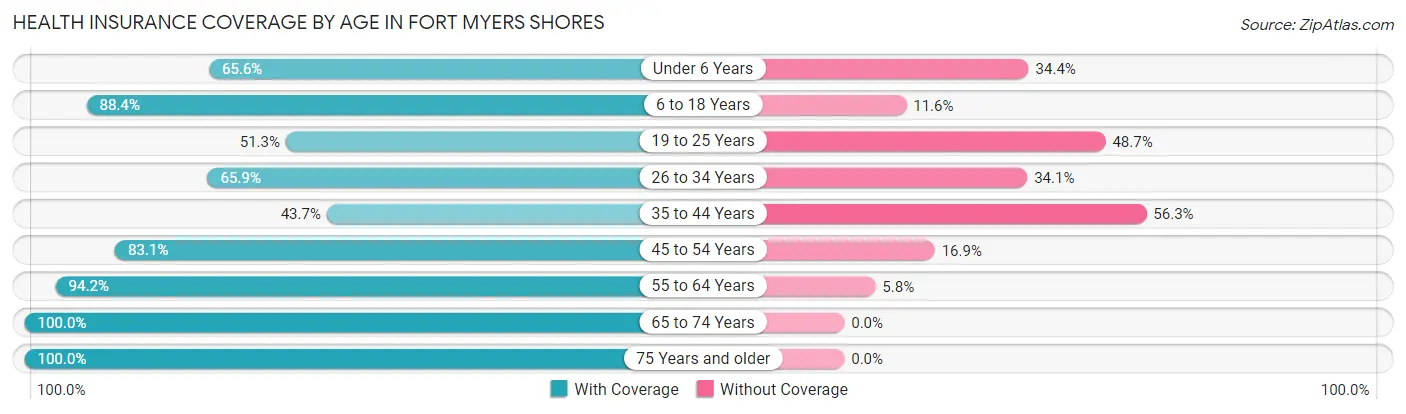
| Age Bracket | With Coverage | Without Coverage |
| Under 6 Years | 126 (65.6%) | 66 (34.4%) |
| 6 to 18 Years | 918 (88.4%) | 120 (11.6%) |
| 19 to 25 Years | 317 (51.3%) | 301 (48.7%) |
| 26 to 34 Years | 338 (65.9%) | 175 (34.1%) |
| 35 to 44 Years | 451 (43.7%) | 582 (56.3%) |
| 45 to 54 Years | 587 (83.1%) | 119 (16.9%) |
| 55 to 64 Years | 779 (94.2%) | 48 (5.8%) |
| 65 to 74 Years | 479 (100.0%) | 0 (0.0%) |
| 75 Years and older | 584 (100.0%) | 0 (0.0%) |
| Total | 4,579 (76.4%) | 1,411 (23.6%) |
Health Insurance Coverage by Citizenship Status in Fort Myers Shores
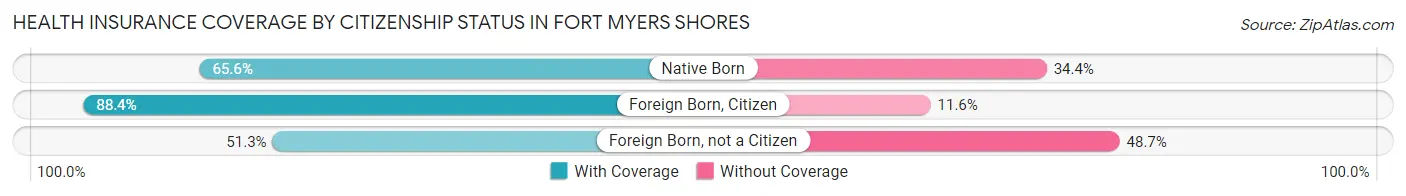
| Citizenship Status | With Coverage | Without Coverage |
| Native Born | 126 (65.6%) | 66 (34.4%) |
| Foreign Born, Citizen | 918 (88.4%) | 120 (11.6%) |
| Foreign Born, not a Citizen | 317 (51.3%) | 301 (48.7%) |
Health Insurance Coverage by Household Income in Fort Myers Shores
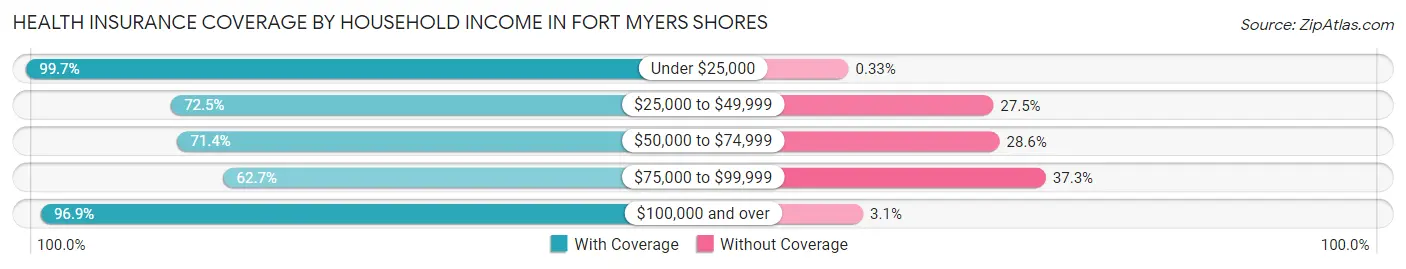
| Household Income | With Coverage | Without Coverage |
| Under $25,000 | 599 (99.7%) | 2 (0.3%) |
| $25,000 to $49,999 | 1,072 (72.5%) | 406 (27.5%) |
| $50,000 to $74,999 | 972 (71.4%) | 390 (28.6%) |
| $75,000 to $99,999 | 980 (62.7%) | 583 (37.3%) |
| $100,000 and over | 946 (96.9%) | 30 (3.1%) |
Public vs Private Health Insurance Coverage by Age in Fort Myers Shores
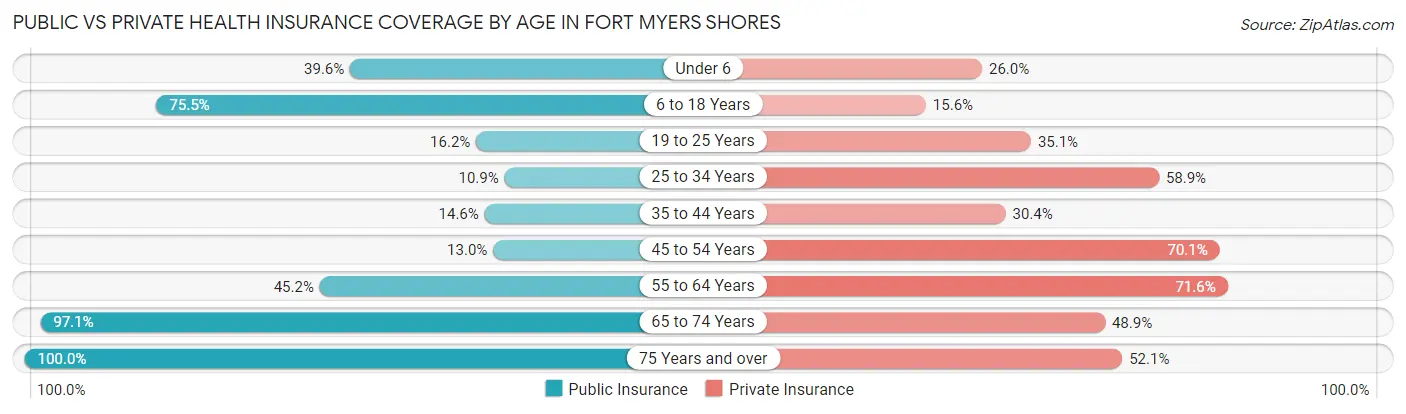
| Age Bracket | Public Insurance | Private Insurance |
| Under 6 | 76 (39.6%) | 50 (26.0%) |
| 6 to 18 Years | 784 (75.5%) | 162 (15.6%) |
| 19 to 25 Years | 100 (16.2%) | 217 (35.1%) |
| 25 to 34 Years | 56 (10.9%) | 302 (58.9%) |
| 35 to 44 Years | 151 (14.6%) | 314 (30.4%) |
| 45 to 54 Years | 92 (13.0%) | 495 (70.1%) |
| 55 to 64 Years | 374 (45.2%) | 592 (71.6%) |
| 65 to 74 Years | 465 (97.1%) | 234 (48.8%) |
| 75 Years and over | 584 (100.0%) | 304 (52.0%) |
| Total | 2,682 (44.8%) | 2,670 (44.6%) |
Disability Status by Sex by Age in Fort Myers Shores
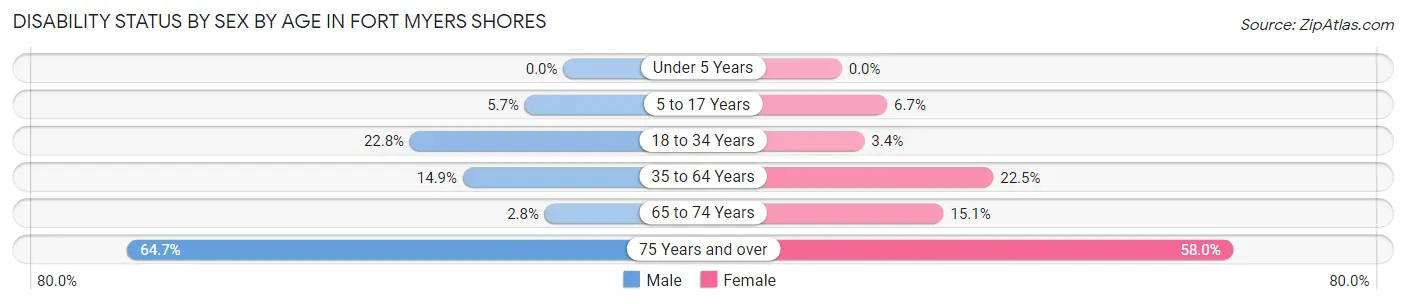
| Age Bracket | Male | Female |
| Under 5 Years | 0 (0.0%) | 0 (0.0%) |
| 5 to 17 Years | 30 (5.7%) | 36 (6.7%) |
| 18 to 34 Years | 126 (22.8%) | 22 (3.4%) |
| 35 to 64 Years | 231 (14.9%) | 229 (22.5%) |
| 65 to 74 Years | 7 (2.8%) | 34 (15.1%) |
| 75 Years and over | 156 (64.7%) | 199 (58.0%) |
Disability Class by Sex by Age in Fort Myers Shores
Disability Class: Hearing Difficulty
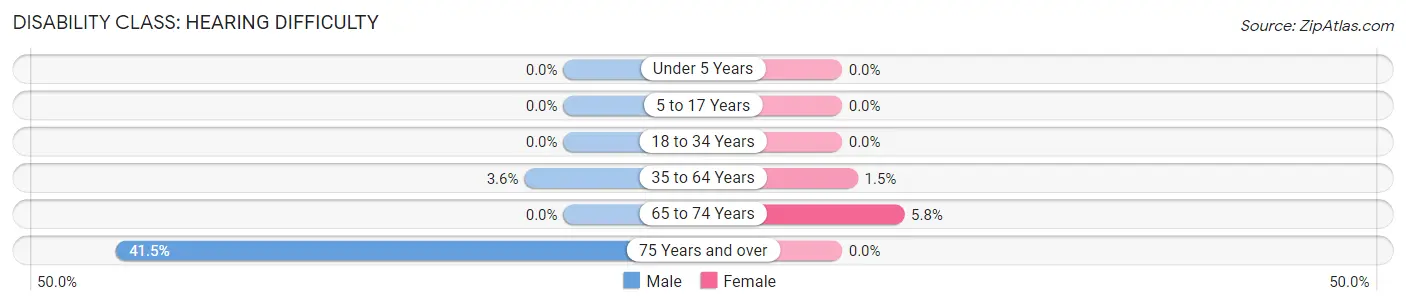
| Age Bracket | Male | Female |
| Under 5 Years | 0 (0.0%) | 0 (0.0%) |
| 5 to 17 Years | 0 (0.0%) | 0 (0.0%) |
| 18 to 34 Years | 0 (0.0%) | 0 (0.0%) |
| 35 to 64 Years | 56 (3.6%) | 15 (1.5%) |
| 65 to 74 Years | 0 (0.0%) | 13 (5.8%) |
| 75 Years and over | 100 (41.5%) | 0 (0.0%) |
Disability Class: Vision Difficulty
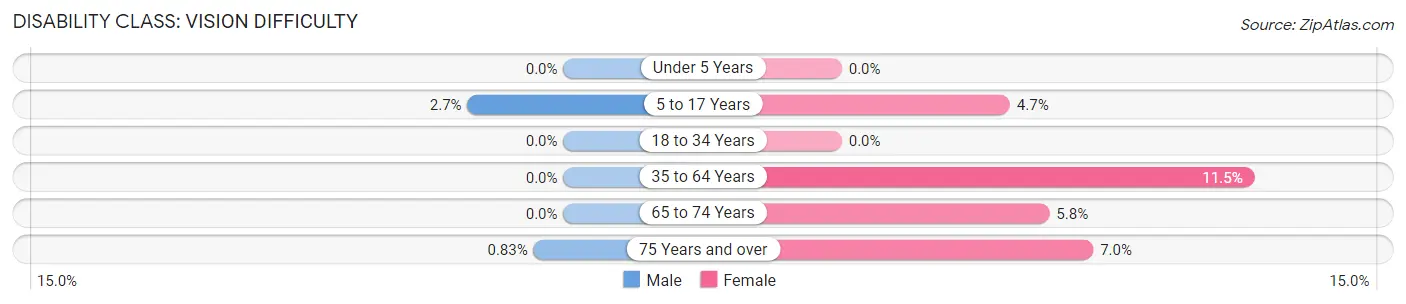
| Age Bracket | Male | Female |
| Under 5 Years | 0 (0.0%) | 0 (0.0%) |
| 5 to 17 Years | 14 (2.7%) | 25 (4.7%) |
| 18 to 34 Years | 0 (0.0%) | 0 (0.0%) |
| 35 to 64 Years | 0 (0.0%) | 117 (11.5%) |
| 65 to 74 Years | 0 (0.0%) | 13 (5.8%) |
| 75 Years and over | 2 (0.8%) | 24 (7.0%) |
Disability Class: Cognitive Difficulty
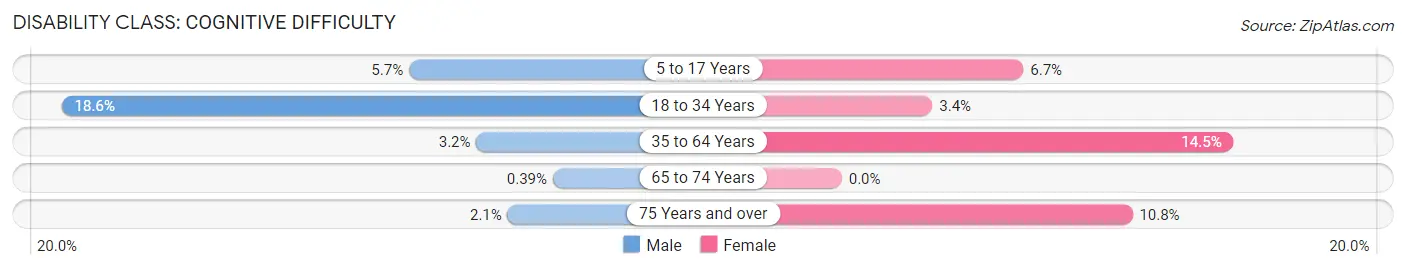
| Age Bracket | Male | Female |
| 5 to 17 Years | 30 (5.7%) | 36 (6.7%) |
| 18 to 34 Years | 103 (18.6%) | 22 (3.4%) |
| 35 to 64 Years | 50 (3.2%) | 148 (14.5%) |
| 65 to 74 Years | 1 (0.4%) | 0 (0.0%) |
| 75 Years and over | 5 (2.1%) | 37 (10.8%) |
Disability Class: Ambulatory Difficulty
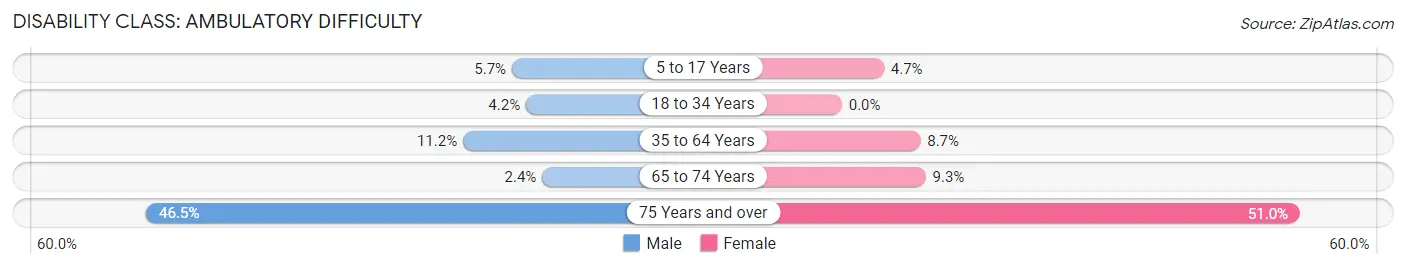
| Age Bracket | Male | Female |
| 5 to 17 Years | 30 (5.7%) | 25 (4.7%) |
| 18 to 34 Years | 23 (4.2%) | 0 (0.0%) |
| 35 to 64 Years | 173 (11.2%) | 89 (8.7%) |
| 65 to 74 Years | 6 (2.4%) | 21 (9.3%) |
| 75 Years and over | 112 (46.5%) | 175 (51.0%) |
Disability Class: Self-Care Difficulty
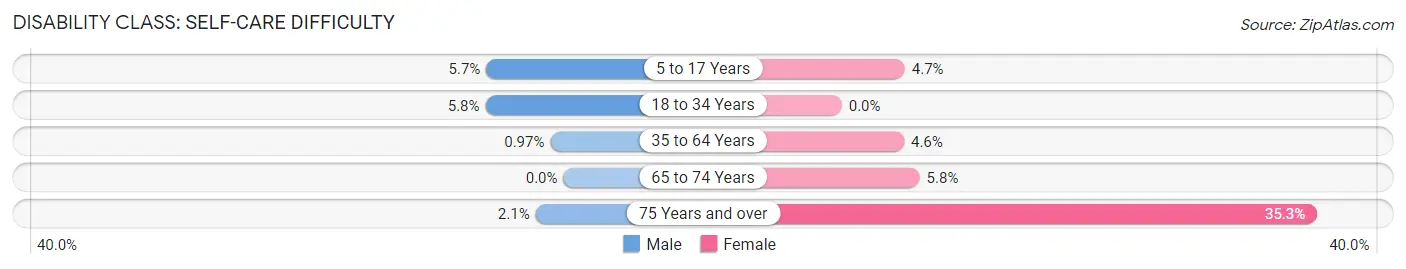
| Age Bracket | Male | Female |
| 5 to 17 Years | 30 (5.7%) | 25 (4.7%) |
| 18 to 34 Years | 32 (5.8%) | 0 (0.0%) |
| 35 to 64 Years | 15 (1.0%) | 47 (4.6%) |
| 65 to 74 Years | 0 (0.0%) | 13 (5.8%) |
| 75 Years and over | 5 (2.1%) | 121 (35.3%) |
Technology Access in Fort Myers Shores
Computing Device Access in Fort Myers Shores
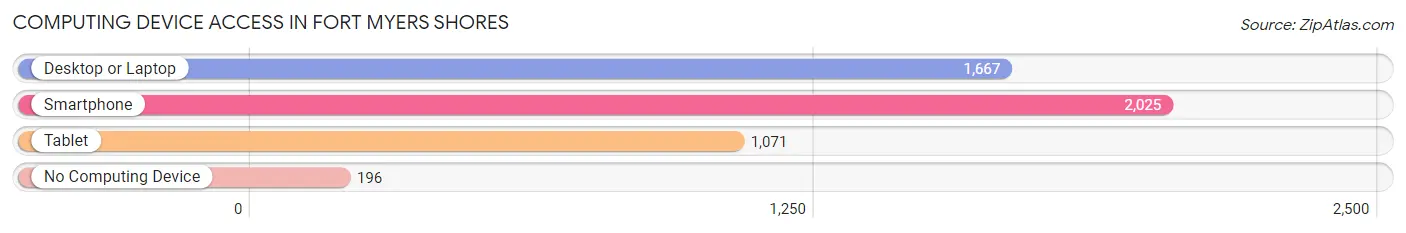
| Device Type | # Households | % Households |
| Desktop or Laptop | 1,667 | 72.3% |
| Smartphone | 2,025 | 87.8% |
| Tablet | 1,071 | 46.5% |
| No Computing Device | 196 | 8.5% |
| Total | 2,305 | 100.0% |
Internet Access in Fort Myers Shores
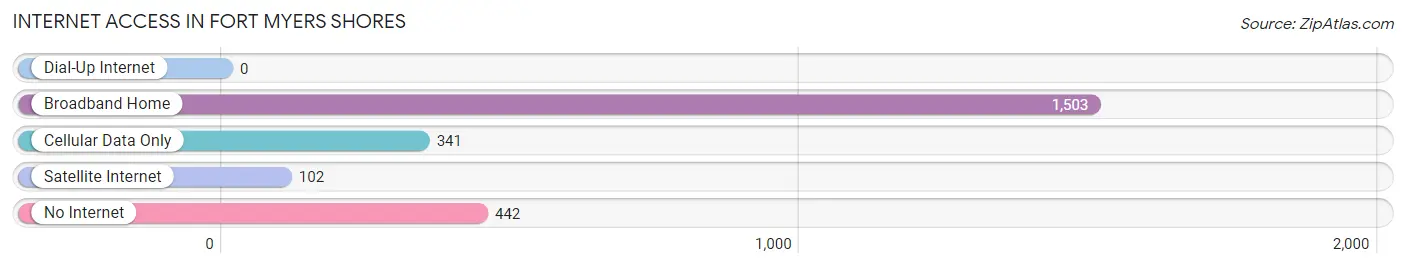
| Internet Type | # Households | % Households |
| Dial-Up Internet | 0 | 0.0% |
| Broadband Home | 1,503 | 65.2% |
| Cellular Data Only | 341 | 14.8% |
| Satellite Internet | 102 | 4.4% |
| No Internet | 442 | 19.2% |
| Total | 2,305 | 100.0% |
Fort Myers Shores Summary
History
The area now known as Fort Myers Shores, Florida was originally inhabited by the Calusa Indians. The Calusa were a powerful Native American tribe that lived in the area for centuries before the arrival of Europeans. The Calusa were known for their advanced engineering and trading skills, and their influence can still be seen in the area today.
In 1513, Spanish explorer Ponce de Leon arrived in the area and named it “La Florida”. He was the first European to explore the area and he claimed it for Spain. The Spanish established a mission in the area in 1566, but it was abandoned in 1569 due to a lack of resources.
In the late 1700s, the area was settled by American settlers. The settlers established a trading post and a small settlement. The settlement was named Fort Myers in honor of Colonel Abraham Myers, who was a veteran of the War of 1812.
In the late 1800s, the area was developed as a resort destination. The area was known for its beautiful beaches and its warm climate. The area was also known for its fishing and hunting opportunities.
In the early 1900s, the area was developed further as a residential area. The area was known for its citrus groves and its fishing industry. The area was also known for its beautiful beaches and its warm climate.
In the late 1900s, the area was developed further as a residential area. The area was known for its beautiful beaches and its warm climate. The area was also known for its fishing and hunting opportunities.
Geography
Fort Myers Shores is located in Lee County, Florida. It is situated on the Gulf of Mexico, just south of Fort Myers. The area is bordered by the Caloosahatchee River to the east and the San Carlos Bay to the west. The area is approximately 10 miles long and 5 miles wide.
The area is mostly flat and is composed of sandy soil. The area is known for its beautiful beaches and its warm climate. The area is also known for its fishing and hunting opportunities.
Economy
The economy of Fort Myers Shores is largely based on tourism. The area is known for its beautiful beaches and its warm climate. The area is also known for its fishing and hunting opportunities.
The area is also home to a number of businesses, including restaurants, hotels, and retail stores. The area is also home to a number of marinas and boat docks.
Demographics
As of the 2010 census, the population of Fort Myers Shores was 8,845. The population is mostly white (83.3%) and Hispanic (14.2%). The median household income is $45,845 and the median age is 44.
Conclusion
Fort Myers Shores, Florida is a beautiful area with a rich history and a vibrant economy. The area is known for its beautiful beaches and its warm climate. The area is also known for its fishing and hunting opportunities. The area is home to a diverse population and a variety of businesses.
Common Questions
What is Per Capita Income in Fort Myers Shores?
Per Capita income in Fort Myers Shores is $32,457.
What is the Median Family Income in Fort Myers Shores?
Median Family Income in Fort Myers Shores is $63,750.
What is the Median Household income in Fort Myers Shores?
Median Household Income in Fort Myers Shores is $66,034.
What is Income or Wage Gap in Fort Myers Shores?
Income or Wage Gap in Fort Myers Shores is 37.7%.
Women in Fort Myers Shores earn 62.3 cents for every dollar earned by a man.
What is Inequality or Gini Index in Fort Myers Shores?
Inequality or Gini Index in Fort Myers Shores is 0.45.
What is the Total Population of Fort Myers Shores?
Total Population of Fort Myers Shores is 5,990.
What is the Total Male Population of Fort Myers Shores?
Total Male Population of Fort Myers Shores is 3,165.
What is the Total Female Population of Fort Myers Shores?
Total Female Population of Fort Myers Shores is 2,825.
What is the Ratio of Males per 100 Females in Fort Myers Shores?
There are 112.04 Males per 100 Females in Fort Myers Shores.
What is the Ratio of Females per 100 Males in Fort Myers Shores?
There are 89.26 Females per 100 Males in Fort Myers Shores.
What is the Median Population Age in Fort Myers Shores?
Median Population Age in Fort Myers Shores is 40.1 Years.
What is the Average Family Size in Fort Myers Shores
Average Family Size in Fort Myers Shores is 3.3 People.
What is the Average Household Size in Fort Myers Shores
Average Household Size in Fort Myers Shores is 2.6 People.
How Large is the Labor Force in Fort Myers Shores?
There are 3,023 People in the Labor Forcein in Fort Myers Shores.
What is the Percentage of People in the Labor Force in Fort Myers Shores?
59.7% of People are in the Labor Force in Fort Myers Shores.
What is the Unemployment Rate in Fort Myers Shores?
Unemployment Rate in Fort Myers Shores is 7.9%.