Ellenton, FL Map & Demographics
Ellenton Map
Ellenton Overview
$27,572
PER CAPITA INCOME
$64,481
AVG FAMILY INCOME
$66,005
AVG HOUSEHOLD INCOME
40.9%
WAGE / INCOME GAP [ % ]
59.1¢/ $1
WAGE / INCOME GAP [ $ ]
0.35
INEQUALITY / GINI INDEX
5,391
TOTAL POPULATION
2,291
MALE POPULATION
3,100
FEMALE POPULATION
73.90
MALES / 100 FEMALES
135.31
FEMALES / 100 MALES
45.9
MEDIAN AGE
3.1
AVG FAMILY SIZE
2.9
AVG HOUSEHOLD SIZE
2,283
LABOR FORCE [ PEOPLE ]
51.6%
PERCENT IN LABOR FORCE
6.9%
UNEMPLOYMENT RATE
Ellenton Zip Codes
Ellenton Area Codes
Income in Ellenton
Income Overview in Ellenton
Per Capita Income in Ellenton is $27,572, while median incomes of families and households are $64,481 and $66,005 respectively.
| Characteristic | Number | Measure |
| Per Capita Income | 5,391 | $27,572 |
| Median Family Income | 1,395 | $64,481 |
| Mean Family Income | 1,395 | $81,683 |
| Median Household Income | 1,881 | $66,005 |
| Mean Household Income | 1,881 | $76,676 |
| Income Deficit | 1,395 | $0 |
| Wage / Income Gap (%) | 5,391 | 40.87% |
| Wage / Income Gap ($) | 5,391 | 59.13¢ per $1 |
| Gini / Inequality Index | 5,391 | 0.35 |
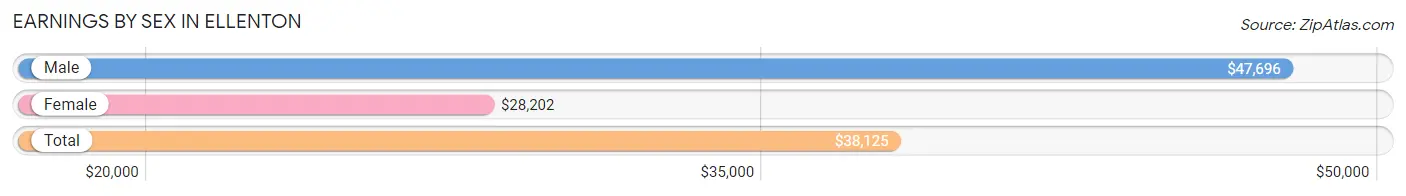
Earnings by Sex in Ellenton
Average Earnings in Ellenton are $38,125, $47,696 for men and $28,202 for women, a difference of 40.9%.
| Sex | Number | Average Earnings |
| Male | 1,009 (45.8%) | $47,696 |
| Female | 1,195 (54.2%) | $28,202 |
| Total | 2,204 (100.0%) | $38,125 |
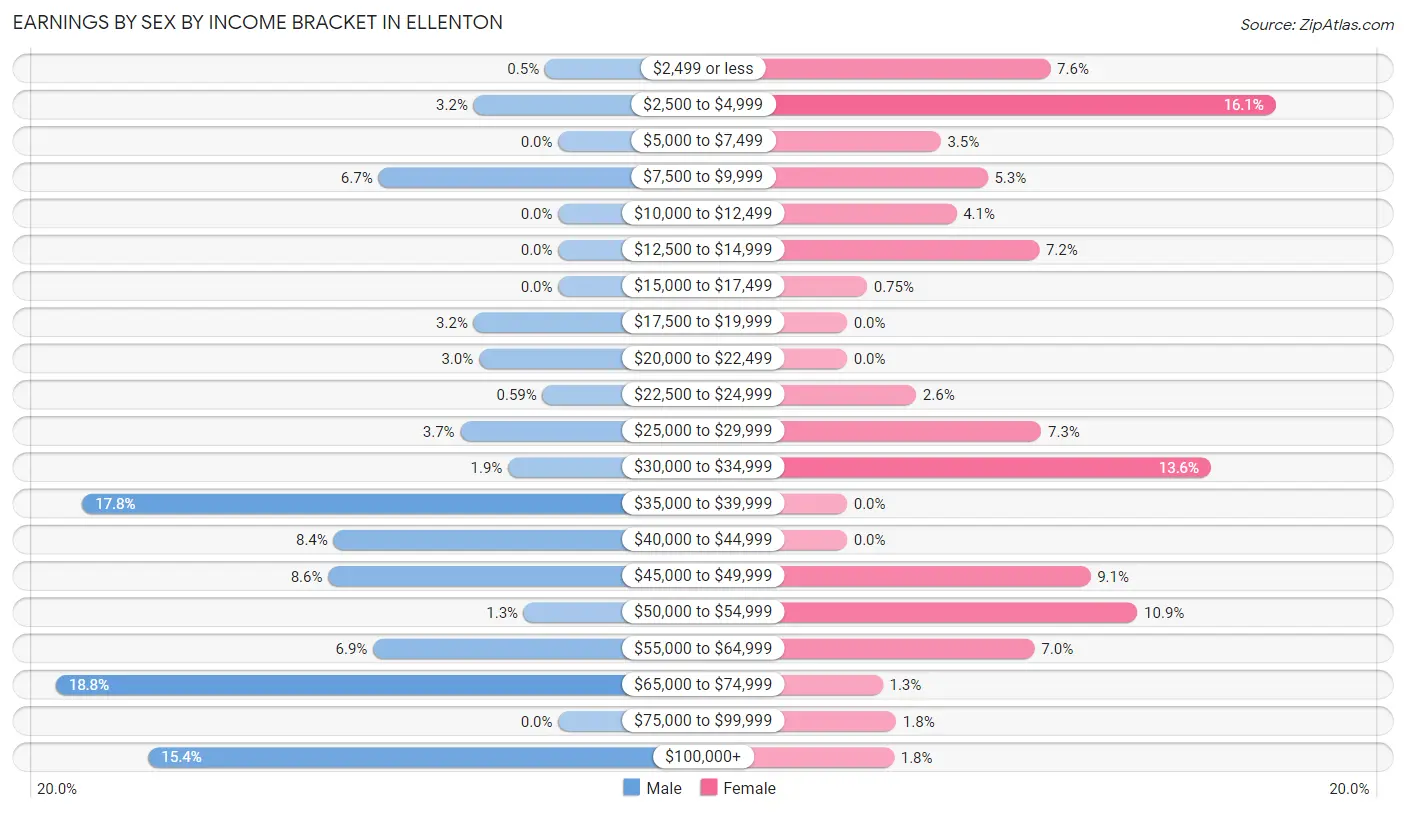
Earnings by Sex by Income Bracket in Ellenton
The most common earnings brackets in Ellenton are $65,000 to $74,999 for men (190 | 18.8%) and $2,500 to $4,999 for women (192 | 16.1%).
| Income | Male | Female |
| $2,499 or less | 5 (0.5%) | 91 (7.6%) |
| $2,500 to $4,999 | 32 (3.2%) | 192 (16.1%) |
| $5,000 to $7,499 | 0 (0.0%) | 42 (3.5%) |
| $7,500 to $9,999 | 68 (6.7%) | 63 (5.3%) |
| $10,000 to $12,499 | 0 (0.0%) | 49 (4.1%) |
| $12,500 to $14,999 | 0 (0.0%) | 86 (7.2%) |
| $15,000 to $17,499 | 0 (0.0%) | 9 (0.7%) |
| $17,500 to $19,999 | 32 (3.2%) | 0 (0.0%) |
| $20,000 to $22,499 | 30 (3.0%) | 0 (0.0%) |
| $22,500 to $24,999 | 6 (0.6%) | 31 (2.6%) |
| $25,000 to $29,999 | 37 (3.7%) | 87 (7.3%) |
| $30,000 to $34,999 | 19 (1.9%) | 163 (13.6%) |
| $35,000 to $39,999 | 180 (17.8%) | 0 (0.0%) |
| $40,000 to $44,999 | 85 (8.4%) | 0 (0.0%) |
| $45,000 to $49,999 | 87 (8.6%) | 109 (9.1%) |
| $50,000 to $54,999 | 13 (1.3%) | 130 (10.9%) |
| $55,000 to $64,999 | 70 (6.9%) | 84 (7.0%) |
| $65,000 to $74,999 | 190 (18.8%) | 16 (1.3%) |
| $75,000 to $99,999 | 0 (0.0%) | 22 (1.8%) |
| $100,000+ | 155 (15.4%) | 21 (1.8%) |
| Total | 1,009 (100.0%) | 1,195 (100.0%) |
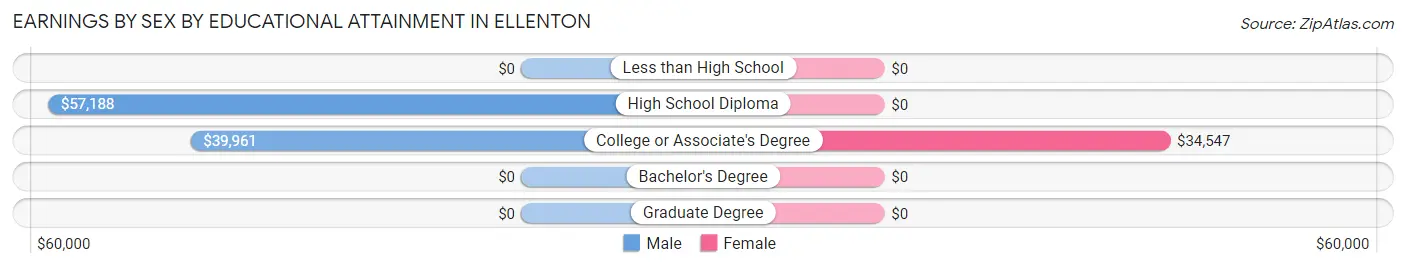
Earnings by Sex by Educational Attainment in Ellenton
Average earnings in Ellenton are $48,524 for men and $34,536 for women, a difference of 28.8%. Men with an educational attainment of high school diploma enjoy the highest average annual earnings of $57,188, while those with college or associate's degree education earn the least with $39,961. Women with an educational attainment of college or associate's degree earn the most with the average annual earnings of $34,547, while those with college or associate's degree education have the smallest earnings of $34,547.
| Educational Attainment | Male Income | Female Income |
| Less than High School | - | - |
| High School Diploma | $57,188 | $0 |
| College or Associate's Degree | $39,961 | $34,547 |
| Bachelor's Degree | - | - |
| Graduate Degree | - | - |
| Total | $48,524 | $34,536 |
Family Income in Ellenton
Family Income Brackets in Ellenton
According to the Ellenton family income data, there are 497 families falling into the $50,000 to $74,999 income range, which is the most common income bracket and makes up 35.6% of all families.
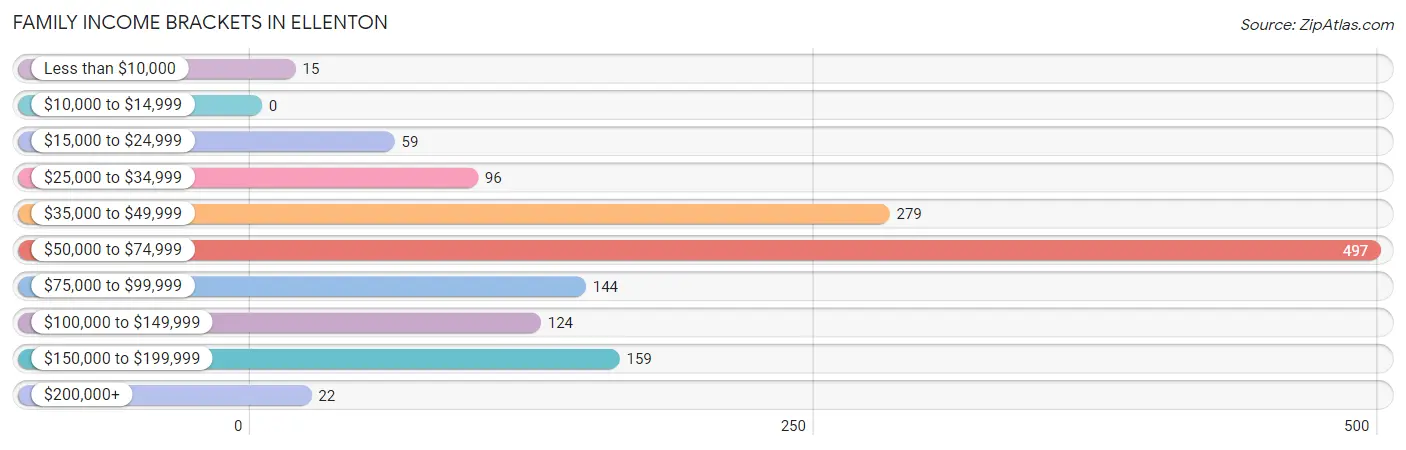
| Income Bracket | # Families | % Families |
| Less than $10,000 | 15 | 1.1% |
| $10,000 to $14,999 | 0 | 0.0% |
| $15,000 to $24,999 | 59 | 4.2% |
| $25,000 to $34,999 | 96 | 6.9% |
| $35,000 to $49,999 | 279 | 20.0% |
| $50,000 to $74,999 | 497 | 35.6% |
| $75,000 to $99,999 | 144 | 10.3% |
| $100,000 to $149,999 | 124 | 8.9% |
| $150,000 to $199,999 | 159 | 11.4% |
| $200,000+ | 22 | 1.6% |
Family Income by Famaliy Size in Ellenton
2-person families (726 | 52.0%) account for the highest median family income in Ellenton with $64,692 per family, while 2-person families (726 | 52.0%) have the highest median income of $32,346 per family member.
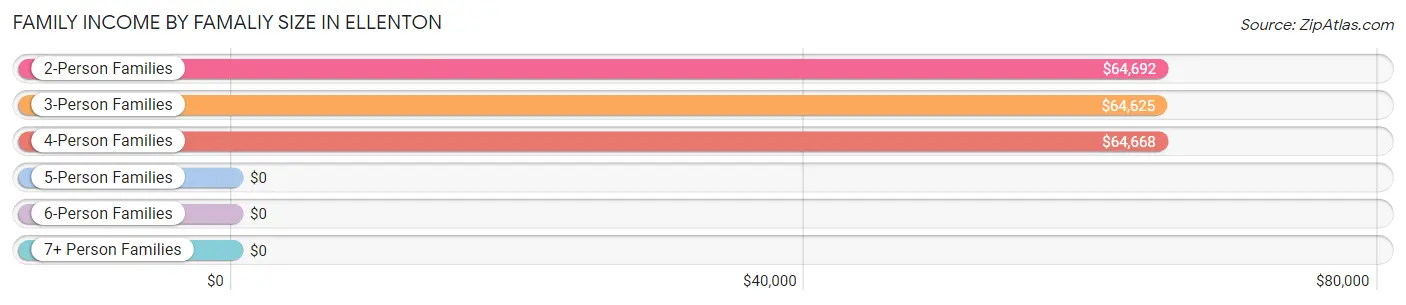
| Income Bracket | # Families | Median Income |
| 2-Person Families | 726 (52.0%) | $64,692 |
| 3-Person Families | 332 (23.8%) | $64,625 |
| 4-Person Families | 255 (18.3%) | $64,668 |
| 5-Person Families | 60 (4.3%) | $0 |
| 6-Person Families | 22 (1.6%) | $0 |
| 7+ Person Families | 0 (0.0%) | $0 |
| Total | 1,395 (100.0%) | $64,481 |
Family Income by Number of Earners in Ellenton
The median family income in Ellenton is $64,481, with families comprising 3+ earners (77) having the highest median family income of $98,011, while families with no earners (279) have the lowest median family income of $58,150, accounting for 5.5% and 20.0% of families, respectively.
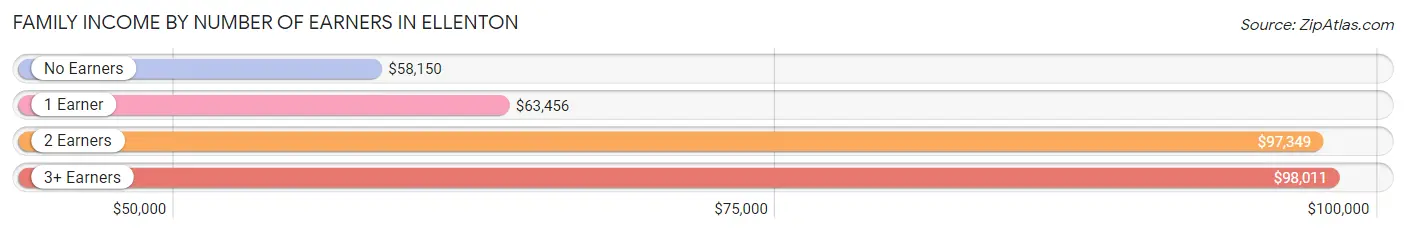
| Number of Earners | # Families | Median Income |
| No Earners | 279 (20.0%) | $58,150 |
| 1 Earner | 615 (44.1%) | $63,456 |
| 2 Earners | 424 (30.4%) | $97,349 |
| 3+ Earners | 77 (5.5%) | $98,011 |
| Total | 1,395 (100.0%) | $64,481 |
Household Income in Ellenton
Household Income Brackets in Ellenton
With 523 households falling in the category, the $50,000 to $74,999 income range is the most frequent in Ellenton, accounting for 27.8% of all households. In contrast, only 17 households (0.9%) fall into the less than $10,000 income bracket, making it the least populous group.
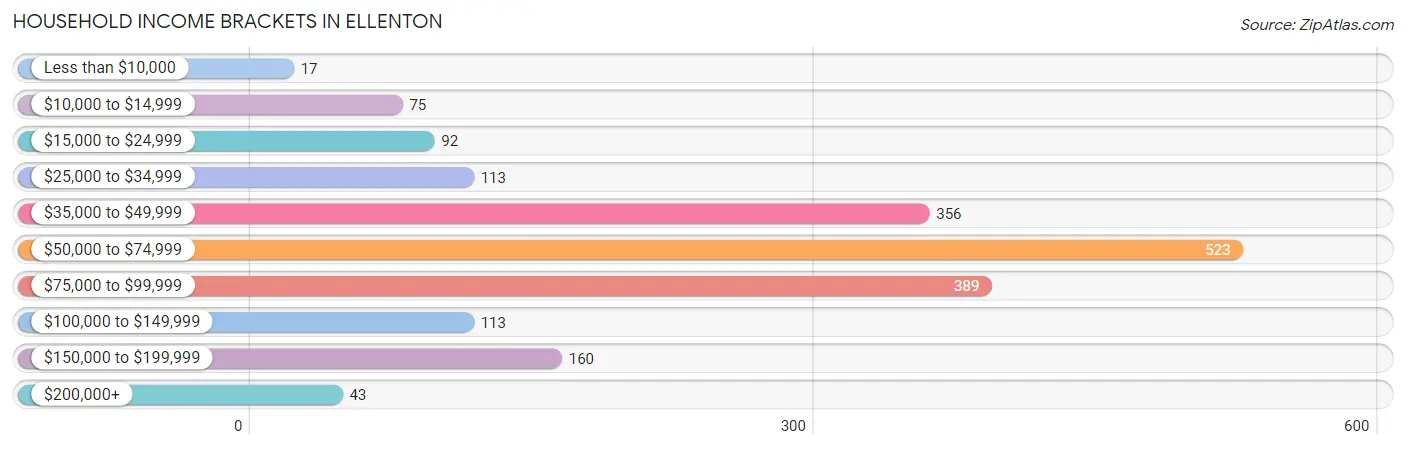
| Income Bracket | # Households | % Households |
| Less than $10,000 | 17 | 0.9% |
| $10,000 to $14,999 | 75 | 4.0% |
| $15,000 to $24,999 | 92 | 4.9% |
| $25,000 to $34,999 | 113 | 6.0% |
| $35,000 to $49,999 | 356 | 18.9% |
| $50,000 to $74,999 | 523 | 27.8% |
| $75,000 to $99,999 | 389 | 20.7% |
| $100,000 to $149,999 | 113 | 6.0% |
| $150,000 to $199,999 | 160 | 8.5% |
| $200,000+ | 43 | 2.3% |
Household Income by Householder Age in Ellenton
The median household income in Ellenton is $66,005, with the highest median household income of $66,307 found in the 45 to 64 years age bracket for the primary householder. A total of 727 households (38.7%) fall into this category. Meanwhile, the 15 to 24 years age bracket for the primary householder has the lowest median household income of $0, with 61 households (3.2%) in this group.
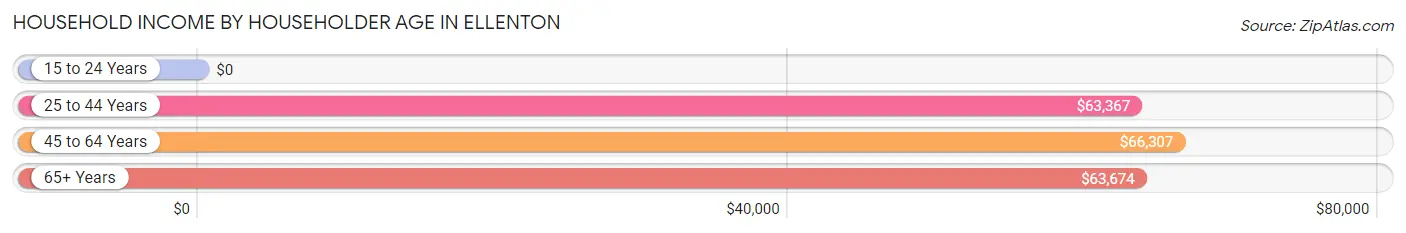
| Income Bracket | # Households | Median Income |
| 15 to 24 Years | 61 (3.2%) | $0 |
| 25 to 44 Years | 476 (25.3%) | $63,367 |
| 45 to 64 Years | 727 (38.7%) | $66,307 |
| 65+ Years | 617 (32.8%) | $63,674 |
| Total | 1,881 (100.0%) | $66,005 |
Poverty in Ellenton
Income Below Poverty by Sex and Age in Ellenton
With 6.9% poverty level for males and 16.6% for females among the residents of Ellenton, 16 and 17 year old males and 18 to 24 year old females are the most vulnerable to poverty, with 86 males (56.6%) and 221 females (75.2%) in their respective age groups living below the poverty level.
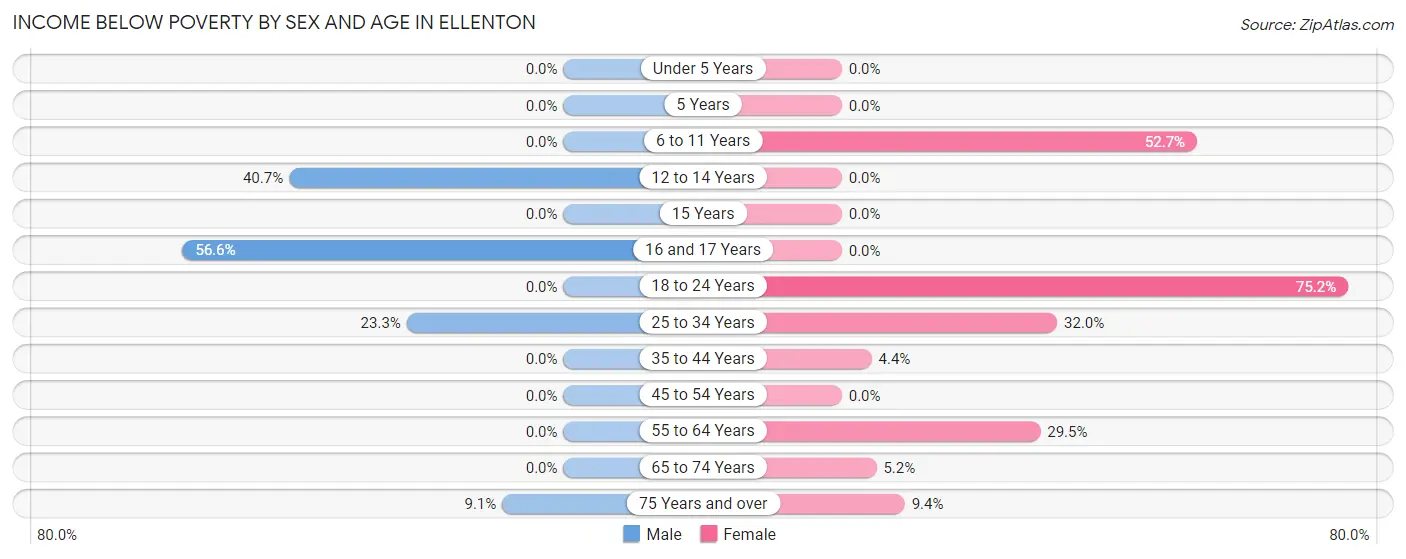
| Age Bracket | Male | Female |
| Under 5 Years | 0 (0.0%) | 0 (0.0%) |
| 5 Years | 0 (0.0%) | 0 (0.0%) |
| 6 to 11 Years | 0 (0.0%) | 58 (52.7%) |
| 12 to 14 Years | 11 (40.7%) | 0 (0.0%) |
| 15 Years | 0 (0.0%) | 0 (0.0%) |
| 16 and 17 Years | 86 (56.6%) | 0 (0.0%) |
| 18 to 24 Years | 0 (0.0%) | 221 (75.2%) |
| 25 to 34 Years | 37 (23.3%) | 47 (32.0%) |
| 35 to 44 Years | 0 (0.0%) | 16 (4.4%) |
| 45 to 54 Years | 0 (0.0%) | 0 (0.0%) |
| 55 to 64 Years | 0 (0.0%) | 74 (29.5%) |
| 65 to 74 Years | 0 (0.0%) | 27 (5.1%) |
| 75 Years and over | 23 (9.1%) | 40 (9.3%) |
| Total | 157 (6.9%) | 483 (16.6%) |
Income Above Poverty by Sex and Age in Ellenton
According to the poverty statistics in Ellenton, males aged under 5 years and females aged under 5 years are the age groups that are most secure financially, with 100.0% of males and 100.0% of females in these age groups living above the poverty line.
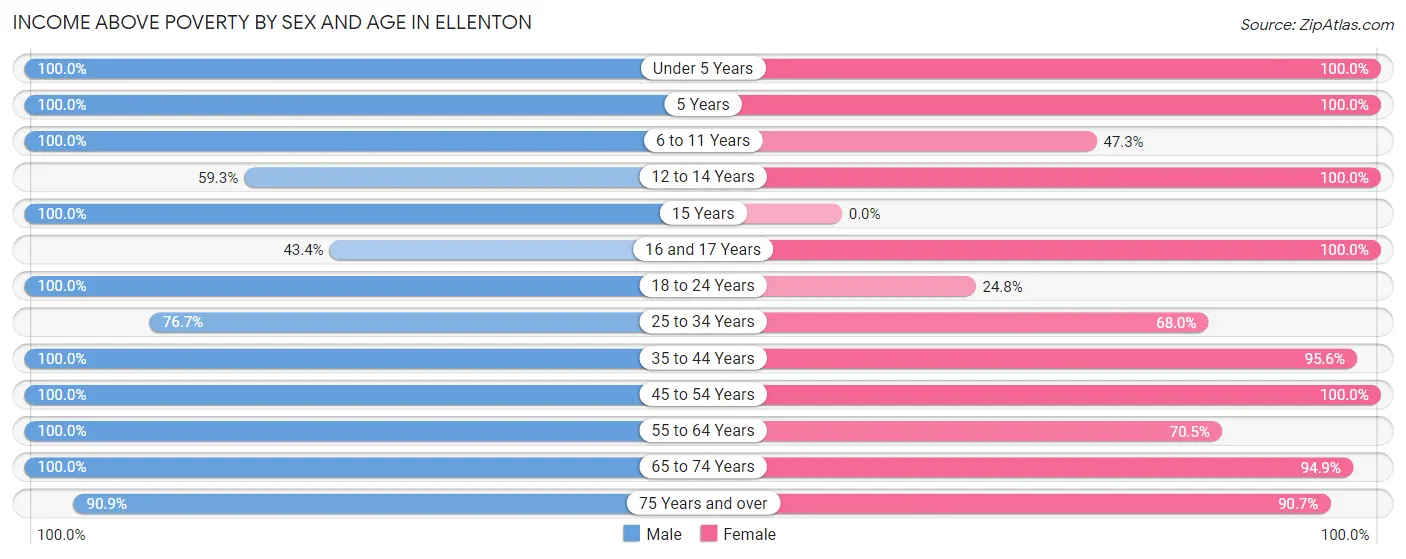
| Age Bracket | Male | Female |
| Under 5 Years | 147 (100.0%) | 22 (100.0%) |
| 5 Years | 5 (100.0%) | 23 (100.0%) |
| 6 to 11 Years | 303 (100.0%) | 52 (47.3%) |
| 12 to 14 Years | 16 (59.3%) | 77 (100.0%) |
| 15 Years | 61 (100.0%) | 0 (0.0%) |
| 16 and 17 Years | 66 (43.4%) | 119 (100.0%) |
| 18 to 24 Years | 103 (100.0%) | 73 (24.8%) |
| 25 to 34 Years | 122 (76.7%) | 100 (68.0%) |
| 35 to 44 Years | 308 (100.0%) | 346 (95.6%) |
| 45 to 54 Years | 218 (100.0%) | 552 (100.0%) |
| 55 to 64 Years | 276 (100.0%) | 177 (70.5%) |
| 65 to 74 Years | 274 (100.0%) | 497 (94.9%) |
| 75 Years and over | 230 (90.9%) | 388 (90.6%) |
| Total | 2,129 (93.1%) | 2,426 (83.4%) |
Income Below Poverty Among Married-Couple Families in Ellenton
The poverty statistics for married-couple families in Ellenton show that 5.7% or 67 of the total 1,180 families live below the poverty line. Families with 1 or 2 children have the highest poverty rate of 16.9%, comprising of 47 families. On the other hand, families with 3 or 4 children have the lowest poverty rate of 0.0%, which includes 0 families.
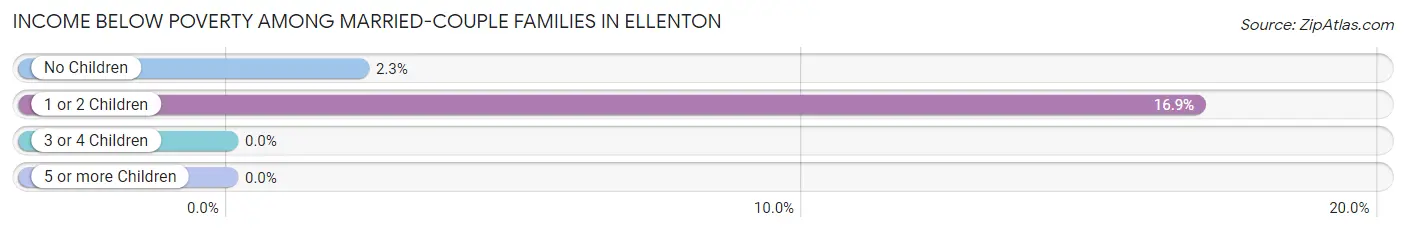
| Children | Above Poverty | Below Poverty |
| No Children | 859 (97.7%) | 20 (2.3%) |
| 1 or 2 Children | 232 (83.2%) | 47 (16.9%) |
| 3 or 4 Children | 22 (100.0%) | 0 (0.0%) |
| 5 or more Children | 0 (0.0%) | 0 (0.0%) |
| Total | 1,113 (94.3%) | 67 (5.7%) |
Income Below Poverty Among Single-Parent Households in Ellenton
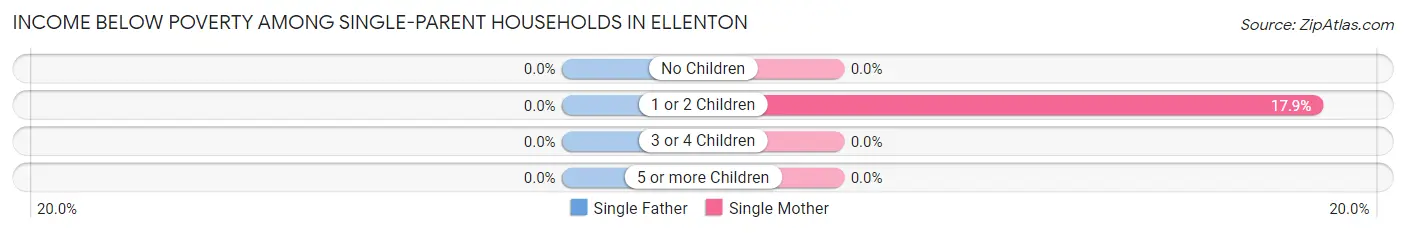
| Children | Single Father | Single Mother |
| No Children | 0 (0.0%) | 0 (0.0%) |
| 1 or 2 Children | 0 (0.0%) | 25 (17.9%) |
| 3 or 4 Children | 0 (0.0%) | 0 (0.0%) |
| 5 or more Children | 0 (0.0%) | 0 (0.0%) |
| Total | 0 (0.0%) | 25 (12.2%) |
Income Below Poverty Among Married-Couple vs Single-Parent Households in Ellenton
The poverty data for Ellenton shows that 67 of the married-couple family households (5.7%) and 25 of the single-parent households (11.6%) are living below the poverty level. Within the married-couple family households, those with 1 or 2 children have the highest poverty rate, with 47 households (16.9%) falling below the poverty line. Among the single-parent households, those with 1 or 2 children have the highest poverty rate, with 25 household (16.7%) living below poverty.
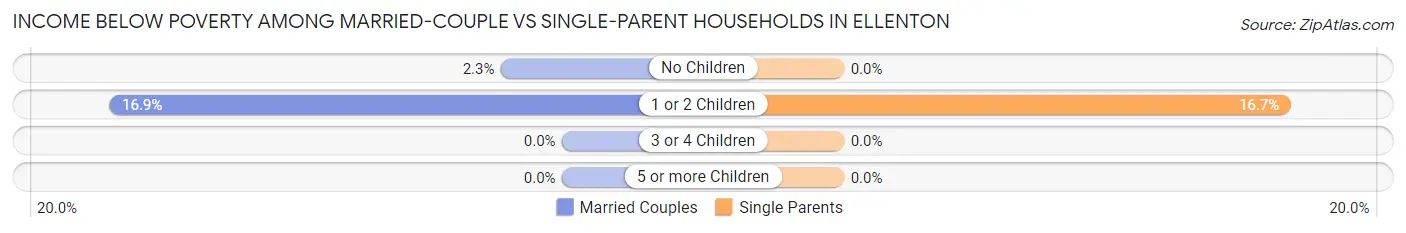
| Children | Married-Couple Families | Single-Parent Households |
| No Children | 20 (2.3%) | 0 (0.0%) |
| 1 or 2 Children | 47 (16.9%) | 25 (16.7%) |
| 3 or 4 Children | 0 (0.0%) | 0 (0.0%) |
| 5 or more Children | 0 (0.0%) | 0 (0.0%) |
| Total | 67 (5.7%) | 25 (11.6%) |
Race in Ellenton
The most populous races in Ellenton are White / Caucasian (3,381 | 62.7%), Hispanic or Latino (2,023 | 37.5%), and Two or more Races (1,297 | 24.1%).
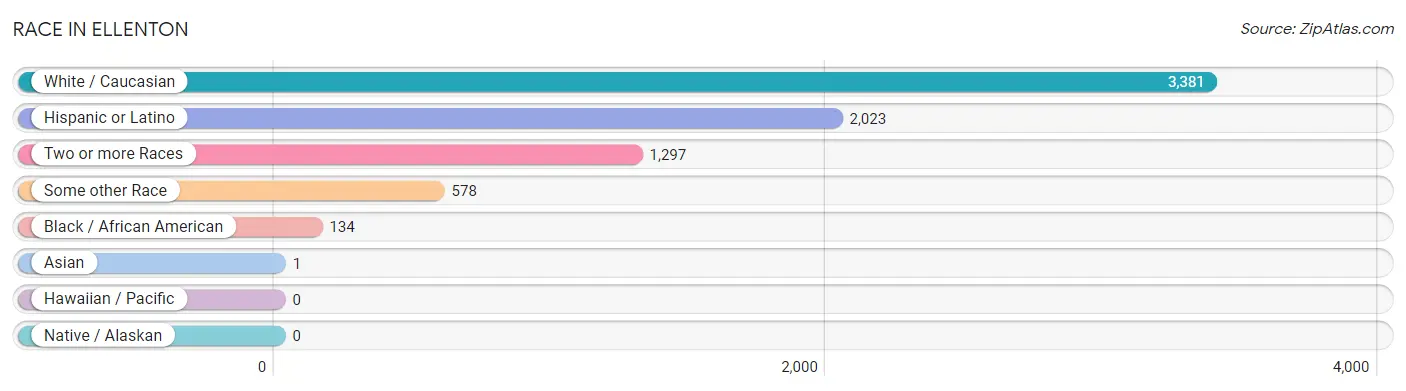
| Race | # Population | % Population |
| Asian | 1 | 0.0% |
| Black / African American | 134 | 2.5% |
| Hawaiian / Pacific | 0 | 0.0% |
| Hispanic or Latino | 2,023 | 37.5% |
| Native / Alaskan | 0 | 0.0% |
| White / Caucasian | 3,381 | 62.7% |
| Two or more Races | 1,297 | 24.1% |
| Some other Race | 578 | 10.7% |
| Total | 5,391 | 100.0% |
Ancestry in Ellenton
The most populous ancestries reported in Ellenton are Mexican (1,270 | 23.6%), Irish (733 | 13.6%), German (585 | 10.8%), South American (454 | 8.4%), and English (407 | 7.5%), together accounting for 64.0% of all Ellenton residents.
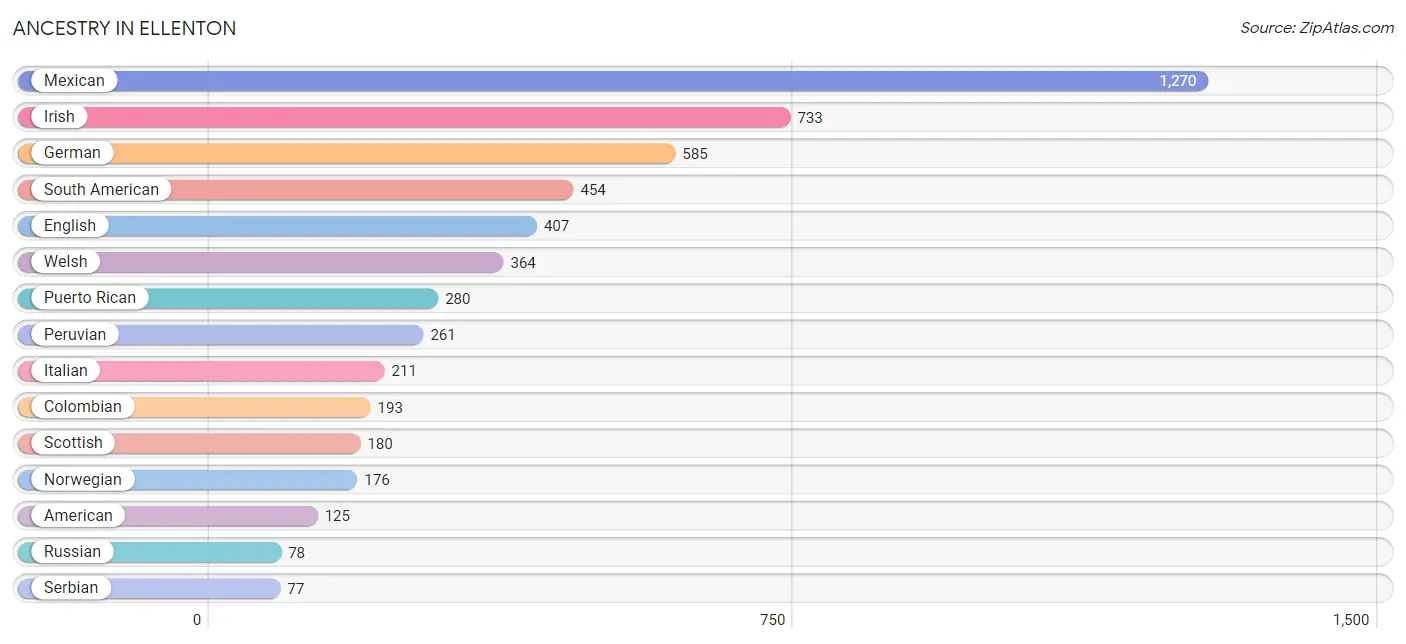
| Ancestry | # Population | % Population |
| African | 1 | 0.0% |
| American | 125 | 2.3% |
| Armenian | 20 | 0.4% |
| Burmese | 44 | 0.8% |
| Canadian | 17 | 0.3% |
| Chickasaw | 7 | 0.1% |
| Colombian | 193 | 3.6% |
| Cuban | 19 | 0.4% |
| Czech | 20 | 0.4% |
| Czechoslovakian | 2 | 0.0% |
| Danish | 25 | 0.5% |
| Dutch | 73 | 1.3% |
| English | 407 | 7.5% |
| European | 69 | 1.3% |
| French | 53 | 1.0% |
| French Canadian | 6 | 0.1% |
| German | 585 | 10.8% |
| Greek | 2 | 0.0% |
| Hungarian | 28 | 0.5% |
| Irish | 733 | 13.6% |
| Italian | 211 | 3.9% |
| Korean | 51 | 0.9% |
| Mexican | 1,270 | 23.6% |
| Norwegian | 176 | 3.3% |
| Peruvian | 261 | 4.8% |
| Puerto Rican | 280 | 5.2% |
| Russian | 78 | 1.5% |
| Scandinavian | 52 | 1.0% |
| Scotch-Irish | 9 | 0.2% |
| Scottish | 180 | 3.3% |
| Serbian | 77 | 1.4% |
| South American | 454 | 8.4% |
| South American Indian | 16 | 0.3% |
| Subsaharan African | 1 | 0.0% |
| Swedish | 59 | 1.1% |
| Welsh | 364 | 6.8% | View All 36 Rows |
Immigrants in Ellenton
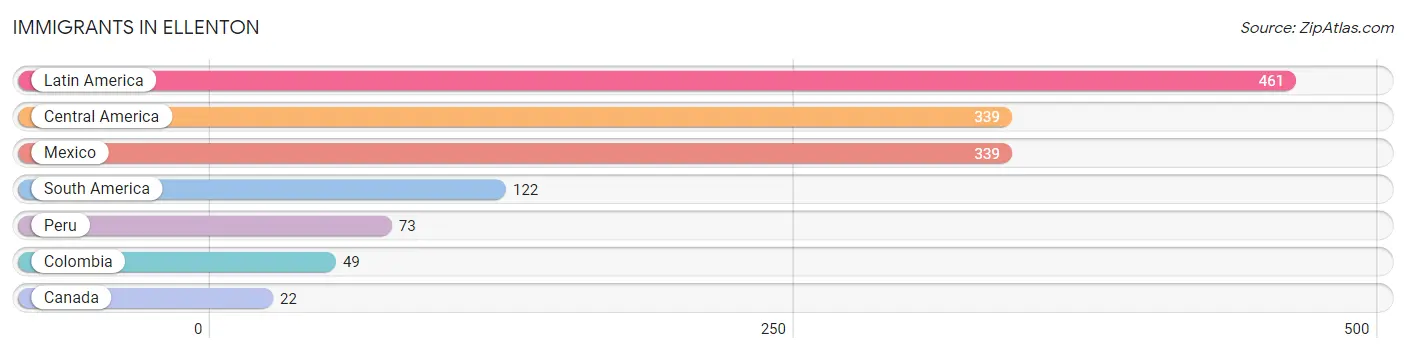
The most numerous immigrant groups reported in Ellenton came from Latin America (461 | 8.6%), Central America (339 | 6.3%), Mexico (339 | 6.3%), South America (122 | 2.3%), and Peru (73 | 1.3%), together accounting for 24.7% of all Ellenton residents.
| Immigration Origin | # Population | % Population |
| Canada | 22 | 0.4% |
| Central America | 339 | 6.3% |
| Colombia | 49 | 0.9% |
| Latin America | 461 | 8.6% |
| Mexico | 339 | 6.3% |
| Peru | 73 | 1.3% |
| South America | 122 | 2.3% | View All 7 Rows |
Sex and Age in Ellenton
Sex and Age in Ellenton
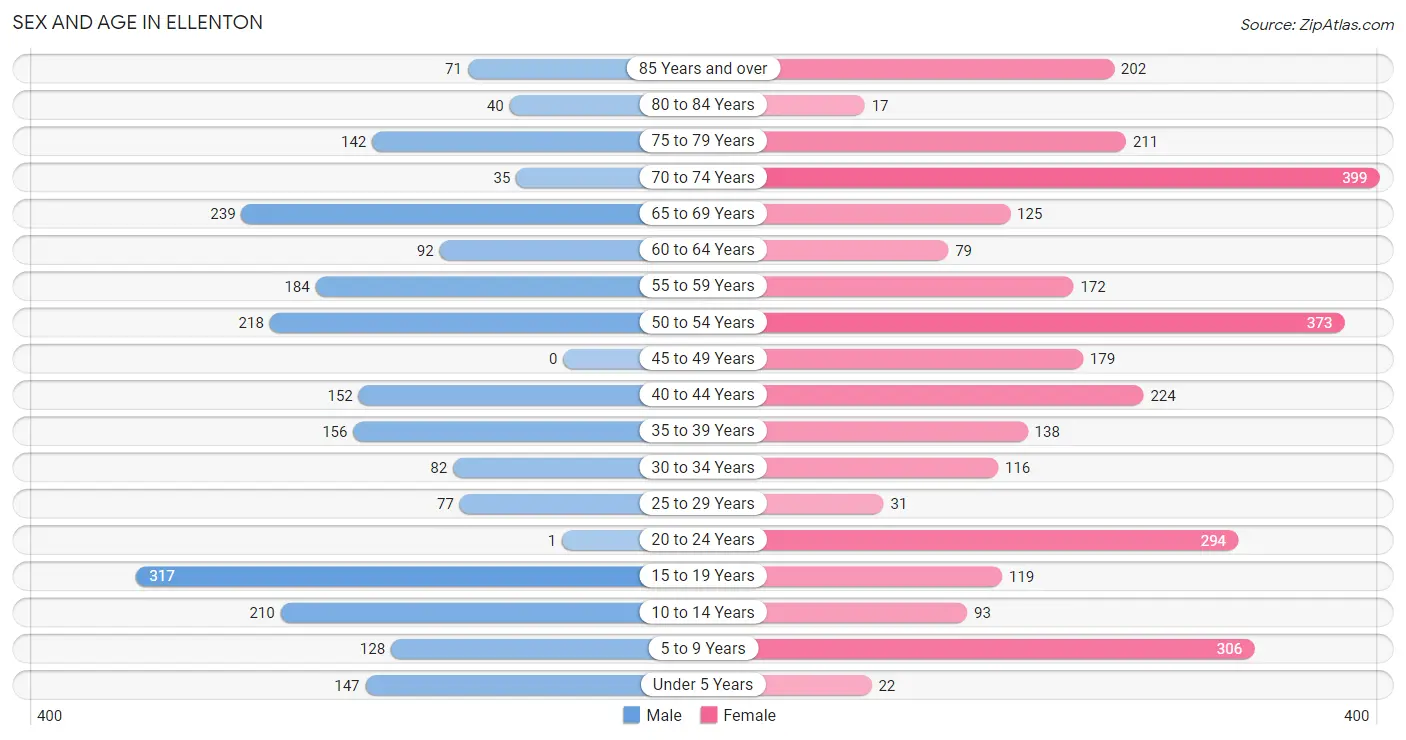
The most populous age groups in Ellenton are 15 to 19 Years (317 | 13.8%) for men and 70 to 74 Years (399 | 12.9%) for women.
| Age Bracket | Male | Female |
| Under 5 Years | 147 (6.4%) | 22 (0.7%) |
| 5 to 9 Years | 128 (5.6%) | 306 (9.9%) |
| 10 to 14 Years | 210 (9.2%) | 93 (3.0%) |
| 15 to 19 Years | 317 (13.8%) | 119 (3.8%) |
| 20 to 24 Years | 1 (0.0%) | 294 (9.5%) |
| 25 to 29 Years | 77 (3.4%) | 31 (1.0%) |
| 30 to 34 Years | 82 (3.6%) | 116 (3.7%) |
| 35 to 39 Years | 156 (6.8%) | 138 (4.4%) |
| 40 to 44 Years | 152 (6.6%) | 224 (7.2%) |
| 45 to 49 Years | 0 (0.0%) | 179 (5.8%) |
| 50 to 54 Years | 218 (9.5%) | 373 (12.0%) |
| 55 to 59 Years | 184 (8.0%) | 172 (5.6%) |
| 60 to 64 Years | 92 (4.0%) | 79 (2.5%) |
| 65 to 69 Years | 239 (10.4%) | 125 (4.0%) |
| 70 to 74 Years | 35 (1.5%) | 399 (12.9%) |
| 75 to 79 Years | 142 (6.2%) | 211 (6.8%) |
| 80 to 84 Years | 40 (1.8%) | 17 (0.5%) |
| 85 Years and over | 71 (3.1%) | 202 (6.5%) |
| Total | 2,291 (100.0%) | 3,100 (100.0%) |
Families and Households in Ellenton
Median Family Size in Ellenton
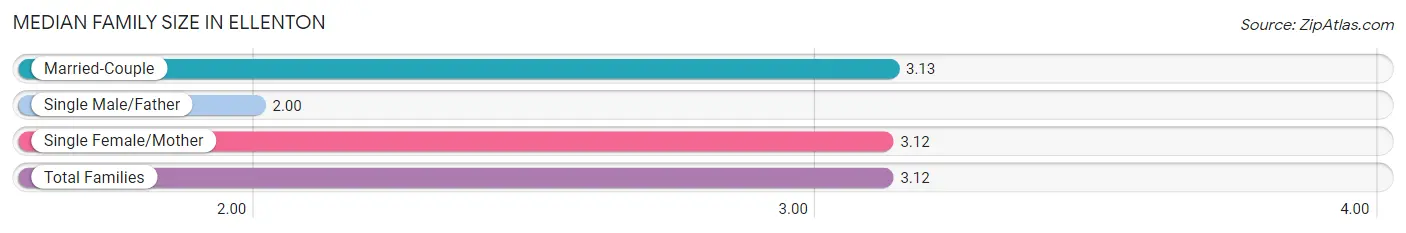
The median family size in Ellenton is 3.12 persons per family, with married-couple families (1,180 | 84.6%) accounting for the largest median family size of 3.13 persons per family. On the other hand, single male/father families (10 | 0.7%) represent the smallest median family size with 2.00 persons per family.
| Family Type | # Families | Family Size |
| Married-Couple | 1,180 (84.6%) | 3.13 |
| Single Male/Father | 10 (0.7%) | 2.00 |
| Single Female/Mother | 205 (14.7%) | 3.12 |
| Total Families | 1,395 (100.0%) | 3.12 |
Median Household Size in Ellenton
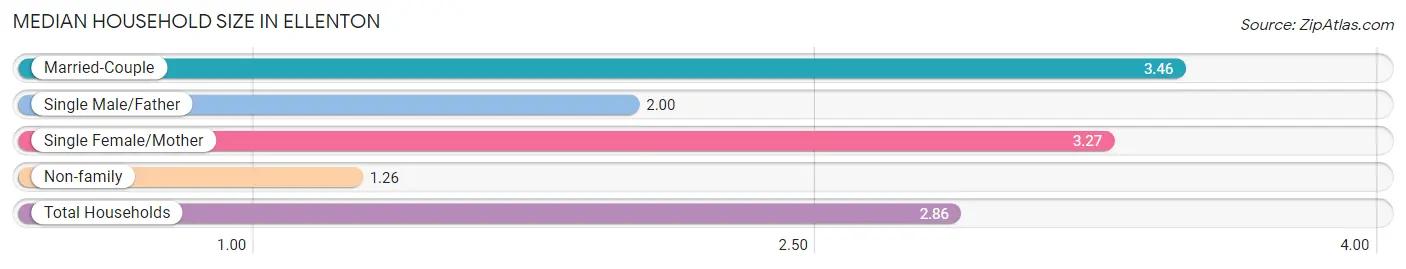
The median household size in Ellenton is 2.86 persons per household, with married-couple households (1,180 | 62.7%) accounting for the largest median household size of 3.46 persons per household. non-family households (486 | 25.8%) represent the smallest median household size with 1.26 persons per household.
| Household Type | # Households | Household Size |
| Married-Couple | 1,180 (62.7%) | 3.46 |
| Single Male/Father | 10 (0.5%) | 2.00 |
| Single Female/Mother | 205 (10.9%) | 3.27 |
| Non-family | 486 (25.8%) | 1.26 |
| Total Households | 1,881 (100.0%) | 2.86 |
Household Size by Marriage Status in Ellenton
Out of a total of 1,881 households in Ellenton, 1,395 (74.2%) are family households, while 486 (25.8%) are nonfamily households. The most numerous type of family households are 2-person households, comprising 726, and the most common type of nonfamily households are 1-person households, comprising 376.
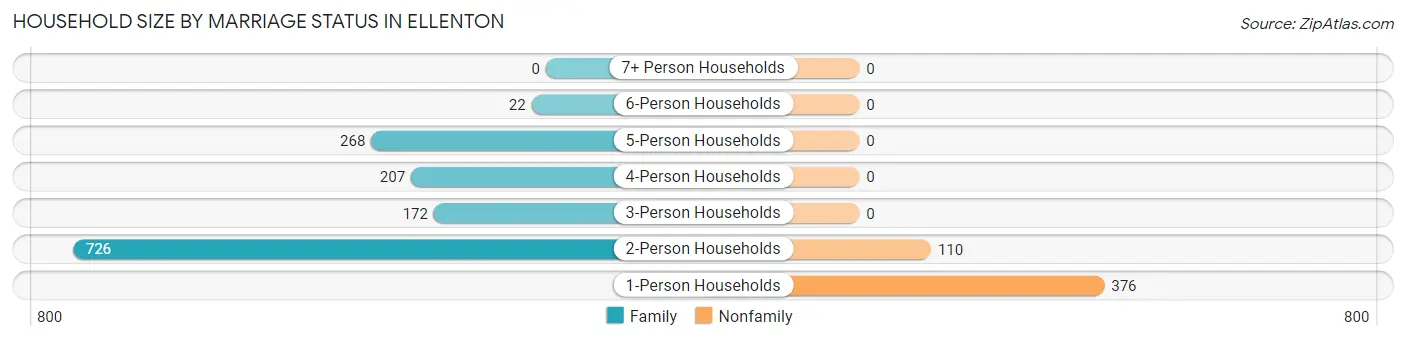
| Household Size | Family Households | Nonfamily Households |
| 1-Person Households | - | 376 (20.0%) |
| 2-Person Households | 726 (38.6%) | 110 (5.9%) |
| 3-Person Households | 172 (9.1%) | 0 (0.0%) |
| 4-Person Households | 207 (11.0%) | 0 (0.0%) |
| 5-Person Households | 268 (14.2%) | 0 (0.0%) |
| 6-Person Households | 22 (1.2%) | 0 (0.0%) |
| 7+ Person Households | 0 (0.0%) | 0 (0.0%) |
| Total | 1,395 (74.2%) | 486 (25.8%) |
Female Fertility in Ellenton
Fertility by Age in Ellenton
Average fertility rate in Ellenton is 96.0 births per 1,000 women. Women in the age bracket of 35 to 50 years have the highest fertility rate with 134.0 births per 1,000 women. Women in the age bracket of 35 to 50 years acount for 70.9% of all women with births.
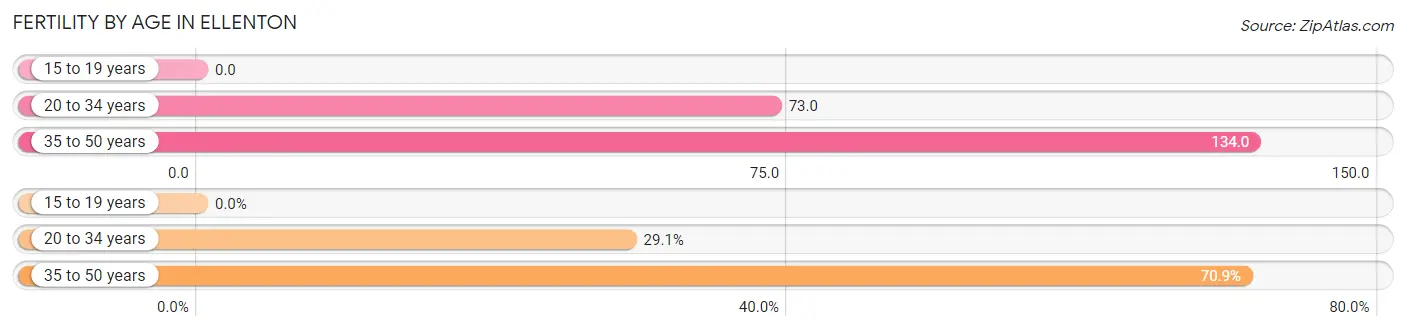
| Age Bracket | Women with Births | Births / 1,000 Women |
| 15 to 19 years | 0 (0.0%) | 0.0 |
| 20 to 34 years | 32 (29.1%) | 73.0 |
| 35 to 50 years | 78 (70.9%) | 134.0 |
| Total | 110 (100.0%) | 96.0 |
Fertility by Age by Marriage Status in Ellenton
70.9% of women with births (110) in Ellenton are married. The highest percentage of unmarried women with births falls into 20 to 34 years age bracket with 100.0% of them unmarried at the time of birth, while the lowest percentage of unmarried women with births belong to 35 to 50 years age bracket with 0.0% of them unmarried.
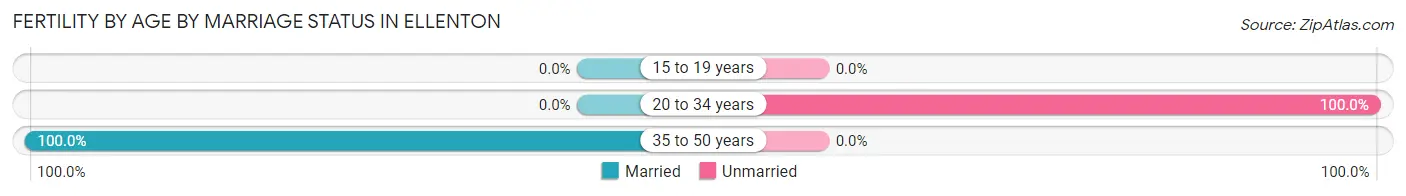
| Age Bracket | Married | Unmarried |
| 15 to 19 years | 0 (0.0%) | 0 (0.0%) |
| 20 to 34 years | 0 (0.0%) | 32 (100.0%) |
| 35 to 50 years | 78 (100.0%) | 0 (0.0%) |
| Total | 78 (70.9%) | 32 (29.1%) |
Fertility by Education in Ellenton
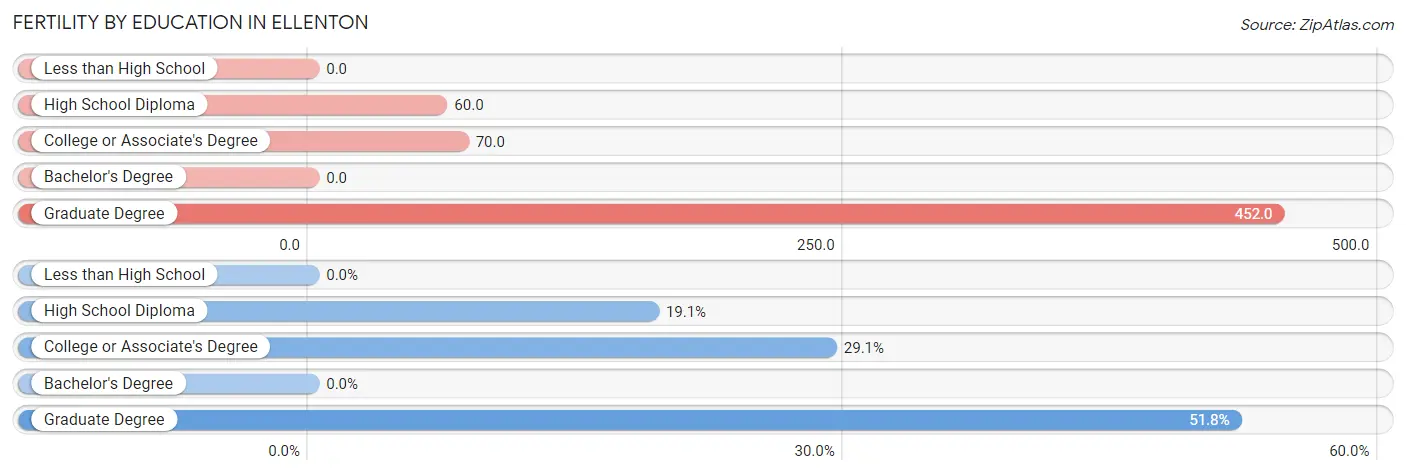
| Educational Attainment | Women with Births | Births / 1,000 Women |
| Less than High School | 0 (0.0%) | 0.0 |
| High School Diploma | 21 (19.1%) | 60.0 |
| College or Associate's Degree | 32 (29.1%) | 70.0 |
| Bachelor's Degree | 0 (0.0%) | 0.0 |
| Graduate Degree | 57 (51.8%) | 452.0 |
| Total | 110 (100.0%) | 96.0 |
Fertility by Education by Marriage Status in Ellenton
29.1% of women with births in Ellenton are unmarried. Women with the educational attainment of high school diploma are most likely to be married with 100.0% of them married at childbirth, while women with the educational attainment of college or associate's degree are least likely to be married with 100.0% of them unmarried at childbirth.
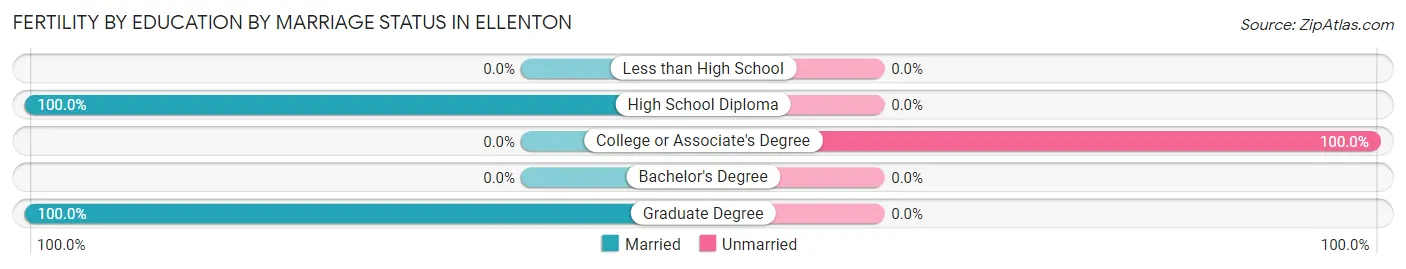
| Educational Attainment | Married | Unmarried |
| Less than High School | 0 (0.0%) | 0 (0.0%) |
| High School Diploma | 21 (100.0%) | 0 (0.0%) |
| College or Associate's Degree | 0 (0.0%) | 32 (100.0%) |
| Bachelor's Degree | 0 (0.0%) | 0 (0.0%) |
| Graduate Degree | 57 (100.0%) | 0 (0.0%) |
| Total | 78 (70.9%) | 32 (29.1%) |
Employment Characteristics in Ellenton
Employment by Class of Employer in Ellenton
Among the 2,126 employed individuals in Ellenton, private company employees (1,368 | 64.3%), local government employees (341 | 16.0%), and self-employed (not incorporated) (325 | 15.3%) make up the most common classes of employment.
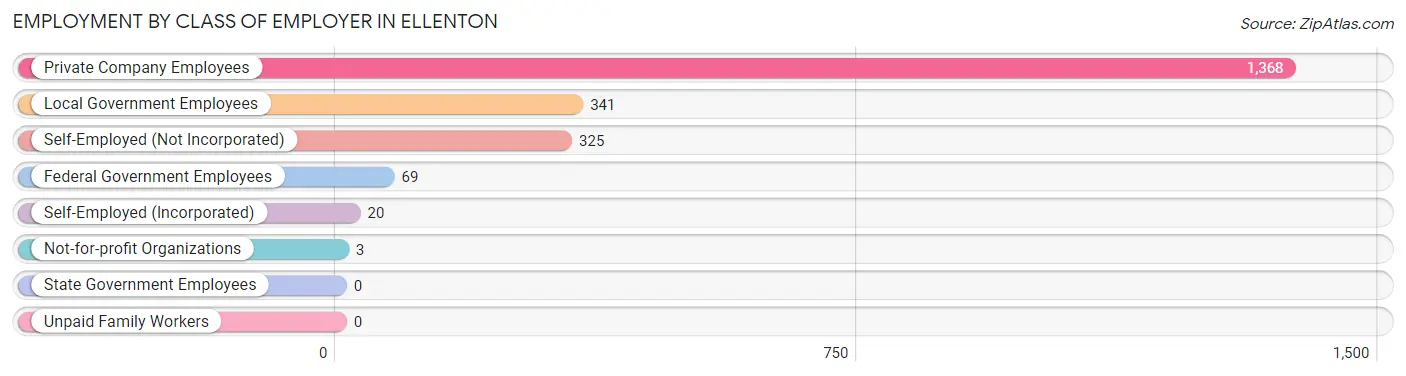
| Employer Class | # Employees | % Employees |
| Private Company Employees | 1,368 | 64.3% |
| Self-Employed (Incorporated) | 20 | 0.9% |
| Self-Employed (Not Incorporated) | 325 | 15.3% |
| Not-for-profit Organizations | 3 | 0.1% |
| Local Government Employees | 341 | 16.0% |
| State Government Employees | 0 | 0.0% |
| Federal Government Employees | 69 | 3.3% |
| Unpaid Family Workers | 0 | 0.0% |
| Total | 2,126 | 100.0% |
Employment Status by Age in Ellenton
According to the labor force statistics for Ellenton, out of the total population over 16 years of age (4,424), 51.6% or 2,283 individuals are in the labor force, with 6.9% or 158 of them unemployed. The age group with the highest labor force participation rate is 25 to 29 years, with 100.0% or 108 individuals in the labor force. Within the labor force, the 16 to 19 years age range has the highest percentage of unemployed individuals, with 34.9% or 90 of them being unemployed.
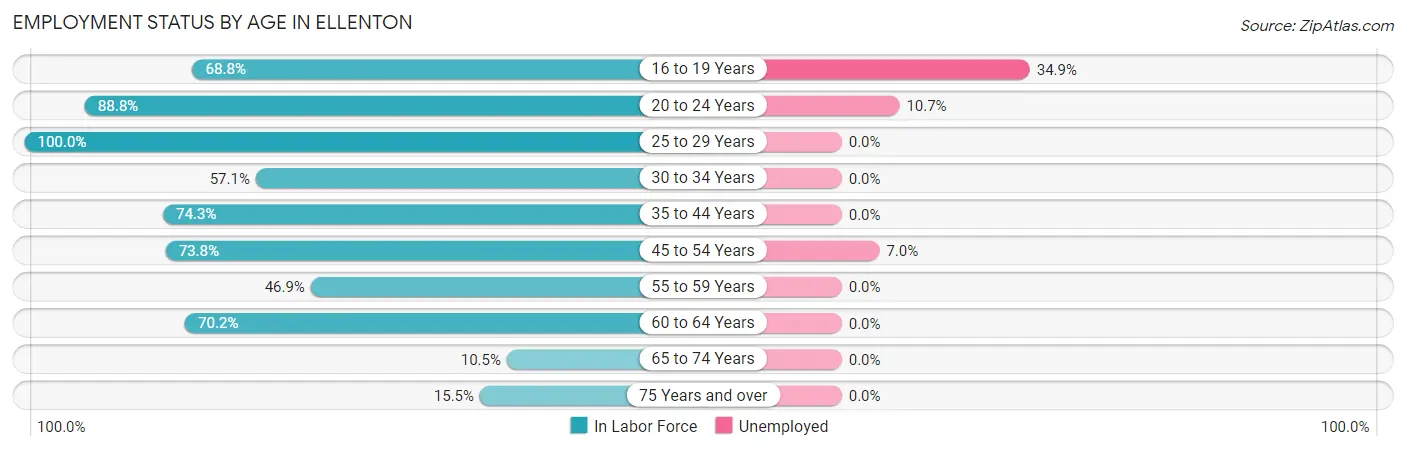
| Age Bracket | In Labor Force | Unemployed |
| 16 to 19 Years | 258 (68.8%) | 90 (34.9%) |
| 20 to 24 Years | 262 (88.8%) | 28 (10.7%) |
| 25 to 29 Years | 108 (100.0%) | 0 (0.0%) |
| 30 to 34 Years | 113 (57.1%) | 0 (0.0%) |
| 35 to 44 Years | 498 (74.3%) | 0 (0.0%) |
| 45 to 54 Years | 568 (73.8%) | 40 (7.0%) |
| 55 to 59 Years | 167 (46.9%) | 0 (0.0%) |
| 60 to 64 Years | 120 (70.2%) | 0 (0.0%) |
| 65 to 74 Years | 84 (10.5%) | 0 (0.0%) |
| 75 Years and over | 106 (15.5%) | 0 (0.0%) |
| Total | 2,283 (51.6%) | 158 (6.9%) |
Employment Status by Educational Attainment in Ellenton
According to labor force statistics for Ellenton, 69.2% of individuals (1,573) out of the total population between 25 and 64 years of age (2,273) are in the labor force, with 2.5% or 39 of them being unemployed. The group with the highest labor force participation rate are those with the educational attainment of bachelor's degree or higher, with 79.9% or 299 individuals in the labor force. Within the labor force, individuals with college / associate degree education have the highest percentage of unemployment, with 5.3% or 40 of them being unemployed.
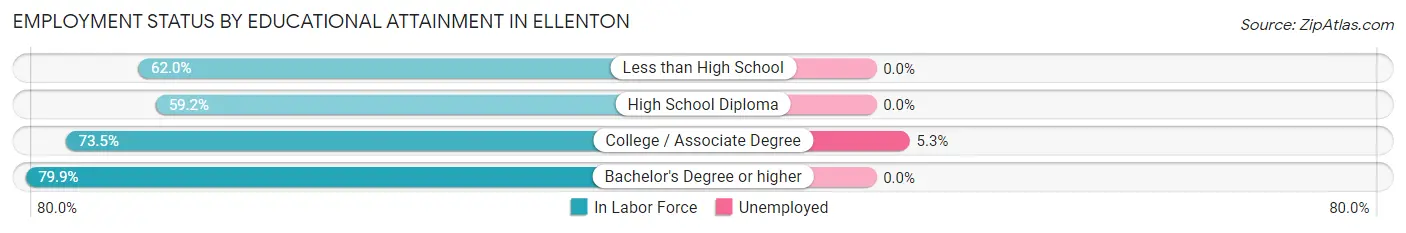
| Educational Attainment | In Labor Force | Unemployed |
| Less than High School | 98 (62.0%) | 0 (0.0%) |
| High School Diploma | 426 (59.2%) | 0 (0.0%) |
| College / Associate Degree | 751 (73.5%) | 54 (5.3%) |
| Bachelor's Degree or higher | 299 (79.9%) | 0 (0.0%) |
| Total | 1,573 (69.2%) | 57 (2.5%) |
Employment Occupations by Sex in Ellenton
Management, Business, Science and Arts Occupations
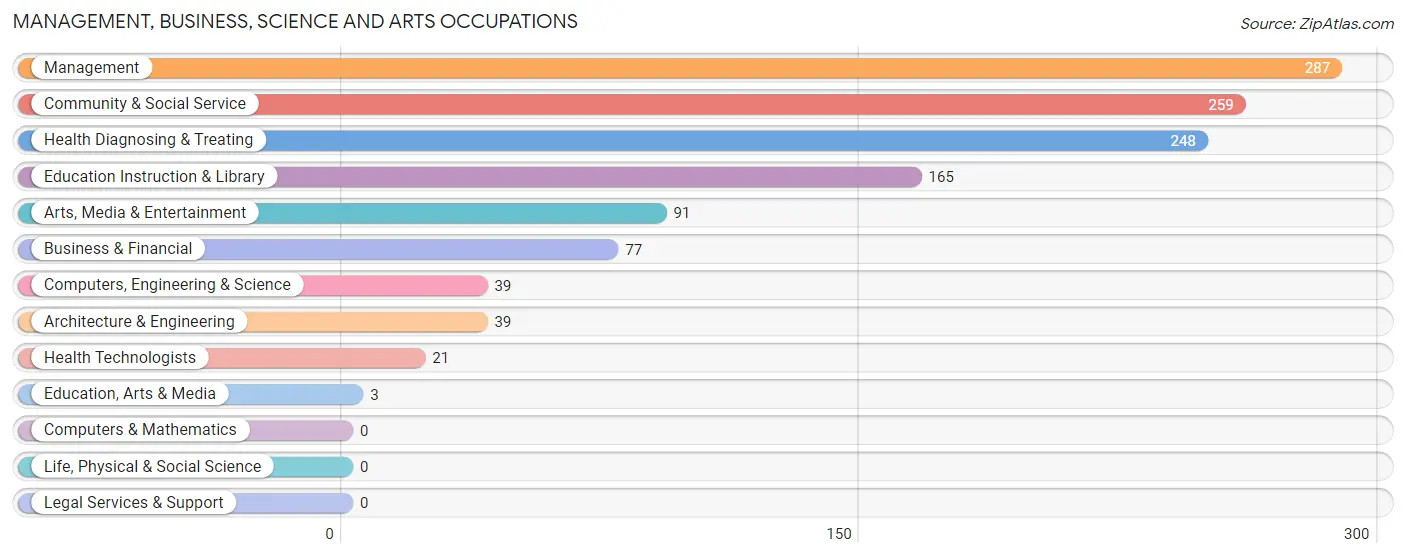
The most common Management, Business, Science and Arts occupations in Ellenton are Management (287 | 13.5%), Community & Social Service (259 | 12.2%), Health Diagnosing & Treating (248 | 11.7%), Education Instruction & Library (165 | 7.8%), and Arts, Media & Entertainment (91 | 4.3%).
Management, Business, Science and Arts Occupations by Sex
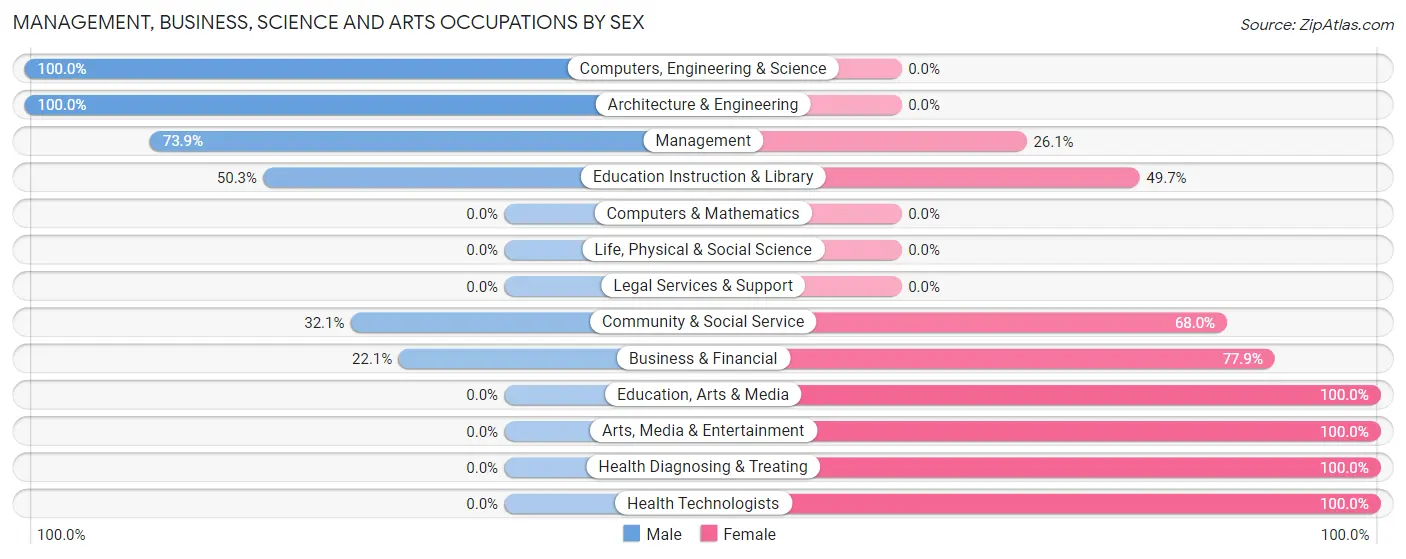
Within the Management, Business, Science and Arts occupations in Ellenton, the most male-oriented occupations are Computers, Engineering & Science (100.0%), Architecture & Engineering (100.0%), and Management (73.9%), while the most female-oriented occupations are Education, Arts & Media (100.0%), Arts, Media & Entertainment (100.0%), and Health Diagnosing & Treating (100.0%).
| Occupation | Male | Female |
| Management | 212 (73.9%) | 75 (26.1%) |
| Business & Financial | 17 (22.1%) | 60 (77.9%) |
| Computers, Engineering & Science | 39 (100.0%) | 0 (0.0%) |
| Computers & Mathematics | 0 (0.0%) | 0 (0.0%) |
| Architecture & Engineering | 39 (100.0%) | 0 (0.0%) |
| Life, Physical & Social Science | 0 (0.0%) | 0 (0.0%) |
| Community & Social Service | 83 (32.1%) | 176 (67.9%) |
| Education, Arts & Media | 0 (0.0%) | 3 (100.0%) |
| Legal Services & Support | 0 (0.0%) | 0 (0.0%) |
| Education Instruction & Library | 83 (50.3%) | 82 (49.7%) |
| Arts, Media & Entertainment | 0 (0.0%) | 91 (100.0%) |
| Health Diagnosing & Treating | 0 (0.0%) | 248 (100.0%) |
| Health Technologists | 0 (0.0%) | 21 (100.0%) |
| Total (Category) | 351 (38.6%) | 559 (61.4%) |
| Total (Overall) | 985 (46.3%) | 1,141 (53.7%) |
Services Occupations
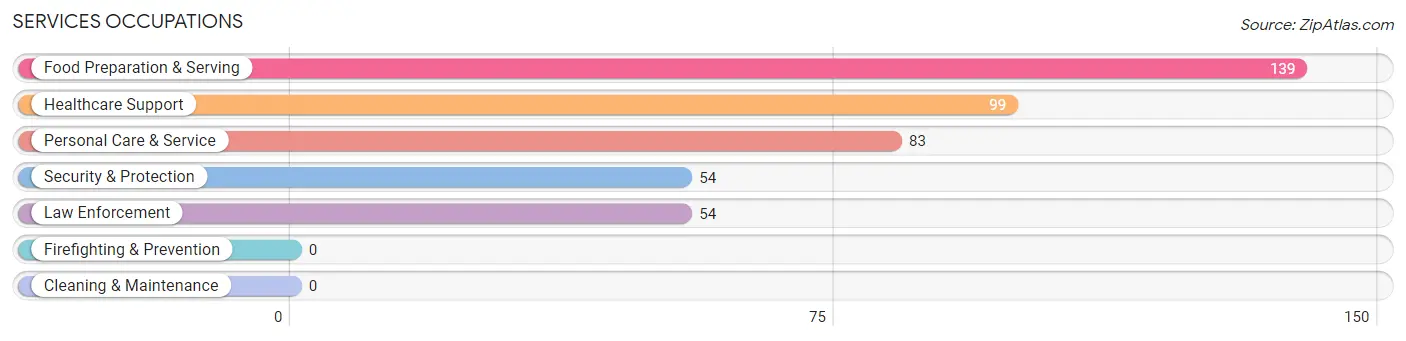
The most common Services occupations in Ellenton are Food Preparation & Serving (139 | 6.5%), Healthcare Support (99 | 4.7%), Personal Care & Service (83 | 3.9%), Security & Protection (54 | 2.5%), and Law Enforcement (54 | 2.5%).
Services Occupations by Sex
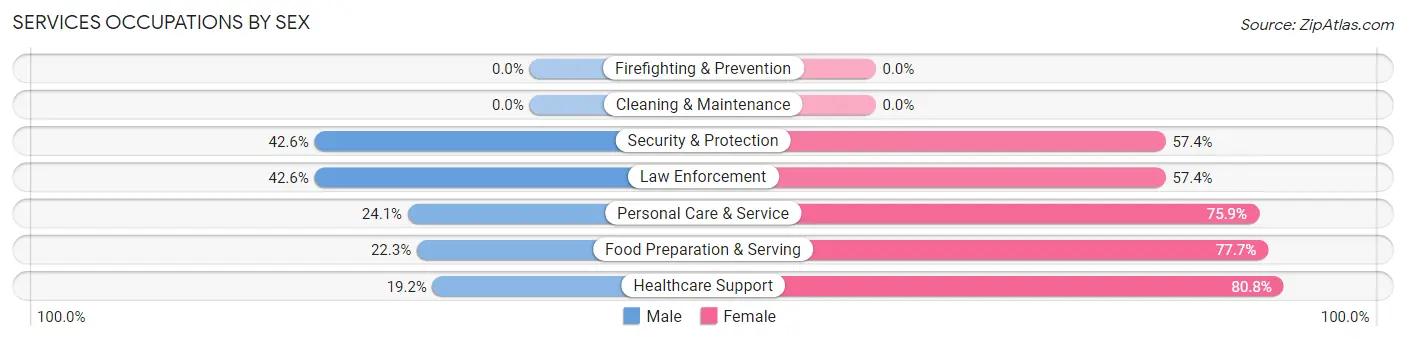
Within the Services occupations in Ellenton, the most male-oriented occupations are Security & Protection (42.6%), Law Enforcement (42.6%), and Personal Care & Service (24.1%), while the most female-oriented occupations are Healthcare Support (80.8%), Food Preparation & Serving (77.7%), and Personal Care & Service (75.9%).
| Occupation | Male | Female |
| Healthcare Support | 19 (19.2%) | 80 (80.8%) |
| Security & Protection | 23 (42.6%) | 31 (57.4%) |
| Firefighting & Prevention | 0 (0.0%) | 0 (0.0%) |
| Law Enforcement | 23 (42.6%) | 31 (57.4%) |
| Food Preparation & Serving | 31 (22.3%) | 108 (77.7%) |
| Cleaning & Maintenance | 0 (0.0%) | 0 (0.0%) |
| Personal Care & Service | 20 (24.1%) | 63 (75.9%) |
| Total (Category) | 93 (24.8%) | 282 (75.2%) |
| Total (Overall) | 985 (46.3%) | 1,141 (53.7%) |
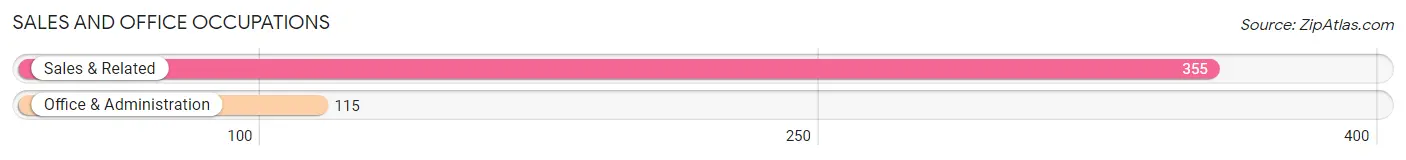
Sales and Office Occupations
The most common Sales and Office occupations in Ellenton are Sales & Related (355 | 16.7%), and Office & Administration (115 | 5.4%).
Sales and Office Occupations by Sex
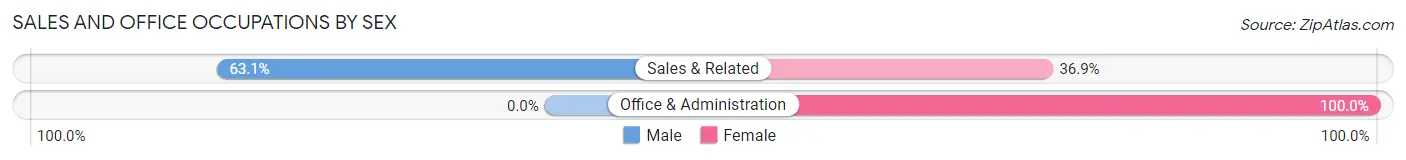
| Occupation | Male | Female |
| Sales & Related | 224 (63.1%) | 131 (36.9%) |
| Office & Administration | 0 (0.0%) | 115 (100.0%) |
| Total (Category) | 224 (47.7%) | 246 (52.3%) |
| Total (Overall) | 985 (46.3%) | 1,141 (53.7%) |
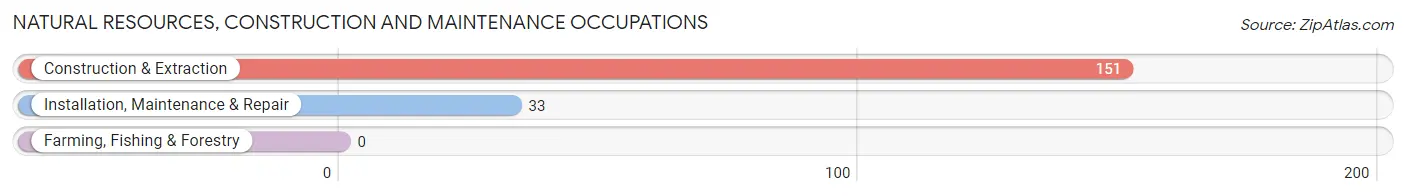
Natural Resources, Construction and Maintenance Occupations
The most common Natural Resources, Construction and Maintenance occupations in Ellenton are Construction & Extraction (151 | 7.1%), and Installation, Maintenance & Repair (33 | 1.5%).
Natural Resources, Construction and Maintenance Occupations by Sex
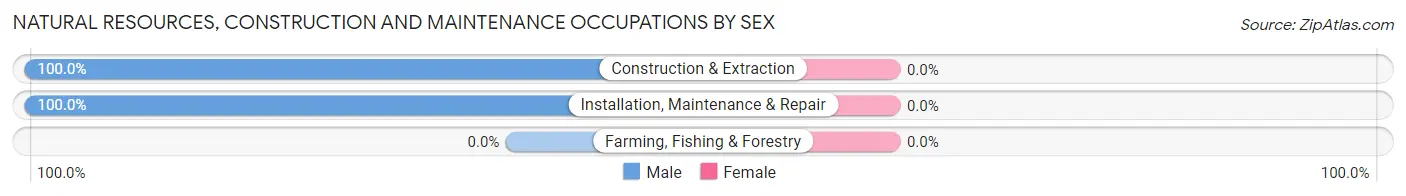
| Occupation | Male | Female |
| Farming, Fishing & Forestry | 0 (0.0%) | 0 (0.0%) |
| Construction & Extraction | 151 (100.0%) | 0 (0.0%) |
| Installation, Maintenance & Repair | 33 (100.0%) | 0 (0.0%) |
| Total (Category) | 184 (100.0%) | 0 (0.0%) |
| Total (Overall) | 985 (46.3%) | 1,141 (53.7%) |
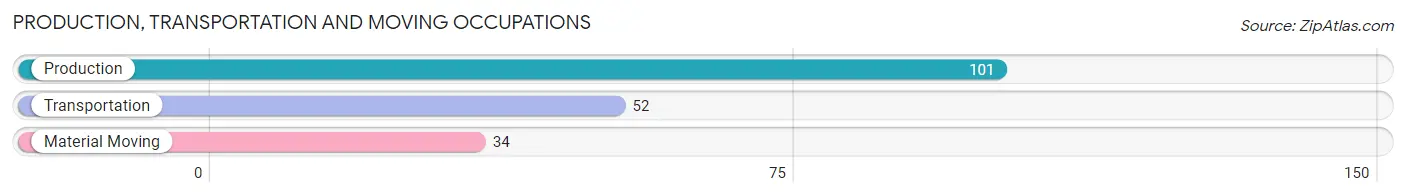
Production, Transportation and Moving Occupations
The most common Production, Transportation and Moving occupations in Ellenton are Production (101 | 4.8%), Transportation (52 | 2.5%), and Material Moving (34 | 1.6%).
Production, Transportation and Moving Occupations by Sex
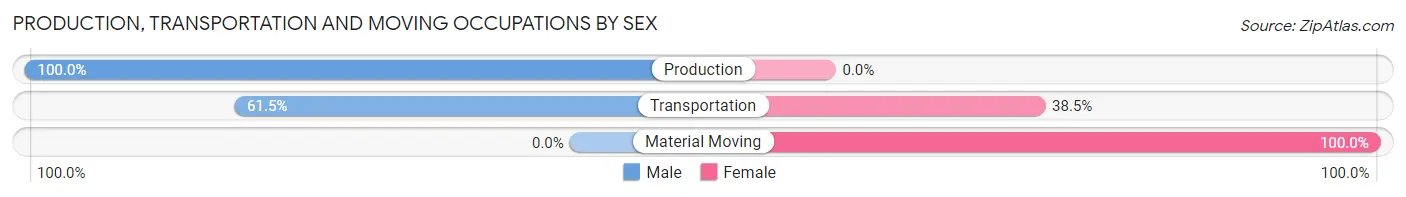
| Occupation | Male | Female |
| Production | 101 (100.0%) | 0 (0.0%) |
| Transportation | 32 (61.5%) | 20 (38.5%) |
| Material Moving | 0 (0.0%) | 34 (100.0%) |
| Total (Category) | 133 (71.1%) | 54 (28.9%) |
| Total (Overall) | 985 (46.3%) | 1,141 (53.7%) |
Employment Industries by Sex in Ellenton
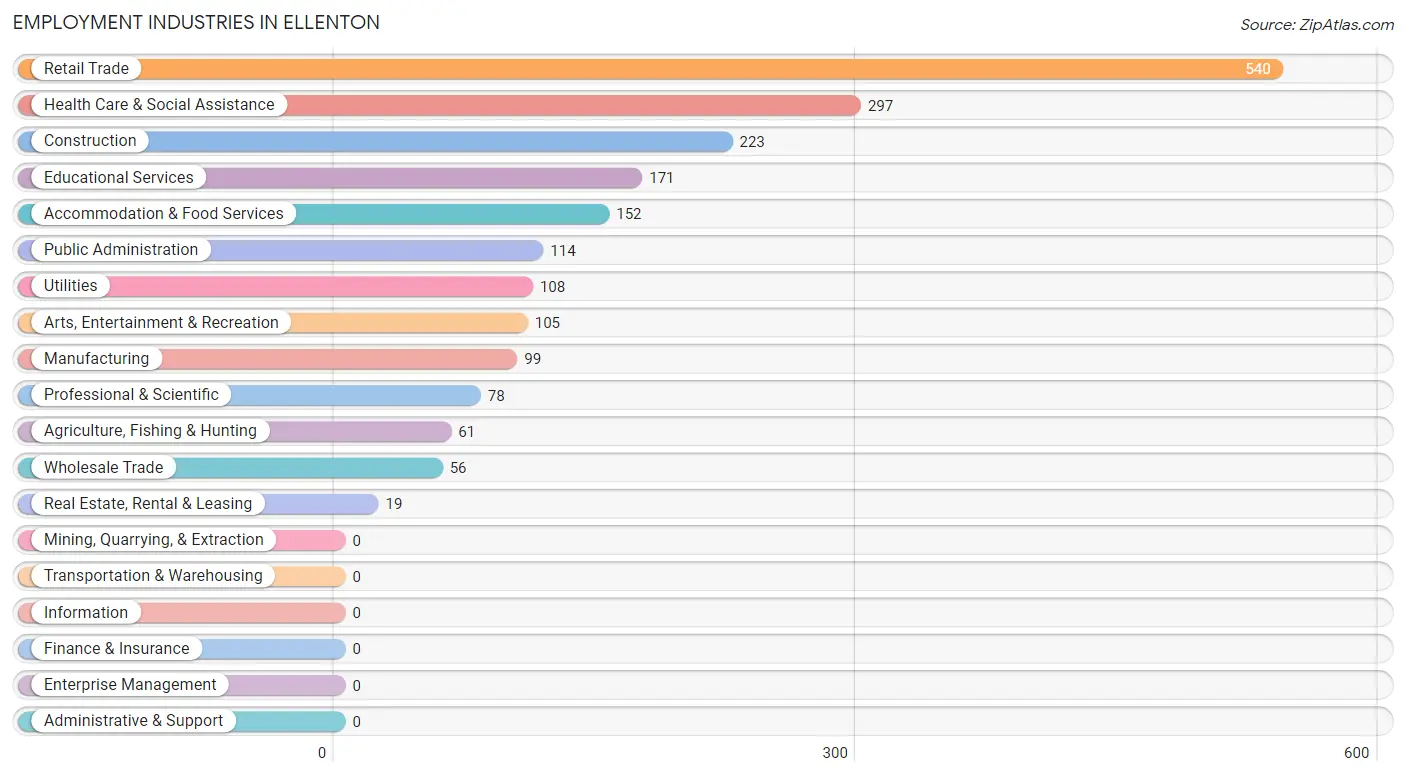
Employment Industries in Ellenton
The major employment industries in Ellenton include Retail Trade (540 | 25.4%), Health Care & Social Assistance (297 | 14.0%), Construction (223 | 10.5%), Educational Services (171 | 8.0%), and Accommodation & Food Services (152 | 7.1%).
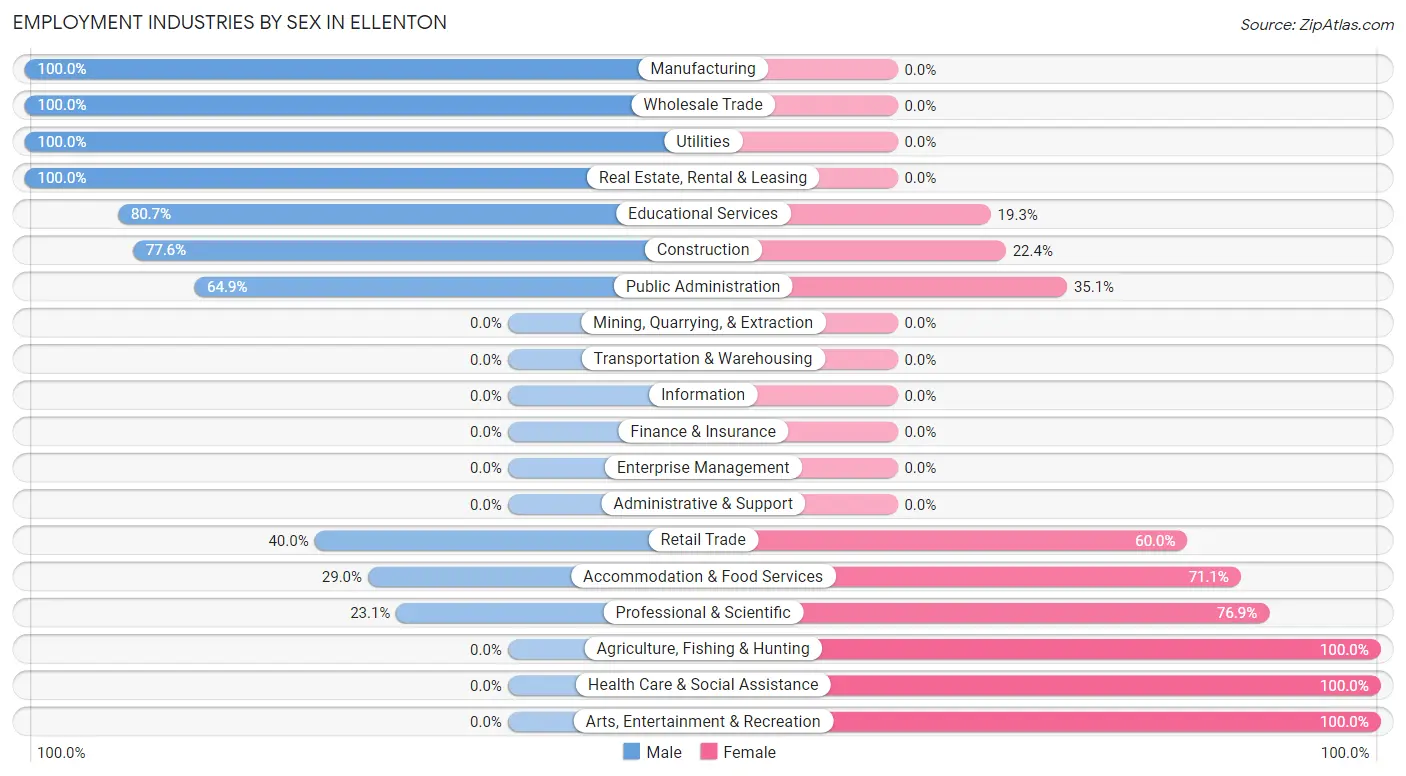
Employment Industries by Sex in Ellenton
The Ellenton industries that see more men than women are Manufacturing (100.0%), Wholesale Trade (100.0%), and Utilities (100.0%), whereas the industries that tend to have a higher number of women are Agriculture, Fishing & Hunting (100.0%), Health Care & Social Assistance (100.0%), and Arts, Entertainment & Recreation (100.0%).
| Industry | Male | Female |
| Agriculture, Fishing & Hunting | 0 (0.0%) | 61 (100.0%) |
| Mining, Quarrying, & Extraction | 0 (0.0%) | 0 (0.0%) |
| Construction | 173 (77.6%) | 50 (22.4%) |
| Manufacturing | 99 (100.0%) | 0 (0.0%) |
| Wholesale Trade | 56 (100.0%) | 0 (0.0%) |
| Retail Trade | 216 (40.0%) | 324 (60.0%) |
| Transportation & Warehousing | 0 (0.0%) | 0 (0.0%) |
| Utilities | 108 (100.0%) | 0 (0.0%) |
| Information | 0 (0.0%) | 0 (0.0%) |
| Finance & Insurance | 0 (0.0%) | 0 (0.0%) |
| Real Estate, Rental & Leasing | 19 (100.0%) | 0 (0.0%) |
| Professional & Scientific | 18 (23.1%) | 60 (76.9%) |
| Enterprise Management | 0 (0.0%) | 0 (0.0%) |
| Administrative & Support | 0 (0.0%) | 0 (0.0%) |
| Educational Services | 138 (80.7%) | 33 (19.3%) |
| Health Care & Social Assistance | 0 (0.0%) | 297 (100.0%) |
| Arts, Entertainment & Recreation | 0 (0.0%) | 105 (100.0%) |
| Accommodation & Food Services | 44 (28.9%) | 108 (71.1%) |
| Public Administration | 74 (64.9%) | 40 (35.1%) |
| Total | 985 (46.3%) | 1,141 (53.7%) |
Education in Ellenton
School Enrollment in Ellenton
The most common levels of schooling among the 1,456 students in Ellenton are elementary school (516 | 35.4%), college / undergraduate (343 | 23.6%), and high school (297 | 20.4%).
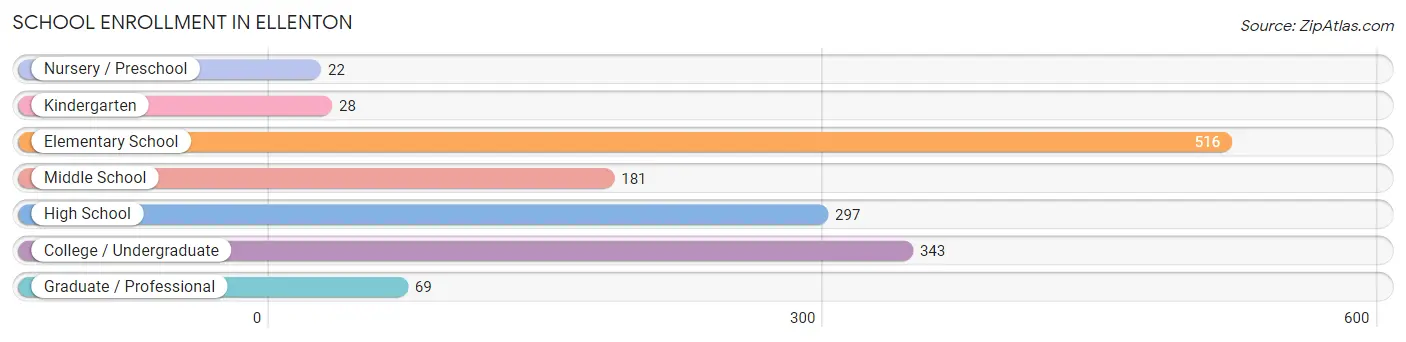
| School Level | # Students | % Students |
| Nursery / Preschool | 22 | 1.5% |
| Kindergarten | 28 | 1.9% |
| Elementary School | 516 | 35.4% |
| Middle School | 181 | 12.4% |
| High School | 297 | 20.4% |
| College / Undergraduate | 343 | 23.6% |
| Graduate / Professional | 69 | 4.7% |
| Total | 1,456 | 100.0% |
School Enrollment by Age by Funding Source in Ellenton
Out of a total of 1,456 students who are enrolled in schools in Ellenton, 290 (19.9%) attend a private institution, while the remaining 1,166 (80.1%) are enrolled in public schools. The age group of 3 to 4 year olds has the highest likelihood of being enrolled in private schools, with 22 (100.0% in the age bracket) enrolled. Conversely, the age group of 15 to 17 year olds has the lowest likelihood of being enrolled in a private school, with 285 (100.0% in the age bracket) attending a public institution.
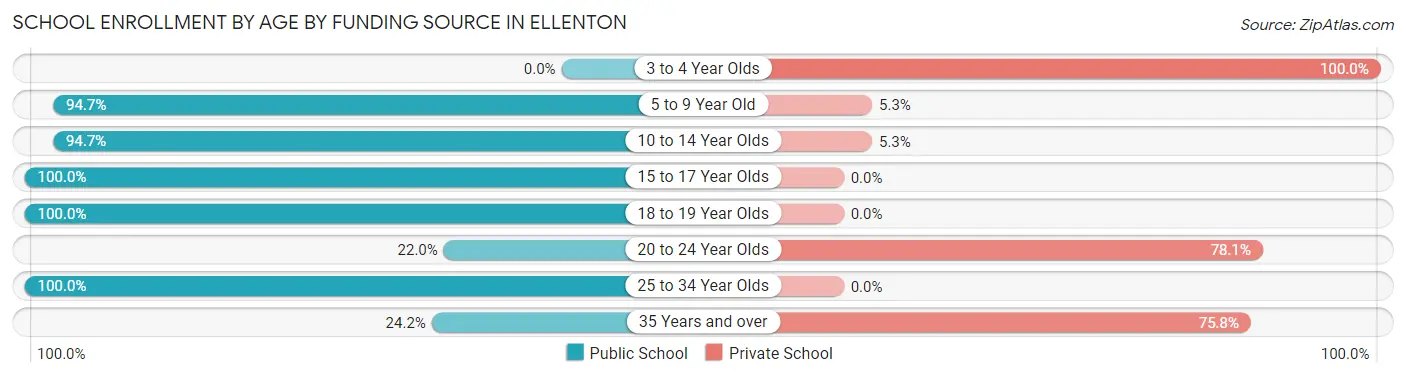
| Age Bracket | Public School | Private School |
| 3 to 4 Year Olds | 0 (0.0%) | 22 (100.0%) |
| 5 to 9 Year Old | 411 (94.7%) | 23 (5.3%) |
| 10 to 14 Year Olds | 287 (94.7%) | 16 (5.3%) |
| 15 to 17 Year Olds | 285 (100.0%) | 0 (0.0%) |
| 18 to 19 Year Olds | 85 (100.0%) | 0 (0.0%) |
| 20 to 24 Year Olds | 45 (22.0%) | 160 (78.0%) |
| 25 to 34 Year Olds | 31 (100.0%) | 0 (0.0%) |
| 35 Years and over | 22 (24.2%) | 69 (75.8%) |
| Total | 1,166 (80.1%) | 290 (19.9%) |
Educational Attainment by Field of Study in Ellenton
Science & technology (151 | 31.1%), education (133 | 27.4%), arts & humanities (68 | 14.0%), literature & languages (57 | 11.7%), and engineering (30 | 6.2%) are the most common fields of study among 486 individuals in Ellenton who have obtained a bachelor's degree or higher.
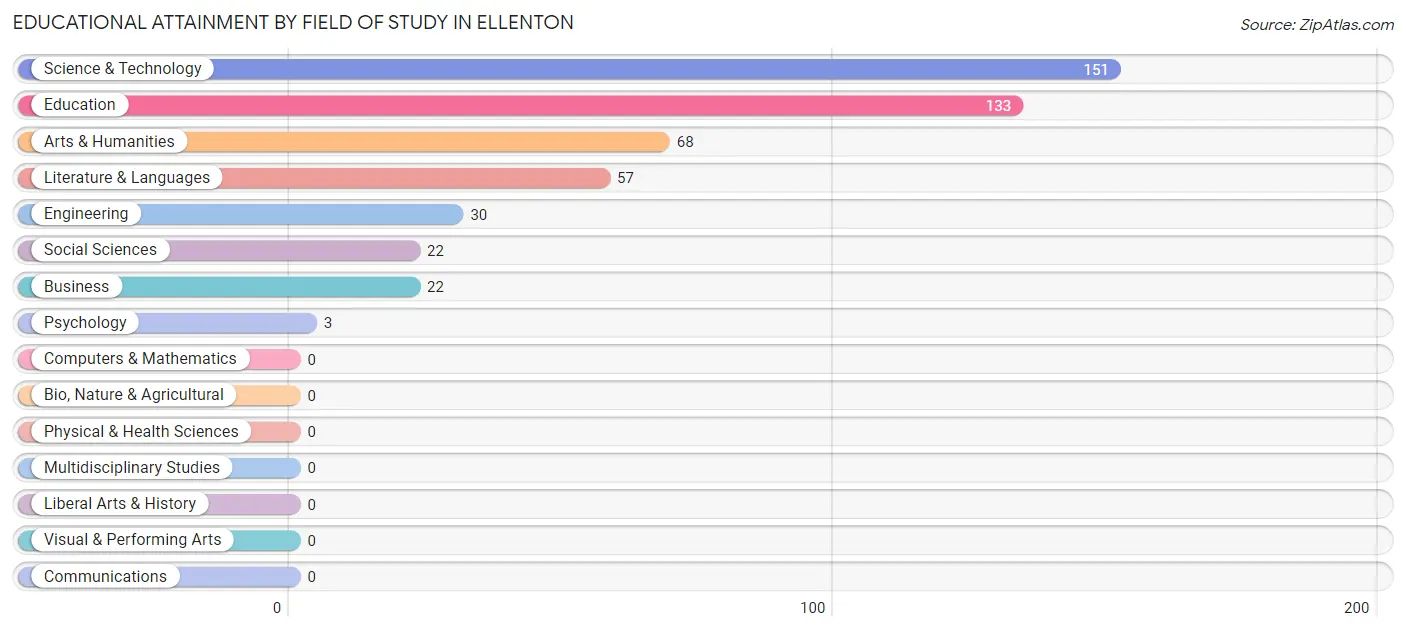
| Field of Study | # Graduates | % Graduates |
| Computers & Mathematics | 0 | 0.0% |
| Bio, Nature & Agricultural | 0 | 0.0% |
| Physical & Health Sciences | 0 | 0.0% |
| Psychology | 3 | 0.6% |
| Social Sciences | 22 | 4.5% |
| Engineering | 30 | 6.2% |
| Multidisciplinary Studies | 0 | 0.0% |
| Science & Technology | 151 | 31.1% |
| Business | 22 | 4.5% |
| Education | 133 | 27.4% |
| Literature & Languages | 57 | 11.7% |
| Liberal Arts & History | 0 | 0.0% |
| Visual & Performing Arts | 0 | 0.0% |
| Communications | 0 | 0.0% |
| Arts & Humanities | 68 | 14.0% |
| Total | 486 | 100.0% |
Transportation & Commute in Ellenton
Vehicle Availability by Sex in Ellenton
The most prevalent vehicle ownership categories in Ellenton are males with 2 vehicles (701, accounting for 71.2%) and females with 2 vehicles (742, making up 61.4%).
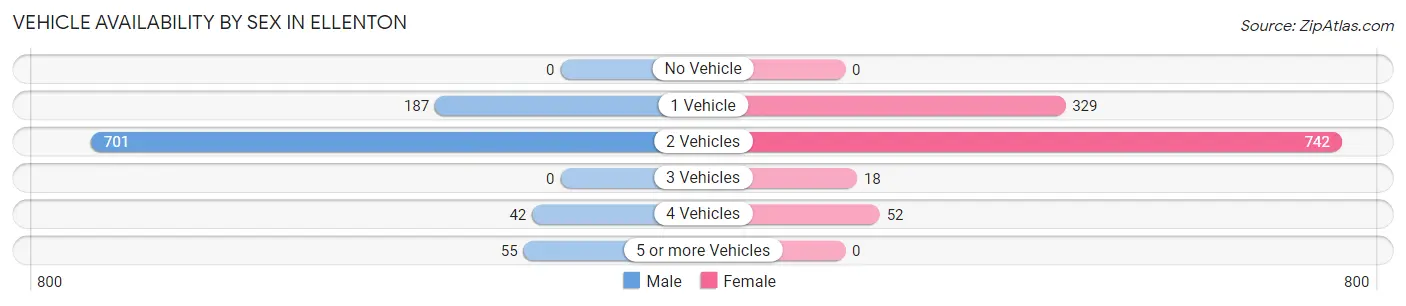
| Vehicles Available | Male | Female |
| No Vehicle | 0 (0.0%) | 0 (0.0%) |
| 1 Vehicle | 187 (19.0%) | 329 (28.8%) |
| 2 Vehicles | 701 (71.2%) | 742 (65.0%) |
| 3 Vehicles | 0 (0.0%) | 18 (1.6%) |
| 4 Vehicles | 42 (4.3%) | 52 (4.6%) |
| 5 or more Vehicles | 55 (5.6%) | 0 (0.0%) |
| Total | 985 (100.0%) | 1,141 (100.0%) |
Commute Time in Ellenton
The most frequently occuring commute durations in Ellenton are 10 to 14 minutes (354 commuters, 18.8%), 30 to 34 minutes (345 commuters, 18.4%), and 5 to 9 minutes (226 commuters, 12.0%).
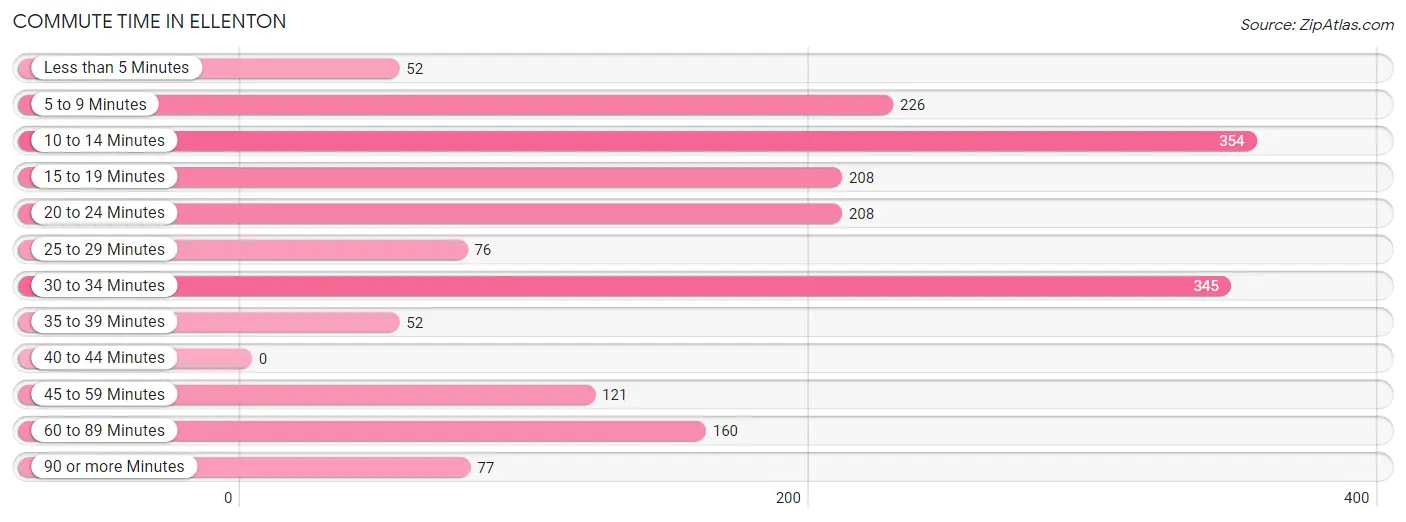
| Commute Time | # Commuters | % Commuters |
| Less than 5 Minutes | 52 | 2.8% |
| 5 to 9 Minutes | 226 | 12.0% |
| 10 to 14 Minutes | 354 | 18.8% |
| 15 to 19 Minutes | 208 | 11.1% |
| 20 to 24 Minutes | 208 | 11.1% |
| 25 to 29 Minutes | 76 | 4.0% |
| 30 to 34 Minutes | 345 | 18.4% |
| 35 to 39 Minutes | 52 | 2.8% |
| 40 to 44 Minutes | 0 | 0.0% |
| 45 to 59 Minutes | 121 | 6.4% |
| 60 to 89 Minutes | 160 | 8.5% |
| 90 or more Minutes | 77 | 4.1% |
Commute Time by Sex in Ellenton
The most common commute times in Ellenton are 10 to 14 minutes (200 commuters, 22.6%) for males and 30 to 34 minutes (297 commuters, 29.8%) for females.
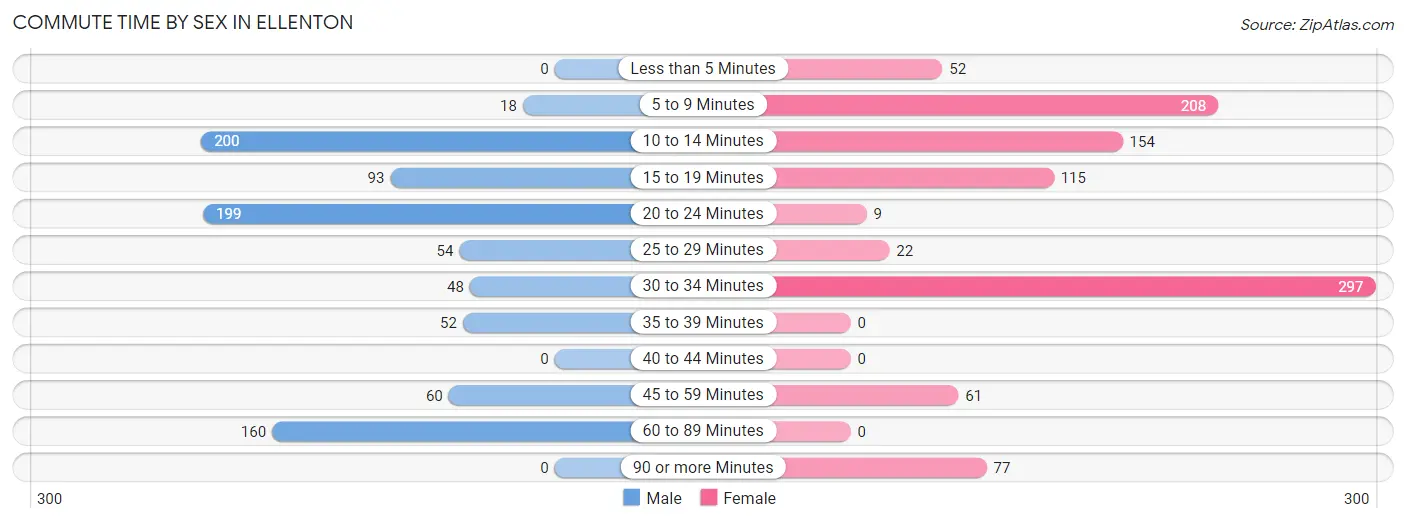
| Commute Time | Male | Female |
| Less than 5 Minutes | 0 (0.0%) | 52 (5.2%) |
| 5 to 9 Minutes | 18 (2.0%) | 208 (20.9%) |
| 10 to 14 Minutes | 200 (22.6%) | 154 (15.5%) |
| 15 to 19 Minutes | 93 (10.5%) | 115 (11.6%) |
| 20 to 24 Minutes | 199 (22.5%) | 9 (0.9%) |
| 25 to 29 Minutes | 54 (6.1%) | 22 (2.2%) |
| 30 to 34 Minutes | 48 (5.4%) | 297 (29.8%) |
| 35 to 39 Minutes | 52 (5.9%) | 0 (0.0%) |
| 40 to 44 Minutes | 0 (0.0%) | 0 (0.0%) |
| 45 to 59 Minutes | 60 (6.8%) | 61 (6.1%) |
| 60 to 89 Minutes | 160 (18.1%) | 0 (0.0%) |
| 90 or more Minutes | 0 (0.0%) | 77 (7.7%) |
Time of Departure to Work by Sex in Ellenton
The most frequent times of departure to work in Ellenton are 8:30 AM to 8:59 AM (160, 18.1%) for males and 8:00 AM to 8:29 AM (195, 19.6%) for females.
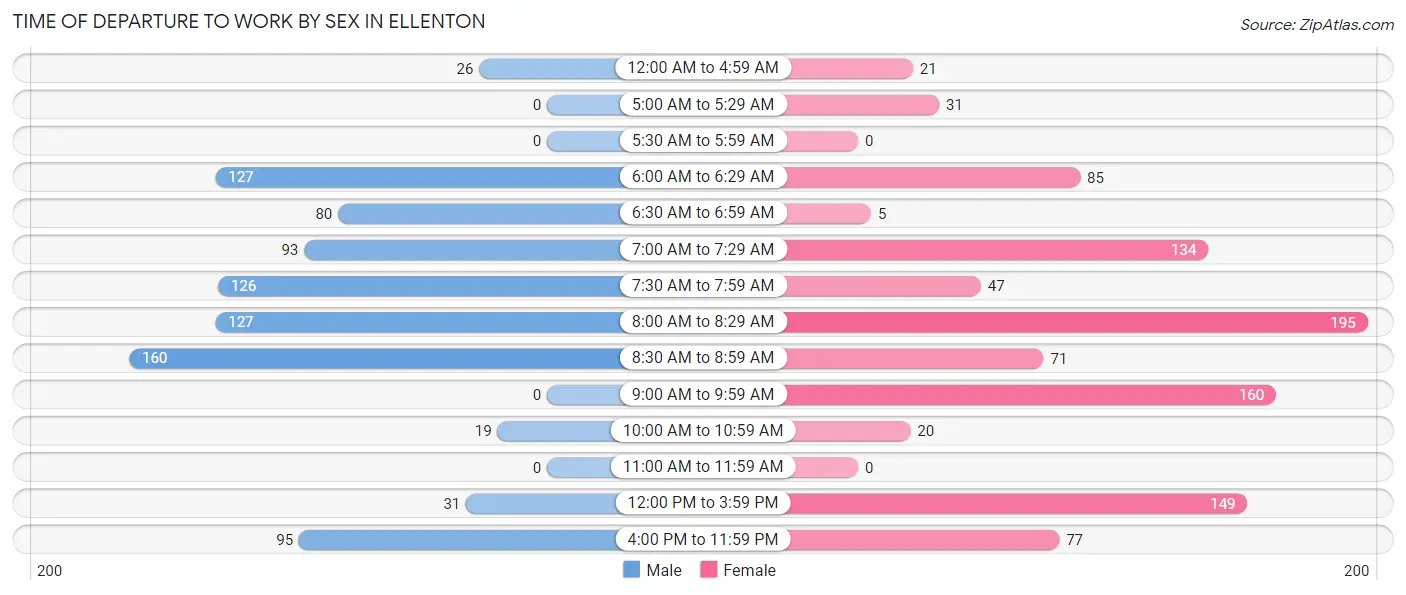
| Time of Departure | Male | Female |
| 12:00 AM to 4:59 AM | 26 (2.9%) | 21 (2.1%) |
| 5:00 AM to 5:29 AM | 0 (0.0%) | 31 (3.1%) |
| 5:30 AM to 5:59 AM | 0 (0.0%) | 0 (0.0%) |
| 6:00 AM to 6:29 AM | 127 (14.4%) | 85 (8.5%) |
| 6:30 AM to 6:59 AM | 80 (9.0%) | 5 (0.5%) |
| 7:00 AM to 7:29 AM | 93 (10.5%) | 134 (13.5%) |
| 7:30 AM to 7:59 AM | 126 (14.2%) | 47 (4.7%) |
| 8:00 AM to 8:29 AM | 127 (14.4%) | 195 (19.6%) |
| 8:30 AM to 8:59 AM | 160 (18.1%) | 71 (7.1%) |
| 9:00 AM to 9:59 AM | 0 (0.0%) | 160 (16.1%) |
| 10:00 AM to 10:59 AM | 19 (2.1%) | 20 (2.0%) |
| 11:00 AM to 11:59 AM | 0 (0.0%) | 0 (0.0%) |
| 12:00 PM to 3:59 PM | 31 (3.5%) | 149 (15.0%) |
| 4:00 PM to 11:59 PM | 95 (10.7%) | 77 (7.7%) |
| Total | 884 (100.0%) | 995 (100.0%) |
Housing Occupancy in Ellenton
Occupancy by Ownership in Ellenton
Of the total 1,881 dwellings in Ellenton, owner-occupied units account for 1,300 (69.1%), while renter-occupied units make up 581 (30.9%).
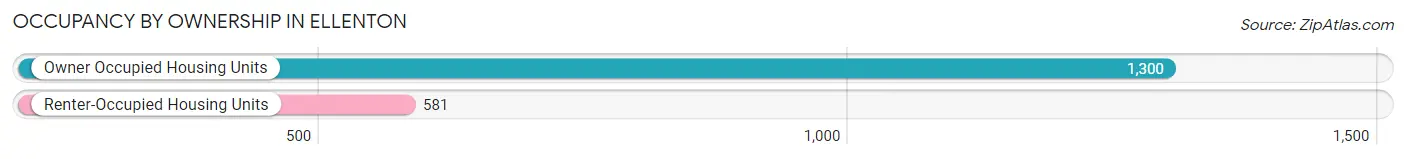
| Occupancy | # Housing Units | % Housing Units |
| Owner Occupied Housing Units | 1,300 | 69.1% |
| Renter-Occupied Housing Units | 581 | 30.9% |
| Total Occupied Housing Units | 1,881 | 100.0% |
Occupancy by Household Size in Ellenton
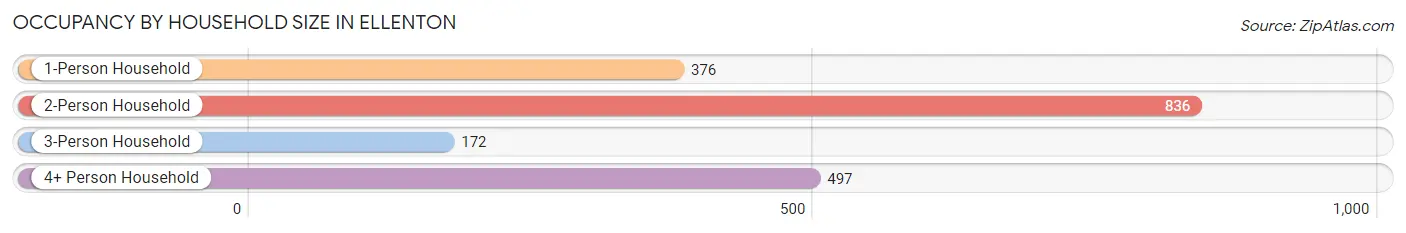
| Household Size | # Housing Units | % Housing Units |
| 1-Person Household | 376 | 20.0% |
| 2-Person Household | 836 | 44.4% |
| 3-Person Household | 172 | 9.1% |
| 4+ Person Household | 497 | 26.4% |
| Total Housing Units | 1,881 | 100.0% |
Occupancy by Ownership by Household Size in Ellenton
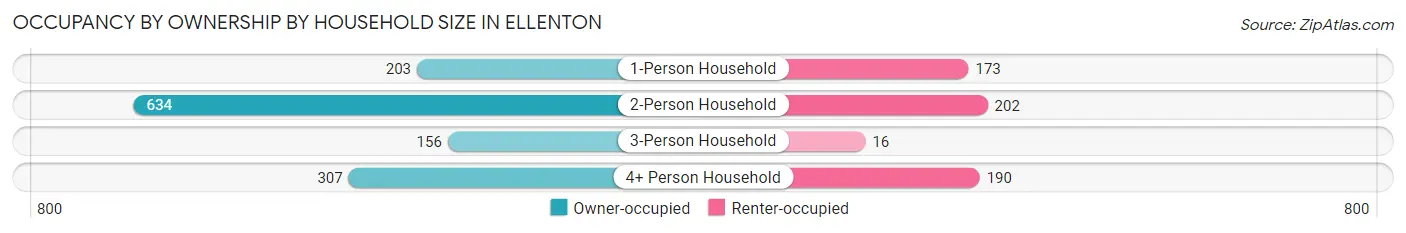
| Household Size | Owner-occupied | Renter-occupied |
| 1-Person Household | 203 (54.0%) | 173 (46.0%) |
| 2-Person Household | 634 (75.8%) | 202 (24.2%) |
| 3-Person Household | 156 (90.7%) | 16 (9.3%) |
| 4+ Person Household | 307 (61.8%) | 190 (38.2%) |
| Total Housing Units | 1,300 (69.1%) | 581 (30.9%) |
Occupancy by Educational Attainment in Ellenton
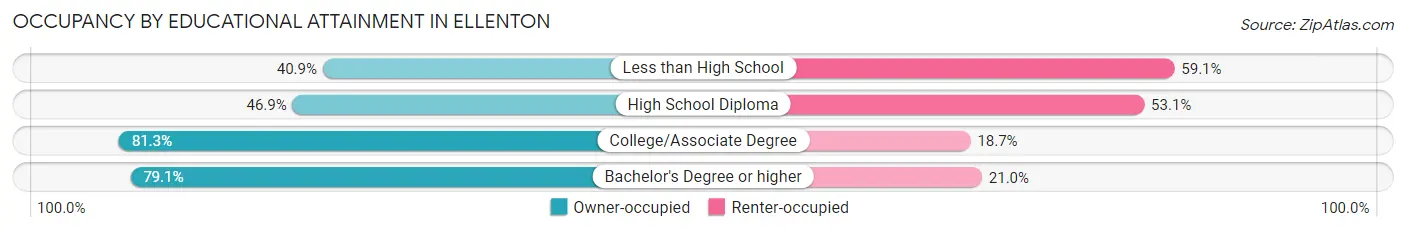
| Household Size | Owner-occupied | Renter-occupied |
| Less than High School | 65 (40.9%) | 94 (59.1%) |
| High School Diploma | 217 (46.9%) | 246 (53.1%) |
| College/Associate Degree | 818 (81.3%) | 188 (18.7%) |
| Bachelor's Degree or higher | 200 (79.0%) | 53 (20.9%) |
Occupancy by Age of Householder in Ellenton
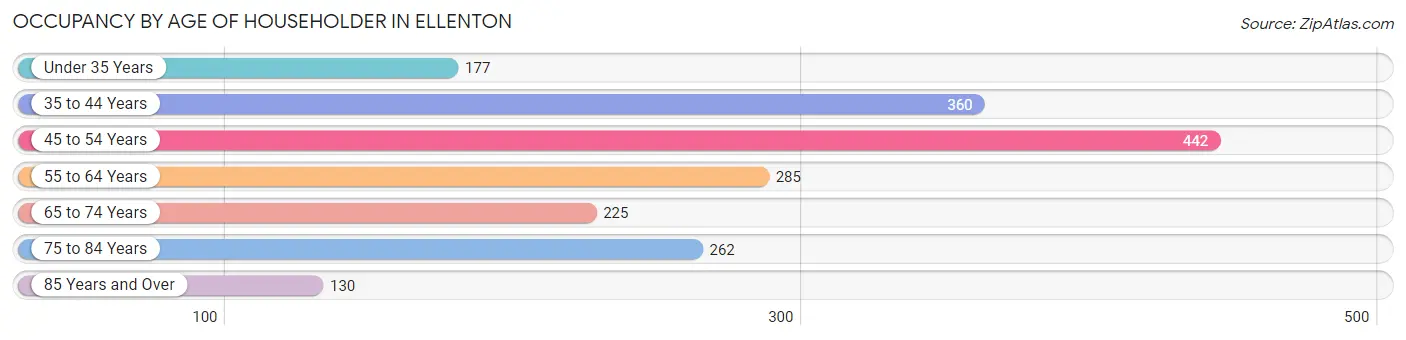
| Age Bracket | # Households | % Households |
| Under 35 Years | 177 | 9.4% |
| 35 to 44 Years | 360 | 19.1% |
| 45 to 54 Years | 442 | 23.5% |
| 55 to 64 Years | 285 | 15.1% |
| 65 to 74 Years | 225 | 12.0% |
| 75 to 84 Years | 262 | 13.9% |
| 85 Years and Over | 130 | 6.9% |
| Total | 1,881 | 100.0% |
Housing Finances in Ellenton
Median Income by Occupancy in Ellenton
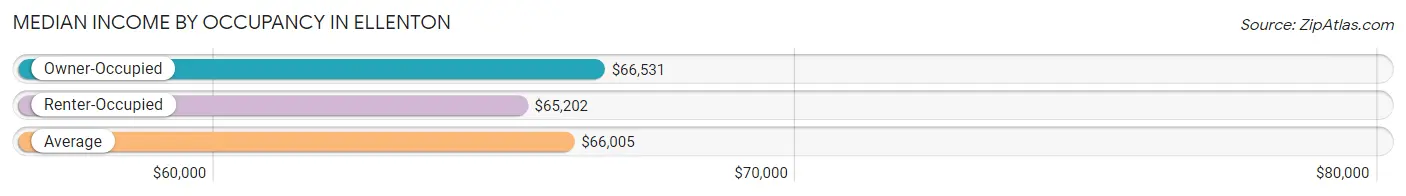
| Occupancy Type | # Households | Median Income |
| Owner-Occupied | 1,300 (69.1%) | $66,531 |
| Renter-Occupied | 581 (30.9%) | $65,202 |
| Average | 1,881 (100.0%) | $66,005 |
Occupancy by Householder Income Bracket in Ellenton
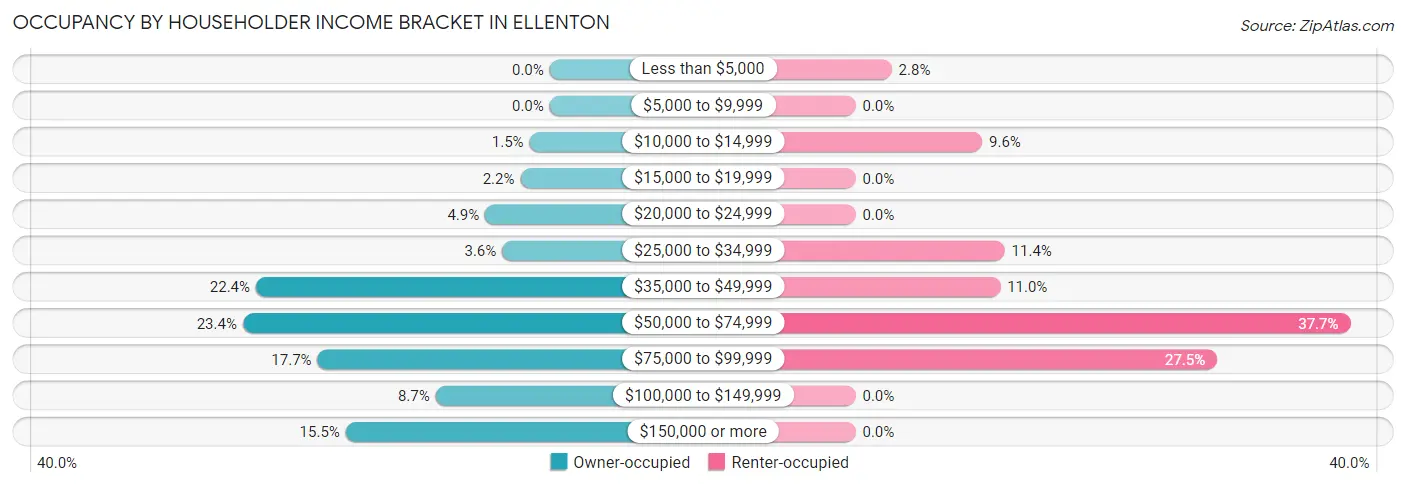
| Income Bracket | Owner-occupied | Renter-occupied |
| Less than $5,000 | 0 (0.0%) | 16 (2.8%) |
| $5,000 to $9,999 | 0 (0.0%) | 0 (0.0%) |
| $10,000 to $14,999 | 20 (1.5%) | 56 (9.6%) |
| $15,000 to $19,999 | 29 (2.2%) | 0 (0.0%) |
| $20,000 to $24,999 | 64 (4.9%) | 0 (0.0%) |
| $25,000 to $34,999 | 47 (3.6%) | 66 (11.4%) |
| $35,000 to $49,999 | 291 (22.4%) | 64 (11.0%) |
| $50,000 to $74,999 | 304 (23.4%) | 219 (37.7%) |
| $75,000 to $99,999 | 230 (17.7%) | 160 (27.5%) |
| $100,000 to $149,999 | 113 (8.7%) | 0 (0.0%) |
| $150,000 or more | 202 (15.5%) | 0 (0.0%) |
| Total | 1,300 (100.0%) | 581 (100.0%) |
Monthly Housing Cost Tiers in Ellenton
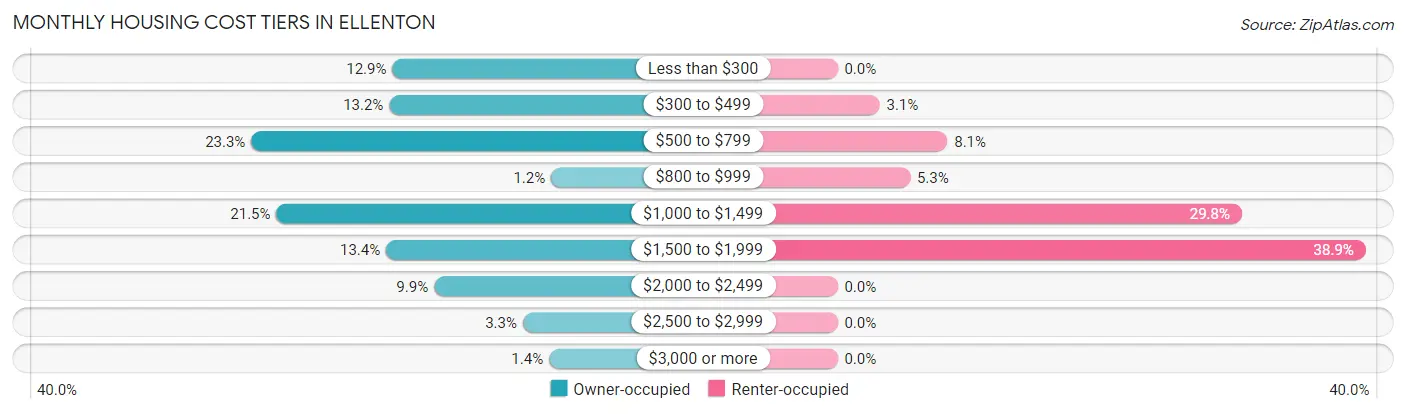
| Monthly Cost | Owner-occupied | Renter-occupied |
| Less than $300 | 168 (12.9%) | 0 (0.0%) |
| $300 to $499 | 171 (13.2%) | 18 (3.1%) |
| $500 to $799 | 303 (23.3%) | 47 (8.1%) |
| $800 to $999 | 16 (1.2%) | 31 (5.3%) |
| $1,000 to $1,499 | 279 (21.5%) | 173 (29.8%) |
| $1,500 to $1,999 | 174 (13.4%) | 226 (38.9%) |
| $2,000 to $2,499 | 128 (9.9%) | 0 (0.0%) |
| $2,500 to $2,999 | 43 (3.3%) | 0 (0.0%) |
| $3,000 or more | 18 (1.4%) | 0 (0.0%) |
| Total | 1,300 (100.0%) | 581 (100.0%) |
Physical Housing Characteristics in Ellenton
Housing Structures in Ellenton
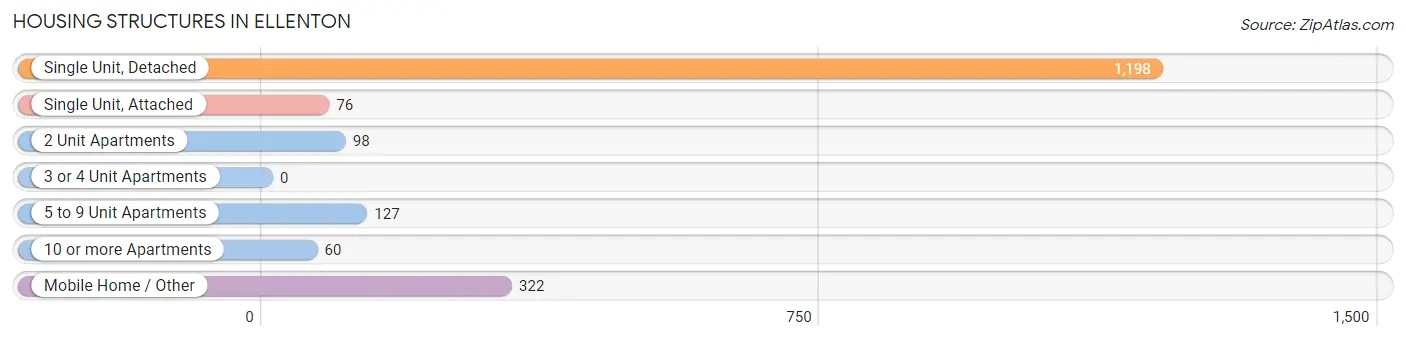
| Structure Type | # Housing Units | % Housing Units |
| Single Unit, Detached | 1,198 | 63.7% |
| Single Unit, Attached | 76 | 4.0% |
| 2 Unit Apartments | 98 | 5.2% |
| 3 or 4 Unit Apartments | 0 | 0.0% |
| 5 to 9 Unit Apartments | 127 | 6.8% |
| 10 or more Apartments | 60 | 3.2% |
| Mobile Home / Other | 322 | 17.1% |
| Total | 1,881 | 100.0% |
Housing Structures by Occupancy in Ellenton
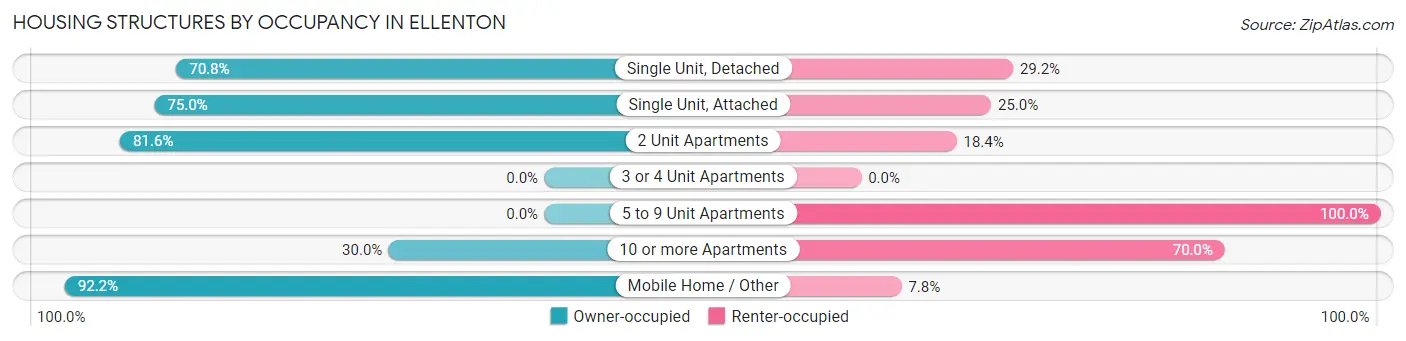
| Structure Type | Owner-occupied | Renter-occupied |
| Single Unit, Detached | 848 (70.8%) | 350 (29.2%) |
| Single Unit, Attached | 57 (75.0%) | 19 (25.0%) |
| 2 Unit Apartments | 80 (81.6%) | 18 (18.4%) |
| 3 or 4 Unit Apartments | 0 (0.0%) | 0 (0.0%) |
| 5 to 9 Unit Apartments | 0 (0.0%) | 127 (100.0%) |
| 10 or more Apartments | 18 (30.0%) | 42 (70.0%) |
| Mobile Home / Other | 297 (92.2%) | 25 (7.8%) |
| Total | 1,300 (69.1%) | 581 (30.9%) |
Housing Structures by Number of Rooms in Ellenton
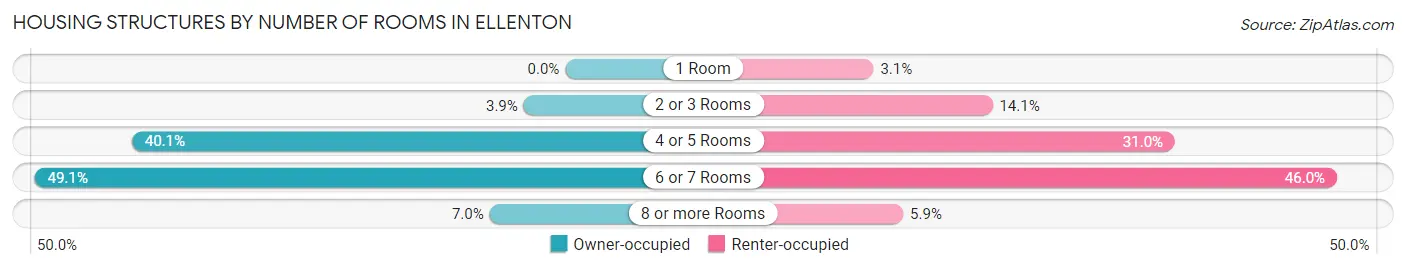
| Number of Rooms | Owner-occupied | Renter-occupied |
| 1 Room | 0 (0.0%) | 18 (3.1%) |
| 2 or 3 Rooms | 50 (3.8%) | 82 (14.1%) |
| 4 or 5 Rooms | 521 (40.1%) | 180 (31.0%) |
| 6 or 7 Rooms | 638 (49.1%) | 267 (46.0%) |
| 8 or more Rooms | 91 (7.0%) | 34 (5.9%) |
| Total | 1,300 (100.0%) | 581 (100.0%) |
Housing Structure by Heating Type in Ellenton
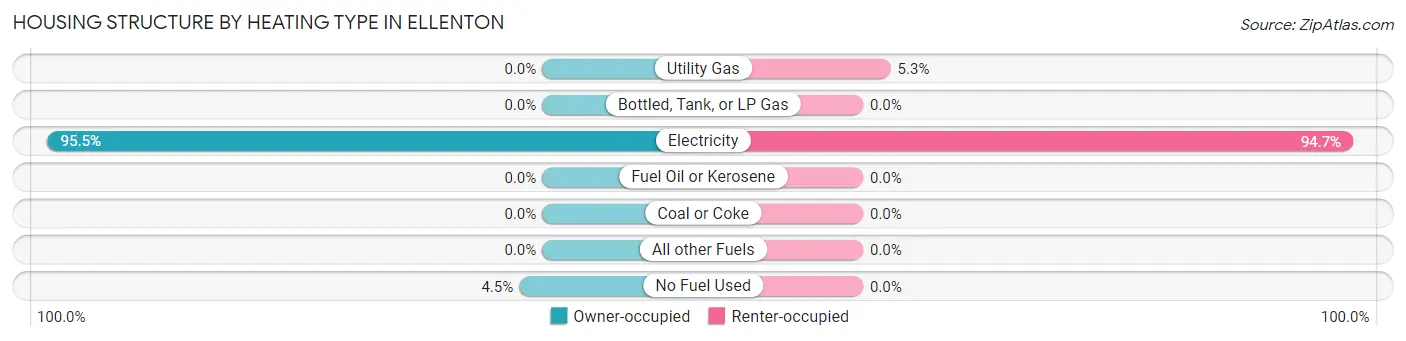
| Heating Type | Owner-occupied | Renter-occupied |
| Utility Gas | 0 (0.0%) | 31 (5.3%) |
| Bottled, Tank, or LP Gas | 0 (0.0%) | 0 (0.0%) |
| Electricity | 1,242 (95.5%) | 550 (94.7%) |
| Fuel Oil or Kerosene | 0 (0.0%) | 0 (0.0%) |
| Coal or Coke | 0 (0.0%) | 0 (0.0%) |
| All other Fuels | 0 (0.0%) | 0 (0.0%) |
| No Fuel Used | 58 (4.5%) | 0 (0.0%) |
| Total | 1,300 (100.0%) | 581 (100.0%) |
Household Vehicle Usage in Ellenton
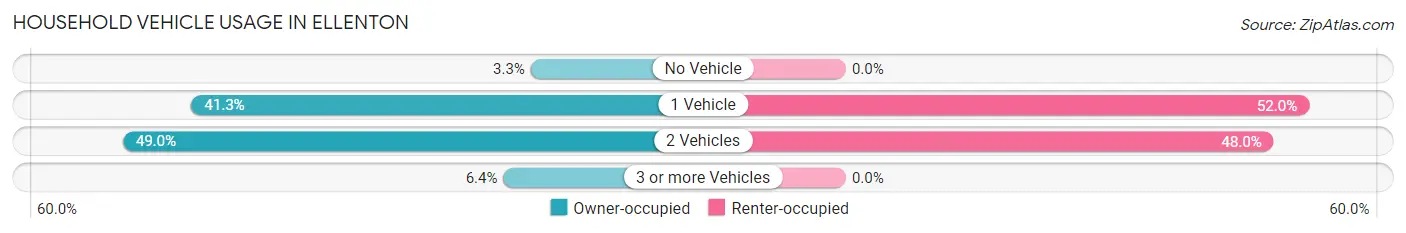
| Vehicles per Household | Owner-occupied | Renter-occupied |
| No Vehicle | 43 (3.3%) | 0 (0.0%) |
| 1 Vehicle | 537 (41.3%) | 302 (52.0%) |
| 2 Vehicles | 637 (49.0%) | 279 (48.0%) |
| 3 or more Vehicles | 83 (6.4%) | 0 (0.0%) |
| Total | 1,300 (100.0%) | 581 (100.0%) |
Real Estate & Mortgages in Ellenton
Real Estate and Mortgage Overview in Ellenton
| Characteristic | Without Mortgage | With Mortgage |
| Housing Units | 561 | 739 |
| Median Property Value | $112,700 | $244,600 |
| Median Household Income | $58,850 | $180 |
| Monthly Housing Costs | $364 | $18 |
| Real Estate Taxes | $1,024 | $0 |
Property Value by Mortgage Status in Ellenton
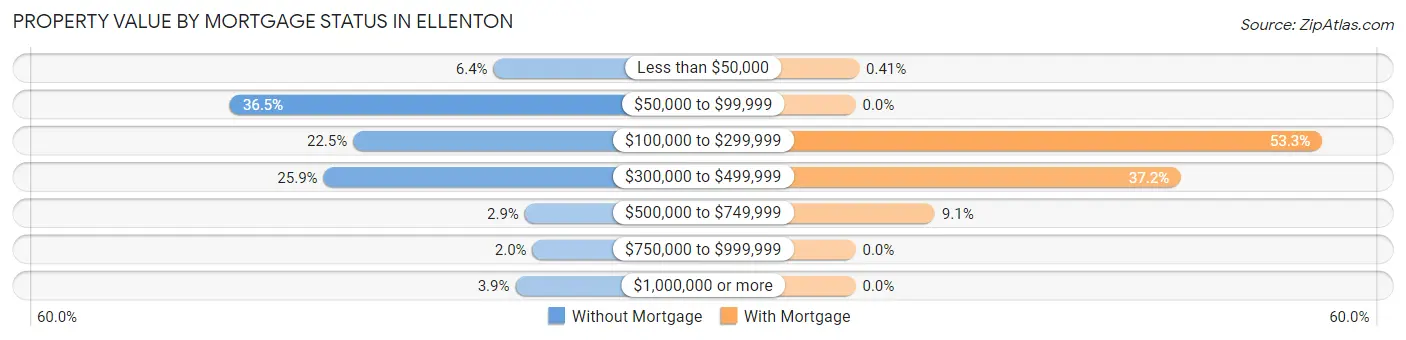
| Property Value | Without Mortgage | With Mortgage |
| Less than $50,000 | 36 (6.4%) | 3 (0.4%) |
| $50,000 to $99,999 | 205 (36.5%) | 0 (0.0%) |
| $100,000 to $299,999 | 126 (22.5%) | 394 (53.3%) |
| $300,000 to $499,999 | 145 (25.9%) | 275 (37.2%) |
| $500,000 to $749,999 | 16 (2.9%) | 67 (9.1%) |
| $750,000 to $999,999 | 11 (2.0%) | 0 (0.0%) |
| $1,000,000 or more | 22 (3.9%) | 0 (0.0%) |
| Total | 561 (100.0%) | 739 (100.0%) |
Household Income by Mortgage Status in Ellenton
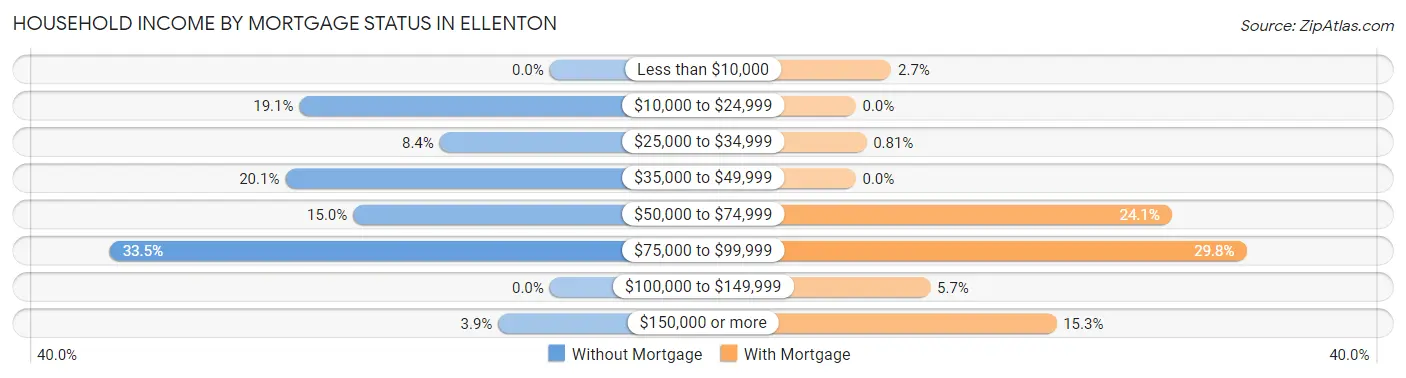
| Household Income | Without Mortgage | With Mortgage |
| Less than $10,000 | 0 (0.0%) | 20 (2.7%) |
| $10,000 to $24,999 | 107 (19.1%) | 0 (0.0%) |
| $25,000 to $34,999 | 47 (8.4%) | 6 (0.8%) |
| $35,000 to $49,999 | 113 (20.1%) | 0 (0.0%) |
| $50,000 to $74,999 | 84 (15.0%) | 178 (24.1%) |
| $75,000 to $99,999 | 188 (33.5%) | 220 (29.8%) |
| $100,000 to $149,999 | 0 (0.0%) | 42 (5.7%) |
| $150,000 or more | 22 (3.9%) | 113 (15.3%) |
| Total | 561 (100.0%) | 739 (100.0%) |
Property Value to Household Income Ratio in Ellenton
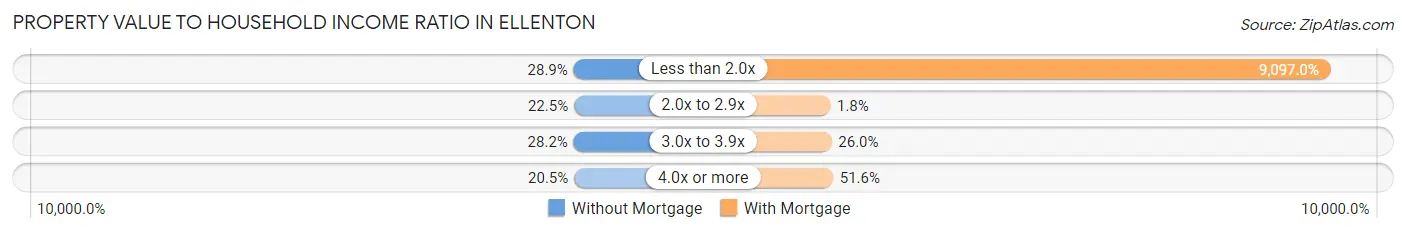
| Value-to-Income Ratio | Without Mortgage | With Mortgage |
| Less than 2.0x | 162 (28.9%) | 67,227 (9,097.0%) |
| 2.0x to 2.9x | 126 (22.5%) | 13 (1.8%) |
| 3.0x to 3.9x | 158 (28.2%) | 192 (26.0%) |
| 4.0x or more | 115 (20.5%) | 381 (51.6%) |
| Total | 561 (100.0%) | 739 (100.0%) |
Real Estate Taxes by Mortgage Status in Ellenton
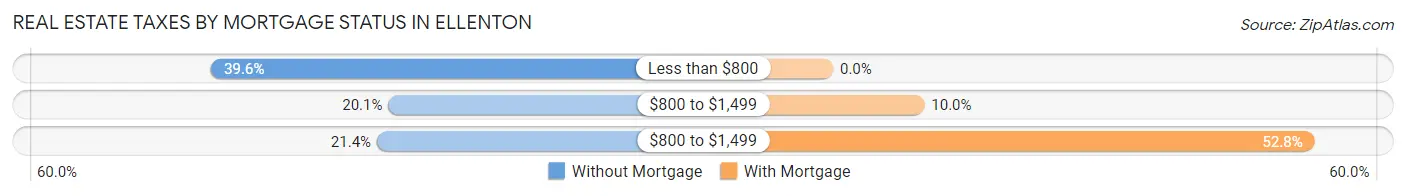
| Property Taxes | Without Mortgage | With Mortgage |
| Less than $800 | 222 (39.6%) | 0 (0.0%) |
| $800 to $1,499 | 113 (20.1%) | 74 (10.0%) |
| $800 to $1,499 | 120 (21.4%) | 390 (52.8%) |
| Total | 561 (100.0%) | 739 (100.0%) |
Health & Disability in Ellenton
Health Insurance Coverage by Age in Ellenton
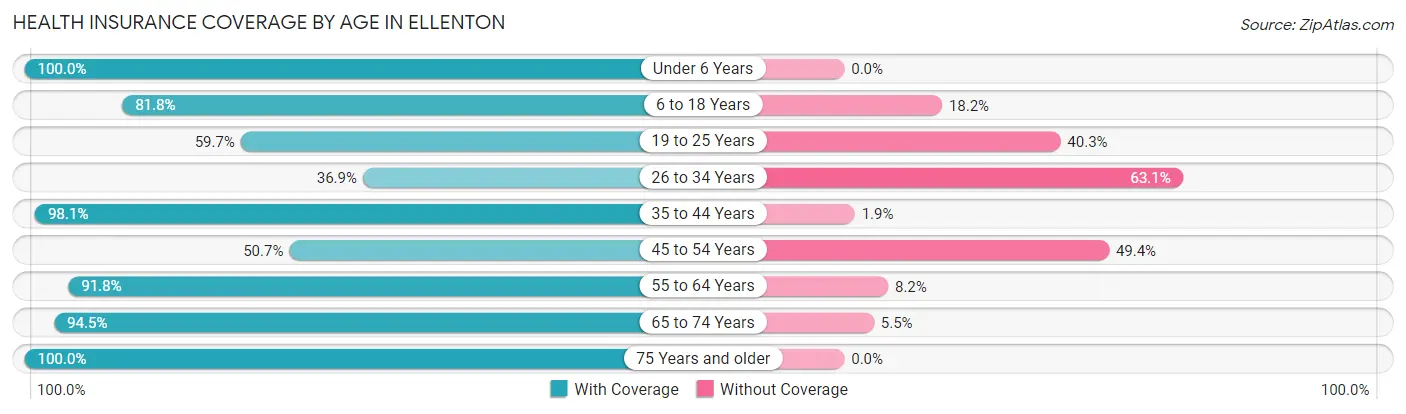
| Age Bracket | With Coverage | Without Coverage |
| Under 6 Years | 197 (100.0%) | 0 (0.0%) |
| 6 to 18 Years | 849 (81.8%) | 189 (18.2%) |
| 19 to 25 Years | 237 (59.7%) | 160 (40.3%) |
| 26 to 34 Years | 113 (36.9%) | 193 (63.1%) |
| 35 to 44 Years | 657 (98.1%) | 13 (1.9%) |
| 45 to 54 Years | 390 (50.6%) | 380 (49.3%) |
| 55 to 64 Years | 484 (91.8%) | 43 (8.2%) |
| 65 to 74 Years | 754 (94.5%) | 44 (5.5%) |
| 75 Years and older | 681 (100.0%) | 0 (0.0%) |
| Total | 4,362 (81.0%) | 1,022 (19.0%) |
Health Insurance Coverage by Citizenship Status in Ellenton
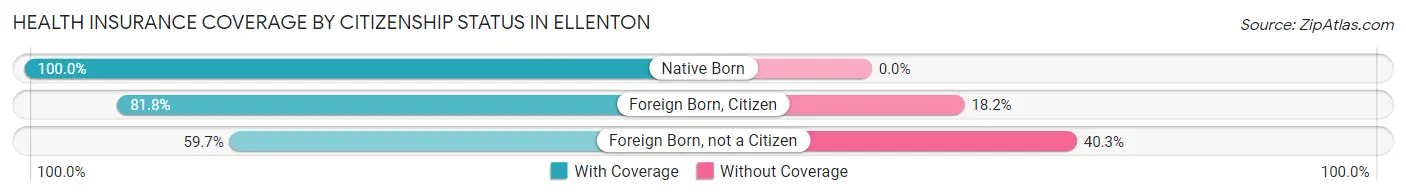
| Citizenship Status | With Coverage | Without Coverage |
| Native Born | 197 (100.0%) | 0 (0.0%) |
| Foreign Born, Citizen | 849 (81.8%) | 189 (18.2%) |
| Foreign Born, not a Citizen | 237 (59.7%) | 160 (40.3%) |
Health Insurance Coverage by Household Income in Ellenton
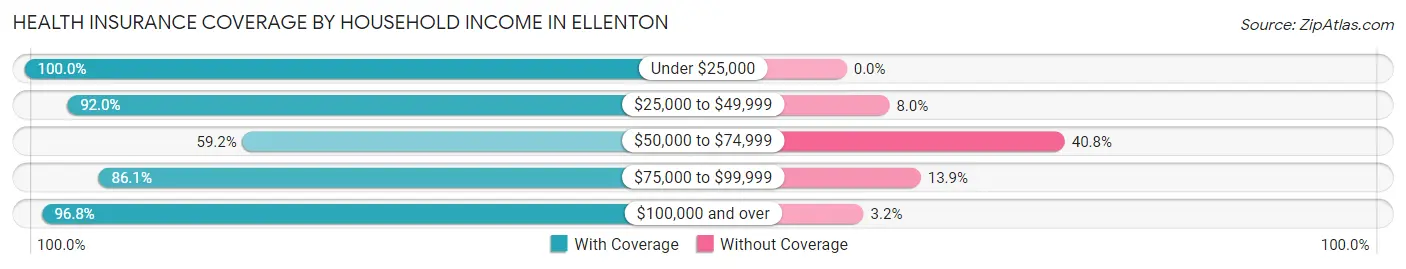
| Household Income | With Coverage | Without Coverage |
| Under $25,000 | 300 (100.0%) | 0 (0.0%) |
| $25,000 to $49,999 | 1,152 (92.0%) | 100 (8.0%) |
| $50,000 to $74,999 | 1,095 (59.2%) | 756 (40.8%) |
| $75,000 to $99,999 | 833 (86.1%) | 134 (13.9%) |
| $100,000 and over | 982 (96.8%) | 32 (3.2%) |
Public vs Private Health Insurance Coverage by Age in Ellenton
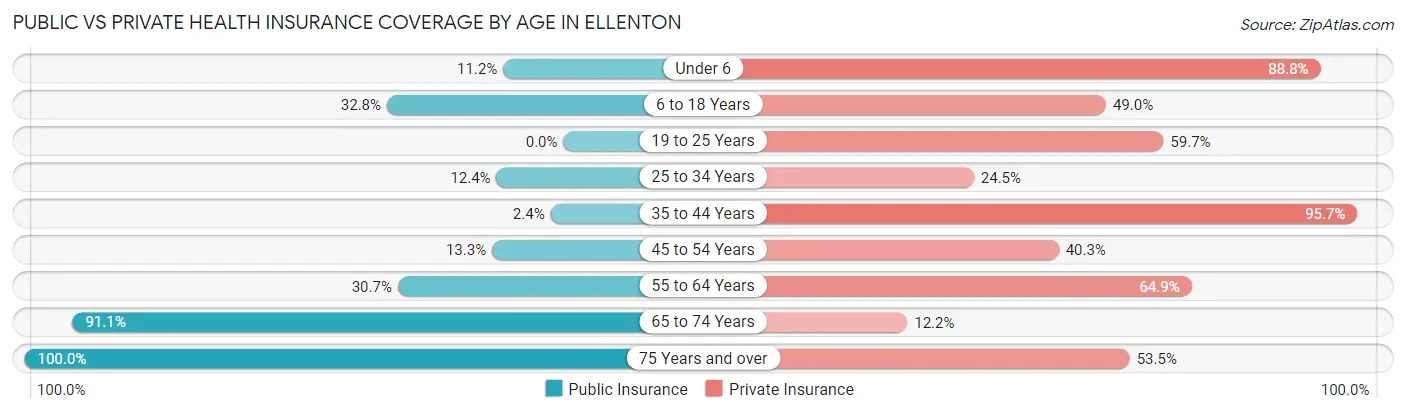
| Age Bracket | Public Insurance | Private Insurance |
| Under 6 | 22 (11.2%) | 175 (88.8%) |
| 6 to 18 Years | 340 (32.8%) | 509 (49.0%) |
| 19 to 25 Years | 0 (0.0%) | 237 (59.7%) |
| 25 to 34 Years | 38 (12.4%) | 75 (24.5%) |
| 35 to 44 Years | 16 (2.4%) | 641 (95.7%) |
| 45 to 54 Years | 102 (13.3%) | 310 (40.3%) |
| 55 to 64 Years | 162 (30.7%) | 342 (64.9%) |
| 65 to 74 Years | 727 (91.1%) | 97 (12.2%) |
| 75 Years and over | 681 (100.0%) | 364 (53.4%) |
| Total | 2,088 (38.8%) | 2,750 (51.1%) |
Disability Status by Sex by Age in Ellenton
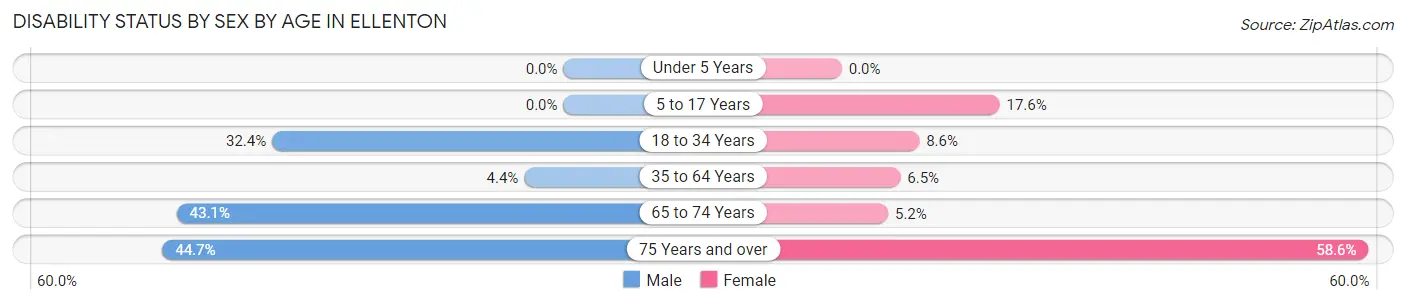
| Age Bracket | Male | Female |
| Under 5 Years | 0 (0.0%) | 0 (0.0%) |
| 5 to 17 Years | 0 (0.0%) | 91 (17.6%) |
| 18 to 34 Years | 85 (32.4%) | 38 (8.6%) |
| 35 to 64 Years | 35 (4.4%) | 76 (6.5%) |
| 65 to 74 Years | 118 (43.1%) | 27 (5.1%) |
| 75 Years and over | 113 (44.7%) | 251 (58.6%) |
Disability Class by Sex by Age in Ellenton
Disability Class: Hearing Difficulty
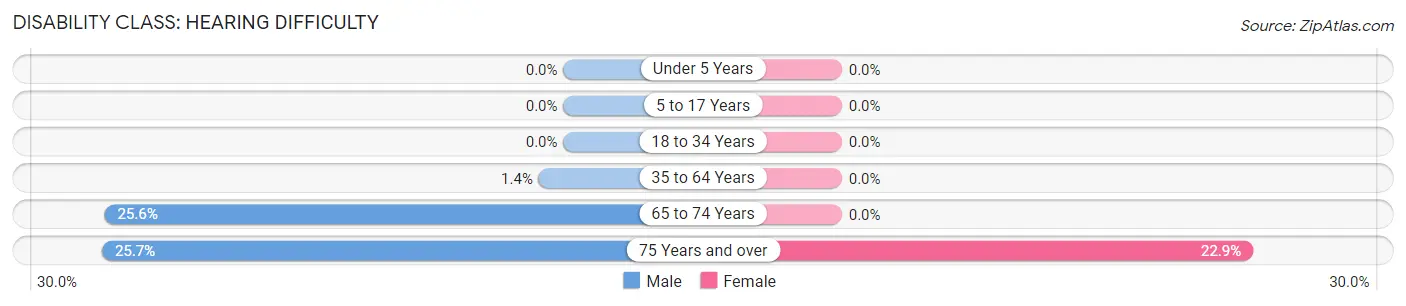
| Age Bracket | Male | Female |
| Under 5 Years | 0 (0.0%) | 0 (0.0%) |
| 5 to 17 Years | 0 (0.0%) | 0 (0.0%) |
| 18 to 34 Years | 0 (0.0%) | 0 (0.0%) |
| 35 to 64 Years | 11 (1.4%) | 0 (0.0%) |
| 65 to 74 Years | 70 (25.6%) | 0 (0.0%) |
| 75 Years and over | 65 (25.7%) | 98 (22.9%) |
Disability Class: Vision Difficulty
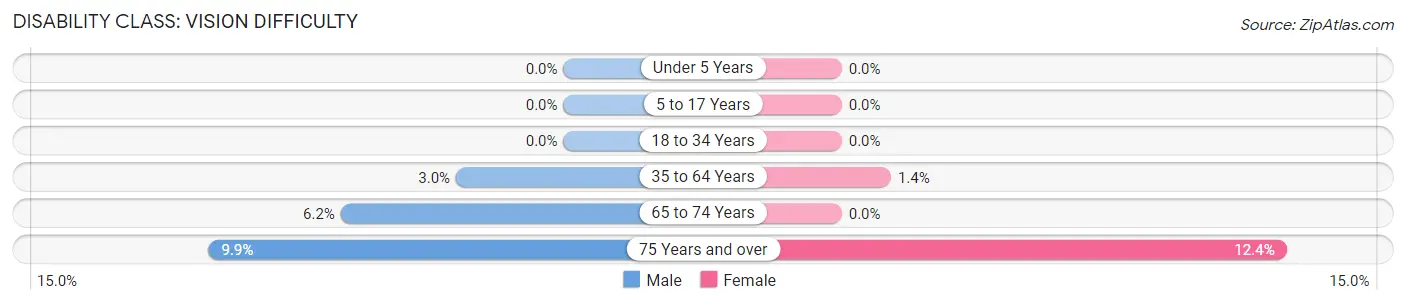
| Age Bracket | Male | Female |
| Under 5 Years | 0 (0.0%) | 0 (0.0%) |
| 5 to 17 Years | 0 (0.0%) | 0 (0.0%) |
| 18 to 34 Years | 0 (0.0%) | 0 (0.0%) |
| 35 to 64 Years | 24 (3.0%) | 16 (1.4%) |
| 65 to 74 Years | 17 (6.2%) | 0 (0.0%) |
| 75 Years and over | 25 (9.9%) | 53 (12.4%) |
Disability Class: Cognitive Difficulty
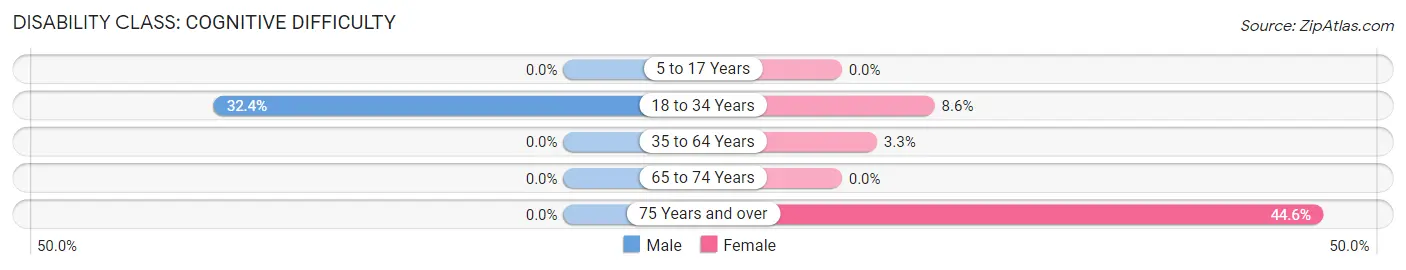
| Age Bracket | Male | Female |
| 5 to 17 Years | 0 (0.0%) | 0 (0.0%) |
| 18 to 34 Years | 85 (32.4%) | 38 (8.6%) |
| 35 to 64 Years | 0 (0.0%) | 38 (3.3%) |
| 65 to 74 Years | 0 (0.0%) | 0 (0.0%) |
| 75 Years and over | 0 (0.0%) | 191 (44.6%) |
Disability Class: Ambulatory Difficulty
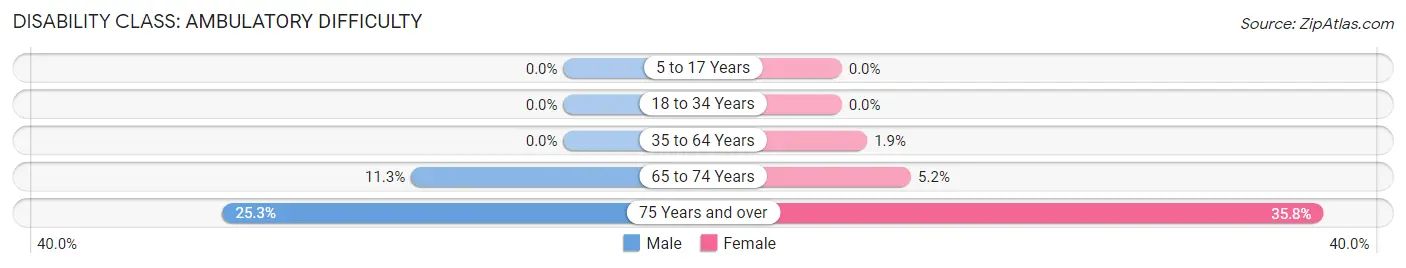
| Age Bracket | Male | Female |
| 5 to 17 Years | 0 (0.0%) | 0 (0.0%) |
| 18 to 34 Years | 0 (0.0%) | 0 (0.0%) |
| 35 to 64 Years | 0 (0.0%) | 22 (1.9%) |
| 65 to 74 Years | 31 (11.3%) | 27 (5.1%) |
| 75 Years and over | 64 (25.3%) | 153 (35.7%) |
Disability Class: Self-Care Difficulty
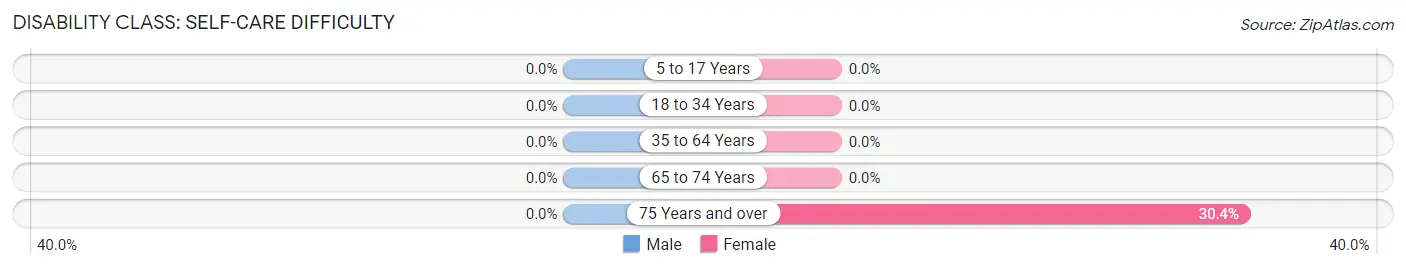
| Age Bracket | Male | Female |
| 5 to 17 Years | 0 (0.0%) | 0 (0.0%) |
| 18 to 34 Years | 0 (0.0%) | 0 (0.0%) |
| 35 to 64 Years | 0 (0.0%) | 0 (0.0%) |
| 65 to 74 Years | 0 (0.0%) | 0 (0.0%) |
| 75 Years and over | 0 (0.0%) | 130 (30.4%) |
Technology Access in Ellenton
Computing Device Access in Ellenton
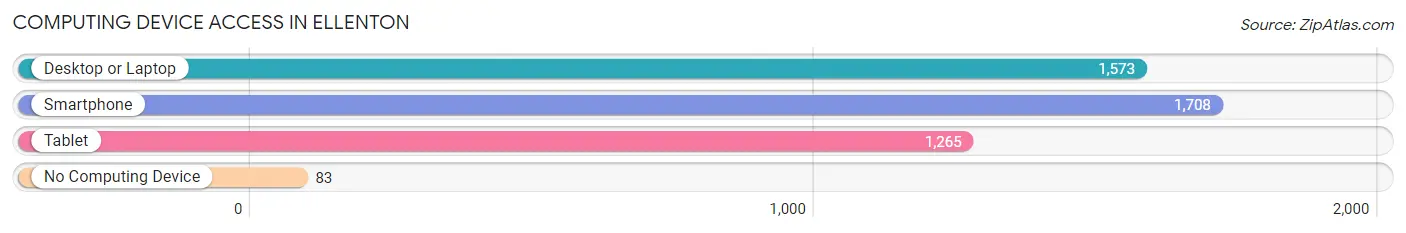
| Device Type | # Households | % Households |
| Desktop or Laptop | 1,573 | 83.6% |
| Smartphone | 1,708 | 90.8% |
| Tablet | 1,265 | 67.2% |
| No Computing Device | 83 | 4.4% |
| Total | 1,881 | 100.0% |
Internet Access in Ellenton
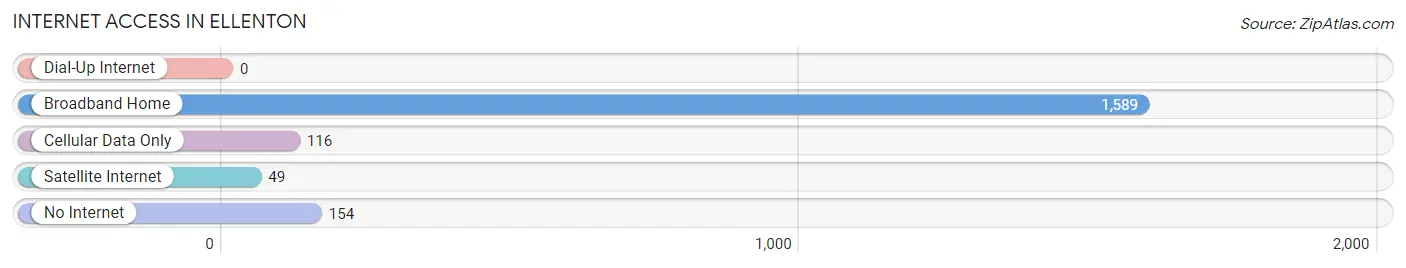
| Internet Type | # Households | % Households |
| Dial-Up Internet | 0 | 0.0% |
| Broadband Home | 1,589 | 84.5% |
| Cellular Data Only | 116 | 6.2% |
| Satellite Internet | 49 | 2.6% |
| No Internet | 154 | 8.2% |
| Total | 1,881 | 100.0% |
Ellenton Summary
Ellenton, Florida is a small town located in Manatee County, Florida. It is situated on the banks of the Manatee River, just south of Bradenton. The town has a population of approximately 2,500 people and is part of the Bradenton-Sarasota-Venice Metropolitan Statistical Area.
History
The area that is now Ellenton was first settled in the late 1800s by a group of settlers from Georgia. The town was originally known as “Ellenton Station” and was a stop on the Florida Central and Peninsular Railroad. The town was officially incorporated in 1887 and was named after the railroad station.
In the early 1900s, Ellenton was a thriving agricultural community. The town was known for its citrus groves, vegetable farms, and cattle ranches. The town also had a thriving lumber industry, with several sawmills located in the area.
In the 1950s, Ellenton began to experience a population boom as people moved to the area from other parts of the state. The town was also home to a number of tourist attractions, including a drive-in movie theater and a miniature golf course.
Geography
Ellenton is located in Manatee County, Florida. The town is situated on the banks of the Manatee River, just south of Bradenton. The town is located in the Tampa Bay Area and is part of the Bradenton-Sarasota-Venice Metropolitan Statistical Area.
The town has a total area of 2.2 square miles, all of which is land. The town is located at an elevation of 15 feet above sea level. The climate in Ellenton is classified as humid subtropical, with hot, humid summers and mild winters.
Economy
The economy of Ellenton is largely based on tourism and agriculture. The town is home to a number of tourist attractions, including a drive-in movie theater and a miniature golf course. The town is also home to several citrus groves, vegetable farms, and cattle ranches.
The town is also home to a number of manufacturing and industrial businesses. The town is home to a number of companies that produce furniture, electronics, and other products. The town is also home to a number of distribution centers for national and international companies.
Demographics
As of the 2010 census, there were 2,500 people living in Ellenton. The racial makeup of the town was 79.2% White, 15.2% African American, 0.4% Native American, 0.8% Asian, 0.1% Pacific Islander, and 4.3% from other races. Hispanic or Latino of any race were 8.4% of the population.
The median household income in Ellenton was $41,250, and the median family income was $50,000. The per capita income for the town was $20,845. About 11.2% of families and 14.2% of the population were below the poverty line, including 19.2% of those under age 18 and 8.2% of those age 65 or over.
Ellenton is a small town with a rich history and a diverse population. The town is home to a number of tourist attractions, agricultural businesses, and manufacturing and industrial businesses. The town has a median household income of $41,250 and a per capita income of $20,845. Ellenton is a great place to live and work, and is a great place to visit.
Common Questions
What is Per Capita Income in Ellenton?
Per Capita income in Ellenton is $27,572.
What is the Median Family Income in Ellenton?
Median Family Income in Ellenton is $64,481.
What is the Median Household income in Ellenton?
Median Household Income in Ellenton is $66,005.
What is Income or Wage Gap in Ellenton?
Income or Wage Gap in Ellenton is 40.9%.
Women in Ellenton earn 59.1 cents for every dollar earned by a man.
What is Inequality or Gini Index in Ellenton?
Inequality or Gini Index in Ellenton is 0.35.
What is the Total Population of Ellenton?
Total Population of Ellenton is 5,391.
What is the Total Male Population of Ellenton?
Total Male Population of Ellenton is 2,291.
What is the Total Female Population of Ellenton?
Total Female Population of Ellenton is 3,100.
What is the Ratio of Males per 100 Females in Ellenton?
There are 73.90 Males per 100 Females in Ellenton.
What is the Ratio of Females per 100 Males in Ellenton?
There are 135.31 Females per 100 Males in Ellenton.
What is the Median Population Age in Ellenton?
Median Population Age in Ellenton is 45.9 Years.
What is the Average Family Size in Ellenton
Average Family Size in Ellenton is 3.1 People.
What is the Average Household Size in Ellenton
Average Household Size in Ellenton is 2.9 People.
How Large is the Labor Force in Ellenton?
There are 2,283 People in the Labor Forcein in Ellenton.
What is the Percentage of People in the Labor Force in Ellenton?
51.6% of People are in the Labor Force in Ellenton.
What is the Unemployment Rate in Ellenton?
Unemployment Rate in Ellenton is 6.9%.