Eastpoint, FL Map & Demographics
Eastpoint Map
Eastpoint Overview
$28,353
PER CAPITA INCOME
$64,592
AVG FAMILY INCOME
$54,096
AVG HOUSEHOLD INCOME
3.8%
WAGE / INCOME GAP [ % ]
96.2¢/ $1
WAGE / INCOME GAP [ $ ]
0.47
INEQUALITY / GINI INDEX
2,624
TOTAL POPULATION
1,307
MALE POPULATION
1,317
FEMALE POPULATION
99.24
MALES / 100 FEMALES
100.77
FEMALES / 100 MALES
39.4
MEDIAN AGE
3.0
AVG FAMILY SIZE
2.5
AVG HOUSEHOLD SIZE
1,289
LABOR FORCE [ PEOPLE ]
63.3%
PERCENT IN LABOR FORCE
13.8%
UNEMPLOYMENT RATE
Eastpoint Zip Codes
Eastpoint Area Codes
Income in Eastpoint
Income Overview in Eastpoint
Per Capita Income in Eastpoint is $28,353, while median incomes of families and households are $64,592 and $54,096 respectively.
| Characteristic | Number | Measure |
| Per Capita Income | 2,624 | $28,353 |
| Median Family Income | 682 | $64,592 |
| Mean Family Income | 682 | $77,486 |
| Median Household Income | 1,046 | $54,096 |
| Mean Household Income | 1,046 | $65,727 |
| Income Deficit | 682 | $0 |
| Wage / Income Gap (%) | 2,624 | 3.76% |
| Wage / Income Gap ($) | 2,624 | 96.24¢ per $1 |
| Gini / Inequality Index | 2,624 | 0.47 |
Earnings by Sex in Eastpoint
Average Earnings in Eastpoint are $28,339, $28,893 for men and $27,808 for women, a difference of 3.8%.
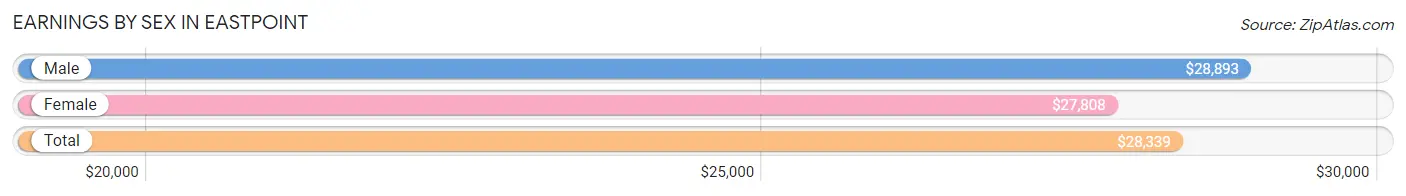
| Sex | Number | Average Earnings |
| Male | 616 (46.9%) | $28,893 |
| Female | 696 (53.0%) | $27,808 |
| Total | 1,312 (100.0%) | $28,339 |
Earnings by Sex by Income Bracket in Eastpoint
The most common earnings brackets in Eastpoint are $10,000 to $12,499 for men (134 | 21.7%) and $100,000+ for women (104 | 14.9%).
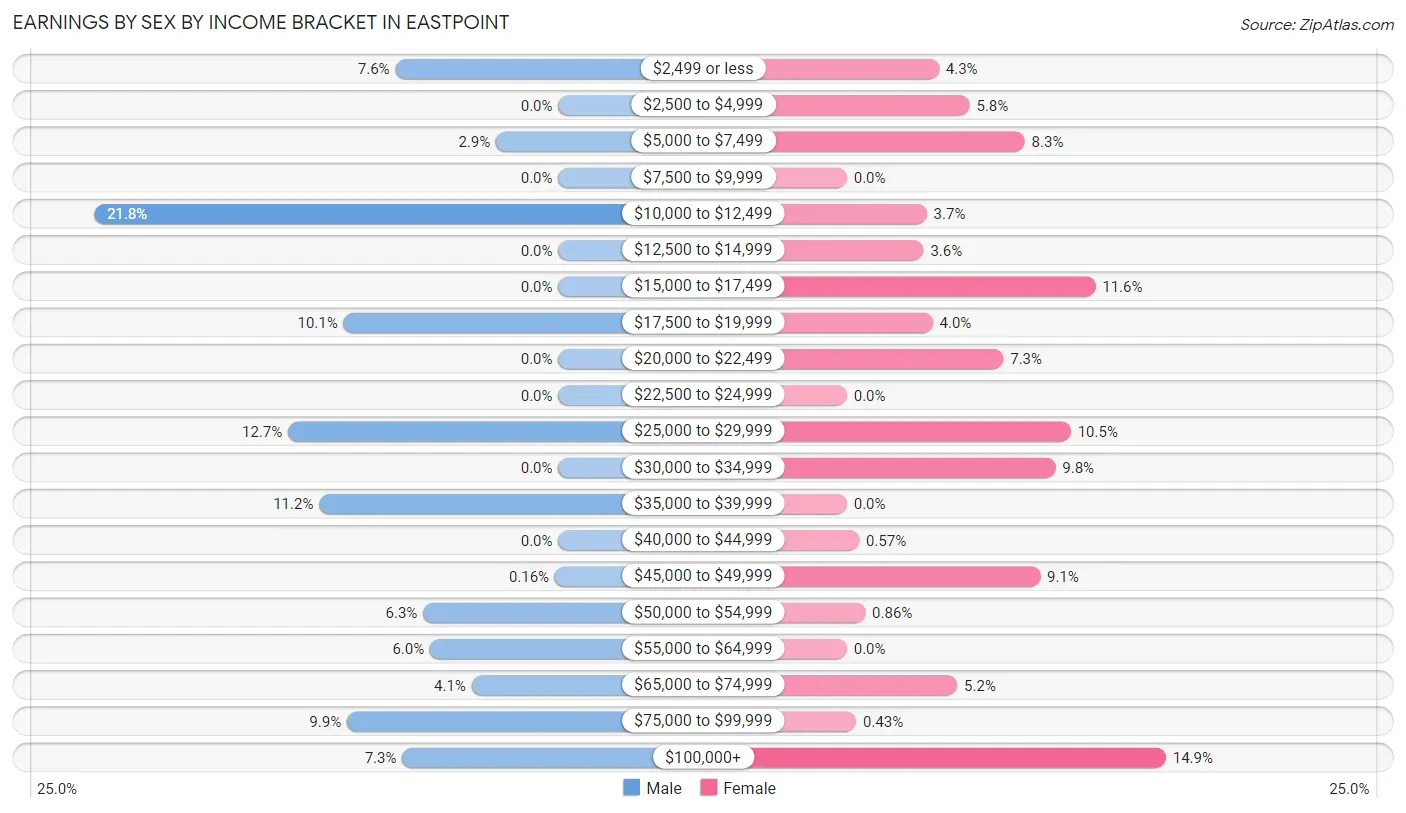
| Income | Male | Female |
| $2,499 or less | 47 (7.6%) | 30 (4.3%) |
| $2,500 to $4,999 | 0 (0.0%) | 40 (5.8%) |
| $5,000 to $7,499 | 18 (2.9%) | 58 (8.3%) |
| $7,500 to $9,999 | 0 (0.0%) | 0 (0.0%) |
| $10,000 to $12,499 | 134 (21.7%) | 26 (3.7%) |
| $12,500 to $14,999 | 0 (0.0%) | 25 (3.6%) |
| $15,000 to $17,499 | 0 (0.0%) | 81 (11.6%) |
| $17,500 to $19,999 | 62 (10.1%) | 28 (4.0%) |
| $20,000 to $22,499 | 0 (0.0%) | 51 (7.3%) |
| $22,500 to $24,999 | 0 (0.0%) | 0 (0.0%) |
| $25,000 to $29,999 | 78 (12.7%) | 73 (10.5%) |
| $30,000 to $34,999 | 0 (0.0%) | 68 (9.8%) |
| $35,000 to $39,999 | 69 (11.2%) | 0 (0.0%) |
| $40,000 to $44,999 | 0 (0.0%) | 4 (0.6%) |
| $45,000 to $49,999 | 1 (0.2%) | 63 (9.0%) |
| $50,000 to $54,999 | 39 (6.3%) | 6 (0.9%) |
| $55,000 to $64,999 | 37 (6.0%) | 0 (0.0%) |
| $65,000 to $74,999 | 25 (4.1%) | 36 (5.2%) |
| $75,000 to $99,999 | 61 (9.9%) | 3 (0.4%) |
| $100,000+ | 45 (7.3%) | 104 (14.9%) |
| Total | 616 (100.0%) | 696 (100.0%) |
Earnings by Sex by Educational Attainment in Eastpoint
Average earnings in Eastpoint are $29,625 for men and $27,808 for women, a difference of 6.1%. Men with an educational attainment of high school diploma enjoy the highest average annual earnings of $38,831, while those with high school diploma education earn the least with $38,831. Women with an educational attainment of bachelor's degree earn the most with the average annual earnings of $68,681, while those with bachelor's degree education have the smallest earnings of $68,681.
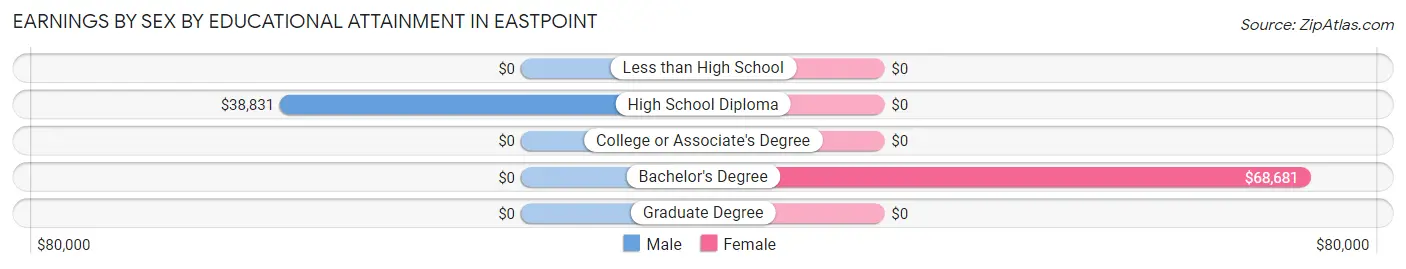
| Educational Attainment | Male Income | Female Income |
| Less than High School | - | - |
| High School Diploma | $38,831 | $0 |
| College or Associate's Degree | - | - |
| Bachelor's Degree | - | - |
| Graduate Degree | - | - |
| Total | $29,625 | $27,808 |
Family Income in Eastpoint
Family Income Brackets in Eastpoint
According to the Eastpoint family income data, there are 192 families falling into the $50,000 to $74,999 income range, which is the most common income bracket and makes up 28.1% of all families. Conversely, the $25,000 to $34,999 income bracket is the least frequent group with only 14 families (2.1%) belonging to this category.
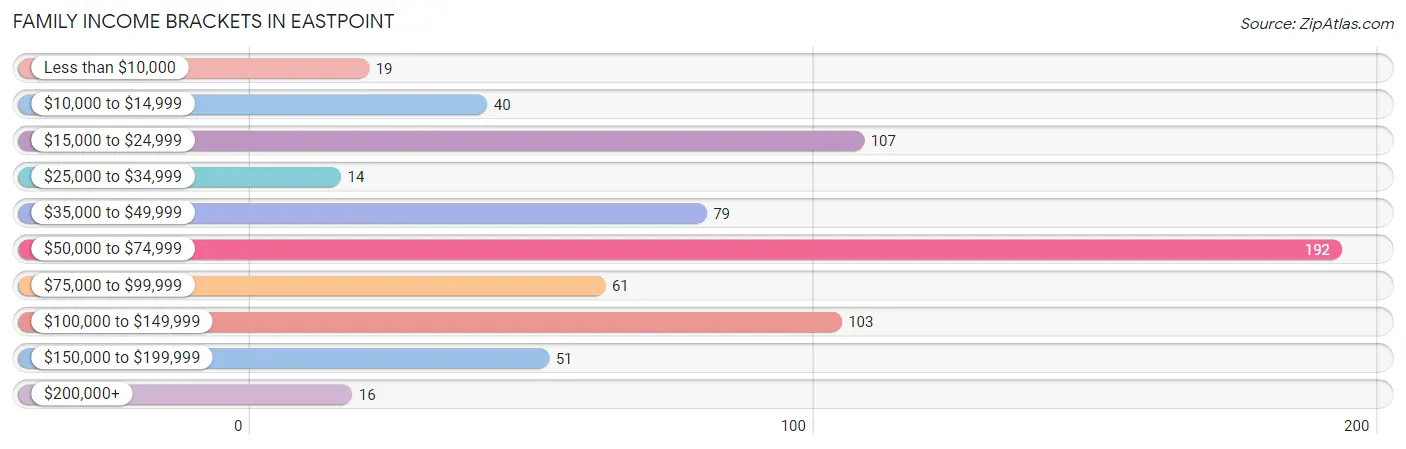
| Income Bracket | # Families | % Families |
| Less than $10,000 | 19 | 2.8% |
| $10,000 to $14,999 | 40 | 5.9% |
| $15,000 to $24,999 | 107 | 15.7% |
| $25,000 to $34,999 | 14 | 2.1% |
| $35,000 to $49,999 | 79 | 11.6% |
| $50,000 to $74,999 | 192 | 28.2% |
| $75,000 to $99,999 | 61 | 8.9% |
| $100,000 to $149,999 | 103 | 15.1% |
| $150,000 to $199,999 | 51 | 7.5% |
| $200,000+ | 16 | 2.3% |
Family Income by Famaliy Size in Eastpoint
2-person families (296 | 43.4%) account for the highest median family income in Eastpoint with $82,800 per family, while 2-person families (296 | 43.4%) have the highest median income of $41,400 per family member.
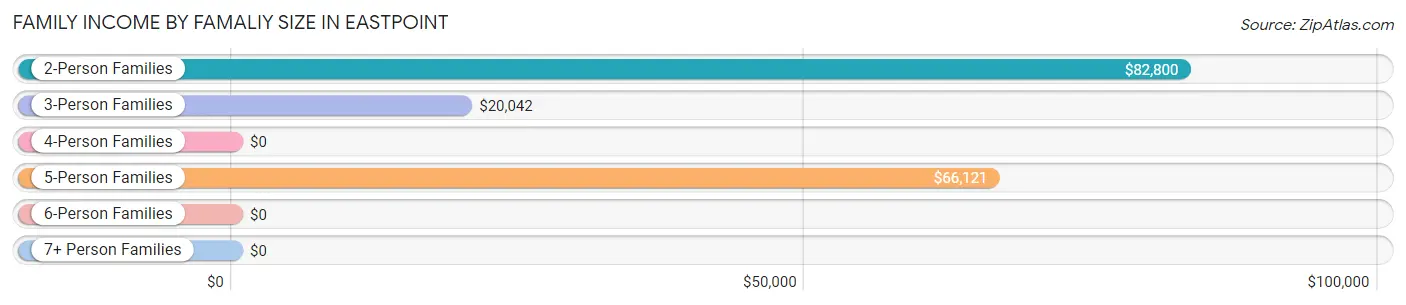
| Income Bracket | # Families | Median Income |
| 2-Person Families | 296 (43.4%) | $82,800 |
| 3-Person Families | 87 (12.8%) | $20,042 |
| 4-Person Families | 136 (19.9%) | $0 |
| 5-Person Families | 150 (22.0%) | $66,121 |
| 6-Person Families | 0 (0.0%) | $0 |
| 7+ Person Families | 13 (1.9%) | $0 |
| Total | 682 (100.0%) | $64,592 |
Family Income by Number of Earners in Eastpoint
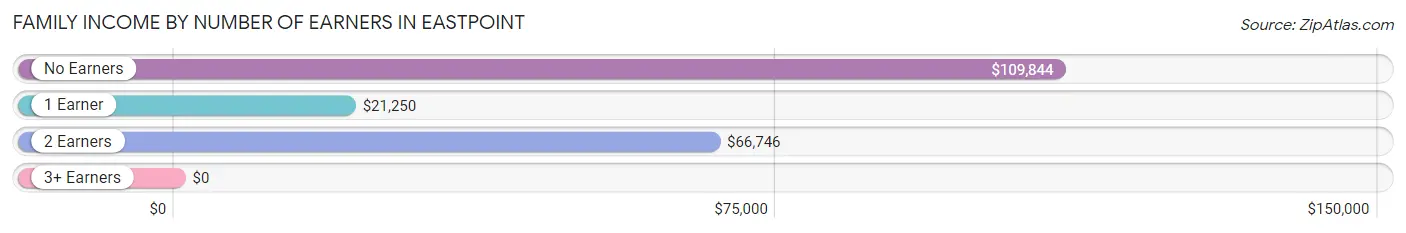
| Number of Earners | # Families | Median Income |
| No Earners | 91 (13.3%) | $109,844 |
| 1 Earner | 252 (36.9%) | $21,250 |
| 2 Earners | 339 (49.7%) | $66,746 |
| 3+ Earners | 0 (0.0%) | $0 |
| Total | 682 (100.0%) | $64,592 |
Household Income in Eastpoint
Household Income Brackets in Eastpoint
With 292 households falling in the category, the $50,000 to $74,999 income range is the most frequent in Eastpoint, accounting for 27.9% of all households. In contrast, only 16 households (1.5%) fall into the $200,000+ income bracket, making it the least populous group.
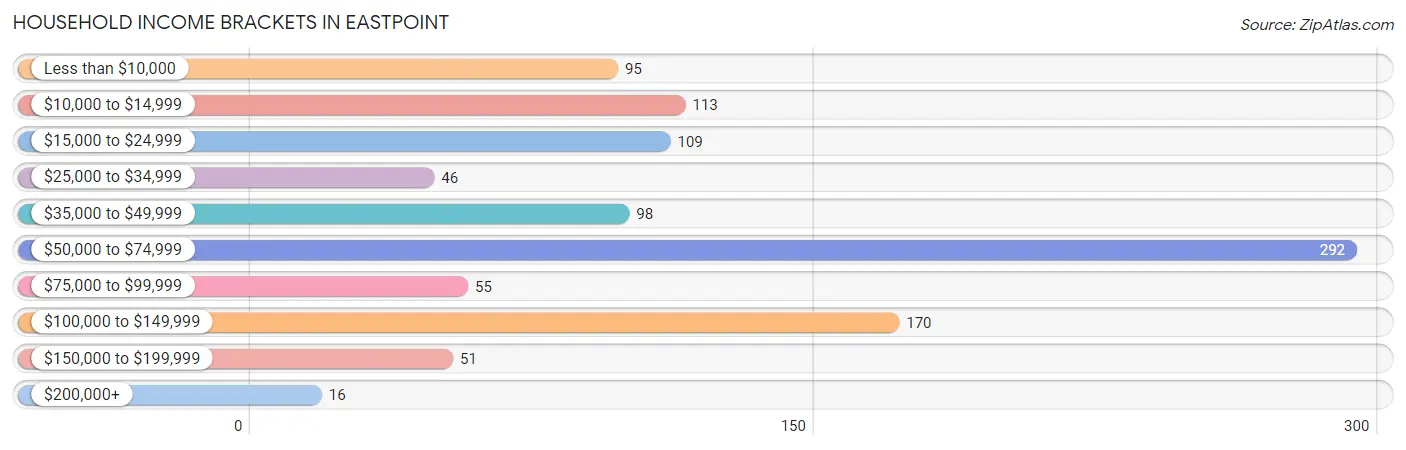
| Income Bracket | # Households | % Households |
| Less than $10,000 | 95 | 9.1% |
| $10,000 to $14,999 | 113 | 10.8% |
| $15,000 to $24,999 | 109 | 10.4% |
| $25,000 to $34,999 | 46 | 4.4% |
| $35,000 to $49,999 | 98 | 9.4% |
| $50,000 to $74,999 | 292 | 27.9% |
| $75,000 to $99,999 | 55 | 5.3% |
| $100,000 to $149,999 | 170 | 16.3% |
| $150,000 to $199,999 | 51 | 4.9% |
| $200,000+ | 16 | 1.5% |
Household Income by Householder Age in Eastpoint
The median household income in Eastpoint is $54,096, with the highest median household income of $57,313 found in the 25 to 44 years age bracket for the primary householder. A total of 433 households (41.4%) fall into this category. Meanwhile, the 15 to 24 years age bracket for the primary householder has the lowest median household income of $0, with 15 households (1.4%) in this group.
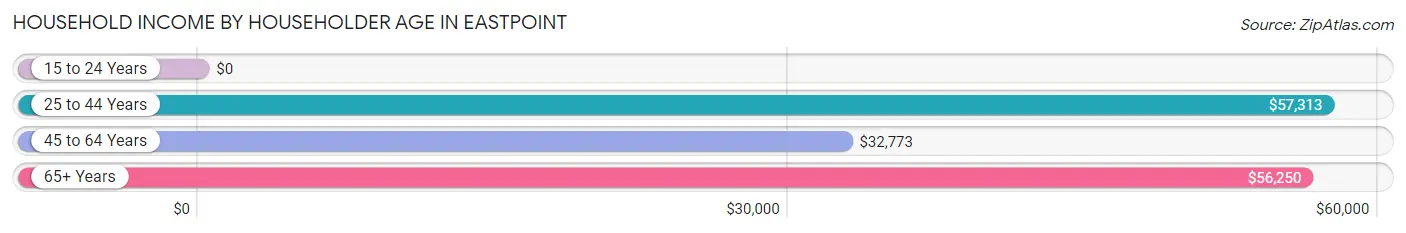
| Income Bracket | # Households | Median Income |
| 15 to 24 Years | 15 (1.4%) | $0 |
| 25 to 44 Years | 433 (41.4%) | $57,313 |
| 45 to 64 Years | 295 (28.2%) | $32,773 |
| 65+ Years | 303 (29.0%) | $56,250 |
| Total | 1,046 (100.0%) | $54,096 |
Poverty in Eastpoint
Income Below Poverty by Sex and Age in Eastpoint
With 25.7% poverty level for males and 24.3% for females among the residents of Eastpoint, 12 to 14 year old males and 15 year old females are the most vulnerable to poverty, with 94 males (100.0%) and 31 females (100.0%) in their respective age groups living below the poverty level.
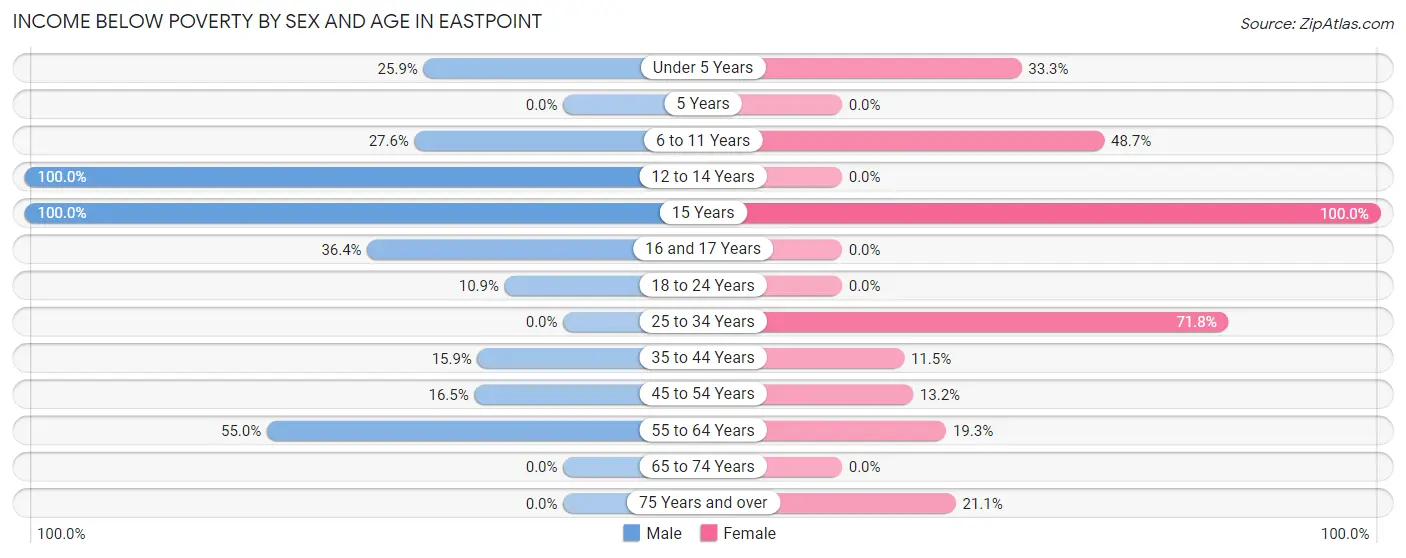
| Age Bracket | Male | Female |
| Under 5 Years | 21 (25.9%) | 16 (33.3%) |
| 5 Years | 0 (0.0%) | 0 (0.0%) |
| 6 to 11 Years | 24 (27.6%) | 74 (48.7%) |
| 12 to 14 Years | 94 (100.0%) | 0 (0.0%) |
| 15 Years | 37 (100.0%) | 31 (100.0%) |
| 16 and 17 Years | 16 (36.4%) | 0 (0.0%) |
| 18 to 24 Years | 15 (10.9%) | 0 (0.0%) |
| 25 to 34 Years | 0 (0.0%) | 89 (71.8%) |
| 35 to 44 Years | 31 (15.9%) | 30 (11.5%) |
| 45 to 54 Years | 32 (16.5%) | 26 (13.2%) |
| 55 to 64 Years | 66 (55.0%) | 35 (19.3%) |
| 65 to 74 Years | 0 (0.0%) | 0 (0.0%) |
| 75 Years and over | 0 (0.0%) | 19 (21.1%) |
| Total | 336 (25.7%) | 320 (24.3%) |
Income Above Poverty by Sex and Age in Eastpoint
According to the poverty statistics in Eastpoint, males aged 25 to 34 years and females aged 12 to 14 years are the age groups that are most secure financially, with 100.0% of males and 100.0% of females in these age groups living above the poverty line.
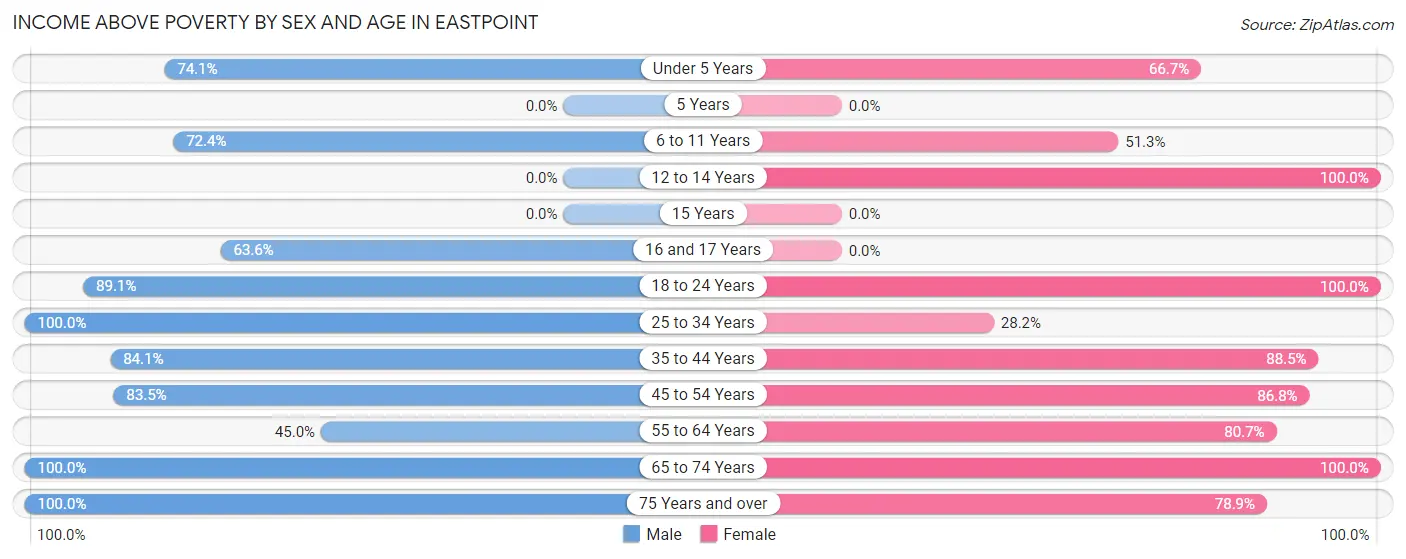
| Age Bracket | Male | Female |
| Under 5 Years | 60 (74.1%) | 32 (66.7%) |
| 5 Years | 0 (0.0%) | 0 (0.0%) |
| 6 to 11 Years | 63 (72.4%) | 78 (51.3%) |
| 12 to 14 Years | 0 (0.0%) | 58 (100.0%) |
| 15 Years | 0 (0.0%) | 0 (0.0%) |
| 16 and 17 Years | 28 (63.6%) | 0 (0.0%) |
| 18 to 24 Years | 123 (89.1%) | 66 (100.0%) |
| 25 to 34 Years | 78 (100.0%) | 35 (28.2%) |
| 35 to 44 Years | 164 (84.1%) | 230 (88.5%) |
| 45 to 54 Years | 162 (83.5%) | 171 (86.8%) |
| 55 to 64 Years | 54 (45.0%) | 146 (80.7%) |
| 65 to 74 Years | 111 (100.0%) | 110 (100.0%) |
| 75 Years and over | 128 (100.0%) | 71 (78.9%) |
| Total | 971 (74.3%) | 997 (75.7%) |
Income Below Poverty Among Married-Couple Families in Eastpoint
The poverty statistics for married-couple families in Eastpoint show that 10.5% or 56 of the total 535 families live below the poverty line. Families with 5 or more children have the highest poverty rate of 100.0%, comprising of 13 families. On the other hand, families with no children have the lowest poverty rate of 0.0%, which includes 0 families.
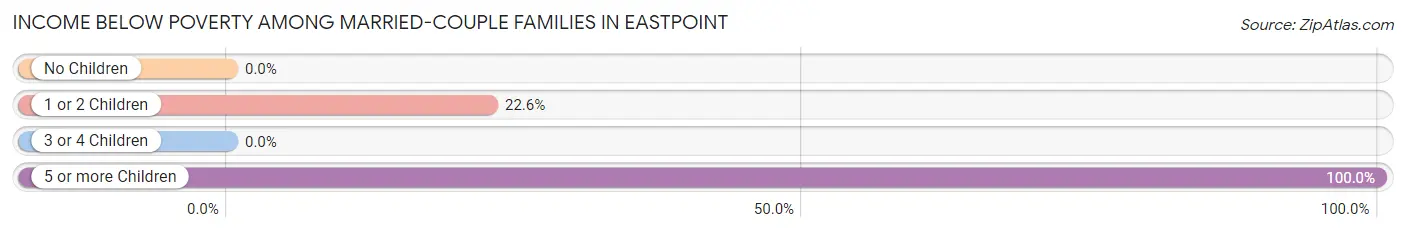
| Children | Above Poverty | Below Poverty |
| No Children | 274 (100.0%) | 0 (0.0%) |
| 1 or 2 Children | 147 (77.4%) | 43 (22.6%) |
| 3 or 4 Children | 58 (100.0%) | 0 (0.0%) |
| 5 or more Children | 0 (0.0%) | 13 (100.0%) |
| Total | 479 (89.5%) | 56 (10.5%) |
Income Below Poverty Among Single-Parent Households in Eastpoint
According to the poverty data in Eastpoint, 46.7% or 14 single-father households and 62.4% or 73 single-mother households are living below the poverty line. Among single-father households, those with 1 or 2 children have the highest poverty rate, with 14 households (100.0%) experiencing poverty. Likewise, among single-mother households, those with 1 or 2 children have the highest poverty rate, with 73 households (100.0%) falling below the poverty line.
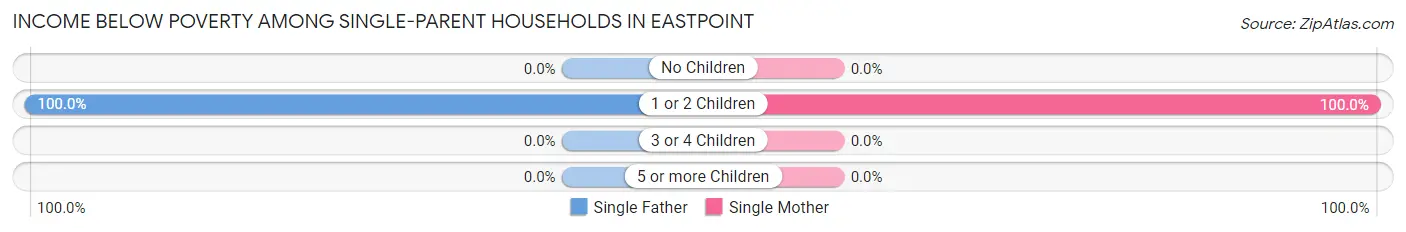
| Children | Single Father | Single Mother |
| No Children | 0 (0.0%) | 0 (0.0%) |
| 1 or 2 Children | 14 (100.0%) | 73 (100.0%) |
| 3 or 4 Children | 0 (0.0%) | 0 (0.0%) |
| 5 or more Children | 0 (0.0%) | 0 (0.0%) |
| Total | 14 (46.7%) | 73 (62.4%) |
Income Below Poverty Among Married-Couple vs Single-Parent Households in Eastpoint
The poverty data for Eastpoint shows that 56 of the married-couple family households (10.5%) and 87 of the single-parent households (59.2%) are living below the poverty level. Within the married-couple family households, those with 5 or more children have the highest poverty rate, with 13 households (100.0%) falling below the poverty line. Among the single-parent households, those with 1 or 2 children have the highest poverty rate, with 87 household (100.0%) living below poverty.
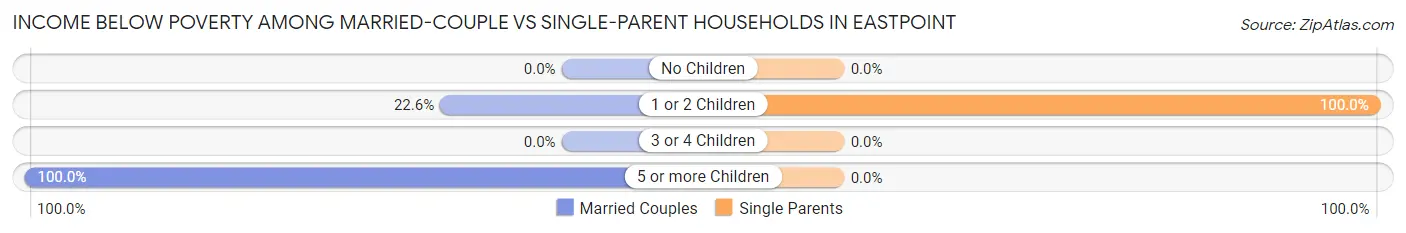
| Children | Married-Couple Families | Single-Parent Households |
| No Children | 0 (0.0%) | 0 (0.0%) |
| 1 or 2 Children | 43 (22.6%) | 87 (100.0%) |
| 3 or 4 Children | 0 (0.0%) | 0 (0.0%) |
| 5 or more Children | 13 (100.0%) | 0 (0.0%) |
| Total | 56 (10.5%) | 87 (59.2%) |
Race in Eastpoint
The most populous races in Eastpoint are White / Caucasian (2,320 | 88.4%), Two or more Races (297 | 11.3%), and Hispanic or Latino (129 | 4.9%).
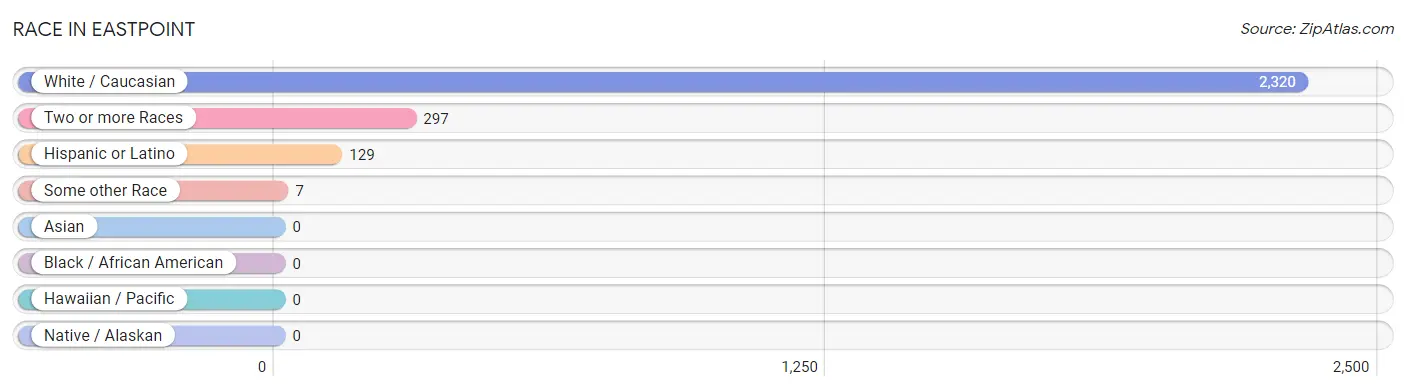
| Race | # Population | % Population |
| Asian | 0 | 0.0% |
| Black / African American | 0 | 0.0% |
| Hawaiian / Pacific | 0 | 0.0% |
| Hispanic or Latino | 129 | 4.9% |
| Native / Alaskan | 0 | 0.0% |
| White / Caucasian | 2,320 | 88.4% |
| Two or more Races | 297 | 11.3% |
| Some other Race | 7 | 0.3% |
| Total | 2,624 | 100.0% |
Ancestry in Eastpoint
The most populous ancestries reported in Eastpoint are Irish (618 | 23.5%), German (327 | 12.5%), English (267 | 10.2%), American (134 | 5.1%), and Italian (113 | 4.3%), together accounting for 55.6% of all Eastpoint residents.
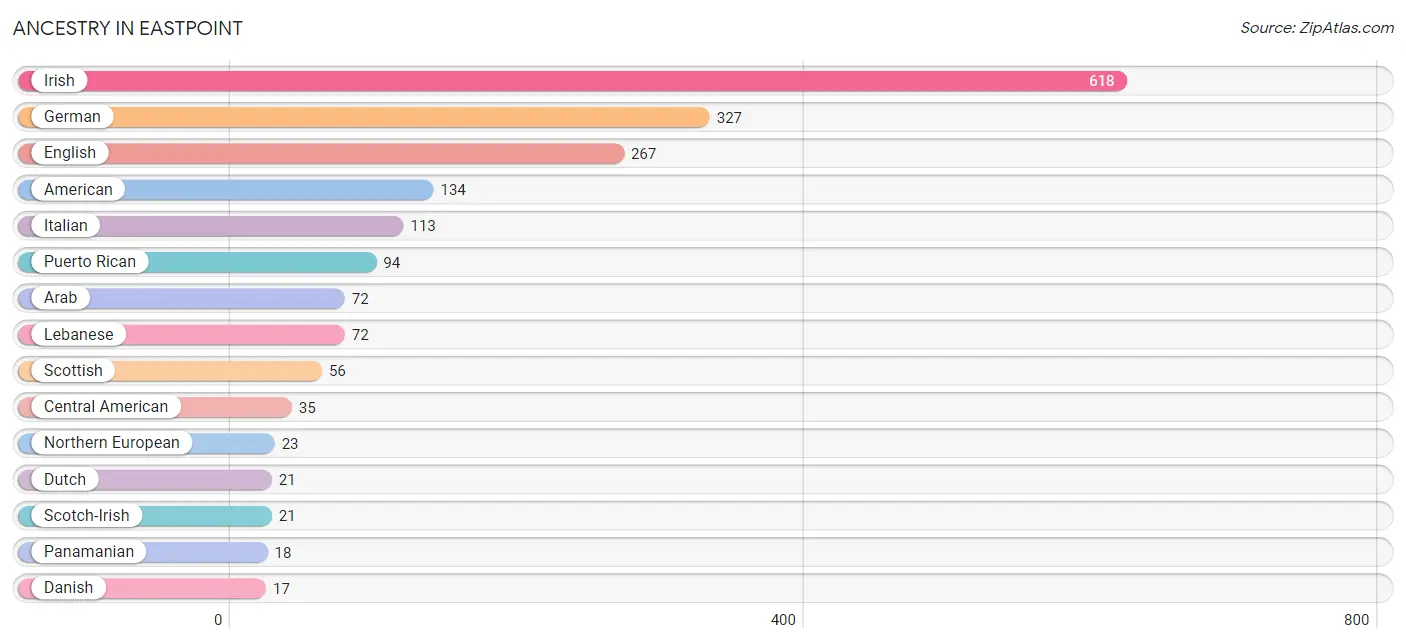
| Ancestry | # Population | % Population |
| American | 134 | 5.1% |
| Arab | 72 | 2.7% |
| British | 6 | 0.2% |
| Central American | 35 | 1.3% |
| Danish | 17 | 0.6% |
| Dutch | 21 | 0.8% |
| Eastern European | 17 | 0.6% |
| English | 267 | 10.2% |
| European | 6 | 0.2% |
| French | 9 | 0.3% |
| French Canadian | 12 | 0.5% |
| German | 327 | 12.5% |
| Guatemalan | 16 | 0.6% |
| Irish | 618 | 23.5% |
| Italian | 113 | 4.3% |
| Lebanese | 72 | 2.7% |
| Northern European | 23 | 0.9% |
| Panamanian | 18 | 0.7% |
| Puerto Rican | 94 | 3.6% |
| Salvadoran | 1 | 0.0% |
| Scotch-Irish | 21 | 0.8% |
| Scottish | 56 | 2.1% |
| Swiss | 2 | 0.1% |
| Welsh | 7 | 0.3% |
| West Indian | 4 | 0.2% | View All 25 Rows |
Immigrants in Eastpoint
The most numerous immigrant groups reported in Eastpoint came from Canada (12 | 0.5%), Central America (4 | 0.2%), Latin America (4 | 0.2%), and Panama (4 | 0.2%), together accounting for 0.9% of all Eastpoint residents.
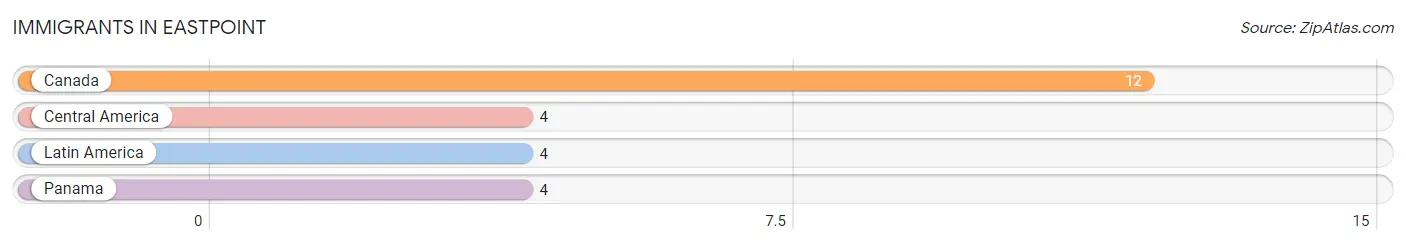
| Immigration Origin | # Population | % Population |
| Canada | 12 | 0.5% |
| Central America | 4 | 0.2% |
| Latin America | 4 | 0.2% |
| Panama | 4 | 0.2% | View All 4 Rows |
Sex and Age in Eastpoint
Sex and Age in Eastpoint
The most populous age groups in Eastpoint are 15 to 19 Years (147 | 11.3%) for men and 35 to 39 Years (195 | 14.8%) for women.
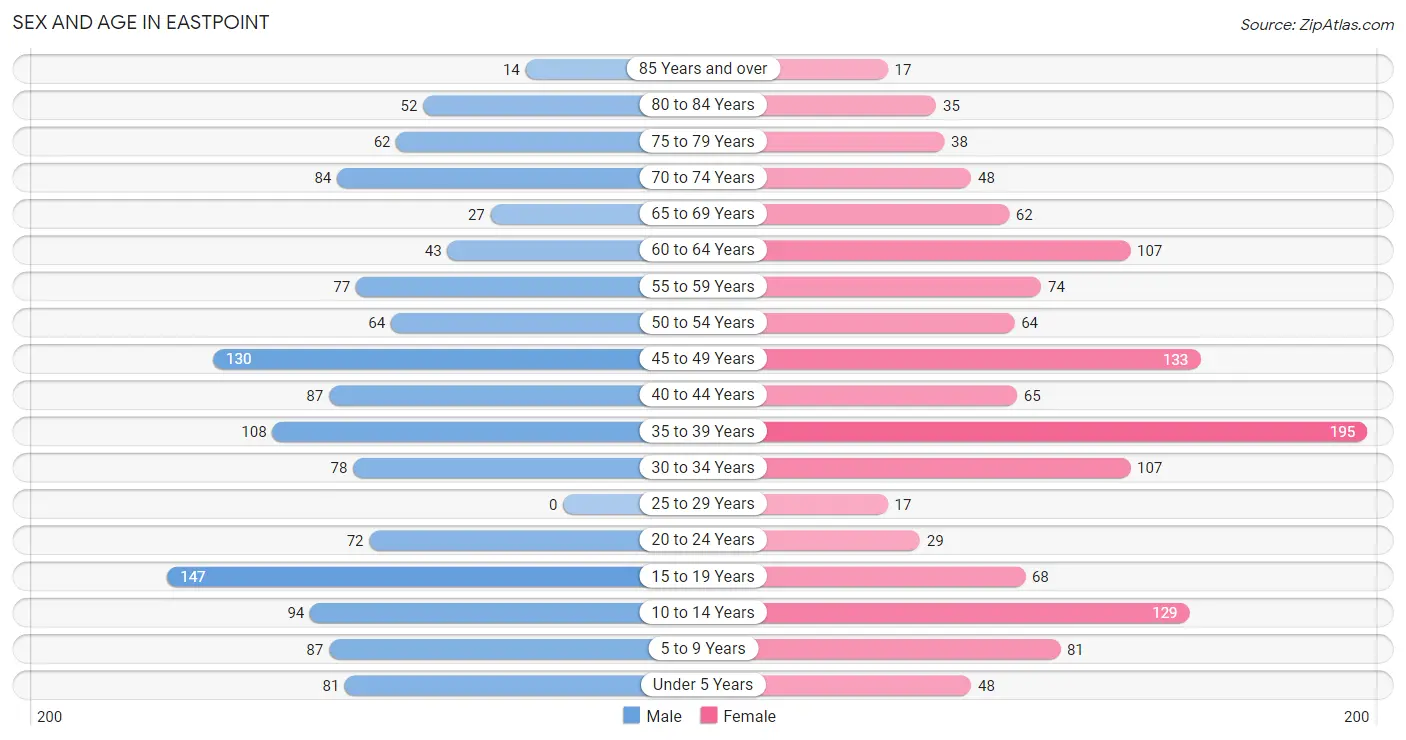
| Age Bracket | Male | Female |
| Under 5 Years | 81 (6.2%) | 48 (3.6%) |
| 5 to 9 Years | 87 (6.7%) | 81 (6.1%) |
| 10 to 14 Years | 94 (7.2%) | 129 (9.8%) |
| 15 to 19 Years | 147 (11.3%) | 68 (5.2%) |
| 20 to 24 Years | 72 (5.5%) | 29 (2.2%) |
| 25 to 29 Years | 0 (0.0%) | 17 (1.3%) |
| 30 to 34 Years | 78 (6.0%) | 107 (8.1%) |
| 35 to 39 Years | 108 (8.3%) | 195 (14.8%) |
| 40 to 44 Years | 87 (6.7%) | 65 (4.9%) |
| 45 to 49 Years | 130 (10.0%) | 133 (10.1%) |
| 50 to 54 Years | 64 (4.9%) | 64 (4.9%) |
| 55 to 59 Years | 77 (5.9%) | 74 (5.6%) |
| 60 to 64 Years | 43 (3.3%) | 107 (8.1%) |
| 65 to 69 Years | 27 (2.1%) | 62 (4.7%) |
| 70 to 74 Years | 84 (6.4%) | 48 (3.6%) |
| 75 to 79 Years | 62 (4.7%) | 38 (2.9%) |
| 80 to 84 Years | 52 (4.0%) | 35 (2.7%) |
| 85 Years and over | 14 (1.1%) | 17 (1.3%) |
| Total | 1,307 (100.0%) | 1,317 (100.0%) |
Families and Households in Eastpoint
Median Family Size in Eastpoint
The median family size in Eastpoint is 2.99 persons per family, with married-couple families (535 | 78.4%) accounting for the largest median family size of 3.03 persons per family. On the other hand, single male/father families (30 | 4.4%) represent the smallest median family size with 2.70 persons per family.
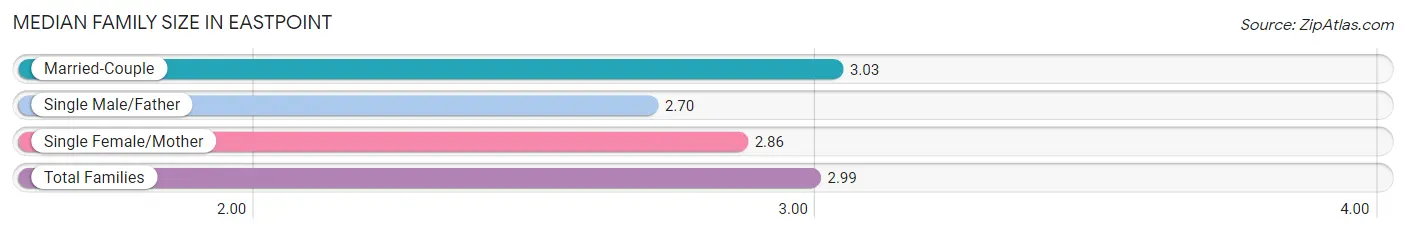
| Family Type | # Families | Family Size |
| Married-Couple | 535 (78.4%) | 3.03 |
| Single Male/Father | 30 (4.4%) | 2.70 |
| Single Female/Mother | 117 (17.2%) | 2.86 |
| Total Families | 682 (100.0%) | 2.99 |
Median Household Size in Eastpoint
The median household size in Eastpoint is 2.51 persons per household, with single female/mother households (117 | 11.2%) accounting for the largest median household size of 3.37 persons per household. non-family households (364 | 34.8%) represent the smallest median household size with 1.42 persons per household.
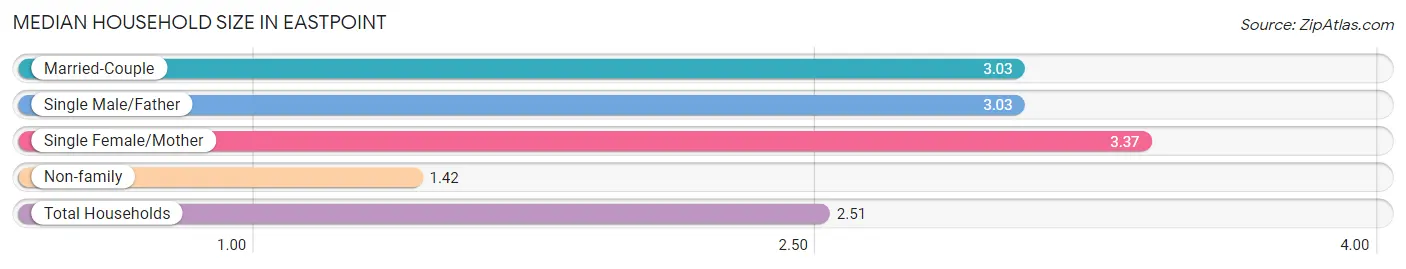
| Household Type | # Households | Household Size |
| Married-Couple | 535 (51.1%) | 3.03 |
| Single Male/Father | 30 (2.9%) | 3.03 |
| Single Female/Mother | 117 (11.2%) | 3.37 |
| Non-family | 364 (34.8%) | 1.42 |
| Total Households | 1,046 (100.0%) | 2.51 |
Household Size by Marriage Status in Eastpoint
Out of a total of 1,046 households in Eastpoint, 682 (65.2%) are family households, while 364 (34.8%) are nonfamily households. The most numerous type of family households are 2-person households, comprising 287, and the most common type of nonfamily households are 1-person households, comprising 305.
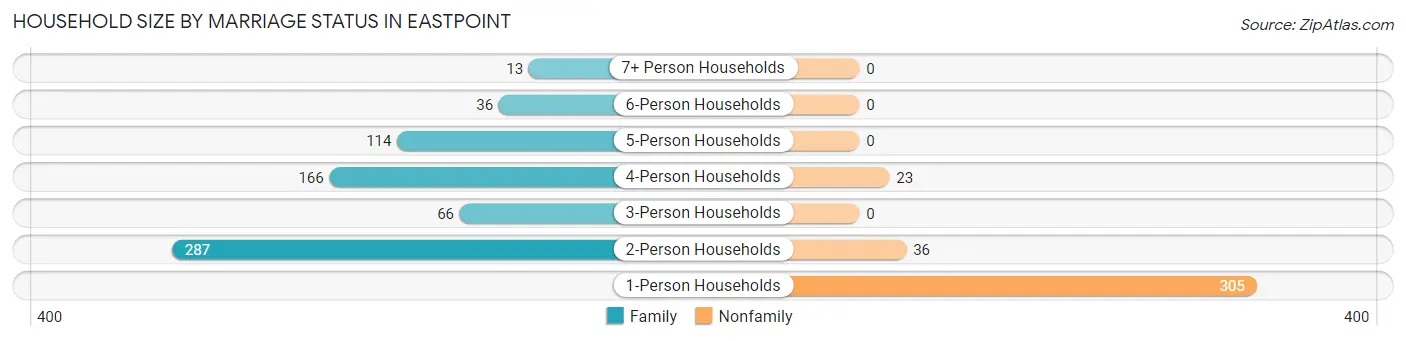
| Household Size | Family Households | Nonfamily Households |
| 1-Person Households | - | 305 (29.2%) |
| 2-Person Households | 287 (27.4%) | 36 (3.4%) |
| 3-Person Households | 66 (6.3%) | 0 (0.0%) |
| 4-Person Households | 166 (15.9%) | 23 (2.2%) |
| 5-Person Households | 114 (10.9%) | 0 (0.0%) |
| 6-Person Households | 36 (3.4%) | 0 (0.0%) |
| 7+ Person Households | 13 (1.2%) | 0 (0.0%) |
| Total | 682 (65.2%) | 364 (34.8%) |
Female Fertility in Eastpoint
Fertility by Age in Eastpoint
Average fertility rate in Eastpoint is 31.0 births per 1,000 women. Women in the age bracket of 35 to 50 years have the highest fertility rate with 48.0 births per 1,000 women. Women in the age bracket of 35 to 50 years acount for 100.0% of all women with births.
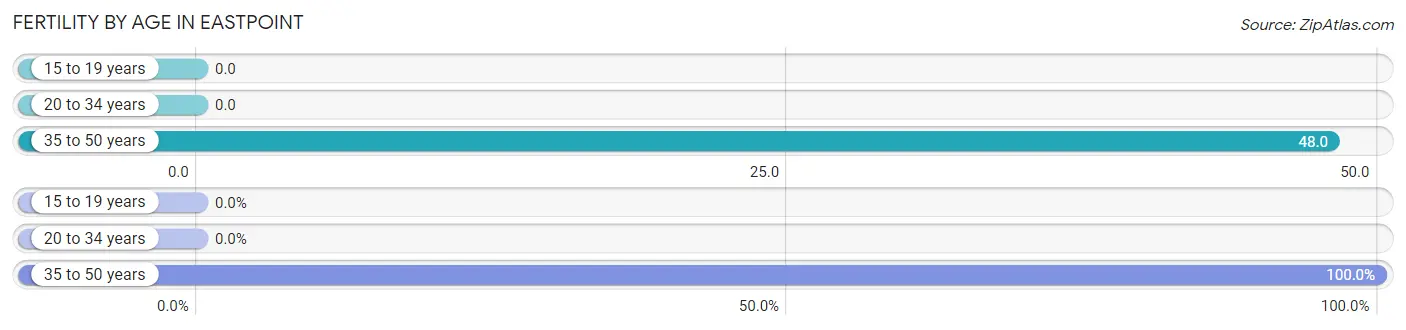
| Age Bracket | Women with Births | Births / 1,000 Women |
| 15 to 19 years | 0 (0.0%) | 0.0 |
| 20 to 34 years | 0 (0.0%) | 0.0 |
| 35 to 50 years | 20 (100.0%) | 48.0 |
| Total | 20 (100.0%) | 31.0 |
Fertility by Age by Marriage Status in Eastpoint
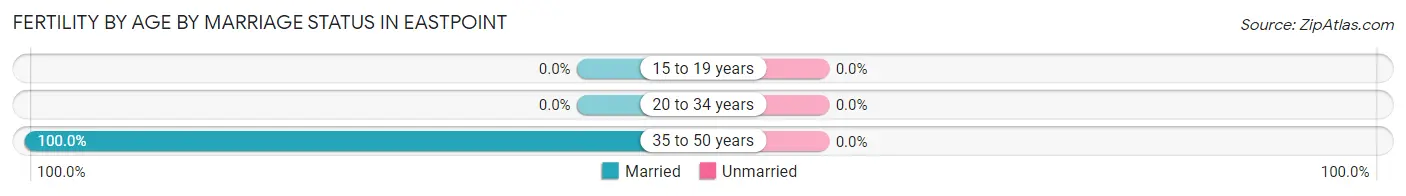
| Age Bracket | Married | Unmarried |
| 15 to 19 years | 0 (0.0%) | 0 (0.0%) |
| 20 to 34 years | 0 (0.0%) | 0 (0.0%) |
| 35 to 50 years | 20 (100.0%) | 0 (0.0%) |
| Total | 20 (100.0%) | 0 (0.0%) |
Fertility by Education in Eastpoint
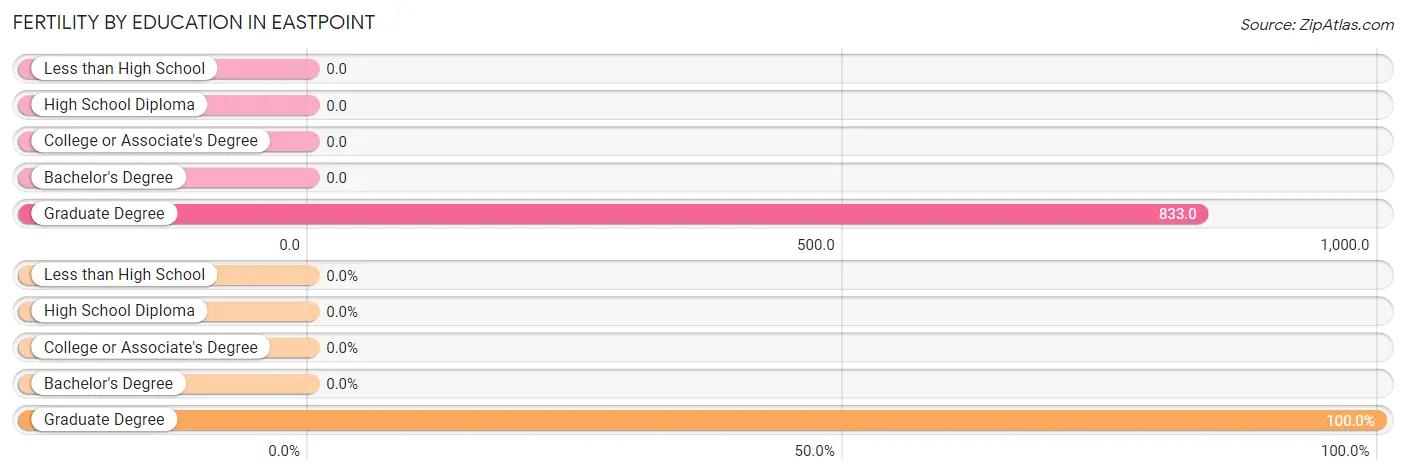
| Educational Attainment | Women with Births | Births / 1,000 Women |
| Less than High School | 0 (0.0%) | 0.0 |
| High School Diploma | 0 (0.0%) | 0.0 |
| College or Associate's Degree | 0 (0.0%) | 0.0 |
| Bachelor's Degree | 0 (0.0%) | 0.0 |
| Graduate Degree | 20 (100.0%) | 833.0 |
| Total | 20 (100.0%) | 31.0 |
Fertility by Education by Marriage Status in Eastpoint
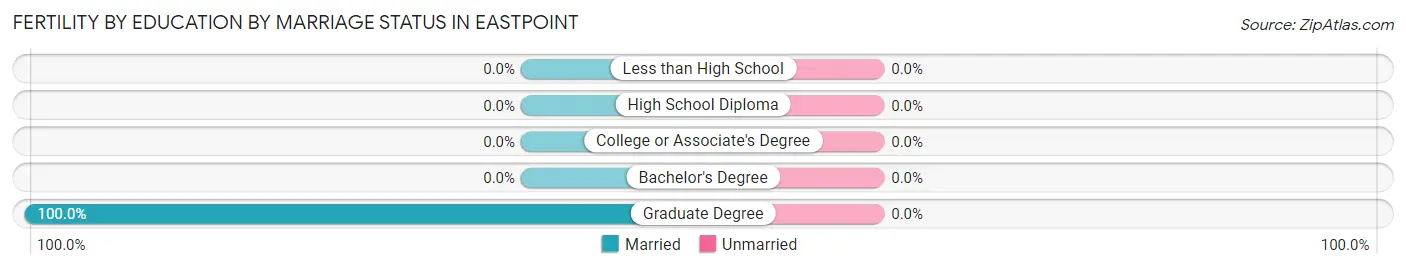
| Educational Attainment | Married | Unmarried |
| Less than High School | 0 (0.0%) | 0 (0.0%) |
| High School Diploma | 0 (0.0%) | 0 (0.0%) |
| College or Associate's Degree | 0 (0.0%) | 0 (0.0%) |
| Bachelor's Degree | 0 (0.0%) | 0 (0.0%) |
| Graduate Degree | 20 (100.0%) | 0 (0.0%) |
| Total | 20 (100.0%) | 0 (0.0%) |
Employment Characteristics in Eastpoint
Employment by Class of Employer in Eastpoint
Among the 1,103 employed individuals in Eastpoint, private company employees (567 | 51.4%), self-employed (not incorporated) (147 | 13.3%), and self-employed (incorporated) (144 | 13.1%) make up the most common classes of employment.
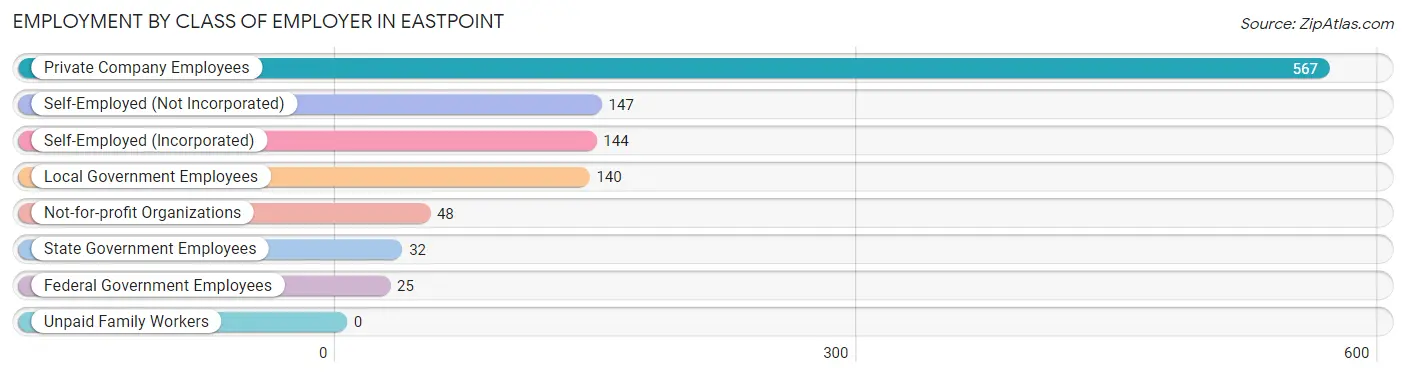
| Employer Class | # Employees | % Employees |
| Private Company Employees | 567 | 51.4% |
| Self-Employed (Incorporated) | 144 | 13.1% |
| Self-Employed (Not Incorporated) | 147 | 13.3% |
| Not-for-profit Organizations | 48 | 4.3% |
| Local Government Employees | 140 | 12.7% |
| State Government Employees | 32 | 2.9% |
| Federal Government Employees | 25 | 2.3% |
| Unpaid Family Workers | 0 | 0.0% |
| Total | 1,103 | 100.0% |
Employment Status by Age in Eastpoint
According to the labor force statistics for Eastpoint, out of the total population over 16 years of age (2,036), 63.3% or 1,289 individuals are in the labor force, with 13.8% or 178 of them unemployed. The age group with the highest labor force participation rate is 25 to 29 years, with 100.0% or 17 individuals in the labor force. Within the labor force, the 20 to 24 years age range has the highest percentage of unemployed individuals, with 66.7% or 48 of them being unemployed.
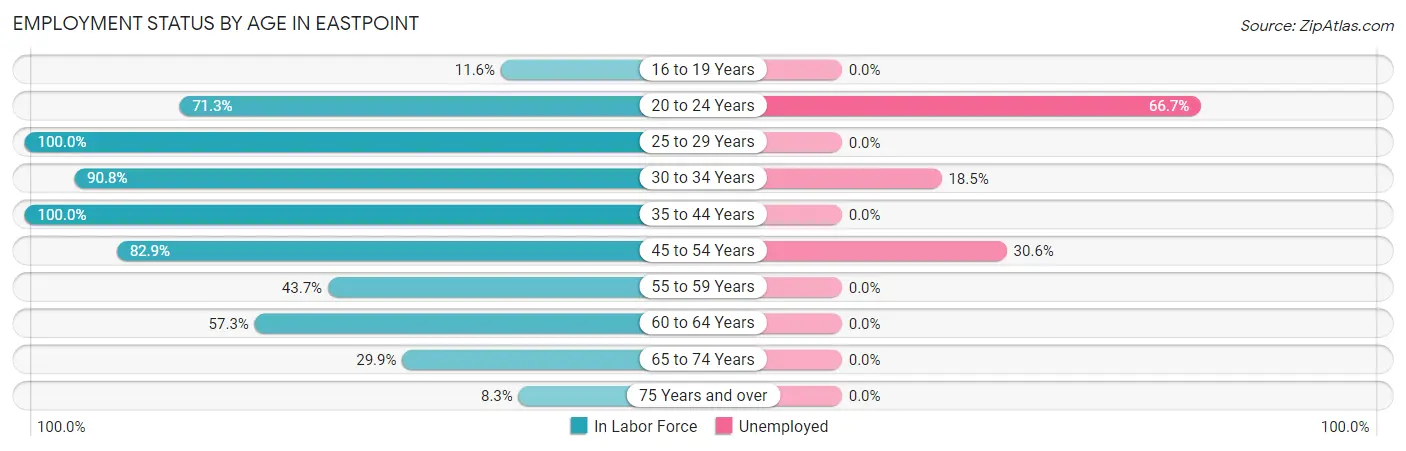
| Age Bracket | In Labor Force | Unemployed |
| 16 to 19 Years | 17 (11.6%) | 0 (0.0%) |
| 20 to 24 Years | 72 (71.3%) | 48 (66.7%) |
| 25 to 29 Years | 17 (100.0%) | 0 (0.0%) |
| 30 to 34 Years | 168 (90.8%) | 31 (18.5%) |
| 35 to 44 Years | 455 (100.0%) | 0 (0.0%) |
| 45 to 54 Years | 324 (82.9%) | 99 (30.6%) |
| 55 to 59 Years | 66 (43.7%) | 0 (0.0%) |
| 60 to 64 Years | 86 (57.3%) | 0 (0.0%) |
| 65 to 74 Years | 66 (29.9%) | 0 (0.0%) |
| 75 Years and over | 18 (8.3%) | 0 (0.0%) |
| Total | 1,289 (63.3%) | 178 (13.8%) |
Employment Status by Educational Attainment in Eastpoint
According to labor force statistics for Eastpoint, 82.7% of individuals (1,116) out of the total population between 25 and 64 years of age (1,349) are in the labor force, with 11.6% or 129 of them being unemployed. The group with the highest labor force participation rate are those with the educational attainment of college / associate degree, with 86.2% or 505 individuals in the labor force. Within the labor force, individuals with college / associate degree education have the highest percentage of unemployment, with 24.0% or 121 of them being unemployed.
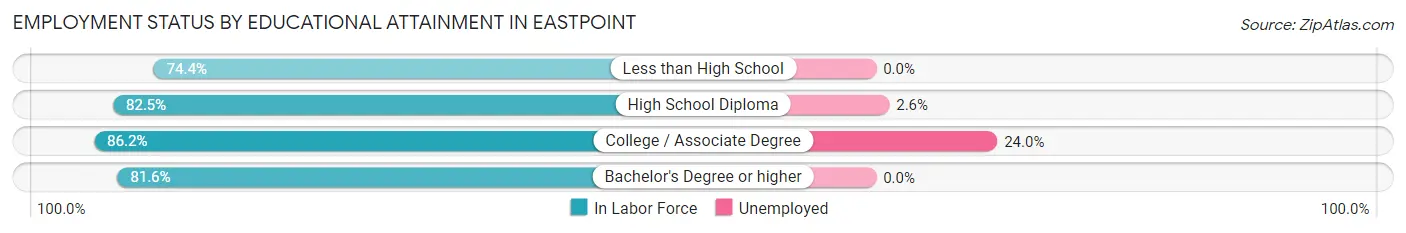
| Educational Attainment | In Labor Force | Unemployed |
| Less than High School | 157 (74.4%) | 0 (0.0%) |
| High School Diploma | 343 (82.5%) | 11 (2.6%) |
| College / Associate Degree | 505 (86.2%) | 141 (24.0%) |
| Bachelor's Degree or higher | 111 (81.6%) | 0 (0.0%) |
| Total | 1,116 (82.7%) | 156 (11.6%) |
Employment Occupations by Sex in Eastpoint
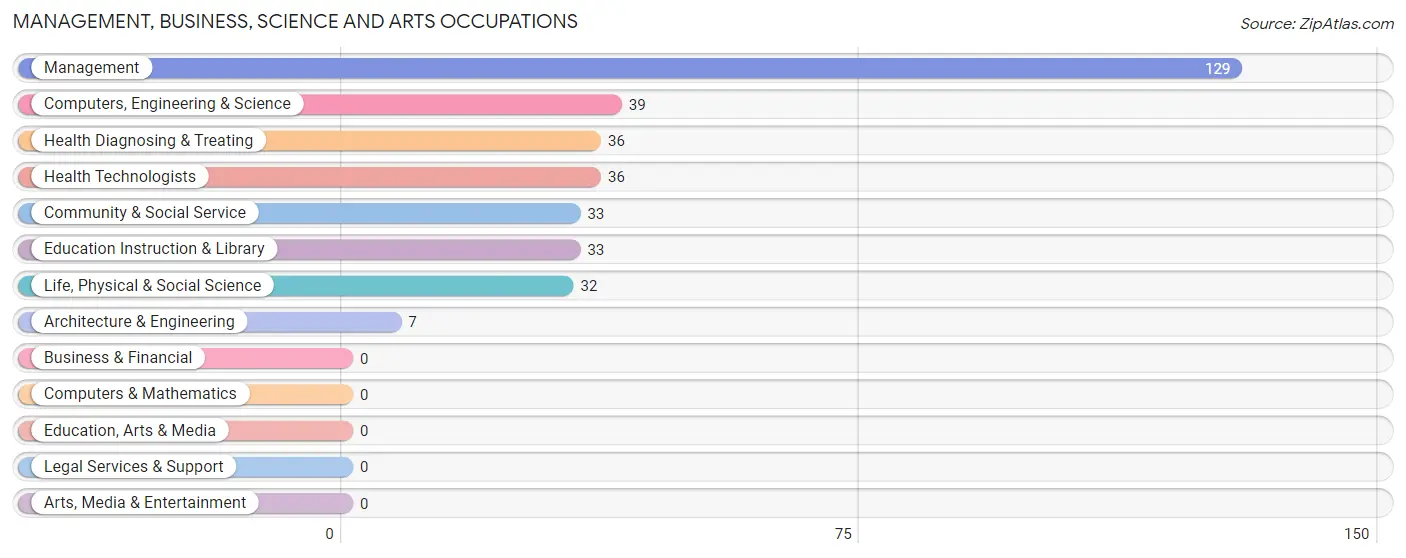
Management, Business, Science and Arts Occupations
The most common Management, Business, Science and Arts occupations in Eastpoint are Management (129 | 11.6%), Computers, Engineering & Science (39 | 3.5%), Health Diagnosing & Treating (36 | 3.2%), Health Technologists (36 | 3.2%), and Community & Social Service (33 | 3.0%).
Management, Business, Science and Arts Occupations by Sex
Within the Management, Business, Science and Arts occupations in Eastpoint, the most male-oriented occupations are Computers, Engineering & Science (100.0%), Architecture & Engineering (100.0%), and Life, Physical & Social Science (100.0%), while the most female-oriented occupations are Health Diagnosing & Treating (100.0%), Health Technologists (100.0%), and Community & Social Service (97.0%).
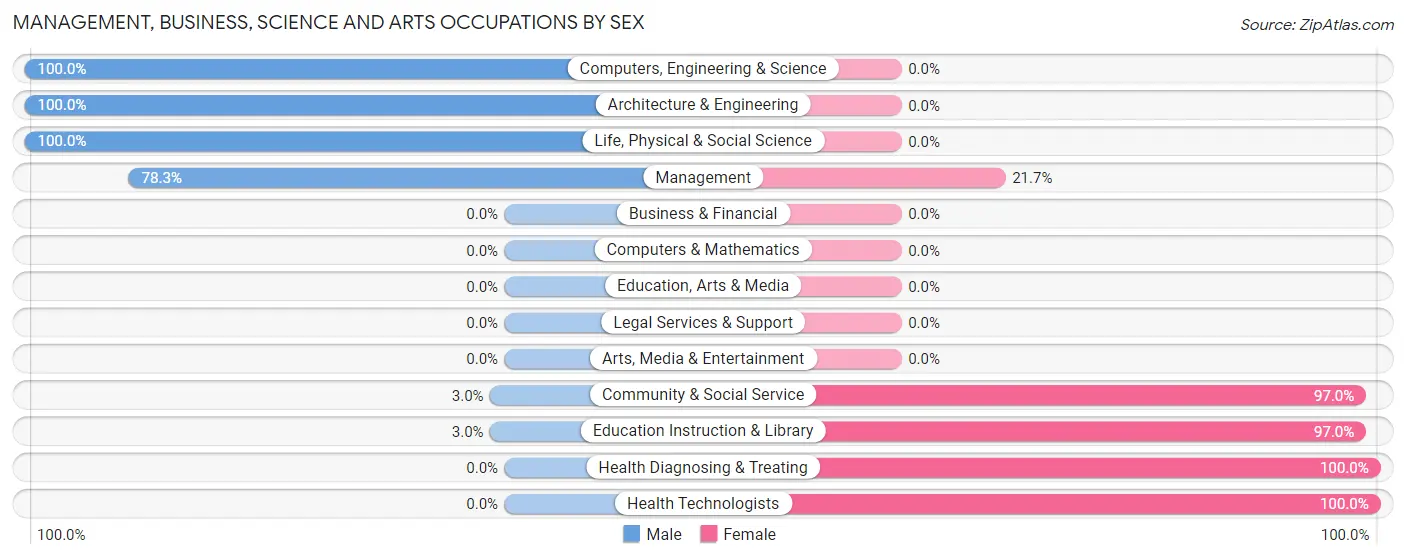
| Occupation | Male | Female |
| Management | 101 (78.3%) | 28 (21.7%) |
| Business & Financial | 0 (0.0%) | 0 (0.0%) |
| Computers, Engineering & Science | 39 (100.0%) | 0 (0.0%) |
| Computers & Mathematics | 0 (0.0%) | 0 (0.0%) |
| Architecture & Engineering | 7 (100.0%) | 0 (0.0%) |
| Life, Physical & Social Science | 32 (100.0%) | 0 (0.0%) |
| Community & Social Service | 1 (3.0%) | 32 (97.0%) |
| Education, Arts & Media | 0 (0.0%) | 0 (0.0%) |
| Legal Services & Support | 0 (0.0%) | 0 (0.0%) |
| Education Instruction & Library | 1 (3.0%) | 32 (97.0%) |
| Arts, Media & Entertainment | 0 (0.0%) | 0 (0.0%) |
| Health Diagnosing & Treating | 0 (0.0%) | 36 (100.0%) |
| Health Technologists | 0 (0.0%) | 36 (100.0%) |
| Total (Category) | 141 (59.5%) | 96 (40.5%) |
| Total (Overall) | 588 (52.9%) | 523 (47.1%) |
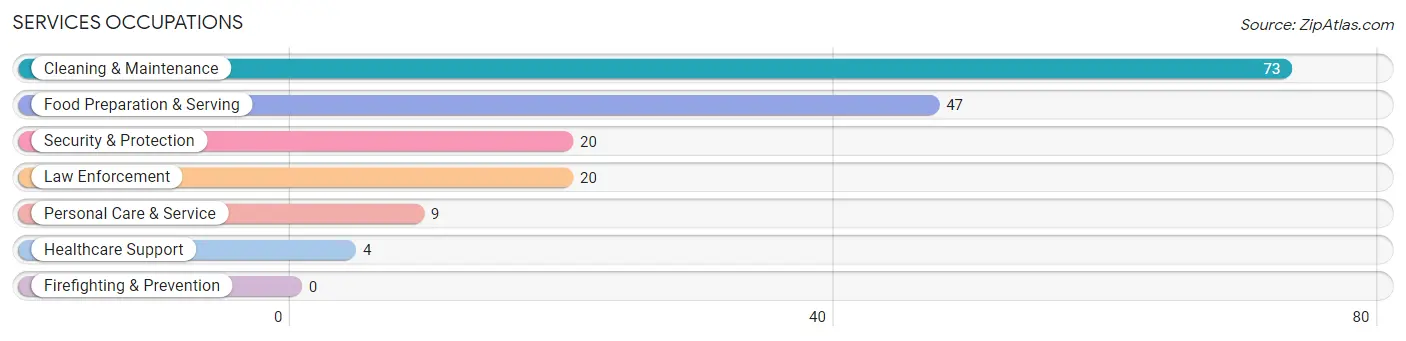
Services Occupations
The most common Services occupations in Eastpoint are Cleaning & Maintenance (73 | 6.6%), Food Preparation & Serving (47 | 4.2%), Security & Protection (20 | 1.8%), Law Enforcement (20 | 1.8%), and Personal Care & Service (9 | 0.8%).
Services Occupations by Sex
Within the Services occupations in Eastpoint, the most male-oriented occupations are Healthcare Support (100.0%), Security & Protection (100.0%), and Law Enforcement (100.0%), while the most female-oriented occupations are Food Preparation & Serving (83.0%), and Cleaning & Maintenance (65.7%).
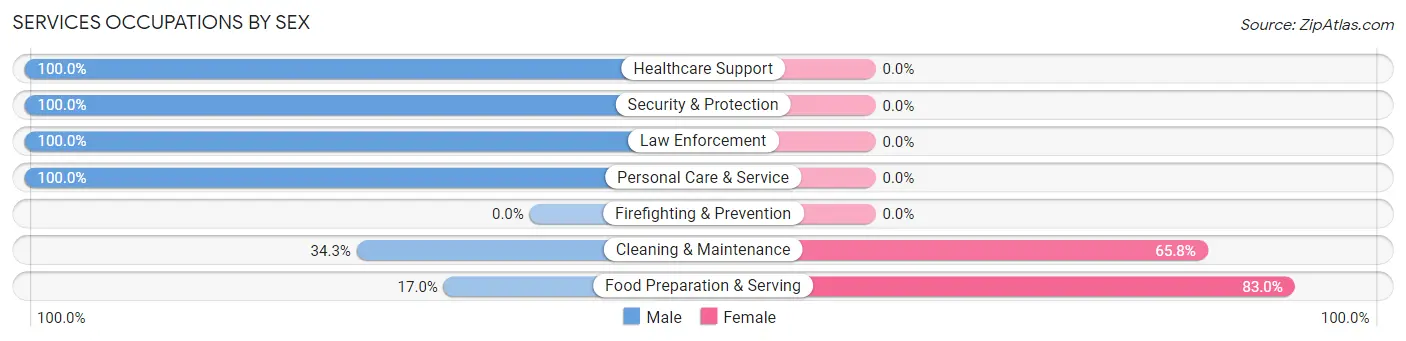
| Occupation | Male | Female |
| Healthcare Support | 4 (100.0%) | 0 (0.0%) |
| Security & Protection | 20 (100.0%) | 0 (0.0%) |
| Firefighting & Prevention | 0 (0.0%) | 0 (0.0%) |
| Law Enforcement | 20 (100.0%) | 0 (0.0%) |
| Food Preparation & Serving | 8 (17.0%) | 39 (83.0%) |
| Cleaning & Maintenance | 25 (34.3%) | 48 (65.7%) |
| Personal Care & Service | 9 (100.0%) | 0 (0.0%) |
| Total (Category) | 66 (43.1%) | 87 (56.9%) |
| Total (Overall) | 588 (52.9%) | 523 (47.1%) |
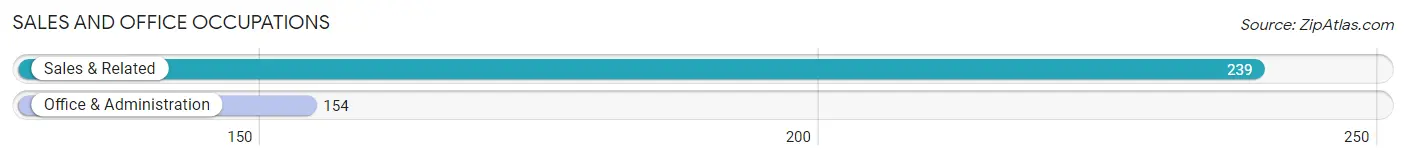
Sales and Office Occupations
The most common Sales and Office occupations in Eastpoint are Sales & Related (239 | 21.5%), and Office & Administration (154 | 13.9%).
Sales and Office Occupations by Sex
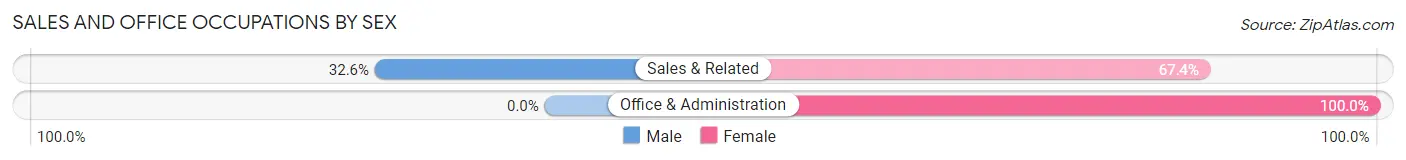
| Occupation | Male | Female |
| Sales & Related | 78 (32.6%) | 161 (67.4%) |
| Office & Administration | 0 (0.0%) | 154 (100.0%) |
| Total (Category) | 78 (19.9%) | 315 (80.1%) |
| Total (Overall) | 588 (52.9%) | 523 (47.1%) |
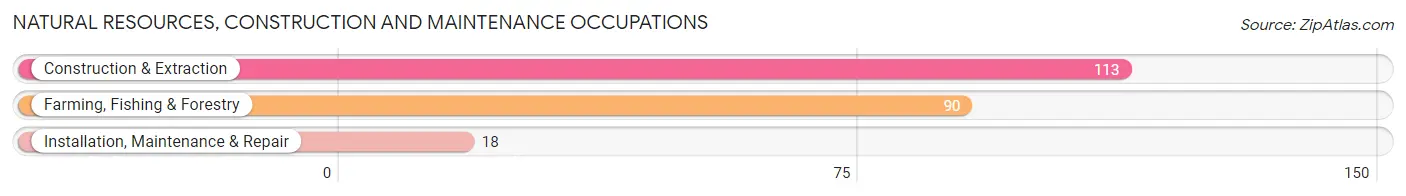
Natural Resources, Construction and Maintenance Occupations
The most common Natural Resources, Construction and Maintenance occupations in Eastpoint are Construction & Extraction (113 | 10.2%), Farming, Fishing & Forestry (90 | 8.1%), and Installation, Maintenance & Repair (18 | 1.6%).
Natural Resources, Construction and Maintenance Occupations by Sex
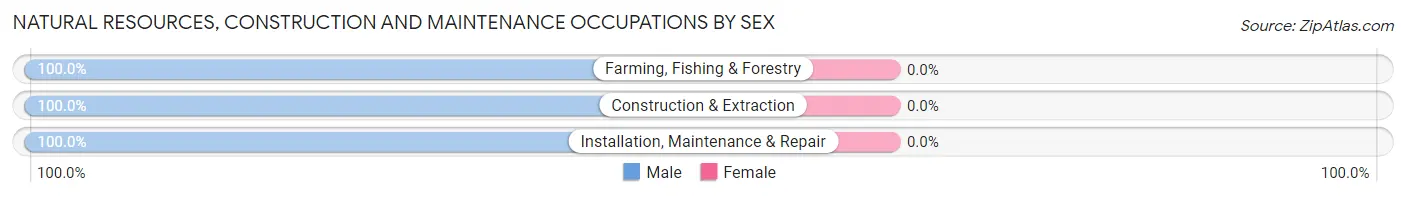
| Occupation | Male | Female |
| Farming, Fishing & Forestry | 90 (100.0%) | 0 (0.0%) |
| Construction & Extraction | 113 (100.0%) | 0 (0.0%) |
| Installation, Maintenance & Repair | 18 (100.0%) | 0 (0.0%) |
| Total (Category) | 221 (100.0%) | 0 (0.0%) |
| Total (Overall) | 588 (52.9%) | 523 (47.1%) |
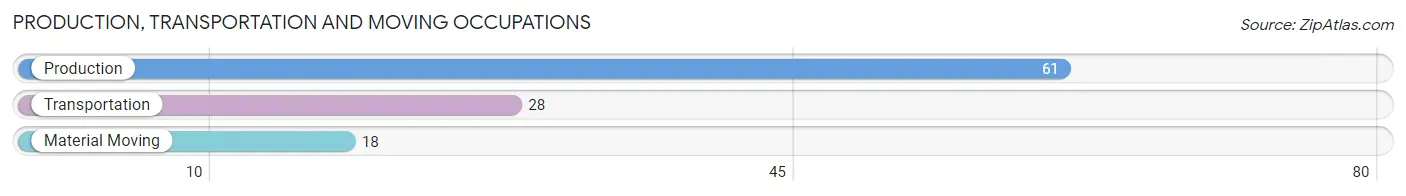
Production, Transportation and Moving Occupations
The most common Production, Transportation and Moving occupations in Eastpoint are Production (61 | 5.5%), Transportation (28 | 2.5%), and Material Moving (18 | 1.6%).
Production, Transportation and Moving Occupations by Sex
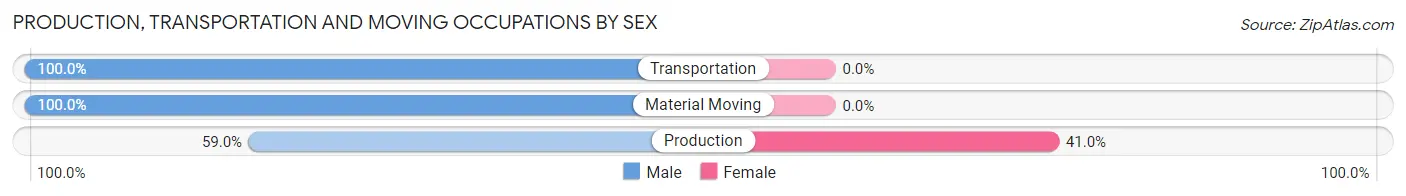
| Occupation | Male | Female |
| Production | 36 (59.0%) | 25 (41.0%) |
| Transportation | 28 (100.0%) | 0 (0.0%) |
| Material Moving | 18 (100.0%) | 0 (0.0%) |
| Total (Category) | 82 (76.6%) | 25 (23.4%) |
| Total (Overall) | 588 (52.9%) | 523 (47.1%) |
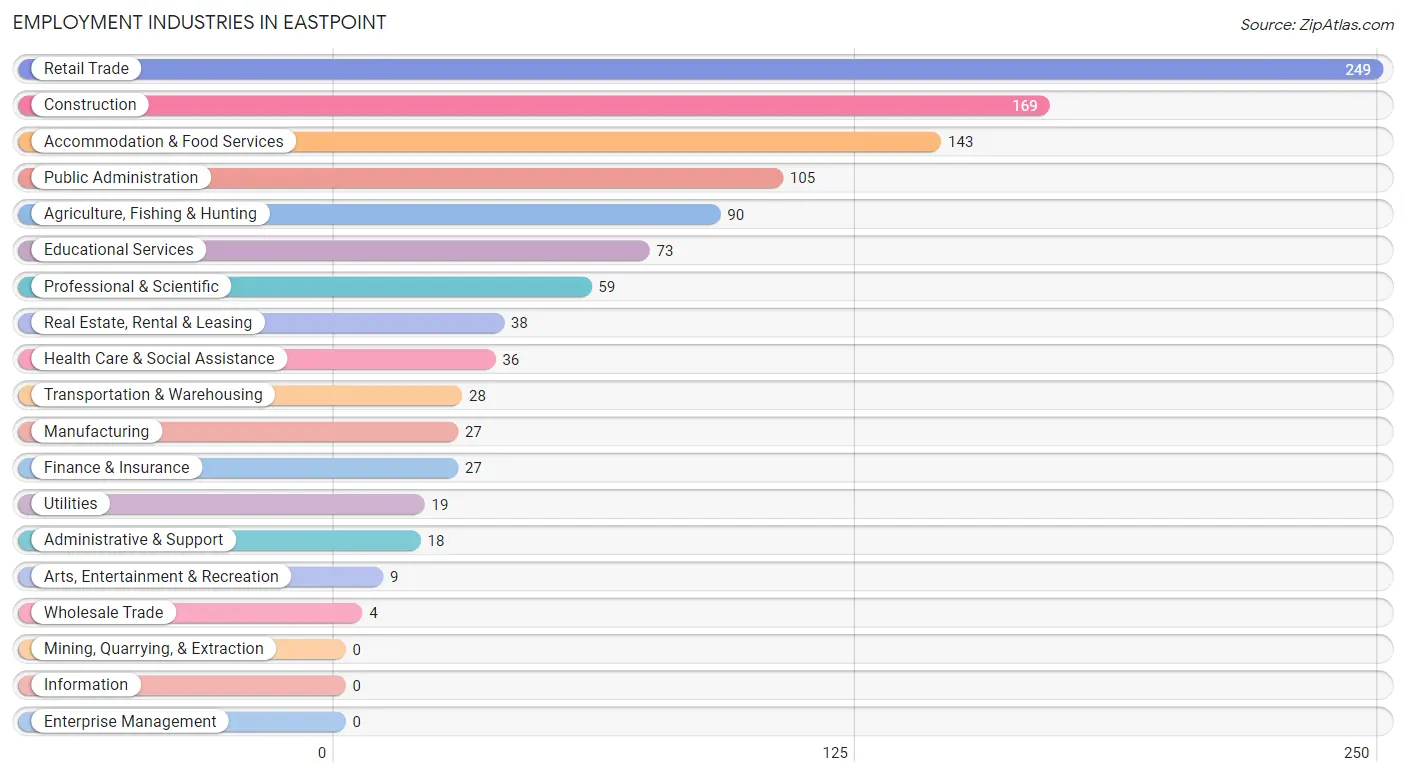
Employment Industries by Sex in Eastpoint
Employment Industries in Eastpoint
The major employment industries in Eastpoint include Retail Trade (249 | 22.4%), Construction (169 | 15.2%), Accommodation & Food Services (143 | 12.9%), Public Administration (105 | 9.5%), and Agriculture, Fishing & Hunting (90 | 8.1%).
Employment Industries by Sex in Eastpoint
The Eastpoint industries that see more men than women are Agriculture, Fishing & Hunting (100.0%), Construction (100.0%), and Manufacturing (100.0%), whereas the industries that tend to have a higher number of women are Wholesale Trade (100.0%), Real Estate, Rental & Leasing (100.0%), and Health Care & Social Assistance (100.0%).
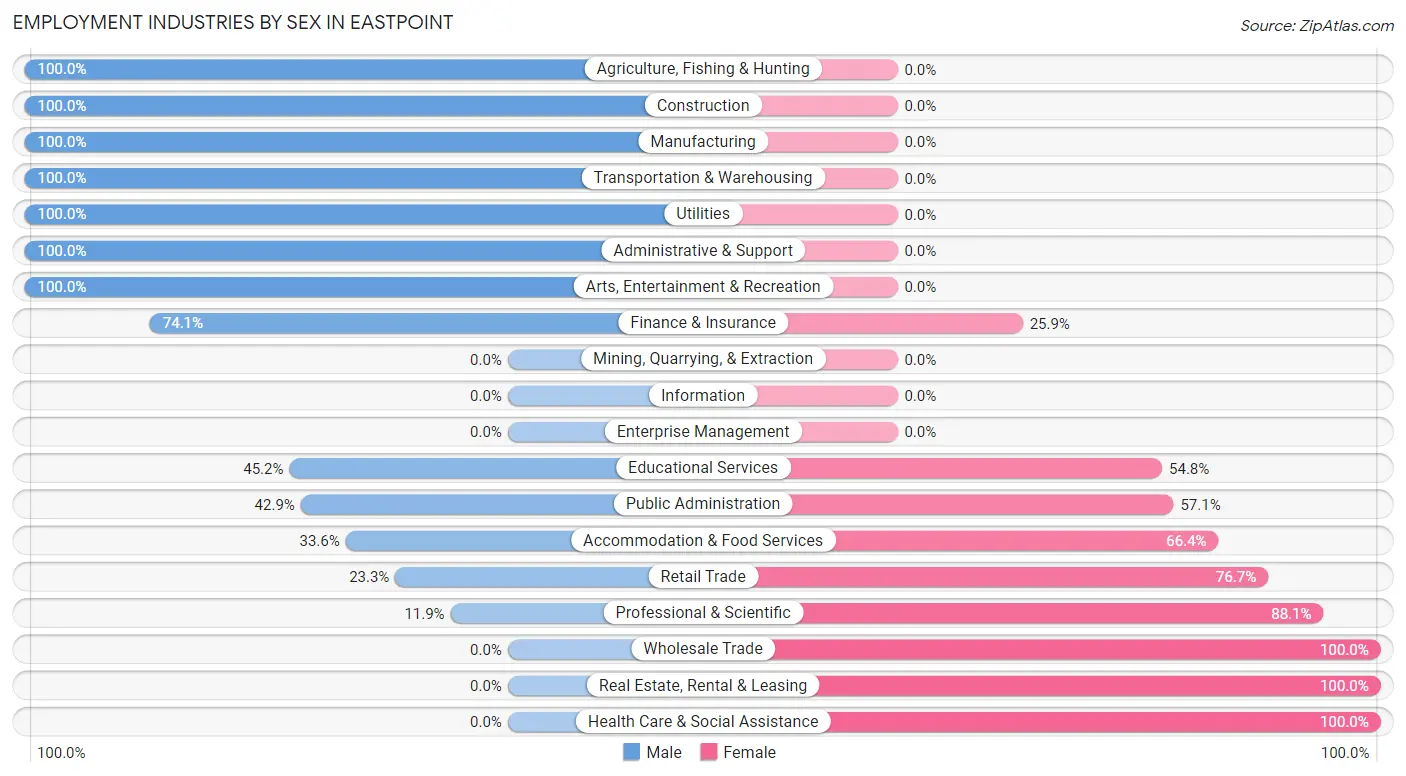
| Industry | Male | Female |
| Agriculture, Fishing & Hunting | 90 (100.0%) | 0 (0.0%) |
| Mining, Quarrying, & Extraction | 0 (0.0%) | 0 (0.0%) |
| Construction | 169 (100.0%) | 0 (0.0%) |
| Manufacturing | 27 (100.0%) | 0 (0.0%) |
| Wholesale Trade | 0 (0.0%) | 4 (100.0%) |
| Retail Trade | 58 (23.3%) | 191 (76.7%) |
| Transportation & Warehousing | 28 (100.0%) | 0 (0.0%) |
| Utilities | 19 (100.0%) | 0 (0.0%) |
| Information | 0 (0.0%) | 0 (0.0%) |
| Finance & Insurance | 20 (74.1%) | 7 (25.9%) |
| Real Estate, Rental & Leasing | 0 (0.0%) | 38 (100.0%) |
| Professional & Scientific | 7 (11.9%) | 52 (88.1%) |
| Enterprise Management | 0 (0.0%) | 0 (0.0%) |
| Administrative & Support | 18 (100.0%) | 0 (0.0%) |
| Educational Services | 33 (45.2%) | 40 (54.8%) |
| Health Care & Social Assistance | 0 (0.0%) | 36 (100.0%) |
| Arts, Entertainment & Recreation | 9 (100.0%) | 0 (0.0%) |
| Accommodation & Food Services | 48 (33.6%) | 95 (66.4%) |
| Public Administration | 45 (42.9%) | 60 (57.1%) |
| Total | 588 (52.9%) | 523 (47.1%) |
Education in Eastpoint
School Enrollment in Eastpoint
The most common levels of schooling among the 662 students in Eastpoint are high school (217 | 32.8%), middle school (182 | 27.5%), and elementary school (169 | 25.5%).
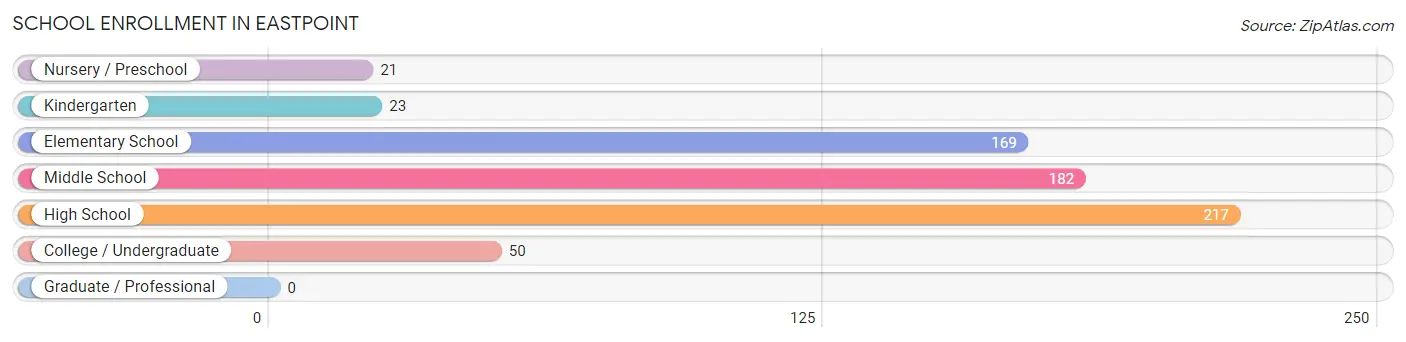
| School Level | # Students | % Students |
| Nursery / Preschool | 21 | 3.2% |
| Kindergarten | 23 | 3.5% |
| Elementary School | 169 | 25.5% |
| Middle School | 182 | 27.5% |
| High School | 217 | 32.8% |
| College / Undergraduate | 50 | 7.5% |
| Graduate / Professional | 0 | 0.0% |
| Total | 662 | 100.0% |
School Enrollment by Age by Funding Source in Eastpoint
Out of a total of 662 students who are enrolled in schools in Eastpoint, 33 (5.0%) attend a private institution, while the remaining 629 (95.0%) are enrolled in public schools. The age group of 5 to 9 year old has the highest likelihood of being enrolled in private schools, with 33 (19.6% in the age bracket) enrolled. Conversely, the age group of 3 to 4 year olds has the lowest likelihood of being enrolled in a private school, with 21 (100.0% in the age bracket) attending a public institution.
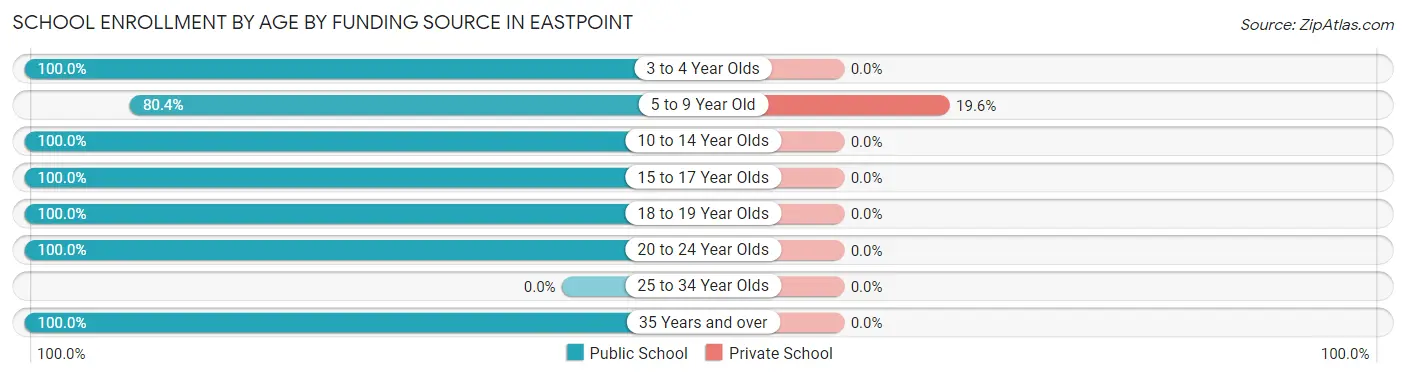
| Age Bracket | Public School | Private School |
| 3 to 4 Year Olds | 21 (100.0%) | 0 (0.0%) |
| 5 to 9 Year Old | 135 (80.4%) | 33 (19.6%) |
| 10 to 14 Year Olds | 223 (100.0%) | 0 (0.0%) |
| 15 to 17 Year Olds | 112 (100.0%) | 0 (0.0%) |
| 18 to 19 Year Olds | 88 (100.0%) | 0 (0.0%) |
| 20 to 24 Year Olds | 11 (100.0%) | 0 (0.0%) |
| 25 to 34 Year Olds | 0 (0.0%) | 0 (0.0%) |
| 35 Years and over | 39 (100.0%) | 0 (0.0%) |
| Total | 629 (95.0%) | 33 (5.0%) |
Educational Attainment by Field of Study in Eastpoint
Science & technology (92 | 28.6%), business (65 | 20.2%), bio, nature & agricultural (56 | 17.4%), education (37 | 11.5%), and multidisciplinary studies (17 | 5.3%) are the most common fields of study among 322 individuals in Eastpoint who have obtained a bachelor's degree or higher.
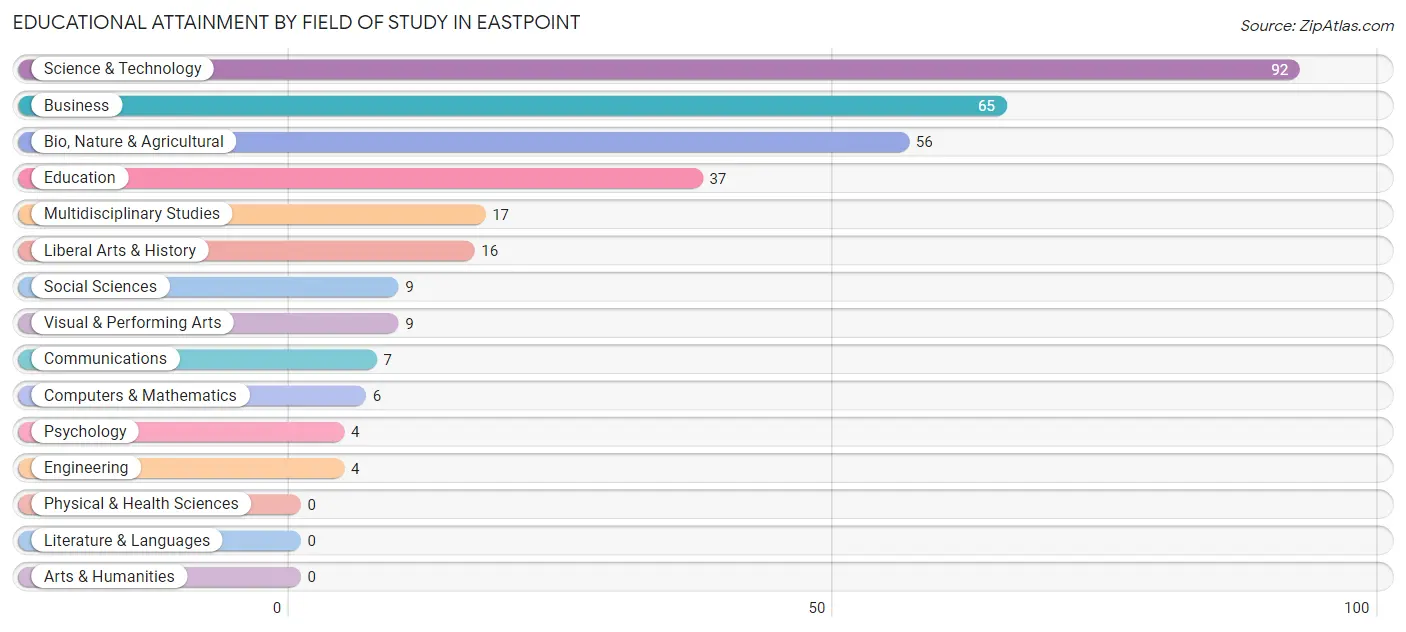
| Field of Study | # Graduates | % Graduates |
| Computers & Mathematics | 6 | 1.9% |
| Bio, Nature & Agricultural | 56 | 17.4% |
| Physical & Health Sciences | 0 | 0.0% |
| Psychology | 4 | 1.2% |
| Social Sciences | 9 | 2.8% |
| Engineering | 4 | 1.2% |
| Multidisciplinary Studies | 17 | 5.3% |
| Science & Technology | 92 | 28.6% |
| Business | 65 | 20.2% |
| Education | 37 | 11.5% |
| Literature & Languages | 0 | 0.0% |
| Liberal Arts & History | 16 | 5.0% |
| Visual & Performing Arts | 9 | 2.8% |
| Communications | 7 | 2.2% |
| Arts & Humanities | 0 | 0.0% |
| Total | 322 | 100.0% |
Transportation & Commute in Eastpoint
Vehicle Availability by Sex in Eastpoint
The most prevalent vehicle ownership categories in Eastpoint are males with 2 vehicles (360, accounting for 61.2%) and females with 2 vehicles (278, making up 69.9%).
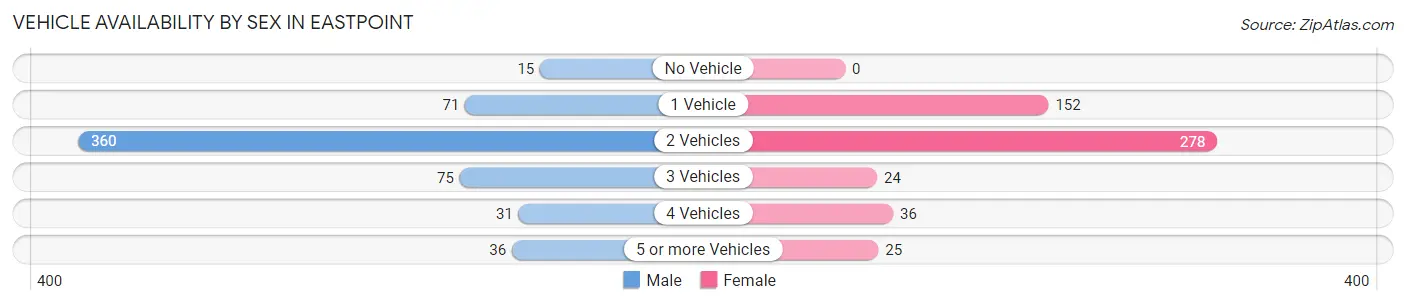
| Vehicles Available | Male | Female |
| No Vehicle | 15 (2.5%) | 0 (0.0%) |
| 1 Vehicle | 71 (12.1%) | 152 (29.5%) |
| 2 Vehicles | 360 (61.2%) | 278 (54.0%) |
| 3 Vehicles | 75 (12.8%) | 24 (4.7%) |
| 4 Vehicles | 31 (5.3%) | 36 (7.0%) |
| 5 or more Vehicles | 36 (6.1%) | 25 (4.9%) |
| Total | 588 (100.0%) | 515 (100.0%) |
Commute Time in Eastpoint
The most frequently occuring commute durations in Eastpoint are 15 to 19 minutes (230 commuters, 21.8%), 5 to 9 minutes (181 commuters, 17.2%), and less than 5 minutes (171 commuters, 16.2%).
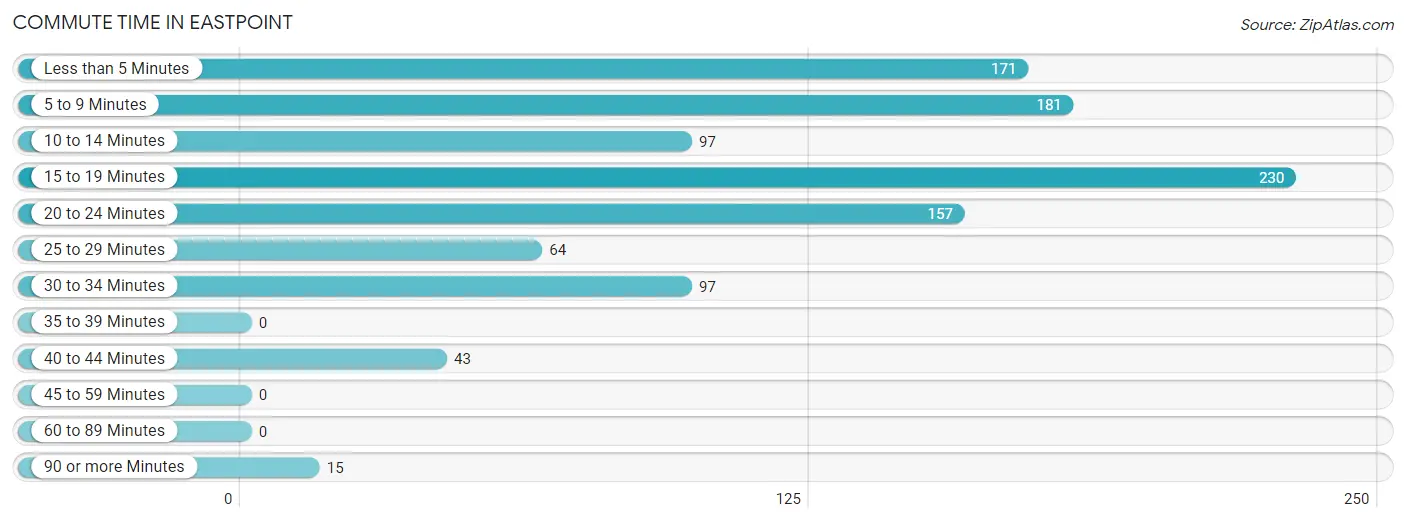
| Commute Time | # Commuters | % Commuters |
| Less than 5 Minutes | 171 | 16.2% |
| 5 to 9 Minutes | 181 | 17.2% |
| 10 to 14 Minutes | 97 | 9.2% |
| 15 to 19 Minutes | 230 | 21.8% |
| 20 to 24 Minutes | 157 | 14.9% |
| 25 to 29 Minutes | 64 | 6.1% |
| 30 to 34 Minutes | 97 | 9.2% |
| 35 to 39 Minutes | 0 | 0.0% |
| 40 to 44 Minutes | 43 | 4.1% |
| 45 to 59 Minutes | 0 | 0.0% |
| 60 to 89 Minutes | 0 | 0.0% |
| 90 or more Minutes | 15 | 1.4% |
Commute Time by Sex in Eastpoint
The most common commute times in Eastpoint are 15 to 19 minutes (106 commuters, 18.8%) for males and 5 to 9 minutes (125 commuters, 25.5%) for females.
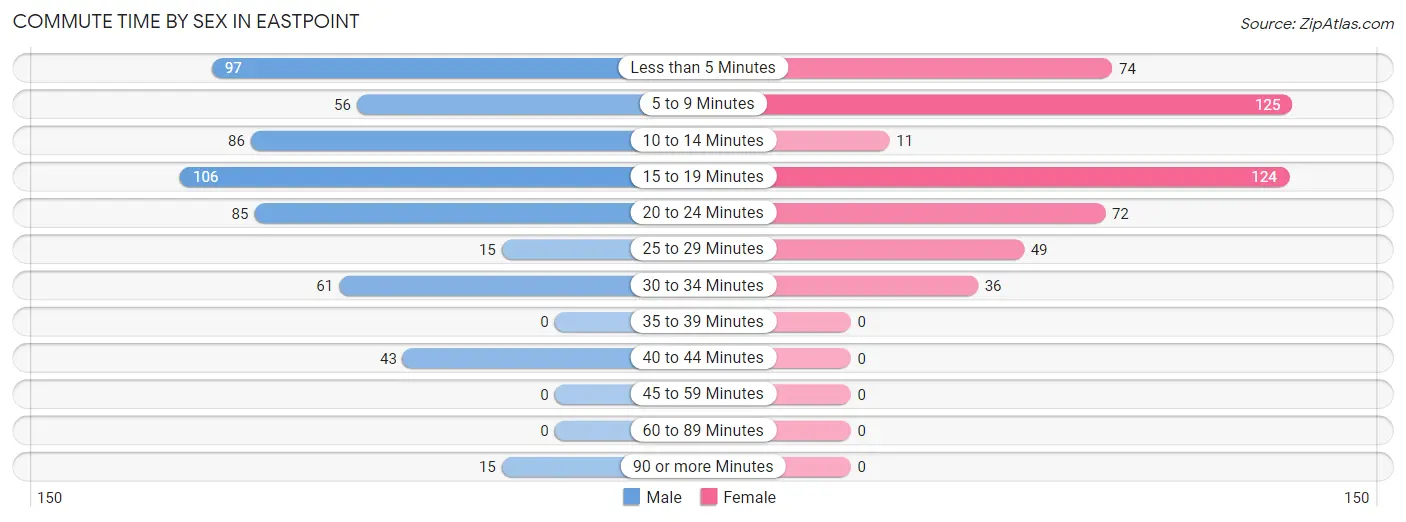
| Commute Time | Male | Female |
| Less than 5 Minutes | 97 (17.2%) | 74 (15.1%) |
| 5 to 9 Minutes | 56 (9.9%) | 125 (25.5%) |
| 10 to 14 Minutes | 86 (15.2%) | 11 (2.2%) |
| 15 to 19 Minutes | 106 (18.8%) | 124 (25.3%) |
| 20 to 24 Minutes | 85 (15.1%) | 72 (14.7%) |
| 25 to 29 Minutes | 15 (2.7%) | 49 (10.0%) |
| 30 to 34 Minutes | 61 (10.8%) | 36 (7.3%) |
| 35 to 39 Minutes | 0 (0.0%) | 0 (0.0%) |
| 40 to 44 Minutes | 43 (7.6%) | 0 (0.0%) |
| 45 to 59 Minutes | 0 (0.0%) | 0 (0.0%) |
| 60 to 89 Minutes | 0 (0.0%) | 0 (0.0%) |
| 90 or more Minutes | 15 (2.7%) | 0 (0.0%) |
Time of Departure to Work by Sex in Eastpoint
The most frequent times of departure to work in Eastpoint are 8:00 AM to 8:29 AM (176, 31.2%) for males and 8:00 AM to 8:29 AM (146, 29.7%) for females.
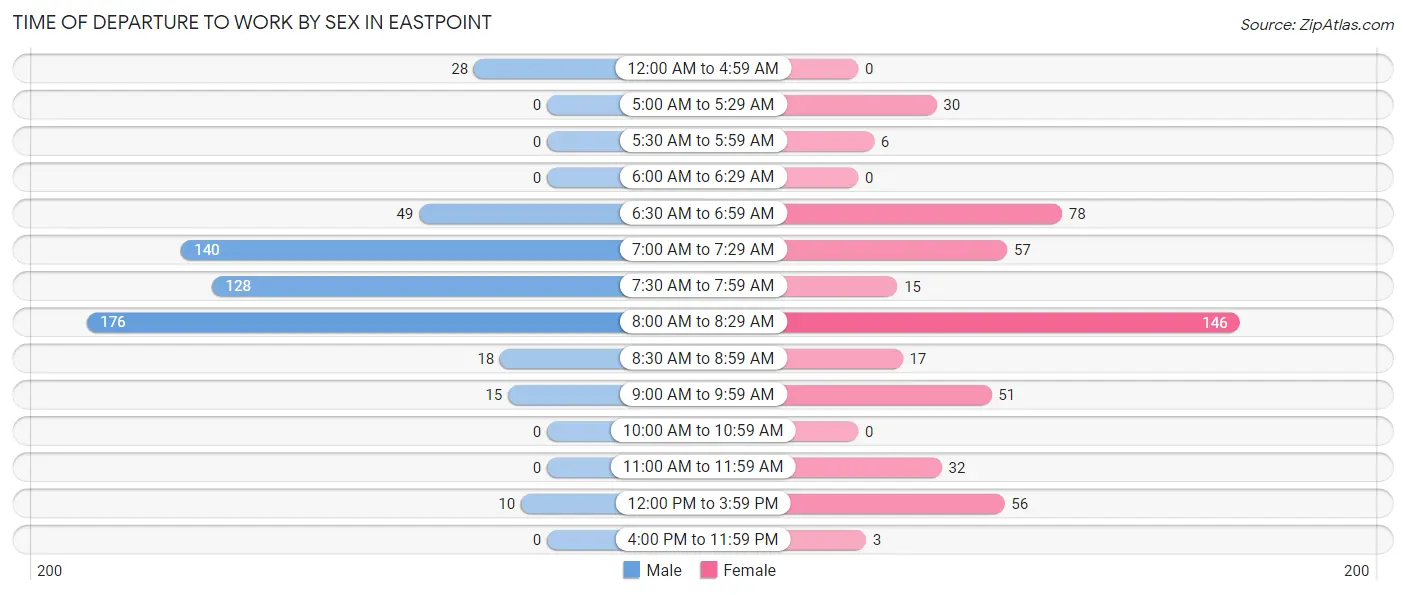
| Time of Departure | Male | Female |
| 12:00 AM to 4:59 AM | 28 (5.0%) | 0 (0.0%) |
| 5:00 AM to 5:29 AM | 0 (0.0%) | 30 (6.1%) |
| 5:30 AM to 5:59 AM | 0 (0.0%) | 6 (1.2%) |
| 6:00 AM to 6:29 AM | 0 (0.0%) | 0 (0.0%) |
| 6:30 AM to 6:59 AM | 49 (8.7%) | 78 (15.9%) |
| 7:00 AM to 7:29 AM | 140 (24.8%) | 57 (11.6%) |
| 7:30 AM to 7:59 AM | 128 (22.7%) | 15 (3.0%) |
| 8:00 AM to 8:29 AM | 176 (31.2%) | 146 (29.7%) |
| 8:30 AM to 8:59 AM | 18 (3.2%) | 17 (3.5%) |
| 9:00 AM to 9:59 AM | 15 (2.7%) | 51 (10.4%) |
| 10:00 AM to 10:59 AM | 0 (0.0%) | 0 (0.0%) |
| 11:00 AM to 11:59 AM | 0 (0.0%) | 32 (6.5%) |
| 12:00 PM to 3:59 PM | 10 (1.8%) | 56 (11.4%) |
| 4:00 PM to 11:59 PM | 0 (0.0%) | 3 (0.6%) |
| Total | 564 (100.0%) | 491 (100.0%) |
Housing Occupancy in Eastpoint
Occupancy by Ownership in Eastpoint
Of the total 1,046 dwellings in Eastpoint, owner-occupied units account for 852 (81.5%), while renter-occupied units make up 194 (18.5%).
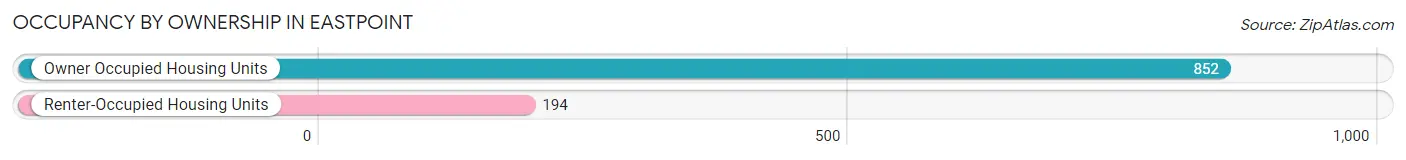
| Occupancy | # Housing Units | % Housing Units |
| Owner Occupied Housing Units | 852 | 81.5% |
| Renter-Occupied Housing Units | 194 | 18.5% |
| Total Occupied Housing Units | 1,046 | 100.0% |
Occupancy by Household Size in Eastpoint
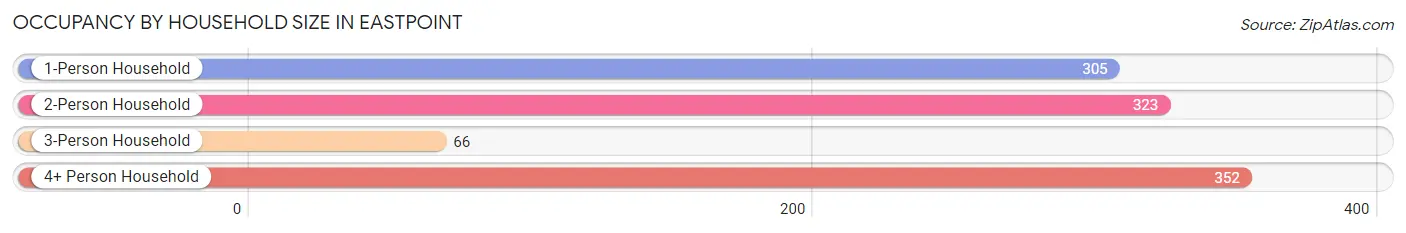
| Household Size | # Housing Units | % Housing Units |
| 1-Person Household | 305 | 29.2% |
| 2-Person Household | 323 | 30.9% |
| 3-Person Household | 66 | 6.3% |
| 4+ Person Household | 352 | 33.7% |
| Total Housing Units | 1,046 | 100.0% |
Occupancy by Ownership by Household Size in Eastpoint
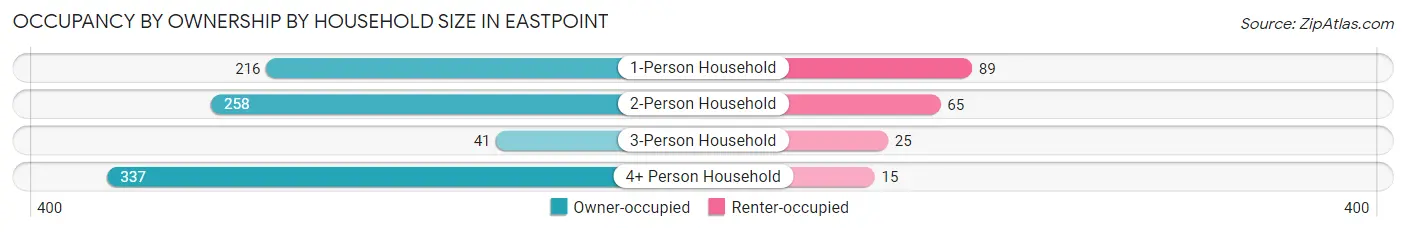
| Household Size | Owner-occupied | Renter-occupied |
| 1-Person Household | 216 (70.8%) | 89 (29.2%) |
| 2-Person Household | 258 (79.9%) | 65 (20.1%) |
| 3-Person Household | 41 (62.1%) | 25 (37.9%) |
| 4+ Person Household | 337 (95.7%) | 15 (4.3%) |
| Total Housing Units | 852 (81.5%) | 194 (18.5%) |
Occupancy by Educational Attainment in Eastpoint
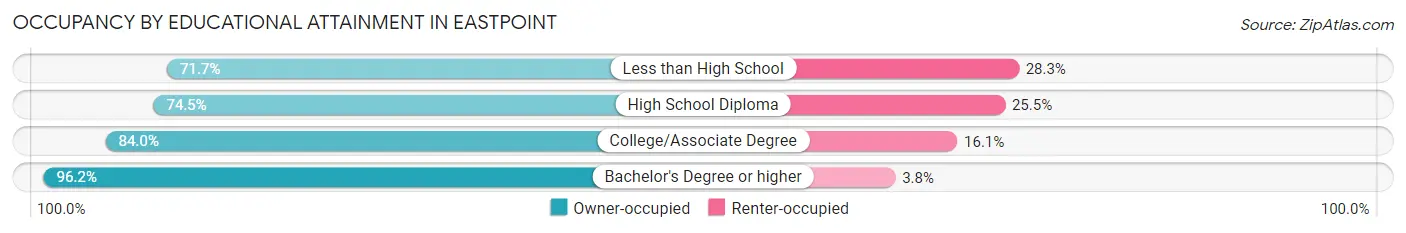
| Household Size | Owner-occupied | Renter-occupied |
| Less than High School | 99 (71.7%) | 39 (28.3%) |
| High School Diploma | 277 (74.5%) | 95 (25.5%) |
| College/Associate Degree | 272 (84.0%) | 52 (16.1%) |
| Bachelor's Degree or higher | 204 (96.2%) | 8 (3.8%) |
Occupancy by Age of Householder in Eastpoint
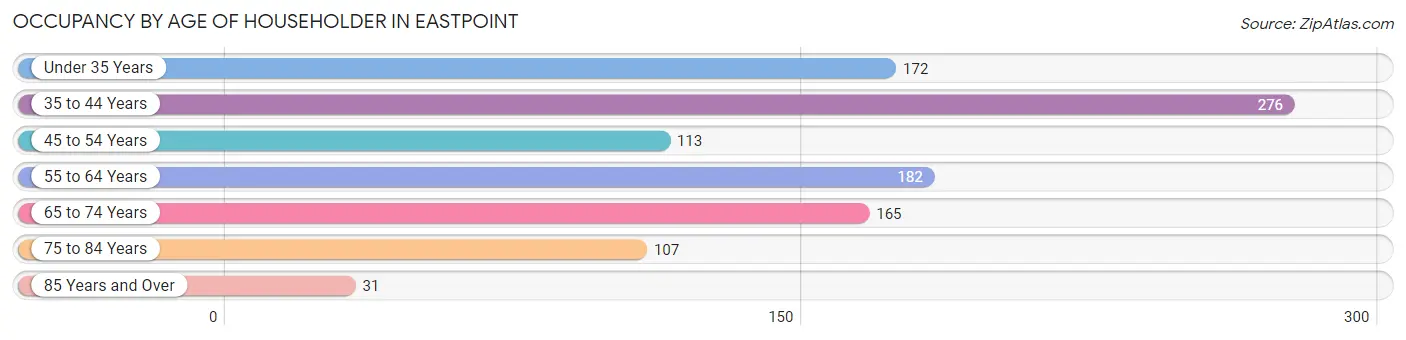
| Age Bracket | # Households | % Households |
| Under 35 Years | 172 | 16.4% |
| 35 to 44 Years | 276 | 26.4% |
| 45 to 54 Years | 113 | 10.8% |
| 55 to 64 Years | 182 | 17.4% |
| 65 to 74 Years | 165 | 15.8% |
| 75 to 84 Years | 107 | 10.2% |
| 85 Years and Over | 31 | 3.0% |
| Total | 1,046 | 100.0% |
Housing Finances in Eastpoint
Median Income by Occupancy in Eastpoint
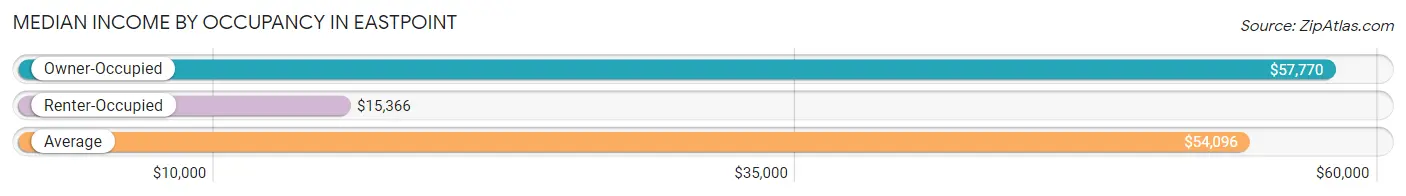
| Occupancy Type | # Households | Median Income |
| Owner-Occupied | 852 (81.5%) | $57,770 |
| Renter-Occupied | 194 (18.5%) | $15,366 |
| Average | 1,046 (100.0%) | $54,096 |
Occupancy by Householder Income Bracket in Eastpoint
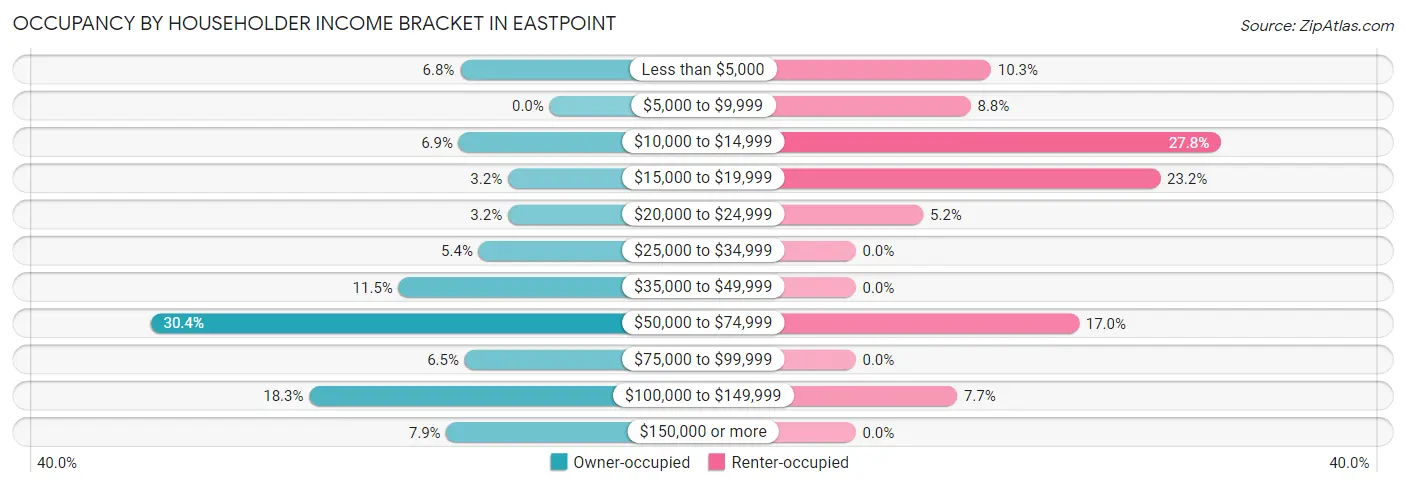
| Income Bracket | Owner-occupied | Renter-occupied |
| Less than $5,000 | 58 (6.8%) | 20 (10.3%) |
| $5,000 to $9,999 | 0 (0.0%) | 17 (8.8%) |
| $10,000 to $14,999 | 59 (6.9%) | 54 (27.8%) |
| $15,000 to $19,999 | 27 (3.2%) | 45 (23.2%) |
| $20,000 to $24,999 | 27 (3.2%) | 10 (5.1%) |
| $25,000 to $34,999 | 46 (5.4%) | 0 (0.0%) |
| $35,000 to $49,999 | 98 (11.5%) | 0 (0.0%) |
| $50,000 to $74,999 | 259 (30.4%) | 33 (17.0%) |
| $75,000 to $99,999 | 55 (6.5%) | 0 (0.0%) |
| $100,000 to $149,999 | 156 (18.3%) | 15 (7.7%) |
| $150,000 or more | 67 (7.9%) | 0 (0.0%) |
| Total | 852 (100.0%) | 194 (100.0%) |
Monthly Housing Cost Tiers in Eastpoint
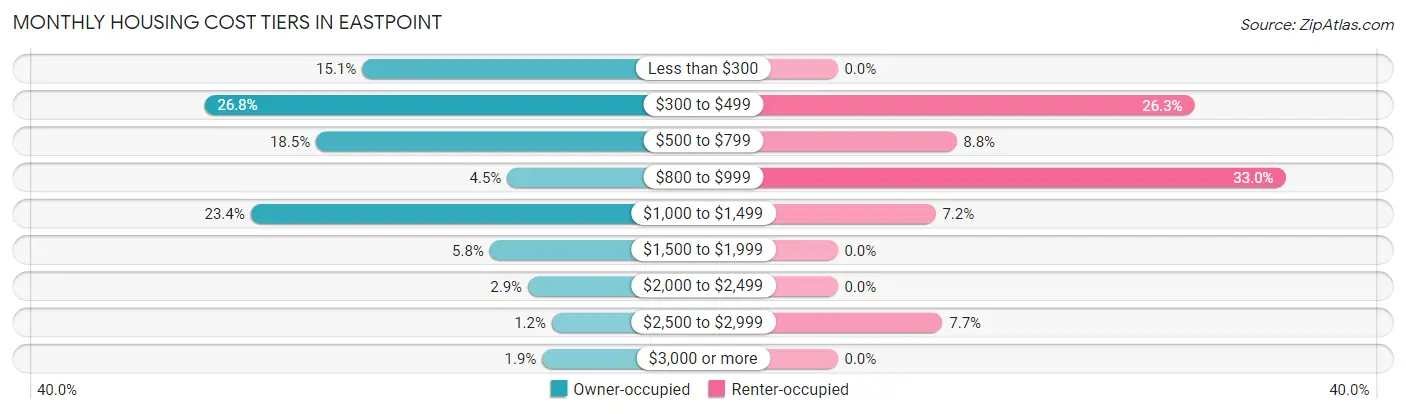
| Monthly Cost | Owner-occupied | Renter-occupied |
| Less than $300 | 129 (15.1%) | 0 (0.0%) |
| $300 to $499 | 228 (26.8%) | 51 (26.3%) |
| $500 to $799 | 158 (18.5%) | 17 (8.8%) |
| $800 to $999 | 38 (4.5%) | 64 (33.0%) |
| $1,000 to $1,499 | 199 (23.4%) | 14 (7.2%) |
| $1,500 to $1,999 | 49 (5.8%) | 0 (0.0%) |
| $2,000 to $2,499 | 25 (2.9%) | 0 (0.0%) |
| $2,500 to $2,999 | 10 (1.2%) | 15 (7.7%) |
| $3,000 or more | 16 (1.9%) | 0 (0.0%) |
| Total | 852 (100.0%) | 194 (100.0%) |
Physical Housing Characteristics in Eastpoint
Housing Structures in Eastpoint
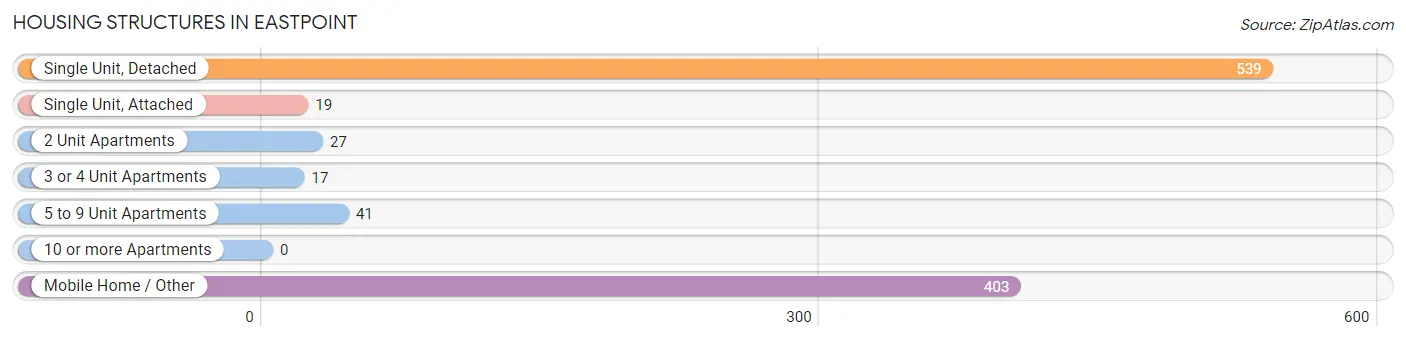
| Structure Type | # Housing Units | % Housing Units |
| Single Unit, Detached | 539 | 51.5% |
| Single Unit, Attached | 19 | 1.8% |
| 2 Unit Apartments | 27 | 2.6% |
| 3 or 4 Unit Apartments | 17 | 1.6% |
| 5 to 9 Unit Apartments | 41 | 3.9% |
| 10 or more Apartments | 0 | 0.0% |
| Mobile Home / Other | 403 | 38.5% |
| Total | 1,046 | 100.0% |
Housing Structures by Occupancy in Eastpoint
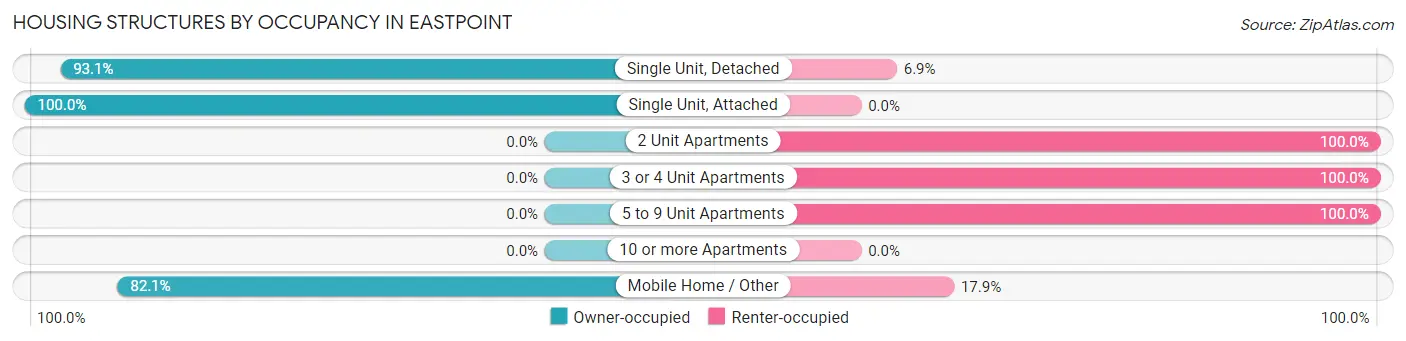
| Structure Type | Owner-occupied | Renter-occupied |
| Single Unit, Detached | 502 (93.1%) | 37 (6.9%) |
| Single Unit, Attached | 19 (100.0%) | 0 (0.0%) |
| 2 Unit Apartments | 0 (0.0%) | 27 (100.0%) |
| 3 or 4 Unit Apartments | 0 (0.0%) | 17 (100.0%) |
| 5 to 9 Unit Apartments | 0 (0.0%) | 41 (100.0%) |
| 10 or more Apartments | 0 (0.0%) | 0 (0.0%) |
| Mobile Home / Other | 331 (82.1%) | 72 (17.9%) |
| Total | 852 (81.5%) | 194 (18.5%) |
Housing Structures by Number of Rooms in Eastpoint
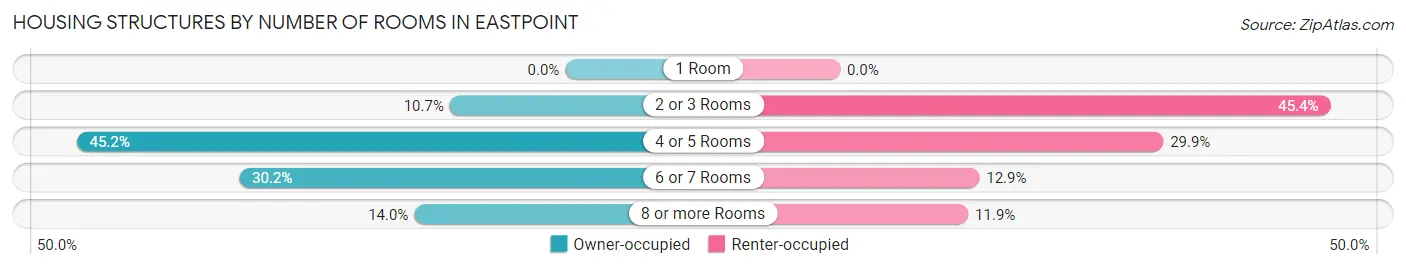
| Number of Rooms | Owner-occupied | Renter-occupied |
| 1 Room | 0 (0.0%) | 0 (0.0%) |
| 2 or 3 Rooms | 91 (10.7%) | 88 (45.4%) |
| 4 or 5 Rooms | 385 (45.2%) | 58 (29.9%) |
| 6 or 7 Rooms | 257 (30.2%) | 25 (12.9%) |
| 8 or more Rooms | 119 (14.0%) | 23 (11.9%) |
| Total | 852 (100.0%) | 194 (100.0%) |
Housing Structure by Heating Type in Eastpoint
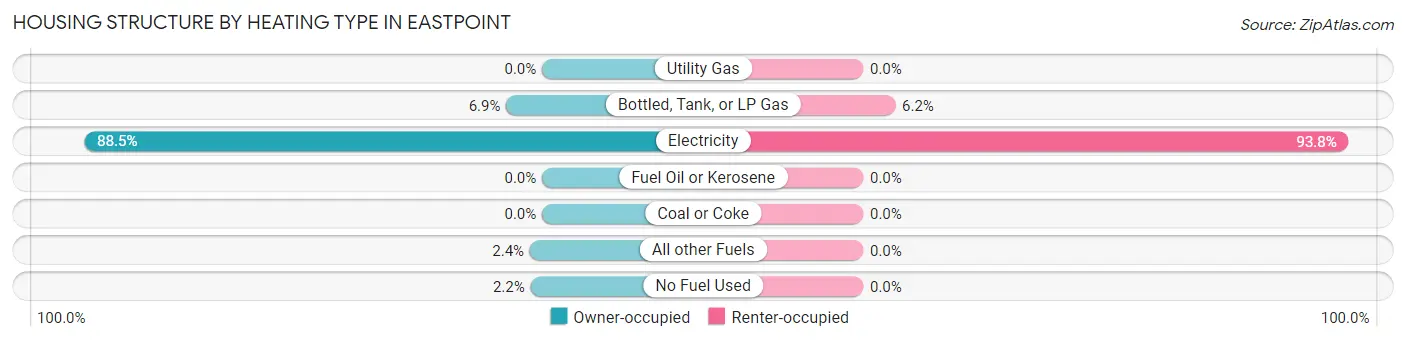
| Heating Type | Owner-occupied | Renter-occupied |
| Utility Gas | 0 (0.0%) | 0 (0.0%) |
| Bottled, Tank, or LP Gas | 59 (6.9%) | 12 (6.2%) |
| Electricity | 754 (88.5%) | 182 (93.8%) |
| Fuel Oil or Kerosene | 0 (0.0%) | 0 (0.0%) |
| Coal or Coke | 0 (0.0%) | 0 (0.0%) |
| All other Fuels | 20 (2.4%) | 0 (0.0%) |
| No Fuel Used | 19 (2.2%) | 0 (0.0%) |
| Total | 852 (100.0%) | 194 (100.0%) |
Household Vehicle Usage in Eastpoint
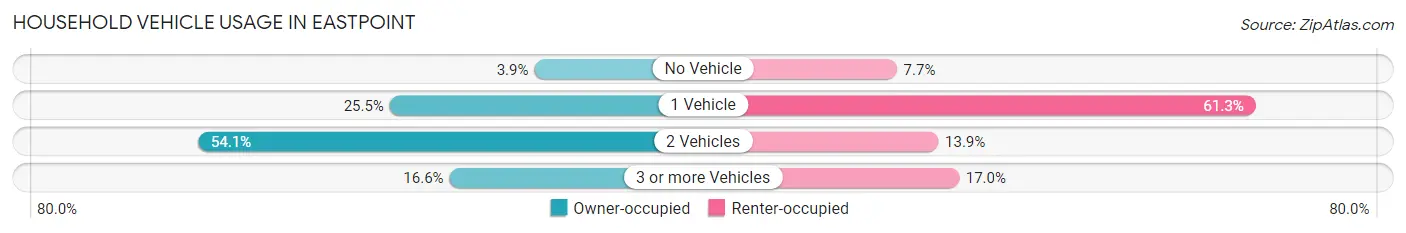
| Vehicles per Household | Owner-occupied | Renter-occupied |
| No Vehicle | 33 (3.9%) | 15 (7.7%) |
| 1 Vehicle | 217 (25.5%) | 119 (61.3%) |
| 2 Vehicles | 461 (54.1%) | 27 (13.9%) |
| 3 or more Vehicles | 141 (16.6%) | 33 (17.0%) |
| Total | 852 (100.0%) | 194 (100.0%) |
Real Estate & Mortgages in Eastpoint
Real Estate and Mortgage Overview in Eastpoint
| Characteristic | Without Mortgage | With Mortgage |
| Housing Units | 442 | 410 |
| Median Property Value | $104,800 | $225,400 |
| Median Household Income | $44,589 | $36 |
| Monthly Housing Costs | $412 | $16 |
| Real Estate Taxes | $369 | $41 |
Property Value by Mortgage Status in Eastpoint
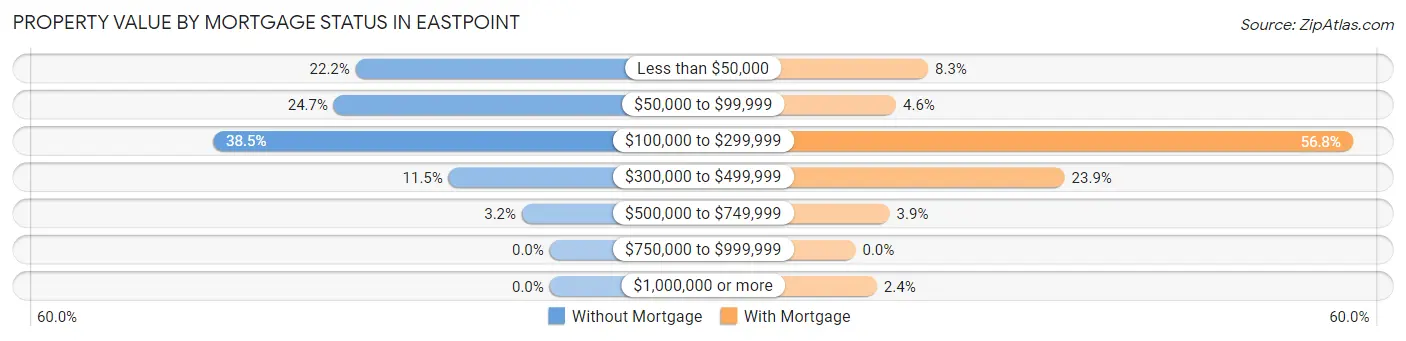
| Property Value | Without Mortgage | With Mortgage |
| Less than $50,000 | 98 (22.2%) | 34 (8.3%) |
| $50,000 to $99,999 | 109 (24.7%) | 19 (4.6%) |
| $100,000 to $299,999 | 170 (38.5%) | 233 (56.8%) |
| $300,000 to $499,999 | 51 (11.5%) | 98 (23.9%) |
| $500,000 to $749,999 | 14 (3.2%) | 16 (3.9%) |
| $750,000 to $999,999 | 0 (0.0%) | 0 (0.0%) |
| $1,000,000 or more | 0 (0.0%) | 10 (2.4%) |
| Total | 442 (100.0%) | 410 (100.0%) |
Household Income by Mortgage Status in Eastpoint
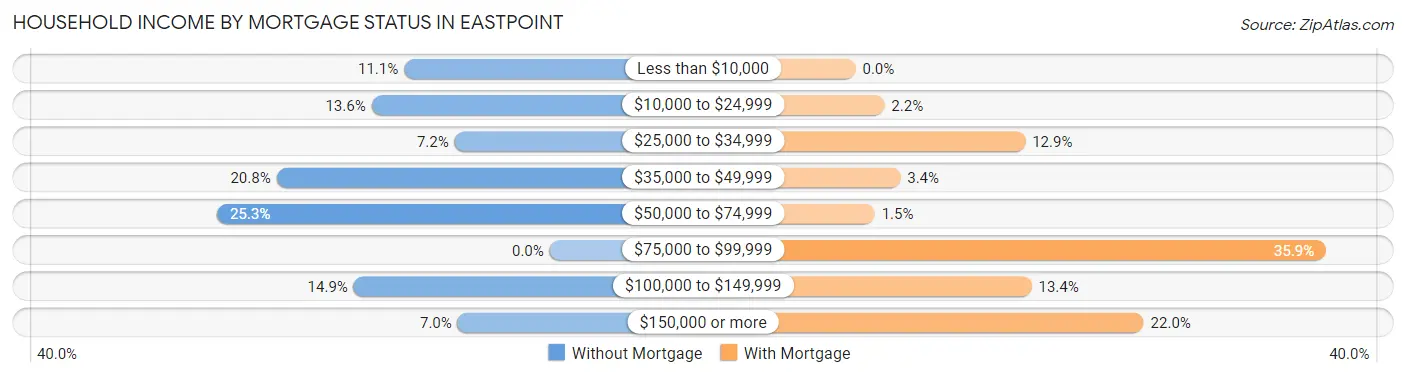
| Household Income | Without Mortgage | With Mortgage |
| Less than $10,000 | 49 (11.1%) | 0 (0.0%) |
| $10,000 to $24,999 | 60 (13.6%) | 9 (2.2%) |
| $25,000 to $34,999 | 32 (7.2%) | 53 (12.9%) |
| $35,000 to $49,999 | 92 (20.8%) | 14 (3.4%) |
| $50,000 to $74,999 | 112 (25.3%) | 6 (1.5%) |
| $75,000 to $99,999 | 0 (0.0%) | 147 (35.8%) |
| $100,000 to $149,999 | 66 (14.9%) | 55 (13.4%) |
| $150,000 or more | 31 (7.0%) | 90 (22.0%) |
| Total | 442 (100.0%) | 410 (100.0%) |
Property Value to Household Income Ratio in Eastpoint
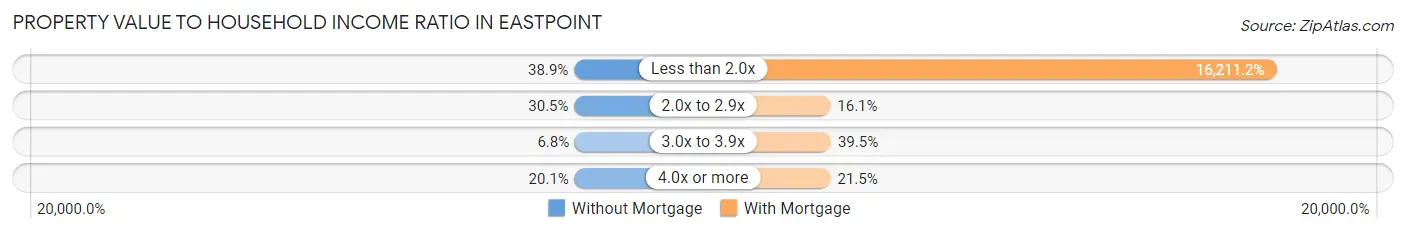
| Value-to-Income Ratio | Without Mortgage | With Mortgage |
| Less than 2.0x | 172 (38.9%) | 66,466 (16,211.2%) |
| 2.0x to 2.9x | 135 (30.5%) | 66 (16.1%) |
| 3.0x to 3.9x | 30 (6.8%) | 162 (39.5%) |
| 4.0x or more | 89 (20.1%) | 88 (21.5%) |
| Total | 442 (100.0%) | 410 (100.0%) |
Real Estate Taxes by Mortgage Status in Eastpoint
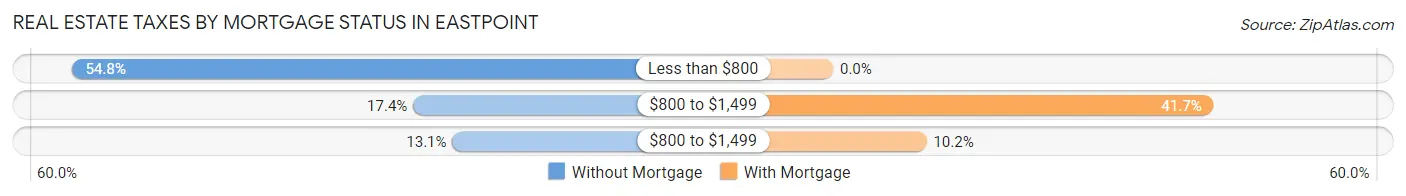
| Property Taxes | Without Mortgage | With Mortgage |
| Less than $800 | 242 (54.7%) | 0 (0.0%) |
| $800 to $1,499 | 77 (17.4%) | 171 (41.7%) |
| $800 to $1,499 | 58 (13.1%) | 42 (10.2%) |
| Total | 442 (100.0%) | 410 (100.0%) |
Health & Disability in Eastpoint
Health Insurance Coverage by Age in Eastpoint
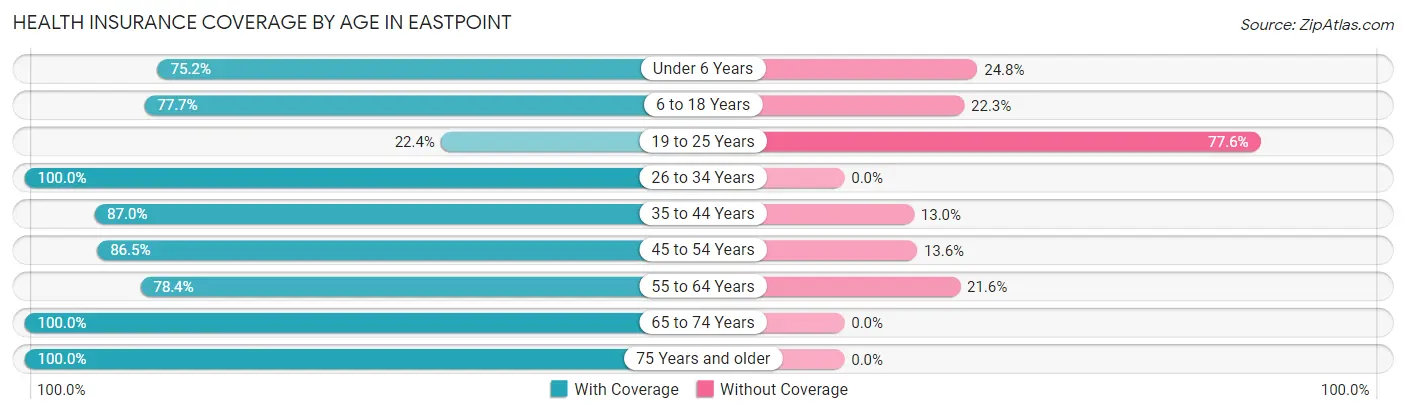
| Age Bracket | With Coverage | Without Coverage |
| Under 6 Years | 97 (75.2%) | 32 (24.8%) |
| 6 to 18 Years | 459 (77.7%) | 132 (22.3%) |
| 19 to 25 Years | 26 (22.4%) | 90 (77.6%) |
| 26 to 34 Years | 202 (100.0%) | 0 (0.0%) |
| 35 to 44 Years | 396 (87.0%) | 59 (13.0%) |
| 45 to 54 Years | 338 (86.5%) | 53 (13.6%) |
| 55 to 64 Years | 236 (78.4%) | 65 (21.6%) |
| 65 to 74 Years | 221 (100.0%) | 0 (0.0%) |
| 75 Years and older | 218 (100.0%) | 0 (0.0%) |
| Total | 2,193 (83.6%) | 431 (16.4%) |
Health Insurance Coverage by Citizenship Status in Eastpoint
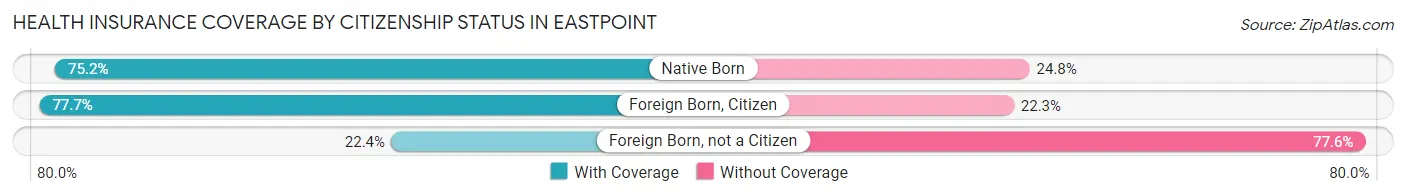
| Citizenship Status | With Coverage | Without Coverage |
| Native Born | 97 (75.2%) | 32 (24.8%) |
| Foreign Born, Citizen | 459 (77.7%) | 132 (22.3%) |
| Foreign Born, not a Citizen | 26 (22.4%) | 90 (77.6%) |
Health Insurance Coverage by Household Income in Eastpoint
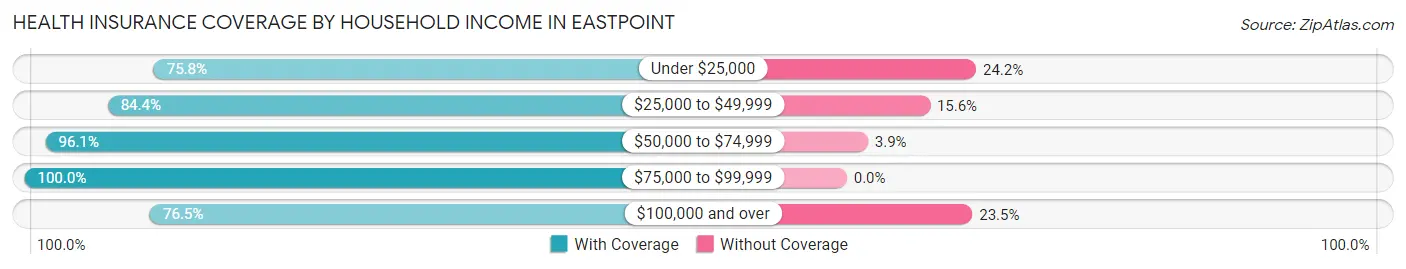
| Household Income | With Coverage | Without Coverage |
| Under $25,000 | 457 (75.8%) | 146 (24.2%) |
| $25,000 to $49,999 | 271 (84.4%) | 50 (15.6%) |
| $50,000 to $74,999 | 682 (96.1%) | 28 (3.9%) |
| $75,000 to $99,999 | 110 (100.0%) | 0 (0.0%) |
| $100,000 and over | 673 (76.5%) | 207 (23.5%) |
Public vs Private Health Insurance Coverage by Age in Eastpoint
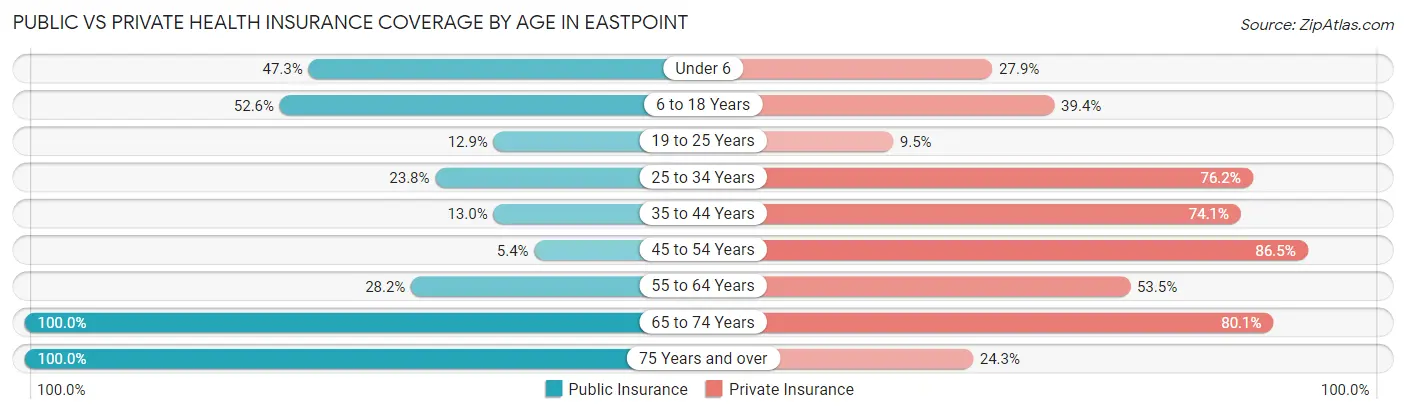
| Age Bracket | Public Insurance | Private Insurance |
| Under 6 | 61 (47.3%) | 36 (27.9%) |
| 6 to 18 Years | 311 (52.6%) | 233 (39.4%) |
| 19 to 25 Years | 15 (12.9%) | 11 (9.5%) |
| 25 to 34 Years | 48 (23.8%) | 154 (76.2%) |
| 35 to 44 Years | 59 (13.0%) | 337 (74.1%) |
| 45 to 54 Years | 21 (5.4%) | 338 (86.5%) |
| 55 to 64 Years | 85 (28.2%) | 161 (53.5%) |
| 65 to 74 Years | 221 (100.0%) | 177 (80.1%) |
| 75 Years and over | 218 (100.0%) | 53 (24.3%) |
| Total | 1,039 (39.6%) | 1,500 (57.2%) |
Disability Status by Sex by Age in Eastpoint
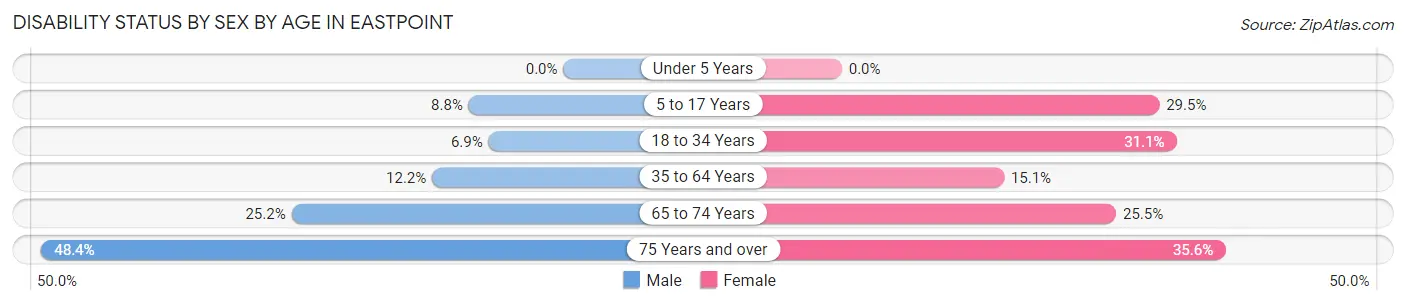
| Age Bracket | Male | Female |
| Under 5 Years | 0 (0.0%) | 0 (0.0%) |
| 5 to 17 Years | 23 (8.8%) | 71 (29.5%) |
| 18 to 34 Years | 15 (6.9%) | 59 (31.0%) |
| 35 to 64 Years | 62 (12.2%) | 96 (15.0%) |
| 65 to 74 Years | 28 (25.2%) | 28 (25.5%) |
| 75 Years and over | 62 (48.4%) | 32 (35.6%) |
Disability Class by Sex by Age in Eastpoint
Disability Class: Hearing Difficulty
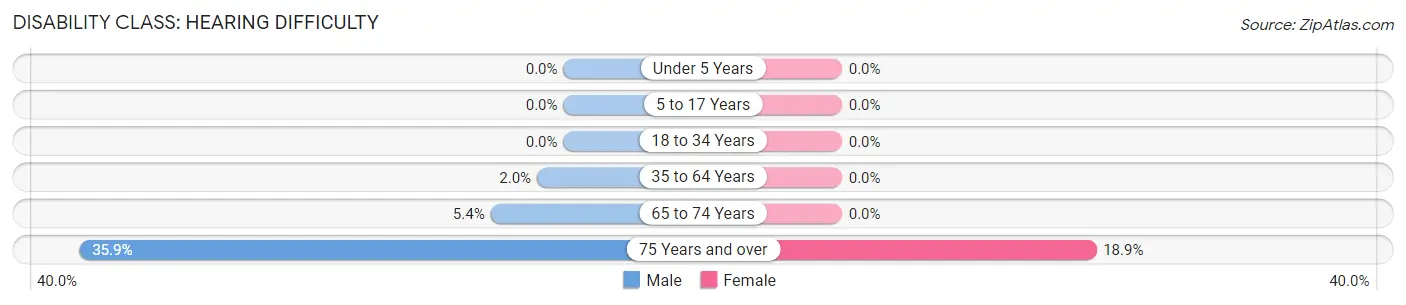
| Age Bracket | Male | Female |
| Under 5 Years | 0 (0.0%) | 0 (0.0%) |
| 5 to 17 Years | 0 (0.0%) | 0 (0.0%) |
| 18 to 34 Years | 0 (0.0%) | 0 (0.0%) |
| 35 to 64 Years | 10 (2.0%) | 0 (0.0%) |
| 65 to 74 Years | 6 (5.4%) | 0 (0.0%) |
| 75 Years and over | 46 (35.9%) | 17 (18.9%) |
Disability Class: Vision Difficulty
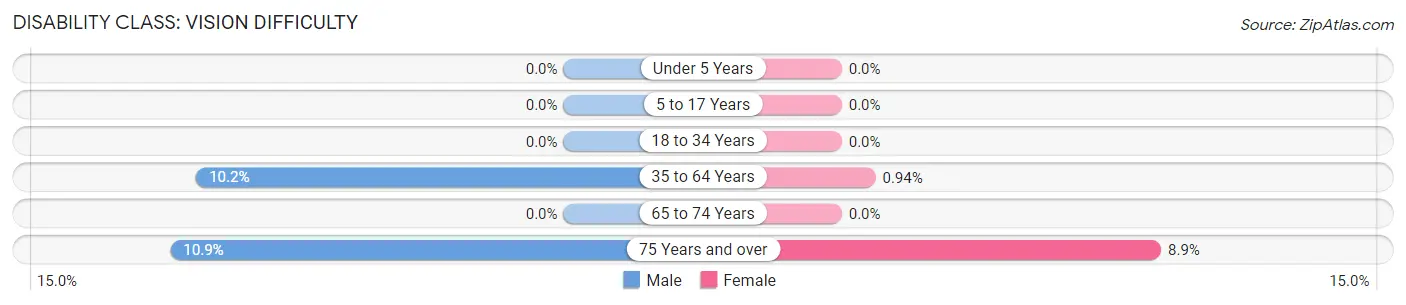
| Age Bracket | Male | Female |
| Under 5 Years | 0 (0.0%) | 0 (0.0%) |
| 5 to 17 Years | 0 (0.0%) | 0 (0.0%) |
| 18 to 34 Years | 0 (0.0%) | 0 (0.0%) |
| 35 to 64 Years | 52 (10.2%) | 6 (0.9%) |
| 65 to 74 Years | 0 (0.0%) | 0 (0.0%) |
| 75 Years and over | 14 (10.9%) | 8 (8.9%) |
Disability Class: Cognitive Difficulty
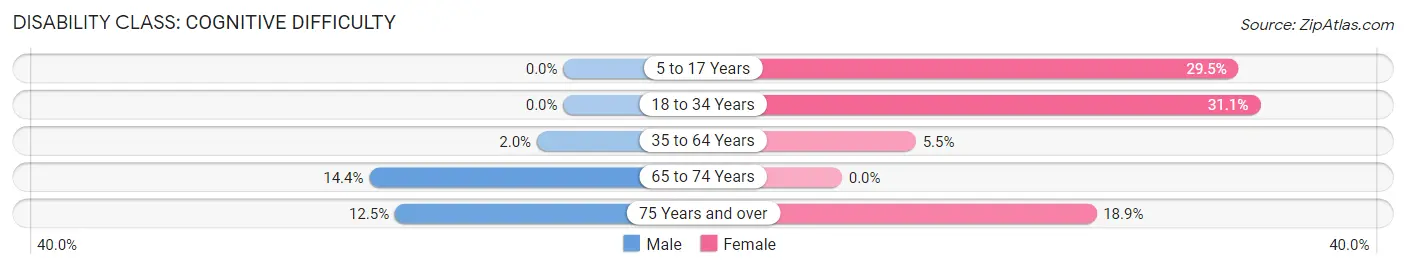
| Age Bracket | Male | Female |
| 5 to 17 Years | 0 (0.0%) | 71 (29.5%) |
| 18 to 34 Years | 0 (0.0%) | 59 (31.0%) |
| 35 to 64 Years | 10 (2.0%) | 35 (5.5%) |
| 65 to 74 Years | 16 (14.4%) | 0 (0.0%) |
| 75 Years and over | 16 (12.5%) | 17 (18.9%) |
Disability Class: Ambulatory Difficulty
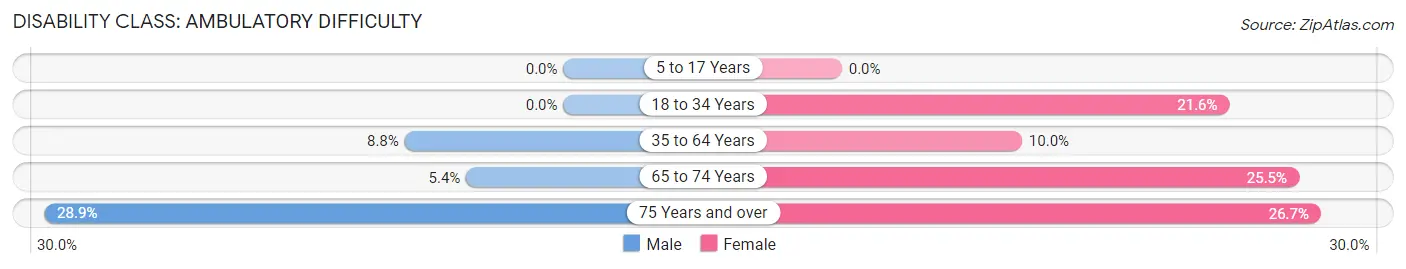
| Age Bracket | Male | Female |
| 5 to 17 Years | 0 (0.0%) | 0 (0.0%) |
| 18 to 34 Years | 0 (0.0%) | 41 (21.6%) |
| 35 to 64 Years | 45 (8.8%) | 64 (10.0%) |
| 65 to 74 Years | 6 (5.4%) | 28 (25.5%) |
| 75 Years and over | 37 (28.9%) | 24 (26.7%) |
Disability Class: Self-Care Difficulty
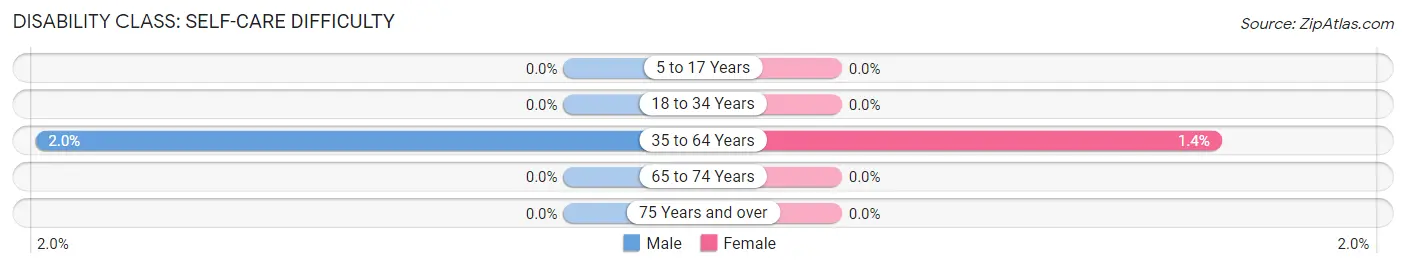
| Age Bracket | Male | Female |
| 5 to 17 Years | 0 (0.0%) | 0 (0.0%) |
| 18 to 34 Years | 0 (0.0%) | 0 (0.0%) |
| 35 to 64 Years | 10 (2.0%) | 9 (1.4%) |
| 65 to 74 Years | 0 (0.0%) | 0 (0.0%) |
| 75 Years and over | 0 (0.0%) | 0 (0.0%) |
Technology Access in Eastpoint
Computing Device Access in Eastpoint
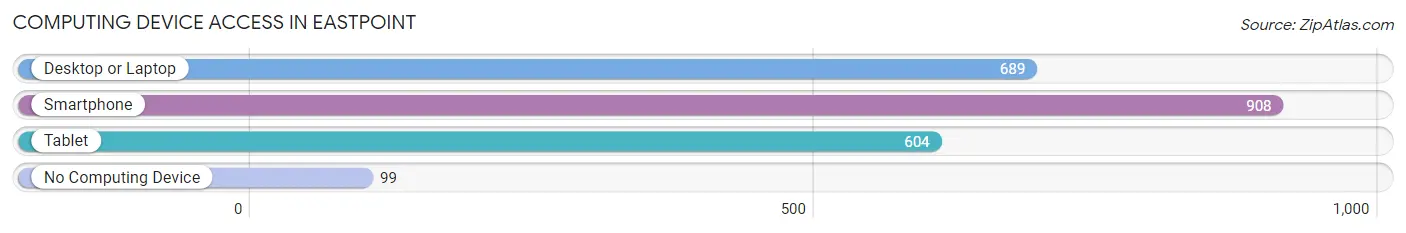
| Device Type | # Households | % Households |
| Desktop or Laptop | 689 | 65.9% |
| Smartphone | 908 | 86.8% |
| Tablet | 604 | 57.7% |
| No Computing Device | 99 | 9.5% |
| Total | 1,046 | 100.0% |
Internet Access in Eastpoint
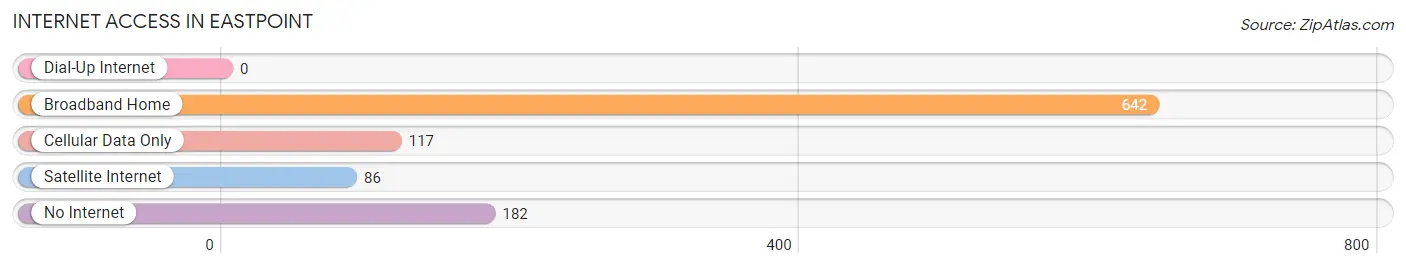
| Internet Type | # Households | % Households |
| Dial-Up Internet | 0 | 0.0% |
| Broadband Home | 642 | 61.4% |
| Cellular Data Only | 117 | 11.2% |
| Satellite Internet | 86 | 8.2% |
| No Internet | 182 | 17.4% |
| Total | 1,046 | 100.0% |
Eastpoint Summary
Eastpoint is a small town located in Franklin County, Florida, United States. It is situated on the Apalachicola Bay, near the mouth of the Apalachicola River. The town is part of the Tallahassee Metropolitan Statistical Area. As of the 2010 census, the population of Eastpoint was 1,374.
History
Eastpoint was first settled in the early 1800s by settlers from Georgia and Alabama. The town was originally known as "West Point" and was located on the west side of the Apalachicola River. In 1832, the town was renamed "Eastpoint" and moved to its current location on the east side of the river.
In the late 1800s, Eastpoint was a thriving port town. It was a major hub for the timber industry, with ships coming from all over the world to purchase lumber. The town also had a thriving fishing industry, with many of the local residents making their living as fishermen.
In the early 1900s, Eastpoint began to decline as the timber industry moved away from the area. The town was also hit hard by the Great Depression, and many of the residents moved away in search of work.
In the 1950s, Eastpoint began to experience a resurgence. The town was chosen as the site of a new bridge across the Apalachicola River, which opened in 1956. This bridge connected Eastpoint to the mainland, and allowed for increased tourism and development.
Geography
Eastpoint is located in Franklin County, Florida, at the mouth of the Apalachicola River. The town is situated on the east side of the river, across from the city of Apalachicola. The town is bordered to the north by the Apalachicola National Forest, and to the south by the Gulf of Mexico.
Eastpoint has a total area of 2.2 square miles, all of which is land. The town is located at an elevation of 10 feet above sea level.
Economy
The economy of Eastpoint is largely based on tourism and fishing. The town is a popular destination for fishing, boating, and other outdoor activities. There are several marinas in the area, as well as a number of restaurants and shops.
The town is also home to several seafood processing plants, which employ many of the local residents. The seafood industry is a major part of the local economy, and provides a significant source of income for the town.
Demographics
As of the 2010 census, there were 1,374 people, 590 households, and 393 families residing in Eastpoint. The population density was 622.2 people per square mile. The racial makeup of the town was 97.2% White, 0.9% African American, 0.2% Native American, 0.2% Asian, 0.1% Pacific Islander, 0.4% from other races, and 0.9% from two or more races. Hispanic or Latino of any race were 1.7% of the population.
The median income for a household in Eastpoint was $31,250, and the median income for a family was $37,500. Males had a median income of $30,000 versus $20,000 for females. The per capita income for the town was $17,845. About 15.2% of families and 17.2% of the population were below the poverty line, including 22.2% of those under age 18 and 11.3% of those age 65 or over.
Common Questions
What is Per Capita Income in Eastpoint?
Per Capita income in Eastpoint is $28,353.
What is the Median Family Income in Eastpoint?
Median Family Income in Eastpoint is $64,592.
What is the Median Household income in Eastpoint?
Median Household Income in Eastpoint is $54,096.
What is Income or Wage Gap in Eastpoint?
Income or Wage Gap in Eastpoint is 3.8%.
Women in Eastpoint earn 96.2 cents for every dollar earned by a man.
What is Inequality or Gini Index in Eastpoint?
Inequality or Gini Index in Eastpoint is 0.47.
What is the Total Population of Eastpoint?
Total Population of Eastpoint is 2,624.
What is the Total Male Population of Eastpoint?
Total Male Population of Eastpoint is 1,307.
What is the Total Female Population of Eastpoint?
Total Female Population of Eastpoint is 1,317.
What is the Ratio of Males per 100 Females in Eastpoint?
There are 99.24 Males per 100 Females in Eastpoint.
What is the Ratio of Females per 100 Males in Eastpoint?
There are 100.77 Females per 100 Males in Eastpoint.
What is the Median Population Age in Eastpoint?
Median Population Age in Eastpoint is 39.4 Years.
What is the Average Family Size in Eastpoint
Average Family Size in Eastpoint is 3.0 People.
What is the Average Household Size in Eastpoint
Average Household Size in Eastpoint is 2.5 People.
How Large is the Labor Force in Eastpoint?
There are 1,289 People in the Labor Forcein in Eastpoint.
What is the Percentage of People in the Labor Force in Eastpoint?
63.3% of People are in the Labor Force in Eastpoint.
What is the Unemployment Rate in Eastpoint?
Unemployment Rate in Eastpoint is 13.8%.