Eagle Lake, FL Map & Demographics
Eagle Lake Map
Eagle Lake Overview
$34,145
PER CAPITA INCOME
$75,117
AVG FAMILY INCOME
$71,705
AVG HOUSEHOLD INCOME
23.4%
WAGE / INCOME GAP [ % ]
76.6¢/ $1
WAGE / INCOME GAP [ $ ]
0.49
INEQUALITY / GINI INDEX
3,111
TOTAL POPULATION
1,707
MALE POPULATION
1,404
FEMALE POPULATION
121.58
MALES / 100 FEMALES
82.25
FEMALES / 100 MALES
34.1
MEDIAN AGE
3.7
AVG FAMILY SIZE
3.2
AVG HOUSEHOLD SIZE
1,411
LABOR FORCE [ PEOPLE ]
65.8%
PERCENT IN LABOR FORCE
5.1%
UNEMPLOYMENT RATE
Eagle Lake Zip Codes
Eagle Lake Area Codes
Income in Eagle Lake
Income Overview in Eagle Lake
Per Capita Income in Eagle Lake is $34,145, while median incomes of families and households are $75,117 and $71,705 respectively.
| Characteristic | Number | Measure |
| Per Capita Income | 3,111 | $34,145 |
| Median Family Income | 753 | $75,117 |
| Mean Family Income | 753 | $115,665 |
| Median Household Income | 961 | $71,705 |
| Mean Household Income | 961 | $105,569 |
| Income Deficit | 753 | $0 |
| Wage / Income Gap (%) | 3,111 | 23.41% |
| Wage / Income Gap ($) | 3,111 | 76.59¢ per $1 |
| Gini / Inequality Index | 3,111 | 0.49 |
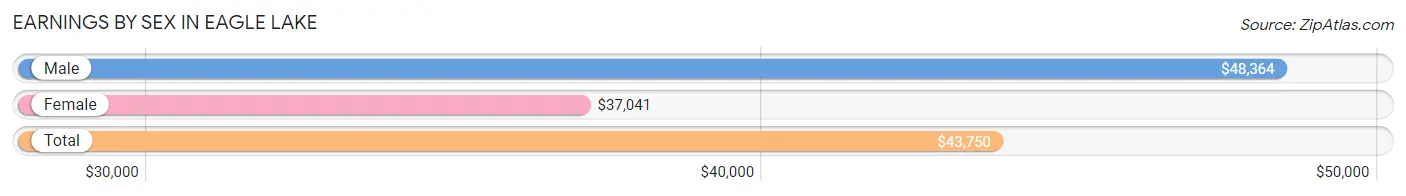
Earnings by Sex in Eagle Lake
Average Earnings in Eagle Lake are $43,750, $48,364 for men and $37,041 for women, a difference of 23.4%.
| Sex | Number | Average Earnings |
| Male | 800 (57.9%) | $48,364 |
| Female | 582 (42.1%) | $37,041 |
| Total | 1,382 (100.0%) | $43,750 |
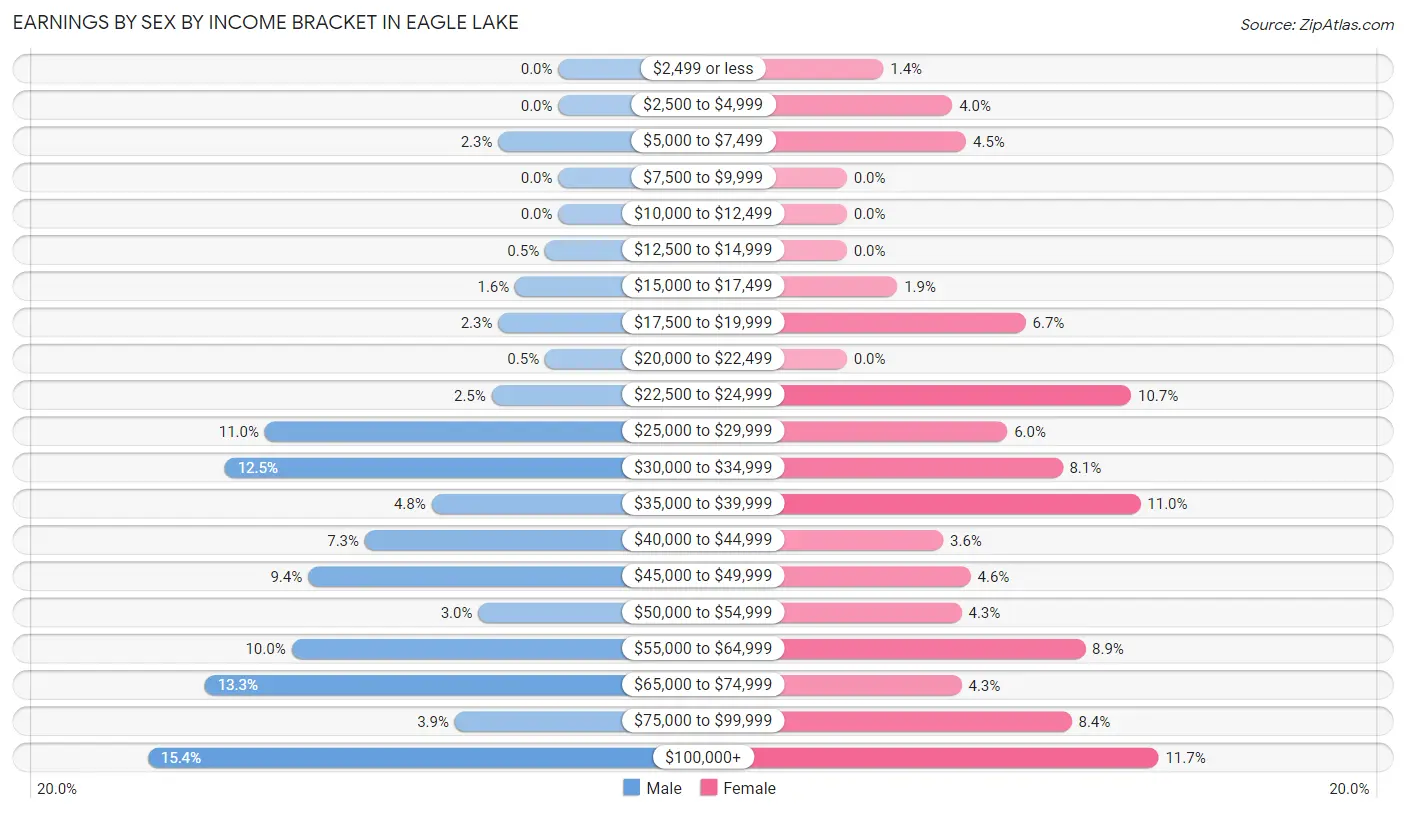
Earnings by Sex by Income Bracket in Eagle Lake
The most common earnings brackets in Eagle Lake are $100,000+ for men (123 | 15.4%) and $100,000+ for women (68 | 11.7%).
| Income | Male | Female |
| $2,499 or less | 0 (0.0%) | 8 (1.4%) |
| $2,500 to $4,999 | 0 (0.0%) | 23 (4.0%) |
| $5,000 to $7,499 | 18 (2.2%) | 26 (4.5%) |
| $7,500 to $9,999 | 0 (0.0%) | 0 (0.0%) |
| $10,000 to $12,499 | 0 (0.0%) | 0 (0.0%) |
| $12,500 to $14,999 | 4 (0.5%) | 0 (0.0%) |
| $15,000 to $17,499 | 13 (1.6%) | 11 (1.9%) |
| $17,500 to $19,999 | 18 (2.2%) | 39 (6.7%) |
| $20,000 to $22,499 | 4 (0.5%) | 0 (0.0%) |
| $22,500 to $24,999 | 20 (2.5%) | 62 (10.6%) |
| $25,000 to $29,999 | 88 (11.0%) | 35 (6.0%) |
| $30,000 to $34,999 | 100 (12.5%) | 47 (8.1%) |
| $35,000 to $39,999 | 38 (4.8%) | 64 (11.0%) |
| $40,000 to $44,999 | 58 (7.2%) | 21 (3.6%) |
| $45,000 to $49,999 | 75 (9.4%) | 27 (4.6%) |
| $50,000 to $54,999 | 24 (3.0%) | 25 (4.3%) |
| $55,000 to $64,999 | 80 (10.0%) | 52 (8.9%) |
| $65,000 to $74,999 | 106 (13.3%) | 25 (4.3%) |
| $75,000 to $99,999 | 31 (3.9%) | 49 (8.4%) |
| $100,000+ | 123 (15.4%) | 68 (11.7%) |
| Total | 800 (100.0%) | 582 (100.0%) |
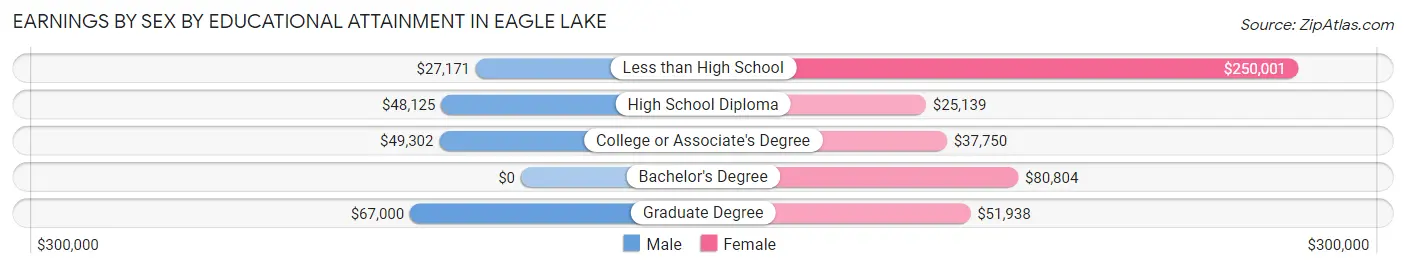
Earnings by Sex by Educational Attainment in Eagle Lake
Average earnings in Eagle Lake are $49,114 for men and $40,595 for women, a difference of 17.3%. Men with an educational attainment of graduate degree enjoy the highest average annual earnings of $67,000, while those with less than high school education earn the least with $27,171. Women with an educational attainment of less than high school earn the most with the average annual earnings of $250,001, while those with high school diploma education have the smallest earnings of $25,139.
| Educational Attainment | Male Income | Female Income |
| Less than High School | $27,171 | $250,001 |
| High School Diploma | $48,125 | $25,139 |
| College or Associate's Degree | $49,302 | $37,750 |
| Bachelor's Degree | - | - |
| Graduate Degree | $67,000 | $51,938 |
| Total | $49,114 | $40,595 |
Family Income in Eagle Lake
Family Income Brackets in Eagle Lake
According to the Eagle Lake family income data, there are 148 families falling into the $75,000 to $99,999 income range, which is the most common income bracket and makes up 19.7% of all families.
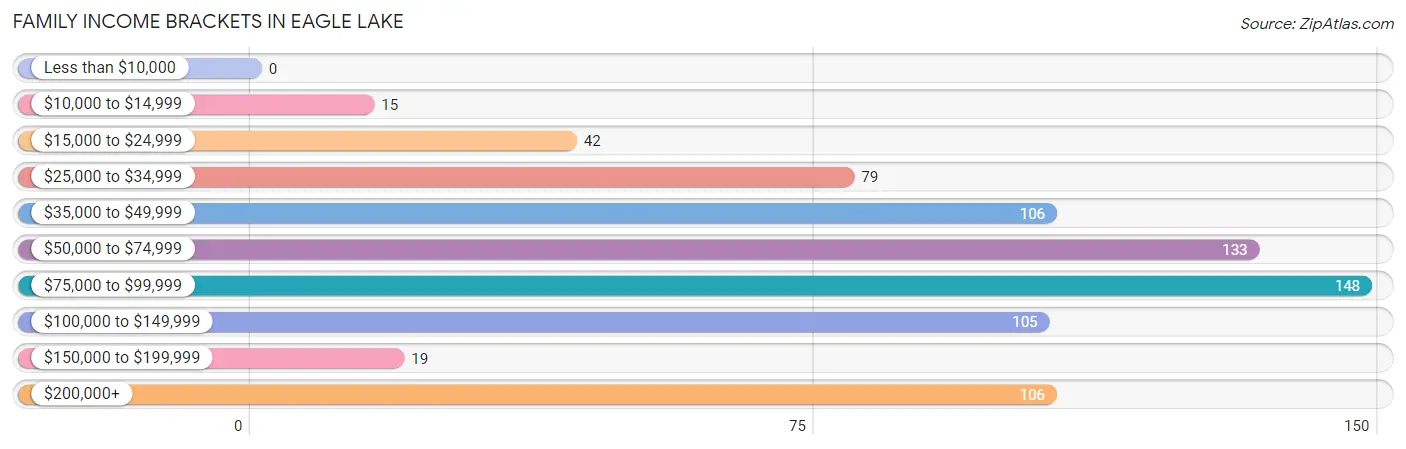
| Income Bracket | # Families | % Families |
| Less than $10,000 | 0 | 0.0% |
| $10,000 to $14,999 | 15 | 2.0% |
| $15,000 to $24,999 | 42 | 5.6% |
| $25,000 to $34,999 | 79 | 10.5% |
| $35,000 to $49,999 | 106 | 14.1% |
| $50,000 to $74,999 | 133 | 17.7% |
| $75,000 to $99,999 | 148 | 19.7% |
| $100,000 to $149,999 | 105 | 13.9% |
| $150,000 to $199,999 | 19 | 2.5% |
| $200,000+ | 106 | 14.1% |
Family Income by Famaliy Size in Eagle Lake
5-person families (26 | 3.5%) account for the highest median family income in Eagle Lake with $112,679 per family, while 2-person families (262 | 34.8%) have the highest median income of $30,000 per family member.
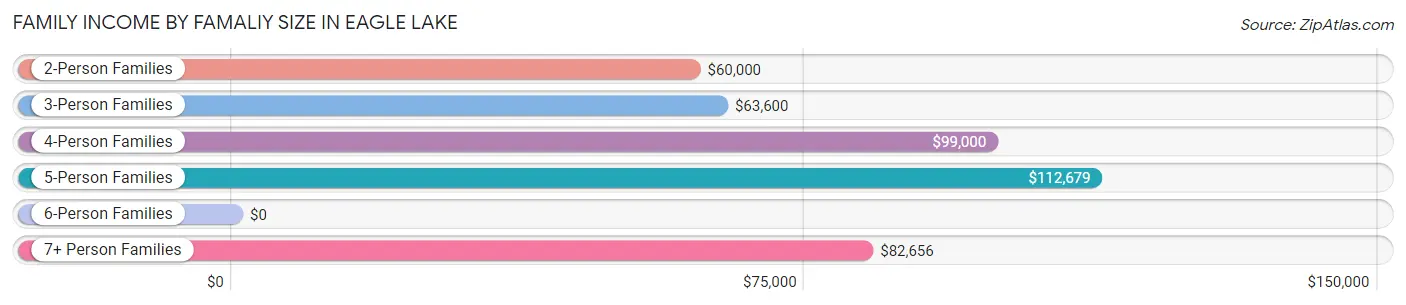
| Income Bracket | # Families | Median Income |
| 2-Person Families | 262 (34.8%) | $60,000 |
| 3-Person Families | 198 (26.3%) | $63,600 |
| 4-Person Families | 188 (25.0%) | $99,000 |
| 5-Person Families | 26 (3.5%) | $112,679 |
| 6-Person Families | 34 (4.5%) | $0 |
| 7+ Person Families | 45 (6.0%) | $82,656 |
| Total | 753 (100.0%) | $75,117 |
Family Income by Number of Earners in Eagle Lake
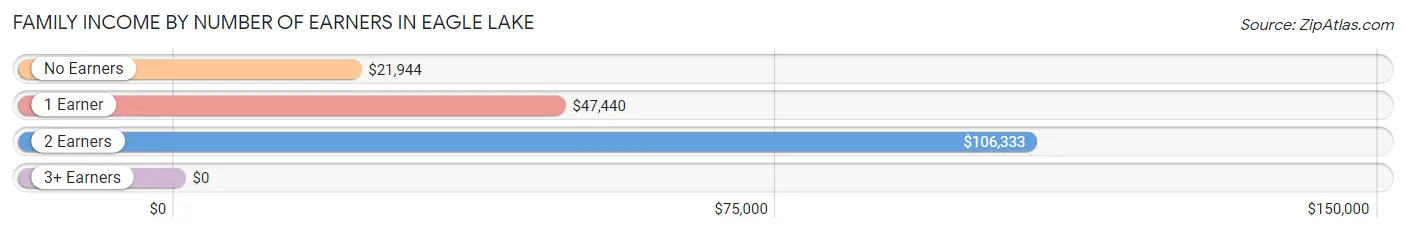
| Number of Earners | # Families | Median Income |
| No Earners | 96 (12.8%) | $21,944 |
| 1 Earner | 265 (35.2%) | $47,440 |
| 2 Earners | 340 (45.2%) | $106,333 |
| 3+ Earners | 52 (6.9%) | $0 |
| Total | 753 (100.0%) | $75,117 |
Household Income in Eagle Lake
Household Income Brackets in Eagle Lake
With 178 households falling in the category, the $75,000 to $99,999 income range is the most frequent in Eagle Lake, accounting for 18.5% of all households. In contrast, only 26 households (2.7%) fall into the less than $10,000 income bracket, making it the least populous group.
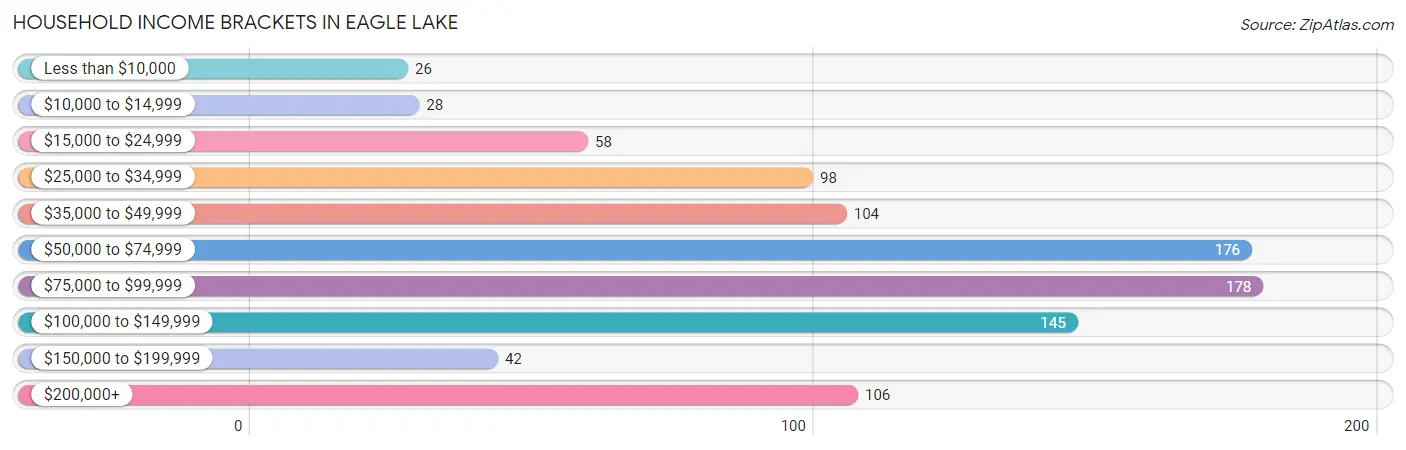
| Income Bracket | # Households | % Households |
| Less than $10,000 | 26 | 2.7% |
| $10,000 to $14,999 | 28 | 2.9% |
| $15,000 to $24,999 | 58 | 6.0% |
| $25,000 to $34,999 | 98 | 10.2% |
| $35,000 to $49,999 | 104 | 10.8% |
| $50,000 to $74,999 | 176 | 18.3% |
| $75,000 to $99,999 | 178 | 18.5% |
| $100,000 to $149,999 | 145 | 15.1% |
| $150,000 to $199,999 | 42 | 4.4% |
| $200,000+ | 106 | 11.0% |
Household Income by Householder Age in Eagle Lake
The median household income in Eagle Lake is $71,705, with the highest median household income of $79,155 found in the 25 to 44 years age bracket for the primary householder. A total of 491 households (51.1%) fall into this category. Meanwhile, the 15 to 24 years age bracket for the primary householder has the lowest median household income of $0, with 6 households (0.6%) in this group.
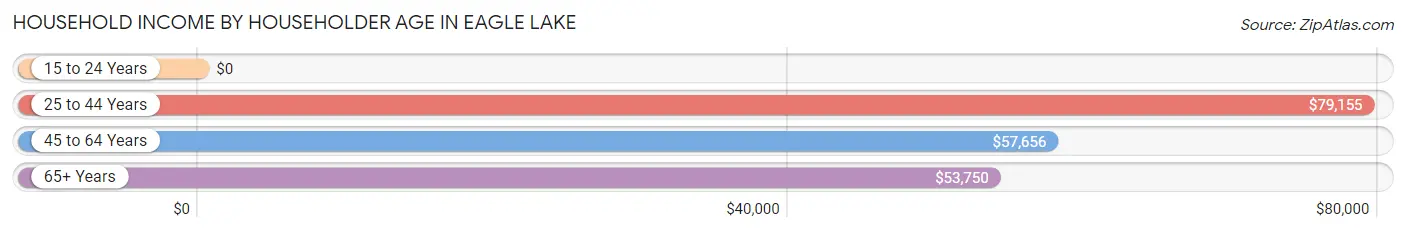
| Income Bracket | # Households | Median Income |
| 15 to 24 Years | 6 (0.6%) | $0 |
| 25 to 44 Years | 491 (51.1%) | $79,155 |
| 45 to 64 Years | 277 (28.8%) | $57,656 |
| 65+ Years | 187 (19.5%) | $53,750 |
| Total | 961 (100.0%) | $71,705 |
Poverty in Eagle Lake
Income Below Poverty by Sex and Age in Eagle Lake
With 10.9% poverty level for males and 7.0% for females among the residents of Eagle Lake, 75 year old and over males and 18 to 24 year old females are the most vulnerable to poverty, with 30 males (35.7%) and 16 females (17.2%) in their respective age groups living below the poverty level.
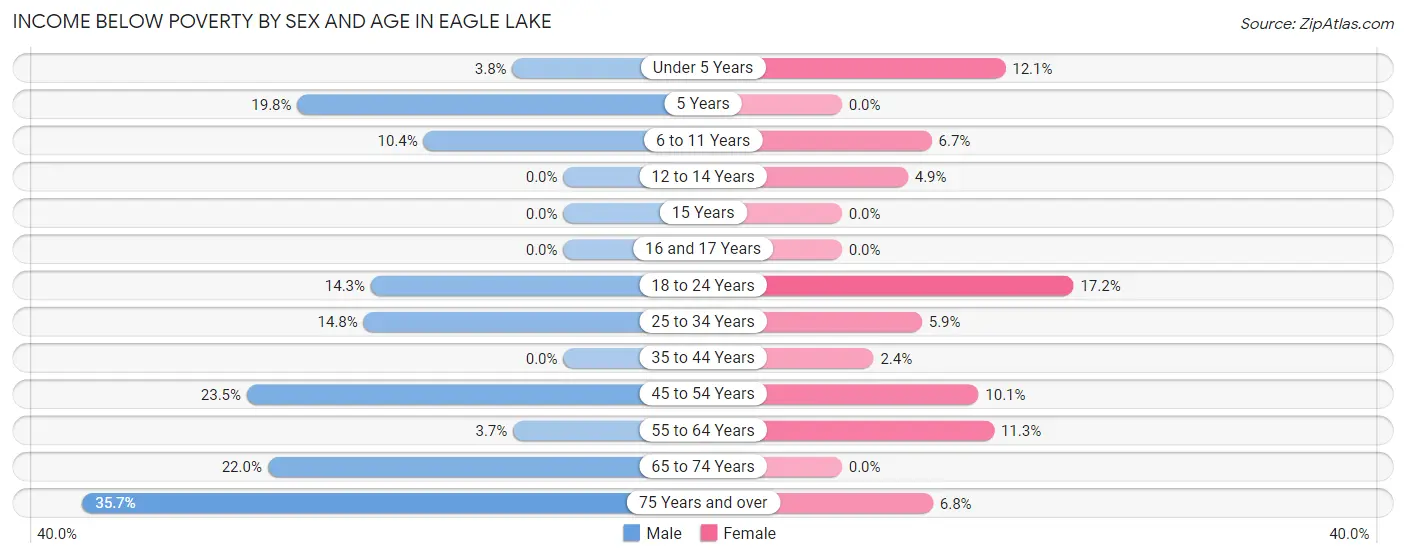
| Age Bracket | Male | Female |
| Under 5 Years | 7 (3.8%) | 17 (12.1%) |
| 5 Years | 16 (19.8%) | 0 (0.0%) |
| 6 to 11 Years | 22 (10.4%) | 7 (6.7%) |
| 12 to 14 Years | 0 (0.0%) | 7 (4.9%) |
| 15 Years | 0 (0.0%) | 0 (0.0%) |
| 16 and 17 Years | 0 (0.0%) | 0 (0.0%) |
| 18 to 24 Years | 5 (14.3%) | 16 (17.2%) |
| 25 to 34 Years | 39 (14.8%) | 12 (5.9%) |
| 35 to 44 Years | 0 (0.0%) | 6 (2.4%) |
| 45 to 54 Years | 43 (23.5%) | 15 (10.1%) |
| 55 to 64 Years | 6 (3.7%) | 13 (11.3%) |
| 65 to 74 Years | 18 (22.0%) | 0 (0.0%) |
| 75 Years and over | 30 (35.7%) | 5 (6.8%) |
| Total | 186 (10.9%) | 98 (7.0%) |
Income Above Poverty by Sex and Age in Eagle Lake
According to the poverty statistics in Eagle Lake, males aged 12 to 14 years and females aged 15 years are the age groups that are most secure financially, with 100.0% of males and 100.0% of females in these age groups living above the poverty line.
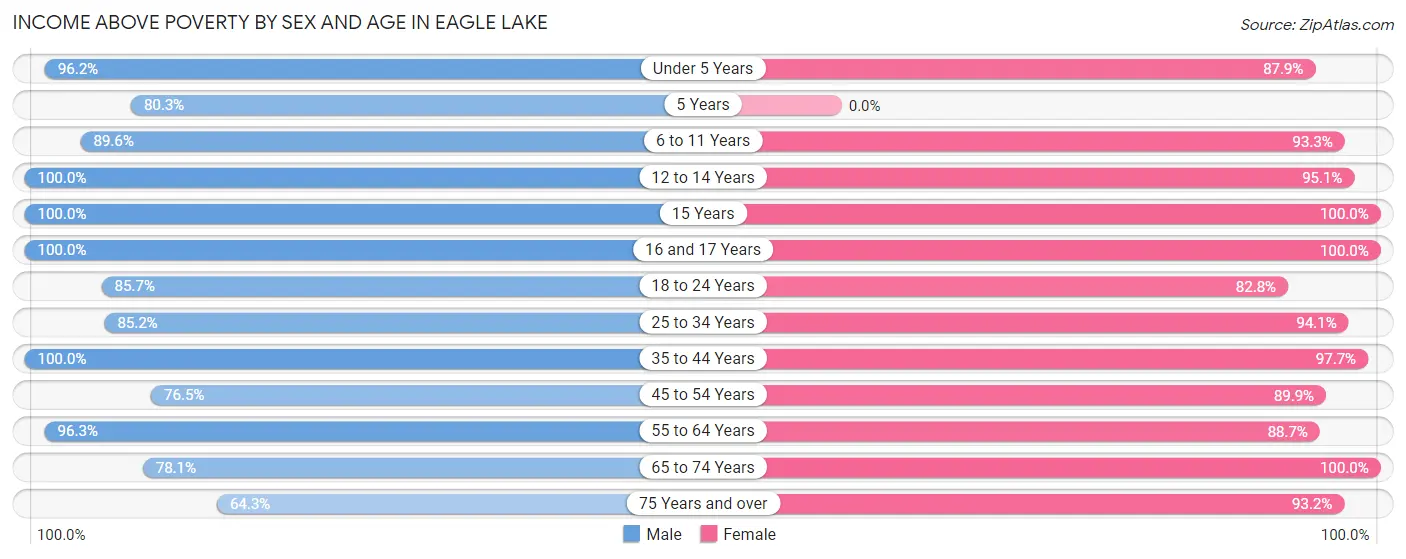
| Age Bracket | Male | Female |
| Under 5 Years | 178 (96.2%) | 123 (87.9%) |
| 5 Years | 65 (80.2%) | 0 (0.0%) |
| 6 to 11 Years | 190 (89.6%) | 98 (93.3%) |
| 12 to 14 Years | 62 (100.0%) | 136 (95.1%) |
| 15 Years | 6 (100.0%) | 32 (100.0%) |
| 16 and 17 Years | 42 (100.0%) | 8 (100.0%) |
| 18 to 24 Years | 30 (85.7%) | 77 (82.8%) |
| 25 to 34 Years | 224 (85.2%) | 190 (94.1%) |
| 35 to 44 Years | 311 (100.0%) | 249 (97.7%) |
| 45 to 54 Years | 140 (76.5%) | 133 (89.9%) |
| 55 to 64 Years | 155 (96.3%) | 102 (88.7%) |
| 65 to 74 Years | 64 (78.0%) | 89 (100.0%) |
| 75 Years and over | 54 (64.3%) | 69 (93.2%) |
| Total | 1,521 (89.1%) | 1,306 (93.0%) |
Income Below Poverty Among Married-Couple Families in Eagle Lake
The poverty statistics for married-couple families in Eagle Lake show that 0.7% or 4 of the total 542 families live below the poverty line. Families with no children have the highest poverty rate of 1.7%, comprising of 4 families. On the other hand, families with 1 or 2 children have the lowest poverty rate of 0.0%, which includes 0 families.
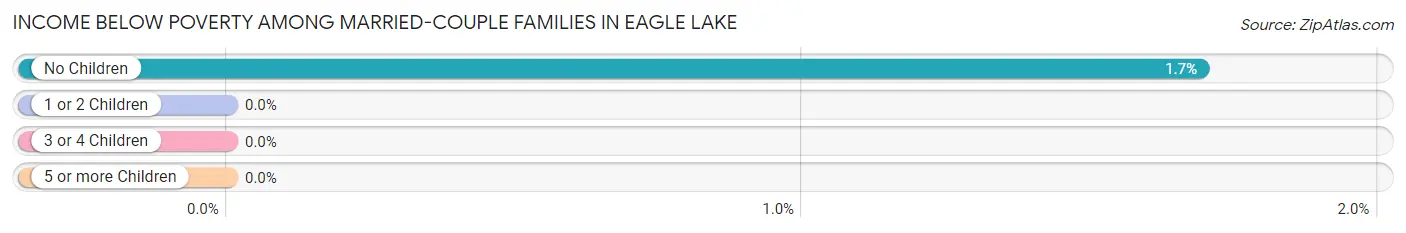
| Children | Above Poverty | Below Poverty |
| No Children | 233 (98.3%) | 4 (1.7%) |
| 1 or 2 Children | 226 (100.0%) | 0 (0.0%) |
| 3 or 4 Children | 55 (100.0%) | 0 (0.0%) |
| 5 or more Children | 24 (100.0%) | 0 (0.0%) |
| Total | 538 (99.3%) | 4 (0.7%) |
Income Below Poverty Among Single-Parent Households in Eagle Lake
According to the poverty data in Eagle Lake, 17.6% or 13 single-father households and 21.9% or 30 single-mother households are living below the poverty line. Among single-father households, those with no children have the highest poverty rate, with 6 households (35.3%) experiencing poverty. Likewise, among single-mother households, those with 1 or 2 children have the highest poverty rate, with 24 households (33.3%) falling below the poverty line.
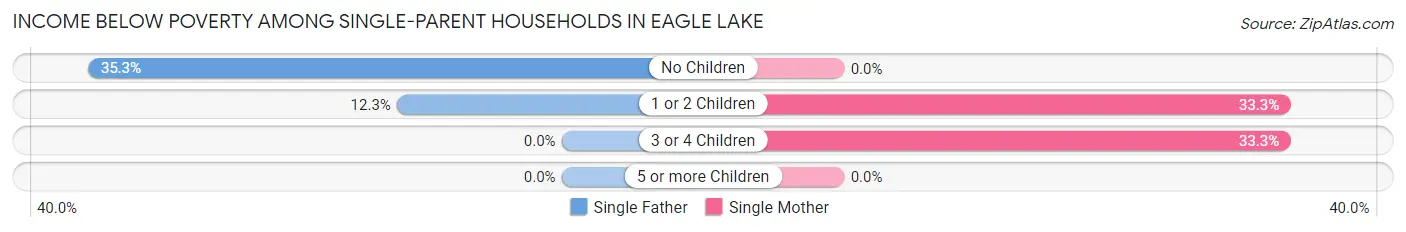
| Children | Single Father | Single Mother |
| No Children | 6 (35.3%) | 0 (0.0%) |
| 1 or 2 Children | 7 (12.3%) | 24 (33.3%) |
| 3 or 4 Children | 0 (0.0%) | 6 (33.3%) |
| 5 or more Children | 0 (0.0%) | 0 (0.0%) |
| Total | 13 (17.6%) | 30 (21.9%) |
Income Below Poverty Among Married-Couple vs Single-Parent Households in Eagle Lake
The poverty data for Eagle Lake shows that 4 of the married-couple family households (0.7%) and 43 of the single-parent households (20.4%) are living below the poverty level. Within the married-couple family households, those with no children have the highest poverty rate, with 4 households (1.7%) falling below the poverty line. Among the single-parent households, those with 3 or 4 children have the highest poverty rate, with 6 household (33.3%) living below poverty.
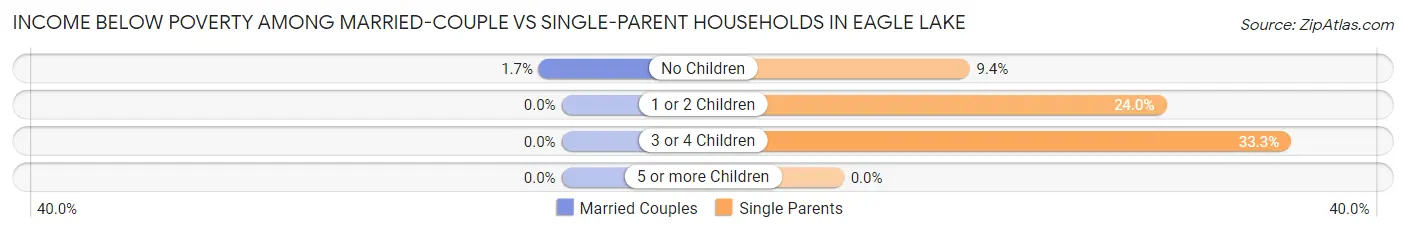
| Children | Married-Couple Families | Single-Parent Households |
| No Children | 4 (1.7%) | 6 (9.4%) |
| 1 or 2 Children | 0 (0.0%) | 31 (24.0%) |
| 3 or 4 Children | 0 (0.0%) | 6 (33.3%) |
| 5 or more Children | 0 (0.0%) | 0 (0.0%) |
| Total | 4 (0.7%) | 43 (20.4%) |
Race in Eagle Lake
The most populous races in Eagle Lake are White / Caucasian (2,384 | 76.6%), Hispanic or Latino (655 | 21.0%), and Two or more Races (305 | 9.8%).
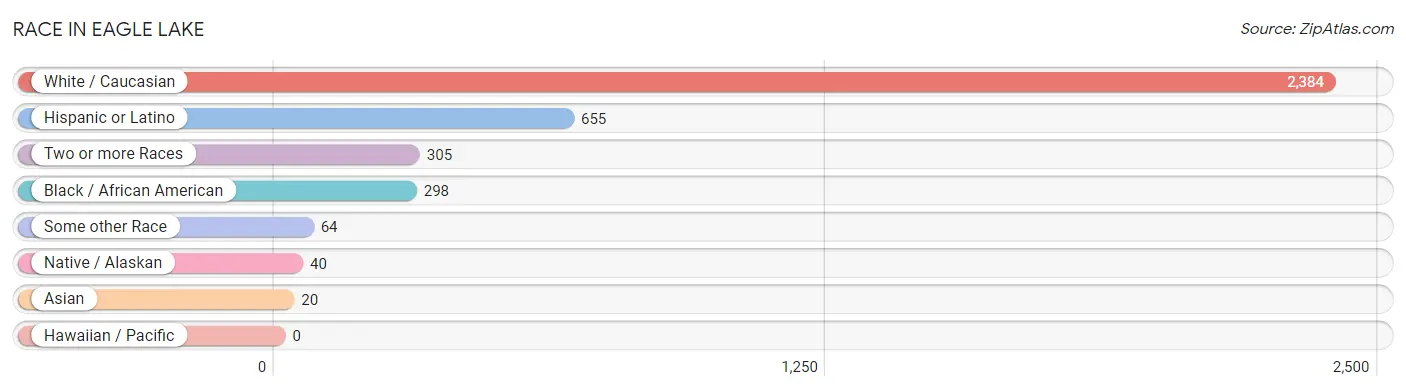
| Race | # Population | % Population |
| Asian | 20 | 0.6% |
| Black / African American | 298 | 9.6% |
| Hawaiian / Pacific | 0 | 0.0% |
| Hispanic or Latino | 655 | 21.0% |
| Native / Alaskan | 40 | 1.3% |
| White / Caucasian | 2,384 | 76.6% |
| Two or more Races | 305 | 9.8% |
| Some other Race | 64 | 2.1% |
| Total | 3,111 | 100.0% |
Ancestry in Eagle Lake
The most populous ancestries reported in Eagle Lake are American (591 | 19.0%), Mexican (284 | 9.1%), English (281 | 9.0%), German (202 | 6.5%), and Irish (179 | 5.8%), together accounting for 49.4% of all Eagle Lake residents.
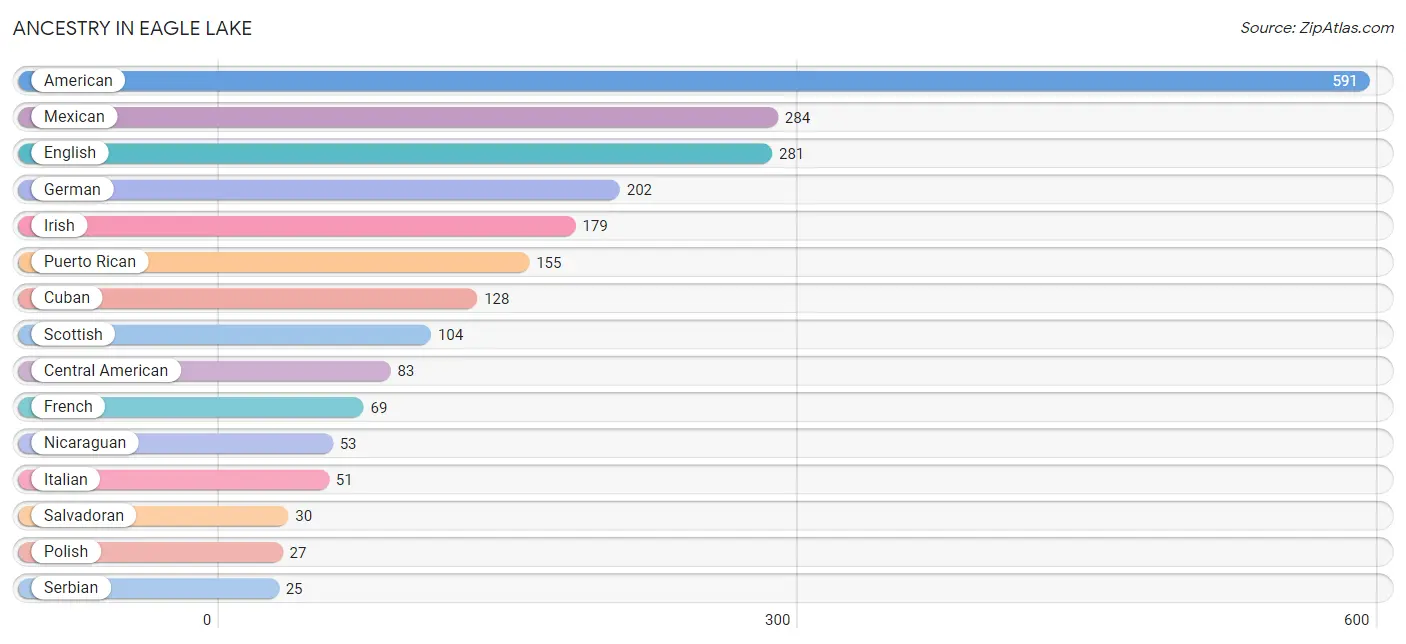
| Ancestry | # Population | % Population |
| American | 591 | 19.0% |
| Armenian | 20 | 0.6% |
| Burmese | 5 | 0.2% |
| Central American | 83 | 2.7% |
| Cherokee | 11 | 0.4% |
| Croatian | 20 | 0.6% |
| Cuban | 128 | 4.1% |
| Danish | 4 | 0.1% |
| Dutch | 9 | 0.3% |
| English | 281 | 9.0% |
| European | 18 | 0.6% |
| French | 69 | 2.2% |
| German | 202 | 6.5% |
| Greek | 6 | 0.2% |
| Irish | 179 | 5.8% |
| Italian | 51 | 1.6% |
| Lithuanian | 6 | 0.2% |
| Mexican | 284 | 9.1% |
| Nicaraguan | 53 | 1.7% |
| Norwegian | 5 | 0.2% |
| Polish | 27 | 0.9% |
| Puerto Rican | 155 | 5.0% |
| Salvadoran | 30 | 1.0% |
| Scandinavian | 15 | 0.5% |
| Scotch-Irish | 4 | 0.1% |
| Scottish | 104 | 3.3% |
| Serbian | 25 | 0.8% |
| Thai | 20 | 0.6% |
| Welsh | 6 | 0.2% | View All 29 Rows |
Immigrants in Eagle Lake
The most numerous immigrant groups reported in Eagle Lake came from Latin America (171 | 5.5%), Caribbean (106 | 3.4%), Haiti (93 | 3.0%), Central America (65 | 2.1%), and Mexico (24 | 0.8%), together accounting for 14.8% of all Eagle Lake residents.
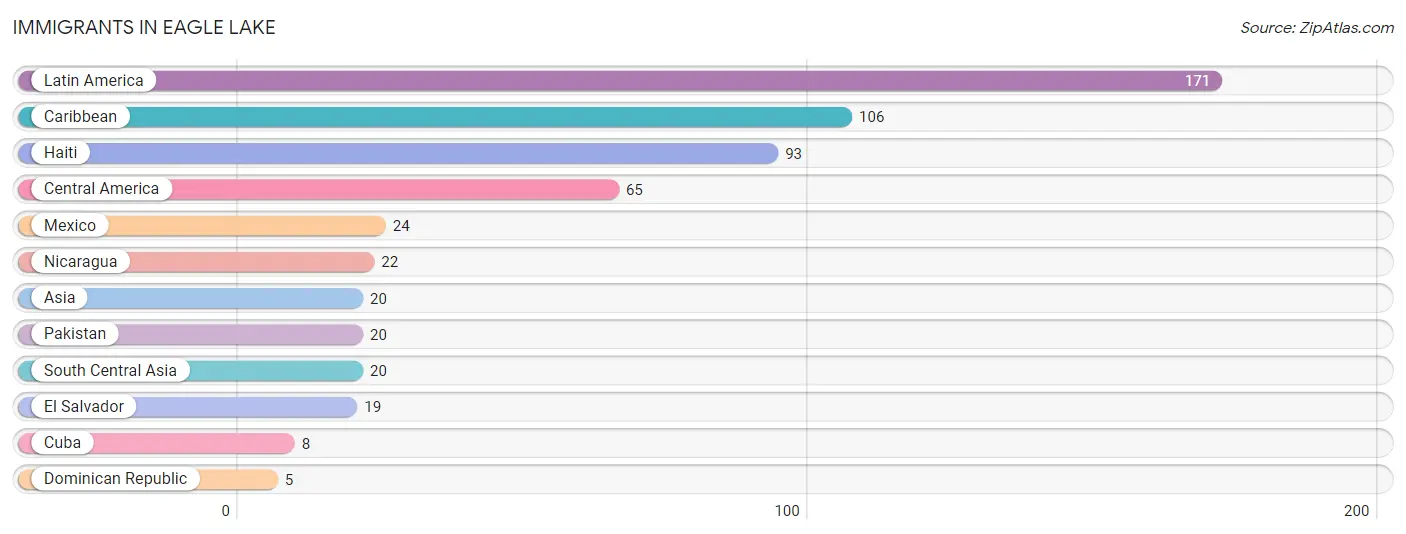
| Immigration Origin | # Population | % Population |
| Asia | 20 | 0.6% |
| Caribbean | 106 | 3.4% |
| Central America | 65 | 2.1% |
| Cuba | 8 | 0.3% |
| Dominican Republic | 5 | 0.2% |
| El Salvador | 19 | 0.6% |
| Haiti | 93 | 3.0% |
| Latin America | 171 | 5.5% |
| Mexico | 24 | 0.8% |
| Nicaragua | 22 | 0.7% |
| Pakistan | 20 | 0.6% |
| South Central Asia | 20 | 0.6% | View All 12 Rows |
Sex and Age in Eagle Lake
Sex and Age in Eagle Lake
The most populous age groups in Eagle Lake are 5 to 9 Years (254 | 14.9%) for men and 10 to 14 Years (191 | 13.6%) for women.
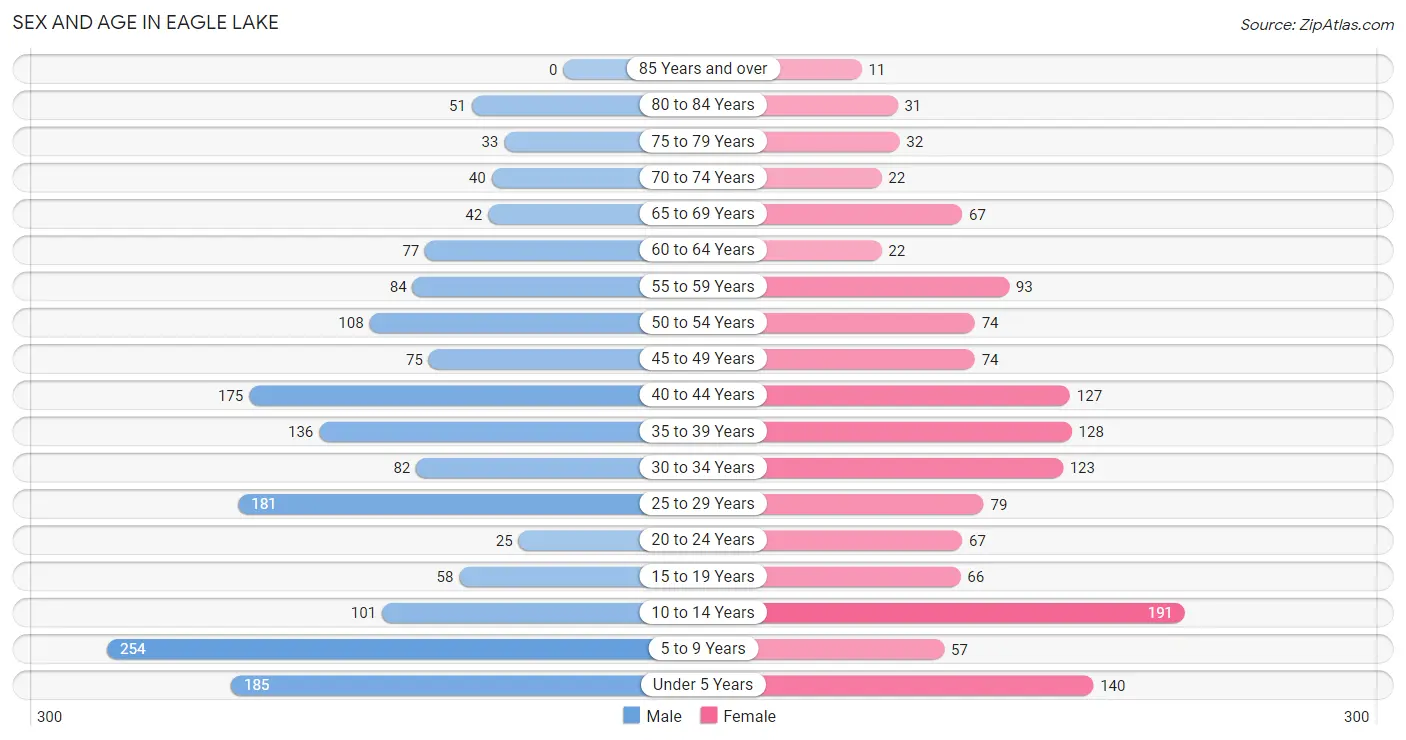
| Age Bracket | Male | Female |
| Under 5 Years | 185 (10.8%) | 140 (10.0%) |
| 5 to 9 Years | 254 (14.9%) | 57 (4.1%) |
| 10 to 14 Years | 101 (5.9%) | 191 (13.6%) |
| 15 to 19 Years | 58 (3.4%) | 66 (4.7%) |
| 20 to 24 Years | 25 (1.5%) | 67 (4.8%) |
| 25 to 29 Years | 181 (10.6%) | 79 (5.6%) |
| 30 to 34 Years | 82 (4.8%) | 123 (8.8%) |
| 35 to 39 Years | 136 (8.0%) | 128 (9.1%) |
| 40 to 44 Years | 175 (10.2%) | 127 (9.0%) |
| 45 to 49 Years | 75 (4.4%) | 74 (5.3%) |
| 50 to 54 Years | 108 (6.3%) | 74 (5.3%) |
| 55 to 59 Years | 84 (4.9%) | 93 (6.6%) |
| 60 to 64 Years | 77 (4.5%) | 22 (1.6%) |
| 65 to 69 Years | 42 (2.5%) | 67 (4.8%) |
| 70 to 74 Years | 40 (2.3%) | 22 (1.6%) |
| 75 to 79 Years | 33 (1.9%) | 32 (2.3%) |
| 80 to 84 Years | 51 (3.0%) | 31 (2.2%) |
| 85 Years and over | 0 (0.0%) | 11 (0.8%) |
| Total | 1,707 (100.0%) | 1,404 (100.0%) |
Families and Households in Eagle Lake
Median Family Size in Eagle Lake
The median family size in Eagle Lake is 3.66 persons per family, with married-couple families (542 | 72.0%) accounting for the largest median family size of 3.77 persons per family. On the other hand, single male/father families (74 | 9.8%) represent the smallest median family size with 3.00 persons per family.
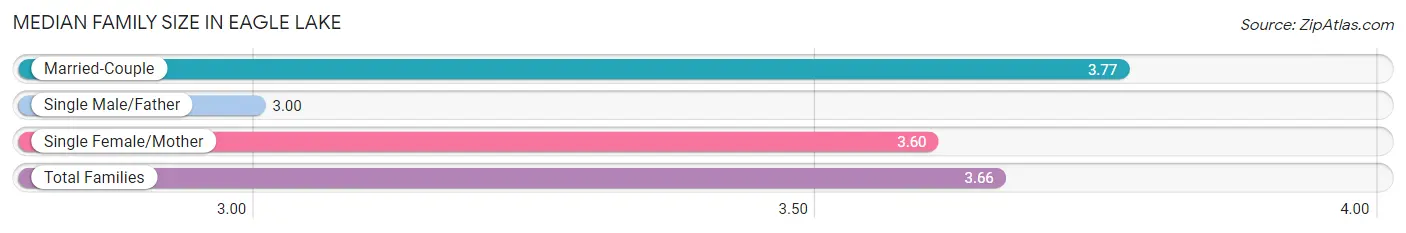
| Family Type | # Families | Family Size |
| Married-Couple | 542 (72.0%) | 3.77 |
| Single Male/Father | 74 (9.8%) | 3.00 |
| Single Female/Mother | 137 (18.2%) | 3.60 |
| Total Families | 753 (100.0%) | 3.66 |
Median Household Size in Eagle Lake
The median household size in Eagle Lake is 3.24 persons per household, with married-couple households (542 | 56.4%) accounting for the largest median household size of 3.82 persons per household. non-family households (208 | 21.6%) represent the smallest median household size with 1.35 persons per household.
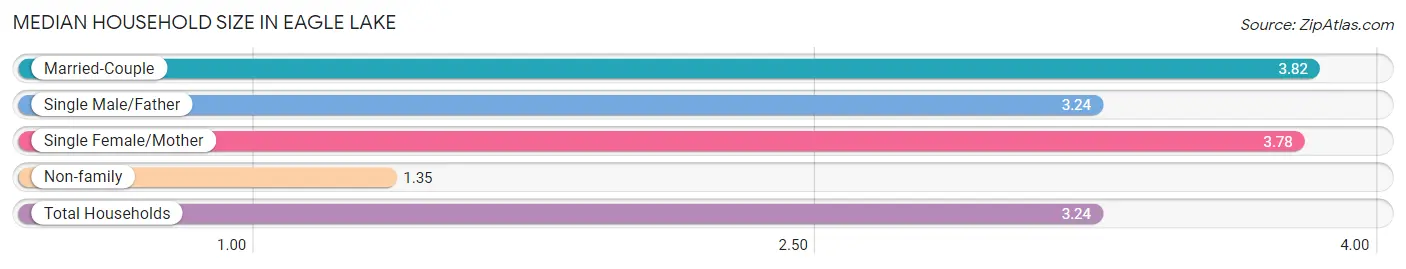
| Household Type | # Households | Household Size |
| Married-Couple | 542 (56.4%) | 3.82 |
| Single Male/Father | 74 (7.7%) | 3.24 |
| Single Female/Mother | 137 (14.3%) | 3.78 |
| Non-family | 208 (21.6%) | 1.35 |
| Total Households | 961 (100.0%) | 3.24 |
Household Size by Marriage Status in Eagle Lake
Out of a total of 961 households in Eagle Lake, 753 (78.4%) are family households, while 208 (21.6%) are nonfamily households. The most numerous type of family households are 2-person households, comprising 244, and the most common type of nonfamily households are 1-person households, comprising 179.
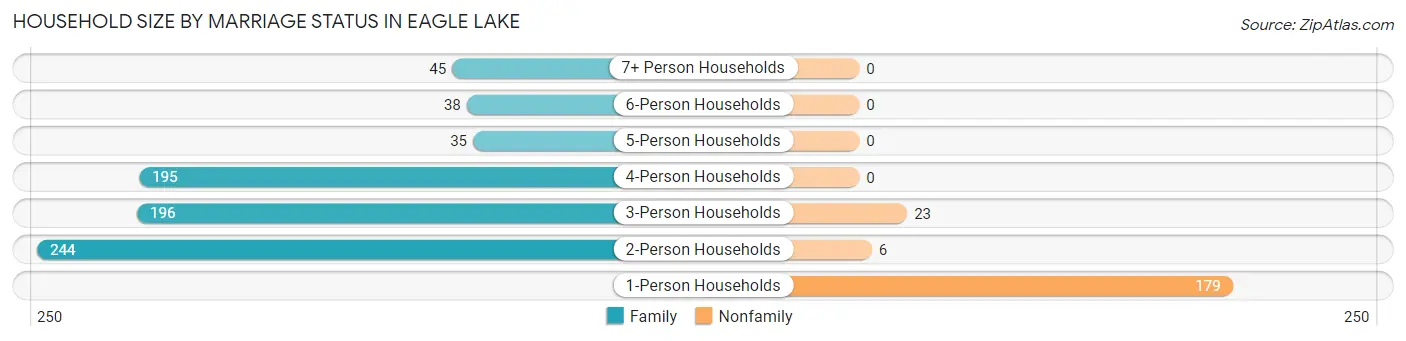
| Household Size | Family Households | Nonfamily Households |
| 1-Person Households | - | 179 (18.6%) |
| 2-Person Households | 244 (25.4%) | 6 (0.6%) |
| 3-Person Households | 196 (20.4%) | 23 (2.4%) |
| 4-Person Households | 195 (20.3%) | 0 (0.0%) |
| 5-Person Households | 35 (3.6%) | 0 (0.0%) |
| 6-Person Households | 38 (4.0%) | 0 (0.0%) |
| 7+ Person Households | 45 (4.7%) | 0 (0.0%) |
| Total | 753 (78.4%) | 208 (21.6%) |
Female Fertility in Eagle Lake
Fertility by Age in Eagle Lake
Average fertility rate in Eagle Lake is 54.0 births per 1,000 women. Women in the age bracket of 20 to 34 years have the highest fertility rate with 108.0 births per 1,000 women. Women in the age bracket of 20 to 34 years acount for 78.4% of all women with births.
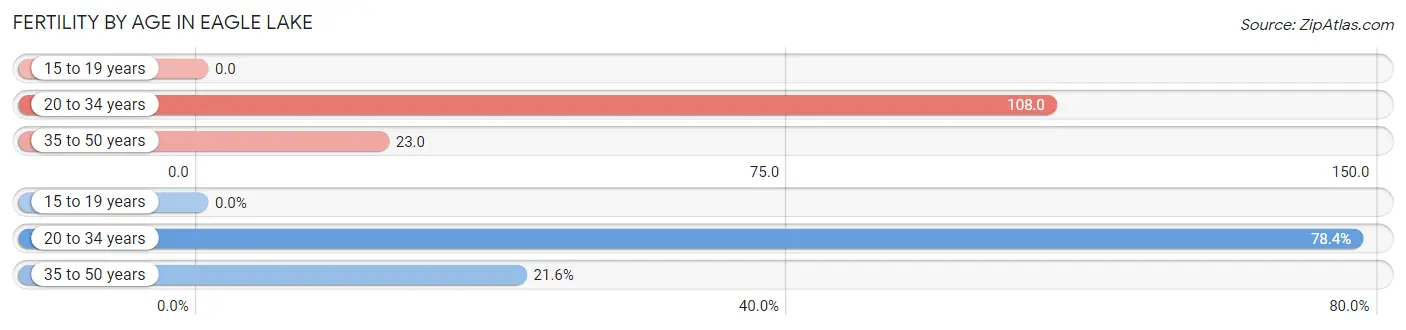
| Age Bracket | Women with Births | Births / 1,000 Women |
| 15 to 19 years | 0 (0.0%) | 0.0 |
| 20 to 34 years | 29 (78.4%) | 108.0 |
| 35 to 50 years | 8 (21.6%) | 23.0 |
| Total | 37 (100.0%) | 54.0 |
Fertility by Age by Marriage Status in Eagle Lake
64.9% of women with births (37) in Eagle Lake are married. The highest percentage of unmarried women with births falls into 20 to 34 years age bracket with 44.8% of them unmarried at the time of birth, while the lowest percentage of unmarried women with births belong to 35 to 50 years age bracket with 0.0% of them unmarried.
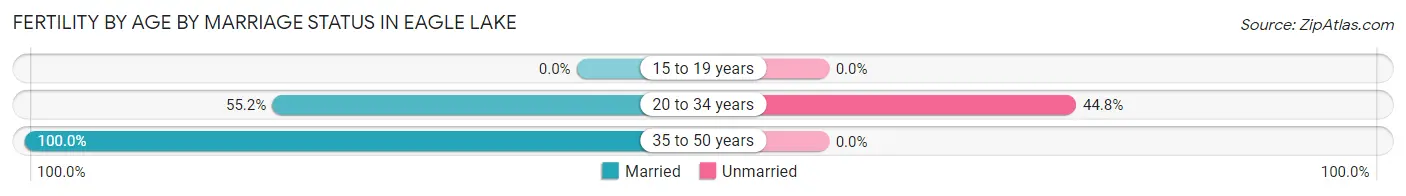
| Age Bracket | Married | Unmarried |
| 15 to 19 years | 0 (0.0%) | 0 (0.0%) |
| 20 to 34 years | 16 (55.2%) | 13 (44.8%) |
| 35 to 50 years | 8 (100.0%) | 0 (0.0%) |
| Total | 24 (64.9%) | 13 (35.1%) |
Fertility by Education in Eagle Lake
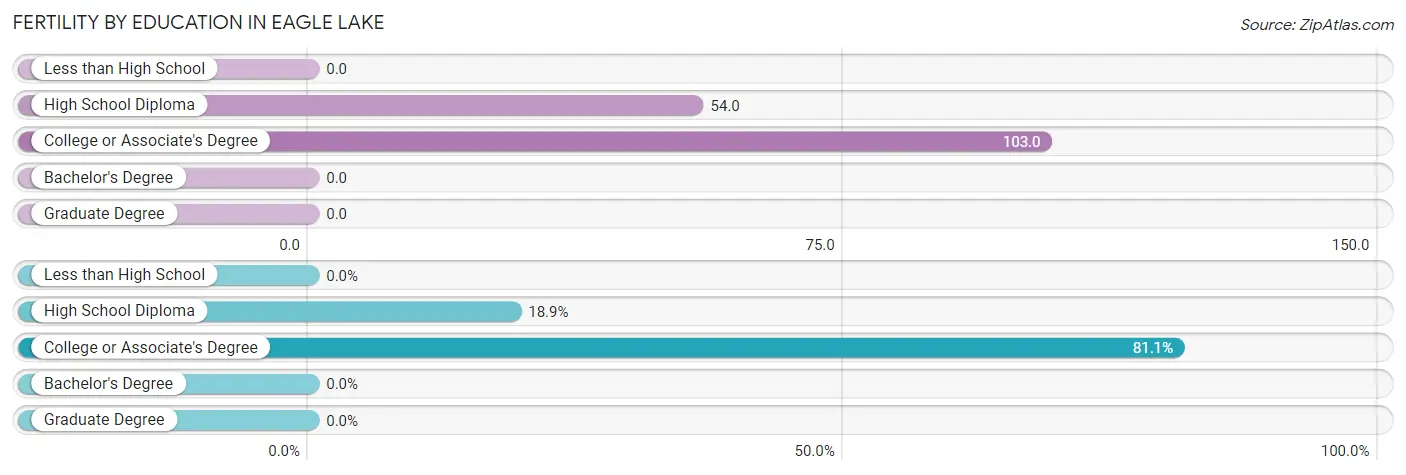
| Educational Attainment | Women with Births | Births / 1,000 Women |
| Less than High School | 0 (0.0%) | 0.0 |
| High School Diploma | 7 (18.9%) | 54.0 |
| College or Associate's Degree | 30 (81.1%) | 103.0 |
| Bachelor's Degree | 0 (0.0%) | 0.0 |
| Graduate Degree | 0 (0.0%) | 0.0 |
| Total | 37 (100.0%) | 54.0 |
Fertility by Education by Marriage Status in Eagle Lake
35.1% of women with births in Eagle Lake are unmarried. Women with the educational attainment of college or associate's degree are most likely to be married with 80.0% of them married at childbirth, while women with the educational attainment of high school diploma are least likely to be married with 100.0% of them unmarried at childbirth.
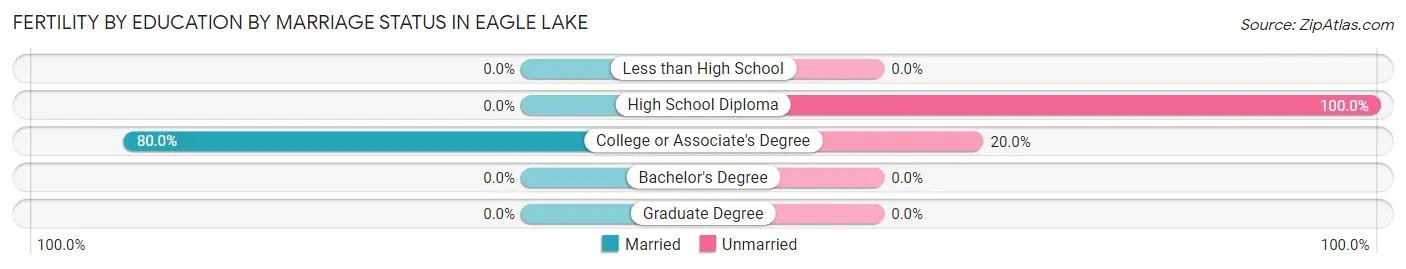
| Educational Attainment | Married | Unmarried |
| Less than High School | 0 (0.0%) | 0 (0.0%) |
| High School Diploma | 0 (0.0%) | 7 (100.0%) |
| College or Associate's Degree | 24 (80.0%) | 6 (20.0%) |
| Bachelor's Degree | 0 (0.0%) | 0 (0.0%) |
| Graduate Degree | 0 (0.0%) | 0 (0.0%) |
| Total | 24 (64.9%) | 13 (35.1%) |
Employment Characteristics in Eagle Lake
Employment by Class of Employer in Eagle Lake
Among the 1,340 employed individuals in Eagle Lake, private company employees (1,006 | 75.1%), local government employees (158 | 11.8%), and not-for-profit organizations (64 | 4.8%) make up the most common classes of employment.
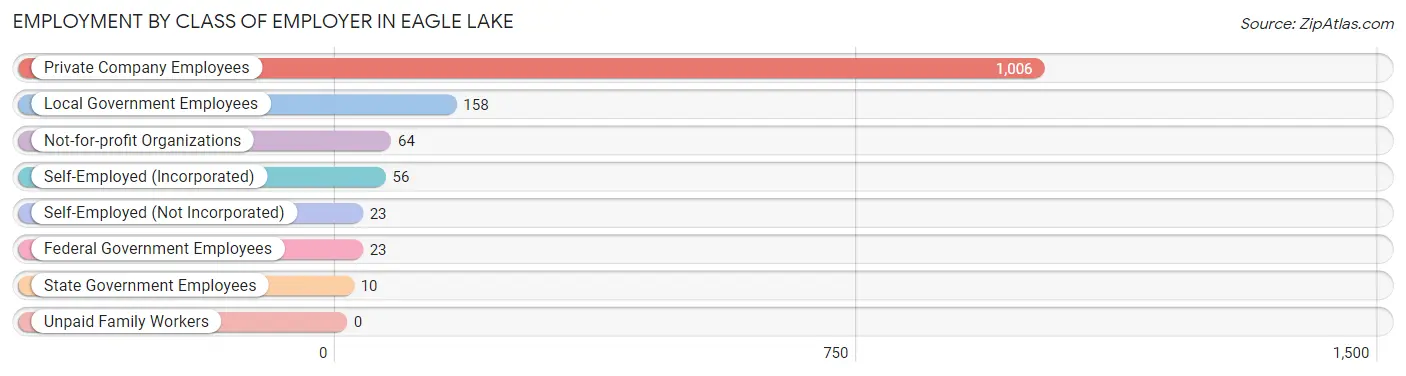
| Employer Class | # Employees | % Employees |
| Private Company Employees | 1,006 | 75.1% |
| Self-Employed (Incorporated) | 56 | 4.2% |
| Self-Employed (Not Incorporated) | 23 | 1.7% |
| Not-for-profit Organizations | 64 | 4.8% |
| Local Government Employees | 158 | 11.8% |
| State Government Employees | 10 | 0.7% |
| Federal Government Employees | 23 | 1.7% |
| Unpaid Family Workers | 0 | 0.0% |
| Total | 1,340 | 100.0% |
Employment Status by Age in Eagle Lake
According to the labor force statistics for Eagle Lake, out of the total population over 16 years of age (2,145), 65.8% or 1,411 individuals are in the labor force, with 5.1% or 72 of them unemployed. The age group with the highest labor force participation rate is 35 to 44 years, with 85.5% or 484 individuals in the labor force. Within the labor force, the 65 to 74 years age range has the highest percentage of unemployed individuals, with 42.1% or 24 of them being unemployed.
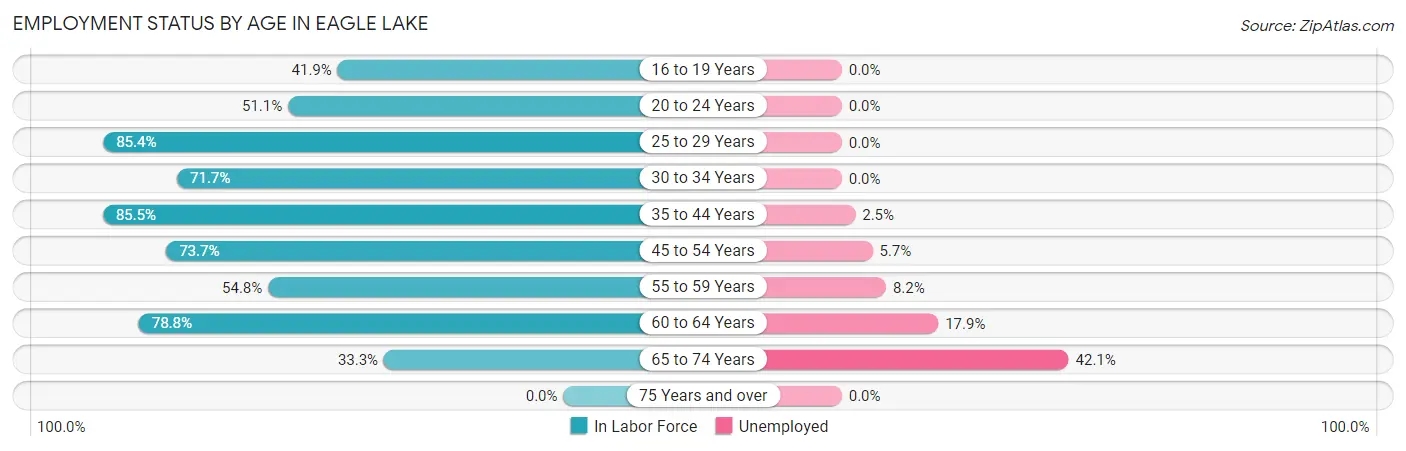
| Age Bracket | In Labor Force | Unemployed |
| 16 to 19 Years | 36 (41.9%) | 0 (0.0%) |
| 20 to 24 Years | 47 (51.1%) | 0 (0.0%) |
| 25 to 29 Years | 222 (85.4%) | 0 (0.0%) |
| 30 to 34 Years | 147 (71.7%) | 0 (0.0%) |
| 35 to 44 Years | 484 (85.5%) | 12 (2.5%) |
| 45 to 54 Years | 244 (73.7%) | 14 (5.7%) |
| 55 to 59 Years | 97 (54.8%) | 8 (8.2%) |
| 60 to 64 Years | 78 (78.8%) | 14 (17.9%) |
| 65 to 74 Years | 57 (33.3%) | 24 (42.1%) |
| 75 Years and over | 0 (0.0%) | 0 (0.0%) |
| Total | 1,411 (65.8%) | 72 (5.1%) |
Employment Status by Educational Attainment in Eagle Lake
According to labor force statistics for Eagle Lake, 77.7% of individuals (1,273) out of the total population between 25 and 64 years of age (1,638) are in the labor force, with 3.8% or 48 of them being unemployed. The group with the highest labor force participation rate are those with the educational attainment of bachelor's degree or higher, with 100.0% or 297 individuals in the labor force. Within the labor force, individuals with high school diploma education have the highest percentage of unemployment, with 5.7% or 21 of them being unemployed.
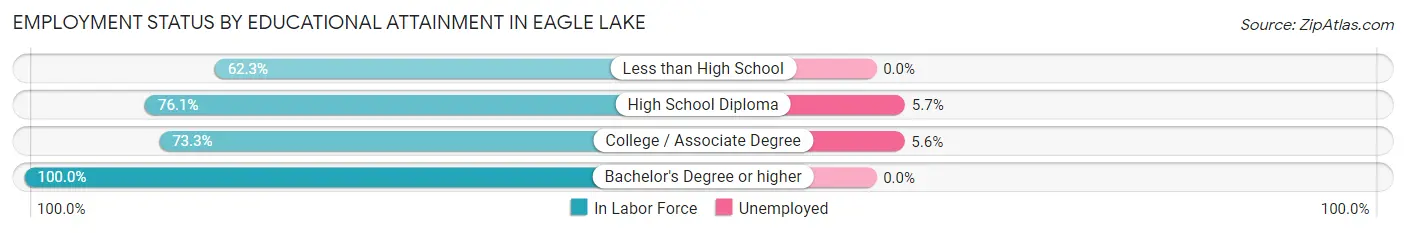
| Educational Attainment | In Labor Force | Unemployed |
| Less than High School | 124 (62.3%) | 0 (0.0%) |
| High School Diploma | 367 (76.1%) | 27 (5.7%) |
| College / Associate Degree | 484 (73.3%) | 37 (5.6%) |
| Bachelor's Degree or higher | 297 (100.0%) | 0 (0.0%) |
| Total | 1,273 (77.7%) | 62 (3.8%) |
Employment Occupations by Sex in Eagle Lake
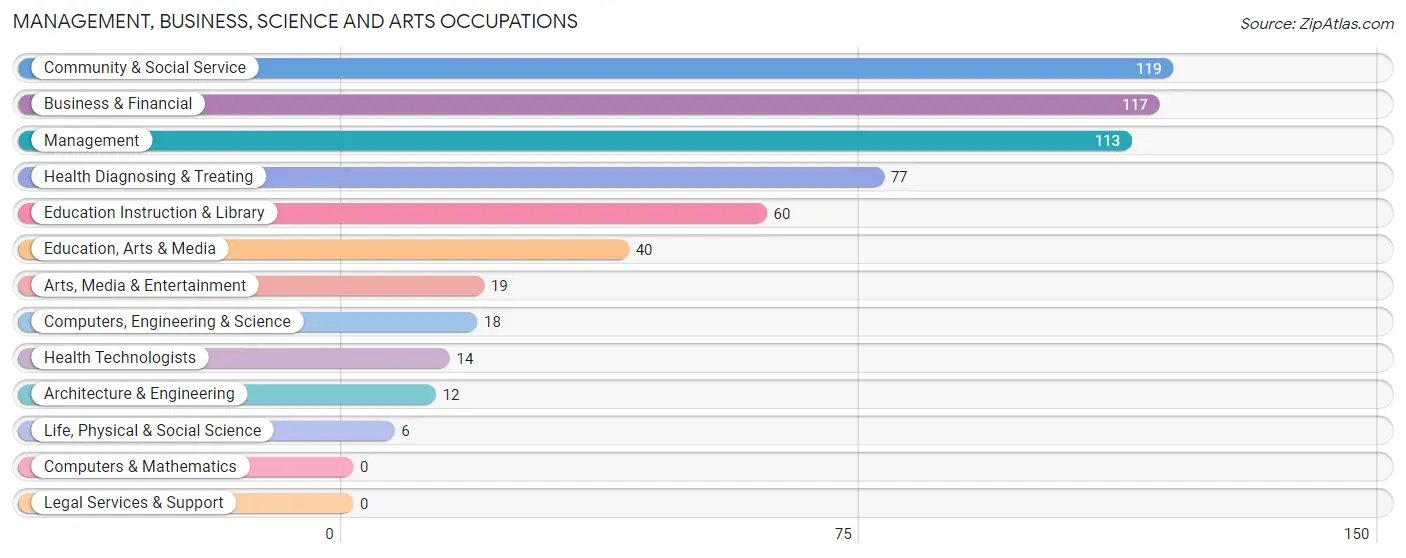
Management, Business, Science and Arts Occupations
The most common Management, Business, Science and Arts occupations in Eagle Lake are Community & Social Service (119 | 8.9%), Business & Financial (117 | 8.7%), Management (113 | 8.4%), Health Diagnosing & Treating (77 | 5.8%), and Education Instruction & Library (60 | 4.5%).
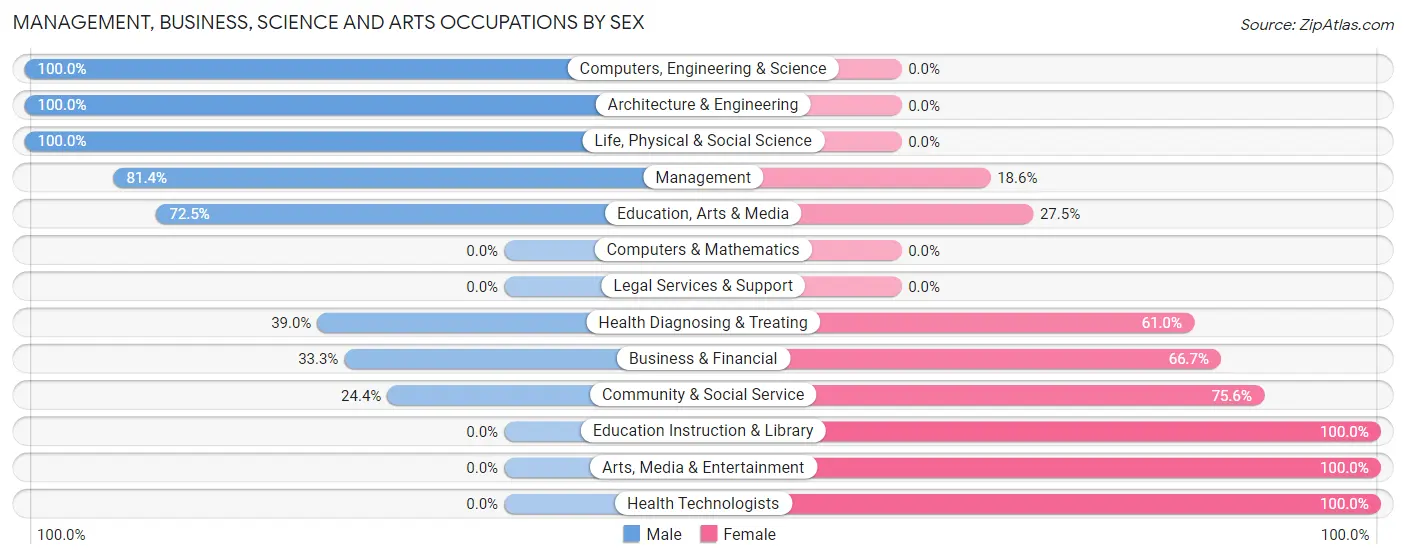
Management, Business, Science and Arts Occupations by Sex
Within the Management, Business, Science and Arts occupations in Eagle Lake, the most male-oriented occupations are Computers, Engineering & Science (100.0%), Architecture & Engineering (100.0%), and Life, Physical & Social Science (100.0%), while the most female-oriented occupations are Education Instruction & Library (100.0%), Arts, Media & Entertainment (100.0%), and Health Technologists (100.0%).
| Occupation | Male | Female |
| Management | 92 (81.4%) | 21 (18.6%) |
| Business & Financial | 39 (33.3%) | 78 (66.7%) |
| Computers, Engineering & Science | 18 (100.0%) | 0 (0.0%) |
| Computers & Mathematics | 0 (0.0%) | 0 (0.0%) |
| Architecture & Engineering | 12 (100.0%) | 0 (0.0%) |
| Life, Physical & Social Science | 6 (100.0%) | 0 (0.0%) |
| Community & Social Service | 29 (24.4%) | 90 (75.6%) |
| Education, Arts & Media | 29 (72.5%) | 11 (27.5%) |
| Legal Services & Support | 0 (0.0%) | 0 (0.0%) |
| Education Instruction & Library | 0 (0.0%) | 60 (100.0%) |
| Arts, Media & Entertainment | 0 (0.0%) | 19 (100.0%) |
| Health Diagnosing & Treating | 30 (39.0%) | 47 (61.0%) |
| Health Technologists | 0 (0.0%) | 14 (100.0%) |
| Total (Category) | 208 (46.9%) | 236 (53.1%) |
| Total (Overall) | 788 (58.8%) | 552 (41.2%) |
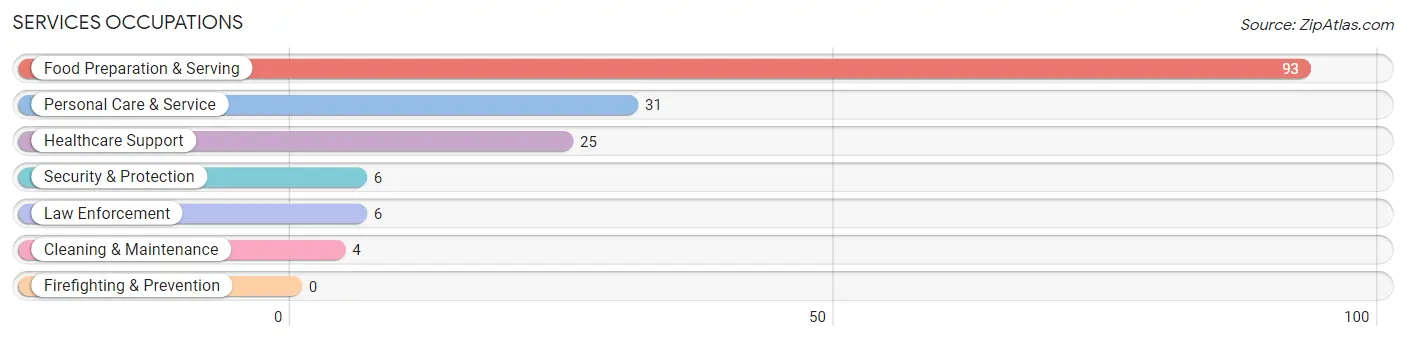
Services Occupations
The most common Services occupations in Eagle Lake are Food Preparation & Serving (93 | 6.9%), Personal Care & Service (31 | 2.3%), Healthcare Support (25 | 1.9%), Security & Protection (6 | 0.4%), and Law Enforcement (6 | 0.4%).
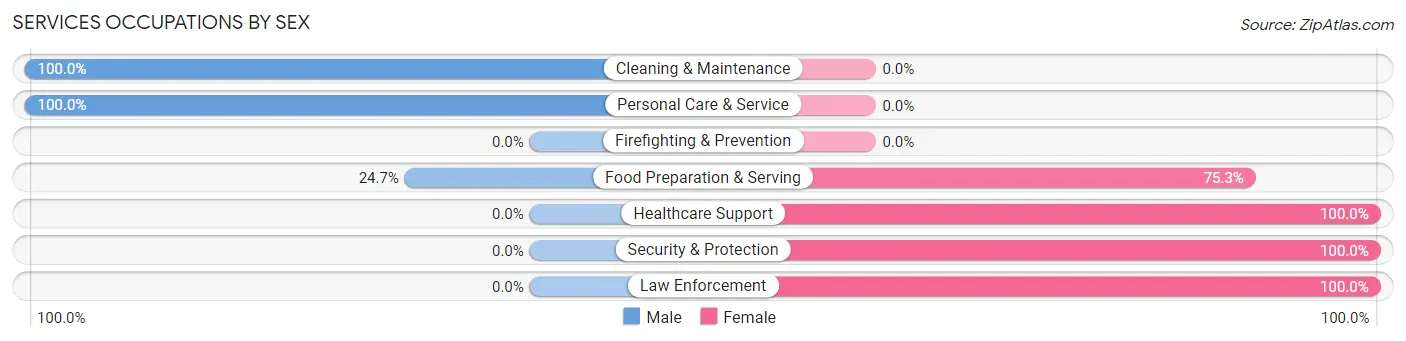
Services Occupations by Sex
Within the Services occupations in Eagle Lake, the most male-oriented occupations are Cleaning & Maintenance (100.0%), Personal Care & Service (100.0%), and Food Preparation & Serving (24.7%), while the most female-oriented occupations are Healthcare Support (100.0%), Security & Protection (100.0%), and Law Enforcement (100.0%).
| Occupation | Male | Female |
| Healthcare Support | 0 (0.0%) | 25 (100.0%) |
| Security & Protection | 0 (0.0%) | 6 (100.0%) |
| Firefighting & Prevention | 0 (0.0%) | 0 (0.0%) |
| Law Enforcement | 0 (0.0%) | 6 (100.0%) |
| Food Preparation & Serving | 23 (24.7%) | 70 (75.3%) |
| Cleaning & Maintenance | 4 (100.0%) | 0 (0.0%) |
| Personal Care & Service | 31 (100.0%) | 0 (0.0%) |
| Total (Category) | 58 (36.5%) | 101 (63.5%) |
| Total (Overall) | 788 (58.8%) | 552 (41.2%) |
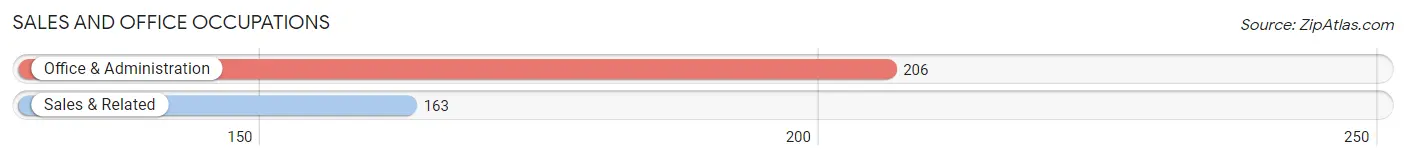
Sales and Office Occupations
The most common Sales and Office occupations in Eagle Lake are Office & Administration (206 | 15.4%), and Sales & Related (163 | 12.2%).
Sales and Office Occupations by Sex
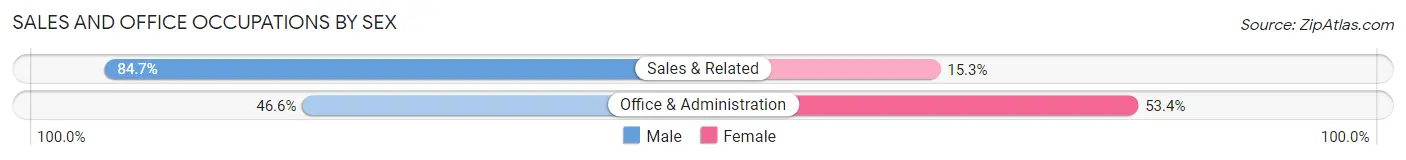
| Occupation | Male | Female |
| Sales & Related | 138 (84.7%) | 25 (15.3%) |
| Office & Administration | 96 (46.6%) | 110 (53.4%) |
| Total (Category) | 234 (63.4%) | 135 (36.6%) |
| Total (Overall) | 788 (58.8%) | 552 (41.2%) |
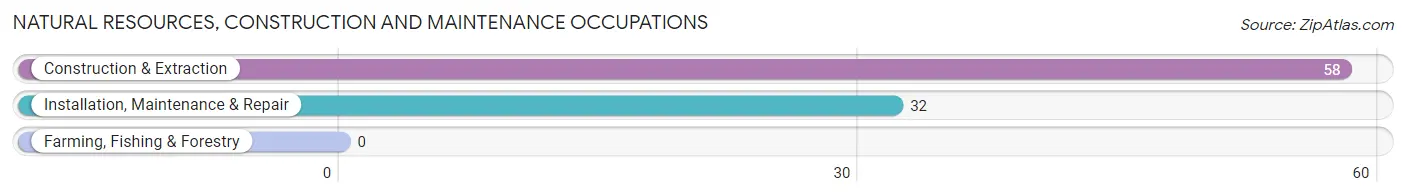
Natural Resources, Construction and Maintenance Occupations
The most common Natural Resources, Construction and Maintenance occupations in Eagle Lake are Construction & Extraction (58 | 4.3%), and Installation, Maintenance & Repair (32 | 2.4%).
Natural Resources, Construction and Maintenance Occupations by Sex
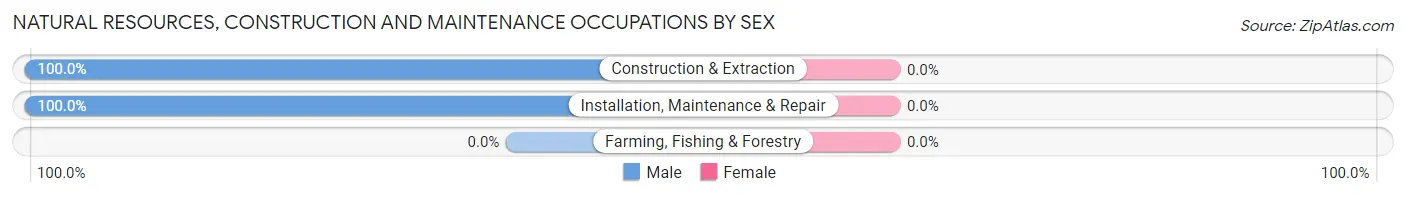
| Occupation | Male | Female |
| Farming, Fishing & Forestry | 0 (0.0%) | 0 (0.0%) |
| Construction & Extraction | 58 (100.0%) | 0 (0.0%) |
| Installation, Maintenance & Repair | 32 (100.0%) | 0 (0.0%) |
| Total (Category) | 90 (100.0%) | 0 (0.0%) |
| Total (Overall) | 788 (58.8%) | 552 (41.2%) |
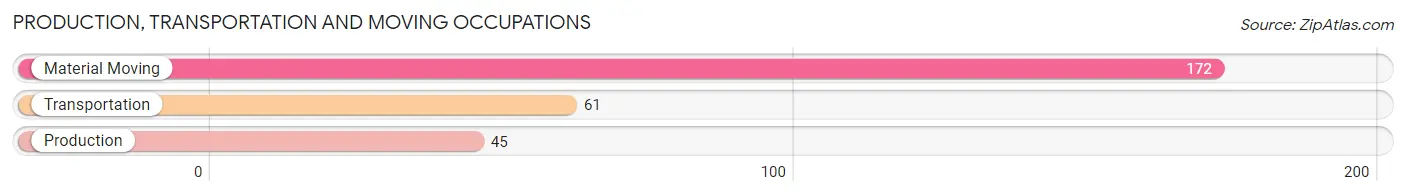
Production, Transportation and Moving Occupations
The most common Production, Transportation and Moving occupations in Eagle Lake are Material Moving (172 | 12.8%), Transportation (61 | 4.5%), and Production (45 | 3.4%).
Production, Transportation and Moving Occupations by Sex
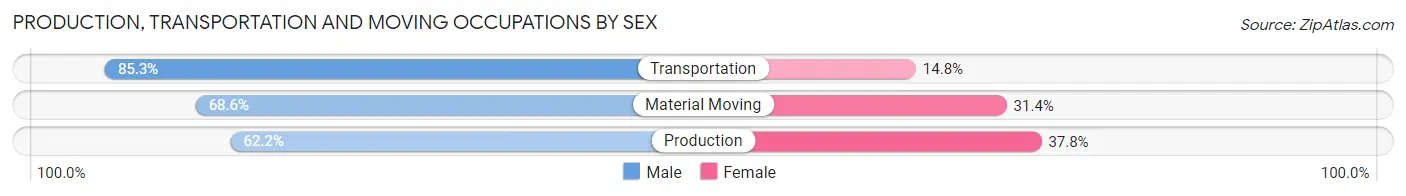
| Occupation | Male | Female |
| Production | 28 (62.2%) | 17 (37.8%) |
| Transportation | 52 (85.3%) | 9 (14.7%) |
| Material Moving | 118 (68.6%) | 54 (31.4%) |
| Total (Category) | 198 (71.2%) | 80 (28.8%) |
| Total (Overall) | 788 (58.8%) | 552 (41.2%) |
Employment Industries by Sex in Eagle Lake
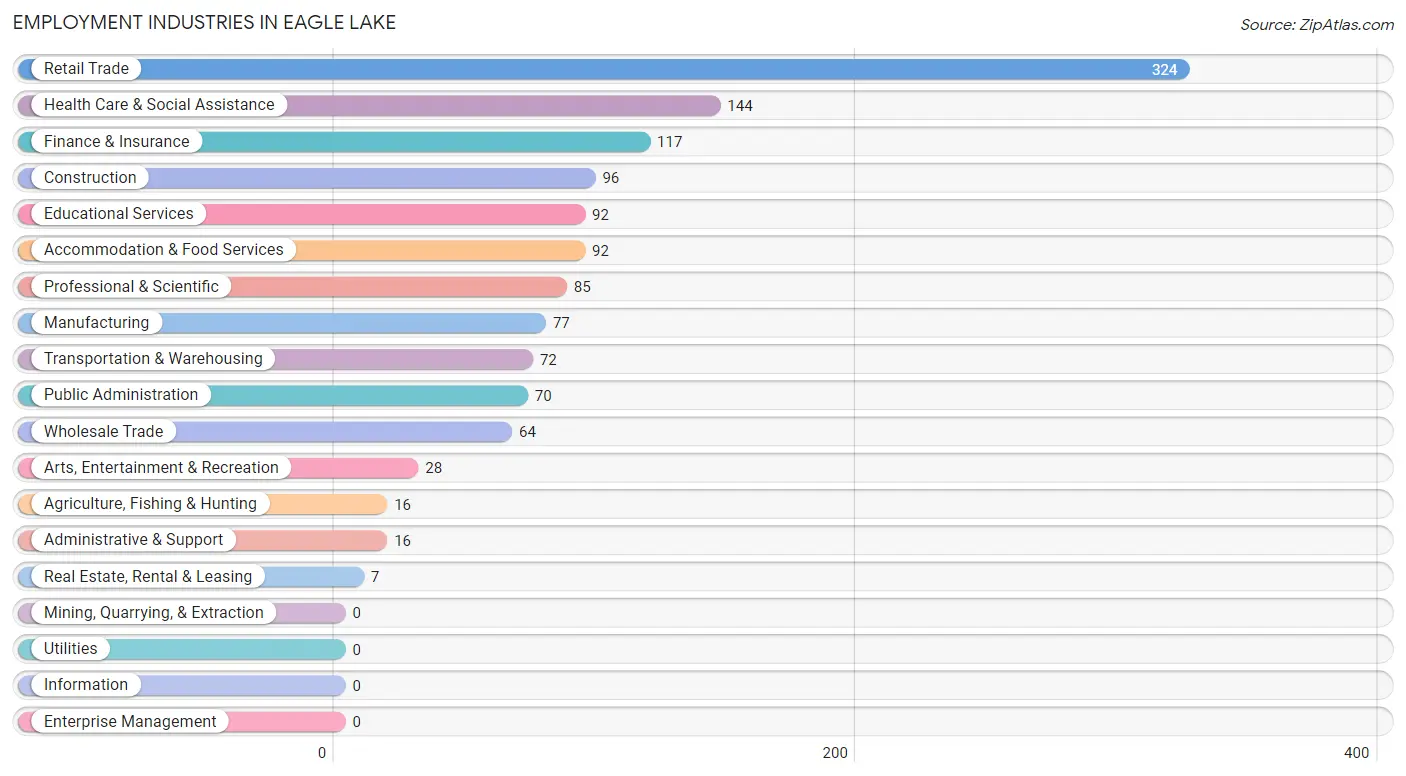
Employment Industries in Eagle Lake
The major employment industries in Eagle Lake include Retail Trade (324 | 24.2%), Health Care & Social Assistance (144 | 10.7%), Finance & Insurance (117 | 8.7%), Construction (96 | 7.2%), and Educational Services (92 | 6.9%).
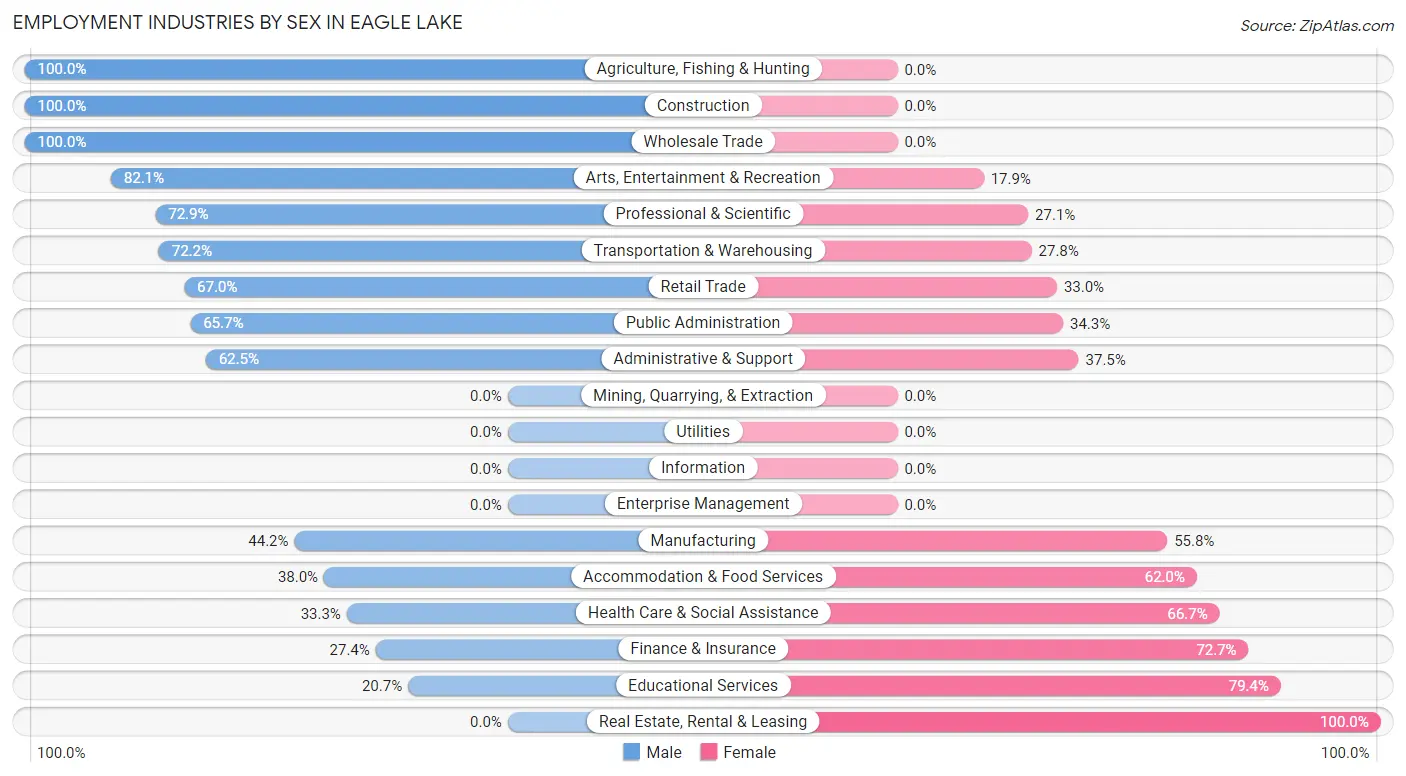
Employment Industries by Sex in Eagle Lake
The Eagle Lake industries that see more men than women are Agriculture, Fishing & Hunting (100.0%), Construction (100.0%), and Wholesale Trade (100.0%), whereas the industries that tend to have a higher number of women are Real Estate, Rental & Leasing (100.0%), Educational Services (79.3%), and Finance & Insurance (72.7%).
| Industry | Male | Female |
| Agriculture, Fishing & Hunting | 16 (100.0%) | 0 (0.0%) |
| Mining, Quarrying, & Extraction | 0 (0.0%) | 0 (0.0%) |
| Construction | 96 (100.0%) | 0 (0.0%) |
| Manufacturing | 34 (44.2%) | 43 (55.8%) |
| Wholesale Trade | 64 (100.0%) | 0 (0.0%) |
| Retail Trade | 217 (67.0%) | 107 (33.0%) |
| Transportation & Warehousing | 52 (72.2%) | 20 (27.8%) |
| Utilities | 0 (0.0%) | 0 (0.0%) |
| Information | 0 (0.0%) | 0 (0.0%) |
| Finance & Insurance | 32 (27.4%) | 85 (72.7%) |
| Real Estate, Rental & Leasing | 0 (0.0%) | 7 (100.0%) |
| Professional & Scientific | 62 (72.9%) | 23 (27.1%) |
| Enterprise Management | 0 (0.0%) | 0 (0.0%) |
| Administrative & Support | 10 (62.5%) | 6 (37.5%) |
| Educational Services | 19 (20.6%) | 73 (79.3%) |
| Health Care & Social Assistance | 48 (33.3%) | 96 (66.7%) |
| Arts, Entertainment & Recreation | 23 (82.1%) | 5 (17.9%) |
| Accommodation & Food Services | 35 (38.0%) | 57 (62.0%) |
| Public Administration | 46 (65.7%) | 24 (34.3%) |
| Total | 788 (58.8%) | 552 (41.2%) |
Education in Eagle Lake
School Enrollment in Eagle Lake
The most common levels of schooling among the 884 students in Eagle Lake are middle school (273 | 30.9%), elementary school (205 | 23.2%), and nursery / preschool (114 | 12.9%).
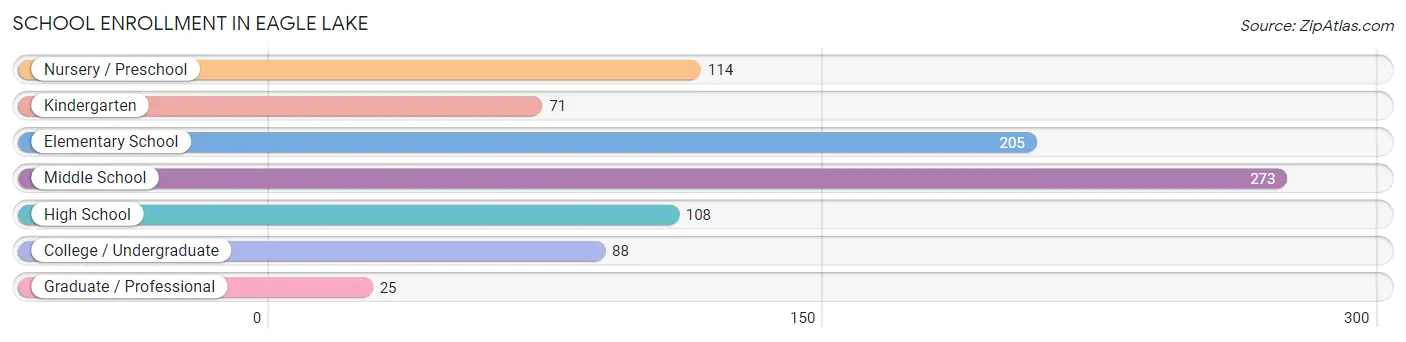
| School Level | # Students | % Students |
| Nursery / Preschool | 114 | 12.9% |
| Kindergarten | 71 | 8.0% |
| Elementary School | 205 | 23.2% |
| Middle School | 273 | 30.9% |
| High School | 108 | 12.2% |
| College / Undergraduate | 88 | 10.0% |
| Graduate / Professional | 25 | 2.8% |
| Total | 884 | 100.0% |
School Enrollment by Age by Funding Source in Eagle Lake
Out of a total of 884 students who are enrolled in schools in Eagle Lake, 266 (30.1%) attend a private institution, while the remaining 618 (69.9%) are enrolled in public schools. The age group of 20 to 24 year olds has the highest likelihood of being enrolled in private schools, with 23 (100.0% in the age bracket) enrolled. Conversely, the age group of 18 to 19 year olds has the lowest likelihood of being enrolled in a private school, with 13 (100.0% in the age bracket) attending a public institution.
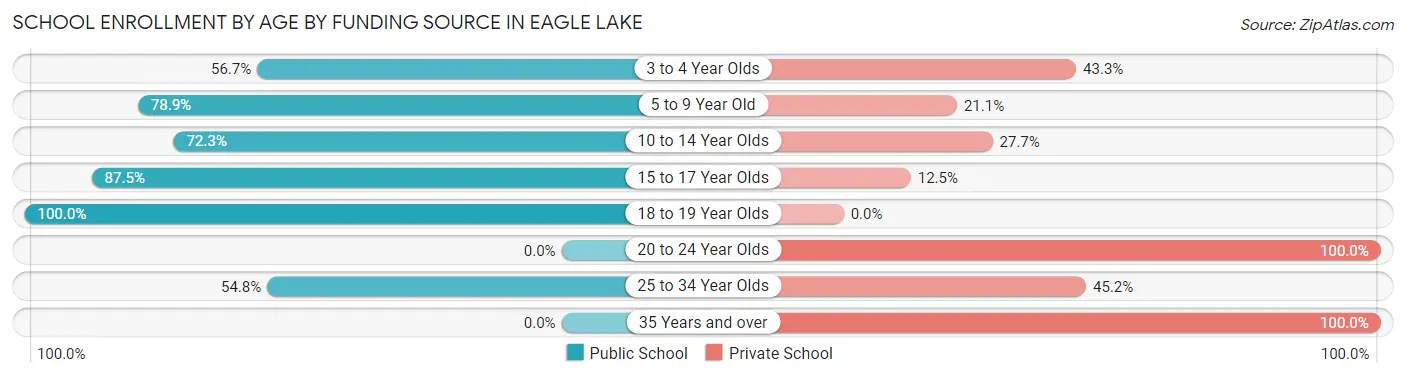
| Age Bracket | Public School | Private School |
| 3 to 4 Year Olds | 55 (56.7%) | 42 (43.3%) |
| 5 to 9 Year Old | 228 (78.9%) | 61 (21.1%) |
| 10 to 14 Year Olds | 211 (72.3%) | 81 (27.7%) |
| 15 to 17 Year Olds | 77 (87.5%) | 11 (12.5%) |
| 18 to 19 Year Olds | 13 (100.0%) | 0 (0.0%) |
| 20 to 24 Year Olds | 0 (0.0%) | 23 (100.0%) |
| 25 to 34 Year Olds | 34 (54.8%) | 28 (45.2%) |
| 35 Years and over | 0 (0.0%) | 20 (100.0%) |
| Total | 618 (69.9%) | 266 (30.1%) |
Educational Attainment by Field of Study in Eagle Lake
Education (95 | 26.8%), business (70 | 19.7%), arts & humanities (36 | 10.1%), physical & health sciences (30 | 8.5%), and psychology (30 | 8.5%) are the most common fields of study among 355 individuals in Eagle Lake who have obtained a bachelor's degree or higher.
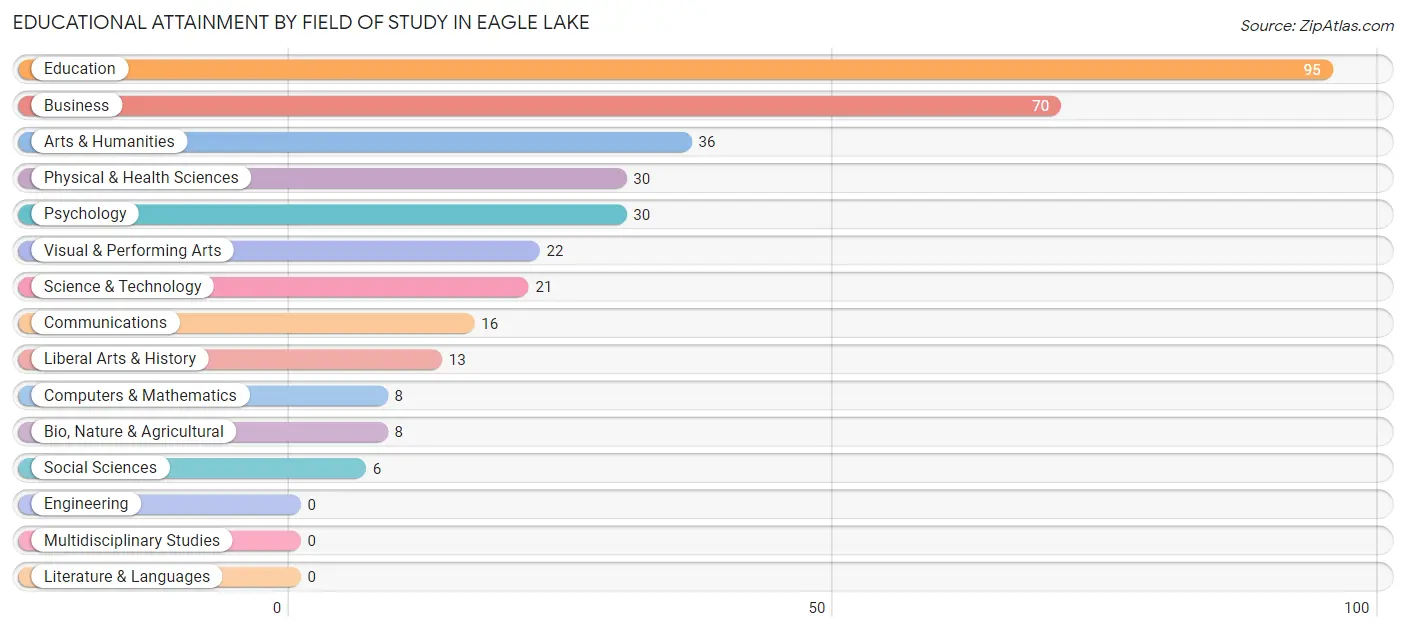
| Field of Study | # Graduates | % Graduates |
| Computers & Mathematics | 8 | 2.2% |
| Bio, Nature & Agricultural | 8 | 2.2% |
| Physical & Health Sciences | 30 | 8.5% |
| Psychology | 30 | 8.5% |
| Social Sciences | 6 | 1.7% |
| Engineering | 0 | 0.0% |
| Multidisciplinary Studies | 0 | 0.0% |
| Science & Technology | 21 | 5.9% |
| Business | 70 | 19.7% |
| Education | 95 | 26.8% |
| Literature & Languages | 0 | 0.0% |
| Liberal Arts & History | 13 | 3.7% |
| Visual & Performing Arts | 22 | 6.2% |
| Communications | 16 | 4.5% |
| Arts & Humanities | 36 | 10.1% |
| Total | 355 | 100.0% |
Transportation & Commute in Eagle Lake
Vehicle Availability by Sex in Eagle Lake
The most prevalent vehicle ownership categories in Eagle Lake are males with 2 vehicles (305, accounting for 38.7%) and females with 2 vehicles (282, making up 55.2%).
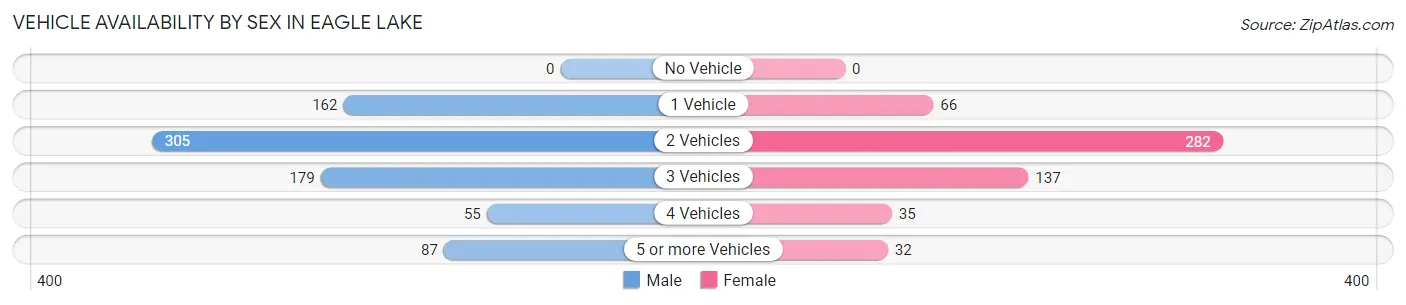
| Vehicles Available | Male | Female |
| No Vehicle | 0 (0.0%) | 0 (0.0%) |
| 1 Vehicle | 162 (20.6%) | 66 (12.0%) |
| 2 Vehicles | 305 (38.7%) | 282 (51.1%) |
| 3 Vehicles | 179 (22.7%) | 137 (24.8%) |
| 4 Vehicles | 55 (7.0%) | 35 (6.3%) |
| 5 or more Vehicles | 87 (11.0%) | 32 (5.8%) |
| Total | 788 (100.0%) | 552 (100.0%) |
Commute Time in Eagle Lake
The most frequently occuring commute durations in Eagle Lake are 30 to 34 minutes (334 commuters, 28.1%), 15 to 19 minutes (218 commuters, 18.4%), and 20 to 24 minutes (141 commuters, 11.9%).
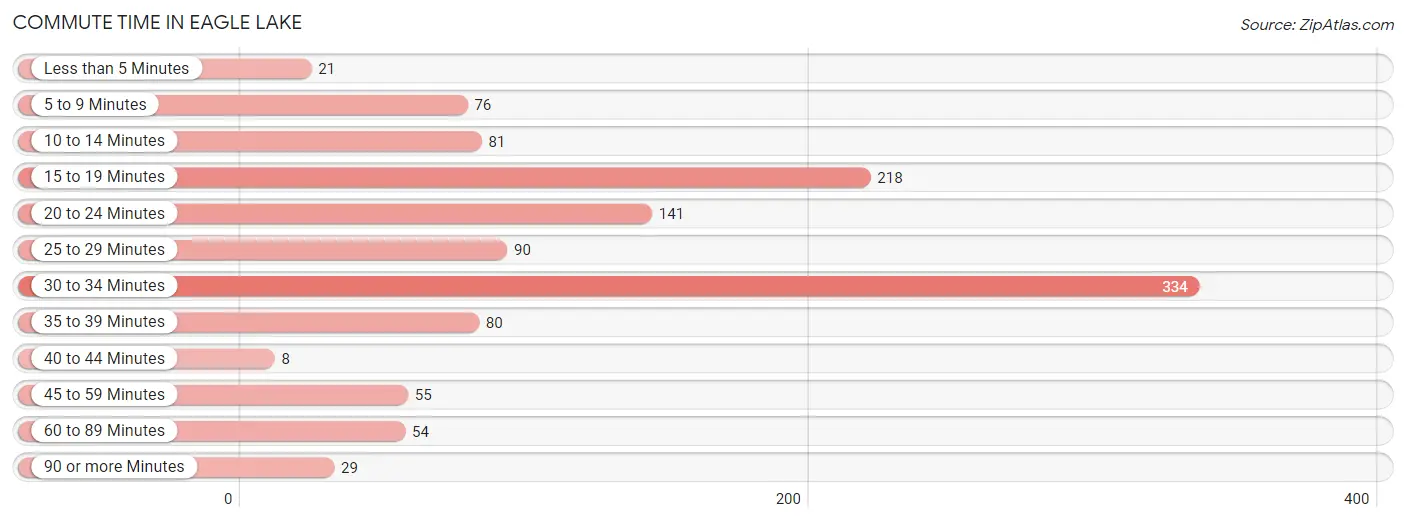
| Commute Time | # Commuters | % Commuters |
| Less than 5 Minutes | 21 | 1.8% |
| 5 to 9 Minutes | 76 | 6.4% |
| 10 to 14 Minutes | 81 | 6.8% |
| 15 to 19 Minutes | 218 | 18.4% |
| 20 to 24 Minutes | 141 | 11.9% |
| 25 to 29 Minutes | 90 | 7.6% |
| 30 to 34 Minutes | 334 | 28.1% |
| 35 to 39 Minutes | 80 | 6.7% |
| 40 to 44 Minutes | 8 | 0.7% |
| 45 to 59 Minutes | 55 | 4.6% |
| 60 to 89 Minutes | 54 | 4.5% |
| 90 or more Minutes | 29 | 2.4% |
Commute Time by Sex in Eagle Lake
The most common commute times in Eagle Lake are 30 to 34 minutes (227 commuters, 32.4%) for males and 15 to 19 minutes (127 commuters, 26.1%) for females.
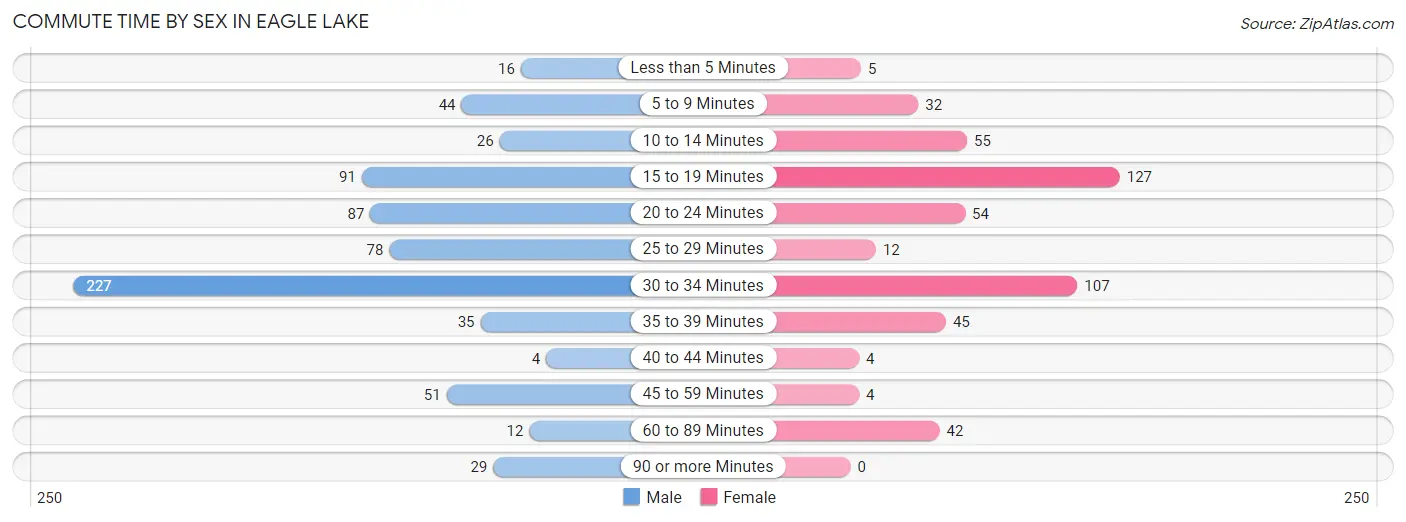
| Commute Time | Male | Female |
| Less than 5 Minutes | 16 (2.3%) | 5 (1.0%) |
| 5 to 9 Minutes | 44 (6.3%) | 32 (6.6%) |
| 10 to 14 Minutes | 26 (3.7%) | 55 (11.3%) |
| 15 to 19 Minutes | 91 (13.0%) | 127 (26.1%) |
| 20 to 24 Minutes | 87 (12.4%) | 54 (11.1%) |
| 25 to 29 Minutes | 78 (11.1%) | 12 (2.5%) |
| 30 to 34 Minutes | 227 (32.4%) | 107 (22.0%) |
| 35 to 39 Minutes | 35 (5.0%) | 45 (9.2%) |
| 40 to 44 Minutes | 4 (0.6%) | 4 (0.8%) |
| 45 to 59 Minutes | 51 (7.3%) | 4 (0.8%) |
| 60 to 89 Minutes | 12 (1.7%) | 42 (8.6%) |
| 90 or more Minutes | 29 (4.1%) | 0 (0.0%) |
Time of Departure to Work by Sex in Eagle Lake
The most frequent times of departure to work in Eagle Lake are 6:30 AM to 6:59 AM (157, 22.4%) for males and 7:00 AM to 7:29 AM (121, 24.8%) for females.
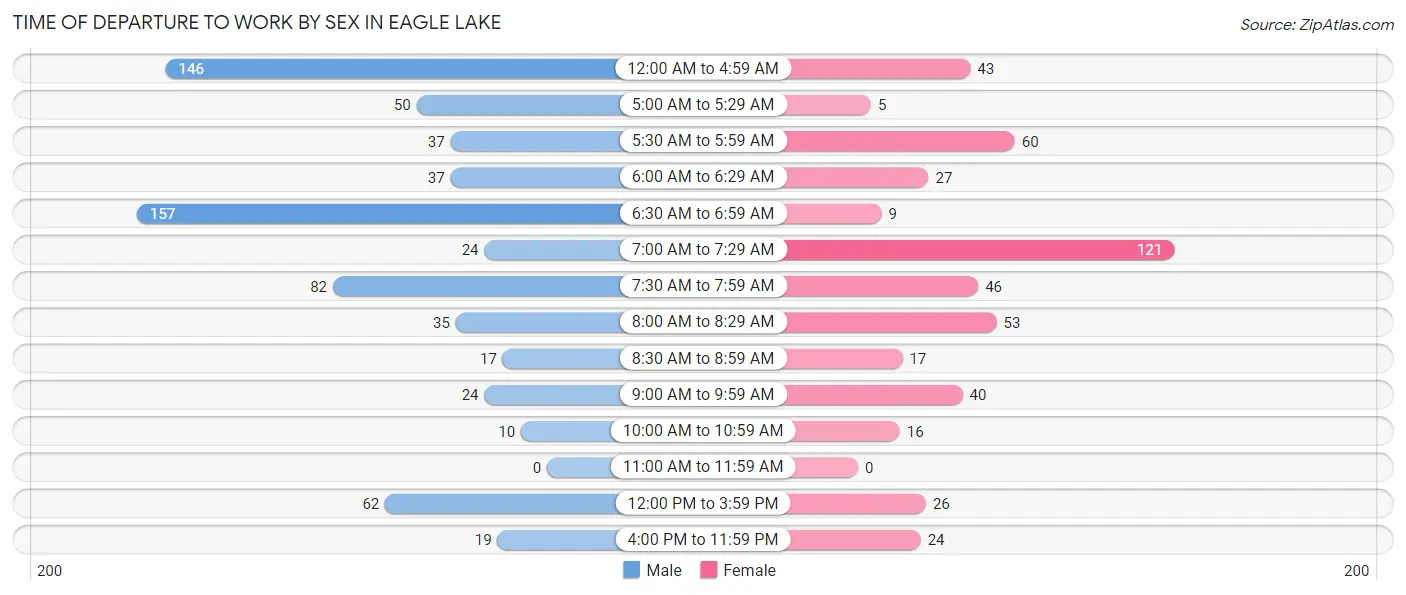
| Time of Departure | Male | Female |
| 12:00 AM to 4:59 AM | 146 (20.9%) | 43 (8.8%) |
| 5:00 AM to 5:29 AM | 50 (7.1%) | 5 (1.0%) |
| 5:30 AM to 5:59 AM | 37 (5.3%) | 60 (12.3%) |
| 6:00 AM to 6:29 AM | 37 (5.3%) | 27 (5.5%) |
| 6:30 AM to 6:59 AM | 157 (22.4%) | 9 (1.8%) |
| 7:00 AM to 7:29 AM | 24 (3.4%) | 121 (24.8%) |
| 7:30 AM to 7:59 AM | 82 (11.7%) | 46 (9.5%) |
| 8:00 AM to 8:29 AM | 35 (5.0%) | 53 (10.9%) |
| 8:30 AM to 8:59 AM | 17 (2.4%) | 17 (3.5%) |
| 9:00 AM to 9:59 AM | 24 (3.4%) | 40 (8.2%) |
| 10:00 AM to 10:59 AM | 10 (1.4%) | 16 (3.3%) |
| 11:00 AM to 11:59 AM | 0 (0.0%) | 0 (0.0%) |
| 12:00 PM to 3:59 PM | 62 (8.9%) | 26 (5.3%) |
| 4:00 PM to 11:59 PM | 19 (2.7%) | 24 (4.9%) |
| Total | 700 (100.0%) | 487 (100.0%) |
Housing Occupancy in Eagle Lake
Occupancy by Ownership in Eagle Lake
Of the total 961 dwellings in Eagle Lake, owner-occupied units account for 751 (78.1%), while renter-occupied units make up 210 (21.8%).
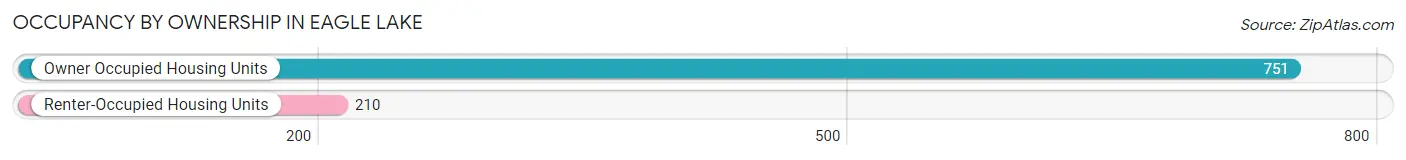
| Occupancy | # Housing Units | % Housing Units |
| Owner Occupied Housing Units | 751 | 78.1% |
| Renter-Occupied Housing Units | 210 | 21.8% |
| Total Occupied Housing Units | 961 | 100.0% |
Occupancy by Household Size in Eagle Lake
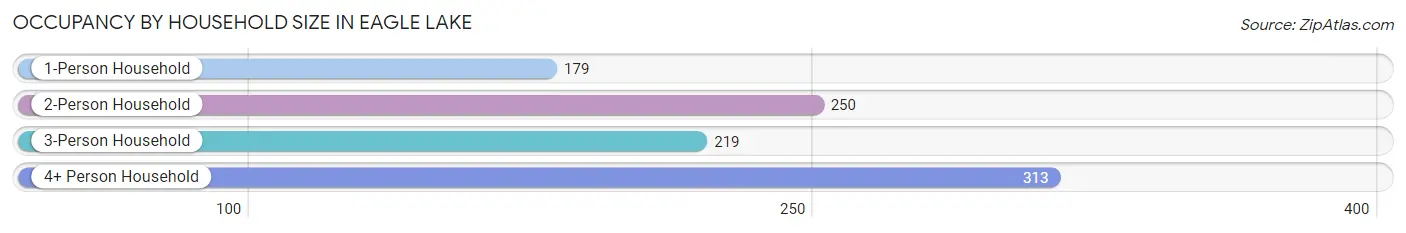
| Household Size | # Housing Units | % Housing Units |
| 1-Person Household | 179 | 18.6% |
| 2-Person Household | 250 | 26.0% |
| 3-Person Household | 219 | 22.8% |
| 4+ Person Household | 313 | 32.6% |
| Total Housing Units | 961 | 100.0% |
Occupancy by Ownership by Household Size in Eagle Lake
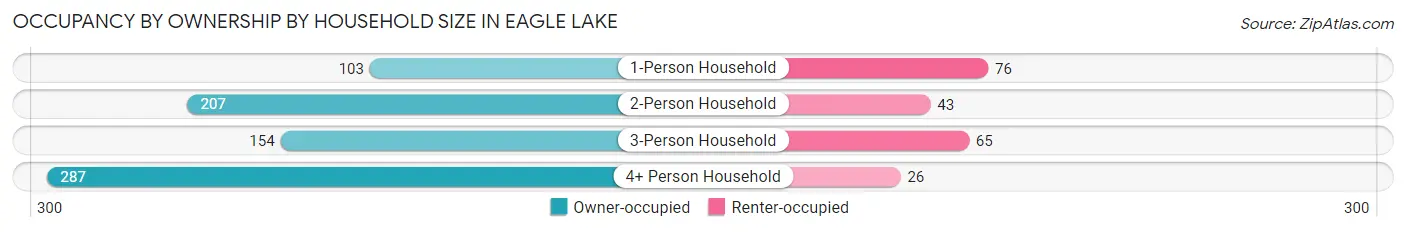
| Household Size | Owner-occupied | Renter-occupied |
| 1-Person Household | 103 (57.5%) | 76 (42.5%) |
| 2-Person Household | 207 (82.8%) | 43 (17.2%) |
| 3-Person Household | 154 (70.3%) | 65 (29.7%) |
| 4+ Person Household | 287 (91.7%) | 26 (8.3%) |
| Total Housing Units | 751 (78.1%) | 210 (21.8%) |
Occupancy by Educational Attainment in Eagle Lake
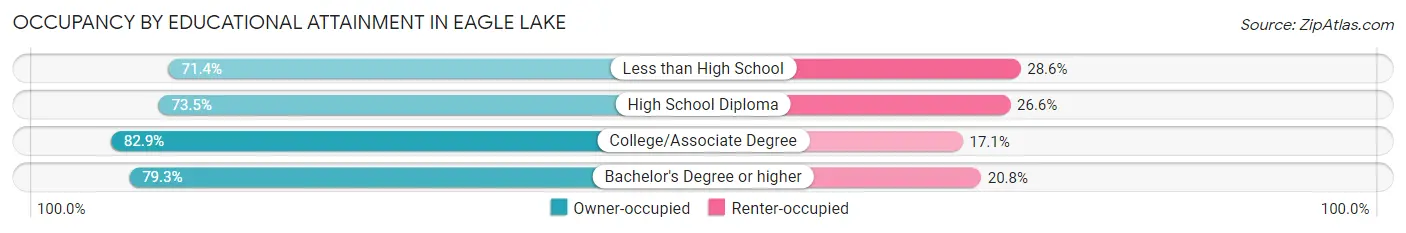
| Household Size | Owner-occupied | Renter-occupied |
| Less than High School | 65 (71.4%) | 26 (28.6%) |
| High School Diploma | 213 (73.5%) | 77 (26.6%) |
| College/Associate Degree | 305 (82.9%) | 63 (17.1%) |
| Bachelor's Degree or higher | 168 (79.2%) | 44 (20.7%) |
Occupancy by Age of Householder in Eagle Lake
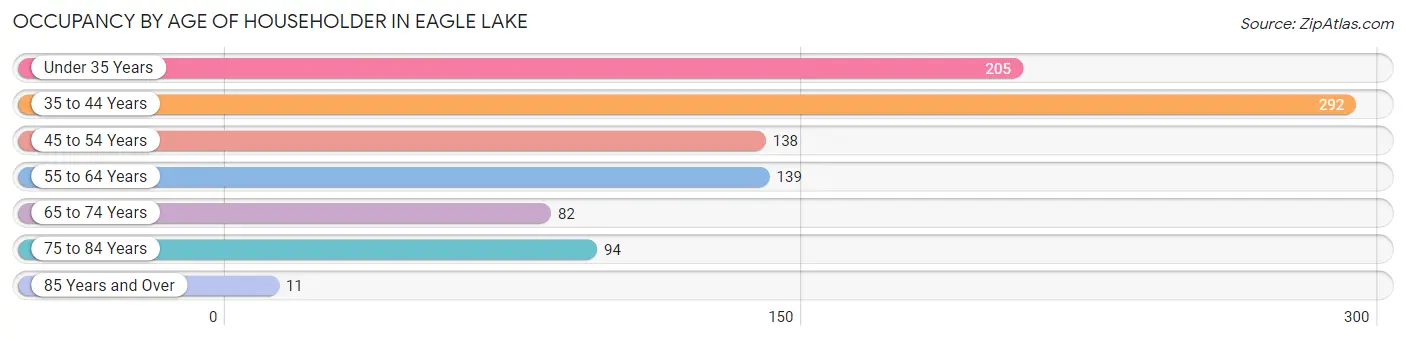
| Age Bracket | # Households | % Households |
| Under 35 Years | 205 | 21.3% |
| 35 to 44 Years | 292 | 30.4% |
| 45 to 54 Years | 138 | 14.4% |
| 55 to 64 Years | 139 | 14.5% |
| 65 to 74 Years | 82 | 8.5% |
| 75 to 84 Years | 94 | 9.8% |
| 85 Years and Over | 11 | 1.1% |
| Total | 961 | 100.0% |
Housing Finances in Eagle Lake
Median Income by Occupancy in Eagle Lake
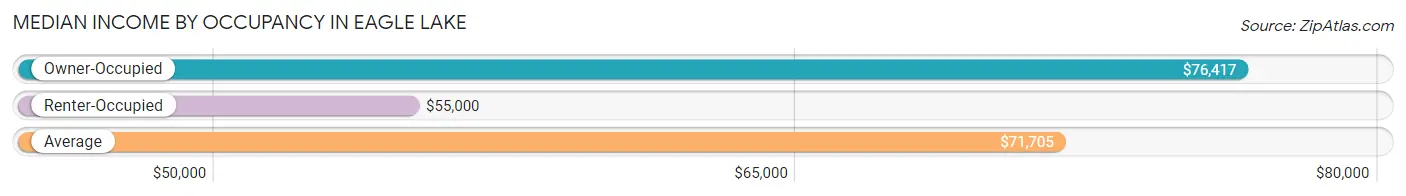
| Occupancy Type | # Households | Median Income |
| Owner-Occupied | 751 (78.1%) | $76,417 |
| Renter-Occupied | 210 (21.8%) | $55,000 |
| Average | 961 (100.0%) | $71,705 |
Occupancy by Householder Income Bracket in Eagle Lake
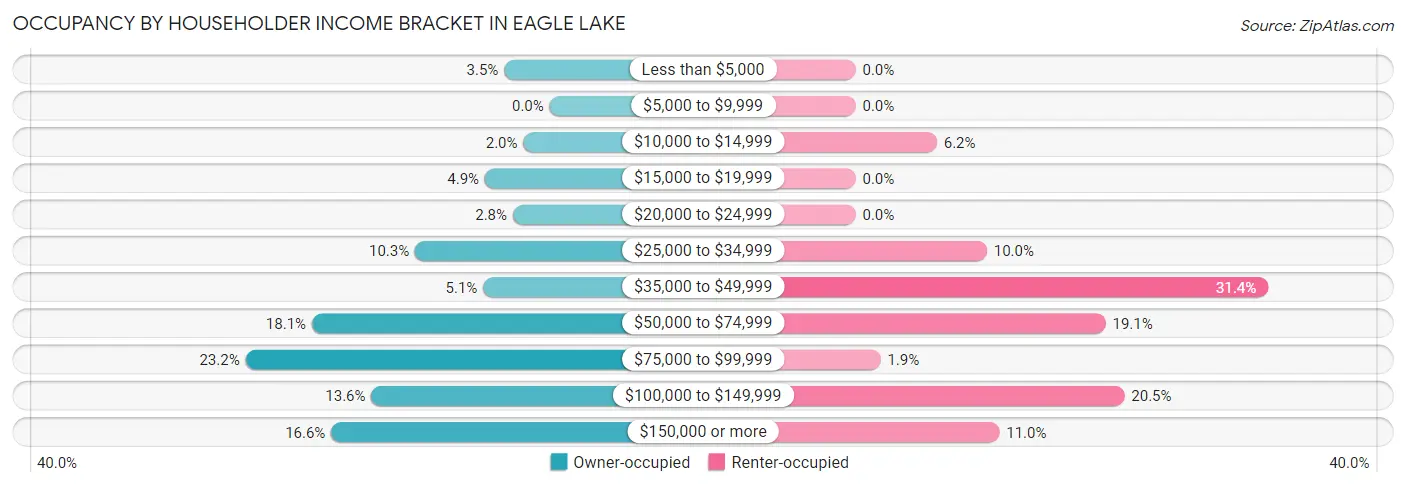
| Income Bracket | Owner-occupied | Renter-occupied |
| Less than $5,000 | 26 (3.5%) | 0 (0.0%) |
| $5,000 to $9,999 | 0 (0.0%) | 0 (0.0%) |
| $10,000 to $14,999 | 15 (2.0%) | 13 (6.2%) |
| $15,000 to $19,999 | 37 (4.9%) | 0 (0.0%) |
| $20,000 to $24,999 | 21 (2.8%) | 0 (0.0%) |
| $25,000 to $34,999 | 77 (10.2%) | 21 (10.0%) |
| $35,000 to $49,999 | 38 (5.1%) | 66 (31.4%) |
| $50,000 to $74,999 | 136 (18.1%) | 40 (19.1%) |
| $75,000 to $99,999 | 174 (23.2%) | 4 (1.9%) |
| $100,000 to $149,999 | 102 (13.6%) | 43 (20.5%) |
| $150,000 or more | 125 (16.6%) | 23 (11.0%) |
| Total | 751 (100.0%) | 210 (100.0%) |
Monthly Housing Cost Tiers in Eagle Lake
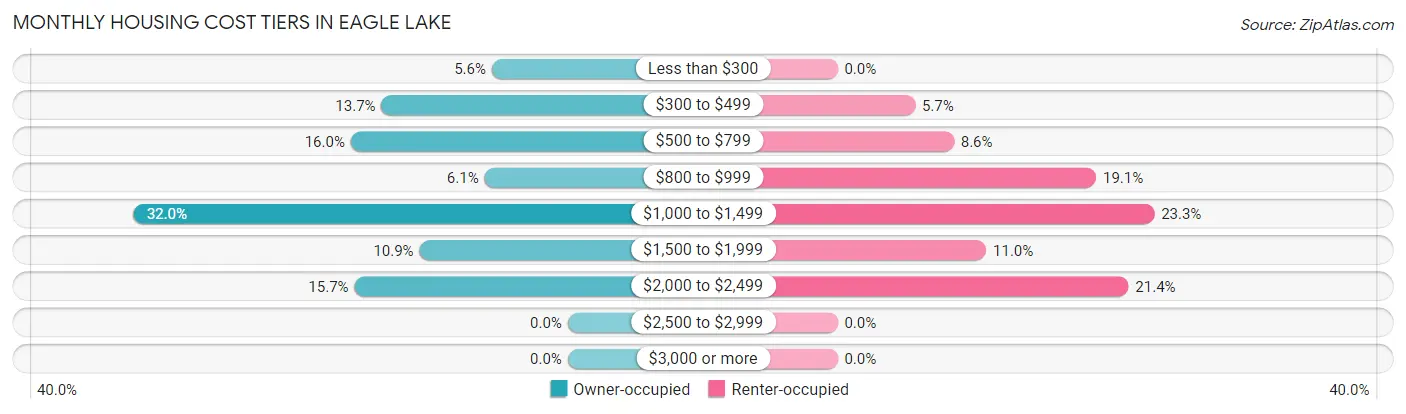
| Monthly Cost | Owner-occupied | Renter-occupied |
| Less than $300 | 42 (5.6%) | 0 (0.0%) |
| $300 to $499 | 103 (13.7%) | 12 (5.7%) |
| $500 to $799 | 120 (16.0%) | 18 (8.6%) |
| $800 to $999 | 46 (6.1%) | 40 (19.1%) |
| $1,000 to $1,499 | 240 (32.0%) | 49 (23.3%) |
| $1,500 to $1,999 | 82 (10.9%) | 23 (11.0%) |
| $2,000 to $2,499 | 118 (15.7%) | 45 (21.4%) |
| $2,500 to $2,999 | 0 (0.0%) | 0 (0.0%) |
| $3,000 or more | 0 (0.0%) | 0 (0.0%) |
| Total | 751 (100.0%) | 210 (100.0%) |
Physical Housing Characteristics in Eagle Lake
Housing Structures in Eagle Lake
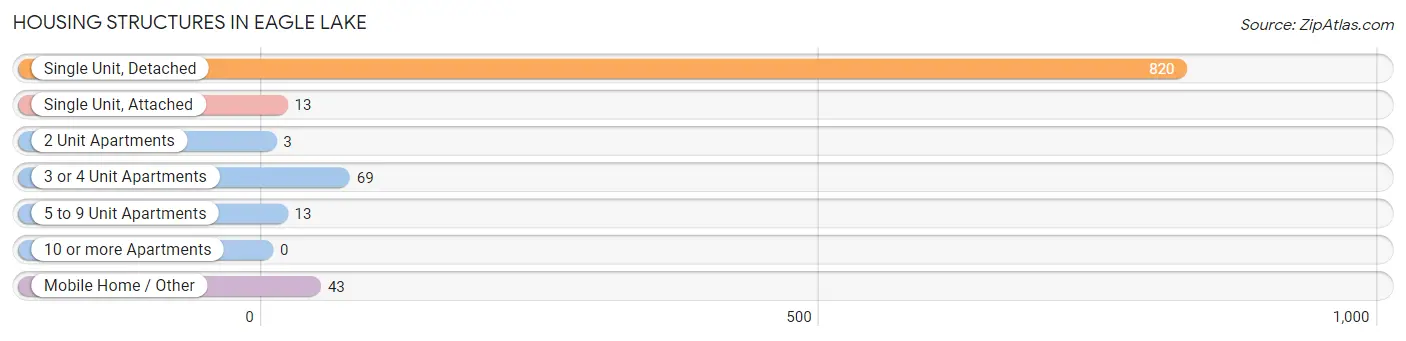
| Structure Type | # Housing Units | % Housing Units |
| Single Unit, Detached | 820 | 85.3% |
| Single Unit, Attached | 13 | 1.3% |
| 2 Unit Apartments | 3 | 0.3% |
| 3 or 4 Unit Apartments | 69 | 7.2% |
| 5 to 9 Unit Apartments | 13 | 1.3% |
| 10 or more Apartments | 0 | 0.0% |
| Mobile Home / Other | 43 | 4.5% |
| Total | 961 | 100.0% |
Housing Structures by Occupancy in Eagle Lake
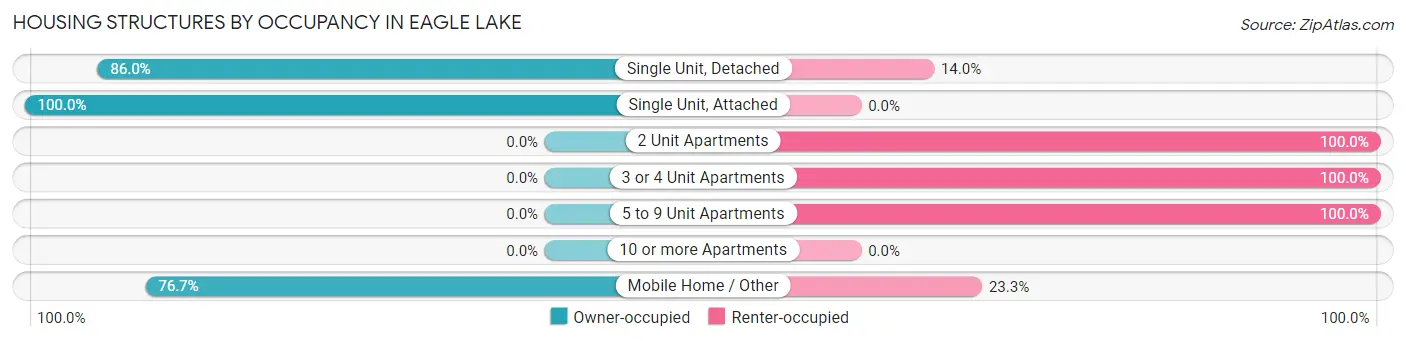
| Structure Type | Owner-occupied | Renter-occupied |
| Single Unit, Detached | 705 (86.0%) | 115 (14.0%) |
| Single Unit, Attached | 13 (100.0%) | 0 (0.0%) |
| 2 Unit Apartments | 0 (0.0%) | 3 (100.0%) |
| 3 or 4 Unit Apartments | 0 (0.0%) | 69 (100.0%) |
| 5 to 9 Unit Apartments | 0 (0.0%) | 13 (100.0%) |
| 10 or more Apartments | 0 (0.0%) | 0 (0.0%) |
| Mobile Home / Other | 33 (76.7%) | 10 (23.3%) |
| Total | 751 (78.1%) | 210 (21.8%) |
Housing Structures by Number of Rooms in Eagle Lake
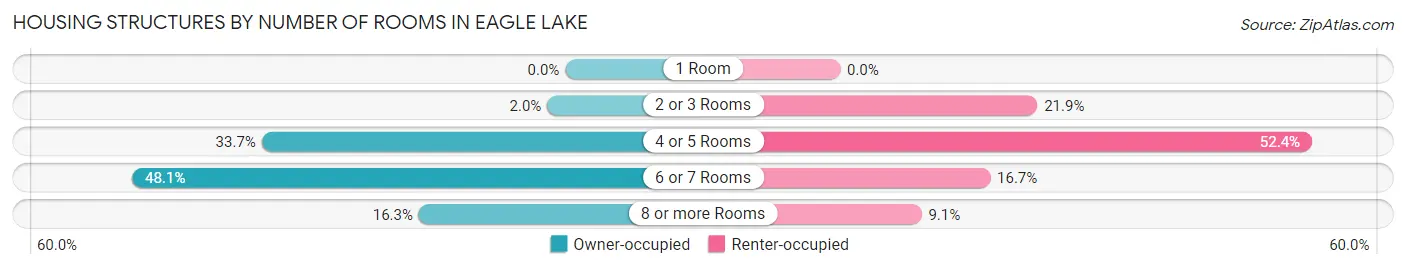
| Number of Rooms | Owner-occupied | Renter-occupied |
| 1 Room | 0 (0.0%) | 0 (0.0%) |
| 2 or 3 Rooms | 15 (2.0%) | 46 (21.9%) |
| 4 or 5 Rooms | 253 (33.7%) | 110 (52.4%) |
| 6 or 7 Rooms | 361 (48.1%) | 35 (16.7%) |
| 8 or more Rooms | 122 (16.3%) | 19 (9.0%) |
| Total | 751 (100.0%) | 210 (100.0%) |
Housing Structure by Heating Type in Eagle Lake
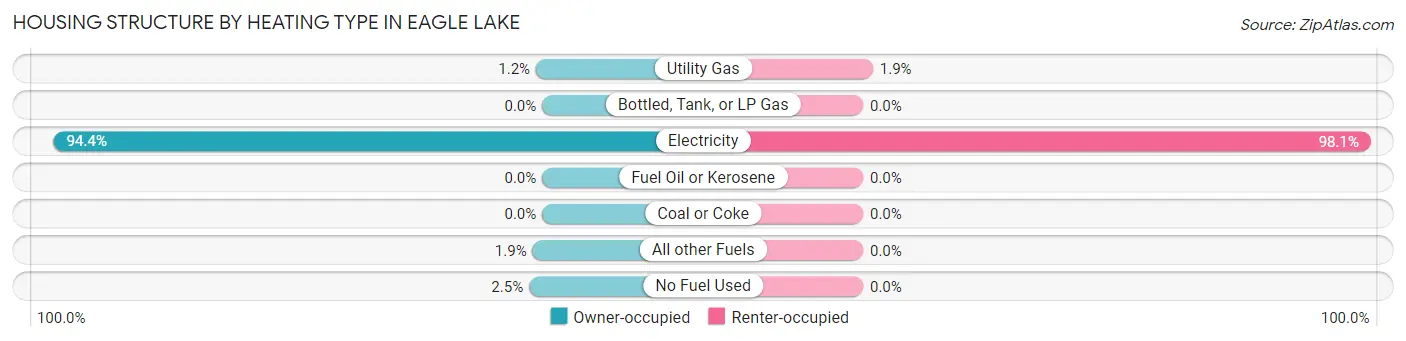
| Heating Type | Owner-occupied | Renter-occupied |
| Utility Gas | 9 (1.2%) | 4 (1.9%) |
| Bottled, Tank, or LP Gas | 0 (0.0%) | 0 (0.0%) |
| Electricity | 709 (94.4%) | 206 (98.1%) |
| Fuel Oil or Kerosene | 0 (0.0%) | 0 (0.0%) |
| Coal or Coke | 0 (0.0%) | 0 (0.0%) |
| All other Fuels | 14 (1.9%) | 0 (0.0%) |
| No Fuel Used | 19 (2.5%) | 0 (0.0%) |
| Total | 751 (100.0%) | 210 (100.0%) |
Household Vehicle Usage in Eagle Lake
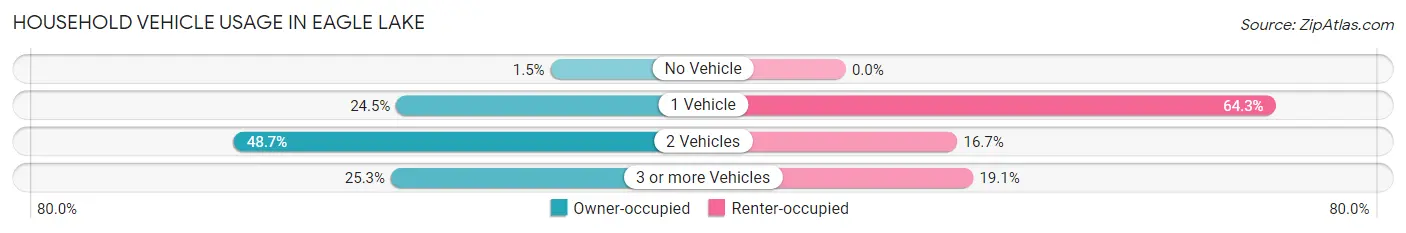
| Vehicles per Household | Owner-occupied | Renter-occupied |
| No Vehicle | 11 (1.5%) | 0 (0.0%) |
| 1 Vehicle | 184 (24.5%) | 135 (64.3%) |
| 2 Vehicles | 366 (48.7%) | 35 (16.7%) |
| 3 or more Vehicles | 190 (25.3%) | 40 (19.1%) |
| Total | 751 (100.0%) | 210 (100.0%) |
Real Estate & Mortgages in Eagle Lake
Real Estate and Mortgage Overview in Eagle Lake
| Characteristic | Without Mortgage | With Mortgage |
| Housing Units | 265 | 486 |
| Median Property Value | $141,300 | $198,900 |
| Median Household Income | $59,844 | $68 |
| Monthly Housing Costs | $477 | $0 |
| Real Estate Taxes | $1,240 | $15 |
Property Value by Mortgage Status in Eagle Lake
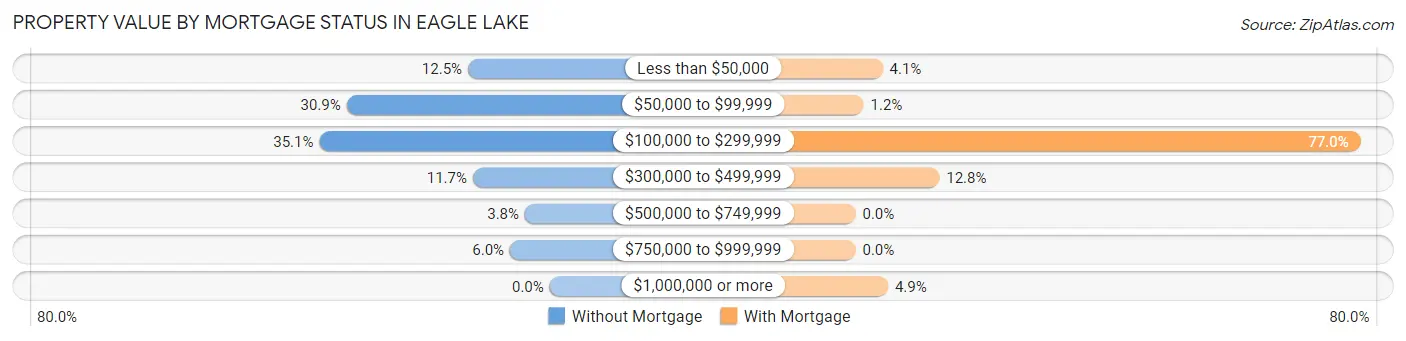
| Property Value | Without Mortgage | With Mortgage |
| Less than $50,000 | 33 (12.4%) | 20 (4.1%) |
| $50,000 to $99,999 | 82 (30.9%) | 6 (1.2%) |
| $100,000 to $299,999 | 93 (35.1%) | 374 (76.9%) |
| $300,000 to $499,999 | 31 (11.7%) | 62 (12.8%) |
| $500,000 to $749,999 | 10 (3.8%) | 0 (0.0%) |
| $750,000 to $999,999 | 16 (6.0%) | 0 (0.0%) |
| $1,000,000 or more | 0 (0.0%) | 24 (4.9%) |
| Total | 265 (100.0%) | 486 (100.0%) |
Household Income by Mortgage Status in Eagle Lake
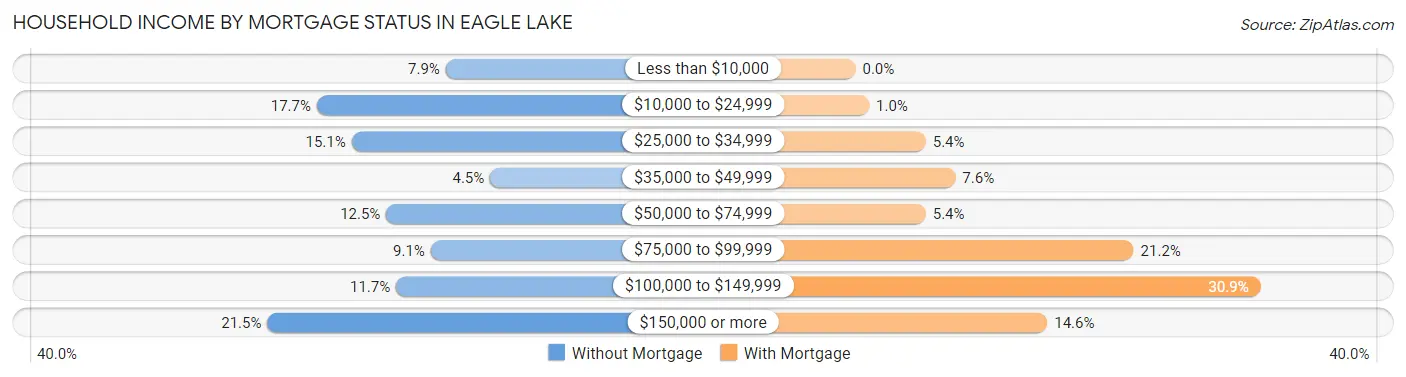
| Household Income | Without Mortgage | With Mortgage |
| Less than $10,000 | 21 (7.9%) | 0 (0.0%) |
| $10,000 to $24,999 | 47 (17.7%) | 5 (1.0%) |
| $25,000 to $34,999 | 40 (15.1%) | 26 (5.3%) |
| $35,000 to $49,999 | 12 (4.5%) | 37 (7.6%) |
| $50,000 to $74,999 | 33 (12.4%) | 26 (5.3%) |
| $75,000 to $99,999 | 24 (9.1%) | 103 (21.2%) |
| $100,000 to $149,999 | 31 (11.7%) | 150 (30.9%) |
| $150,000 or more | 57 (21.5%) | 71 (14.6%) |
| Total | 265 (100.0%) | 486 (100.0%) |
Property Value to Household Income Ratio in Eagle Lake
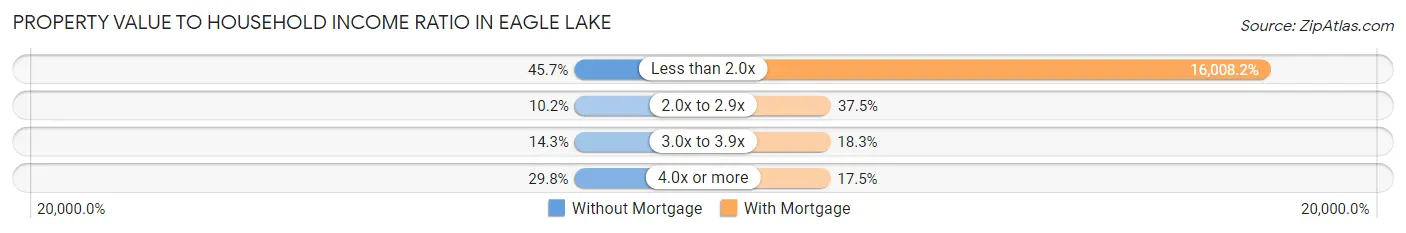
| Value-to-Income Ratio | Without Mortgage | With Mortgage |
| Less than 2.0x | 121 (45.7%) | 77,800 (16,008.2%) |
| 2.0x to 2.9x | 27 (10.2%) | 182 (37.4%) |
| 3.0x to 3.9x | 38 (14.3%) | 89 (18.3%) |
| 4.0x or more | 79 (29.8%) | 85 (17.5%) |
| Total | 265 (100.0%) | 486 (100.0%) |
Real Estate Taxes by Mortgage Status in Eagle Lake
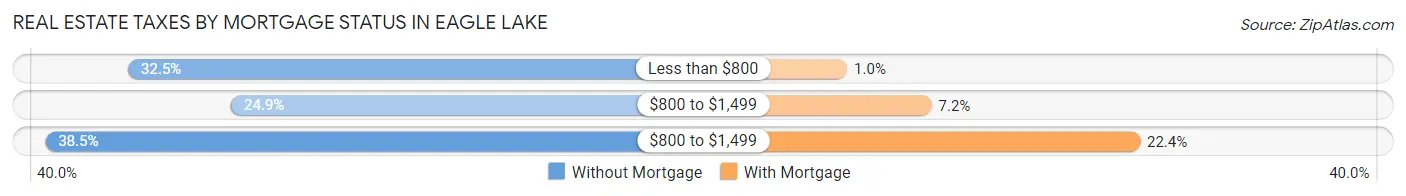
| Property Taxes | Without Mortgage | With Mortgage |
| Less than $800 | 86 (32.5%) | 5 (1.0%) |
| $800 to $1,499 | 66 (24.9%) | 35 (7.2%) |
| $800 to $1,499 | 102 (38.5%) | 109 (22.4%) |
| Total | 265 (100.0%) | 486 (100.0%) |
Health & Disability in Eagle Lake
Health Insurance Coverage by Age in Eagle Lake
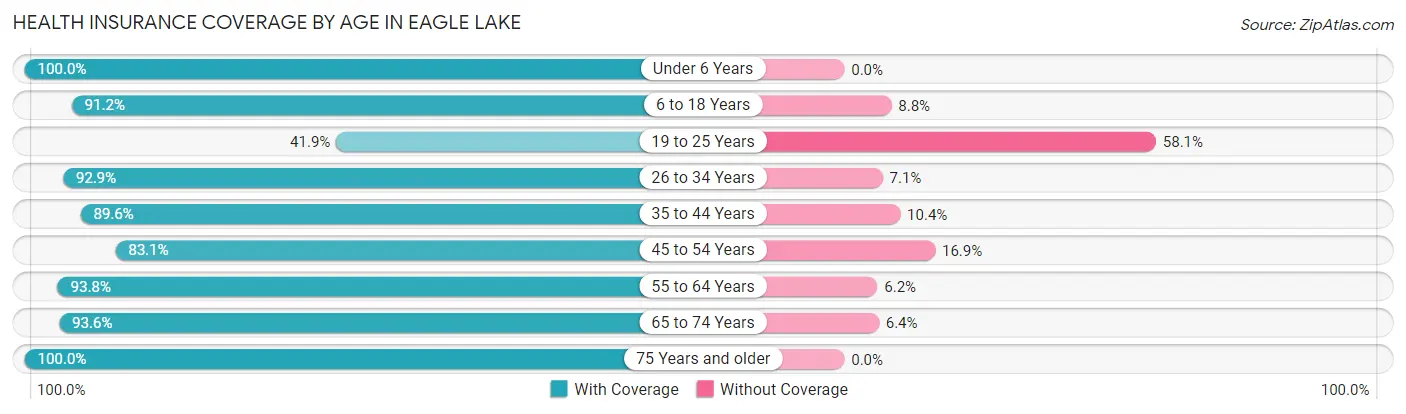
| Age Bracket | With Coverage | Without Coverage |
| Under 6 Years | 406 (100.0%) | 0 (0.0%) |
| 6 to 18 Years | 561 (91.2%) | 54 (8.8%) |
| 19 to 25 Years | 88 (41.9%) | 122 (58.1%) |
| 26 to 34 Years | 351 (92.9%) | 27 (7.1%) |
| 35 to 44 Years | 507 (89.6%) | 59 (10.4%) |
| 45 to 54 Years | 275 (83.1%) | 56 (16.9%) |
| 55 to 64 Years | 259 (93.8%) | 17 (6.2%) |
| 65 to 74 Years | 160 (93.6%) | 11 (6.4%) |
| 75 Years and older | 158 (100.0%) | 0 (0.0%) |
| Total | 2,765 (88.9%) | 346 (11.1%) |
Health Insurance Coverage by Citizenship Status in Eagle Lake
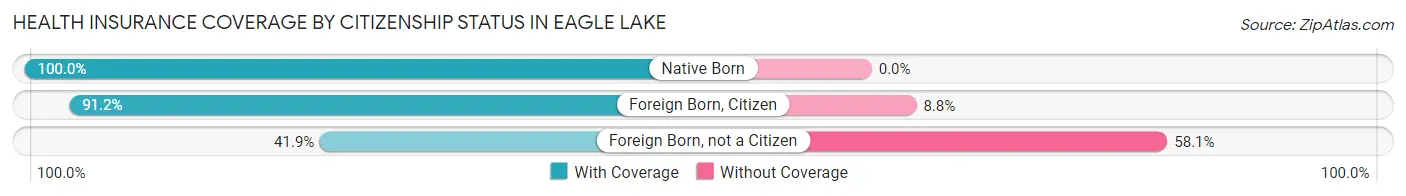
| Citizenship Status | With Coverage | Without Coverage |
| Native Born | 406 (100.0%) | 0 (0.0%) |
| Foreign Born, Citizen | 561 (91.2%) | 54 (8.8%) |
| Foreign Born, not a Citizen | 88 (41.9%) | 122 (58.1%) |
Health Insurance Coverage by Household Income in Eagle Lake
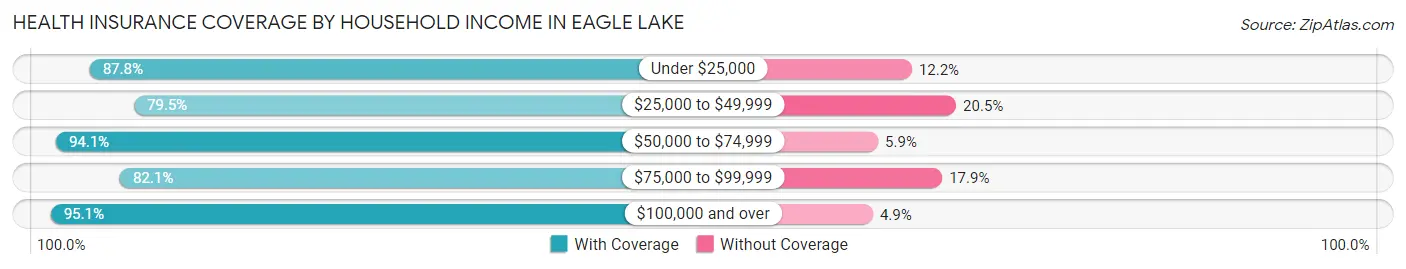
| Household Income | With Coverage | Without Coverage |
| Under $25,000 | 187 (87.8%) | 26 (12.2%) |
| $25,000 to $49,999 | 458 (79.5%) | 118 (20.5%) |
| $50,000 to $74,999 | 448 (94.1%) | 28 (5.9%) |
| $75,000 to $99,999 | 528 (82.1%) | 115 (17.9%) |
| $100,000 and over | 1,144 (95.1%) | 59 (4.9%) |
Public vs Private Health Insurance Coverage by Age in Eagle Lake
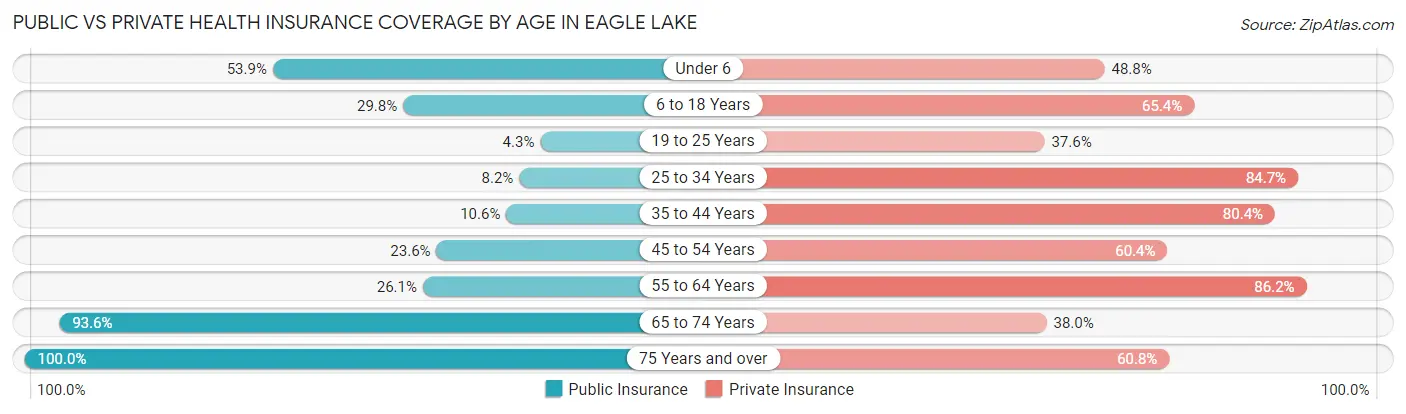
| Age Bracket | Public Insurance | Private Insurance |
| Under 6 | 219 (53.9%) | 198 (48.8%) |
| 6 to 18 Years | 183 (29.8%) | 402 (65.4%) |
| 19 to 25 Years | 9 (4.3%) | 79 (37.6%) |
| 25 to 34 Years | 31 (8.2%) | 320 (84.7%) |
| 35 to 44 Years | 60 (10.6%) | 455 (80.4%) |
| 45 to 54 Years | 78 (23.6%) | 200 (60.4%) |
| 55 to 64 Years | 72 (26.1%) | 238 (86.2%) |
| 65 to 74 Years | 160 (93.6%) | 65 (38.0%) |
| 75 Years and over | 158 (100.0%) | 96 (60.8%) |
| Total | 970 (31.2%) | 2,053 (66.0%) |
Disability Status by Sex by Age in Eagle Lake
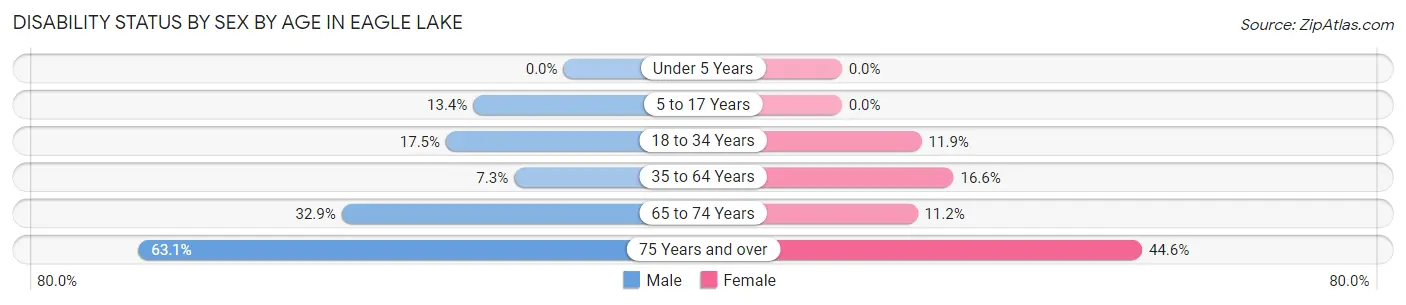
| Age Bracket | Male | Female |
| Under 5 Years | 0 (0.0%) | 0 (0.0%) |
| 5 to 17 Years | 54 (13.4%) | 0 (0.0%) |
| 18 to 34 Years | 52 (17.4%) | 35 (11.9%) |
| 35 to 64 Years | 48 (7.3%) | 86 (16.6%) |
| 65 to 74 Years | 27 (32.9%) | 10 (11.2%) |
| 75 Years and over | 53 (63.1%) | 33 (44.6%) |
Disability Class by Sex by Age in Eagle Lake
Disability Class: Hearing Difficulty
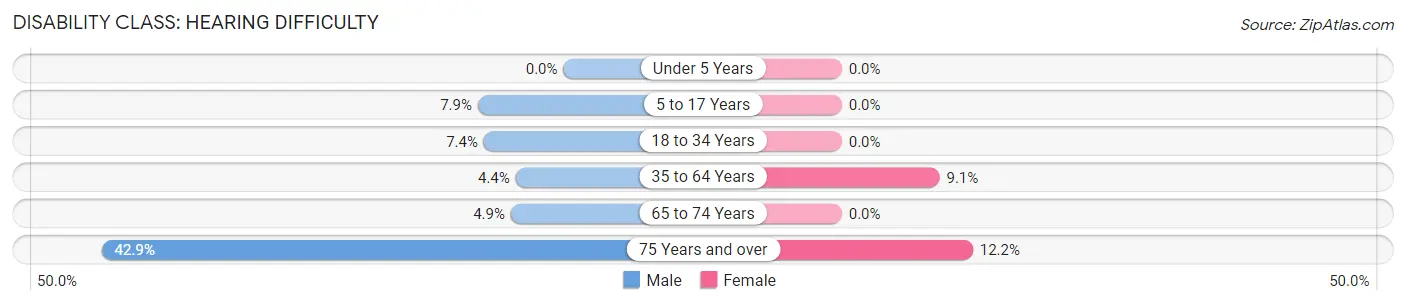
| Age Bracket | Male | Female |
| Under 5 Years | 0 (0.0%) | 0 (0.0%) |
| 5 to 17 Years | 32 (7.9%) | 0 (0.0%) |
| 18 to 34 Years | 22 (7.4%) | 0 (0.0%) |
| 35 to 64 Years | 29 (4.4%) | 47 (9.1%) |
| 65 to 74 Years | 4 (4.9%) | 0 (0.0%) |
| 75 Years and over | 36 (42.9%) | 9 (12.2%) |
Disability Class: Vision Difficulty
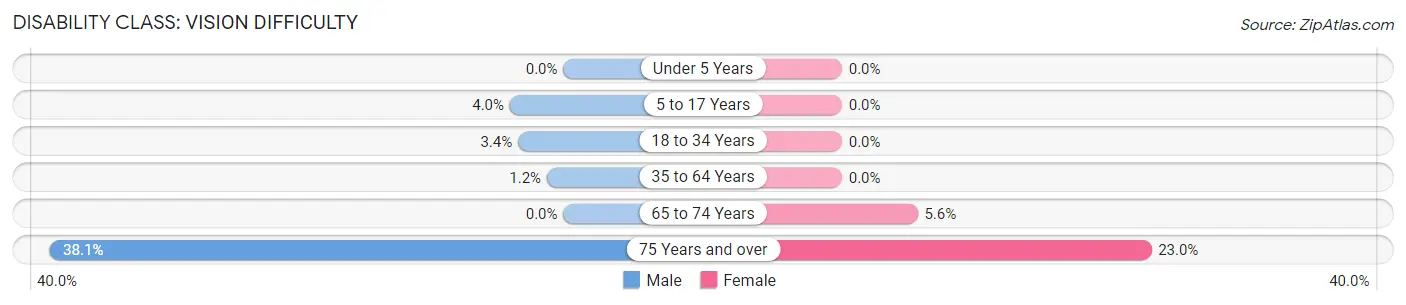
| Age Bracket | Male | Female |
| Under 5 Years | 0 (0.0%) | 0 (0.0%) |
| 5 to 17 Years | 16 (4.0%) | 0 (0.0%) |
| 18 to 34 Years | 10 (3.4%) | 0 (0.0%) |
| 35 to 64 Years | 8 (1.2%) | 0 (0.0%) |
| 65 to 74 Years | 0 (0.0%) | 5 (5.6%) |
| 75 Years and over | 32 (38.1%) | 17 (23.0%) |
Disability Class: Cognitive Difficulty
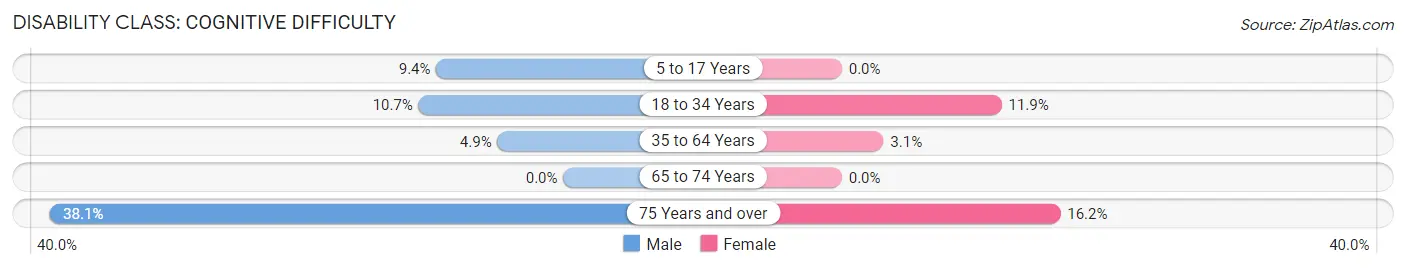
| Age Bracket | Male | Female |
| 5 to 17 Years | 38 (9.4%) | 0 (0.0%) |
| 18 to 34 Years | 32 (10.7%) | 35 (11.9%) |
| 35 to 64 Years | 32 (4.9%) | 16 (3.1%) |
| 65 to 74 Years | 0 (0.0%) | 0 (0.0%) |
| 75 Years and over | 32 (38.1%) | 12 (16.2%) |
Disability Class: Ambulatory Difficulty
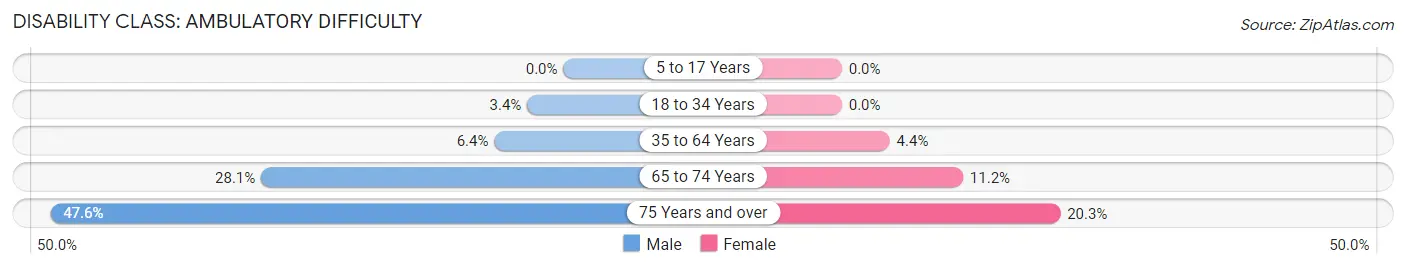
| Age Bracket | Male | Female |
| 5 to 17 Years | 0 (0.0%) | 0 (0.0%) |
| 18 to 34 Years | 10 (3.4%) | 0 (0.0%) |
| 35 to 64 Years | 42 (6.4%) | 23 (4.4%) |
| 65 to 74 Years | 23 (28.1%) | 10 (11.2%) |
| 75 Years and over | 40 (47.6%) | 15 (20.3%) |
Disability Class: Self-Care Difficulty
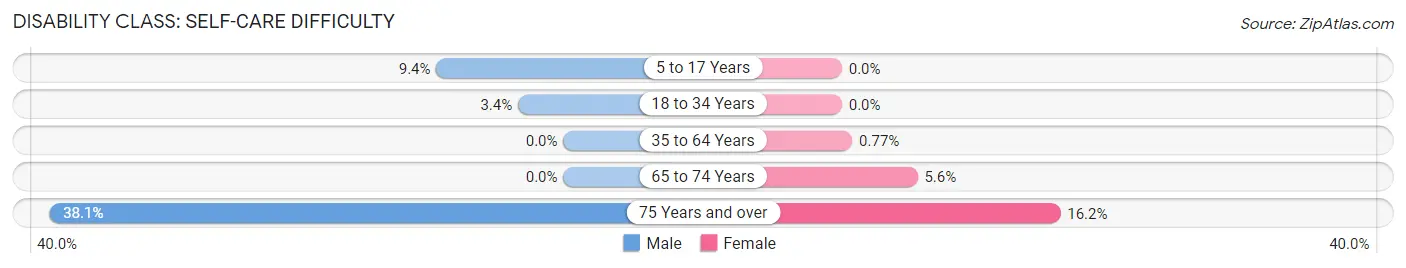
| Age Bracket | Male | Female |
| 5 to 17 Years | 38 (9.4%) | 0 (0.0%) |
| 18 to 34 Years | 10 (3.4%) | 0 (0.0%) |
| 35 to 64 Years | 0 (0.0%) | 4 (0.8%) |
| 65 to 74 Years | 0 (0.0%) | 5 (5.6%) |
| 75 Years and over | 32 (38.1%) | 12 (16.2%) |
Technology Access in Eagle Lake
Computing Device Access in Eagle Lake
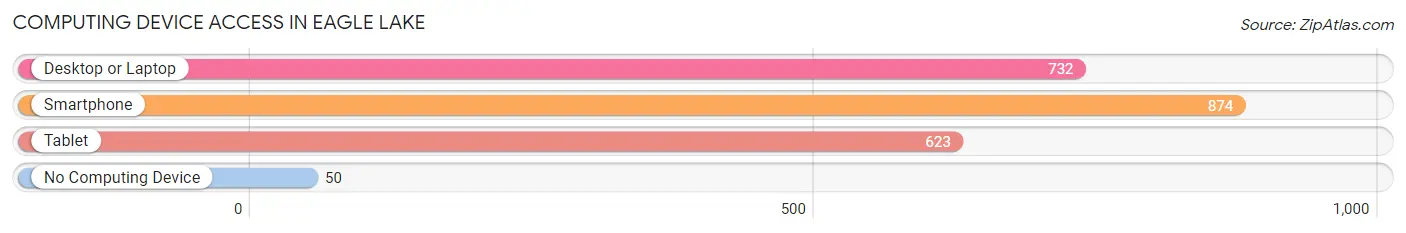
| Device Type | # Households | % Households |
| Desktop or Laptop | 732 | 76.2% |
| Smartphone | 874 | 90.9% |
| Tablet | 623 | 64.8% |
| No Computing Device | 50 | 5.2% |
| Total | 961 | 100.0% |
Internet Access in Eagle Lake
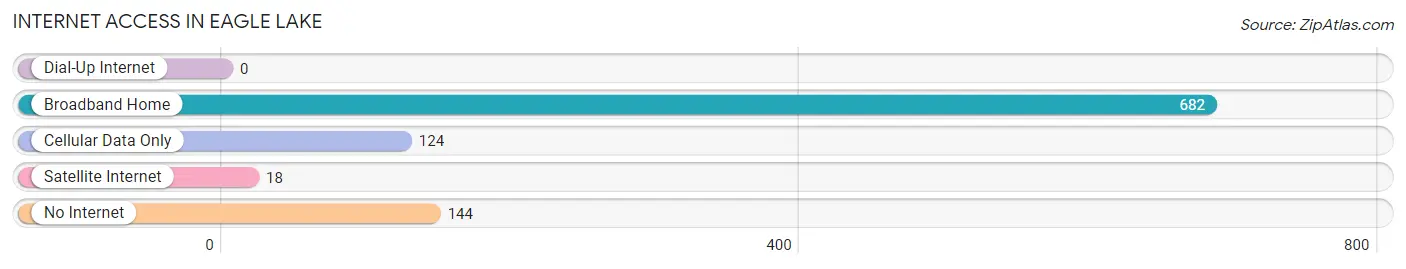
| Internet Type | # Households | % Households |
| Dial-Up Internet | 0 | 0.0% |
| Broadband Home | 682 | 71.0% |
| Cellular Data Only | 124 | 12.9% |
| Satellite Internet | 18 | 1.9% |
| No Internet | 144 | 15.0% |
| Total | 961 | 100.0% |
Eagle Lake Summary
Eagle Lake is a small city located in Polk County, Florida. It is situated on the eastern shore of Lake Hancock, a large lake in the region. The city has a population of approximately 2,500 people and is part of the Lakeland-Winter Haven Metropolitan Statistical Area.
History
The area that is now Eagle Lake was originally inhabited by the Seminole Indians. The first European settlers arrived in the area in the late 1800s and established a small farming community. The town was officially incorporated in 1925 and was named after the nearby lake.
In the early 1900s, the city was a popular destination for tourists and fishermen. The city was also home to a number of citrus groves and other agricultural businesses. In the 1950s, the city began to experience a population boom as more people moved to the area for its natural beauty and recreational opportunities.
Geography
Eagle Lake is located in central Florida, approximately 25 miles east of Tampa. The city is situated on the eastern shore of Lake Hancock, a large lake in the region. The city is surrounded by a number of smaller lakes, including Lake Pierce, Lake Alfred, and Lake Hamilton. The city is also located near the Green Swamp, a large wetland area in the region.
The city has a total area of 2.3 square miles, all of which is land. The city has a humid subtropical climate, with hot, humid summers and mild winters.
Economy
The economy of Eagle Lake is largely based on tourism and agriculture. The city is home to a number of citrus groves and other agricultural businesses. The city is also home to a number of small businesses, including restaurants, retail stores, and other services.
The city is also home to a number of recreational opportunities, including fishing, boating, and camping. The city is also home to a number of parks and other outdoor attractions.
Demographics
As of the 2010 census, the population of Eagle Lake was 2,500. The racial makeup of the city was 79.2% White, 15.2% African American, 0.4% Native American, 0.8% Asian, 0.1% Pacific Islander, and 4.3% from other races. Hispanic or Latino of any race were 8.2% of the population.
The median household income in the city was $37,500, and the median family income was $45,000. The per capita income in the city was $19,000. About 15.2% of the population was below the poverty line.
Conclusion
Eagle Lake is a small city located in Polk County, Florida. It is situated on the eastern shore of Lake Hancock and is part of the Lakeland-Winter Haven Metropolitan Statistical Area. The city has a population of approximately 2,500 people and is home to a number of citrus groves and other agricultural businesses. The economy of the city is largely based on tourism and agriculture, and the city is home to a number of recreational opportunities. The racial makeup of the city is 79.2% White, 15.2% African American, 0.4% Native American, 0.8% Asian, 0.1% Pacific Islander, and 4.3% from other races. The median household income in the city was $37,500, and the median family income was $45,000.
Common Questions
What is Per Capita Income in Eagle Lake?
Per Capita income in Eagle Lake is $34,145.
What is the Median Family Income in Eagle Lake?
Median Family Income in Eagle Lake is $75,117.
What is the Median Household income in Eagle Lake?
Median Household Income in Eagle Lake is $71,705.
What is Income or Wage Gap in Eagle Lake?
Income or Wage Gap in Eagle Lake is 23.4%.
Women in Eagle Lake earn 76.6 cents for every dollar earned by a man.
What is Inequality or Gini Index in Eagle Lake?
Inequality or Gini Index in Eagle Lake is 0.49.
What is the Total Population of Eagle Lake?
Total Population of Eagle Lake is 3,111.
What is the Total Male Population of Eagle Lake?
Total Male Population of Eagle Lake is 1,707.
What is the Total Female Population of Eagle Lake?
Total Female Population of Eagle Lake is 1,404.
What is the Ratio of Males per 100 Females in Eagle Lake?
There are 121.58 Males per 100 Females in Eagle Lake.
What is the Ratio of Females per 100 Males in Eagle Lake?
There are 82.25 Females per 100 Males in Eagle Lake.
What is the Median Population Age in Eagle Lake?
Median Population Age in Eagle Lake is 34.1 Years.
What is the Average Family Size in Eagle Lake
Average Family Size in Eagle Lake is 3.7 People.
What is the Average Household Size in Eagle Lake
Average Household Size in Eagle Lake is 3.2 People.
How Large is the Labor Force in Eagle Lake?
There are 1,411 People in the Labor Forcein in Eagle Lake.
What is the Percentage of People in the Labor Force in Eagle Lake?
65.8% of People are in the Labor Force in Eagle Lake.
What is the Unemployment Rate in Eagle Lake?
Unemployment Rate in Eagle Lake is 5.1%.