Defuniak Springs, FL Map & Demographics
Defuniak Springs Map
Defuniak Springs Overview
$27,193
PER CAPITA INCOME
$68,920
AVG FAMILY INCOME
$56,455
AVG HOUSEHOLD INCOME
12.4%
WAGE / INCOME GAP [ % ]
87.6¢/ $1
WAGE / INCOME GAP [ $ ]
$10,124
FAMILY INCOME DEFICIT
0.40
INEQUALITY / GINI INDEX
6,072
TOTAL POPULATION
2,778
MALE POPULATION
3,294
FEMALE POPULATION
84.34
MALES / 100 FEMALES
118.57
FEMALES / 100 MALES
34.3
MEDIAN AGE
3.0
AVG FAMILY SIZE
2.5
AVG HOUSEHOLD SIZE
3,081
LABOR FORCE [ PEOPLE ]
62.5%
PERCENT IN LABOR FORCE
14.4%
UNEMPLOYMENT RATE
Defuniak Springs Area Codes
Income in Defuniak Springs
Income Overview in Defuniak Springs
Per Capita Income in Defuniak Springs is $27,193, while median incomes of families and households are $68,920 and $56,455 respectively.
| Characteristic | Number | Measure |
| Per Capita Income | 6,072 | $27,193 |
| Median Family Income | 1,471 | $68,920 |
| Mean Family Income | 1,471 | $78,586 |
| Median Household Income | 2,394 | $56,455 |
| Mean Household Income | 2,394 | $69,510 |
| Income Deficit | 1,471 | $10,124 |
| Wage / Income Gap (%) | 6,072 | 12.42% |
| Wage / Income Gap ($) | 6,072 | 87.58¢ per $1 |
| Gini / Inequality Index | 6,072 | 0.40 |
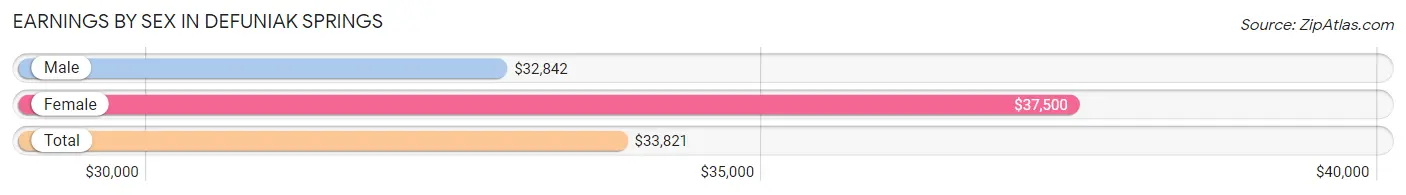
Earnings by Sex in Defuniak Springs
Average Earnings in Defuniak Springs are $33,821, $32,842 for men and $37,500 for women, a difference of 12.4%.
| Sex | Number | Average Earnings |
| Male | 1,686 (53.5%) | $32,842 |
| Female | 1,466 (46.5%) | $37,500 |
| Total | 3,152 (100.0%) | $33,821 |
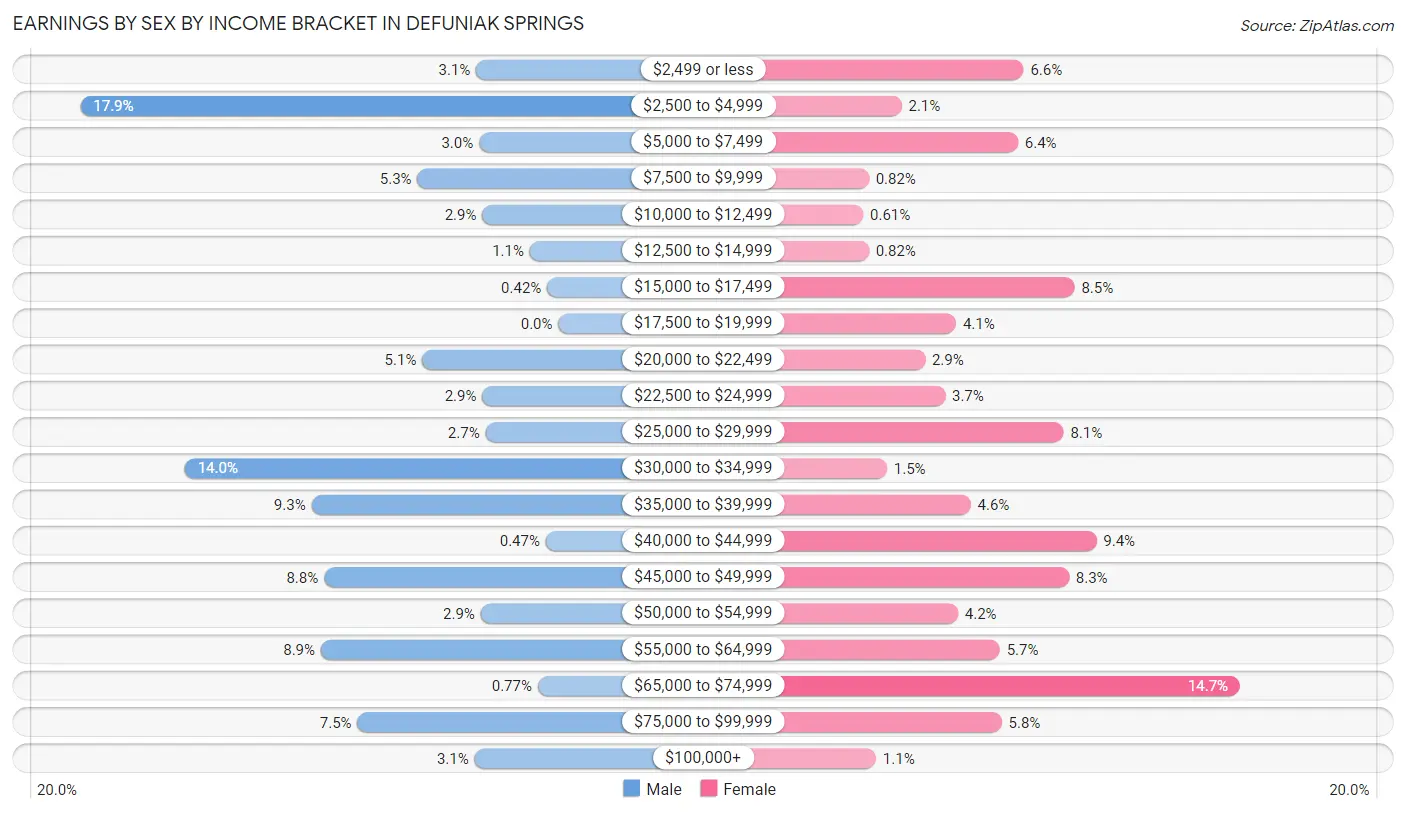
Earnings by Sex by Income Bracket in Defuniak Springs
The most common earnings brackets in Defuniak Springs are $2,500 to $4,999 for men (302 | 17.9%) and $65,000 to $74,999 for women (216 | 14.7%).
| Income | Male | Female |
| $2,499 or less | 52 (3.1%) | 97 (6.6%) |
| $2,500 to $4,999 | 302 (17.9%) | 30 (2.1%) |
| $5,000 to $7,499 | 50 (3.0%) | 94 (6.4%) |
| $7,500 to $9,999 | 89 (5.3%) | 12 (0.8%) |
| $10,000 to $12,499 | 48 (2.9%) | 9 (0.6%) |
| $12,500 to $14,999 | 18 (1.1%) | 12 (0.8%) |
| $15,000 to $17,499 | 7 (0.4%) | 125 (8.5%) |
| $17,500 to $19,999 | 0 (0.0%) | 60 (4.1%) |
| $20,000 to $22,499 | 86 (5.1%) | 43 (2.9%) |
| $22,500 to $24,999 | 48 (2.9%) | 54 (3.7%) |
| $25,000 to $29,999 | 46 (2.7%) | 119 (8.1%) |
| $30,000 to $34,999 | 236 (14.0%) | 22 (1.5%) |
| $35,000 to $39,999 | 156 (9.2%) | 68 (4.6%) |
| $40,000 to $44,999 | 8 (0.5%) | 137 (9.3%) |
| $45,000 to $49,999 | 148 (8.8%) | 122 (8.3%) |
| $50,000 to $54,999 | 49 (2.9%) | 61 (4.2%) |
| $55,000 to $64,999 | 150 (8.9%) | 84 (5.7%) |
| $65,000 to $74,999 | 13 (0.8%) | 216 (14.7%) |
| $75,000 to $99,999 | 127 (7.5%) | 85 (5.8%) |
| $100,000+ | 53 (3.1%) | 16 (1.1%) |
| Total | 1,686 (100.0%) | 1,466 (100.0%) |
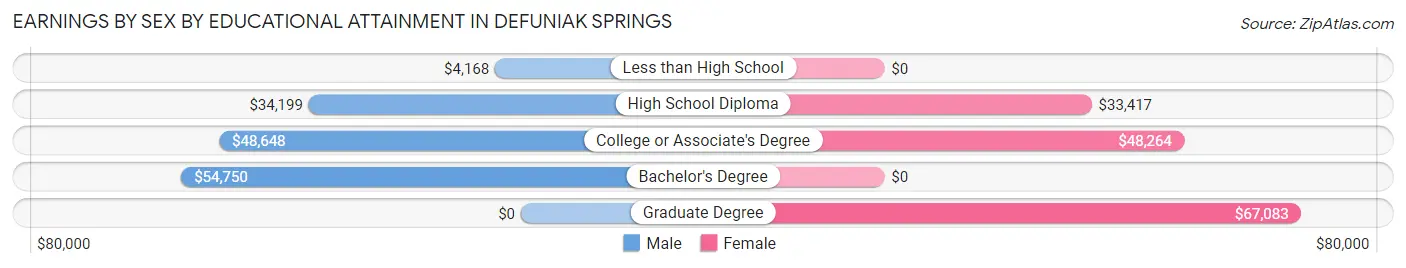
Earnings by Sex by Educational Attainment in Defuniak Springs
Average earnings in Defuniak Springs are $33,387 for men and $41,890 for women, a difference of 20.3%. Men with an educational attainment of bachelor's degree enjoy the highest average annual earnings of $54,750, while those with less than high school education earn the least with $4,168. Women with an educational attainment of graduate degree earn the most with the average annual earnings of $67,083, while those with high school diploma education have the smallest earnings of $33,417.
| Educational Attainment | Male Income | Female Income |
| Less than High School | $4,168 | $0 |
| High School Diploma | $34,199 | $33,417 |
| College or Associate's Degree | $48,648 | $48,264 |
| Bachelor's Degree | $54,750 | $0 |
| Graduate Degree | - | - |
| Total | $33,387 | $41,890 |
Family Income in Defuniak Springs
Family Income Brackets in Defuniak Springs
According to the Defuniak Springs family income data, there are 302 families falling into the $100,000 to $149,999 income range, which is the most common income bracket and makes up 20.5% of all families.
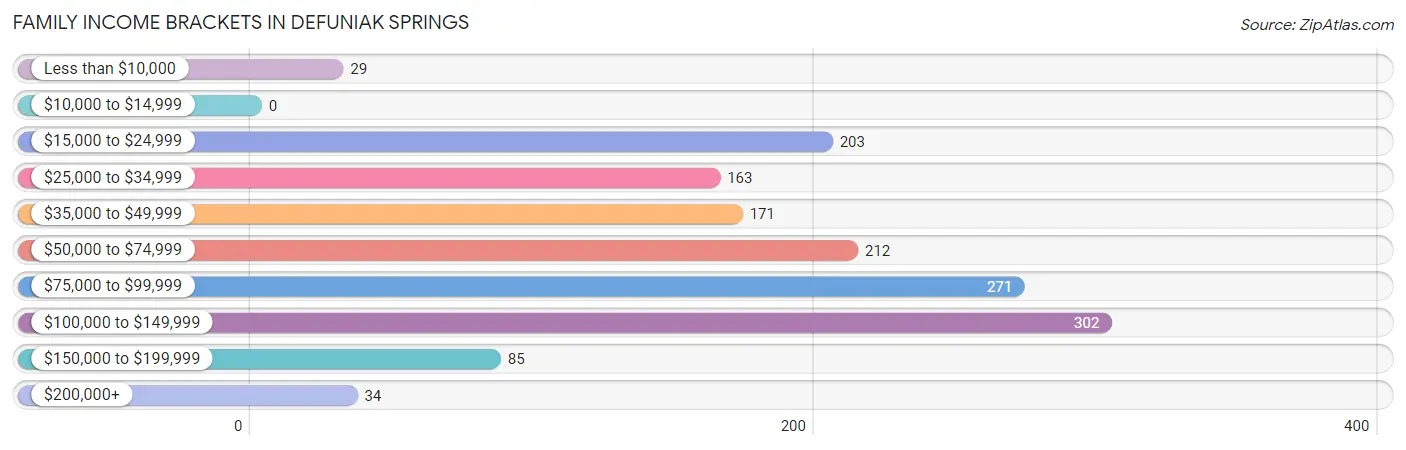
| Income Bracket | # Families | % Families |
| Less than $10,000 | 29 | 2.0% |
| $10,000 to $14,999 | 0 | 0.0% |
| $15,000 to $24,999 | 203 | 13.8% |
| $25,000 to $34,999 | 163 | 11.1% |
| $35,000 to $49,999 | 171 | 11.6% |
| $50,000 to $74,999 | 212 | 14.4% |
| $75,000 to $99,999 | 271 | 18.4% |
| $100,000 to $149,999 | 302 | 20.5% |
| $150,000 to $199,999 | 85 | 5.8% |
| $200,000+ | 34 | 2.3% |
Family Income by Famaliy Size in Defuniak Springs
4-person families (299 | 20.3%) account for the highest median family income in Defuniak Springs with $87,235 per family, while 2-person families (434 | 29.5%) have the highest median income of $39,643 per family member.
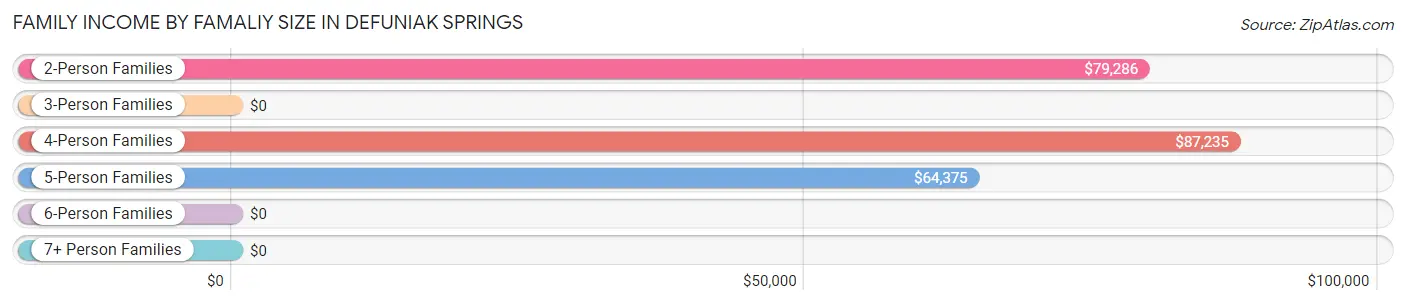
| Income Bracket | # Families | Median Income |
| 2-Person Families | 434 (29.5%) | $79,286 |
| 3-Person Families | 598 (40.6%) | $0 |
| 4-Person Families | 299 (20.3%) | $87,235 |
| 5-Person Families | 93 (6.3%) | $64,375 |
| 6-Person Families | 44 (3.0%) | $0 |
| 7+ Person Families | 3 (0.2%) | $0 |
| Total | 1,471 (100.0%) | $68,920 |
Family Income by Number of Earners in Defuniak Springs
The median family income in Defuniak Springs is $68,920, with families comprising 3+ earners (117) having the highest median family income of $119,119, while families with 1 earner (524) have the lowest median family income of $33,813, accounting for 8.0% and 35.6% of families, respectively.
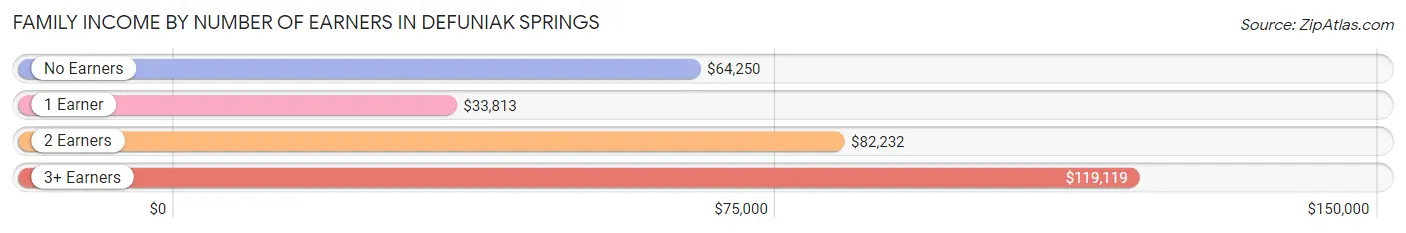
| Number of Earners | # Families | Median Income |
| No Earners | 202 (13.7%) | $64,250 |
| 1 Earner | 524 (35.6%) | $33,813 |
| 2 Earners | 628 (42.7%) | $82,232 |
| 3+ Earners | 117 (8.0%) | $119,119 |
| Total | 1,471 (100.0%) | $68,920 |
Household Income in Defuniak Springs
Household Income Brackets in Defuniak Springs
With 412 households falling in the category, the $75,000 to $99,999 income range is the most frequent in Defuniak Springs, accounting for 17.2% of all households. In contrast, only 45 households (1.9%) fall into the $200,000+ income bracket, making it the least populous group.
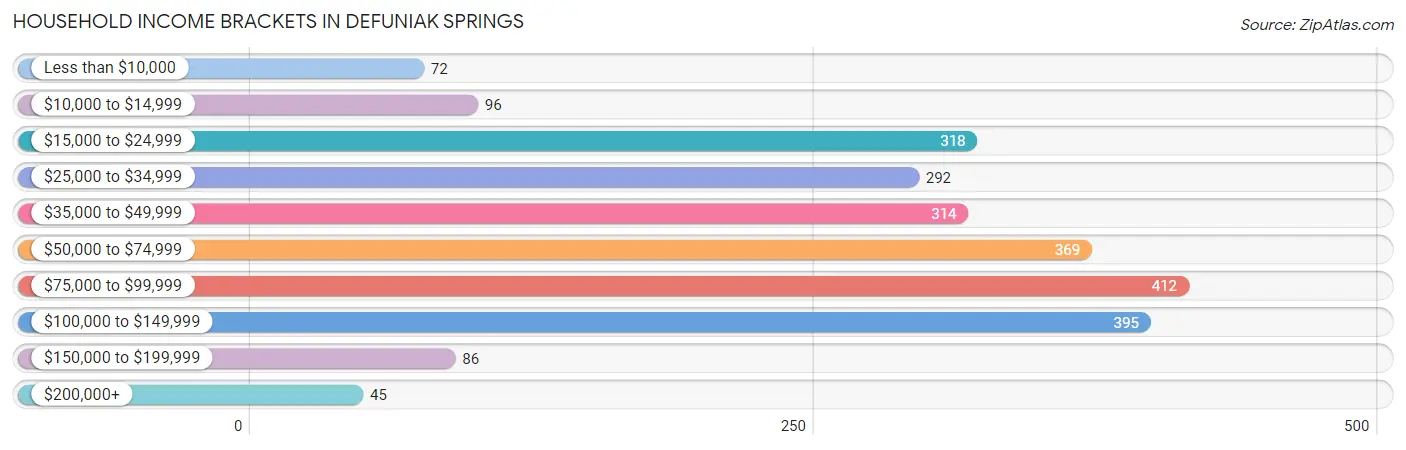
| Income Bracket | # Households | % Households |
| Less than $10,000 | 72 | 3.0% |
| $10,000 to $14,999 | 96 | 4.0% |
| $15,000 to $24,999 | 318 | 13.3% |
| $25,000 to $34,999 | 292 | 12.2% |
| $35,000 to $49,999 | 314 | 13.1% |
| $50,000 to $74,999 | 369 | 15.4% |
| $75,000 to $99,999 | 412 | 17.2% |
| $100,000 to $149,999 | 395 | 16.5% |
| $150,000 to $199,999 | 86 | 3.6% |
| $200,000+ | 45 | 1.9% |
Household Income by Householder Age in Defuniak Springs
The median household income in Defuniak Springs is $56,455, with the highest median household income of $77,589 found in the 45 to 64 years age bracket for the primary householder. A total of 581 households (24.3%) fall into this category. Meanwhile, the 15 to 24 years age bracket for the primary householder has the lowest median household income of $0, with 142 households (5.9%) in this group.
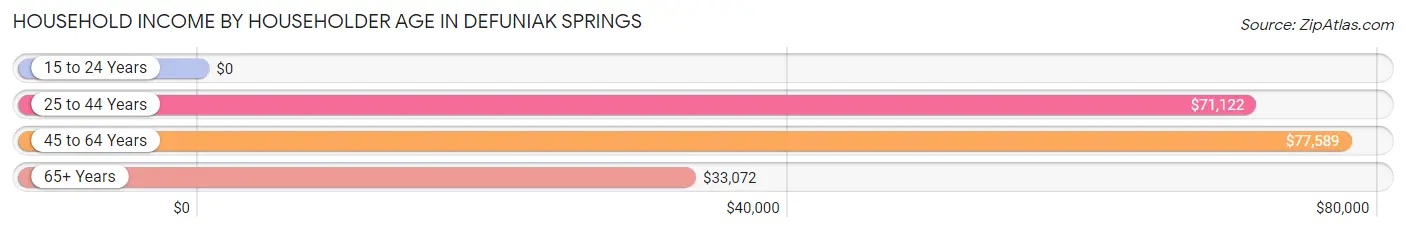
| Income Bracket | # Households | Median Income |
| 15 to 24 Years | 142 (5.9%) | $0 |
| 25 to 44 Years | 1,048 (43.8%) | $71,122 |
| 45 to 64 Years | 581 (24.3%) | $77,589 |
| 65+ Years | 623 (26.0%) | $33,072 |
| Total | 2,394 (100.0%) | $56,455 |
Poverty in Defuniak Springs
Income Below Poverty by Sex and Age in Defuniak Springs
With 13.6% poverty level for males and 22.2% for females among the residents of Defuniak Springs, 6 to 11 year old males and 5 year old females are the most vulnerable to poverty, with 126 males (90.6%) and 35 females (79.5%) in their respective age groups living below the poverty level.
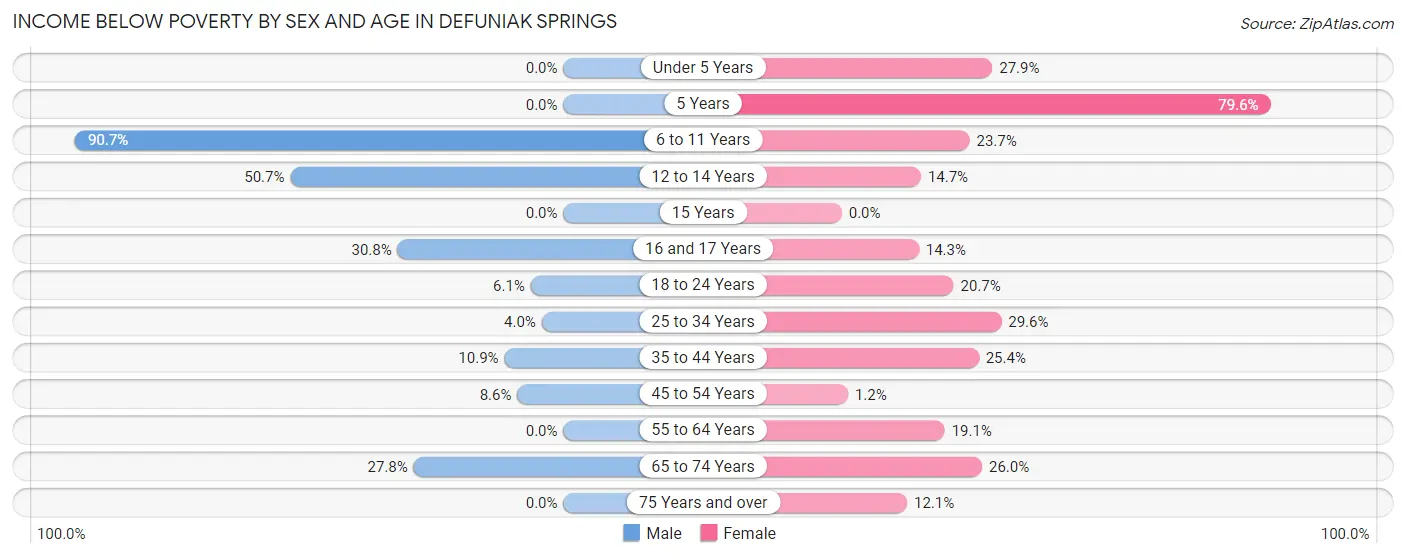
| Age Bracket | Male | Female |
| Under 5 Years | 0 (0.0%) | 81 (27.9%) |
| 5 Years | 0 (0.0%) | 35 (79.5%) |
| 6 to 11 Years | 126 (90.6%) | 55 (23.7%) |
| 12 to 14 Years | 37 (50.7%) | 21 (14.7%) |
| 15 Years | 0 (0.0%) | 0 (0.0%) |
| 16 and 17 Years | 28 (30.8%) | 12 (14.3%) |
| 18 to 24 Years | 19 (6.1%) | 56 (20.7%) |
| 25 to 34 Years | 34 (4.0%) | 151 (29.6%) |
| 35 to 44 Years | 36 (10.9%) | 137 (25.4%) |
| 45 to 54 Years | 20 (8.6%) | 3 (1.1%) |
| 55 to 64 Years | 0 (0.0%) | 55 (19.1%) |
| 65 to 74 Years | 67 (27.8%) | 63 (26.0%) |
| 75 Years and over | 0 (0.0%) | 27 (12.1%) |
| Total | 367 (13.6%) | 696 (22.2%) |
Income Above Poverty by Sex and Age in Defuniak Springs
According to the poverty statistics in Defuniak Springs, males aged under 5 years and females aged 15 years are the age groups that are most secure financially, with 100.0% of males and 100.0% of females in these age groups living above the poverty line.
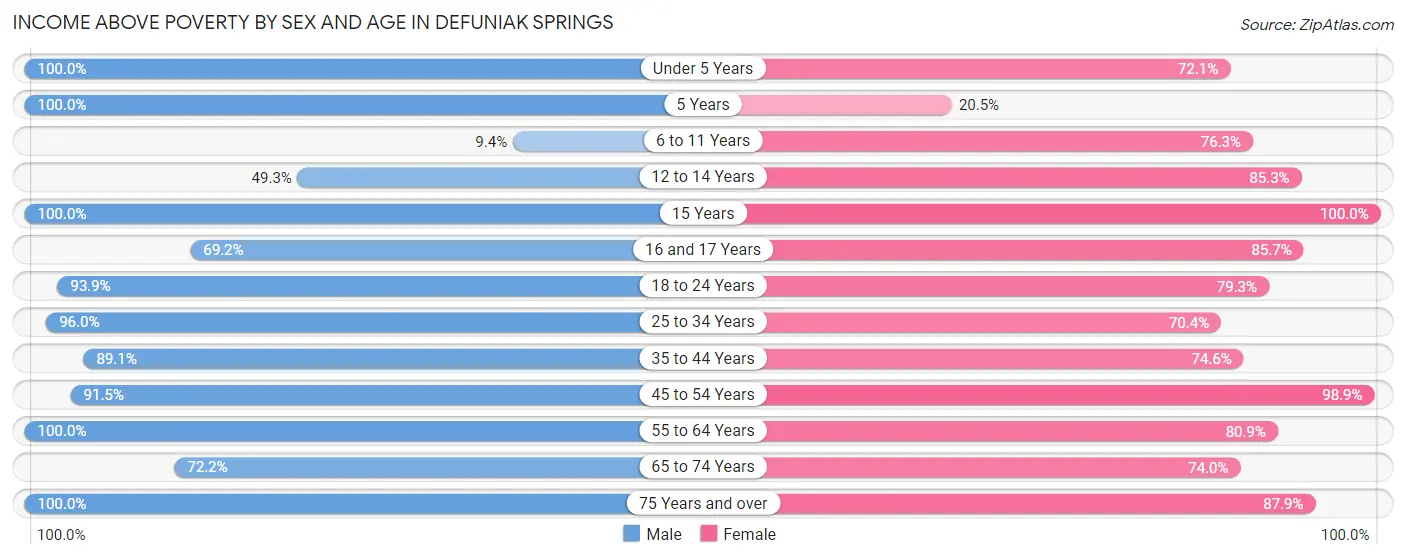
| Age Bracket | Male | Female |
| Under 5 Years | 157 (100.0%) | 209 (72.1%) |
| 5 Years | 12 (100.0%) | 9 (20.4%) |
| 6 to 11 Years | 13 (9.3%) | 177 (76.3%) |
| 12 to 14 Years | 36 (49.3%) | 122 (85.3%) |
| 15 Years | 9 (100.0%) | 10 (100.0%) |
| 16 and 17 Years | 63 (69.2%) | 72 (85.7%) |
| 18 to 24 Years | 294 (93.9%) | 214 (79.3%) |
| 25 to 34 Years | 811 (96.0%) | 359 (70.4%) |
| 35 to 44 Years | 293 (89.1%) | 402 (74.6%) |
| 45 to 54 Years | 214 (91.4%) | 257 (98.9%) |
| 55 to 64 Years | 134 (100.0%) | 233 (80.9%) |
| 65 to 74 Years | 174 (72.2%) | 179 (74.0%) |
| 75 Years and over | 120 (100.0%) | 196 (87.9%) |
| Total | 2,330 (86.4%) | 2,439 (77.8%) |
Income Below Poverty Among Married-Couple Families in Defuniak Springs
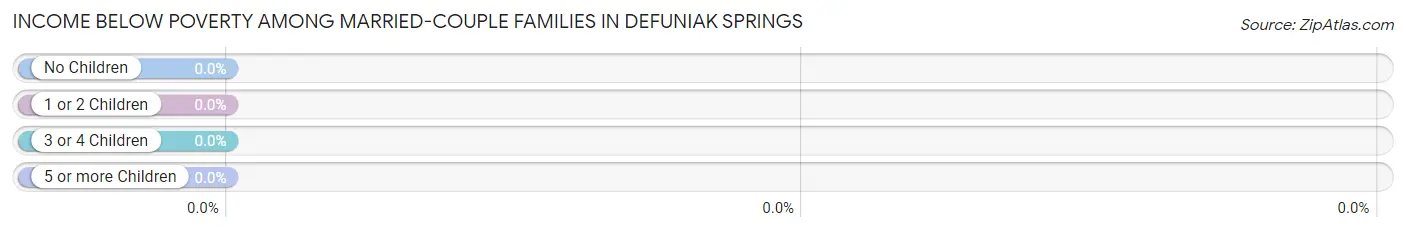
| Children | Above Poverty | Below Poverty |
| No Children | 260 (100.0%) | 0 (0.0%) |
| 1 or 2 Children | 549 (100.0%) | 0 (0.0%) |
| 3 or 4 Children | 77 (100.0%) | 0 (0.0%) |
| 5 or more Children | 0 (0.0%) | 0 (0.0%) |
| Total | 886 (100.0%) | 0 (0.0%) |
Income Below Poverty Among Single-Parent Households in Defuniak Springs
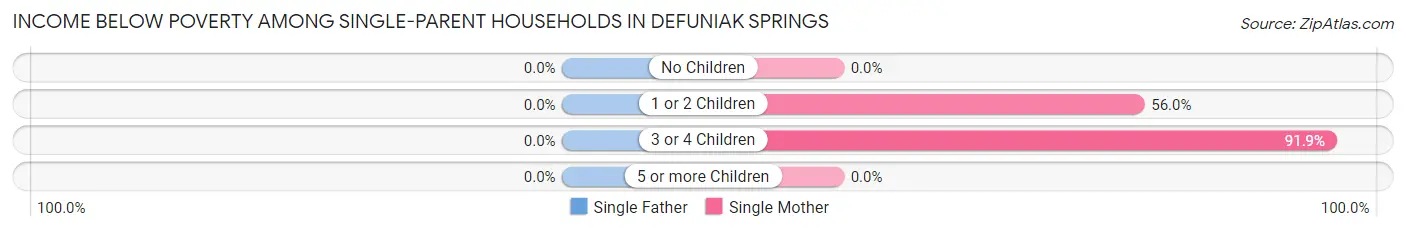
| Children | Single Father | Single Mother |
| No Children | 0 (0.0%) | 0 (0.0%) |
| 1 or 2 Children | 0 (0.0%) | 140 (56.0%) |
| 3 or 4 Children | 0 (0.0%) | 79 (91.9%) |
| 5 or more Children | 0 (0.0%) | 0 (0.0%) |
| Total | 0 (0.0%) | 219 (44.9%) |
Income Below Poverty Among Married-Couple vs Single-Parent Households in Defuniak Springs
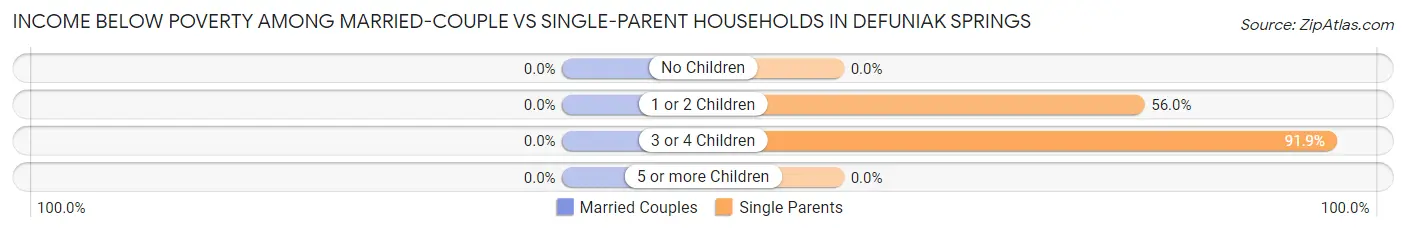
| Children | Married-Couple Families | Single-Parent Households |
| No Children | 0 (0.0%) | 0 (0.0%) |
| 1 or 2 Children | 0 (0.0%) | 140 (56.0%) |
| 3 or 4 Children | 0 (0.0%) | 79 (91.9%) |
| 5 or more Children | 0 (0.0%) | 0 (0.0%) |
| Total | 0 (0.0%) | 219 (37.4%) |
Race in Defuniak Springs
The most populous races in Defuniak Springs are White / Caucasian (3,998 | 65.8%), Black / African American (1,325 | 21.8%), and Two or more Races (462 | 7.6%).
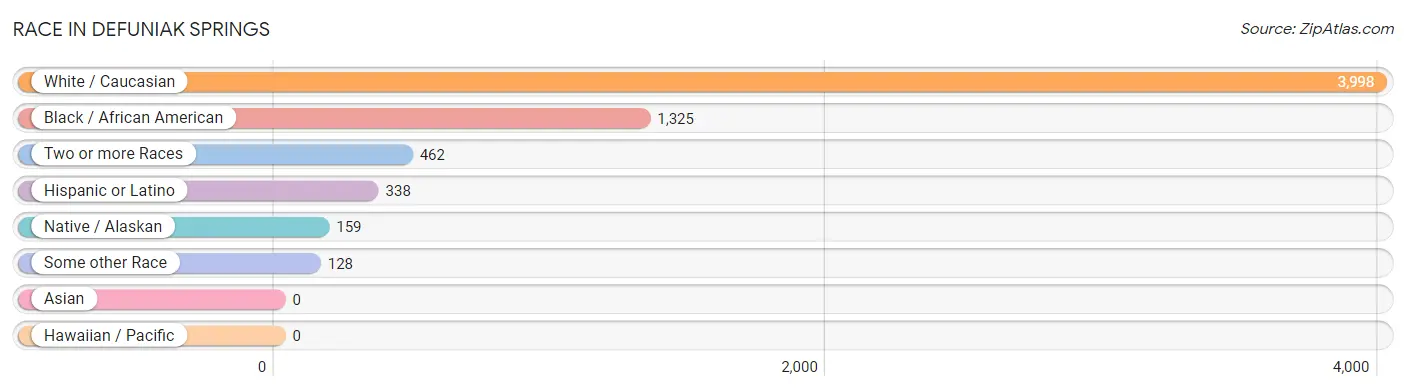
| Race | # Population | % Population |
| Asian | 0 | 0.0% |
| Black / African American | 1,325 | 21.8% |
| Hawaiian / Pacific | 0 | 0.0% |
| Hispanic or Latino | 338 | 5.6% |
| Native / Alaskan | 159 | 2.6% |
| White / Caucasian | 3,998 | 65.8% |
| Two or more Races | 462 | 7.6% |
| Some other Race | 128 | 2.1% |
| Total | 6,072 | 100.0% |
Ancestry in Defuniak Springs
The most populous ancestries reported in Defuniak Springs are American (542 | 8.9%), German (360 | 5.9%), Irish (309 | 5.1%), English (262 | 4.3%), and Mexican (244 | 4.0%), together accounting for 28.3% of all Defuniak Springs residents.
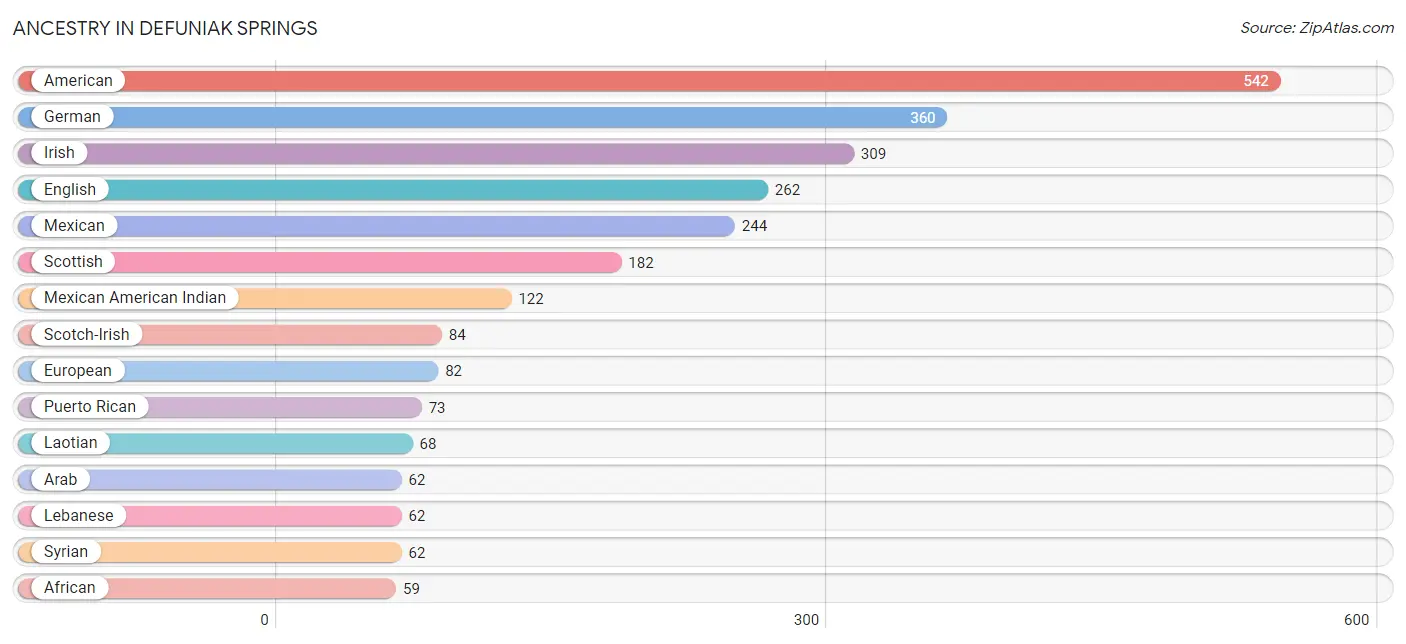
| Ancestry | # Population | % Population |
| African | 59 | 1.0% |
| Albanian | 11 | 0.2% |
| American | 542 | 8.9% |
| Arab | 62 | 1.0% |
| British | 37 | 0.6% |
| Canadian | 8 | 0.1% |
| Cherokee | 14 | 0.2% |
| Chickasaw | 12 | 0.2% |
| Creek | 38 | 0.6% |
| Cuban | 18 | 0.3% |
| Danish | 6 | 0.1% |
| Dutch | 20 | 0.3% |
| English | 262 | 4.3% |
| European | 82 | 1.3% |
| French | 12 | 0.2% |
| German | 360 | 5.9% |
| Irish | 309 | 5.1% |
| Italian | 51 | 0.8% |
| Jamaican | 20 | 0.3% |
| Laotian | 68 | 1.1% |
| Lebanese | 62 | 1.0% |
| Mexican | 244 | 4.0% |
| Mexican American Indian | 122 | 2.0% |
| Norwegian | 48 | 0.8% |
| Polish | 31 | 0.5% |
| Portuguese | 10 | 0.2% |
| Puerto Rican | 73 | 1.2% |
| Scandinavian | 43 | 0.7% |
| Scotch-Irish | 84 | 1.4% |
| Scottish | 182 | 3.0% |
| Slavic | 14 | 0.2% |
| Subsaharan African | 59 | 1.0% |
| Swedish | 12 | 0.2% |
| Syrian | 62 | 1.0% |
| Welsh | 42 | 0.7% | View All 35 Rows |
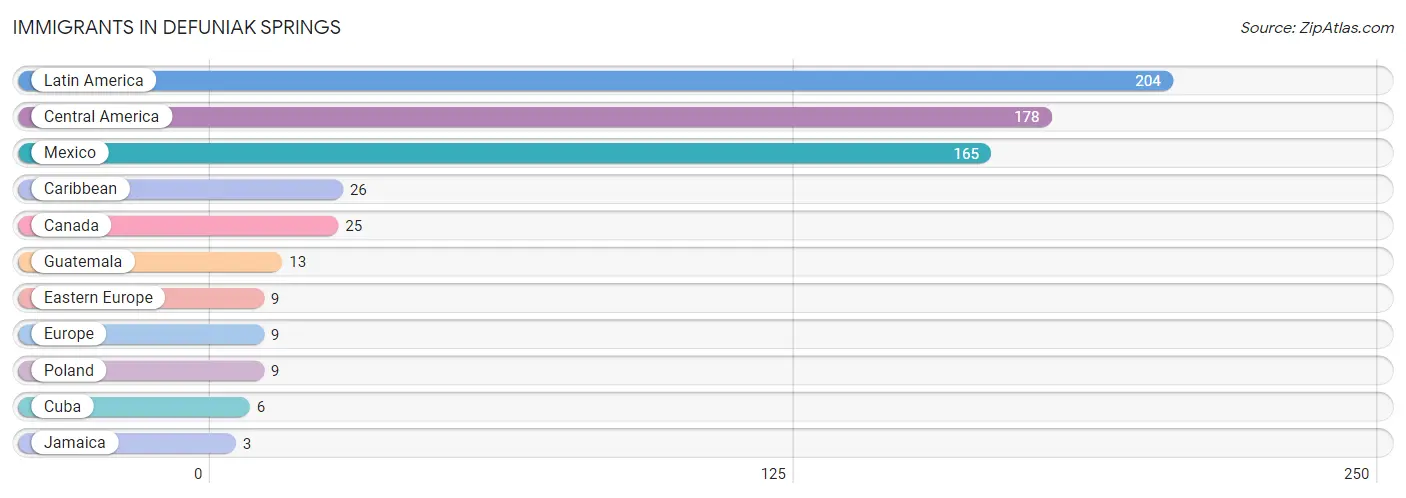
Immigrants in Defuniak Springs
The most numerous immigrant groups reported in Defuniak Springs came from Latin America (204 | 3.4%), Central America (178 | 2.9%), Mexico (165 | 2.7%), Caribbean (26 | 0.4%), and Canada (25 | 0.4%), together accounting for 9.9% of all Defuniak Springs residents.
| Immigration Origin | # Population | % Population |
| Canada | 25 | 0.4% |
| Caribbean | 26 | 0.4% |
| Central America | 178 | 2.9% |
| Cuba | 6 | 0.1% |
| Eastern Europe | 9 | 0.2% |
| Europe | 9 | 0.2% |
| Guatemala | 13 | 0.2% |
| Jamaica | 3 | 0.1% |
| Latin America | 204 | 3.4% |
| Mexico | 165 | 2.7% |
| Poland | 9 | 0.2% | View All 11 Rows |
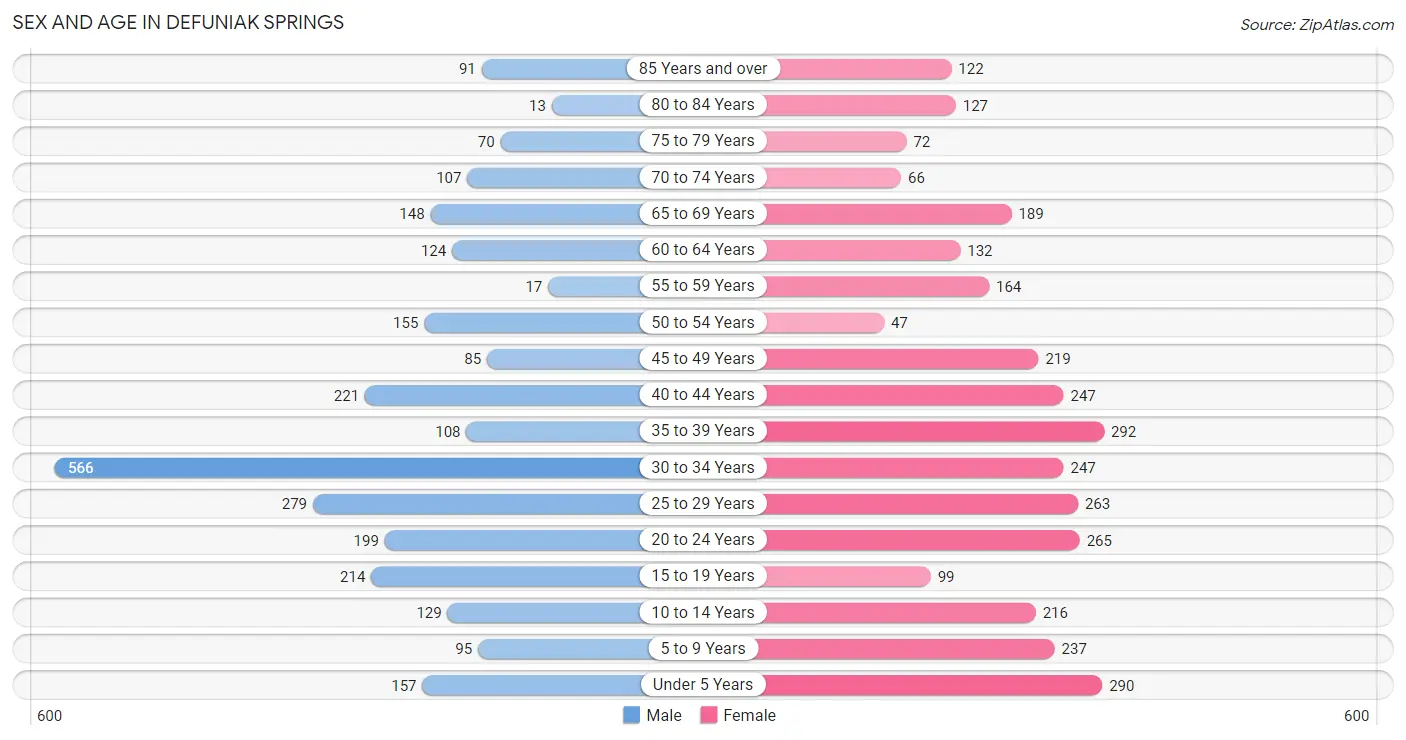
Sex and Age in Defuniak Springs
Sex and Age in Defuniak Springs
The most populous age groups in Defuniak Springs are 30 to 34 Years (566 | 20.4%) for men and 35 to 39 Years (292 | 8.9%) for women.
| Age Bracket | Male | Female |
| Under 5 Years | 157 (5.7%) | 290 (8.8%) |
| 5 to 9 Years | 95 (3.4%) | 237 (7.2%) |
| 10 to 14 Years | 129 (4.6%) | 216 (6.6%) |
| 15 to 19 Years | 214 (7.7%) | 99 (3.0%) |
| 20 to 24 Years | 199 (7.2%) | 265 (8.0%) |
| 25 to 29 Years | 279 (10.0%) | 263 (8.0%) |
| 30 to 34 Years | 566 (20.4%) | 247 (7.5%) |
| 35 to 39 Years | 108 (3.9%) | 292 (8.9%) |
| 40 to 44 Years | 221 (8.0%) | 247 (7.5%) |
| 45 to 49 Years | 85 (3.1%) | 219 (6.7%) |
| 50 to 54 Years | 155 (5.6%) | 47 (1.4%) |
| 55 to 59 Years | 17 (0.6%) | 164 (5.0%) |
| 60 to 64 Years | 124 (4.5%) | 132 (4.0%) |
| 65 to 69 Years | 148 (5.3%) | 189 (5.7%) |
| 70 to 74 Years | 107 (3.8%) | 66 (2.0%) |
| 75 to 79 Years | 70 (2.5%) | 72 (2.2%) |
| 80 to 84 Years | 13 (0.5%) | 127 (3.9%) |
| 85 Years and over | 91 (3.3%) | 122 (3.7%) |
| Total | 2,778 (100.0%) | 3,294 (100.0%) |
Families and Households in Defuniak Springs
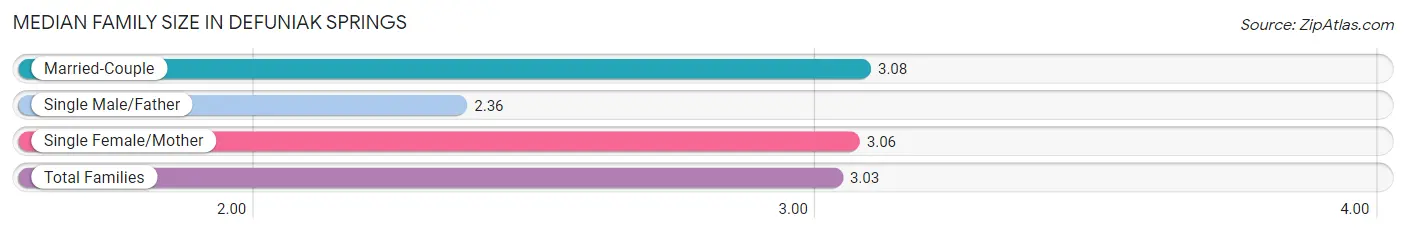
Median Family Size in Defuniak Springs
The median family size in Defuniak Springs is 3.03 persons per family, with married-couple families (886 | 60.2%) accounting for the largest median family size of 3.08 persons per family. On the other hand, single male/father families (97 | 6.6%) represent the smallest median family size with 2.36 persons per family.
| Family Type | # Families | Family Size |
| Married-Couple | 886 (60.2%) | 3.08 |
| Single Male/Father | 97 (6.6%) | 2.36 |
| Single Female/Mother | 488 (33.2%) | 3.06 |
| Total Families | 1,471 (100.0%) | 3.03 |
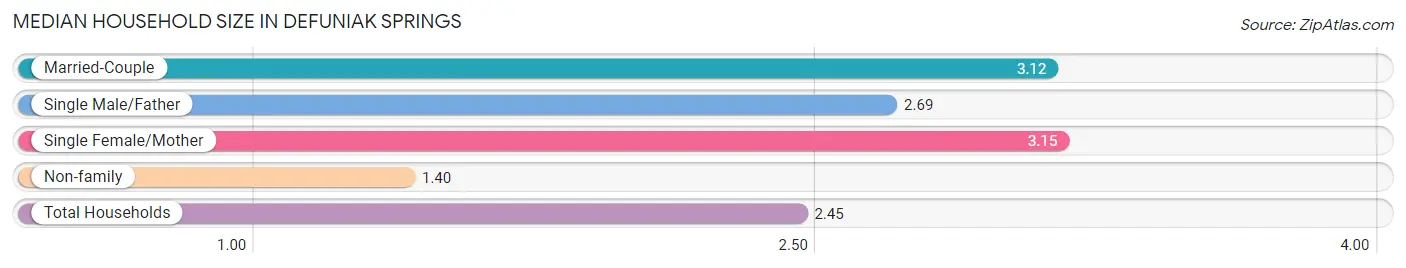
Median Household Size in Defuniak Springs
The median household size in Defuniak Springs is 2.45 persons per household, with single female/mother households (488 | 20.4%) accounting for the largest median household size of 3.15 persons per household. non-family households (923 | 38.6%) represent the smallest median household size with 1.40 persons per household.
| Household Type | # Households | Household Size |
| Married-Couple | 886 (37.0%) | 3.12 |
| Single Male/Father | 97 (4.1%) | 2.69 |
| Single Female/Mother | 488 (20.4%) | 3.15 |
| Non-family | 923 (38.6%) | 1.40 |
| Total Households | 2,394 (100.0%) | 2.45 |
Household Size by Marriage Status in Defuniak Springs
Out of a total of 2,394 households in Defuniak Springs, 1,471 (61.5%) are family households, while 923 (38.6%) are nonfamily households. The most numerous type of family households are 3-person households, comprising 562, and the most common type of nonfamily households are 1-person households, comprising 601.
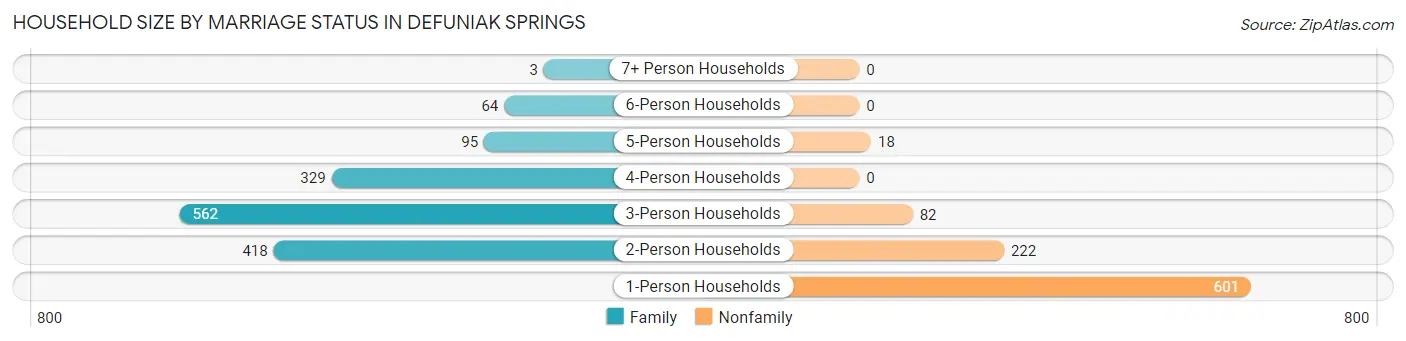
| Household Size | Family Households | Nonfamily Households |
| 1-Person Households | - | 601 (25.1%) |
| 2-Person Households | 418 (17.5%) | 222 (9.3%) |
| 3-Person Households | 562 (23.5%) | 82 (3.4%) |
| 4-Person Households | 329 (13.7%) | 0 (0.0%) |
| 5-Person Households | 95 (4.0%) | 18 (0.7%) |
| 6-Person Households | 64 (2.7%) | 0 (0.0%) |
| 7+ Person Households | 3 (0.1%) | 0 (0.0%) |
| Total | 1,471 (61.5%) | 923 (38.6%) |
Female Fertility in Defuniak Springs
Fertility by Age in Defuniak Springs
Average fertility rate in Defuniak Springs is 42.0 births per 1,000 women. Women in the age bracket of 20 to 34 years have the highest fertility rate with 89.0 births per 1,000 women. Women in the age bracket of 20 to 34 years acount for 100.0% of all women with births.
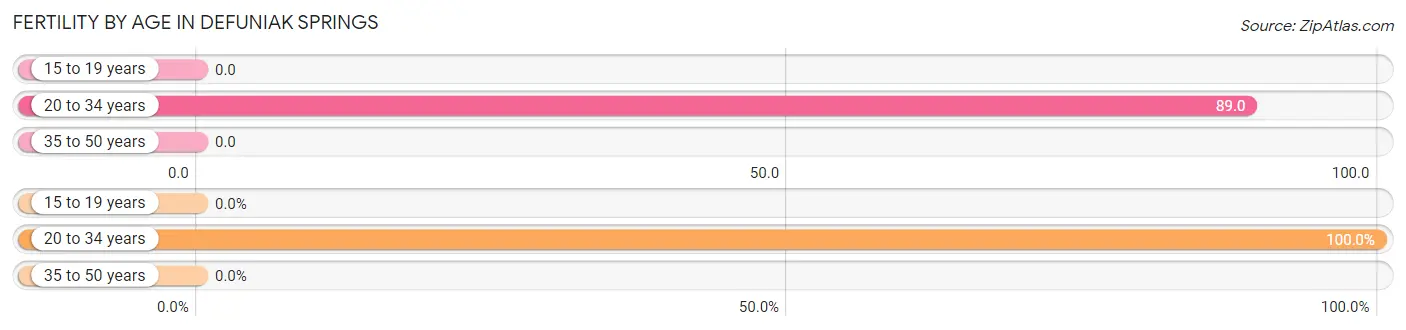
| Age Bracket | Women with Births | Births / 1,000 Women |
| 15 to 19 years | 0 (0.0%) | 0.0 |
| 20 to 34 years | 69 (100.0%) | 89.0 |
| 35 to 50 years | 0 (0.0%) | 0.0 |
| Total | 69 (100.0%) | 42.0 |
Fertility by Age by Marriage Status in Defuniak Springs
65.2% of women with births (69) in Defuniak Springs are married. The highest percentage of unmarried women with births falls into 20 to 34 years age bracket with 34.8% of them unmarried at the time of birth, while the lowest percentage of unmarried women with births belong to 20 to 34 years age bracket with 34.8% of them unmarried.
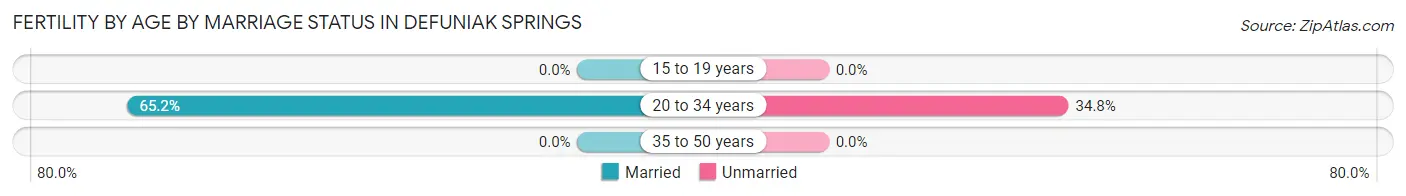
| Age Bracket | Married | Unmarried |
| 15 to 19 years | 0 (0.0%) | 0 (0.0%) |
| 20 to 34 years | 45 (65.2%) | 24 (34.8%) |
| 35 to 50 years | 0 (0.0%) | 0 (0.0%) |
| Total | 45 (65.2%) | 24 (34.8%) |
Fertility by Education in Defuniak Springs
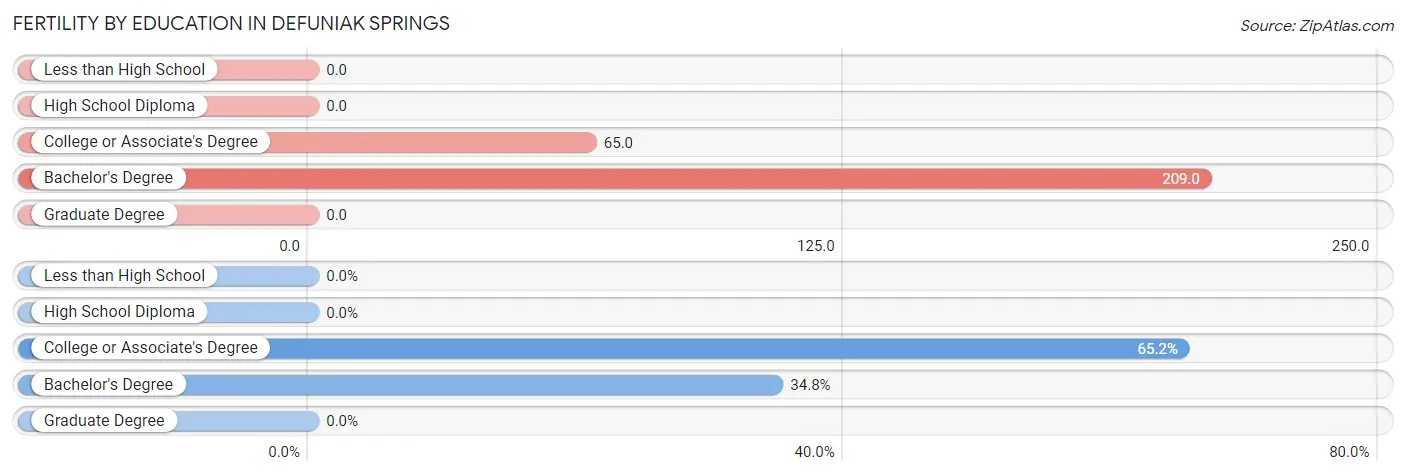
| Educational Attainment | Women with Births | Births / 1,000 Women |
| Less than High School | 0 (0.0%) | 0.0 |
| High School Diploma | 0 (0.0%) | 0.0 |
| College or Associate's Degree | 45 (65.2%) | 65.0 |
| Bachelor's Degree | 24 (34.8%) | 209.0 |
| Graduate Degree | 0 (0.0%) | 0.0 |
| Total | 69 (100.0%) | 42.0 |
Fertility by Education by Marriage Status in Defuniak Springs
34.8% of women with births in Defuniak Springs are unmarried. Women with the educational attainment of college or associate's degree are most likely to be married with 73.3% of them married at childbirth, while women with the educational attainment of bachelor's degree are least likely to be married with 50.0% of them unmarried at childbirth.
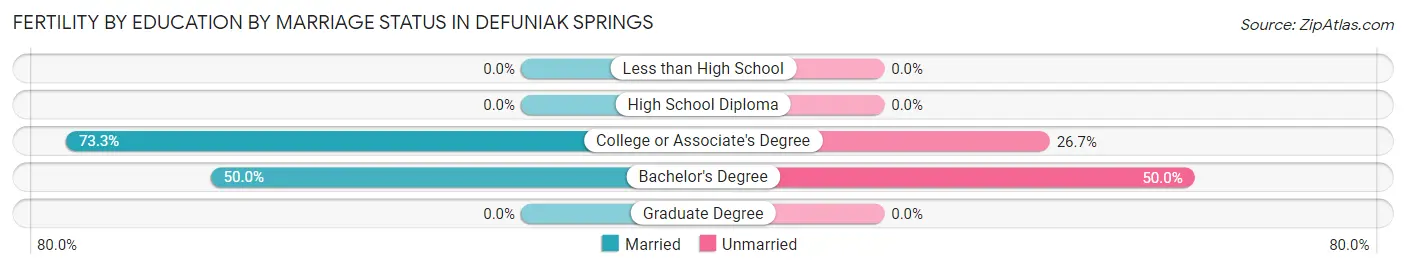
| Educational Attainment | Married | Unmarried |
| Less than High School | 0 (0.0%) | 0 (0.0%) |
| High School Diploma | 0 (0.0%) | 0 (0.0%) |
| College or Associate's Degree | 33 (73.3%) | 12 (26.7%) |
| Bachelor's Degree | 12 (50.0%) | 12 (50.0%) |
| Graduate Degree | 0 (0.0%) | 0 (0.0%) |
| Total | 45 (65.2%) | 24 (34.8%) |
Employment Characteristics in Defuniak Springs
Employment by Class of Employer in Defuniak Springs
Among the 2,525 employed individuals in Defuniak Springs, private company employees (1,382 | 54.7%), not-for-profit organizations (289 | 11.5%), and local government employees (284 | 11.3%) make up the most common classes of employment.
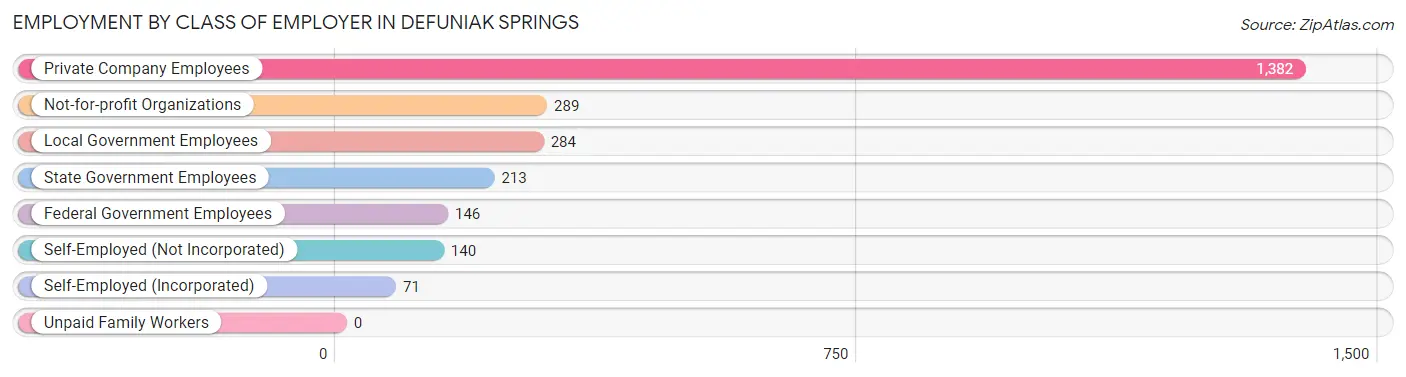
| Employer Class | # Employees | % Employees |
| Private Company Employees | 1,382 | 54.7% |
| Self-Employed (Incorporated) | 71 | 2.8% |
| Self-Employed (Not Incorporated) | 140 | 5.5% |
| Not-for-profit Organizations | 289 | 11.5% |
| Local Government Employees | 284 | 11.3% |
| State Government Employees | 213 | 8.4% |
| Federal Government Employees | 146 | 5.8% |
| Unpaid Family Workers | 0 | 0.0% |
| Total | 2,525 | 100.0% |
Employment Status by Age in Defuniak Springs
According to the labor force statistics for Defuniak Springs, out of the total population over 16 years of age (4,929), 62.5% or 3,081 individuals are in the labor force, with 14.4% or 444 of them unemployed. The age group with the highest labor force participation rate is 35 to 44 years, with 90.2% or 783 individuals in the labor force. Within the labor force, the 30 to 34 years age range has the highest percentage of unemployed individuals, with 41.7% or 302 of them being unemployed.
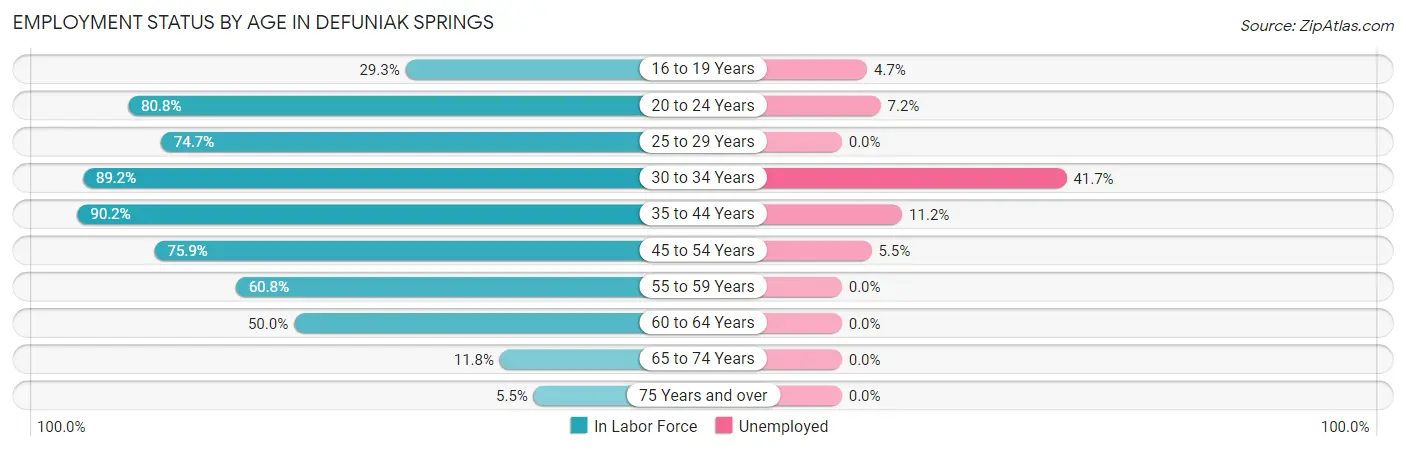
| Age Bracket | In Labor Force | Unemployed |
| 16 to 19 Years | 86 (29.3%) | 4 (4.7%) |
| 20 to 24 Years | 375 (80.8%) | 27 (7.2%) |
| 25 to 29 Years | 405 (74.7%) | 0 (0.0%) |
| 30 to 34 Years | 725 (89.2%) | 302 (41.7%) |
| 35 to 44 Years | 783 (90.2%) | 88 (11.2%) |
| 45 to 54 Years | 384 (75.9%) | 21 (5.5%) |
| 55 to 59 Years | 110 (60.8%) | 0 (0.0%) |
| 60 to 64 Years | 128 (50.0%) | 0 (0.0%) |
| 65 to 74 Years | 60 (11.8%) | 0 (0.0%) |
| 75 Years and over | 27 (5.5%) | 0 (0.0%) |
| Total | 3,081 (62.5%) | 444 (14.4%) |
Employment Status by Educational Attainment in Defuniak Springs
According to labor force statistics for Defuniak Springs, 80.1% of individuals (2,536) out of the total population between 25 and 64 years of age (3,166) are in the labor force, with 16.3% or 413 of them being unemployed. The group with the highest labor force participation rate are those with the educational attainment of less than high school, with 91.7% or 540 individuals in the labor force. Within the labor force, individuals with less than high school education have the highest percentage of unemployment, with 66.1% or 357 of them being unemployed.
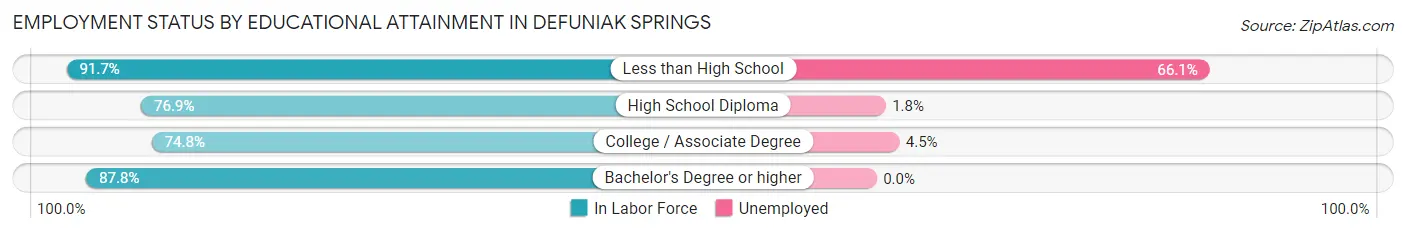
| Educational Attainment | In Labor Force | Unemployed |
| Less than High School | 540 (91.7%) | 389 (66.1%) |
| High School Diploma | 868 (76.9%) | 20 (1.8%) |
| College / Associate Degree | 833 (74.8%) | 50 (4.5%) |
| Bachelor's Degree or higher | 294 (87.8%) | 0 (0.0%) |
| Total | 2,536 (80.1%) | 516 (16.3%) |
Employment Occupations by Sex in Defuniak Springs
Management, Business, Science and Arts Occupations
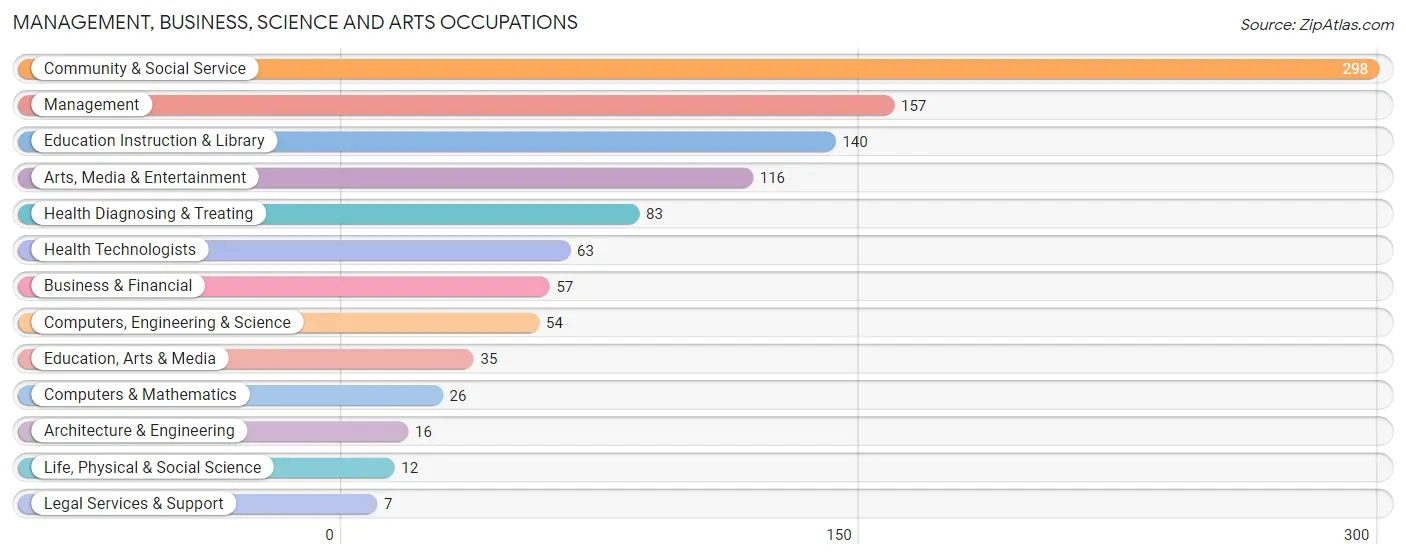
The most common Management, Business, Science and Arts occupations in Defuniak Springs are Community & Social Service (298 | 11.4%), Management (157 | 6.0%), Education Instruction & Library (140 | 5.3%), Arts, Media & Entertainment (116 | 4.4%), and Health Diagnosing & Treating (83 | 3.2%).
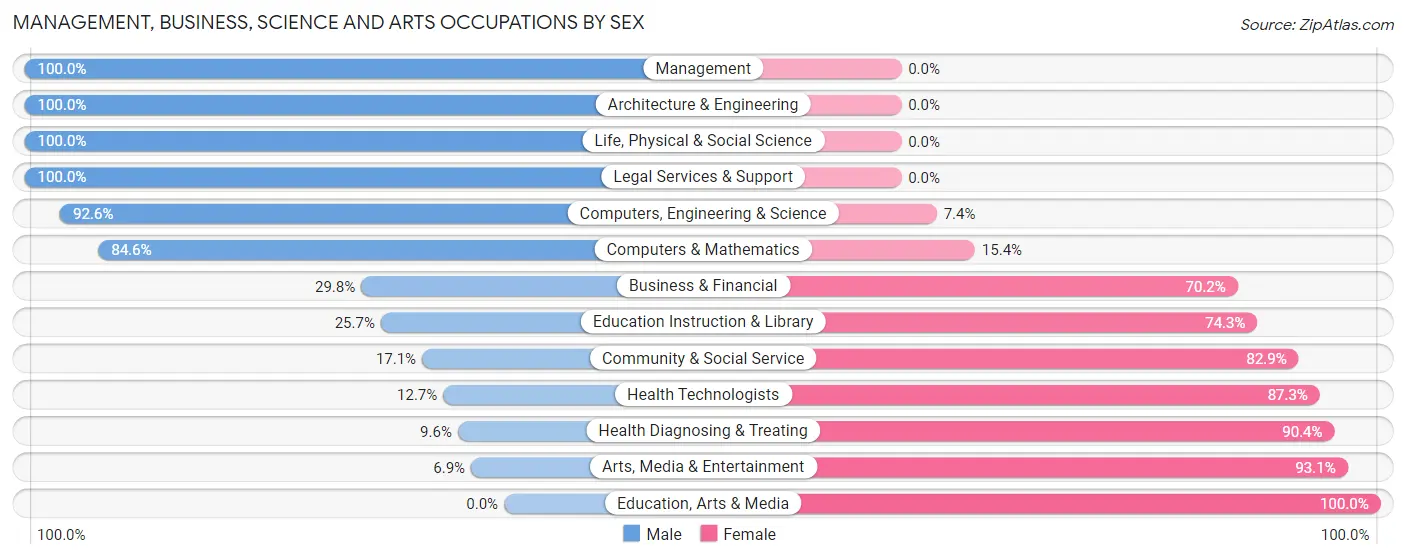
Management, Business, Science and Arts Occupations by Sex
Within the Management, Business, Science and Arts occupations in Defuniak Springs, the most male-oriented occupations are Management (100.0%), Architecture & Engineering (100.0%), and Life, Physical & Social Science (100.0%), while the most female-oriented occupations are Education, Arts & Media (100.0%), Arts, Media & Entertainment (93.1%), and Health Diagnosing & Treating (90.4%).
| Occupation | Male | Female |
| Management | 157 (100.0%) | 0 (0.0%) |
| Business & Financial | 17 (29.8%) | 40 (70.2%) |
| Computers, Engineering & Science | 50 (92.6%) | 4 (7.4%) |
| Computers & Mathematics | 22 (84.6%) | 4 (15.4%) |
| Architecture & Engineering | 16 (100.0%) | 0 (0.0%) |
| Life, Physical & Social Science | 12 (100.0%) | 0 (0.0%) |
| Community & Social Service | 51 (17.1%) | 247 (82.9%) |
| Education, Arts & Media | 0 (0.0%) | 35 (100.0%) |
| Legal Services & Support | 7 (100.0%) | 0 (0.0%) |
| Education Instruction & Library | 36 (25.7%) | 104 (74.3%) |
| Arts, Media & Entertainment | 8 (6.9%) | 108 (93.1%) |
| Health Diagnosing & Treating | 8 (9.6%) | 75 (90.4%) |
| Health Technologists | 8 (12.7%) | 55 (87.3%) |
| Total (Category) | 283 (43.6%) | 366 (56.4%) |
| Total (Overall) | 1,288 (49.2%) | 1,330 (50.8%) |
Services Occupations
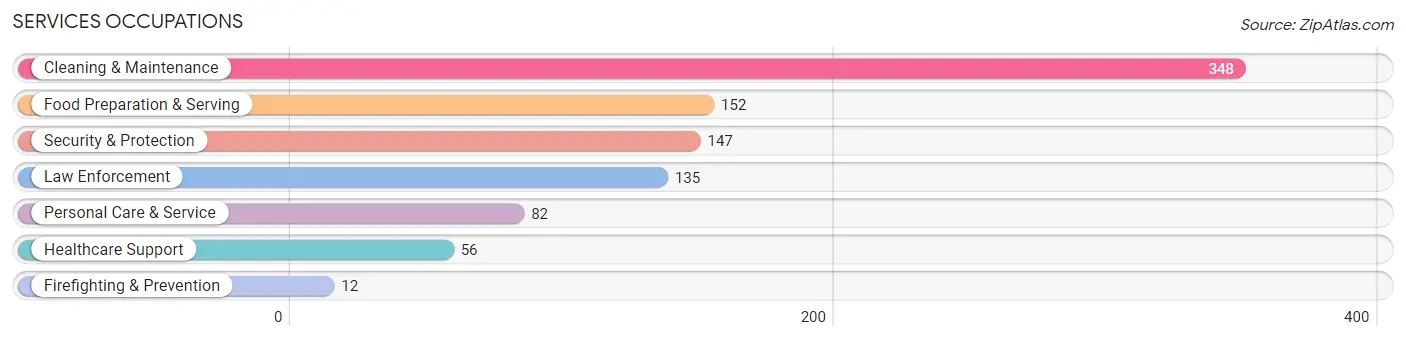
The most common Services occupations in Defuniak Springs are Cleaning & Maintenance (348 | 13.3%), Food Preparation & Serving (152 | 5.8%), Security & Protection (147 | 5.6%), Law Enforcement (135 | 5.2%), and Personal Care & Service (82 | 3.1%).
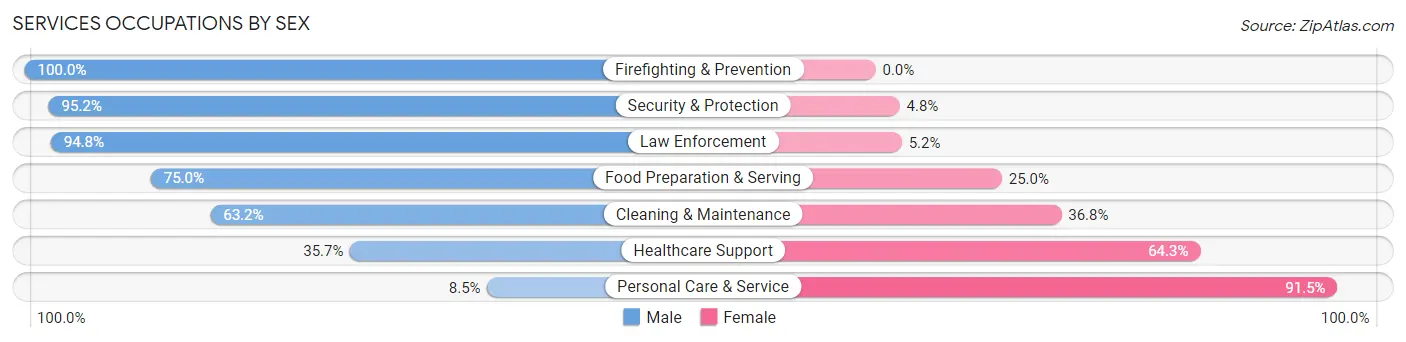
Services Occupations by Sex
Within the Services occupations in Defuniak Springs, the most male-oriented occupations are Firefighting & Prevention (100.0%), Security & Protection (95.2%), and Law Enforcement (94.8%), while the most female-oriented occupations are Personal Care & Service (91.5%), Healthcare Support (64.3%), and Cleaning & Maintenance (36.8%).
| Occupation | Male | Female |
| Healthcare Support | 20 (35.7%) | 36 (64.3%) |
| Security & Protection | 140 (95.2%) | 7 (4.8%) |
| Firefighting & Prevention | 12 (100.0%) | 0 (0.0%) |
| Law Enforcement | 128 (94.8%) | 7 (5.2%) |
| Food Preparation & Serving | 114 (75.0%) | 38 (25.0%) |
| Cleaning & Maintenance | 220 (63.2%) | 128 (36.8%) |
| Personal Care & Service | 7 (8.5%) | 75 (91.5%) |
| Total (Category) | 501 (63.8%) | 284 (36.2%) |
| Total (Overall) | 1,288 (49.2%) | 1,330 (50.8%) |
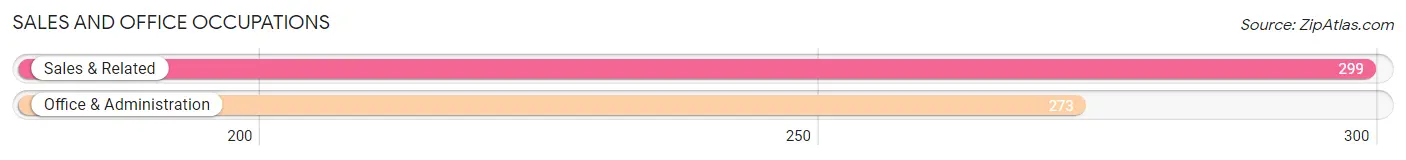
Sales and Office Occupations
The most common Sales and Office occupations in Defuniak Springs are Sales & Related (299 | 11.4%), and Office & Administration (273 | 10.4%).
Sales and Office Occupations by Sex
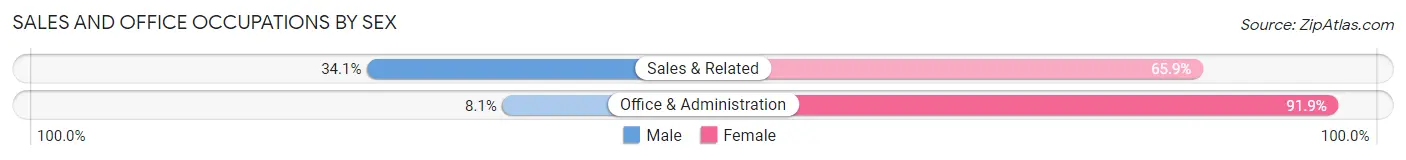
| Occupation | Male | Female |
| Sales & Related | 102 (34.1%) | 197 (65.9%) |
| Office & Administration | 22 (8.1%) | 251 (91.9%) |
| Total (Category) | 124 (21.7%) | 448 (78.3%) |
| Total (Overall) | 1,288 (49.2%) | 1,330 (50.8%) |
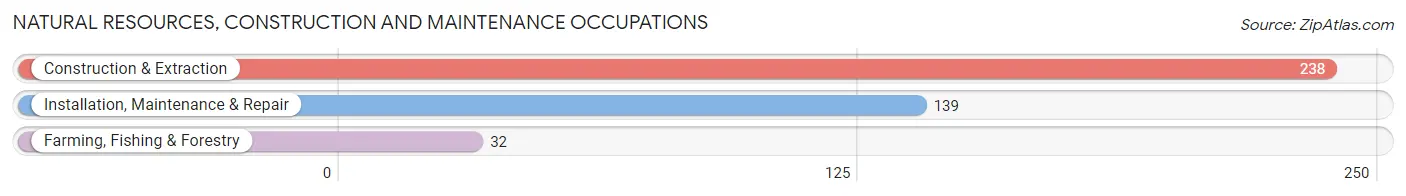
Natural Resources, Construction and Maintenance Occupations
The most common Natural Resources, Construction and Maintenance occupations in Defuniak Springs are Construction & Extraction (238 | 9.1%), Installation, Maintenance & Repair (139 | 5.3%), and Farming, Fishing & Forestry (32 | 1.2%).
Natural Resources, Construction and Maintenance Occupations by Sex
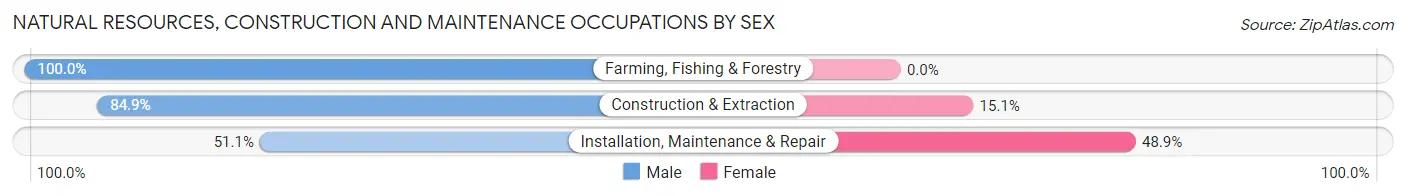
| Occupation | Male | Female |
| Farming, Fishing & Forestry | 32 (100.0%) | 0 (0.0%) |
| Construction & Extraction | 202 (84.9%) | 36 (15.1%) |
| Installation, Maintenance & Repair | 71 (51.1%) | 68 (48.9%) |
| Total (Category) | 305 (74.6%) | 104 (25.4%) |
| Total (Overall) | 1,288 (49.2%) | 1,330 (50.8%) |
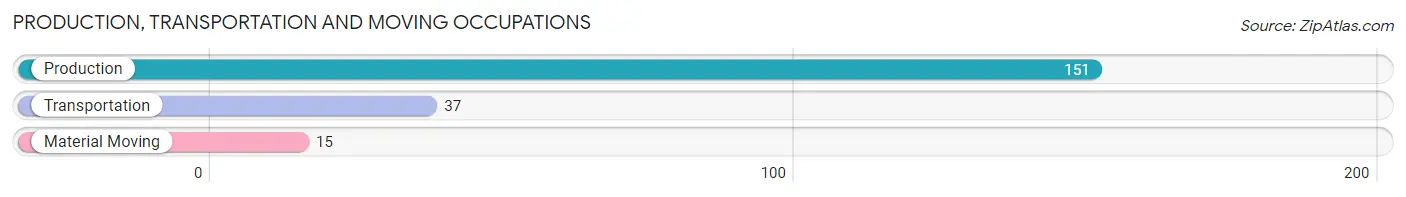
Production, Transportation and Moving Occupations
The most common Production, Transportation and Moving occupations in Defuniak Springs are Production (151 | 5.8%), Transportation (37 | 1.4%), and Material Moving (15 | 0.6%).
Production, Transportation and Moving Occupations by Sex
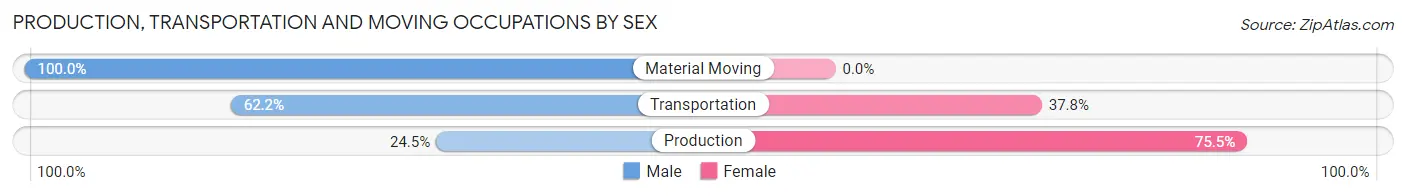
| Occupation | Male | Female |
| Production | 37 (24.5%) | 114 (75.5%) |
| Transportation | 23 (62.2%) | 14 (37.8%) |
| Material Moving | 15 (100.0%) | 0 (0.0%) |
| Total (Category) | 75 (36.9%) | 128 (63.0%) |
| Total (Overall) | 1,288 (49.2%) | 1,330 (50.8%) |
Employment Industries by Sex in Defuniak Springs
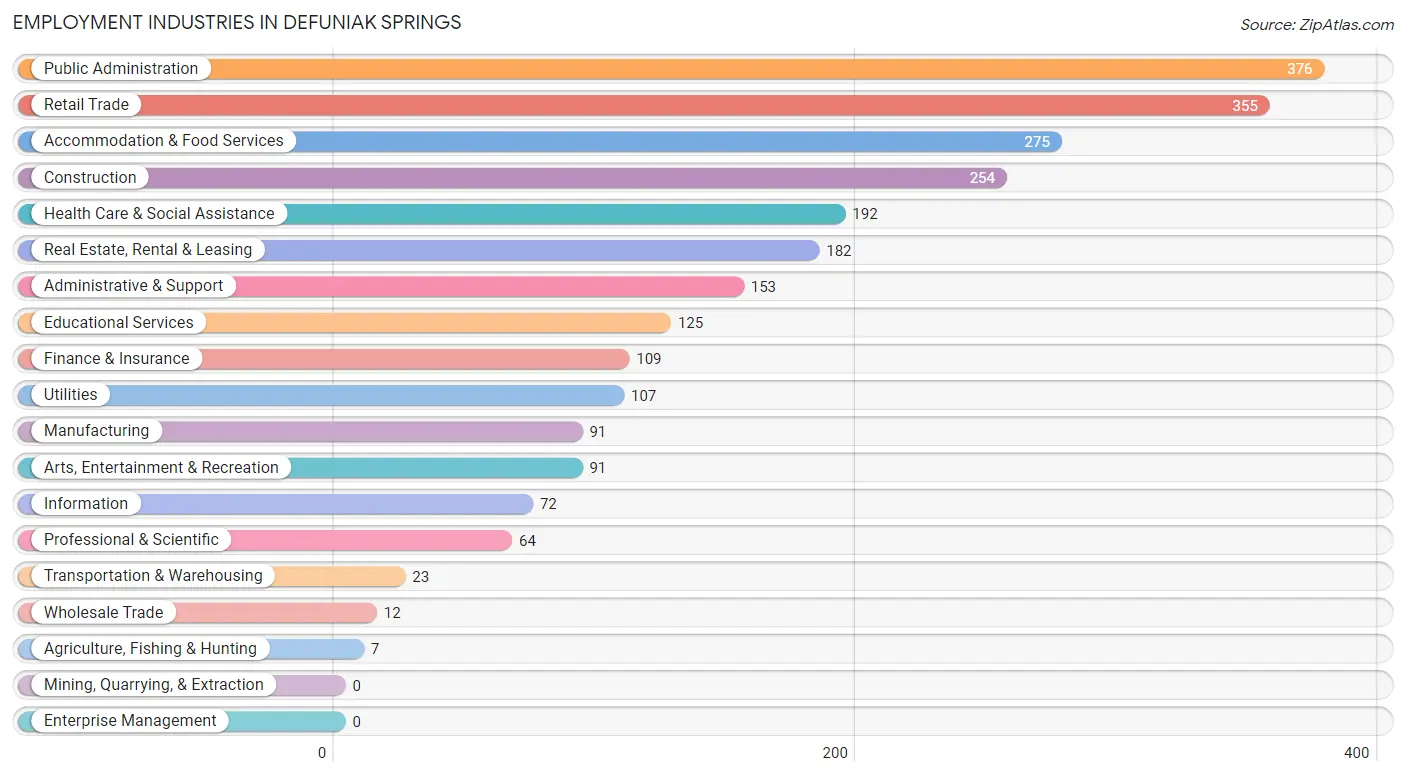
Employment Industries in Defuniak Springs
The major employment industries in Defuniak Springs include Public Administration (376 | 14.4%), Retail Trade (355 | 13.6%), Accommodation & Food Services (275 | 10.5%), Construction (254 | 9.7%), and Health Care & Social Assistance (192 | 7.3%).
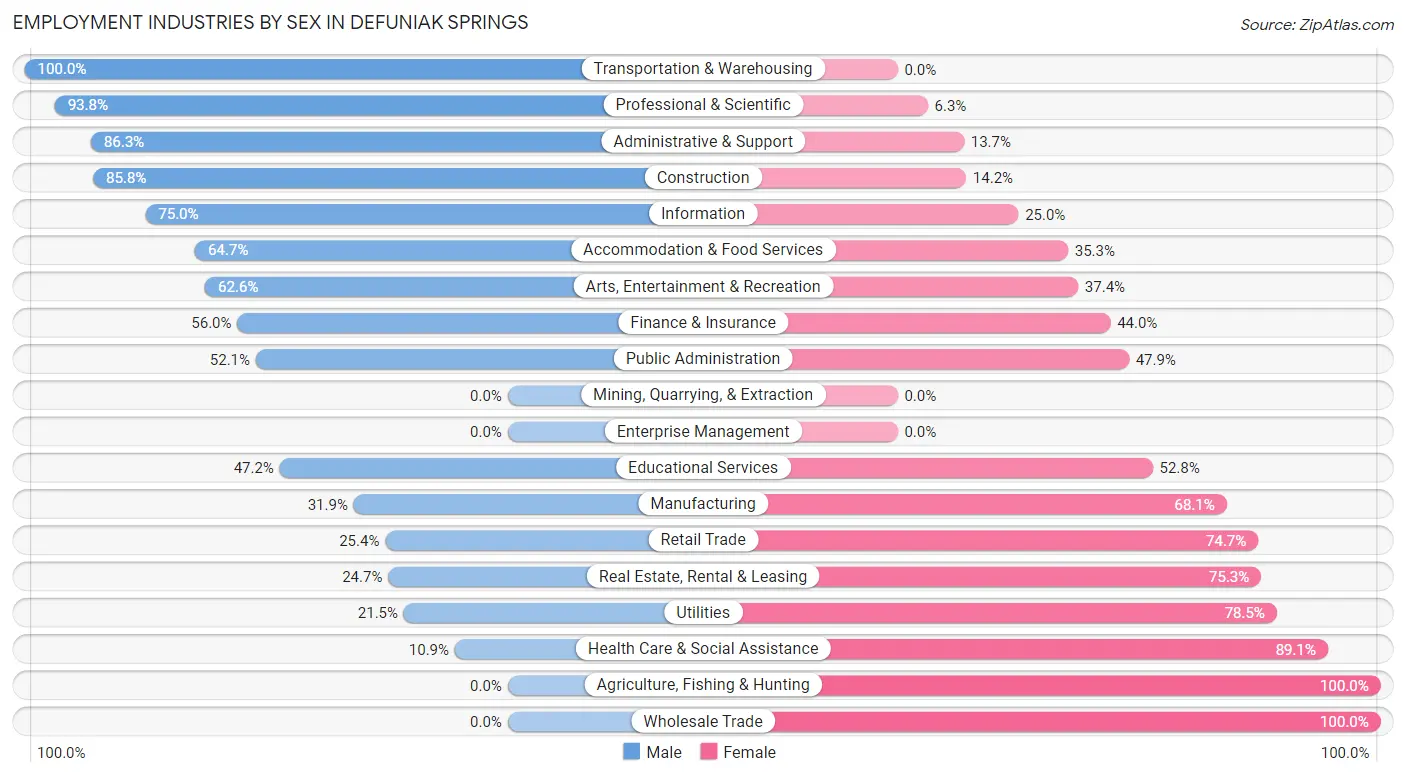
Employment Industries by Sex in Defuniak Springs
The Defuniak Springs industries that see more men than women are Transportation & Warehousing (100.0%), Professional & Scientific (93.8%), and Administrative & Support (86.3%), whereas the industries that tend to have a higher number of women are Agriculture, Fishing & Hunting (100.0%), Wholesale Trade (100.0%), and Health Care & Social Assistance (89.1%).
| Industry | Male | Female |
| Agriculture, Fishing & Hunting | 0 (0.0%) | 7 (100.0%) |
| Mining, Quarrying, & Extraction | 0 (0.0%) | 0 (0.0%) |
| Construction | 218 (85.8%) | 36 (14.2%) |
| Manufacturing | 29 (31.9%) | 62 (68.1%) |
| Wholesale Trade | 0 (0.0%) | 12 (100.0%) |
| Retail Trade | 90 (25.4%) | 265 (74.7%) |
| Transportation & Warehousing | 23 (100.0%) | 0 (0.0%) |
| Utilities | 23 (21.5%) | 84 (78.5%) |
| Information | 54 (75.0%) | 18 (25.0%) |
| Finance & Insurance | 61 (56.0%) | 48 (44.0%) |
| Real Estate, Rental & Leasing | 45 (24.7%) | 137 (75.3%) |
| Professional & Scientific | 60 (93.8%) | 4 (6.2%) |
| Enterprise Management | 0 (0.0%) | 0 (0.0%) |
| Administrative & Support | 132 (86.3%) | 21 (13.7%) |
| Educational Services | 59 (47.2%) | 66 (52.8%) |
| Health Care & Social Assistance | 21 (10.9%) | 171 (89.1%) |
| Arts, Entertainment & Recreation | 57 (62.6%) | 34 (37.4%) |
| Accommodation & Food Services | 178 (64.7%) | 97 (35.3%) |
| Public Administration | 196 (52.1%) | 180 (47.9%) |
| Total | 1,288 (49.2%) | 1,330 (50.8%) |
Education in Defuniak Springs
School Enrollment in Defuniak Springs
The most common levels of schooling among the 1,136 students in Defuniak Springs are middle school (319 | 28.1%), elementary school (291 | 25.6%), and high school (235 | 20.7%).
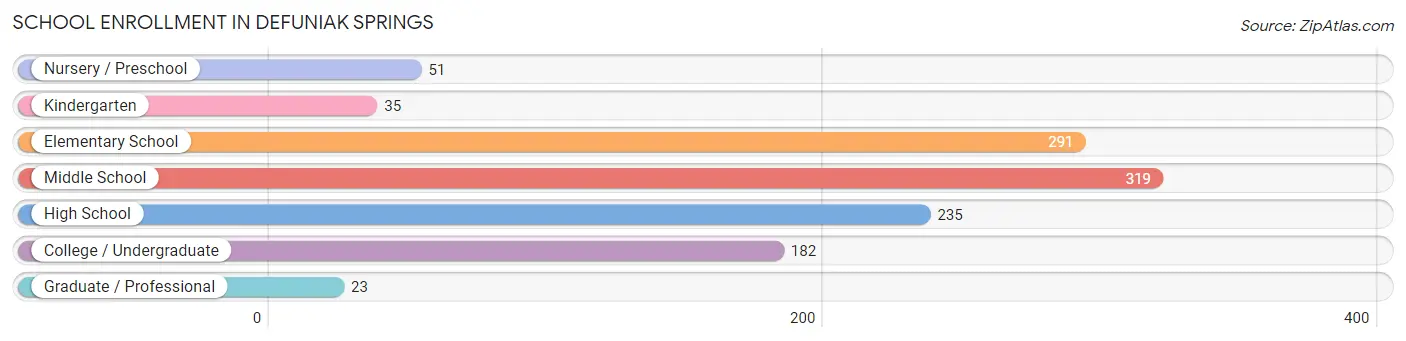
| School Level | # Students | % Students |
| Nursery / Preschool | 51 | 4.5% |
| Kindergarten | 35 | 3.1% |
| Elementary School | 291 | 25.6% |
| Middle School | 319 | 28.1% |
| High School | 235 | 20.7% |
| College / Undergraduate | 182 | 16.0% |
| Graduate / Professional | 23 | 2.0% |
| Total | 1,136 | 100.0% |
School Enrollment by Age by Funding Source in Defuniak Springs
Out of a total of 1,136 students who are enrolled in schools in Defuniak Springs, 107 (9.4%) attend a private institution, while the remaining 1,029 (90.6%) are enrolled in public schools. The age group of 3 to 4 year olds has the highest likelihood of being enrolled in private schools, with 42 (100.0% in the age bracket) enrolled. Conversely, the age group of 18 to 19 year olds has the lowest likelihood of being enrolled in a private school, with 87 (100.0% in the age bracket) attending a public institution.
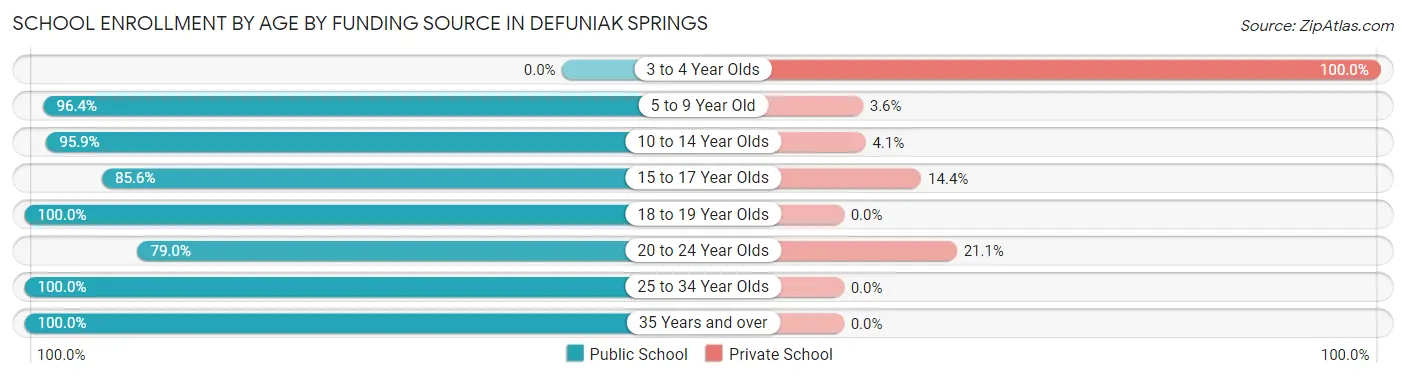
| Age Bracket | Public School | Private School |
| 3 to 4 Year Olds | 0 (0.0%) | 42 (100.0%) |
| 5 to 9 Year Old | 298 (96.4%) | 11 (3.6%) |
| 10 to 14 Year Olds | 331 (95.9%) | 14 (4.1%) |
| 15 to 17 Year Olds | 166 (85.6%) | 28 (14.4%) |
| 18 to 19 Year Olds | 87 (100.0%) | 0 (0.0%) |
| 20 to 24 Year Olds | 45 (78.9%) | 12 (21.0%) |
| 25 to 34 Year Olds | 66 (100.0%) | 0 (0.0%) |
| 35 Years and over | 36 (100.0%) | 0 (0.0%) |
| Total | 1,029 (90.6%) | 107 (9.4%) |
Educational Attainment by Field of Study in Defuniak Springs
Education (176 | 24.0%), business (128 | 17.5%), engineering (76 | 10.4%), arts & humanities (68 | 9.3%), and communications (64 | 8.7%) are the most common fields of study among 732 individuals in Defuniak Springs who have obtained a bachelor's degree or higher.
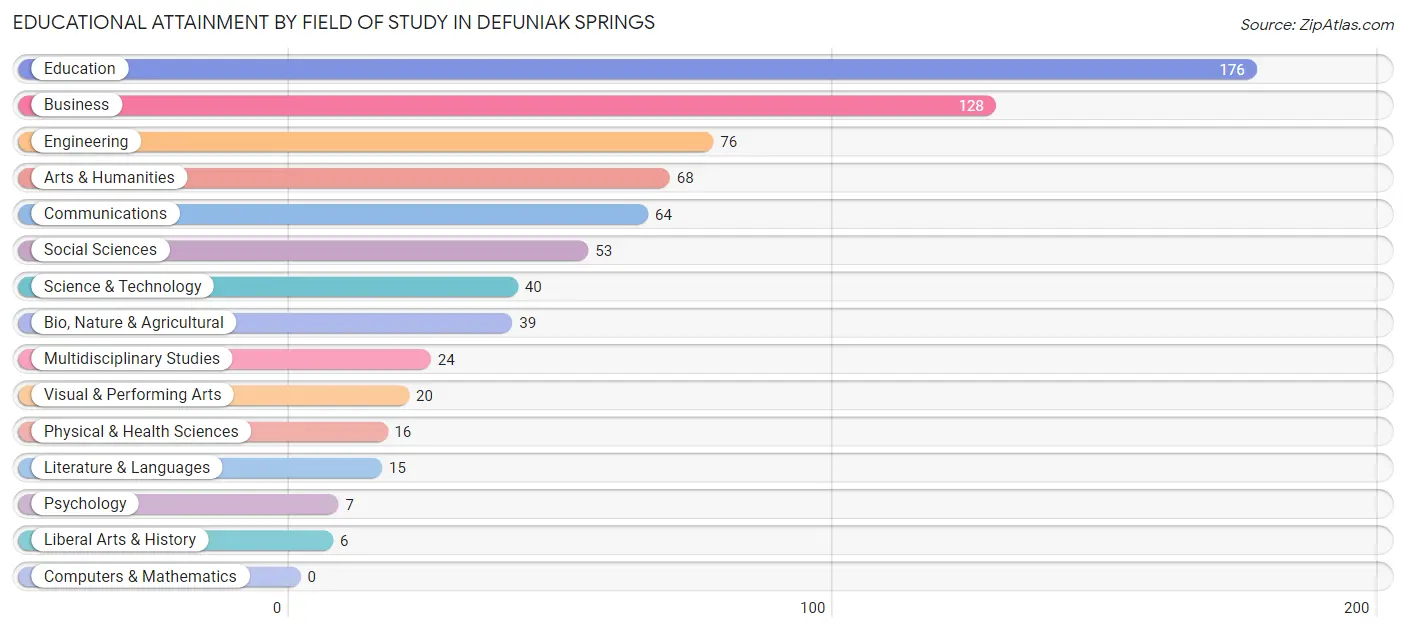
| Field of Study | # Graduates | % Graduates |
| Computers & Mathematics | 0 | 0.0% |
| Bio, Nature & Agricultural | 39 | 5.3% |
| Physical & Health Sciences | 16 | 2.2% |
| Psychology | 7 | 1.0% |
| Social Sciences | 53 | 7.2% |
| Engineering | 76 | 10.4% |
| Multidisciplinary Studies | 24 | 3.3% |
| Science & Technology | 40 | 5.5% |
| Business | 128 | 17.5% |
| Education | 176 | 24.0% |
| Literature & Languages | 15 | 2.1% |
| Liberal Arts & History | 6 | 0.8% |
| Visual & Performing Arts | 20 | 2.7% |
| Communications | 64 | 8.7% |
| Arts & Humanities | 68 | 9.3% |
| Total | 732 | 100.0% |
Transportation & Commute in Defuniak Springs
Vehicle Availability by Sex in Defuniak Springs
The most prevalent vehicle ownership categories in Defuniak Springs are males with 2 vehicles (641, accounting for 49.1%) and females with 2 vehicles (603, making up 52.6%).
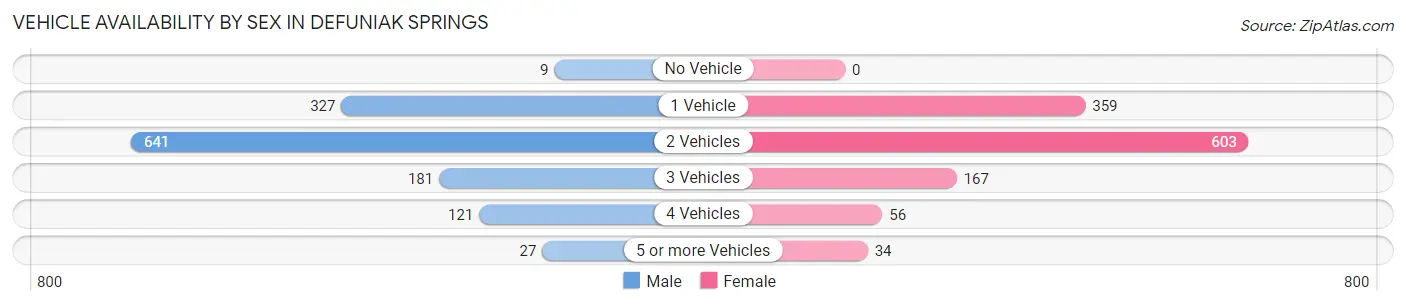
| Vehicles Available | Male | Female |
| No Vehicle | 9 (0.7%) | 0 (0.0%) |
| 1 Vehicle | 327 (25.0%) | 359 (29.4%) |
| 2 Vehicles | 641 (49.1%) | 603 (49.5%) |
| 3 Vehicles | 181 (13.9%) | 167 (13.7%) |
| 4 Vehicles | 121 (9.3%) | 56 (4.6%) |
| 5 or more Vehicles | 27 (2.1%) | 34 (2.8%) |
| Total | 1,306 (100.0%) | 1,219 (100.0%) |
Commute Time in Defuniak Springs
The most frequently occuring commute durations in Defuniak Springs are 5 to 9 minutes (414 commuters, 18.2%), 45 to 59 minutes (335 commuters, 14.7%), and 25 to 29 minutes (334 commuters, 14.7%).
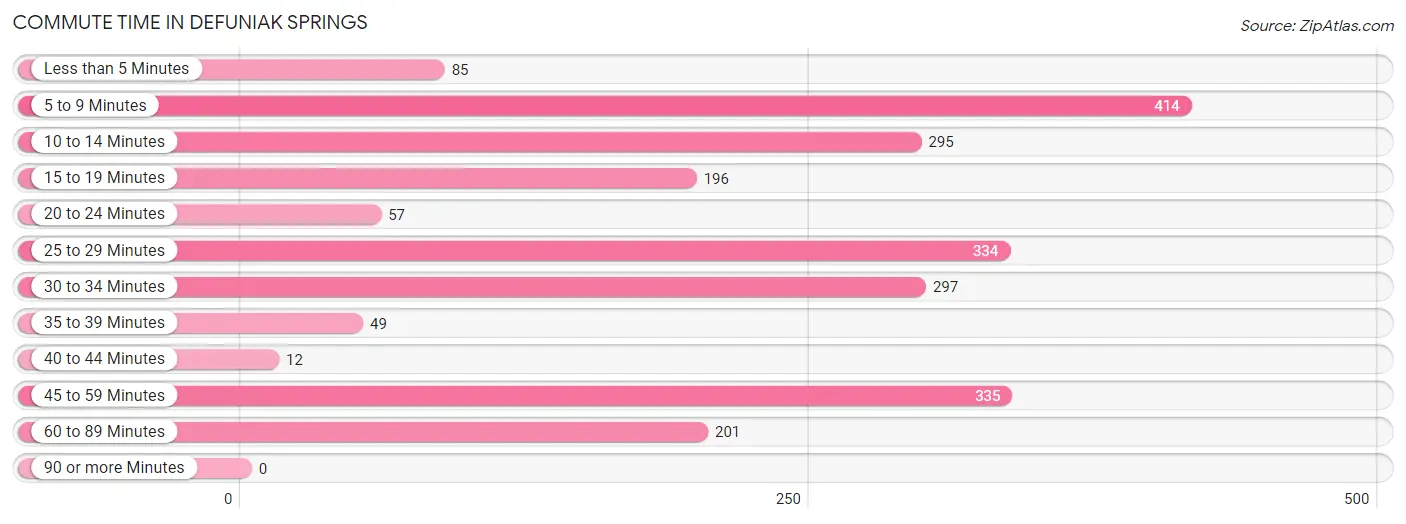
| Commute Time | # Commuters | % Commuters |
| Less than 5 Minutes | 85 | 3.7% |
| 5 to 9 Minutes | 414 | 18.2% |
| 10 to 14 Minutes | 295 | 13.0% |
| 15 to 19 Minutes | 196 | 8.6% |
| 20 to 24 Minutes | 57 | 2.5% |
| 25 to 29 Minutes | 334 | 14.7% |
| 30 to 34 Minutes | 297 | 13.1% |
| 35 to 39 Minutes | 49 | 2.1% |
| 40 to 44 Minutes | 12 | 0.5% |
| 45 to 59 Minutes | 335 | 14.7% |
| 60 to 89 Minutes | 201 | 8.8% |
| 90 or more Minutes | 0 | 0.0% |
Commute Time by Sex in Defuniak Springs
The most common commute times in Defuniak Springs are 5 to 9 minutes (209 commuters, 17.3%) for males and 30 to 34 minutes (214 commuters, 20.0%) for females.
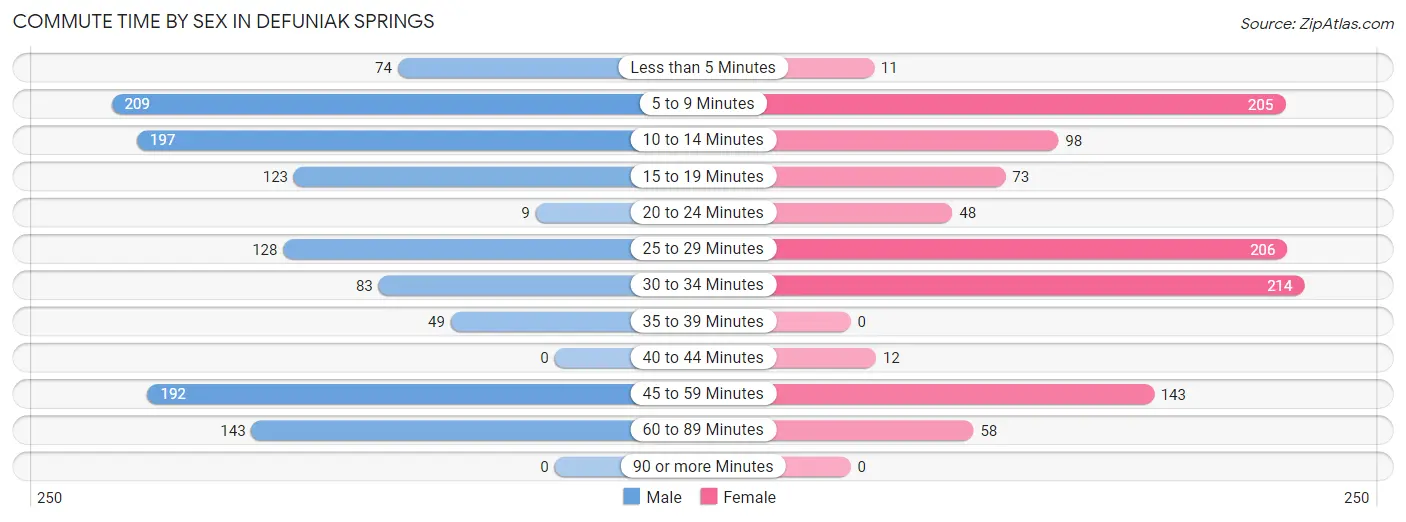
| Commute Time | Male | Female |
| Less than 5 Minutes | 74 (6.1%) | 11 (1.0%) |
| 5 to 9 Minutes | 209 (17.3%) | 205 (19.2%) |
| 10 to 14 Minutes | 197 (16.3%) | 98 (9.2%) |
| 15 to 19 Minutes | 123 (10.2%) | 73 (6.8%) |
| 20 to 24 Minutes | 9 (0.7%) | 48 (4.5%) |
| 25 to 29 Minutes | 128 (10.6%) | 206 (19.3%) |
| 30 to 34 Minutes | 83 (6.9%) | 214 (20.0%) |
| 35 to 39 Minutes | 49 (4.1%) | 0 (0.0%) |
| 40 to 44 Minutes | 0 (0.0%) | 12 (1.1%) |
| 45 to 59 Minutes | 192 (15.9%) | 143 (13.4%) |
| 60 to 89 Minutes | 143 (11.8%) | 58 (5.4%) |
| 90 or more Minutes | 0 (0.0%) | 0 (0.0%) |
Time of Departure to Work by Sex in Defuniak Springs
The most frequent times of departure to work in Defuniak Springs are 12:00 AM to 4:59 AM (198, 16.4%) for males and 7:30 AM to 7:59 AM (268, 25.1%) for females.
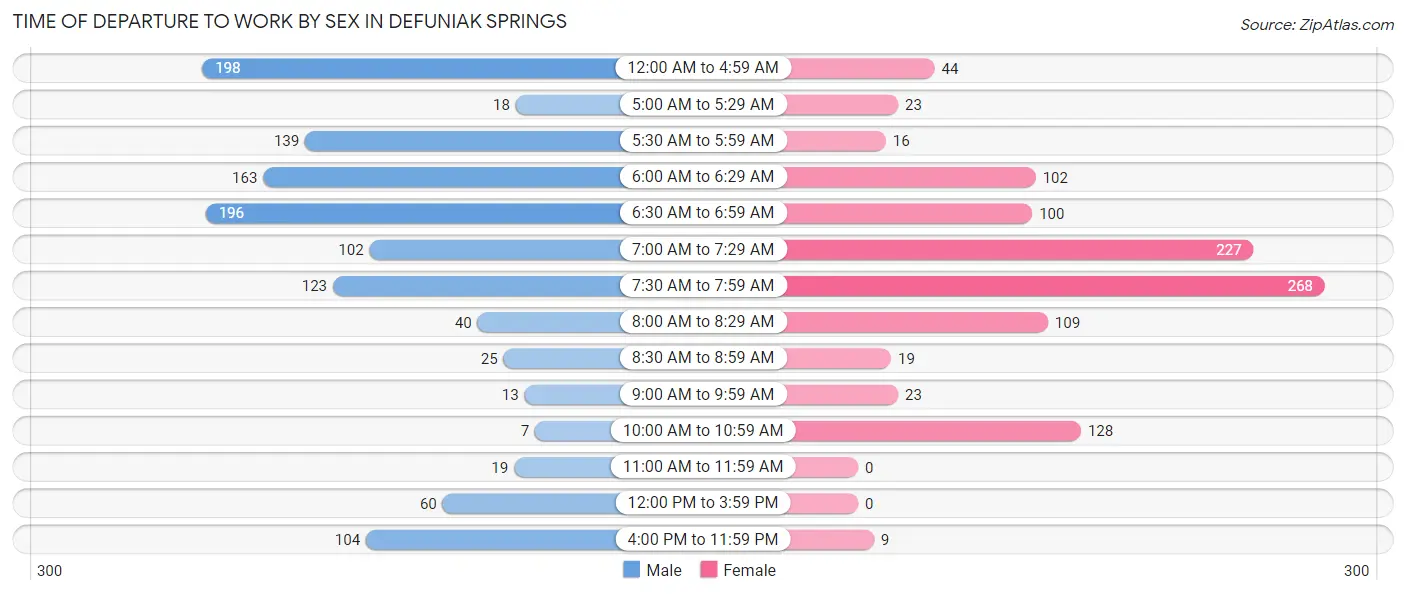
| Time of Departure | Male | Female |
| 12:00 AM to 4:59 AM | 198 (16.4%) | 44 (4.1%) |
| 5:00 AM to 5:29 AM | 18 (1.5%) | 23 (2.1%) |
| 5:30 AM to 5:59 AM | 139 (11.5%) | 16 (1.5%) |
| 6:00 AM to 6:29 AM | 163 (13.5%) | 102 (9.6%) |
| 6:30 AM to 6:59 AM | 196 (16.2%) | 100 (9.4%) |
| 7:00 AM to 7:29 AM | 102 (8.5%) | 227 (21.2%) |
| 7:30 AM to 7:59 AM | 123 (10.2%) | 268 (25.1%) |
| 8:00 AM to 8:29 AM | 40 (3.3%) | 109 (10.2%) |
| 8:30 AM to 8:59 AM | 25 (2.1%) | 19 (1.8%) |
| 9:00 AM to 9:59 AM | 13 (1.1%) | 23 (2.1%) |
| 10:00 AM to 10:59 AM | 7 (0.6%) | 128 (12.0%) |
| 11:00 AM to 11:59 AM | 19 (1.6%) | 0 (0.0%) |
| 12:00 PM to 3:59 PM | 60 (5.0%) | 0 (0.0%) |
| 4:00 PM to 11:59 PM | 104 (8.6%) | 9 (0.8%) |
| Total | 1,207 (100.0%) | 1,068 (100.0%) |
Housing Occupancy in Defuniak Springs
Occupancy by Ownership in Defuniak Springs
Of the total 2,394 dwellings in Defuniak Springs, owner-occupied units account for 1,536 (64.2%), while renter-occupied units make up 858 (35.8%).
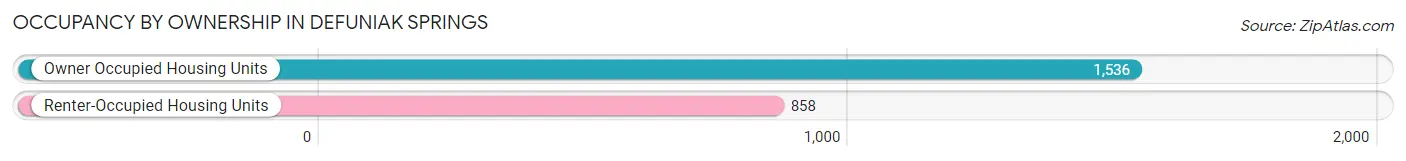
| Occupancy | # Housing Units | % Housing Units |
| Owner Occupied Housing Units | 1,536 | 64.2% |
| Renter-Occupied Housing Units | 858 | 35.8% |
| Total Occupied Housing Units | 2,394 | 100.0% |
Occupancy by Household Size in Defuniak Springs
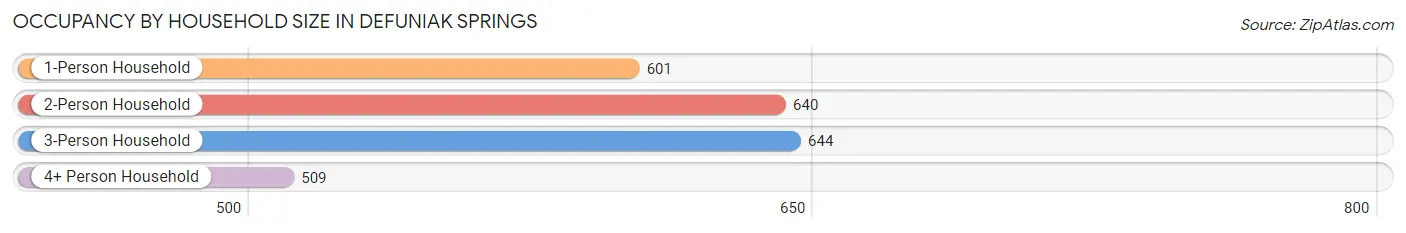
| Household Size | # Housing Units | % Housing Units |
| 1-Person Household | 601 | 25.1% |
| 2-Person Household | 640 | 26.7% |
| 3-Person Household | 644 | 26.9% |
| 4+ Person Household | 509 | 21.3% |
| Total Housing Units | 2,394 | 100.0% |
Occupancy by Ownership by Household Size in Defuniak Springs
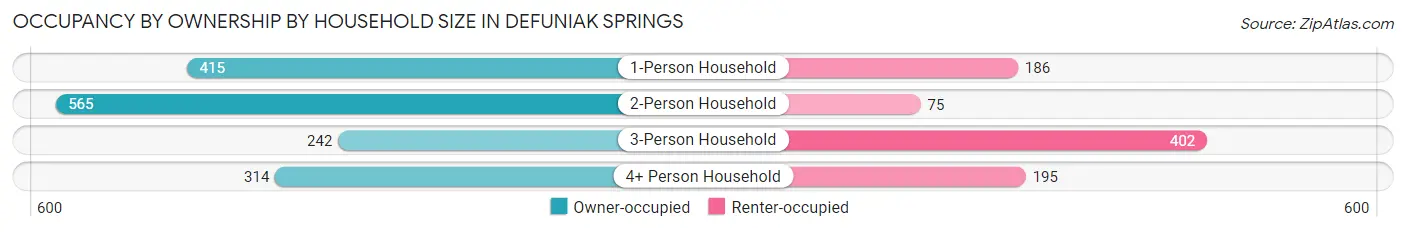
| Household Size | Owner-occupied | Renter-occupied |
| 1-Person Household | 415 (69.1%) | 186 (30.9%) |
| 2-Person Household | 565 (88.3%) | 75 (11.7%) |
| 3-Person Household | 242 (37.6%) | 402 (62.4%) |
| 4+ Person Household | 314 (61.7%) | 195 (38.3%) |
| Total Housing Units | 1,536 (64.2%) | 858 (35.8%) |
Occupancy by Educational Attainment in Defuniak Springs
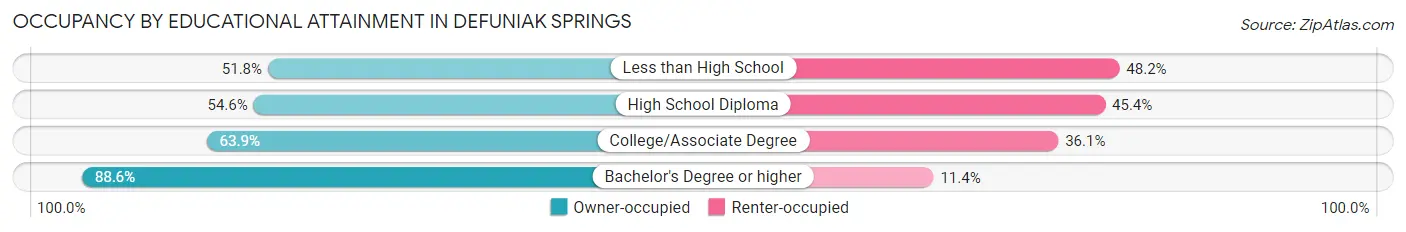
| Household Size | Owner-occupied | Renter-occupied |
| Less than High School | 117 (51.8%) | 109 (48.2%) |
| High School Diploma | 391 (54.6%) | 325 (45.4%) |
| College/Associate Degree | 669 (63.9%) | 378 (36.1%) |
| Bachelor's Degree or higher | 359 (88.6%) | 46 (11.4%) |
Occupancy by Age of Householder in Defuniak Springs
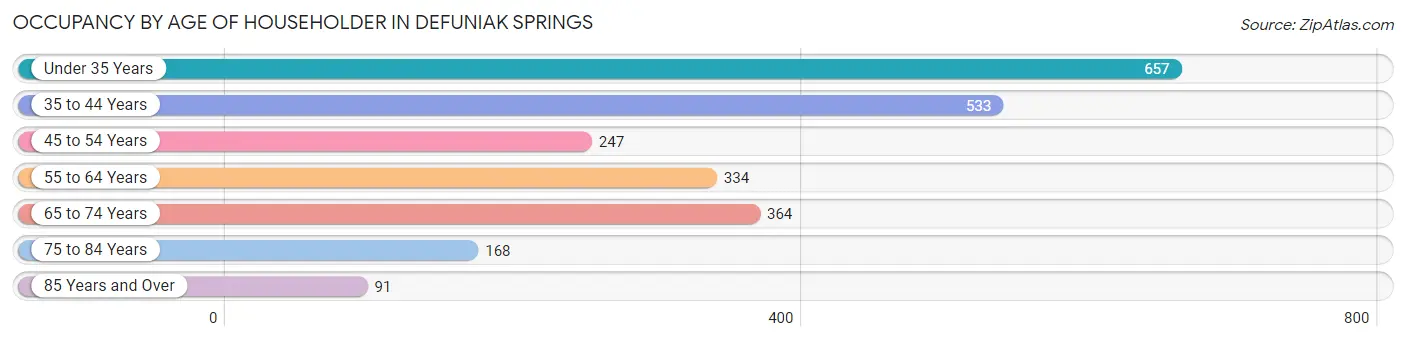
| Age Bracket | # Households | % Households |
| Under 35 Years | 657 | 27.4% |
| 35 to 44 Years | 533 | 22.3% |
| 45 to 54 Years | 247 | 10.3% |
| 55 to 64 Years | 334 | 14.0% |
| 65 to 74 Years | 364 | 15.2% |
| 75 to 84 Years | 168 | 7.0% |
| 85 Years and Over | 91 | 3.8% |
| Total | 2,394 | 100.0% |
Housing Finances in Defuniak Springs
Median Income by Occupancy in Defuniak Springs
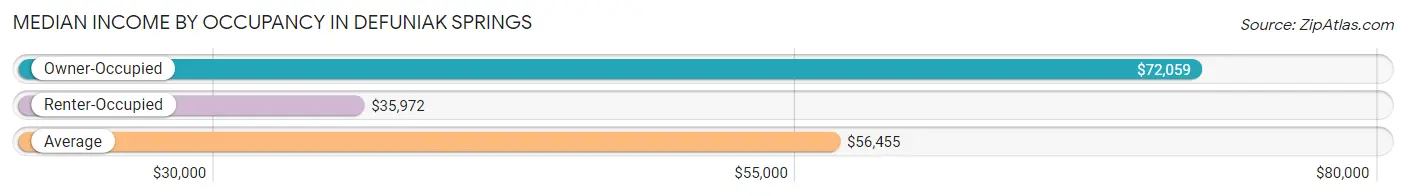
| Occupancy Type | # Households | Median Income |
| Owner-Occupied | 1,536 (64.2%) | $72,059 |
| Renter-Occupied | 858 (35.8%) | $35,972 |
| Average | 2,394 (100.0%) | $56,455 |
Occupancy by Householder Income Bracket in Defuniak Springs
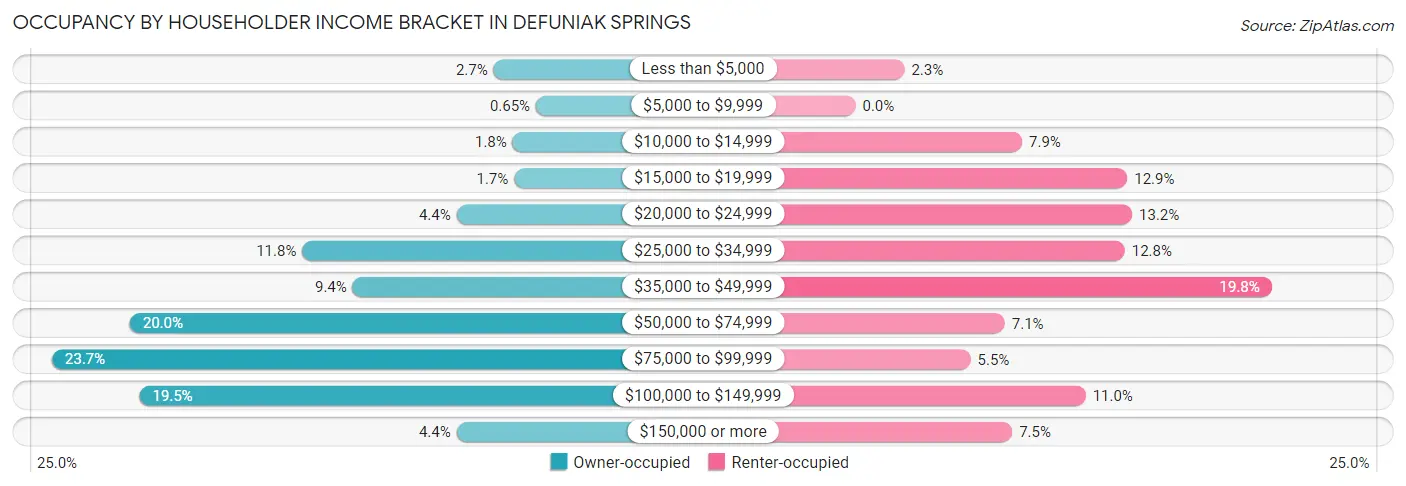
| Income Bracket | Owner-occupied | Renter-occupied |
| Less than $5,000 | 41 (2.7%) | 20 (2.3%) |
| $5,000 to $9,999 | 10 (0.6%) | 0 (0.0%) |
| $10,000 to $14,999 | 27 (1.8%) | 68 (7.9%) |
| $15,000 to $19,999 | 26 (1.7%) | 111 (12.9%) |
| $20,000 to $24,999 | 68 (4.4%) | 113 (13.2%) |
| $25,000 to $34,999 | 181 (11.8%) | 110 (12.8%) |
| $35,000 to $49,999 | 144 (9.4%) | 170 (19.8%) |
| $50,000 to $74,999 | 307 (20.0%) | 61 (7.1%) |
| $75,000 to $99,999 | 364 (23.7%) | 47 (5.5%) |
| $100,000 to $149,999 | 300 (19.5%) | 94 (11.0%) |
| $150,000 or more | 68 (4.4%) | 64 (7.5%) |
| Total | 1,536 (100.0%) | 858 (100.0%) |
Monthly Housing Cost Tiers in Defuniak Springs
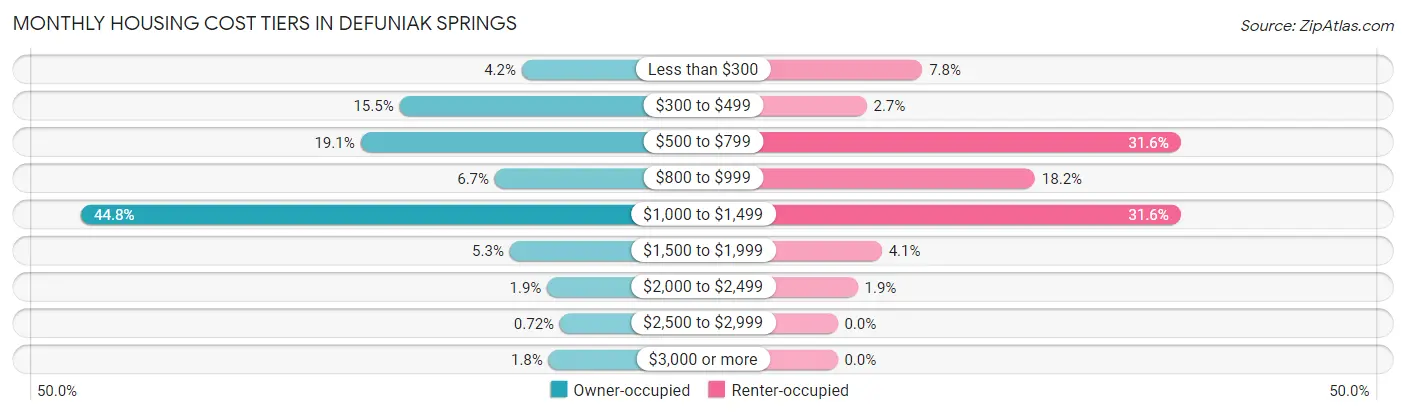
| Monthly Cost | Owner-occupied | Renter-occupied |
| Less than $300 | 65 (4.2%) | 67 (7.8%) |
| $300 to $499 | 238 (15.5%) | 23 (2.7%) |
| $500 to $799 | 293 (19.1%) | 271 (31.6%) |
| $800 to $999 | 103 (6.7%) | 156 (18.2%) |
| $1,000 to $1,499 | 688 (44.8%) | 271 (31.6%) |
| $1,500 to $1,999 | 82 (5.3%) | 35 (4.1%) |
| $2,000 to $2,499 | 29 (1.9%) | 16 (1.9%) |
| $2,500 to $2,999 | 11 (0.7%) | 0 (0.0%) |
| $3,000 or more | 27 (1.8%) | 0 (0.0%) |
| Total | 1,536 (100.0%) | 858 (100.0%) |
Physical Housing Characteristics in Defuniak Springs
Housing Structures in Defuniak Springs
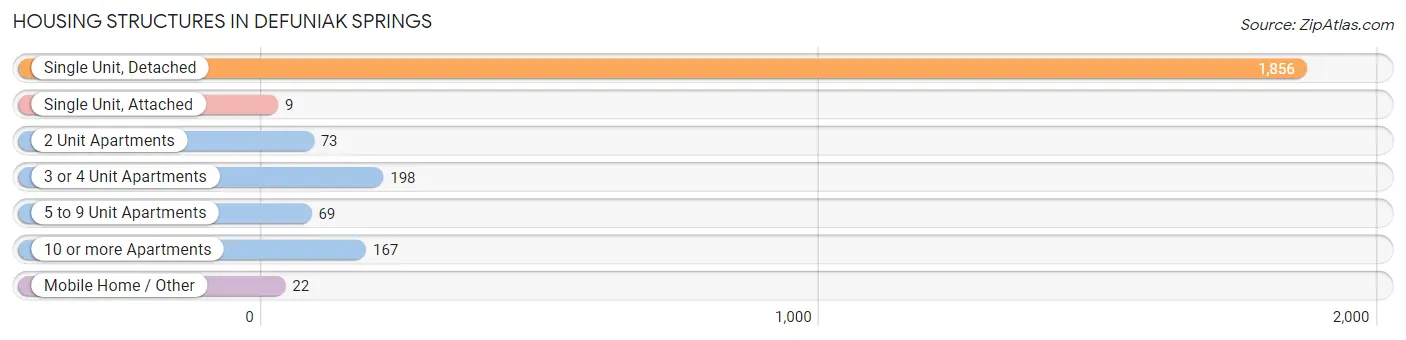
| Structure Type | # Housing Units | % Housing Units |
| Single Unit, Detached | 1,856 | 77.5% |
| Single Unit, Attached | 9 | 0.4% |
| 2 Unit Apartments | 73 | 3.0% |
| 3 or 4 Unit Apartments | 198 | 8.3% |
| 5 to 9 Unit Apartments | 69 | 2.9% |
| 10 or more Apartments | 167 | 7.0% |
| Mobile Home / Other | 22 | 0.9% |
| Total | 2,394 | 100.0% |
Housing Structures by Occupancy in Defuniak Springs
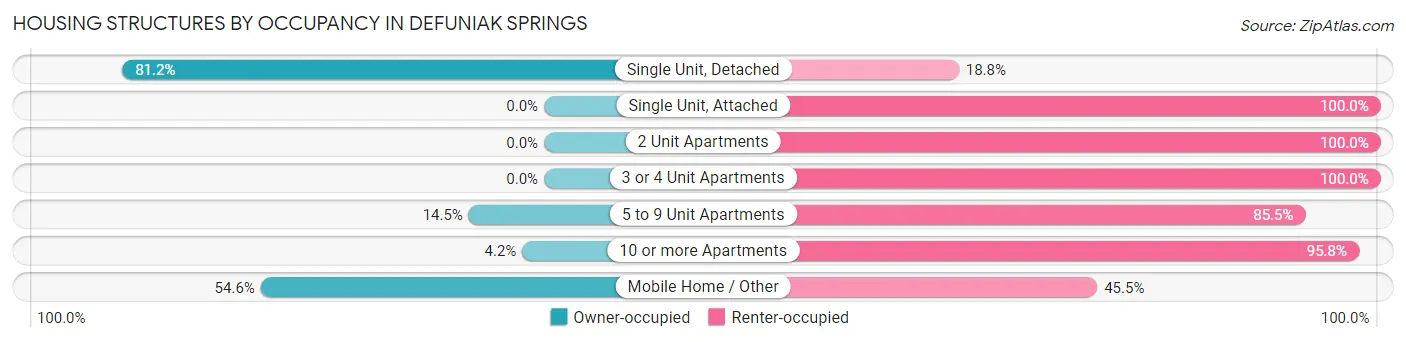
| Structure Type | Owner-occupied | Renter-occupied |
| Single Unit, Detached | 1,507 (81.2%) | 349 (18.8%) |
| Single Unit, Attached | 0 (0.0%) | 9 (100.0%) |
| 2 Unit Apartments | 0 (0.0%) | 73 (100.0%) |
| 3 or 4 Unit Apartments | 0 (0.0%) | 198 (100.0%) |
| 5 to 9 Unit Apartments | 10 (14.5%) | 59 (85.5%) |
| 10 or more Apartments | 7 (4.2%) | 160 (95.8%) |
| Mobile Home / Other | 12 (54.5%) | 10 (45.5%) |
| Total | 1,536 (64.2%) | 858 (35.8%) |
Housing Structures by Number of Rooms in Defuniak Springs
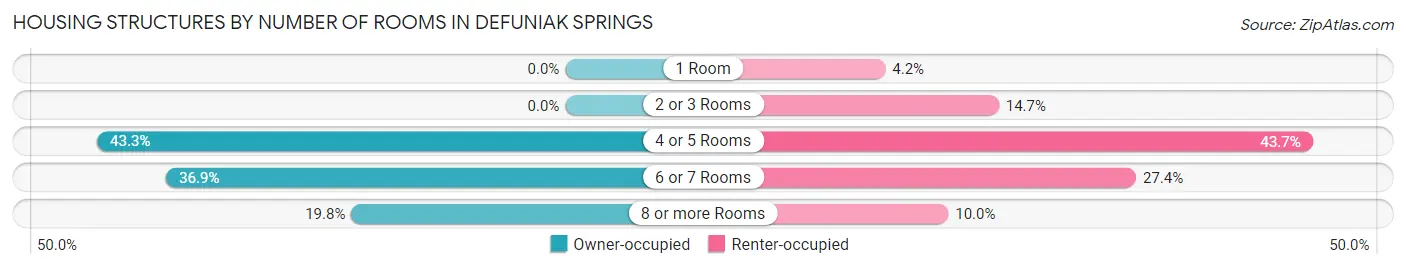
| Number of Rooms | Owner-occupied | Renter-occupied |
| 1 Room | 0 (0.0%) | 36 (4.2%) |
| 2 or 3 Rooms | 0 (0.0%) | 126 (14.7%) |
| 4 or 5 Rooms | 665 (43.3%) | 375 (43.7%) |
| 6 or 7 Rooms | 567 (36.9%) | 235 (27.4%) |
| 8 or more Rooms | 304 (19.8%) | 86 (10.0%) |
| Total | 1,536 (100.0%) | 858 (100.0%) |
Housing Structure by Heating Type in Defuniak Springs
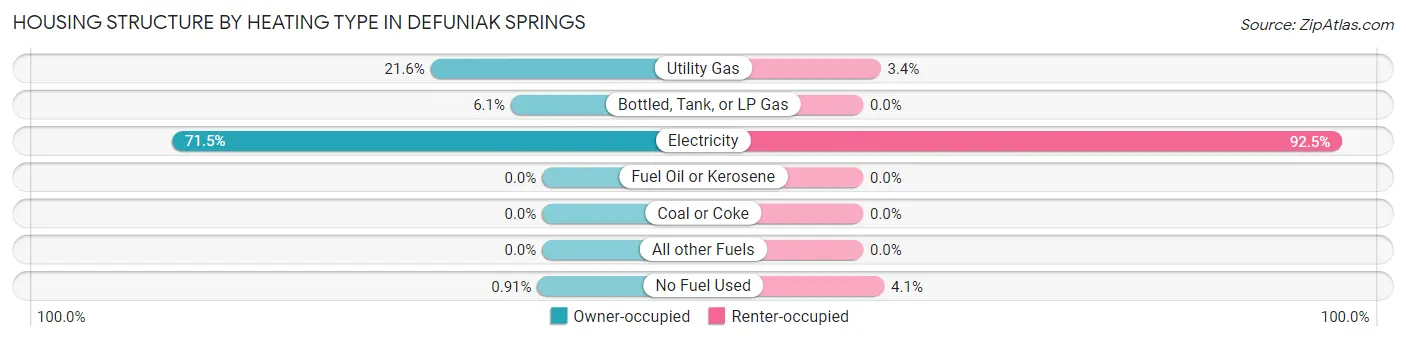
| Heating Type | Owner-occupied | Renter-occupied |
| Utility Gas | 331 (21.5%) | 29 (3.4%) |
| Bottled, Tank, or LP Gas | 93 (6.0%) | 0 (0.0%) |
| Electricity | 1,098 (71.5%) | 794 (92.5%) |
| Fuel Oil or Kerosene | 0 (0.0%) | 0 (0.0%) |
| Coal or Coke | 0 (0.0%) | 0 (0.0%) |
| All other Fuels | 0 (0.0%) | 0 (0.0%) |
| No Fuel Used | 14 (0.9%) | 35 (4.1%) |
| Total | 1,536 (100.0%) | 858 (100.0%) |
Household Vehicle Usage in Defuniak Springs
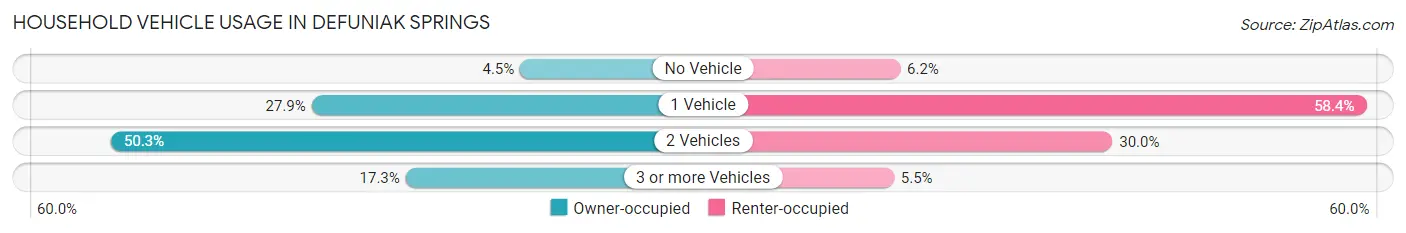
| Vehicles per Household | Owner-occupied | Renter-occupied |
| No Vehicle | 69 (4.5%) | 53 (6.2%) |
| 1 Vehicle | 428 (27.9%) | 501 (58.4%) |
| 2 Vehicles | 773 (50.3%) | 257 (29.9%) |
| 3 or more Vehicles | 266 (17.3%) | 47 (5.5%) |
| Total | 1,536 (100.0%) | 858 (100.0%) |
Real Estate & Mortgages in Defuniak Springs
Real Estate and Mortgage Overview in Defuniak Springs
| Characteristic | Without Mortgage | With Mortgage |
| Housing Units | 566 | 970 |
| Median Property Value | $140,200 | $164,400 |
| Median Household Income | $44,931 | $35 |
| Monthly Housing Costs | $482 | $27 |
| Real Estate Taxes | $369 | $195 |
Property Value by Mortgage Status in Defuniak Springs
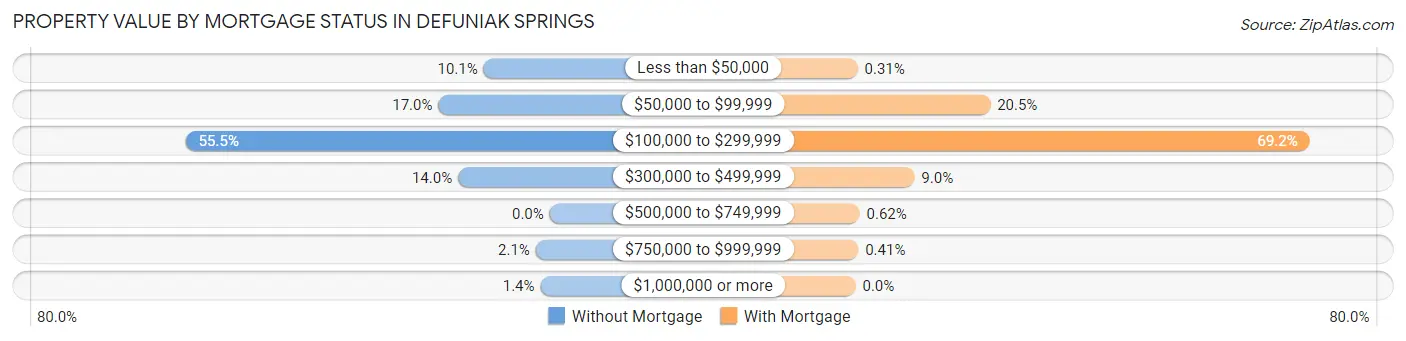
| Property Value | Without Mortgage | With Mortgage |
| Less than $50,000 | 57 (10.1%) | 3 (0.3%) |
| $50,000 to $99,999 | 96 (17.0%) | 199 (20.5%) |
| $100,000 to $299,999 | 314 (55.5%) | 671 (69.2%) |
| $300,000 to $499,999 | 79 (14.0%) | 87 (9.0%) |
| $500,000 to $749,999 | 0 (0.0%) | 6 (0.6%) |
| $750,000 to $999,999 | 12 (2.1%) | 4 (0.4%) |
| $1,000,000 or more | 8 (1.4%) | 0 (0.0%) |
| Total | 566 (100.0%) | 970 (100.0%) |
Household Income by Mortgage Status in Defuniak Springs
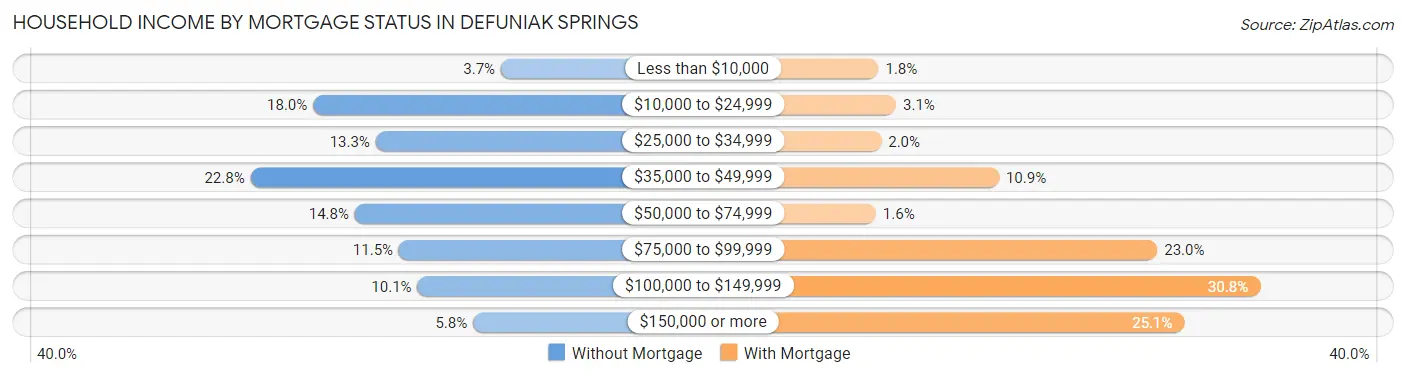
| Household Income | Without Mortgage | With Mortgage |
| Less than $10,000 | 21 (3.7%) | 17 (1.8%) |
| $10,000 to $24,999 | 102 (18.0%) | 30 (3.1%) |
| $25,000 to $34,999 | 75 (13.3%) | 19 (2.0%) |
| $35,000 to $49,999 | 129 (22.8%) | 106 (10.9%) |
| $50,000 to $74,999 | 84 (14.8%) | 15 (1.5%) |
| $75,000 to $99,999 | 65 (11.5%) | 223 (23.0%) |
| $100,000 to $149,999 | 57 (10.1%) | 299 (30.8%) |
| $150,000 or more | 33 (5.8%) | 243 (25.1%) |
| Total | 566 (100.0%) | 970 (100.0%) |
Property Value to Household Income Ratio in Defuniak Springs
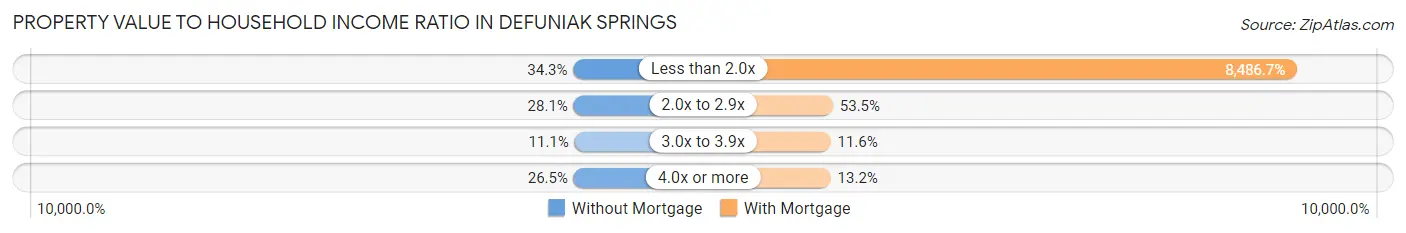
| Value-to-Income Ratio | Without Mortgage | With Mortgage |
| Less than 2.0x | 194 (34.3%) | 82,321 (8,486.7%) |
| 2.0x to 2.9x | 159 (28.1%) | 519 (53.5%) |
| 3.0x to 3.9x | 63 (11.1%) | 112 (11.6%) |
| 4.0x or more | 150 (26.5%) | 128 (13.2%) |
| Total | 566 (100.0%) | 970 (100.0%) |
Real Estate Taxes by Mortgage Status in Defuniak Springs
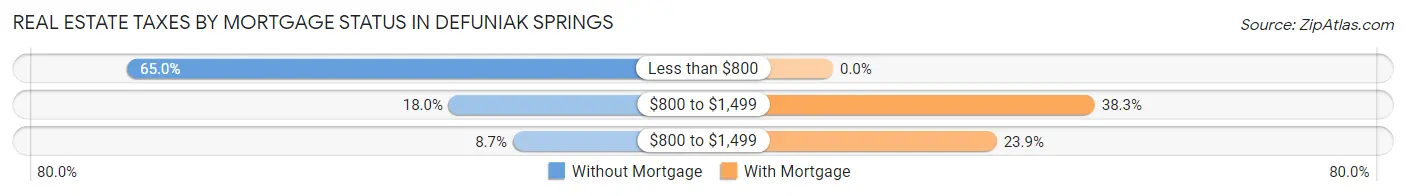
| Property Taxes | Without Mortgage | With Mortgage |
| Less than $800 | 368 (65.0%) | 0 (0.0%) |
| $800 to $1,499 | 102 (18.0%) | 371 (38.3%) |
| $800 to $1,499 | 49 (8.7%) | 232 (23.9%) |
| Total | 566 (100.0%) | 970 (100.0%) |
Health & Disability in Defuniak Springs
Health Insurance Coverage by Age in Defuniak Springs
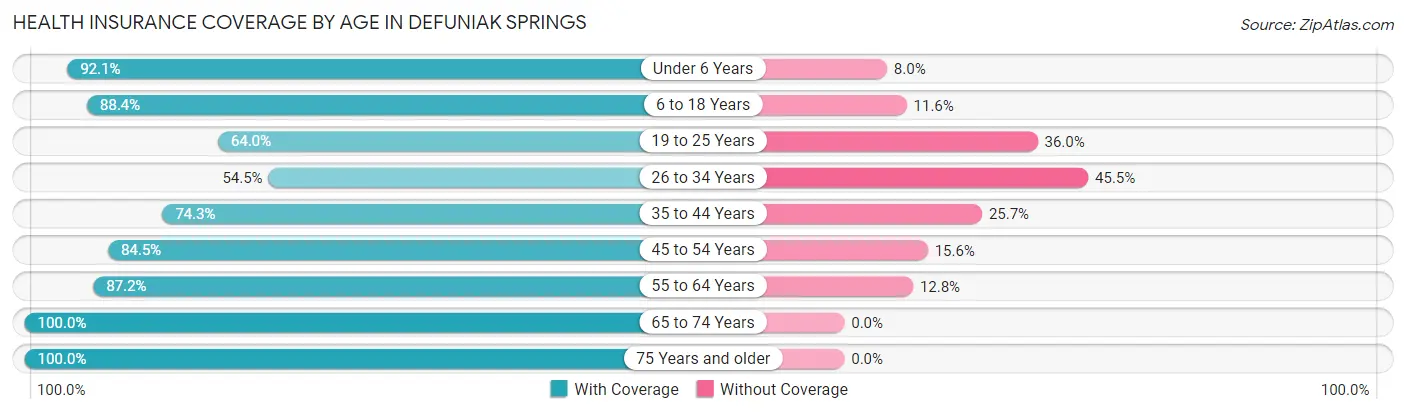
| Age Bracket | With Coverage | Without Coverage |
| Under 6 Years | 463 (92.0%) | 40 (8.0%) |
| 6 to 18 Years | 753 (88.4%) | 99 (11.6%) |
| 19 to 25 Years | 362 (64.0%) | 204 (36.0%) |
| 26 to 34 Years | 728 (54.5%) | 607 (45.5%) |
| 35 to 44 Years | 640 (74.3%) | 221 (25.7%) |
| 45 to 54 Years | 402 (84.5%) | 74 (15.5%) |
| 55 to 64 Years | 368 (87.2%) | 54 (12.8%) |
| 65 to 74 Years | 483 (100.0%) | 0 (0.0%) |
| 75 Years and older | 343 (100.0%) | 0 (0.0%) |
| Total | 4,542 (77.8%) | 1,299 (22.2%) |
Health Insurance Coverage by Citizenship Status in Defuniak Springs
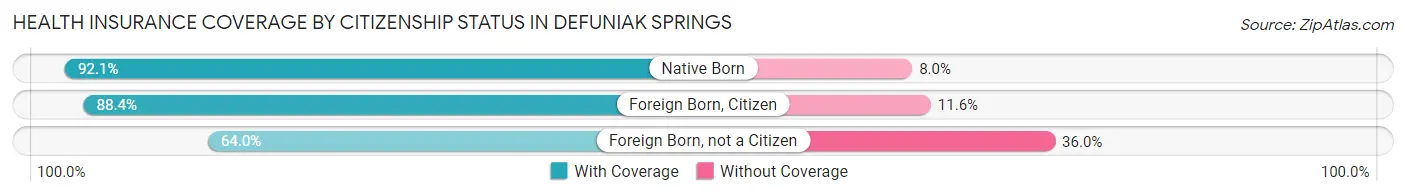
| Citizenship Status | With Coverage | Without Coverage |
| Native Born | 463 (92.0%) | 40 (8.0%) |
| Foreign Born, Citizen | 753 (88.4%) | 99 (11.6%) |
| Foreign Born, not a Citizen | 362 (64.0%) | 204 (36.0%) |
Health Insurance Coverage by Household Income in Defuniak Springs
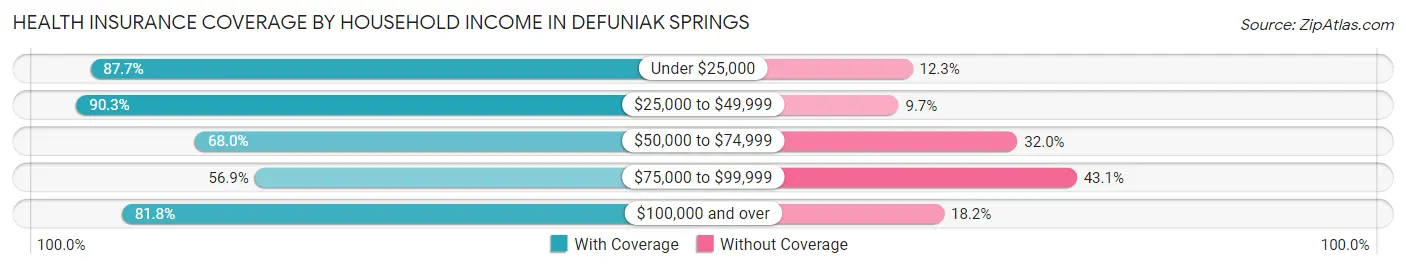
| Household Income | With Coverage | Without Coverage |
| Under $25,000 | 805 (87.7%) | 113 (12.3%) |
| $25,000 to $49,999 | 1,090 (90.3%) | 117 (9.7%) |
| $50,000 to $74,999 | 675 (68.0%) | 317 (32.0%) |
| $75,000 to $99,999 | 584 (56.9%) | 442 (43.1%) |
| $100,000 and over | 1,382 (81.8%) | 308 (18.2%) |
Public vs Private Health Insurance Coverage by Age in Defuniak Springs
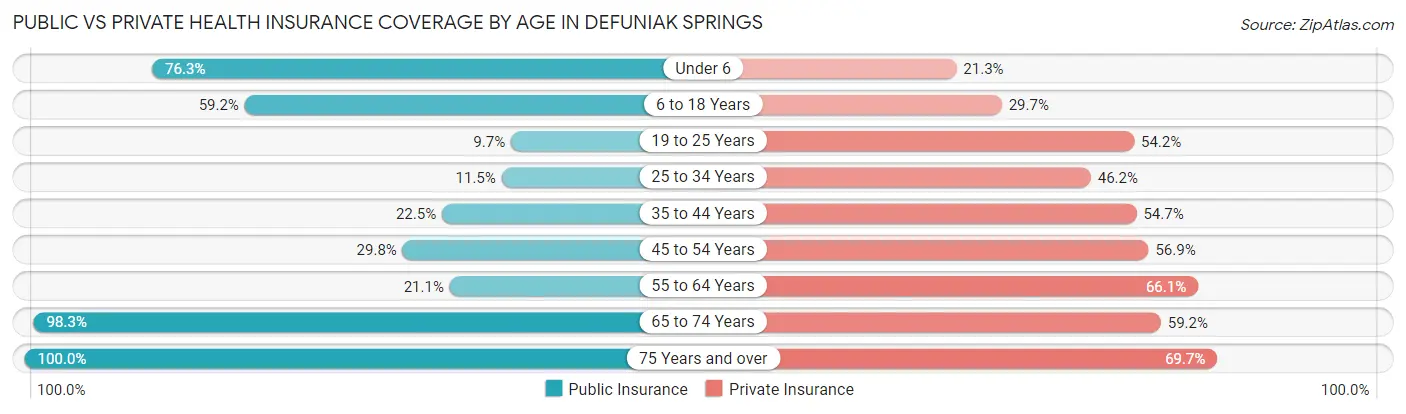
| Age Bracket | Public Insurance | Private Insurance |
| Under 6 | 384 (76.3%) | 107 (21.3%) |
| 6 to 18 Years | 504 (59.2%) | 253 (29.7%) |
| 19 to 25 Years | 55 (9.7%) | 307 (54.2%) |
| 25 to 34 Years | 153 (11.5%) | 617 (46.2%) |
| 35 to 44 Years | 194 (22.5%) | 471 (54.7%) |
| 45 to 54 Years | 142 (29.8%) | 271 (56.9%) |
| 55 to 64 Years | 89 (21.1%) | 279 (66.1%) |
| 65 to 74 Years | 475 (98.3%) | 286 (59.2%) |
| 75 Years and over | 343 (100.0%) | 239 (69.7%) |
| Total | 2,339 (40.0%) | 2,830 (48.4%) |
Disability Status by Sex by Age in Defuniak Springs
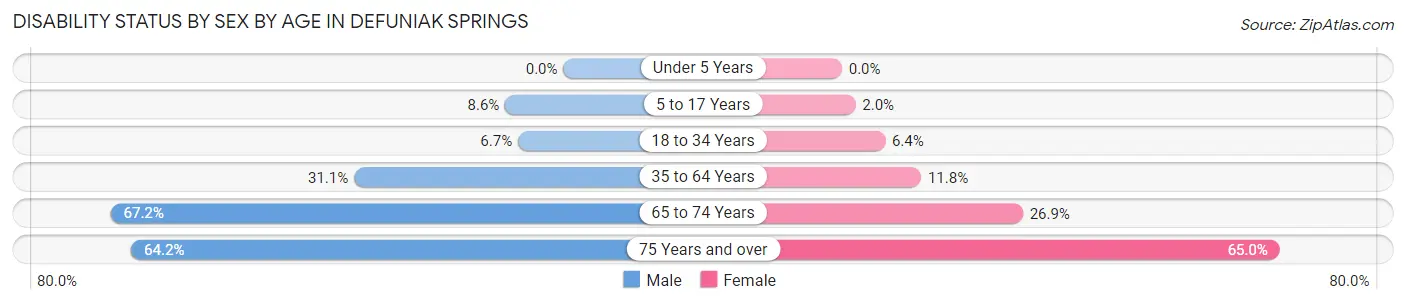
| Age Bracket | Male | Female |
| Under 5 Years | 0 (0.0%) | 0 (0.0%) |
| 5 to 17 Years | 28 (8.6%) | 11 (2.0%) |
| 18 to 34 Years | 78 (6.7%) | 50 (6.4%) |
| 35 to 64 Years | 211 (31.1%) | 127 (11.8%) |
| 65 to 74 Years | 162 (67.2%) | 65 (26.9%) |
| 75 Years and over | 77 (64.2%) | 145 (65.0%) |
Disability Class by Sex by Age in Defuniak Springs
Disability Class: Hearing Difficulty
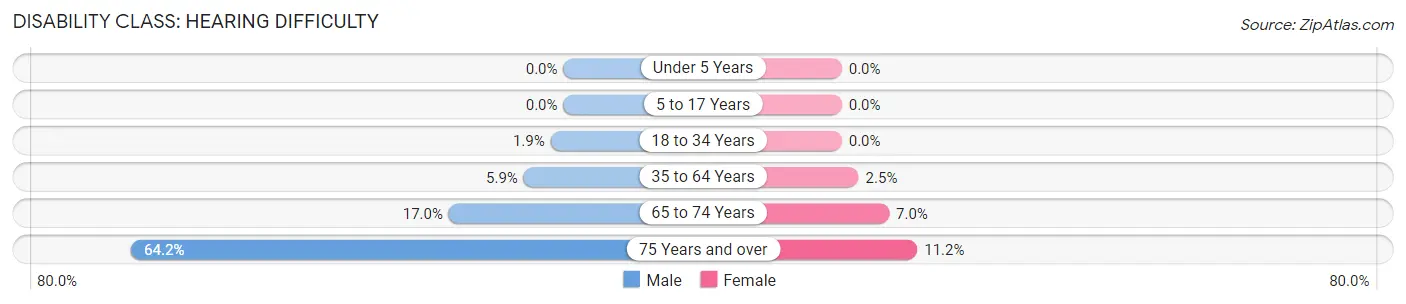
| Age Bracket | Male | Female |
| Under 5 Years | 0 (0.0%) | 0 (0.0%) |
| 5 to 17 Years | 0 (0.0%) | 0 (0.0%) |
| 18 to 34 Years | 22 (1.9%) | 0 (0.0%) |
| 35 to 64 Years | 40 (5.9%) | 27 (2.5%) |
| 65 to 74 Years | 41 (17.0%) | 17 (7.0%) |
| 75 Years and over | 77 (64.2%) | 25 (11.2%) |
Disability Class: Vision Difficulty
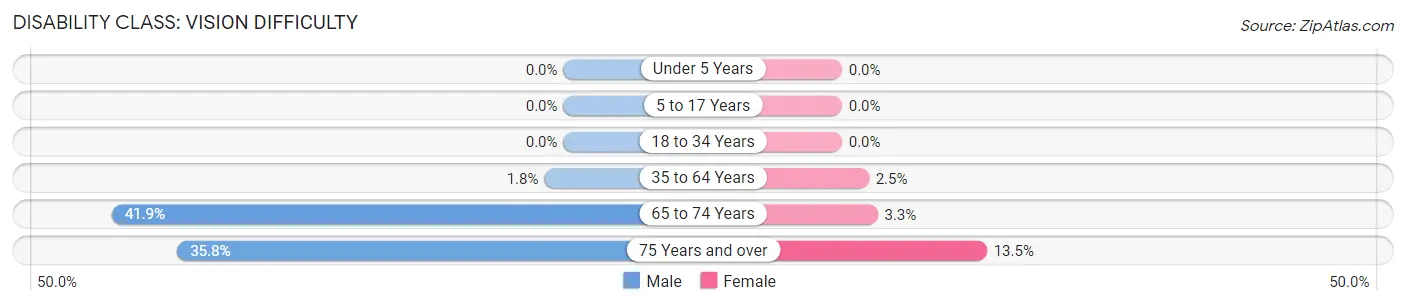
| Age Bracket | Male | Female |
| Under 5 Years | 0 (0.0%) | 0 (0.0%) |
| 5 to 17 Years | 0 (0.0%) | 0 (0.0%) |
| 18 to 34 Years | 0 (0.0%) | 0 (0.0%) |
| 35 to 64 Years | 12 (1.8%) | 27 (2.5%) |
| 65 to 74 Years | 101 (41.9%) | 8 (3.3%) |
| 75 Years and over | 43 (35.8%) | 30 (13.5%) |
Disability Class: Cognitive Difficulty
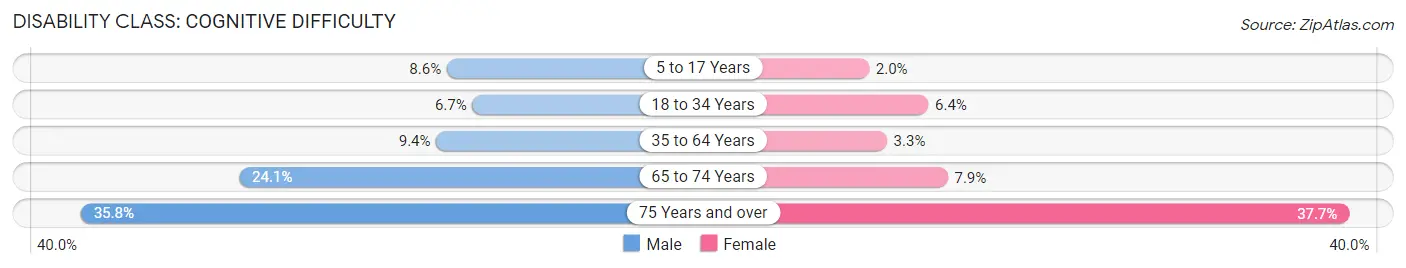
| Age Bracket | Male | Female |
| 5 to 17 Years | 28 (8.6%) | 11 (2.0%) |
| 18 to 34 Years | 78 (6.7%) | 50 (6.4%) |
| 35 to 64 Years | 64 (9.4%) | 36 (3.3%) |
| 65 to 74 Years | 58 (24.1%) | 19 (7.9%) |
| 75 Years and over | 43 (35.8%) | 84 (37.7%) |
Disability Class: Ambulatory Difficulty
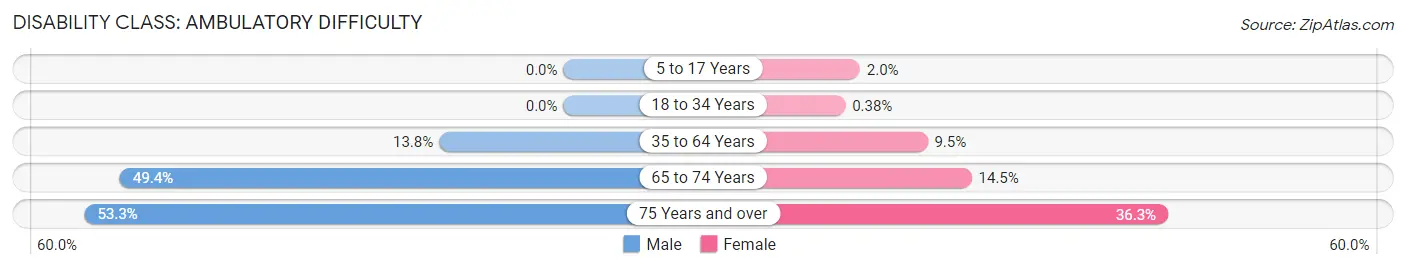
| Age Bracket | Male | Female |
| 5 to 17 Years | 0 (0.0%) | 11 (2.0%) |
| 18 to 34 Years | 0 (0.0%) | 3 (0.4%) |
| 35 to 64 Years | 94 (13.8%) | 103 (9.5%) |
| 65 to 74 Years | 119 (49.4%) | 35 (14.5%) |
| 75 Years and over | 64 (53.3%) | 81 (36.3%) |
Disability Class: Self-Care Difficulty
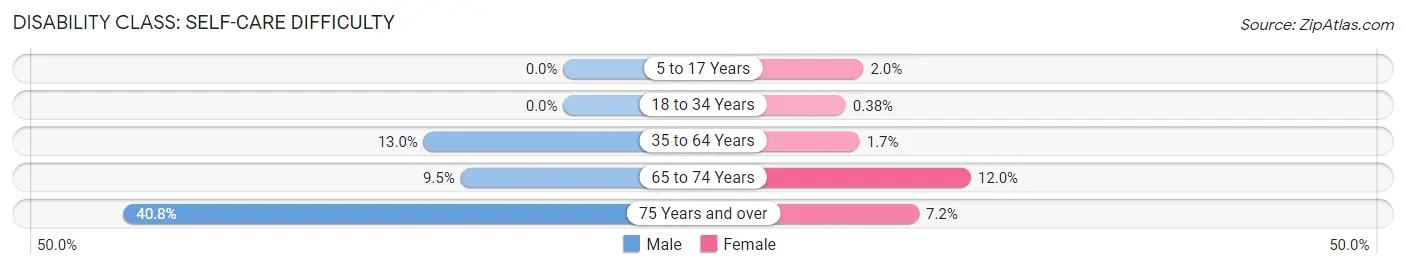
| Age Bracket | Male | Female |
| 5 to 17 Years | 0 (0.0%) | 11 (2.0%) |
| 18 to 34 Years | 0 (0.0%) | 3 (0.4%) |
| 35 to 64 Years | 88 (13.0%) | 18 (1.7%) |
| 65 to 74 Years | 23 (9.5%) | 29 (12.0%) |
| 75 Years and over | 49 (40.8%) | 16 (7.2%) |
Technology Access in Defuniak Springs
Computing Device Access in Defuniak Springs
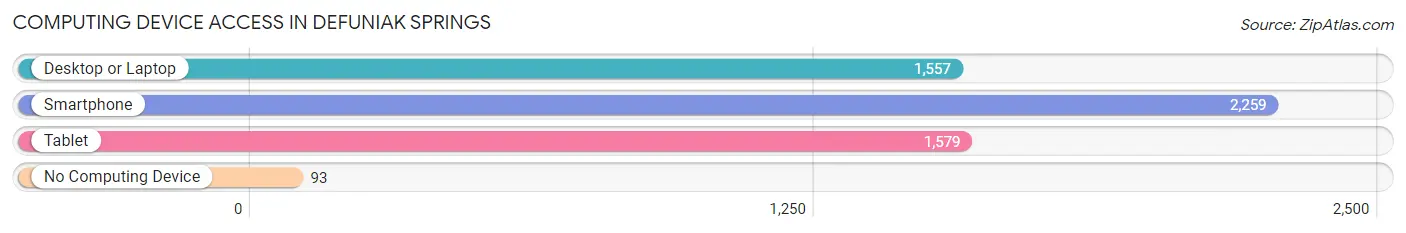
| Device Type | # Households | % Households |
| Desktop or Laptop | 1,557 | 65.0% |
| Smartphone | 2,259 | 94.4% |
| Tablet | 1,579 | 66.0% |
| No Computing Device | 93 | 3.9% |
| Total | 2,394 | 100.0% |
Internet Access in Defuniak Springs
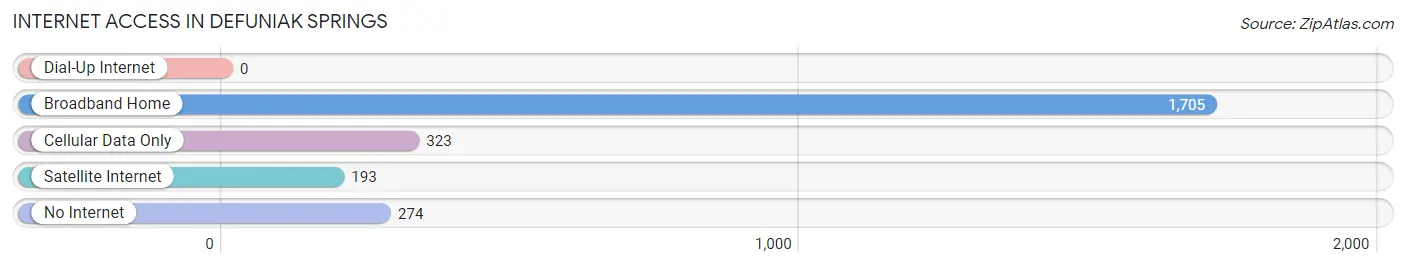
| Internet Type | # Households | % Households |
| Dial-Up Internet | 0 | 0.0% |
| Broadband Home | 1,705 | 71.2% |
| Cellular Data Only | 323 | 13.5% |
| Satellite Internet | 193 | 8.1% |
| No Internet | 274 | 11.5% |
| Total | 2,394 | 100.0% |
Defuniak Springs Summary
Funiak Springs is a city located in Walton County, Florida, United States. It is the county seat of Walton County and is located in the Florida Panhandle. The population was 5,089 at the 2010 census. It is the principal city of the Defuniak Springs Micropolitan Statistical Area, which includes all of Walton County.
History
The area that is now Defuniak Springs was first settled in the early 1800s by settlers from the Carolinas and Georgia. The town was originally known as "Spring Hill" due to the numerous natural springs in the area. In 1887, the town was renamed Defuniak Springs after a local creek. The town was officially incorporated in 1889.
In the early 1900s, Defuniak Springs was a popular tourist destination due to its natural springs and mineral baths. The town was also known for its large hotel, the Chautauqua Hotel, which was built in 1887 and was a popular destination for visitors from all over the country.
In the 1920s, the town began to decline as a tourist destination due to the Great Depression and the rise of automobile travel. The Chautauqua Hotel was eventually demolished in the 1950s.
Geography
Defuniak Springs is located in the Florida Panhandle at 30°42'N 86°7'W (30.7, -86.12). The city is situated on the western shore of Lake Defuniak, a natural freshwater lake. The city is located approximately 20 miles (32 km) north of the Gulf of Mexico.
The city has a total area of 5.2 square miles (13.4 km2), of which 5.1 square miles (13.2 km2) is land and 0.1 square miles (0.2 km2) (1.56%) is water.
Economy
The economy of Defuniak Springs is largely based on tourism and agriculture. The city is home to several tourist attractions, including the Chautauqua Winery, the Walton County Historical Museum, and the Defuniak Springs Historic District.
Agriculture is also an important part of the local economy. The area is home to several farms, including dairy farms, vegetable farms, and citrus groves.
Demographics
As of the 2010 census, there were 5,089 people, 2,072 households, and 1,323 families residing in the city. The population density was 990.3 people per square mile (382.2/km2). There were 2,521 housing units at an average density of 489.3 per square mile (189.2/km2). The racial makeup of the city was 79.2% White, 15.3% African American, 0.5% Native American, 0.7% Asian, 0.1% Pacific Islander, 2.3% from other races, and 2.0% from two or more races. Hispanic or Latino of any race were 5.3% of the population.
There were 2,072 households, out of which 24.7% had children under the age of 18 living with them, 43.2% were married couples living together, 15.2% had a female householder with no husband present, and 36.7% were non-families. 32.2% of all households were made up of individuals, and 14.2% had someone living alone who was 65 years of age or older. The average household size was 2.30 and the average family size was 2.90.
In the city, the population was spread out, with 22.2% under the age of 18, 8.2% from 18 to 24, 24.2% from 25 to 44, 24.3% from 45 to 64, and 21.1% who were 65 years of age or older. The median age was 41 years. For every 100 females, there were 87.2 males. For every 100 females age 18 and over, there were 83.2 males.
The median income for a household in the city was $30,938, and the median income for a family was $37,813. Males had a median income of $30,000 versus $20,972 for females. The per capita income for the city was $17,845. About 13.2% of families and 17.2% of the population were below the poverty line, including 24.2% of those under age 18 and 11.2% of those age 65 or over.
Common Questions
What is Per Capita Income in Defuniak Springs?
Per Capita income in Defuniak Springs is $27,193.
What is the Median Family Income in Defuniak Springs?
Median Family Income in Defuniak Springs is $68,920.
What is the Median Household income in Defuniak Springs?
Median Household Income in Defuniak Springs is $56,455.
What is Income or Wage Gap in Defuniak Springs?
Income or Wage Gap in Defuniak Springs is 12.4%.
Women in Defuniak Springs earn 87.6 cents for every dollar earned by a man.
What is Family Income Deficit in Defuniak Springs?
Family Income Deficit in Defuniak Springs is $10,124.
Families that are below poverty line in Defuniak Springs earn $10,124 less on average than the poverty threshold level.
What is Inequality or Gini Index in Defuniak Springs?
Inequality or Gini Index in Defuniak Springs is 0.40.
What is the Total Population of Defuniak Springs?
Total Population of Defuniak Springs is 6,072.
What is the Total Male Population of Defuniak Springs?
Total Male Population of Defuniak Springs is 2,778.
What is the Total Female Population of Defuniak Springs?
Total Female Population of Defuniak Springs is 3,294.
What is the Ratio of Males per 100 Females in Defuniak Springs?
There are 84.34 Males per 100 Females in Defuniak Springs.
What is the Ratio of Females per 100 Males in Defuniak Springs?
There are 118.57 Females per 100 Males in Defuniak Springs.
What is the Median Population Age in Defuniak Springs?
Median Population Age in Defuniak Springs is 34.3 Years.
What is the Average Family Size in Defuniak Springs
Average Family Size in Defuniak Springs is 3.0 People.
What is the Average Household Size in Defuniak Springs
Average Household Size in Defuniak Springs is 2.5 People.
How Large is the Labor Force in Defuniak Springs?
There are 3,081 People in the Labor Forcein in Defuniak Springs.
What is the Percentage of People in the Labor Force in Defuniak Springs?
62.5% of People are in the Labor Force in Defuniak Springs.
What is the Unemployment Rate in Defuniak Springs?
Unemployment Rate in Defuniak Springs is 14.4%.