Clewiston, FL Map & Demographics
Clewiston Map
Clewiston Overview
$26,751
PER CAPITA INCOME
$47,473
AVG FAMILY INCOME
$50,538
AVG HOUSEHOLD INCOME
21.3%
WAGE / INCOME GAP [ % ]
78.7¢/ $1
WAGE / INCOME GAP [ $ ]
0.44
INEQUALITY / GINI INDEX
7,252
TOTAL POPULATION
3,880
MALE POPULATION
3,372
FEMALE POPULATION
115.07
MALES / 100 FEMALES
86.91
FEMALES / 100 MALES
35.8
MEDIAN AGE
3.0
AVG FAMILY SIZE
2.7
AVG HOUSEHOLD SIZE
3,769
LABOR FORCE [ PEOPLE ]
64.4%
PERCENT IN LABOR FORCE
4.4%
UNEMPLOYMENT RATE
Clewiston Zip Codes
Clewiston Area Codes
Income in Clewiston
Income Overview in Clewiston
Per Capita Income in Clewiston is $26,751, while median incomes of families and households are $47,473 and $50,538 respectively.
| Characteristic | Number | Measure |
| Per Capita Income | 7,252 | $26,751 |
| Median Family Income | 1,979 | $47,473 |
| Mean Family Income | 1,979 | $73,058 |
| Median Household Income | 2,641 | $50,538 |
| Mean Household Income | 2,641 | $71,531 |
| Income Deficit | 1,979 | $0 |
| Wage / Income Gap (%) | 7,252 | 21.30% |
| Wage / Income Gap ($) | 7,252 | 78.70¢ per $1 |
| Gini / Inequality Index | 7,252 | 0.44 |
Earnings by Sex in Clewiston
Average Earnings in Clewiston are $29,618, $31,755 for men and $24,992 for women, a difference of 21.3%.
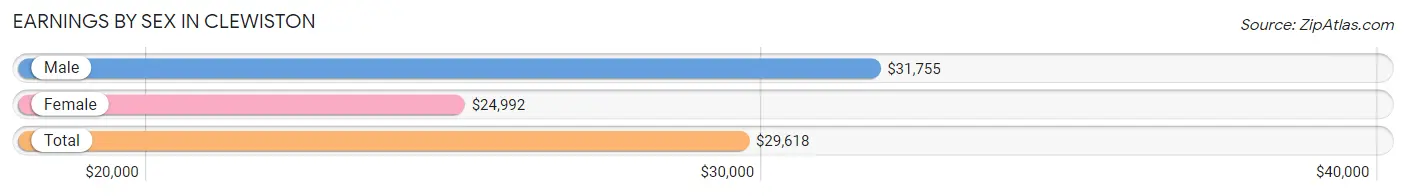
| Sex | Number | Average Earnings |
| Male | 2,373 (59.7%) | $31,755 |
| Female | 1,600 (40.3%) | $24,992 |
| Total | 3,973 (100.0%) | $29,618 |
Earnings by Sex by Income Bracket in Clewiston
The most common earnings brackets in Clewiston are $25,000 to $29,999 for men (484 | 20.4%) and $22,500 to $24,999 for women (314 | 19.6%).
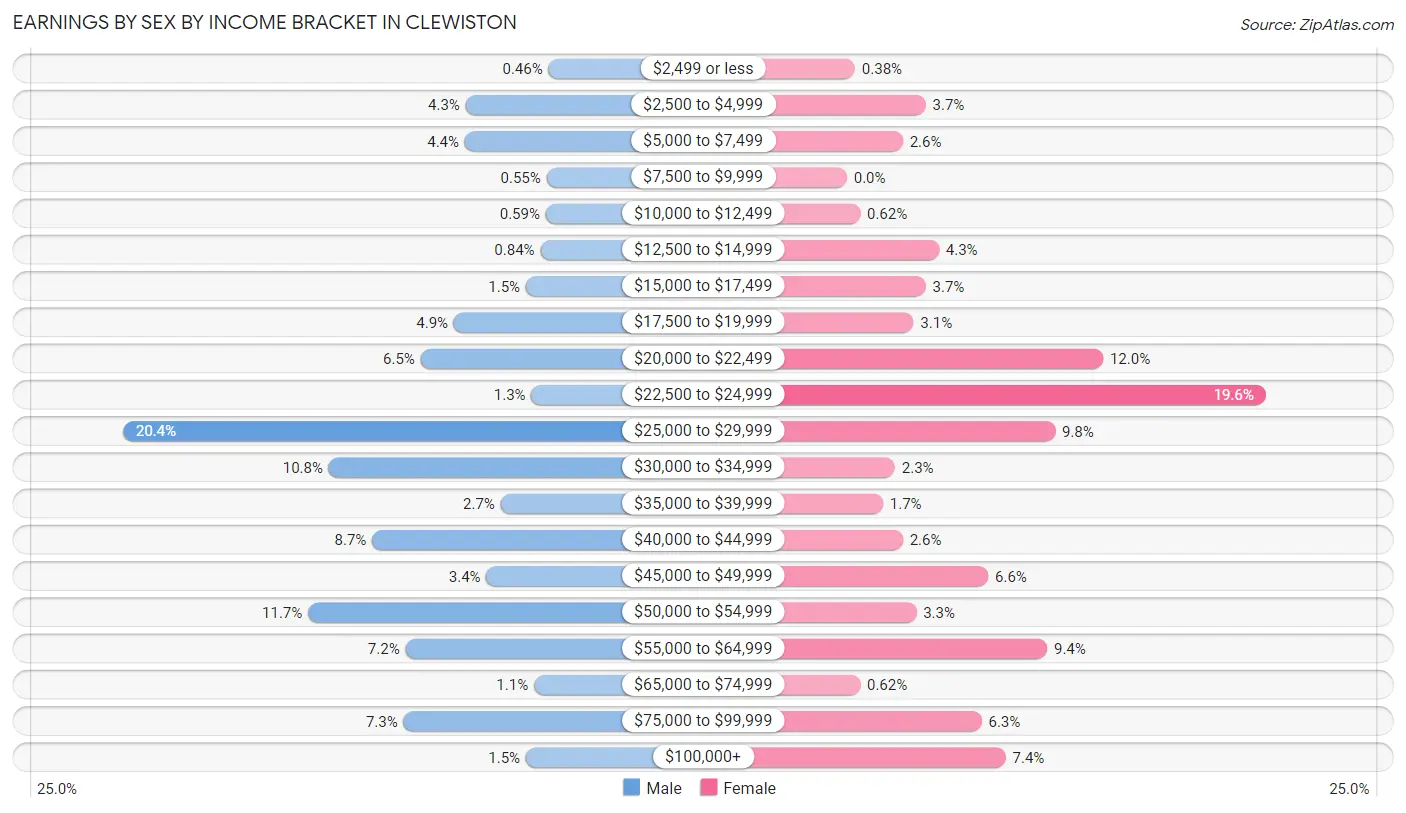
| Income | Male | Female |
| $2,499 or less | 11 (0.5%) | 6 (0.4%) |
| $2,500 to $4,999 | 103 (4.3%) | 59 (3.7%) |
| $5,000 to $7,499 | 104 (4.4%) | 42 (2.6%) |
| $7,500 to $9,999 | 13 (0.5%) | 0 (0.0%) |
| $10,000 to $12,499 | 14 (0.6%) | 10 (0.6%) |
| $12,500 to $14,999 | 20 (0.8%) | 69 (4.3%) |
| $15,000 to $17,499 | 36 (1.5%) | 59 (3.7%) |
| $17,500 to $19,999 | 116 (4.9%) | 50 (3.1%) |
| $20,000 to $22,499 | 153 (6.5%) | 192 (12.0%) |
| $22,500 to $24,999 | 30 (1.3%) | 314 (19.6%) |
| $25,000 to $29,999 | 484 (20.4%) | 156 (9.8%) |
| $30,000 to $34,999 | 255 (10.7%) | 36 (2.2%) |
| $35,000 to $39,999 | 64 (2.7%) | 27 (1.7%) |
| $40,000 to $44,999 | 207 (8.7%) | 42 (2.6%) |
| $45,000 to $49,999 | 80 (3.4%) | 106 (6.6%) |
| $50,000 to $54,999 | 278 (11.7%) | 52 (3.3%) |
| $55,000 to $64,999 | 170 (7.2%) | 150 (9.4%) |
| $65,000 to $74,999 | 27 (1.1%) | 10 (0.6%) |
| $75,000 to $99,999 | 172 (7.2%) | 101 (6.3%) |
| $100,000+ | 36 (1.5%) | 119 (7.4%) |
| Total | 2,373 (100.0%) | 1,600 (100.0%) |
Earnings by Sex by Educational Attainment in Clewiston
Average earnings in Clewiston are $31,798 for men and $28,611 for women, a difference of 10.0%. Men with an educational attainment of bachelor's degree enjoy the highest average annual earnings of $75,098, while those with less than high school education earn the least with $29,509. Women with an educational attainment of graduate degree earn the most with the average annual earnings of $88,198, while those with high school diploma education have the smallest earnings of $22,306.
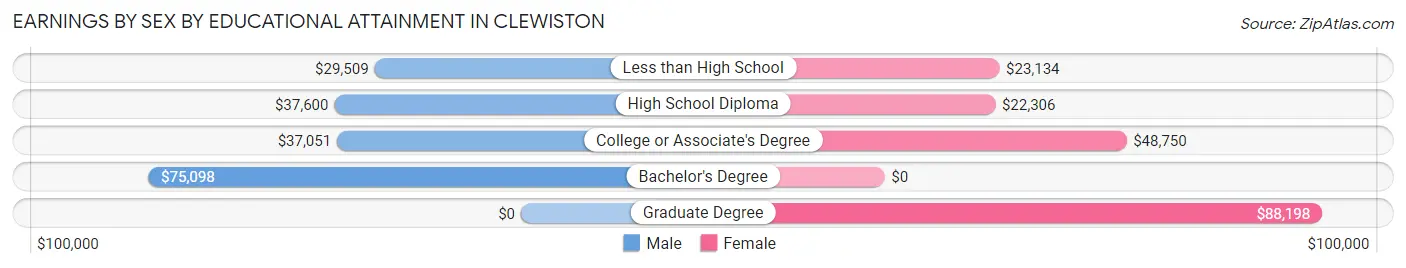
| Educational Attainment | Male Income | Female Income |
| Less than High School | $29,509 | $23,134 |
| High School Diploma | $37,600 | $22,306 |
| College or Associate's Degree | $37,051 | $48,750 |
| Bachelor's Degree | $75,098 | $0 |
| Graduate Degree | - | - |
| Total | $31,798 | $28,611 |
Family Income in Clewiston
Family Income Brackets in Clewiston
According to the Clewiston family income data, there are 297 families falling into the $100,000 to $149,999 income range, which is the most common income bracket and makes up 15.0% of all families. Conversely, the $200,000+ income bracket is the least frequent group with only 69 families (3.5%) belonging to this category.
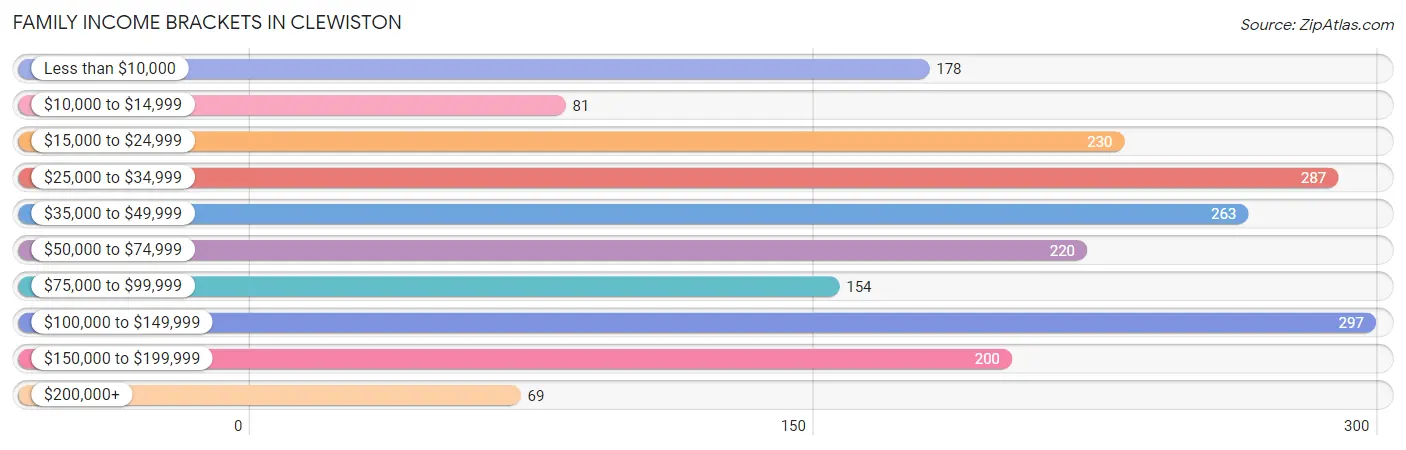
| Income Bracket | # Families | % Families |
| Less than $10,000 | 178 | 9.0% |
| $10,000 to $14,999 | 81 | 4.1% |
| $15,000 to $24,999 | 230 | 11.6% |
| $25,000 to $34,999 | 287 | 14.5% |
| $35,000 to $49,999 | 263 | 13.3% |
| $50,000 to $74,999 | 220 | 11.1% |
| $75,000 to $99,999 | 154 | 7.8% |
| $100,000 to $149,999 | 297 | 15.0% |
| $150,000 to $199,999 | 200 | 10.1% |
| $200,000+ | 69 | 3.5% |
Family Income by Famaliy Size in Clewiston
5-person families (199 | 10.1%) account for the highest median family income in Clewiston with $88,886 per family, while 3-person families (422 | 21.3%) have the highest median income of $21,733 per family member.
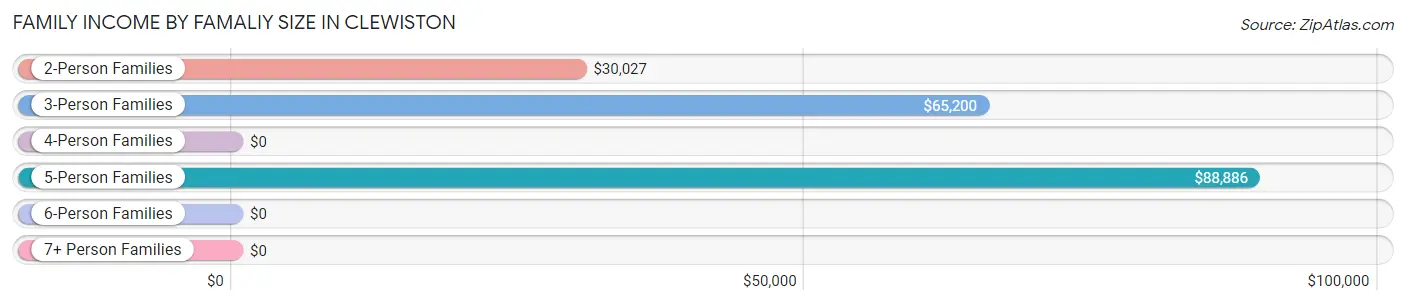
| Income Bracket | # Families | Median Income |
| 2-Person Families | 968 (48.9%) | $30,027 |
| 3-Person Families | 422 (21.3%) | $65,200 |
| 4-Person Families | 339 (17.1%) | $0 |
| 5-Person Families | 199 (10.1%) | $88,886 |
| 6-Person Families | 43 (2.2%) | $0 |
| 7+ Person Families | 8 (0.4%) | $0 |
| Total | 1,979 (100.0%) | $47,473 |
Family Income by Number of Earners in Clewiston
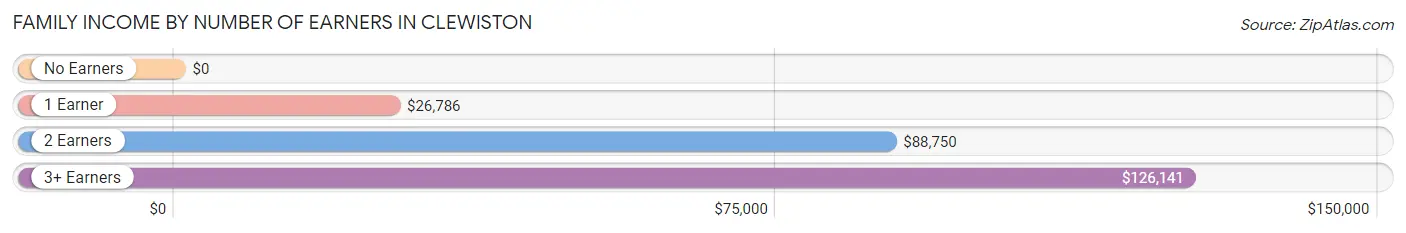
| Number of Earners | # Families | Median Income |
| No Earners | 238 (12.0%) | $0 |
| 1 Earner | 806 (40.7%) | $26,786 |
| 2 Earners | 638 (32.2%) | $88,750 |
| 3+ Earners | 297 (15.0%) | $126,141 |
| Total | 1,979 (100.0%) | $47,473 |
Household Income in Clewiston
Household Income Brackets in Clewiston
With 499 households falling in the category, the $100,000 to $149,999 income range is the most frequent in Clewiston, accounting for 18.9% of all households. In contrast, only 45 households (1.7%) fall into the $10,000 to $14,999 income bracket, making it the least populous group.
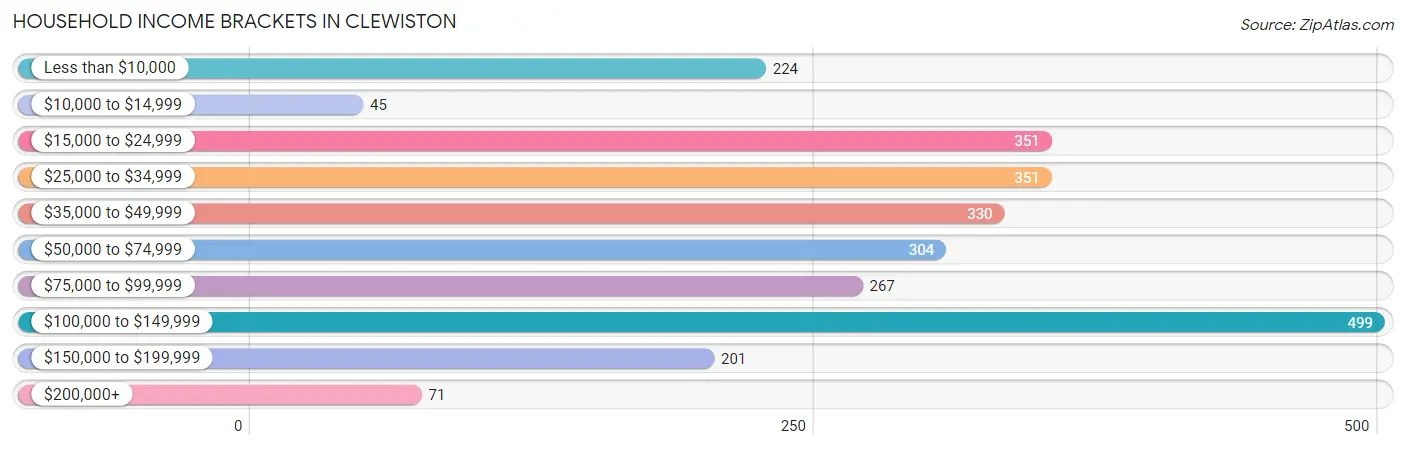
| Income Bracket | # Households | % Households |
| Less than $10,000 | 224 | 8.5% |
| $10,000 to $14,999 | 45 | 1.7% |
| $15,000 to $24,999 | 351 | 13.3% |
| $25,000 to $34,999 | 351 | 13.3% |
| $35,000 to $49,999 | 330 | 12.5% |
| $50,000 to $74,999 | 304 | 11.5% |
| $75,000 to $99,999 | 267 | 10.1% |
| $100,000 to $149,999 | 499 | 18.9% |
| $150,000 to $199,999 | 201 | 7.6% |
| $200,000+ | 71 | 2.7% |
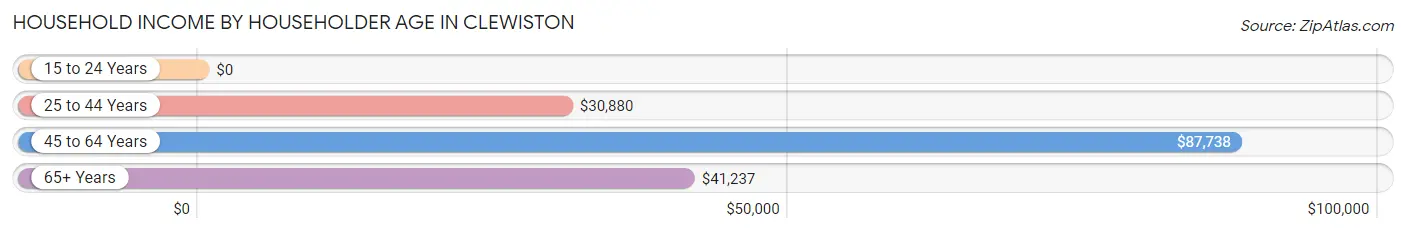
Household Income by Householder Age in Clewiston
The median household income in Clewiston is $50,538, with the highest median household income of $87,738 found in the 45 to 64 years age bracket for the primary householder. A total of 978 households (37.0%) fall into this category. Meanwhile, the 15 to 24 years age bracket for the primary householder has the lowest median household income of $0, with 271 households (10.3%) in this group.
| Income Bracket | # Households | Median Income |
| 15 to 24 Years | 271 (10.3%) | $0 |
| 25 to 44 Years | 788 (29.8%) | $30,880 |
| 45 to 64 Years | 978 (37.0%) | $87,738 |
| 65+ Years | 604 (22.9%) | $41,237 |
| Total | 2,641 (100.0%) | $50,538 |
Poverty in Clewiston
Income Below Poverty by Sex and Age in Clewiston
With 13.6% poverty level for males and 20.5% for females among the residents of Clewiston, 12 to 14 year old males and 15 year old females are the most vulnerable to poverty, with 87 males (68.5%) and 6 females (100.0%) in their respective age groups living below the poverty level.
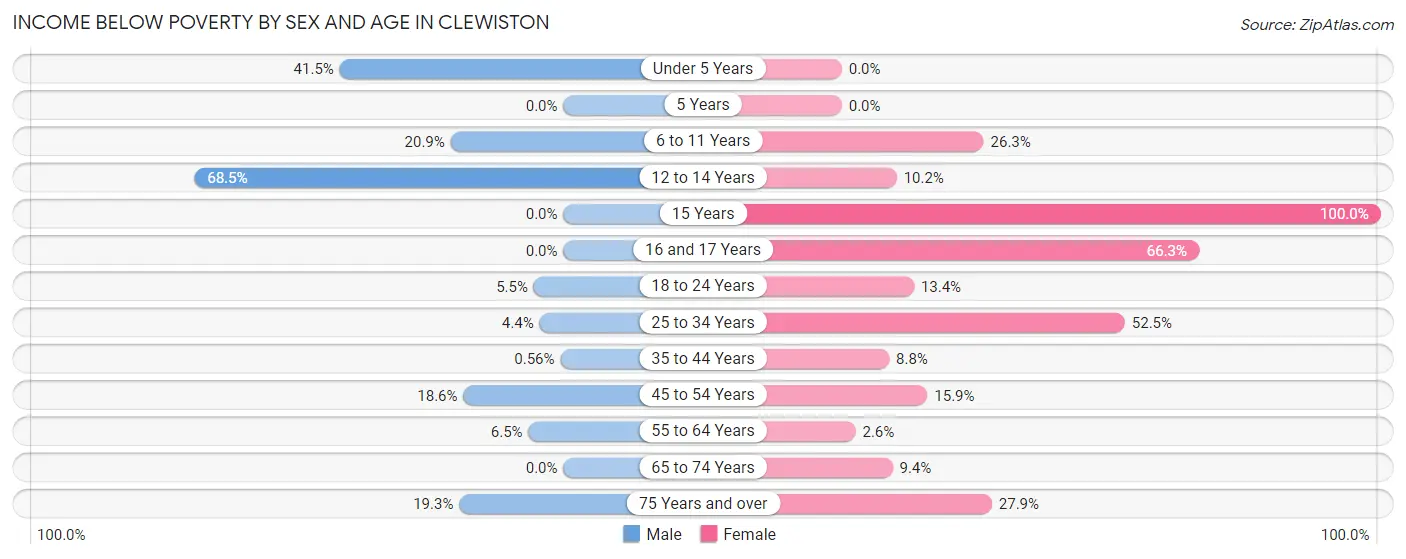
| Age Bracket | Male | Female |
| Under 5 Years | 71 (41.5%) | 0 (0.0%) |
| 5 Years | 0 (0.0%) | 0 (0.0%) |
| 6 to 11 Years | 113 (20.9%) | 60 (26.3%) |
| 12 to 14 Years | 87 (68.5%) | 16 (10.2%) |
| 15 Years | 0 (0.0%) | 6 (100.0%) |
| 16 and 17 Years | 0 (0.0%) | 55 (66.3%) |
| 18 to 24 Years | 24 (5.5%) | 49 (13.4%) |
| 25 to 34 Years | 29 (4.4%) | 279 (52.5%) |
| 35 to 44 Years | 2 (0.6%) | 31 (8.8%) |
| 45 to 54 Years | 116 (18.6%) | 87 (15.9%) |
| 55 to 64 Years | 19 (6.5%) | 11 (2.5%) |
| 65 to 74 Years | 0 (0.0%) | 21 (9.4%) |
| 75 Years and over | 58 (19.3%) | 56 (27.9%) |
| Total | 519 (13.6%) | 671 (20.5%) |
Income Above Poverty by Sex and Age in Clewiston
According to the poverty statistics in Clewiston, males aged 5 years and females aged under 5 years are the age groups that are most secure financially, with 100.0% of males and 100.0% of females in these age groups living above the poverty line.
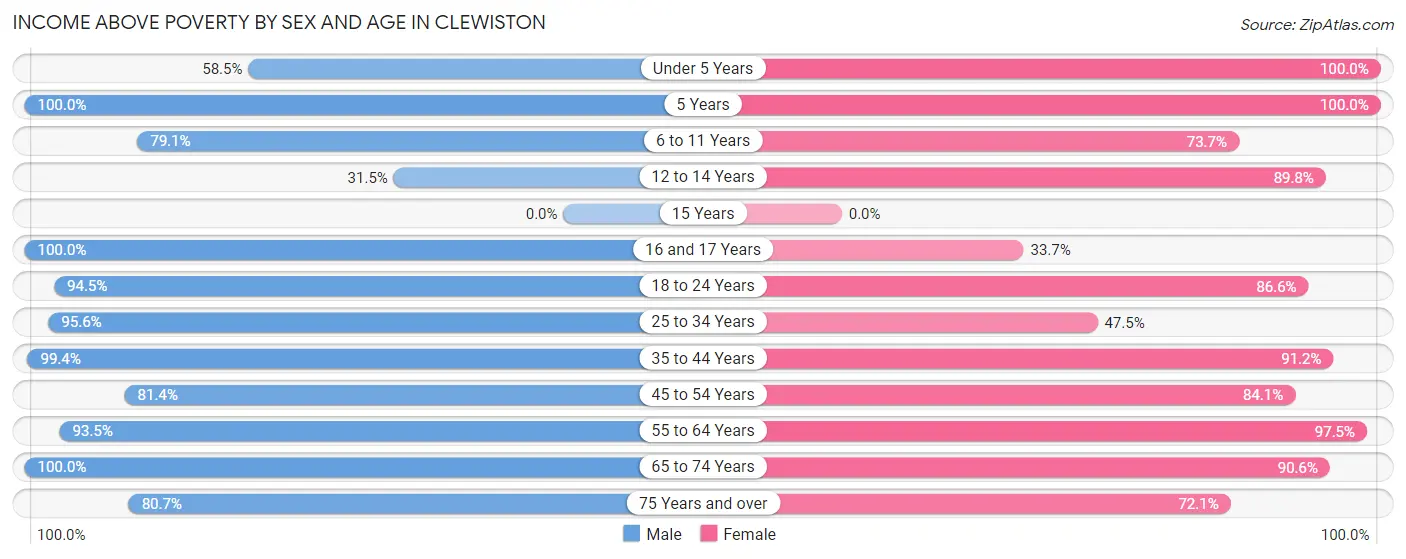
| Age Bracket | Male | Female |
| Under 5 Years | 100 (58.5%) | 115 (100.0%) |
| 5 Years | 26 (100.0%) | 30 (100.0%) |
| 6 to 11 Years | 427 (79.1%) | 168 (73.7%) |
| 12 to 14 Years | 40 (31.5%) | 141 (89.8%) |
| 15 Years | 0 (0.0%) | 0 (0.0%) |
| 16 and 17 Years | 20 (100.0%) | 28 (33.7%) |
| 18 to 24 Years | 414 (94.5%) | 317 (86.6%) |
| 25 to 34 Years | 626 (95.6%) | 252 (47.5%) |
| 35 to 44 Years | 352 (99.4%) | 322 (91.2%) |
| 45 to 54 Years | 509 (81.4%) | 461 (84.1%) |
| 55 to 64 Years | 274 (93.5%) | 420 (97.5%) |
| 65 to 74 Years | 265 (100.0%) | 202 (90.6%) |
| 75 Years and over | 242 (80.7%) | 145 (72.1%) |
| Total | 3,295 (86.4%) | 2,601 (79.5%) |
Income Below Poverty Among Married-Couple Families in Clewiston
The poverty statistics for married-couple families in Clewiston show that 23.3% or 253 of the total 1,085 families live below the poverty line. Families with 1 or 2 children have the highest poverty rate of 32.9%, comprising of 113 families. On the other hand, families with 3 or 4 children have the lowest poverty rate of 0.0%, which includes 0 families.
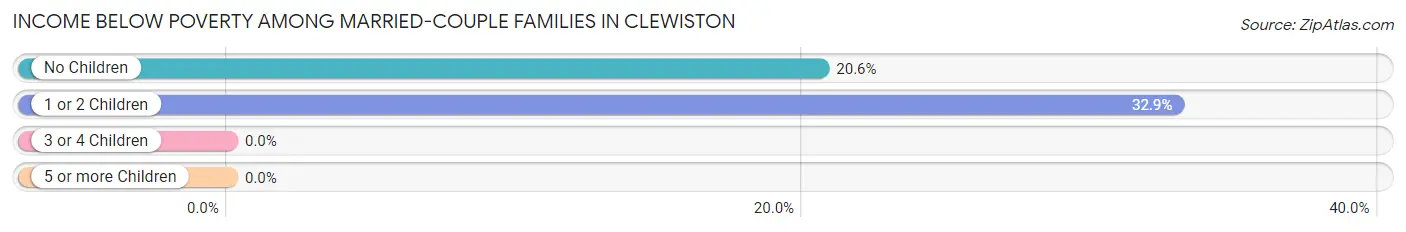
| Children | Above Poverty | Below Poverty |
| No Children | 540 (79.4%) | 140 (20.6%) |
| 1 or 2 Children | 230 (67.1%) | 113 (32.9%) |
| 3 or 4 Children | 62 (100.0%) | 0 (0.0%) |
| 5 or more Children | 0 (0.0%) | 0 (0.0%) |
| Total | 832 (76.7%) | 253 (23.3%) |
Income Below Poverty Among Single-Parent Households in Clewiston
According to the poverty data in Clewiston, 6.7% or 27 single-father households and 25.0% or 122 single-mother households are living below the poverty line. Among single-father households, those with no children have the highest poverty rate, with 27 households (7.9%) experiencing poverty. Likewise, among single-mother households, those with 1 or 2 children have the highest poverty rate, with 95 households (41.8%) falling below the poverty line.
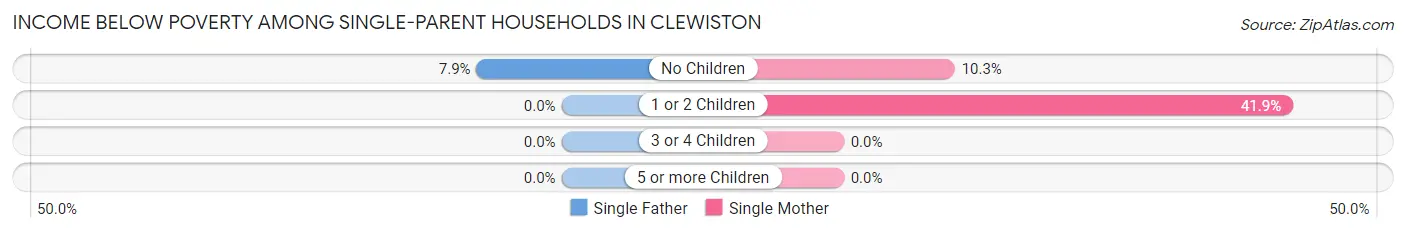
| Children | Single Father | Single Mother |
| No Children | 27 (7.9%) | 27 (10.3%) |
| 1 or 2 Children | 0 (0.0%) | 95 (41.8%) |
| 3 or 4 Children | 0 (0.0%) | 0 (0.0%) |
| 5 or more Children | 0 (0.0%) | 0 (0.0%) |
| Total | 27 (6.7%) | 122 (25.0%) |
Income Below Poverty Among Married-Couple vs Single-Parent Households in Clewiston
The poverty data for Clewiston shows that 253 of the married-couple family households (23.3%) and 149 of the single-parent households (16.7%) are living below the poverty level. Within the married-couple family households, those with 1 or 2 children have the highest poverty rate, with 113 households (32.9%) falling below the poverty line. Among the single-parent households, those with 1 or 2 children have the highest poverty rate, with 95 household (36.3%) living below poverty.
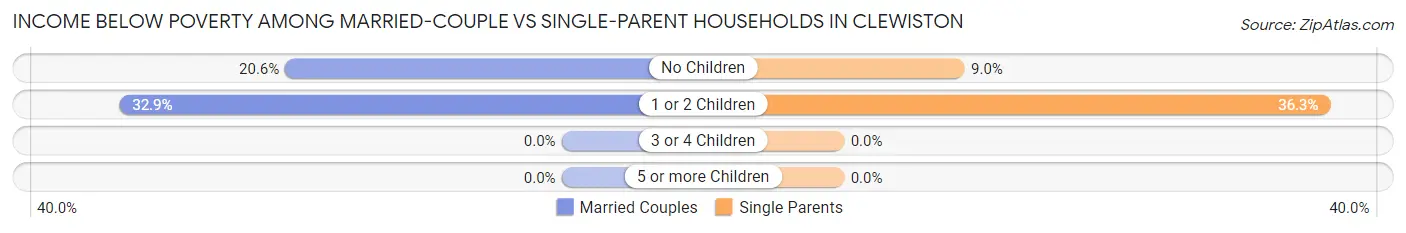
| Children | Married-Couple Families | Single-Parent Households |
| No Children | 140 (20.6%) | 54 (9.0%) |
| 1 or 2 Children | 113 (32.9%) | 95 (36.3%) |
| 3 or 4 Children | 0 (0.0%) | 0 (0.0%) |
| 5 or more Children | 0 (0.0%) | 0 (0.0%) |
| Total | 253 (23.3%) | 149 (16.7%) |
Race in Clewiston
The most populous races in Clewiston are White / Caucasian (4,944 | 68.2%), Hispanic or Latino (3,673 | 50.6%), and Black / African American (775 | 10.7%).
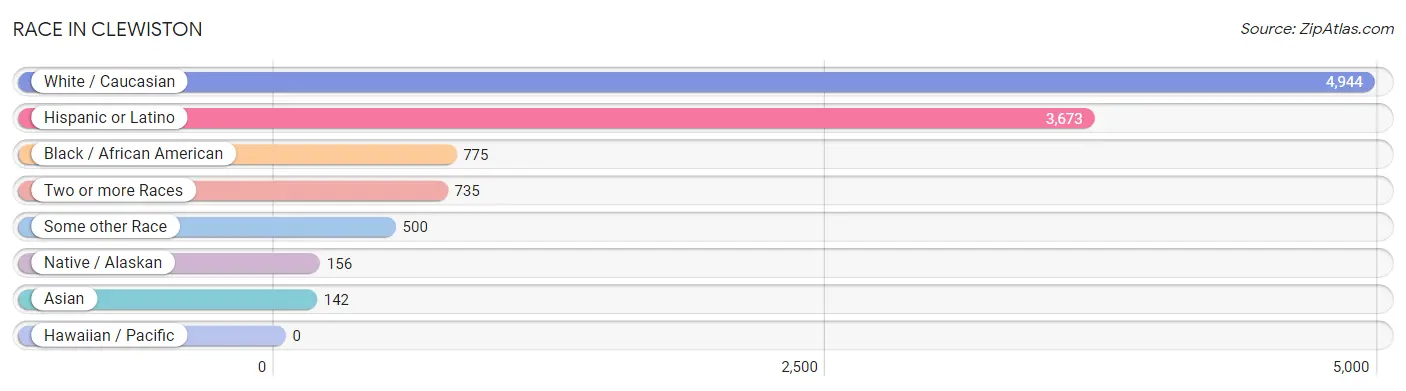
| Race | # Population | % Population |
| Asian | 142 | 2.0% |
| Black / African American | 775 | 10.7% |
| Hawaiian / Pacific | 0 | 0.0% |
| Hispanic or Latino | 3,673 | 50.6% |
| Native / Alaskan | 156 | 2.1% |
| White / Caucasian | 4,944 | 68.2% |
| Two or more Races | 735 | 10.1% |
| Some other Race | 500 | 6.9% |
| Total | 7,252 | 100.0% |
Ancestry in Clewiston
The most populous ancestries reported in Clewiston are Mexican (1,451 | 20.0%), Cuban (1,188 | 16.4%), American (618 | 8.5%), Central American (538 | 7.4%), and German (516 | 7.1%), together accounting for 59.5% of all Clewiston residents.
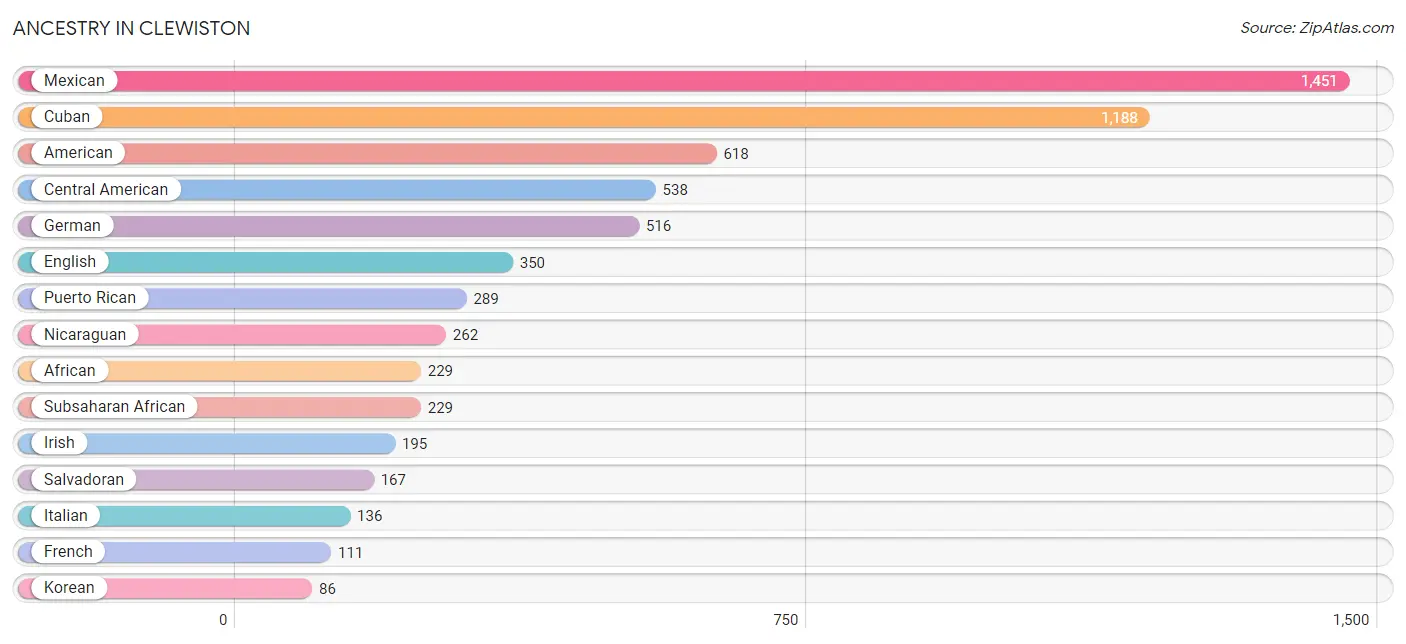
| Ancestry | # Population | % Population |
| African | 229 | 3.2% |
| American | 618 | 8.5% |
| Arab | 4 | 0.1% |
| British | 10 | 0.1% |
| Canadian | 28 | 0.4% |
| Central American | 538 | 7.4% |
| Central American Indian | 8 | 0.1% |
| Cuban | 1,188 | 16.4% |
| English | 350 | 4.8% |
| European | 61 | 0.8% |
| French | 111 | 1.5% |
| French Canadian | 13 | 0.2% |
| German | 516 | 7.1% |
| Guatemalan | 79 | 1.1% |
| Haitian | 6 | 0.1% |
| Honduran | 30 | 0.4% |
| Indian (Asian) | 56 | 0.8% |
| Irish | 195 | 2.7% |
| Italian | 136 | 1.9% |
| Korean | 86 | 1.2% |
| Mexican | 1,451 | 20.0% |
| Mexican American Indian | 8 | 0.1% |
| Nicaraguan | 262 | 3.6% |
| Polish | 70 | 1.0% |
| Puerto Rican | 289 | 4.0% |
| Salvadoran | 167 | 2.3% |
| Scotch-Irish | 75 | 1.0% |
| Scottish | 27 | 0.4% |
| Slovak | 17 | 0.2% |
| Subsaharan African | 229 | 3.2% |
| Syrian | 4 | 0.1% |
| Thai | 14 | 0.2% |
| Welsh | 14 | 0.2% | View All 33 Rows |
Immigrants in Clewiston
The most numerous immigrant groups reported in Clewiston came from Latin America (1,845 | 25.4%), Central America (1,171 | 16.2%), Caribbean (674 | 9.3%), Cuba (668 | 9.2%), and Mexico (647 | 8.9%), together accounting for 69.0% of all Clewiston residents.
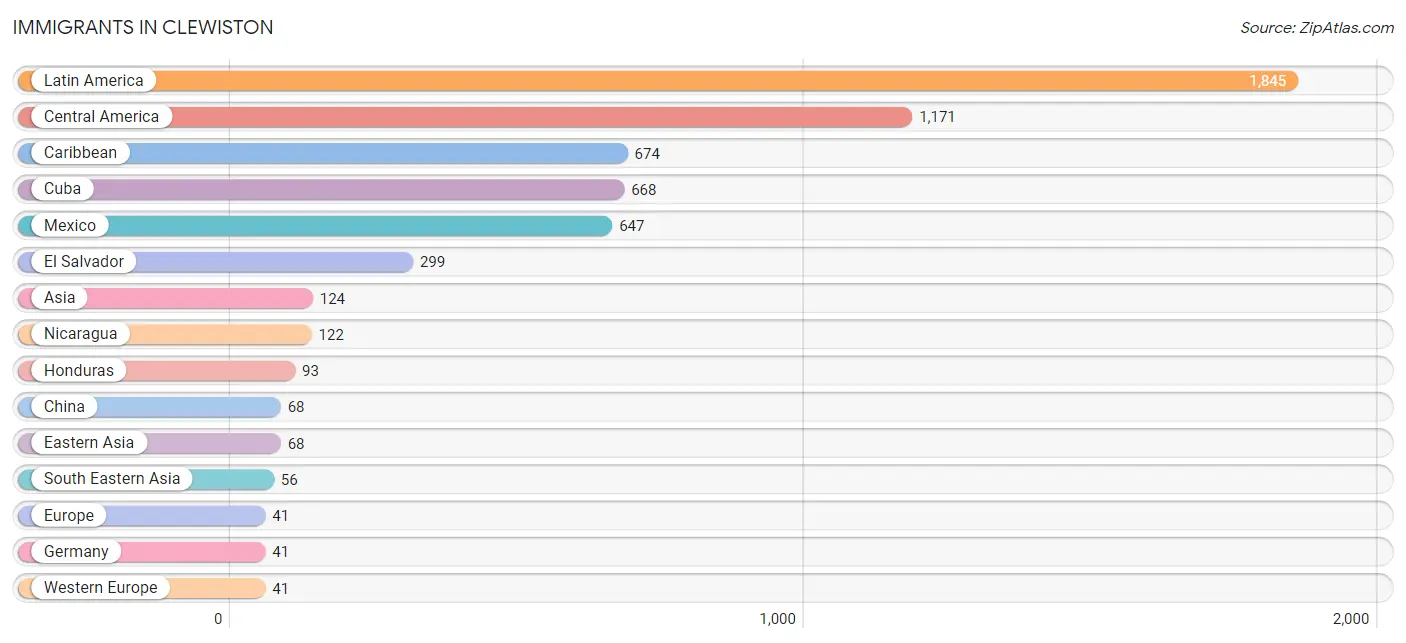
| Immigration Origin | # Population | % Population |
| Asia | 124 | 1.7% |
| Caribbean | 674 | 9.3% |
| Central America | 1,171 | 16.2% |
| China | 68 | 0.9% |
| Cuba | 668 | 9.2% |
| Eastern Asia | 68 | 0.9% |
| El Salvador | 299 | 4.1% |
| Europe | 41 | 0.6% |
| Germany | 41 | 0.6% |
| Guatemala | 10 | 0.1% |
| Haiti | 6 | 0.1% |
| Honduras | 93 | 1.3% |
| Latin America | 1,845 | 25.4% |
| Mexico | 647 | 8.9% |
| Nicaragua | 122 | 1.7% |
| Philippines | 34 | 0.5% |
| South Eastern Asia | 56 | 0.8% |
| Thailand | 22 | 0.3% |
| Western Europe | 41 | 0.6% | View All 19 Rows |
Sex and Age in Clewiston
Sex and Age in Clewiston
The most populous age groups in Clewiston are 25 to 29 Years (380 | 9.8%) for men and 30 to 34 Years (360 | 10.7%) for women.
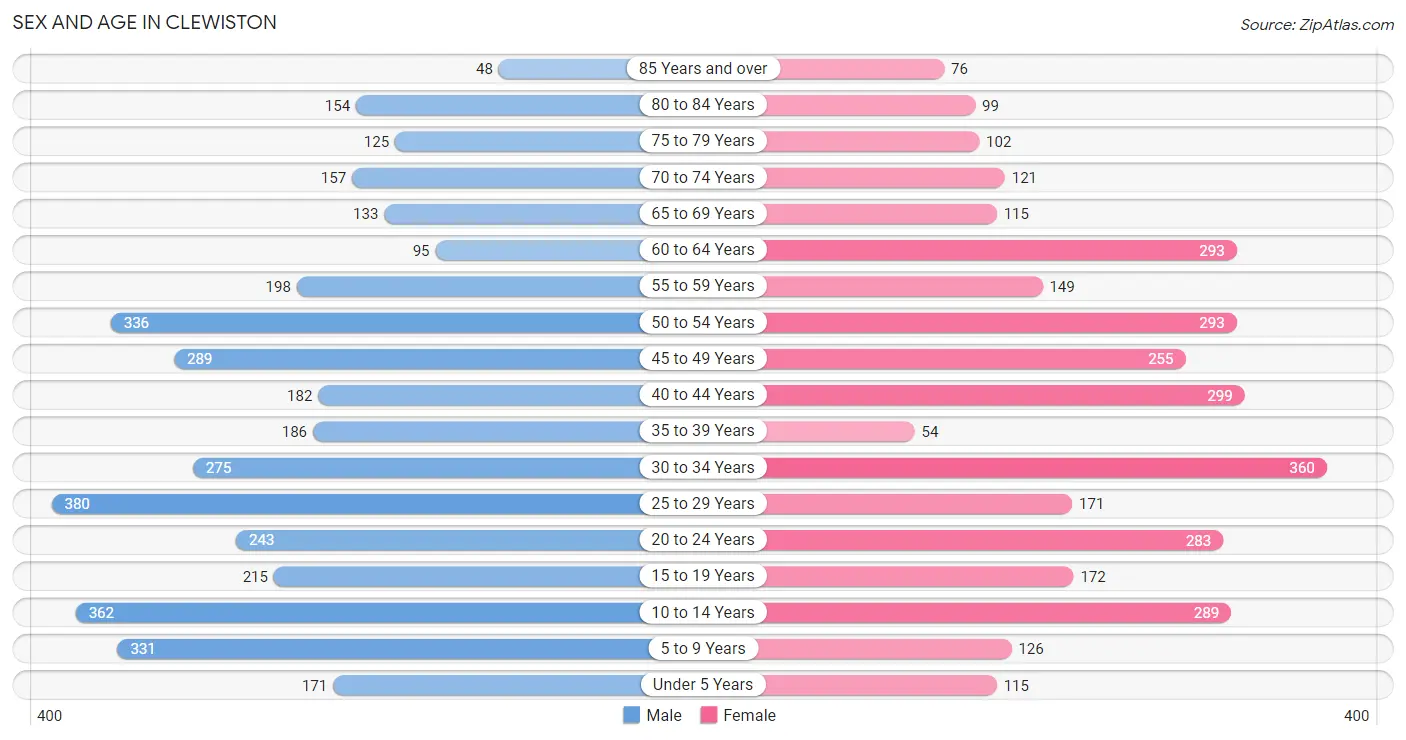
| Age Bracket | Male | Female |
| Under 5 Years | 171 (4.4%) | 115 (3.4%) |
| 5 to 9 Years | 331 (8.5%) | 126 (3.7%) |
| 10 to 14 Years | 362 (9.3%) | 289 (8.6%) |
| 15 to 19 Years | 215 (5.5%) | 172 (5.1%) |
| 20 to 24 Years | 243 (6.3%) | 283 (8.4%) |
| 25 to 29 Years | 380 (9.8%) | 171 (5.1%) |
| 30 to 34 Years | 275 (7.1%) | 360 (10.7%) |
| 35 to 39 Years | 186 (4.8%) | 54 (1.6%) |
| 40 to 44 Years | 182 (4.7%) | 299 (8.9%) |
| 45 to 49 Years | 289 (7.4%) | 255 (7.6%) |
| 50 to 54 Years | 336 (8.7%) | 293 (8.7%) |
| 55 to 59 Years | 198 (5.1%) | 149 (4.4%) |
| 60 to 64 Years | 95 (2.5%) | 293 (8.7%) |
| 65 to 69 Years | 133 (3.4%) | 115 (3.4%) |
| 70 to 74 Years | 157 (4.1%) | 121 (3.6%) |
| 75 to 79 Years | 125 (3.2%) | 102 (3.0%) |
| 80 to 84 Years | 154 (4.0%) | 99 (2.9%) |
| 85 Years and over | 48 (1.2%) | 76 (2.2%) |
| Total | 3,880 (100.0%) | 3,372 (100.0%) |
Families and Households in Clewiston
Median Family Size in Clewiston
The median family size in Clewiston is 3.02 persons per family, with married-couple families (1,085 | 54.8%) accounting for the largest median family size of 3.13 persons per family. On the other hand, single male/father families (406 | 20.5%) represent the smallest median family size with 2.71 persons per family.
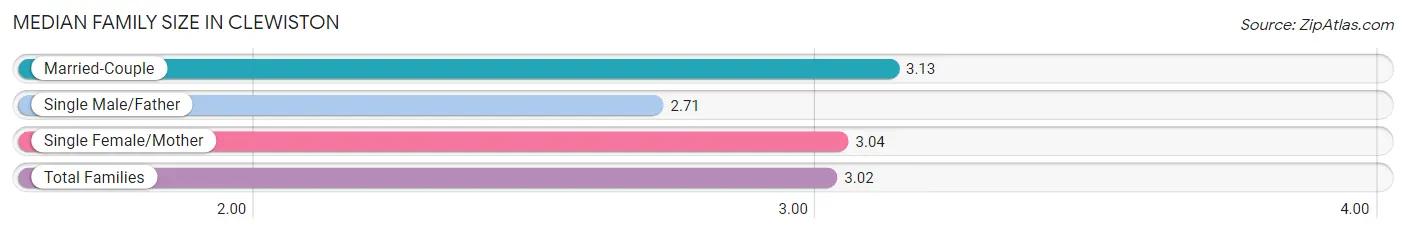
| Family Type | # Families | Family Size |
| Married-Couple | 1,085 (54.8%) | 3.13 |
| Single Male/Father | 406 (20.5%) | 2.71 |
| Single Female/Mother | 488 (24.7%) | 3.04 |
| Total Families | 1,979 (100.0%) | 3.02 |
Median Household Size in Clewiston
The median household size in Clewiston is 2.68 persons per household, with single female/mother households (488 | 18.5%) accounting for the largest median household size of 3.3 persons per household. non-family households (662 | 25.1%) represent the smallest median household size with 1.29 persons per household.
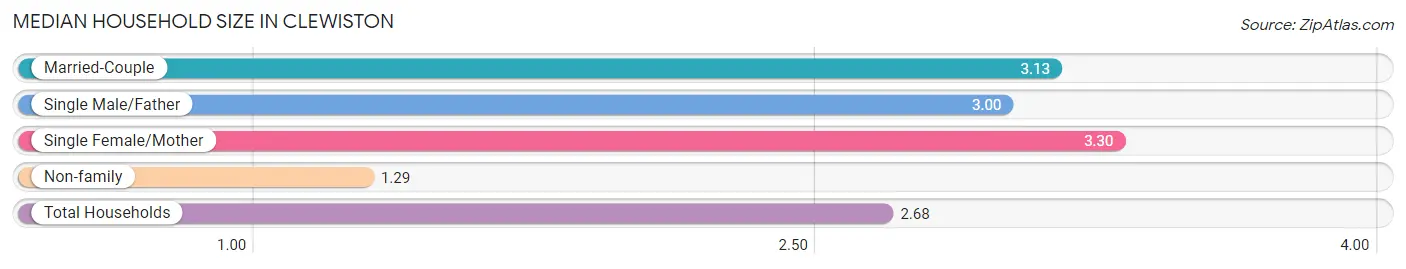
| Household Type | # Households | Household Size |
| Married-Couple | 1,085 (41.1%) | 3.13 |
| Single Male/Father | 406 (15.4%) | 3.00 |
| Single Female/Mother | 488 (18.5%) | 3.30 |
| Non-family | 662 (25.1%) | 1.29 |
| Total Households | 2,641 (100.0%) | 2.68 |
Household Size by Marriage Status in Clewiston
Out of a total of 2,641 households in Clewiston, 1,979 (74.9%) are family households, while 662 (25.1%) are nonfamily households. The most numerous type of family households are 2-person households, comprising 807, and the most common type of nonfamily households are 1-person households, comprising 534.
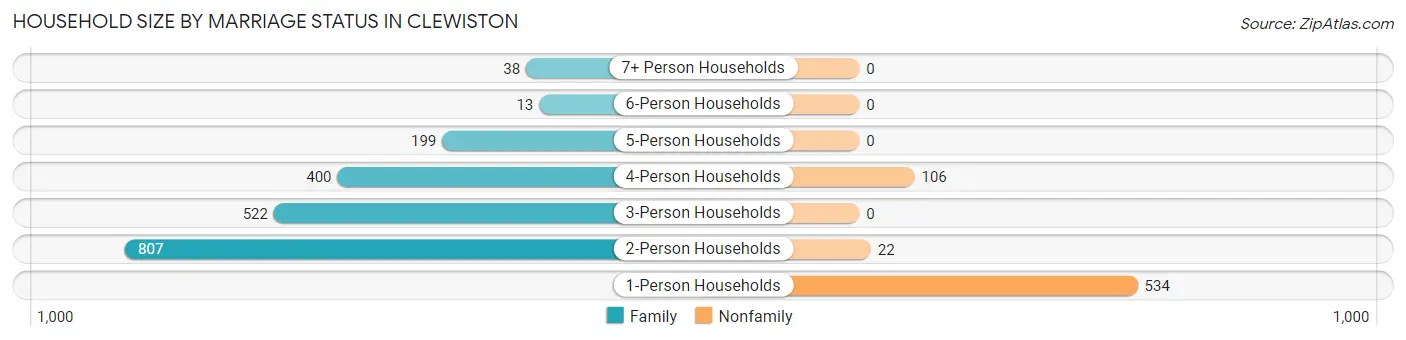
| Household Size | Family Households | Nonfamily Households |
| 1-Person Households | - | 534 (20.2%) |
| 2-Person Households | 807 (30.6%) | 22 (0.8%) |
| 3-Person Households | 522 (19.8%) | 0 (0.0%) |
| 4-Person Households | 400 (15.1%) | 106 (4.0%) |
| 5-Person Households | 199 (7.5%) | 0 (0.0%) |
| 6-Person Households | 13 (0.5%) | 0 (0.0%) |
| 7+ Person Households | 38 (1.4%) | 0 (0.0%) |
| Total | 1,979 (74.9%) | 662 (25.1%) |
Female Fertility in Clewiston
Fertility by Age in Clewiston
Average fertility rate in Clewiston is 36.0 births per 1,000 women. Women in the age bracket of 35 to 50 years have the highest fertility rate with 58.0 births per 1,000 women. Women in the age bracket of 35 to 50 years acount for 68.3% of all women with births.
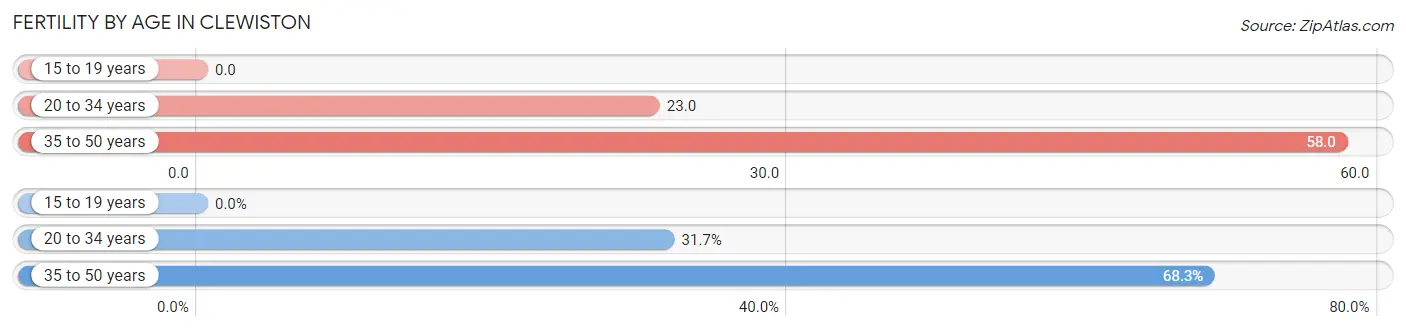
| Age Bracket | Women with Births | Births / 1,000 Women |
| 15 to 19 years | 0 (0.0%) | 0.0 |
| 20 to 34 years | 19 (31.7%) | 23.0 |
| 35 to 50 years | 41 (68.3%) | 58.0 |
| Total | 60 (100.0%) | 36.0 |
Fertility by Age by Marriage Status in Clewiston
73.3% of women with births (60) in Clewiston are married. The highest percentage of unmarried women with births falls into 35 to 50 years age bracket with 39.0% of them unmarried at the time of birth, while the lowest percentage of unmarried women with births belong to 20 to 34 years age bracket with 0.0% of them unmarried.
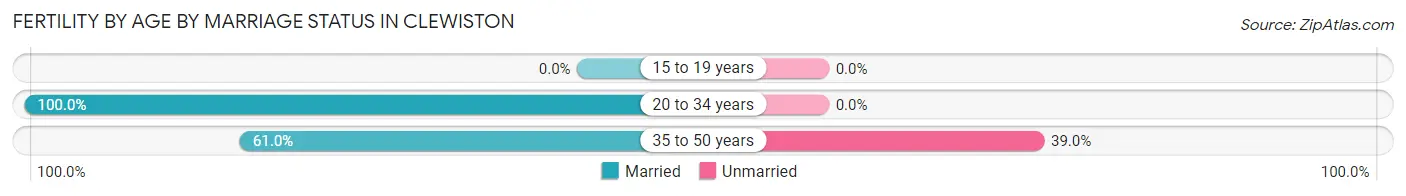
| Age Bracket | Married | Unmarried |
| 15 to 19 years | 0 (0.0%) | 0 (0.0%) |
| 20 to 34 years | 19 (100.0%) | 0 (0.0%) |
| 35 to 50 years | 25 (61.0%) | 16 (39.0%) |
| Total | 44 (73.3%) | 16 (26.7%) |
Fertility by Education in Clewiston
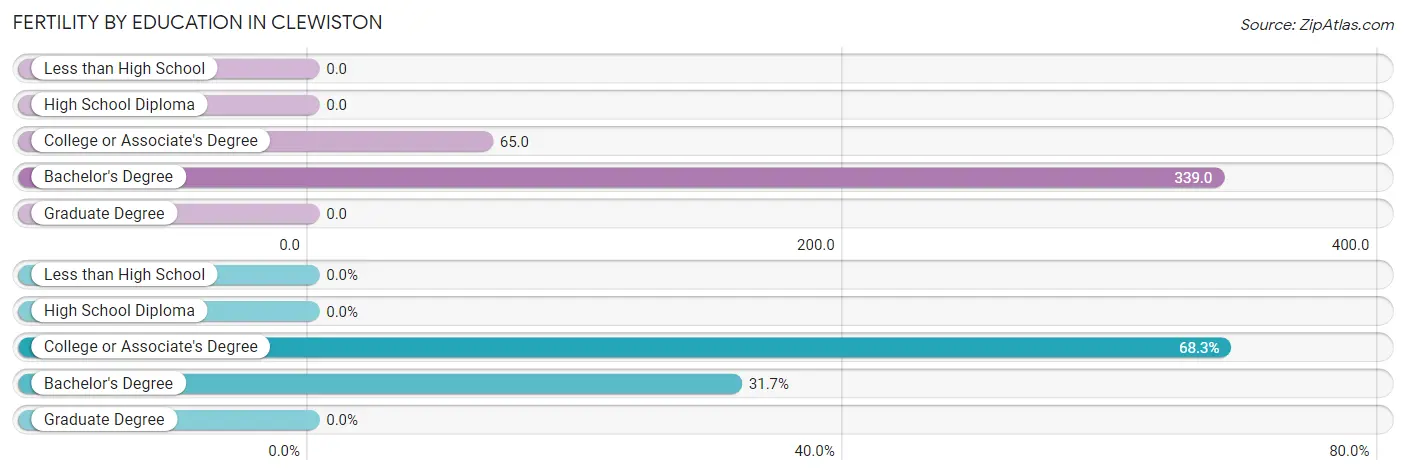
| Educational Attainment | Women with Births | Births / 1,000 Women |
| Less than High School | 0 (0.0%) | 0.0 |
| High School Diploma | 0 (0.0%) | 0.0 |
| College or Associate's Degree | 41 (68.3%) | 65.0 |
| Bachelor's Degree | 19 (31.7%) | 339.0 |
| Graduate Degree | 0 (0.0%) | 0.0 |
| Total | 60 (100.0%) | 36.0 |
Fertility by Education by Marriage Status in Clewiston
26.7% of women with births in Clewiston are unmarried. Women with the educational attainment of bachelor's degree are most likely to be married with 100.0% of them married at childbirth, while women with the educational attainment of college or associate's degree are least likely to be married with 39.0% of them unmarried at childbirth.
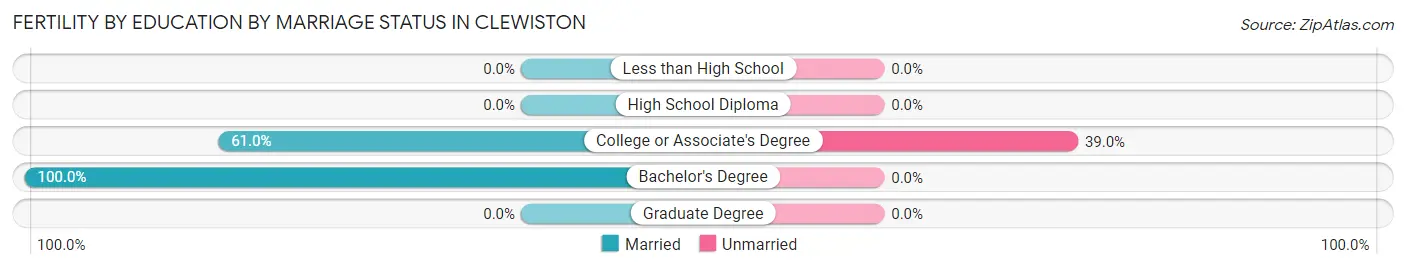
| Educational Attainment | Married | Unmarried |
| Less than High School | 0 (0.0%) | 0 (0.0%) |
| High School Diploma | 0 (0.0%) | 0 (0.0%) |
| College or Associate's Degree | 25 (61.0%) | 16 (39.0%) |
| Bachelor's Degree | 19 (100.0%) | 0 (0.0%) |
| Graduate Degree | 0 (0.0%) | 0 (0.0%) |
| Total | 44 (73.3%) | 16 (26.7%) |
Employment Characteristics in Clewiston
Employment by Class of Employer in Clewiston
Among the 3,554 employed individuals in Clewiston, private company employees (2,765 | 77.8%), not-for-profit organizations (183 | 5.1%), and self-employed (not incorporated) (178 | 5.0%) make up the most common classes of employment.
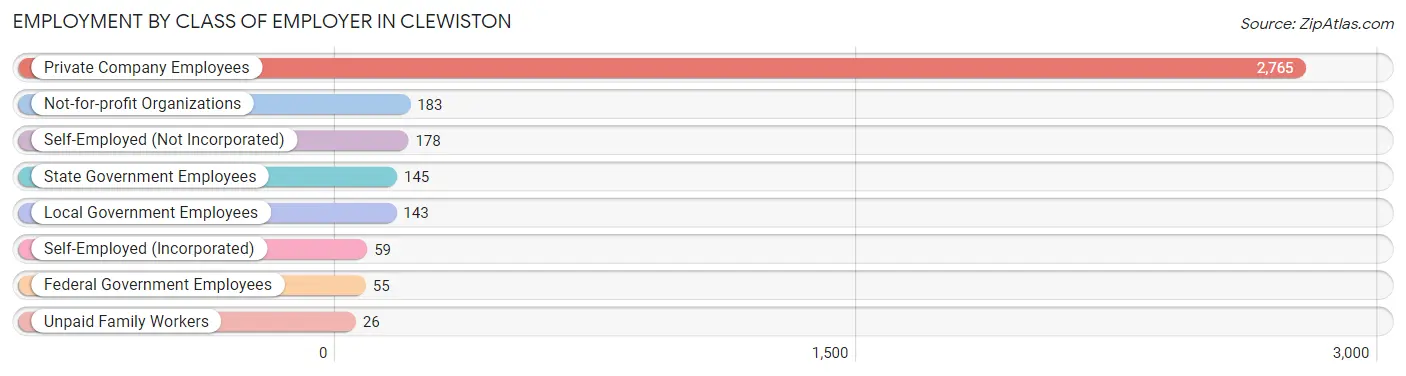
| Employer Class | # Employees | % Employees |
| Private Company Employees | 2,765 | 77.8% |
| Self-Employed (Incorporated) | 59 | 1.7% |
| Self-Employed (Not Incorporated) | 178 | 5.0% |
| Not-for-profit Organizations | 183 | 5.1% |
| Local Government Employees | 143 | 4.0% |
| State Government Employees | 145 | 4.1% |
| Federal Government Employees | 55 | 1.5% |
| Unpaid Family Workers | 26 | 0.7% |
| Total | 3,554 | 100.0% |
Employment Status by Age in Clewiston
According to the labor force statistics for Clewiston, out of the total population over 16 years of age (5,852), 64.4% or 3,769 individuals are in the labor force, with 4.4% or 166 of them unemployed. The age group with the highest labor force participation rate is 35 to 44 years, with 93.3% or 673 individuals in the labor force. Within the labor force, the 25 to 29 years age range has the highest percentage of unemployed individuals, with 20.5% or 81 of them being unemployed.
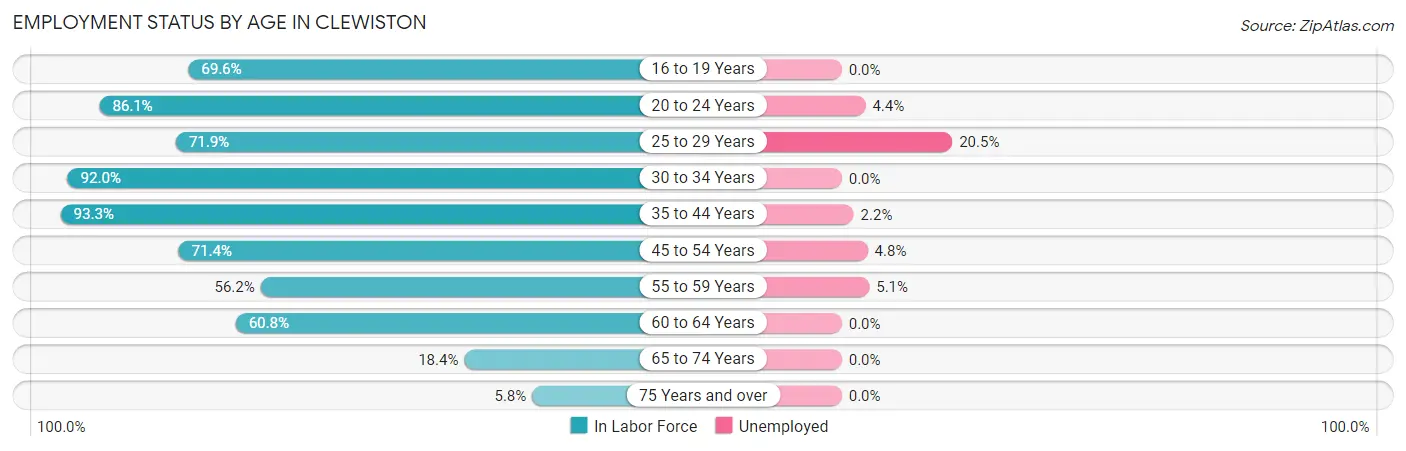
| Age Bracket | In Labor Force | Unemployed |
| 16 to 19 Years | 265 (69.6%) | 0 (0.0%) |
| 20 to 24 Years | 453 (86.1%) | 20 (4.4%) |
| 25 to 29 Years | 396 (71.9%) | 81 (20.5%) |
| 30 to 34 Years | 584 (92.0%) | 0 (0.0%) |
| 35 to 44 Years | 673 (93.3%) | 15 (2.2%) |
| 45 to 54 Years | 838 (71.4%) | 40 (4.8%) |
| 55 to 59 Years | 195 (56.2%) | 10 (5.1%) |
| 60 to 64 Years | 236 (60.8%) | 0 (0.0%) |
| 65 to 74 Years | 97 (18.4%) | 0 (0.0%) |
| 75 Years and over | 35 (5.8%) | 0 (0.0%) |
| Total | 3,769 (64.4%) | 166 (4.4%) |
Employment Status by Educational Attainment in Clewiston
According to labor force statistics for Clewiston, 76.6% of individuals (2,922) out of the total population between 25 and 64 years of age (3,815) are in the labor force, with 5.0% or 146 of them being unemployed. The group with the highest labor force participation rate are those with the educational attainment of bachelor's degree or higher, with 98.0% or 440 individuals in the labor force. Within the labor force, individuals with less than high school education have the highest percentage of unemployment, with 10.7% or 91 of them being unemployed.
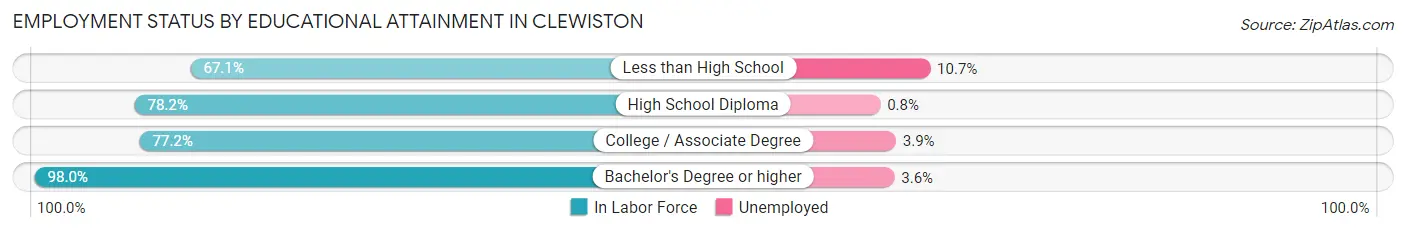
| Educational Attainment | In Labor Force | Unemployed |
| Less than High School | 849 (67.1%) | 135 (10.7%) |
| High School Diploma | 795 (78.2%) | 8 (0.8%) |
| College / Associate Degree | 837 (77.2%) | 42 (3.9%) |
| Bachelor's Degree or higher | 440 (98.0%) | 16 (3.6%) |
| Total | 2,922 (76.6%) | 191 (5.0%) |
Employment Occupations by Sex in Clewiston
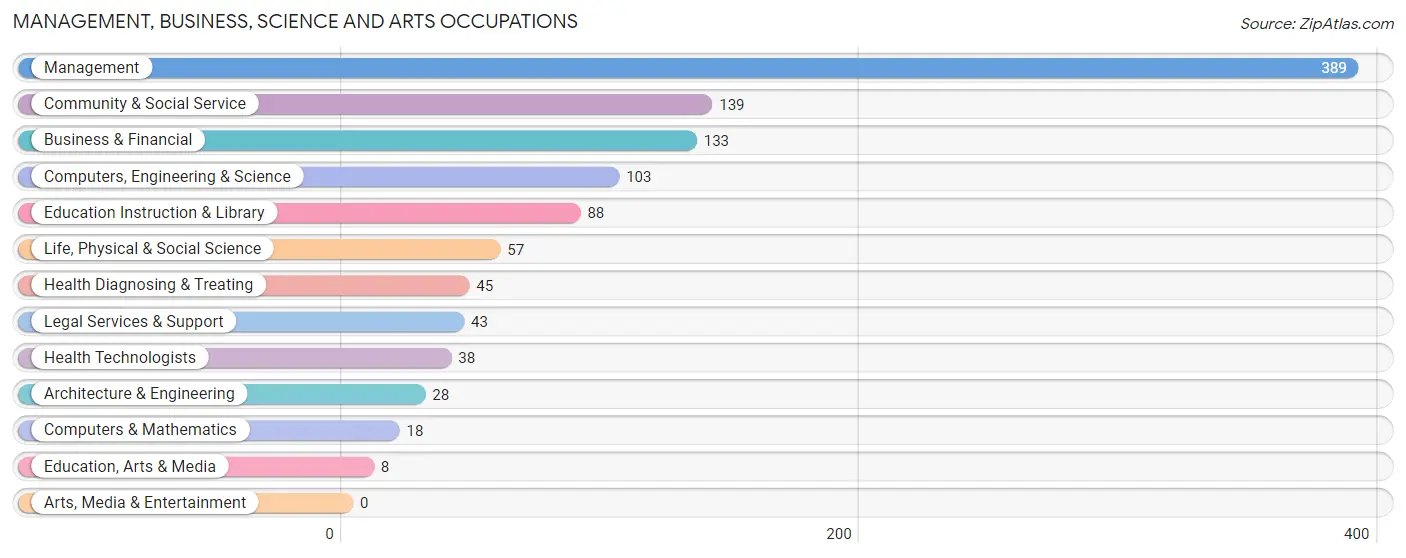
Management, Business, Science and Arts Occupations
The most common Management, Business, Science and Arts occupations in Clewiston are Management (389 | 10.8%), Community & Social Service (139 | 3.9%), Business & Financial (133 | 3.7%), Computers, Engineering & Science (103 | 2.9%), and Education Instruction & Library (88 | 2.4%).
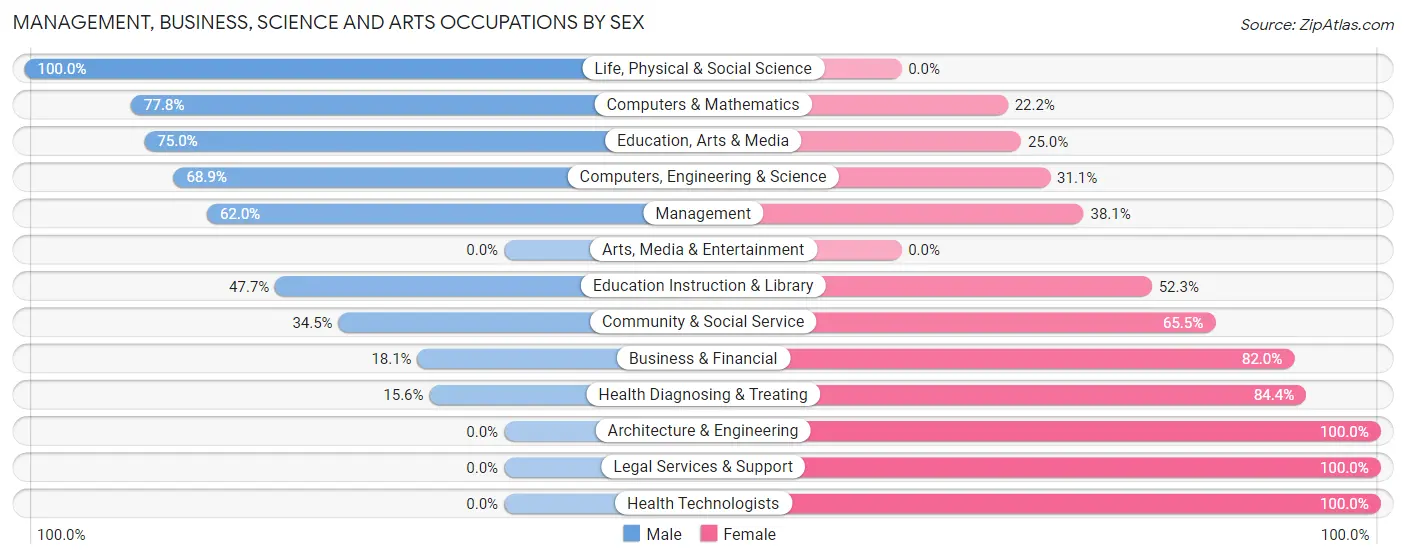
Management, Business, Science and Arts Occupations by Sex
Within the Management, Business, Science and Arts occupations in Clewiston, the most male-oriented occupations are Life, Physical & Social Science (100.0%), Computers & Mathematics (77.8%), and Education, Arts & Media (75.0%), while the most female-oriented occupations are Architecture & Engineering (100.0%), Legal Services & Support (100.0%), and Health Technologists (100.0%).
| Occupation | Male | Female |
| Management | 241 (62.0%) | 148 (38.1%) |
| Business & Financial | 24 (18.0%) | 109 (82.0%) |
| Computers, Engineering & Science | 71 (68.9%) | 32 (31.1%) |
| Computers & Mathematics | 14 (77.8%) | 4 (22.2%) |
| Architecture & Engineering | 0 (0.0%) | 28 (100.0%) |
| Life, Physical & Social Science | 57 (100.0%) | 0 (0.0%) |
| Community & Social Service | 48 (34.5%) | 91 (65.5%) |
| Education, Arts & Media | 6 (75.0%) | 2 (25.0%) |
| Legal Services & Support | 0 (0.0%) | 43 (100.0%) |
| Education Instruction & Library | 42 (47.7%) | 46 (52.3%) |
| Arts, Media & Entertainment | 0 (0.0%) | 0 (0.0%) |
| Health Diagnosing & Treating | 7 (15.6%) | 38 (84.4%) |
| Health Technologists | 0 (0.0%) | 38 (100.0%) |
| Total (Category) | 391 (48.3%) | 418 (51.7%) |
| Total (Overall) | 2,053 (57.0%) | 1,552 (43.0%) |
Services Occupations
The most common Services occupations in Clewiston are Food Preparation & Serving (216 | 6.0%), Healthcare Support (205 | 5.7%), Cleaning & Maintenance (163 | 4.5%), and Personal Care & Service (21 | 0.6%).

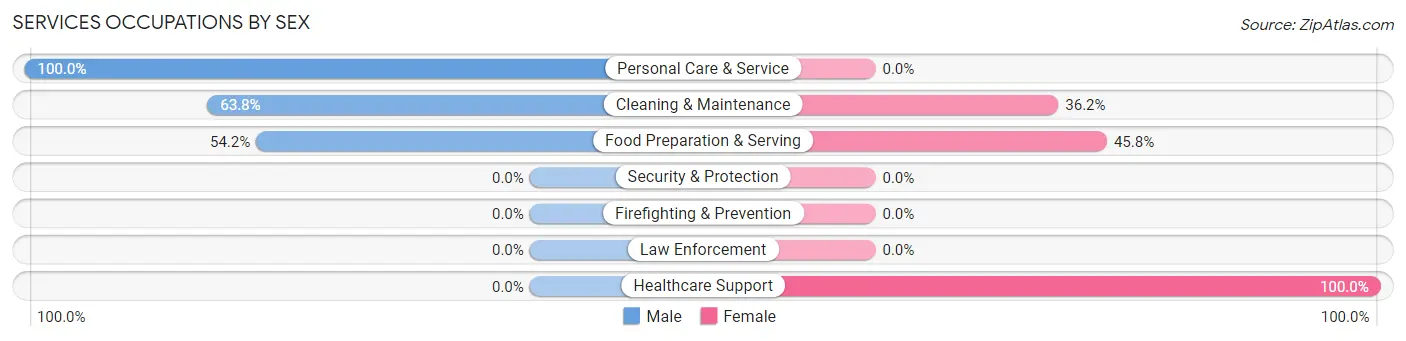
Services Occupations by Sex
Within the Services occupations in Clewiston, the most male-oriented occupations are Personal Care & Service (100.0%), Cleaning & Maintenance (63.8%), and Food Preparation & Serving (54.2%), while the most female-oriented occupations are Healthcare Support (100.0%), Food Preparation & Serving (45.8%), and Cleaning & Maintenance (36.2%).
| Occupation | Male | Female |
| Healthcare Support | 0 (0.0%) | 205 (100.0%) |
| Security & Protection | 0 (0.0%) | 0 (0.0%) |
| Firefighting & Prevention | 0 (0.0%) | 0 (0.0%) |
| Law Enforcement | 0 (0.0%) | 0 (0.0%) |
| Food Preparation & Serving | 117 (54.2%) | 99 (45.8%) |
| Cleaning & Maintenance | 104 (63.8%) | 59 (36.2%) |
| Personal Care & Service | 21 (100.0%) | 0 (0.0%) |
| Total (Category) | 242 (40.0%) | 363 (60.0%) |
| Total (Overall) | 2,053 (57.0%) | 1,552 (43.0%) |
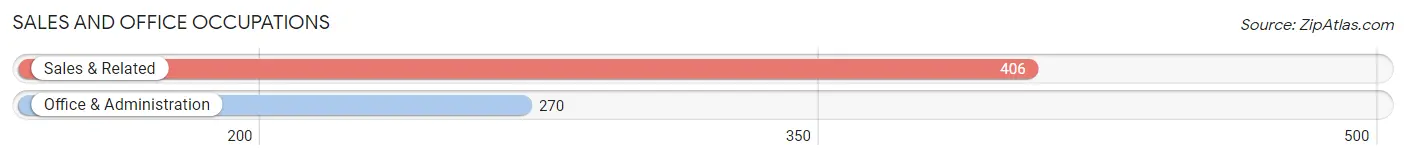
Sales and Office Occupations
The most common Sales and Office occupations in Clewiston are Sales & Related (406 | 11.3%), and Office & Administration (270 | 7.5%).
Sales and Office Occupations by Sex
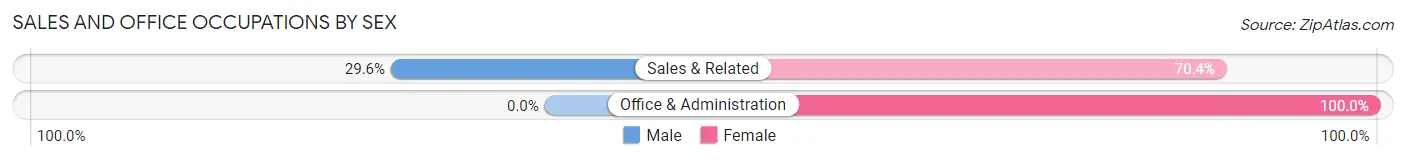
| Occupation | Male | Female |
| Sales & Related | 120 (29.6%) | 286 (70.4%) |
| Office & Administration | 0 (0.0%) | 270 (100.0%) |
| Total (Category) | 120 (17.7%) | 556 (82.3%) |
| Total (Overall) | 2,053 (57.0%) | 1,552 (43.0%) |
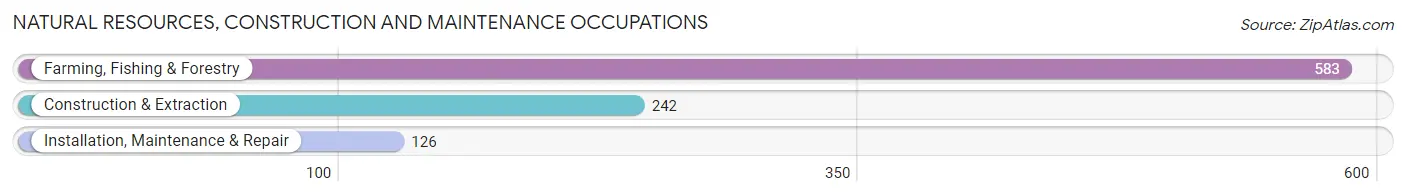
Natural Resources, Construction and Maintenance Occupations
The most common Natural Resources, Construction and Maintenance occupations in Clewiston are Farming, Fishing & Forestry (583 | 16.2%), Construction & Extraction (242 | 6.7%), and Installation, Maintenance & Repair (126 | 3.5%).
Natural Resources, Construction and Maintenance Occupations by Sex
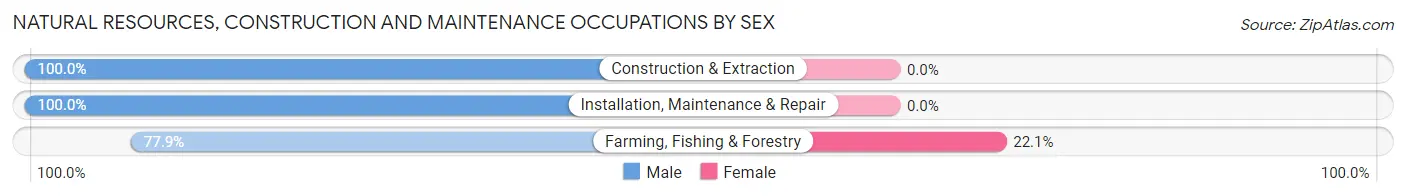
| Occupation | Male | Female |
| Farming, Fishing & Forestry | 454 (77.9%) | 129 (22.1%) |
| Construction & Extraction | 242 (100.0%) | 0 (0.0%) |
| Installation, Maintenance & Repair | 126 (100.0%) | 0 (0.0%) |
| Total (Category) | 822 (86.4%) | 129 (13.6%) |
| Total (Overall) | 2,053 (57.0%) | 1,552 (43.0%) |
Production, Transportation and Moving Occupations
The most common Production, Transportation and Moving occupations in Clewiston are Production (236 | 6.6%), Material Moving (214 | 5.9%), and Transportation (114 | 3.2%).
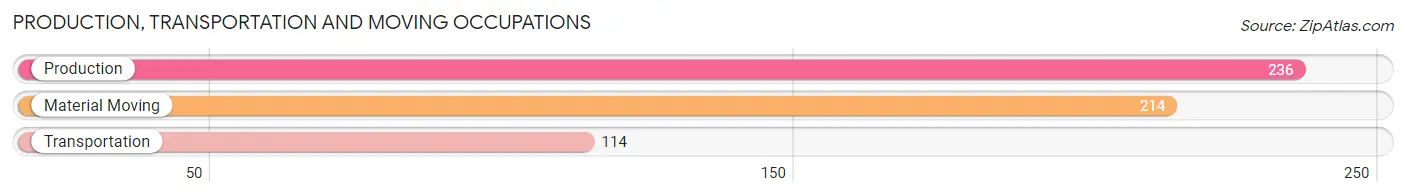
Production, Transportation and Moving Occupations by Sex
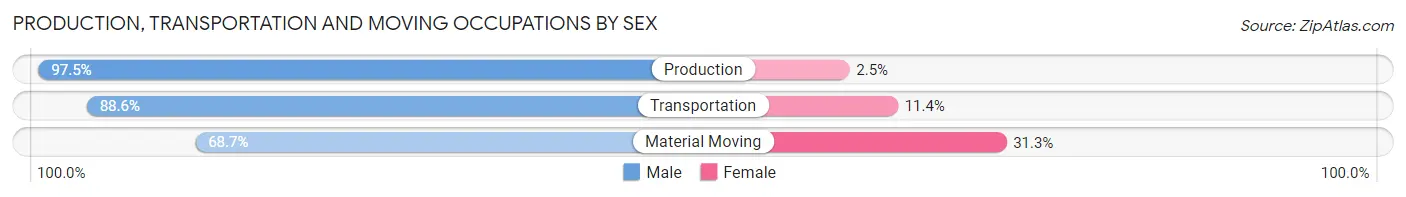
| Occupation | Male | Female |
| Production | 230 (97.5%) | 6 (2.5%) |
| Transportation | 101 (88.6%) | 13 (11.4%) |
| Material Moving | 147 (68.7%) | 67 (31.3%) |
| Total (Category) | 478 (84.8%) | 86 (15.2%) |
| Total (Overall) | 2,053 (57.0%) | 1,552 (43.0%) |
Employment Industries by Sex in Clewiston
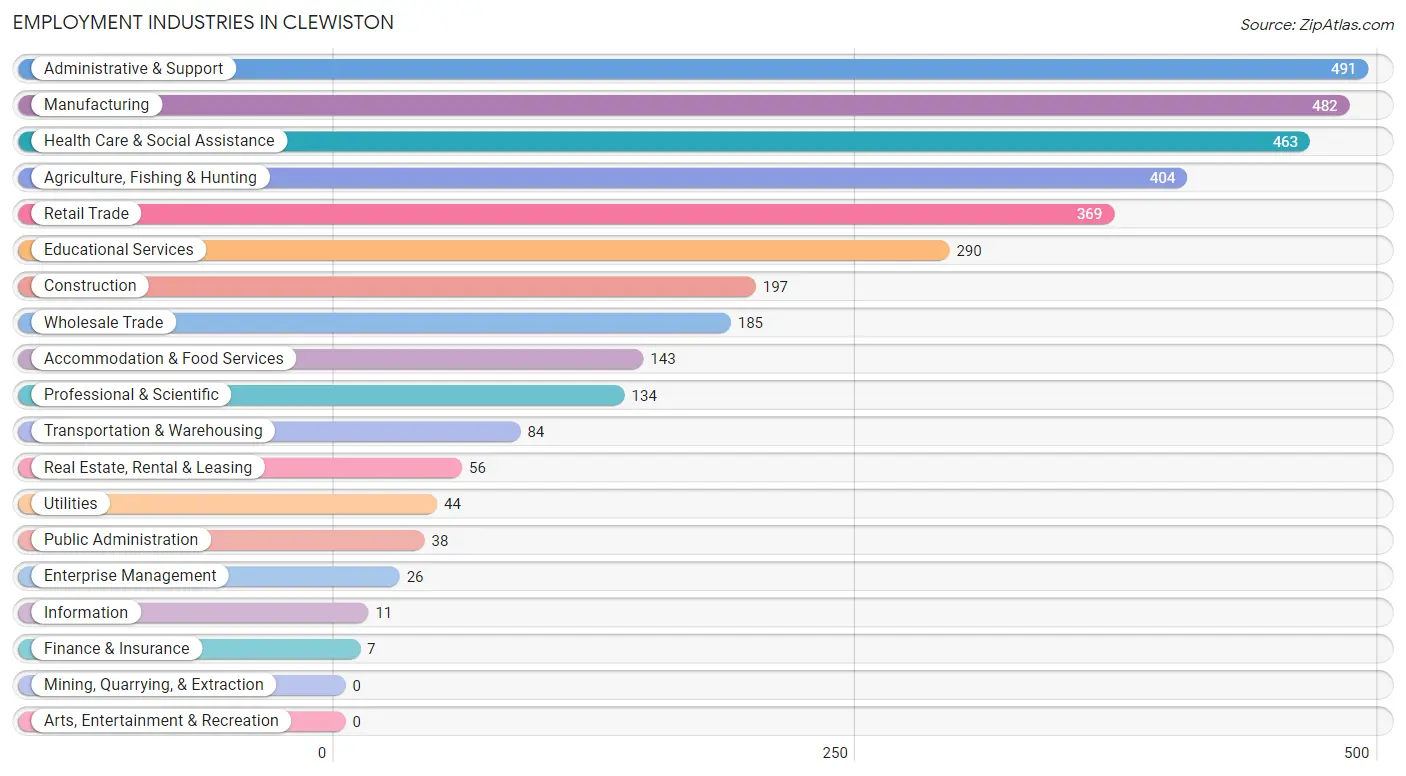
Employment Industries in Clewiston
The major employment industries in Clewiston include Administrative & Support (491 | 13.6%), Manufacturing (482 | 13.4%), Health Care & Social Assistance (463 | 12.8%), Agriculture, Fishing & Hunting (404 | 11.2%), and Retail Trade (369 | 10.2%).
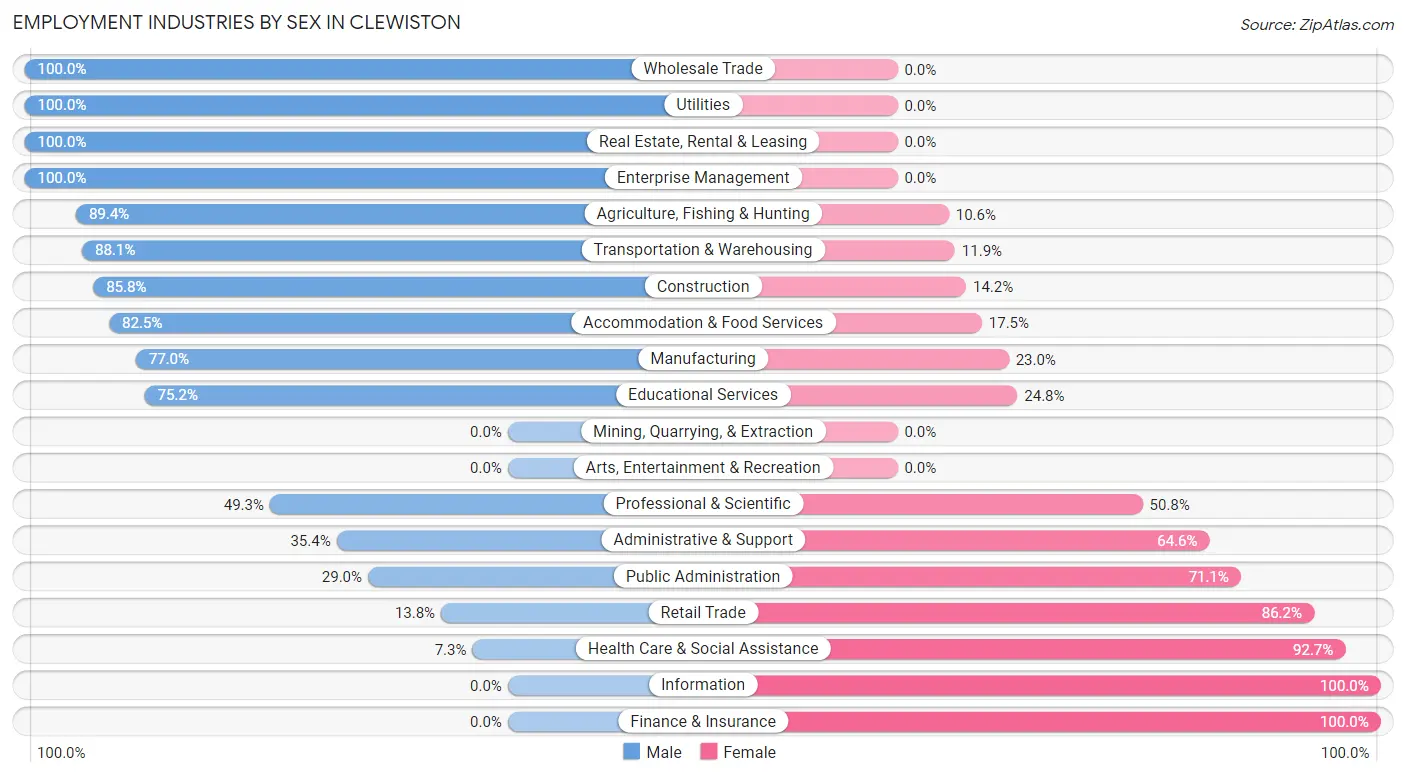
Employment Industries by Sex in Clewiston
The Clewiston industries that see more men than women are Wholesale Trade (100.0%), Utilities (100.0%), and Real Estate, Rental & Leasing (100.0%), whereas the industries that tend to have a higher number of women are Information (100.0%), Finance & Insurance (100.0%), and Health Care & Social Assistance (92.7%).
| Industry | Male | Female |
| Agriculture, Fishing & Hunting | 361 (89.4%) | 43 (10.6%) |
| Mining, Quarrying, & Extraction | 0 (0.0%) | 0 (0.0%) |
| Construction | 169 (85.8%) | 28 (14.2%) |
| Manufacturing | 371 (77.0%) | 111 (23.0%) |
| Wholesale Trade | 185 (100.0%) | 0 (0.0%) |
| Retail Trade | 51 (13.8%) | 318 (86.2%) |
| Transportation & Warehousing | 74 (88.1%) | 10 (11.9%) |
| Utilities | 44 (100.0%) | 0 (0.0%) |
| Information | 0 (0.0%) | 11 (100.0%) |
| Finance & Insurance | 0 (0.0%) | 7 (100.0%) |
| Real Estate, Rental & Leasing | 56 (100.0%) | 0 (0.0%) |
| Professional & Scientific | 66 (49.2%) | 68 (50.7%) |
| Enterprise Management | 26 (100.0%) | 0 (0.0%) |
| Administrative & Support | 174 (35.4%) | 317 (64.6%) |
| Educational Services | 218 (75.2%) | 72 (24.8%) |
| Health Care & Social Assistance | 34 (7.3%) | 429 (92.7%) |
| Arts, Entertainment & Recreation | 0 (0.0%) | 0 (0.0%) |
| Accommodation & Food Services | 118 (82.5%) | 25 (17.5%) |
| Public Administration | 11 (28.9%) | 27 (71.1%) |
| Total | 2,053 (57.0%) | 1,552 (43.0%) |
Education in Clewiston
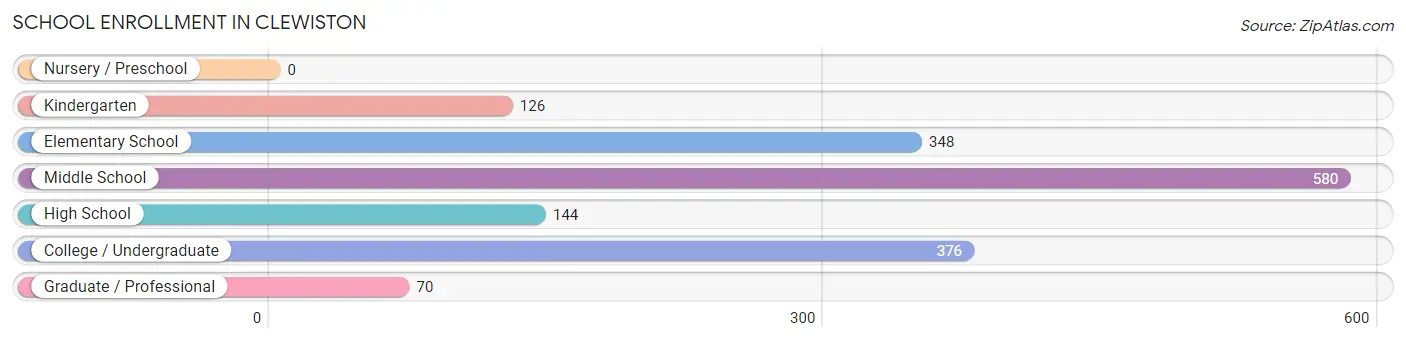
School Enrollment in Clewiston
The most common levels of schooling among the 1,644 students in Clewiston are middle school (580 | 35.3%), college / undergraduate (376 | 22.9%), and elementary school (348 | 21.2%).
| School Level | # Students | % Students |
| Nursery / Preschool | 0 | 0.0% |
| Kindergarten | 126 | 7.7% |
| Elementary School | 348 | 21.2% |
| Middle School | 580 | 35.3% |
| High School | 144 | 8.8% |
| College / Undergraduate | 376 | 22.9% |
| Graduate / Professional | 70 | 4.3% |
| Total | 1,644 | 100.0% |
School Enrollment by Age by Funding Source in Clewiston
Out of a total of 1,644 students who are enrolled in schools in Clewiston, 237 (14.4%) attend a private institution, while the remaining 1,407 (85.6%) are enrolled in public schools. The age group of 10 to 14 year olds has the highest likelihood of being enrolled in private schools, with 155 (23.8% in the age bracket) enrolled. Conversely, the age group of 18 to 19 year olds has the lowest likelihood of being enrolled in a private school, with 186 (100.0% in the age bracket) attending a public institution.
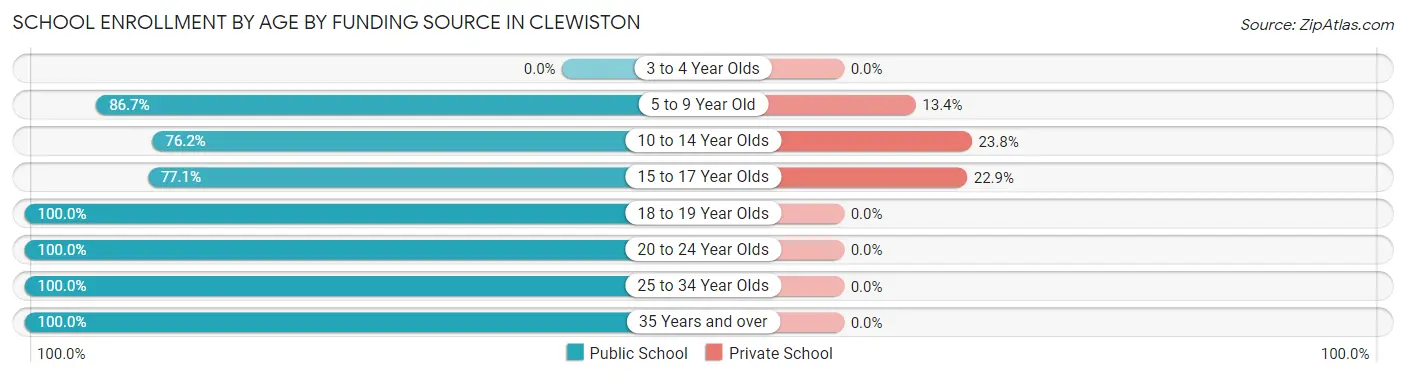
| Age Bracket | Public School | Private School |
| 3 to 4 Year Olds | 0 (0.0%) | 0 (0.0%) |
| 5 to 9 Year Old | 370 (86.7%) | 57 (13.4%) |
| 10 to 14 Year Olds | 496 (76.2%) | 155 (23.8%) |
| 15 to 17 Year Olds | 84 (77.1%) | 25 (22.9%) |
| 18 to 19 Year Olds | 186 (100.0%) | 0 (0.0%) |
| 20 to 24 Year Olds | 153 (100.0%) | 0 (0.0%) |
| 25 to 34 Year Olds | 107 (100.0%) | 0 (0.0%) |
| 35 Years and over | 11 (100.0%) | 0 (0.0%) |
| Total | 1,407 (85.6%) | 237 (14.4%) |
Educational Attainment by Field of Study in Clewiston
Business (155 | 25.5%), education (150 | 24.7%), bio, nature & agricultural (106 | 17.4%), psychology (70 | 11.5%), and science & technology (40 | 6.6%) are the most common fields of study among 608 individuals in Clewiston who have obtained a bachelor's degree or higher.
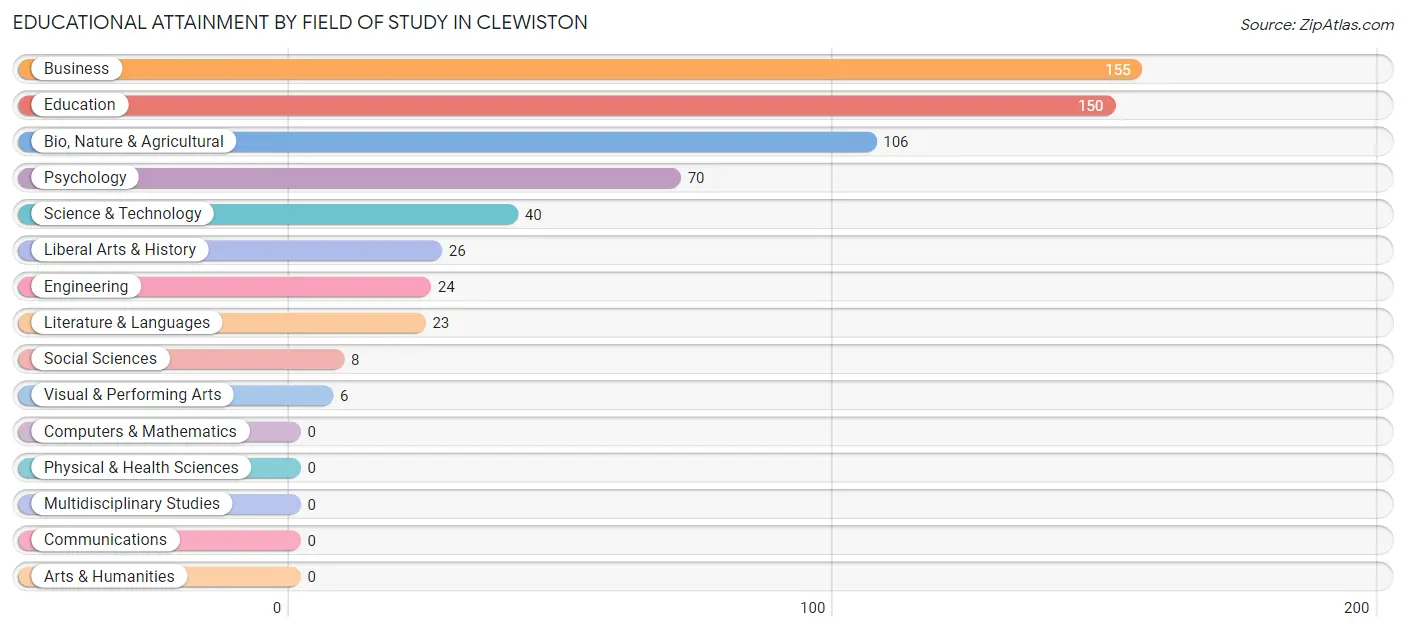
| Field of Study | # Graduates | % Graduates |
| Computers & Mathematics | 0 | 0.0% |
| Bio, Nature & Agricultural | 106 | 17.4% |
| Physical & Health Sciences | 0 | 0.0% |
| Psychology | 70 | 11.5% |
| Social Sciences | 8 | 1.3% |
| Engineering | 24 | 4.0% |
| Multidisciplinary Studies | 0 | 0.0% |
| Science & Technology | 40 | 6.6% |
| Business | 155 | 25.5% |
| Education | 150 | 24.7% |
| Literature & Languages | 23 | 3.8% |
| Liberal Arts & History | 26 | 4.3% |
| Visual & Performing Arts | 6 | 1.0% |
| Communications | 0 | 0.0% |
| Arts & Humanities | 0 | 0.0% |
| Total | 608 | 100.0% |
Transportation & Commute in Clewiston
Vehicle Availability by Sex in Clewiston
The most prevalent vehicle ownership categories in Clewiston are males with 1 vehicle (751, accounting for 37.4%) and females with 1 vehicle (398, making up 48.8%).
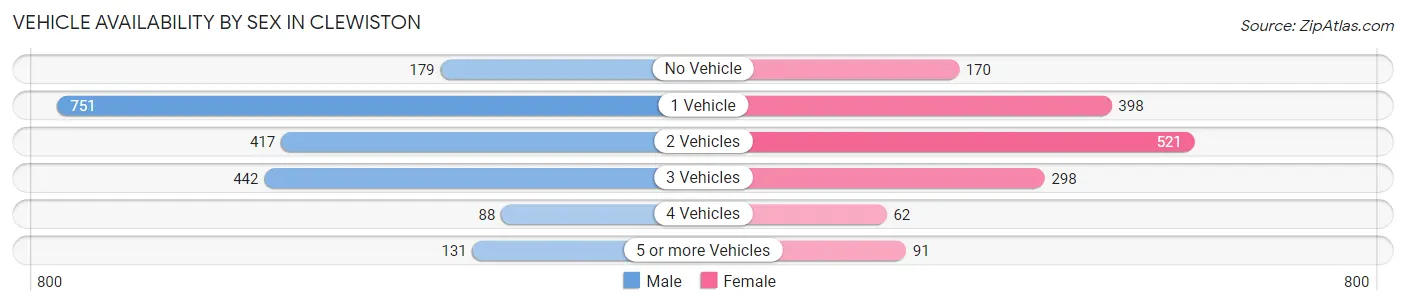
| Vehicles Available | Male | Female |
| No Vehicle | 179 (8.9%) | 170 (11.0%) |
| 1 Vehicle | 751 (37.4%) | 398 (25.8%) |
| 2 Vehicles | 417 (20.8%) | 521 (33.8%) |
| 3 Vehicles | 442 (22.0%) | 298 (19.4%) |
| 4 Vehicles | 88 (4.4%) | 62 (4.0%) |
| 5 or more Vehicles | 131 (6.5%) | 91 (5.9%) |
| Total | 2,008 (100.0%) | 1,540 (100.0%) |
Commute Time in Clewiston
The most frequently occuring commute durations in Clewiston are 10 to 14 minutes (748 commuters, 21.6%), 5 to 9 minutes (645 commuters, 18.6%), and less than 5 minutes (400 commuters, 11.6%).
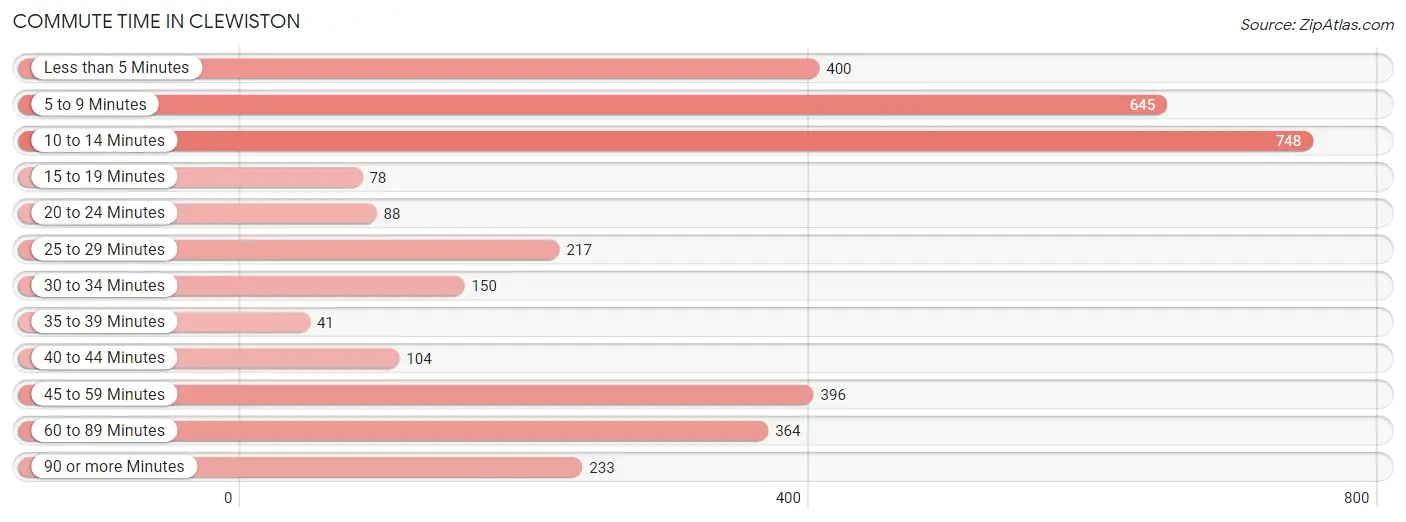
| Commute Time | # Commuters | % Commuters |
| Less than 5 Minutes | 400 | 11.6% |
| 5 to 9 Minutes | 645 | 18.6% |
| 10 to 14 Minutes | 748 | 21.6% |
| 15 to 19 Minutes | 78 | 2.2% |
| 20 to 24 Minutes | 88 | 2.5% |
| 25 to 29 Minutes | 217 | 6.3% |
| 30 to 34 Minutes | 150 | 4.3% |
| 35 to 39 Minutes | 41 | 1.2% |
| 40 to 44 Minutes | 104 | 3.0% |
| 45 to 59 Minutes | 396 | 11.4% |
| 60 to 89 Minutes | 364 | 10.5% |
| 90 or more Minutes | 233 | 6.7% |
Commute Time by Sex in Clewiston
The most common commute times in Clewiston are 10 to 14 minutes (467 commuters, 23.6%) for males and 5 to 9 minutes (351 commuters, 23.6%) for females.
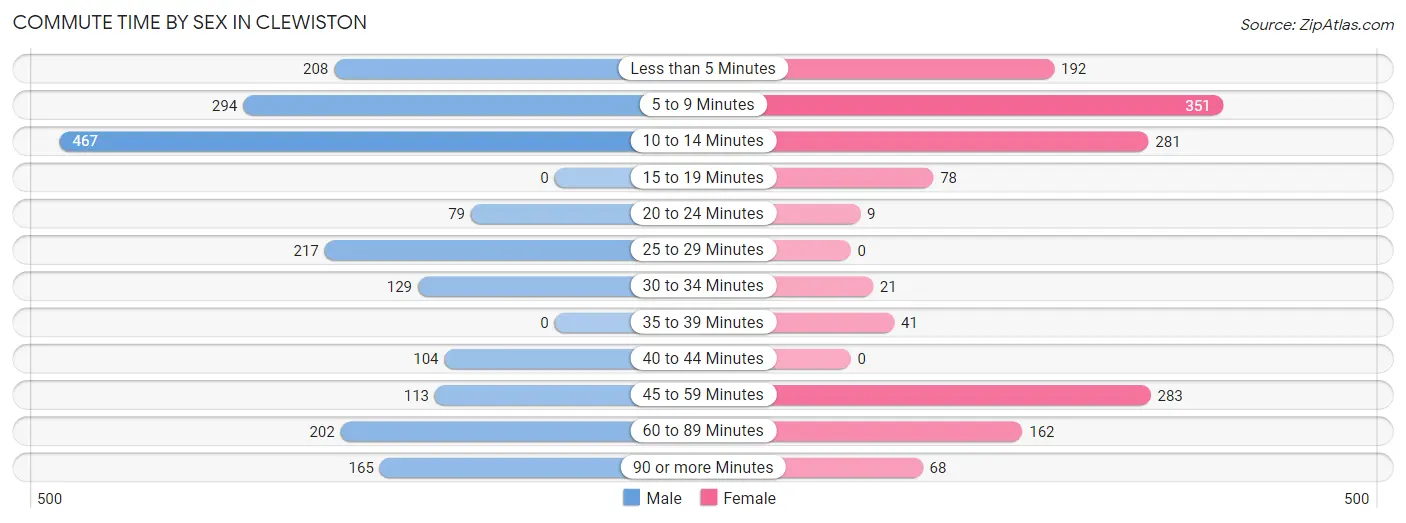
| Commute Time | Male | Female |
| Less than 5 Minutes | 208 (10.5%) | 192 (12.9%) |
| 5 to 9 Minutes | 294 (14.9%) | 351 (23.6%) |
| 10 to 14 Minutes | 467 (23.6%) | 281 (18.9%) |
| 15 to 19 Minutes | 0 (0.0%) | 78 (5.2%) |
| 20 to 24 Minutes | 79 (4.0%) | 9 (0.6%) |
| 25 to 29 Minutes | 217 (11.0%) | 0 (0.0%) |
| 30 to 34 Minutes | 129 (6.5%) | 21 (1.4%) |
| 35 to 39 Minutes | 0 (0.0%) | 41 (2.8%) |
| 40 to 44 Minutes | 104 (5.3%) | 0 (0.0%) |
| 45 to 59 Minutes | 113 (5.7%) | 283 (19.0%) |
| 60 to 89 Minutes | 202 (10.2%) | 162 (10.9%) |
| 90 or more Minutes | 165 (8.3%) | 68 (4.6%) |
Time of Departure to Work by Sex in Clewiston
The most frequent times of departure to work in Clewiston are 6:00 AM to 6:29 AM (368, 18.6%) for males and 6:30 AM to 6:59 AM (418, 28.1%) for females.
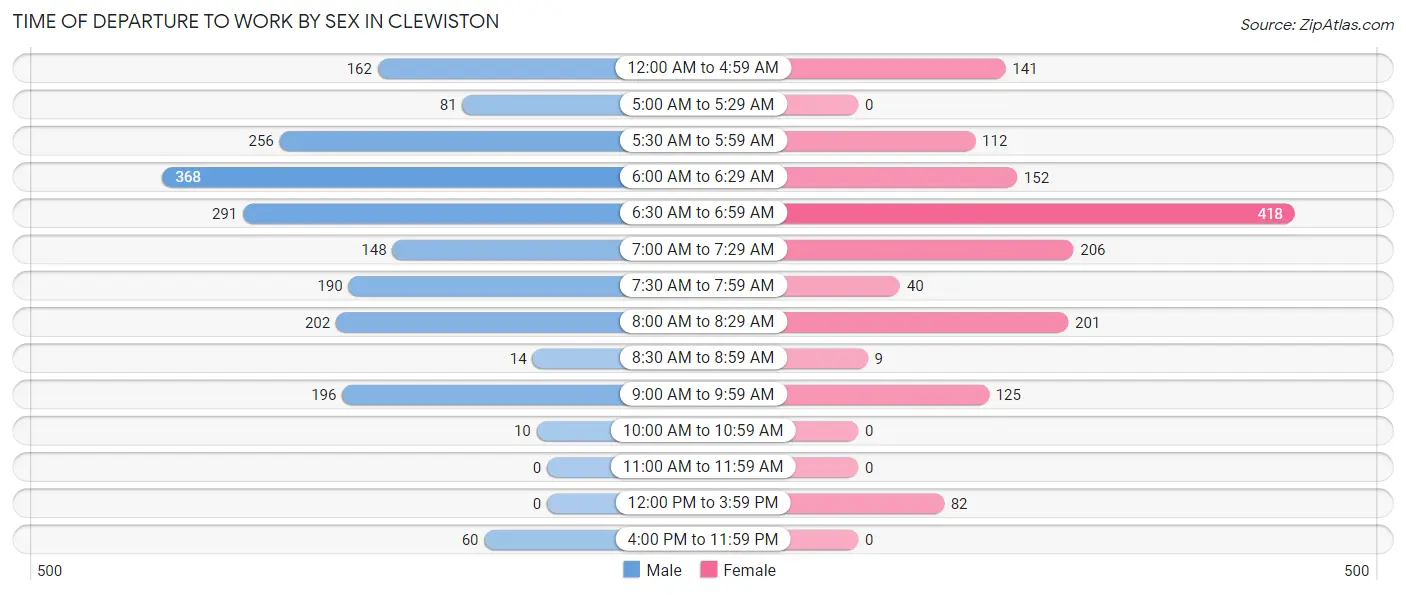
| Time of Departure | Male | Female |
| 12:00 AM to 4:59 AM | 162 (8.2%) | 141 (9.5%) |
| 5:00 AM to 5:29 AM | 81 (4.1%) | 0 (0.0%) |
| 5:30 AM to 5:59 AM | 256 (12.9%) | 112 (7.5%) |
| 6:00 AM to 6:29 AM | 368 (18.6%) | 152 (10.2%) |
| 6:30 AM to 6:59 AM | 291 (14.7%) | 418 (28.1%) |
| 7:00 AM to 7:29 AM | 148 (7.5%) | 206 (13.9%) |
| 7:30 AM to 7:59 AM | 190 (9.6%) | 40 (2.7%) |
| 8:00 AM to 8:29 AM | 202 (10.2%) | 201 (13.5%) |
| 8:30 AM to 8:59 AM | 14 (0.7%) | 9 (0.6%) |
| 9:00 AM to 9:59 AM | 196 (9.9%) | 125 (8.4%) |
| 10:00 AM to 10:59 AM | 10 (0.5%) | 0 (0.0%) |
| 11:00 AM to 11:59 AM | 0 (0.0%) | 0 (0.0%) |
| 12:00 PM to 3:59 PM | 0 (0.0%) | 82 (5.5%) |
| 4:00 PM to 11:59 PM | 60 (3.0%) | 0 (0.0%) |
| Total | 1,978 (100.0%) | 1,486 (100.0%) |
Housing Occupancy in Clewiston
Occupancy by Ownership in Clewiston
Of the total 2,641 dwellings in Clewiston, owner-occupied units account for 1,616 (61.2%), while renter-occupied units make up 1,025 (38.8%).
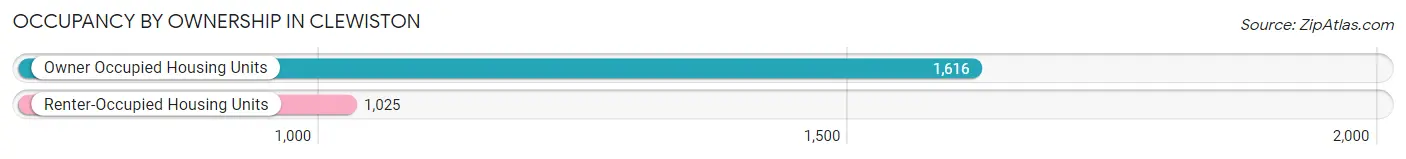
| Occupancy | # Housing Units | % Housing Units |
| Owner Occupied Housing Units | 1,616 | 61.2% |
| Renter-Occupied Housing Units | 1,025 | 38.8% |
| Total Occupied Housing Units | 2,641 | 100.0% |
Occupancy by Household Size in Clewiston
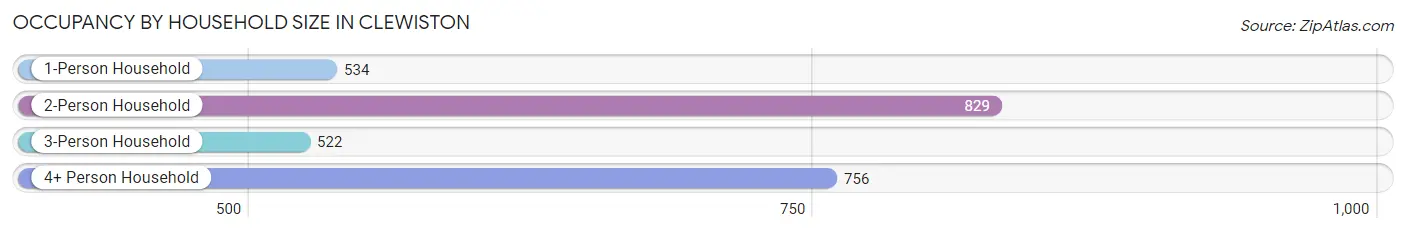
| Household Size | # Housing Units | % Housing Units |
| 1-Person Household | 534 | 20.2% |
| 2-Person Household | 829 | 31.4% |
| 3-Person Household | 522 | 19.8% |
| 4+ Person Household | 756 | 28.6% |
| Total Housing Units | 2,641 | 100.0% |
Occupancy by Ownership by Household Size in Clewiston
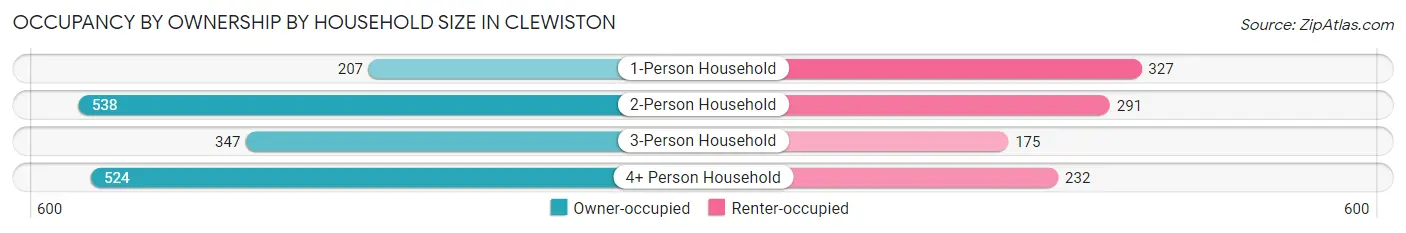
| Household Size | Owner-occupied | Renter-occupied |
| 1-Person Household | 207 (38.8%) | 327 (61.2%) |
| 2-Person Household | 538 (64.9%) | 291 (35.1%) |
| 3-Person Household | 347 (66.5%) | 175 (33.5%) |
| 4+ Person Household | 524 (69.3%) | 232 (30.7%) |
| Total Housing Units | 1,616 (61.2%) | 1,025 (38.8%) |
Occupancy by Educational Attainment in Clewiston
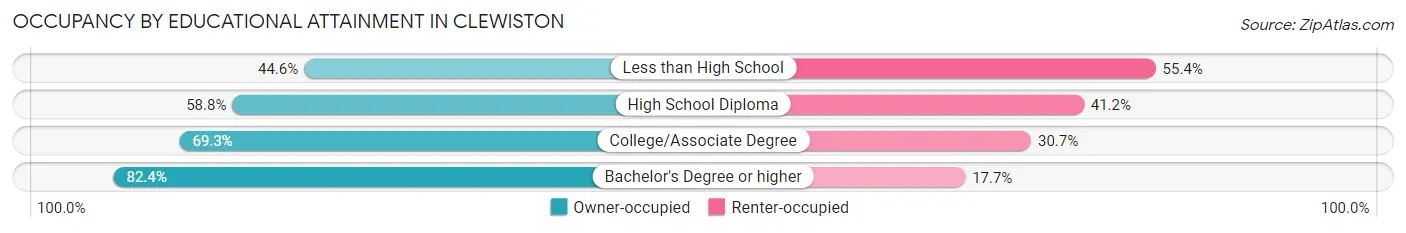
| Household Size | Owner-occupied | Renter-occupied |
| Less than High School | 280 (44.6%) | 348 (55.4%) |
| High School Diploma | 543 (58.8%) | 380 (41.2%) |
| College/Associate Degree | 555 (69.3%) | 246 (30.7%) |
| Bachelor's Degree or higher | 238 (82.4%) | 51 (17.6%) |
Occupancy by Age of Householder in Clewiston
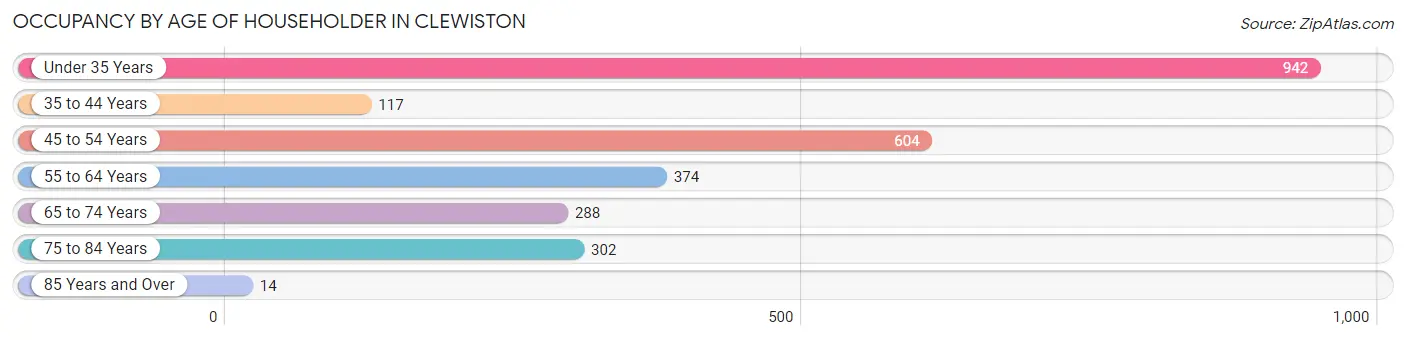
| Age Bracket | # Households | % Households |
| Under 35 Years | 942 | 35.7% |
| 35 to 44 Years | 117 | 4.4% |
| 45 to 54 Years | 604 | 22.9% |
| 55 to 64 Years | 374 | 14.2% |
| 65 to 74 Years | 288 | 10.9% |
| 75 to 84 Years | 302 | 11.4% |
| 85 Years and Over | 14 | 0.5% |
| Total | 2,641 | 100.0% |
Housing Finances in Clewiston
Median Income by Occupancy in Clewiston
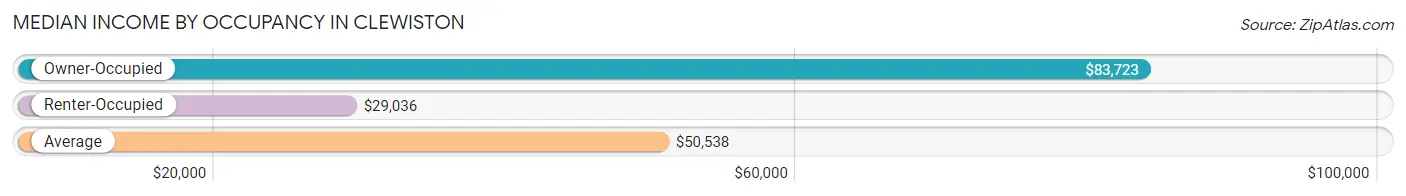
| Occupancy Type | # Households | Median Income |
| Owner-Occupied | 1,616 (61.2%) | $83,723 |
| Renter-Occupied | 1,025 (38.8%) | $29,036 |
| Average | 2,641 (100.0%) | $50,538 |
Occupancy by Householder Income Bracket in Clewiston
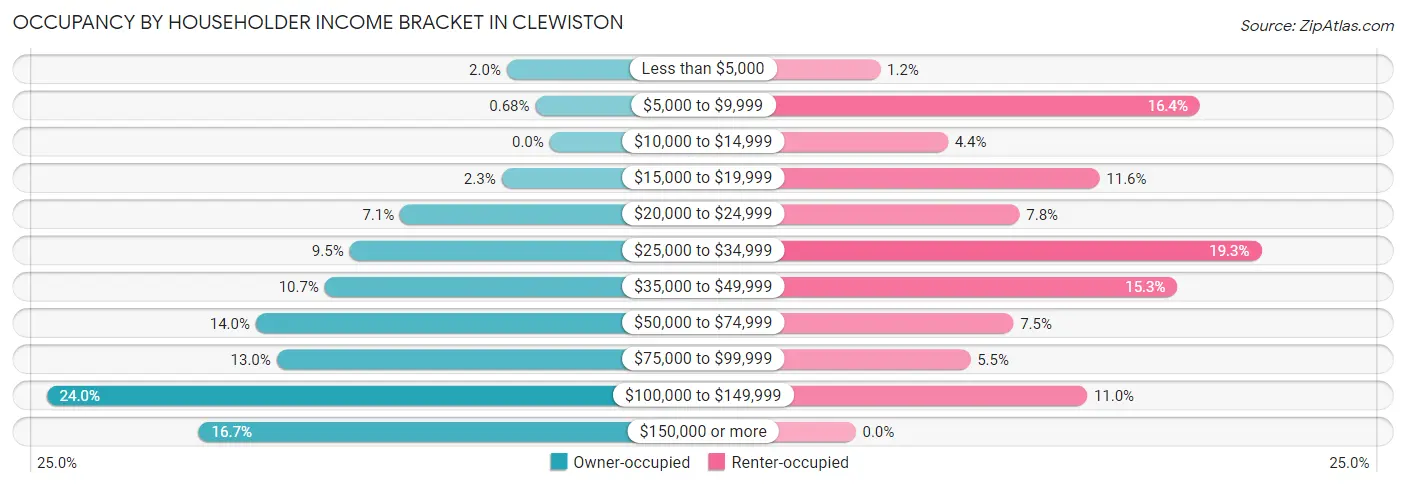
| Income Bracket | Owner-occupied | Renter-occupied |
| Less than $5,000 | 33 (2.0%) | 12 (1.2%) |
| $5,000 to $9,999 | 11 (0.7%) | 168 (16.4%) |
| $10,000 to $14,999 | 0 (0.0%) | 45 (4.4%) |
| $15,000 to $19,999 | 37 (2.3%) | 119 (11.6%) |
| $20,000 to $24,999 | 115 (7.1%) | 80 (7.8%) |
| $25,000 to $34,999 | 154 (9.5%) | 198 (19.3%) |
| $35,000 to $49,999 | 173 (10.7%) | 157 (15.3%) |
| $50,000 to $74,999 | 226 (14.0%) | 77 (7.5%) |
| $75,000 to $99,999 | 210 (13.0%) | 56 (5.5%) |
| $100,000 to $149,999 | 387 (23.9%) | 113 (11.0%) |
| $150,000 or more | 270 (16.7%) | 0 (0.0%) |
| Total | 1,616 (100.0%) | 1,025 (100.0%) |
Monthly Housing Cost Tiers in Clewiston
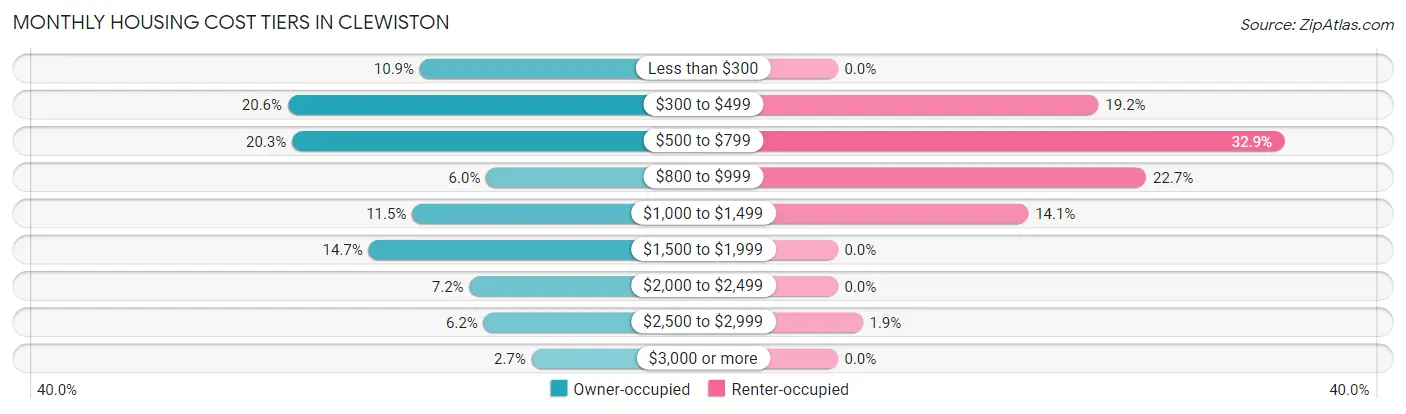
| Monthly Cost | Owner-occupied | Renter-occupied |
| Less than $300 | 176 (10.9%) | 0 (0.0%) |
| $300 to $499 | 333 (20.6%) | 197 (19.2%) |
| $500 to $799 | 328 (20.3%) | 337 (32.9%) |
| $800 to $999 | 97 (6.0%) | 233 (22.7%) |
| $1,000 to $1,499 | 185 (11.5%) | 144 (14.1%) |
| $1,500 to $1,999 | 237 (14.7%) | 0 (0.0%) |
| $2,000 to $2,499 | 117 (7.2%) | 0 (0.0%) |
| $2,500 to $2,999 | 100 (6.2%) | 19 (1.8%) |
| $3,000 or more | 43 (2.7%) | 0 (0.0%) |
| Total | 1,616 (100.0%) | 1,025 (100.0%) |
Physical Housing Characteristics in Clewiston
Housing Structures in Clewiston
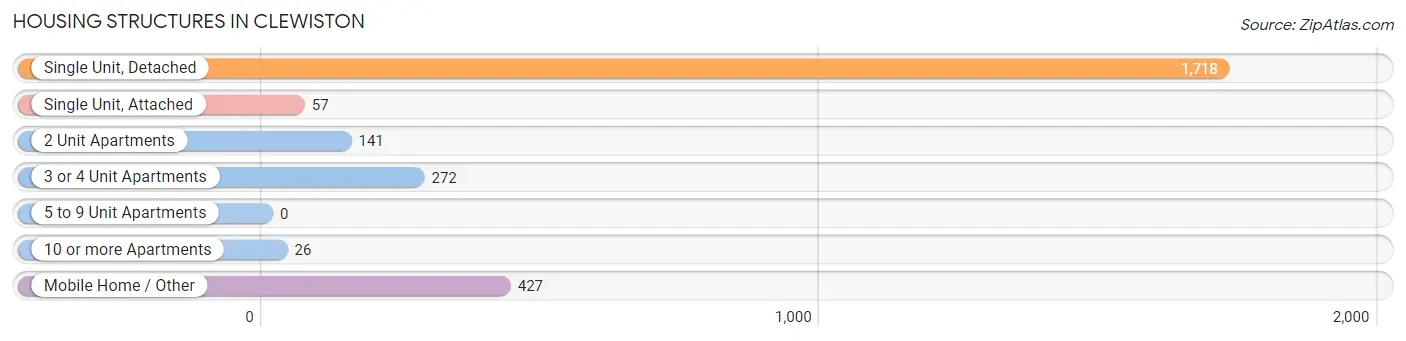
| Structure Type | # Housing Units | % Housing Units |
| Single Unit, Detached | 1,718 | 65.0% |
| Single Unit, Attached | 57 | 2.2% |
| 2 Unit Apartments | 141 | 5.3% |
| 3 or 4 Unit Apartments | 272 | 10.3% |
| 5 to 9 Unit Apartments | 0 | 0.0% |
| 10 or more Apartments | 26 | 1.0% |
| Mobile Home / Other | 427 | 16.2% |
| Total | 2,641 | 100.0% |
Housing Structures by Occupancy in Clewiston
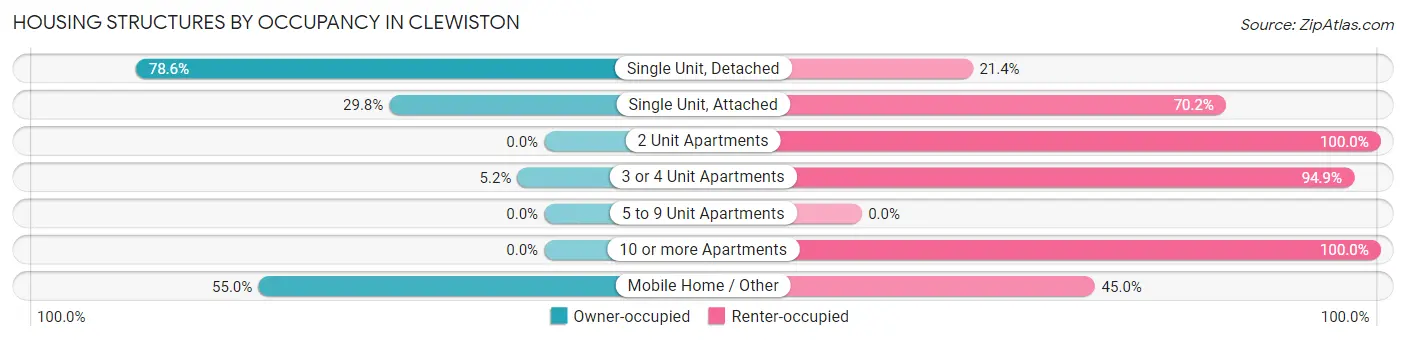
| Structure Type | Owner-occupied | Renter-occupied |
| Single Unit, Detached | 1,350 (78.6%) | 368 (21.4%) |
| Single Unit, Attached | 17 (29.8%) | 40 (70.2%) |
| 2 Unit Apartments | 0 (0.0%) | 141 (100.0%) |
| 3 or 4 Unit Apartments | 14 (5.1%) | 258 (94.9%) |
| 5 to 9 Unit Apartments | 0 (0.0%) | 0 (0.0%) |
| 10 or more Apartments | 0 (0.0%) | 26 (100.0%) |
| Mobile Home / Other | 235 (55.0%) | 192 (45.0%) |
| Total | 1,616 (61.2%) | 1,025 (38.8%) |
Housing Structures by Number of Rooms in Clewiston
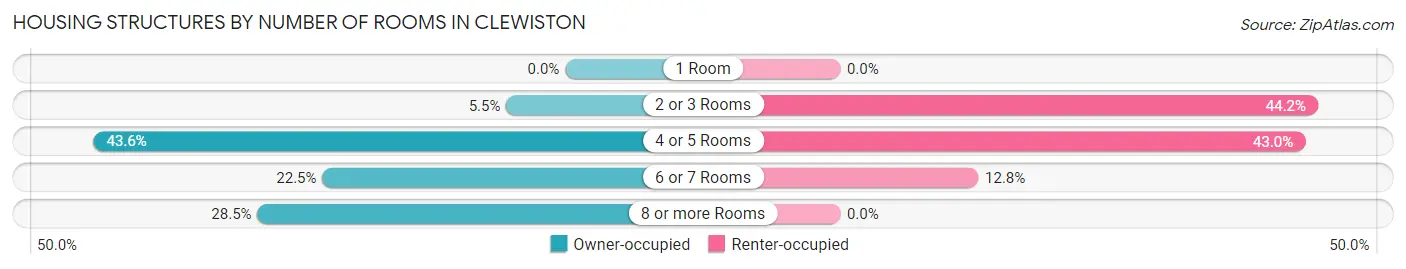
| Number of Rooms | Owner-occupied | Renter-occupied |
| 1 Room | 0 (0.0%) | 0 (0.0%) |
| 2 or 3 Rooms | 88 (5.4%) | 453 (44.2%) |
| 4 or 5 Rooms | 705 (43.6%) | 441 (43.0%) |
| 6 or 7 Rooms | 363 (22.5%) | 131 (12.8%) |
| 8 or more Rooms | 460 (28.5%) | 0 (0.0%) |
| Total | 1,616 (100.0%) | 1,025 (100.0%) |
Housing Structure by Heating Type in Clewiston
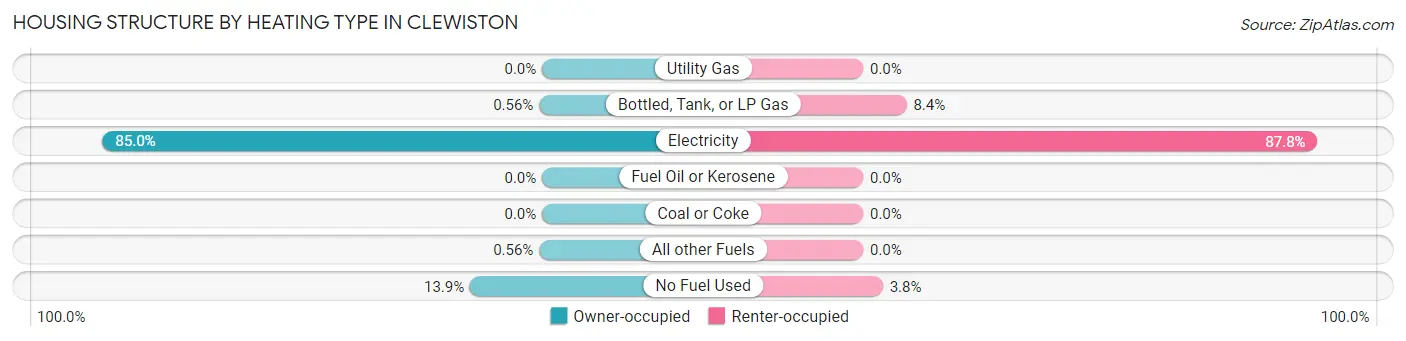
| Heating Type | Owner-occupied | Renter-occupied |
| Utility Gas | 0 (0.0%) | 0 (0.0%) |
| Bottled, Tank, or LP Gas | 9 (0.6%) | 86 (8.4%) |
| Electricity | 1,373 (85.0%) | 900 (87.8%) |
| Fuel Oil or Kerosene | 0 (0.0%) | 0 (0.0%) |
| Coal or Coke | 0 (0.0%) | 0 (0.0%) |
| All other Fuels | 9 (0.6%) | 0 (0.0%) |
| No Fuel Used | 225 (13.9%) | 39 (3.8%) |
| Total | 1,616 (100.0%) | 1,025 (100.0%) |
Household Vehicle Usage in Clewiston
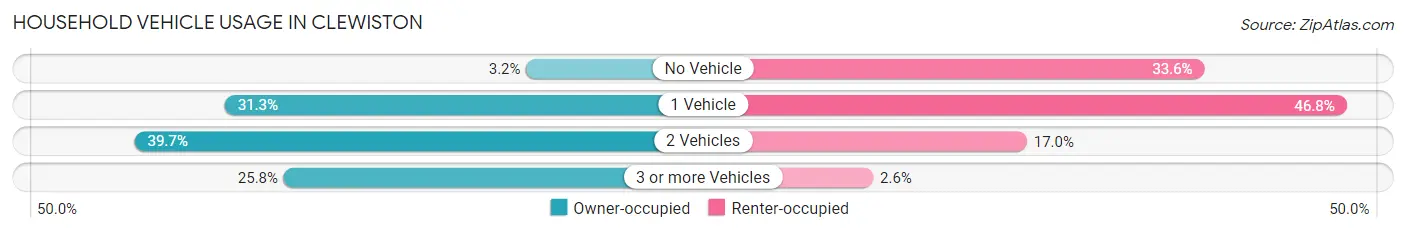
| Vehicles per Household | Owner-occupied | Renter-occupied |
| No Vehicle | 51 (3.2%) | 344 (33.6%) |
| 1 Vehicle | 506 (31.3%) | 480 (46.8%) |
| 2 Vehicles | 642 (39.7%) | 174 (17.0%) |
| 3 or more Vehicles | 417 (25.8%) | 27 (2.6%) |
| Total | 1,616 (100.0%) | 1,025 (100.0%) |
Real Estate & Mortgages in Clewiston
Real Estate and Mortgage Overview in Clewiston
| Characteristic | Without Mortgage | With Mortgage |
| Housing Units | 792 | 824 |
| Median Property Value | - | - |
| Median Household Income | $54,019 | $113 |
| Monthly Housing Costs | $460 | $43 |
| Real Estate Taxes | $1,133 | $0 |
Property Value by Mortgage Status in Clewiston
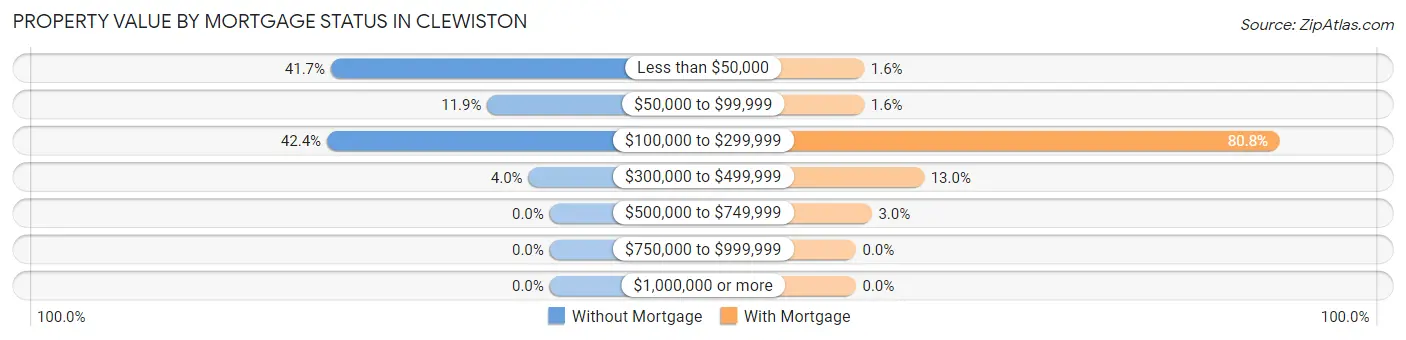
| Property Value | Without Mortgage | With Mortgage |
| Less than $50,000 | 330 (41.7%) | 13 (1.6%) |
| $50,000 to $99,999 | 94 (11.9%) | 13 (1.6%) |
| $100,000 to $299,999 | 336 (42.4%) | 666 (80.8%) |
| $300,000 to $499,999 | 32 (4.0%) | 107 (13.0%) |
| $500,000 to $749,999 | 0 (0.0%) | 25 (3.0%) |
| $750,000 to $999,999 | 0 (0.0%) | 0 (0.0%) |
| $1,000,000 or more | 0 (0.0%) | 0 (0.0%) |
| Total | 792 (100.0%) | 824 (100.0%) |
Household Income by Mortgage Status in Clewiston
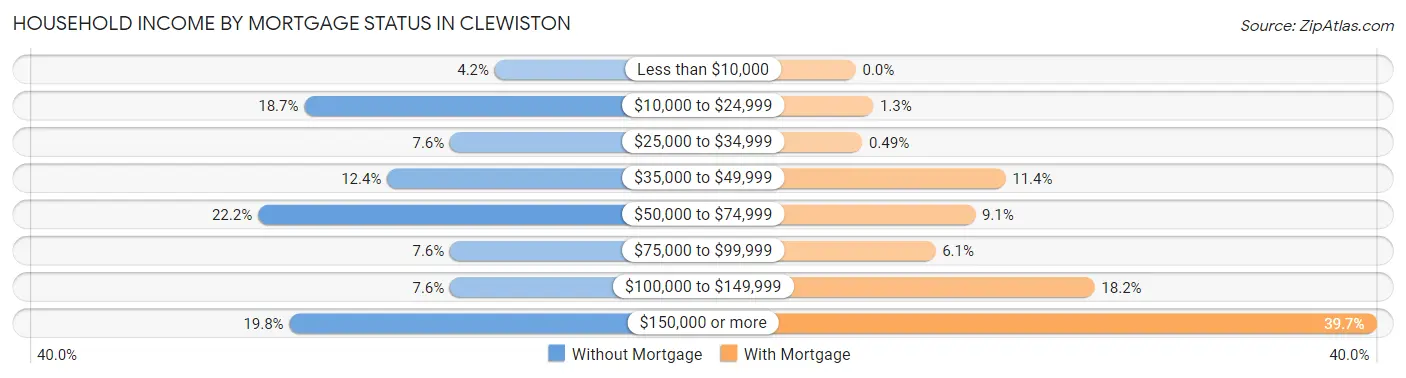
| Household Income | Without Mortgage | With Mortgage |
| Less than $10,000 | 33 (4.2%) | 0 (0.0%) |
| $10,000 to $24,999 | 148 (18.7%) | 11 (1.3%) |
| $25,000 to $34,999 | 60 (7.6%) | 4 (0.5%) |
| $35,000 to $49,999 | 98 (12.4%) | 94 (11.4%) |
| $50,000 to $74,999 | 176 (22.2%) | 75 (9.1%) |
| $75,000 to $99,999 | 60 (7.6%) | 50 (6.1%) |
| $100,000 to $149,999 | 60 (7.6%) | 150 (18.2%) |
| $150,000 or more | 157 (19.8%) | 327 (39.7%) |
| Total | 792 (100.0%) | 824 (100.0%) |
Property Value to Household Income Ratio in Clewiston
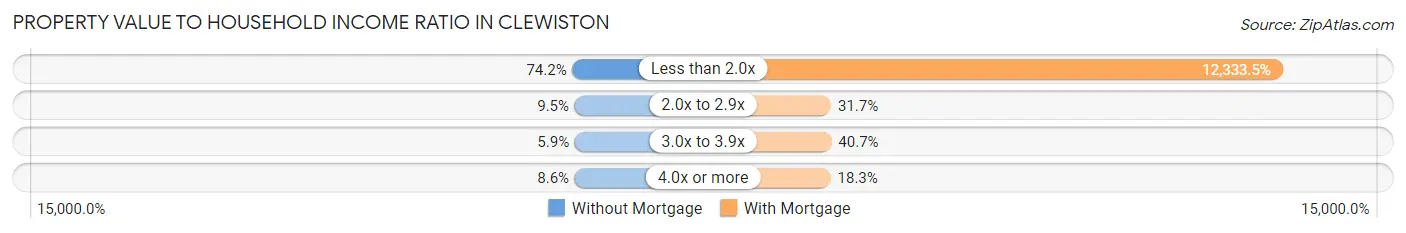
| Value-to-Income Ratio | Without Mortgage | With Mortgage |
| Less than 2.0x | 588 (74.2%) | 101,628 (12,333.5%) |
| 2.0x to 2.9x | 75 (9.5%) | 261 (31.7%) |
| 3.0x to 3.9x | 47 (5.9%) | 335 (40.7%) |
| 4.0x or more | 68 (8.6%) | 151 (18.3%) |
| Total | 792 (100.0%) | 824 (100.0%) |
Real Estate Taxes by Mortgage Status in Clewiston
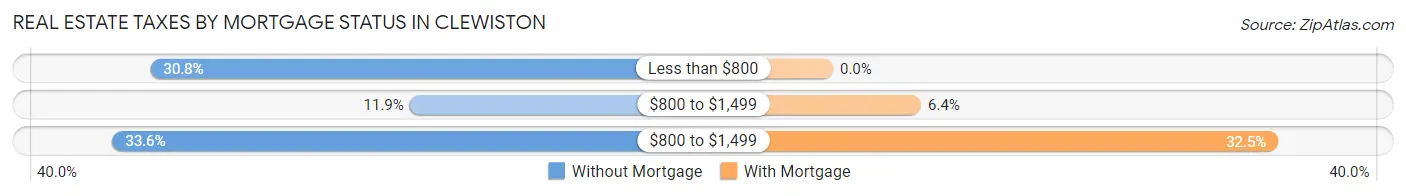
| Property Taxes | Without Mortgage | With Mortgage |
| Less than $800 | 244 (30.8%) | 0 (0.0%) |
| $800 to $1,499 | 94 (11.9%) | 53 (6.4%) |
| $800 to $1,499 | 266 (33.6%) | 268 (32.5%) |
| Total | 792 (100.0%) | 824 (100.0%) |
Health & Disability in Clewiston
Health Insurance Coverage by Age in Clewiston
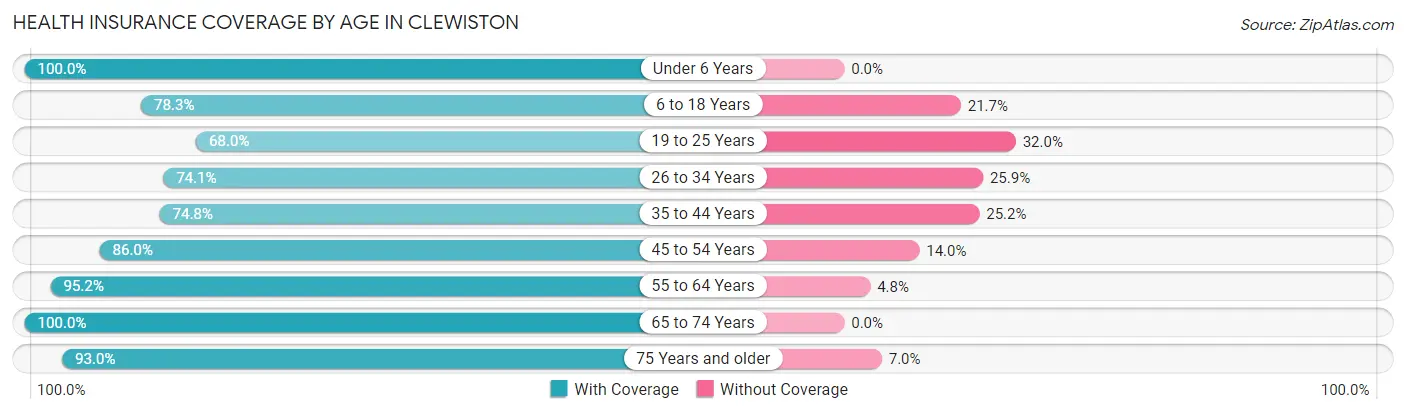
| Age Bracket | With Coverage | Without Coverage |
| Under 6 Years | 342 (100.0%) | 0 (0.0%) |
| 6 to 18 Years | 966 (78.3%) | 268 (21.7%) |
| 19 to 25 Years | 615 (68.0%) | 289 (32.0%) |
| 26 to 34 Years | 751 (74.1%) | 262 (25.9%) |
| 35 to 44 Years | 529 (74.8%) | 178 (25.2%) |
| 45 to 54 Years | 1,009 (86.0%) | 164 (14.0%) |
| 55 to 64 Years | 689 (95.2%) | 35 (4.8%) |
| 65 to 74 Years | 488 (100.0%) | 0 (0.0%) |
| 75 Years and older | 466 (93.0%) | 35 (7.0%) |
| Total | 5,855 (82.6%) | 1,231 (17.4%) |
Health Insurance Coverage by Citizenship Status in Clewiston
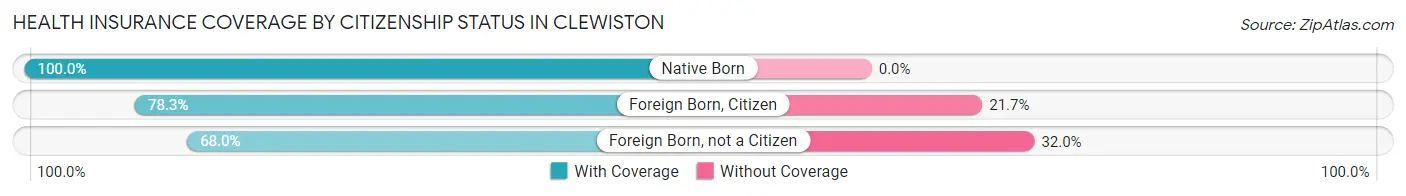
| Citizenship Status | With Coverage | Without Coverage |
| Native Born | 342 (100.0%) | 0 (0.0%) |
| Foreign Born, Citizen | 966 (78.3%) | 268 (21.7%) |
| Foreign Born, not a Citizen | 615 (68.0%) | 289 (32.0%) |
Health Insurance Coverage by Household Income in Clewiston
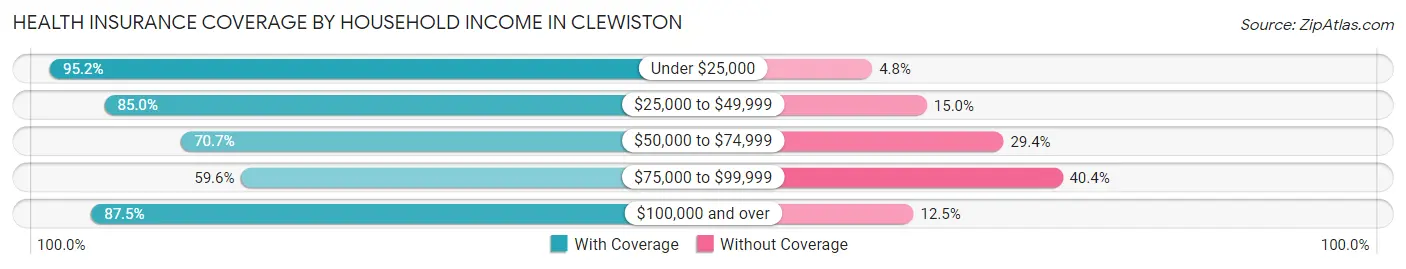
| Household Income | With Coverage | Without Coverage |
| Under $25,000 | 1,157 (95.2%) | 58 (4.8%) |
| $25,000 to $49,999 | 1,519 (85.0%) | 268 (15.0%) |
| $50,000 to $74,999 | 561 (70.7%) | 233 (29.3%) |
| $75,000 to $99,999 | 550 (59.6%) | 373 (40.4%) |
| $100,000 and over | 2,065 (87.5%) | 295 (12.5%) |
Public vs Private Health Insurance Coverage by Age in Clewiston
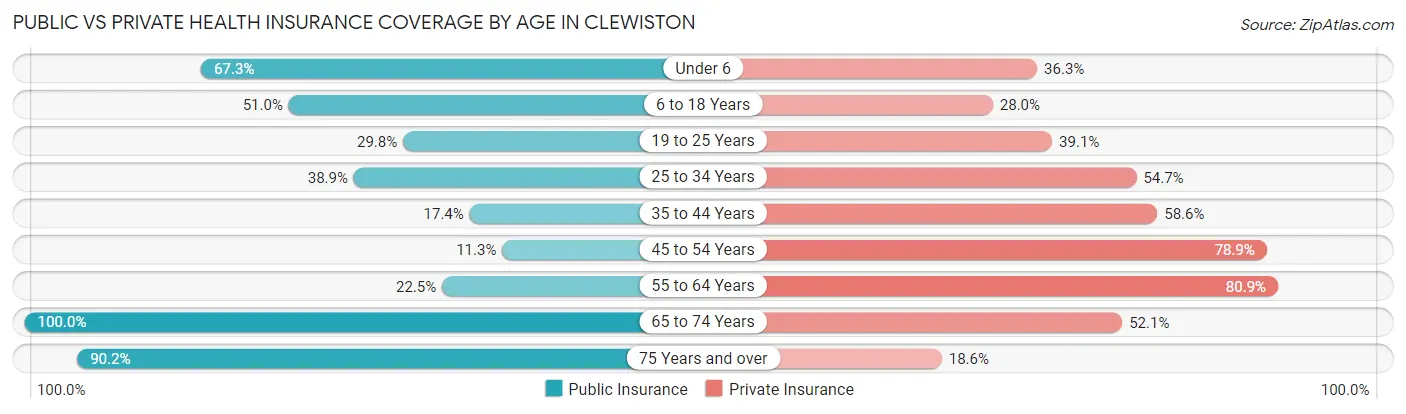
| Age Bracket | Public Insurance | Private Insurance |
| Under 6 | 230 (67.2%) | 124 (36.3%) |
| 6 to 18 Years | 629 (51.0%) | 346 (28.0%) |
| 19 to 25 Years | 269 (29.8%) | 353 (39.1%) |
| 25 to 34 Years | 394 (38.9%) | 554 (54.7%) |
| 35 to 44 Years | 123 (17.4%) | 414 (58.6%) |
| 45 to 54 Years | 133 (11.3%) | 925 (78.9%) |
| 55 to 64 Years | 163 (22.5%) | 586 (80.9%) |
| 65 to 74 Years | 488 (100.0%) | 254 (52.0%) |
| 75 Years and over | 452 (90.2%) | 93 (18.6%) |
| Total | 2,881 (40.7%) | 3,649 (51.5%) |
Disability Status by Sex by Age in Clewiston
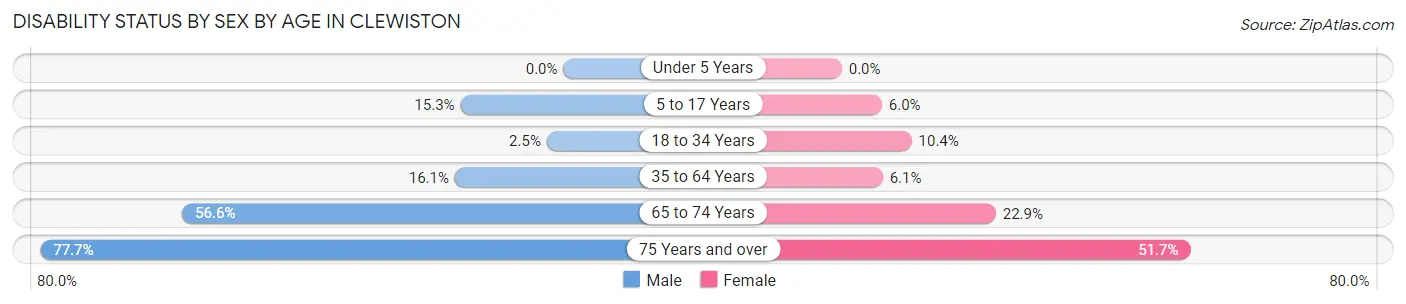
| Age Bracket | Male | Female |
| Under 5 Years | 0 (0.0%) | 0 (0.0%) |
| 5 to 17 Years | 109 (15.3%) | 30 (5.9%) |
| 18 to 34 Years | 27 (2.5%) | 93 (10.4%) |
| 35 to 64 Years | 205 (16.1%) | 81 (6.1%) |
| 65 to 74 Years | 150 (56.6%) | 51 (22.9%) |
| 75 Years and over | 233 (77.7%) | 104 (51.7%) |
Disability Class by Sex by Age in Clewiston
Disability Class: Hearing Difficulty
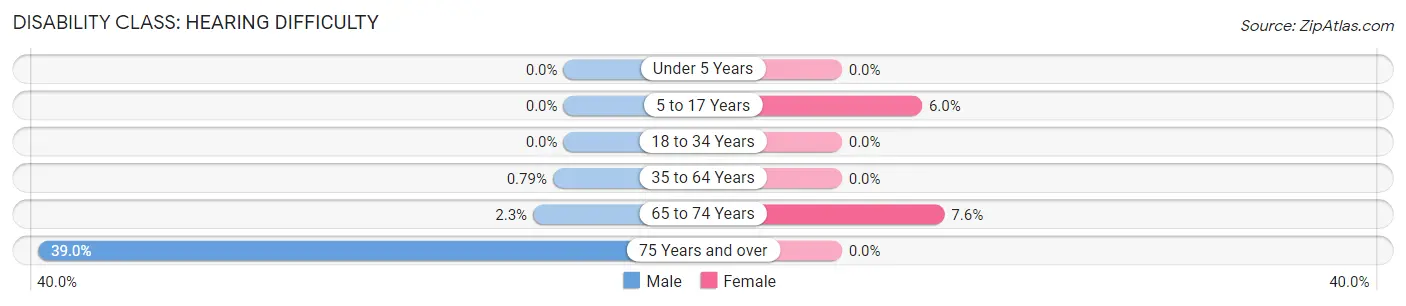
| Age Bracket | Male | Female |
| Under 5 Years | 0 (0.0%) | 0 (0.0%) |
| 5 to 17 Years | 0 (0.0%) | 30 (5.9%) |
| 18 to 34 Years | 0 (0.0%) | 0 (0.0%) |
| 35 to 64 Years | 10 (0.8%) | 0 (0.0%) |
| 65 to 74 Years | 6 (2.3%) | 17 (7.6%) |
| 75 Years and over | 117 (39.0%) | 0 (0.0%) |
Disability Class: Vision Difficulty
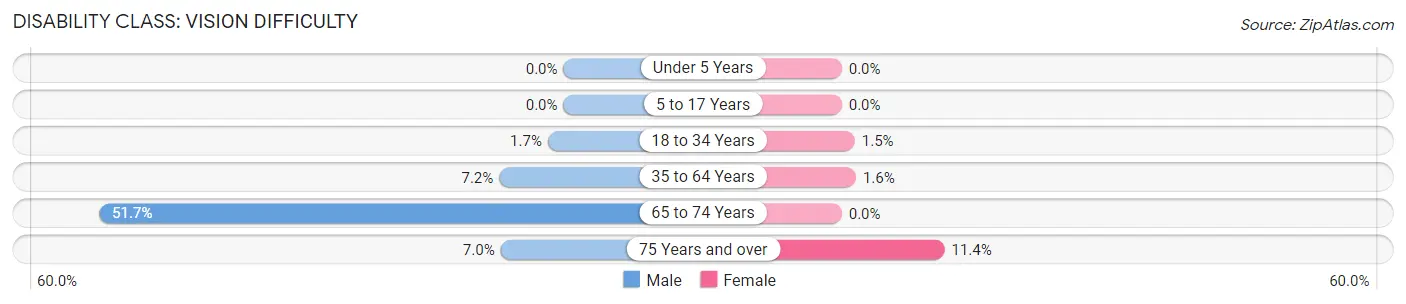
| Age Bracket | Male | Female |
| Under 5 Years | 0 (0.0%) | 0 (0.0%) |
| 5 to 17 Years | 0 (0.0%) | 0 (0.0%) |
| 18 to 34 Years | 19 (1.7%) | 13 (1.5%) |
| 35 to 64 Years | 91 (7.1%) | 21 (1.6%) |
| 65 to 74 Years | 137 (51.7%) | 0 (0.0%) |
| 75 Years and over | 21 (7.0%) | 23 (11.4%) |
Disability Class: Cognitive Difficulty
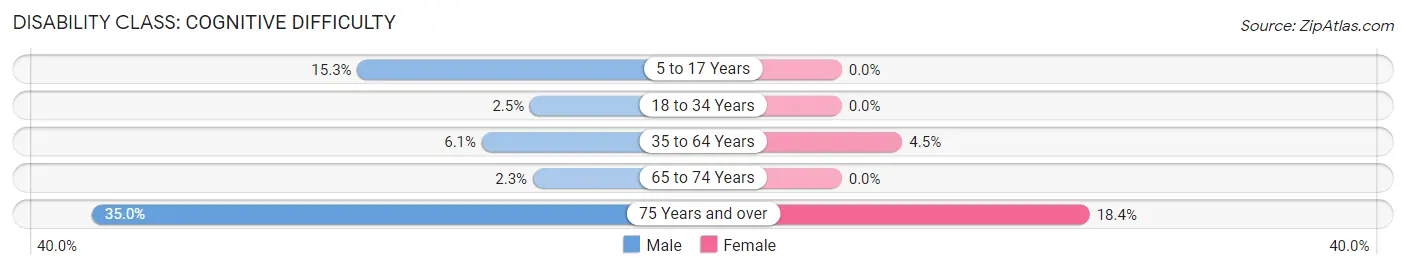
| Age Bracket | Male | Female |
| 5 to 17 Years | 109 (15.3%) | 0 (0.0%) |
| 18 to 34 Years | 27 (2.5%) | 0 (0.0%) |
| 35 to 64 Years | 77 (6.0%) | 60 (4.5%) |
| 65 to 74 Years | 6 (2.3%) | 0 (0.0%) |
| 75 Years and over | 105 (35.0%) | 37 (18.4%) |
Disability Class: Ambulatory Difficulty
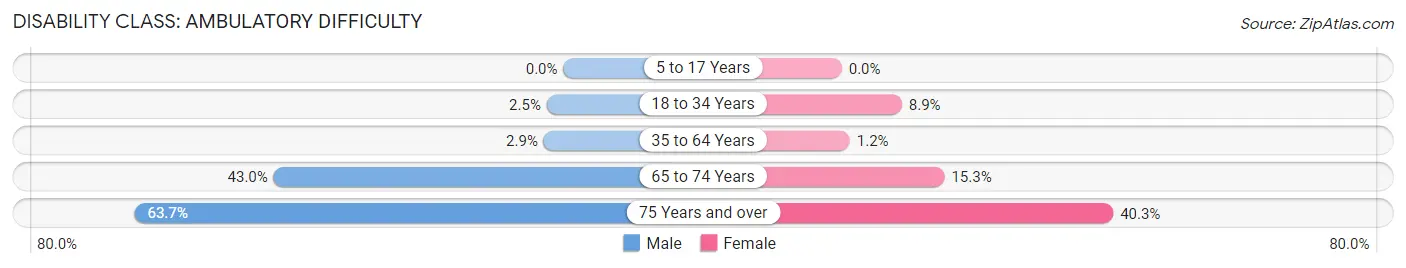
| Age Bracket | Male | Female |
| 5 to 17 Years | 0 (0.0%) | 0 (0.0%) |
| 18 to 34 Years | 27 (2.5%) | 80 (8.9%) |
| 35 to 64 Years | 37 (2.9%) | 16 (1.2%) |
| 65 to 74 Years | 114 (43.0%) | 34 (15.2%) |
| 75 Years and over | 191 (63.7%) | 81 (40.3%) |
Disability Class: Self-Care Difficulty
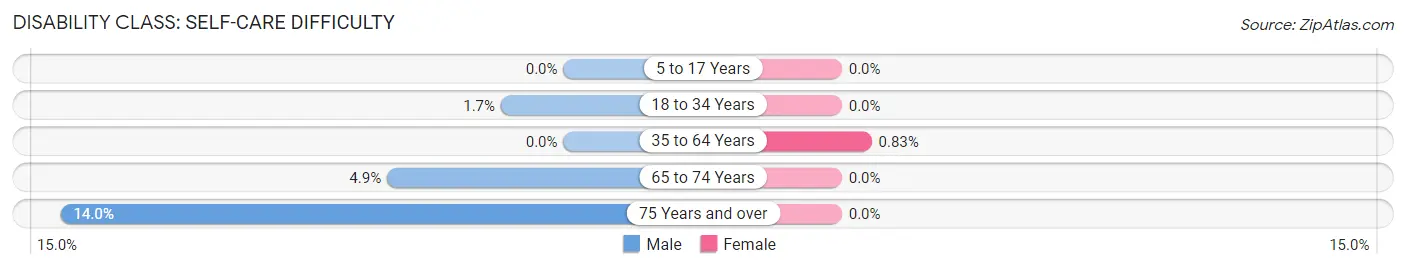
| Age Bracket | Male | Female |
| 5 to 17 Years | 0 (0.0%) | 0 (0.0%) |
| 18 to 34 Years | 19 (1.7%) | 0 (0.0%) |
| 35 to 64 Years | 0 (0.0%) | 11 (0.8%) |
| 65 to 74 Years | 13 (4.9%) | 0 (0.0%) |
| 75 Years and over | 42 (14.0%) | 0 (0.0%) |
Technology Access in Clewiston
Computing Device Access in Clewiston
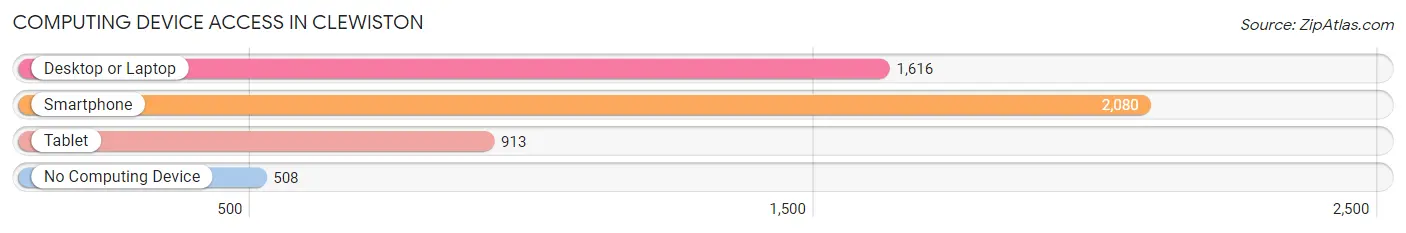
| Device Type | # Households | % Households |
| Desktop or Laptop | 1,616 | 61.2% |
| Smartphone | 2,080 | 78.8% |
| Tablet | 913 | 34.6% |
| No Computing Device | 508 | 19.2% |
| Total | 2,641 | 100.0% |
Internet Access in Clewiston
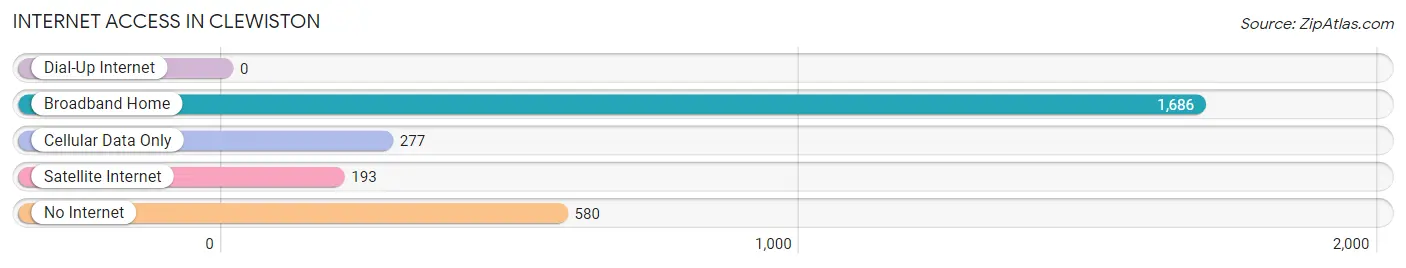
| Internet Type | # Households | % Households |
| Dial-Up Internet | 0 | 0.0% |
| Broadband Home | 1,686 | 63.8% |
| Cellular Data Only | 277 | 10.5% |
| Satellite Internet | 193 | 7.3% |
| No Internet | 580 | 22.0% |
| Total | 2,641 | 100.0% |
Clewiston Summary
Clewiston, Florida is a small city located in Hendry County, in the south-central part of the state. It is situated on the banks of Lake Okeechobee, the largest freshwater lake in the state. The city is known for its rich history, diverse geography, and vibrant economy.
History
Clewiston was founded in 1925 by sugar magnate and philanthropist, Barron Gift Collier. He purchased the land from the Seminole Indians and named the city after his daughter, Clewis. The city was incorporated in 1928 and quickly became a hub for the sugar industry. The city was home to the first sugar mill in the state, the Clewiston Sugar Mill, which was built in 1929. The mill was the first of its kind in the United States and was the largest in the world at the time.
The city was also home to the first airfield in the state, the Clewiston Airport. The airport was built in 1929 and was used to transport sugar cane from the mill to other parts of the state. The airport was also used to transport passengers and mail.
The city was also home to the first public school in the state, the Clewiston High School. The school was built in 1930 and was the first public school in the state to offer a four-year high school program.
Geography
Clewiston is located in the south-central part of the state, on the banks of Lake Okeechobee. The city is situated in the Big Cypress National Preserve, a protected area of wetlands and swamps. The city is surrounded by the Everglades, a vast wetland ecosystem. The city is also located near the Caloosahatchee River, which flows into the Gulf of Mexico.
The city has a humid subtropical climate, with hot, humid summers and mild winters. The average temperature in the summer is around 90 degrees Fahrenheit, and the average temperature in the winter is around 60 degrees Fahrenheit.
Economy
The economy of Clewiston is largely based on agriculture and tourism. The city is home to the largest sugar mill in the state, the Clewiston Sugar Mill. The mill produces sugar cane, which is used to make sugar, molasses, and other products. The city is also home to several other agricultural businesses, including citrus groves, cattle ranches, and vegetable farms.
The city is also a popular tourist destination, due to its proximity to Lake Okeechobee and the Everglades. The city is home to several fishing and hunting guides, as well as several airboat tours. The city is also home to several restaurants, hotels, and other tourist attractions.
Demographics
As of the 2010 census, the population of Clewiston was 7,155. The population is largely made up of white (77.3%), Hispanic (17.2%), and African American (3.2%) residents. The median household income is $31,945, and the median age is 37. The city has a poverty rate of 24.3%.
Clewiston is a small city with a rich history, diverse geography, and vibrant economy. The city is home to the largest sugar mill in the state, as well as several other agricultural businesses. The city is also a popular tourist destination, due to its proximity to Lake Okeechobee and the Everglades. The city has a diverse population, with a median household income of $31,945 and a poverty rate of 24.3%.
Common Questions
What is Per Capita Income in Clewiston?
Per Capita income in Clewiston is $26,751.
What is the Median Family Income in Clewiston?
Median Family Income in Clewiston is $47,473.
What is the Median Household income in Clewiston?
Median Household Income in Clewiston is $50,538.
What is Income or Wage Gap in Clewiston?
Income or Wage Gap in Clewiston is 21.3%.
Women in Clewiston earn 78.7 cents for every dollar earned by a man.
What is Inequality or Gini Index in Clewiston?
Inequality or Gini Index in Clewiston is 0.44.
What is the Total Population of Clewiston?
Total Population of Clewiston is 7,252.
What is the Total Male Population of Clewiston?
Total Male Population of Clewiston is 3,880.
What is the Total Female Population of Clewiston?
Total Female Population of Clewiston is 3,372.
What is the Ratio of Males per 100 Females in Clewiston?
There are 115.07 Males per 100 Females in Clewiston.
What is the Ratio of Females per 100 Males in Clewiston?
There are 86.91 Females per 100 Males in Clewiston.
What is the Median Population Age in Clewiston?
Median Population Age in Clewiston is 35.8 Years.
What is the Average Family Size in Clewiston
Average Family Size in Clewiston is 3.0 People.
What is the Average Household Size in Clewiston
Average Household Size in Clewiston is 2.7 People.
How Large is the Labor Force in Clewiston?
There are 3,769 People in the Labor Forcein in Clewiston.
What is the Percentage of People in the Labor Force in Clewiston?
64.4% of People are in the Labor Force in Clewiston.
What is the Unemployment Rate in Clewiston?
Unemployment Rate in Clewiston is 4.4%.