Charlotte Park, FL Map & Demographics
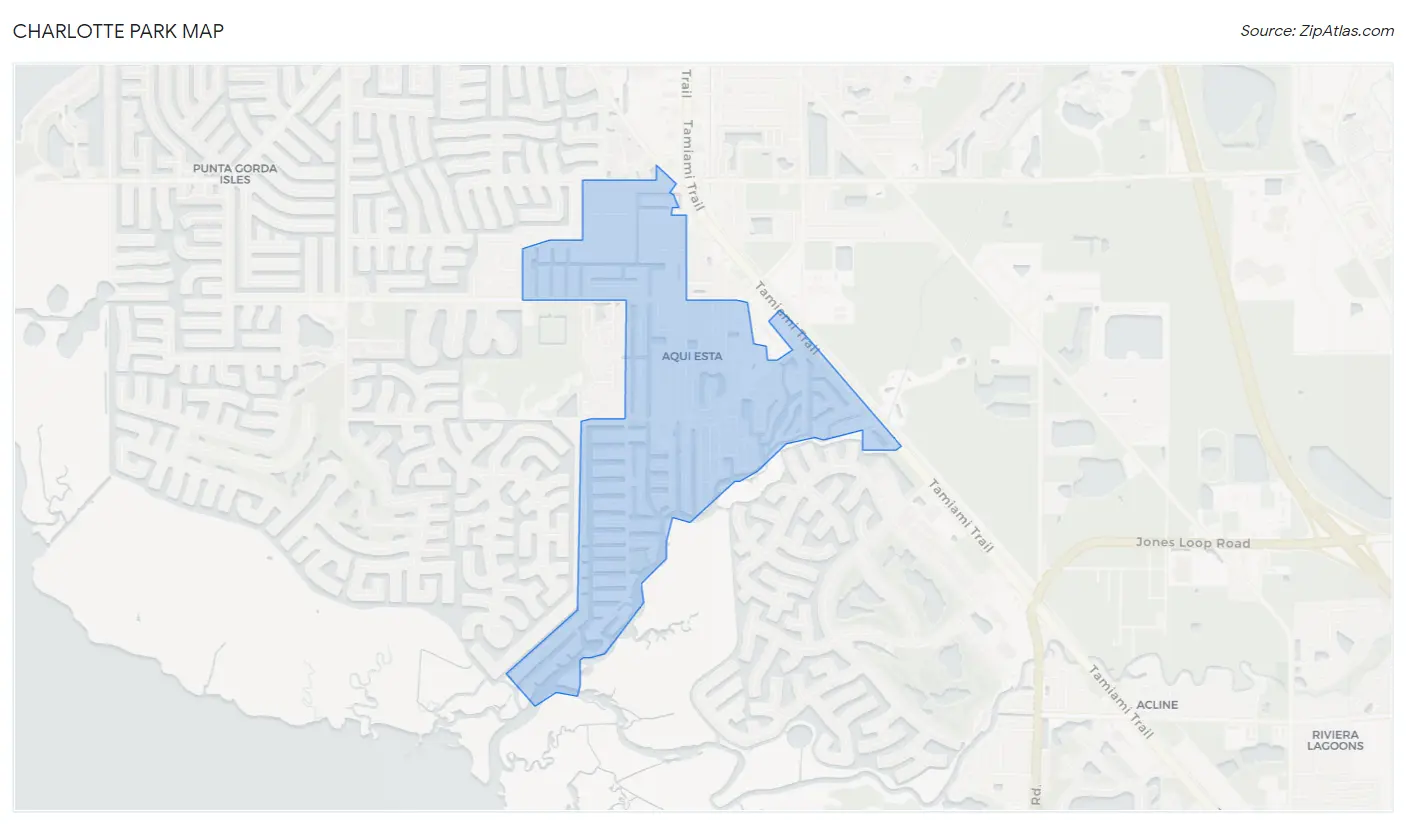
Charlotte Park Map
Charlotte Park Overview
$43,946
PER CAPITA INCOME
$74,417
AVG FAMILY INCOME
$64,893
AVG HOUSEHOLD INCOME
20.5%
WAGE / INCOME GAP [ % ]
79.5¢/ $1
WAGE / INCOME GAP [ $ ]
$18,283
FAMILY INCOME DEFICIT
0.38
INEQUALITY / GINI INDEX
1,795
TOTAL POPULATION
879
MALE POPULATION
916
FEMALE POPULATION
95.96
MALES / 100 FEMALES
104.21
FEMALES / 100 MALES
68.8
MEDIAN AGE
2.3
AVG FAMILY SIZE
1.9
AVG HOUSEHOLD SIZE
677
LABOR FORCE [ PEOPLE ]
38.9%
PERCENT IN LABOR FORCE
3.8%
UNEMPLOYMENT RATE
Income in Charlotte Park
Income Overview in Charlotte Park
Per Capita Income in Charlotte Park is $43,946, while median incomes of families and households are $74,417 and $64,893 respectively.
| Characteristic | Number | Measure |
| Per Capita Income | 1,795 | $43,946 |
| Median Family Income | 559 | $74,417 |
| Mean Family Income | 559 | $88,993 |
| Median Household Income | 951 | $64,893 |
| Mean Household Income | 951 | $80,380 |
| Income Deficit | 559 | $18,283 |
| Wage / Income Gap (%) | 1,795 | 20.48% |
| Wage / Income Gap ($) | 1,795 | 79.52¢ per $1 |
| Gini / Inequality Index | 1,795 | 0.38 |
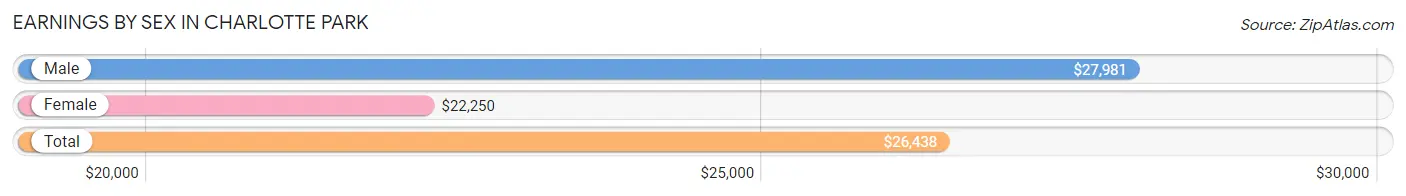
Earnings by Sex in Charlotte Park
Average Earnings in Charlotte Park are $26,438, $27,981 for men and $22,250 for women, a difference of 20.5%.
| Sex | Number | Average Earnings |
| Male | 461 (58.1%) | $27,981 |
| Female | 332 (41.9%) | $22,250 |
| Total | 793 (100.0%) | $26,438 |
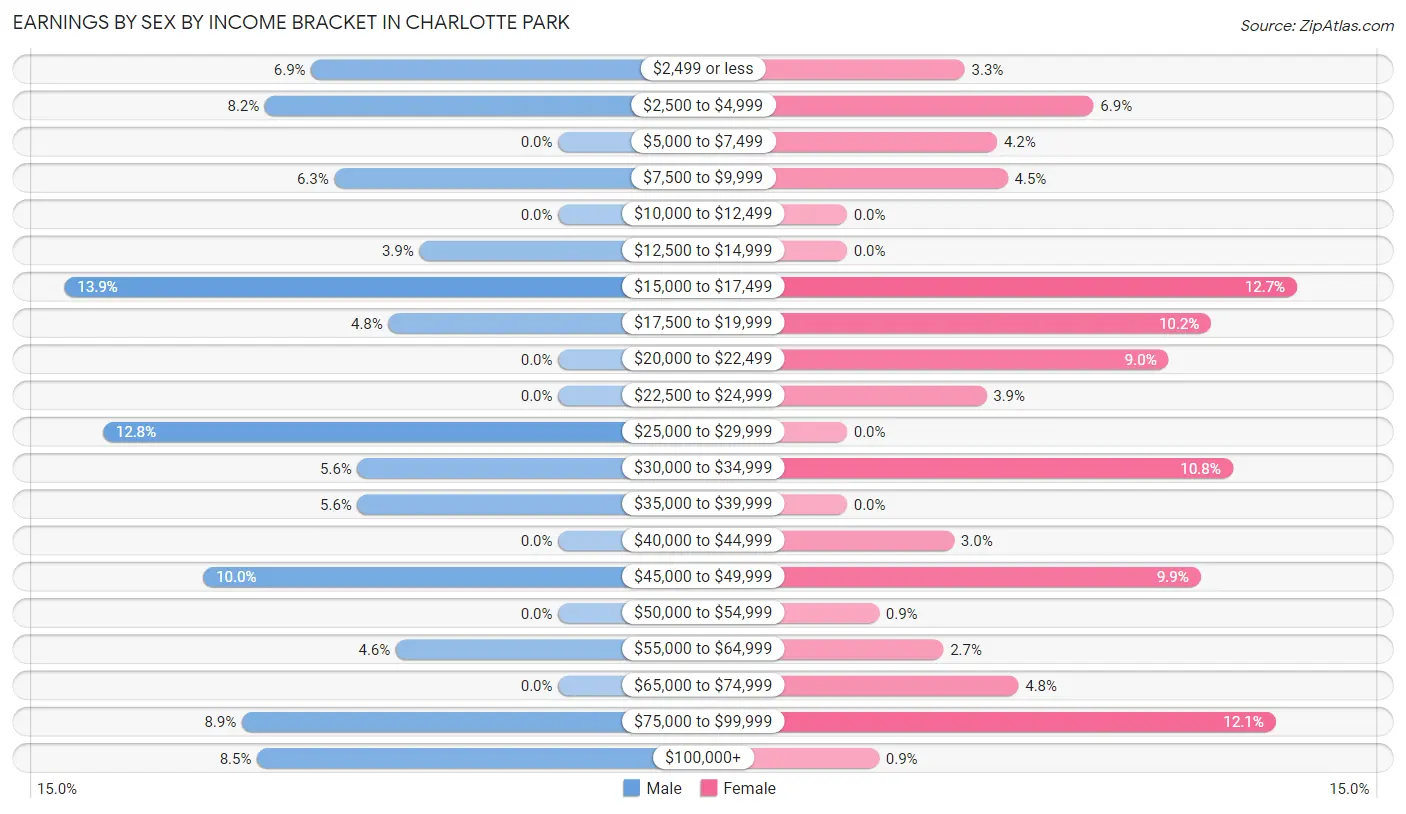
Earnings by Sex by Income Bracket in Charlotte Park
The most common earnings brackets in Charlotte Park are $15,000 to $17,499 for men (64 | 13.9%) and $15,000 to $17,499 for women (42 | 12.7%).
| Income | Male | Female |
| $2,499 or less | 32 (6.9%) | 11 (3.3%) |
| $2,500 to $4,999 | 38 (8.2%) | 23 (6.9%) |
| $5,000 to $7,499 | 0 (0.0%) | 14 (4.2%) |
| $7,500 to $9,999 | 29 (6.3%) | 15 (4.5%) |
| $10,000 to $12,499 | 0 (0.0%) | 0 (0.0%) |
| $12,500 to $14,999 | 18 (3.9%) | 0 (0.0%) |
| $15,000 to $17,499 | 64 (13.9%) | 42 (12.7%) |
| $17,500 to $19,999 | 22 (4.8%) | 34 (10.2%) |
| $20,000 to $22,499 | 0 (0.0%) | 30 (9.0%) |
| $22,500 to $24,999 | 0 (0.0%) | 13 (3.9%) |
| $25,000 to $29,999 | 59 (12.8%) | 0 (0.0%) |
| $30,000 to $34,999 | 26 (5.6%) | 36 (10.8%) |
| $35,000 to $39,999 | 26 (5.6%) | 0 (0.0%) |
| $40,000 to $44,999 | 0 (0.0%) | 10 (3.0%) |
| $45,000 to $49,999 | 46 (10.0%) | 33 (9.9%) |
| $50,000 to $54,999 | 0 (0.0%) | 3 (0.9%) |
| $55,000 to $64,999 | 21 (4.6%) | 9 (2.7%) |
| $65,000 to $74,999 | 0 (0.0%) | 16 (4.8%) |
| $75,000 to $99,999 | 41 (8.9%) | 40 (12.0%) |
| $100,000+ | 39 (8.5%) | 3 (0.9%) |
| Total | 461 (100.0%) | 332 (100.0%) |
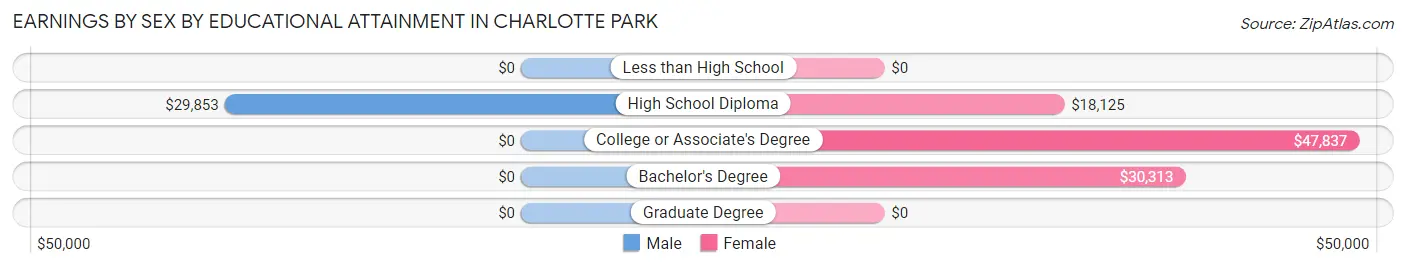
Earnings by Sex by Educational Attainment in Charlotte Park
Average earnings in Charlotte Park are $28,686 for men and $30,156 for women, a difference of 4.9%. Men with an educational attainment of high school diploma enjoy the highest average annual earnings of $29,853, while those with high school diploma education earn the least with $29,853. Women with an educational attainment of college or associate's degree earn the most with the average annual earnings of $47,837, while those with high school diploma education have the smallest earnings of $18,125.
| Educational Attainment | Male Income | Female Income |
| Less than High School | - | - |
| High School Diploma | $29,853 | $18,125 |
| College or Associate's Degree | - | - |
| Bachelor's Degree | - | - |
| Graduate Degree | - | - |
| Total | $28,686 | $30,156 |
Family Income in Charlotte Park
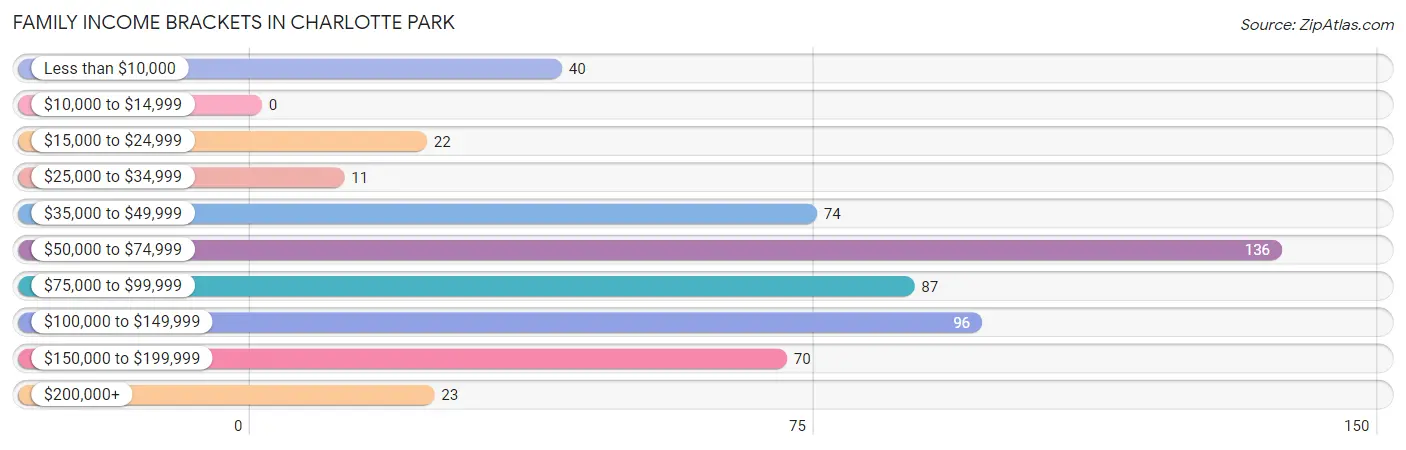
Family Income Brackets in Charlotte Park
According to the Charlotte Park family income data, there are 136 families falling into the $50,000 to $74,999 income range, which is the most common income bracket and makes up 24.3% of all families.
| Income Bracket | # Families | % Families |
| Less than $10,000 | 40 | 7.2% |
| $10,000 to $14,999 | 0 | 0.0% |
| $15,000 to $24,999 | 22 | 3.9% |
| $25,000 to $34,999 | 11 | 2.0% |
| $35,000 to $49,999 | 74 | 13.2% |
| $50,000 to $74,999 | 136 | 24.3% |
| $75,000 to $99,999 | 87 | 15.6% |
| $100,000 to $149,999 | 96 | 17.2% |
| $150,000 to $199,999 | 70 | 12.5% |
| $200,000+ | 23 | 4.1% |
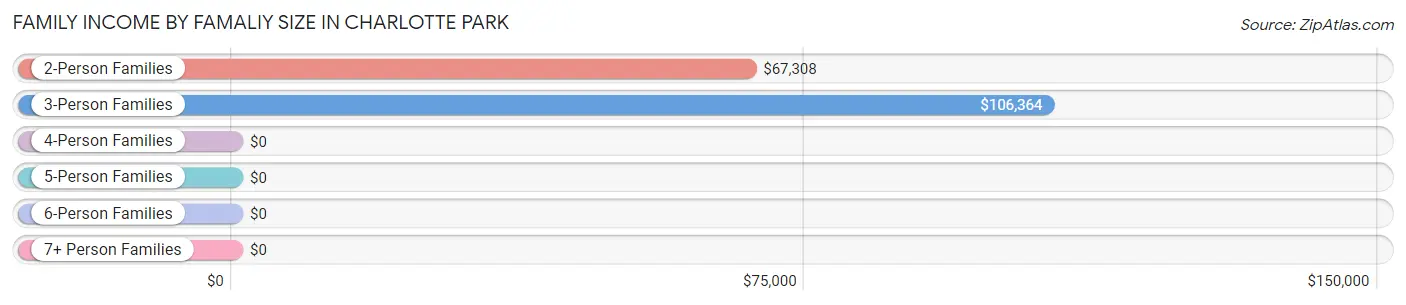
Family Income by Famaliy Size in Charlotte Park
3-person families (58 | 10.4%) account for the highest median family income in Charlotte Park with $106,364 per family, while 3-person families (58 | 10.4%) have the highest median income of $35,455 per family member.
| Income Bracket | # Families | Median Income |
| 2-Person Families | 460 (82.3%) | $67,308 |
| 3-Person Families | 58 (10.4%) | $106,364 |
| 4-Person Families | 41 (7.3%) | $0 |
| 5-Person Families | 0 (0.0%) | $0 |
| 6-Person Families | 0 (0.0%) | $0 |
| 7+ Person Families | 0 (0.0%) | $0 |
| Total | 559 (100.0%) | $74,417 |
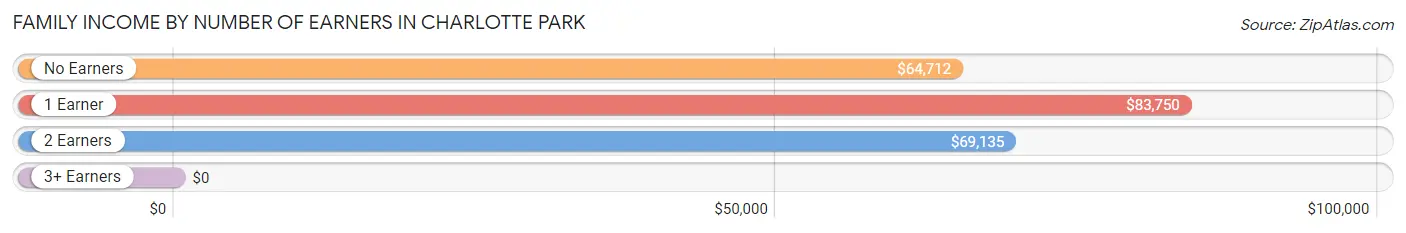
Family Income by Number of Earners in Charlotte Park
| Number of Earners | # Families | Median Income |
| No Earners | 222 (39.7%) | $64,712 |
| 1 Earner | 182 (32.6%) | $83,750 |
| 2 Earners | 139 (24.9%) | $69,135 |
| 3+ Earners | 16 (2.9%) | $0 |
| Total | 559 (100.0%) | $74,417 |
Household Income in Charlotte Park
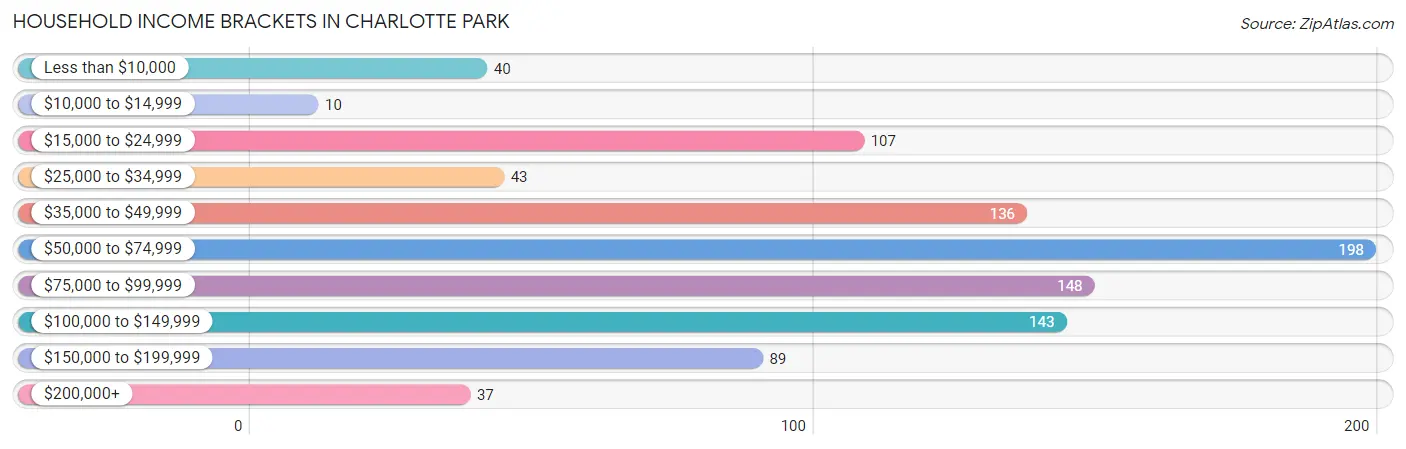
Household Income Brackets in Charlotte Park
With 198 households falling in the category, the $50,000 to $74,999 income range is the most frequent in Charlotte Park, accounting for 20.8% of all households. In contrast, only 10 households (1.1%) fall into the $10,000 to $14,999 income bracket, making it the least populous group.
| Income Bracket | # Households | % Households |
| Less than $10,000 | 40 | 4.2% |
| $10,000 to $14,999 | 10 | 1.1% |
| $15,000 to $24,999 | 107 | 11.3% |
| $25,000 to $34,999 | 43 | 4.5% |
| $35,000 to $49,999 | 136 | 14.3% |
| $50,000 to $74,999 | 198 | 20.8% |
| $75,000 to $99,999 | 148 | 15.6% |
| $100,000 to $149,999 | 143 | 15.0% |
| $150,000 to $199,999 | 89 | 9.4% |
| $200,000+ | 37 | 3.9% |
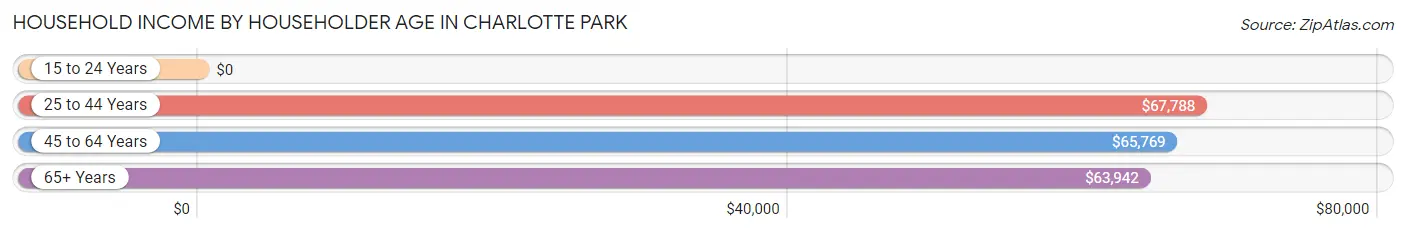
Household Income by Householder Age in Charlotte Park
The median household income in Charlotte Park is $64,893, with the highest median household income of $67,788 found in the 25 to 44 years age bracket for the primary householder. A total of 83 households (8.7%) fall into this category.
| Income Bracket | # Households | Median Income |
| 15 to 24 Years | 0 (0.0%) | $0 |
| 25 to 44 Years | 83 (8.7%) | $67,788 |
| 45 to 64 Years | 272 (28.6%) | $65,769 |
| 65+ Years | 596 (62.7%) | $63,942 |
| Total | 951 (100.0%) | $64,893 |
Poverty in Charlotte Park
Income Below Poverty by Sex and Age in Charlotte Park
With 6.8% poverty level for males and 7.5% for females among the residents of Charlotte Park, 55 to 64 year old males and 12 to 14 year old females are the most vulnerable to poverty, with 36 males (15.1%) and 6 females (100.0%) in their respective age groups living below the poverty level.
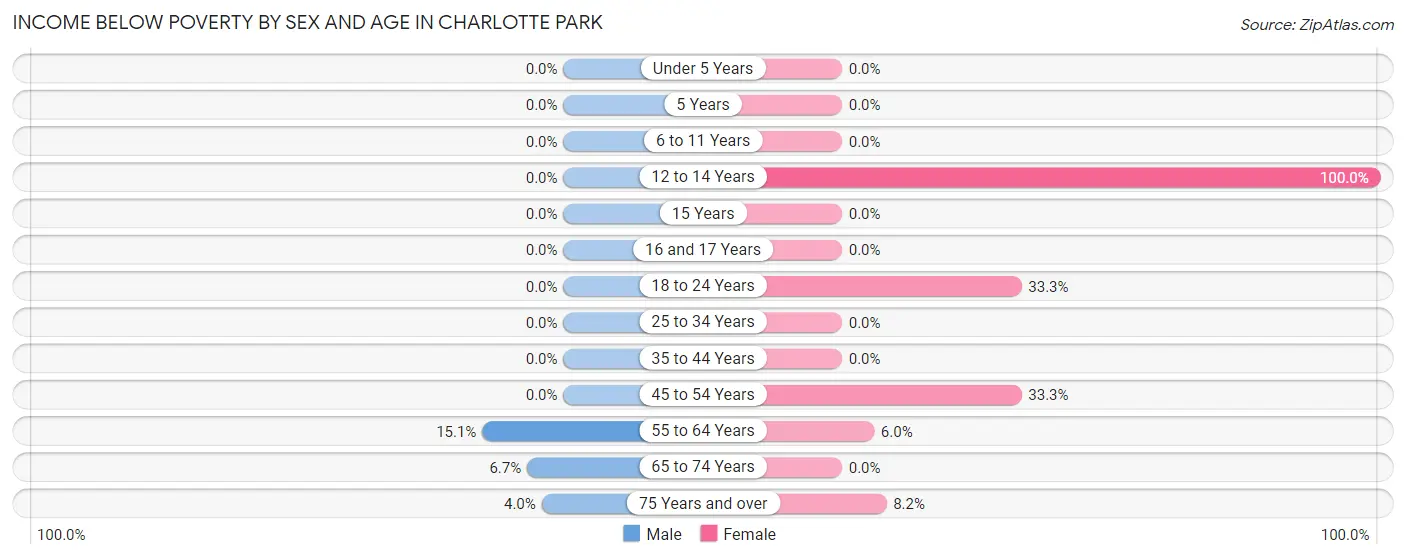
| Age Bracket | Male | Female |
| Under 5 Years | 0 (0.0%) | 0 (0.0%) |
| 5 Years | 0 (0.0%) | 0 (0.0%) |
| 6 to 11 Years | 0 (0.0%) | 0 (0.0%) |
| 12 to 14 Years | 0 (0.0%) | 6 (100.0%) |
| 15 Years | 0 (0.0%) | 0 (0.0%) |
| 16 and 17 Years | 0 (0.0%) | 0 (0.0%) |
| 18 to 24 Years | 0 (0.0%) | 11 (33.3%) |
| 25 to 34 Years | 0 (0.0%) | 0 (0.0%) |
| 35 to 44 Years | 0 (0.0%) | 0 (0.0%) |
| 45 to 54 Years | 0 (0.0%) | 21 (33.3%) |
| 55 to 64 Years | 36 (15.1%) | 9 (6.0%) |
| 65 to 74 Years | 12 (6.7%) | 0 (0.0%) |
| 75 Years and over | 12 (4.0%) | 22 (8.2%) |
| Total | 60 (6.8%) | 69 (7.5%) |
Income Above Poverty by Sex and Age in Charlotte Park
According to the poverty statistics in Charlotte Park, males aged 6 to 11 years and females aged under 5 years are the age groups that are most secure financially, with 100.0% of males and 100.0% of females in these age groups living above the poverty line.
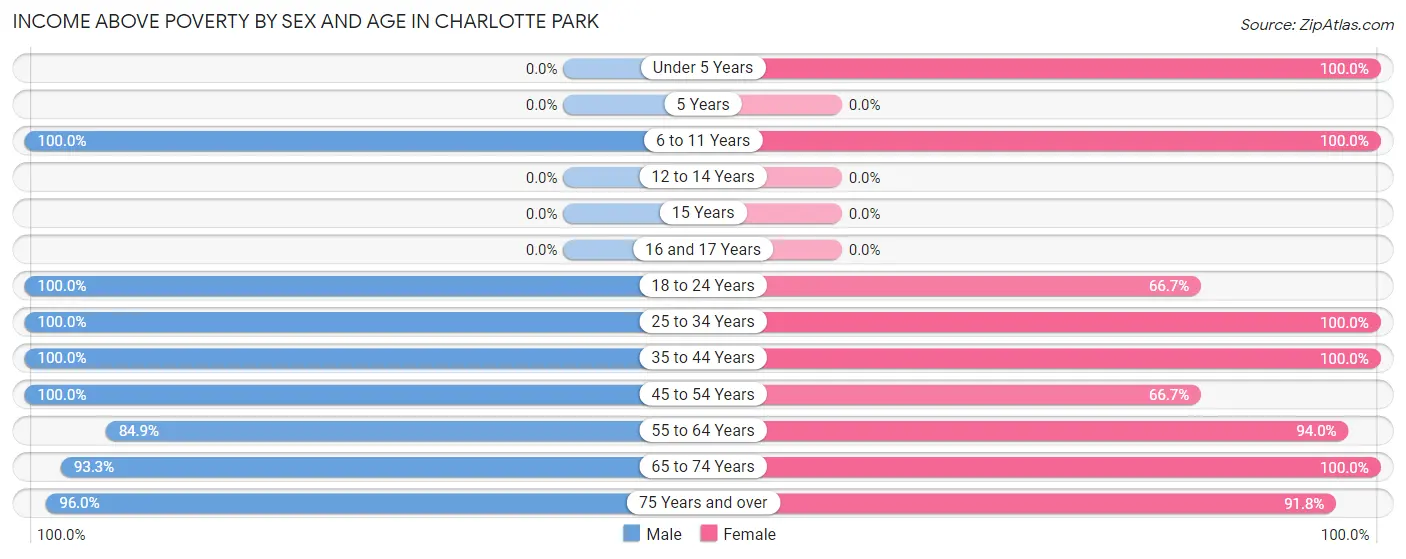
| Age Bracket | Male | Female |
| Under 5 Years | 0 (0.0%) | 22 (100.0%) |
| 5 Years | 0 (0.0%) | 0 (0.0%) |
| 6 to 11 Years | 9 (100.0%) | 18 (100.0%) |
| 12 to 14 Years | 0 (0.0%) | 0 (0.0%) |
| 15 Years | 0 (0.0%) | 0 (0.0%) |
| 16 and 17 Years | 0 (0.0%) | 0 (0.0%) |
| 18 to 24 Years | 22 (100.0%) | 22 (66.7%) |
| 25 to 34 Years | 40 (100.0%) | 51 (100.0%) |
| 35 to 44 Years | 33 (100.0%) | 42 (100.0%) |
| 45 to 54 Years | 60 (100.0%) | 42 (66.7%) |
| 55 to 64 Years | 203 (84.9%) | 142 (94.0%) |
| 65 to 74 Years | 166 (93.3%) | 263 (100.0%) |
| 75 Years and over | 286 (96.0%) | 245 (91.8%) |
| Total | 819 (93.2%) | 847 (92.5%) |
Income Below Poverty Among Married-Couple Families in Charlotte Park
The poverty statistics for married-couple families in Charlotte Park show that 7.3% or 40 of the total 550 families live below the poverty line. Families with 1 or 2 children have the highest poverty rate of 28.6%, comprising of 12 families. On the other hand, families with no children have the lowest poverty rate of 5.5%, which includes 28 families.
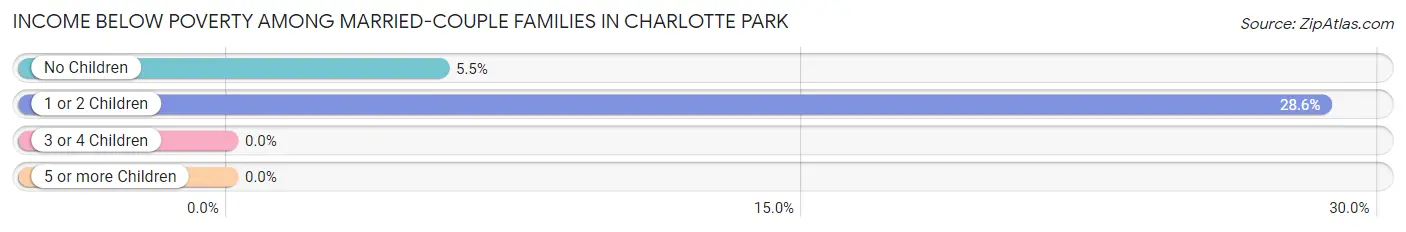
| Children | Above Poverty | Below Poverty |
| No Children | 480 (94.5%) | 28 (5.5%) |
| 1 or 2 Children | 30 (71.4%) | 12 (28.6%) |
| 3 or 4 Children | 0 (0.0%) | 0 (0.0%) |
| 5 or more Children | 0 (0.0%) | 0 (0.0%) |
| Total | 510 (92.7%) | 40 (7.3%) |
Income Below Poverty Among Single-Parent Households in Charlotte Park
| Children | Single Father | Single Mother |
| No Children | 0 (0.0%) | 0 (0.0%) |
| 1 or 2 Children | 0 (0.0%) | 0 (0.0%) |
| 3 or 4 Children | 0 (0.0%) | 0 (0.0%) |
| 5 or more Children | 0 (0.0%) | 0 (0.0%) |
| Total | 0 (0.0%) | 0 (0.0%) |
Income Below Poverty Among Married-Couple vs Single-Parent Households in Charlotte Park
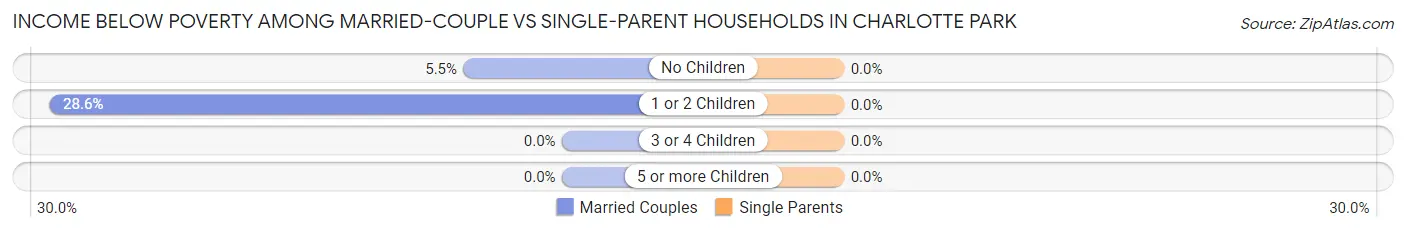
| Children | Married-Couple Families | Single-Parent Households |
| No Children | 28 (5.5%) | 0 (0.0%) |
| 1 or 2 Children | 12 (28.6%) | 0 (0.0%) |
| 3 or 4 Children | 0 (0.0%) | 0 (0.0%) |
| 5 or more Children | 0 (0.0%) | 0 (0.0%) |
| Total | 40 (7.3%) | 0 (0.0%) |
Race in Charlotte Park
The most populous races in Charlotte Park are White / Caucasian (1,727 | 96.2%), Hispanic or Latino (99 | 5.5%), and Some other Race (38 | 2.1%).
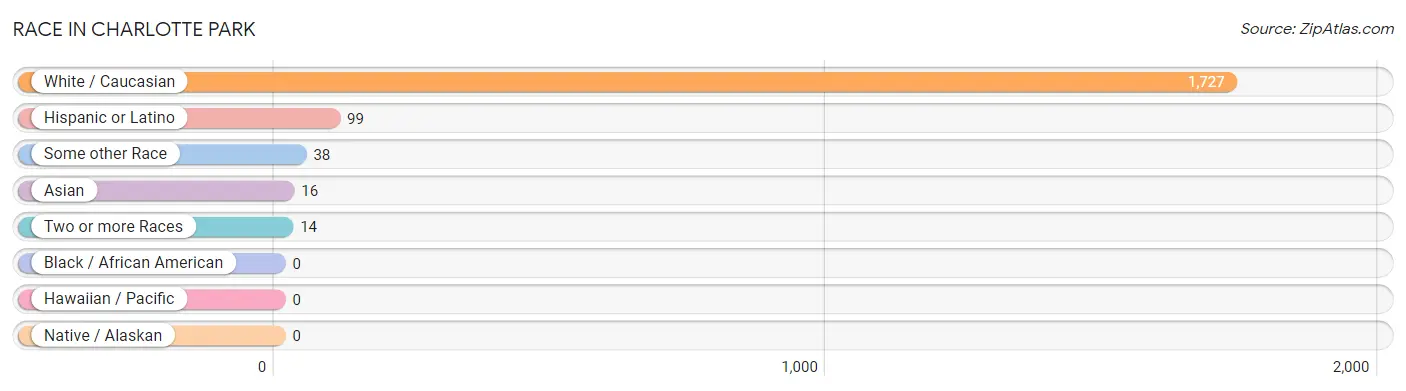
| Race | # Population | % Population |
| Asian | 16 | 0.9% |
| Black / African American | 0 | 0.0% |
| Hawaiian / Pacific | 0 | 0.0% |
| Hispanic or Latino | 99 | 5.5% |
| Native / Alaskan | 0 | 0.0% |
| White / Caucasian | 1,727 | 96.2% |
| Two or more Races | 14 | 0.8% |
| Some other Race | 38 | 2.1% |
| Total | 1,795 | 100.0% |
Ancestry in Charlotte Park
The most populous ancestries reported in Charlotte Park are Irish (418 | 23.3%), German (273 | 15.2%), American (260 | 14.5%), English (247 | 13.8%), and Italian (187 | 10.4%), together accounting for 77.2% of all Charlotte Park residents.
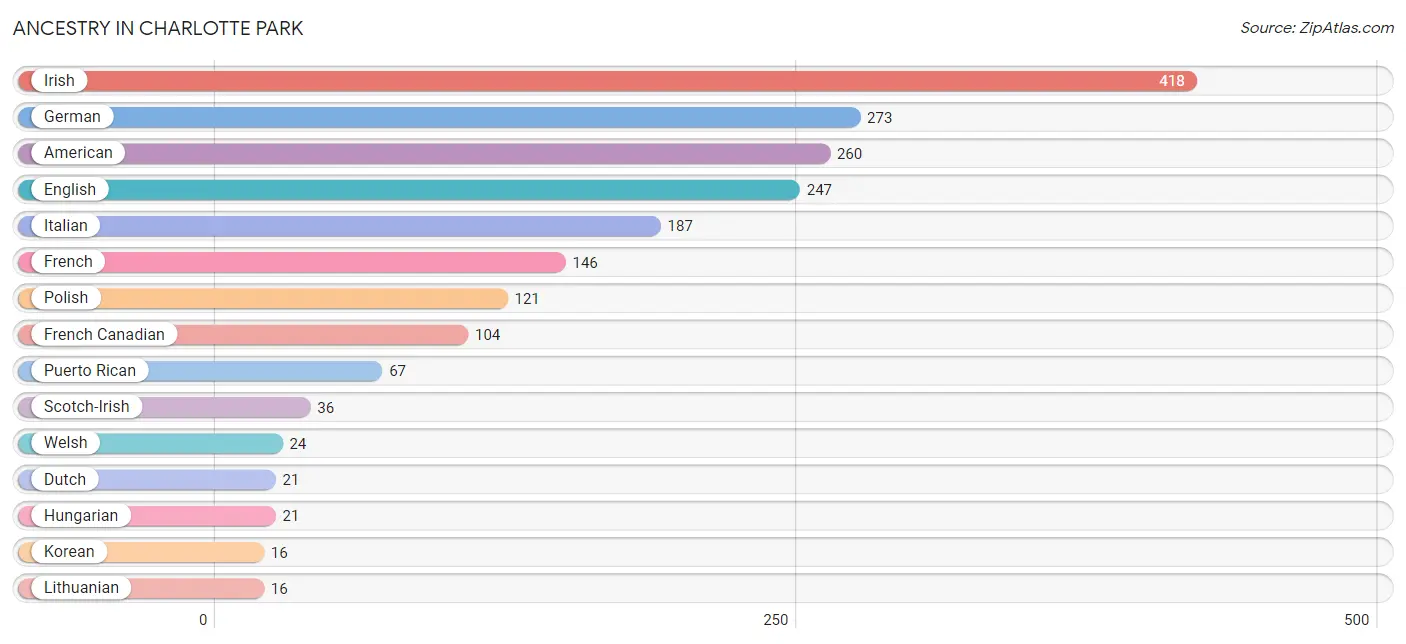
| Ancestry | # Population | % Population |
| American | 260 | 14.5% |
| Cuban | 10 | 0.6% |
| Danish | 13 | 0.7% |
| Dutch | 21 | 1.2% |
| English | 247 | 13.8% |
| European | 3 | 0.2% |
| French | 146 | 8.1% |
| French Canadian | 104 | 5.8% |
| German | 273 | 15.2% |
| Greek | 3 | 0.2% |
| Hungarian | 21 | 1.2% |
| Irish | 418 | 23.3% |
| Italian | 187 | 10.4% |
| Korean | 16 | 0.9% |
| Lithuanian | 16 | 0.9% |
| Mexican | 11 | 0.6% |
| Polish | 121 | 6.7% |
| Puerto Rican | 67 | 3.7% |
| Scandinavian | 10 | 0.6% |
| Scotch-Irish | 36 | 2.0% |
| Scottish | 8 | 0.4% |
| Spanish | 11 | 0.6% |
| Swedish | 12 | 0.7% |
| Swiss | 16 | 0.9% |
| Welsh | 24 | 1.3% | View All 25 Rows |
Immigrants in Charlotte Park
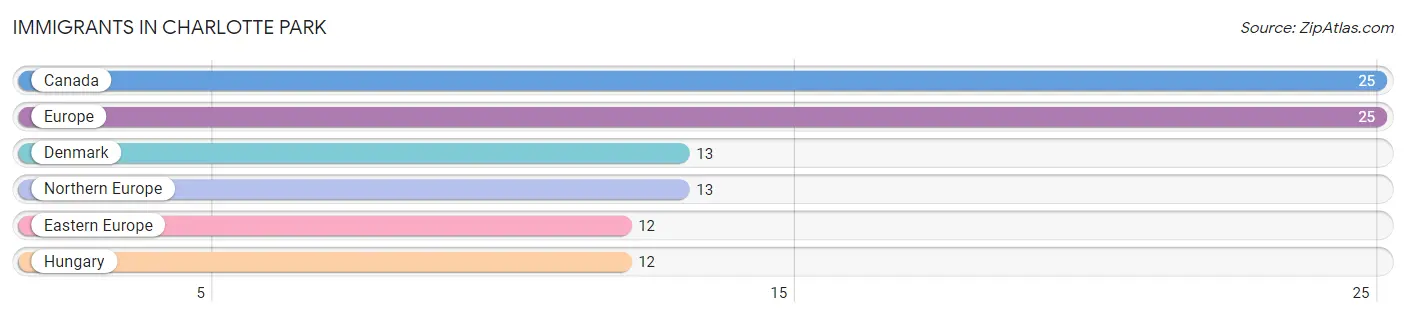
The most numerous immigrant groups reported in Charlotte Park came from Canada (25 | 1.4%), Europe (25 | 1.4%), Denmark (13 | 0.7%), Northern Europe (13 | 0.7%), and Eastern Europe (12 | 0.7%), together accounting for 4.9% of all Charlotte Park residents.
| Immigration Origin | # Population | % Population |
| Canada | 25 | 1.4% |
| Denmark | 13 | 0.7% |
| Eastern Europe | 12 | 0.7% |
| Europe | 25 | 1.4% |
| Hungary | 12 | 0.7% |
| Northern Europe | 13 | 0.7% | View All 6 Rows |
Sex and Age in Charlotte Park
Sex and Age in Charlotte Park
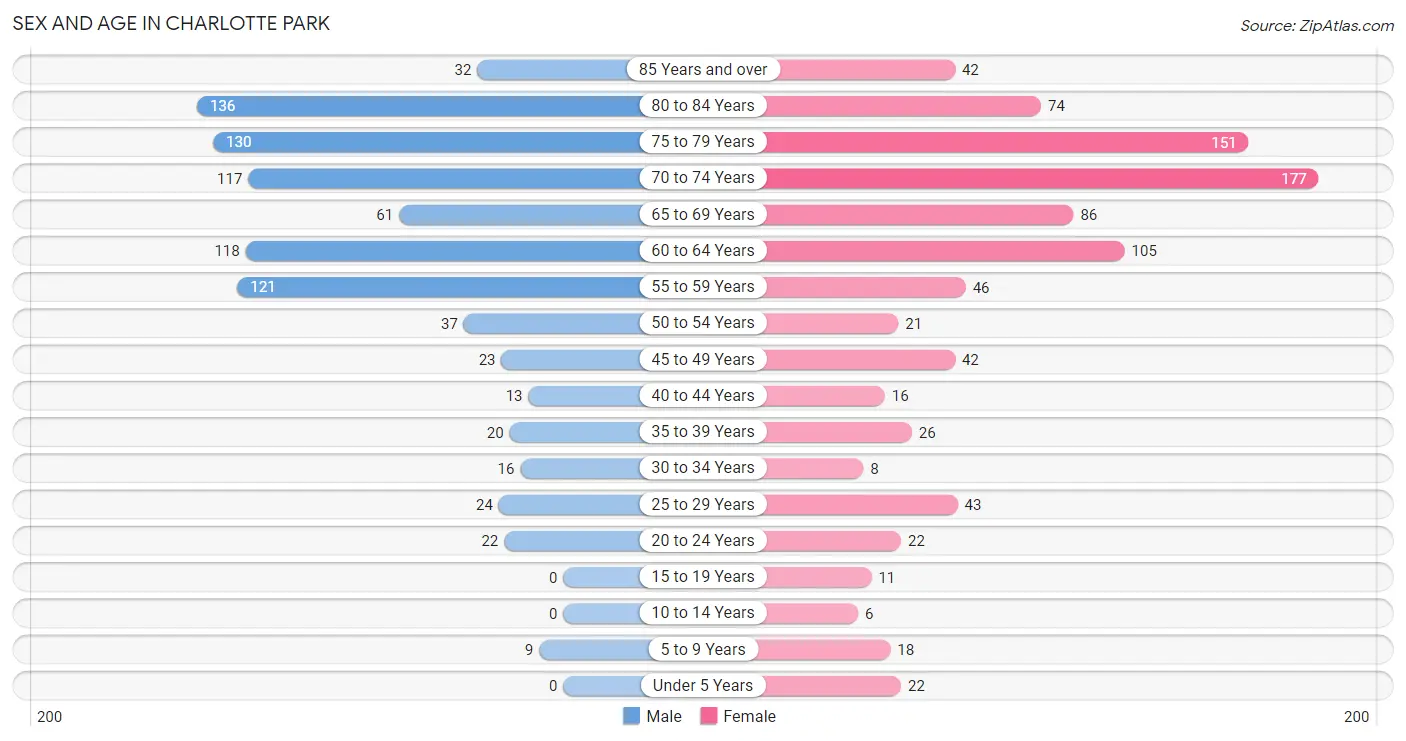
The most populous age groups in Charlotte Park are 80 to 84 Years (136 | 15.5%) for men and 70 to 74 Years (177 | 19.3%) for women.
| Age Bracket | Male | Female |
| Under 5 Years | 0 (0.0%) | 22 (2.4%) |
| 5 to 9 Years | 9 (1.0%) | 18 (2.0%) |
| 10 to 14 Years | 0 (0.0%) | 6 (0.7%) |
| 15 to 19 Years | 0 (0.0%) | 11 (1.2%) |
| 20 to 24 Years | 22 (2.5%) | 22 (2.4%) |
| 25 to 29 Years | 24 (2.7%) | 43 (4.7%) |
| 30 to 34 Years | 16 (1.8%) | 8 (0.9%) |
| 35 to 39 Years | 20 (2.3%) | 26 (2.8%) |
| 40 to 44 Years | 13 (1.5%) | 16 (1.8%) |
| 45 to 49 Years | 23 (2.6%) | 42 (4.6%) |
| 50 to 54 Years | 37 (4.2%) | 21 (2.3%) |
| 55 to 59 Years | 121 (13.8%) | 46 (5.0%) |
| 60 to 64 Years | 118 (13.4%) | 105 (11.5%) |
| 65 to 69 Years | 61 (6.9%) | 86 (9.4%) |
| 70 to 74 Years | 117 (13.3%) | 177 (19.3%) |
| 75 to 79 Years | 130 (14.8%) | 151 (16.5%) |
| 80 to 84 Years | 136 (15.5%) | 74 (8.1%) |
| 85 Years and over | 32 (3.6%) | 42 (4.6%) |
| Total | 879 (100.0%) | 916 (100.0%) |
Families and Households in Charlotte Park
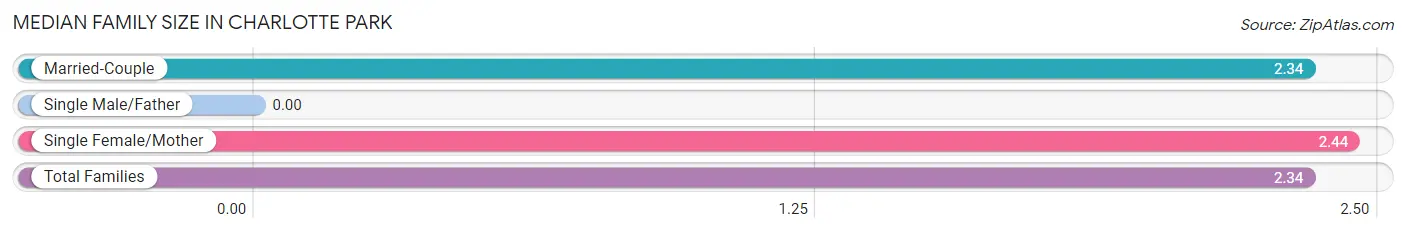
Median Family Size in Charlotte Park
| Family Type | # Families | Family Size |
| Married-Couple | 550 (98.4%) | 2.34 |
| Single Male/Father | 0 (0.0%) | - |
| Single Female/Mother | 9 (1.6%) | 2.44 |
| Total Families | 559 (100.0%) | 2.34 |
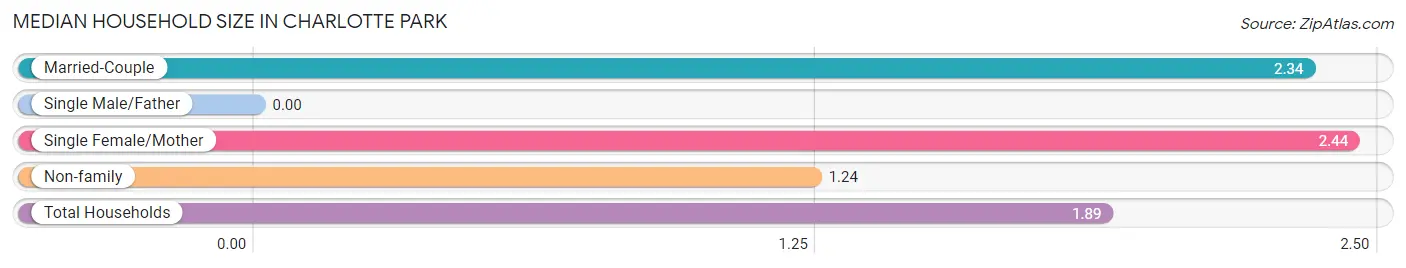
Median Household Size in Charlotte Park
| Household Type | # Households | Household Size |
| Married-Couple | 550 (57.8%) | 2.34 |
| Single Male/Father | 0 (0.0%) | - |
| Single Female/Mother | 9 (0.9%) | 2.44 |
| Non-family | 392 (41.2%) | 1.24 |
| Total Households | 951 (100.0%) | 1.89 |
Household Size by Marriage Status in Charlotte Park
Out of a total of 951 households in Charlotte Park, 559 (58.8%) are family households, while 392 (41.2%) are nonfamily households. The most numerous type of family households are 2-person households, comprising 460, and the most common type of nonfamily households are 1-person households, comprising 302.
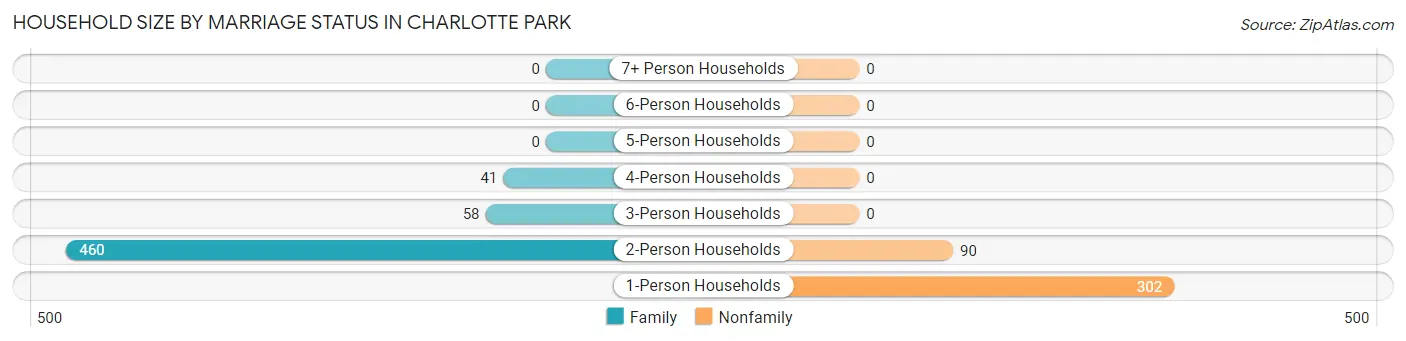
| Household Size | Family Households | Nonfamily Households |
| 1-Person Households | - | 302 (31.8%) |
| 2-Person Households | 460 (48.4%) | 90 (9.5%) |
| 3-Person Households | 58 (6.1%) | 0 (0.0%) |
| 4-Person Households | 41 (4.3%) | 0 (0.0%) |
| 5-Person Households | 0 (0.0%) | 0 (0.0%) |
| 6-Person Households | 0 (0.0%) | 0 (0.0%) |
| 7+ Person Households | 0 (0.0%) | 0 (0.0%) |
| Total | 559 (58.8%) | 392 (41.2%) |
Female Fertility in Charlotte Park
Fertility by Age in Charlotte Park
| Age Bracket | Women with Births | Births / 1,000 Women |
| 15 to 19 years | 0 (0.0%) | 0.0 |
| 20 to 34 years | 0 (0.0%) | 0.0 |
| 35 to 50 years | 0 (0.0%) | 0.0 |
| Total | 0 (0.0%) | 0.0 |
Fertility by Age by Marriage Status in Charlotte Park
| Age Bracket | Married | Unmarried |
| 15 to 19 years | 0 (0.0%) | 0 (0.0%) |
| 20 to 34 years | 0 (0.0%) | 0 (0.0%) |
| 35 to 50 years | 0 (0.0%) | 0 (0.0%) |
| Total | 0 (0.0%) | 0 (0.0%) |
Fertility by Education in Charlotte Park
| Educational Attainment | Women with Births | Births / 1,000 Women |
| Less than High School | 0 (0.0%) | 0.0 |
| High School Diploma | 0 (0.0%) | 0.0 |
| College or Associate's Degree | 0 (0.0%) | 0.0 |
| Bachelor's Degree | 0 (0.0%) | 0.0 |
| Graduate Degree | 0 (0.0%) | 0.0 |
| Total | 0 (0.0%) | 0.0 |
Fertility by Education by Marriage Status in Charlotte Park
| Educational Attainment | Married | Unmarried |
| Less than High School | 0 (0.0%) | 0 (0.0%) |
| High School Diploma | 0 (0.0%) | 0 (0.0%) |
| College or Associate's Degree | 0 (0.0%) | 0 (0.0%) |
| Bachelor's Degree | 0 (0.0%) | 0 (0.0%) |
| Graduate Degree | 0 (0.0%) | 0 (0.0%) |
| Total | 0 (0.0%) | 0 (0.0%) |
Employment Characteristics in Charlotte Park
Employment by Class of Employer in Charlotte Park
Among the 644 employed individuals in Charlotte Park, private company employees (398 | 61.8%), local government employees (80 | 12.4%), and self-employed (not incorporated) (74 | 11.5%) make up the most common classes of employment.
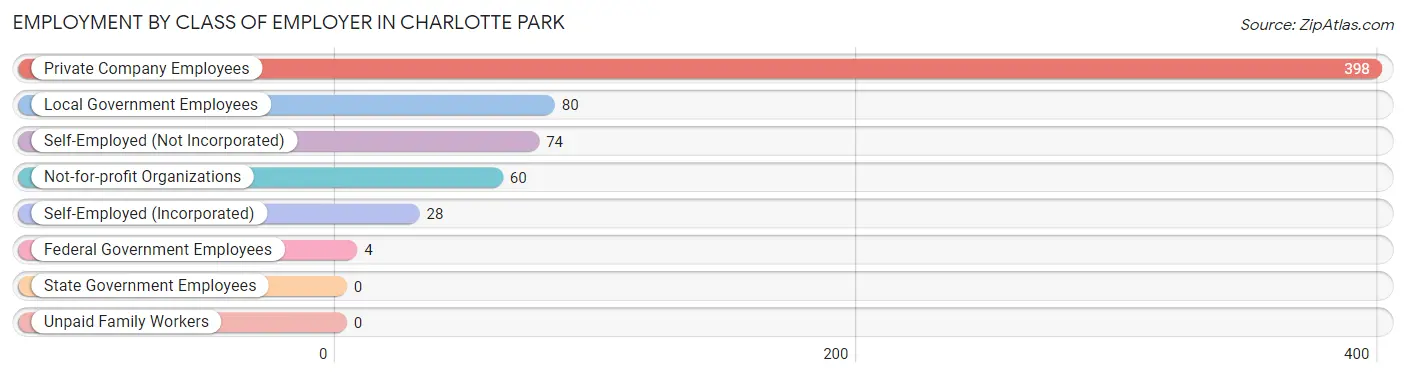
| Employer Class | # Employees | % Employees |
| Private Company Employees | 398 | 61.8% |
| Self-Employed (Incorporated) | 28 | 4.3% |
| Self-Employed (Not Incorporated) | 74 | 11.5% |
| Not-for-profit Organizations | 60 | 9.3% |
| Local Government Employees | 80 | 12.4% |
| State Government Employees | 0 | 0.0% |
| Federal Government Employees | 4 | 0.6% |
| Unpaid Family Workers | 0 | 0.0% |
| Total | 644 | 100.0% |
Employment Status by Age in Charlotte Park
According to the labor force statistics for Charlotte Park, out of the total population over 16 years of age (1,740), 38.9% or 677 individuals are in the labor force, with 3.8% or 26 of them unemployed. The age group with the highest labor force participation rate is 20 to 24 years, with 100.0% or 44 individuals in the labor force. Within the labor force, the 75 years and over age range has the highest percentage of unemployed individuals, with 27.3% or 18 of them being unemployed.
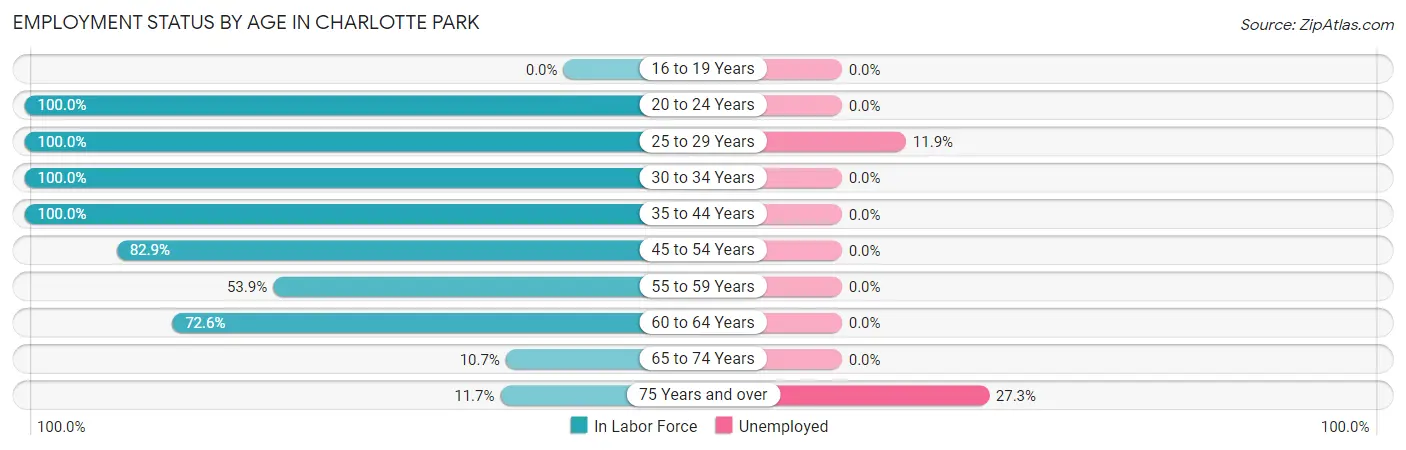
| Age Bracket | In Labor Force | Unemployed |
| 16 to 19 Years | 0 (0.0%) | 0 (0.0%) |
| 20 to 24 Years | 44 (100.0%) | 0 (0.0%) |
| 25 to 29 Years | 67 (100.0%) | 8 (11.9%) |
| 30 to 34 Years | 24 (100.0%) | 0 (0.0%) |
| 35 to 44 Years | 75 (100.0%) | 0 (0.0%) |
| 45 to 54 Years | 102 (82.9%) | 0 (0.0%) |
| 55 to 59 Years | 90 (53.9%) | 0 (0.0%) |
| 60 to 64 Years | 162 (72.6%) | 0 (0.0%) |
| 65 to 74 Years | 47 (10.7%) | 0 (0.0%) |
| 75 Years and over | 66 (11.7%) | 18 (27.3%) |
| Total | 677 (38.9%) | 26 (3.8%) |
Employment Status by Educational Attainment in Charlotte Park
According to labor force statistics for Charlotte Park, 76.6% of individuals (520) out of the total population between 25 and 64 years of age (679) are in the labor force, with 1.5% or 8 of them being unemployed. The group with the highest labor force participation rate are those with the educational attainment of less than high school, with 100.0% or 15 individuals in the labor force. Within the labor force, individuals with bachelor's degree or higher education have the highest percentage of unemployment, with 17.8% or 8 of them being unemployed.
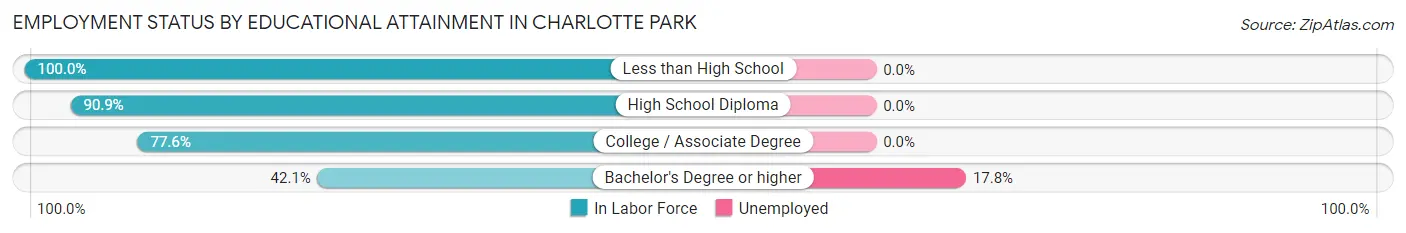
| Educational Attainment | In Labor Force | Unemployed |
| Less than High School | 15 (100.0%) | 0 (0.0%) |
| High School Diploma | 190 (90.9%) | 0 (0.0%) |
| College / Associate Degree | 270 (77.6%) | 0 (0.0%) |
| Bachelor's Degree or higher | 45 (42.1%) | 19 (17.8%) |
| Total | 520 (76.6%) | 10 (1.5%) |
Employment Occupations by Sex in Charlotte Park
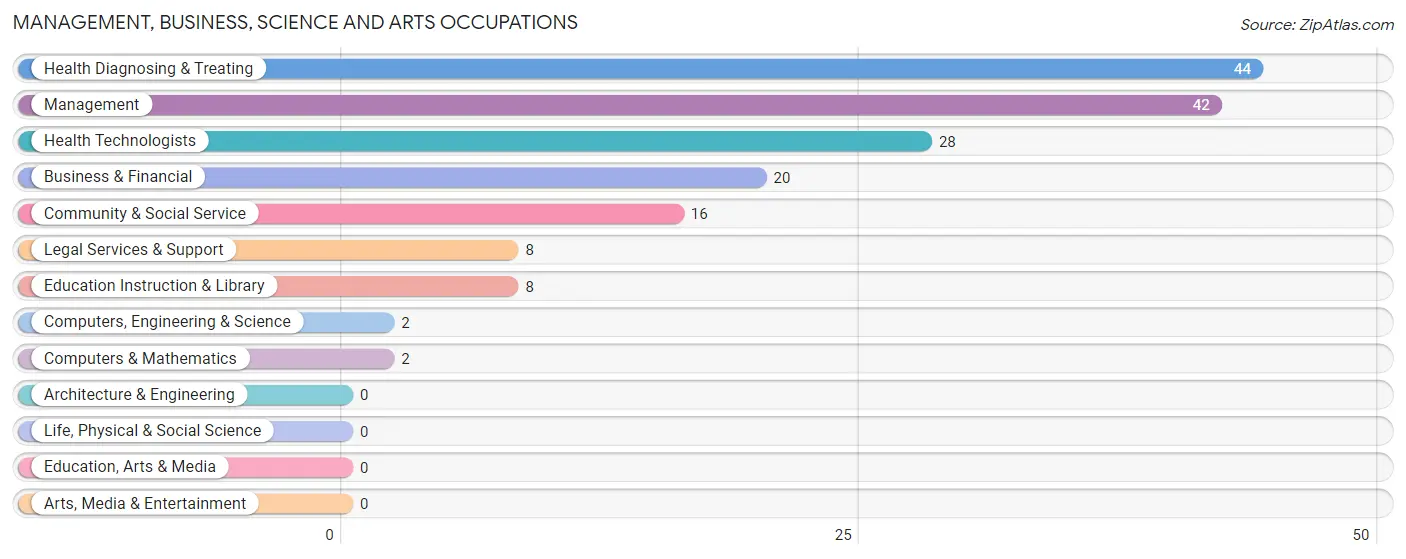
Management, Business, Science and Arts Occupations
The most common Management, Business, Science and Arts occupations in Charlotte Park are Health Diagnosing & Treating (44 | 6.8%), Management (42 | 6.5%), Health Technologists (28 | 4.3%), Business & Financial (20 | 3.1%), and Community & Social Service (16 | 2.5%).
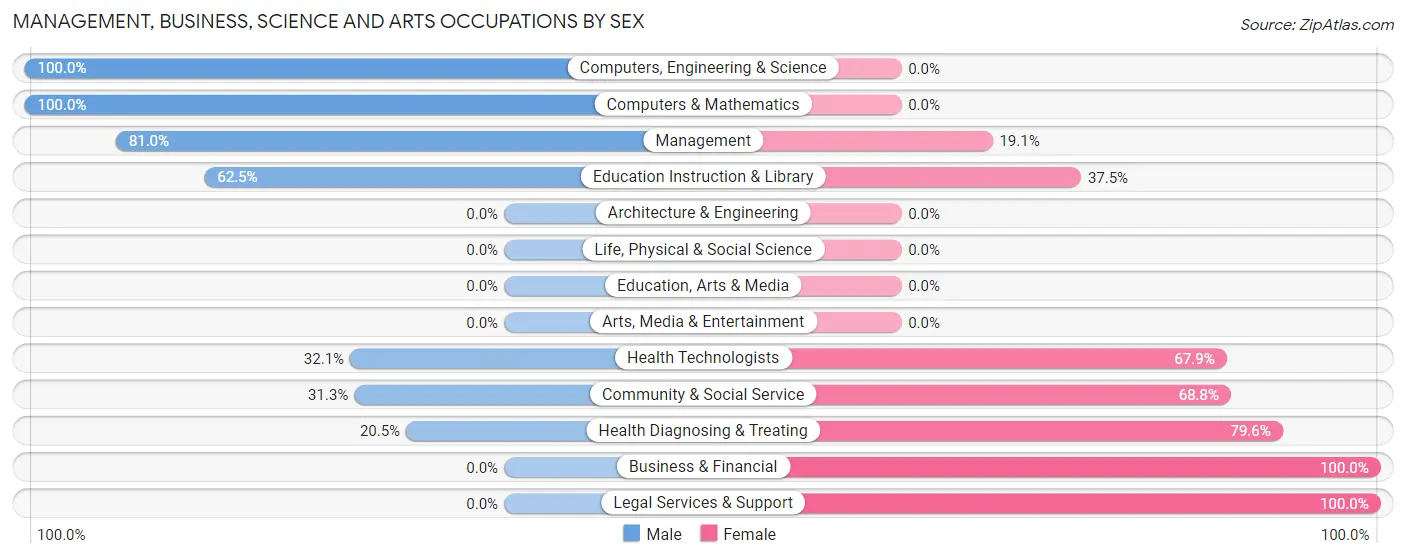
Management, Business, Science and Arts Occupations by Sex
Within the Management, Business, Science and Arts occupations in Charlotte Park, the most male-oriented occupations are Computers, Engineering & Science (100.0%), Computers & Mathematics (100.0%), and Management (80.9%), while the most female-oriented occupations are Business & Financial (100.0%), Legal Services & Support (100.0%), and Health Diagnosing & Treating (79.5%).
| Occupation | Male | Female |
| Management | 34 (80.9%) | 8 (19.1%) |
| Business & Financial | 0 (0.0%) | 20 (100.0%) |
| Computers, Engineering & Science | 2 (100.0%) | 0 (0.0%) |
| Computers & Mathematics | 2 (100.0%) | 0 (0.0%) |
| Architecture & Engineering | 0 (0.0%) | 0 (0.0%) |
| Life, Physical & Social Science | 0 (0.0%) | 0 (0.0%) |
| Community & Social Service | 5 (31.2%) | 11 (68.8%) |
| Education, Arts & Media | 0 (0.0%) | 0 (0.0%) |
| Legal Services & Support | 0 (0.0%) | 8 (100.0%) |
| Education Instruction & Library | 5 (62.5%) | 3 (37.5%) |
| Arts, Media & Entertainment | 0 (0.0%) | 0 (0.0%) |
| Health Diagnosing & Treating | 9 (20.4%) | 35 (79.5%) |
| Health Technologists | 9 (32.1%) | 19 (67.9%) |
| Total (Category) | 50 (40.3%) | 74 (59.7%) |
| Total (Overall) | 370 (56.8%) | 281 (43.2%) |
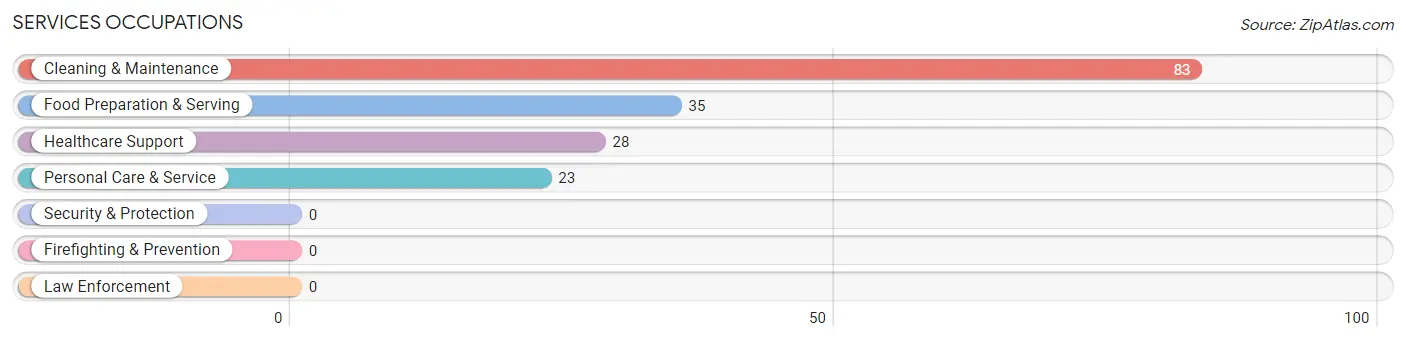
Services Occupations
The most common Services occupations in Charlotte Park are Cleaning & Maintenance (83 | 12.8%), Food Preparation & Serving (35 | 5.4%), Healthcare Support (28 | 4.3%), and Personal Care & Service (23 | 3.5%).
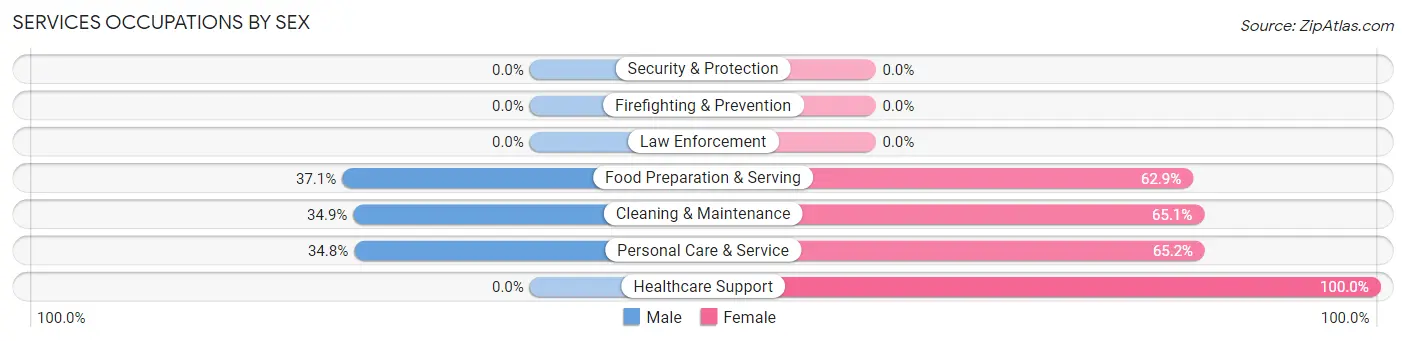
Services Occupations by Sex
Within the Services occupations in Charlotte Park, the most male-oriented occupations are Food Preparation & Serving (37.1%), Cleaning & Maintenance (34.9%), and Personal Care & Service (34.8%), while the most female-oriented occupations are Healthcare Support (100.0%), Personal Care & Service (65.2%), and Cleaning & Maintenance (65.1%).
| Occupation | Male | Female |
| Healthcare Support | 0 (0.0%) | 28 (100.0%) |
| Security & Protection | 0 (0.0%) | 0 (0.0%) |
| Firefighting & Prevention | 0 (0.0%) | 0 (0.0%) |
| Law Enforcement | 0 (0.0%) | 0 (0.0%) |
| Food Preparation & Serving | 13 (37.1%) | 22 (62.9%) |
| Cleaning & Maintenance | 29 (34.9%) | 54 (65.1%) |
| Personal Care & Service | 8 (34.8%) | 15 (65.2%) |
| Total (Category) | 50 (29.6%) | 119 (70.4%) |
| Total (Overall) | 370 (56.8%) | 281 (43.2%) |
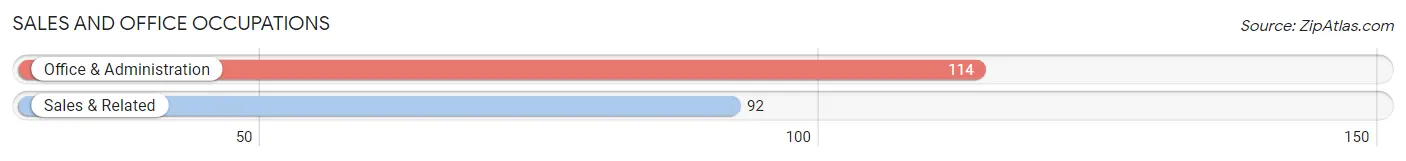
Sales and Office Occupations
The most common Sales and Office occupations in Charlotte Park are Office & Administration (114 | 17.5%), and Sales & Related (92 | 14.1%).
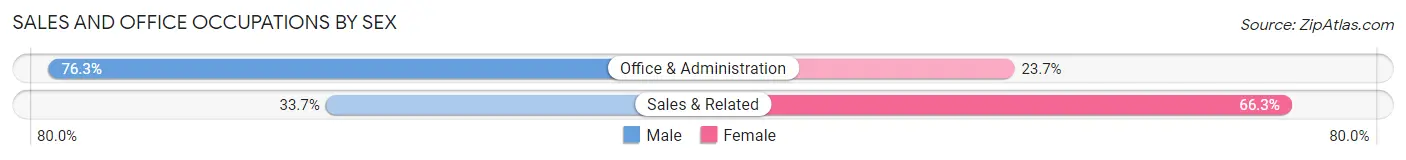
Sales and Office Occupations by Sex
| Occupation | Male | Female |
| Sales & Related | 31 (33.7%) | 61 (66.3%) |
| Office & Administration | 87 (76.3%) | 27 (23.7%) |
| Total (Category) | 118 (57.3%) | 88 (42.7%) |
| Total (Overall) | 370 (56.8%) | 281 (43.2%) |
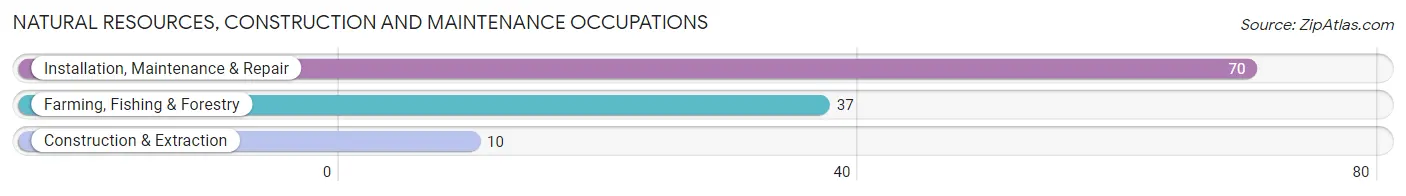
Natural Resources, Construction and Maintenance Occupations
The most common Natural Resources, Construction and Maintenance occupations in Charlotte Park are Installation, Maintenance & Repair (70 | 10.7%), Farming, Fishing & Forestry (37 | 5.7%), and Construction & Extraction (10 | 1.5%).
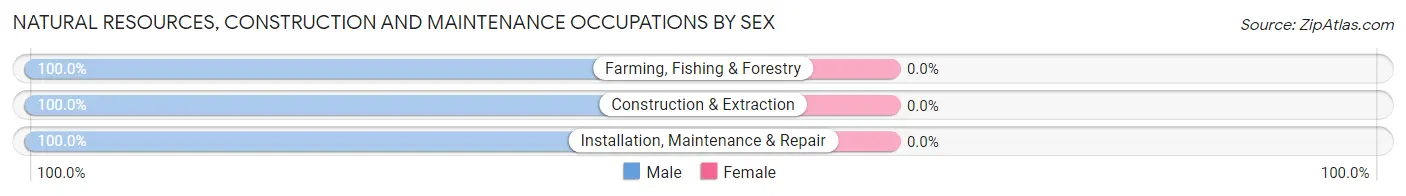
Natural Resources, Construction and Maintenance Occupations by Sex
| Occupation | Male | Female |
| Farming, Fishing & Forestry | 37 (100.0%) | 0 (0.0%) |
| Construction & Extraction | 10 (100.0%) | 0 (0.0%) |
| Installation, Maintenance & Repair | 70 (100.0%) | 0 (0.0%) |
| Total (Category) | 117 (100.0%) | 0 (0.0%) |
| Total (Overall) | 370 (56.8%) | 281 (43.2%) |
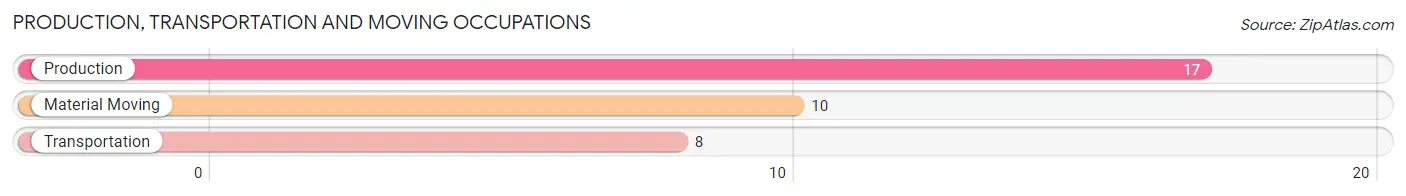
Production, Transportation and Moving Occupations
The most common Production, Transportation and Moving occupations in Charlotte Park are Production (17 | 2.6%), Material Moving (10 | 1.5%), and Transportation (8 | 1.2%).
Production, Transportation and Moving Occupations by Sex
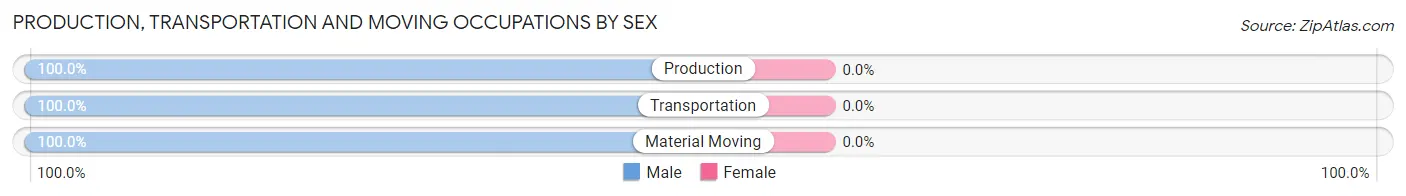
| Occupation | Male | Female |
| Production | 17 (100.0%) | 0 (0.0%) |
| Transportation | 8 (100.0%) | 0 (0.0%) |
| Material Moving | 10 (100.0%) | 0 (0.0%) |
| Total (Category) | 35 (100.0%) | 0 (0.0%) |
| Total (Overall) | 370 (56.8%) | 281 (43.2%) |
Employment Industries by Sex in Charlotte Park
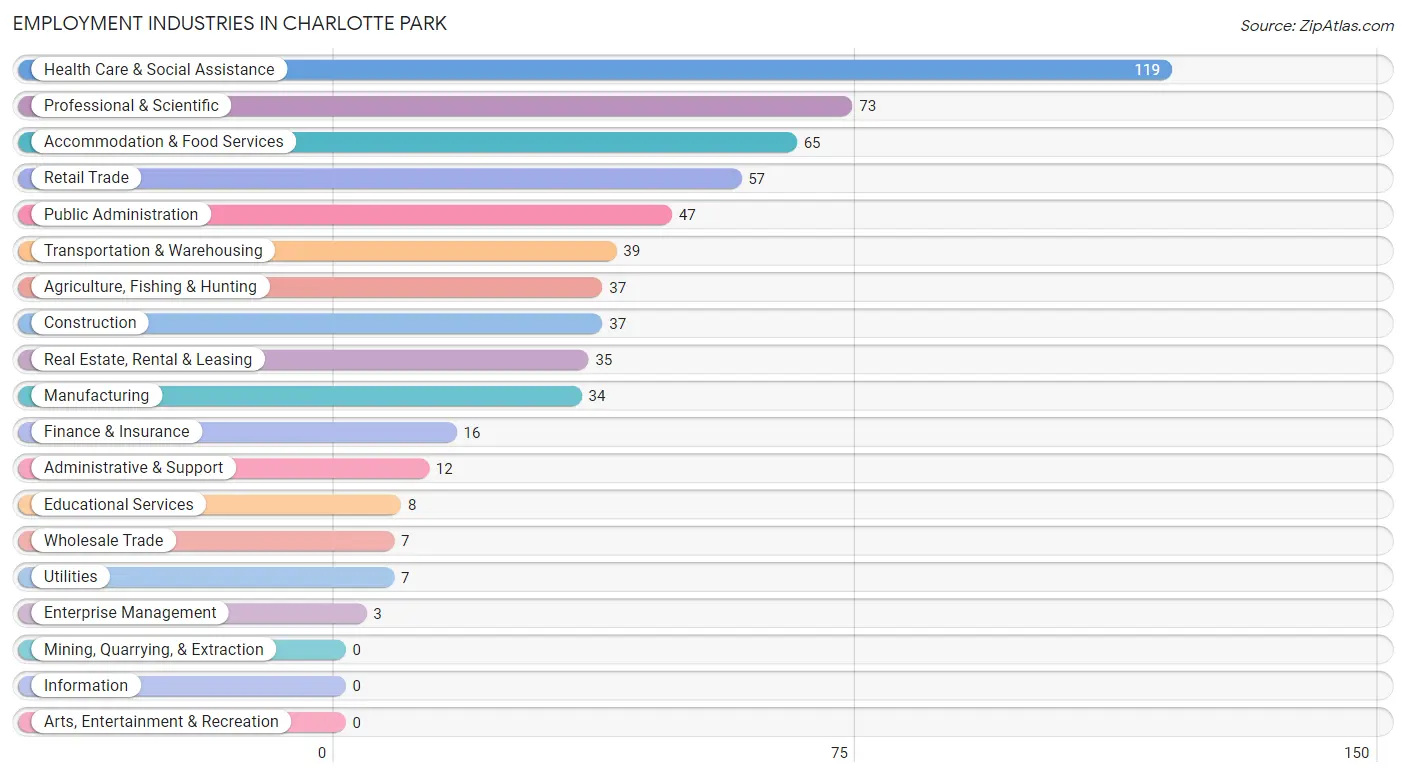
Employment Industries in Charlotte Park
The major employment industries in Charlotte Park include Health Care & Social Assistance (119 | 18.3%), Professional & Scientific (73 | 11.2%), Accommodation & Food Services (65 | 10.0%), Retail Trade (57 | 8.8%), and Public Administration (47 | 7.2%).
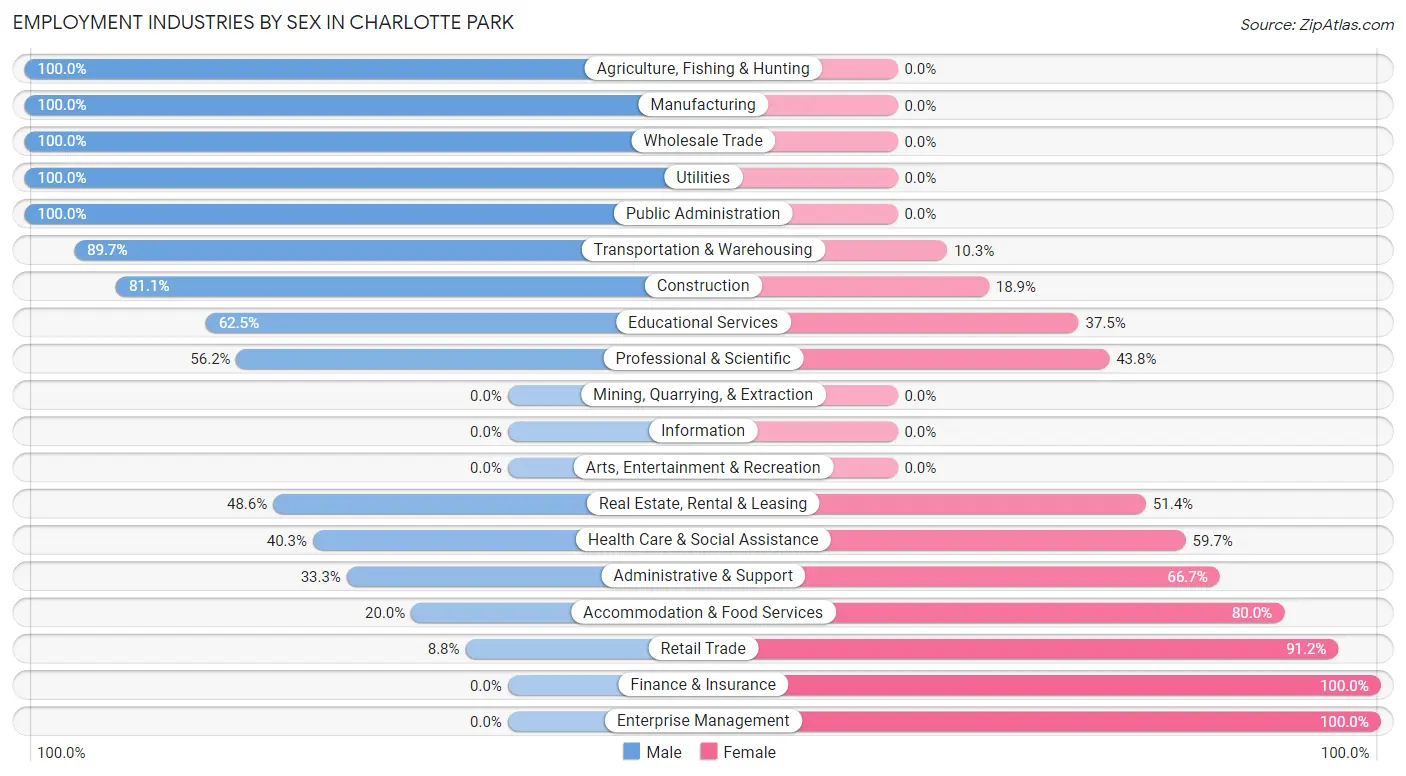
Employment Industries by Sex in Charlotte Park
The Charlotte Park industries that see more men than women are Agriculture, Fishing & Hunting (100.0%), Manufacturing (100.0%), and Wholesale Trade (100.0%), whereas the industries that tend to have a higher number of women are Finance & Insurance (100.0%), Enterprise Management (100.0%), and Retail Trade (91.2%).
| Industry | Male | Female |
| Agriculture, Fishing & Hunting | 37 (100.0%) | 0 (0.0%) |
| Mining, Quarrying, & Extraction | 0 (0.0%) | 0 (0.0%) |
| Construction | 30 (81.1%) | 7 (18.9%) |
| Manufacturing | 34 (100.0%) | 0 (0.0%) |
| Wholesale Trade | 7 (100.0%) | 0 (0.0%) |
| Retail Trade | 5 (8.8%) | 52 (91.2%) |
| Transportation & Warehousing | 35 (89.7%) | 4 (10.3%) |
| Utilities | 7 (100.0%) | 0 (0.0%) |
| Information | 0 (0.0%) | 0 (0.0%) |
| Finance & Insurance | 0 (0.0%) | 16 (100.0%) |
| Real Estate, Rental & Leasing | 17 (48.6%) | 18 (51.4%) |
| Professional & Scientific | 41 (56.2%) | 32 (43.8%) |
| Enterprise Management | 0 (0.0%) | 3 (100.0%) |
| Administrative & Support | 4 (33.3%) | 8 (66.7%) |
| Educational Services | 5 (62.5%) | 3 (37.5%) |
| Health Care & Social Assistance | 48 (40.3%) | 71 (59.7%) |
| Arts, Entertainment & Recreation | 0 (0.0%) | 0 (0.0%) |
| Accommodation & Food Services | 13 (20.0%) | 52 (80.0%) |
| Public Administration | 47 (100.0%) | 0 (0.0%) |
| Total | 370 (56.8%) | 281 (43.2%) |
Education in Charlotte Park
School Enrollment in Charlotte Park
The most common levels of schooling among the 72 students in Charlotte Park are college / undergraduate (28 | 38.9%), elementary school (27 | 37.5%), and high school (11 | 15.3%).
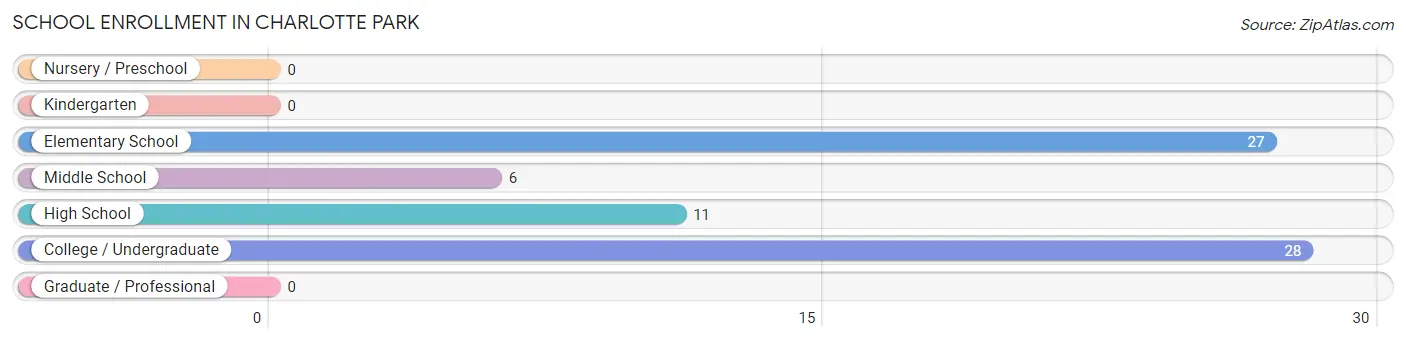
| School Level | # Students | % Students |
| Nursery / Preschool | 0 | 0.0% |
| Kindergarten | 0 | 0.0% |
| Elementary School | 27 | 37.5% |
| Middle School | 6 | 8.3% |
| High School | 11 | 15.3% |
| College / Undergraduate | 28 | 38.9% |
| Graduate / Professional | 0 | 0.0% |
| Total | 72 | 100.0% |
School Enrollment by Age by Funding Source in Charlotte Park
Out of a total of 72 students who are enrolled in schools in Charlotte Park, 9 (12.5%) attend a private institution, while the remaining 63 (87.5%) are enrolled in public schools. The age group of 35 years and over has the highest likelihood of being enrolled in private schools, with 9 (32.1% in the age bracket) enrolled. Conversely, the age group of 5 to 9 year old has the lowest likelihood of being enrolled in a private school, with 27 (100.0% in the age bracket) attending a public institution.
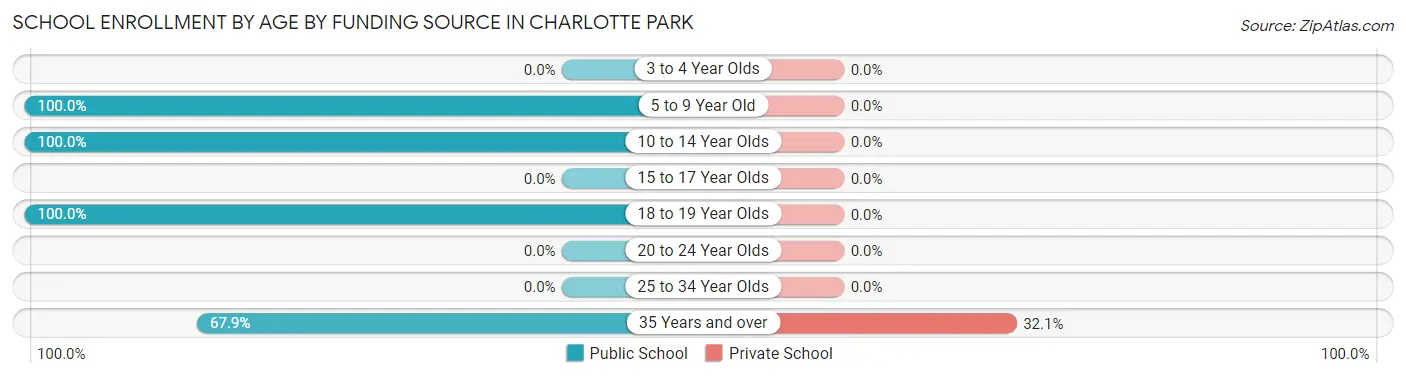
| Age Bracket | Public School | Private School |
| 3 to 4 Year Olds | 0 (0.0%) | 0 (0.0%) |
| 5 to 9 Year Old | 27 (100.0%) | 0 (0.0%) |
| 10 to 14 Year Olds | 6 (100.0%) | 0 (0.0%) |
| 15 to 17 Year Olds | 0 (0.0%) | 0 (0.0%) |
| 18 to 19 Year Olds | 11 (100.0%) | 0 (0.0%) |
| 20 to 24 Year Olds | 0 (0.0%) | 0 (0.0%) |
| 25 to 34 Year Olds | 0 (0.0%) | 0 (0.0%) |
| 35 Years and over | 19 (67.9%) | 9 (32.1%) |
| Total | 63 (87.5%) | 9 (12.5%) |
Educational Attainment by Field of Study in Charlotte Park
Arts & humanities (64 | 16.0%), engineering (63 | 15.7%), science & technology (60 | 15.0%), education (38 | 9.5%), and physical & health sciences (34 | 8.5%) are the most common fields of study among 401 individuals in Charlotte Park who have obtained a bachelor's degree or higher.
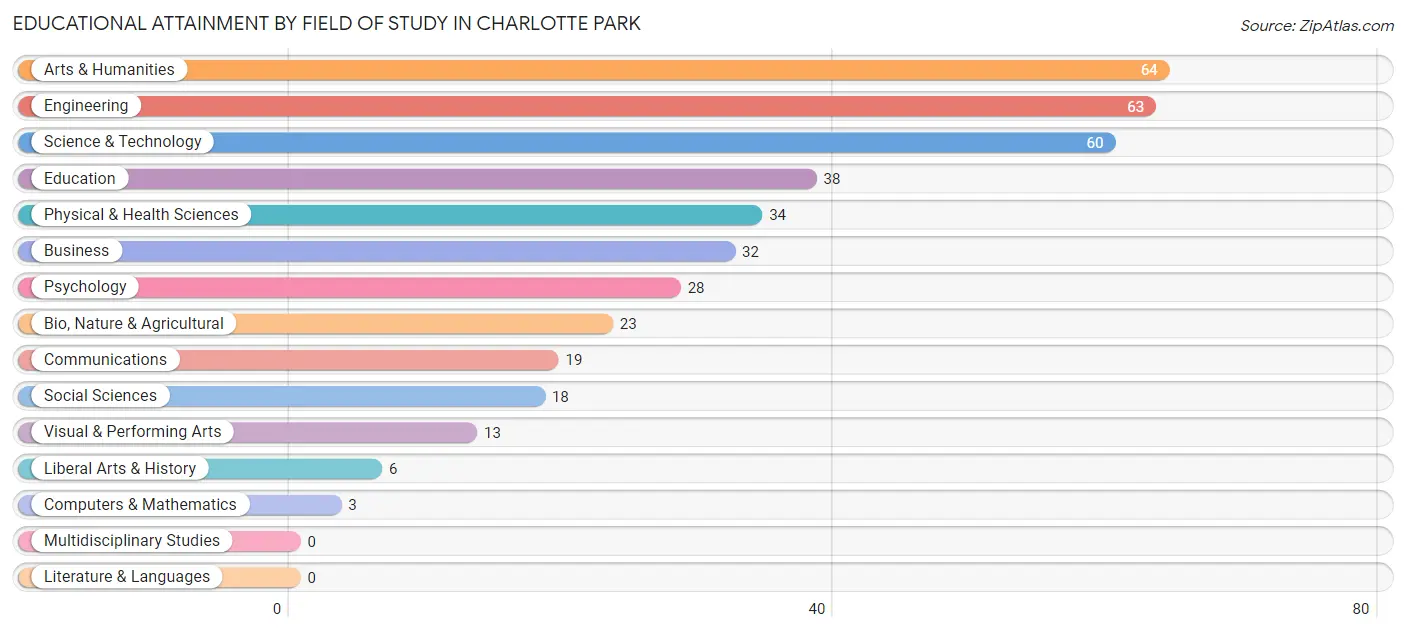
| Field of Study | # Graduates | % Graduates |
| Computers & Mathematics | 3 | 0.7% |
| Bio, Nature & Agricultural | 23 | 5.7% |
| Physical & Health Sciences | 34 | 8.5% |
| Psychology | 28 | 7.0% |
| Social Sciences | 18 | 4.5% |
| Engineering | 63 | 15.7% |
| Multidisciplinary Studies | 0 | 0.0% |
| Science & Technology | 60 | 15.0% |
| Business | 32 | 8.0% |
| Education | 38 | 9.5% |
| Literature & Languages | 0 | 0.0% |
| Liberal Arts & History | 6 | 1.5% |
| Visual & Performing Arts | 13 | 3.2% |
| Communications | 19 | 4.7% |
| Arts & Humanities | 64 | 16.0% |
| Total | 401 | 100.0% |
Transportation & Commute in Charlotte Park
Vehicle Availability by Sex in Charlotte Park
The most prevalent vehicle ownership categories in Charlotte Park are males with 2 vehicles (146, accounting for 40.2%) and females with 2 vehicles (118, making up 52.0%).
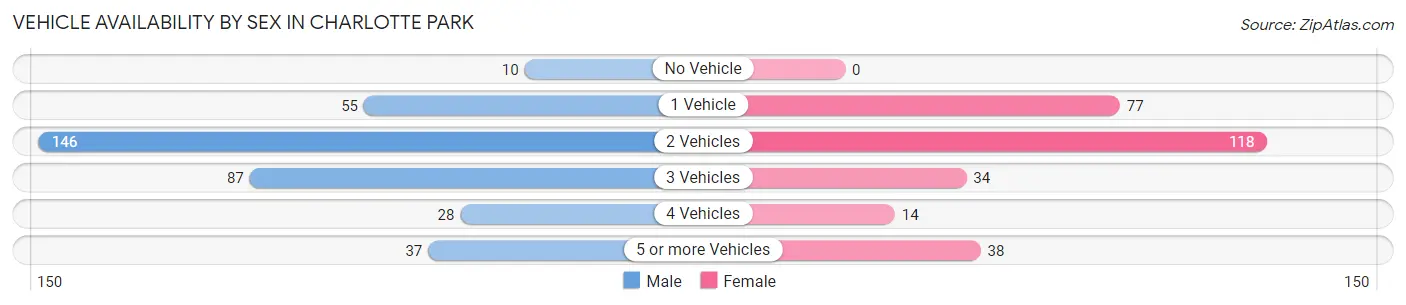
| Vehicles Available | Male | Female |
| No Vehicle | 10 (2.8%) | 0 (0.0%) |
| 1 Vehicle | 55 (15.1%) | 77 (27.4%) |
| 2 Vehicles | 146 (40.2%) | 118 (42.0%) |
| 3 Vehicles | 87 (24.0%) | 34 (12.1%) |
| 4 Vehicles | 28 (7.7%) | 14 (5.0%) |
| 5 or more Vehicles | 37 (10.2%) | 38 (13.5%) |
| Total | 363 (100.0%) | 281 (100.0%) |
Commute Time in Charlotte Park
The most frequently occuring commute durations in Charlotte Park are 5 to 9 minutes (98 commuters, 18.4%), 20 to 24 minutes (75 commuters, 14.1%), and 10 to 14 minutes (73 commuters, 13.7%).
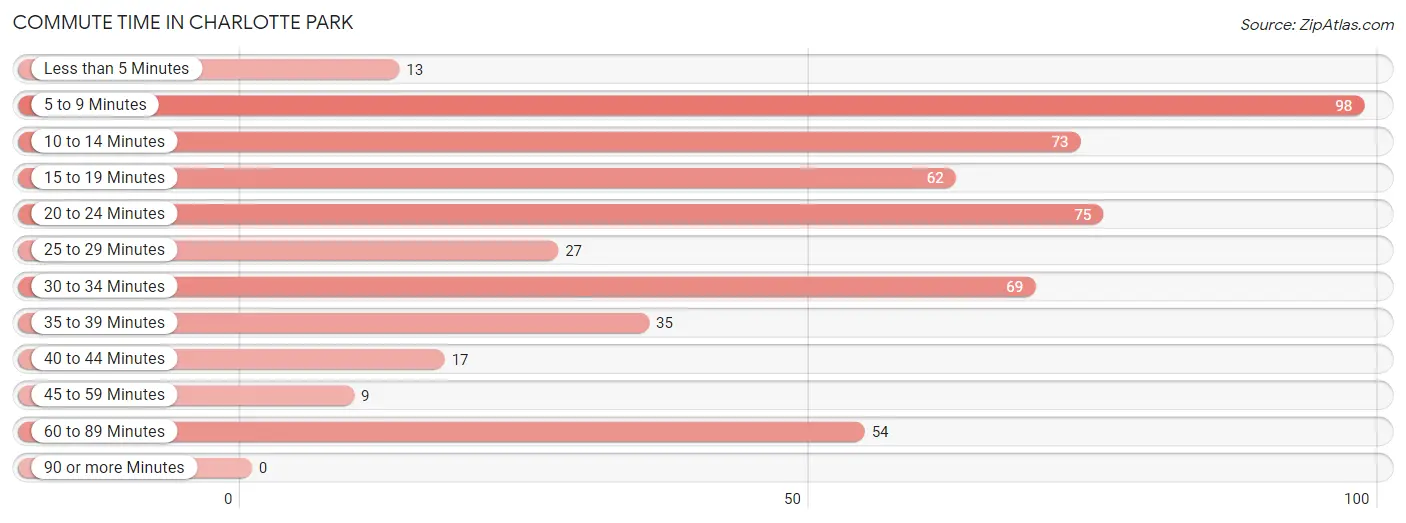
| Commute Time | # Commuters | % Commuters |
| Less than 5 Minutes | 13 | 2.4% |
| 5 to 9 Minutes | 98 | 18.4% |
| 10 to 14 Minutes | 73 | 13.7% |
| 15 to 19 Minutes | 62 | 11.7% |
| 20 to 24 Minutes | 75 | 14.1% |
| 25 to 29 Minutes | 27 | 5.1% |
| 30 to 34 Minutes | 69 | 13.0% |
| 35 to 39 Minutes | 35 | 6.6% |
| 40 to 44 Minutes | 17 | 3.2% |
| 45 to 59 Minutes | 9 | 1.7% |
| 60 to 89 Minutes | 54 | 10.2% |
| 90 or more Minutes | 0 | 0.0% |
Commute Time by Sex in Charlotte Park
The most common commute times in Charlotte Park are 5 to 9 minutes (62 commuters, 20.9%) for males and 15 to 19 minutes (56 commuters, 23.7%) for females.
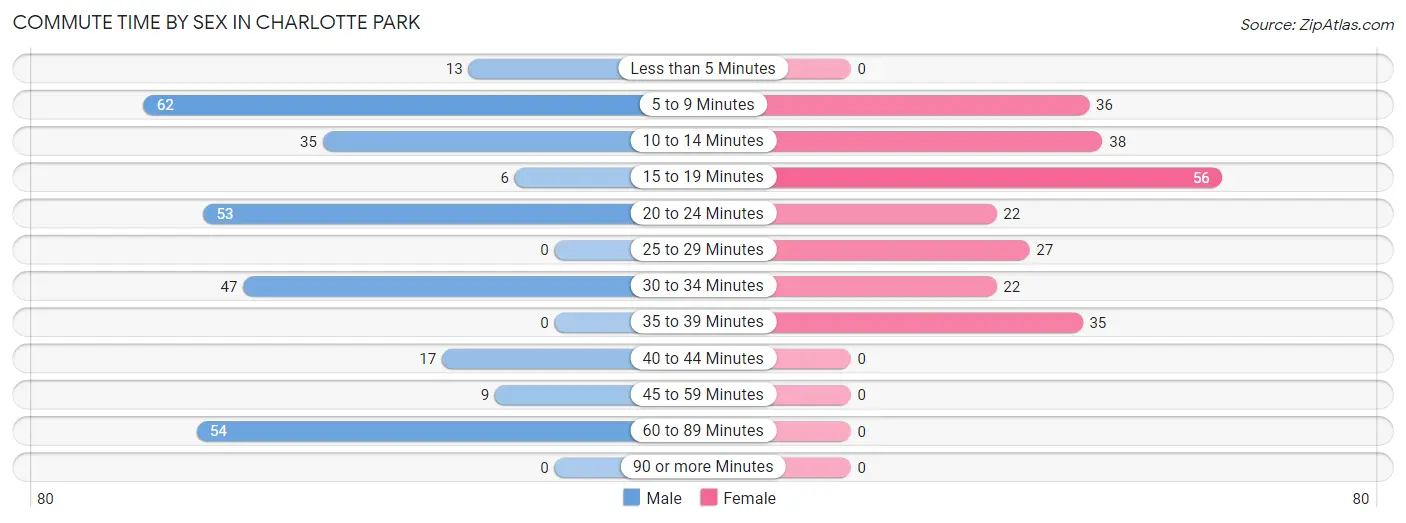
| Commute Time | Male | Female |
| Less than 5 Minutes | 13 (4.4%) | 0 (0.0%) |
| 5 to 9 Minutes | 62 (20.9%) | 36 (15.2%) |
| 10 to 14 Minutes | 35 (11.8%) | 38 (16.1%) |
| 15 to 19 Minutes | 6 (2.0%) | 56 (23.7%) |
| 20 to 24 Minutes | 53 (17.9%) | 22 (9.3%) |
| 25 to 29 Minutes | 0 (0.0%) | 27 (11.4%) |
| 30 to 34 Minutes | 47 (15.9%) | 22 (9.3%) |
| 35 to 39 Minutes | 0 (0.0%) | 35 (14.8%) |
| 40 to 44 Minutes | 17 (5.7%) | 0 (0.0%) |
| 45 to 59 Minutes | 9 (3.0%) | 0 (0.0%) |
| 60 to 89 Minutes | 54 (18.2%) | 0 (0.0%) |
| 90 or more Minutes | 0 (0.0%) | 0 (0.0%) |
Time of Departure to Work by Sex in Charlotte Park
The most frequent times of departure to work in Charlotte Park are 7:00 AM to 7:29 AM (69, 23.3%) for males and 9:00 AM to 9:59 AM (45, 19.1%) for females.
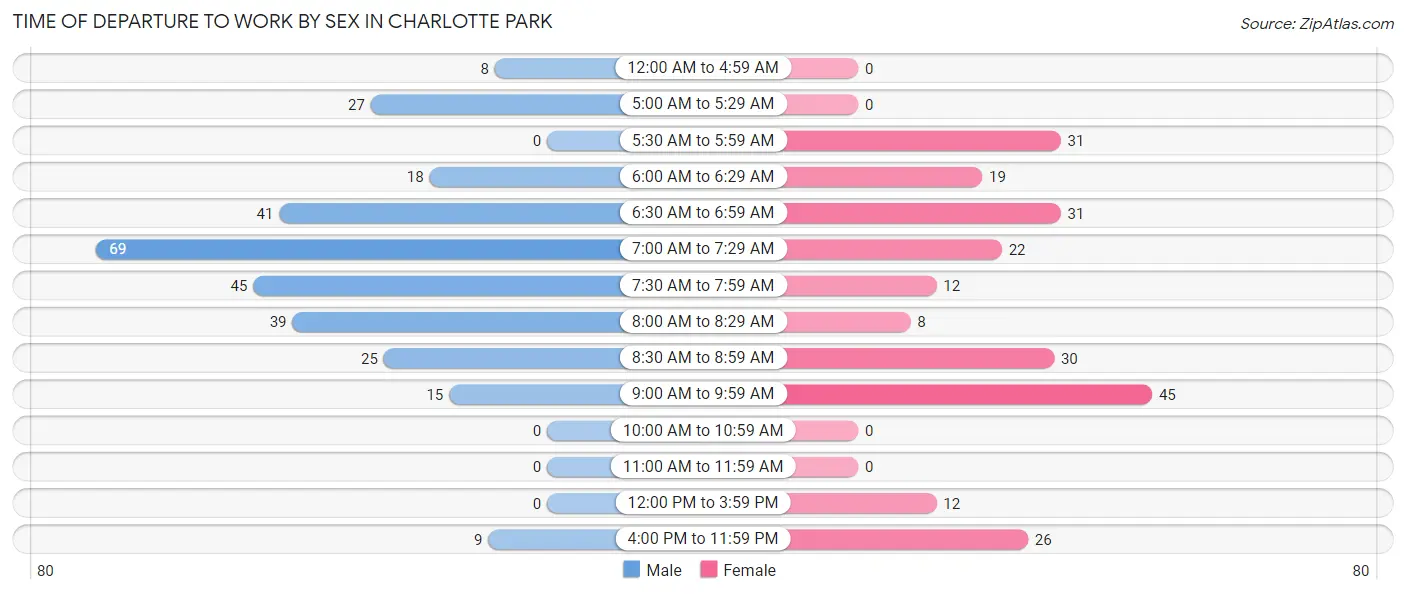
| Time of Departure | Male | Female |
| 12:00 AM to 4:59 AM | 8 (2.7%) | 0 (0.0%) |
| 5:00 AM to 5:29 AM | 27 (9.1%) | 0 (0.0%) |
| 5:30 AM to 5:59 AM | 0 (0.0%) | 31 (13.1%) |
| 6:00 AM to 6:29 AM | 18 (6.1%) | 19 (8.1%) |
| 6:30 AM to 6:59 AM | 41 (13.9%) | 31 (13.1%) |
| 7:00 AM to 7:29 AM | 69 (23.3%) | 22 (9.3%) |
| 7:30 AM to 7:59 AM | 45 (15.2%) | 12 (5.1%) |
| 8:00 AM to 8:29 AM | 39 (13.2%) | 8 (3.4%) |
| 8:30 AM to 8:59 AM | 25 (8.5%) | 30 (12.7%) |
| 9:00 AM to 9:59 AM | 15 (5.1%) | 45 (19.1%) |
| 10:00 AM to 10:59 AM | 0 (0.0%) | 0 (0.0%) |
| 11:00 AM to 11:59 AM | 0 (0.0%) | 0 (0.0%) |
| 12:00 PM to 3:59 PM | 0 (0.0%) | 12 (5.1%) |
| 4:00 PM to 11:59 PM | 9 (3.0%) | 26 (11.0%) |
| Total | 296 (100.0%) | 236 (100.0%) |
Housing Occupancy in Charlotte Park
Occupancy by Ownership in Charlotte Park
Of the total 951 dwellings in Charlotte Park, owner-occupied units account for 837 (88.0%), while renter-occupied units make up 114 (12.0%).
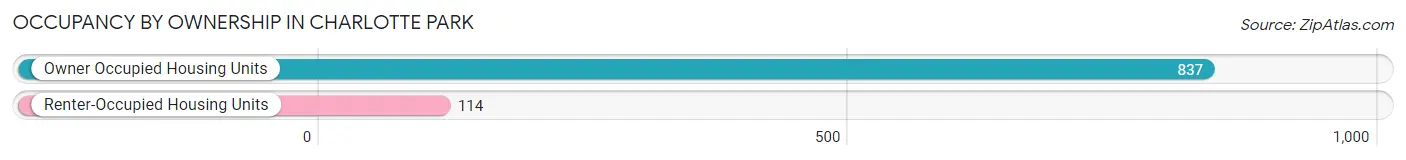
| Occupancy | # Housing Units | % Housing Units |
| Owner Occupied Housing Units | 837 | 88.0% |
| Renter-Occupied Housing Units | 114 | 12.0% |
| Total Occupied Housing Units | 951 | 100.0% |
Occupancy by Household Size in Charlotte Park
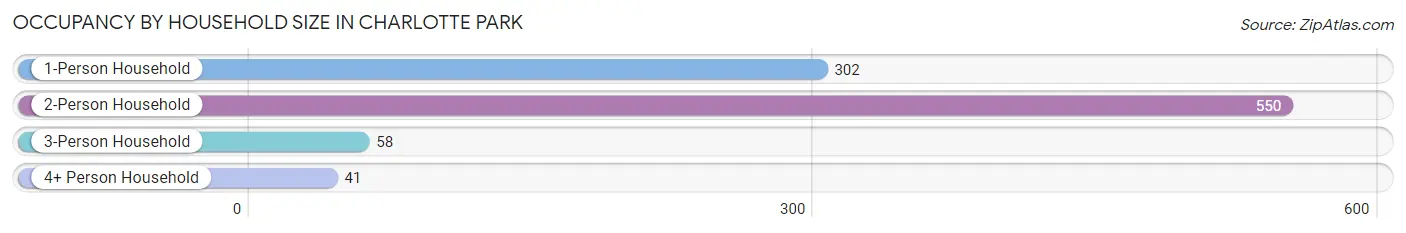
| Household Size | # Housing Units | % Housing Units |
| 1-Person Household | 302 | 31.8% |
| 2-Person Household | 550 | 57.8% |
| 3-Person Household | 58 | 6.1% |
| 4+ Person Household | 41 | 4.3% |
| Total Housing Units | 951 | 100.0% |
Occupancy by Ownership by Household Size in Charlotte Park
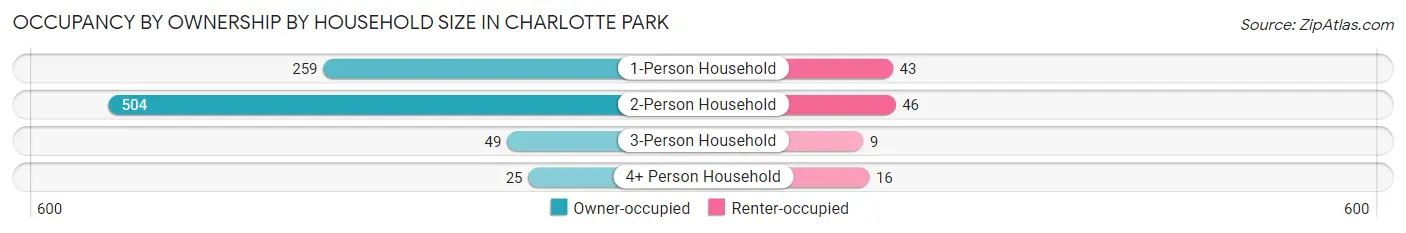
| Household Size | Owner-occupied | Renter-occupied |
| 1-Person Household | 259 (85.8%) | 43 (14.2%) |
| 2-Person Household | 504 (91.6%) | 46 (8.4%) |
| 3-Person Household | 49 (84.5%) | 9 (15.5%) |
| 4+ Person Household | 25 (61.0%) | 16 (39.0%) |
| Total Housing Units | 837 (88.0%) | 114 (12.0%) |
Occupancy by Educational Attainment in Charlotte Park
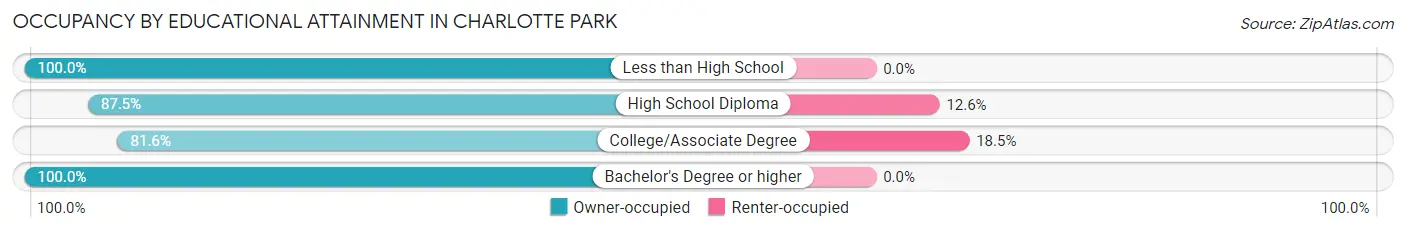
| Household Size | Owner-occupied | Renter-occupied |
| Less than High School | 44 (100.0%) | 0 (0.0%) |
| High School Diploma | 230 (87.5%) | 33 (12.6%) |
| College/Associate Degree | 358 (81.6%) | 81 (18.4%) |
| Bachelor's Degree or higher | 205 (100.0%) | 0 (0.0%) |
Occupancy by Age of Householder in Charlotte Park
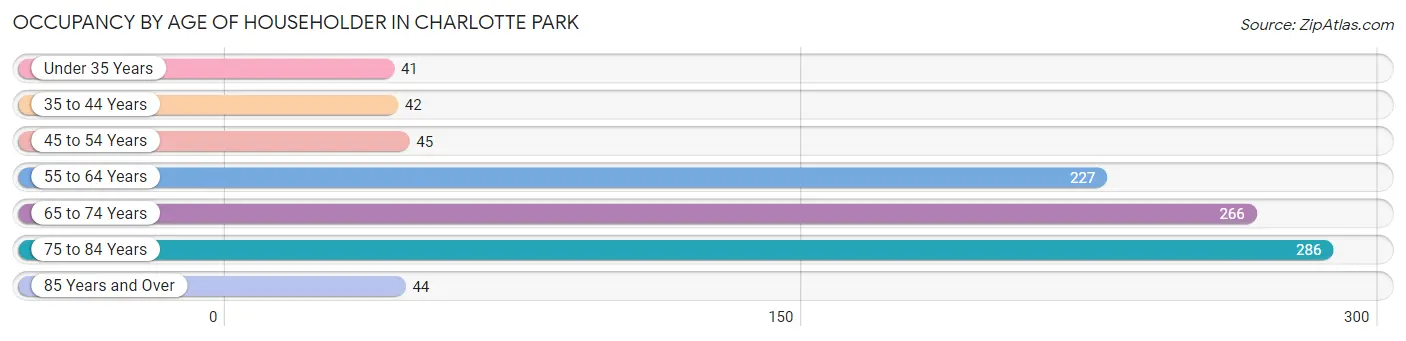
| Age Bracket | # Households | % Households |
| Under 35 Years | 41 | 4.3% |
| 35 to 44 Years | 42 | 4.4% |
| 45 to 54 Years | 45 | 4.7% |
| 55 to 64 Years | 227 | 23.9% |
| 65 to 74 Years | 266 | 28.0% |
| 75 to 84 Years | 286 | 30.1% |
| 85 Years and Over | 44 | 4.6% |
| Total | 951 | 100.0% |
Housing Finances in Charlotte Park
Median Income by Occupancy in Charlotte Park
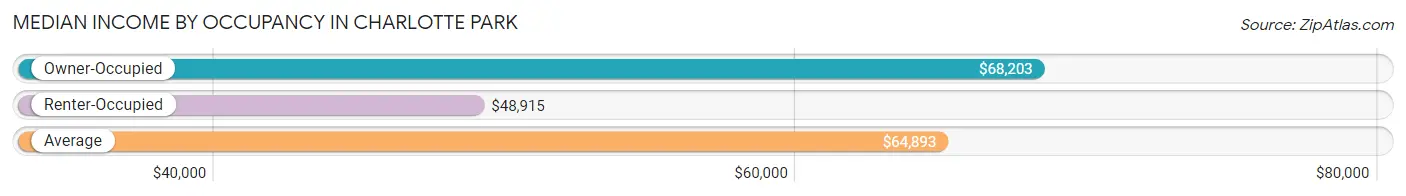
| Occupancy Type | # Households | Median Income |
| Owner-Occupied | 837 (88.0%) | $68,203 |
| Renter-Occupied | 114 (12.0%) | $48,915 |
| Average | 951 (100.0%) | $64,893 |
Occupancy by Householder Income Bracket in Charlotte Park
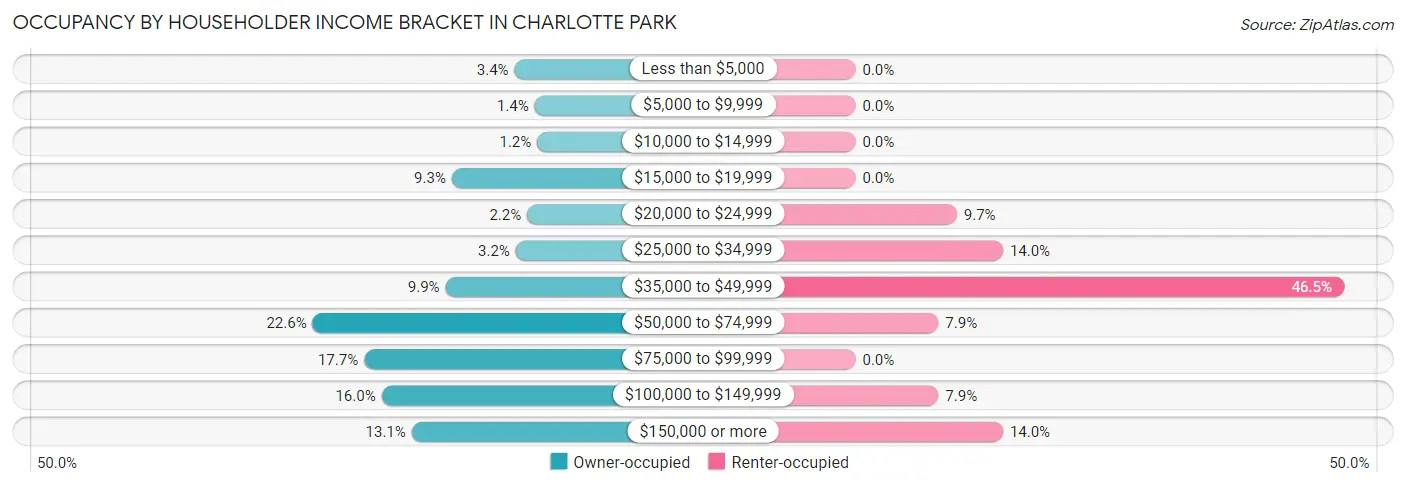
| Income Bracket | Owner-occupied | Renter-occupied |
| Less than $5,000 | 28 (3.4%) | 0 (0.0%) |
| $5,000 to $9,999 | 12 (1.4%) | 0 (0.0%) |
| $10,000 to $14,999 | 10 (1.2%) | 0 (0.0%) |
| $15,000 to $19,999 | 78 (9.3%) | 0 (0.0%) |
| $20,000 to $24,999 | 18 (2.1%) | 11 (9.7%) |
| $25,000 to $34,999 | 27 (3.2%) | 16 (14.0%) |
| $35,000 to $49,999 | 83 (9.9%) | 53 (46.5%) |
| $50,000 to $74,999 | 189 (22.6%) | 9 (7.9%) |
| $75,000 to $99,999 | 148 (17.7%) | 0 (0.0%) |
| $100,000 to $149,999 | 134 (16.0%) | 9 (7.9%) |
| $150,000 or more | 110 (13.1%) | 16 (14.0%) |
| Total | 837 (100.0%) | 114 (100.0%) |
Monthly Housing Cost Tiers in Charlotte Park
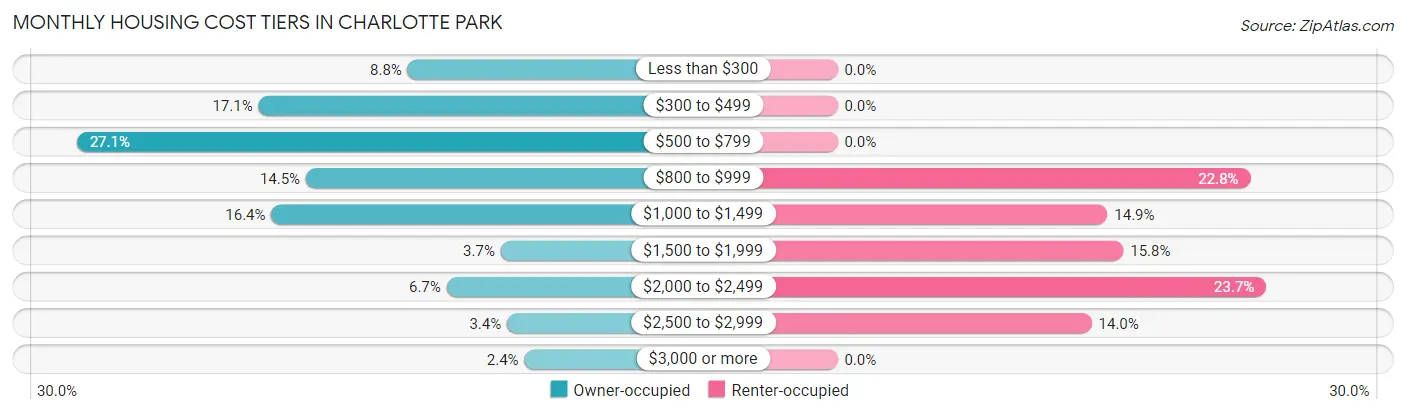
| Monthly Cost | Owner-occupied | Renter-occupied |
| Less than $300 | 74 (8.8%) | 0 (0.0%) |
| $300 to $499 | 143 (17.1%) | 0 (0.0%) |
| $500 to $799 | 227 (27.1%) | 0 (0.0%) |
| $800 to $999 | 121 (14.5%) | 26 (22.8%) |
| $1,000 to $1,499 | 137 (16.4%) | 17 (14.9%) |
| $1,500 to $1,999 | 31 (3.7%) | 18 (15.8%) |
| $2,000 to $2,499 | 56 (6.7%) | 27 (23.7%) |
| $2,500 to $2,999 | 28 (3.4%) | 16 (14.0%) |
| $3,000 or more | 20 (2.4%) | 0 (0.0%) |
| Total | 837 (100.0%) | 114 (100.0%) |
Physical Housing Characteristics in Charlotte Park
Housing Structures in Charlotte Park
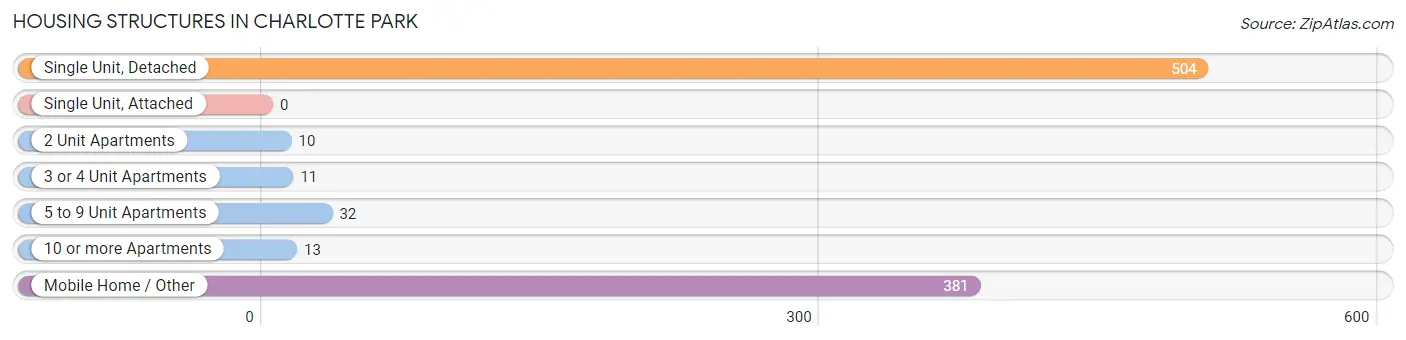
| Structure Type | # Housing Units | % Housing Units |
| Single Unit, Detached | 504 | 53.0% |
| Single Unit, Attached | 0 | 0.0% |
| 2 Unit Apartments | 10 | 1.1% |
| 3 or 4 Unit Apartments | 11 | 1.2% |
| 5 to 9 Unit Apartments | 32 | 3.4% |
| 10 or more Apartments | 13 | 1.4% |
| Mobile Home / Other | 381 | 40.1% |
| Total | 951 | 100.0% |
Housing Structures by Occupancy in Charlotte Park
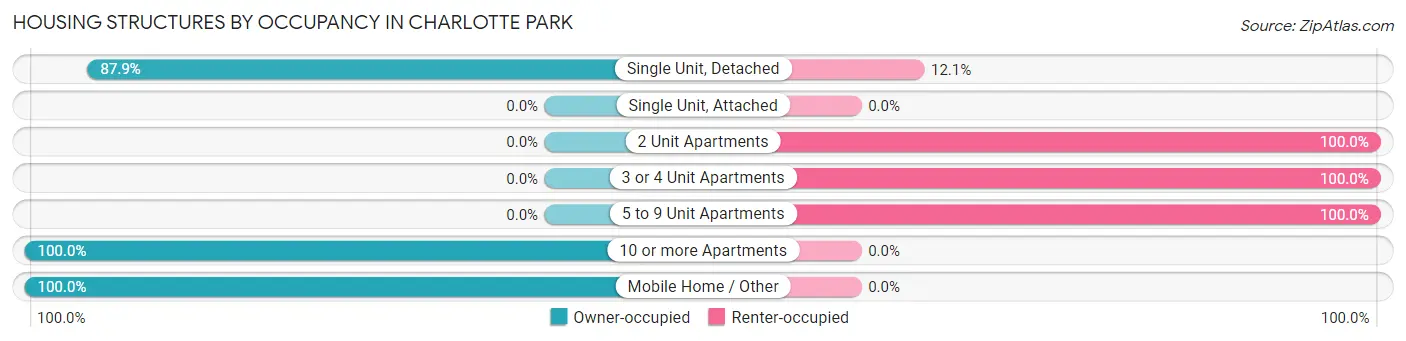
| Structure Type | Owner-occupied | Renter-occupied |
| Single Unit, Detached | 443 (87.9%) | 61 (12.1%) |
| Single Unit, Attached | 0 (0.0%) | 0 (0.0%) |
| 2 Unit Apartments | 0 (0.0%) | 10 (100.0%) |
| 3 or 4 Unit Apartments | 0 (0.0%) | 11 (100.0%) |
| 5 to 9 Unit Apartments | 0 (0.0%) | 32 (100.0%) |
| 10 or more Apartments | 13 (100.0%) | 0 (0.0%) |
| Mobile Home / Other | 381 (100.0%) | 0 (0.0%) |
| Total | 837 (88.0%) | 114 (12.0%) |
Housing Structures by Number of Rooms in Charlotte Park
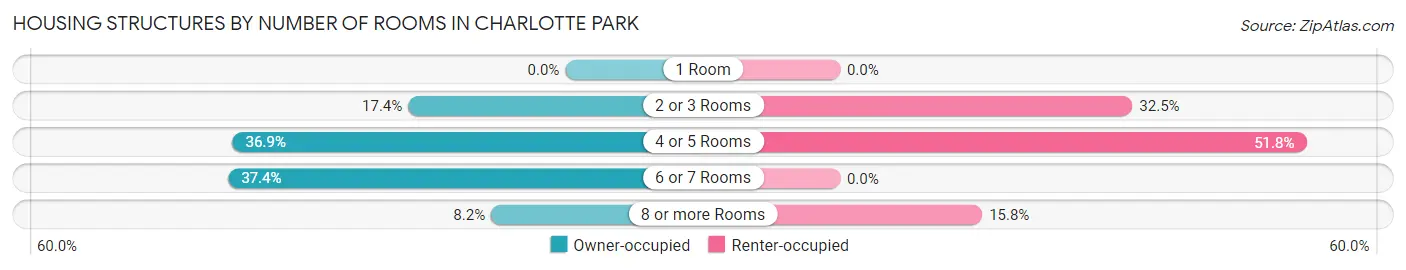
| Number of Rooms | Owner-occupied | Renter-occupied |
| 1 Room | 0 (0.0%) | 0 (0.0%) |
| 2 or 3 Rooms | 146 (17.4%) | 37 (32.5%) |
| 4 or 5 Rooms | 309 (36.9%) | 59 (51.7%) |
| 6 or 7 Rooms | 313 (37.4%) | 0 (0.0%) |
| 8 or more Rooms | 69 (8.2%) | 18 (15.8%) |
| Total | 837 (100.0%) | 114 (100.0%) |
Housing Structure by Heating Type in Charlotte Park
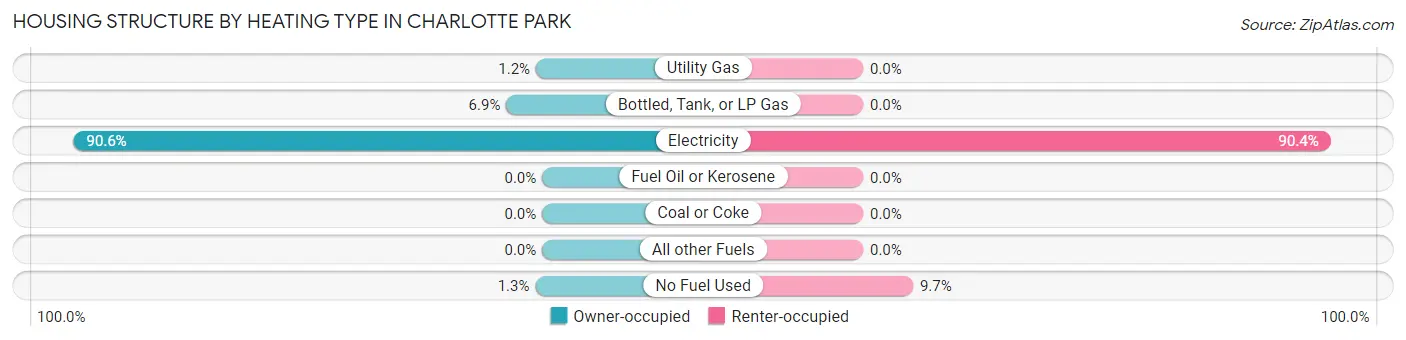
| Heating Type | Owner-occupied | Renter-occupied |
| Utility Gas | 10 (1.2%) | 0 (0.0%) |
| Bottled, Tank, or LP Gas | 58 (6.9%) | 0 (0.0%) |
| Electricity | 758 (90.6%) | 103 (90.3%) |
| Fuel Oil or Kerosene | 0 (0.0%) | 0 (0.0%) |
| Coal or Coke | 0 (0.0%) | 0 (0.0%) |
| All other Fuels | 0 (0.0%) | 0 (0.0%) |
| No Fuel Used | 11 (1.3%) | 11 (9.7%) |
| Total | 837 (100.0%) | 114 (100.0%) |
Household Vehicle Usage in Charlotte Park
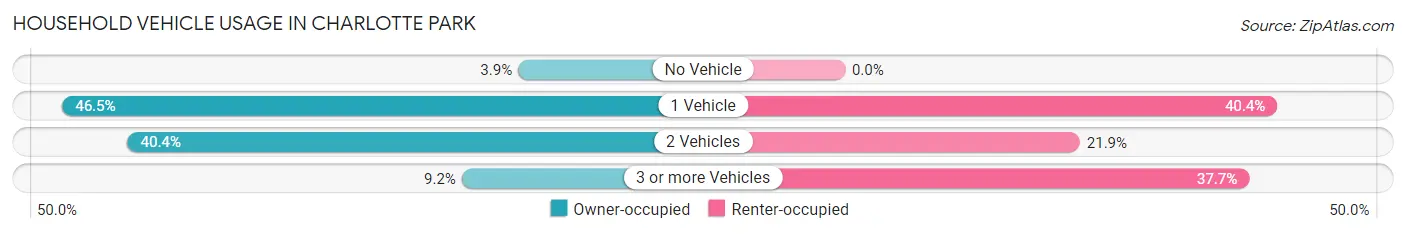
| Vehicles per Household | Owner-occupied | Renter-occupied |
| No Vehicle | 33 (3.9%) | 0 (0.0%) |
| 1 Vehicle | 389 (46.5%) | 46 (40.4%) |
| 2 Vehicles | 338 (40.4%) | 25 (21.9%) |
| 3 or more Vehicles | 77 (9.2%) | 43 (37.7%) |
| Total | 837 (100.0%) | 114 (100.0%) |
Real Estate & Mortgages in Charlotte Park
Real Estate and Mortgage Overview in Charlotte Park
| Characteristic | Without Mortgage | With Mortgage |
| Housing Units | 654 | 183 |
| Median Property Value | $204,300 | $267,100 |
| Median Household Income | $64,808 | $55 |
| Monthly Housing Costs | $592 | $0 |
| Real Estate Taxes | $2,274 | $0 |
Property Value by Mortgage Status in Charlotte Park
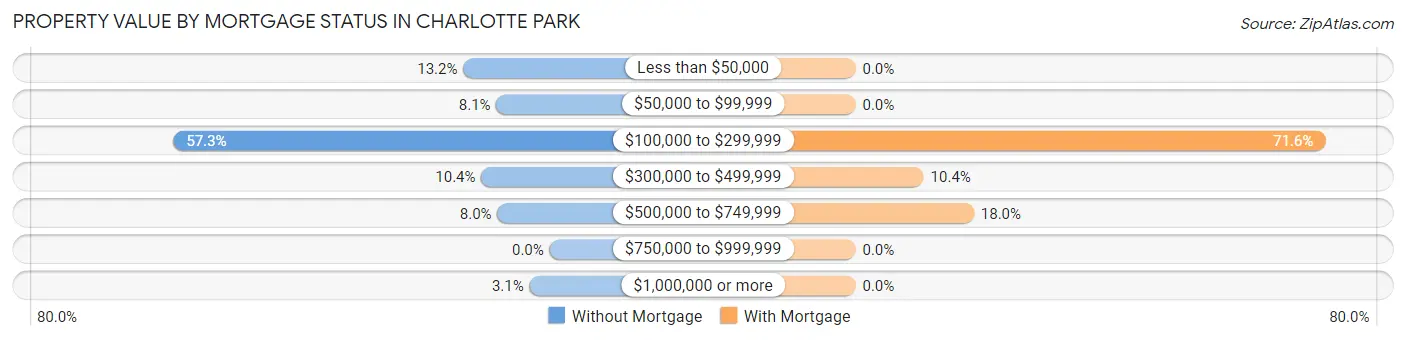
| Property Value | Without Mortgage | With Mortgage |
| Less than $50,000 | 86 (13.2%) | 0 (0.0%) |
| $50,000 to $99,999 | 53 (8.1%) | 0 (0.0%) |
| $100,000 to $299,999 | 375 (57.3%) | 131 (71.6%) |
| $300,000 to $499,999 | 68 (10.4%) | 19 (10.4%) |
| $500,000 to $749,999 | 52 (8.0%) | 33 (18.0%) |
| $750,000 to $999,999 | 0 (0.0%) | 0 (0.0%) |
| $1,000,000 or more | 20 (3.1%) | 0 (0.0%) |
| Total | 654 (100.0%) | 183 (100.0%) |
Household Income by Mortgage Status in Charlotte Park
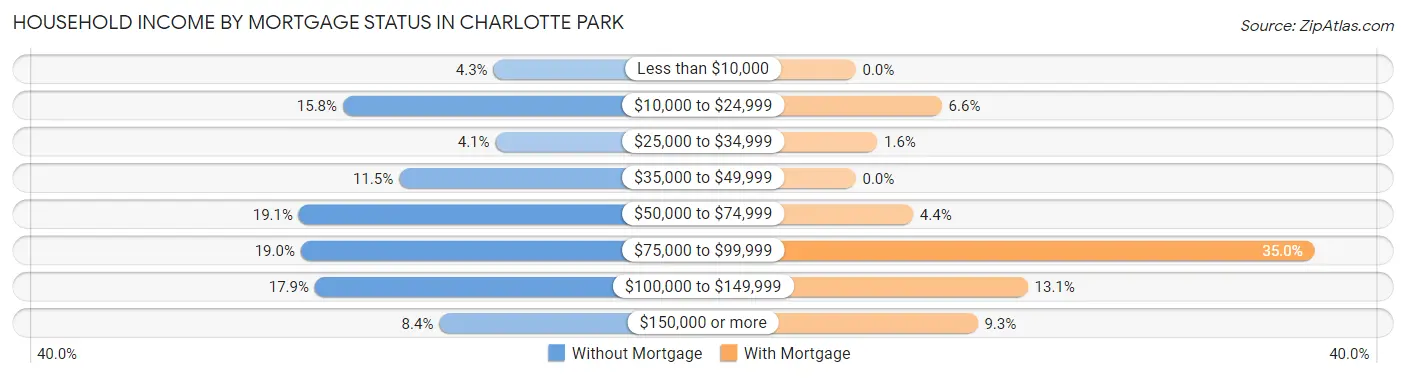
| Household Income | Without Mortgage | With Mortgage |
| Less than $10,000 | 28 (4.3%) | 0 (0.0%) |
| $10,000 to $24,999 | 103 (15.8%) | 12 (6.6%) |
| $25,000 to $34,999 | 27 (4.1%) | 3 (1.6%) |
| $35,000 to $49,999 | 75 (11.5%) | 0 (0.0%) |
| $50,000 to $74,999 | 125 (19.1%) | 8 (4.4%) |
| $75,000 to $99,999 | 124 (19.0%) | 64 (35.0%) |
| $100,000 to $149,999 | 117 (17.9%) | 24 (13.1%) |
| $150,000 or more | 55 (8.4%) | 17 (9.3%) |
| Total | 654 (100.0%) | 183 (100.0%) |
Property Value to Household Income Ratio in Charlotte Park
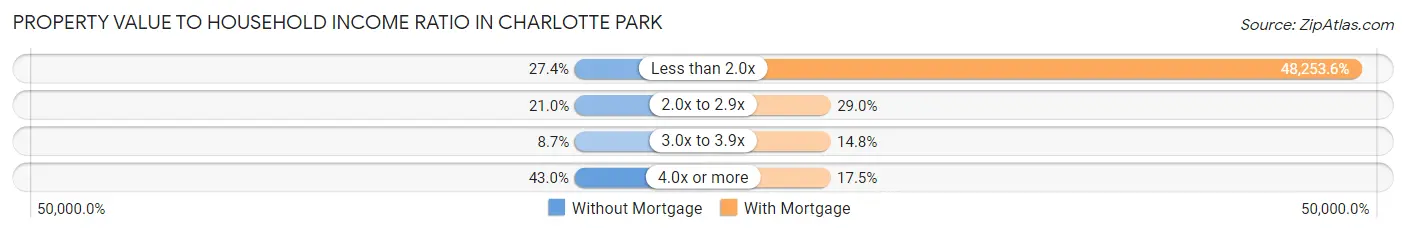
| Value-to-Income Ratio | Without Mortgage | With Mortgage |
| Less than 2.0x | 179 (27.4%) | 88,304 (48,253.6%) |
| 2.0x to 2.9x | 137 (20.9%) | 53 (29.0%) |
| 3.0x to 3.9x | 57 (8.7%) | 27 (14.7%) |
| 4.0x or more | 281 (43.0%) | 32 (17.5%) |
| Total | 654 (100.0%) | 183 (100.0%) |
Real Estate Taxes by Mortgage Status in Charlotte Park
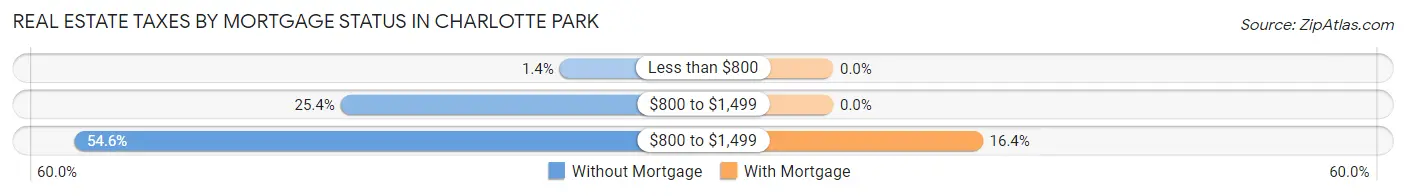
| Property Taxes | Without Mortgage | With Mortgage |
| Less than $800 | 9 (1.4%) | 0 (0.0%) |
| $800 to $1,499 | 166 (25.4%) | 0 (0.0%) |
| $800 to $1,499 | 357 (54.6%) | 30 (16.4%) |
| Total | 654 (100.0%) | 183 (100.0%) |
Health & Disability in Charlotte Park
Health Insurance Coverage by Age in Charlotte Park
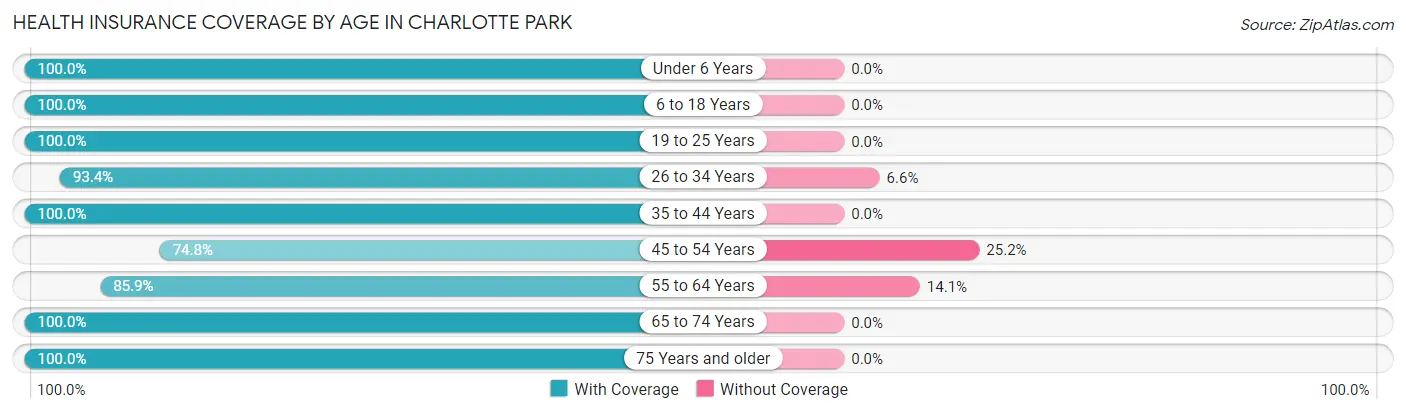
| Age Bracket | With Coverage | Without Coverage |
| Under 6 Years | 22 (100.0%) | 0 (0.0%) |
| 6 to 18 Years | 44 (100.0%) | 0 (0.0%) |
| 19 to 25 Years | 44 (100.0%) | 0 (0.0%) |
| 26 to 34 Years | 85 (93.4%) | 6 (6.6%) |
| 35 to 44 Years | 75 (100.0%) | 0 (0.0%) |
| 45 to 54 Years | 92 (74.8%) | 31 (25.2%) |
| 55 to 64 Years | 335 (85.9%) | 55 (14.1%) |
| 65 to 74 Years | 441 (100.0%) | 0 (0.0%) |
| 75 Years and older | 565 (100.0%) | 0 (0.0%) |
| Total | 1,703 (94.9%) | 92 (5.1%) |
Health Insurance Coverage by Citizenship Status in Charlotte Park
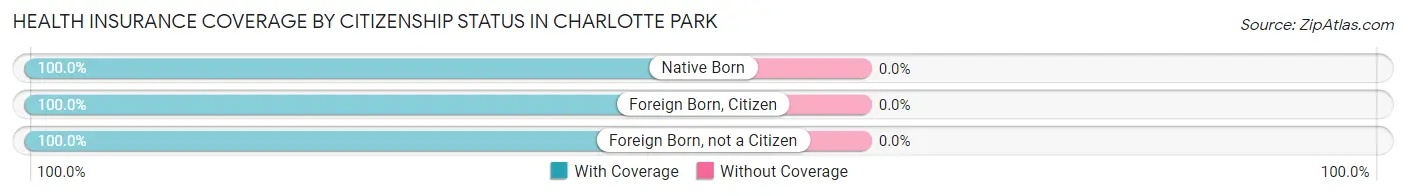
| Citizenship Status | With Coverage | Without Coverage |
| Native Born | 22 (100.0%) | 0 (0.0%) |
| Foreign Born, Citizen | 44 (100.0%) | 0 (0.0%) |
| Foreign Born, not a Citizen | 44 (100.0%) | 0 (0.0%) |
Health Insurance Coverage by Household Income in Charlotte Park
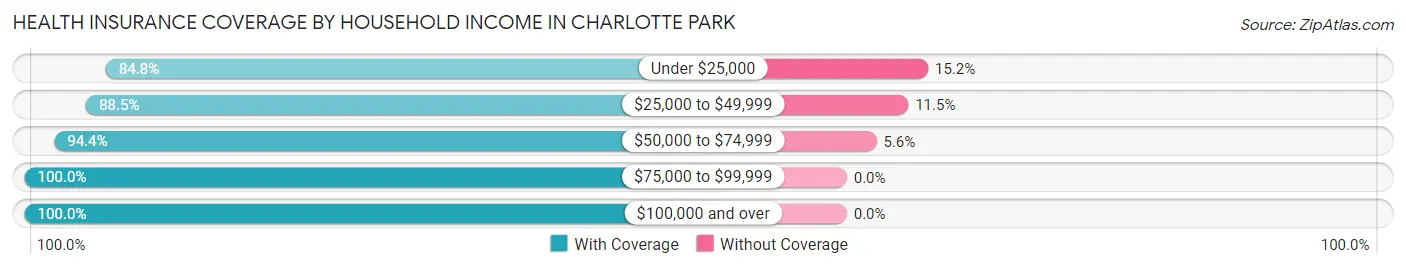
| Household Income | With Coverage | Without Coverage |
| Under $25,000 | 195 (84.8%) | 35 (15.2%) |
| $25,000 to $49,999 | 246 (88.5%) | 32 (11.5%) |
| $50,000 to $74,999 | 424 (94.4%) | 25 (5.6%) |
| $75,000 to $99,999 | 239 (100.0%) | 0 (0.0%) |
| $100,000 and over | 599 (100.0%) | 0 (0.0%) |
Public vs Private Health Insurance Coverage by Age in Charlotte Park
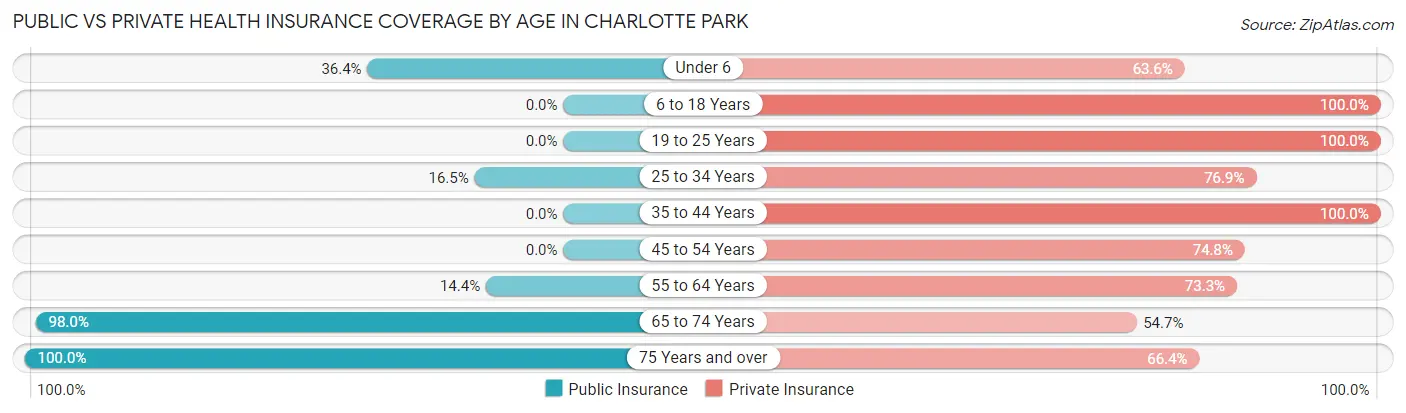
| Age Bracket | Public Insurance | Private Insurance |
| Under 6 | 8 (36.4%) | 14 (63.6%) |
| 6 to 18 Years | 0 (0.0%) | 44 (100.0%) |
| 19 to 25 Years | 0 (0.0%) | 44 (100.0%) |
| 25 to 34 Years | 15 (16.5%) | 70 (76.9%) |
| 35 to 44 Years | 0 (0.0%) | 75 (100.0%) |
| 45 to 54 Years | 0 (0.0%) | 92 (74.8%) |
| 55 to 64 Years | 56 (14.4%) | 286 (73.3%) |
| 65 to 74 Years | 432 (98.0%) | 241 (54.6%) |
| 75 Years and over | 565 (100.0%) | 375 (66.4%) |
| Total | 1,076 (59.9%) | 1,241 (69.1%) |
Disability Status by Sex by Age in Charlotte Park
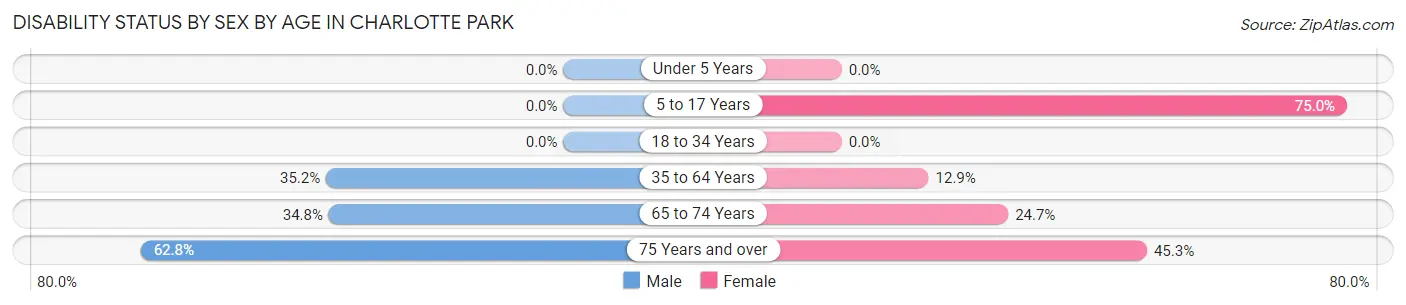
| Age Bracket | Male | Female |
| Under 5 Years | 0 (0.0%) | 0 (0.0%) |
| 5 to 17 Years | 0 (0.0%) | 18 (75.0%) |
| 18 to 34 Years | 0 (0.0%) | 0 (0.0%) |
| 35 to 64 Years | 117 (35.2%) | 33 (12.9%) |
| 65 to 74 Years | 62 (34.8%) | 65 (24.7%) |
| 75 Years and over | 187 (62.7%) | 121 (45.3%) |
Disability Class by Sex by Age in Charlotte Park
Disability Class: Hearing Difficulty
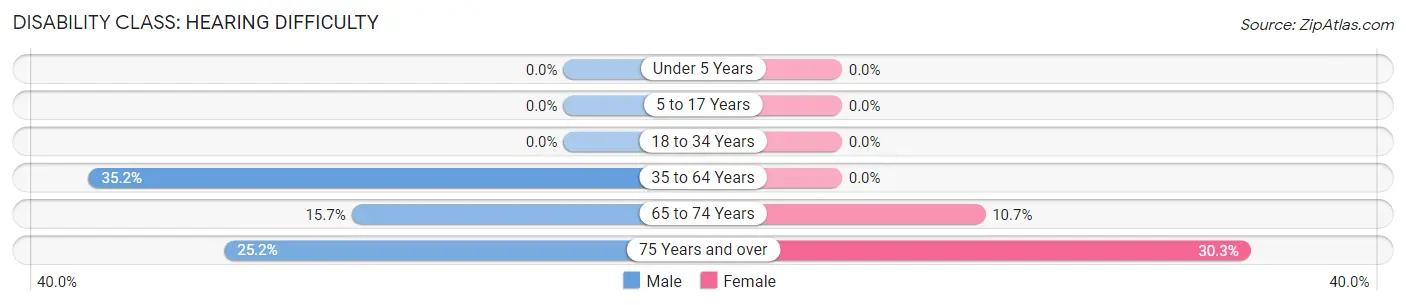
| Age Bracket | Male | Female |
| Under 5 Years | 0 (0.0%) | 0 (0.0%) |
| 5 to 17 Years | 0 (0.0%) | 0 (0.0%) |
| 18 to 34 Years | 0 (0.0%) | 0 (0.0%) |
| 35 to 64 Years | 117 (35.2%) | 0 (0.0%) |
| 65 to 74 Years | 28 (15.7%) | 28 (10.6%) |
| 75 Years and over | 75 (25.2%) | 81 (30.3%) |
Disability Class: Vision Difficulty
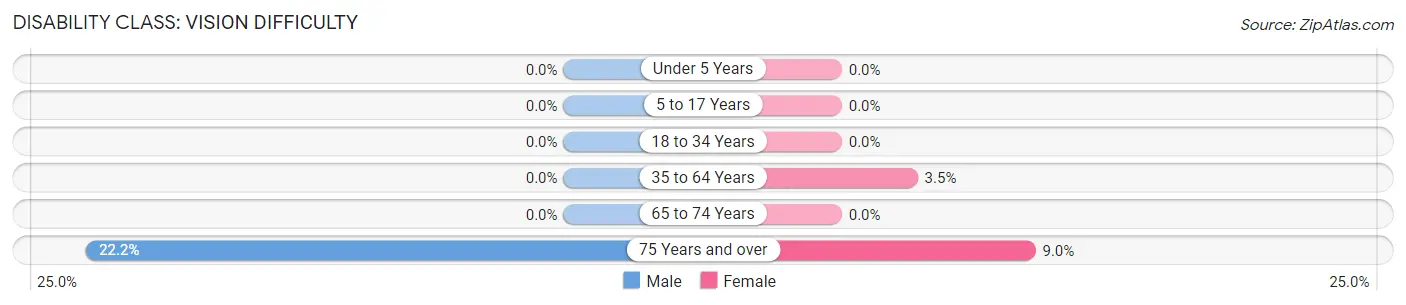
| Age Bracket | Male | Female |
| Under 5 Years | 0 (0.0%) | 0 (0.0%) |
| 5 to 17 Years | 0 (0.0%) | 0 (0.0%) |
| 18 to 34 Years | 0 (0.0%) | 0 (0.0%) |
| 35 to 64 Years | 0 (0.0%) | 9 (3.5%) |
| 65 to 74 Years | 0 (0.0%) | 0 (0.0%) |
| 75 Years and over | 66 (22.2%) | 24 (9.0%) |
Disability Class: Cognitive Difficulty
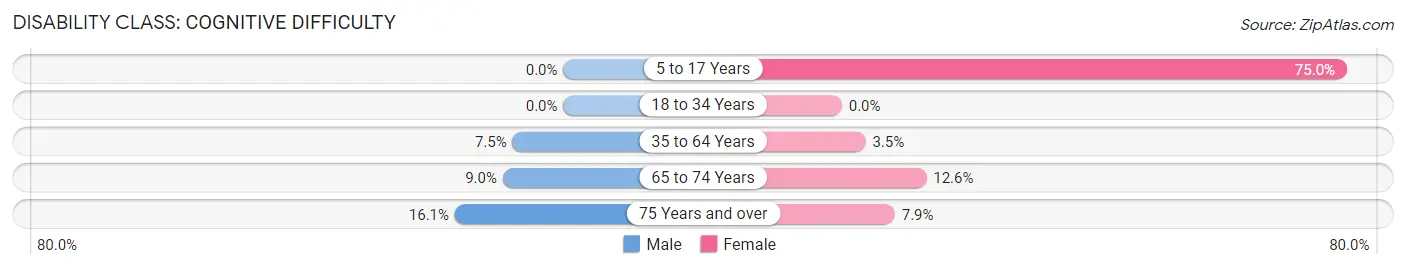
| Age Bracket | Male | Female |
| 5 to 17 Years | 0 (0.0%) | 18 (75.0%) |
| 18 to 34 Years | 0 (0.0%) | 0 (0.0%) |
| 35 to 64 Years | 25 (7.5%) | 9 (3.5%) |
| 65 to 74 Years | 16 (9.0%) | 33 (12.6%) |
| 75 Years and over | 48 (16.1%) | 21 (7.9%) |
Disability Class: Ambulatory Difficulty
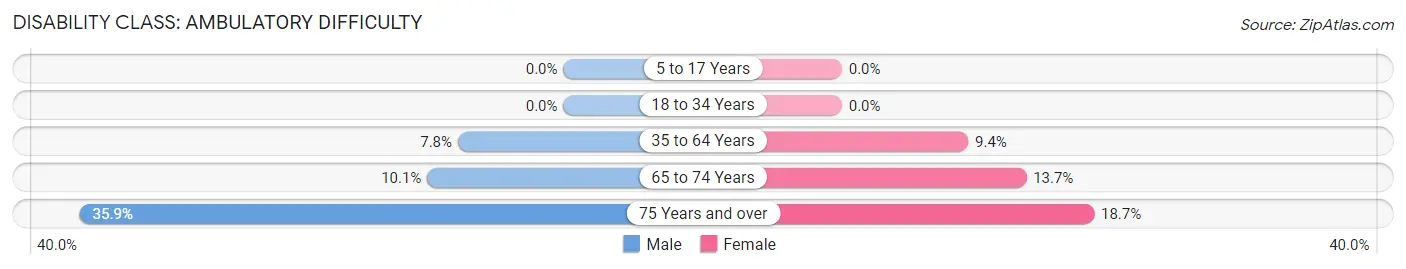
| Age Bracket | Male | Female |
| 5 to 17 Years | 0 (0.0%) | 0 (0.0%) |
| 18 to 34 Years | 0 (0.0%) | 0 (0.0%) |
| 35 to 64 Years | 26 (7.8%) | 24 (9.4%) |
| 65 to 74 Years | 18 (10.1%) | 36 (13.7%) |
| 75 Years and over | 107 (35.9%) | 50 (18.7%) |
Disability Class: Self-Care Difficulty
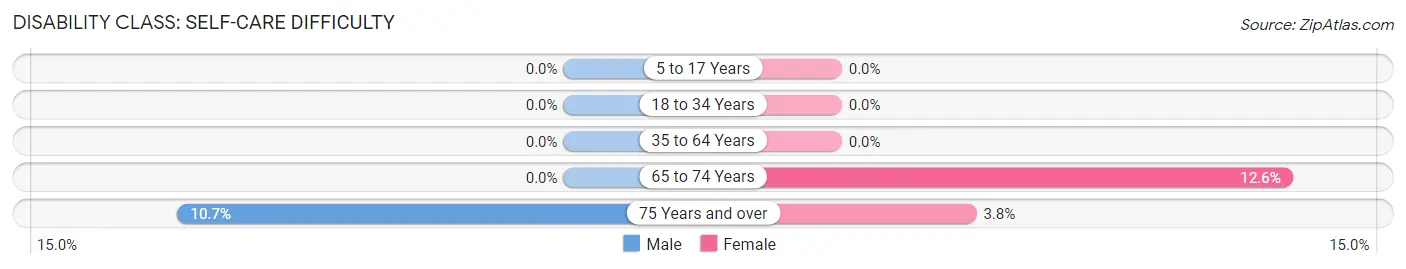
| Age Bracket | Male | Female |
| 5 to 17 Years | 0 (0.0%) | 0 (0.0%) |
| 18 to 34 Years | 0 (0.0%) | 0 (0.0%) |
| 35 to 64 Years | 0 (0.0%) | 0 (0.0%) |
| 65 to 74 Years | 0 (0.0%) | 33 (12.6%) |
| 75 Years and over | 32 (10.7%) | 10 (3.7%) |
Technology Access in Charlotte Park
Computing Device Access in Charlotte Park
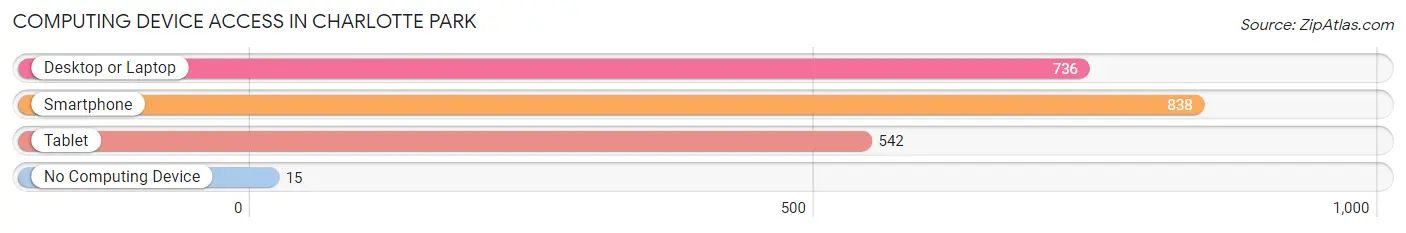
| Device Type | # Households | % Households |
| Desktop or Laptop | 736 | 77.4% |
| Smartphone | 838 | 88.1% |
| Tablet | 542 | 57.0% |
| No Computing Device | 15 | 1.6% |
| Total | 951 | 100.0% |
Internet Access in Charlotte Park
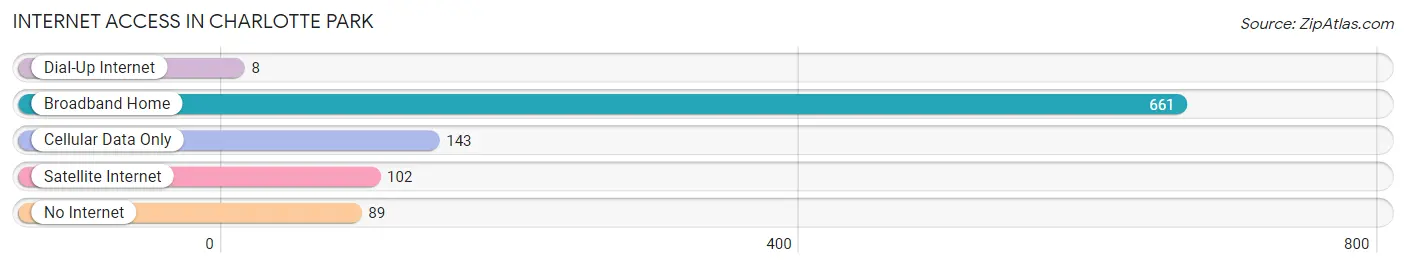
| Internet Type | # Households | % Households |
| Dial-Up Internet | 8 | 0.8% |
| Broadband Home | 661 | 69.5% |
| Cellular Data Only | 143 | 15.0% |
| Satellite Internet | 102 | 10.7% |
| No Internet | 89 | 9.4% |
| Total | 951 | 100.0% |
Charlotte Park Summary
Charlotte Park is a census-designated place (CDP) located in Charlotte County, Florida, United States. The population was 2,845 at the 2010 census. It is part of the Punta Gorda Metropolitan Statistical Area.
History
The area that is now Charlotte Park was originally inhabited by the Calusa Indians. The first European settlers arrived in the area in the late 19th century. The area was originally known as "Charlotte Harbor" and was a popular fishing spot. In the early 20th century, the area was developed as a residential community. The first post office was established in the area in 1921.
Geography
Charlotte Park is located at 26°59'N 82°00'W (26.983, -82.000). According to the United States Census Bureau, the CDP has a total area of 4.2 square miles (10.8 km2), of which 4.1 square miles (10.6 km2) is land and 0.1 square mile (0.2 km2) (2.37%) is water.
Economy
The economy of Charlotte Park is largely based on tourism and agriculture. The area is home to several resorts and hotels, as well as a number of restaurants and other businesses catering to tourists. Agriculture is also an important part of the local economy, with citrus and other fruits being grown in the area.
Demographics
As of the census of 2000, there were 2,845 people, 1,093 households, and 790 families residing in the CDP. The population density was 690.3 people per square mile (266.7/km2). There were 1,179 housing units at an average density of 285.2/sq mi (110.2/km2). The racial makeup of the CDP was 97.45% White, 0.53% African American, 0.21% Native American, 0.53% Asian, 0.04% Pacific Islander, 0.53% from other races, and 0.71% from two or more races. Hispanic or Latino of any race were 2.45% of the population.
There were 1,093 households, out of which 28.2% had children under the age of 18 living with them, 58.2% were married couples living together, 9.2% had a female householder with no husband present, and 28.7% were non-families. 22.7% of all households were made up of individuals, and 11.2% had someone living alone who was 65 years of age or older. The average household size was 2.60 and the average family size was 3.03.
In the CDP, the population was spread out, with 22.7% under the age of 18, 6.2% from 18 to 24, 25.2% from 25 to 44, 24.7% from 45 to 64, and 21.2% who were 65 years of age or older. The median age was 42 years. For every 100 females, there were 97.2 males. For every 100 females age 18 and over, there were 94.2 males.
The median income for a household in the CDP was $37,917, and the median income for a family was $41,964. Males had a median income of $30,000 versus $21,250 for females. The per capita income for the CDP was $17,945. About 6.2% of families and 8.2% of the population were below the poverty line, including 10.2% of those under age 18 and 6.2% of those age 65 or over.
Common Questions
What is Per Capita Income in Charlotte Park?
Per Capita income in Charlotte Park is $43,946.
What is the Median Family Income in Charlotte Park?
Median Family Income in Charlotte Park is $74,417.
What is the Median Household income in Charlotte Park?
Median Household Income in Charlotte Park is $64,893.
What is Income or Wage Gap in Charlotte Park?
Income or Wage Gap in Charlotte Park is 20.5%.
Women in Charlotte Park earn 79.5 cents for every dollar earned by a man.
What is Family Income Deficit in Charlotte Park?
Family Income Deficit in Charlotte Park is $18,283.
Families that are below poverty line in Charlotte Park earn $18,283 less on average than the poverty threshold level.
What is Inequality or Gini Index in Charlotte Park?
Inequality or Gini Index in Charlotte Park is 0.38.
What is the Total Population of Charlotte Park?
Total Population of Charlotte Park is 1,795.
What is the Total Male Population of Charlotte Park?
Total Male Population of Charlotte Park is 879.
What is the Total Female Population of Charlotte Park?
Total Female Population of Charlotte Park is 916.
What is the Ratio of Males per 100 Females in Charlotte Park?
There are 95.96 Males per 100 Females in Charlotte Park.
What is the Ratio of Females per 100 Males in Charlotte Park?
There are 104.21 Females per 100 Males in Charlotte Park.
What is the Median Population Age in Charlotte Park?
Median Population Age in Charlotte Park is 68.8 Years.
What is the Average Family Size in Charlotte Park
Average Family Size in Charlotte Park is 2.3 People.
What is the Average Household Size in Charlotte Park
Average Household Size in Charlotte Park is 1.9 People.
How Large is the Labor Force in Charlotte Park?
There are 677 People in the Labor Forcein in Charlotte Park.
What is the Percentage of People in the Labor Force in Charlotte Park?
38.9% of People are in the Labor Force in Charlotte Park.
What is the Unemployment Rate in Charlotte Park?
Unemployment Rate in Charlotte Park is 3.8%.