Carrabelle, FL Map & Demographics
Carrabelle Map
Carrabelle Overview
$13,858
PER CAPITA INCOME
$46,989
AVG FAMILY INCOME
$41,563
AVG HOUSEHOLD INCOME
11.5%
WAGE / INCOME GAP [ % ]
88.5¢/ $1
WAGE / INCOME GAP [ $ ]
0.49
INEQUALITY / GINI INDEX
3,151
TOTAL POPULATION
2,217
MALE POPULATION
934
FEMALE POPULATION
237.37
MALES / 100 FEMALES
42.13
FEMALES / 100 MALES
36.1
MEDIAN AGE
3.2
AVG FAMILY SIZE
2.5
AVG HOUSEHOLD SIZE
642
LABOR FORCE [ PEOPLE ]
23.6%
PERCENT IN LABOR FORCE
9.7%
UNEMPLOYMENT RATE
Carrabelle Zip Codes
Carrabelle Area Codes
Income in Carrabelle
Income Overview in Carrabelle
Per Capita Income in Carrabelle is $13,858, while median incomes of families and households are $46,989 and $41,563 respectively.
| Characteristic | Number | Measure |
| Per Capita Income | 3,151 | $13,858 |
| Median Family Income | 427 | $46,989 |
| Mean Family Income | 427 | $71,357 |
| Median Household Income | 699 | $41,563 |
| Mean Household Income | 699 | $59,030 |
| Income Deficit | 427 | $0 |
| Wage / Income Gap (%) | 3,151 | 11.54% |
| Wage / Income Gap ($) | 3,151 | 88.46¢ per $1 |
| Gini / Inequality Index | 3,151 | 0.49 |
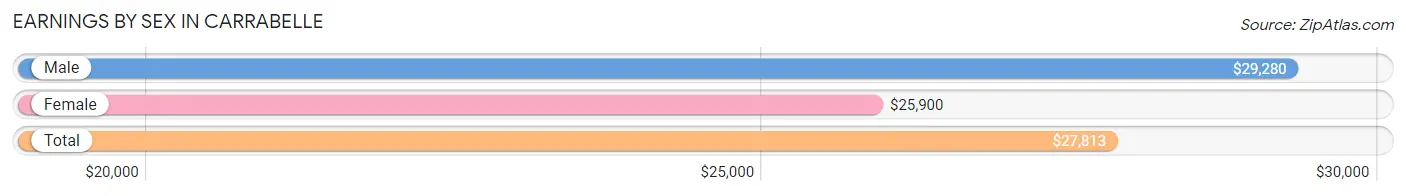
Earnings by Sex in Carrabelle
Average Earnings in Carrabelle are $27,813, $29,280 for men and $25,900 for women, a difference of 11.5%.
| Sex | Number | Average Earnings |
| Male | 367 (50.3%) | $29,280 |
| Female | 362 (49.7%) | $25,900 |
| Total | 729 (100.0%) | $27,813 |
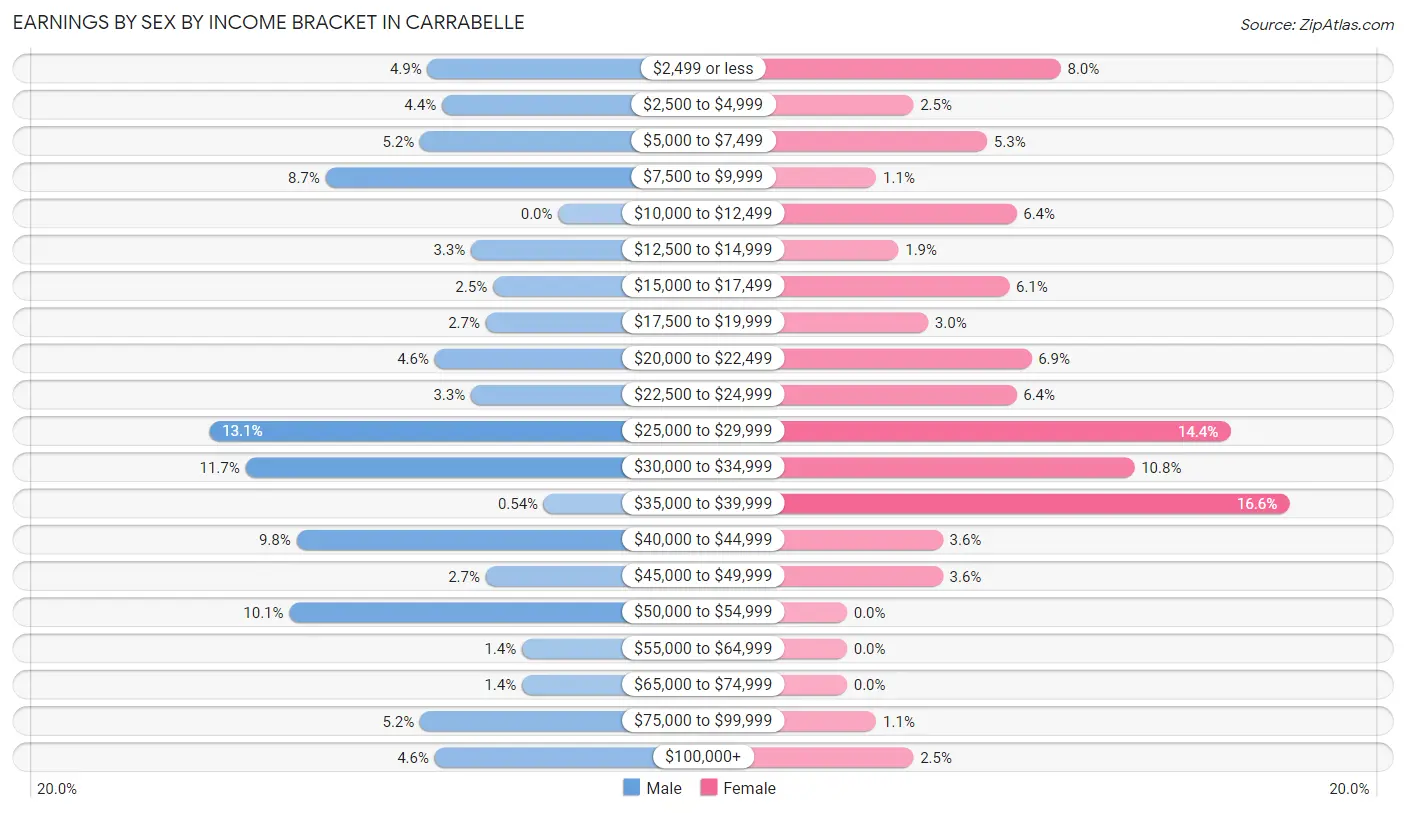
Earnings by Sex by Income Bracket in Carrabelle
The most common earnings brackets in Carrabelle are $25,000 to $29,999 for men (48 | 13.1%) and $35,000 to $39,999 for women (60 | 16.6%).
| Income | Male | Female |
| $2,499 or less | 18 (4.9%) | 29 (8.0%) |
| $2,500 to $4,999 | 16 (4.4%) | 9 (2.5%) |
| $5,000 to $7,499 | 19 (5.2%) | 19 (5.2%) |
| $7,500 to $9,999 | 32 (8.7%) | 4 (1.1%) |
| $10,000 to $12,499 | 0 (0.0%) | 23 (6.4%) |
| $12,500 to $14,999 | 12 (3.3%) | 7 (1.9%) |
| $15,000 to $17,499 | 9 (2.5%) | 22 (6.1%) |
| $17,500 to $19,999 | 10 (2.7%) | 11 (3.0%) |
| $20,000 to $22,499 | 17 (4.6%) | 25 (6.9%) |
| $22,500 to $24,999 | 12 (3.3%) | 23 (6.4%) |
| $25,000 to $29,999 | 48 (13.1%) | 52 (14.4%) |
| $30,000 to $34,999 | 43 (11.7%) | 39 (10.8%) |
| $35,000 to $39,999 | 2 (0.5%) | 60 (16.6%) |
| $40,000 to $44,999 | 36 (9.8%) | 13 (3.6%) |
| $45,000 to $49,999 | 10 (2.7%) | 13 (3.6%) |
| $50,000 to $54,999 | 37 (10.1%) | 0 (0.0%) |
| $55,000 to $64,999 | 5 (1.4%) | 0 (0.0%) |
| $65,000 to $74,999 | 5 (1.4%) | 0 (0.0%) |
| $75,000 to $99,999 | 19 (5.2%) | 4 (1.1%) |
| $100,000+ | 17 (4.6%) | 9 (2.5%) |
| Total | 367 (100.0%) | 362 (100.0%) |
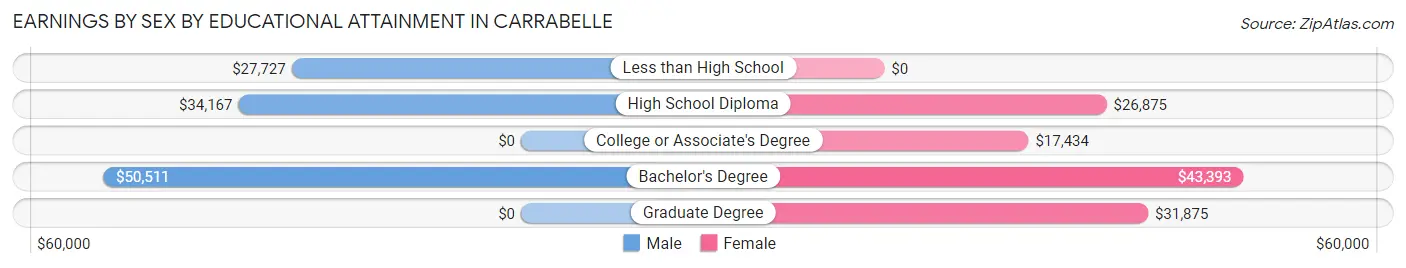
Earnings by Sex by Educational Attainment in Carrabelle
Average earnings in Carrabelle are $29,697 for men and $21,550 for women, a difference of 27.4%. Men with an educational attainment of bachelor's degree enjoy the highest average annual earnings of $50,511, while those with less than high school education earn the least with $27,727. Women with an educational attainment of bachelor's degree earn the most with the average annual earnings of $43,393, while those with college or associate's degree education have the smallest earnings of $17,434.
| Educational Attainment | Male Income | Female Income |
| Less than High School | $27,727 | $0 |
| High School Diploma | $34,167 | $26,875 |
| College or Associate's Degree | - | - |
| Bachelor's Degree | $50,511 | $43,393 |
| Graduate Degree | - | - |
| Total | $29,697 | $21,550 |
Family Income in Carrabelle
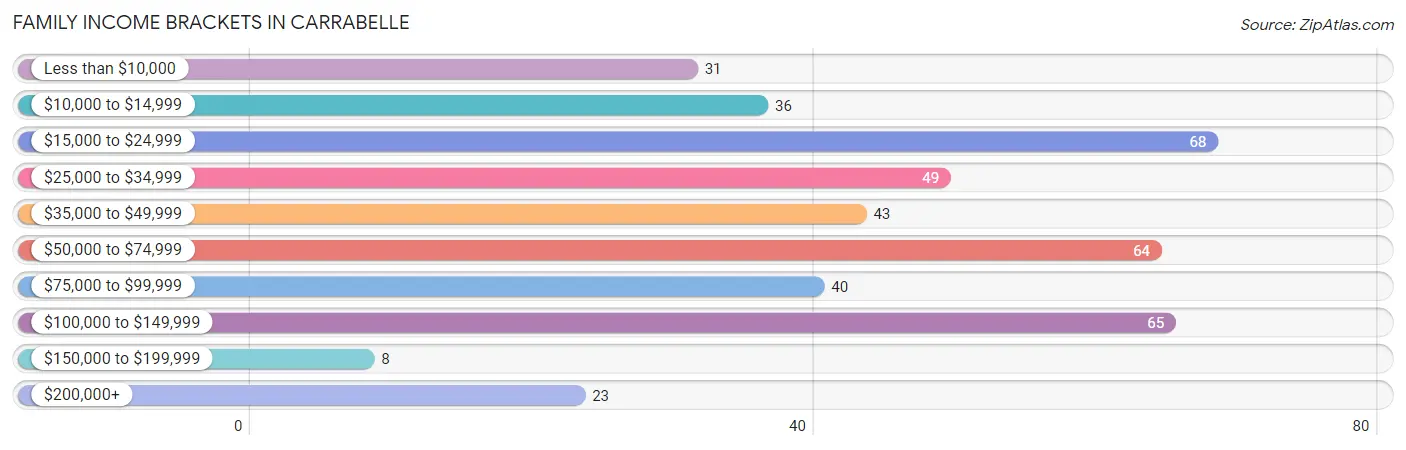
Family Income Brackets in Carrabelle
According to the Carrabelle family income data, there are 68 families falling into the $15,000 to $24,999 income range, which is the most common income bracket and makes up 15.9% of all families. Conversely, the $150,000 to $199,999 income bracket is the least frequent group with only 8 families (1.9%) belonging to this category.
| Income Bracket | # Families | % Families |
| Less than $10,000 | 31 | 7.3% |
| $10,000 to $14,999 | 36 | 8.4% |
| $15,000 to $24,999 | 68 | 15.9% |
| $25,000 to $34,999 | 49 | 11.5% |
| $35,000 to $49,999 | 43 | 10.1% |
| $50,000 to $74,999 | 64 | 15.0% |
| $75,000 to $99,999 | 40 | 9.4% |
| $100,000 to $149,999 | 65 | 15.2% |
| $150,000 to $199,999 | 8 | 1.9% |
| $200,000+ | 23 | 5.4% |
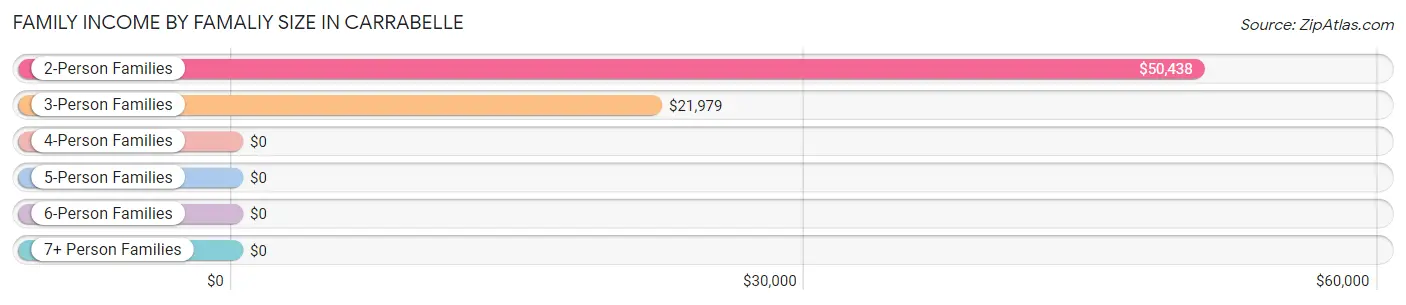
Family Income by Famaliy Size in Carrabelle
2-person families (251 | 58.8%) account for the highest median family income in Carrabelle with $50,438 per family, while 2-person families (251 | 58.8%) have the highest median income of $25,219 per family member.
| Income Bracket | # Families | Median Income |
| 2-Person Families | 251 (58.8%) | $50,438 |
| 3-Person Families | 55 (12.9%) | $21,979 |
| 4-Person Families | 92 (21.5%) | $0 |
| 5-Person Families | 29 (6.8%) | $0 |
| 6-Person Families | 0 (0.0%) | $0 |
| 7+ Person Families | 0 (0.0%) | $0 |
| Total | 427 (100.0%) | $46,989 |
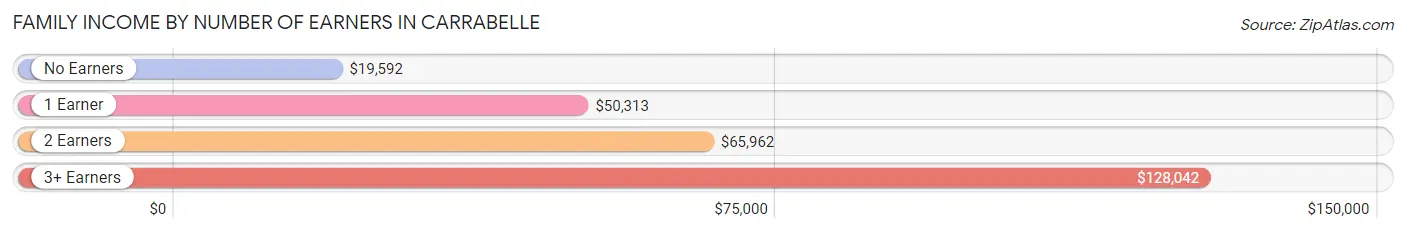
Family Income by Number of Earners in Carrabelle
The median family income in Carrabelle is $46,989, with families comprising 3+ earners (47) having the highest median family income of $128,042, while families with no earners (179) have the lowest median family income of $19,592, accounting for 11.0% and 41.9% of families, respectively.
| Number of Earners | # Families | Median Income |
| No Earners | 179 (41.9%) | $19,592 |
| 1 Earner | 131 (30.7%) | $50,313 |
| 2 Earners | 70 (16.4%) | $65,962 |
| 3+ Earners | 47 (11.0%) | $128,042 |
| Total | 427 (100.0%) | $46,989 |
Household Income in Carrabelle
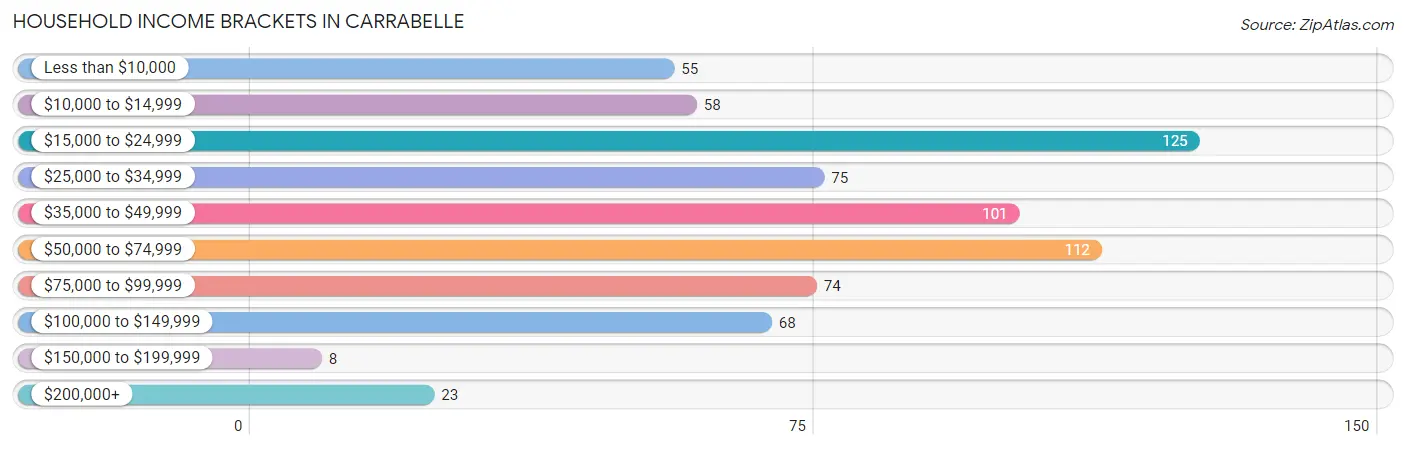
Household Income Brackets in Carrabelle
With 125 households falling in the category, the $15,000 to $24,999 income range is the most frequent in Carrabelle, accounting for 17.9% of all households. In contrast, only 8 households (1.1%) fall into the $150,000 to $199,999 income bracket, making it the least populous group.
| Income Bracket | # Households | % Households |
| Less than $10,000 | 55 | 7.9% |
| $10,000 to $14,999 | 58 | 8.3% |
| $15,000 to $24,999 | 125 | 17.9% |
| $25,000 to $34,999 | 75 | 10.7% |
| $35,000 to $49,999 | 101 | 14.4% |
| $50,000 to $74,999 | 112 | 16.0% |
| $75,000 to $99,999 | 74 | 10.6% |
| $100,000 to $149,999 | 68 | 9.7% |
| $150,000 to $199,999 | 8 | 1.1% |
| $200,000+ | 23 | 3.3% |
Household Income by Householder Age in Carrabelle
The median household income in Carrabelle is $41,563, with the highest median household income of $54,583 found in the 25 to 44 years age bracket for the primary householder. A total of 93 households (13.3%) fall into this category. Meanwhile, the 15 to 24 years age bracket for the primary householder has the lowest median household income of $0, with 16 households (2.3%) in this group.
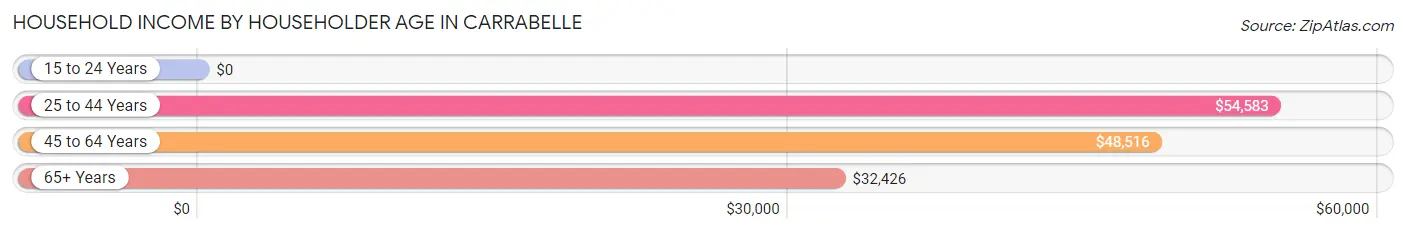
| Income Bracket | # Households | Median Income |
| 15 to 24 Years | 16 (2.3%) | $0 |
| 25 to 44 Years | 93 (13.3%) | $54,583 |
| 45 to 64 Years | 265 (37.9%) | $48,516 |
| 65+ Years | 325 (46.5%) | $32,426 |
| Total | 699 (100.0%) | $41,563 |
Poverty in Carrabelle
Income Below Poverty by Sex and Age in Carrabelle
With 31.1% poverty level for males and 29.9% for females among the residents of Carrabelle, 12 to 14 year old males and under 5 year old females are the most vulnerable to poverty, with 47 males (97.9%) and 71 females (94.7%) in their respective age groups living below the poverty level.
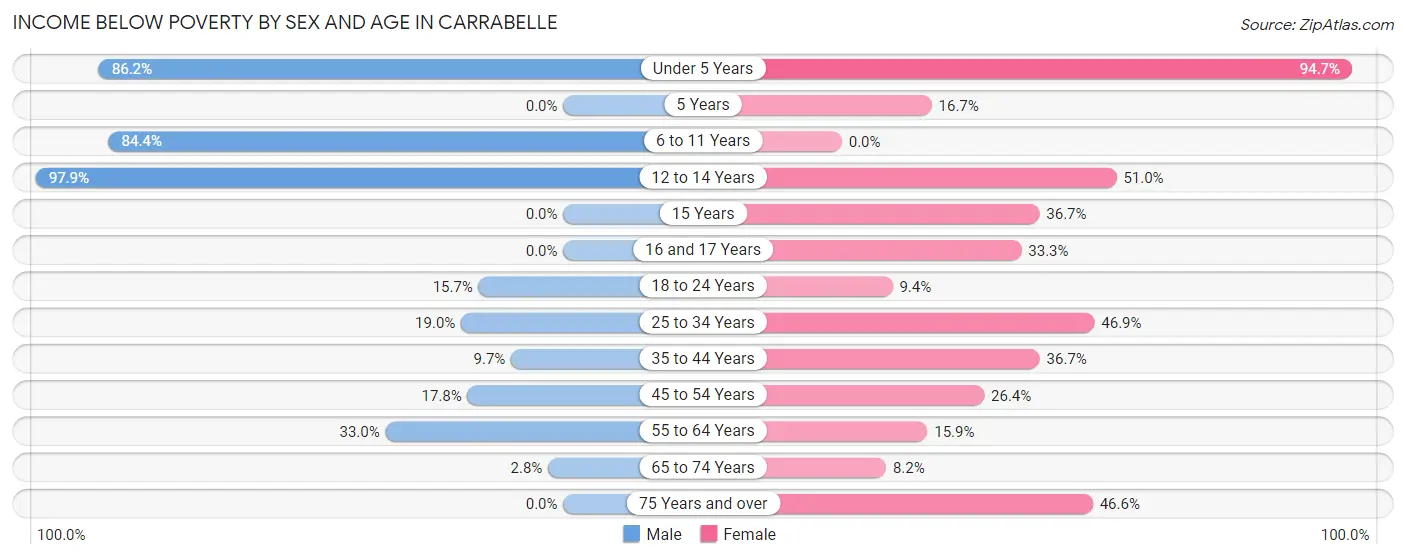
| Age Bracket | Male | Female |
| Under 5 Years | 25 (86.2%) | 71 (94.7%) |
| 5 Years | 0 (0.0%) | 1 (16.7%) |
| 6 to 11 Years | 92 (84.4%) | 0 (0.0%) |
| 12 to 14 Years | 47 (97.9%) | 52 (51.0%) |
| 15 Years | 0 (0.0%) | 11 (36.7%) |
| 16 and 17 Years | 0 (0.0%) | 3 (33.3%) |
| 18 to 24 Years | 11 (15.7%) | 11 (9.4%) |
| 25 to 34 Years | 22 (19.0%) | 15 (46.9%) |
| 35 to 44 Years | 3 (9.7%) | 18 (36.7%) |
| 45 to 54 Years | 8 (17.8%) | 28 (26.4%) |
| 55 to 64 Years | 34 (33.0%) | 20 (15.9%) |
| 65 to 74 Years | 5 (2.8%) | 15 (8.2%) |
| 75 Years and over | 0 (0.0%) | 34 (46.6%) |
| Total | 247 (31.1%) | 279 (29.9%) |
Income Above Poverty by Sex and Age in Carrabelle
According to the poverty statistics in Carrabelle, males aged 5 years and females aged 6 to 11 years are the age groups that are most secure financially, with 100.0% of males and 100.0% of females in these age groups living above the poverty line.
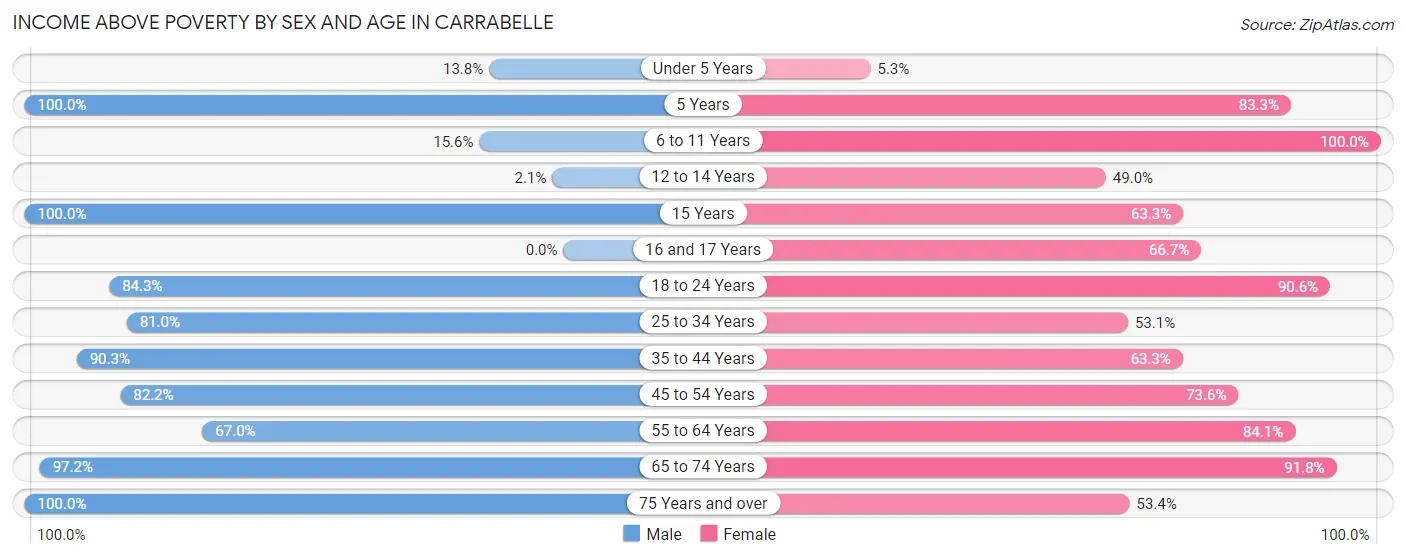
| Age Bracket | Male | Female |
| Under 5 Years | 4 (13.8%) | 4 (5.3%) |
| 5 Years | 1 (100.0%) | 5 (83.3%) |
| 6 to 11 Years | 17 (15.6%) | 26 (100.0%) |
| 12 to 14 Years | 1 (2.1%) | 50 (49.0%) |
| 15 Years | 5 (100.0%) | 19 (63.3%) |
| 16 and 17 Years | 0 (0.0%) | 6 (66.7%) |
| 18 to 24 Years | 59 (84.3%) | 106 (90.6%) |
| 25 to 34 Years | 94 (81.0%) | 17 (53.1%) |
| 35 to 44 Years | 28 (90.3%) | 31 (63.3%) |
| 45 to 54 Years | 37 (82.2%) | 78 (73.6%) |
| 55 to 64 Years | 69 (67.0%) | 106 (84.1%) |
| 65 to 74 Years | 173 (97.2%) | 168 (91.8%) |
| 75 Years and over | 58 (100.0%) | 39 (53.4%) |
| Total | 546 (68.9%) | 655 (70.1%) |
Income Below Poverty Among Married-Couple Families in Carrabelle
The poverty statistics for married-couple families in Carrabelle show that 6.9% or 17 of the total 245 families live below the poverty line. Families with 1 or 2 children have the highest poverty rate of 33.3%, comprising of 6 families. On the other hand, families with 3 or 4 children have the lowest poverty rate of 0.0%, which includes 0 families.
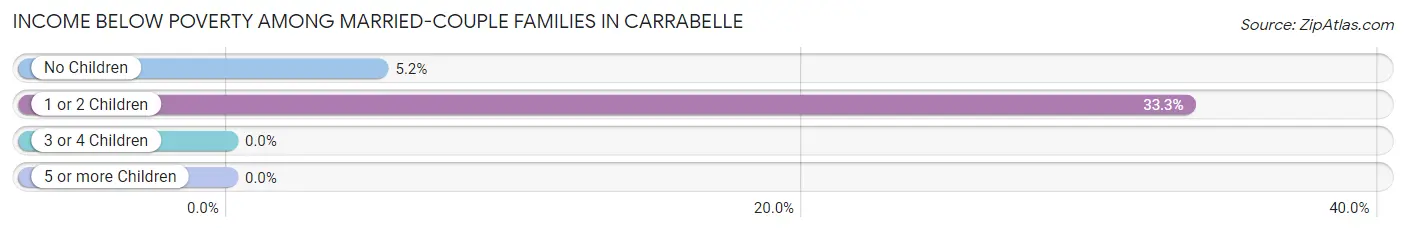
| Children | Above Poverty | Below Poverty |
| No Children | 199 (94.8%) | 11 (5.2%) |
| 1 or 2 Children | 12 (66.7%) | 6 (33.3%) |
| 3 or 4 Children | 17 (100.0%) | 0 (0.0%) |
| 5 or more Children | 0 (0.0%) | 0 (0.0%) |
| Total | 228 (93.1%) | 17 (6.9%) |
Income Below Poverty Among Single-Parent Households in Carrabelle
According to the poverty data in Carrabelle, 22.2% or 8 single-father households and 46.6% or 68 single-mother households are living below the poverty line. Among single-father households, those with 3 or 4 children have the highest poverty rate, with 8 households (100.0%) experiencing poverty. Likewise, among single-mother households, those with 3 or 4 children have the highest poverty rate, with 31 households (100.0%) falling below the poverty line.
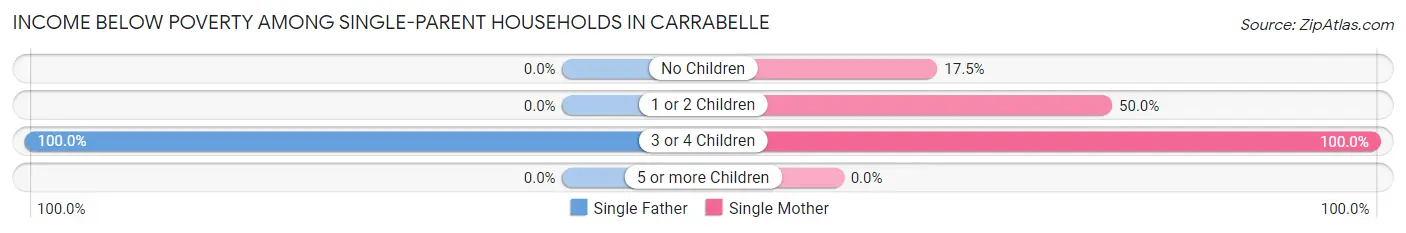
| Children | Single Father | Single Mother |
| No Children | 0 (0.0%) | 11 (17.5%) |
| 1 or 2 Children | 0 (0.0%) | 26 (50.0%) |
| 3 or 4 Children | 8 (100.0%) | 31 (100.0%) |
| 5 or more Children | 0 (0.0%) | 0 (0.0%) |
| Total | 8 (22.2%) | 68 (46.6%) |
Income Below Poverty Among Married-Couple vs Single-Parent Households in Carrabelle
The poverty data for Carrabelle shows that 17 of the married-couple family households (6.9%) and 76 of the single-parent households (41.8%) are living below the poverty level. Within the married-couple family households, those with 1 or 2 children have the highest poverty rate, with 6 households (33.3%) falling below the poverty line. Among the single-parent households, those with 3 or 4 children have the highest poverty rate, with 39 household (100.0%) living below poverty.
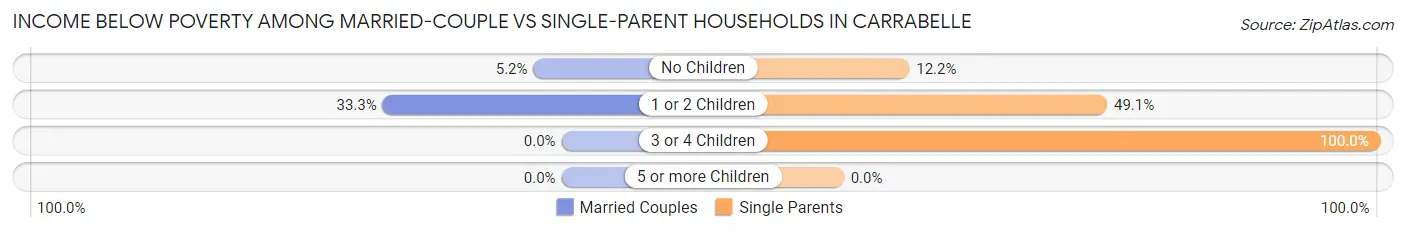
| Children | Married-Couple Families | Single-Parent Households |
| No Children | 11 (5.2%) | 11 (12.2%) |
| 1 or 2 Children | 6 (33.3%) | 26 (49.1%) |
| 3 or 4 Children | 0 (0.0%) | 39 (100.0%) |
| 5 or more Children | 0 (0.0%) | 0 (0.0%) |
| Total | 17 (6.9%) | 76 (41.8%) |
Race in Carrabelle
The most populous races in Carrabelle are White / Caucasian (1,731 | 54.9%), Black / African American (652 | 20.7%), and Two or more Races (453 | 14.4%).
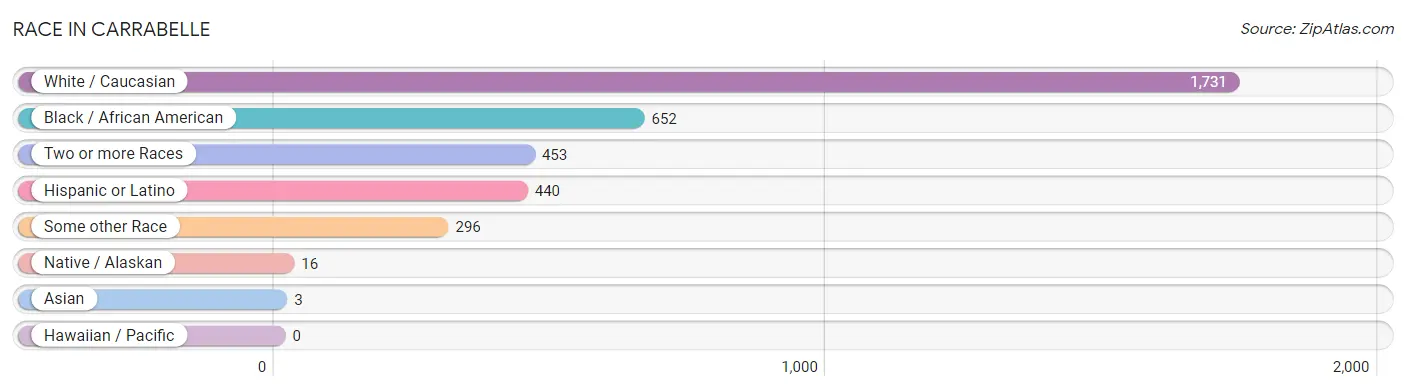
| Race | # Population | % Population |
| Asian | 3 | 0.1% |
| Black / African American | 652 | 20.7% |
| Hawaiian / Pacific | 0 | 0.0% |
| Hispanic or Latino | 440 | 14.0% |
| Native / Alaskan | 16 | 0.5% |
| White / Caucasian | 1,731 | 54.9% |
| Two or more Races | 453 | 14.4% |
| Some other Race | 296 | 9.4% |
| Total | 3,151 | 100.0% |
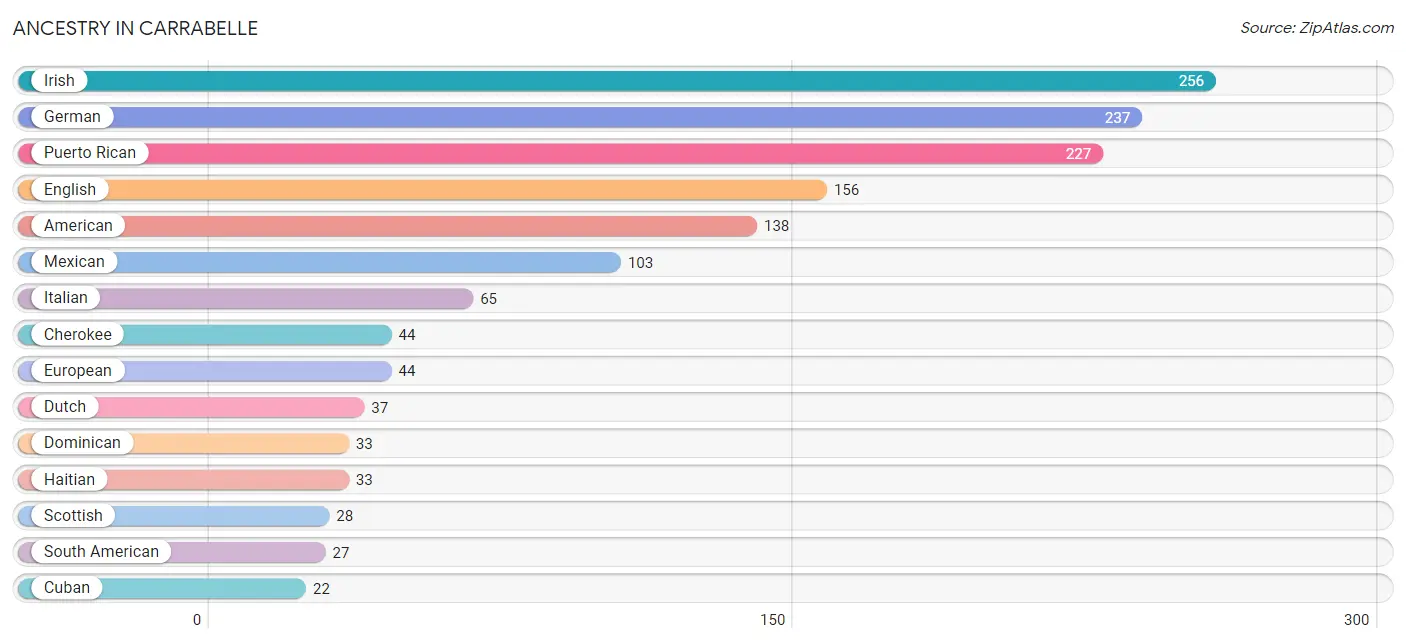
Ancestry in Carrabelle
The most populous ancestries reported in Carrabelle are Irish (256 | 8.1%), German (237 | 7.5%), Puerto Rican (227 | 7.2%), English (156 | 5.0%), and American (138 | 4.4%), together accounting for 32.2% of all Carrabelle residents.
| Ancestry | # Population | % Population |
| African | 11 | 0.4% |
| American | 138 | 4.4% |
| Australian | 10 | 0.3% |
| Austrian | 6 | 0.2% |
| Blackfeet | 17 | 0.5% |
| Cajun | 5 | 0.2% |
| Central American | 20 | 0.6% |
| Central American Indian | 1 | 0.0% |
| Cherokee | 44 | 1.4% |
| Chilean | 11 | 0.4% |
| Creek | 18 | 0.6% |
| Cuban | 22 | 0.7% |
| Czech | 3 | 0.1% |
| Danish | 7 | 0.2% |
| Dominican | 33 | 1.1% |
| Dutch | 37 | 1.2% |
| Eastern European | 4 | 0.1% |
| English | 156 | 5.0% |
| European | 44 | 1.4% |
| Finnish | 4 | 0.1% |
| French | 7 | 0.2% |
| French Canadian | 22 | 0.7% |
| German | 237 | 7.5% |
| Greek | 4 | 0.1% |
| Guatemalan | 5 | 0.2% |
| Haitian | 33 | 1.1% |
| Irish | 256 | 8.1% |
| Italian | 65 | 2.1% |
| Jamaican | 18 | 0.6% |
| Mexican | 103 | 3.3% |
| Nicaraguan | 3 | 0.1% |
| Norwegian | 3 | 0.1% |
| Polish | 18 | 0.6% |
| Puerto Rican | 227 | 7.2% |
| Salvadoran | 12 | 0.4% |
| Scandinavian | 3 | 0.1% |
| Scotch-Irish | 16 | 0.5% |
| Scottish | 28 | 0.9% |
| Sioux | 3 | 0.1% |
| South American | 27 | 0.9% |
| Spaniard | 5 | 0.2% |
| Spanish | 3 | 0.1% |
| Subsaharan African | 11 | 0.4% |
| Swiss | 2 | 0.1% |
| Trinidadian and Tobagonian | 8 | 0.3% |
| U.S. Virgin Islander | 3 | 0.1% |
| Venezuelan | 16 | 0.5% |
| Welsh | 9 | 0.3% |
| West Indian | 1 | 0.0% |
| Yaqui | 7 | 0.2% | View All 50 Rows |
Immigrants in Carrabelle
The most numerous immigrant groups reported in Carrabelle came from Latin America (195 | 6.2%), Central America (92 | 2.9%), Mexico (78 | 2.5%), Caribbean (75 | 2.4%), and Cuba (31 | 1.0%), together accounting for 14.9% of all Carrabelle residents.
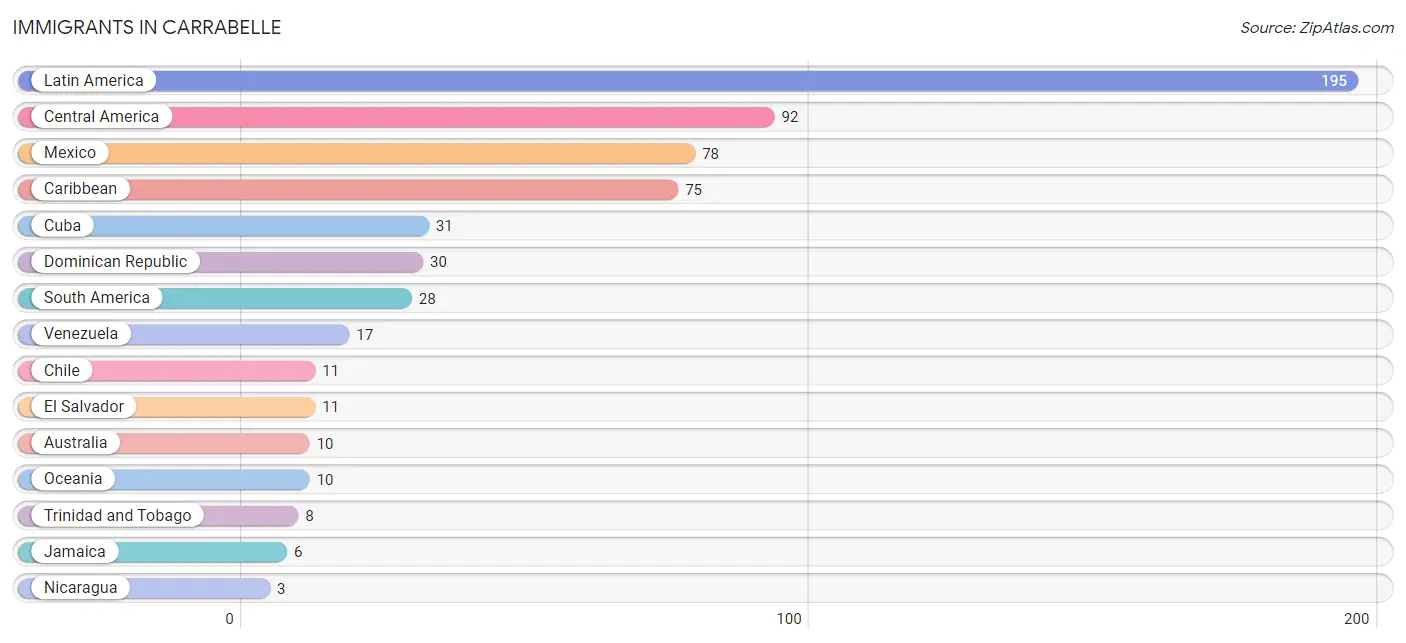
| Immigration Origin | # Population | % Population |
| Australia | 10 | 0.3% |
| Caribbean | 75 | 2.4% |
| Central America | 92 | 2.9% |
| Chile | 11 | 0.4% |
| Cuba | 31 | 1.0% |
| Dominican Republic | 30 | 0.9% |
| El Salvador | 11 | 0.4% |
| Jamaica | 6 | 0.2% |
| Latin America | 195 | 6.2% |
| Mexico | 78 | 2.5% |
| Nicaragua | 3 | 0.1% |
| Oceania | 10 | 0.3% |
| South America | 28 | 0.9% |
| Trinidad and Tobago | 8 | 0.3% |
| Venezuela | 17 | 0.5% | View All 15 Rows |
Sex and Age in Carrabelle
Sex and Age in Carrabelle
The most populous age groups in Carrabelle are 30 to 34 Years (470 | 21.2%) for men and 65 to 69 Years (116 | 12.4%) for women.
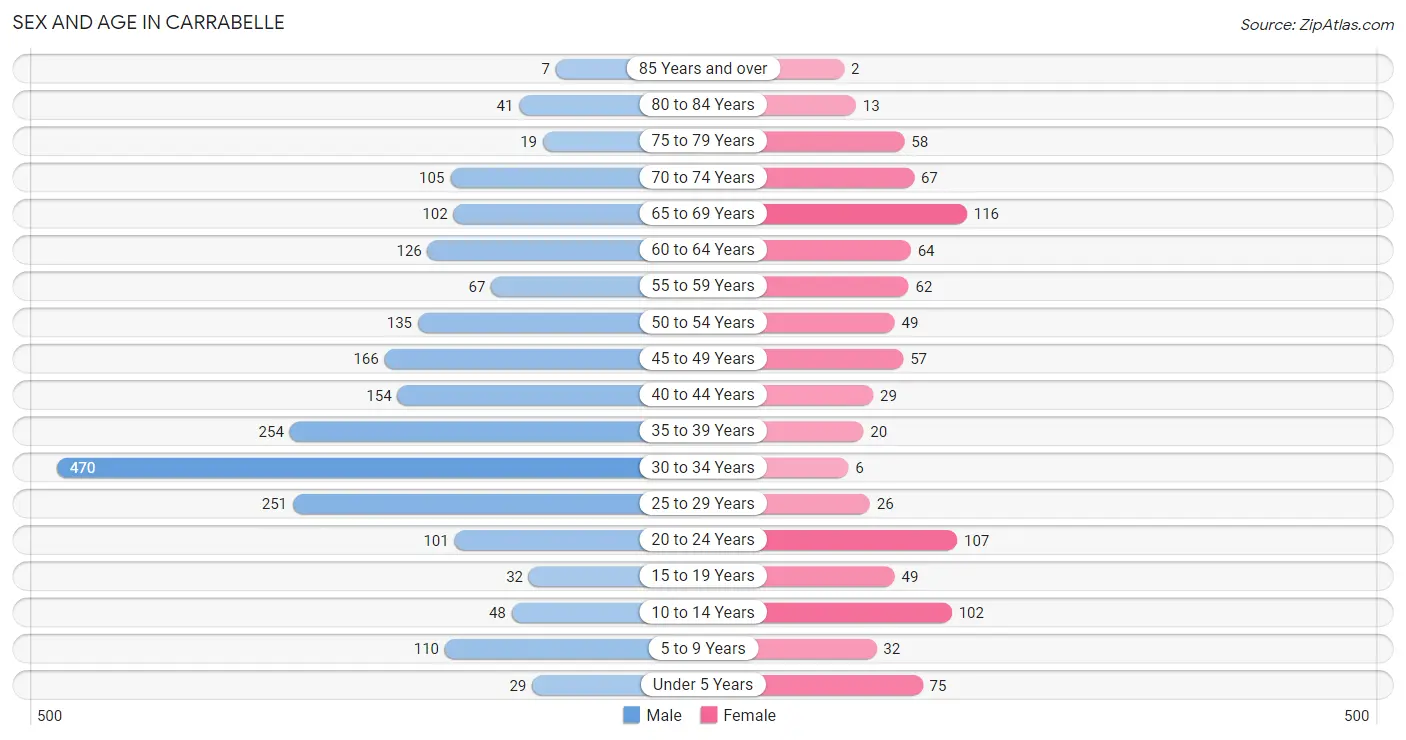
| Age Bracket | Male | Female |
| Under 5 Years | 29 (1.3%) | 75 (8.0%) |
| 5 to 9 Years | 110 (5.0%) | 32 (3.4%) |
| 10 to 14 Years | 48 (2.2%) | 102 (10.9%) |
| 15 to 19 Years | 32 (1.4%) | 49 (5.2%) |
| 20 to 24 Years | 101 (4.6%) | 107 (11.5%) |
| 25 to 29 Years | 251 (11.3%) | 26 (2.8%) |
| 30 to 34 Years | 470 (21.2%) | 6 (0.6%) |
| 35 to 39 Years | 254 (11.5%) | 20 (2.1%) |
| 40 to 44 Years | 154 (7.0%) | 29 (3.1%) |
| 45 to 49 Years | 166 (7.5%) | 57 (6.1%) |
| 50 to 54 Years | 135 (6.1%) | 49 (5.2%) |
| 55 to 59 Years | 67 (3.0%) | 62 (6.6%) |
| 60 to 64 Years | 126 (5.7%) | 64 (6.9%) |
| 65 to 69 Years | 102 (4.6%) | 116 (12.4%) |
| 70 to 74 Years | 105 (4.7%) | 67 (7.2%) |
| 75 to 79 Years | 19 (0.9%) | 58 (6.2%) |
| 80 to 84 Years | 41 (1.8%) | 13 (1.4%) |
| 85 Years and over | 7 (0.3%) | 2 (0.2%) |
| Total | 2,217 (100.0%) | 934 (100.0%) |
Families and Households in Carrabelle
Median Family Size in Carrabelle
The median family size in Carrabelle is 3.17 persons per family, with single female/mother families (146 | 34.2%) accounting for the largest median family size of 3.92 persons per family. On the other hand, married-couple families (245 | 57.4%) represent the smallest median family size with 2.66 persons per family.
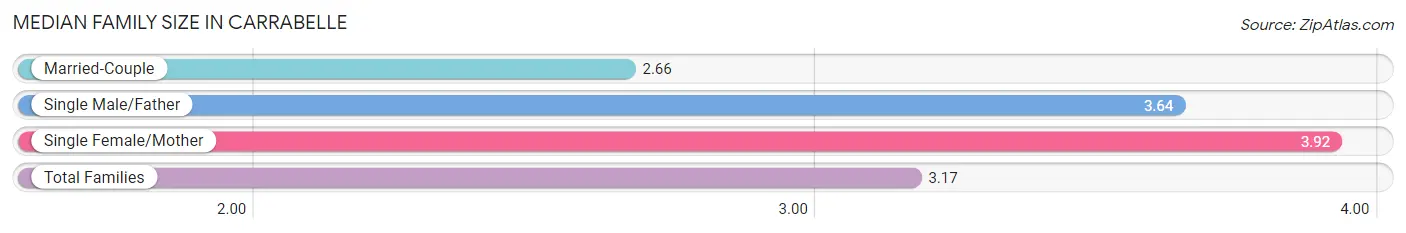
| Family Type | # Families | Family Size |
| Married-Couple | 245 (57.4%) | 2.66 |
| Single Male/Father | 36 (8.4%) | 3.64 |
| Single Female/Mother | 146 (34.2%) | 3.92 |
| Total Families | 427 (100.0%) | 3.17 |
Median Household Size in Carrabelle
The median household size in Carrabelle is 2.46 persons per household, with single female/mother households (146 | 20.9%) accounting for the largest median household size of 4.05 persons per household. non-family households (272 | 38.9%) represent the smallest median household size with 1.25 persons per household.
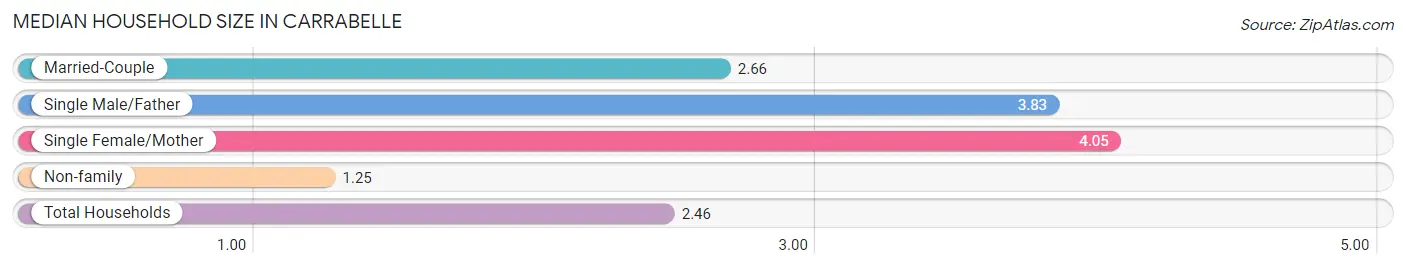
| Household Type | # Households | Household Size |
| Married-Couple | 245 (35.0%) | 2.66 |
| Single Male/Father | 36 (5.1%) | 3.83 |
| Single Female/Mother | 146 (20.9%) | 4.05 |
| Non-family | 272 (38.9%) | 1.25 |
| Total Households | 699 (100.0%) | 2.46 |
Household Size by Marriage Status in Carrabelle
Out of a total of 699 households in Carrabelle, 427 (61.1%) are family households, while 272 (38.9%) are nonfamily households. The most numerous type of family households are 2-person households, comprising 248, and the most common type of nonfamily households are 1-person households, comprising 215.
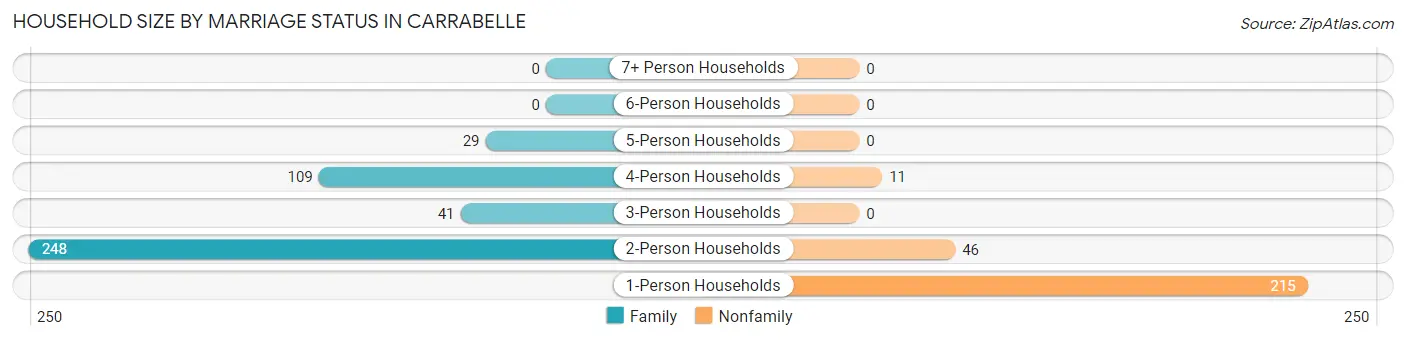
| Household Size | Family Households | Nonfamily Households |
| 1-Person Households | - | 215 (30.8%) |
| 2-Person Households | 248 (35.5%) | 46 (6.6%) |
| 3-Person Households | 41 (5.9%) | 0 (0.0%) |
| 4-Person Households | 109 (15.6%) | 11 (1.6%) |
| 5-Person Households | 29 (4.2%) | 0 (0.0%) |
| 6-Person Households | 0 (0.0%) | 0 (0.0%) |
| 7+ Person Households | 0 (0.0%) | 0 (0.0%) |
| Total | 427 (61.1%) | 272 (38.9%) |
Female Fertility in Carrabelle
Fertility by Age in Carrabelle
Average fertility rate in Carrabelle is 55.0 births per 1,000 women. Women in the age bracket of 20 to 34 years have the highest fertility rate with 101.0 births per 1,000 women. Women in the age bracket of 20 to 34 years acount for 82.4% of all women with births.
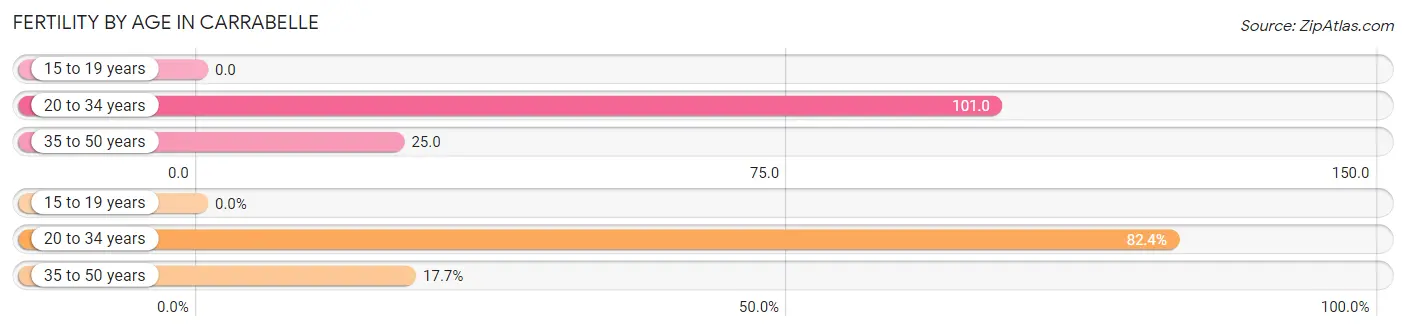
| Age Bracket | Women with Births | Births / 1,000 Women |
| 15 to 19 years | 0 (0.0%) | 0.0 |
| 20 to 34 years | 14 (82.4%) | 101.0 |
| 35 to 50 years | 3 (17.6%) | 25.0 |
| Total | 17 (100.0%) | 55.0 |
Fertility by Age by Marriage Status in Carrabelle
17.6% of women with births (17) in Carrabelle are married. The highest percentage of unmarried women with births falls into 20 to 34 years age bracket with 100.0% of them unmarried at the time of birth, while the lowest percentage of unmarried women with births belong to 35 to 50 years age bracket with 0.0% of them unmarried.
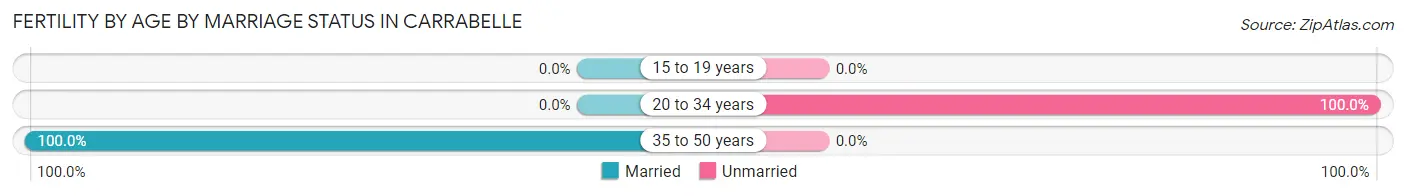
| Age Bracket | Married | Unmarried |
| 15 to 19 years | 0 (0.0%) | 0 (0.0%) |
| 20 to 34 years | 0 (0.0%) | 14 (100.0%) |
| 35 to 50 years | 3 (100.0%) | 0 (0.0%) |
| Total | 3 (17.6%) | 14 (82.4%) |
Fertility by Education in Carrabelle
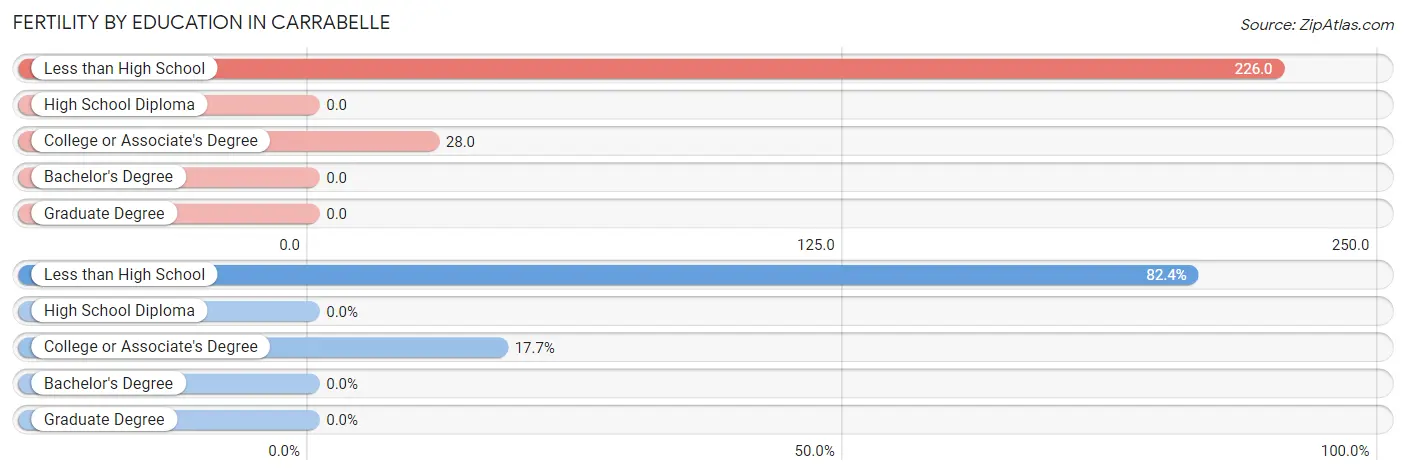
| Educational Attainment | Women with Births | Births / 1,000 Women |
| Less than High School | 14 (82.4%) | 226.0 |
| High School Diploma | 0 (0.0%) | 0.0 |
| College or Associate's Degree | 3 (17.6%) | 28.0 |
| Bachelor's Degree | 0 (0.0%) | 0.0 |
| Graduate Degree | 0 (0.0%) | 0.0 |
| Total | 17 (100.0%) | 55.0 |
Fertility by Education by Marriage Status in Carrabelle
82.4% of women with births in Carrabelle are unmarried. Women with the educational attainment of college or associate's degree are most likely to be married with 100.0% of them married at childbirth, while women with the educational attainment of less than high school are least likely to be married with 100.0% of them unmarried at childbirth.
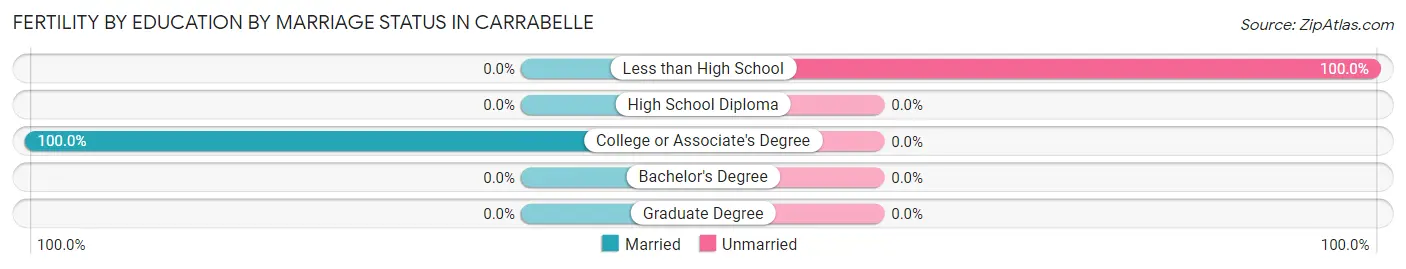
| Educational Attainment | Married | Unmarried |
| Less than High School | 0 (0.0%) | 14 (100.0%) |
| High School Diploma | 0 (0.0%) | 0 (0.0%) |
| College or Associate's Degree | 3 (100.0%) | 0 (0.0%) |
| Bachelor's Degree | 0 (0.0%) | 0 (0.0%) |
| Graduate Degree | 0 (0.0%) | 0 (0.0%) |
| Total | 3 (17.6%) | 14 (82.4%) |
Employment Characteristics in Carrabelle
Employment by Class of Employer in Carrabelle
Among the 532 employed individuals in Carrabelle, private company employees (302 | 56.8%), state government employees (69 | 13.0%), and self-employed (incorporated) (67 | 12.6%) make up the most common classes of employment.
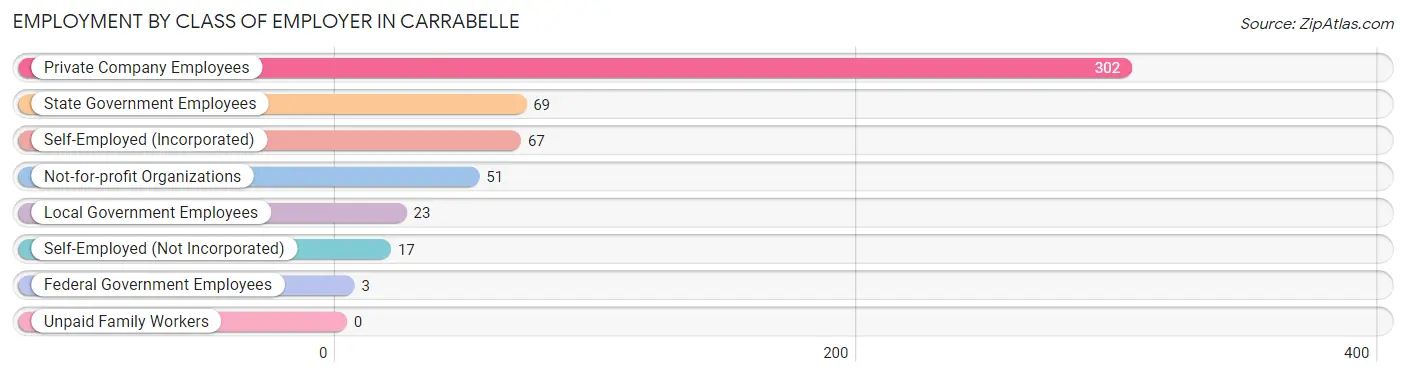
| Employer Class | # Employees | % Employees |
| Private Company Employees | 302 | 56.8% |
| Self-Employed (Incorporated) | 67 | 12.6% |
| Self-Employed (Not Incorporated) | 17 | 3.2% |
| Not-for-profit Organizations | 51 | 9.6% |
| Local Government Employees | 23 | 4.3% |
| State Government Employees | 69 | 13.0% |
| Federal Government Employees | 3 | 0.6% |
| Unpaid Family Workers | 0 | 0.0% |
| Total | 532 | 100.0% |
Employment Status by Age in Carrabelle
According to the labor force statistics for Carrabelle, out of the total population over 16 years of age (2,720), 23.6% or 642 individuals are in the labor force, with 9.7% or 62 of them unemployed. The age group with the highest labor force participation rate is 20 to 24 years, with 68.3% or 142 individuals in the labor force. Within the labor force, the 25 to 29 years age range has the highest percentage of unemployed individuals, with 31.3% or 30 of them being unemployed.
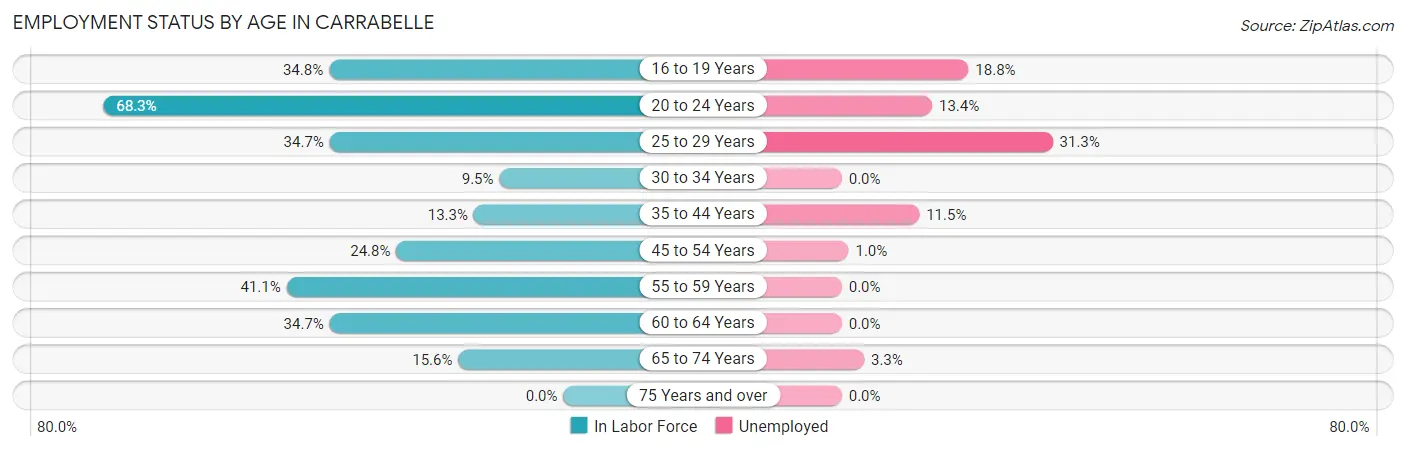
| Age Bracket | In Labor Force | Unemployed |
| 16 to 19 Years | 16 (34.8%) | 3 (18.8%) |
| 20 to 24 Years | 142 (68.3%) | 19 (13.4%) |
| 25 to 29 Years | 96 (34.7%) | 30 (31.3%) |
| 30 to 34 Years | 45 (9.5%) | 0 (0.0%) |
| 35 to 44 Years | 61 (13.3%) | 7 (11.5%) |
| 45 to 54 Years | 101 (24.8%) | 1 (1.0%) |
| 55 to 59 Years | 53 (41.1%) | 0 (0.0%) |
| 60 to 64 Years | 66 (34.7%) | 0 (0.0%) |
| 65 to 74 Years | 61 (15.6%) | 2 (3.3%) |
| 75 Years and over | 0 (0.0%) | 0 (0.0%) |
| Total | 642 (23.6%) | 62 (9.7%) |
Employment Status by Educational Attainment in Carrabelle
According to labor force statistics for Carrabelle, 21.8% of individuals (422) out of the total population between 25 and 64 years of age (1,936) are in the labor force, with 9.0% or 38 of them being unemployed. The group with the highest labor force participation rate are those with the educational attainment of bachelor's degree or higher, with 59.2% or 61 individuals in the labor force. Within the labor force, individuals with less than high school education have the highest percentage of unemployment, with 28.6% or 30 of them being unemployed.
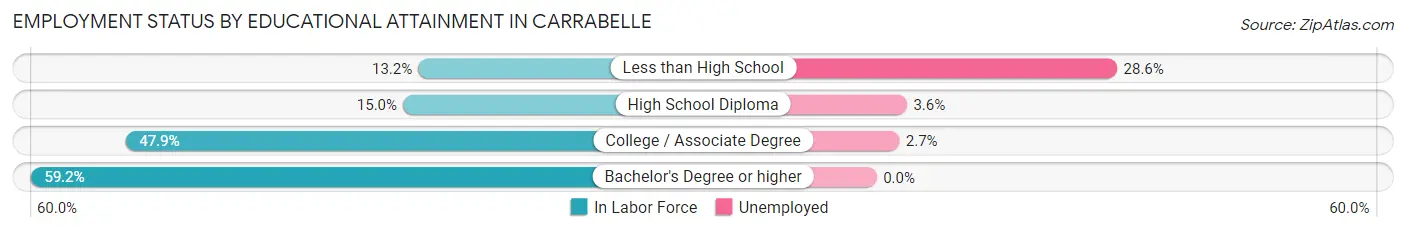
| Educational Attainment | In Labor Force | Unemployed |
| Less than High School | 105 (13.2%) | 227 (28.6%) |
| High School Diploma | 110 (15.0%) | 26 (3.6%) |
| College / Associate Degree | 146 (47.9%) | 8 (2.7%) |
| Bachelor's Degree or higher | 61 (59.2%) | 0 (0.0%) |
| Total | 422 (21.8%) | 174 (9.0%) |
Employment Occupations by Sex in Carrabelle
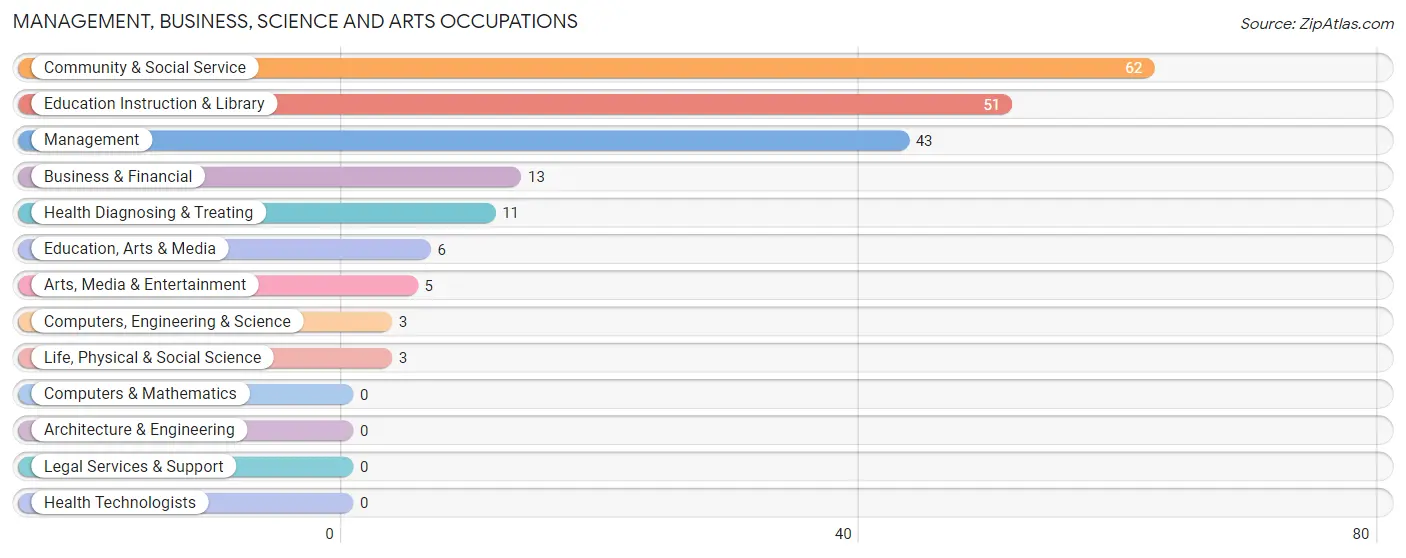
Management, Business, Science and Arts Occupations
The most common Management, Business, Science and Arts occupations in Carrabelle are Community & Social Service (62 | 10.7%), Education Instruction & Library (51 | 8.8%), Management (43 | 7.4%), Business & Financial (13 | 2.2%), and Health Diagnosing & Treating (11 | 1.9%).
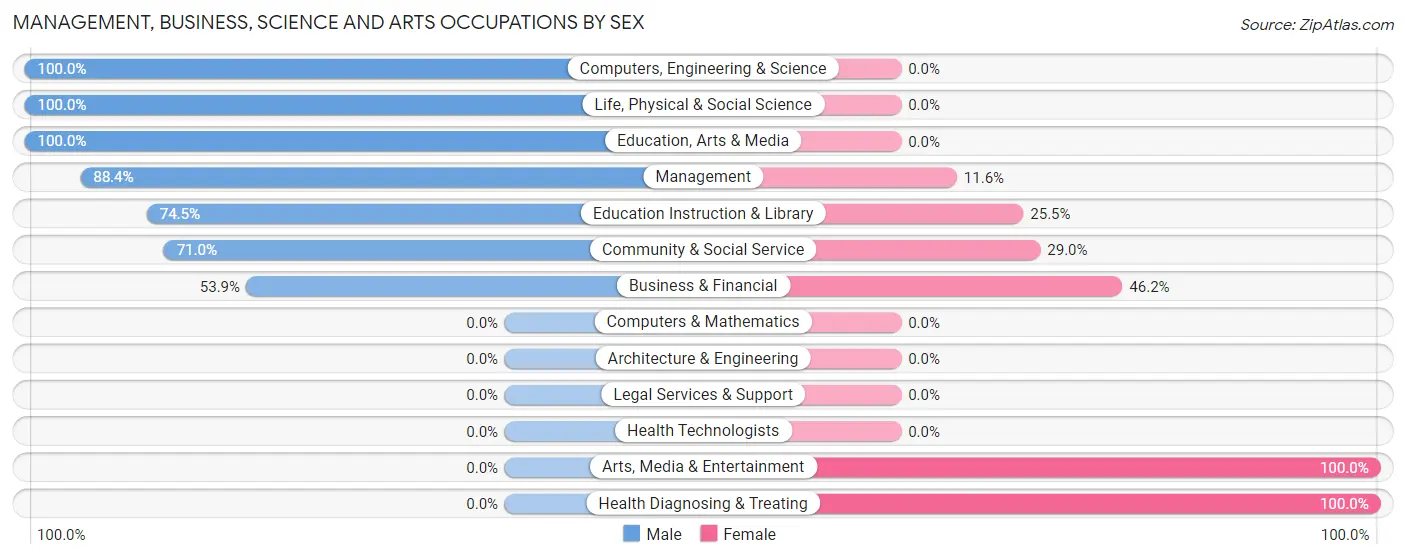
Management, Business, Science and Arts Occupations by Sex
Within the Management, Business, Science and Arts occupations in Carrabelle, the most male-oriented occupations are Computers, Engineering & Science (100.0%), Life, Physical & Social Science (100.0%), and Education, Arts & Media (100.0%), while the most female-oriented occupations are Arts, Media & Entertainment (100.0%), Health Diagnosing & Treating (100.0%), and Business & Financial (46.2%).
| Occupation | Male | Female |
| Management | 38 (88.4%) | 5 (11.6%) |
| Business & Financial | 7 (53.8%) | 6 (46.2%) |
| Computers, Engineering & Science | 3 (100.0%) | 0 (0.0%) |
| Computers & Mathematics | 0 (0.0%) | 0 (0.0%) |
| Architecture & Engineering | 0 (0.0%) | 0 (0.0%) |
| Life, Physical & Social Science | 3 (100.0%) | 0 (0.0%) |
| Community & Social Service | 44 (71.0%) | 18 (29.0%) |
| Education, Arts & Media | 6 (100.0%) | 0 (0.0%) |
| Legal Services & Support | 0 (0.0%) | 0 (0.0%) |
| Education Instruction & Library | 38 (74.5%) | 13 (25.5%) |
| Arts, Media & Entertainment | 0 (0.0%) | 5 (100.0%) |
| Health Diagnosing & Treating | 0 (0.0%) | 11 (100.0%) |
| Health Technologists | 0 (0.0%) | 0 (0.0%) |
| Total (Category) | 92 (69.7%) | 40 (30.3%) |
| Total (Overall) | 269 (46.5%) | 310 (53.5%) |
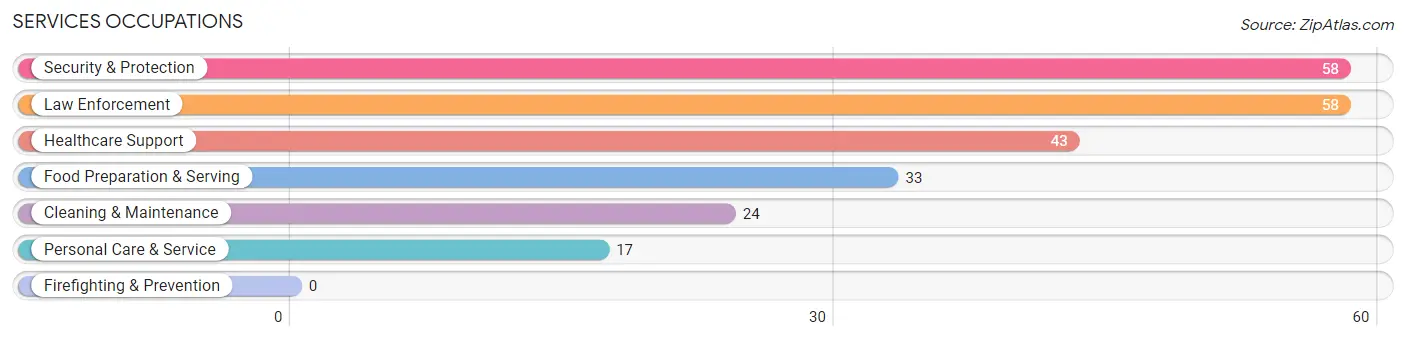
Services Occupations
The most common Services occupations in Carrabelle are Security & Protection (58 | 10.0%), Law Enforcement (58 | 10.0%), Healthcare Support (43 | 7.4%), Food Preparation & Serving (33 | 5.7%), and Cleaning & Maintenance (24 | 4.2%).
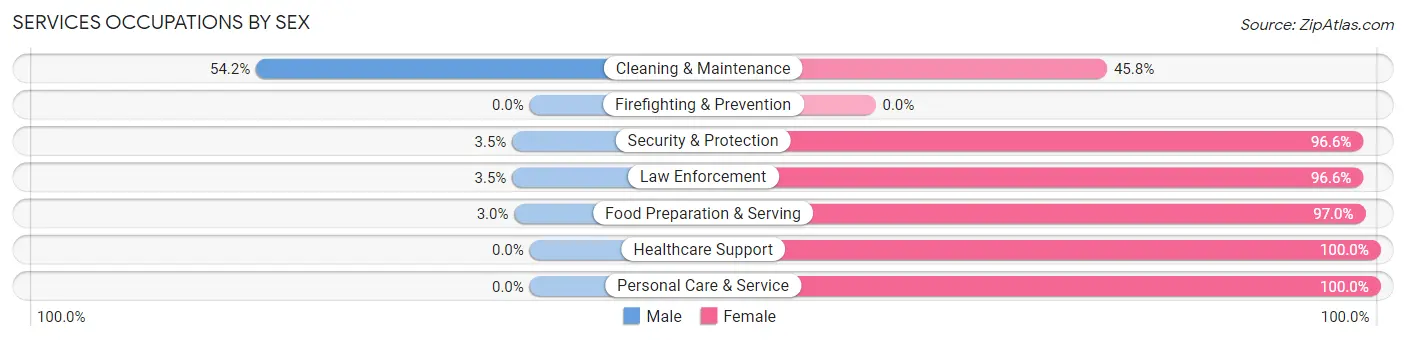
Services Occupations by Sex
Within the Services occupations in Carrabelle, the most male-oriented occupations are Cleaning & Maintenance (54.2%), Security & Protection (3.5%), and Law Enforcement (3.5%), while the most female-oriented occupations are Healthcare Support (100.0%), Personal Care & Service (100.0%), and Food Preparation & Serving (97.0%).
| Occupation | Male | Female |
| Healthcare Support | 0 (0.0%) | 43 (100.0%) |
| Security & Protection | 2 (3.5%) | 56 (96.6%) |
| Firefighting & Prevention | 0 (0.0%) | 0 (0.0%) |
| Law Enforcement | 2 (3.5%) | 56 (96.6%) |
| Food Preparation & Serving | 1 (3.0%) | 32 (97.0%) |
| Cleaning & Maintenance | 13 (54.2%) | 11 (45.8%) |
| Personal Care & Service | 0 (0.0%) | 17 (100.0%) |
| Total (Category) | 16 (9.1%) | 159 (90.9%) |
| Total (Overall) | 269 (46.5%) | 310 (53.5%) |
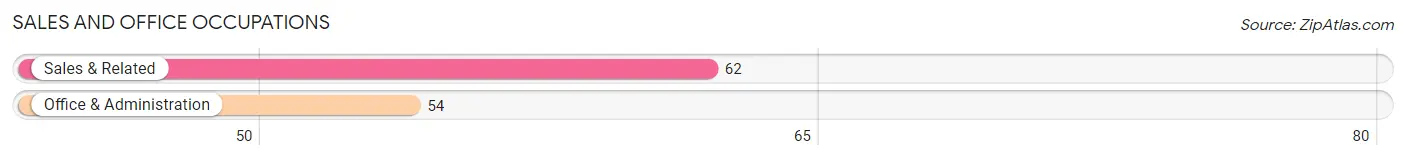
Sales and Office Occupations
The most common Sales and Office occupations in Carrabelle are Sales & Related (62 | 10.7%), and Office & Administration (54 | 9.3%).
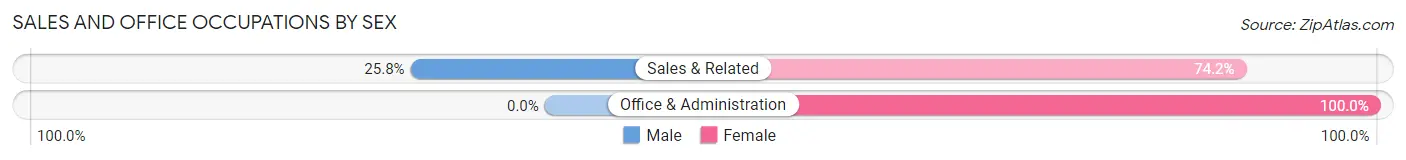
Sales and Office Occupations by Sex
| Occupation | Male | Female |
| Sales & Related | 16 (25.8%) | 46 (74.2%) |
| Office & Administration | 0 (0.0%) | 54 (100.0%) |
| Total (Category) | 16 (13.8%) | 100 (86.2%) |
| Total (Overall) | 269 (46.5%) | 310 (53.5%) |
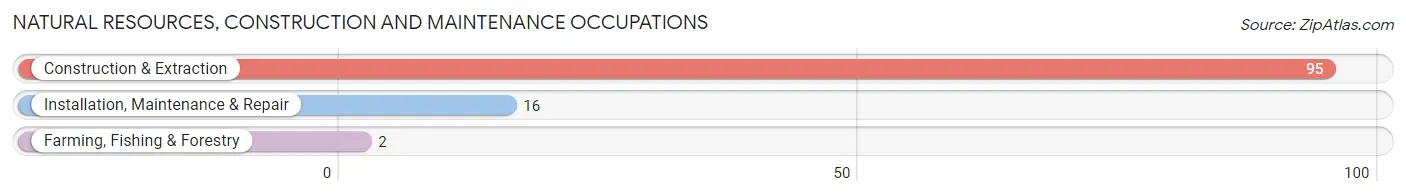
Natural Resources, Construction and Maintenance Occupations
The most common Natural Resources, Construction and Maintenance occupations in Carrabelle are Construction & Extraction (95 | 16.4%), Installation, Maintenance & Repair (16 | 2.8%), and Farming, Fishing & Forestry (2 | 0.4%).
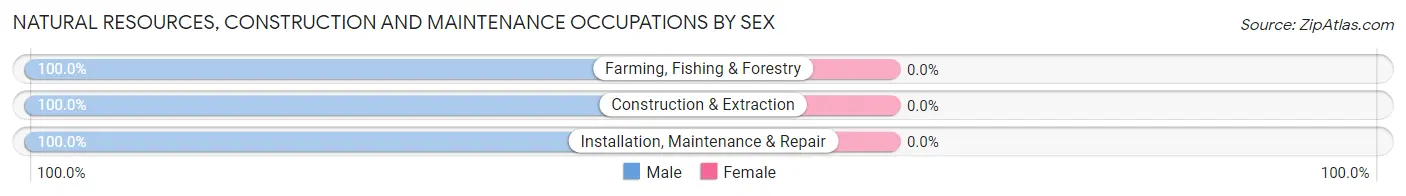
Natural Resources, Construction and Maintenance Occupations by Sex
| Occupation | Male | Female |
| Farming, Fishing & Forestry | 2 (100.0%) | 0 (0.0%) |
| Construction & Extraction | 95 (100.0%) | 0 (0.0%) |
| Installation, Maintenance & Repair | 16 (100.0%) | 0 (0.0%) |
| Total (Category) | 113 (100.0%) | 0 (0.0%) |
| Total (Overall) | 269 (46.5%) | 310 (53.5%) |
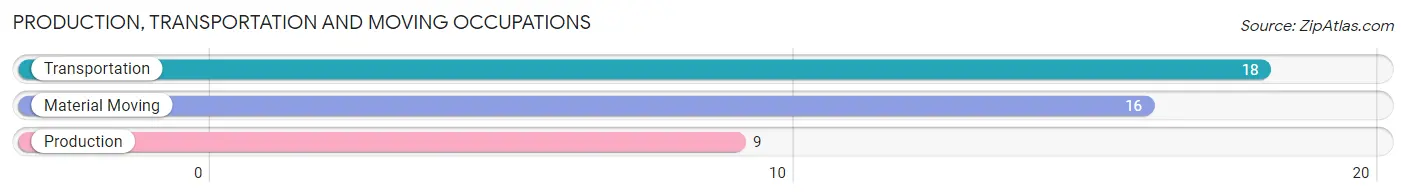
Production, Transportation and Moving Occupations
The most common Production, Transportation and Moving occupations in Carrabelle are Transportation (18 | 3.1%), Material Moving (16 | 2.8%), and Production (9 | 1.5%).
Production, Transportation and Moving Occupations by Sex
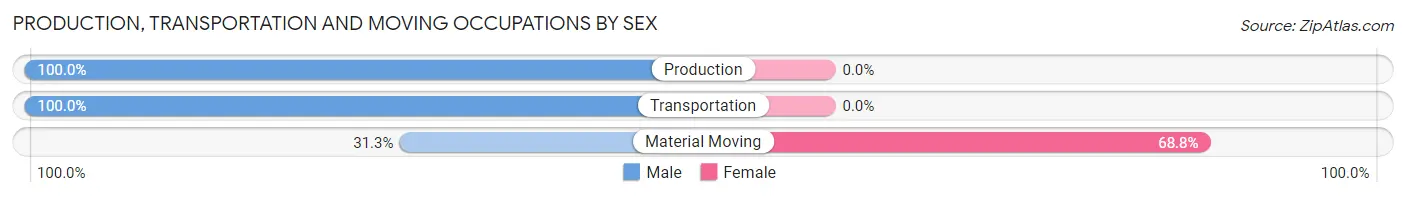
| Occupation | Male | Female |
| Production | 9 (100.0%) | 0 (0.0%) |
| Transportation | 18 (100.0%) | 0 (0.0%) |
| Material Moving | 5 (31.2%) | 11 (68.8%) |
| Total (Category) | 32 (74.4%) | 11 (25.6%) |
| Total (Overall) | 269 (46.5%) | 310 (53.5%) |
Employment Industries by Sex in Carrabelle
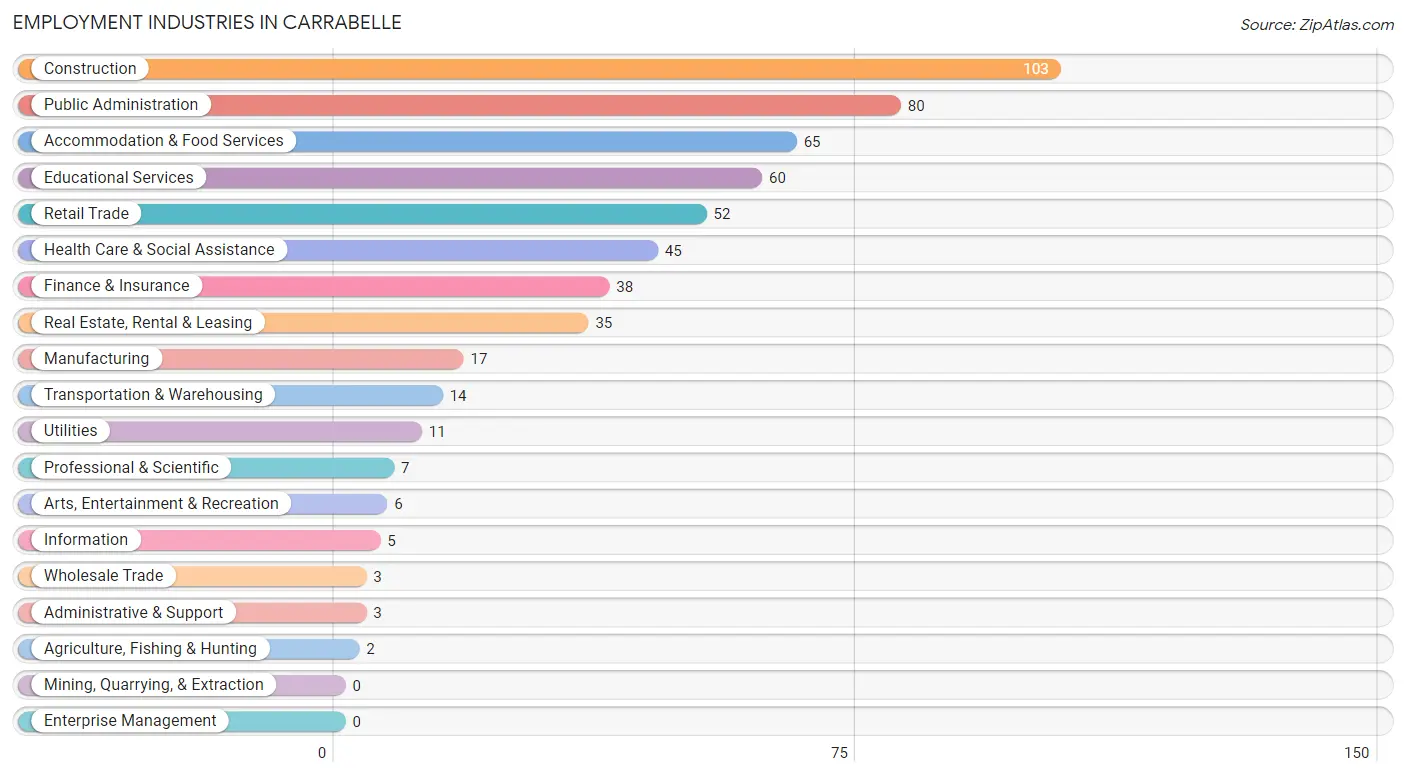
Employment Industries in Carrabelle
The major employment industries in Carrabelle include Construction (103 | 17.8%), Public Administration (80 | 13.8%), Accommodation & Food Services (65 | 11.2%), Educational Services (60 | 10.4%), and Retail Trade (52 | 9.0%).
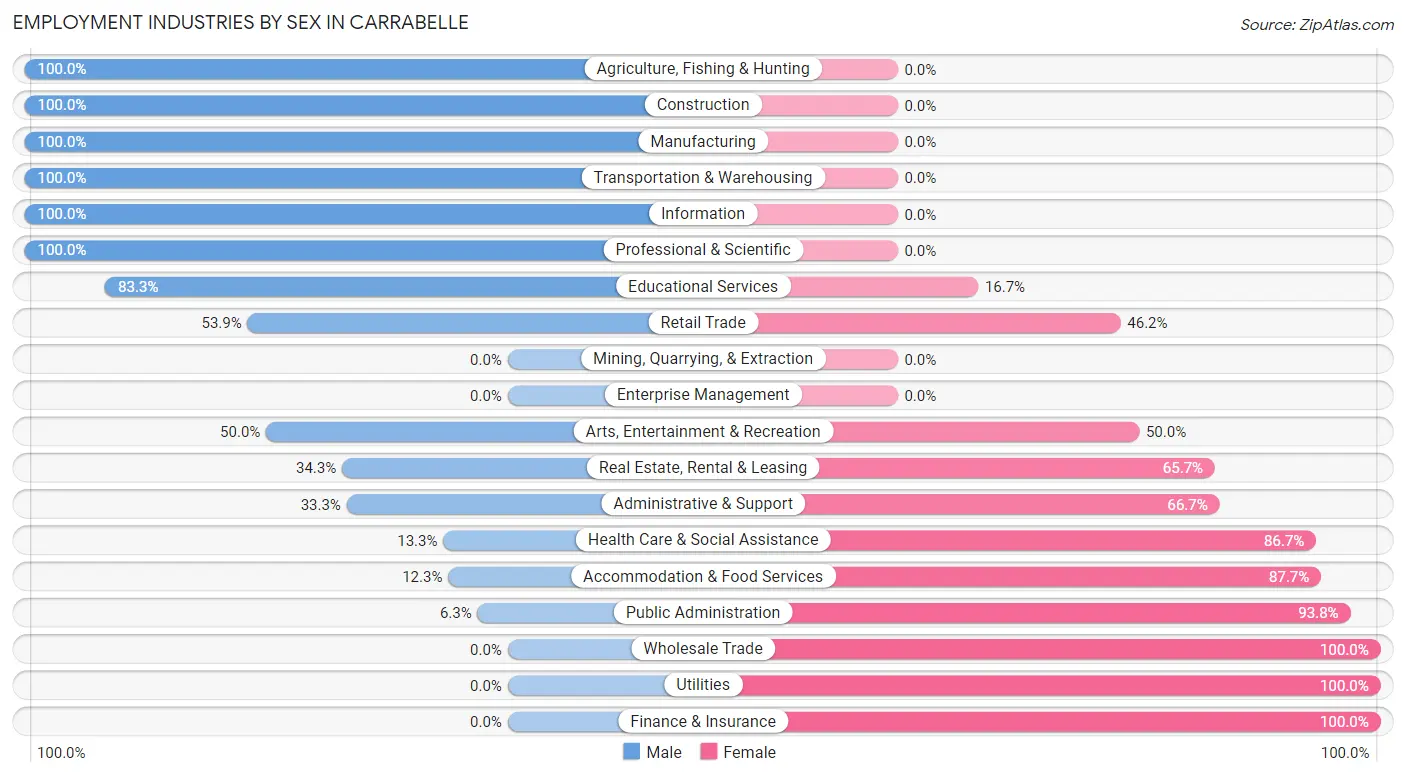
Employment Industries by Sex in Carrabelle
The Carrabelle industries that see more men than women are Agriculture, Fishing & Hunting (100.0%), Construction (100.0%), and Manufacturing (100.0%), whereas the industries that tend to have a higher number of women are Wholesale Trade (100.0%), Utilities (100.0%), and Finance & Insurance (100.0%).
| Industry | Male | Female |
| Agriculture, Fishing & Hunting | 2 (100.0%) | 0 (0.0%) |
| Mining, Quarrying, & Extraction | 0 (0.0%) | 0 (0.0%) |
| Construction | 103 (100.0%) | 0 (0.0%) |
| Manufacturing | 17 (100.0%) | 0 (0.0%) |
| Wholesale Trade | 0 (0.0%) | 3 (100.0%) |
| Retail Trade | 28 (53.8%) | 24 (46.2%) |
| Transportation & Warehousing | 14 (100.0%) | 0 (0.0%) |
| Utilities | 0 (0.0%) | 11 (100.0%) |
| Information | 5 (100.0%) | 0 (0.0%) |
| Finance & Insurance | 0 (0.0%) | 38 (100.0%) |
| Real Estate, Rental & Leasing | 12 (34.3%) | 23 (65.7%) |
| Professional & Scientific | 7 (100.0%) | 0 (0.0%) |
| Enterprise Management | 0 (0.0%) | 0 (0.0%) |
| Administrative & Support | 1 (33.3%) | 2 (66.7%) |
| Educational Services | 50 (83.3%) | 10 (16.7%) |
| Health Care & Social Assistance | 6 (13.3%) | 39 (86.7%) |
| Arts, Entertainment & Recreation | 3 (50.0%) | 3 (50.0%) |
| Accommodation & Food Services | 8 (12.3%) | 57 (87.7%) |
| Public Administration | 5 (6.2%) | 75 (93.8%) |
| Total | 269 (46.5%) | 310 (53.5%) |
Education in Carrabelle
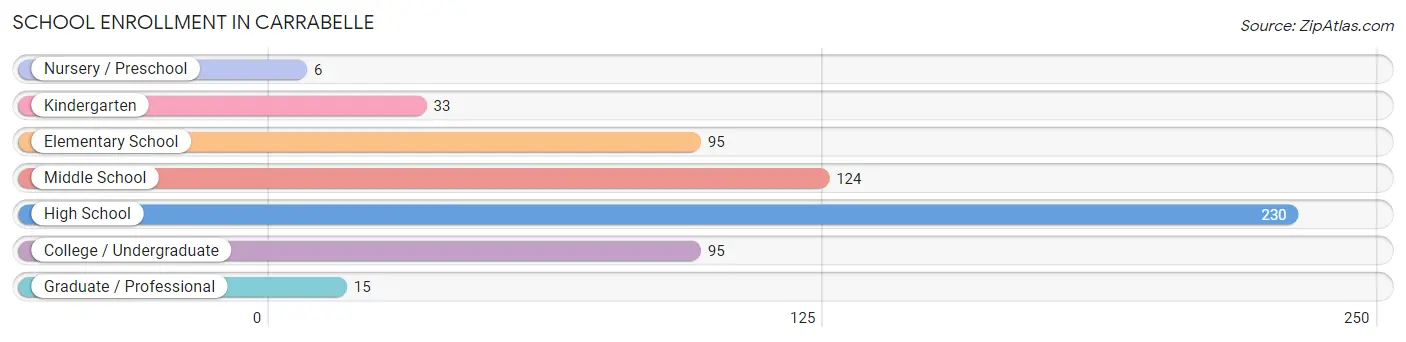
School Enrollment in Carrabelle
The most common levels of schooling among the 598 students in Carrabelle are high school (230 | 38.5%), middle school (124 | 20.7%), and elementary school (95 | 15.9%).
| School Level | # Students | % Students |
| Nursery / Preschool | 6 | 1.0% |
| Kindergarten | 33 | 5.5% |
| Elementary School | 95 | 15.9% |
| Middle School | 124 | 20.7% |
| High School | 230 | 38.5% |
| College / Undergraduate | 95 | 15.9% |
| Graduate / Professional | 15 | 2.5% |
| Total | 598 | 100.0% |
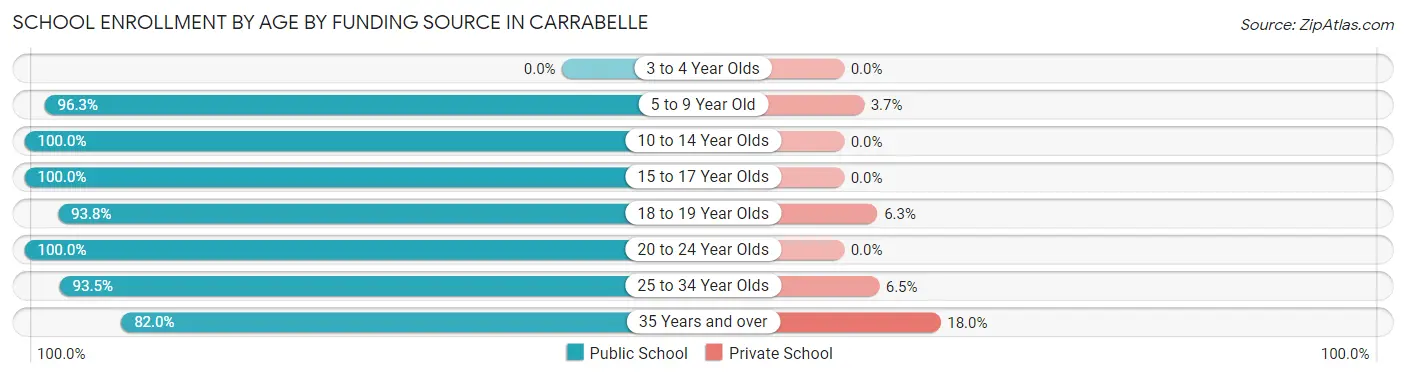
School Enrollment by Age by Funding Source in Carrabelle
Out of a total of 598 students who are enrolled in schools in Carrabelle, 31 (5.2%) attend a private institution, while the remaining 567 (94.8%) are enrolled in public schools. The age group of 35 years and over has the highest likelihood of being enrolled in private schools, with 18 (18.0% in the age bracket) enrolled. Conversely, the age group of 10 to 14 year olds has the lowest likelihood of being enrolled in a private school, with 150 (100.0% in the age bracket) attending a public institution.
| Age Bracket | Public School | Private School |
| 3 to 4 Year Olds | 0 (0.0%) | 0 (0.0%) |
| 5 to 9 Year Old | 129 (96.3%) | 5 (3.7%) |
| 10 to 14 Year Olds | 150 (100.0%) | 0 (0.0%) |
| 15 to 17 Year Olds | 41 (100.0%) | 0 (0.0%) |
| 18 to 19 Year Olds | 15 (93.8%) | 1 (6.2%) |
| 20 to 24 Year Olds | 50 (100.0%) | 0 (0.0%) |
| 25 to 34 Year Olds | 100 (93.5%) | 7 (6.5%) |
| 35 Years and over | 82 (82.0%) | 18 (18.0%) |
| Total | 567 (94.8%) | 31 (5.2%) |
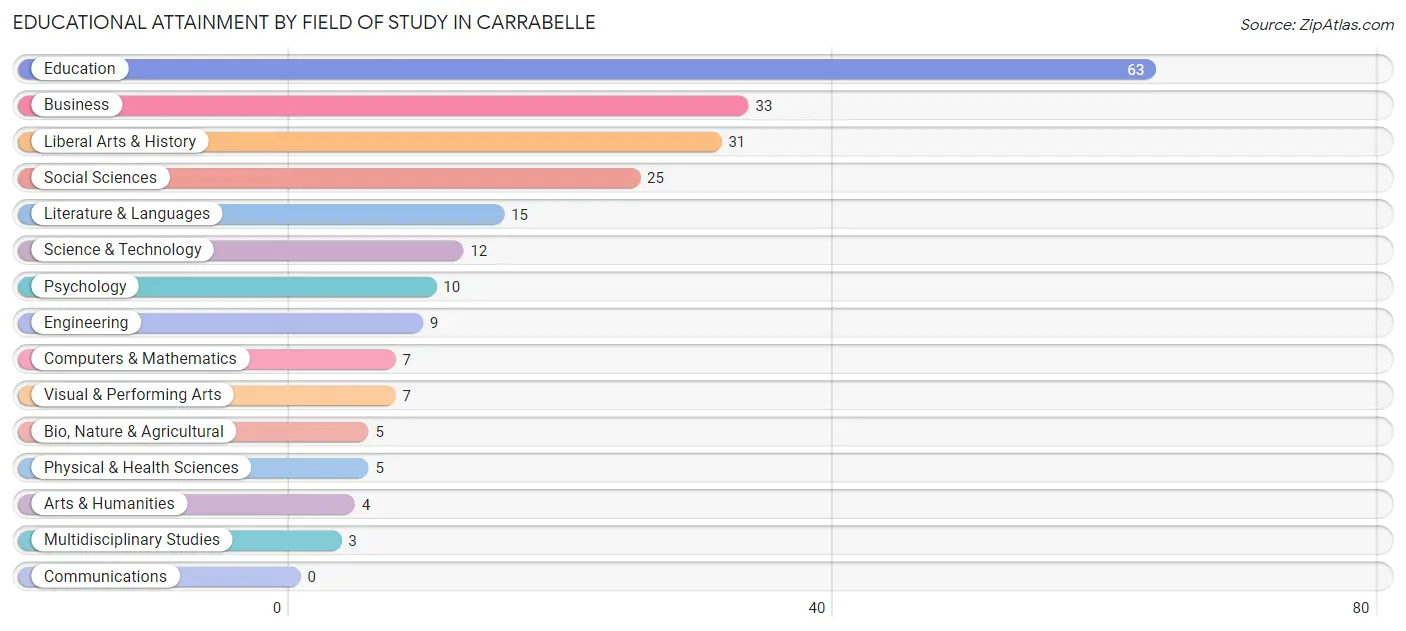
Educational Attainment by Field of Study in Carrabelle
Education (63 | 27.5%), business (33 | 14.4%), liberal arts & history (31 | 13.5%), social sciences (25 | 10.9%), and literature & languages (15 | 6.6%) are the most common fields of study among 229 individuals in Carrabelle who have obtained a bachelor's degree or higher.
| Field of Study | # Graduates | % Graduates |
| Computers & Mathematics | 7 | 3.1% |
| Bio, Nature & Agricultural | 5 | 2.2% |
| Physical & Health Sciences | 5 | 2.2% |
| Psychology | 10 | 4.4% |
| Social Sciences | 25 | 10.9% |
| Engineering | 9 | 3.9% |
| Multidisciplinary Studies | 3 | 1.3% |
| Science & Technology | 12 | 5.2% |
| Business | 33 | 14.4% |
| Education | 63 | 27.5% |
| Literature & Languages | 15 | 6.6% |
| Liberal Arts & History | 31 | 13.5% |
| Visual & Performing Arts | 7 | 3.1% |
| Communications | 0 | 0.0% |
| Arts & Humanities | 4 | 1.8% |
| Total | 229 | 100.0% |
Transportation & Commute in Carrabelle
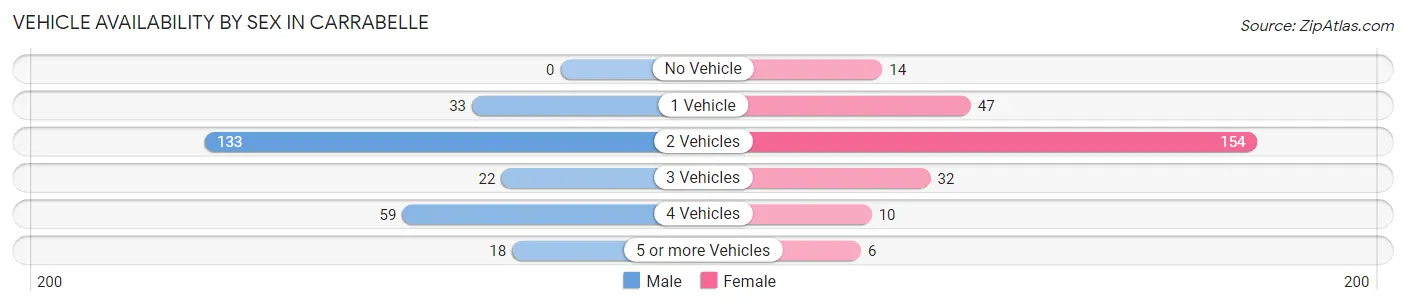
Vehicle Availability by Sex in Carrabelle
The most prevalent vehicle ownership categories in Carrabelle are males with 2 vehicles (133, accounting for 50.2%) and females with 2 vehicles (154, making up 50.6%).
| Vehicles Available | Male | Female |
| No Vehicle | 0 (0.0%) | 14 (5.3%) |
| 1 Vehicle | 33 (12.4%) | 47 (17.9%) |
| 2 Vehicles | 133 (50.2%) | 154 (58.6%) |
| 3 Vehicles | 22 (8.3%) | 32 (12.2%) |
| 4 Vehicles | 59 (22.3%) | 10 (3.8%) |
| 5 or more Vehicles | 18 (6.8%) | 6 (2.3%) |
| Total | 265 (100.0%) | 263 (100.0%) |
Commute Time in Carrabelle
The most frequently occuring commute durations in Carrabelle are 30 to 34 minutes (116 commuters, 22.2%), less than 5 minutes (79 commuters, 15.1%), and 20 to 24 minutes (75 commuters, 14.3%).
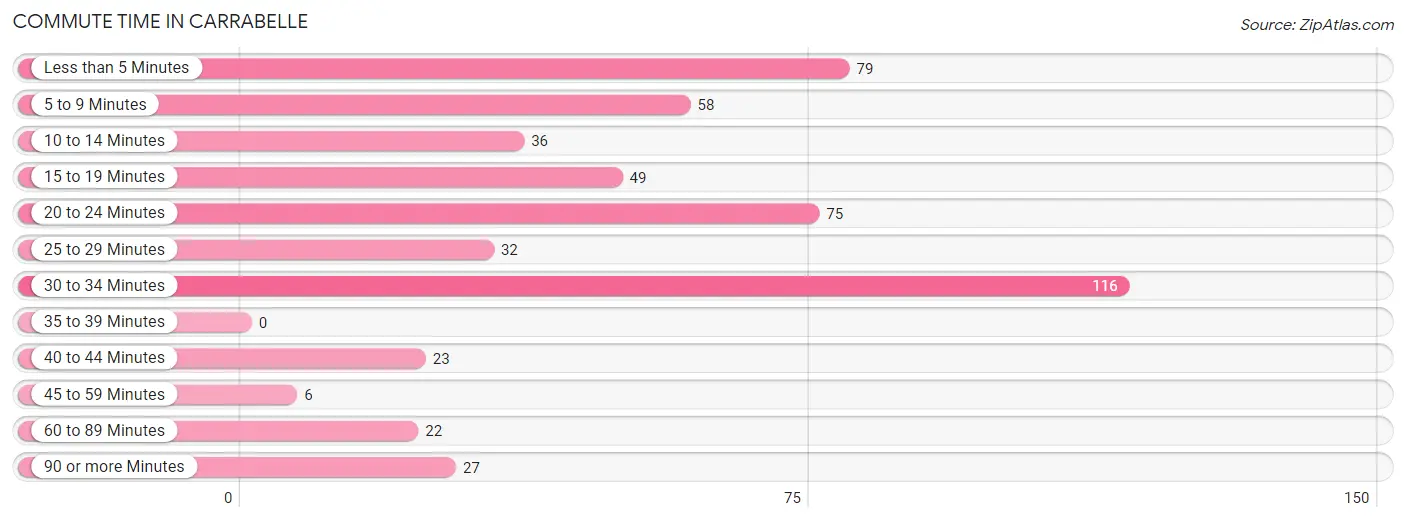
| Commute Time | # Commuters | % Commuters |
| Less than 5 Minutes | 79 | 15.1% |
| 5 to 9 Minutes | 58 | 11.1% |
| 10 to 14 Minutes | 36 | 6.9% |
| 15 to 19 Minutes | 49 | 9.4% |
| 20 to 24 Minutes | 75 | 14.3% |
| 25 to 29 Minutes | 32 | 6.1% |
| 30 to 34 Minutes | 116 | 22.2% |
| 35 to 39 Minutes | 0 | 0.0% |
| 40 to 44 Minutes | 23 | 4.4% |
| 45 to 59 Minutes | 6 | 1.1% |
| 60 to 89 Minutes | 22 | 4.2% |
| 90 or more Minutes | 27 | 5.2% |
Commute Time by Sex in Carrabelle
The most common commute times in Carrabelle are 20 to 24 minutes (47 commuters, 17.7%) for males and 30 to 34 minutes (71 commuters, 27.6%) for females.
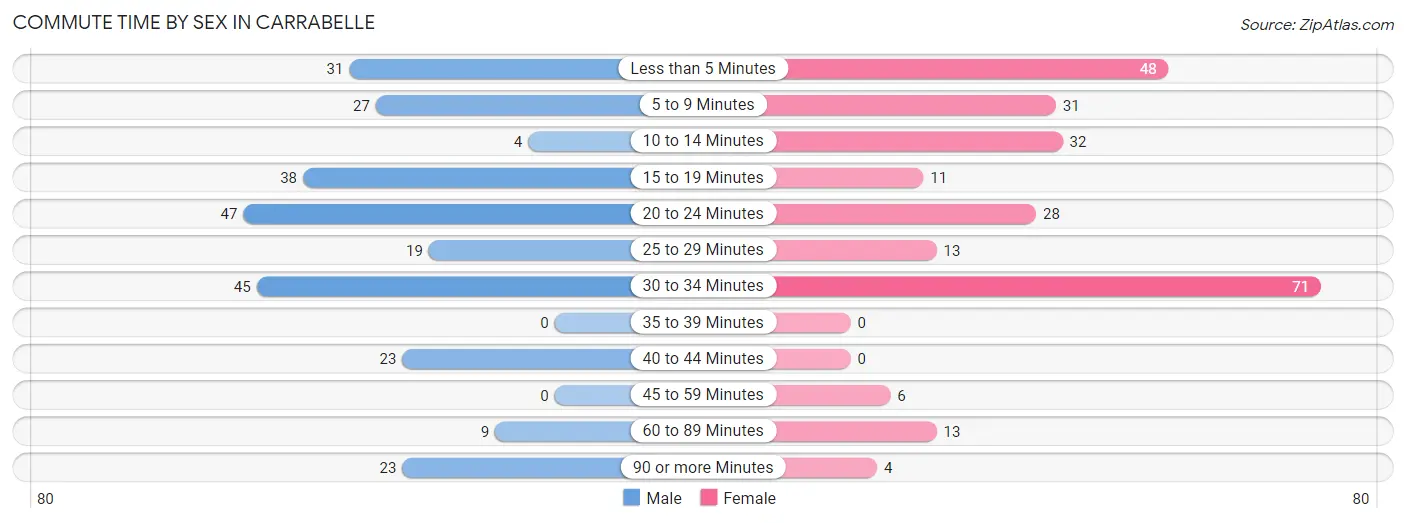
| Commute Time | Male | Female |
| Less than 5 Minutes | 31 (11.7%) | 48 (18.7%) |
| 5 to 9 Minutes | 27 (10.2%) | 31 (12.1%) |
| 10 to 14 Minutes | 4 (1.5%) | 32 (12.4%) |
| 15 to 19 Minutes | 38 (14.3%) | 11 (4.3%) |
| 20 to 24 Minutes | 47 (17.7%) | 28 (10.9%) |
| 25 to 29 Minutes | 19 (7.1%) | 13 (5.1%) |
| 30 to 34 Minutes | 45 (16.9%) | 71 (27.6%) |
| 35 to 39 Minutes | 0 (0.0%) | 0 (0.0%) |
| 40 to 44 Minutes | 23 (8.6%) | 0 (0.0%) |
| 45 to 59 Minutes | 0 (0.0%) | 6 (2.3%) |
| 60 to 89 Minutes | 9 (3.4%) | 13 (5.1%) |
| 90 or more Minutes | 23 (8.6%) | 4 (1.6%) |
Time of Departure to Work by Sex in Carrabelle
The most frequent times of departure to work in Carrabelle are 7:30 AM to 7:59 AM (69, 25.9%) for males and 7:30 AM to 7:59 AM (50, 19.5%) for females.
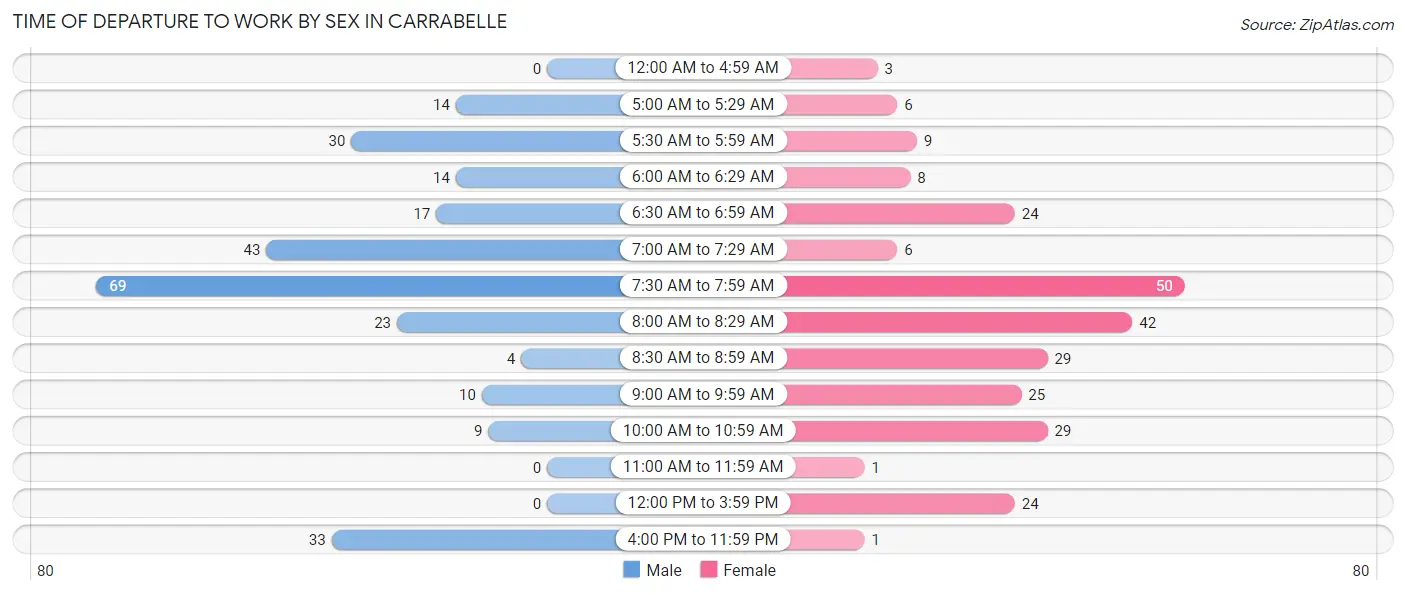
| Time of Departure | Male | Female |
| 12:00 AM to 4:59 AM | 0 (0.0%) | 3 (1.2%) |
| 5:00 AM to 5:29 AM | 14 (5.3%) | 6 (2.3%) |
| 5:30 AM to 5:59 AM | 30 (11.3%) | 9 (3.5%) |
| 6:00 AM to 6:29 AM | 14 (5.3%) | 8 (3.1%) |
| 6:30 AM to 6:59 AM | 17 (6.4%) | 24 (9.3%) |
| 7:00 AM to 7:29 AM | 43 (16.2%) | 6 (2.3%) |
| 7:30 AM to 7:59 AM | 69 (25.9%) | 50 (19.5%) |
| 8:00 AM to 8:29 AM | 23 (8.6%) | 42 (16.3%) |
| 8:30 AM to 8:59 AM | 4 (1.5%) | 29 (11.3%) |
| 9:00 AM to 9:59 AM | 10 (3.8%) | 25 (9.7%) |
| 10:00 AM to 10:59 AM | 9 (3.4%) | 29 (11.3%) |
| 11:00 AM to 11:59 AM | 0 (0.0%) | 1 (0.4%) |
| 12:00 PM to 3:59 PM | 0 (0.0%) | 24 (9.3%) |
| 4:00 PM to 11:59 PM | 33 (12.4%) | 1 (0.4%) |
| Total | 266 (100.0%) | 257 (100.0%) |
Housing Occupancy in Carrabelle
Occupancy by Ownership in Carrabelle
Of the total 699 dwellings in Carrabelle, owner-occupied units account for 517 (74.0%), while renter-occupied units make up 182 (26.0%).
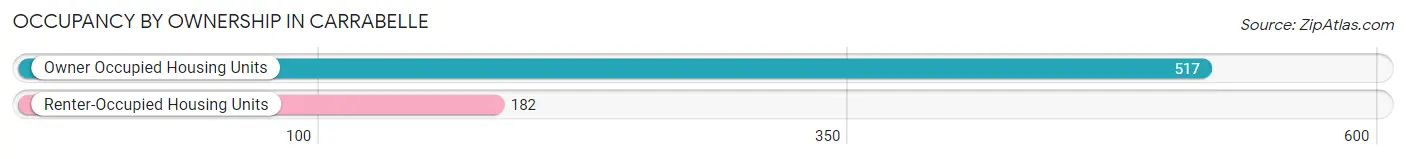
| Occupancy | # Housing Units | % Housing Units |
| Owner Occupied Housing Units | 517 | 74.0% |
| Renter-Occupied Housing Units | 182 | 26.0% |
| Total Occupied Housing Units | 699 | 100.0% |
Occupancy by Household Size in Carrabelle
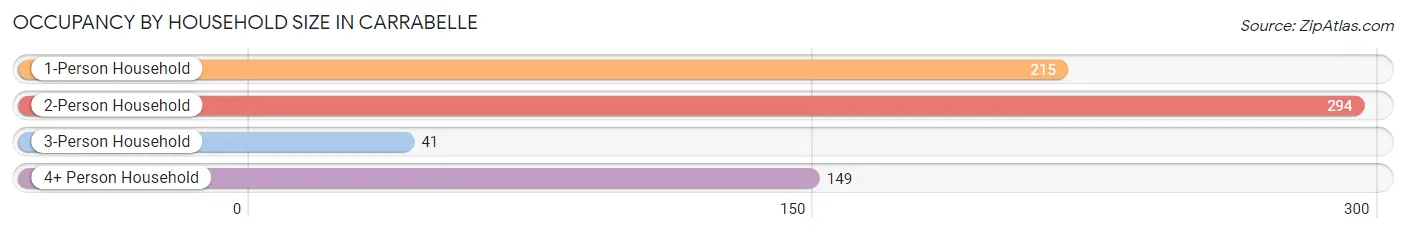
| Household Size | # Housing Units | % Housing Units |
| 1-Person Household | 215 | 30.8% |
| 2-Person Household | 294 | 42.1% |
| 3-Person Household | 41 | 5.9% |
| 4+ Person Household | 149 | 21.3% |
| Total Housing Units | 699 | 100.0% |
Occupancy by Ownership by Household Size in Carrabelle
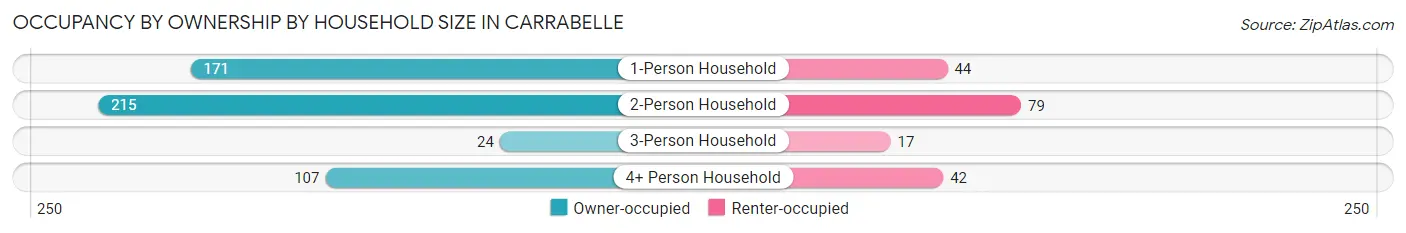
| Household Size | Owner-occupied | Renter-occupied |
| 1-Person Household | 171 (79.5%) | 44 (20.5%) |
| 2-Person Household | 215 (73.1%) | 79 (26.9%) |
| 3-Person Household | 24 (58.5%) | 17 (41.5%) |
| 4+ Person Household | 107 (71.8%) | 42 (28.2%) |
| Total Housing Units | 517 (74.0%) | 182 (26.0%) |
Occupancy by Educational Attainment in Carrabelle
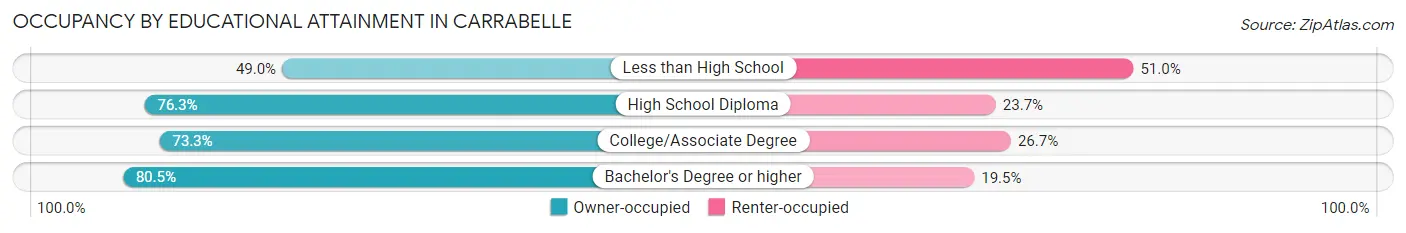
| Household Size | Owner-occupied | Renter-occupied |
| Less than High School | 24 (49.0%) | 25 (51.0%) |
| High School Diploma | 151 (76.3%) | 47 (23.7%) |
| College/Associate Degree | 222 (73.3%) | 81 (26.7%) |
| Bachelor's Degree or higher | 120 (80.5%) | 29 (19.5%) |
Occupancy by Age of Householder in Carrabelle
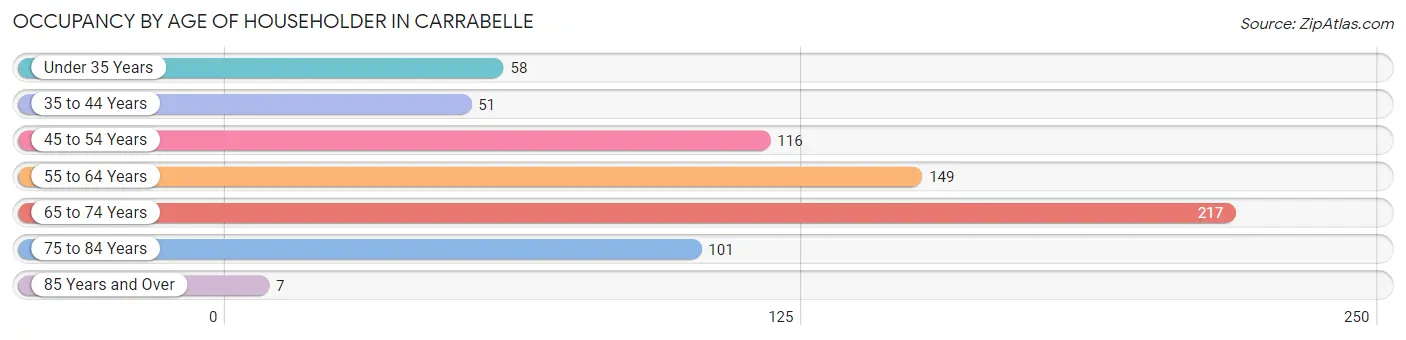
| Age Bracket | # Households | % Households |
| Under 35 Years | 58 | 8.3% |
| 35 to 44 Years | 51 | 7.3% |
| 45 to 54 Years | 116 | 16.6% |
| 55 to 64 Years | 149 | 21.3% |
| 65 to 74 Years | 217 | 31.0% |
| 75 to 84 Years | 101 | 14.4% |
| 85 Years and Over | 7 | 1.0% |
| Total | 699 | 100.0% |
Housing Finances in Carrabelle
Median Income by Occupancy in Carrabelle
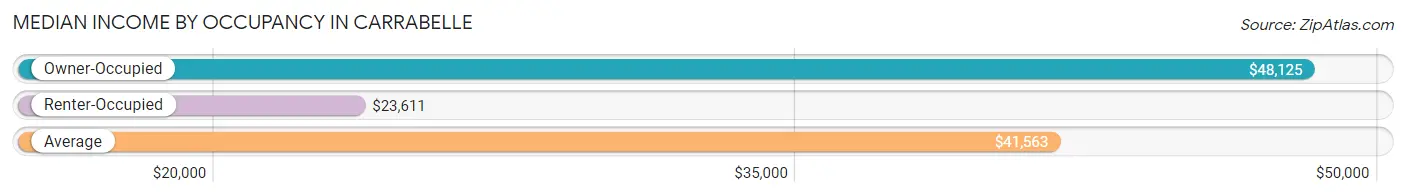
| Occupancy Type | # Households | Median Income |
| Owner-Occupied | 517 (74.0%) | $48,125 |
| Renter-Occupied | 182 (26.0%) | $23,611 |
| Average | 699 (100.0%) | $41,563 |
Occupancy by Householder Income Bracket in Carrabelle
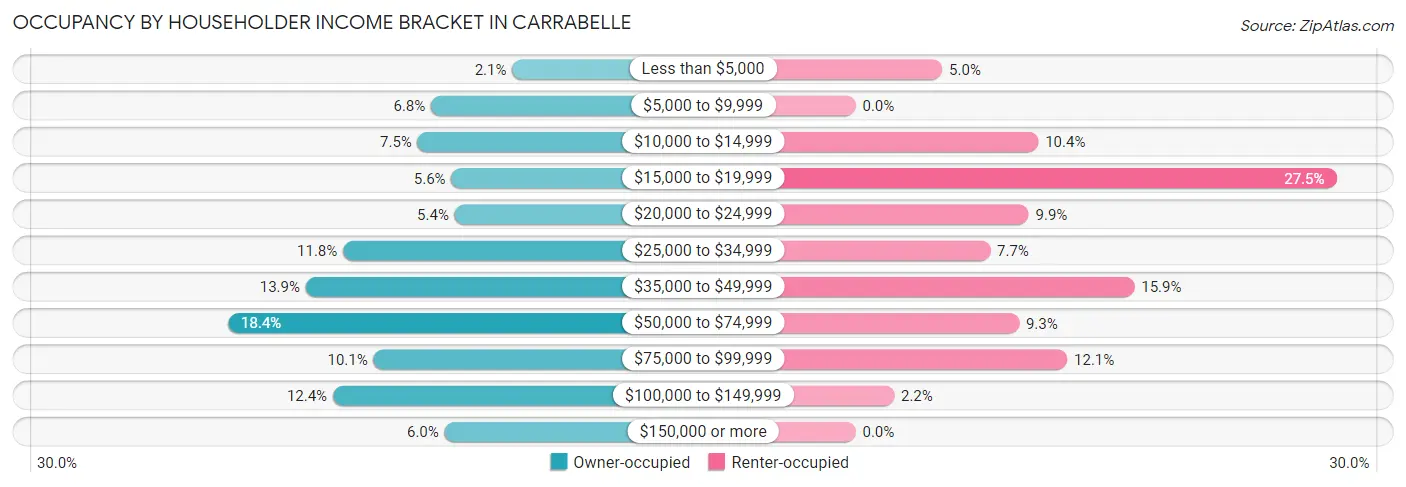
| Income Bracket | Owner-occupied | Renter-occupied |
| Less than $5,000 | 11 (2.1%) | 9 (5.0%) |
| $5,000 to $9,999 | 35 (6.8%) | 0 (0.0%) |
| $10,000 to $14,999 | 39 (7.5%) | 19 (10.4%) |
| $15,000 to $19,999 | 29 (5.6%) | 50 (27.5%) |
| $20,000 to $24,999 | 28 (5.4%) | 18 (9.9%) |
| $25,000 to $34,999 | 61 (11.8%) | 14 (7.7%) |
| $35,000 to $49,999 | 72 (13.9%) | 29 (15.9%) |
| $50,000 to $74,999 | 95 (18.4%) | 17 (9.3%) |
| $75,000 to $99,999 | 52 (10.1%) | 22 (12.1%) |
| $100,000 to $149,999 | 64 (12.4%) | 4 (2.2%) |
| $150,000 or more | 31 (6.0%) | 0 (0.0%) |
| Total | 517 (100.0%) | 182 (100.0%) |
Monthly Housing Cost Tiers in Carrabelle
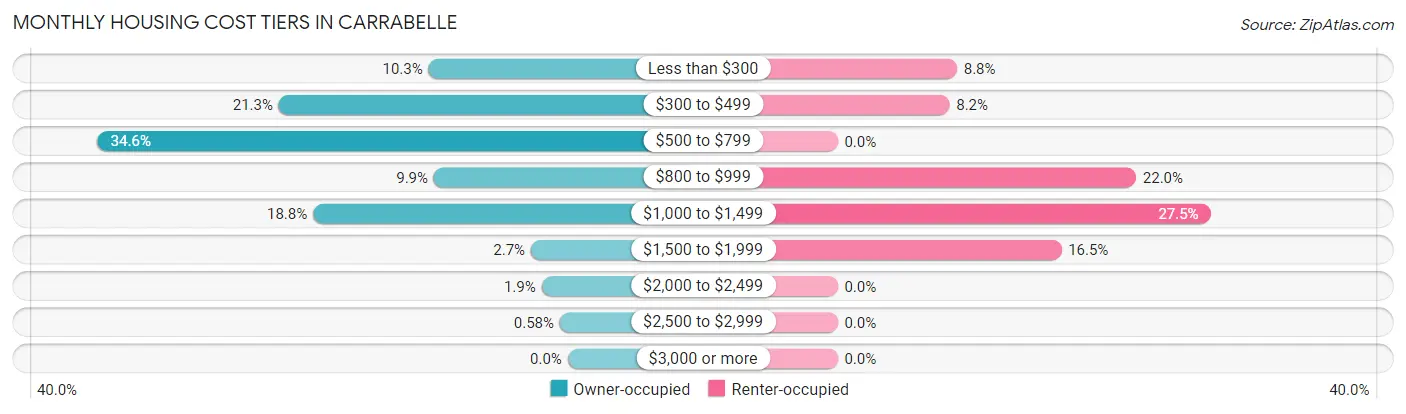
| Monthly Cost | Owner-occupied | Renter-occupied |
| Less than $300 | 53 (10.2%) | 16 (8.8%) |
| $300 to $499 | 110 (21.3%) | 15 (8.2%) |
| $500 to $799 | 179 (34.6%) | 0 (0.0%) |
| $800 to $999 | 51 (9.9%) | 40 (22.0%) |
| $1,000 to $1,499 | 97 (18.8%) | 50 (27.5%) |
| $1,500 to $1,999 | 14 (2.7%) | 30 (16.5%) |
| $2,000 to $2,499 | 10 (1.9%) | 0 (0.0%) |
| $2,500 to $2,999 | 3 (0.6%) | 0 (0.0%) |
| $3,000 or more | 0 (0.0%) | 0 (0.0%) |
| Total | 517 (100.0%) | 182 (100.0%) |
Physical Housing Characteristics in Carrabelle
Housing Structures in Carrabelle
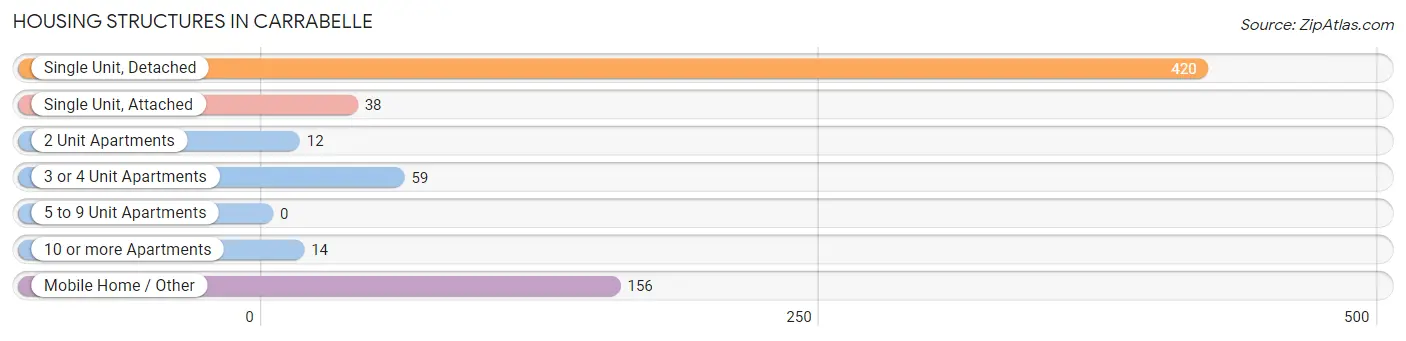
| Structure Type | # Housing Units | % Housing Units |
| Single Unit, Detached | 420 | 60.1% |
| Single Unit, Attached | 38 | 5.4% |
| 2 Unit Apartments | 12 | 1.7% |
| 3 or 4 Unit Apartments | 59 | 8.4% |
| 5 to 9 Unit Apartments | 0 | 0.0% |
| 10 or more Apartments | 14 | 2.0% |
| Mobile Home / Other | 156 | 22.3% |
| Total | 699 | 100.0% |
Housing Structures by Occupancy in Carrabelle
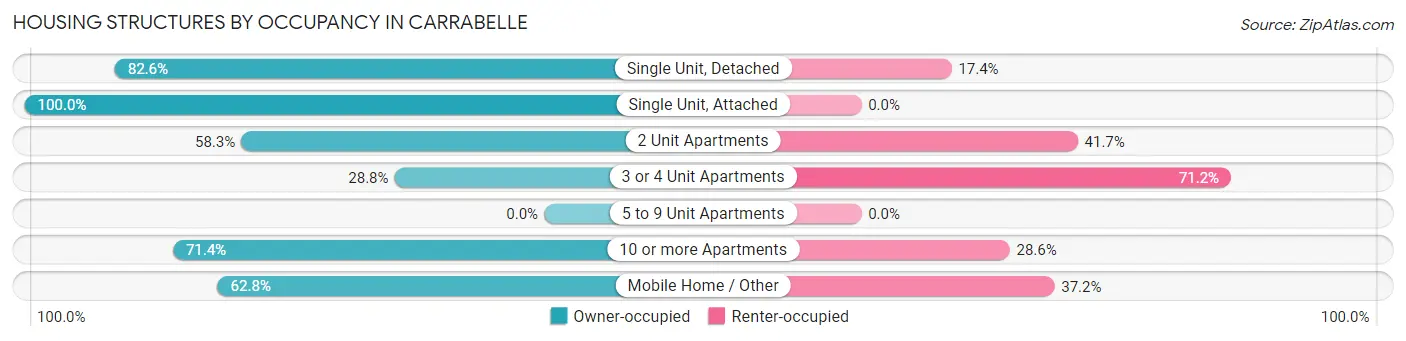
| Structure Type | Owner-occupied | Renter-occupied |
| Single Unit, Detached | 347 (82.6%) | 73 (17.4%) |
| Single Unit, Attached | 38 (100.0%) | 0 (0.0%) |
| 2 Unit Apartments | 7 (58.3%) | 5 (41.7%) |
| 3 or 4 Unit Apartments | 17 (28.8%) | 42 (71.2%) |
| 5 to 9 Unit Apartments | 0 (0.0%) | 0 (0.0%) |
| 10 or more Apartments | 10 (71.4%) | 4 (28.6%) |
| Mobile Home / Other | 98 (62.8%) | 58 (37.2%) |
| Total | 517 (74.0%) | 182 (26.0%) |
Housing Structures by Number of Rooms in Carrabelle
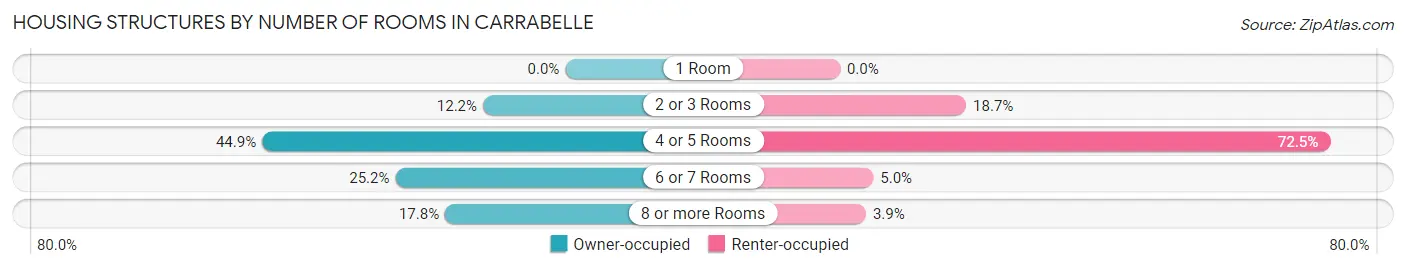
| Number of Rooms | Owner-occupied | Renter-occupied |
| 1 Room | 0 (0.0%) | 0 (0.0%) |
| 2 or 3 Rooms | 63 (12.2%) | 34 (18.7%) |
| 4 or 5 Rooms | 232 (44.9%) | 132 (72.5%) |
| 6 or 7 Rooms | 130 (25.2%) | 9 (5.0%) |
| 8 or more Rooms | 92 (17.8%) | 7 (3.8%) |
| Total | 517 (100.0%) | 182 (100.0%) |
Housing Structure by Heating Type in Carrabelle
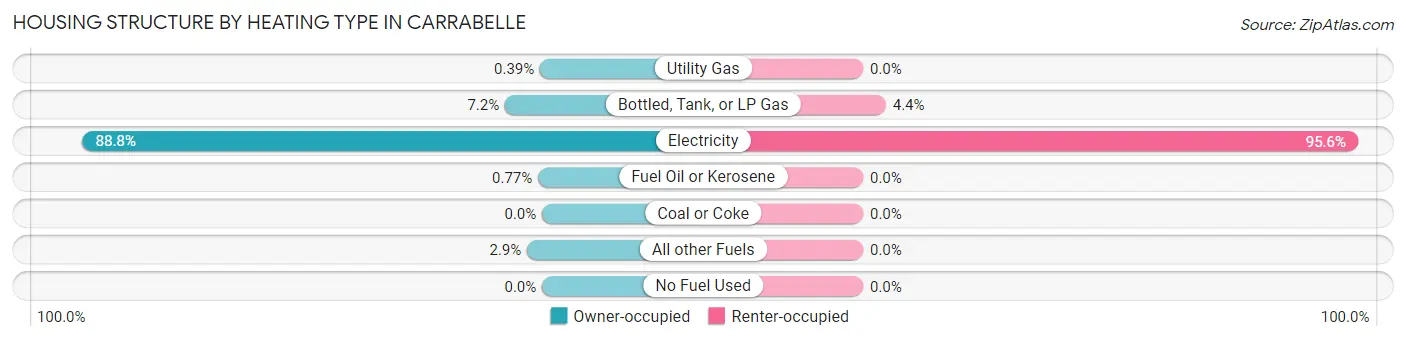
| Heating Type | Owner-occupied | Renter-occupied |
| Utility Gas | 2 (0.4%) | 0 (0.0%) |
| Bottled, Tank, or LP Gas | 37 (7.2%) | 8 (4.4%) |
| Electricity | 459 (88.8%) | 174 (95.6%) |
| Fuel Oil or Kerosene | 4 (0.8%) | 0 (0.0%) |
| Coal or Coke | 0 (0.0%) | 0 (0.0%) |
| All other Fuels | 15 (2.9%) | 0 (0.0%) |
| No Fuel Used | 0 (0.0%) | 0 (0.0%) |
| Total | 517 (100.0%) | 182 (100.0%) |
Household Vehicle Usage in Carrabelle
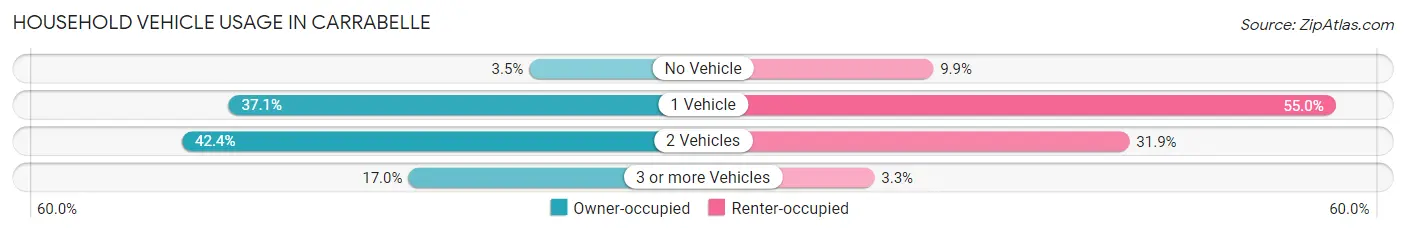
| Vehicles per Household | Owner-occupied | Renter-occupied |
| No Vehicle | 18 (3.5%) | 18 (9.9%) |
| 1 Vehicle | 192 (37.1%) | 100 (54.9%) |
| 2 Vehicles | 219 (42.4%) | 58 (31.9%) |
| 3 or more Vehicles | 88 (17.0%) | 6 (3.3%) |
| Total | 517 (100.0%) | 182 (100.0%) |
Real Estate & Mortgages in Carrabelle
Real Estate and Mortgage Overview in Carrabelle
| Characteristic | Without Mortgage | With Mortgage |
| Housing Units | 326 | 191 |
| Median Property Value | $135,300 | $169,800 |
| Median Household Income | $47,292 | $5 |
| Monthly Housing Costs | $500 | $0 |
| Real Estate Taxes | $1,380 | $7 |
Property Value by Mortgage Status in Carrabelle
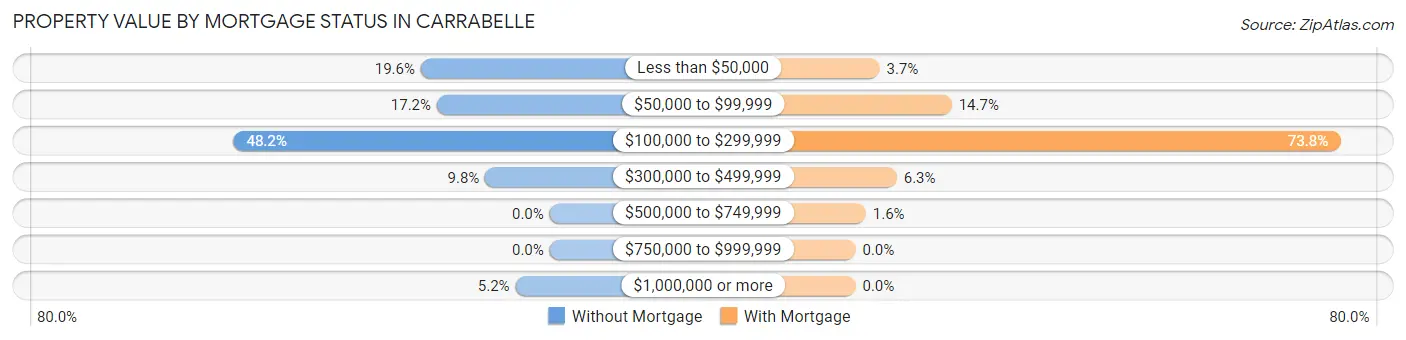
| Property Value | Without Mortgage | With Mortgage |
| Less than $50,000 | 64 (19.6%) | 7 (3.7%) |
| $50,000 to $99,999 | 56 (17.2%) | 28 (14.7%) |
| $100,000 to $299,999 | 157 (48.2%) | 141 (73.8%) |
| $300,000 to $499,999 | 32 (9.8%) | 12 (6.3%) |
| $500,000 to $749,999 | 0 (0.0%) | 3 (1.6%) |
| $750,000 to $999,999 | 0 (0.0%) | 0 (0.0%) |
| $1,000,000 or more | 17 (5.2%) | 0 (0.0%) |
| Total | 326 (100.0%) | 191 (100.0%) |
Household Income by Mortgage Status in Carrabelle
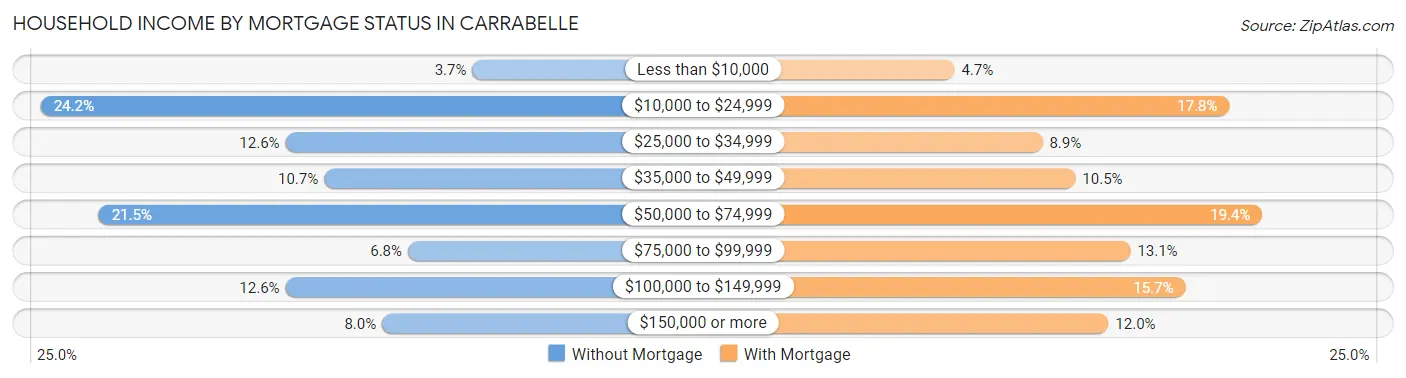
| Household Income | Without Mortgage | With Mortgage |
| Less than $10,000 | 12 (3.7%) | 9 (4.7%) |
| $10,000 to $24,999 | 79 (24.2%) | 34 (17.8%) |
| $25,000 to $34,999 | 41 (12.6%) | 17 (8.9%) |
| $35,000 to $49,999 | 35 (10.7%) | 20 (10.5%) |
| $50,000 to $74,999 | 70 (21.5%) | 37 (19.4%) |
| $75,000 to $99,999 | 22 (6.8%) | 25 (13.1%) |
| $100,000 to $149,999 | 41 (12.6%) | 30 (15.7%) |
| $150,000 or more | 26 (8.0%) | 23 (12.0%) |
| Total | 326 (100.0%) | 191 (100.0%) |
Property Value to Household Income Ratio in Carrabelle
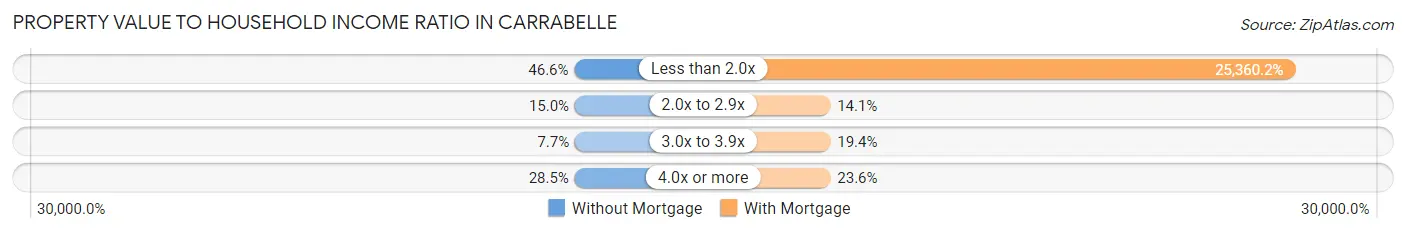
| Value-to-Income Ratio | Without Mortgage | With Mortgage |
| Less than 2.0x | 152 (46.6%) | 48,438 (25,360.2%) |
| 2.0x to 2.9x | 49 (15.0%) | 27 (14.1%) |
| 3.0x to 3.9x | 25 (7.7%) | 37 (19.4%) |
| 4.0x or more | 93 (28.5%) | 45 (23.6%) |
| Total | 326 (100.0%) | 191 (100.0%) |
Real Estate Taxes by Mortgage Status in Carrabelle
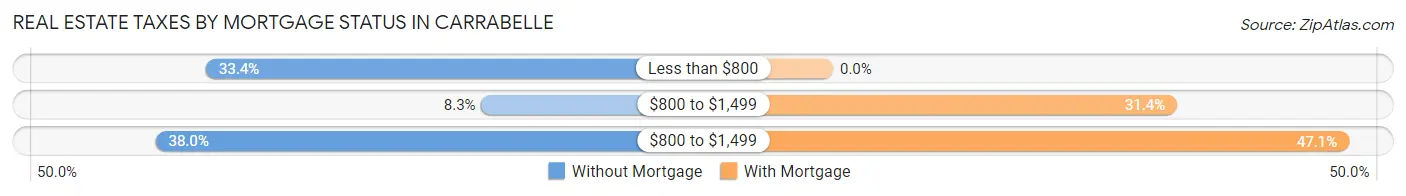
| Property Taxes | Without Mortgage | With Mortgage |
| Less than $800 | 109 (33.4%) | 0 (0.0%) |
| $800 to $1,499 | 27 (8.3%) | 60 (31.4%) |
| $800 to $1,499 | 124 (38.0%) | 90 (47.1%) |
| Total | 326 (100.0%) | 191 (100.0%) |
Health & Disability in Carrabelle
Health Insurance Coverage by Age in Carrabelle
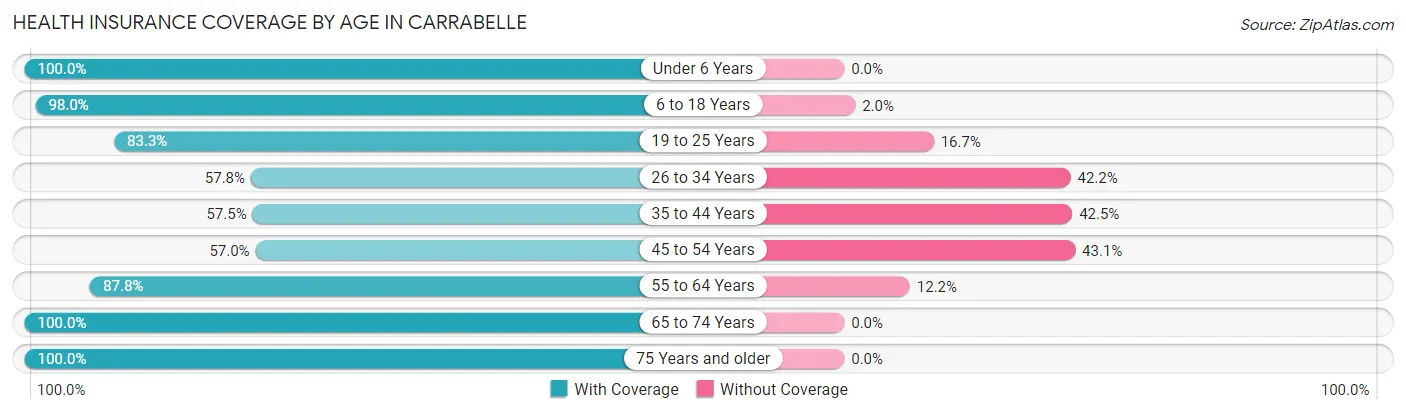
| Age Bracket | With Coverage | Without Coverage |
| Under 6 Years | 111 (100.0%) | 0 (0.0%) |
| 6 to 18 Years | 337 (98.0%) | 7 (2.0%) |
| 19 to 25 Years | 160 (83.3%) | 32 (16.7%) |
| 26 to 34 Years | 74 (57.8%) | 54 (42.2%) |
| 35 to 44 Years | 46 (57.5%) | 34 (42.5%) |
| 45 to 54 Years | 86 (57.0%) | 65 (43.0%) |
| 55 to 64 Years | 201 (87.8%) | 28 (12.2%) |
| 65 to 74 Years | 361 (100.0%) | 0 (0.0%) |
| 75 Years and older | 131 (100.0%) | 0 (0.0%) |
| Total | 1,507 (87.3%) | 220 (12.7%) |
Health Insurance Coverage by Citizenship Status in Carrabelle
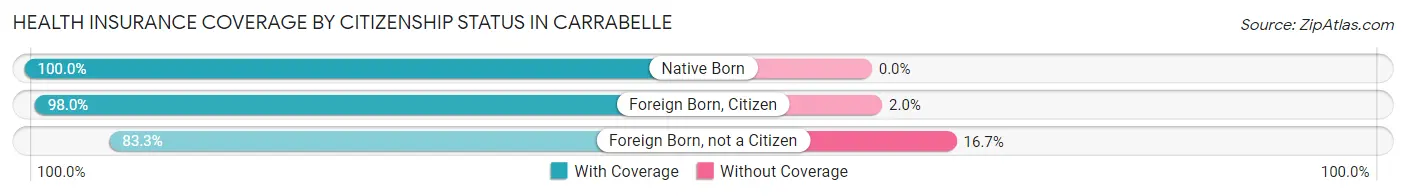
| Citizenship Status | With Coverage | Without Coverage |
| Native Born | 111 (100.0%) | 0 (0.0%) |
| Foreign Born, Citizen | 337 (98.0%) | 7 (2.0%) |
| Foreign Born, not a Citizen | 160 (83.3%) | 32 (16.7%) |
Health Insurance Coverage by Household Income in Carrabelle
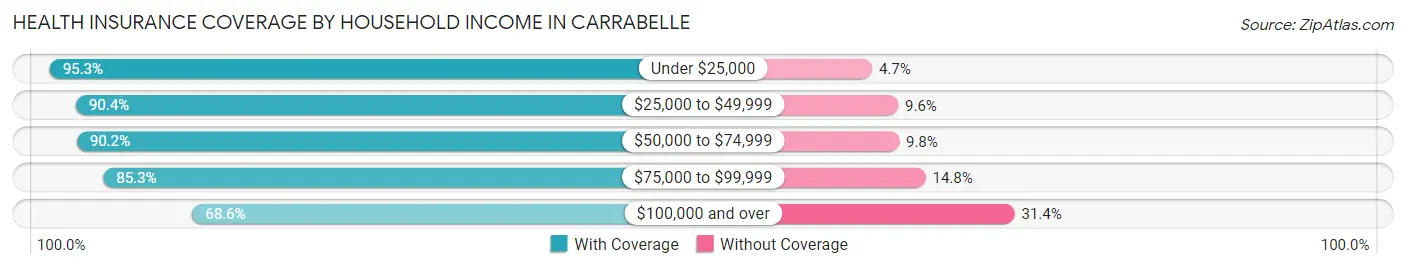
| Household Income | With Coverage | Without Coverage |
| Under $25,000 | 546 (95.3%) | 27 (4.7%) |
| $25,000 to $49,999 | 329 (90.4%) | 35 (9.6%) |
| $50,000 to $74,999 | 258 (90.2%) | 28 (9.8%) |
| $75,000 to $99,999 | 156 (85.3%) | 27 (14.7%) |
| $100,000 and over | 216 (68.6%) | 99 (31.4%) |
Public vs Private Health Insurance Coverage by Age in Carrabelle
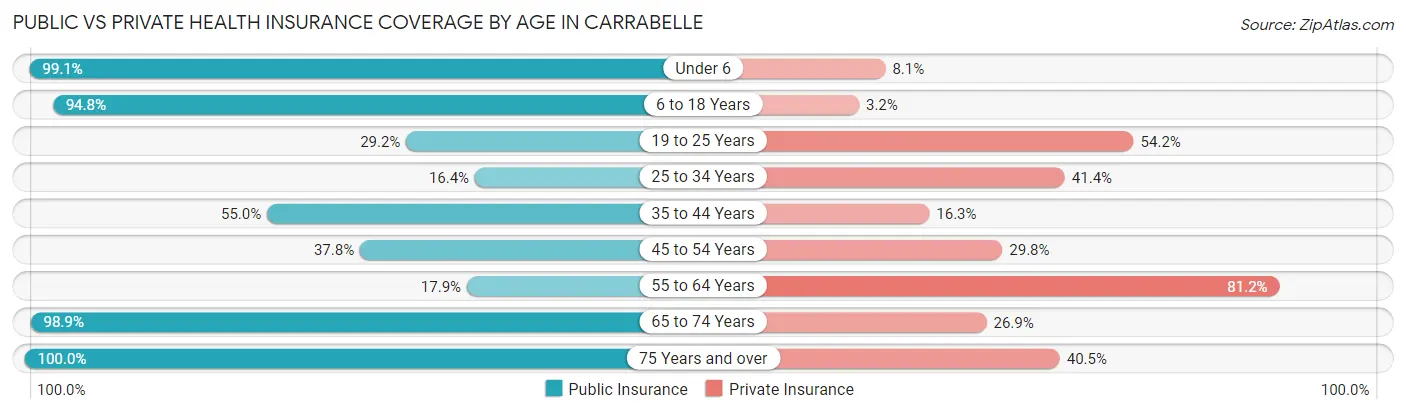
| Age Bracket | Public Insurance | Private Insurance |
| Under 6 | 110 (99.1%) | 9 (8.1%) |
| 6 to 18 Years | 326 (94.8%) | 11 (3.2%) |
| 19 to 25 Years | 56 (29.2%) | 104 (54.2%) |
| 25 to 34 Years | 21 (16.4%) | 53 (41.4%) |
| 35 to 44 Years | 44 (55.0%) | 13 (16.3%) |
| 45 to 54 Years | 57 (37.8%) | 45 (29.8%) |
| 55 to 64 Years | 41 (17.9%) | 186 (81.2%) |
| 65 to 74 Years | 357 (98.9%) | 97 (26.9%) |
| 75 Years and over | 131 (100.0%) | 53 (40.5%) |
| Total | 1,143 (66.2%) | 571 (33.1%) |
Disability Status by Sex by Age in Carrabelle
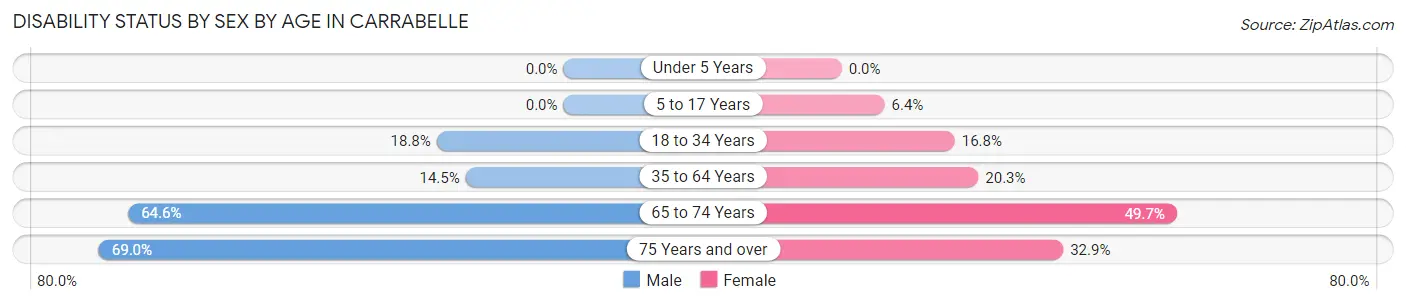
| Age Bracket | Male | Female |
| Under 5 Years | 0 (0.0%) | 0 (0.0%) |
| 5 to 17 Years | 0 (0.0%) | 11 (6.4%) |
| 18 to 34 Years | 35 (18.8%) | 25 (16.8%) |
| 35 to 64 Years | 26 (14.5%) | 57 (20.3%) |
| 65 to 74 Years | 115 (64.6%) | 91 (49.7%) |
| 75 Years and over | 40 (69.0%) | 24 (32.9%) |
Disability Class by Sex by Age in Carrabelle
Disability Class: Hearing Difficulty
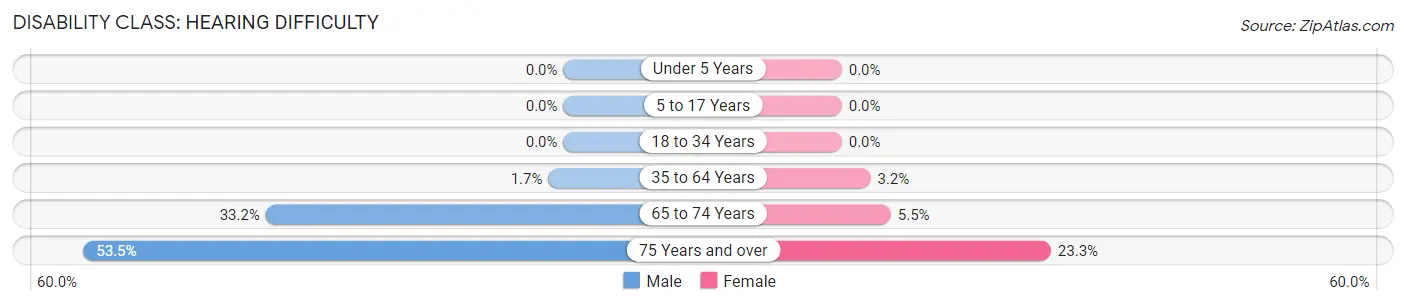
| Age Bracket | Male | Female |
| Under 5 Years | 0 (0.0%) | 0 (0.0%) |
| 5 to 17 Years | 0 (0.0%) | 0 (0.0%) |
| 18 to 34 Years | 0 (0.0%) | 0 (0.0%) |
| 35 to 64 Years | 3 (1.7%) | 9 (3.2%) |
| 65 to 74 Years | 59 (33.2%) | 10 (5.5%) |
| 75 Years and over | 31 (53.4%) | 17 (23.3%) |
Disability Class: Vision Difficulty
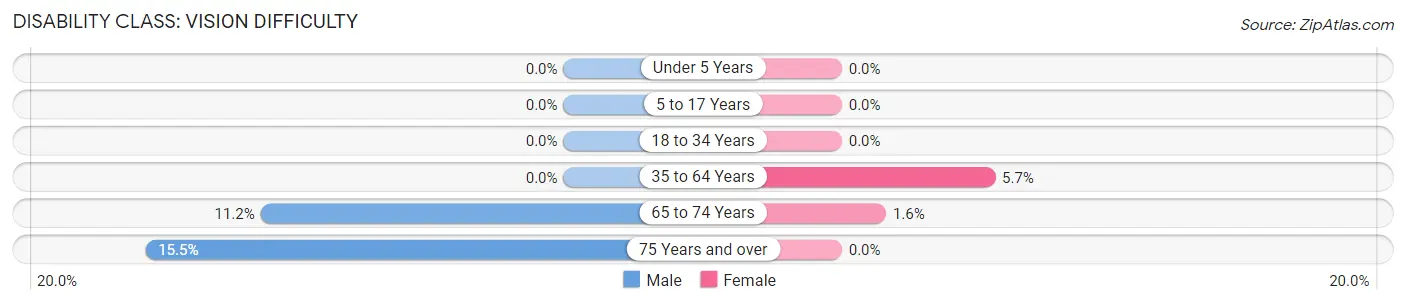
| Age Bracket | Male | Female |
| Under 5 Years | 0 (0.0%) | 0 (0.0%) |
| 5 to 17 Years | 0 (0.0%) | 0 (0.0%) |
| 18 to 34 Years | 0 (0.0%) | 0 (0.0%) |
| 35 to 64 Years | 0 (0.0%) | 16 (5.7%) |
| 65 to 74 Years | 20 (11.2%) | 3 (1.6%) |
| 75 Years and over | 9 (15.5%) | 0 (0.0%) |
Disability Class: Cognitive Difficulty
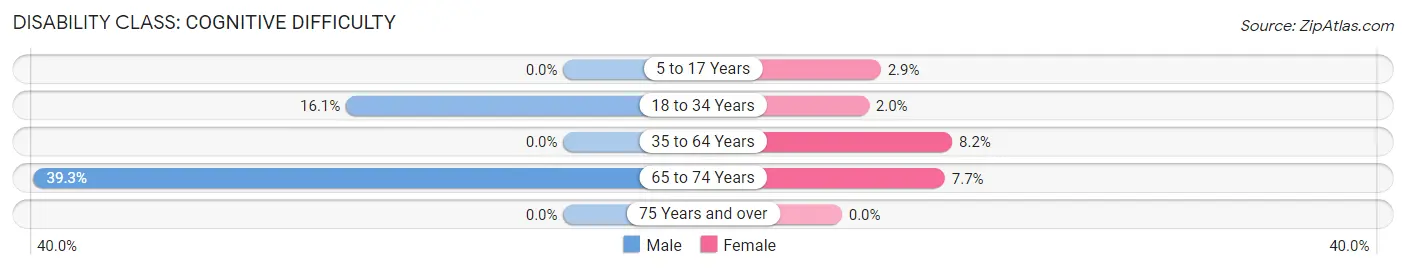
| Age Bracket | Male | Female |
| 5 to 17 Years | 0 (0.0%) | 5 (2.9%) |
| 18 to 34 Years | 30 (16.1%) | 3 (2.0%) |
| 35 to 64 Years | 0 (0.0%) | 23 (8.2%) |
| 65 to 74 Years | 70 (39.3%) | 14 (7.6%) |
| 75 Years and over | 0 (0.0%) | 0 (0.0%) |
Disability Class: Ambulatory Difficulty
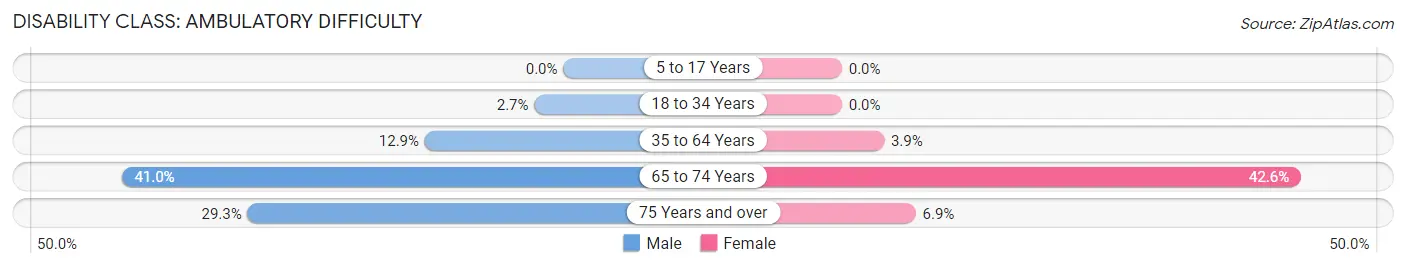
| Age Bracket | Male | Female |
| 5 to 17 Years | 0 (0.0%) | 0 (0.0%) |
| 18 to 34 Years | 5 (2.7%) | 0 (0.0%) |
| 35 to 64 Years | 23 (12.9%) | 11 (3.9%) |
| 65 to 74 Years | 73 (41.0%) | 78 (42.6%) |
| 75 Years and over | 17 (29.3%) | 5 (6.9%) |
Disability Class: Self-Care Difficulty
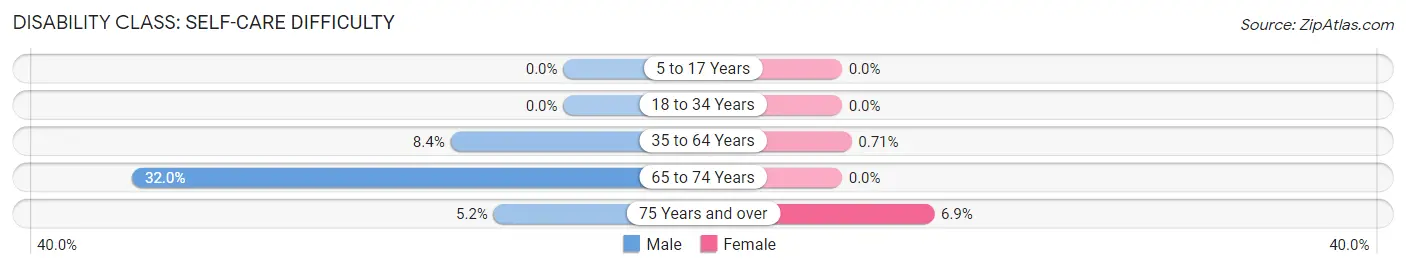
| Age Bracket | Male | Female |
| 5 to 17 Years | 0 (0.0%) | 0 (0.0%) |
| 18 to 34 Years | 0 (0.0%) | 0 (0.0%) |
| 35 to 64 Years | 15 (8.4%) | 2 (0.7%) |
| 65 to 74 Years | 57 (32.0%) | 0 (0.0%) |
| 75 Years and over | 3 (5.2%) | 5 (6.9%) |
Technology Access in Carrabelle
Computing Device Access in Carrabelle
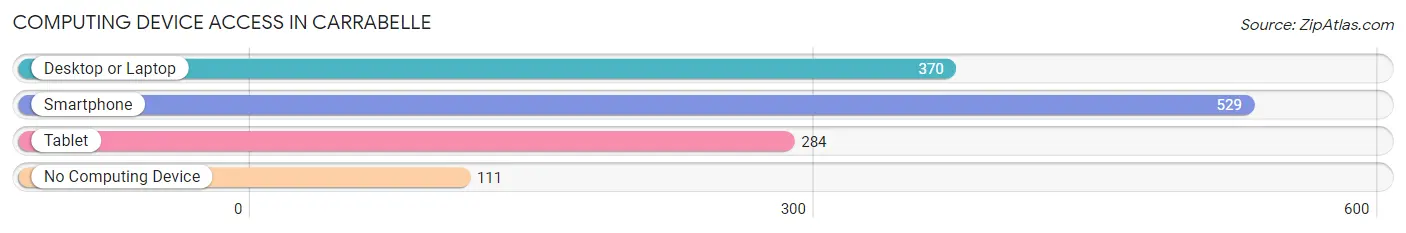
| Device Type | # Households | % Households |
| Desktop or Laptop | 370 | 52.9% |
| Smartphone | 529 | 75.7% |
| Tablet | 284 | 40.6% |
| No Computing Device | 111 | 15.9% |
| Total | 699 | 100.0% |
Internet Access in Carrabelle
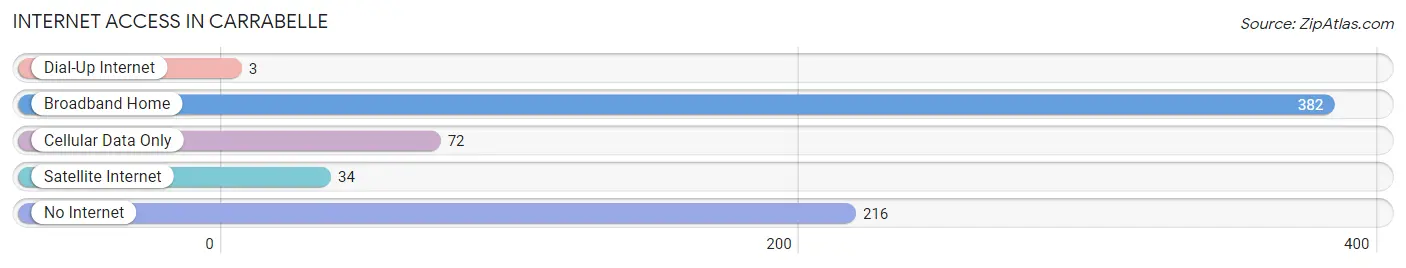
| Internet Type | # Households | % Households |
| Dial-Up Internet | 3 | 0.4% |
| Broadband Home | 382 | 54.6% |
| Cellular Data Only | 72 | 10.3% |
| Satellite Internet | 34 | 4.9% |
| No Internet | 216 | 30.9% |
| Total | 699 | 100.0% |
Carrabelle Summary
Carrabelle is a small city located in Franklin County, Florida, United States. It is situated on the Gulf of Mexico, about 30 miles south of Tallahassee. The city has a population of 2,778 as of the 2010 census.
History
Carrabelle was founded in 1882 by William Carrabelle, a former Confederate soldier. The city was originally known as Carrabelle City, but the name was changed to Carrabelle in 1885. The city was incorporated in 1895.
Carrabelle was a major port for the lumber industry in the late 19th and early 20th centuries. The city was also a major center for the fishing industry, with many of the local fishermen supplying seafood to the nearby cities of Apalachicola and St. Marks.
In the early 20th century, Carrabelle was a popular tourist destination, with many visitors coming to the city to enjoy the beaches and fishing. The city was also home to a number of resorts, including the Carrabelle Beach Hotel, which was built in 1912.
In the 1950s, Carrabelle began to decline as the lumber and fishing industries declined. The city was also hit hard by Hurricane Eloise in 1975, which caused extensive damage to the city.
Geography
Carrabelle is located in Franklin County, Florida, on the Gulf of Mexico. The city is situated on the Carrabelle River, which flows into the Gulf of Mexico. The city is bordered by the Apalachicola National Forest to the north and the St. Marks National Wildlife Refuge to the south.
The city has a total area of 4.2 square miles, of which 4.1 square miles is land and 0.1 square miles is water.
Economy
Carrabelle’s economy is largely based on tourism and fishing. The city is home to several marinas, which provide access to the Gulf of Mexico for fishing and recreational activities. The city is also home to several restaurants, hotels, and other tourist attractions.
The city is also home to a number of manufacturing and industrial businesses, including a paper mill and a seafood processing plant.
Demographics
As of the 2010 census, there were 2,778 people, 1,093 households, and 717 families residing in the city. The population density was 668.3 people per square mile. There were 1,269 housing units at an average density of 308.3 per square mile.
The racial makeup of the city was 79.2% White, 17.2% African American, 0.3% Native American, 0.7% Asian, 0.1% Pacific Islander, 1.2% from other races, and 1.3% from two or more races. Hispanic or Latino of any race were 3.2% of the population.
There were 1,093 households, out of which 28.2% had children under the age of 18 living with them, 44.2% were married couples living together, 16.2% had a female householder with no husband present, and 34.2% were non-families. 28.2% of all households were made up of individuals, and 11.7% had someone living alone who was 65 years of age or older. The average household size was 2.50 and the average family size was 3.03.
In the city, the population was spread out, with 25.2% under the age of 18, 8.2% from 18 to 24, 25.2% from 25 to 44, 25.2% from 45 to 64, and 16.2% who were 65 years of age or older. The median age was 38 years. For every 100 females, there were 94.2 males. For every 100 females age 18 and over, there were 91.2 males.
The median income for a household in the city was $30,938, and the median income for a family was $35,625. Males had a median income of $27,500 versus $20,000 for females. The per capita income for the city was $15,945. About 14.2% of families and 17.2% of the population were below the poverty line, including 22.2% of those under age 18 and 14.2% of those age 65 or over.
Common Questions
What is Per Capita Income in Carrabelle?
Per Capita income in Carrabelle is $13,858.
What is the Median Family Income in Carrabelle?
Median Family Income in Carrabelle is $46,989.
What is the Median Household income in Carrabelle?
Median Household Income in Carrabelle is $41,563.
What is Income or Wage Gap in Carrabelle?
Income or Wage Gap in Carrabelle is 11.5%.
Women in Carrabelle earn 88.5 cents for every dollar earned by a man.
What is Inequality or Gini Index in Carrabelle?
Inequality or Gini Index in Carrabelle is 0.49.
What is the Total Population of Carrabelle?
Total Population of Carrabelle is 3,151.
What is the Total Male Population of Carrabelle?
Total Male Population of Carrabelle is 2,217.
What is the Total Female Population of Carrabelle?
Total Female Population of Carrabelle is 934.
What is the Ratio of Males per 100 Females in Carrabelle?
There are 237.37 Males per 100 Females in Carrabelle.
What is the Ratio of Females per 100 Males in Carrabelle?
There are 42.13 Females per 100 Males in Carrabelle.
What is the Median Population Age in Carrabelle?
Median Population Age in Carrabelle is 36.1 Years.
What is the Average Family Size in Carrabelle
Average Family Size in Carrabelle is 3.2 People.
What is the Average Household Size in Carrabelle
Average Household Size in Carrabelle is 2.5 People.
How Large is the Labor Force in Carrabelle?
There are 642 People in the Labor Forcein in Carrabelle.
What is the Percentage of People in the Labor Force in Carrabelle?
23.6% of People are in the Labor Force in Carrabelle.
What is the Unemployment Rate in Carrabelle?
Unemployment Rate in Carrabelle is 9.7%.