Cape Canaveral, FL Map & Demographics
Cape Canaveral Map
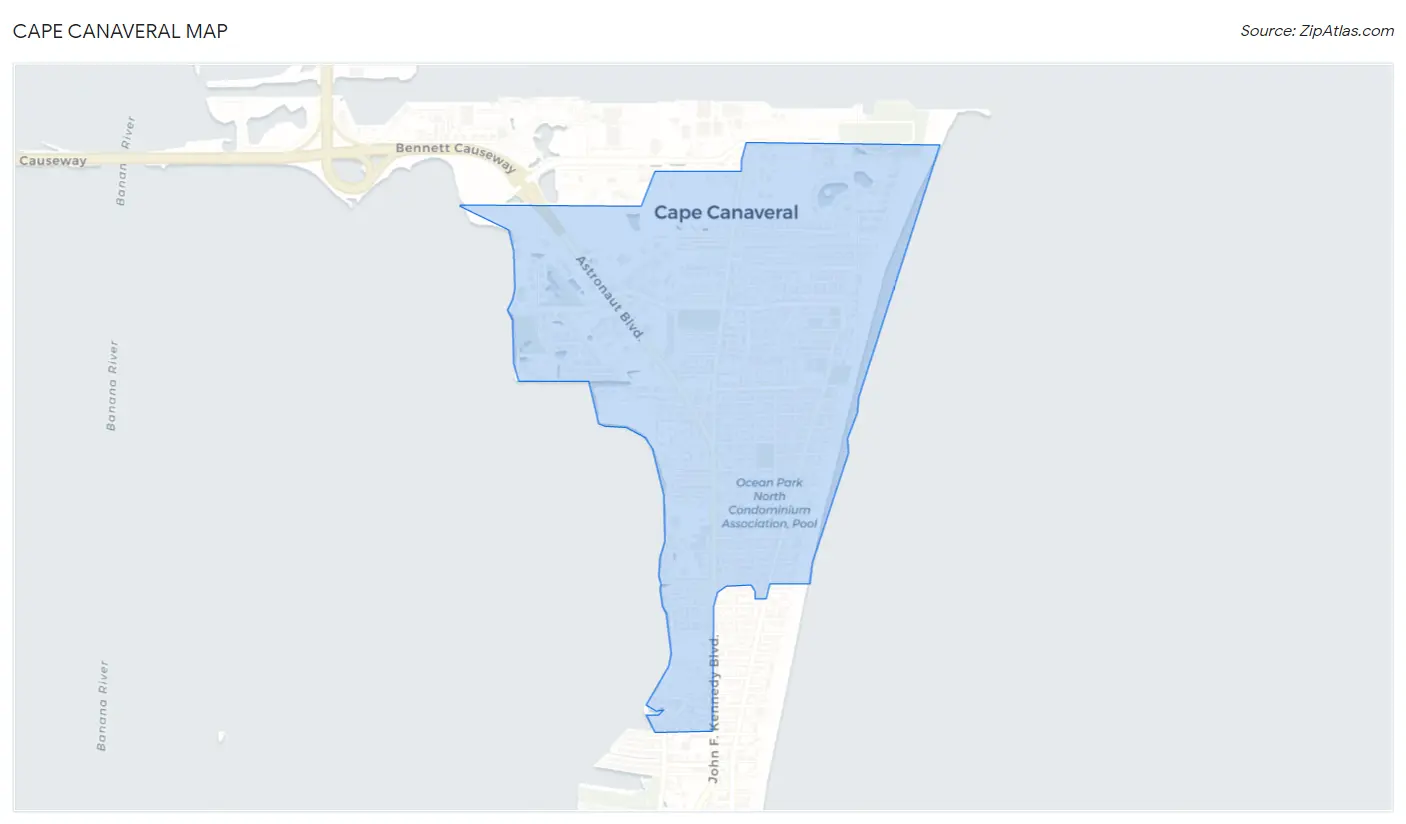
Cape Canaveral Overview
$50,214
PER CAPITA INCOME
$86,014
AVG FAMILY INCOME
$68,495
AVG HOUSEHOLD INCOME
15.1%
WAGE / INCOME GAP [ % ]
84.9¢/ $1
WAGE / INCOME GAP [ $ ]
$12,486
FAMILY INCOME DEFICIT
0.42
INEQUALITY / GINI INDEX
9,980
TOTAL POPULATION
5,205
MALE POPULATION
4,775
FEMALE POPULATION
109.01
MALES / 100 FEMALES
91.74
FEMALES / 100 MALES
59.0
MEDIAN AGE
2.3
AVG FAMILY SIZE
1.7
AVG HOUSEHOLD SIZE
5,380
LABOR FORCE [ PEOPLE ]
57.1%
PERCENT IN LABOR FORCE
2.9%
UNEMPLOYMENT RATE
Cape Canaveral Zip Codes
Cape Canaveral Area Codes
Income in Cape Canaveral
Income Overview in Cape Canaveral
Per Capita Income in Cape Canaveral is $50,214, while median incomes of families and households are $86,014 and $68,495 respectively.
| Characteristic | Number | Measure |
| Per Capita Income | 9,980 | $50,214 |
| Median Family Income | 2,490 | $86,014 |
| Mean Family Income | 2,490 | $111,660 |
| Median Household Income | 5,776 | $68,495 |
| Mean Household Income | 5,776 | $85,617 |
| Income Deficit | 2,490 | $12,486 |
| Wage / Income Gap (%) | 9,980 | 15.08% |
| Wage / Income Gap ($) | 9,980 | 84.92¢ per $1 |
| Gini / Inequality Index | 9,980 | 0.42 |
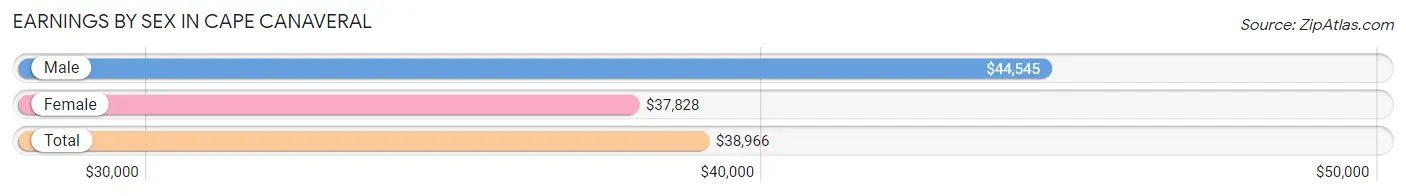
Earnings by Sex in Cape Canaveral
Average Earnings in Cape Canaveral are $38,966, $44,545 for men and $37,828 for women, a difference of 15.1%.
| Sex | Number | Average Earnings |
| Male | 3,126 (55.2%) | $44,545 |
| Female | 2,536 (44.8%) | $37,828 |
| Total | 5,662 (100.0%) | $38,966 |
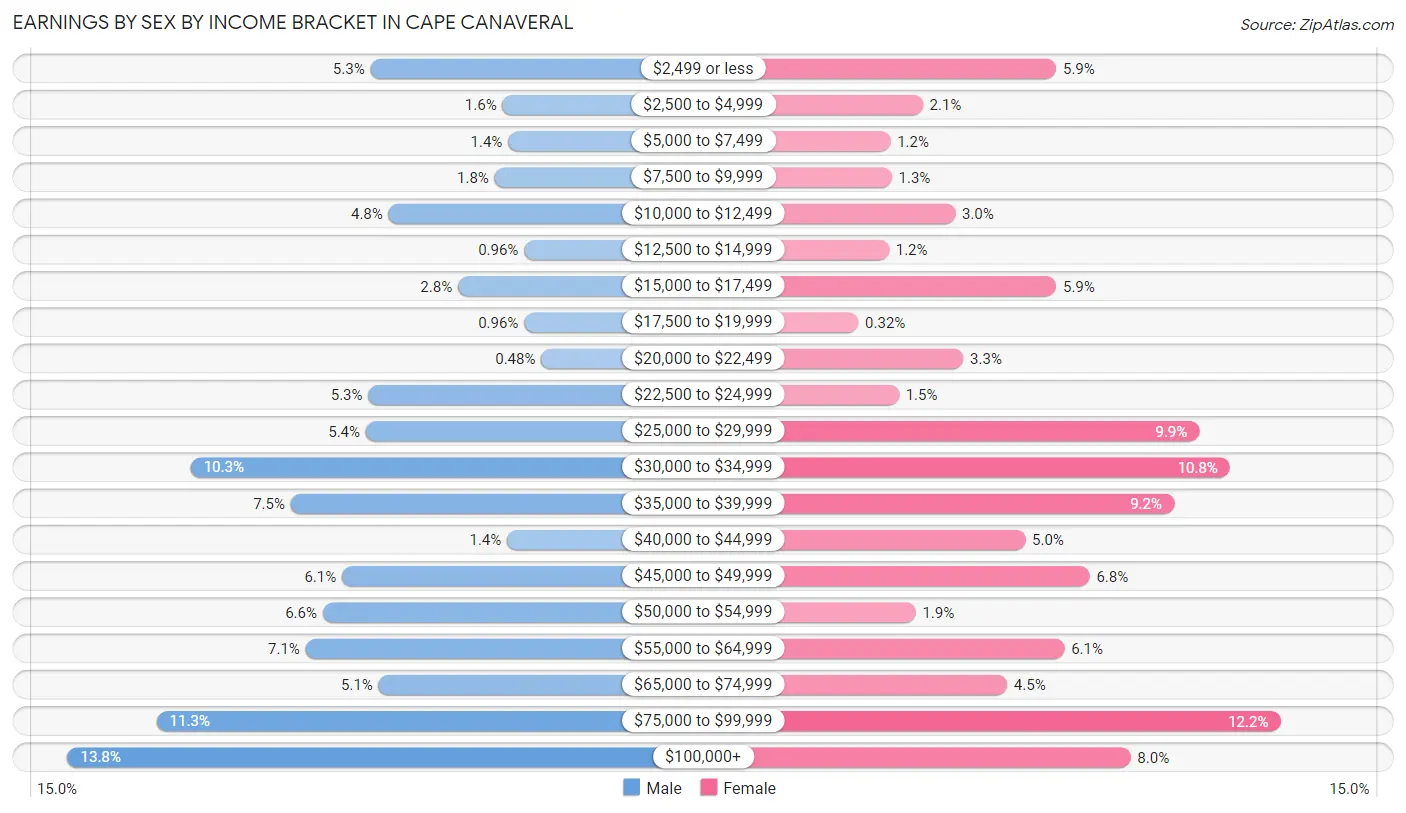
Earnings by Sex by Income Bracket in Cape Canaveral
The most common earnings brackets in Cape Canaveral are $100,000+ for men (431 | 13.8%) and $75,000 to $99,999 for women (309 | 12.2%).
| Income | Male | Female |
| $2,499 or less | 165 (5.3%) | 149 (5.9%) |
| $2,500 to $4,999 | 49 (1.6%) | 54 (2.1%) |
| $5,000 to $7,499 | 44 (1.4%) | 31 (1.2%) |
| $7,500 to $9,999 | 56 (1.8%) | 32 (1.3%) |
| $10,000 to $12,499 | 149 (4.8%) | 77 (3.0%) |
| $12,500 to $14,999 | 30 (1.0%) | 30 (1.2%) |
| $15,000 to $17,499 | 88 (2.8%) | 149 (5.9%) |
| $17,500 to $19,999 | 30 (1.0%) | 8 (0.3%) |
| $20,000 to $22,499 | 15 (0.5%) | 83 (3.3%) |
| $22,500 to $24,999 | 167 (5.3%) | 37 (1.5%) |
| $25,000 to $29,999 | 169 (5.4%) | 251 (9.9%) |
| $30,000 to $34,999 | 323 (10.3%) | 273 (10.8%) |
| $35,000 to $39,999 | 235 (7.5%) | 233 (9.2%) |
| $40,000 to $44,999 | 45 (1.4%) | 127 (5.0%) |
| $45,000 to $49,999 | 190 (6.1%) | 173 (6.8%) |
| $50,000 to $54,999 | 207 (6.6%) | 49 (1.9%) |
| $55,000 to $64,999 | 222 (7.1%) | 155 (6.1%) |
| $65,000 to $74,999 | 158 (5.1%) | 114 (4.5%) |
| $75,000 to $99,999 | 353 (11.3%) | 309 (12.2%) |
| $100,000+ | 431 (13.8%) | 202 (8.0%) |
| Total | 3,126 (100.0%) | 2,536 (100.0%) |
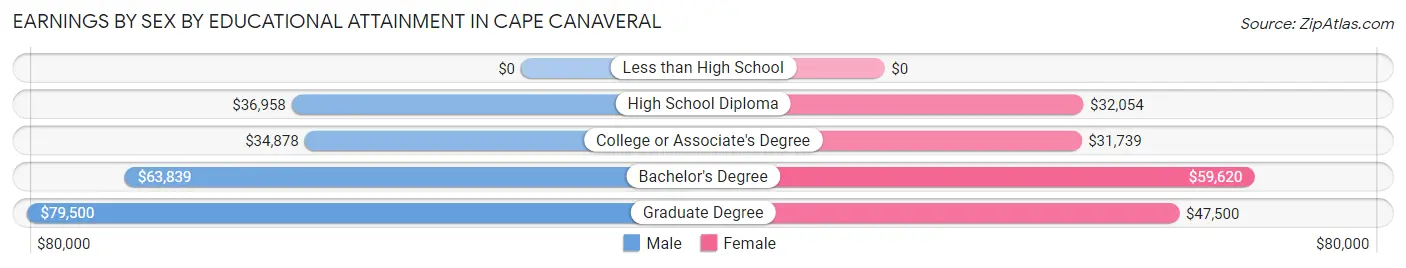
Earnings by Sex by Educational Attainment in Cape Canaveral
Average earnings in Cape Canaveral are $48,183 for men and $38,672 for women, a difference of 19.7%. Men with an educational attainment of graduate degree enjoy the highest average annual earnings of $79,500, while those with college or associate's degree education earn the least with $34,878. Women with an educational attainment of bachelor's degree earn the most with the average annual earnings of $59,620, while those with college or associate's degree education have the smallest earnings of $31,739.
| Educational Attainment | Male Income | Female Income |
| Less than High School | - | - |
| High School Diploma | $36,958 | $32,054 |
| College or Associate's Degree | $34,878 | $31,739 |
| Bachelor's Degree | $63,839 | $59,620 |
| Graduate Degree | $79,500 | $47,500 |
| Total | $48,183 | $38,672 |
Family Income in Cape Canaveral
Family Income Brackets in Cape Canaveral
According to the Cape Canaveral family income data, there are 491 families falling into the $50,000 to $74,999 income range, which is the most common income bracket and makes up 19.7% of all families. Conversely, the $15,000 to $24,999 income bracket is the least frequent group with only 20 families (0.8%) belonging to this category.
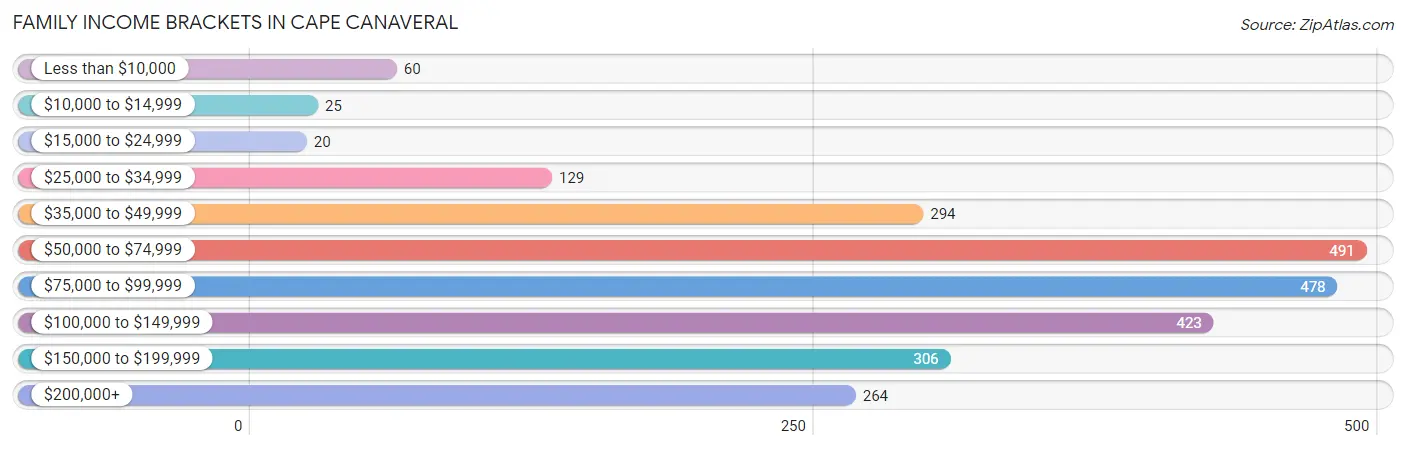
| Income Bracket | # Families | % Families |
| Less than $10,000 | 60 | 2.4% |
| $10,000 to $14,999 | 25 | 1.0% |
| $15,000 to $24,999 | 20 | 0.8% |
| $25,000 to $34,999 | 129 | 5.2% |
| $35,000 to $49,999 | 294 | 11.8% |
| $50,000 to $74,999 | 491 | 19.7% |
| $75,000 to $99,999 | 478 | 19.2% |
| $100,000 to $149,999 | 423 | 17.0% |
| $150,000 to $199,999 | 306 | 12.3% |
| $200,000+ | 264 | 10.6% |
Family Income by Famaliy Size in Cape Canaveral
4-person families (109 | 4.4%) account for the highest median family income in Cape Canaveral with $165,639 per family, while 2-person families (2,105 | 84.5%) have the highest median income of $41,952 per family member.
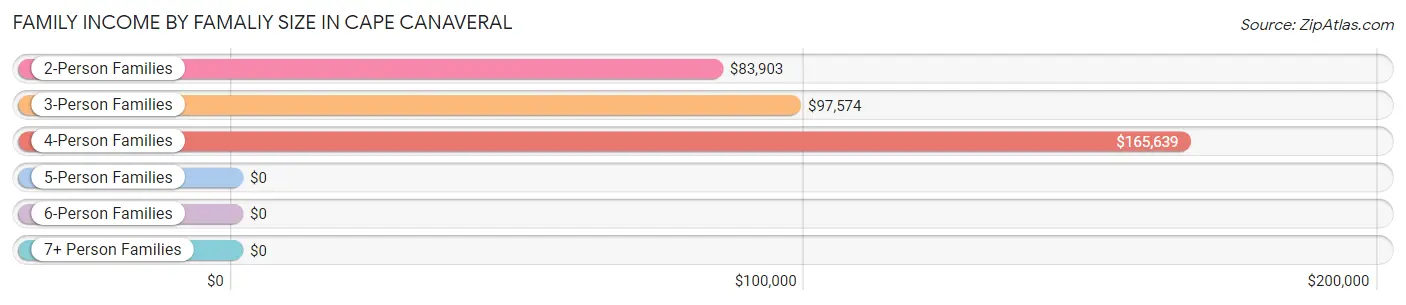
| Income Bracket | # Families | Median Income |
| 2-Person Families | 2,105 (84.5%) | $83,903 |
| 3-Person Families | 255 (10.2%) | $97,574 |
| 4-Person Families | 109 (4.4%) | $165,639 |
| 5-Person Families | 14 (0.6%) | $0 |
| 6-Person Families | 7 (0.3%) | $0 |
| 7+ Person Families | 0 (0.0%) | $0 |
| Total | 2,490 (100.0%) | $86,014 |
Family Income by Number of Earners in Cape Canaveral
The median family income in Cape Canaveral is $86,014, with families comprising 3+ earners (39) having the highest median family income of $158,482, while families with 1 earner (803) have the lowest median family income of $78,537, accounting for 1.6% and 32.3% of families, respectively.
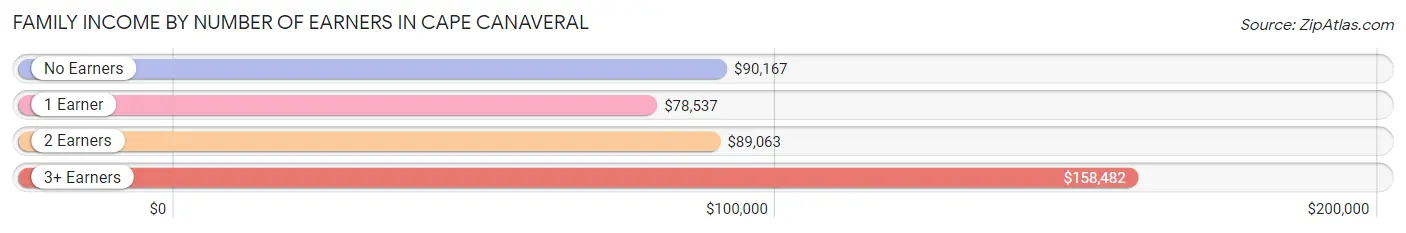
| Number of Earners | # Families | Median Income |
| No Earners | 734 (29.5%) | $90,167 |
| 1 Earner | 803 (32.3%) | $78,537 |
| 2 Earners | 914 (36.7%) | $89,063 |
| 3+ Earners | 39 (1.6%) | $158,482 |
| Total | 2,490 (100.0%) | $86,014 |
Household Income in Cape Canaveral
Household Income Brackets in Cape Canaveral
With 1,363 households falling in the category, the $50,000 to $74,999 income range is the most frequent in Cape Canaveral, accounting for 23.6% of all households. In contrast, only 110 households (1.9%) fall into the $10,000 to $14,999 income bracket, making it the least populous group.
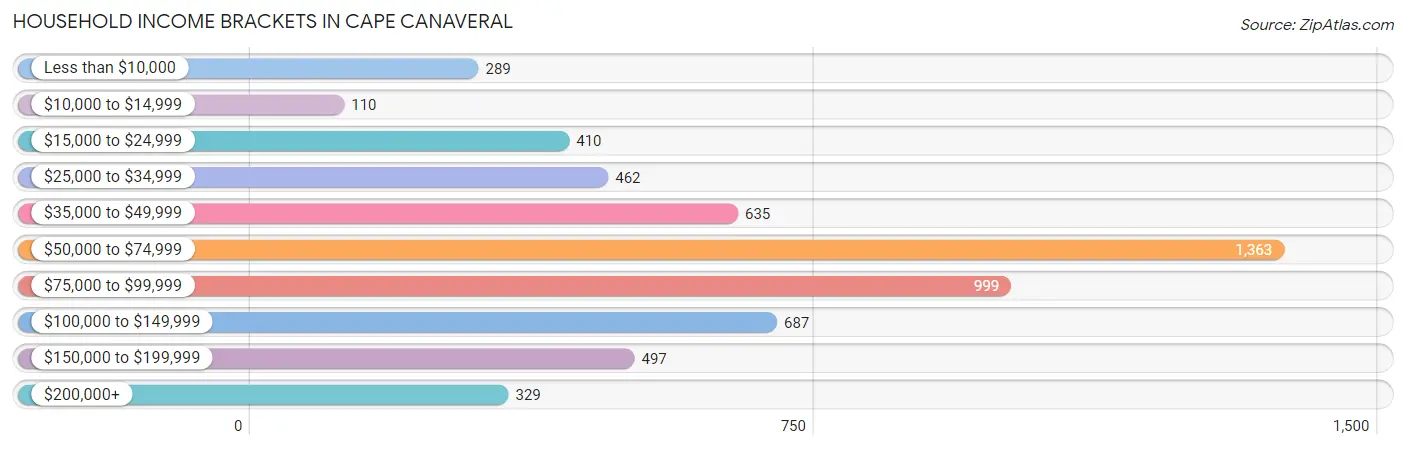
| Income Bracket | # Households | % Households |
| Less than $10,000 | 289 | 5.0% |
| $10,000 to $14,999 | 110 | 1.9% |
| $15,000 to $24,999 | 410 | 7.1% |
| $25,000 to $34,999 | 462 | 8.0% |
| $35,000 to $49,999 | 635 | 11.0% |
| $50,000 to $74,999 | 1,363 | 23.6% |
| $75,000 to $99,999 | 999 | 17.3% |
| $100,000 to $149,999 | 687 | 11.9% |
| $150,000 to $199,999 | 497 | 8.6% |
| $200,000+ | 329 | 5.7% |
Household Income by Householder Age in Cape Canaveral
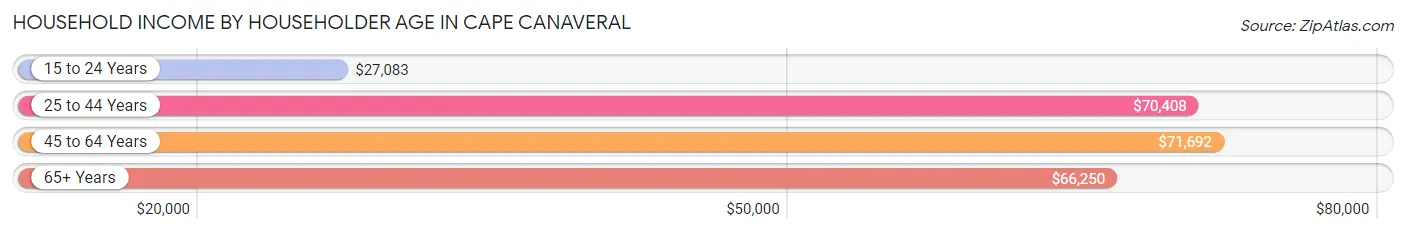
The median household income in Cape Canaveral is $68,495, with the highest median household income of $71,692 found in the 45 to 64 years age bracket for the primary householder. A total of 2,468 households (42.7%) fall into this category. Meanwhile, the 15 to 24 years age bracket for the primary householder has the lowest median household income of $27,083, with 58 households (1.0%) in this group.
| Income Bracket | # Households | Median Income |
| 15 to 24 Years | 58 (1.0%) | $27,083 |
| 25 to 44 Years | 1,015 (17.6%) | $70,408 |
| 45 to 64 Years | 2,468 (42.7%) | $71,692 |
| 65+ Years | 2,235 (38.7%) | $66,250 |
| Total | 5,776 (100.0%) | $68,495 |
Poverty in Cape Canaveral
Income Below Poverty by Sex and Age in Cape Canaveral
With 8.4% poverty level for males and 8.6% for females among the residents of Cape Canaveral, 15 year old males and 25 to 34 year old females are the most vulnerable to poverty, with 9 males (100.0%) and 65 females (22.6%) in their respective age groups living below the poverty level.
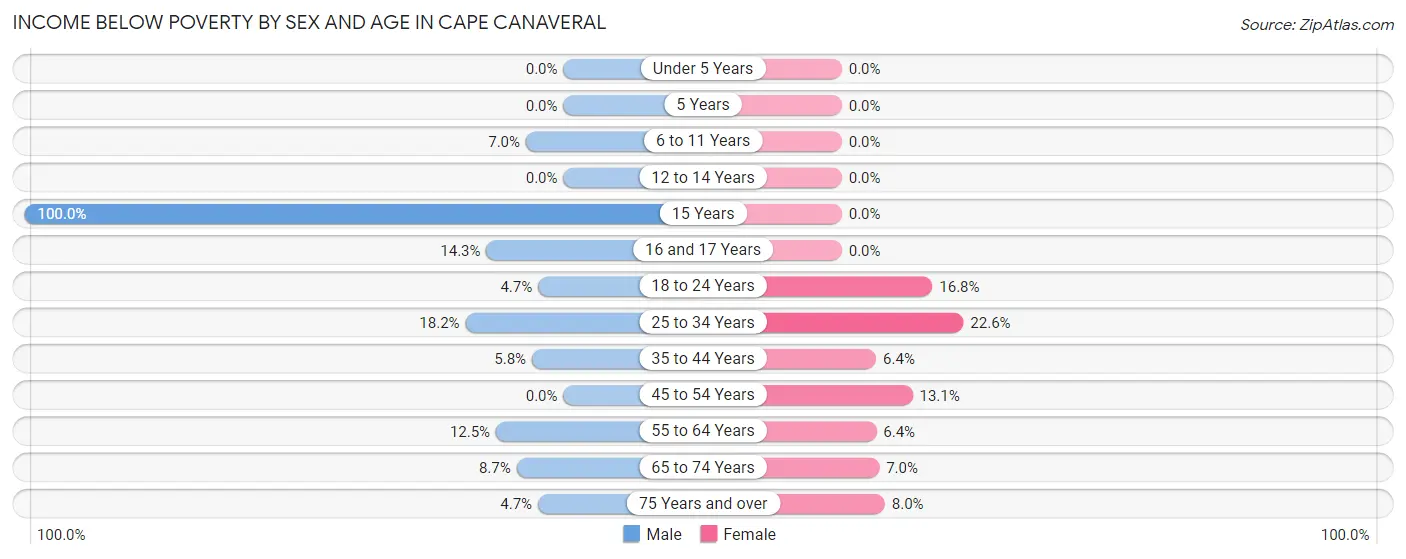
| Age Bracket | Male | Female |
| Under 5 Years | 0 (0.0%) | 0 (0.0%) |
| 5 Years | 0 (0.0%) | 0 (0.0%) |
| 6 to 11 Years | 8 (7.0%) | 0 (0.0%) |
| 12 to 14 Years | 0 (0.0%) | 0 (0.0%) |
| 15 Years | 9 (100.0%) | 0 (0.0%) |
| 16 and 17 Years | 18 (14.3%) | 0 (0.0%) |
| 18 to 24 Years | 6 (4.7%) | 20 (16.8%) |
| 25 to 34 Years | 74 (18.2%) | 65 (22.6%) |
| 35 to 44 Years | 37 (5.8%) | 31 (6.4%) |
| 45 to 54 Years | 0 (0.0%) | 81 (13.1%) |
| 55 to 64 Years | 157 (12.5%) | 91 (6.4%) |
| 65 to 74 Years | 94 (8.7%) | 61 (7.0%) |
| 75 Years and over | 33 (4.7%) | 54 (8.0%) |
| Total | 436 (8.4%) | 403 (8.6%) |
Income Above Poverty by Sex and Age in Cape Canaveral
According to the poverty statistics in Cape Canaveral, males aged under 5 years and females aged under 5 years are the age groups that are most secure financially, with 100.0% of males and 100.0% of females in these age groups living above the poverty line.
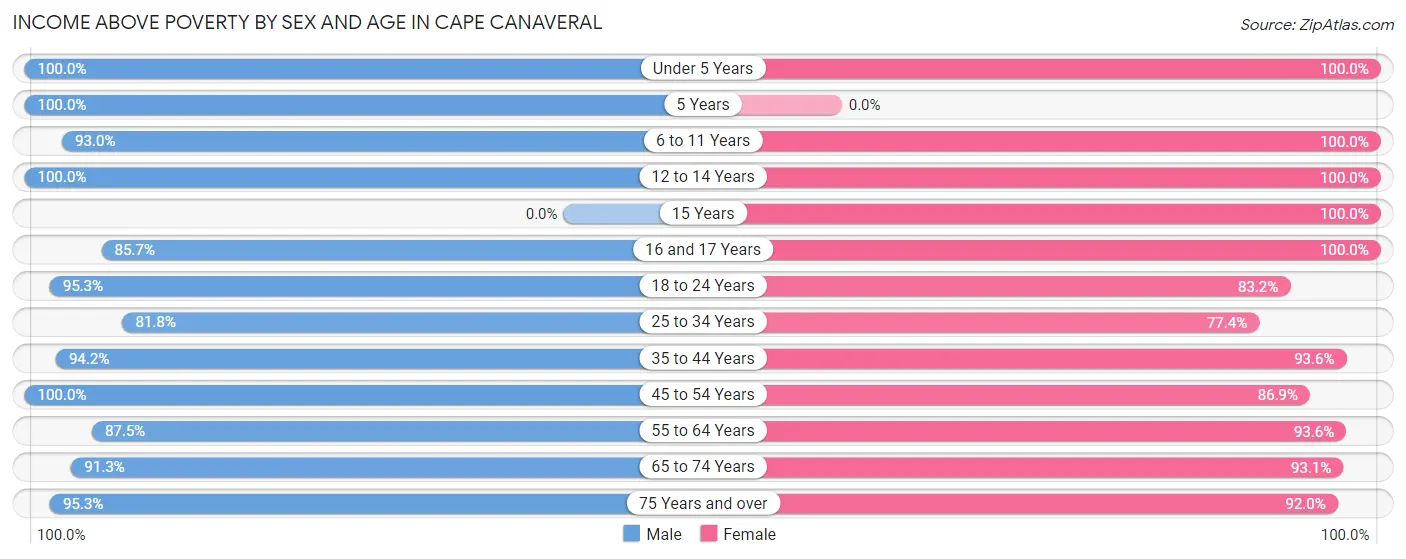
| Age Bracket | Male | Female |
| Under 5 Years | 55 (100.0%) | 82 (100.0%) |
| 5 Years | 38 (100.0%) | 0 (0.0%) |
| 6 to 11 Years | 107 (93.0%) | 103 (100.0%) |
| 12 to 14 Years | 35 (100.0%) | 12 (100.0%) |
| 15 Years | 0 (0.0%) | 14 (100.0%) |
| 16 and 17 Years | 108 (85.7%) | 20 (100.0%) |
| 18 to 24 Years | 122 (95.3%) | 99 (83.2%) |
| 25 to 34 Years | 333 (81.8%) | 223 (77.4%) |
| 35 to 44 Years | 598 (94.2%) | 455 (93.6%) |
| 45 to 54 Years | 588 (100.0%) | 536 (86.9%) |
| 55 to 64 Years | 1,098 (87.5%) | 1,327 (93.6%) |
| 65 to 74 Years | 988 (91.3%) | 817 (93.0%) |
| 75 Years and over | 666 (95.3%) | 622 (92.0%) |
| Total | 4,736 (91.6%) | 4,310 (91.4%) |
Income Below Poverty Among Married-Couple Families in Cape Canaveral
The poverty statistics for married-couple families in Cape Canaveral show that 3.4% or 67 of the total 1,951 families live below the poverty line. Families with no children have the highest poverty rate of 3.6%, comprising of 67 families. On the other hand, families with 1 or 2 children have the lowest poverty rate of 0.0%, which includes 0 families.
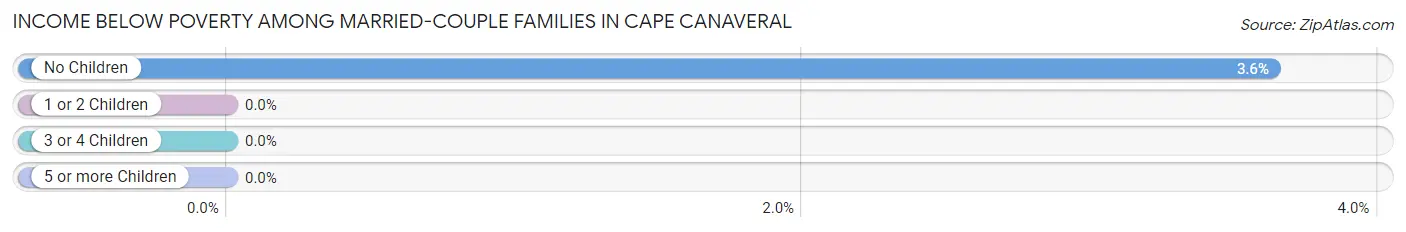
| Children | Above Poverty | Below Poverty |
| No Children | 1,779 (96.4%) | 67 (3.6%) |
| 1 or 2 Children | 98 (100.0%) | 0 (0.0%) |
| 3 or 4 Children | 7 (100.0%) | 0 (0.0%) |
| 5 or more Children | 0 (0.0%) | 0 (0.0%) |
| Total | 1,884 (96.6%) | 67 (3.4%) |
Income Below Poverty Among Single-Parent Households in Cape Canaveral
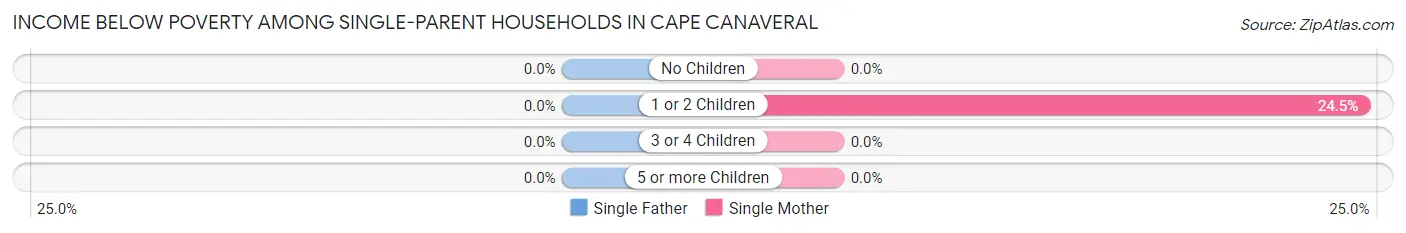
| Children | Single Father | Single Mother |
| No Children | 0 (0.0%) | 0 (0.0%) |
| 1 or 2 Children | 0 (0.0%) | 25 (24.5%) |
| 3 or 4 Children | 0 (0.0%) | 0 (0.0%) |
| 5 or more Children | 0 (0.0%) | 0 (0.0%) |
| Total | 0 (0.0%) | 25 (7.0%) |
Income Below Poverty Among Married-Couple vs Single-Parent Households in Cape Canaveral
The poverty data for Cape Canaveral shows that 67 of the married-couple family households (3.4%) and 25 of the single-parent households (4.6%) are living below the poverty level. Within the married-couple family households, those with no children have the highest poverty rate, with 67 households (3.6%) falling below the poverty line. Among the single-parent households, those with 1 or 2 children have the highest poverty rate, with 25 household (11.2%) living below poverty.
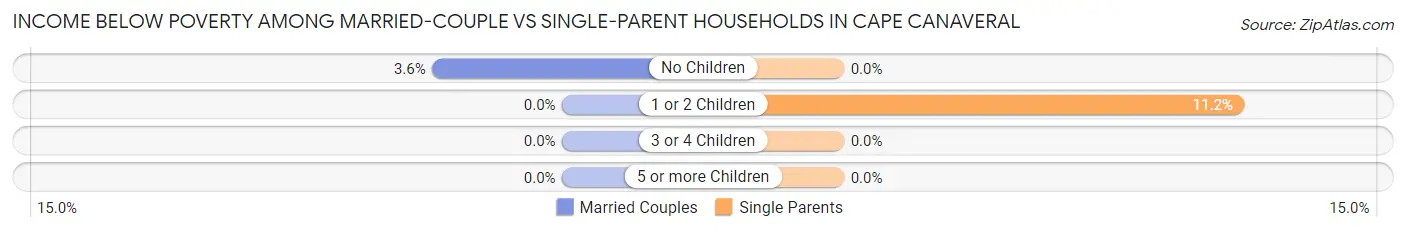
| Children | Married-Couple Families | Single-Parent Households |
| No Children | 67 (3.6%) | 0 (0.0%) |
| 1 or 2 Children | 0 (0.0%) | 25 (11.2%) |
| 3 or 4 Children | 0 (0.0%) | 0 (0.0%) |
| 5 or more Children | 0 (0.0%) | 0 (0.0%) |
| Total | 67 (3.4%) | 25 (4.6%) |
Race in Cape Canaveral
The most populous races in Cape Canaveral are White / Caucasian (9,131 | 91.5%), Hispanic or Latino (763 | 7.6%), and Some other Race (385 | 3.9%).
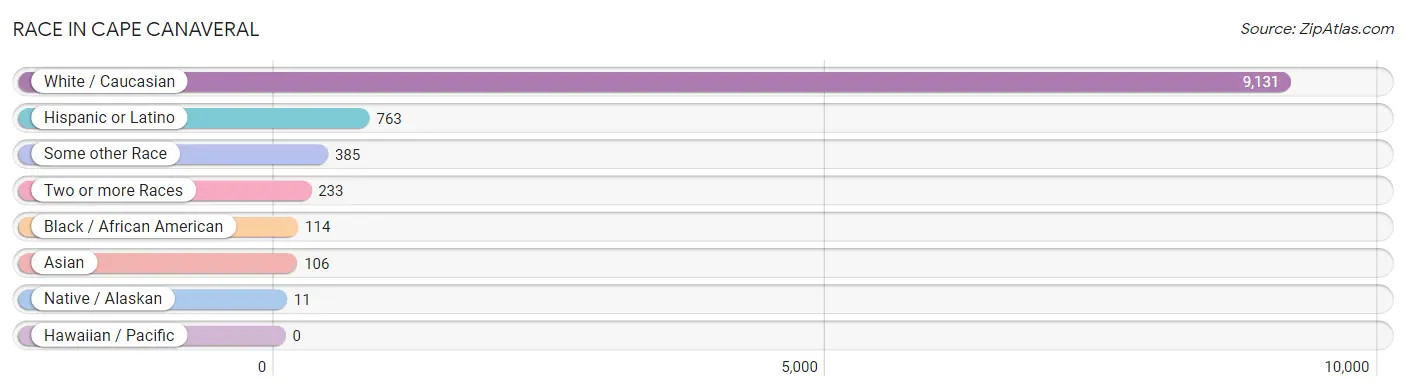
| Race | # Population | % Population |
| Asian | 106 | 1.1% |
| Black / African American | 114 | 1.1% |
| Hawaiian / Pacific | 0 | 0.0% |
| Hispanic or Latino | 763 | 7.6% |
| Native / Alaskan | 11 | 0.1% |
| White / Caucasian | 9,131 | 91.5% |
| Two or more Races | 233 | 2.3% |
| Some other Race | 385 | 3.9% |
| Total | 9,980 | 100.0% |
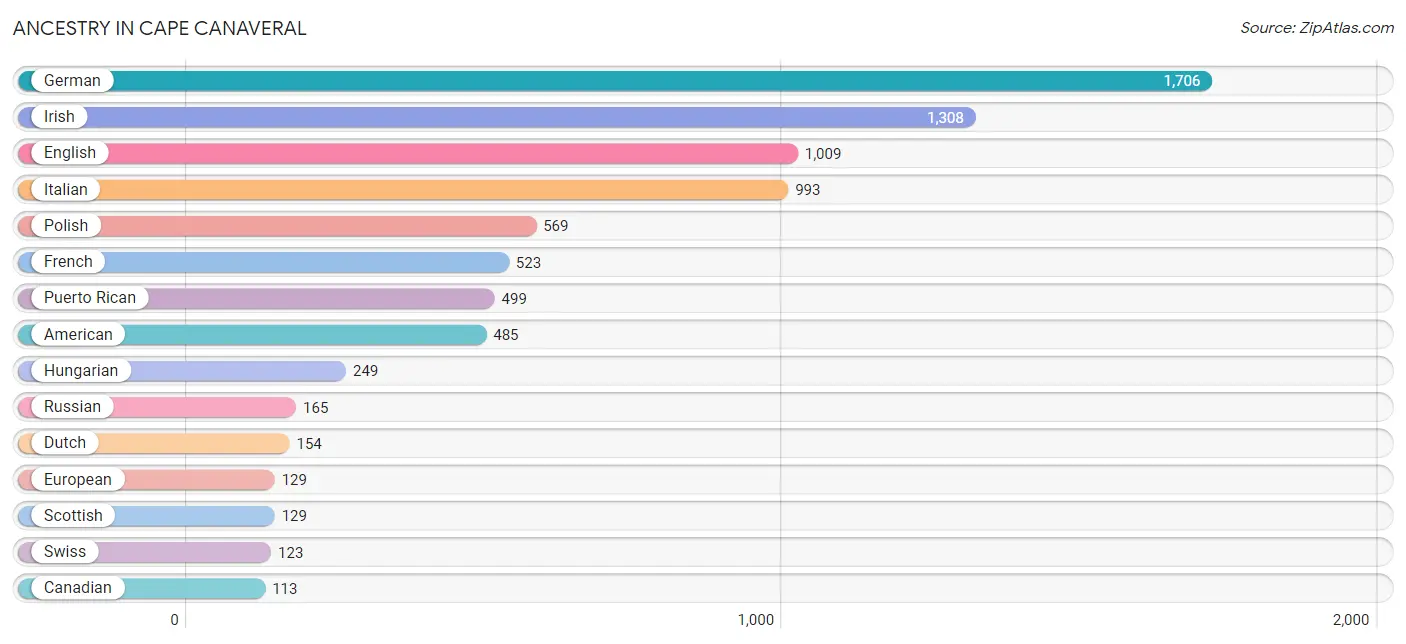
Ancestry in Cape Canaveral
The most populous ancestries reported in Cape Canaveral are German (1,706 | 17.1%), Irish (1,308 | 13.1%), English (1,009 | 10.1%), Italian (993 | 10.0%), and Polish (569 | 5.7%), together accounting for 56.0% of all Cape Canaveral residents.
| Ancestry | # Population | % Population |
| African | 54 | 0.5% |
| American | 485 | 4.9% |
| Arab | 24 | 0.2% |
| Austrian | 20 | 0.2% |
| Basque | 12 | 0.1% |
| Belgian | 10 | 0.1% |
| Bhutanese | 14 | 0.1% |
| Brazilian | 60 | 0.6% |
| British | 34 | 0.3% |
| Burmese | 15 | 0.2% |
| Canadian | 113 | 1.1% |
| Celtic | 15 | 0.2% |
| Central American | 20 | 0.2% |
| Colombian | 24 | 0.2% |
| Costa Rican | 20 | 0.2% |
| Creek | 11 | 0.1% |
| Croatian | 11 | 0.1% |
| Cuban | 53 | 0.5% |
| Czech | 17 | 0.2% |
| Czechoslovakian | 15 | 0.2% |
| Danish | 61 | 0.6% |
| Dutch | 154 | 1.5% |
| Eastern European | 22 | 0.2% |
| Ecuadorian | 12 | 0.1% |
| English | 1,009 | 10.1% |
| European | 129 | 1.3% |
| Finnish | 12 | 0.1% |
| French | 523 | 5.2% |
| French Canadian | 108 | 1.1% |
| German | 1,706 | 17.1% |
| Greek | 18 | 0.2% |
| Haitian | 11 | 0.1% |
| Hungarian | 249 | 2.5% |
| Indian (Asian) | 26 | 0.3% |
| Irish | 1,308 | 13.1% |
| Italian | 993 | 10.0% |
| Jamaican | 31 | 0.3% |
| Korean | 36 | 0.4% |
| Lebanese | 24 | 0.2% |
| Lithuanian | 40 | 0.4% |
| Maltese | 13 | 0.1% |
| Mexican | 93 | 0.9% |
| Norwegian | 40 | 0.4% |
| Pennsylvania German | 25 | 0.3% |
| Polish | 569 | 5.7% |
| Portuguese | 32 | 0.3% |
| Puerto Rican | 499 | 5.0% |
| Russian | 165 | 1.7% |
| Scandinavian | 25 | 0.3% |
| Scotch-Irish | 88 | 0.9% |
| Scottish | 129 | 1.3% |
| Slovak | 43 | 0.4% |
| Slovene | 19 | 0.2% |
| South American | 63 | 0.6% |
| Spaniard | 12 | 0.1% |
| Spanish | 10 | 0.1% |
| Sri Lankan | 12 | 0.1% |
| Subsaharan African | 54 | 0.5% |
| Swedish | 95 | 0.9% |
| Swiss | 123 | 1.2% |
| Thai | 25 | 0.3% |
| U.S. Virgin Islander | 15 | 0.2% |
| Ukrainian | 7 | 0.1% |
| Venezuelan | 27 | 0.3% |
| Welsh | 14 | 0.1% |
| West Indian | 15 | 0.2% |
| Yugoslavian | 10 | 0.1% | View All 67 Rows |
Immigrants in Cape Canaveral
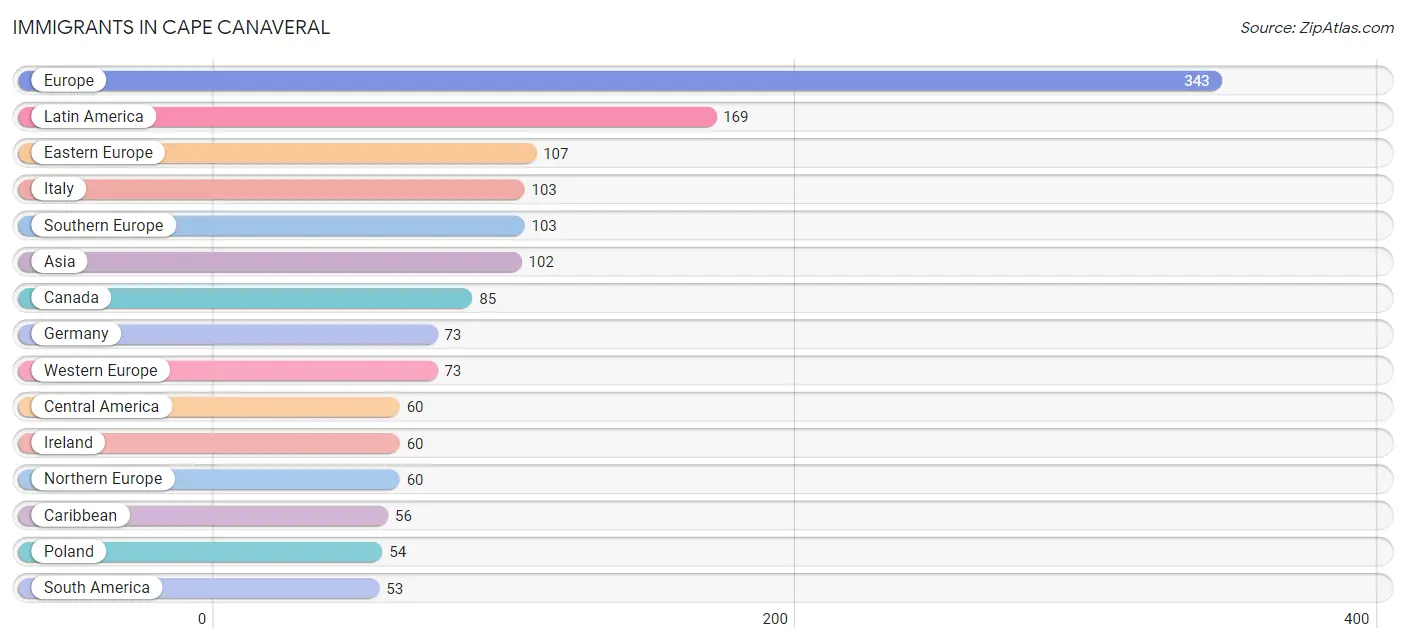
The most numerous immigrant groups reported in Cape Canaveral came from Europe (343 | 3.4%), Latin America (169 | 1.7%), Eastern Europe (107 | 1.1%), Italy (103 | 1.0%), and Southern Europe (103 | 1.0%), together accounting for 8.3% of all Cape Canaveral residents.
| Immigration Origin | # Population | % Population |
| Africa | 5 | 0.1% |
| Asia | 102 | 1.0% |
| Brazil | 29 | 0.3% |
| Canada | 85 | 0.9% |
| Caribbean | 56 | 0.6% |
| Central America | 60 | 0.6% |
| China | 20 | 0.2% |
| Colombia | 24 | 0.2% |
| Costa Rica | 20 | 0.2% |
| Cuba | 12 | 0.1% |
| Czechoslovakia | 8 | 0.1% |
| Eastern Africa | 5 | 0.1% |
| Eastern Asia | 41 | 0.4% |
| Eastern Europe | 107 | 1.1% |
| Europe | 343 | 3.4% |
| Germany | 73 | 0.7% |
| Hungary | 12 | 0.1% |
| India | 7 | 0.1% |
| Ireland | 60 | 0.6% |
| Italy | 103 | 1.0% |
| Jamaica | 44 | 0.4% |
| Japan | 6 | 0.1% |
| Korea | 15 | 0.2% |
| Latin America | 169 | 1.7% |
| Mexico | 40 | 0.4% |
| Northern Europe | 60 | 0.6% |
| Philippines | 28 | 0.3% |
| Poland | 54 | 0.5% |
| South America | 53 | 0.5% |
| South Central Asia | 21 | 0.2% |
| South Eastern Asia | 40 | 0.4% |
| Southern Europe | 103 | 1.0% |
| Uzbekistan | 14 | 0.1% |
| Vietnam | 12 | 0.1% |
| Western Europe | 73 | 0.7% | View All 35 Rows |
Sex and Age in Cape Canaveral
Sex and Age in Cape Canaveral
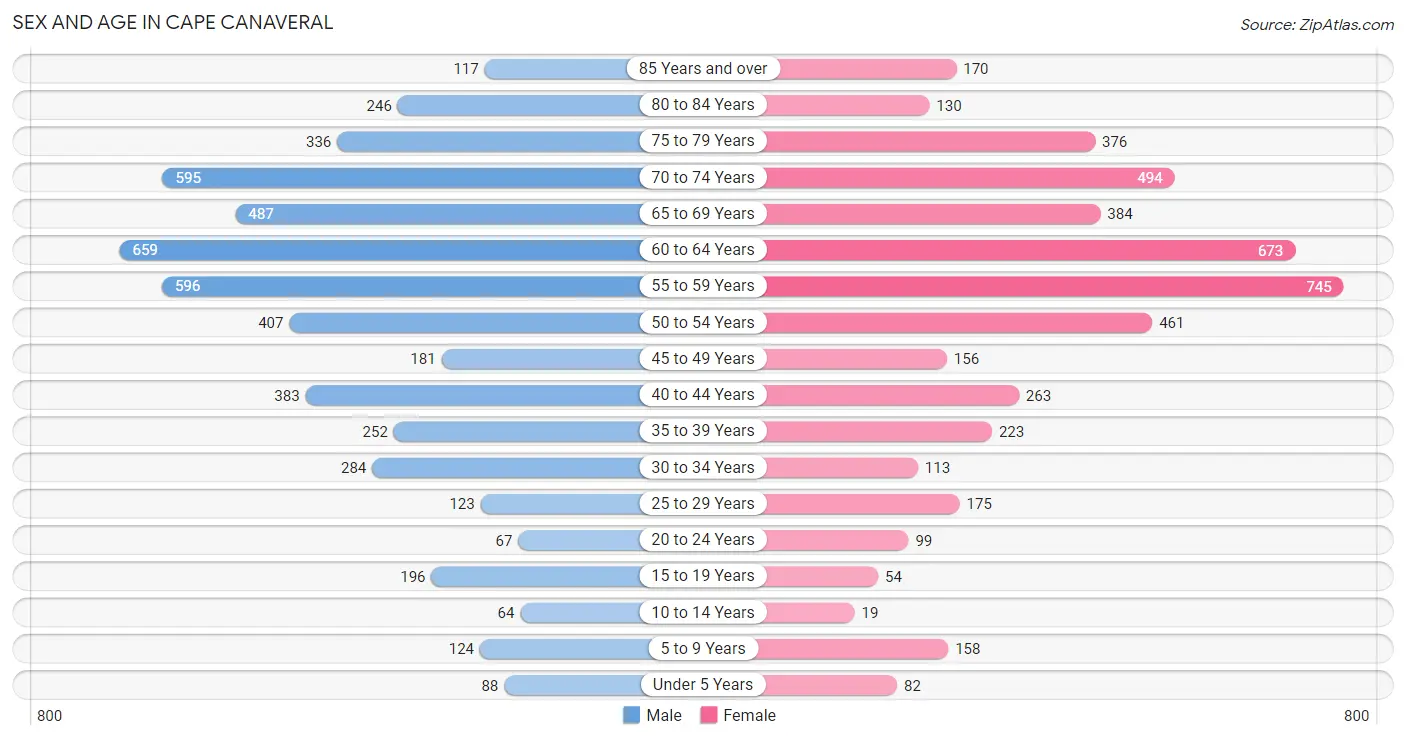
The most populous age groups in Cape Canaveral are 60 to 64 Years (659 | 12.7%) for men and 55 to 59 Years (745 | 15.6%) for women.
| Age Bracket | Male | Female |
| Under 5 Years | 88 (1.7%) | 82 (1.7%) |
| 5 to 9 Years | 124 (2.4%) | 158 (3.3%) |
| 10 to 14 Years | 64 (1.2%) | 19 (0.4%) |
| 15 to 19 Years | 196 (3.8%) | 54 (1.1%) |
| 20 to 24 Years | 67 (1.3%) | 99 (2.1%) |
| 25 to 29 Years | 123 (2.4%) | 175 (3.7%) |
| 30 to 34 Years | 284 (5.5%) | 113 (2.4%) |
| 35 to 39 Years | 252 (4.8%) | 223 (4.7%) |
| 40 to 44 Years | 383 (7.4%) | 263 (5.5%) |
| 45 to 49 Years | 181 (3.5%) | 156 (3.3%) |
| 50 to 54 Years | 407 (7.8%) | 461 (9.7%) |
| 55 to 59 Years | 596 (11.5%) | 745 (15.6%) |
| 60 to 64 Years | 659 (12.7%) | 673 (14.1%) |
| 65 to 69 Years | 487 (9.4%) | 384 (8.0%) |
| 70 to 74 Years | 595 (11.4%) | 494 (10.3%) |
| 75 to 79 Years | 336 (6.5%) | 376 (7.9%) |
| 80 to 84 Years | 246 (4.7%) | 130 (2.7%) |
| 85 Years and over | 117 (2.2%) | 170 (3.6%) |
| Total | 5,205 (100.0%) | 4,775 (100.0%) |
Families and Households in Cape Canaveral
Median Family Size in Cape Canaveral
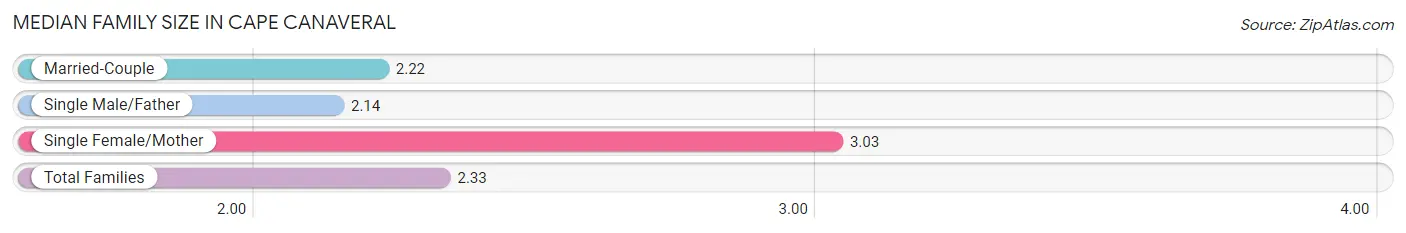
The median family size in Cape Canaveral is 2.33 persons per family, with single female/mother families (359 | 14.4%) accounting for the largest median family size of 3.03 persons per family. On the other hand, single male/father families (180 | 7.2%) represent the smallest median family size with 2.14 persons per family.
| Family Type | # Families | Family Size |
| Married-Couple | 1,951 (78.3%) | 2.22 |
| Single Male/Father | 180 (7.2%) | 2.14 |
| Single Female/Mother | 359 (14.4%) | 3.03 |
| Total Families | 2,490 (100.0%) | 2.33 |
Median Household Size in Cape Canaveral
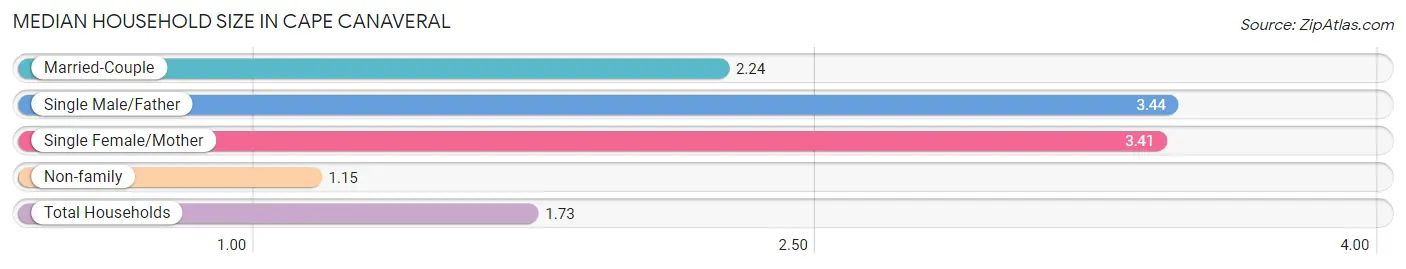
The median household size in Cape Canaveral is 1.73 persons per household, with single male/father households (180 | 3.1%) accounting for the largest median household size of 3.44 persons per household. non-family households (3,286 | 56.9%) represent the smallest median household size with 1.15 persons per household.
| Household Type | # Households | Household Size |
| Married-Couple | 1,951 (33.8%) | 2.24 |
| Single Male/Father | 180 (3.1%) | 3.44 |
| Single Female/Mother | 359 (6.2%) | 3.41 |
| Non-family | 3,286 (56.9%) | 1.15 |
| Total Households | 5,776 (100.0%) | 1.73 |
Household Size by Marriage Status in Cape Canaveral
Out of a total of 5,776 households in Cape Canaveral, 2,490 (43.1%) are family households, while 3,286 (56.9%) are nonfamily households. The most numerous type of family households are 2-person households, comprising 1,875, and the most common type of nonfamily households are 1-person households, comprising 2,852.
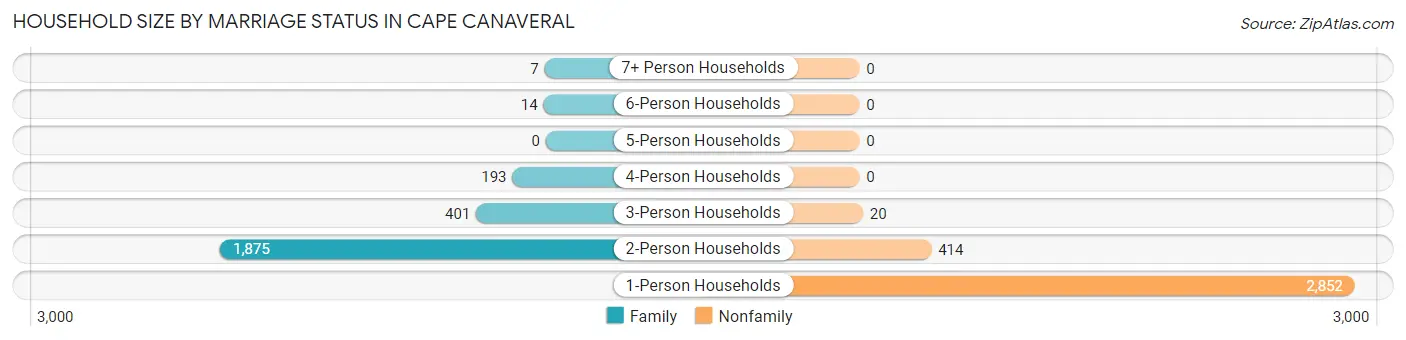
| Household Size | Family Households | Nonfamily Households |
| 1-Person Households | - | 2,852 (49.4%) |
| 2-Person Households | 1,875 (32.5%) | 414 (7.2%) |
| 3-Person Households | 401 (6.9%) | 20 (0.4%) |
| 4-Person Households | 193 (3.3%) | 0 (0.0%) |
| 5-Person Households | 0 (0.0%) | 0 (0.0%) |
| 6-Person Households | 14 (0.2%) | 0 (0.0%) |
| 7+ Person Households | 7 (0.1%) | 0 (0.0%) |
| Total | 2,490 (43.1%) | 3,286 (56.9%) |
Female Fertility in Cape Canaveral
Fertility by Age in Cape Canaveral
Average fertility rate in Cape Canaveral is 14.0 births per 1,000 women. Women in the age bracket of 35 to 50 years have the highest fertility rate with 23.0 births per 1,000 women. Women in the age bracket of 35 to 50 years acount for 100.0% of all women with births.
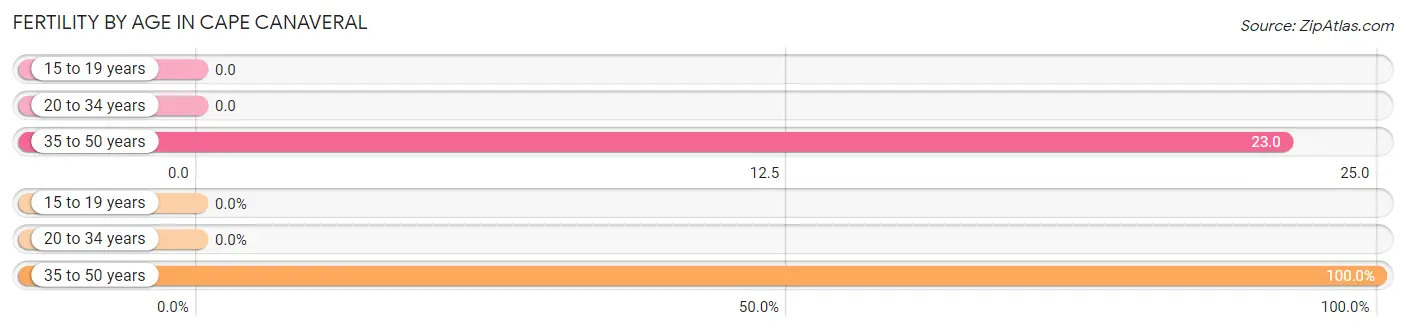
| Age Bracket | Women with Births | Births / 1,000 Women |
| 15 to 19 years | 0 (0.0%) | 0.0 |
| 20 to 34 years | 0 (0.0%) | 0.0 |
| 35 to 50 years | 15 (100.0%) | 23.0 |
| Total | 15 (100.0%) | 14.0 |
Fertility by Age by Marriage Status in Cape Canaveral
60.0% of women with births (15) in Cape Canaveral are married. The highest percentage of unmarried women with births falls into 35 to 50 years age bracket with 40.0% of them unmarried at the time of birth, while the lowest percentage of unmarried women with births belong to 35 to 50 years age bracket with 40.0% of them unmarried.
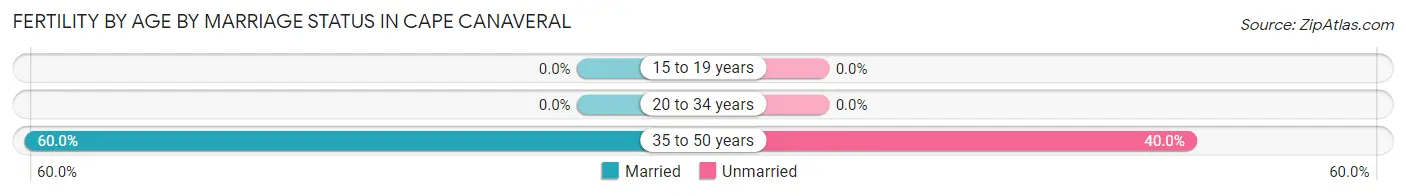
| Age Bracket | Married | Unmarried |
| 15 to 19 years | 0 (0.0%) | 0 (0.0%) |
| 20 to 34 years | 0 (0.0%) | 0 (0.0%) |
| 35 to 50 years | 9 (60.0%) | 6 (40.0%) |
| Total | 9 (60.0%) | 6 (40.0%) |
Fertility by Education in Cape Canaveral
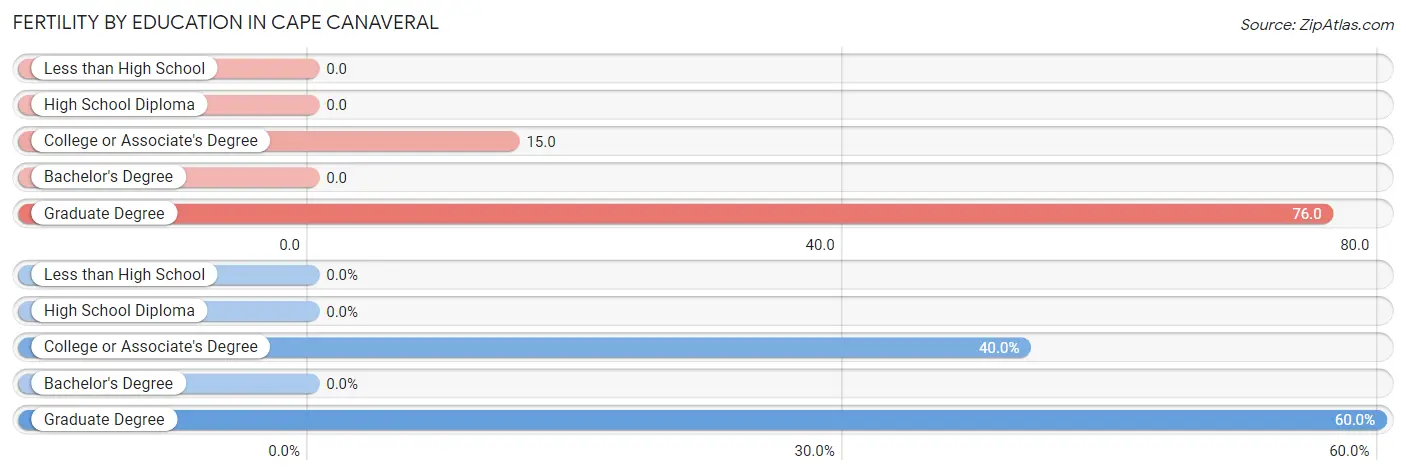
| Educational Attainment | Women with Births | Births / 1,000 Women |
| Less than High School | 0 (0.0%) | 0.0 |
| High School Diploma | 0 (0.0%) | 0.0 |
| College or Associate's Degree | 6 (40.0%) | 15.0 |
| Bachelor's Degree | 0 (0.0%) | 0.0 |
| Graduate Degree | 9 (60.0%) | 76.0 |
| Total | 15 (100.0%) | 14.0 |
Fertility by Education by Marriage Status in Cape Canaveral
40.0% of women with births in Cape Canaveral are unmarried. Women with the educational attainment of graduate degree are most likely to be married with 100.0% of them married at childbirth, while women with the educational attainment of college or associate's degree are least likely to be married with 100.0% of them unmarried at childbirth.
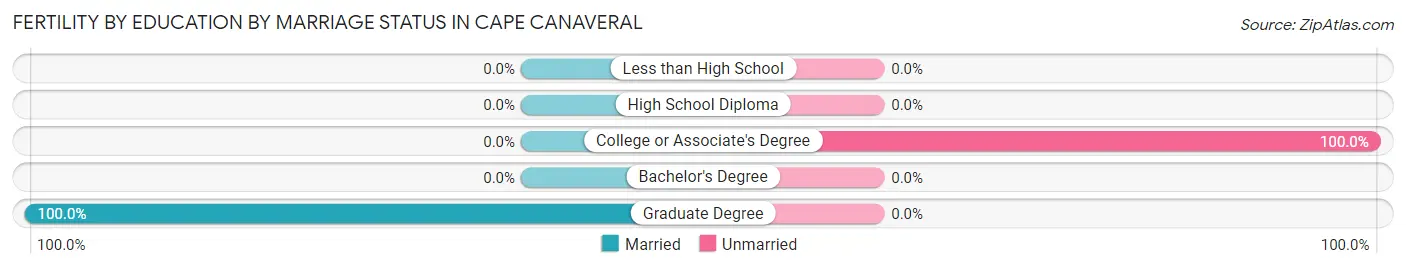
| Educational Attainment | Married | Unmarried |
| Less than High School | 0 (0.0%) | 0 (0.0%) |
| High School Diploma | 0 (0.0%) | 0 (0.0%) |
| College or Associate's Degree | 0 (0.0%) | 6 (100.0%) |
| Bachelor's Degree | 0 (0.0%) | 0 (0.0%) |
| Graduate Degree | 9 (100.0%) | 0 (0.0%) |
| Total | 9 (60.0%) | 6 (40.0%) |
Employment Characteristics in Cape Canaveral
Employment by Class of Employer in Cape Canaveral
Among the 5,114 employed individuals in Cape Canaveral, private company employees (3,114 | 60.9%), self-employed (not incorporated) (503 | 9.8%), and federal government employees (407 | 8.0%) make up the most common classes of employment.
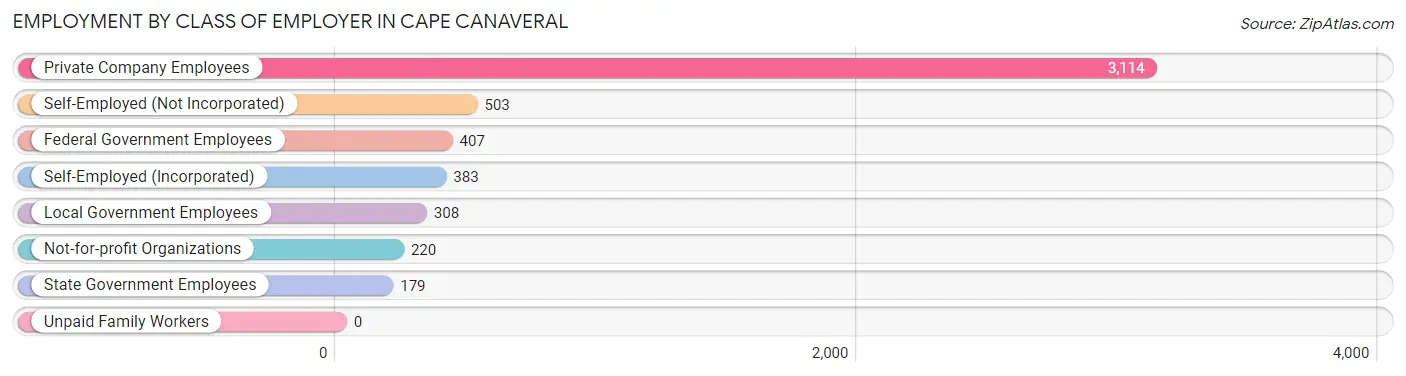
| Employer Class | # Employees | % Employees |
| Private Company Employees | 3,114 | 60.9% |
| Self-Employed (Incorporated) | 383 | 7.5% |
| Self-Employed (Not Incorporated) | 503 | 9.8% |
| Not-for-profit Organizations | 220 | 4.3% |
| Local Government Employees | 308 | 6.0% |
| State Government Employees | 179 | 3.5% |
| Federal Government Employees | 407 | 8.0% |
| Unpaid Family Workers | 0 | 0.0% |
| Total | 5,114 | 100.0% |
Employment Status by Age in Cape Canaveral
According to the labor force statistics for Cape Canaveral, out of the total population over 16 years of age (9,422), 57.1% or 5,380 individuals are in the labor force, with 2.9% or 156 of them unemployed. The age group with the highest labor force participation rate is 30 to 34 years, with 99.0% or 393 individuals in the labor force. Within the labor force, the 35 to 44 years age range has the highest percentage of unemployed individuals, with 8.6% or 87 of them being unemployed.
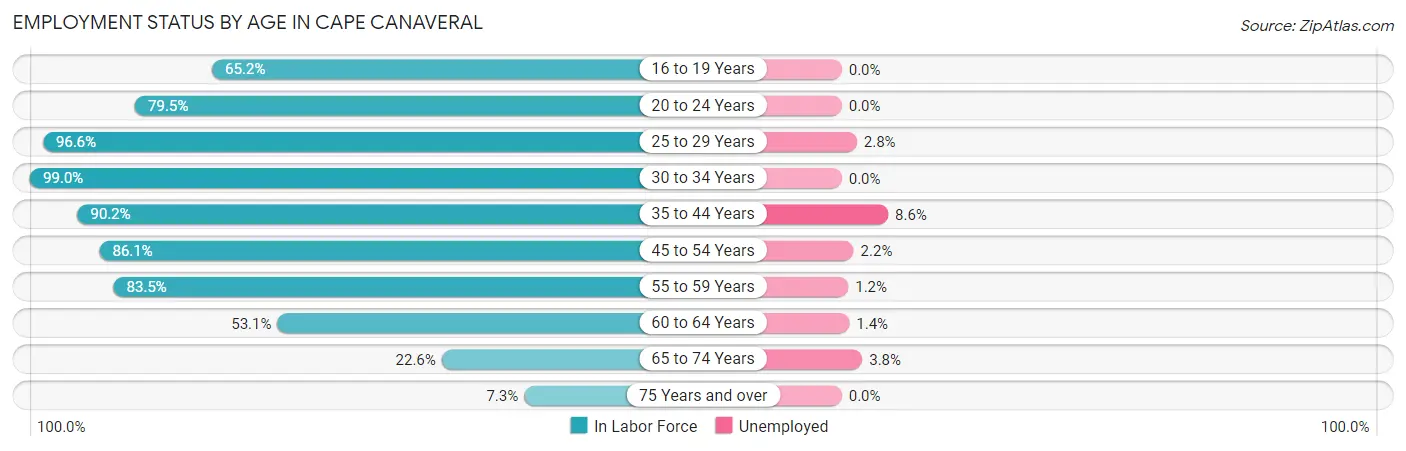
| Age Bracket | In Labor Force | Unemployed |
| 16 to 19 Years | 148 (65.2%) | 0 (0.0%) |
| 20 to 24 Years | 132 (79.5%) | 0 (0.0%) |
| 25 to 29 Years | 288 (96.6%) | 8 (2.8%) |
| 30 to 34 Years | 393 (99.0%) | 0 (0.0%) |
| 35 to 44 Years | 1,011 (90.2%) | 87 (8.6%) |
| 45 to 54 Years | 1,038 (86.1%) | 23 (2.2%) |
| 55 to 59 Years | 1,120 (83.5%) | 13 (1.2%) |
| 60 to 64 Years | 707 (53.1%) | 10 (1.4%) |
| 65 to 74 Years | 443 (22.6%) | 17 (3.8%) |
| 75 Years and over | 100 (7.3%) | 0 (0.0%) |
| Total | 5,380 (57.1%) | 156 (2.9%) |
Employment Status by Educational Attainment in Cape Canaveral
According to labor force statistics for Cape Canaveral, 80.0% of individuals (4,555) out of the total population between 25 and 64 years of age (5,694) are in the labor force, with 3.1% or 141 of them being unemployed. The group with the highest labor force participation rate are those with the educational attainment of college / associate degree, with 83.2% or 1,460 individuals in the labor force. Within the labor force, individuals with high school diploma education have the highest percentage of unemployment, with 5.7% or 75 of them being unemployed.
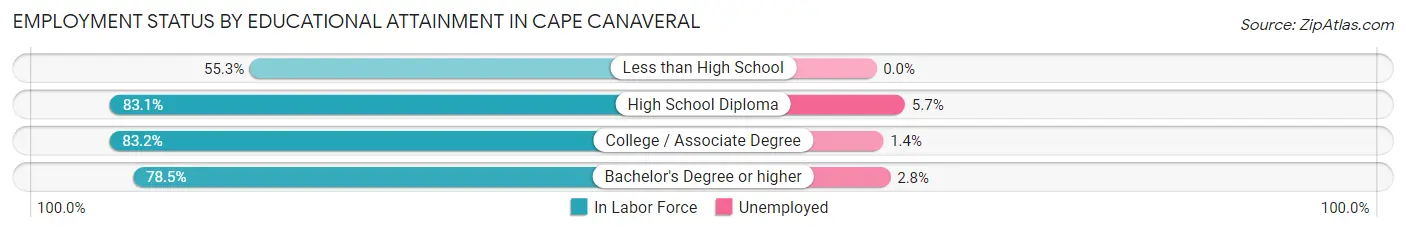
| Educational Attainment | In Labor Force | Unemployed |
| Less than High School | 167 (55.3%) | 0 (0.0%) |
| High School Diploma | 1,315 (83.1%) | 90 (5.7%) |
| College / Associate Degree | 1,460 (83.2%) | 25 (1.4%) |
| Bachelor's Degree or higher | 1,613 (78.5%) | 58 (2.8%) |
| Total | 4,555 (80.0%) | 177 (3.1%) |
Employment Occupations by Sex in Cape Canaveral
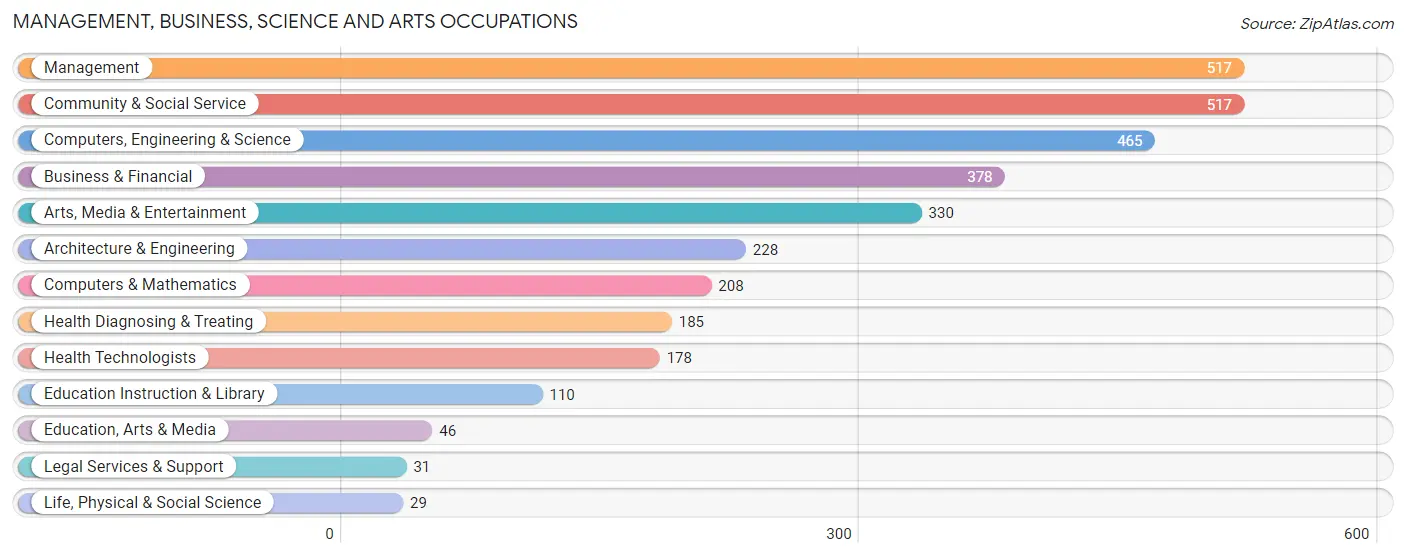
Management, Business, Science and Arts Occupations
The most common Management, Business, Science and Arts occupations in Cape Canaveral are Management (517 | 10.0%), Community & Social Service (517 | 10.0%), Computers, Engineering & Science (465 | 9.0%), Business & Financial (378 | 7.3%), and Arts, Media & Entertainment (330 | 6.4%).
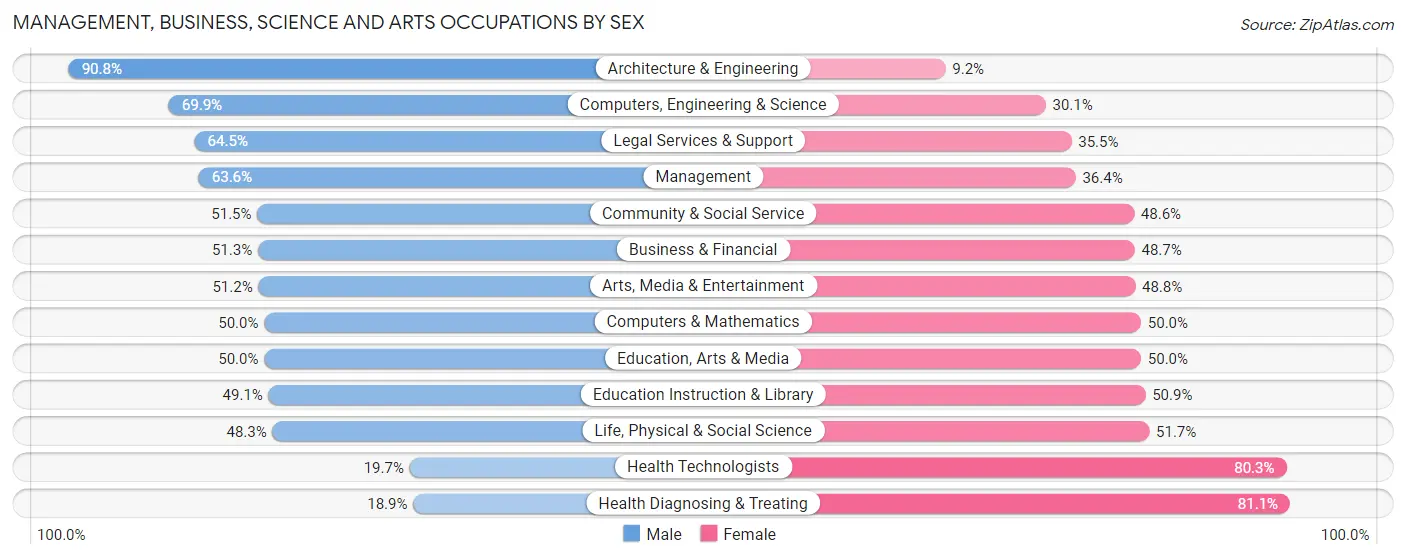
Management, Business, Science and Arts Occupations by Sex
Within the Management, Business, Science and Arts occupations in Cape Canaveral, the most male-oriented occupations are Architecture & Engineering (90.8%), Computers, Engineering & Science (69.9%), and Legal Services & Support (64.5%), while the most female-oriented occupations are Health Diagnosing & Treating (81.1%), Health Technologists (80.3%), and Life, Physical & Social Science (51.7%).
| Occupation | Male | Female |
| Management | 329 (63.6%) | 188 (36.4%) |
| Business & Financial | 194 (51.3%) | 184 (48.7%) |
| Computers, Engineering & Science | 325 (69.9%) | 140 (30.1%) |
| Computers & Mathematics | 104 (50.0%) | 104 (50.0%) |
| Architecture & Engineering | 207 (90.8%) | 21 (9.2%) |
| Life, Physical & Social Science | 14 (48.3%) | 15 (51.7%) |
| Community & Social Service | 266 (51.4%) | 251 (48.5%) |
| Education, Arts & Media | 23 (50.0%) | 23 (50.0%) |
| Legal Services & Support | 20 (64.5%) | 11 (35.5%) |
| Education Instruction & Library | 54 (49.1%) | 56 (50.9%) |
| Arts, Media & Entertainment | 169 (51.2%) | 161 (48.8%) |
| Health Diagnosing & Treating | 35 (18.9%) | 150 (81.1%) |
| Health Technologists | 35 (19.7%) | 143 (80.3%) |
| Total (Category) | 1,149 (55.7%) | 913 (44.3%) |
| Total (Overall) | 2,817 (54.3%) | 2,367 (45.7%) |
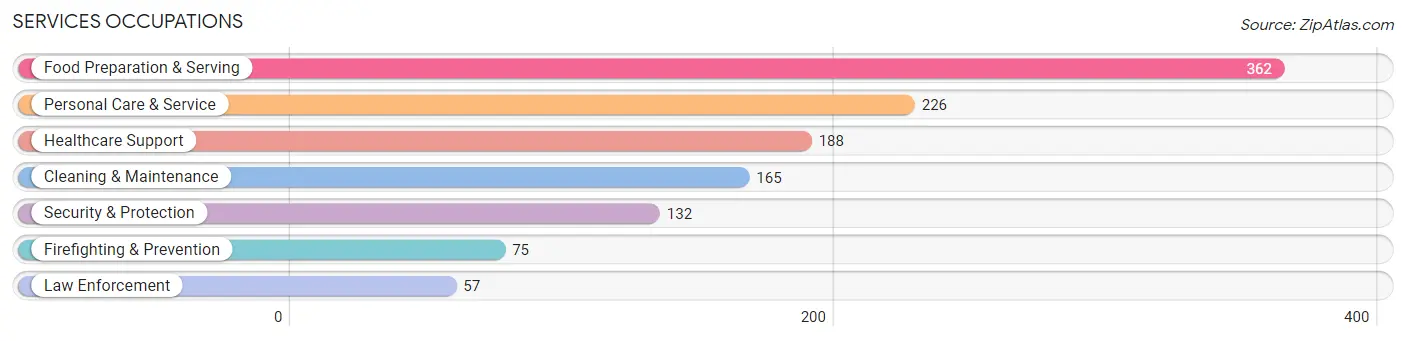
Services Occupations
The most common Services occupations in Cape Canaveral are Food Preparation & Serving (362 | 7.0%), Personal Care & Service (226 | 4.4%), Healthcare Support (188 | 3.6%), Cleaning & Maintenance (165 | 3.2%), and Security & Protection (132 | 2.5%).
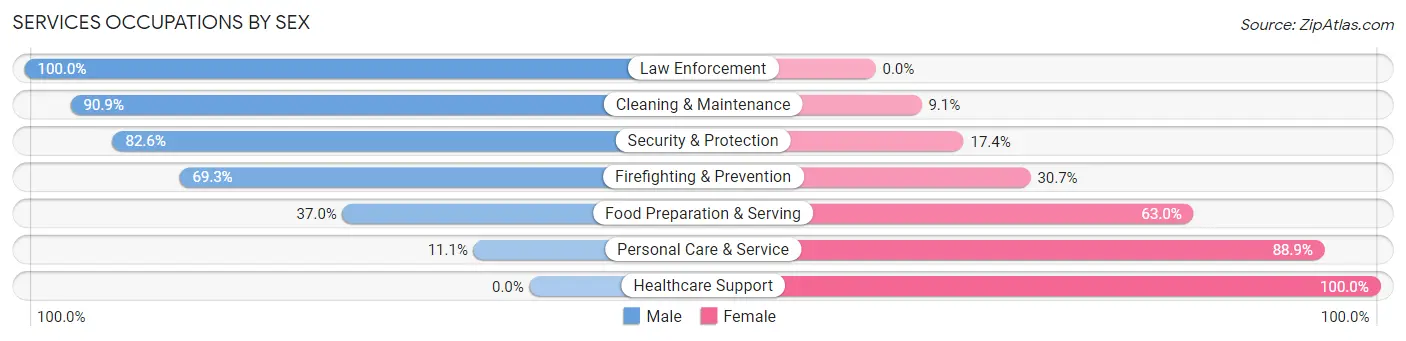
Services Occupations by Sex
Within the Services occupations in Cape Canaveral, the most male-oriented occupations are Law Enforcement (100.0%), Cleaning & Maintenance (90.9%), and Security & Protection (82.6%), while the most female-oriented occupations are Healthcare Support (100.0%), Personal Care & Service (88.9%), and Food Preparation & Serving (63.0%).
| Occupation | Male | Female |
| Healthcare Support | 0 (0.0%) | 188 (100.0%) |
| Security & Protection | 109 (82.6%) | 23 (17.4%) |
| Firefighting & Prevention | 52 (69.3%) | 23 (30.7%) |
| Law Enforcement | 57 (100.0%) | 0 (0.0%) |
| Food Preparation & Serving | 134 (37.0%) | 228 (63.0%) |
| Cleaning & Maintenance | 150 (90.9%) | 15 (9.1%) |
| Personal Care & Service | 25 (11.1%) | 201 (88.9%) |
| Total (Category) | 418 (39.0%) | 655 (61.0%) |
| Total (Overall) | 2,817 (54.3%) | 2,367 (45.7%) |
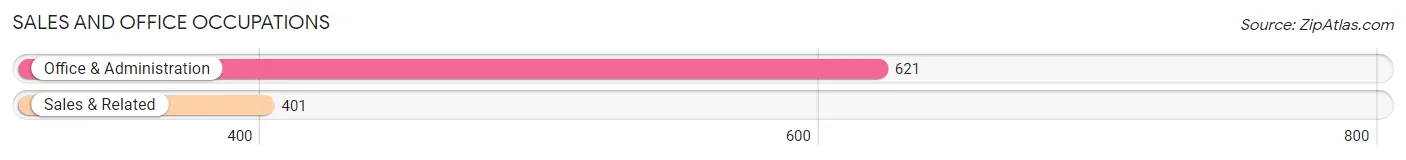
Sales and Office Occupations
The most common Sales and Office occupations in Cape Canaveral are Office & Administration (621 | 12.0%), and Sales & Related (401 | 7.7%).
Sales and Office Occupations by Sex
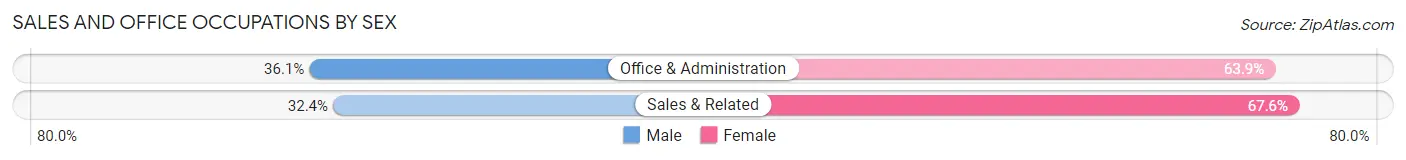
| Occupation | Male | Female |
| Sales & Related | 130 (32.4%) | 271 (67.6%) |
| Office & Administration | 224 (36.1%) | 397 (63.9%) |
| Total (Category) | 354 (34.6%) | 668 (65.4%) |
| Total (Overall) | 2,817 (54.3%) | 2,367 (45.7%) |
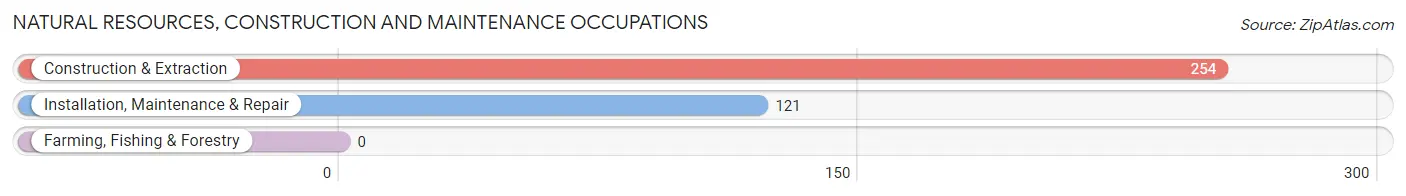
Natural Resources, Construction and Maintenance Occupations
The most common Natural Resources, Construction and Maintenance occupations in Cape Canaveral are Construction & Extraction (254 | 4.9%), and Installation, Maintenance & Repair (121 | 2.3%).
Natural Resources, Construction and Maintenance Occupations by Sex
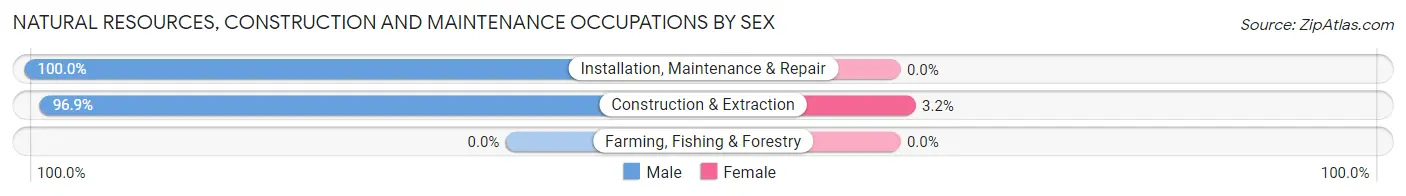
| Occupation | Male | Female |
| Farming, Fishing & Forestry | 0 (0.0%) | 0 (0.0%) |
| Construction & Extraction | 246 (96.9%) | 8 (3.2%) |
| Installation, Maintenance & Repair | 121 (100.0%) | 0 (0.0%) |
| Total (Category) | 367 (97.9%) | 8 (2.1%) |
| Total (Overall) | 2,817 (54.3%) | 2,367 (45.7%) |
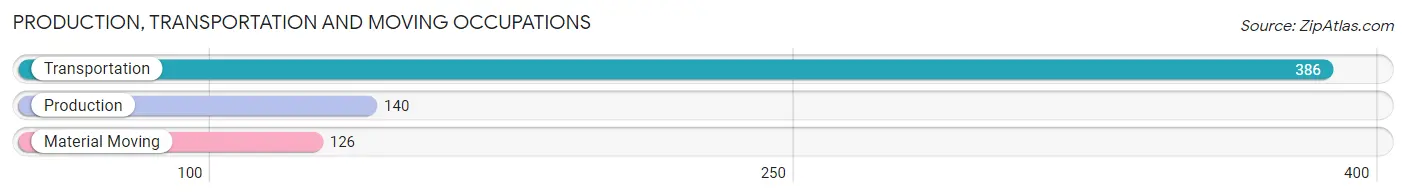
Production, Transportation and Moving Occupations
The most common Production, Transportation and Moving occupations in Cape Canaveral are Transportation (386 | 7.4%), Production (140 | 2.7%), and Material Moving (126 | 2.4%).
Production, Transportation and Moving Occupations by Sex
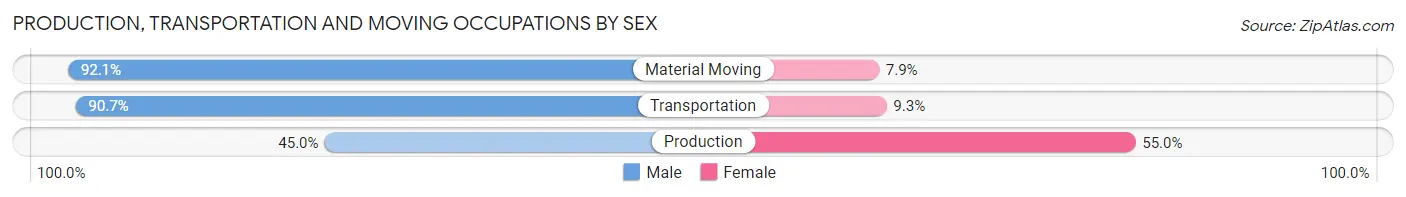
| Occupation | Male | Female |
| Production | 63 (45.0%) | 77 (55.0%) |
| Transportation | 350 (90.7%) | 36 (9.3%) |
| Material Moving | 116 (92.1%) | 10 (7.9%) |
| Total (Category) | 529 (81.1%) | 123 (18.9%) |
| Total (Overall) | 2,817 (54.3%) | 2,367 (45.7%) |
Employment Industries by Sex in Cape Canaveral
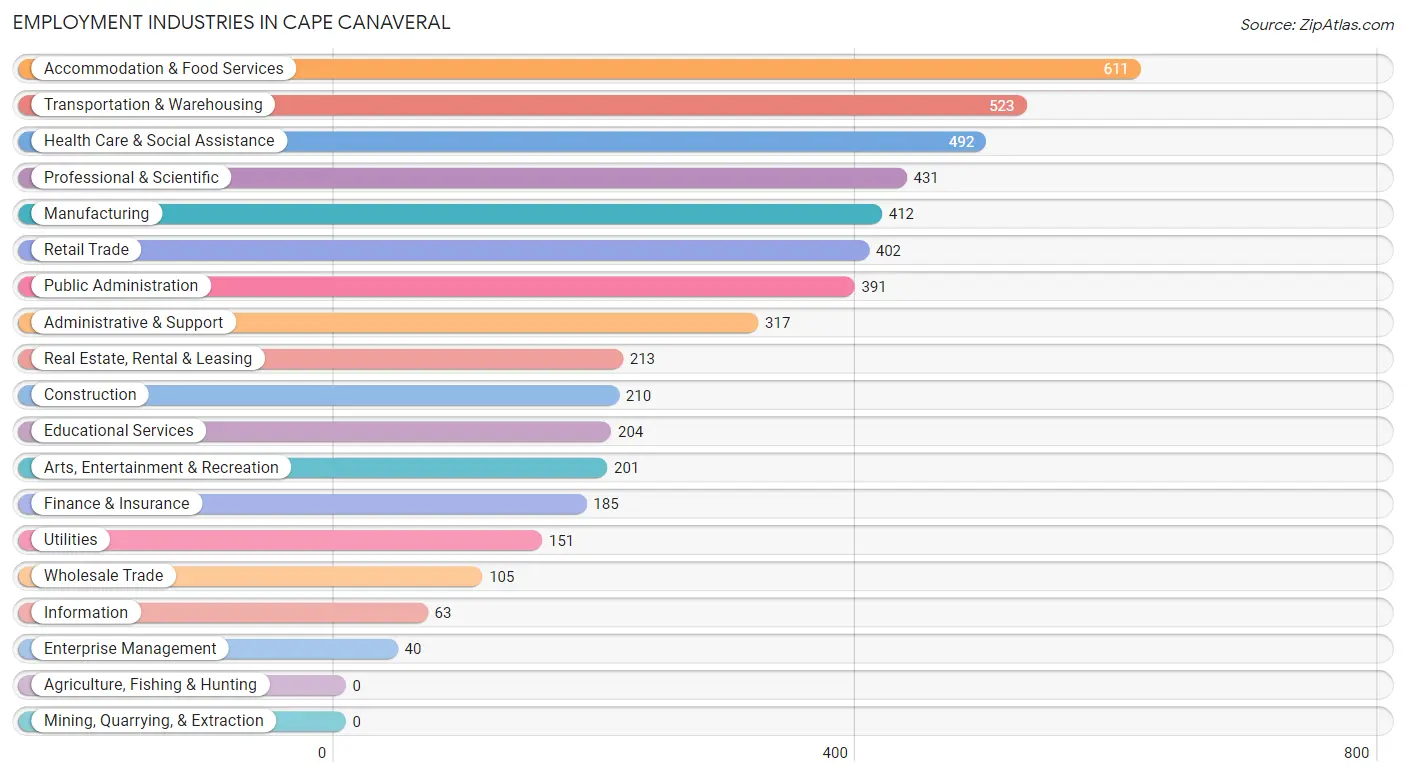
Employment Industries in Cape Canaveral
The major employment industries in Cape Canaveral include Accommodation & Food Services (611 | 11.8%), Transportation & Warehousing (523 | 10.1%), Health Care & Social Assistance (492 | 9.5%), Professional & Scientific (431 | 8.3%), and Manufacturing (412 | 8.0%).
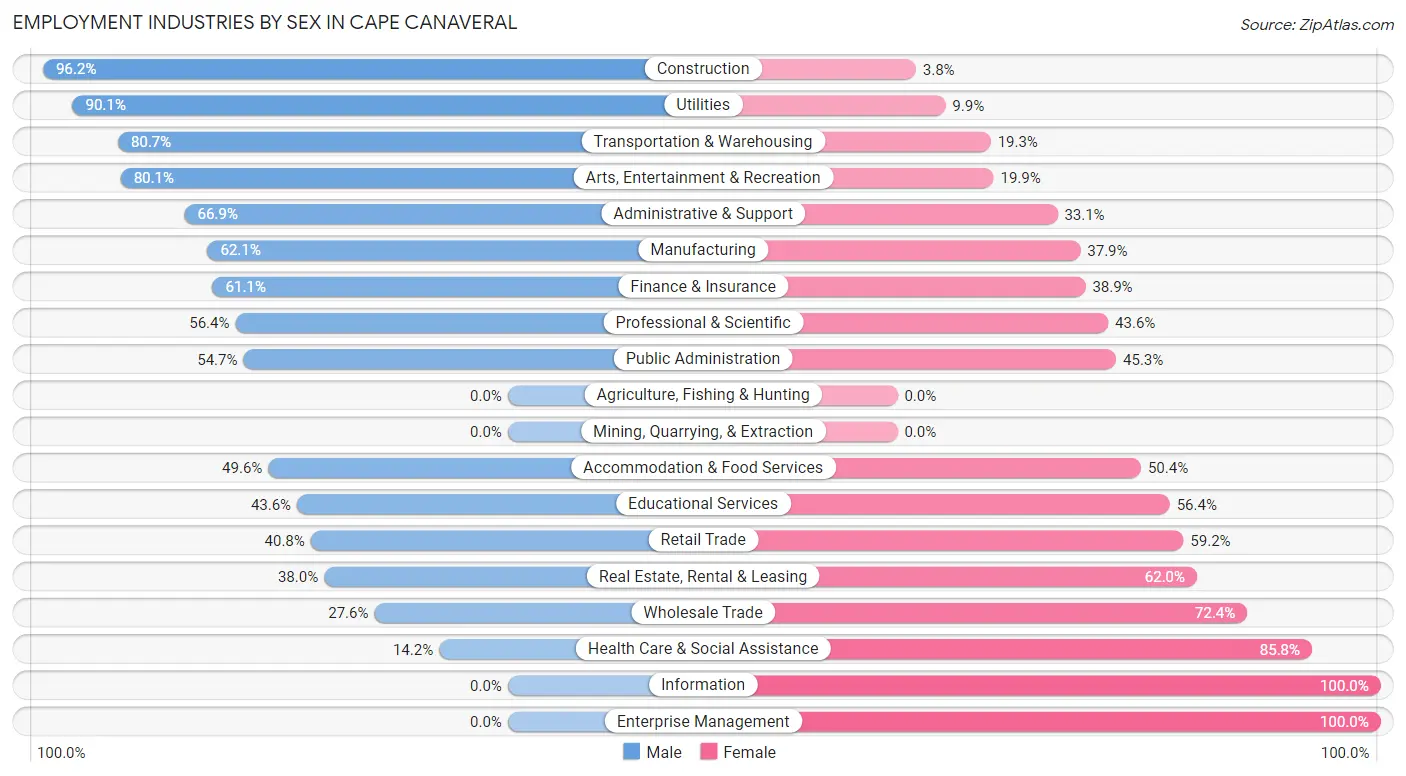
Employment Industries by Sex in Cape Canaveral
The Cape Canaveral industries that see more men than women are Construction (96.2%), Utilities (90.1%), and Transportation & Warehousing (80.7%), whereas the industries that tend to have a higher number of women are Information (100.0%), Enterprise Management (100.0%), and Health Care & Social Assistance (85.8%).
| Industry | Male | Female |
| Agriculture, Fishing & Hunting | 0 (0.0%) | 0 (0.0%) |
| Mining, Quarrying, & Extraction | 0 (0.0%) | 0 (0.0%) |
| Construction | 202 (96.2%) | 8 (3.8%) |
| Manufacturing | 256 (62.1%) | 156 (37.9%) |
| Wholesale Trade | 29 (27.6%) | 76 (72.4%) |
| Retail Trade | 164 (40.8%) | 238 (59.2%) |
| Transportation & Warehousing | 422 (80.7%) | 101 (19.3%) |
| Utilities | 136 (90.1%) | 15 (9.9%) |
| Information | 0 (0.0%) | 63 (100.0%) |
| Finance & Insurance | 113 (61.1%) | 72 (38.9%) |
| Real Estate, Rental & Leasing | 81 (38.0%) | 132 (62.0%) |
| Professional & Scientific | 243 (56.4%) | 188 (43.6%) |
| Enterprise Management | 0 (0.0%) | 40 (100.0%) |
| Administrative & Support | 212 (66.9%) | 105 (33.1%) |
| Educational Services | 89 (43.6%) | 115 (56.4%) |
| Health Care & Social Assistance | 70 (14.2%) | 422 (85.8%) |
| Arts, Entertainment & Recreation | 161 (80.1%) | 40 (19.9%) |
| Accommodation & Food Services | 303 (49.6%) | 308 (50.4%) |
| Public Administration | 214 (54.7%) | 177 (45.3%) |
| Total | 2,817 (54.3%) | 2,367 (45.7%) |
Education in Cape Canaveral
School Enrollment in Cape Canaveral
The most common levels of schooling among the 967 students in Cape Canaveral are elementary school (243 | 25.1%), college / undergraduate (216 | 22.3%), and high school (179 | 18.5%).
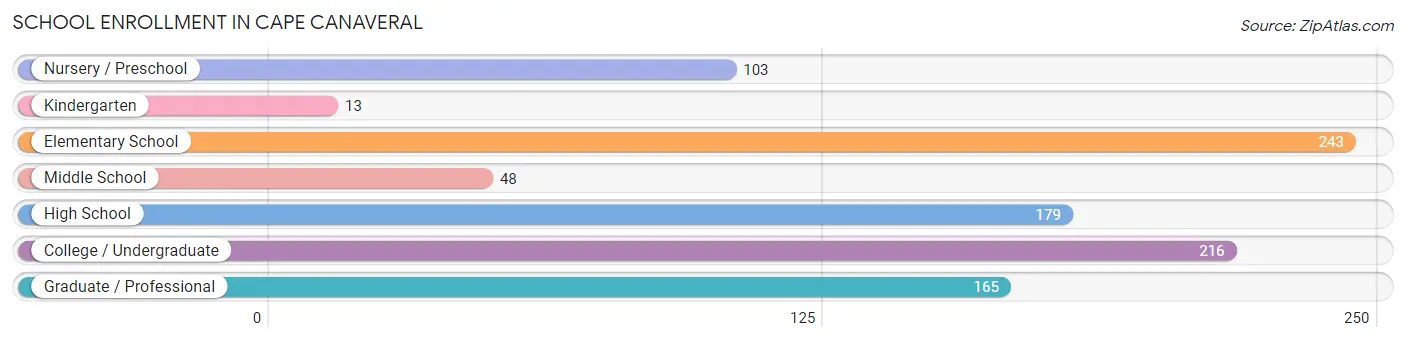
| School Level | # Students | % Students |
| Nursery / Preschool | 103 | 10.6% |
| Kindergarten | 13 | 1.3% |
| Elementary School | 243 | 25.1% |
| Middle School | 48 | 5.0% |
| High School | 179 | 18.5% |
| College / Undergraduate | 216 | 22.3% |
| Graduate / Professional | 165 | 17.1% |
| Total | 967 | 100.0% |
School Enrollment by Age by Funding Source in Cape Canaveral
Out of a total of 967 students who are enrolled in schools in Cape Canaveral, 224 (23.2%) attend a private institution, while the remaining 743 (76.8%) are enrolled in public schools. The age group of 20 to 24 year olds has the highest likelihood of being enrolled in private schools, with 61 (76.2% in the age bracket) enrolled. Conversely, the age group of 3 to 4 year olds has the lowest likelihood of being enrolled in a private school, with 65 (100.0% in the age bracket) attending a public institution.
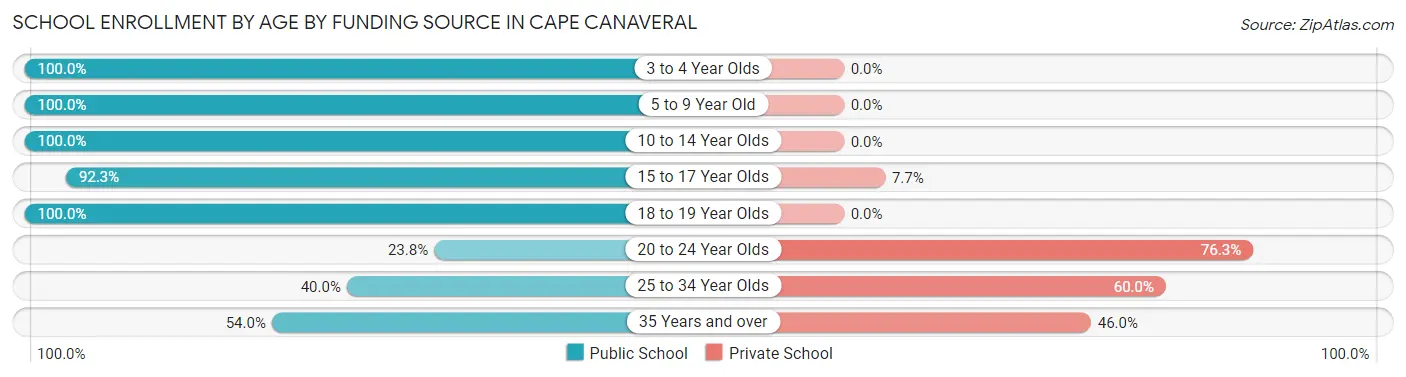
| Age Bracket | Public School | Private School |
| 3 to 4 Year Olds | 65 (100.0%) | 0 (0.0%) |
| 5 to 9 Year Old | 282 (100.0%) | 0 (0.0%) |
| 10 to 14 Year Olds | 83 (100.0%) | 0 (0.0%) |
| 15 to 17 Year Olds | 144 (92.3%) | 12 (7.7%) |
| 18 to 19 Year Olds | 20 (100.0%) | 0 (0.0%) |
| 20 to 24 Year Olds | 19 (23.7%) | 61 (76.2%) |
| 25 to 34 Year Olds | 62 (40.0%) | 93 (60.0%) |
| 35 Years and over | 68 (54.0%) | 58 (46.0%) |
| Total | 743 (76.8%) | 224 (23.2%) |
Educational Attainment by Field of Study in Cape Canaveral
Business (836 | 23.4%), engineering (646 | 18.1%), science & technology (374 | 10.5%), education (324 | 9.1%), and social sciences (259 | 7.3%) are the most common fields of study among 3,567 individuals in Cape Canaveral who have obtained a bachelor's degree or higher.
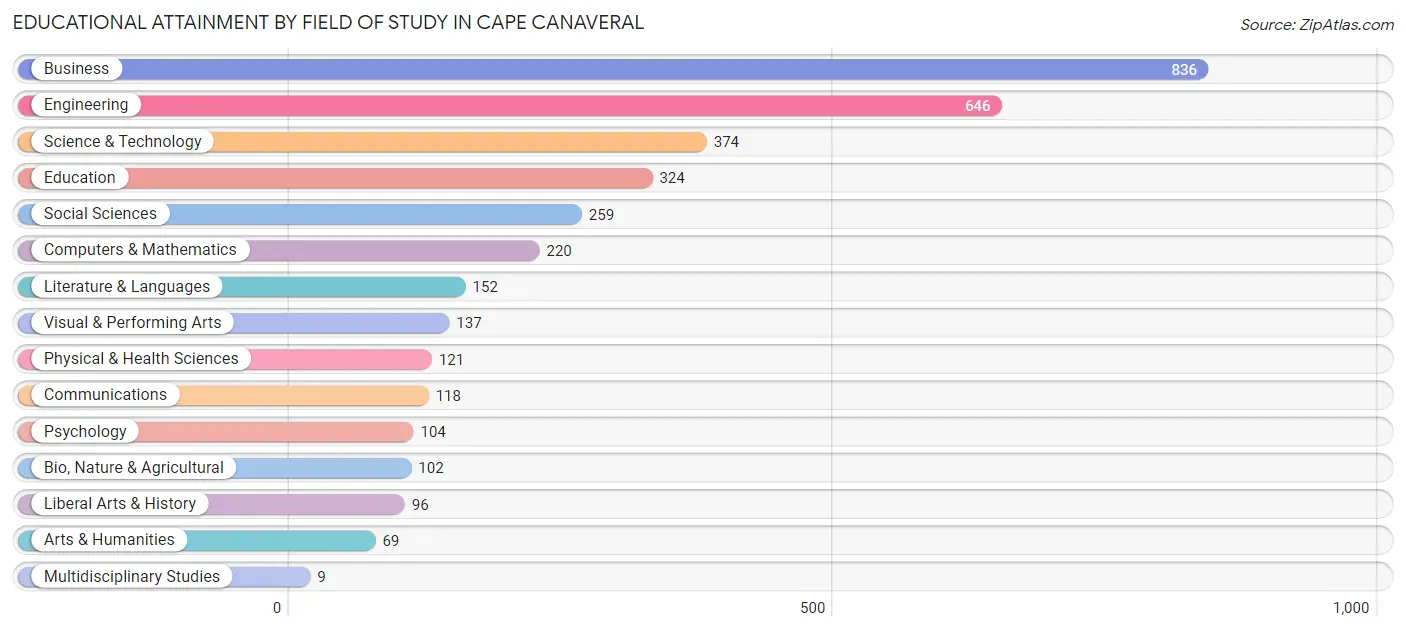
| Field of Study | # Graduates | % Graduates |
| Computers & Mathematics | 220 | 6.2% |
| Bio, Nature & Agricultural | 102 | 2.9% |
| Physical & Health Sciences | 121 | 3.4% |
| Psychology | 104 | 2.9% |
| Social Sciences | 259 | 7.3% |
| Engineering | 646 | 18.1% |
| Multidisciplinary Studies | 9 | 0.3% |
| Science & Technology | 374 | 10.5% |
| Business | 836 | 23.4% |
| Education | 324 | 9.1% |
| Literature & Languages | 152 | 4.3% |
| Liberal Arts & History | 96 | 2.7% |
| Visual & Performing Arts | 137 | 3.8% |
| Communications | 118 | 3.3% |
| Arts & Humanities | 69 | 1.9% |
| Total | 3,567 | 100.0% |
Transportation & Commute in Cape Canaveral
Vehicle Availability by Sex in Cape Canaveral
The most prevalent vehicle ownership categories in Cape Canaveral are males with 2 vehicles (1,261, accounting for 44.6%) and females with 2 vehicles (1,181, making up 55.1%).
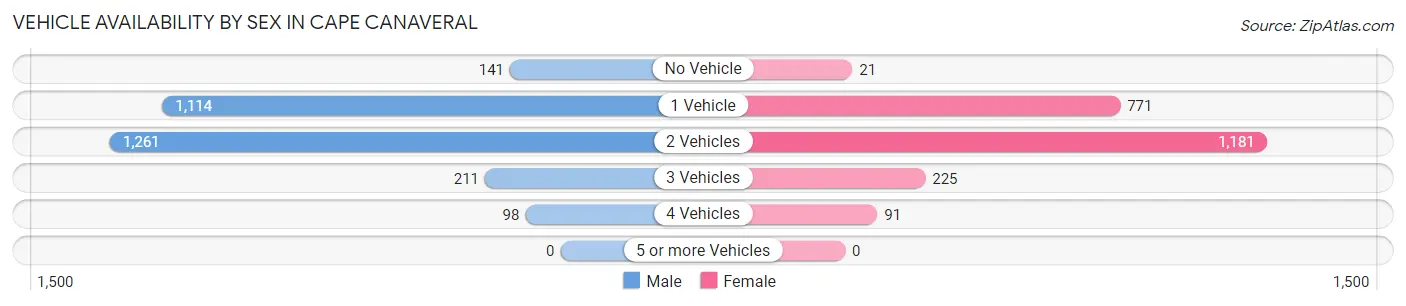
| Vehicles Available | Male | Female |
| No Vehicle | 141 (5.0%) | 21 (0.9%) |
| 1 Vehicle | 1,114 (39.4%) | 771 (33.7%) |
| 2 Vehicles | 1,261 (44.6%) | 1,181 (51.6%) |
| 3 Vehicles | 211 (7.5%) | 225 (9.8%) |
| 4 Vehicles | 98 (3.5%) | 91 (4.0%) |
| 5 or more Vehicles | 0 (0.0%) | 0 (0.0%) |
| Total | 2,825 (100.0%) | 2,289 (100.0%) |
Commute Time in Cape Canaveral
The most frequently occuring commute durations in Cape Canaveral are 10 to 14 minutes (835 commuters, 19.8%), 5 to 9 minutes (673 commuters, 16.0%), and 15 to 19 minutes (541 commuters, 12.9%).
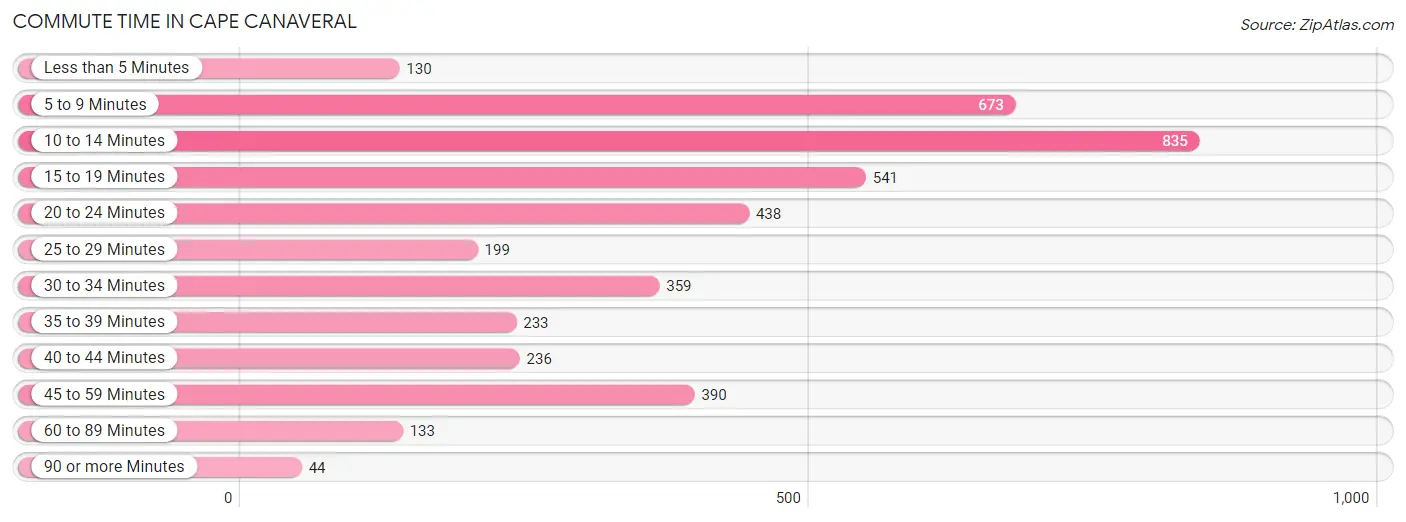
| Commute Time | # Commuters | % Commuters |
| Less than 5 Minutes | 130 | 3.1% |
| 5 to 9 Minutes | 673 | 16.0% |
| 10 to 14 Minutes | 835 | 19.8% |
| 15 to 19 Minutes | 541 | 12.9% |
| 20 to 24 Minutes | 438 | 10.4% |
| 25 to 29 Minutes | 199 | 4.7% |
| 30 to 34 Minutes | 359 | 8.5% |
| 35 to 39 Minutes | 233 | 5.5% |
| 40 to 44 Minutes | 236 | 5.6% |
| 45 to 59 Minutes | 390 | 9.3% |
| 60 to 89 Minutes | 133 | 3.2% |
| 90 or more Minutes | 44 | 1.0% |
Commute Time by Sex in Cape Canaveral
The most common commute times in Cape Canaveral are 10 to 14 minutes (609 commuters, 27.2%) for males and 5 to 9 minutes (313 commuters, 15.9%) for females.
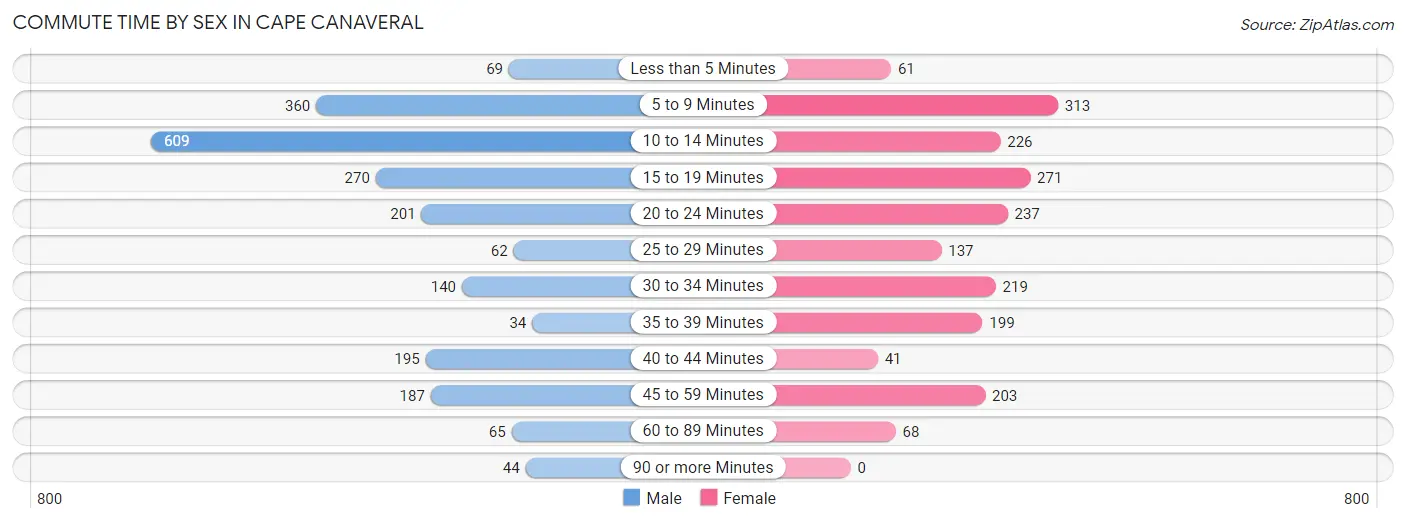
| Commute Time | Male | Female |
| Less than 5 Minutes | 69 (3.1%) | 61 (3.1%) |
| 5 to 9 Minutes | 360 (16.1%) | 313 (15.9%) |
| 10 to 14 Minutes | 609 (27.2%) | 226 (11.4%) |
| 15 to 19 Minutes | 270 (12.1%) | 271 (13.7%) |
| 20 to 24 Minutes | 201 (9.0%) | 237 (12.0%) |
| 25 to 29 Minutes | 62 (2.8%) | 137 (6.9%) |
| 30 to 34 Minutes | 140 (6.3%) | 219 (11.1%) |
| 35 to 39 Minutes | 34 (1.5%) | 199 (10.1%) |
| 40 to 44 Minutes | 195 (8.7%) | 41 (2.1%) |
| 45 to 59 Minutes | 187 (8.4%) | 203 (10.3%) |
| 60 to 89 Minutes | 65 (2.9%) | 68 (3.4%) |
| 90 or more Minutes | 44 (2.0%) | 0 (0.0%) |
Time of Departure to Work by Sex in Cape Canaveral
The most frequent times of departure to work in Cape Canaveral are 7:00 AM to 7:29 AM (416, 18.6%) for males and 10:00 AM to 10:59 AM (327, 16.6%) for females.
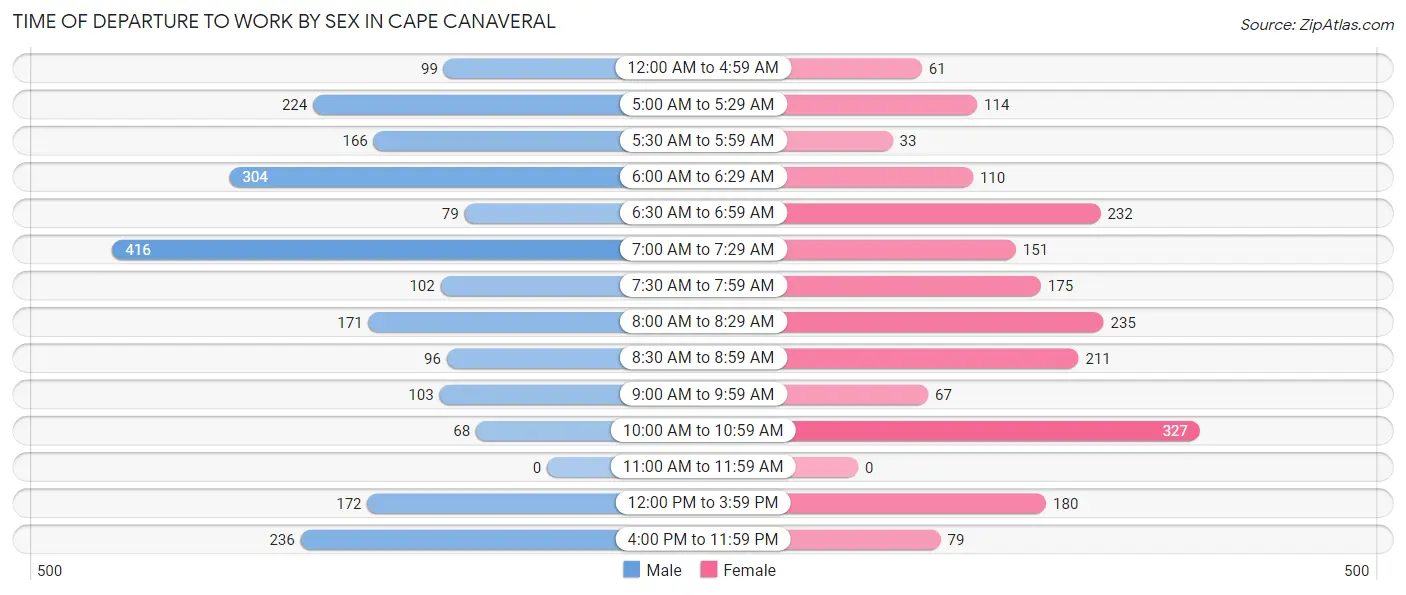
| Time of Departure | Male | Female |
| 12:00 AM to 4:59 AM | 99 (4.4%) | 61 (3.1%) |
| 5:00 AM to 5:29 AM | 224 (10.0%) | 114 (5.8%) |
| 5:30 AM to 5:59 AM | 166 (7.4%) | 33 (1.7%) |
| 6:00 AM to 6:29 AM | 304 (13.6%) | 110 (5.6%) |
| 6:30 AM to 6:59 AM | 79 (3.5%) | 232 (11.7%) |
| 7:00 AM to 7:29 AM | 416 (18.6%) | 151 (7.6%) |
| 7:30 AM to 7:59 AM | 102 (4.6%) | 175 (8.9%) |
| 8:00 AM to 8:29 AM | 171 (7.6%) | 235 (11.9%) |
| 8:30 AM to 8:59 AM | 96 (4.3%) | 211 (10.7%) |
| 9:00 AM to 9:59 AM | 103 (4.6%) | 67 (3.4%) |
| 10:00 AM to 10:59 AM | 68 (3.0%) | 327 (16.6%) |
| 11:00 AM to 11:59 AM | 0 (0.0%) | 0 (0.0%) |
| 12:00 PM to 3:59 PM | 172 (7.7%) | 180 (9.1%) |
| 4:00 PM to 11:59 PM | 236 (10.5%) | 79 (4.0%) |
| Total | 2,236 (100.0%) | 1,975 (100.0%) |
Housing Occupancy in Cape Canaveral
Occupancy by Ownership in Cape Canaveral
Of the total 5,776 dwellings in Cape Canaveral, owner-occupied units account for 3,547 (61.4%), while renter-occupied units make up 2,229 (38.6%).
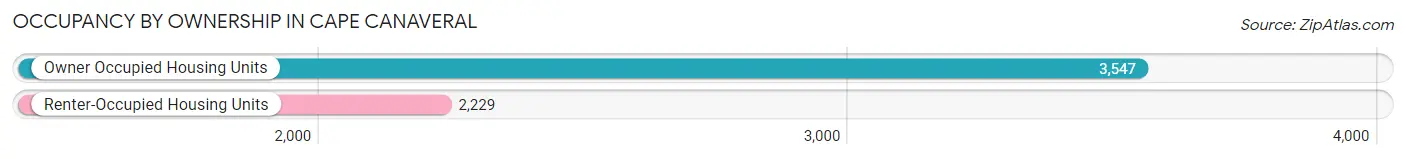
| Occupancy | # Housing Units | % Housing Units |
| Owner Occupied Housing Units | 3,547 | 61.4% |
| Renter-Occupied Housing Units | 2,229 | 38.6% |
| Total Occupied Housing Units | 5,776 | 100.0% |
Occupancy by Household Size in Cape Canaveral
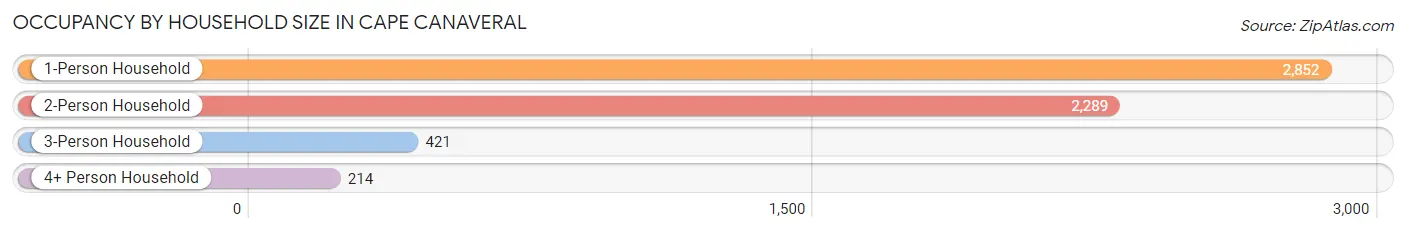
| Household Size | # Housing Units | % Housing Units |
| 1-Person Household | 2,852 | 49.4% |
| 2-Person Household | 2,289 | 39.6% |
| 3-Person Household | 421 | 7.3% |
| 4+ Person Household | 214 | 3.7% |
| Total Housing Units | 5,776 | 100.0% |
Occupancy by Ownership by Household Size in Cape Canaveral
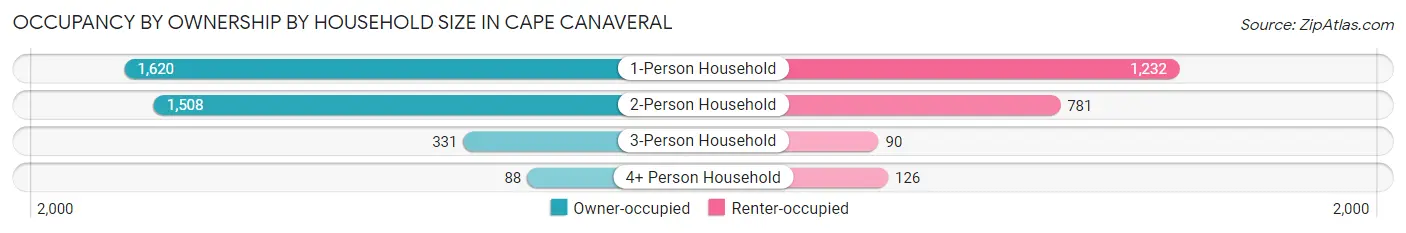
| Household Size | Owner-occupied | Renter-occupied |
| 1-Person Household | 1,620 (56.8%) | 1,232 (43.2%) |
| 2-Person Household | 1,508 (65.9%) | 781 (34.1%) |
| 3-Person Household | 331 (78.6%) | 90 (21.4%) |
| 4+ Person Household | 88 (41.1%) | 126 (58.9%) |
| Total Housing Units | 3,547 (61.4%) | 2,229 (38.6%) |
Occupancy by Educational Attainment in Cape Canaveral
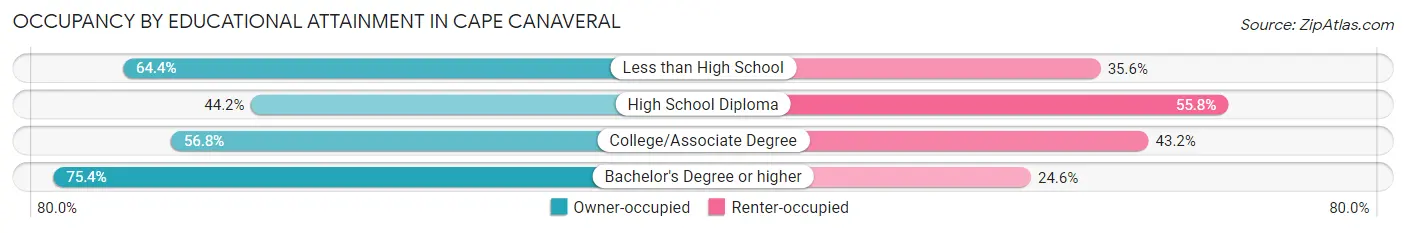
| Household Size | Owner-occupied | Renter-occupied |
| Less than High School | 150 (64.4%) | 83 (35.6%) |
| High School Diploma | 635 (44.2%) | 802 (55.8%) |
| College/Associate Degree | 1,021 (56.8%) | 777 (43.2%) |
| Bachelor's Degree or higher | 1,741 (75.4%) | 567 (24.6%) |
Occupancy by Age of Householder in Cape Canaveral
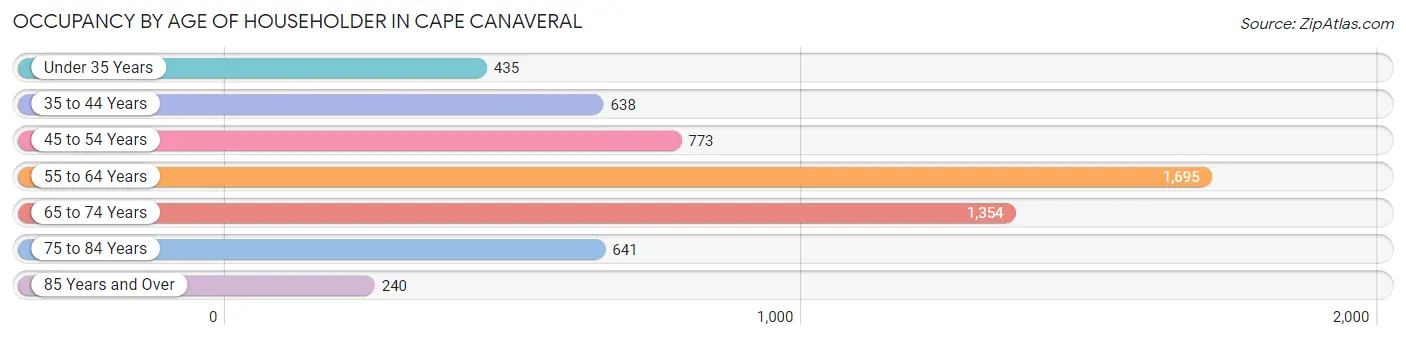
| Age Bracket | # Households | % Households |
| Under 35 Years | 435 | 7.5% |
| 35 to 44 Years | 638 | 11.1% |
| 45 to 54 Years | 773 | 13.4% |
| 55 to 64 Years | 1,695 | 29.3% |
| 65 to 74 Years | 1,354 | 23.4% |
| 75 to 84 Years | 641 | 11.1% |
| 85 Years and Over | 240 | 4.2% |
| Total | 5,776 | 100.0% |
Housing Finances in Cape Canaveral
Median Income by Occupancy in Cape Canaveral
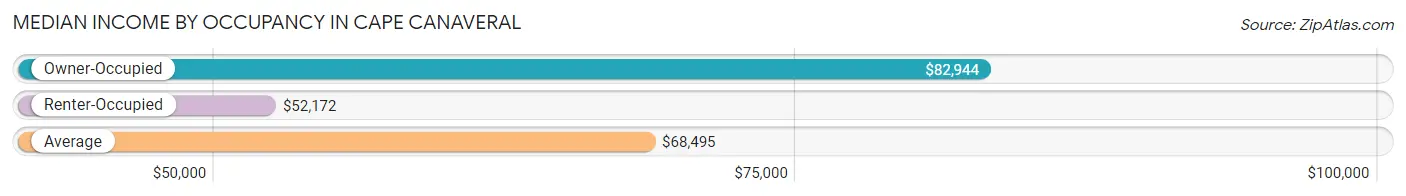
| Occupancy Type | # Households | Median Income |
| Owner-Occupied | 3,547 (61.4%) | $82,944 |
| Renter-Occupied | 2,229 (38.6%) | $52,172 |
| Average | 5,776 (100.0%) | $68,495 |
Occupancy by Householder Income Bracket in Cape Canaveral
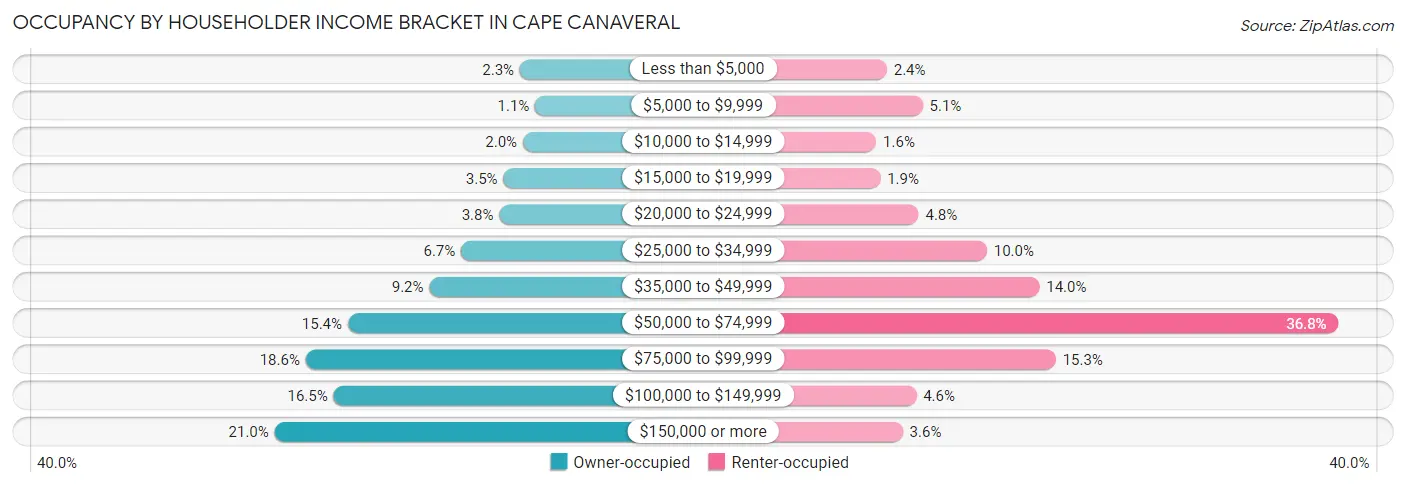
| Income Bracket | Owner-occupied | Renter-occupied |
| Less than $5,000 | 80 (2.3%) | 53 (2.4%) |
| $5,000 to $9,999 | 39 (1.1%) | 114 (5.1%) |
| $10,000 to $14,999 | 72 (2.0%) | 35 (1.6%) |
| $15,000 to $19,999 | 125 (3.5%) | 42 (1.9%) |
| $20,000 to $24,999 | 136 (3.8%) | 107 (4.8%) |
| $25,000 to $34,999 | 239 (6.7%) | 223 (10.0%) |
| $35,000 to $49,999 | 325 (9.2%) | 312 (14.0%) |
| $50,000 to $74,999 | 545 (15.4%) | 820 (36.8%) |
| $75,000 to $99,999 | 659 (18.6%) | 340 (15.2%) |
| $100,000 to $149,999 | 584 (16.5%) | 103 (4.6%) |
| $150,000 or more | 743 (20.9%) | 80 (3.6%) |
| Total | 3,547 (100.0%) | 2,229 (100.0%) |
Monthly Housing Cost Tiers in Cape Canaveral
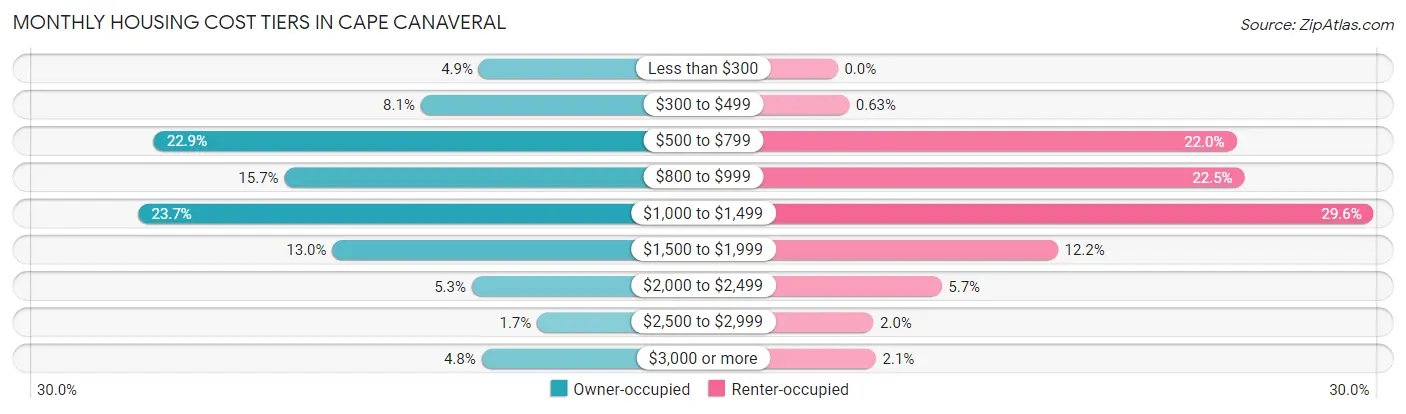
| Monthly Cost | Owner-occupied | Renter-occupied |
| Less than $300 | 174 (4.9%) | 0 (0.0%) |
| $300 to $499 | 288 (8.1%) | 14 (0.6%) |
| $500 to $799 | 811 (22.9%) | 491 (22.0%) |
| $800 to $999 | 555 (15.7%) | 501 (22.5%) |
| $1,000 to $1,499 | 841 (23.7%) | 660 (29.6%) |
| $1,500 to $1,999 | 461 (13.0%) | 271 (12.2%) |
| $2,000 to $2,499 | 188 (5.3%) | 128 (5.7%) |
| $2,500 to $2,999 | 60 (1.7%) | 44 (2.0%) |
| $3,000 or more | 169 (4.8%) | 47 (2.1%) |
| Total | 3,547 (100.0%) | 2,229 (100.0%) |
Physical Housing Characteristics in Cape Canaveral
Housing Structures in Cape Canaveral
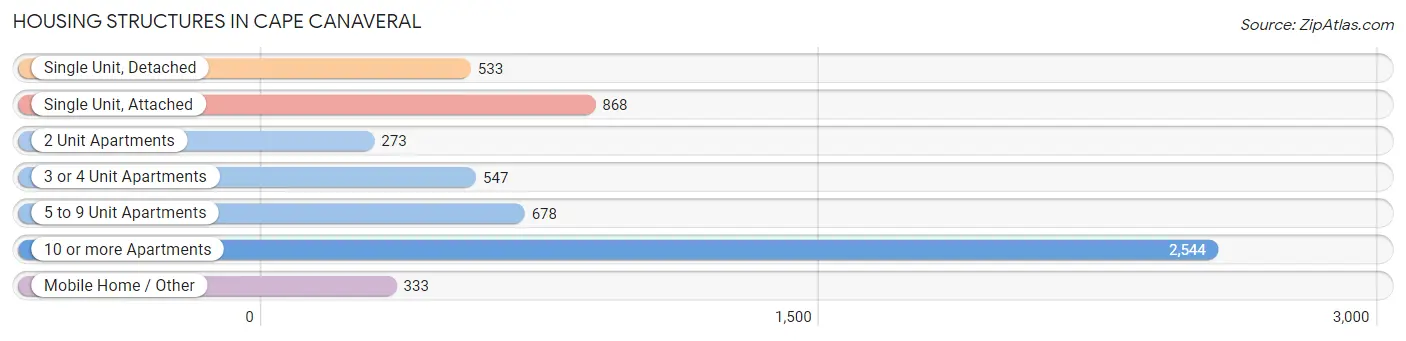
| Structure Type | # Housing Units | % Housing Units |
| Single Unit, Detached | 533 | 9.2% |
| Single Unit, Attached | 868 | 15.0% |
| 2 Unit Apartments | 273 | 4.7% |
| 3 or 4 Unit Apartments | 547 | 9.5% |
| 5 to 9 Unit Apartments | 678 | 11.7% |
| 10 or more Apartments | 2,544 | 44.0% |
| Mobile Home / Other | 333 | 5.8% |
| Total | 5,776 | 100.0% |
Housing Structures by Occupancy in Cape Canaveral
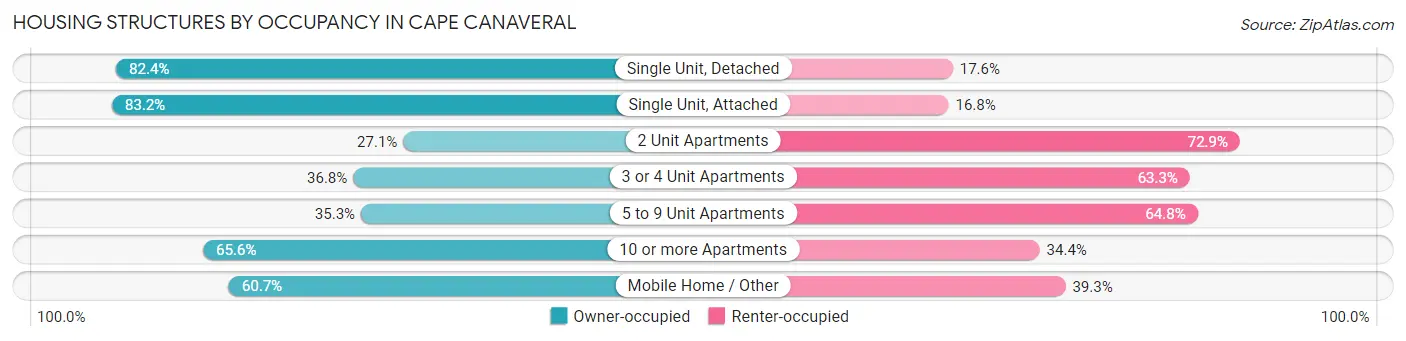
| Structure Type | Owner-occupied | Renter-occupied |
| Single Unit, Detached | 439 (82.4%) | 94 (17.6%) |
| Single Unit, Attached | 722 (83.2%) | 146 (16.8%) |
| 2 Unit Apartments | 74 (27.1%) | 199 (72.9%) |
| 3 or 4 Unit Apartments | 201 (36.7%) | 346 (63.2%) |
| 5 to 9 Unit Apartments | 239 (35.2%) | 439 (64.7%) |
| 10 or more Apartments | 1,670 (65.6%) | 874 (34.4%) |
| Mobile Home / Other | 202 (60.7%) | 131 (39.3%) |
| Total | 3,547 (61.4%) | 2,229 (38.6%) |
Housing Structures by Number of Rooms in Cape Canaveral
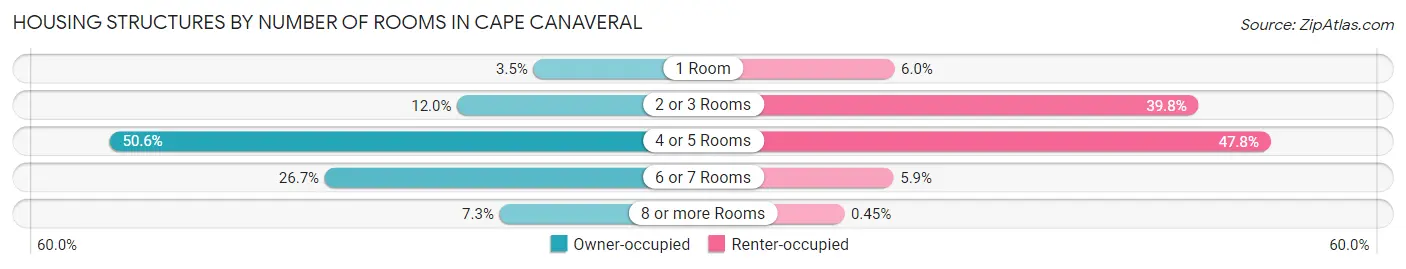
| Number of Rooms | Owner-occupied | Renter-occupied |
| 1 Room | 124 (3.5%) | 134 (6.0%) |
| 2 or 3 Rooms | 425 (12.0%) | 887 (39.8%) |
| 4 or 5 Rooms | 1,794 (50.6%) | 1,066 (47.8%) |
| 6 or 7 Rooms | 946 (26.7%) | 132 (5.9%) |
| 8 or more Rooms | 258 (7.3%) | 10 (0.4%) |
| Total | 3,547 (100.0%) | 2,229 (100.0%) |
Housing Structure by Heating Type in Cape Canaveral
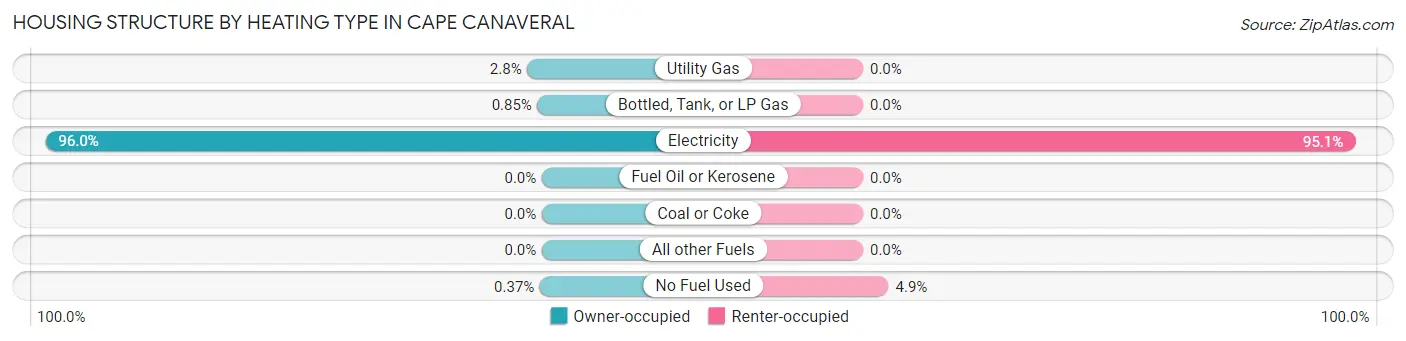
| Heating Type | Owner-occupied | Renter-occupied |
| Utility Gas | 100 (2.8%) | 0 (0.0%) |
| Bottled, Tank, or LP Gas | 30 (0.9%) | 0 (0.0%) |
| Electricity | 3,404 (96.0%) | 2,119 (95.1%) |
| Fuel Oil or Kerosene | 0 (0.0%) | 0 (0.0%) |
| Coal or Coke | 0 (0.0%) | 0 (0.0%) |
| All other Fuels | 0 (0.0%) | 0 (0.0%) |
| No Fuel Used | 13 (0.4%) | 110 (4.9%) |
| Total | 3,547 (100.0%) | 2,229 (100.0%) |
Household Vehicle Usage in Cape Canaveral
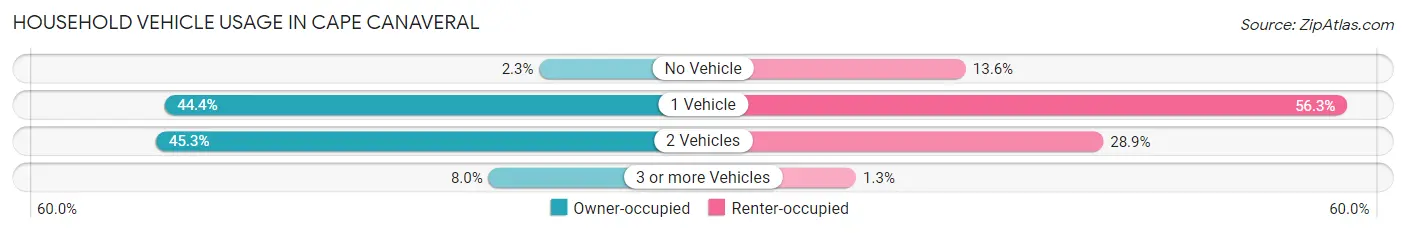
| Vehicles per Household | Owner-occupied | Renter-occupied |
| No Vehicle | 83 (2.3%) | 302 (13.6%) |
| 1 Vehicle | 1,573 (44.4%) | 1,254 (56.3%) |
| 2 Vehicles | 1,606 (45.3%) | 645 (28.9%) |
| 3 or more Vehicles | 285 (8.0%) | 28 (1.3%) |
| Total | 3,547 (100.0%) | 2,229 (100.0%) |
Real Estate & Mortgages in Cape Canaveral
Real Estate and Mortgage Overview in Cape Canaveral
| Characteristic | Without Mortgage | With Mortgage |
| Housing Units | 2,164 | 1,383 |
| Median Property Value | $317,700 | $327,500 |
| Median Household Income | $74,167 | $313 |
| Monthly Housing Costs | $723 | $169 |
| Real Estate Taxes | $2,304 | $9 |
Property Value by Mortgage Status in Cape Canaveral
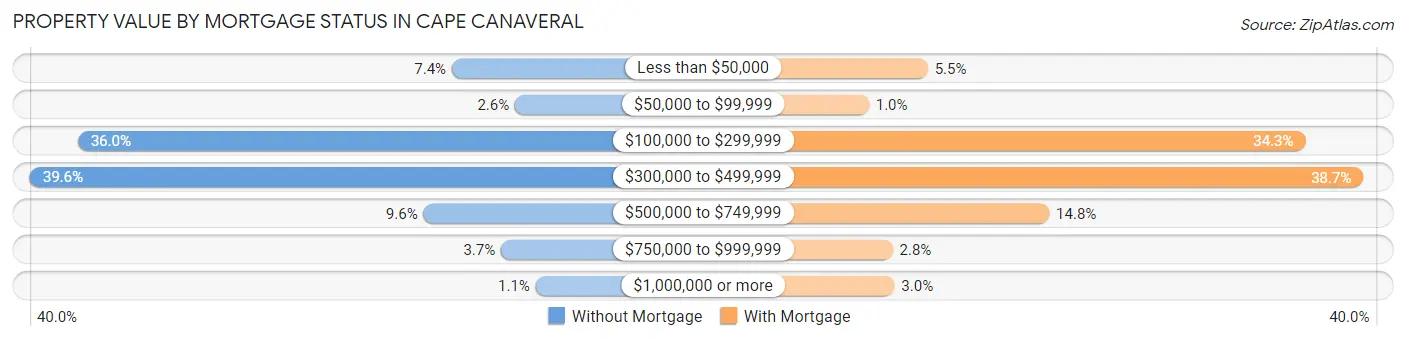
| Property Value | Without Mortgage | With Mortgage |
| Less than $50,000 | 161 (7.4%) | 76 (5.5%) |
| $50,000 to $99,999 | 57 (2.6%) | 14 (1.0%) |
| $100,000 to $299,999 | 778 (35.9%) | 474 (34.3%) |
| $300,000 to $499,999 | 857 (39.6%) | 535 (38.7%) |
| $500,000 to $749,999 | 208 (9.6%) | 204 (14.7%) |
| $750,000 to $999,999 | 80 (3.7%) | 39 (2.8%) |
| $1,000,000 or more | 23 (1.1%) | 41 (3.0%) |
| Total | 2,164 (100.0%) | 1,383 (100.0%) |
Household Income by Mortgage Status in Cape Canaveral
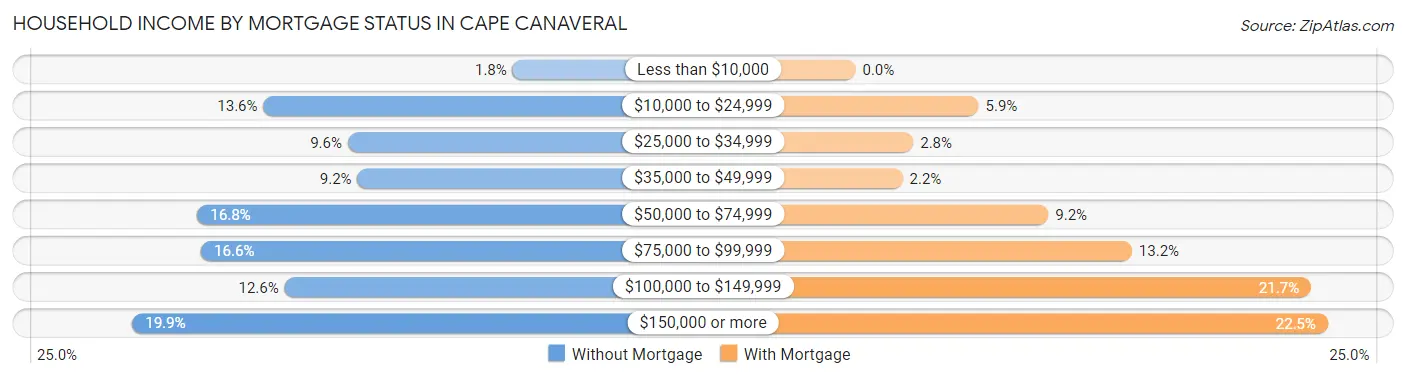
| Household Income | Without Mortgage | With Mortgage |
| Less than $10,000 | 38 (1.8%) | 0 (0.0%) |
| $10,000 to $24,999 | 295 (13.6%) | 81 (5.9%) |
| $25,000 to $34,999 | 208 (9.6%) | 38 (2.8%) |
| $35,000 to $49,999 | 198 (9.1%) | 31 (2.2%) |
| $50,000 to $74,999 | 363 (16.8%) | 127 (9.2%) |
| $75,000 to $99,999 | 359 (16.6%) | 182 (13.2%) |
| $100,000 to $149,999 | 273 (12.6%) | 300 (21.7%) |
| $150,000 or more | 430 (19.9%) | 311 (22.5%) |
| Total | 2,164 (100.0%) | 1,383 (100.0%) |
Property Value to Household Income Ratio in Cape Canaveral
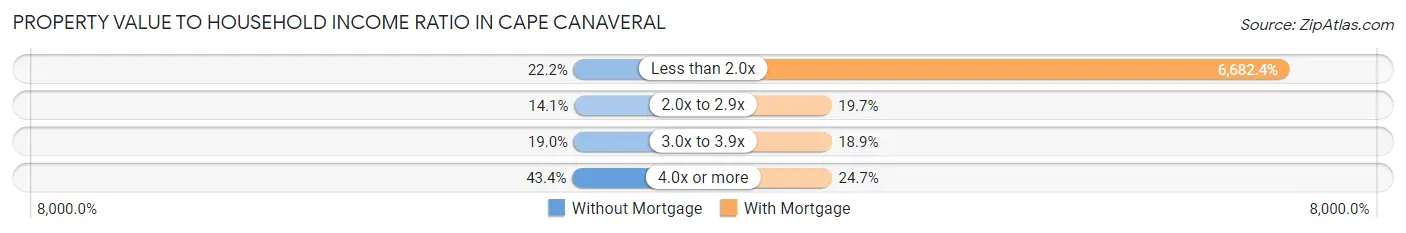
| Value-to-Income Ratio | Without Mortgage | With Mortgage |
| Less than 2.0x | 480 (22.2%) | 92,417 (6,682.4%) |
| 2.0x to 2.9x | 305 (14.1%) | 273 (19.7%) |
| 3.0x to 3.9x | 410 (19.0%) | 262 (18.9%) |
| 4.0x or more | 940 (43.4%) | 342 (24.7%) |
| Total | 2,164 (100.0%) | 1,383 (100.0%) |
Real Estate Taxes by Mortgage Status in Cape Canaveral
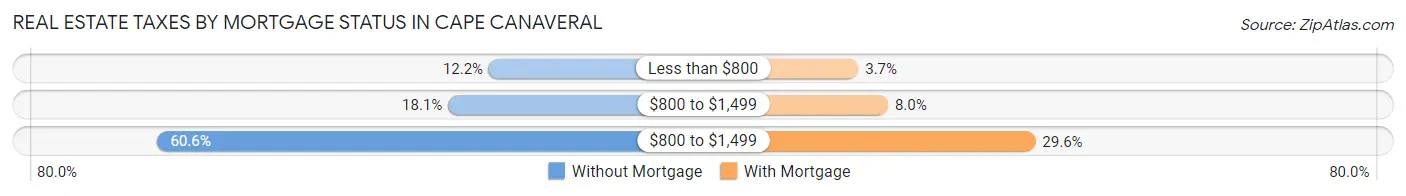
| Property Taxes | Without Mortgage | With Mortgage |
| Less than $800 | 263 (12.1%) | 51 (3.7%) |
| $800 to $1,499 | 392 (18.1%) | 111 (8.0%) |
| $800 to $1,499 | 1,311 (60.6%) | 409 (29.6%) |
| Total | 2,164 (100.0%) | 1,383 (100.0%) |
Health & Disability in Cape Canaveral
Health Insurance Coverage by Age in Cape Canaveral
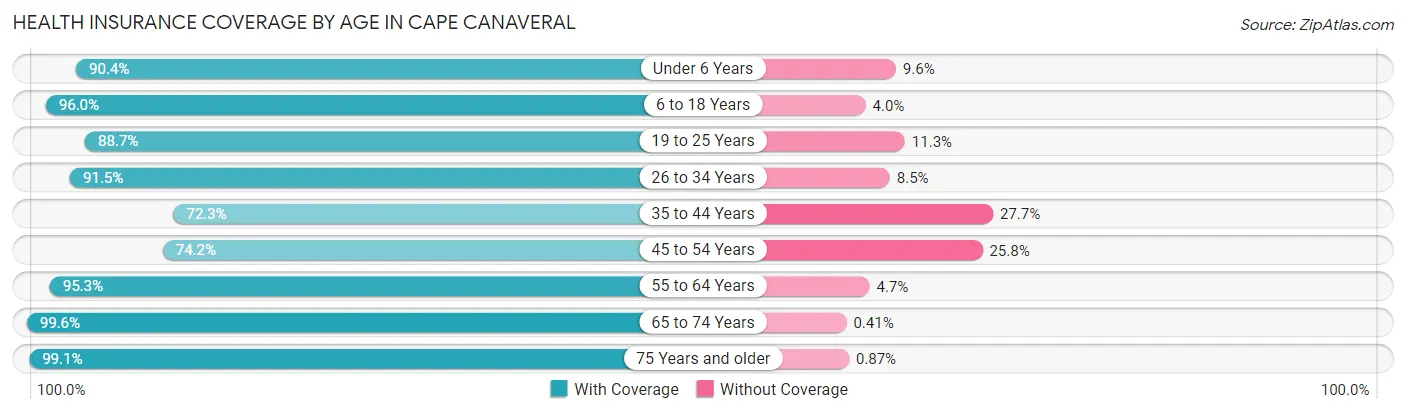
| Age Bracket | With Coverage | Without Coverage |
| Under 6 Years | 188 (90.4%) | 20 (9.6%) |
| 6 to 18 Years | 484 (96.0%) | 20 (4.0%) |
| 19 to 25 Years | 212 (88.7%) | 27 (11.3%) |
| 26 to 34 Years | 636 (91.5%) | 59 (8.5%) |
| 35 to 44 Years | 810 (72.3%) | 311 (27.7%) |
| 45 to 54 Years | 867 (74.2%) | 301 (25.8%) |
| 55 to 64 Years | 2,547 (95.3%) | 126 (4.7%) |
| 65 to 74 Years | 1,952 (99.6%) | 8 (0.4%) |
| 75 Years and older | 1,363 (99.1%) | 12 (0.9%) |
| Total | 9,059 (91.1%) | 884 (8.9%) |
Health Insurance Coverage by Citizenship Status in Cape Canaveral
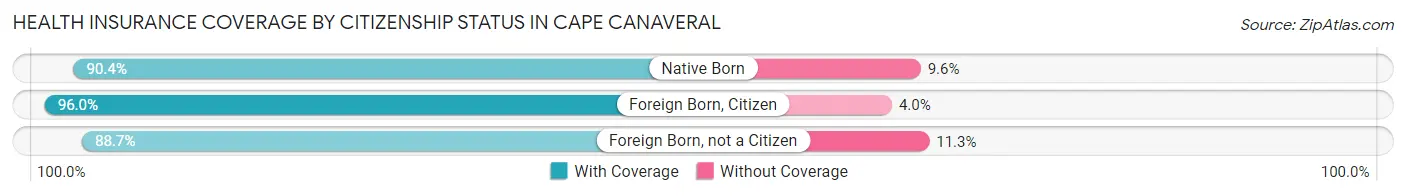
| Citizenship Status | With Coverage | Without Coverage |
| Native Born | 188 (90.4%) | 20 (9.6%) |
| Foreign Born, Citizen | 484 (96.0%) | 20 (4.0%) |
| Foreign Born, not a Citizen | 212 (88.7%) | 27 (11.3%) |
Health Insurance Coverage by Household Income in Cape Canaveral
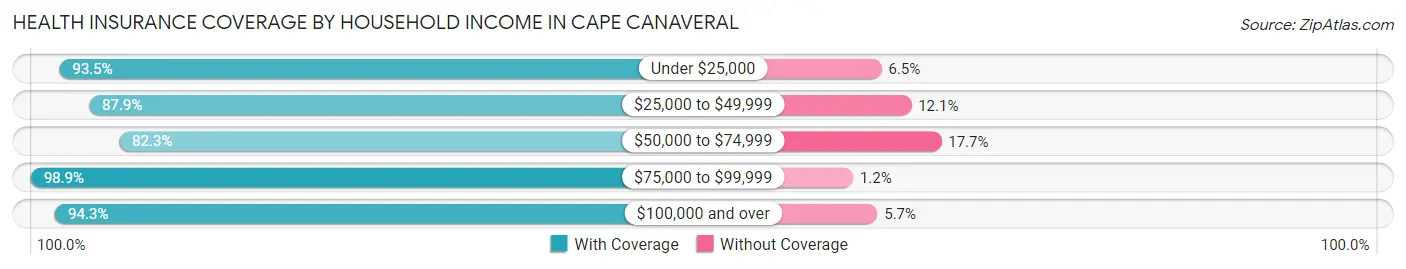
| Household Income | With Coverage | Without Coverage |
| Under $25,000 | 861 (93.5%) | 60 (6.5%) |
| $25,000 to $49,999 | 1,450 (87.9%) | 199 (12.1%) |
| $50,000 to $74,999 | 1,942 (82.3%) | 418 (17.7%) |
| $75,000 to $99,999 | 1,717 (98.9%) | 20 (1.1%) |
| $100,000 and over | 3,089 (94.3%) | 187 (5.7%) |
Public vs Private Health Insurance Coverage by Age in Cape Canaveral
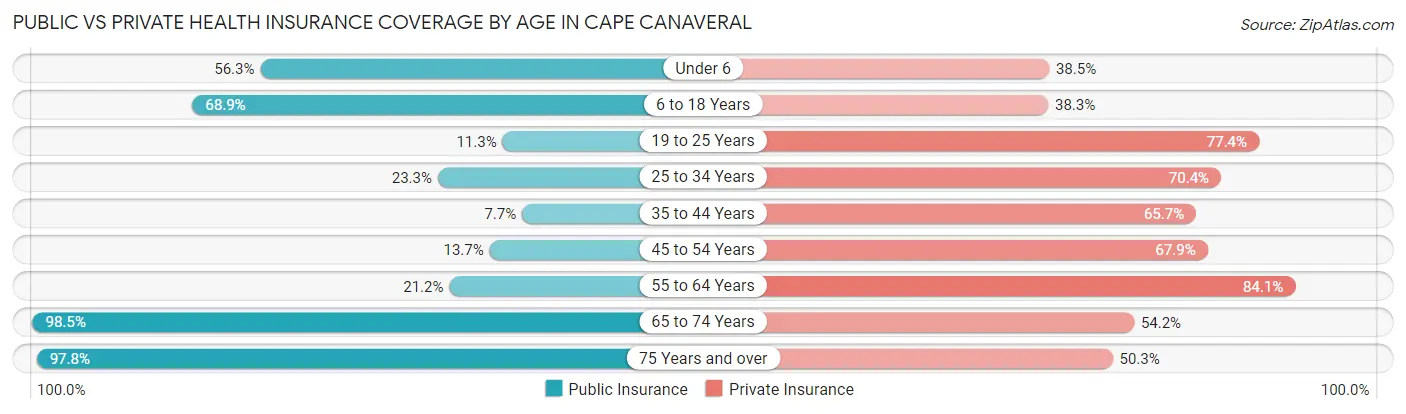
| Age Bracket | Public Insurance | Private Insurance |
| Under 6 | 117 (56.2%) | 80 (38.5%) |
| 6 to 18 Years | 347 (68.9%) | 193 (38.3%) |
| 19 to 25 Years | 27 (11.3%) | 185 (77.4%) |
| 25 to 34 Years | 162 (23.3%) | 489 (70.4%) |
| 35 to 44 Years | 86 (7.7%) | 737 (65.7%) |
| 45 to 54 Years | 160 (13.7%) | 793 (67.9%) |
| 55 to 64 Years | 566 (21.2%) | 2,249 (84.1%) |
| 65 to 74 Years | 1,931 (98.5%) | 1,063 (54.2%) |
| 75 Years and over | 1,344 (97.8%) | 691 (50.2%) |
| Total | 4,740 (47.7%) | 6,480 (65.2%) |
Disability Status by Sex by Age in Cape Canaveral
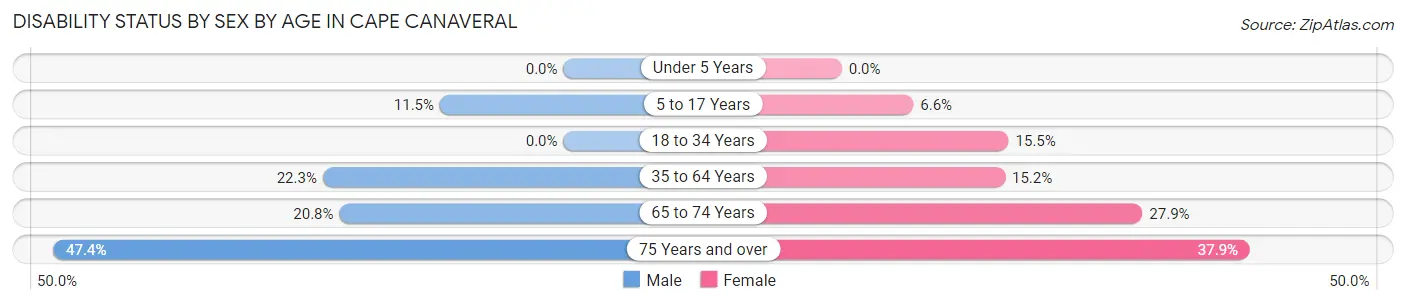
| Age Bracket | Male | Female |
| Under 5 Years | 0 (0.0%) | 0 (0.0%) |
| 5 to 17 Years | 37 (11.5%) | 14 (6.6%) |
| 18 to 34 Years | 0 (0.0%) | 63 (15.5%) |
| 35 to 64 Years | 545 (22.3%) | 382 (15.1%) |
| 65 to 74 Years | 225 (20.8%) | 245 (27.9%) |
| 75 Years and over | 331 (47.3%) | 256 (37.9%) |
Disability Class by Sex by Age in Cape Canaveral
Disability Class: Hearing Difficulty
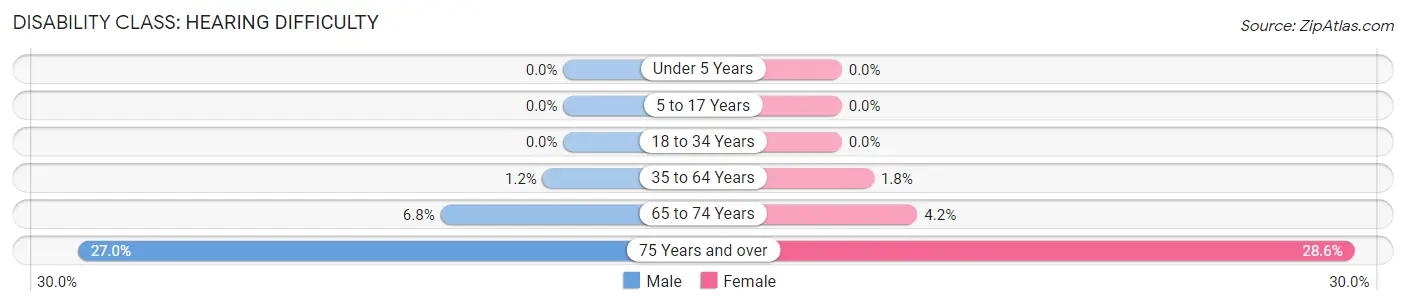
| Age Bracket | Male | Female |
| Under 5 Years | 0 (0.0%) | 0 (0.0%) |
| 5 to 17 Years | 0 (0.0%) | 0 (0.0%) |
| 18 to 34 Years | 0 (0.0%) | 0 (0.0%) |
| 35 to 64 Years | 28 (1.1%) | 45 (1.8%) |
| 65 to 74 Years | 74 (6.8%) | 37 (4.2%) |
| 75 Years and over | 189 (27.0%) | 193 (28.5%) |
Disability Class: Vision Difficulty
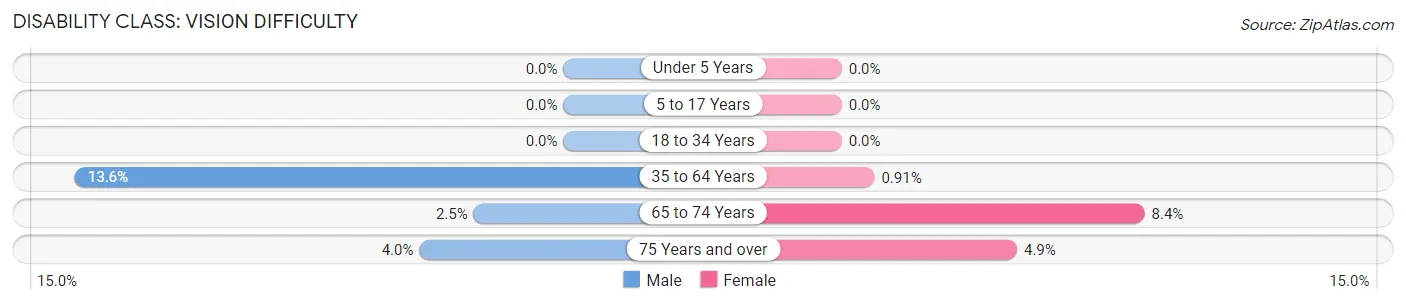
| Age Bracket | Male | Female |
| Under 5 Years | 0 (0.0%) | 0 (0.0%) |
| 5 to 17 Years | 0 (0.0%) | 0 (0.0%) |
| 18 to 34 Years | 0 (0.0%) | 0 (0.0%) |
| 35 to 64 Years | 332 (13.6%) | 23 (0.9%) |
| 65 to 74 Years | 27 (2.5%) | 74 (8.4%) |
| 75 Years and over | 28 (4.0%) | 33 (4.9%) |
Disability Class: Cognitive Difficulty
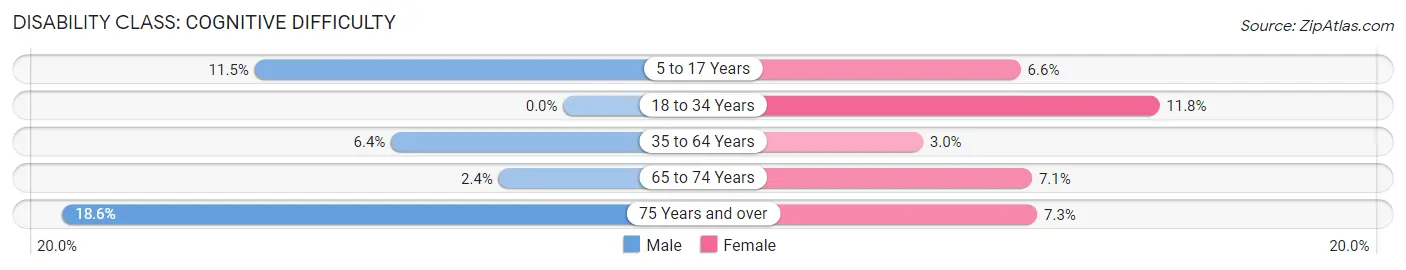
| Age Bracket | Male | Female |
| 5 to 17 Years | 37 (11.5%) | 14 (6.6%) |
| 18 to 34 Years | 0 (0.0%) | 48 (11.8%) |
| 35 to 64 Years | 156 (6.4%) | 76 (3.0%) |
| 65 to 74 Years | 26 (2.4%) | 62 (7.1%) |
| 75 Years and over | 130 (18.6%) | 49 (7.2%) |
Disability Class: Ambulatory Difficulty
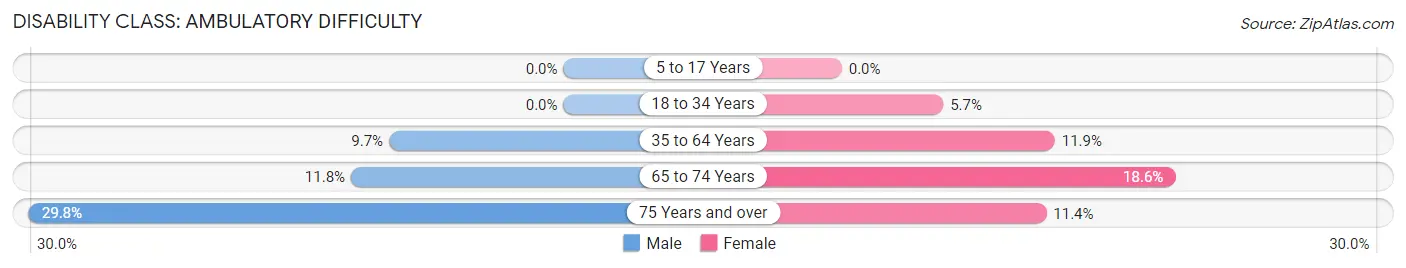
| Age Bracket | Male | Female |
| 5 to 17 Years | 0 (0.0%) | 0 (0.0%) |
| 18 to 34 Years | 0 (0.0%) | 23 (5.7%) |
| 35 to 64 Years | 237 (9.7%) | 299 (11.9%) |
| 65 to 74 Years | 128 (11.8%) | 163 (18.6%) |
| 75 Years and over | 208 (29.8%) | 77 (11.4%) |
Disability Class: Self-Care Difficulty
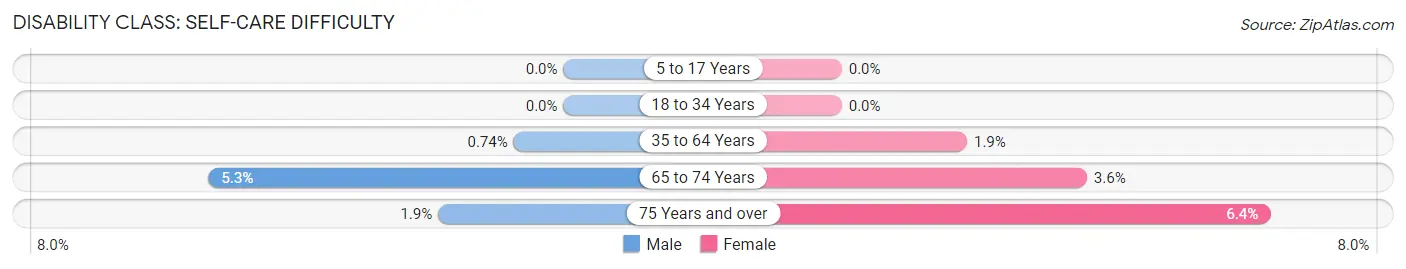
| Age Bracket | Male | Female |
| 5 to 17 Years | 0 (0.0%) | 0 (0.0%) |
| 18 to 34 Years | 0 (0.0%) | 0 (0.0%) |
| 35 to 64 Years | 18 (0.7%) | 47 (1.9%) |
| 65 to 74 Years | 57 (5.3%) | 32 (3.6%) |
| 75 Years and over | 13 (1.9%) | 43 (6.4%) |
Technology Access in Cape Canaveral
Computing Device Access in Cape Canaveral
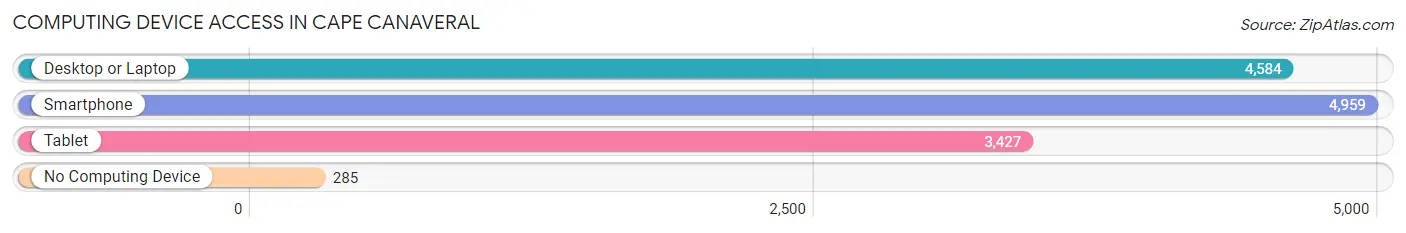
| Device Type | # Households | % Households |
| Desktop or Laptop | 4,584 | 79.4% |
| Smartphone | 4,959 | 85.9% |
| Tablet | 3,427 | 59.3% |
| No Computing Device | 285 | 4.9% |
| Total | 5,776 | 100.0% |
Internet Access in Cape Canaveral
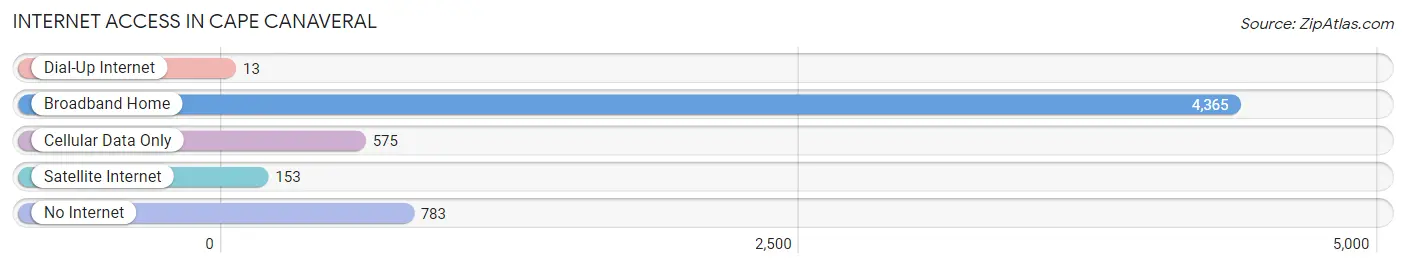
| Internet Type | # Households | % Households |
| Dial-Up Internet | 13 | 0.2% |
| Broadband Home | 4,365 | 75.6% |
| Cellular Data Only | 575 | 10.0% |
| Satellite Internet | 153 | 2.6% |
| No Internet | 783 | 13.6% |
| Total | 5,776 | 100.0% |
Cape Canaveral Summary
Cape Canaveral is a city located in Brevard County, Florida, United States. It is part of the Palm Bay–Melbourne–Titusville Metropolitan Statistical Area. The population was 9,912 at the 2010 United States Census. It is part of the Space Coast region of Florida.
History
The area around Cape Canaveral was first inhabited by the Ais Indians, who were part of the Timucua people. The area was explored by Spanish explorers in the 16th century, and the first European settlement was established in the area in 1763. The area was named Cape Canaveral by the Spanish, which means “Cape of Reeds”.
In the 19th century, the area was used as a cattle ranching area. In the early 20th century, the area was used for military purposes, and the first military installation was established in the area in 1949.
In the 1950s, the area was chosen as the site for the launch of the first U.S. satellite, Explorer 1. This event marked the beginning of the Space Age, and the area became known as the “Space Coast”.
In the 1960s, the area was chosen as the site for the launch of the first U.S. manned space mission, Apollo 11. This event marked the beginning of the Apollo program, and the area became known as the “Cradle of the Space Age”.
In the 1970s, the area was chosen as the site for the launch of the first Space Shuttle mission, STS-1. This event marked the beginning of the Space Shuttle program, and the area became known as the “Gateway to the Stars”.
Geography
Cape Canaveral is located on the east coast of Florida, on the Atlantic Ocean. It is located at 28°24'N 80°36'W. The city is located on a barrier island, and is bordered by the Banana River to the west and the Indian River to the east.
The city has a total area of 8.3 square miles, of which 7.9 square miles is land and 0.4 square miles is water. The city is located on a peninsula, and is surrounded by the Atlantic Ocean to the east, the Banana River to the west, and the Indian River to the south.
Economy
Cape Canaveral is home to a variety of businesses and industries. The city is home to the Kennedy Space Center, which is the primary launch site for the U.S. space program. The city is also home to a variety of aerospace and defense contractors, as well as a number of tourist attractions.
The city is also home to a variety of retail and service businesses, as well as a number of restaurants and hotels. The city is also home to a number of marinas, which provide access to the Atlantic Ocean and the Indian River.
Demographics
As of the 2010 United States Census, there were 9,912 people, 4,072 households, and 2,541 families residing in the city. The population density was 1,258.3 people per square mile. There were 4,845 housing units at an average density of 612.3 per square mile.
The racial makeup of the city was 79.2% White, 11.3% African American, 0.4% Native American, 2.2% Asian, 0.1% Pacific Islander, 4.3% from other races, and 2.5% from two or more races. Hispanic or Latino of any race were 11.3% of the population.
The median income for a household in the city was $41,945, and the median income for a family was $50,945. Males had a median income of $37,945 versus $27,945 for females. The per capita income for the city was $21,945. About 8.3% of families and 10.3% of the population were below the poverty line, including 14.3% of those under age 18 and 6.3% of those age 65 or over.
Common Questions
What is Per Capita Income in Cape Canaveral?
Per Capita income in Cape Canaveral is $50,214.
What is the Median Family Income in Cape Canaveral?
Median Family Income in Cape Canaveral is $86,014.
What is the Median Household income in Cape Canaveral?
Median Household Income in Cape Canaveral is $68,495.
What is Income or Wage Gap in Cape Canaveral?
Income or Wage Gap in Cape Canaveral is 15.1%.
Women in Cape Canaveral earn 84.9 cents for every dollar earned by a man.
What is Family Income Deficit in Cape Canaveral?
Family Income Deficit in Cape Canaveral is $12,486.
Families that are below poverty line in Cape Canaveral earn $12,486 less on average than the poverty threshold level.
What is Inequality or Gini Index in Cape Canaveral?
Inequality or Gini Index in Cape Canaveral is 0.42.
What is the Total Population of Cape Canaveral?
Total Population of Cape Canaveral is 9,980.
What is the Total Male Population of Cape Canaveral?
Total Male Population of Cape Canaveral is 5,205.
What is the Total Female Population of Cape Canaveral?
Total Female Population of Cape Canaveral is 4,775.
What is the Ratio of Males per 100 Females in Cape Canaveral?
There are 109.01 Males per 100 Females in Cape Canaveral.
What is the Ratio of Females per 100 Males in Cape Canaveral?
There are 91.74 Females per 100 Males in Cape Canaveral.
What is the Median Population Age in Cape Canaveral?
Median Population Age in Cape Canaveral is 59.0 Years.
What is the Average Family Size in Cape Canaveral
Average Family Size in Cape Canaveral is 2.3 People.
What is the Average Household Size in Cape Canaveral
Average Household Size in Cape Canaveral is 1.7 People.
How Large is the Labor Force in Cape Canaveral?
There are 5,380 People in the Labor Forcein in Cape Canaveral.
What is the Percentage of People in the Labor Force in Cape Canaveral?
57.1% of People are in the Labor Force in Cape Canaveral.
What is the Unemployment Rate in Cape Canaveral?
Unemployment Rate in Cape Canaveral is 2.9%.