Bowling Green, FL Map & Demographics
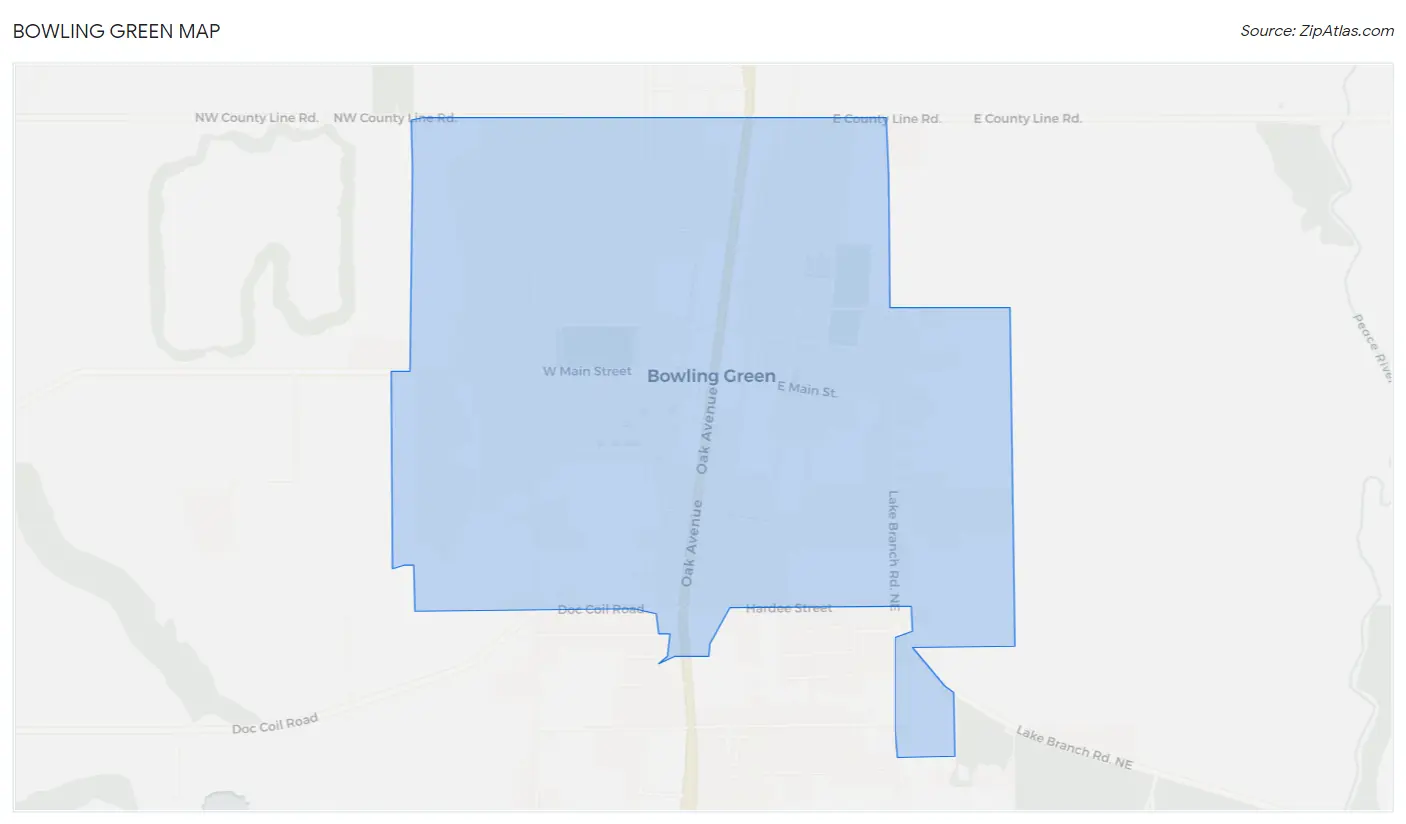
Bowling Green Map
Bowling Green Overview
$18,995
PER CAPITA INCOME
$52,368
AVG FAMILY INCOME
$46,429
AVG HOUSEHOLD INCOME
32.7%
WAGE / INCOME GAP [ % ]
67.3¢/ $1
WAGE / INCOME GAP [ $ ]
$10,104
FAMILY INCOME DEFICIT
0.48
INEQUALITY / GINI INDEX
2,484
TOTAL POPULATION
1,363
MALE POPULATION
1,121
FEMALE POPULATION
121.59
MALES / 100 FEMALES
82.25
FEMALES / 100 MALES
26.9
MEDIAN AGE
3.7
AVG FAMILY SIZE
3.3
AVG HOUSEHOLD SIZE
1,019
LABOR FORCE [ PEOPLE ]
54.5%
PERCENT IN LABOR FORCE
13.8%
UNEMPLOYMENT RATE
Bowling Green Zip Codes
Bowling Green Area Codes
Income in Bowling Green
Income Overview in Bowling Green
Per Capita Income in Bowling Green is $18,995, while median incomes of families and households are $52,368 and $46,429 respectively.
| Characteristic | Number | Measure |
| Per Capita Income | 2,484 | $18,995 |
| Median Family Income | 542 | $52,368 |
| Mean Family Income | 542 | $67,388 |
| Median Household Income | 728 | $46,429 |
| Mean Household Income | 728 | $64,241 |
| Income Deficit | 542 | $10,104 |
| Wage / Income Gap (%) | 2,484 | 32.68% |
| Wage / Income Gap ($) | 2,484 | 67.32¢ per $1 |
| Gini / Inequality Index | 2,484 | 0.48 |
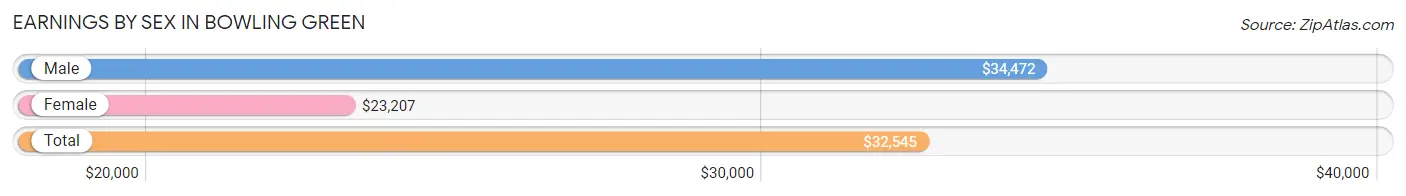
Earnings by Sex in Bowling Green
Average Earnings in Bowling Green are $32,545, $34,472 for men and $23,207 for women, a difference of 32.7%.
| Sex | Number | Average Earnings |
| Male | 606 (58.1%) | $34,472 |
| Female | 437 (41.9%) | $23,207 |
| Total | 1,043 (100.0%) | $32,545 |
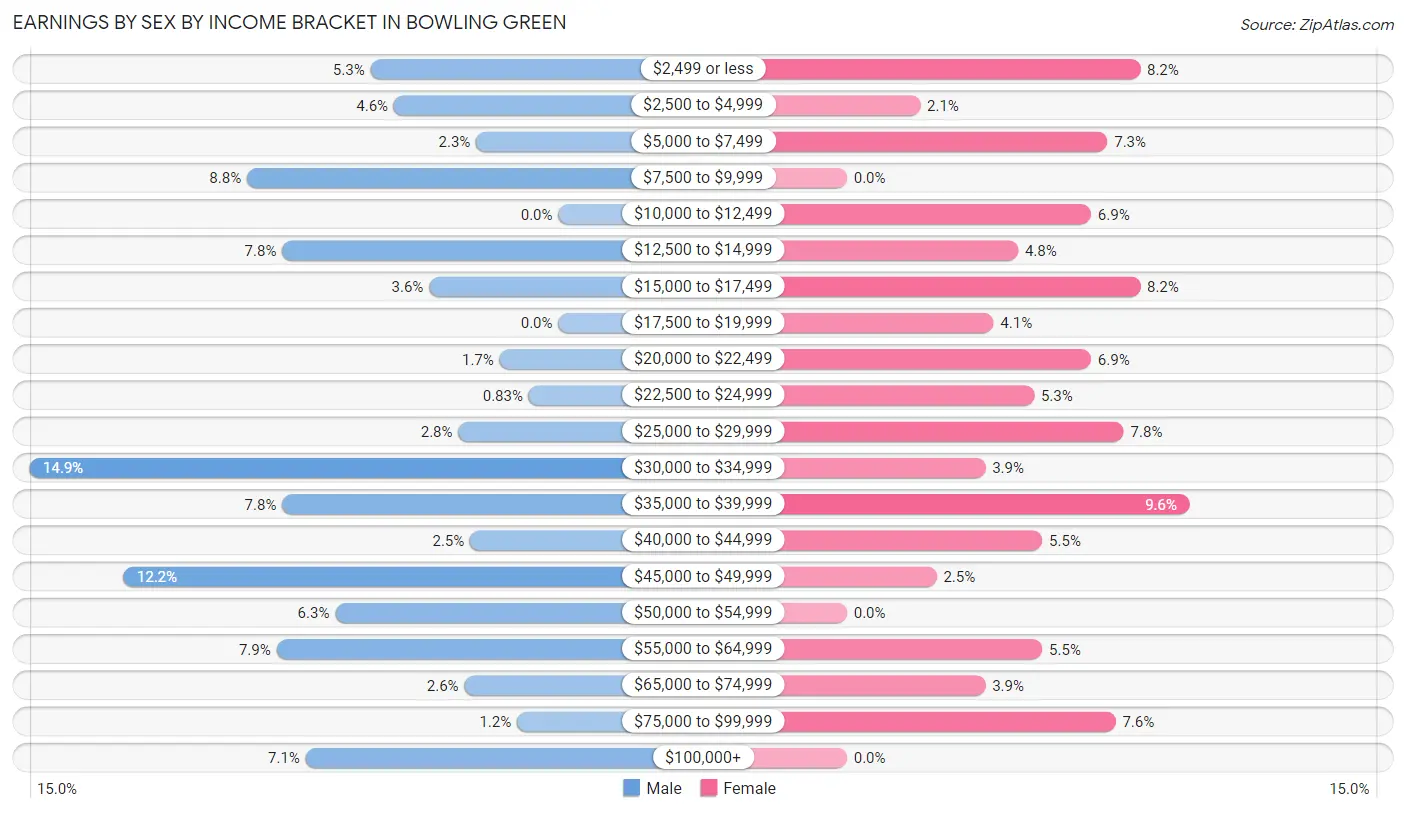
Earnings by Sex by Income Bracket in Bowling Green
The most common earnings brackets in Bowling Green are $30,000 to $34,999 for men (90 | 14.8%) and $35,000 to $39,999 for women (42 | 9.6%).
| Income | Male | Female |
| $2,499 or less | 32 (5.3%) | 36 (8.2%) |
| $2,500 to $4,999 | 28 (4.6%) | 9 (2.1%) |
| $5,000 to $7,499 | 14 (2.3%) | 32 (7.3%) |
| $7,500 to $9,999 | 53 (8.7%) | 0 (0.0%) |
| $10,000 to $12,499 | 0 (0.0%) | 30 (6.9%) |
| $12,500 to $14,999 | 47 (7.8%) | 21 (4.8%) |
| $15,000 to $17,499 | 22 (3.6%) | 36 (8.2%) |
| $17,500 to $19,999 | 0 (0.0%) | 18 (4.1%) |
| $20,000 to $22,499 | 10 (1.7%) | 30 (6.9%) |
| $22,500 to $24,999 | 5 (0.8%) | 23 (5.3%) |
| $25,000 to $29,999 | 17 (2.8%) | 34 (7.8%) |
| $30,000 to $34,999 | 90 (14.8%) | 17 (3.9%) |
| $35,000 to $39,999 | 47 (7.8%) | 42 (9.6%) |
| $40,000 to $44,999 | 15 (2.5%) | 24 (5.5%) |
| $45,000 to $49,999 | 74 (12.2%) | 11 (2.5%) |
| $50,000 to $54,999 | 38 (6.3%) | 0 (0.0%) |
| $55,000 to $64,999 | 48 (7.9%) | 24 (5.5%) |
| $65,000 to $74,999 | 16 (2.6%) | 17 (3.9%) |
| $75,000 to $99,999 | 7 (1.2%) | 33 (7.5%) |
| $100,000+ | 43 (7.1%) | 0 (0.0%) |
| Total | 606 (100.0%) | 437 (100.0%) |
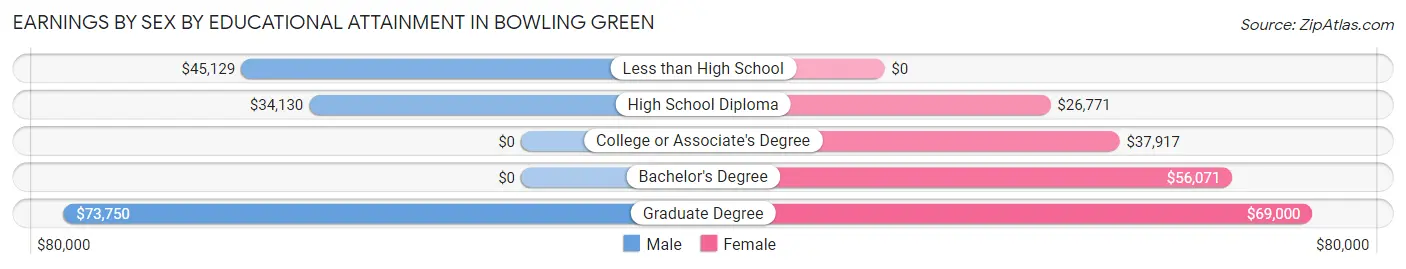
Earnings by Sex by Educational Attainment in Bowling Green
Average earnings in Bowling Green are $38,242 for men and $34,135 for women, a difference of 10.7%. Men with an educational attainment of graduate degree enjoy the highest average annual earnings of $73,750, while those with high school diploma education earn the least with $34,130. Women with an educational attainment of graduate degree earn the most with the average annual earnings of $69,000, while those with high school diploma education have the smallest earnings of $26,771.
| Educational Attainment | Male Income | Female Income |
| Less than High School | $45,129 | $0 |
| High School Diploma | $34,130 | $26,771 |
| College or Associate's Degree | - | - |
| Bachelor's Degree | - | - |
| Graduate Degree | $73,750 | $69,000 |
| Total | $38,242 | $34,135 |
Family Income in Bowling Green
Family Income Brackets in Bowling Green
According to the Bowling Green family income data, there are 110 families falling into the $50,000 to $74,999 income range, which is the most common income bracket and makes up 20.3% of all families. Conversely, the $150,000 to $199,999 income bracket is the least frequent group with only 14 families (2.6%) belonging to this category.
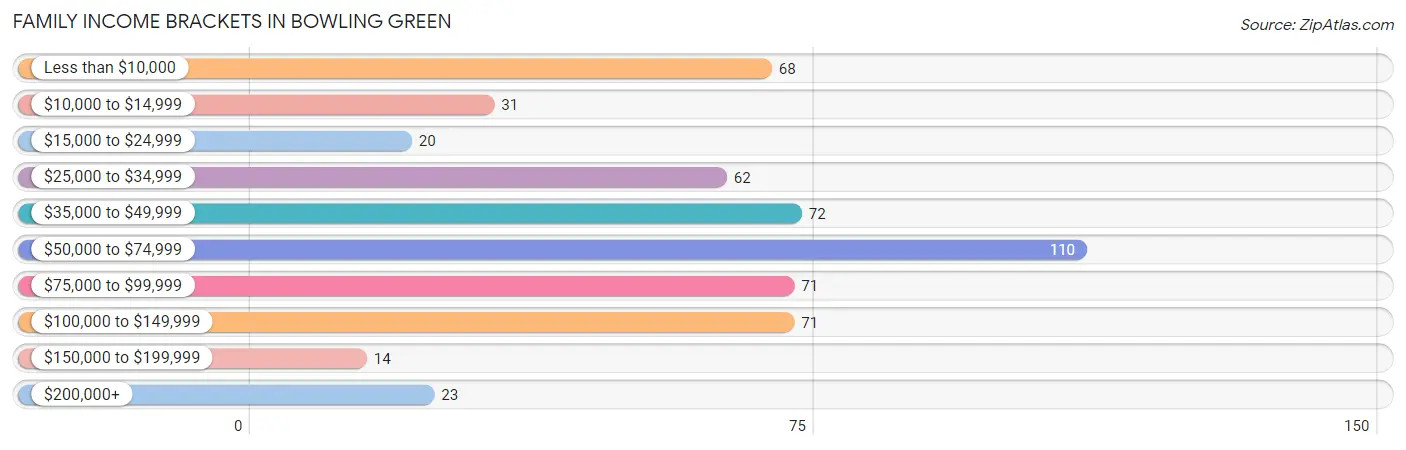
| Income Bracket | # Families | % Families |
| Less than $10,000 | 68 | 12.5% |
| $10,000 to $14,999 | 31 | 5.7% |
| $15,000 to $24,999 | 20 | 3.7% |
| $25,000 to $34,999 | 62 | 11.4% |
| $35,000 to $49,999 | 72 | 13.3% |
| $50,000 to $74,999 | 110 | 20.3% |
| $75,000 to $99,999 | 71 | 13.1% |
| $100,000 to $149,999 | 71 | 13.1% |
| $150,000 to $199,999 | 14 | 2.6% |
| $200,000+ | 23 | 4.2% |
Family Income by Famaliy Size in Bowling Green
6-person families (34 | 6.3%) account for the highest median family income in Bowling Green with $107,857 per family, while 2-person families (217 | 40.0%) have the highest median income of $22,375 per family member.
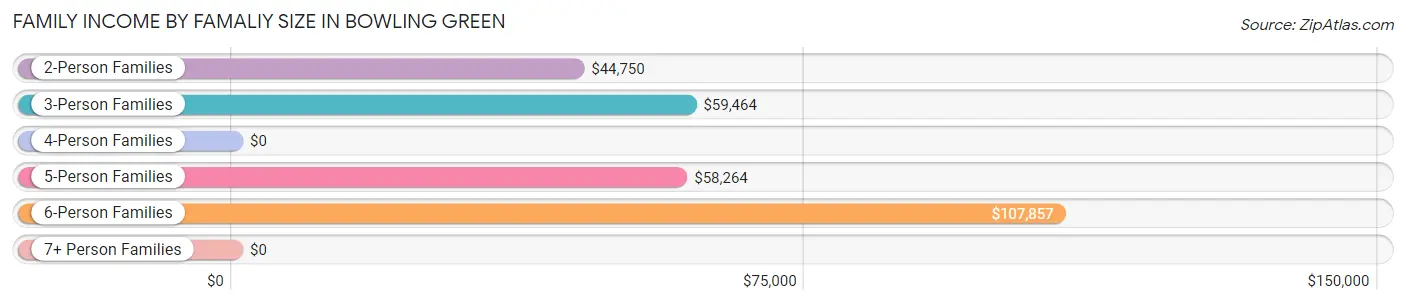
| Income Bracket | # Families | Median Income |
| 2-Person Families | 217 (40.0%) | $44,750 |
| 3-Person Families | 79 (14.6%) | $59,464 |
| 4-Person Families | 71 (13.1%) | $0 |
| 5-Person Families | 133 (24.5%) | $58,264 |
| 6-Person Families | 34 (6.3%) | $107,857 |
| 7+ Person Families | 8 (1.5%) | $0 |
| Total | 542 (100.0%) | $52,368 |
Family Income by Number of Earners in Bowling Green
The median family income in Bowling Green is $52,368, with families comprising 3+ earners (67) having the highest median family income of $108,802, while families with no earners (146) have the lowest median family income of $11,250, accounting for 12.4% and 26.9% of families, respectively.
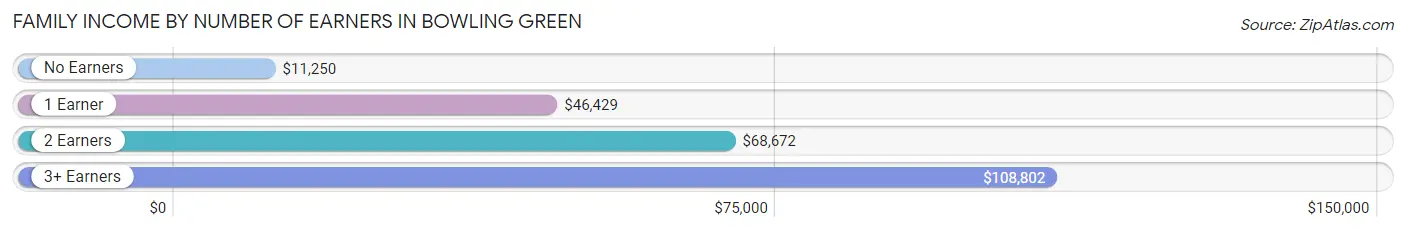
| Number of Earners | # Families | Median Income |
| No Earners | 146 (26.9%) | $11,250 |
| 1 Earner | 148 (27.3%) | $46,429 |
| 2 Earners | 181 (33.4%) | $68,672 |
| 3+ Earners | 67 (12.4%) | $108,802 |
| Total | 542 (100.0%) | $52,368 |
Household Income in Bowling Green
Household Income Brackets in Bowling Green
With 131 households falling in the category, the $50,000 to $74,999 income range is the most frequent in Bowling Green, accounting for 18.0% of all households. In contrast, only 14 households (1.9%) fall into the $150,000 to $199,999 income bracket, making it the least populous group.
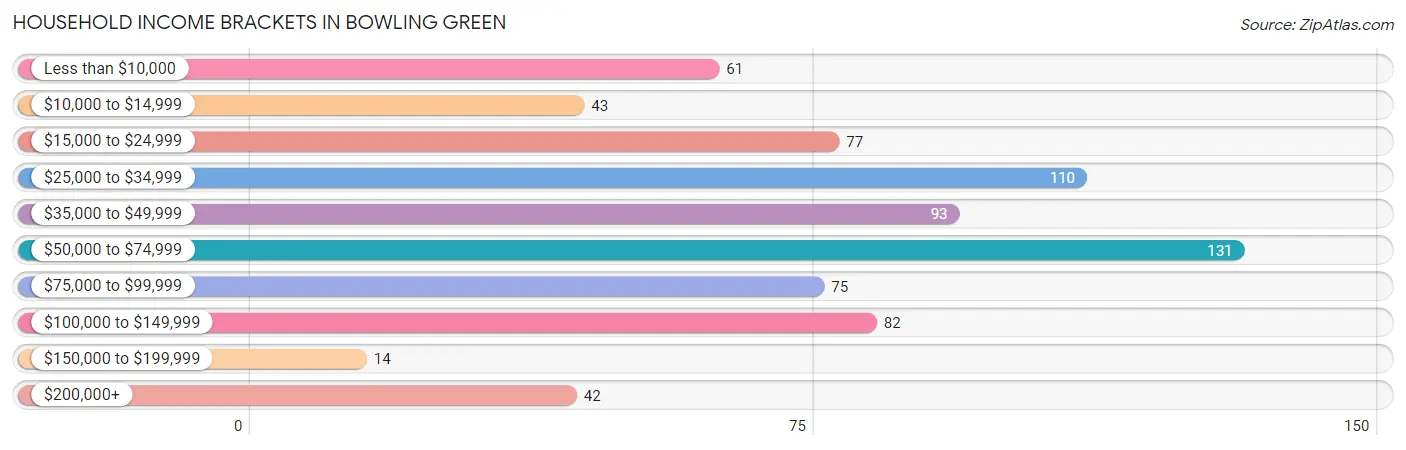
| Income Bracket | # Households | % Households |
| Less than $10,000 | 61 | 8.4% |
| $10,000 to $14,999 | 43 | 5.9% |
| $15,000 to $24,999 | 77 | 10.6% |
| $25,000 to $34,999 | 110 | 15.1% |
| $35,000 to $49,999 | 93 | 12.8% |
| $50,000 to $74,999 | 131 | 18.0% |
| $75,000 to $99,999 | 75 | 10.3% |
| $100,000 to $149,999 | 82 | 11.3% |
| $150,000 to $199,999 | 14 | 1.9% |
| $200,000+ | 42 | 5.8% |
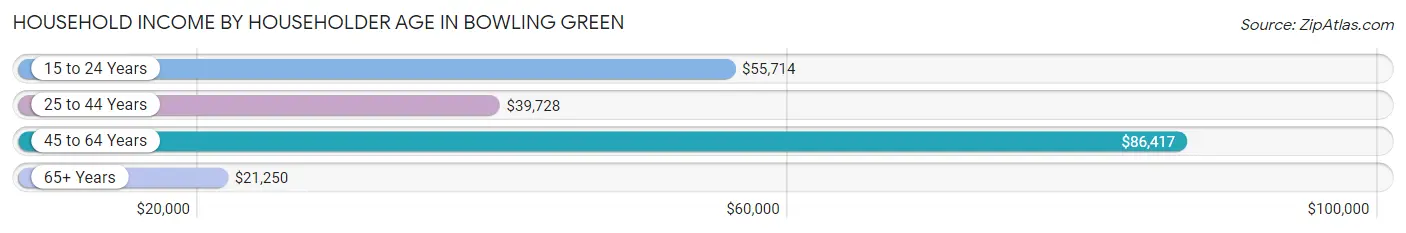
Household Income by Householder Age in Bowling Green
The median household income in Bowling Green is $46,429, with the highest median household income of $86,417 found in the 45 to 64 years age bracket for the primary householder. A total of 225 households (30.9%) fall into this category. Meanwhile, the 65+ years age bracket for the primary householder has the lowest median household income of $21,250, with 200 households (27.5%) in this group.
| Income Bracket | # Households | Median Income |
| 15 to 24 Years | 82 (11.3%) | $55,714 |
| 25 to 44 Years | 221 (30.4%) | $39,728 |
| 45 to 64 Years | 225 (30.9%) | $86,417 |
| 65+ Years | 200 (27.5%) | $21,250 |
| Total | 728 (100.0%) | $46,429 |
Poverty in Bowling Green
Income Below Poverty by Sex and Age in Bowling Green
With 32.4% poverty level for males and 35.1% for females among the residents of Bowling Green, 15 year old males and 16 and 17 year old females are the most vulnerable to poverty, with 61 males (78.2%) and 50 females (82.0%) in their respective age groups living below the poverty level.
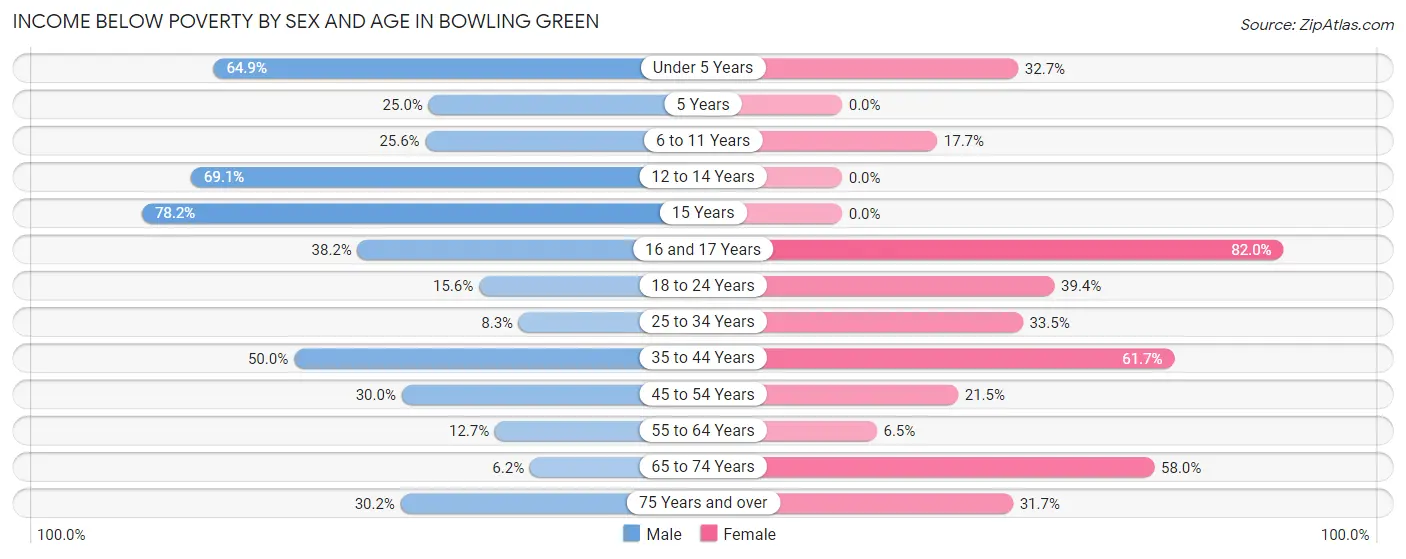
| Age Bracket | Male | Female |
| Under 5 Years | 87 (64.9%) | 17 (32.7%) |
| 5 Years | 10 (25.0%) | 0 (0.0%) |
| 6 to 11 Years | 32 (25.6%) | 9 (17.6%) |
| 12 to 14 Years | 47 (69.1%) | 0 (0.0%) |
| 15 Years | 61 (78.2%) | 0 (0.0%) |
| 16 and 17 Years | 21 (38.2%) | 50 (82.0%) |
| 18 to 24 Years | 28 (15.6%) | 80 (39.4%) |
| 25 to 34 Years | 16 (8.3%) | 55 (33.5%) |
| 35 to 44 Years | 69 (50.0%) | 50 (61.7%) |
| 45 to 54 Years | 30 (30.0%) | 31 (21.5%) |
| 55 to 64 Years | 9 (12.7%) | 8 (6.5%) |
| 65 to 74 Years | 6 (6.2%) | 40 (58.0%) |
| 75 Years and over | 16 (30.2%) | 33 (31.7%) |
| Total | 432 (32.4%) | 373 (35.1%) |
Income Above Poverty by Sex and Age in Bowling Green
According to the poverty statistics in Bowling Green, males aged 65 to 74 years and females aged 12 to 14 years are the age groups that are most secure financially, with 93.8% of males and 100.0% of females in these age groups living above the poverty line.
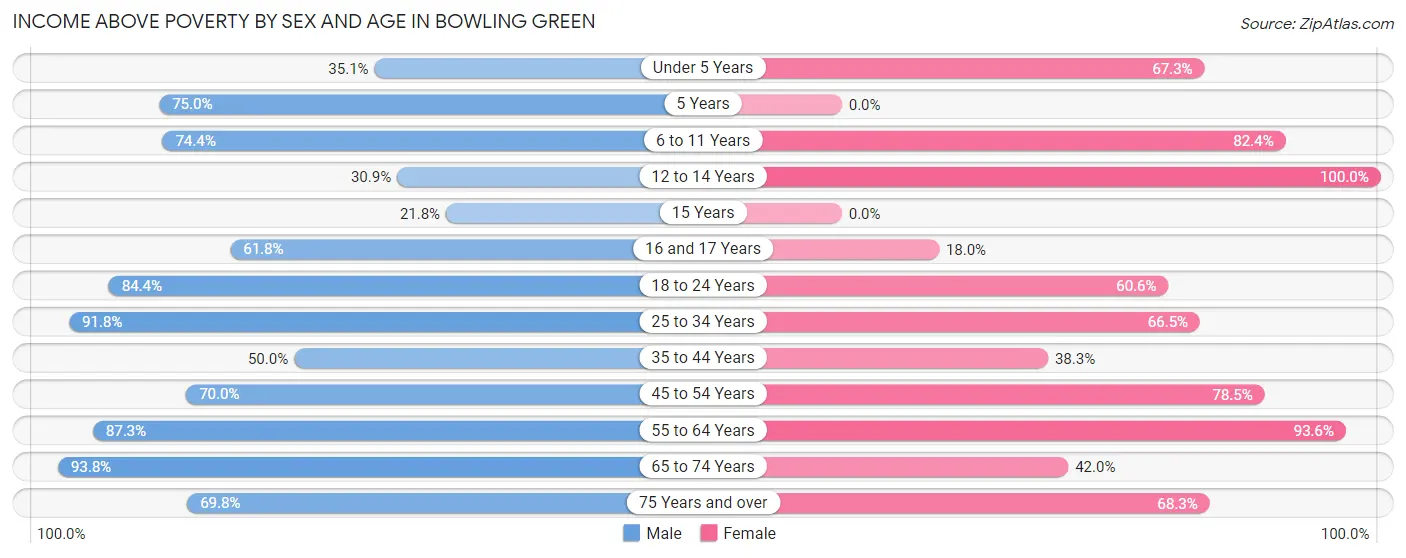
| Age Bracket | Male | Female |
| Under 5 Years | 47 (35.1%) | 35 (67.3%) |
| 5 Years | 30 (75.0%) | 0 (0.0%) |
| 6 to 11 Years | 93 (74.4%) | 42 (82.4%) |
| 12 to 14 Years | 21 (30.9%) | 9 (100.0%) |
| 15 Years | 17 (21.8%) | 0 (0.0%) |
| 16 and 17 Years | 34 (61.8%) | 11 (18.0%) |
| 18 to 24 Years | 151 (84.4%) | 123 (60.6%) |
| 25 to 34 Years | 178 (91.7%) | 109 (66.5%) |
| 35 to 44 Years | 69 (50.0%) | 31 (38.3%) |
| 45 to 54 Years | 70 (70.0%) | 113 (78.5%) |
| 55 to 64 Years | 62 (87.3%) | 116 (93.5%) |
| 65 to 74 Years | 91 (93.8%) | 29 (42.0%) |
| 75 Years and over | 37 (69.8%) | 71 (68.3%) |
| Total | 900 (67.6%) | 689 (64.9%) |
Income Below Poverty Among Married-Couple Families in Bowling Green
The poverty statistics for married-couple families in Bowling Green show that 21.4% or 81 of the total 378 families live below the poverty line. Families with 3 or 4 children have the highest poverty rate of 38.1%, comprising of 32 families. On the other hand, families with no children have the lowest poverty rate of 12.7%, which includes 20 families.
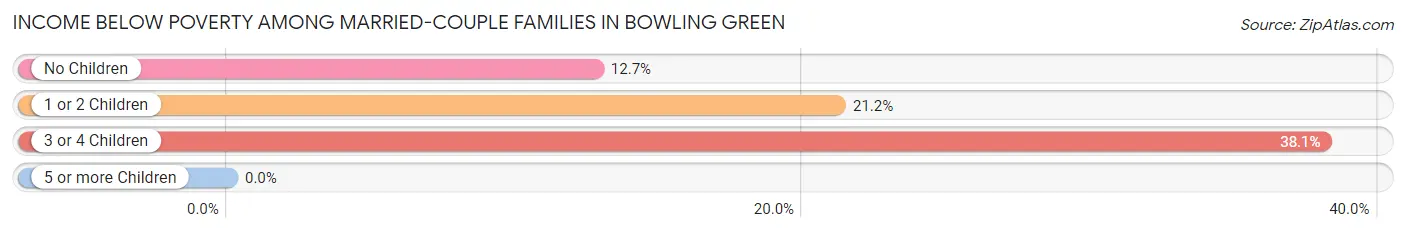
| Children | Above Poverty | Below Poverty |
| No Children | 137 (87.3%) | 20 (12.7%) |
| 1 or 2 Children | 108 (78.8%) | 29 (21.2%) |
| 3 or 4 Children | 52 (61.9%) | 32 (38.1%) |
| 5 or more Children | 0 (0.0%) | 0 (0.0%) |
| Total | 297 (78.6%) | 81 (21.4%) |
Income Below Poverty Among Single-Parent Households in Bowling Green
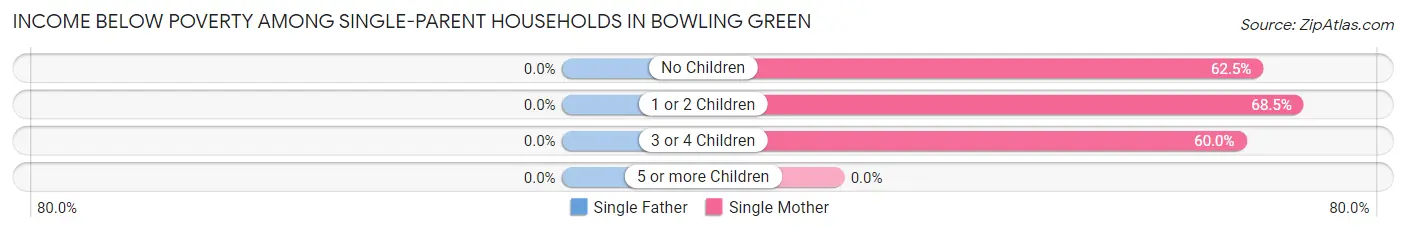
| Children | Single Father | Single Mother |
| No Children | 0 (0.0%) | 15 (62.5%) |
| 1 or 2 Children | 0 (0.0%) | 61 (68.5%) |
| 3 or 4 Children | 0 (0.0%) | 6 (60.0%) |
| 5 or more Children | 0 (0.0%) | 0 (0.0%) |
| Total | 0 (0.0%) | 82 (66.7%) |
Income Below Poverty Among Married-Couple vs Single-Parent Households in Bowling Green
The poverty data for Bowling Green shows that 81 of the married-couple family households (21.4%) and 82 of the single-parent households (50.0%) are living below the poverty level. Within the married-couple family households, those with 3 or 4 children have the highest poverty rate, with 32 households (38.1%) falling below the poverty line. Among the single-parent households, those with 3 or 4 children have the highest poverty rate, with 6 household (60.0%) living below poverty.
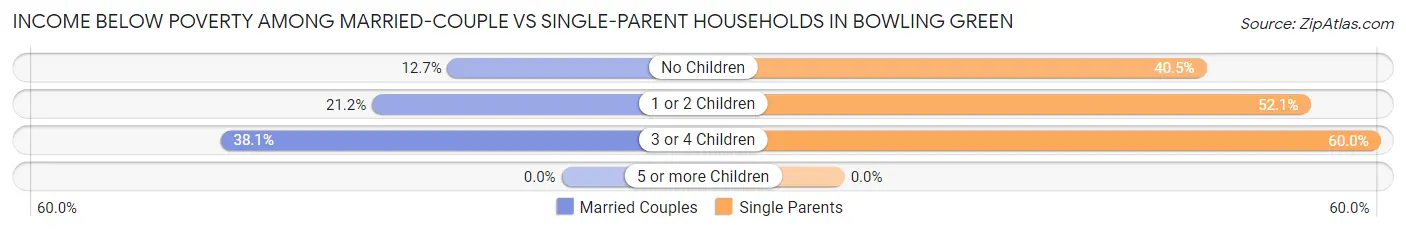
| Children | Married-Couple Families | Single-Parent Households |
| No Children | 20 (12.7%) | 15 (40.5%) |
| 1 or 2 Children | 29 (21.2%) | 61 (52.1%) |
| 3 or 4 Children | 32 (38.1%) | 6 (60.0%) |
| 5 or more Children | 0 (0.0%) | 0 (0.0%) |
| Total | 81 (21.4%) | 82 (50.0%) |
Race in Bowling Green
The most populous races in Bowling Green are White / Caucasian (1,431 | 57.6%), Hispanic or Latino (1,259 | 50.7%), and Two or more Races (583 | 23.5%).
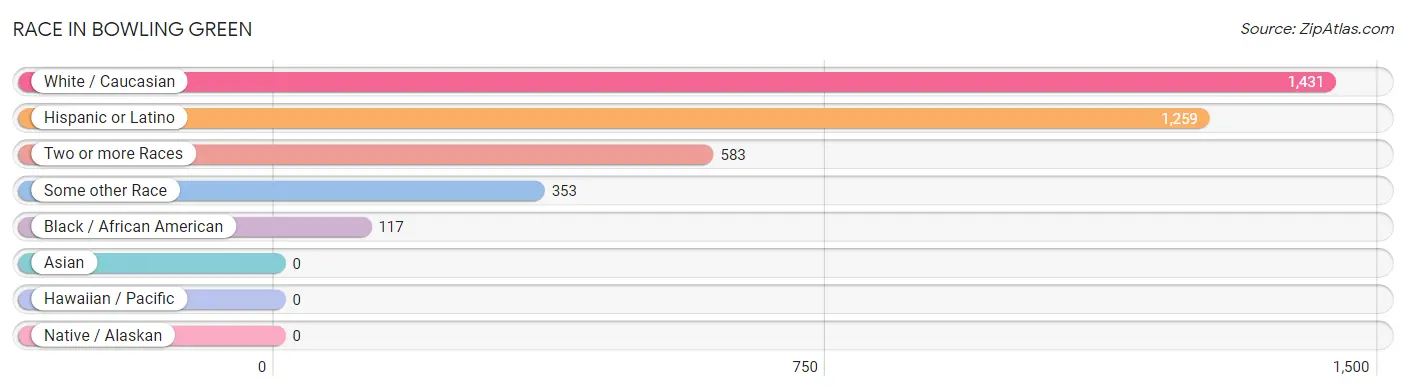
| Race | # Population | % Population |
| Asian | 0 | 0.0% |
| Black / African American | 117 | 4.7% |
| Hawaiian / Pacific | 0 | 0.0% |
| Hispanic or Latino | 1,259 | 50.7% |
| Native / Alaskan | 0 | 0.0% |
| White / Caucasian | 1,431 | 57.6% |
| Two or more Races | 583 | 23.5% |
| Some other Race | 353 | 14.2% |
| Total | 2,484 | 100.0% |
Ancestry in Bowling Green
The most populous ancestries reported in Bowling Green are Mexican (1,095 | 44.1%), Irish (232 | 9.3%), American (205 | 8.3%), English (153 | 6.2%), and German (122 | 4.9%), together accounting for 72.7% of all Bowling Green residents.
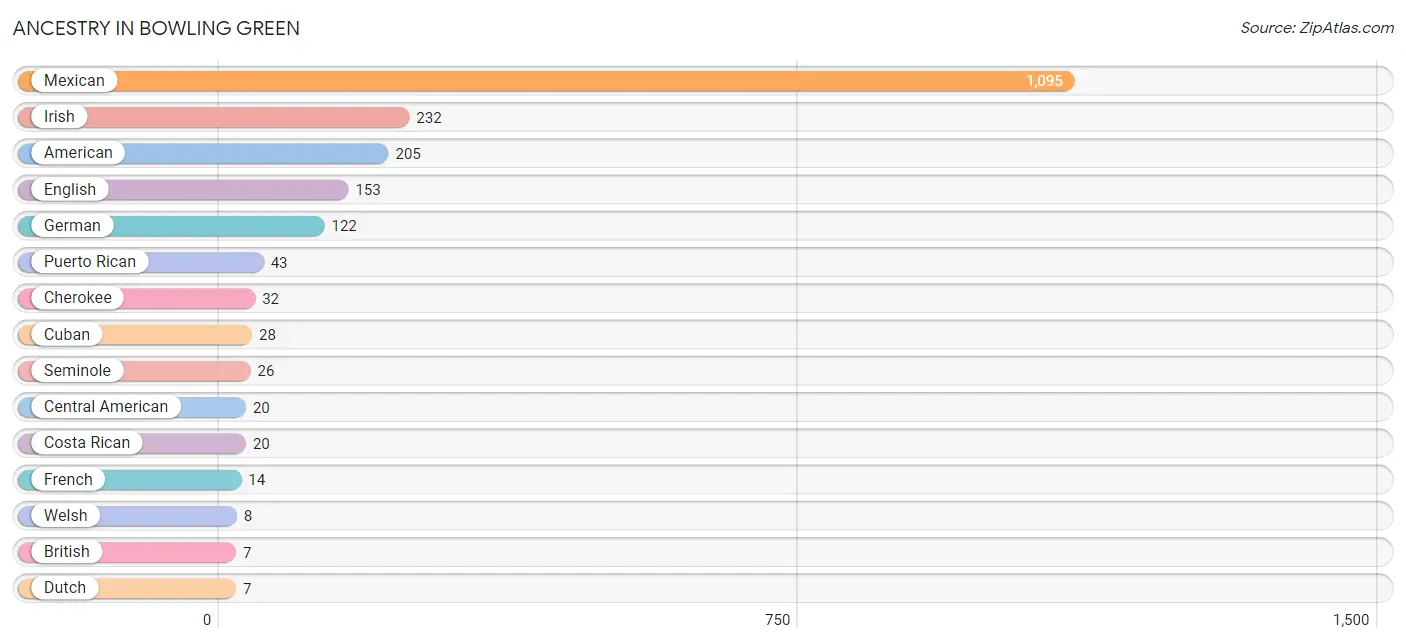
| Ancestry | # Population | % Population |
| African | 2 | 0.1% |
| American | 205 | 8.3% |
| British | 7 | 0.3% |
| Central American | 20 | 0.8% |
| Cherokee | 32 | 1.3% |
| Costa Rican | 20 | 0.8% |
| Cuban | 28 | 1.1% |
| Dutch | 7 | 0.3% |
| English | 153 | 6.2% |
| French | 14 | 0.6% |
| German | 122 | 4.9% |
| Guyanese | 5 | 0.2% |
| Irish | 232 | 9.3% |
| Italian | 6 | 0.2% |
| Mexican | 1,095 | 44.1% |
| Norwegian | 6 | 0.2% |
| Pennsylvania German | 5 | 0.2% |
| Peruvian | 7 | 0.3% |
| Puerto Rican | 43 | 1.7% |
| Scottish | 2 | 0.1% |
| Seminole | 26 | 1.1% |
| South American | 7 | 0.3% |
| Subsaharan African | 2 | 0.1% |
| Swedish | 4 | 0.2% |
| Swiss | 5 | 0.2% |
| Ukrainian | 3 | 0.1% |
| Welsh | 8 | 0.3% | View All 27 Rows |
Immigrants in Bowling Green
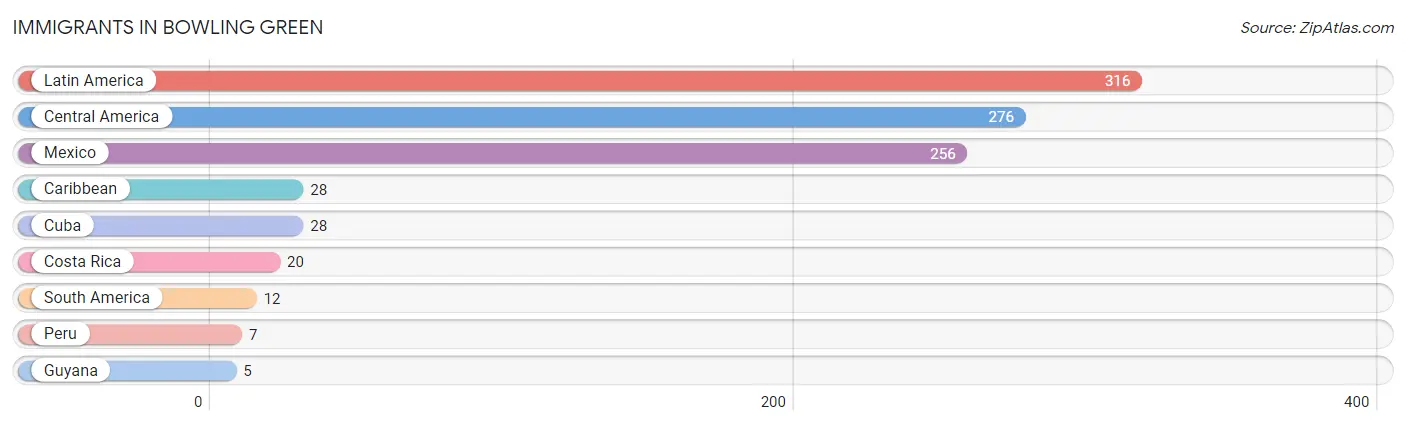
The most numerous immigrant groups reported in Bowling Green came from Latin America (316 | 12.7%), Central America (276 | 11.1%), Mexico (256 | 10.3%), Caribbean (28 | 1.1%), and Cuba (28 | 1.1%), together accounting for 36.4% of all Bowling Green residents.
| Immigration Origin | # Population | % Population |
| Caribbean | 28 | 1.1% |
| Central America | 276 | 11.1% |
| Costa Rica | 20 | 0.8% |
| Cuba | 28 | 1.1% |
| Guyana | 5 | 0.2% |
| Latin America | 316 | 12.7% |
| Mexico | 256 | 10.3% |
| Peru | 7 | 0.3% |
| South America | 12 | 0.5% | View All 9 Rows |
Sex and Age in Bowling Green
Sex and Age in Bowling Green
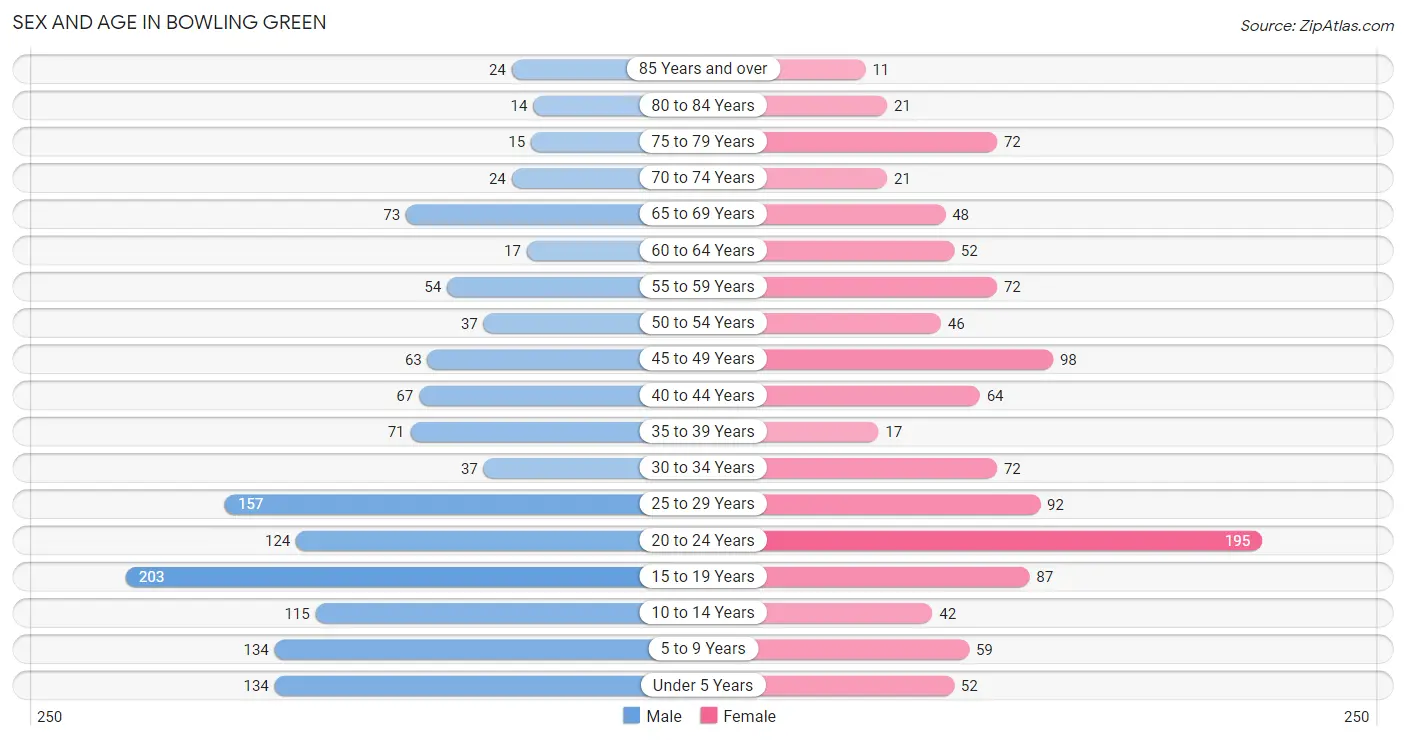
The most populous age groups in Bowling Green are 15 to 19 Years (203 | 14.9%) for men and 20 to 24 Years (195 | 17.4%) for women.
| Age Bracket | Male | Female |
| Under 5 Years | 134 (9.8%) | 52 (4.6%) |
| 5 to 9 Years | 134 (9.8%) | 59 (5.3%) |
| 10 to 14 Years | 115 (8.4%) | 42 (3.7%) |
| 15 to 19 Years | 203 (14.9%) | 87 (7.8%) |
| 20 to 24 Years | 124 (9.1%) | 195 (17.4%) |
| 25 to 29 Years | 157 (11.5%) | 92 (8.2%) |
| 30 to 34 Years | 37 (2.7%) | 72 (6.4%) |
| 35 to 39 Years | 71 (5.2%) | 17 (1.5%) |
| 40 to 44 Years | 67 (4.9%) | 64 (5.7%) |
| 45 to 49 Years | 63 (4.6%) | 98 (8.7%) |
| 50 to 54 Years | 37 (2.7%) | 46 (4.1%) |
| 55 to 59 Years | 54 (4.0%) | 72 (6.4%) |
| 60 to 64 Years | 17 (1.3%) | 52 (4.6%) |
| 65 to 69 Years | 73 (5.4%) | 48 (4.3%) |
| 70 to 74 Years | 24 (1.8%) | 21 (1.9%) |
| 75 to 79 Years | 15 (1.1%) | 72 (6.4%) |
| 80 to 84 Years | 14 (1.0%) | 21 (1.9%) |
| 85 Years and over | 24 (1.8%) | 11 (1.0%) |
| Total | 1,363 (100.0%) | 1,121 (100.0%) |
Families and Households in Bowling Green
Median Family Size in Bowling Green
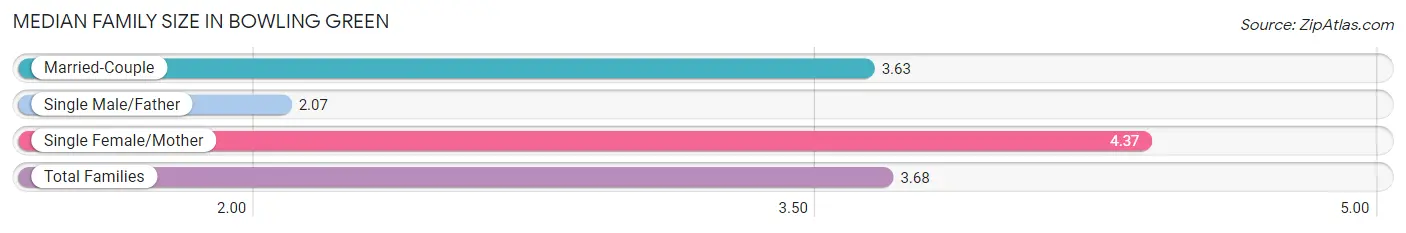
The median family size in Bowling Green is 3.68 persons per family, with single female/mother families (123 | 22.7%) accounting for the largest median family size of 4.37 persons per family. On the other hand, single male/father families (41 | 7.6%) represent the smallest median family size with 2.07 persons per family.
| Family Type | # Families | Family Size |
| Married-Couple | 378 (69.7%) | 3.63 |
| Single Male/Father | 41 (7.6%) | 2.07 |
| Single Female/Mother | 123 (22.7%) | 4.37 |
| Total Families | 542 (100.0%) | 3.68 |
Median Household Size in Bowling Green
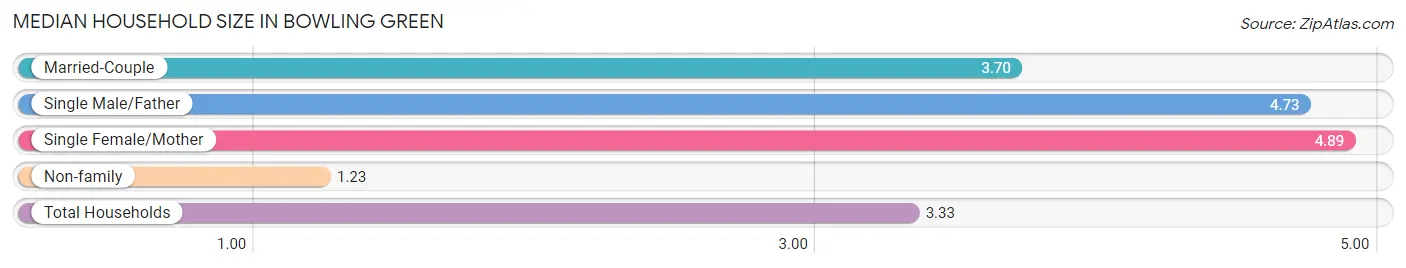
The median household size in Bowling Green is 3.33 persons per household, with single female/mother households (123 | 16.9%) accounting for the largest median household size of 4.89 persons per household. non-family households (186 | 25.6%) represent the smallest median household size with 1.23 persons per household.
| Household Type | # Households | Household Size |
| Married-Couple | 378 (51.9%) | 3.70 |
| Single Male/Father | 41 (5.6%) | 4.73 |
| Single Female/Mother | 123 (16.9%) | 4.89 |
| Non-family | 186 (25.6%) | 1.23 |
| Total Households | 728 (100.0%) | 3.33 |
Household Size by Marriage Status in Bowling Green
Out of a total of 728 households in Bowling Green, 542 (74.5%) are family households, while 186 (25.6%) are nonfamily households. The most numerous type of family households are 5-person households, comprising 138, and the most common type of nonfamily households are 1-person households, comprising 148.
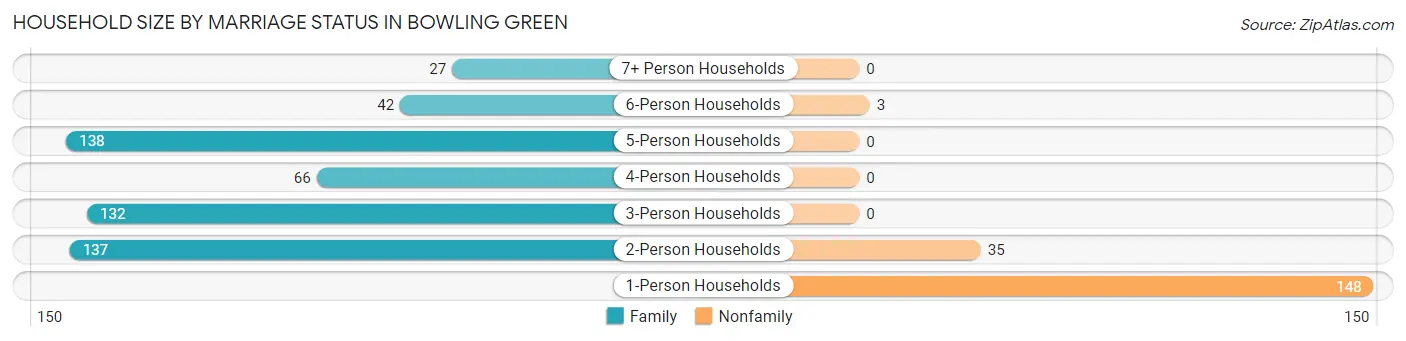
| Household Size | Family Households | Nonfamily Households |
| 1-Person Households | - | 148 (20.3%) |
| 2-Person Households | 137 (18.8%) | 35 (4.8%) |
| 3-Person Households | 132 (18.1%) | 0 (0.0%) |
| 4-Person Households | 66 (9.1%) | 0 (0.0%) |
| 5-Person Households | 138 (19.0%) | 0 (0.0%) |
| 6-Person Households | 42 (5.8%) | 3 (0.4%) |
| 7+ Person Households | 27 (3.7%) | 0 (0.0%) |
| Total | 542 (74.5%) | 186 (25.6%) |
Female Fertility in Bowling Green
Fertility by Age in Bowling Green
Average fertility rate in Bowling Green is 16.0 births per 1,000 women. Women in the age bracket of 35 to 50 years have the highest fertility rate with 21.0 births per 1,000 women. Women in the age bracket of 20 to 34 years acount for 60.0% of all women with births.
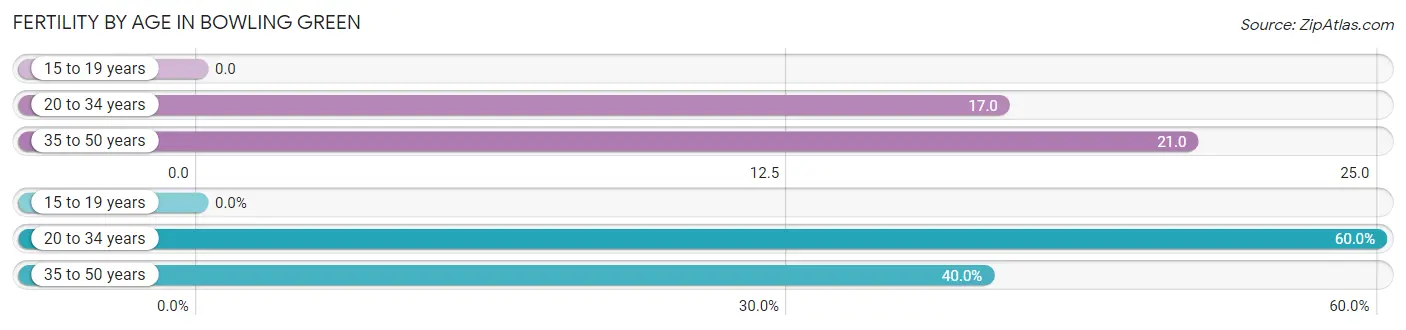
| Age Bracket | Women with Births | Births / 1,000 Women |
| 15 to 19 years | 0 (0.0%) | 0.0 |
| 20 to 34 years | 6 (60.0%) | 17.0 |
| 35 to 50 years | 4 (40.0%) | 21.0 |
| Total | 10 (100.0%) | 16.0 |
Fertility by Age by Marriage Status in Bowling Green
60.0% of women with births (10) in Bowling Green are married. The highest percentage of unmarried women with births falls into 35 to 50 years age bracket with 100.0% of them unmarried at the time of birth, while the lowest percentage of unmarried women with births belong to 20 to 34 years age bracket with 0.0% of them unmarried.
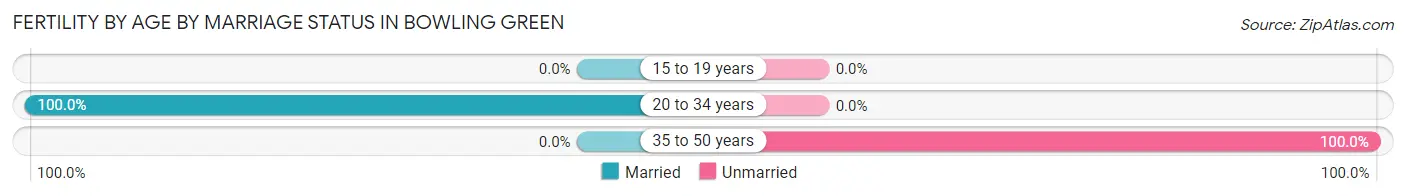
| Age Bracket | Married | Unmarried |
| 15 to 19 years | 0 (0.0%) | 0 (0.0%) |
| 20 to 34 years | 6 (100.0%) | 0 (0.0%) |
| 35 to 50 years | 0 (0.0%) | 4 (100.0%) |
| Total | 6 (60.0%) | 4 (40.0%) |
Fertility by Education in Bowling Green
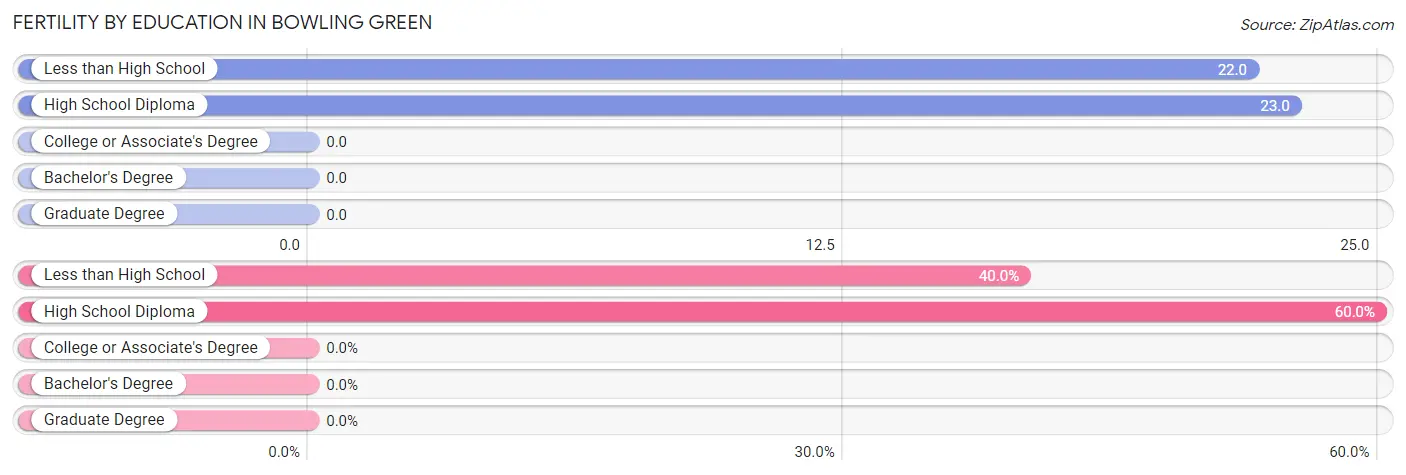
| Educational Attainment | Women with Births | Births / 1,000 Women |
| Less than High School | 4 (40.0%) | 22.0 |
| High School Diploma | 6 (60.0%) | 23.0 |
| College or Associate's Degree | 0 (0.0%) | 0.0 |
| Bachelor's Degree | 0 (0.0%) | 0.0 |
| Graduate Degree | 0 (0.0%) | 0.0 |
| Total | 10 (100.0%) | 16.0 |
Fertility by Education by Marriage Status in Bowling Green
40.0% of women with births in Bowling Green are unmarried. Women with the educational attainment of high school diploma are most likely to be married with 100.0% of them married at childbirth, while women with the educational attainment of less than high school are least likely to be married with 100.0% of them unmarried at childbirth.
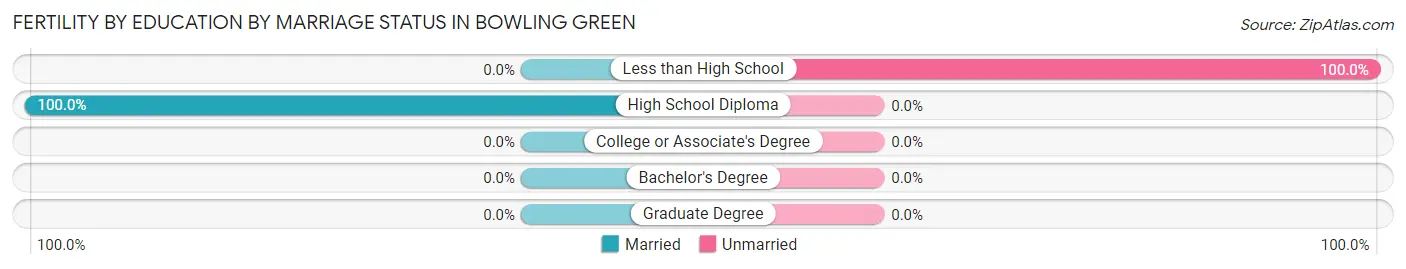
| Educational Attainment | Married | Unmarried |
| Less than High School | 0 (0.0%) | 4 (100.0%) |
| High School Diploma | 6 (100.0%) | 0 (0.0%) |
| College or Associate's Degree | 0 (0.0%) | 0 (0.0%) |
| Bachelor's Degree | 0 (0.0%) | 0 (0.0%) |
| Graduate Degree | 0 (0.0%) | 0 (0.0%) |
| Total | 6 (60.0%) | 4 (40.0%) |
Employment Characteristics in Bowling Green
Employment by Class of Employer in Bowling Green
Among the 872 employed individuals in Bowling Green, private company employees (654 | 75.0%), local government employees (93 | 10.7%), and not-for-profit organizations (46 | 5.3%) make up the most common classes of employment.
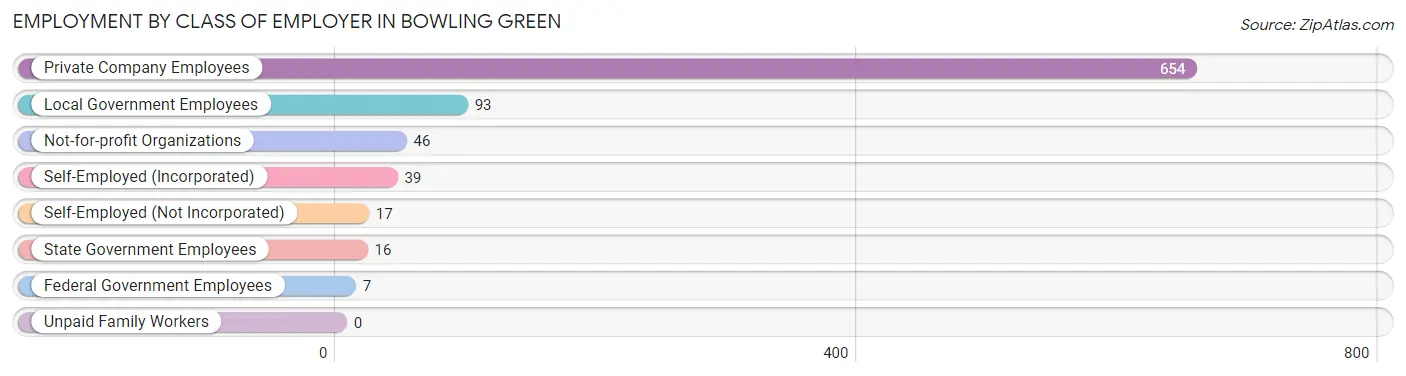
| Employer Class | # Employees | % Employees |
| Private Company Employees | 654 | 75.0% |
| Self-Employed (Incorporated) | 39 | 4.5% |
| Self-Employed (Not Incorporated) | 17 | 1.9% |
| Not-for-profit Organizations | 46 | 5.3% |
| Local Government Employees | 93 | 10.7% |
| State Government Employees | 16 | 1.8% |
| Federal Government Employees | 7 | 0.8% |
| Unpaid Family Workers | 0 | 0.0% |
| Total | 872 | 100.0% |
Employment Status by Age in Bowling Green
According to the labor force statistics for Bowling Green, out of the total population over 16 years of age (1,870), 54.5% or 1,019 individuals are in the labor force, with 13.8% or 141 of them unemployed. The age group with the highest labor force participation rate is 30 to 34 years, with 78.9% or 86 individuals in the labor force. Within the labor force, the 16 to 19 years age range has the highest percentage of unemployed individuals, with 43.8% or 28 of them being unemployed.
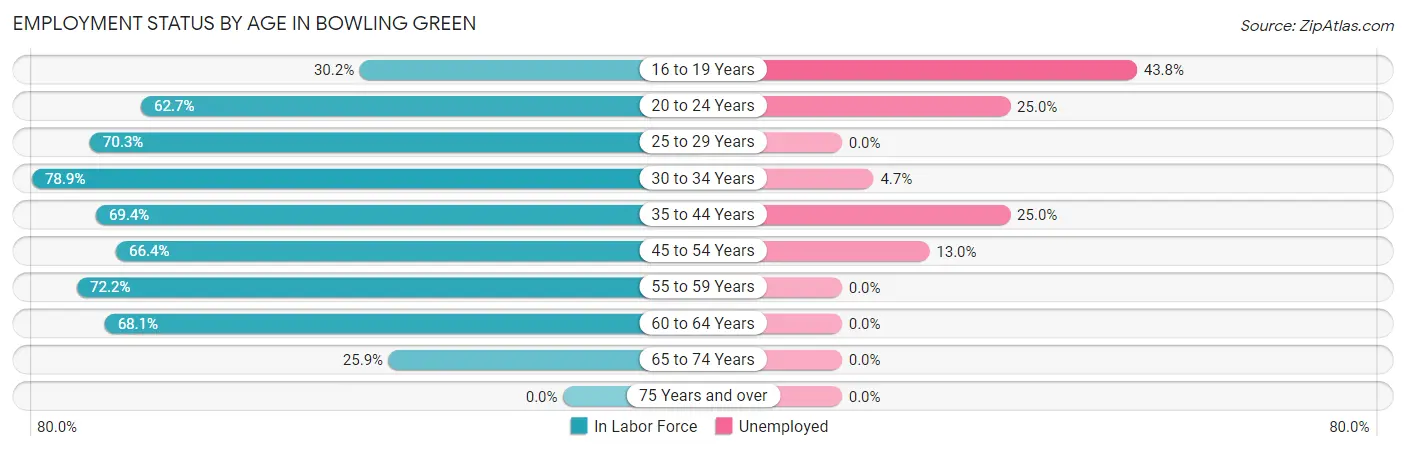
| Age Bracket | In Labor Force | Unemployed |
| 16 to 19 Years | 64 (30.2%) | 28 (43.8%) |
| 20 to 24 Years | 200 (62.7%) | 50 (25.0%) |
| 25 to 29 Years | 175 (70.3%) | 0 (0.0%) |
| 30 to 34 Years | 86 (78.9%) | 4 (4.7%) |
| 35 to 44 Years | 152 (69.4%) | 38 (25.0%) |
| 45 to 54 Years | 162 (66.4%) | 21 (13.0%) |
| 55 to 59 Years | 91 (72.2%) | 0 (0.0%) |
| 60 to 64 Years | 47 (68.1%) | 0 (0.0%) |
| 65 to 74 Years | 43 (25.9%) | 0 (0.0%) |
| 75 Years and over | 0 (0.0%) | 0 (0.0%) |
| Total | 1,019 (54.5%) | 141 (13.8%) |
Employment Status by Educational Attainment in Bowling Green
According to labor force statistics for Bowling Green, 70.2% of individuals (713) out of the total population between 25 and 64 years of age (1,016) are in the labor force, with 8.8% or 63 of them being unemployed. The group with the highest labor force participation rate are those with the educational attainment of bachelor's degree or higher, with 100.0% or 102 individuals in the labor force. Within the labor force, individuals with college / associate degree education have the highest percentage of unemployment, with 16.9% or 28 of them being unemployed.
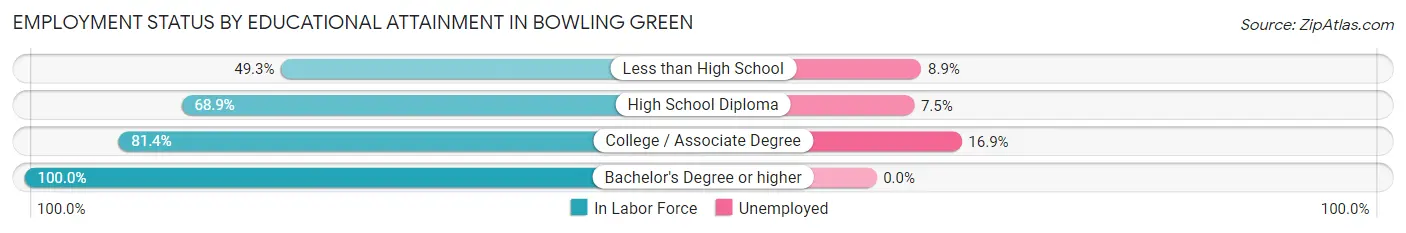
| Educational Attainment | In Labor Force | Unemployed |
| Less than High School | 112 (49.3%) | 20 (8.9%) |
| High School Diploma | 333 (68.9%) | 36 (7.5%) |
| College / Associate Degree | 166 (81.4%) | 34 (16.9%) |
| Bachelor's Degree or higher | 102 (100.0%) | 0 (0.0%) |
| Total | 713 (70.2%) | 89 (8.8%) |
Employment Occupations by Sex in Bowling Green
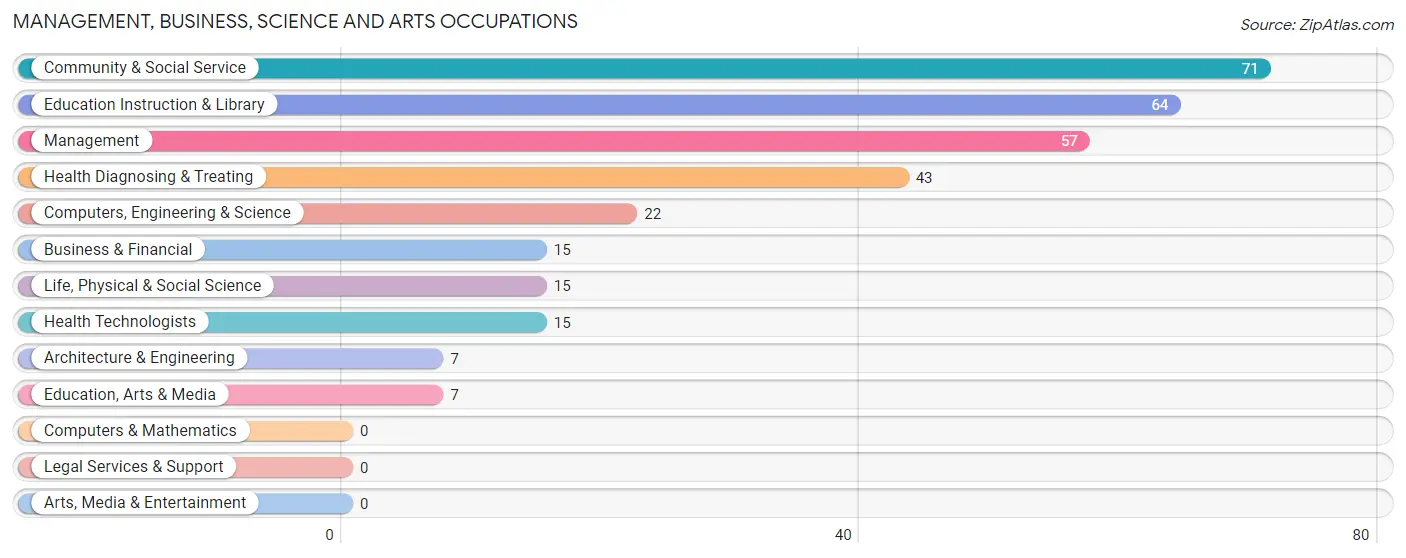
Management, Business, Science and Arts Occupations
The most common Management, Business, Science and Arts occupations in Bowling Green are Community & Social Service (71 | 8.1%), Education Instruction & Library (64 | 7.3%), Management (57 | 6.5%), Health Diagnosing & Treating (43 | 4.9%), and Computers, Engineering & Science (22 | 2.5%).
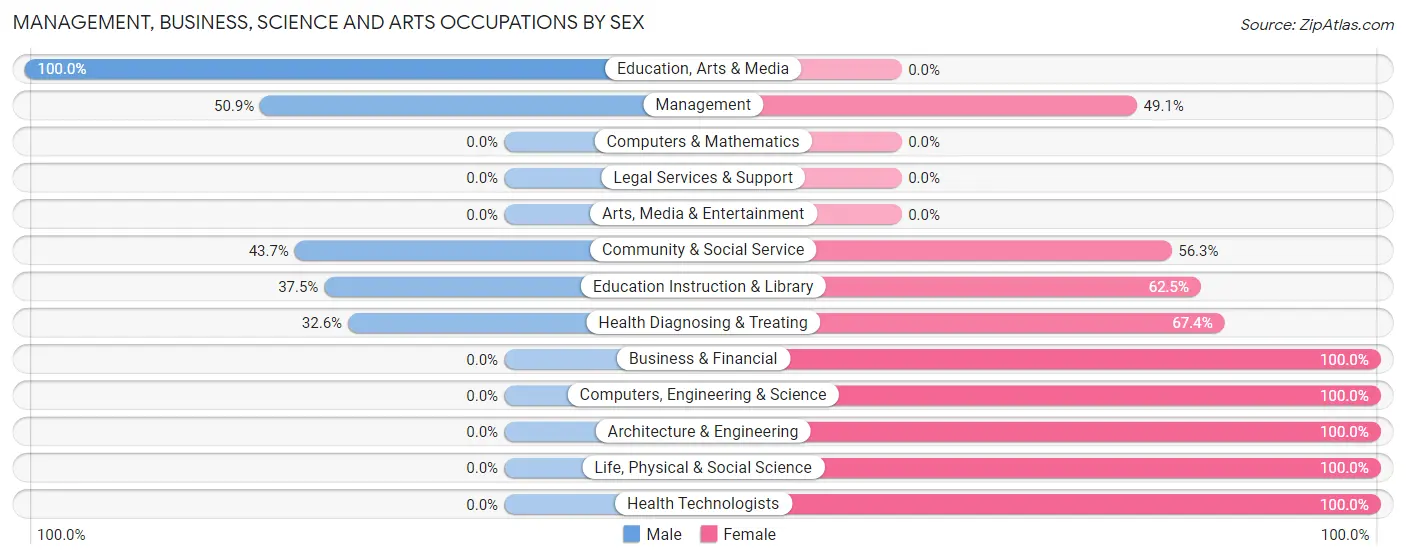
Management, Business, Science and Arts Occupations by Sex
Within the Management, Business, Science and Arts occupations in Bowling Green, the most male-oriented occupations are Education, Arts & Media (100.0%), Management (50.9%), and Community & Social Service (43.7%), while the most female-oriented occupations are Business & Financial (100.0%), Computers, Engineering & Science (100.0%), and Architecture & Engineering (100.0%).
| Occupation | Male | Female |
| Management | 29 (50.9%) | 28 (49.1%) |
| Business & Financial | 0 (0.0%) | 15 (100.0%) |
| Computers, Engineering & Science | 0 (0.0%) | 22 (100.0%) |
| Computers & Mathematics | 0 (0.0%) | 0 (0.0%) |
| Architecture & Engineering | 0 (0.0%) | 7 (100.0%) |
| Life, Physical & Social Science | 0 (0.0%) | 15 (100.0%) |
| Community & Social Service | 31 (43.7%) | 40 (56.3%) |
| Education, Arts & Media | 7 (100.0%) | 0 (0.0%) |
| Legal Services & Support | 0 (0.0%) | 0 (0.0%) |
| Education Instruction & Library | 24 (37.5%) | 40 (62.5%) |
| Arts, Media & Entertainment | 0 (0.0%) | 0 (0.0%) |
| Health Diagnosing & Treating | 14 (32.6%) | 29 (67.4%) |
| Health Technologists | 0 (0.0%) | 15 (100.0%) |
| Total (Category) | 74 (35.6%) | 134 (64.4%) |
| Total (Overall) | 484 (55.1%) | 395 (44.9%) |
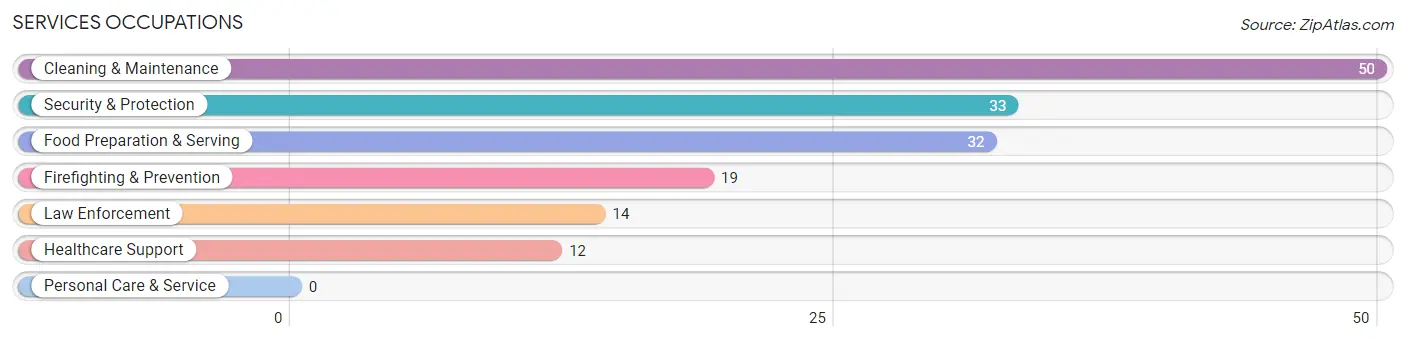
Services Occupations
The most common Services occupations in Bowling Green are Cleaning & Maintenance (50 | 5.7%), Security & Protection (33 | 3.7%), Food Preparation & Serving (32 | 3.6%), Firefighting & Prevention (19 | 2.2%), and Law Enforcement (14 | 1.6%).
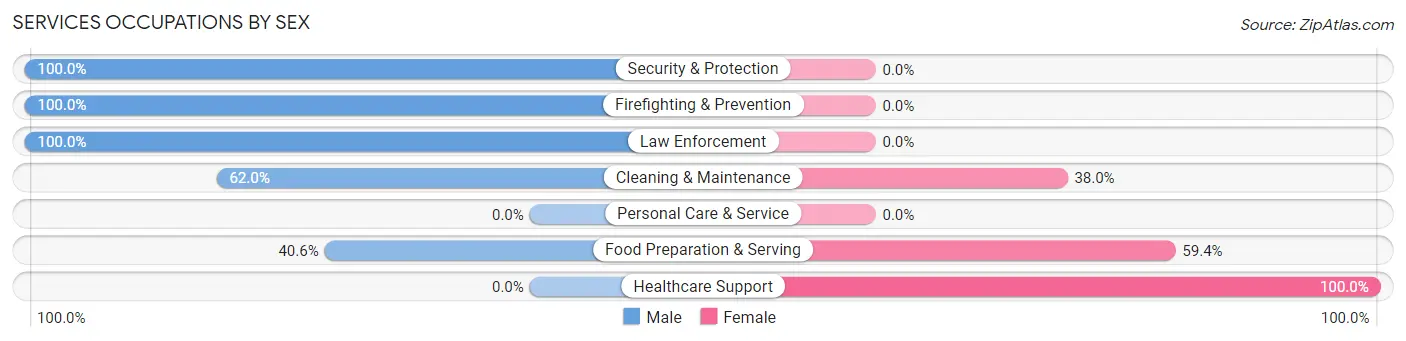
Services Occupations by Sex
Within the Services occupations in Bowling Green, the most male-oriented occupations are Security & Protection (100.0%), Firefighting & Prevention (100.0%), and Law Enforcement (100.0%), while the most female-oriented occupations are Healthcare Support (100.0%), Food Preparation & Serving (59.4%), and Cleaning & Maintenance (38.0%).
| Occupation | Male | Female |
| Healthcare Support | 0 (0.0%) | 12 (100.0%) |
| Security & Protection | 33 (100.0%) | 0 (0.0%) |
| Firefighting & Prevention | 19 (100.0%) | 0 (0.0%) |
| Law Enforcement | 14 (100.0%) | 0 (0.0%) |
| Food Preparation & Serving | 13 (40.6%) | 19 (59.4%) |
| Cleaning & Maintenance | 31 (62.0%) | 19 (38.0%) |
| Personal Care & Service | 0 (0.0%) | 0 (0.0%) |
| Total (Category) | 77 (60.6%) | 50 (39.4%) |
| Total (Overall) | 484 (55.1%) | 395 (44.9%) |
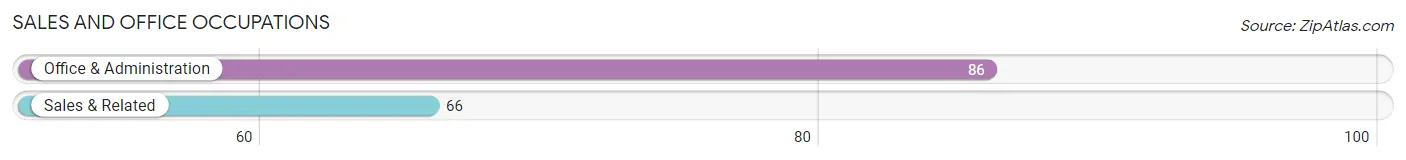
Sales and Office Occupations
The most common Sales and Office occupations in Bowling Green are Office & Administration (86 | 9.8%), and Sales & Related (66 | 7.5%).
Sales and Office Occupations by Sex
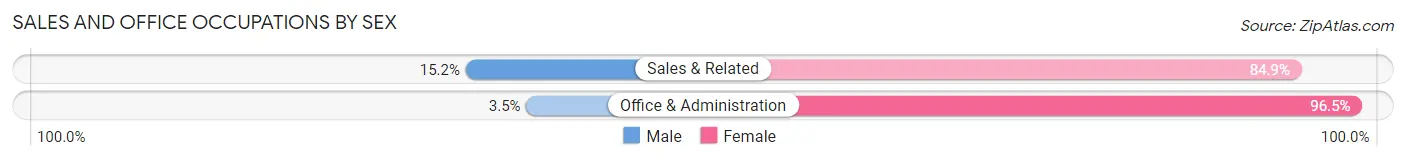
| Occupation | Male | Female |
| Sales & Related | 10 (15.1%) | 56 (84.9%) |
| Office & Administration | 3 (3.5%) | 83 (96.5%) |
| Total (Category) | 13 (8.6%) | 139 (91.4%) |
| Total (Overall) | 484 (55.1%) | 395 (44.9%) |
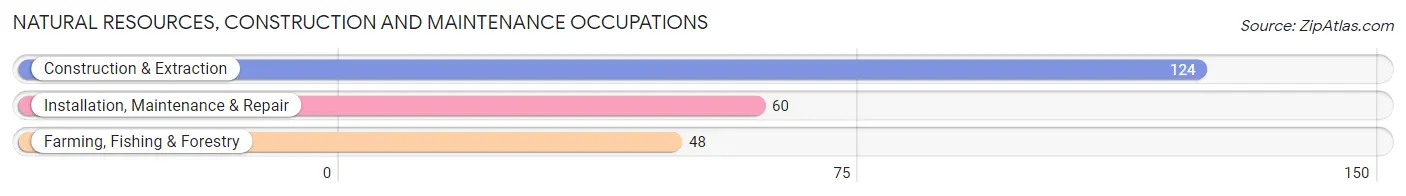
Natural Resources, Construction and Maintenance Occupations
The most common Natural Resources, Construction and Maintenance occupations in Bowling Green are Construction & Extraction (124 | 14.1%), Installation, Maintenance & Repair (60 | 6.8%), and Farming, Fishing & Forestry (48 | 5.5%).
Natural Resources, Construction and Maintenance Occupations by Sex
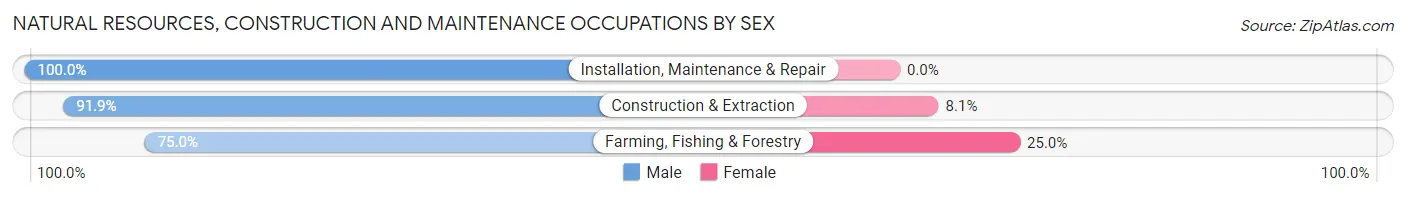
| Occupation | Male | Female |
| Farming, Fishing & Forestry | 36 (75.0%) | 12 (25.0%) |
| Construction & Extraction | 114 (91.9%) | 10 (8.1%) |
| Installation, Maintenance & Repair | 60 (100.0%) | 0 (0.0%) |
| Total (Category) | 210 (90.5%) | 22 (9.5%) |
| Total (Overall) | 484 (55.1%) | 395 (44.9%) |
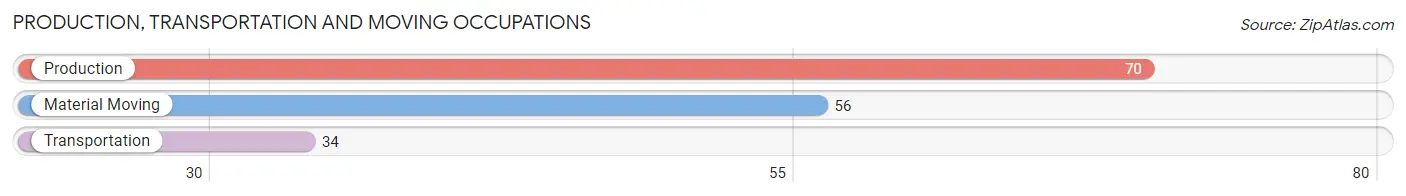
Production, Transportation and Moving Occupations
The most common Production, Transportation and Moving occupations in Bowling Green are Production (70 | 8.0%), Material Moving (56 | 6.4%), and Transportation (34 | 3.9%).
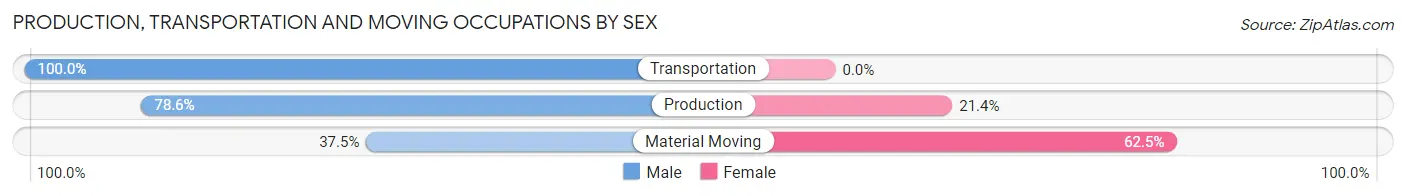
Production, Transportation and Moving Occupations by Sex
| Occupation | Male | Female |
| Production | 55 (78.6%) | 15 (21.4%) |
| Transportation | 34 (100.0%) | 0 (0.0%) |
| Material Moving | 21 (37.5%) | 35 (62.5%) |
| Total (Category) | 110 (68.8%) | 50 (31.2%) |
| Total (Overall) | 484 (55.1%) | 395 (44.9%) |
Employment Industries by Sex in Bowling Green
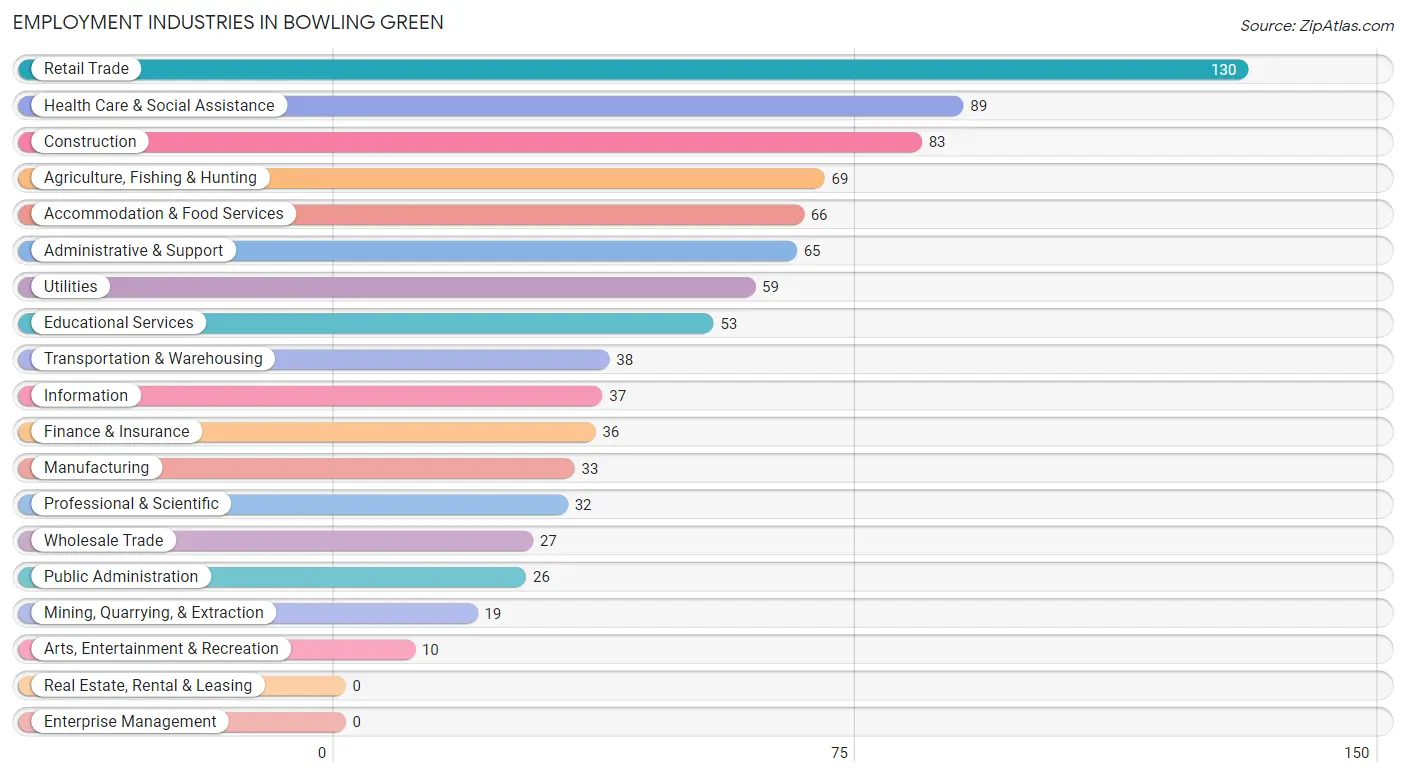
Employment Industries in Bowling Green
The major employment industries in Bowling Green include Retail Trade (130 | 14.8%), Health Care & Social Assistance (89 | 10.1%), Construction (83 | 9.4%), Agriculture, Fishing & Hunting (69 | 7.9%), and Accommodation & Food Services (66 | 7.5%).
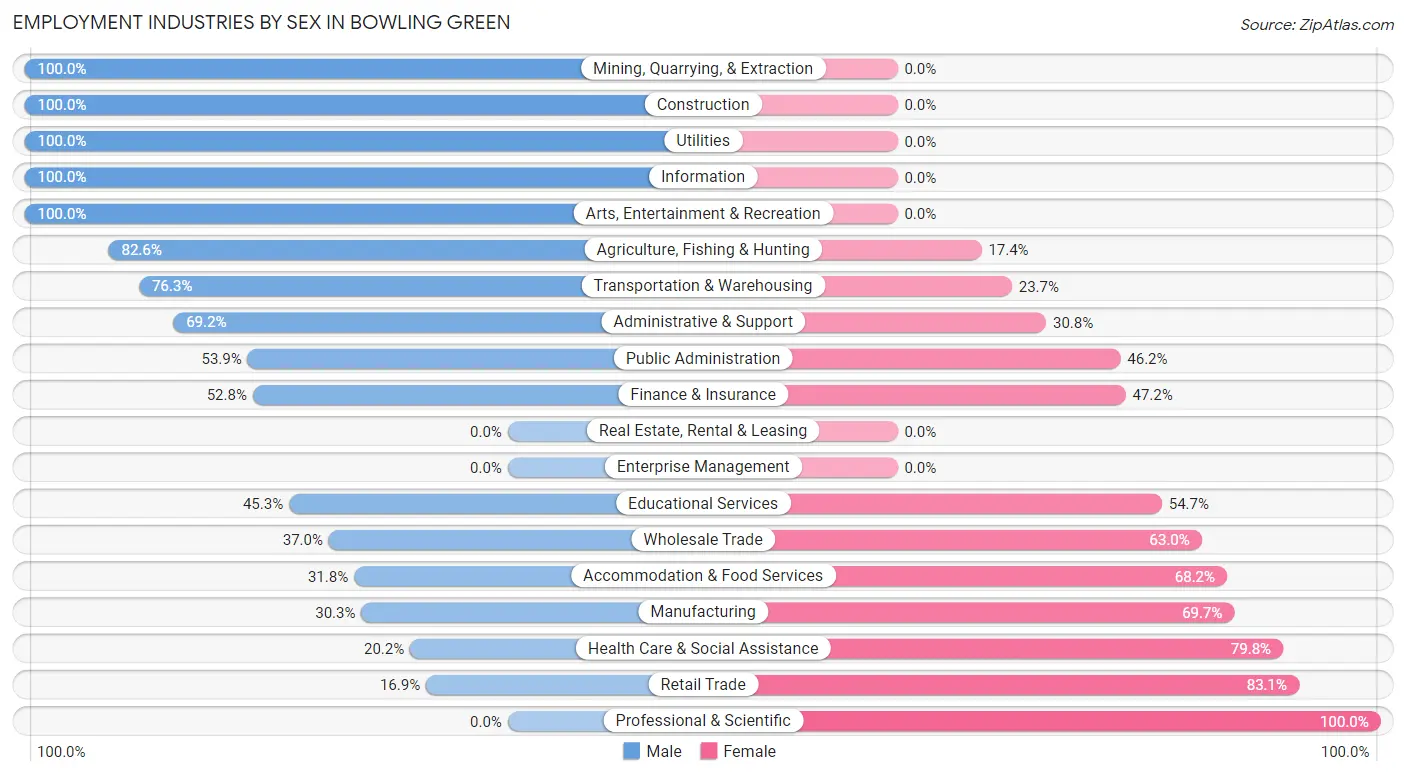
Employment Industries by Sex in Bowling Green
The Bowling Green industries that see more men than women are Mining, Quarrying, & Extraction (100.0%), Construction (100.0%), and Utilities (100.0%), whereas the industries that tend to have a higher number of women are Professional & Scientific (100.0%), Retail Trade (83.1%), and Health Care & Social Assistance (79.8%).
| Industry | Male | Female |
| Agriculture, Fishing & Hunting | 57 (82.6%) | 12 (17.4%) |
| Mining, Quarrying, & Extraction | 19 (100.0%) | 0 (0.0%) |
| Construction | 83 (100.0%) | 0 (0.0%) |
| Manufacturing | 10 (30.3%) | 23 (69.7%) |
| Wholesale Trade | 10 (37.0%) | 17 (63.0%) |
| Retail Trade | 22 (16.9%) | 108 (83.1%) |
| Transportation & Warehousing | 29 (76.3%) | 9 (23.7%) |
| Utilities | 59 (100.0%) | 0 (0.0%) |
| Information | 37 (100.0%) | 0 (0.0%) |
| Finance & Insurance | 19 (52.8%) | 17 (47.2%) |
| Real Estate, Rental & Leasing | 0 (0.0%) | 0 (0.0%) |
| Professional & Scientific | 0 (0.0%) | 32 (100.0%) |
| Enterprise Management | 0 (0.0%) | 0 (0.0%) |
| Administrative & Support | 45 (69.2%) | 20 (30.8%) |
| Educational Services | 24 (45.3%) | 29 (54.7%) |
| Health Care & Social Assistance | 18 (20.2%) | 71 (79.8%) |
| Arts, Entertainment & Recreation | 10 (100.0%) | 0 (0.0%) |
| Accommodation & Food Services | 21 (31.8%) | 45 (68.2%) |
| Public Administration | 14 (53.8%) | 12 (46.2%) |
| Total | 484 (55.1%) | 395 (44.9%) |
Education in Bowling Green
School Enrollment in Bowling Green
The most common levels of schooling among the 759 students in Bowling Green are high school (215 | 28.3%), college / undergraduate (161 | 21.2%), and elementary school (148 | 19.5%).

| School Level | # Students | % Students |
| Nursery / Preschool | 49 | 6.5% |
| Kindergarten | 28 | 3.7% |
| Elementary School | 148 | 19.5% |
| Middle School | 133 | 17.5% |
| High School | 215 | 28.3% |
| College / Undergraduate | 161 | 21.2% |
| Graduate / Professional | 25 | 3.3% |
| Total | 759 | 100.0% |
School Enrollment by Age by Funding Source in Bowling Green
Out of a total of 759 students who are enrolled in schools in Bowling Green, 35 (4.6%) attend a private institution, while the remaining 724 (95.4%) are enrolled in public schools. The age group of 20 to 24 year olds has the highest likelihood of being enrolled in private schools, with 20 (15.3% in the age bracket) enrolled. Conversely, the age group of 3 to 4 year olds has the lowest likelihood of being enrolled in a private school, with 21 (100.0% in the age bracket) attending a public institution.
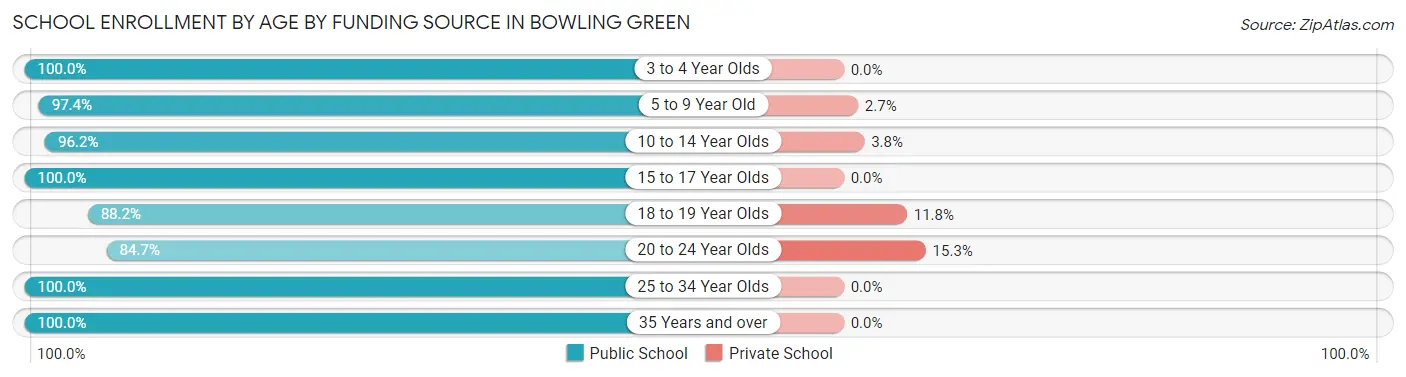
| Age Bracket | Public School | Private School |
| 3 to 4 Year Olds | 21 (100.0%) | 0 (0.0%) |
| 5 to 9 Year Old | 184 (97.4%) | 5 (2.6%) |
| 10 to 14 Year Olds | 151 (96.2%) | 6 (3.8%) |
| 15 to 17 Year Olds | 194 (100.0%) | 0 (0.0%) |
| 18 to 19 Year Olds | 30 (88.2%) | 4 (11.8%) |
| 20 to 24 Year Olds | 111 (84.7%) | 20 (15.3%) |
| 25 to 34 Year Olds | 15 (100.0%) | 0 (0.0%) |
| 35 Years and over | 18 (100.0%) | 0 (0.0%) |
| Total | 724 (95.4%) | 35 (4.6%) |
Educational Attainment by Field of Study in Bowling Green
Education (31 | 23.1%), business (26 | 19.4%), science & technology (22 | 16.4%), physical & health sciences (19 | 14.2%), and liberal arts & history (15 | 11.2%) are the most common fields of study among 134 individuals in Bowling Green who have obtained a bachelor's degree or higher.
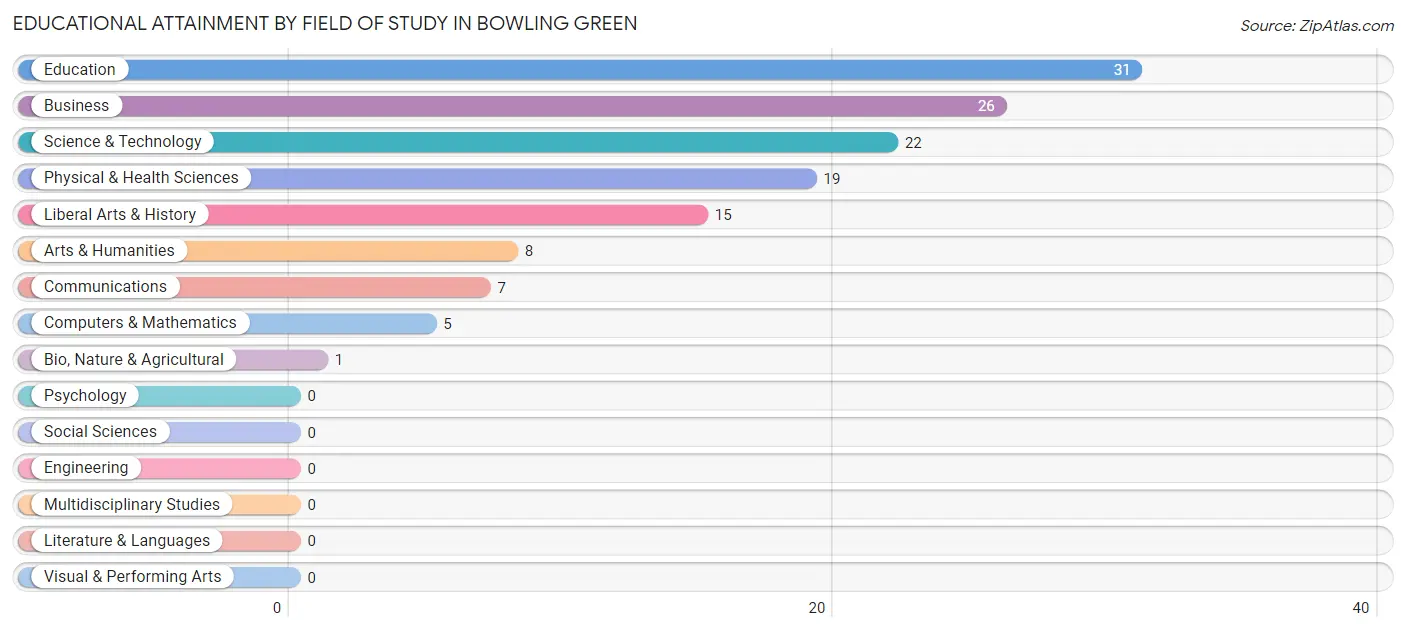
| Field of Study | # Graduates | % Graduates |
| Computers & Mathematics | 5 | 3.7% |
| Bio, Nature & Agricultural | 1 | 0.7% |
| Physical & Health Sciences | 19 | 14.2% |
| Psychology | 0 | 0.0% |
| Social Sciences | 0 | 0.0% |
| Engineering | 0 | 0.0% |
| Multidisciplinary Studies | 0 | 0.0% |
| Science & Technology | 22 | 16.4% |
| Business | 26 | 19.4% |
| Education | 31 | 23.1% |
| Literature & Languages | 0 | 0.0% |
| Liberal Arts & History | 15 | 11.2% |
| Visual & Performing Arts | 0 | 0.0% |
| Communications | 7 | 5.2% |
| Arts & Humanities | 8 | 6.0% |
| Total | 134 | 100.0% |
Transportation & Commute in Bowling Green
Vehicle Availability by Sex in Bowling Green
The most prevalent vehicle ownership categories in Bowling Green are males with 2 vehicles (185, accounting for 38.7%) and females with 2 vehicles (154, making up 48.6%).
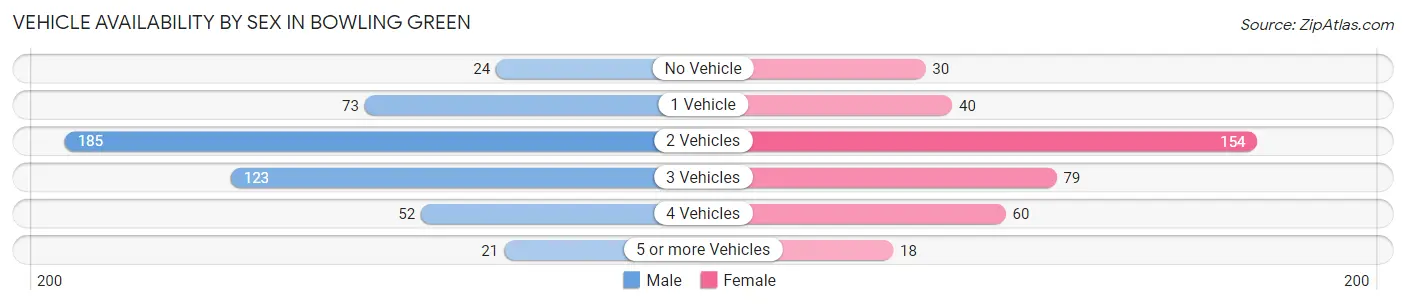
| Vehicles Available | Male | Female |
| No Vehicle | 24 (5.0%) | 30 (7.9%) |
| 1 Vehicle | 73 (15.3%) | 40 (10.5%) |
| 2 Vehicles | 185 (38.7%) | 154 (40.4%) |
| 3 Vehicles | 123 (25.7%) | 79 (20.7%) |
| 4 Vehicles | 52 (10.9%) | 60 (15.8%) |
| 5 or more Vehicles | 21 (4.4%) | 18 (4.7%) |
| Total | 478 (100.0%) | 381 (100.0%) |
Commute Time in Bowling Green
The most frequently occuring commute durations in Bowling Green are 20 to 24 minutes (143 commuters, 17.2%), 15 to 19 minutes (128 commuters, 15.4%), and 30 to 34 minutes (111 commuters, 13.4%).
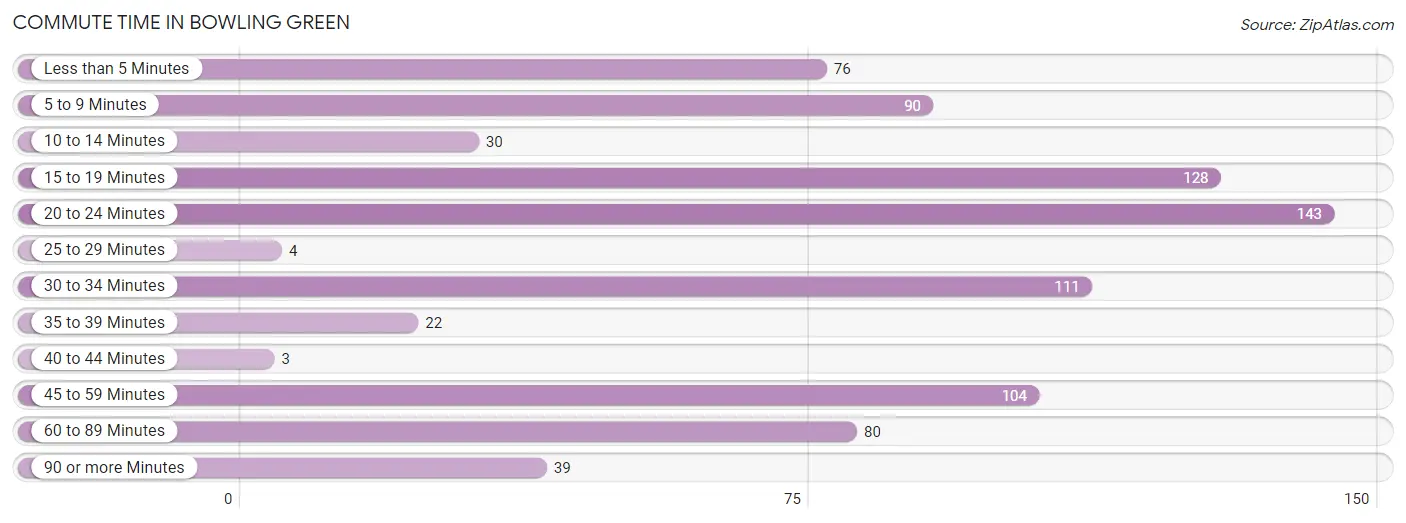
| Commute Time | # Commuters | % Commuters |
| Less than 5 Minutes | 76 | 9.2% |
| 5 to 9 Minutes | 90 | 10.8% |
| 10 to 14 Minutes | 30 | 3.6% |
| 15 to 19 Minutes | 128 | 15.4% |
| 20 to 24 Minutes | 143 | 17.2% |
| 25 to 29 Minutes | 4 | 0.5% |
| 30 to 34 Minutes | 111 | 13.4% |
| 35 to 39 Minutes | 22 | 2.6% |
| 40 to 44 Minutes | 3 | 0.4% |
| 45 to 59 Minutes | 104 | 12.5% |
| 60 to 89 Minutes | 80 | 9.6% |
| 90 or more Minutes | 39 | 4.7% |
Commute Time by Sex in Bowling Green
The most common commute times in Bowling Green are 20 to 24 minutes (104 commuters, 21.5%) for males and 15 to 19 minutes (100 commuters, 28.9%) for females.
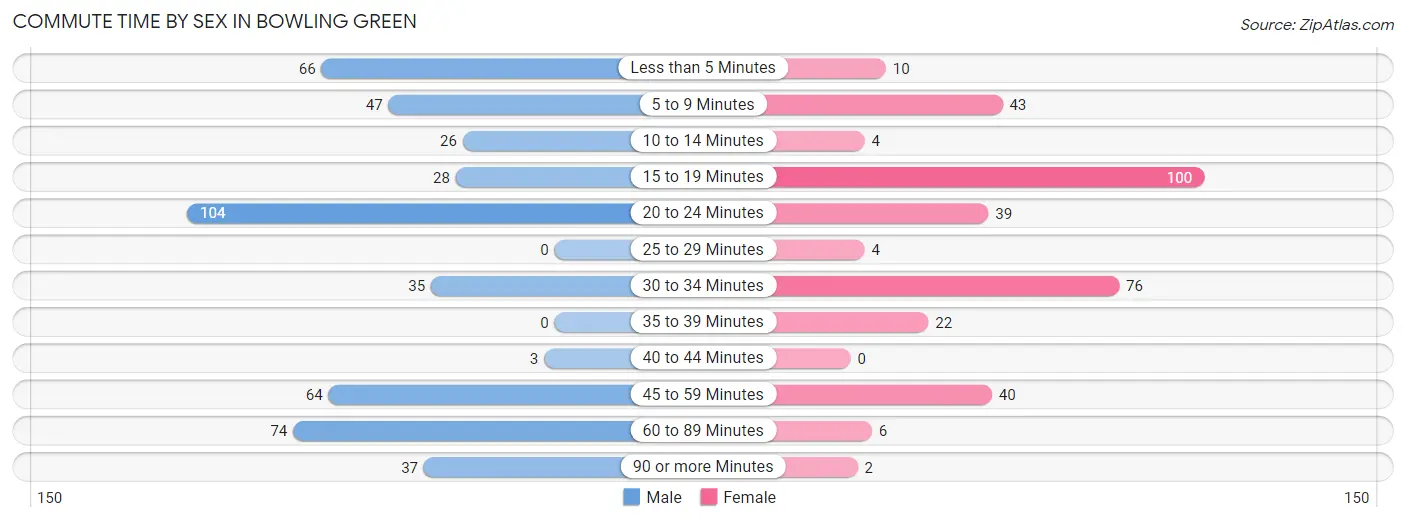
| Commute Time | Male | Female |
| Less than 5 Minutes | 66 (13.6%) | 10 (2.9%) |
| 5 to 9 Minutes | 47 (9.7%) | 43 (12.4%) |
| 10 to 14 Minutes | 26 (5.4%) | 4 (1.2%) |
| 15 to 19 Minutes | 28 (5.8%) | 100 (28.9%) |
| 20 to 24 Minutes | 104 (21.5%) | 39 (11.3%) |
| 25 to 29 Minutes | 0 (0.0%) | 4 (1.2%) |
| 30 to 34 Minutes | 35 (7.2%) | 76 (22.0%) |
| 35 to 39 Minutes | 0 (0.0%) | 22 (6.4%) |
| 40 to 44 Minutes | 3 (0.6%) | 0 (0.0%) |
| 45 to 59 Minutes | 64 (13.2%) | 40 (11.6%) |
| 60 to 89 Minutes | 74 (15.3%) | 6 (1.7%) |
| 90 or more Minutes | 37 (7.6%) | 2 (0.6%) |
Time of Departure to Work by Sex in Bowling Green
The most frequent times of departure to work in Bowling Green are 5:00 AM to 5:29 AM (94, 19.4%) for males and 6:30 AM to 6:59 AM (62, 17.9%) for females.
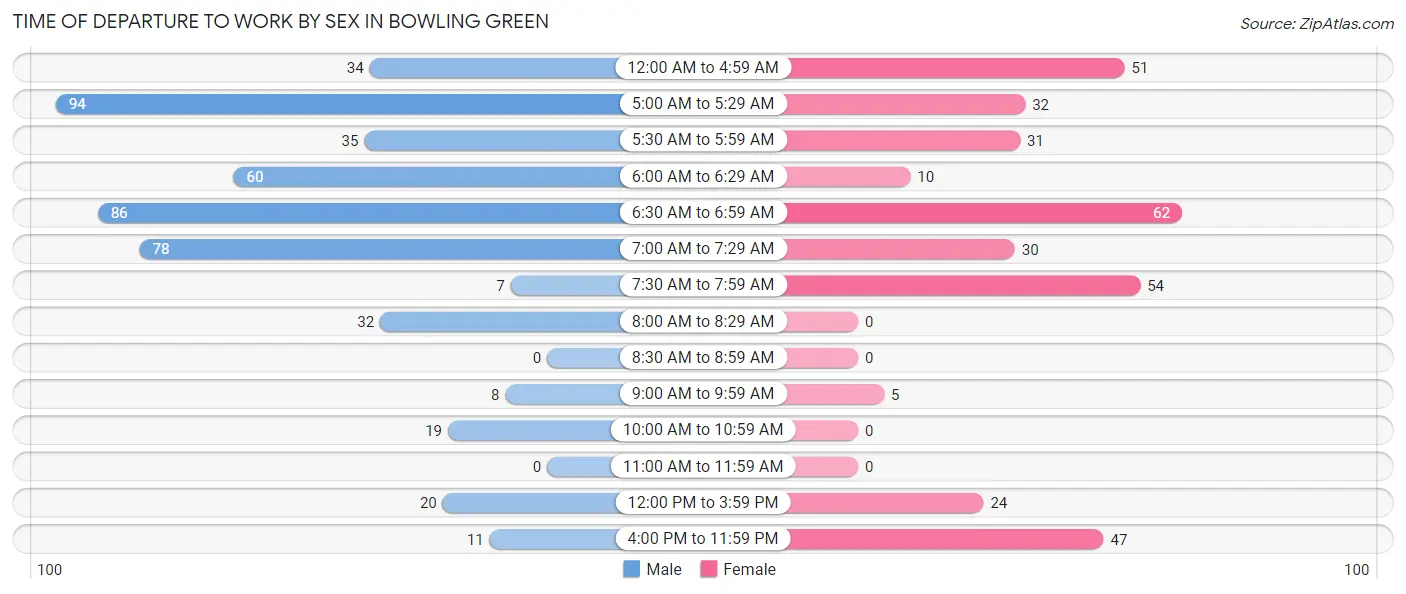
| Time of Departure | Male | Female |
| 12:00 AM to 4:59 AM | 34 (7.0%) | 51 (14.7%) |
| 5:00 AM to 5:29 AM | 94 (19.4%) | 32 (9.2%) |
| 5:30 AM to 5:59 AM | 35 (7.2%) | 31 (9.0%) |
| 6:00 AM to 6:29 AM | 60 (12.4%) | 10 (2.9%) |
| 6:30 AM to 6:59 AM | 86 (17.8%) | 62 (17.9%) |
| 7:00 AM to 7:29 AM | 78 (16.1%) | 30 (8.7%) |
| 7:30 AM to 7:59 AM | 7 (1.5%) | 54 (15.6%) |
| 8:00 AM to 8:29 AM | 32 (6.6%) | 0 (0.0%) |
| 8:30 AM to 8:59 AM | 0 (0.0%) | 0 (0.0%) |
| 9:00 AM to 9:59 AM | 8 (1.7%) | 5 (1.5%) |
| 10:00 AM to 10:59 AM | 19 (3.9%) | 0 (0.0%) |
| 11:00 AM to 11:59 AM | 0 (0.0%) | 0 (0.0%) |
| 12:00 PM to 3:59 PM | 20 (4.1%) | 24 (6.9%) |
| 4:00 PM to 11:59 PM | 11 (2.3%) | 47 (13.6%) |
| Total | 484 (100.0%) | 346 (100.0%) |
Housing Occupancy in Bowling Green
Occupancy by Ownership in Bowling Green
Of the total 728 dwellings in Bowling Green, owner-occupied units account for 419 (57.6%), while renter-occupied units make up 309 (42.4%).
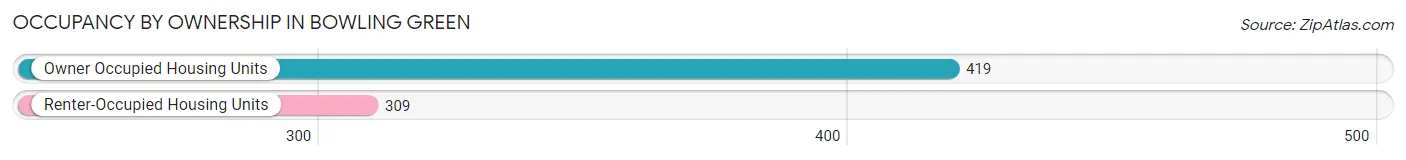
| Occupancy | # Housing Units | % Housing Units |
| Owner Occupied Housing Units | 419 | 57.6% |
| Renter-Occupied Housing Units | 309 | 42.4% |
| Total Occupied Housing Units | 728 | 100.0% |
Occupancy by Household Size in Bowling Green
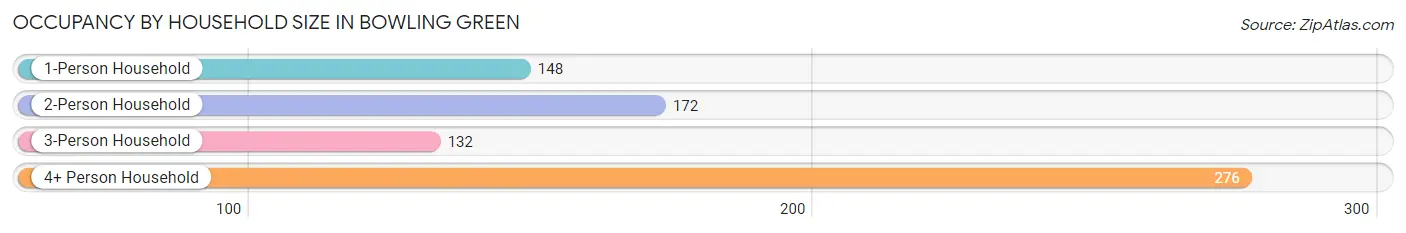
| Household Size | # Housing Units | % Housing Units |
| 1-Person Household | 148 | 20.3% |
| 2-Person Household | 172 | 23.6% |
| 3-Person Household | 132 | 18.1% |
| 4+ Person Household | 276 | 37.9% |
| Total Housing Units | 728 | 100.0% |
Occupancy by Ownership by Household Size in Bowling Green
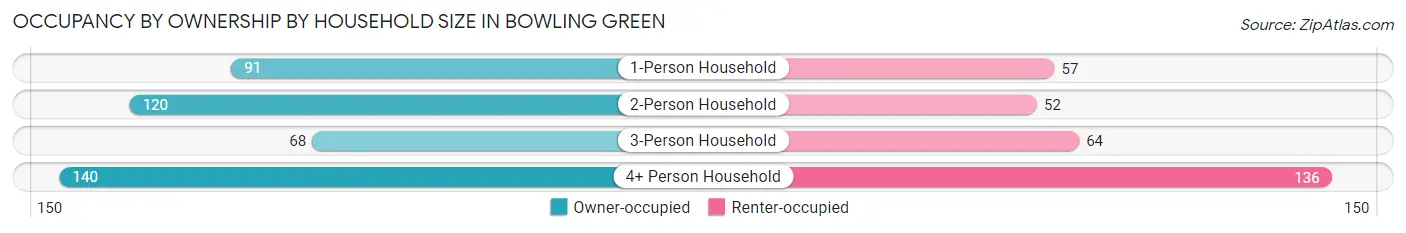
| Household Size | Owner-occupied | Renter-occupied |
| 1-Person Household | 91 (61.5%) | 57 (38.5%) |
| 2-Person Household | 120 (69.8%) | 52 (30.2%) |
| 3-Person Household | 68 (51.5%) | 64 (48.5%) |
| 4+ Person Household | 140 (50.7%) | 136 (49.3%) |
| Total Housing Units | 419 (57.6%) | 309 (42.4%) |
Occupancy by Educational Attainment in Bowling Green
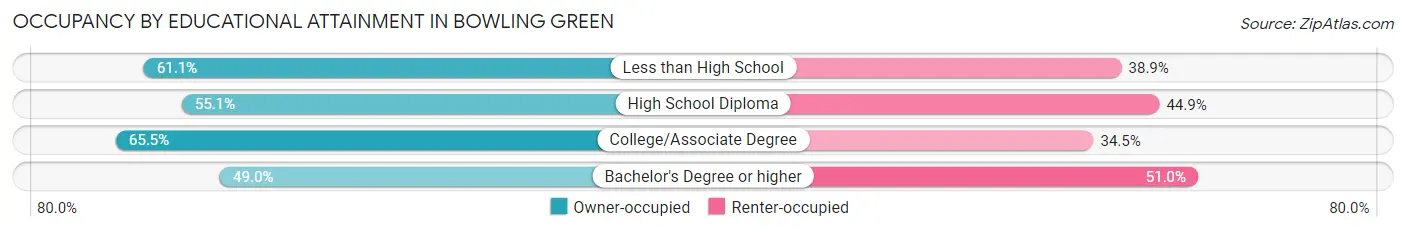
| Household Size | Owner-occupied | Renter-occupied |
| Less than High School | 91 (61.1%) | 58 (38.9%) |
| High School Diploma | 185 (55.1%) | 151 (44.9%) |
| College/Associate Degree | 95 (65.5%) | 50 (34.5%) |
| Bachelor's Degree or higher | 48 (49.0%) | 50 (51.0%) |
Occupancy by Age of Householder in Bowling Green
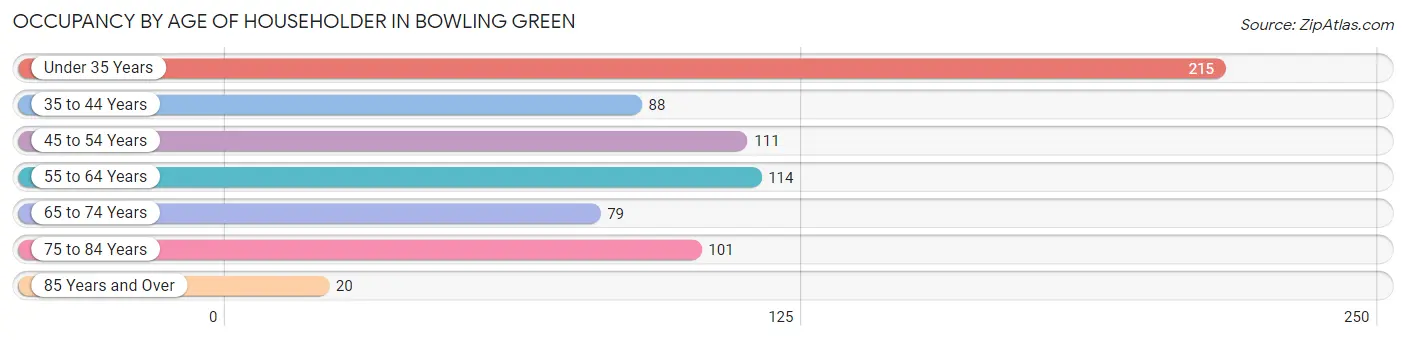
| Age Bracket | # Households | % Households |
| Under 35 Years | 215 | 29.5% |
| 35 to 44 Years | 88 | 12.1% |
| 45 to 54 Years | 111 | 15.2% |
| 55 to 64 Years | 114 | 15.7% |
| 65 to 74 Years | 79 | 10.8% |
| 75 to 84 Years | 101 | 13.9% |
| 85 Years and Over | 20 | 2.8% |
| Total | 728 | 100.0% |
Housing Finances in Bowling Green
Median Income by Occupancy in Bowling Green
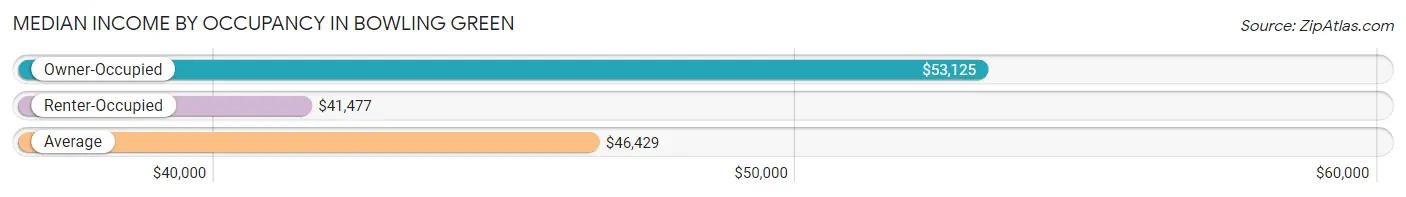
| Occupancy Type | # Households | Median Income |
| Owner-Occupied | 419 (57.6%) | $53,125 |
| Renter-Occupied | 309 (42.4%) | $41,477 |
| Average | 728 (100.0%) | $46,429 |
Occupancy by Householder Income Bracket in Bowling Green
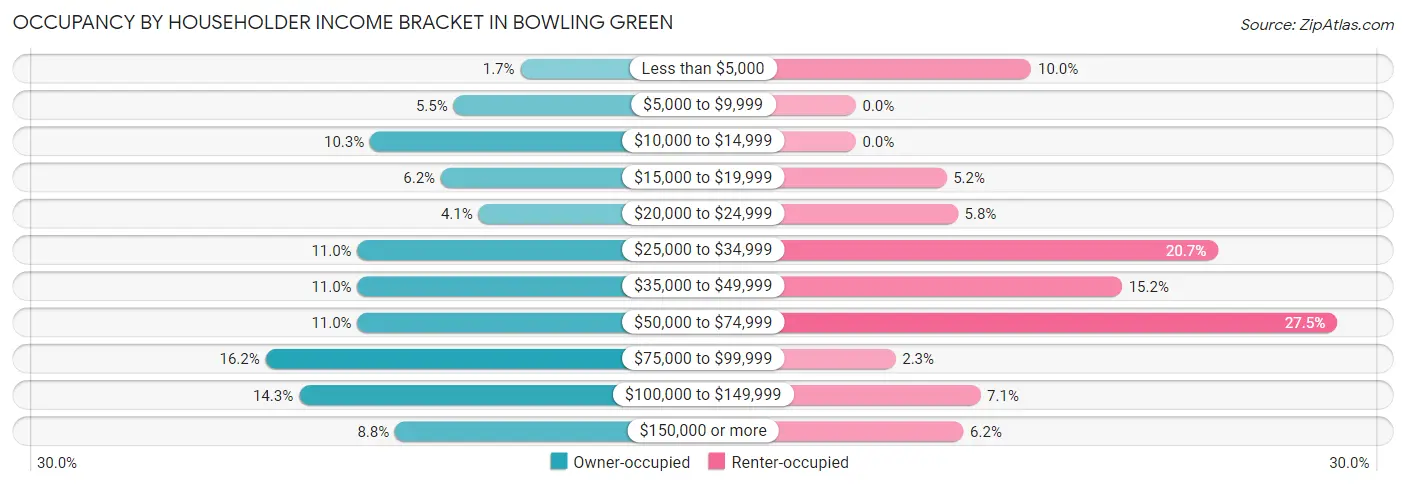
| Income Bracket | Owner-occupied | Renter-occupied |
| Less than $5,000 | 7 (1.7%) | 31 (10.0%) |
| $5,000 to $9,999 | 23 (5.5%) | 0 (0.0%) |
| $10,000 to $14,999 | 43 (10.3%) | 0 (0.0%) |
| $15,000 to $19,999 | 26 (6.2%) | 16 (5.2%) |
| $20,000 to $24,999 | 17 (4.1%) | 18 (5.8%) |
| $25,000 to $34,999 | 46 (11.0%) | 64 (20.7%) |
| $35,000 to $49,999 | 46 (11.0%) | 47 (15.2%) |
| $50,000 to $74,999 | 46 (11.0%) | 85 (27.5%) |
| $75,000 to $99,999 | 68 (16.2%) | 7 (2.3%) |
| $100,000 to $149,999 | 60 (14.3%) | 22 (7.1%) |
| $150,000 or more | 37 (8.8%) | 19 (6.1%) |
| Total | 419 (100.0%) | 309 (100.0%) |
Monthly Housing Cost Tiers in Bowling Green
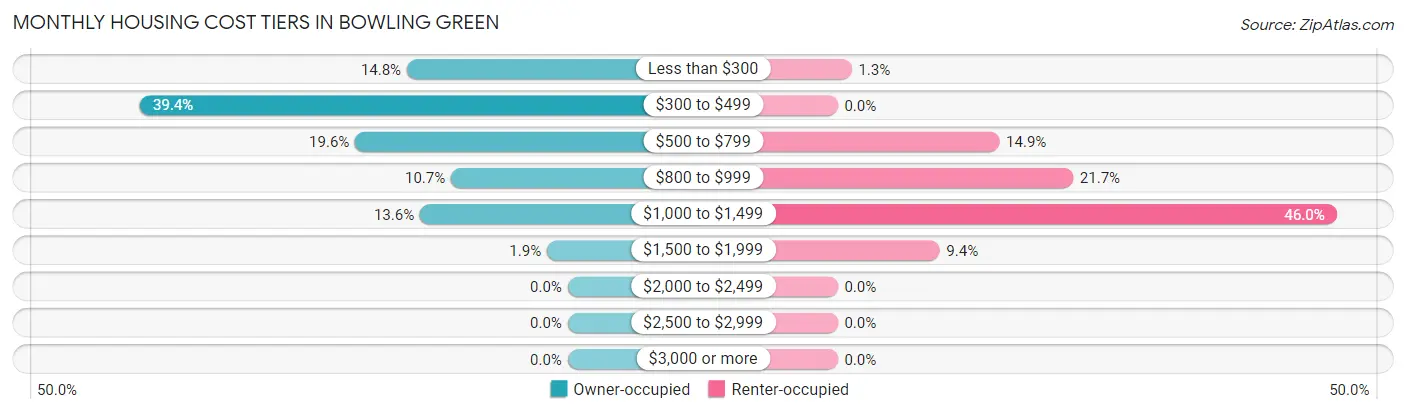
| Monthly Cost | Owner-occupied | Renter-occupied |
| Less than $300 | 62 (14.8%) | 4 (1.3%) |
| $300 to $499 | 165 (39.4%) | 0 (0.0%) |
| $500 to $799 | 82 (19.6%) | 46 (14.9%) |
| $800 to $999 | 45 (10.7%) | 67 (21.7%) |
| $1,000 to $1,499 | 57 (13.6%) | 142 (46.0%) |
| $1,500 to $1,999 | 8 (1.9%) | 29 (9.4%) |
| $2,000 to $2,499 | 0 (0.0%) | 0 (0.0%) |
| $2,500 to $2,999 | 0 (0.0%) | 0 (0.0%) |
| $3,000 or more | 0 (0.0%) | 0 (0.0%) |
| Total | 419 (100.0%) | 309 (100.0%) |
Physical Housing Characteristics in Bowling Green
Housing Structures in Bowling Green
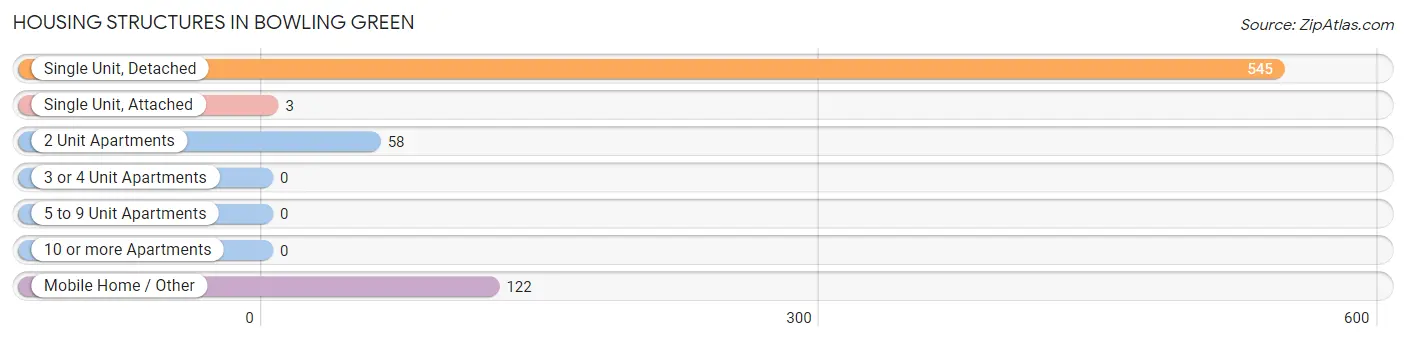
| Structure Type | # Housing Units | % Housing Units |
| Single Unit, Detached | 545 | 74.9% |
| Single Unit, Attached | 3 | 0.4% |
| 2 Unit Apartments | 58 | 8.0% |
| 3 or 4 Unit Apartments | 0 | 0.0% |
| 5 to 9 Unit Apartments | 0 | 0.0% |
| 10 or more Apartments | 0 | 0.0% |
| Mobile Home / Other | 122 | 16.8% |
| Total | 728 | 100.0% |
Housing Structures by Occupancy in Bowling Green
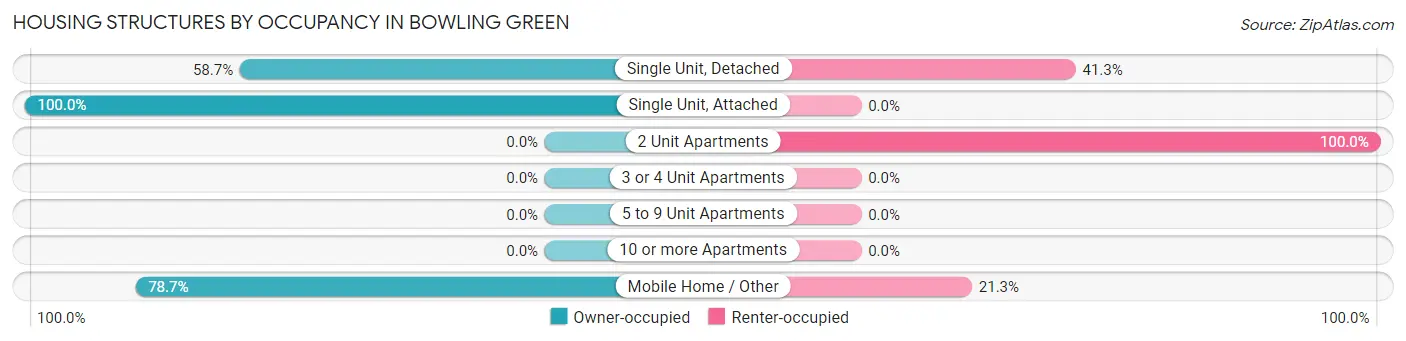
| Structure Type | Owner-occupied | Renter-occupied |
| Single Unit, Detached | 320 (58.7%) | 225 (41.3%) |
| Single Unit, Attached | 3 (100.0%) | 0 (0.0%) |
| 2 Unit Apartments | 0 (0.0%) | 58 (100.0%) |
| 3 or 4 Unit Apartments | 0 (0.0%) | 0 (0.0%) |
| 5 to 9 Unit Apartments | 0 (0.0%) | 0 (0.0%) |
| 10 or more Apartments | 0 (0.0%) | 0 (0.0%) |
| Mobile Home / Other | 96 (78.7%) | 26 (21.3%) |
| Total | 419 (57.6%) | 309 (42.4%) |
Housing Structures by Number of Rooms in Bowling Green
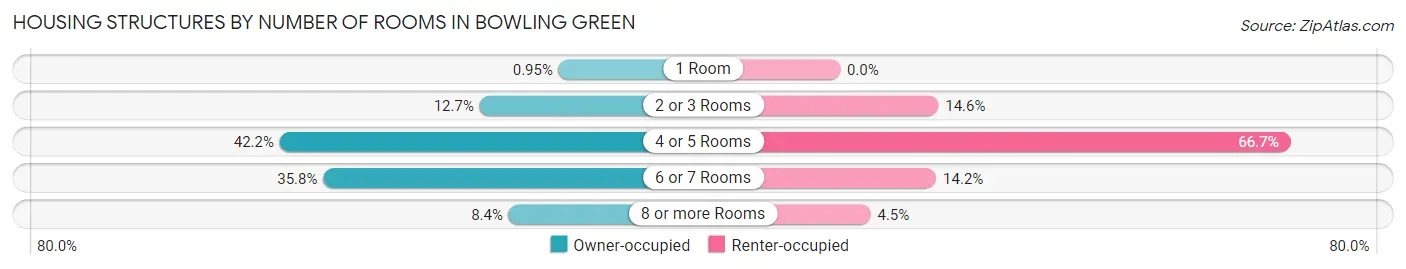
| Number of Rooms | Owner-occupied | Renter-occupied |
| 1 Room | 4 (0.9%) | 0 (0.0%) |
| 2 or 3 Rooms | 53 (12.7%) | 45 (14.6%) |
| 4 or 5 Rooms | 177 (42.2%) | 206 (66.7%) |
| 6 or 7 Rooms | 150 (35.8%) | 44 (14.2%) |
| 8 or more Rooms | 35 (8.4%) | 14 (4.5%) |
| Total | 419 (100.0%) | 309 (100.0%) |
Housing Structure by Heating Type in Bowling Green
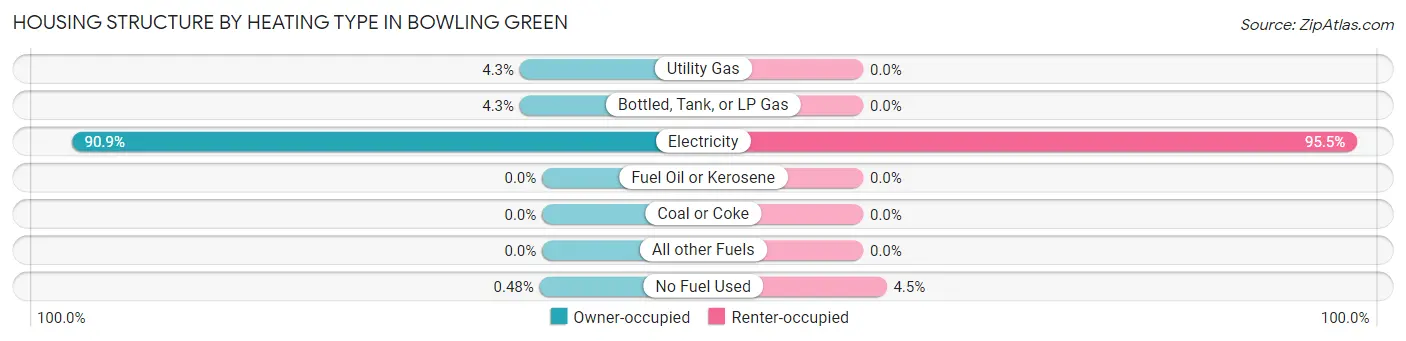
| Heating Type | Owner-occupied | Renter-occupied |
| Utility Gas | 18 (4.3%) | 0 (0.0%) |
| Bottled, Tank, or LP Gas | 18 (4.3%) | 0 (0.0%) |
| Electricity | 381 (90.9%) | 295 (95.5%) |
| Fuel Oil or Kerosene | 0 (0.0%) | 0 (0.0%) |
| Coal or Coke | 0 (0.0%) | 0 (0.0%) |
| All other Fuels | 0 (0.0%) | 0 (0.0%) |
| No Fuel Used | 2 (0.5%) | 14 (4.5%) |
| Total | 419 (100.0%) | 309 (100.0%) |
Household Vehicle Usage in Bowling Green
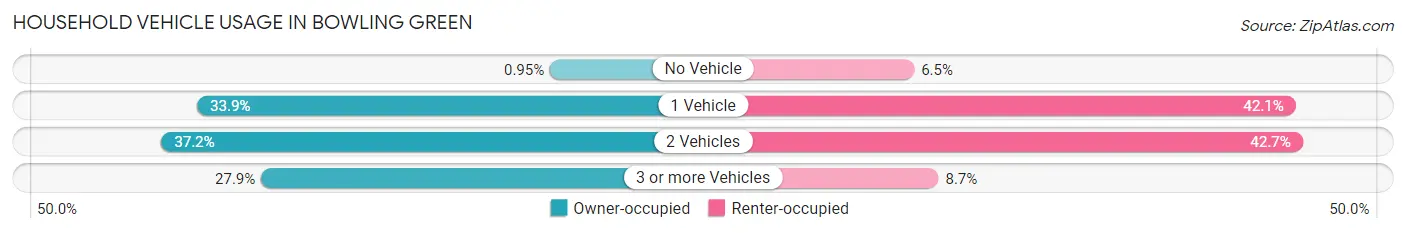
| Vehicles per Household | Owner-occupied | Renter-occupied |
| No Vehicle | 4 (0.9%) | 20 (6.5%) |
| 1 Vehicle | 142 (33.9%) | 130 (42.1%) |
| 2 Vehicles | 156 (37.2%) | 132 (42.7%) |
| 3 or more Vehicles | 117 (27.9%) | 27 (8.7%) |
| Total | 419 (100.0%) | 309 (100.0%) |
Real Estate & Mortgages in Bowling Green
Real Estate and Mortgage Overview in Bowling Green
| Characteristic | Without Mortgage | With Mortgage |
| Housing Units | 295 | 124 |
| Median Property Value | $61,800 | $127,100 |
| Median Household Income | $39,063 | $17 |
| Monthly Housing Costs | $382 | $0 |
| Real Estate Taxes | $642 | $5 |
Property Value by Mortgage Status in Bowling Green
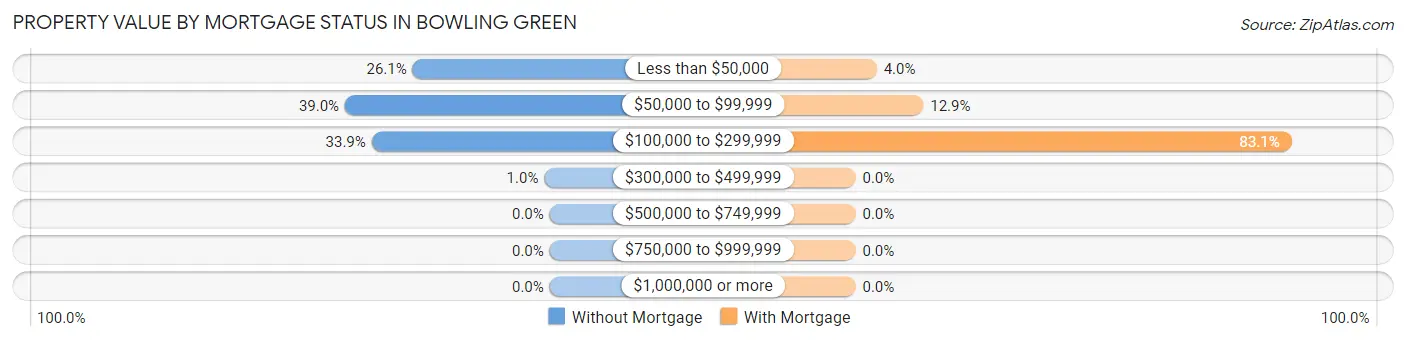
| Property Value | Without Mortgage | With Mortgage |
| Less than $50,000 | 77 (26.1%) | 5 (4.0%) |
| $50,000 to $99,999 | 115 (39.0%) | 16 (12.9%) |
| $100,000 to $299,999 | 100 (33.9%) | 103 (83.1%) |
| $300,000 to $499,999 | 3 (1.0%) | 0 (0.0%) |
| $500,000 to $749,999 | 0 (0.0%) | 0 (0.0%) |
| $750,000 to $999,999 | 0 (0.0%) | 0 (0.0%) |
| $1,000,000 or more | 0 (0.0%) | 0 (0.0%) |
| Total | 295 (100.0%) | 124 (100.0%) |
Household Income by Mortgage Status in Bowling Green
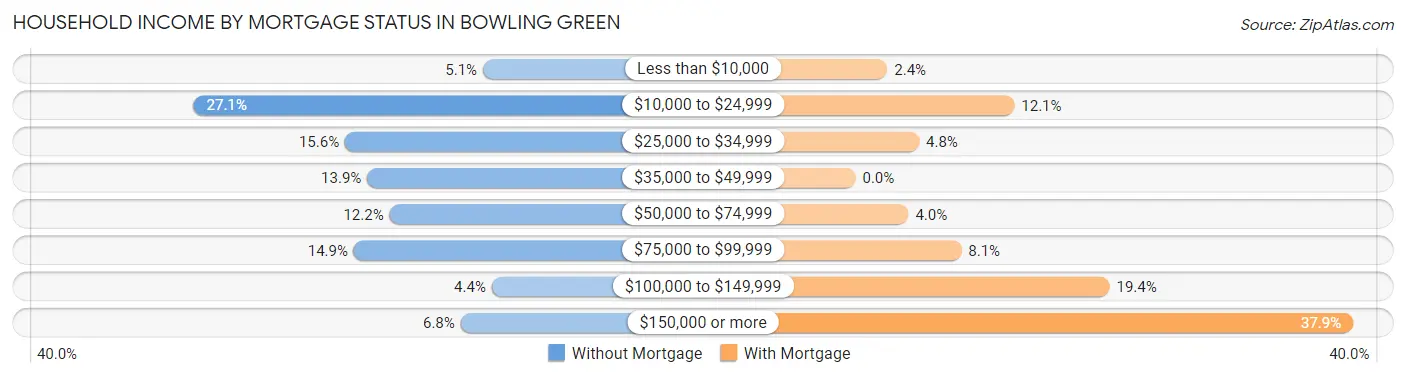
| Household Income | Without Mortgage | With Mortgage |
| Less than $10,000 | 15 (5.1%) | 3 (2.4%) |
| $10,000 to $24,999 | 80 (27.1%) | 15 (12.1%) |
| $25,000 to $34,999 | 46 (15.6%) | 6 (4.8%) |
| $35,000 to $49,999 | 41 (13.9%) | 0 (0.0%) |
| $50,000 to $74,999 | 36 (12.2%) | 5 (4.0%) |
| $75,000 to $99,999 | 44 (14.9%) | 10 (8.1%) |
| $100,000 to $149,999 | 13 (4.4%) | 24 (19.4%) |
| $150,000 or more | 20 (6.8%) | 47 (37.9%) |
| Total | 295 (100.0%) | 124 (100.0%) |
Property Value to Household Income Ratio in Bowling Green
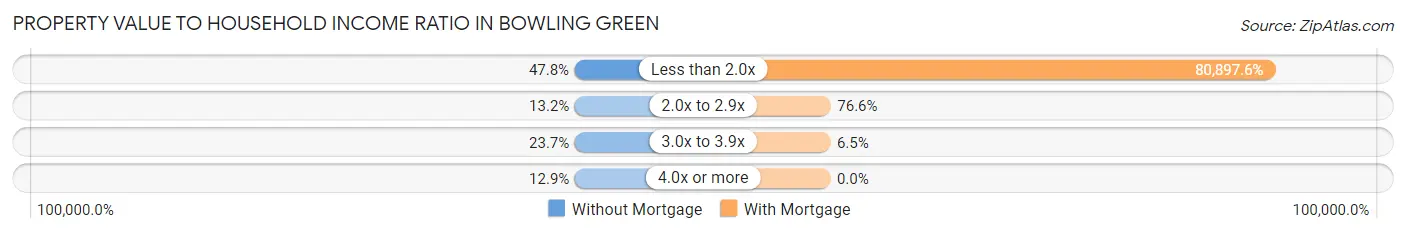
| Value-to-Income Ratio | Without Mortgage | With Mortgage |
| Less than 2.0x | 141 (47.8%) | 100,313 (80,897.6%) |
| 2.0x to 2.9x | 39 (13.2%) | 95 (76.6%) |
| 3.0x to 3.9x | 70 (23.7%) | 8 (6.5%) |
| 4.0x or more | 38 (12.9%) | 0 (0.0%) |
| Total | 295 (100.0%) | 124 (100.0%) |
Real Estate Taxes by Mortgage Status in Bowling Green
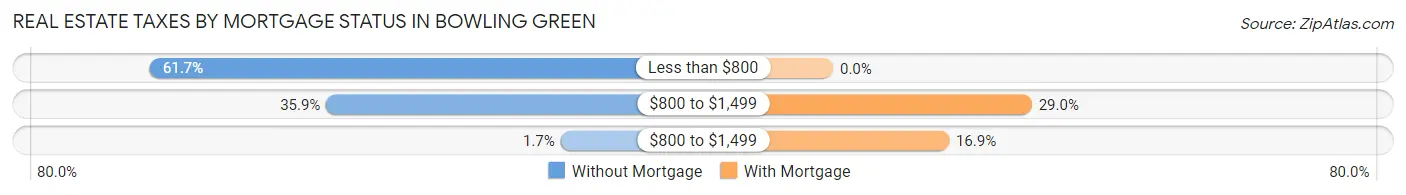
| Property Taxes | Without Mortgage | With Mortgage |
| Less than $800 | 182 (61.7%) | 0 (0.0%) |
| $800 to $1,499 | 106 (35.9%) | 36 (29.0%) |
| $800 to $1,499 | 5 (1.7%) | 21 (16.9%) |
| Total | 295 (100.0%) | 124 (100.0%) |
Health & Disability in Bowling Green
Health Insurance Coverage by Age in Bowling Green
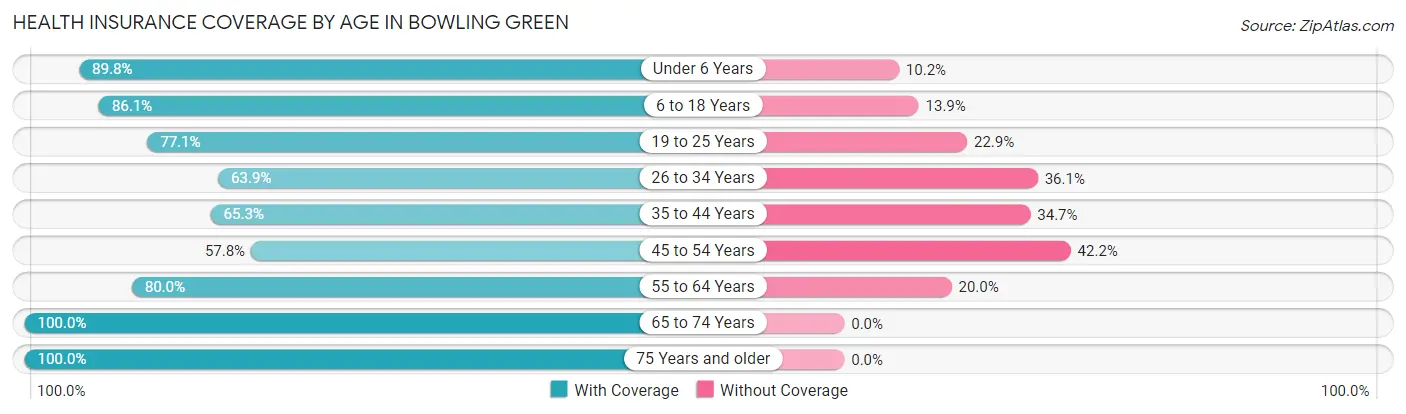
| Age Bracket | With Coverage | Without Coverage |
| Under 6 Years | 203 (89.8%) | 23 (10.2%) |
| 6 to 18 Years | 460 (86.1%) | 74 (13.9%) |
| 19 to 25 Years | 310 (77.1%) | 92 (22.9%) |
| 26 to 34 Years | 218 (63.9%) | 123 (36.1%) |
| 35 to 44 Years | 143 (65.3%) | 76 (34.7%) |
| 45 to 54 Years | 141 (57.8%) | 103 (42.2%) |
| 55 to 64 Years | 156 (80.0%) | 39 (20.0%) |
| 65 to 74 Years | 166 (100.0%) | 0 (0.0%) |
| 75 Years and older | 157 (100.0%) | 0 (0.0%) |
| Total | 1,954 (78.7%) | 530 (21.3%) |
Health Insurance Coverage by Citizenship Status in Bowling Green
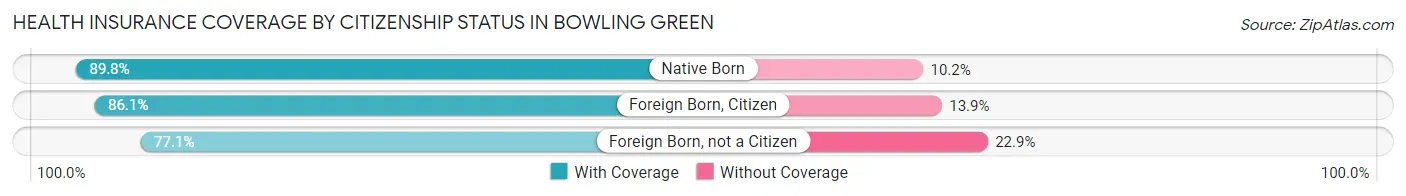
| Citizenship Status | With Coverage | Without Coverage |
| Native Born | 203 (89.8%) | 23 (10.2%) |
| Foreign Born, Citizen | 460 (86.1%) | 74 (13.9%) |
| Foreign Born, not a Citizen | 310 (77.1%) | 92 (22.9%) |
Health Insurance Coverage by Household Income in Bowling Green
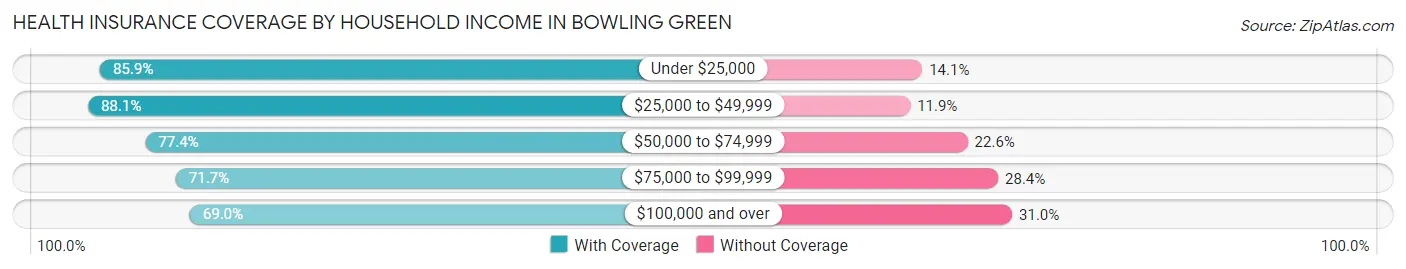
| Household Income | With Coverage | Without Coverage |
| Under $25,000 | 462 (85.9%) | 76 (14.1%) |
| $25,000 to $49,999 | 497 (88.1%) | 67 (11.9%) |
| $50,000 to $74,999 | 287 (77.4%) | 84 (22.6%) |
| $75,000 to $99,999 | 187 (71.7%) | 74 (28.3%) |
| $100,000 and over | 477 (69.0%) | 214 (31.0%) |
Public vs Private Health Insurance Coverage by Age in Bowling Green
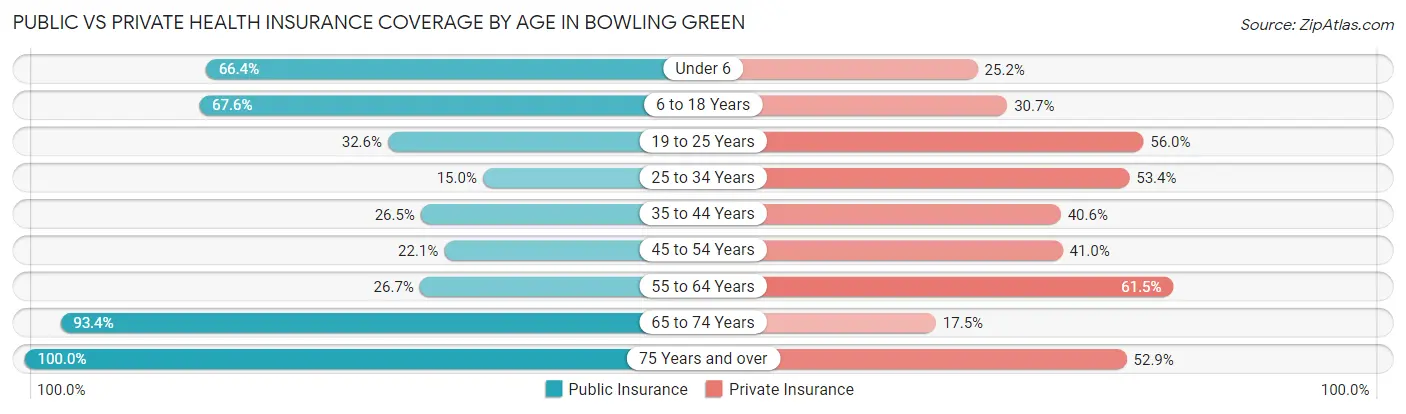
| Age Bracket | Public Insurance | Private Insurance |
| Under 6 | 150 (66.4%) | 57 (25.2%) |
| 6 to 18 Years | 361 (67.6%) | 164 (30.7%) |
| 19 to 25 Years | 131 (32.6%) | 225 (56.0%) |
| 25 to 34 Years | 51 (15.0%) | 182 (53.4%) |
| 35 to 44 Years | 58 (26.5%) | 89 (40.6%) |
| 45 to 54 Years | 54 (22.1%) | 100 (41.0%) |
| 55 to 64 Years | 52 (26.7%) | 120 (61.5%) |
| 65 to 74 Years | 155 (93.4%) | 29 (17.5%) |
| 75 Years and over | 157 (100.0%) | 83 (52.9%) |
| Total | 1,169 (47.1%) | 1,049 (42.2%) |
Disability Status by Sex by Age in Bowling Green
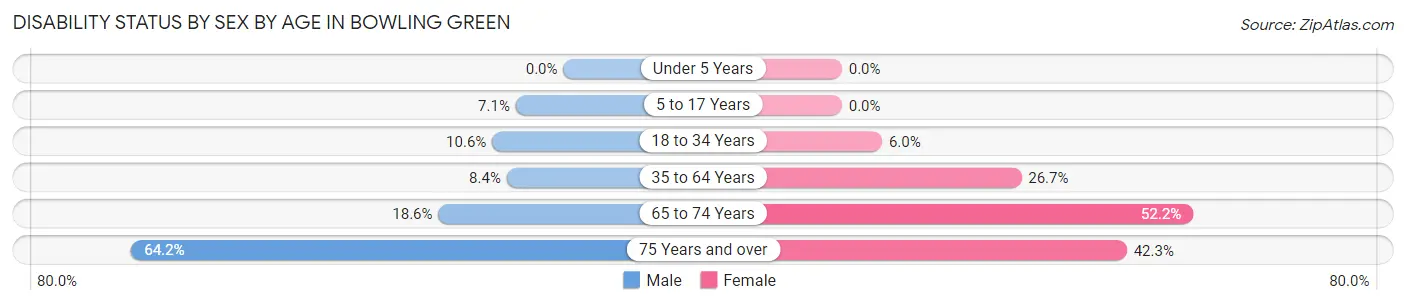
| Age Bracket | Male | Female |
| Under 5 Years | 0 (0.0%) | 0 (0.0%) |
| 5 to 17 Years | 27 (7.1%) | 0 (0.0%) |
| 18 to 34 Years | 41 (10.6%) | 23 (6.0%) |
| 35 to 64 Years | 26 (8.4%) | 93 (26.7%) |
| 65 to 74 Years | 18 (18.6%) | 36 (52.2%) |
| 75 Years and over | 34 (64.1%) | 44 (42.3%) |
Disability Class by Sex by Age in Bowling Green
Disability Class: Hearing Difficulty
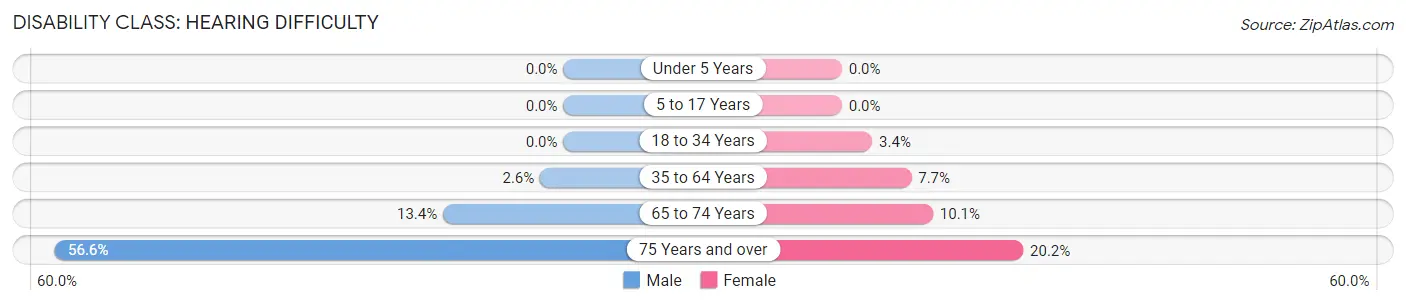
| Age Bracket | Male | Female |
| Under 5 Years | 0 (0.0%) | 0 (0.0%) |
| 5 to 17 Years | 0 (0.0%) | 0 (0.0%) |
| 18 to 34 Years | 0 (0.0%) | 13 (3.4%) |
| 35 to 64 Years | 8 (2.6%) | 27 (7.7%) |
| 65 to 74 Years | 13 (13.4%) | 7 (10.1%) |
| 75 Years and over | 30 (56.6%) | 21 (20.2%) |
Disability Class: Vision Difficulty
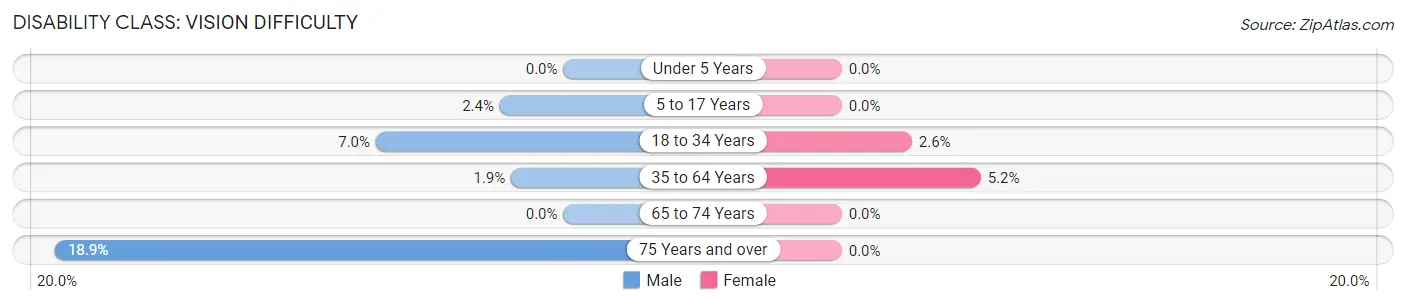
| Age Bracket | Male | Female |
| Under 5 Years | 0 (0.0%) | 0 (0.0%) |
| 5 to 17 Years | 9 (2.4%) | 0 (0.0%) |
| 18 to 34 Years | 27 (7.0%) | 10 (2.6%) |
| 35 to 64 Years | 6 (1.9%) | 18 (5.2%) |
| 65 to 74 Years | 0 (0.0%) | 0 (0.0%) |
| 75 Years and over | 10 (18.9%) | 0 (0.0%) |
Disability Class: Cognitive Difficulty
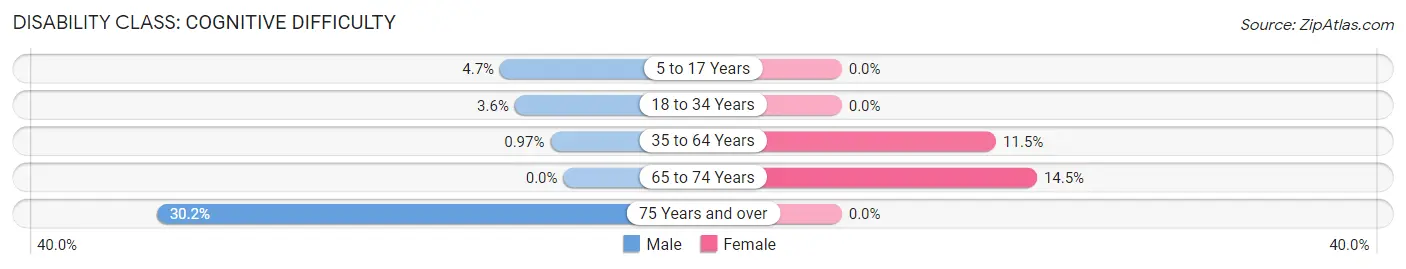
| Age Bracket | Male | Female |
| 5 to 17 Years | 18 (4.7%) | 0 (0.0%) |
| 18 to 34 Years | 14 (3.6%) | 0 (0.0%) |
| 35 to 64 Years | 3 (1.0%) | 40 (11.5%) |
| 65 to 74 Years | 0 (0.0%) | 10 (14.5%) |
| 75 Years and over | 16 (30.2%) | 0 (0.0%) |
Disability Class: Ambulatory Difficulty
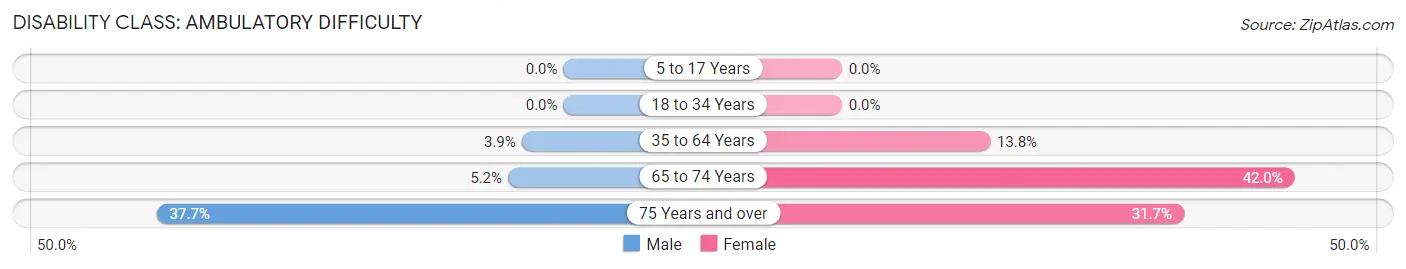
| Age Bracket | Male | Female |
| 5 to 17 Years | 0 (0.0%) | 0 (0.0%) |
| 18 to 34 Years | 0 (0.0%) | 0 (0.0%) |
| 35 to 64 Years | 12 (3.9%) | 48 (13.8%) |
| 65 to 74 Years | 5 (5.1%) | 29 (42.0%) |
| 75 Years and over | 20 (37.7%) | 33 (31.7%) |
Disability Class: Self-Care Difficulty
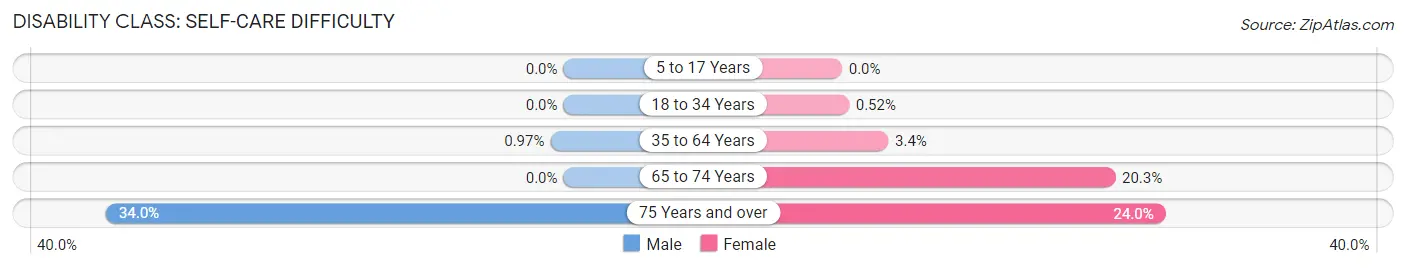
| Age Bracket | Male | Female |
| 5 to 17 Years | 0 (0.0%) | 0 (0.0%) |
| 18 to 34 Years | 0 (0.0%) | 2 (0.5%) |
| 35 to 64 Years | 3 (1.0%) | 12 (3.4%) |
| 65 to 74 Years | 0 (0.0%) | 14 (20.3%) |
| 75 Years and over | 18 (34.0%) | 25 (24.0%) |
Technology Access in Bowling Green
Computing Device Access in Bowling Green
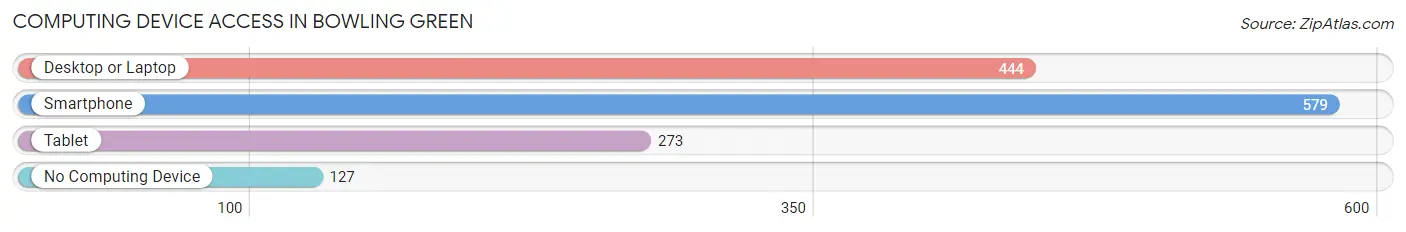
| Device Type | # Households | % Households |
| Desktop or Laptop | 444 | 61.0% |
| Smartphone | 579 | 79.5% |
| Tablet | 273 | 37.5% |
| No Computing Device | 127 | 17.4% |
| Total | 728 | 100.0% |
Internet Access in Bowling Green
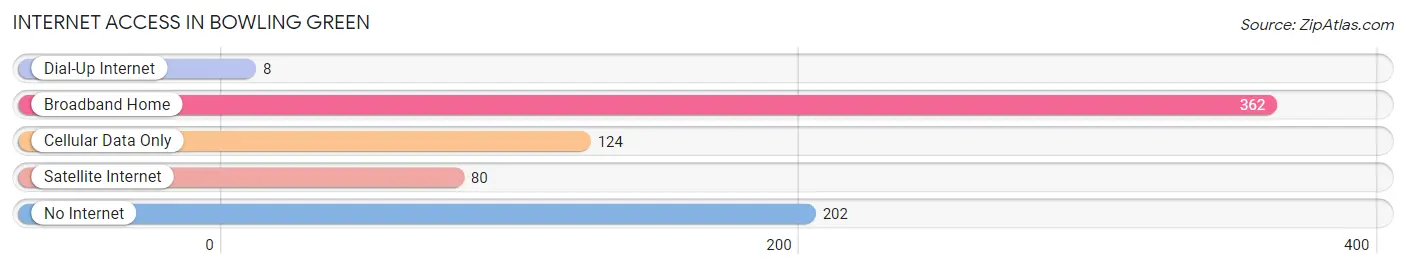
| Internet Type | # Households | % Households |
| Dial-Up Internet | 8 | 1.1% |
| Broadband Home | 362 | 49.7% |
| Cellular Data Only | 124 | 17.0% |
| Satellite Internet | 80 | 11.0% |
| No Internet | 202 | 27.8% |
| Total | 728 | 100.0% |
Bowling Green Summary
Bowling Green is a small town located in the central part of Florida, in Hardee County. It is situated about 25 miles east of the city of Bradenton and about 40 miles south of the city of Tampa. The town has a population of approximately 1,500 people and is part of the Tampa-St. Petersburg-Clearwater metropolitan area.
History
The area that is now known as Bowling Green was first settled in the late 1800s by a group of settlers from Georgia. The town was originally called “Bowling Green Station” and was a stop on the Seaboard Air Line Railroad. The town was officially incorporated in 1925 and was named after the nearby Bowling Green Plantation.
Geography
Bowling Green is located in the central part of Florida, in Hardee County. It is situated about 25 miles east of the city of Bradenton and about 40 miles south of the city of Tampa. The town is located on the Peace River, which is a tributary of the Gulf of Mexico. The town is surrounded by citrus groves and is home to several lakes, including Lake June-in-Winter, Lake Istokpoga, and Lake Arbuckle.
Economy
The economy of Bowling Green is largely based on agriculture. The town is home to several citrus groves and is a major producer of oranges, grapefruits, and tangerines. The town is also home to several cattle ranches and is a major producer of beef. In addition, the town is home to several manufacturing companies, including a paper mill and a furniture factory.
Demographics
As of the 2010 census, the population of Bowling Green was 1,500 people. The racial makeup of the town was 94.7% White, 1.3% African American, 0.7% Native American, 0.7% Asian, 0.3% from other races, and 2.0% from two or more races. The median household income was $37,500 and the median family income was $41,250. The per capita income was $17,857.
Conclusion
Bowling Green is a small town located in the central part of Florida, in Hardee County. It is situated about 25 miles east of the city of Bradenton and about 40 miles south of the city of Tampa. The town has a population of approximately 1,500 people and is part of the Tampa-St. Petersburg-Clearwater metropolitan area. The economy of Bowling Green is largely based on agriculture, with the town being home to several citrus groves and cattle ranches. The town is also home to several manufacturing companies. The racial makeup of the town is 94.7% White, 1.3% African American, 0.7% Native American, 0.7% Asian, 0.3% from other races, and 2.0% from two or more races. The median household income was $37,500 and the median family income was $41,250. The per capita income was $17,857.
Common Questions
What is Per Capita Income in Bowling Green?
Per Capita income in Bowling Green is $18,995.
What is the Median Family Income in Bowling Green?
Median Family Income in Bowling Green is $52,368.
What is the Median Household income in Bowling Green?
Median Household Income in Bowling Green is $46,429.
What is Income or Wage Gap in Bowling Green?
Income or Wage Gap in Bowling Green is 32.7%.
Women in Bowling Green earn 67.3 cents for every dollar earned by a man.
What is Family Income Deficit in Bowling Green?
Family Income Deficit in Bowling Green is $10,104.
Families that are below poverty line in Bowling Green earn $10,104 less on average than the poverty threshold level.
What is Inequality or Gini Index in Bowling Green?
Inequality or Gini Index in Bowling Green is 0.48.
What is the Total Population of Bowling Green?
Total Population of Bowling Green is 2,484.
What is the Total Male Population of Bowling Green?
Total Male Population of Bowling Green is 1,363.
What is the Total Female Population of Bowling Green?
Total Female Population of Bowling Green is 1,121.
What is the Ratio of Males per 100 Females in Bowling Green?
There are 121.59 Males per 100 Females in Bowling Green.
What is the Ratio of Females per 100 Males in Bowling Green?
There are 82.25 Females per 100 Males in Bowling Green.
What is the Median Population Age in Bowling Green?
Median Population Age in Bowling Green is 26.9 Years.
What is the Average Family Size in Bowling Green
Average Family Size in Bowling Green is 3.7 People.
What is the Average Household Size in Bowling Green
Average Household Size in Bowling Green is 3.3 People.
How Large is the Labor Force in Bowling Green?
There are 1,019 People in the Labor Forcein in Bowling Green.
What is the Percentage of People in the Labor Force in Bowling Green?
54.5% of People are in the Labor Force in Bowling Green.
What is the Unemployment Rate in Bowling Green?
Unemployment Rate in Bowling Green is 13.8%.