Bonifay, FL Map & Demographics
Bonifay Map
Bonifay Overview
$19,419
PER CAPITA INCOME
$38,100
AVG FAMILY INCOME
$32,750
AVG HOUSEHOLD INCOME
18.8%
WAGE / INCOME GAP [ % ]
81.2¢/ $1
WAGE / INCOME GAP [ $ ]
$12,811
FAMILY INCOME DEFICIT
0.43
INEQUALITY / GINI INDEX
2,760
TOTAL POPULATION
1,145
MALE POPULATION
1,615
FEMALE POPULATION
70.90
MALES / 100 FEMALES
141.05
FEMALES / 100 MALES
45.1
MEDIAN AGE
2.9
AVG FAMILY SIZE
2.0
AVG HOUSEHOLD SIZE
954
LABOR FORCE [ PEOPLE ]
43.3%
PERCENT IN LABOR FORCE
8.5%
UNEMPLOYMENT RATE
Bonifay Zip Codes
Bonifay Area Codes
Income in Bonifay
Income Overview in Bonifay
Per Capita Income in Bonifay is $19,419, while median incomes of families and households are $38,100 and $32,750 respectively.
| Characteristic | Number | Measure |
| Per Capita Income | 2,760 | $19,419 |
| Median Family Income | 622 | $38,100 |
| Mean Family Income | 622 | $48,926 |
| Median Household Income | 1,263 | $32,750 |
| Mean Household Income | 1,263 | $39,630 |
| Income Deficit | 622 | $12,811 |
| Wage / Income Gap (%) | 2,760 | 18.81% |
| Wage / Income Gap ($) | 2,760 | 81.19¢ per $1 |
| Gini / Inequality Index | 2,760 | 0.43 |
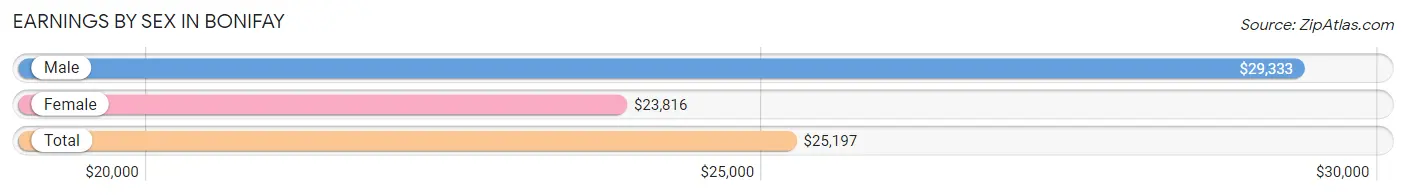
Earnings by Sex in Bonifay
Average Earnings in Bonifay are $25,197, $29,333 for men and $23,816 for women, a difference of 18.8%.
| Sex | Number | Average Earnings |
| Male | 318 (32.6%) | $29,333 |
| Female | 658 (67.4%) | $23,816 |
| Total | 976 (100.0%) | $25,197 |
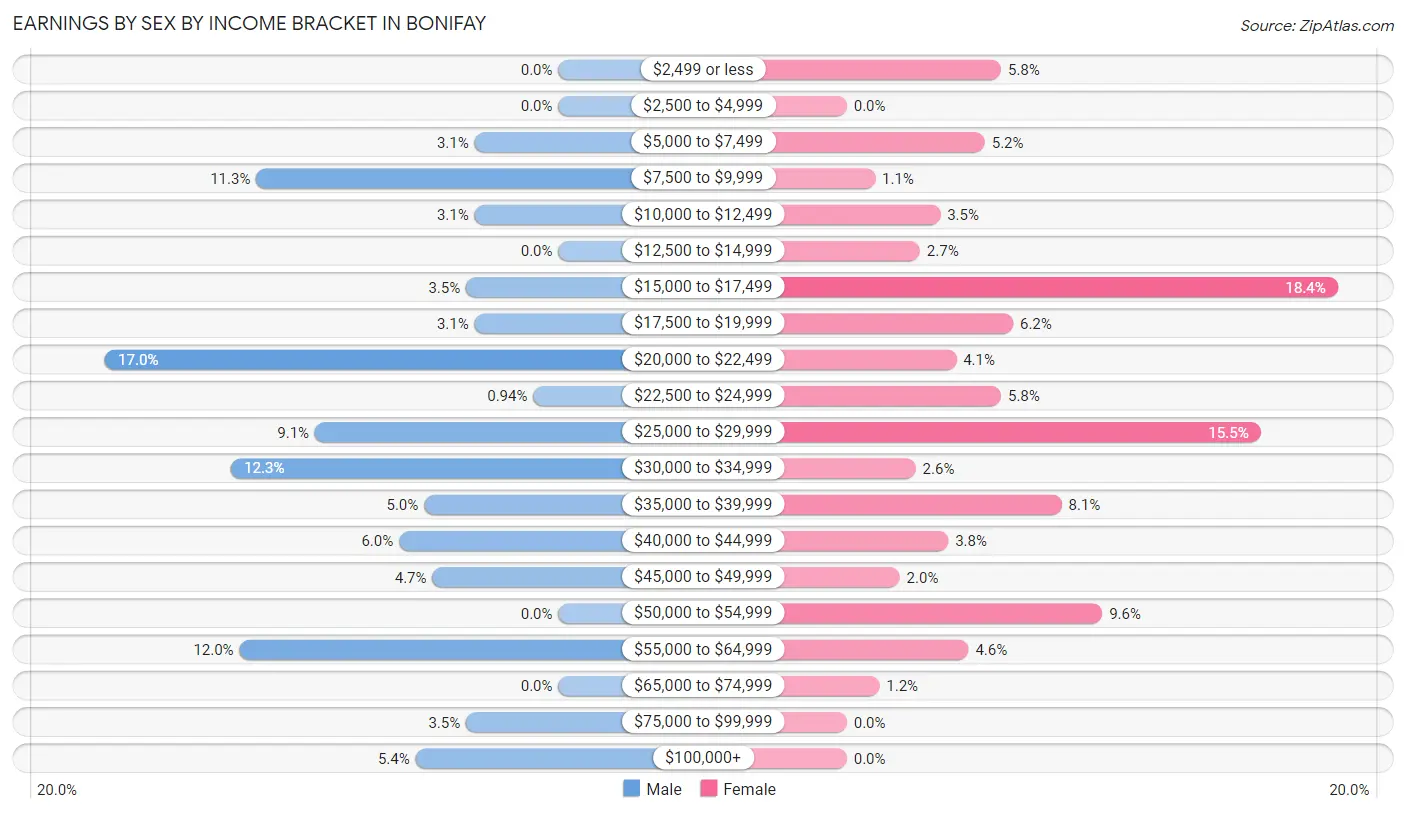
Earnings by Sex by Income Bracket in Bonifay
The most common earnings brackets in Bonifay are $20,000 to $22,499 for men (54 | 17.0%) and $15,000 to $17,499 for women (121 | 18.4%).
| Income | Male | Female |
| $2,499 or less | 0 (0.0%) | 38 (5.8%) |
| $2,500 to $4,999 | 0 (0.0%) | 0 (0.0%) |
| $5,000 to $7,499 | 10 (3.1%) | 34 (5.2%) |
| $7,500 to $9,999 | 36 (11.3%) | 7 (1.1%) |
| $10,000 to $12,499 | 10 (3.1%) | 23 (3.5%) |
| $12,500 to $14,999 | 0 (0.0%) | 18 (2.7%) |
| $15,000 to $17,499 | 11 (3.5%) | 121 (18.4%) |
| $17,500 to $19,999 | 10 (3.1%) | 41 (6.2%) |
| $20,000 to $22,499 | 54 (17.0%) | 27 (4.1%) |
| $22,500 to $24,999 | 3 (0.9%) | 38 (5.8%) |
| $25,000 to $29,999 | 29 (9.1%) | 102 (15.5%) |
| $30,000 to $34,999 | 39 (12.3%) | 17 (2.6%) |
| $35,000 to $39,999 | 16 (5.0%) | 53 (8.1%) |
| $40,000 to $44,999 | 19 (6.0%) | 25 (3.8%) |
| $45,000 to $49,999 | 15 (4.7%) | 13 (2.0%) |
| $50,000 to $54,999 | 0 (0.0%) | 63 (9.6%) |
| $55,000 to $64,999 | 38 (11.9%) | 30 (4.6%) |
| $65,000 to $74,999 | 0 (0.0%) | 8 (1.2%) |
| $75,000 to $99,999 | 11 (3.5%) | 0 (0.0%) |
| $100,000+ | 17 (5.3%) | 0 (0.0%) |
| Total | 318 (100.0%) | 658 (100.0%) |
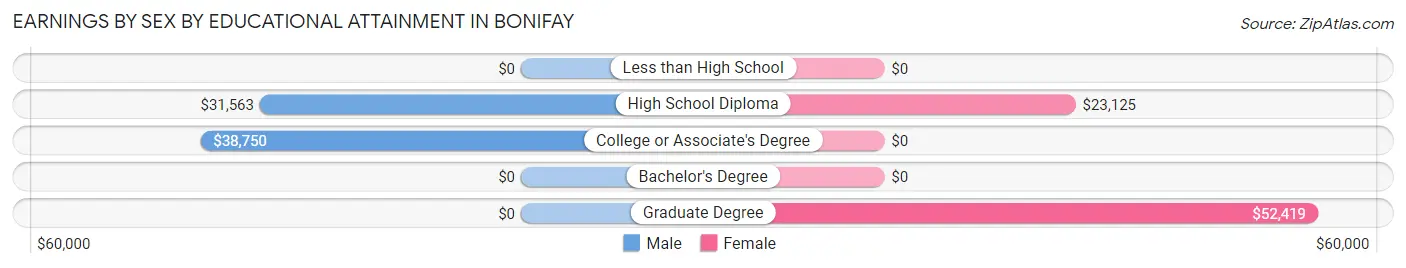
Earnings by Sex by Educational Attainment in Bonifay
Average earnings in Bonifay are $32,383 for men and $25,750 for women, a difference of 20.5%. Men with an educational attainment of college or associate's degree enjoy the highest average annual earnings of $38,750, while those with high school diploma education earn the least with $31,563. Women with an educational attainment of graduate degree earn the most with the average annual earnings of $52,419, while those with high school diploma education have the smallest earnings of $23,125.
| Educational Attainment | Male Income | Female Income |
| Less than High School | - | - |
| High School Diploma | $31,563 | $23,125 |
| College or Associate's Degree | $38,750 | $0 |
| Bachelor's Degree | - | - |
| Graduate Degree | - | - |
| Total | $32,383 | $25,750 |
Family Income in Bonifay
Family Income Brackets in Bonifay
According to the Bonifay family income data, there are 156 families falling into the $50,000 to $74,999 income range, which is the most common income bracket and makes up 25.1% of all families.
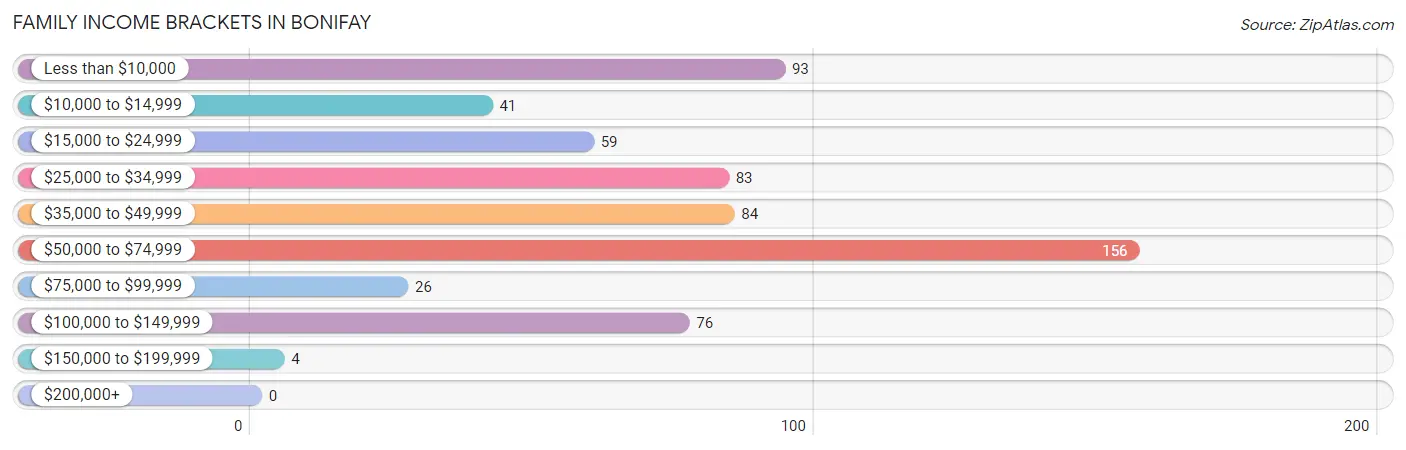
| Income Bracket | # Families | % Families |
| Less than $10,000 | 93 | 15.0% |
| $10,000 to $14,999 | 41 | 6.6% |
| $15,000 to $24,999 | 59 | 9.5% |
| $25,000 to $34,999 | 83 | 13.3% |
| $35,000 to $49,999 | 84 | 13.5% |
| $50,000 to $74,999 | 156 | 25.1% |
| $75,000 to $99,999 | 26 | 4.2% |
| $100,000 to $149,999 | 76 | 12.2% |
| $150,000 to $199,999 | 4 | 0.6% |
| $200,000+ | 0 | 0.0% |
Family Income by Famaliy Size in Bonifay
2-person families (250 | 40.2%) account for the highest median family income in Bonifay with $53,796 per family, while 2-person families (250 | 40.2%) have the highest median income of $26,898 per family member.
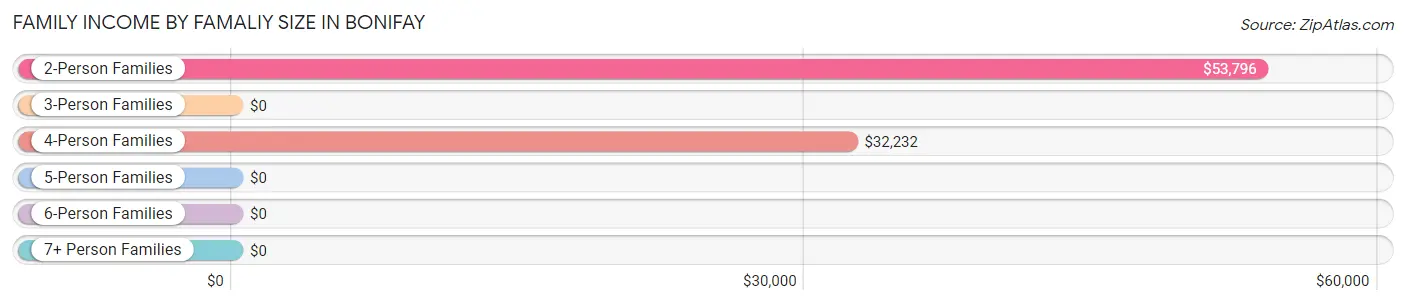
| Income Bracket | # Families | Median Income |
| 2-Person Families | 250 (40.2%) | $53,796 |
| 3-Person Families | 142 (22.8%) | $0 |
| 4-Person Families | 104 (16.7%) | $32,232 |
| 5-Person Families | 28 (4.5%) | $0 |
| 6-Person Families | 98 (15.8%) | $0 |
| 7+ Person Families | 0 (0.0%) | $0 |
| Total | 622 (100.0%) | $38,100 |
Family Income by Number of Earners in Bonifay
The median family income in Bonifay is $38,100, with families comprising 3+ earners (41) having the highest median family income of $121,076, while families with 1 earner (324) have the lowest median family income of $30,955, accounting for 6.6% and 52.1% of families, respectively.
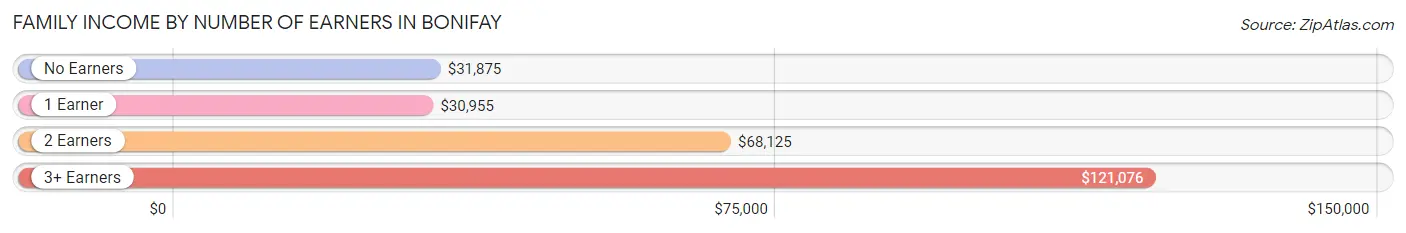
| Number of Earners | # Families | Median Income |
| No Earners | 146 (23.5%) | $31,875 |
| 1 Earner | 324 (52.1%) | $30,955 |
| 2 Earners | 111 (17.8%) | $68,125 |
| 3+ Earners | 41 (6.6%) | $121,076 |
| Total | 622 (100.0%) | $38,100 |
Household Income in Bonifay
Household Income Brackets in Bonifay
With 251 households falling in the category, the $35,000 to $49,999 income range is the most frequent in Bonifay, accounting for 19.9% of all households.
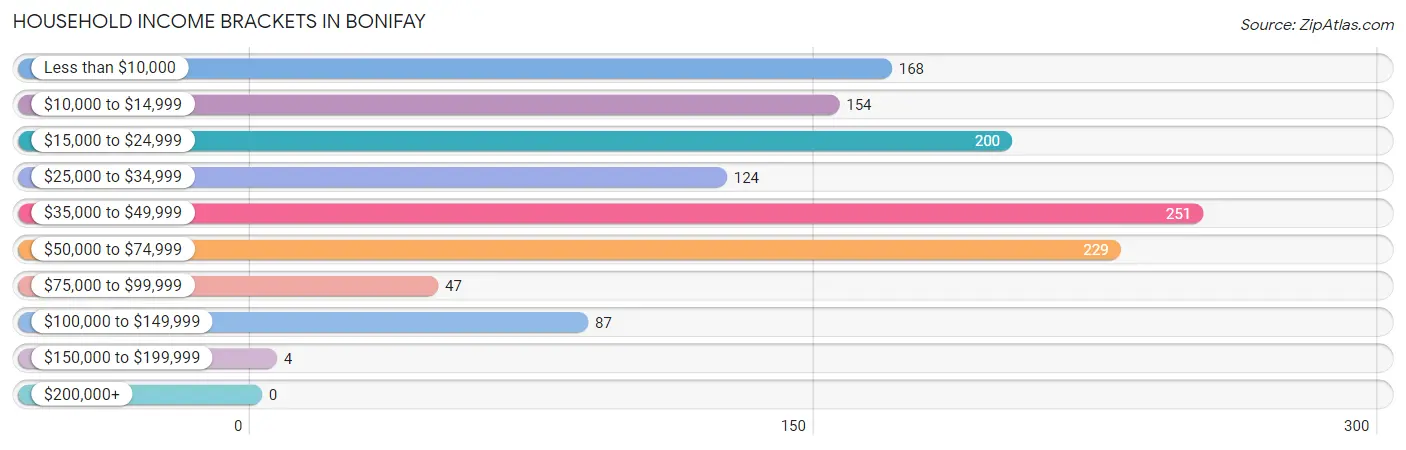
| Income Bracket | # Households | % Households |
| Less than $10,000 | 168 | 13.3% |
| $10,000 to $14,999 | 154 | 12.2% |
| $15,000 to $24,999 | 200 | 15.8% |
| $25,000 to $34,999 | 124 | 9.8% |
| $35,000 to $49,999 | 251 | 19.9% |
| $50,000 to $74,999 | 229 | 18.1% |
| $75,000 to $99,999 | 47 | 3.7% |
| $100,000 to $149,999 | 87 | 6.9% |
| $150,000 to $199,999 | 4 | 0.3% |
| $200,000+ | 0 | 0.0% |
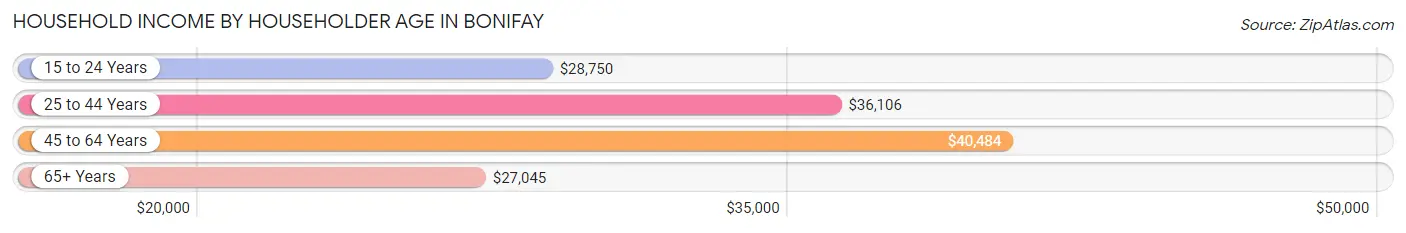
Household Income by Householder Age in Bonifay
The median household income in Bonifay is $32,750, with the highest median household income of $40,484 found in the 45 to 64 years age bracket for the primary householder. A total of 390 households (30.9%) fall into this category. Meanwhile, the 65+ years age bracket for the primary householder has the lowest median household income of $27,045, with 504 households (39.9%) in this group.
| Income Bracket | # Households | Median Income |
| 15 to 24 Years | 84 (6.7%) | $28,750 |
| 25 to 44 Years | 285 (22.6%) | $36,106 |
| 45 to 64 Years | 390 (30.9%) | $40,484 |
| 65+ Years | 504 (39.9%) | $27,045 |
| Total | 1,263 (100.0%) | $32,750 |
Poverty in Bonifay
Income Below Poverty by Sex and Age in Bonifay
With 30.1% poverty level for males and 33.3% for females among the residents of Bonifay, 5 year old males and under 5 year old females are the most vulnerable to poverty, with 7 males (100.0%) and 29 females (78.4%) in their respective age groups living below the poverty level.
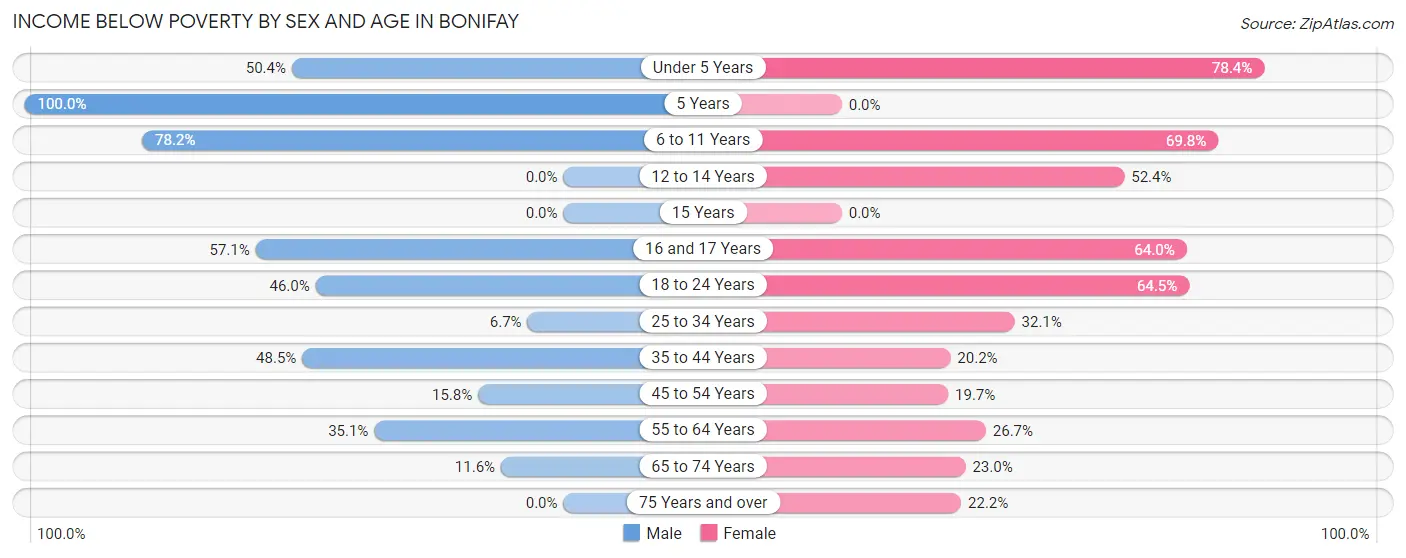
| Age Bracket | Male | Female |
| Under 5 Years | 62 (50.4%) | 29 (78.4%) |
| 5 Years | 7 (100.0%) | 0 (0.0%) |
| 6 to 11 Years | 86 (78.2%) | 44 (69.8%) |
| 12 to 14 Years | 0 (0.0%) | 54 (52.4%) |
| 15 Years | 0 (0.0%) | 0 (0.0%) |
| 16 and 17 Years | 20 (57.1%) | 16 (64.0%) |
| 18 to 24 Years | 46 (46.0%) | 78 (64.5%) |
| 25 to 34 Years | 5 (6.7%) | 85 (32.1%) |
| 35 to 44 Years | 32 (48.5%) | 26 (20.2%) |
| 45 to 54 Years | 16 (15.8%) | 29 (19.7%) |
| 55 to 64 Years | 33 (35.1%) | 50 (26.7%) |
| 65 to 74 Years | 16 (11.6%) | 45 (23.0%) |
| 75 Years and over | 0 (0.0%) | 35 (22.2%) |
| Total | 323 (30.1%) | 491 (33.3%) |
Income Above Poverty by Sex and Age in Bonifay
According to the poverty statistics in Bonifay, males aged 12 to 14 years and females aged 5 years are the age groups that are most secure financially, with 100.0% of males and 100.0% of females in these age groups living above the poverty line.
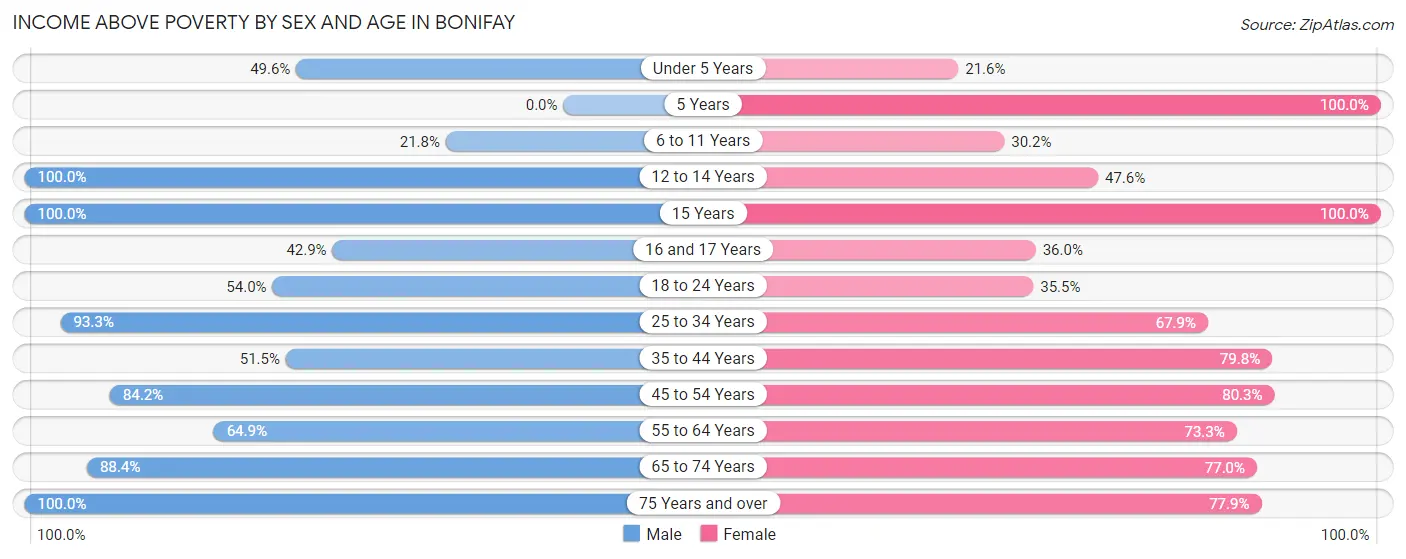
| Age Bracket | Male | Female |
| Under 5 Years | 61 (49.6%) | 8 (21.6%) |
| 5 Years | 0 (0.0%) | 37 (100.0%) |
| 6 to 11 Years | 24 (21.8%) | 19 (30.2%) |
| 12 to 14 Years | 41 (100.0%) | 49 (47.6%) |
| 15 Years | 29 (100.0%) | 6 (100.0%) |
| 16 and 17 Years | 15 (42.9%) | 9 (36.0%) |
| 18 to 24 Years | 54 (54.0%) | 43 (35.5%) |
| 25 to 34 Years | 70 (93.3%) | 180 (67.9%) |
| 35 to 44 Years | 34 (51.5%) | 103 (79.8%) |
| 45 to 54 Years | 85 (84.2%) | 118 (80.3%) |
| 55 to 64 Years | 61 (64.9%) | 137 (73.3%) |
| 65 to 74 Years | 122 (88.4%) | 151 (77.0%) |
| 75 Years and over | 154 (100.0%) | 123 (77.8%) |
| Total | 750 (69.9%) | 983 (66.7%) |
Income Below Poverty Among Married-Couple Families in Bonifay
The poverty statistics for married-couple families in Bonifay show that 25.1% or 90 of the total 358 families live below the poverty line. Families with 3 or 4 children have the highest poverty rate of 82.7%, comprising of 81 families. On the other hand, families with no children have the lowest poverty rate of 0.0%, which includes 0 families.
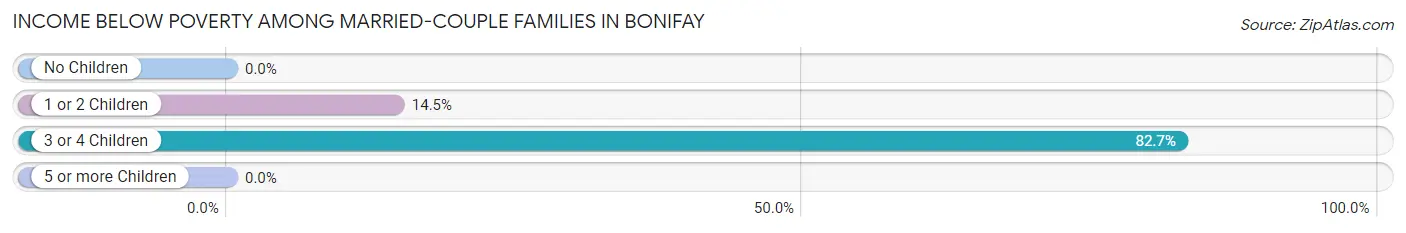
| Children | Above Poverty | Below Poverty |
| No Children | 198 (100.0%) | 0 (0.0%) |
| 1 or 2 Children | 53 (85.5%) | 9 (14.5%) |
| 3 or 4 Children | 17 (17.3%) | 81 (82.7%) |
| 5 or more Children | 0 (0.0%) | 0 (0.0%) |
| Total | 268 (74.9%) | 90 (25.1%) |
Income Below Poverty Among Single-Parent Households in Bonifay
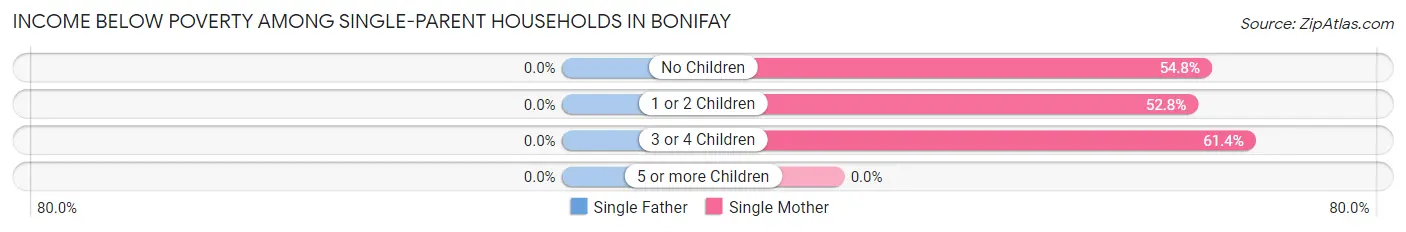
| Children | Single Father | Single Mother |
| No Children | 0 (0.0%) | 17 (54.8%) |
| 1 or 2 Children | 0 (0.0%) | 85 (52.8%) |
| 3 or 4 Children | 0 (0.0%) | 27 (61.4%) |
| 5 or more Children | 0 (0.0%) | 0 (0.0%) |
| Total | 0 (0.0%) | 129 (54.7%) |
Income Below Poverty Among Married-Couple vs Single-Parent Households in Bonifay
The poverty data for Bonifay shows that 90 of the married-couple family households (25.1%) and 129 of the single-parent households (48.9%) are living below the poverty level. Within the married-couple family households, those with 3 or 4 children have the highest poverty rate, with 81 households (82.7%) falling below the poverty line. Among the single-parent households, those with no children have the highest poverty rate, with 17 household (54.8%) living below poverty.
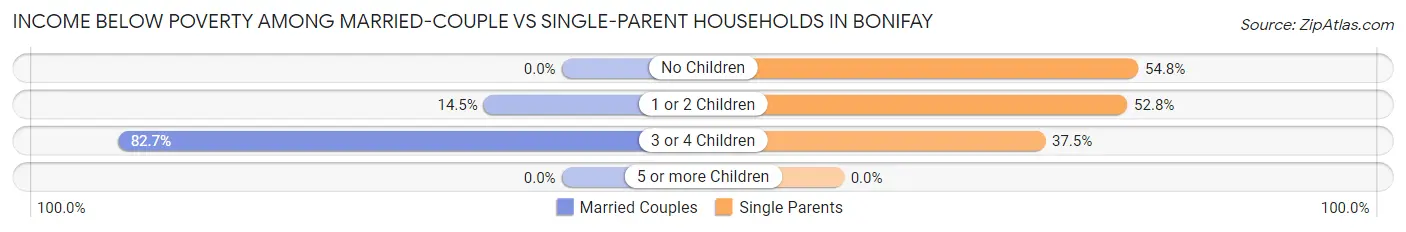
| Children | Married-Couple Families | Single-Parent Households |
| No Children | 0 (0.0%) | 17 (54.8%) |
| 1 or 2 Children | 9 (14.5%) | 85 (52.8%) |
| 3 or 4 Children | 81 (82.7%) | 27 (37.5%) |
| 5 or more Children | 0 (0.0%) | 0 (0.0%) |
| Total | 90 (25.1%) | 129 (48.9%) |
Race in Bonifay
The most populous races in Bonifay are White / Caucasian (2,008 | 72.8%), Black / African American (429 | 15.5%), and Two or more Races (263 | 9.5%).
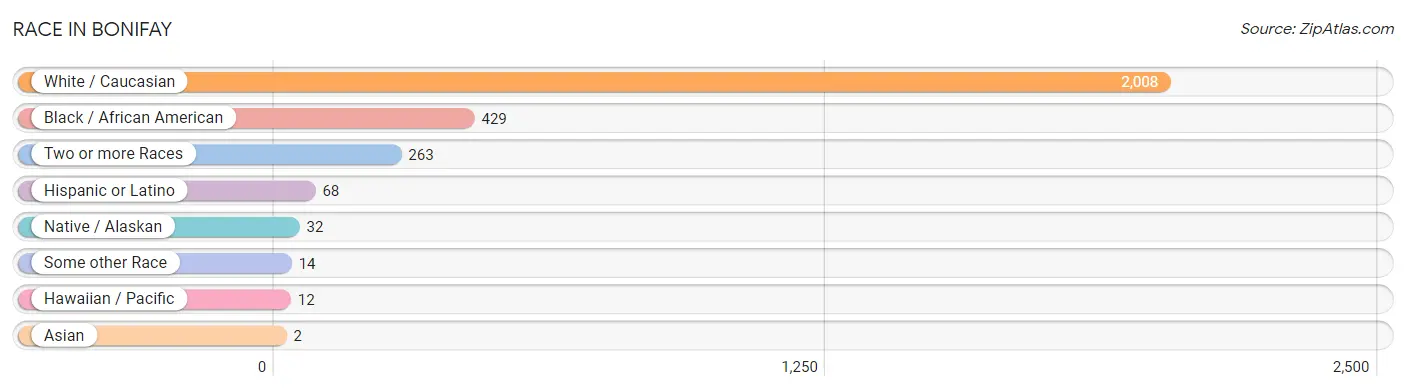
| Race | # Population | % Population |
| Asian | 2 | 0.1% |
| Black / African American | 429 | 15.5% |
| Hawaiian / Pacific | 12 | 0.4% |
| Hispanic or Latino | 68 | 2.5% |
| Native / Alaskan | 32 | 1.2% |
| White / Caucasian | 2,008 | 72.8% |
| Two or more Races | 263 | 9.5% |
| Some other Race | 14 | 0.5% |
| Total | 2,760 | 100.0% |
Ancestry in Bonifay
The most populous ancestries reported in Bonifay are American (489 | 17.7%), English (358 | 13.0%), Irish (270 | 9.8%), German (223 | 8.1%), and Creek (54 | 2.0%), together accounting for 50.5% of all Bonifay residents.
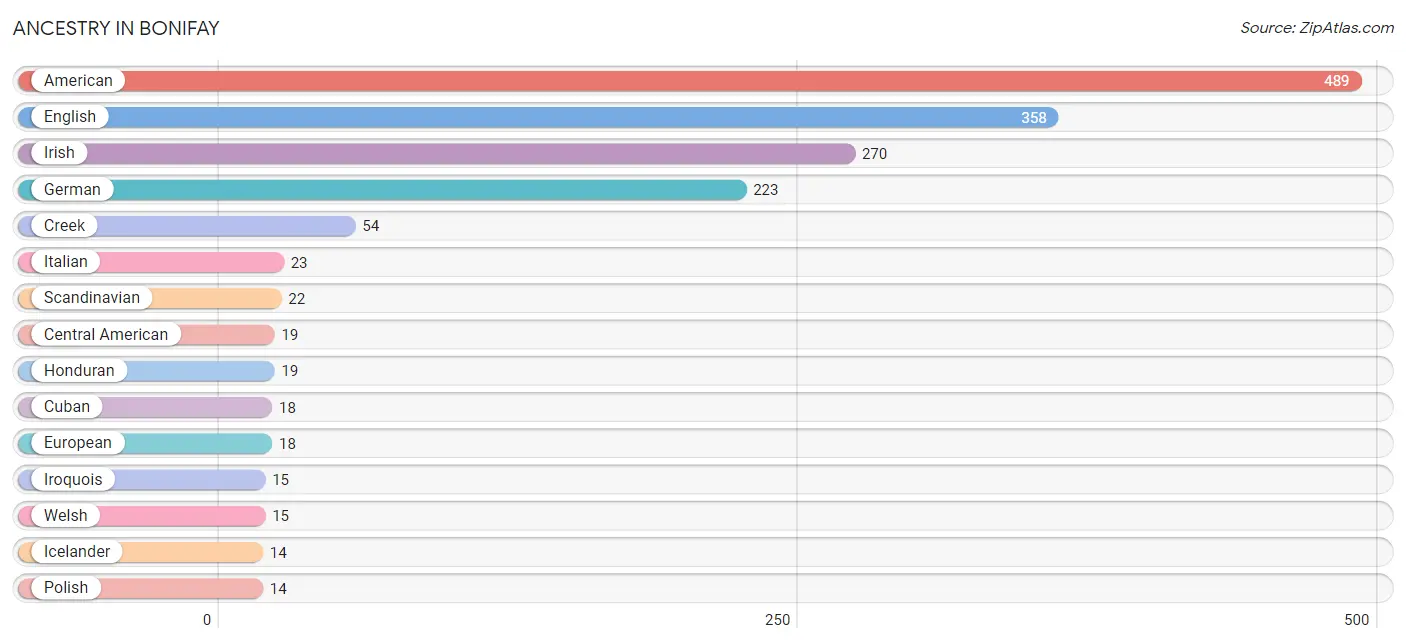
| Ancestry | # Population | % Population |
| American | 489 | 17.7% |
| British | 6 | 0.2% |
| Central American | 19 | 0.7% |
| Cherokee | 8 | 0.3% |
| Colombian | 8 | 0.3% |
| Creek | 54 | 2.0% |
| Cuban | 18 | 0.6% |
| Czech | 1 | 0.0% |
| Dominican | 5 | 0.2% |
| English | 358 | 13.0% |
| European | 18 | 0.6% |
| French | 10 | 0.4% |
| French American Indian | 1 | 0.0% |
| German | 223 | 8.1% |
| Guamanian / Chamorro | 12 | 0.4% |
| Honduran | 19 | 0.7% |
| Hungarian | 7 | 0.3% |
| Icelander | 14 | 0.5% |
| Irish | 270 | 9.8% |
| Iroquois | 15 | 0.5% |
| Italian | 23 | 0.8% |
| Jamaican | 8 | 0.3% |
| Mexican | 6 | 0.2% |
| Norwegian | 5 | 0.2% |
| Polish | 14 | 0.5% |
| Puerto Rican | 2 | 0.1% |
| Scandinavian | 22 | 0.8% |
| Scotch-Irish | 9 | 0.3% |
| Scottish | 11 | 0.4% |
| South American | 8 | 0.3% |
| Sri Lankan | 2 | 0.1% |
| Swedish | 5 | 0.2% |
| Welsh | 15 | 0.5% | View All 33 Rows |
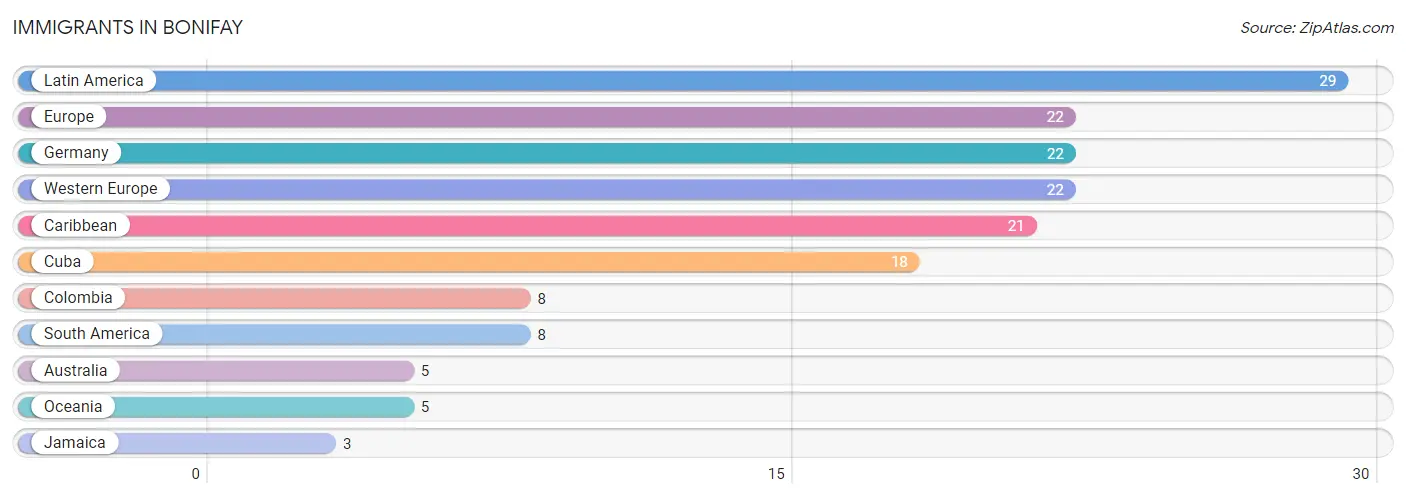
Immigrants in Bonifay
The most numerous immigrant groups reported in Bonifay came from Latin America (29 | 1.1%), Europe (22 | 0.8%), Germany (22 | 0.8%), Western Europe (22 | 0.8%), and Caribbean (21 | 0.8%), together accounting for 4.2% of all Bonifay residents.
| Immigration Origin | # Population | % Population |
| Australia | 5 | 0.2% |
| Caribbean | 21 | 0.8% |
| Colombia | 8 | 0.3% |
| Cuba | 18 | 0.6% |
| Europe | 22 | 0.8% |
| Germany | 22 | 0.8% |
| Jamaica | 3 | 0.1% |
| Latin America | 29 | 1.1% |
| Oceania | 5 | 0.2% |
| South America | 8 | 0.3% |
| Western Europe | 22 | 0.8% | View All 11 Rows |
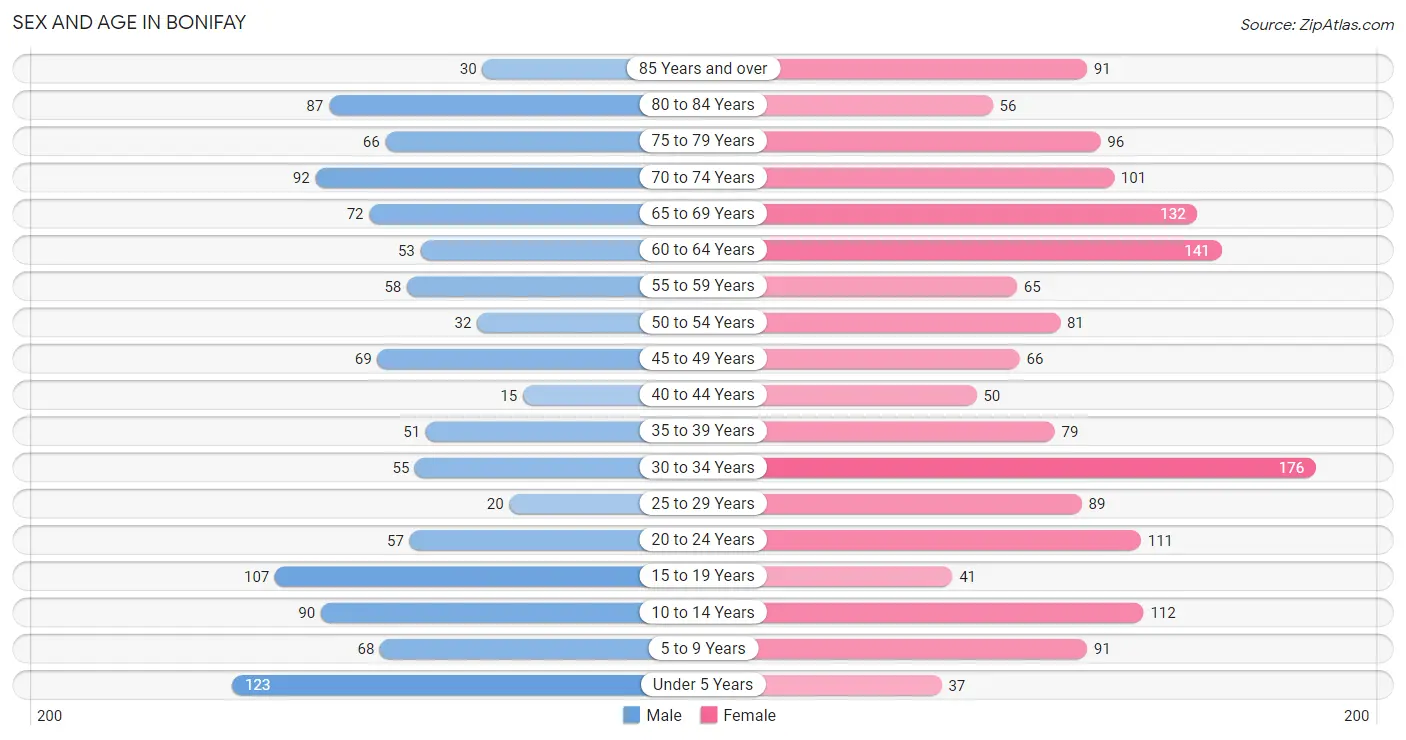
Sex and Age in Bonifay
Sex and Age in Bonifay
The most populous age groups in Bonifay are Under 5 Years (123 | 10.7%) for men and 30 to 34 Years (176 | 10.9%) for women.
| Age Bracket | Male | Female |
| Under 5 Years | 123 (10.7%) | 37 (2.3%) |
| 5 to 9 Years | 68 (5.9%) | 91 (5.6%) |
| 10 to 14 Years | 90 (7.9%) | 112 (6.9%) |
| 15 to 19 Years | 107 (9.3%) | 41 (2.5%) |
| 20 to 24 Years | 57 (5.0%) | 111 (6.9%) |
| 25 to 29 Years | 20 (1.8%) | 89 (5.5%) |
| 30 to 34 Years | 55 (4.8%) | 176 (10.9%) |
| 35 to 39 Years | 51 (4.4%) | 79 (4.9%) |
| 40 to 44 Years | 15 (1.3%) | 50 (3.1%) |
| 45 to 49 Years | 69 (6.0%) | 66 (4.1%) |
| 50 to 54 Years | 32 (2.8%) | 81 (5.0%) |
| 55 to 59 Years | 58 (5.1%) | 65 (4.0%) |
| 60 to 64 Years | 53 (4.6%) | 141 (8.7%) |
| 65 to 69 Years | 72 (6.3%) | 132 (8.2%) |
| 70 to 74 Years | 92 (8.0%) | 101 (6.2%) |
| 75 to 79 Years | 66 (5.8%) | 96 (5.9%) |
| 80 to 84 Years | 87 (7.6%) | 56 (3.5%) |
| 85 Years and over | 30 (2.6%) | 91 (5.6%) |
| Total | 1,145 (100.0%) | 1,615 (100.0%) |
Families and Households in Bonifay
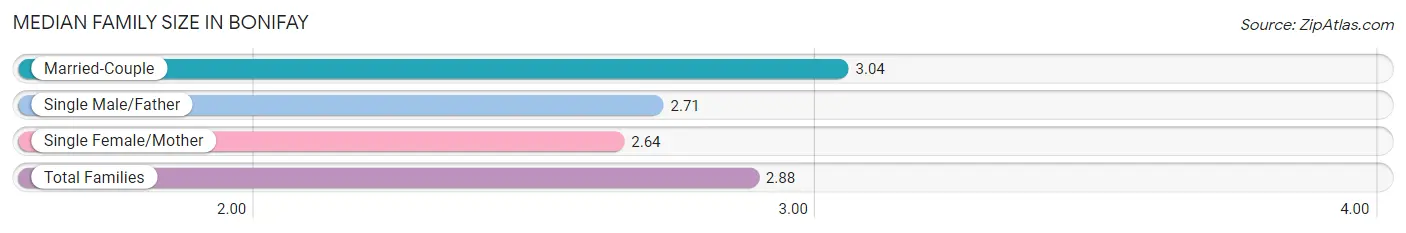
Median Family Size in Bonifay
The median family size in Bonifay is 2.88 persons per family, with married-couple families (358 | 57.6%) accounting for the largest median family size of 3.04 persons per family. On the other hand, single female/mother families (236 | 37.9%) represent the smallest median family size with 2.64 persons per family.
| Family Type | # Families | Family Size |
| Married-Couple | 358 (57.6%) | 3.04 |
| Single Male/Father | 28 (4.5%) | 2.71 |
| Single Female/Mother | 236 (37.9%) | 2.64 |
| Total Families | 622 (100.0%) | 2.88 |
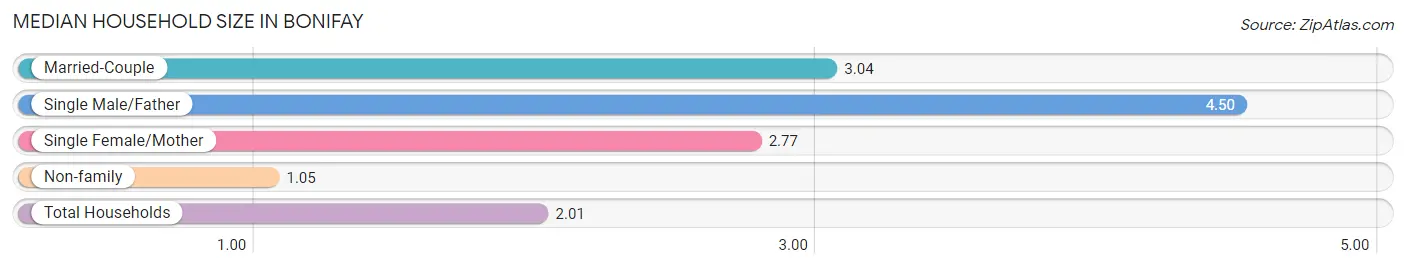
Median Household Size in Bonifay
The median household size in Bonifay is 2.01 persons per household, with single male/father households (28 | 2.2%) accounting for the largest median household size of 4.5 persons per household. non-family households (641 | 50.7%) represent the smallest median household size with 1.05 persons per household.
| Household Type | # Households | Household Size |
| Married-Couple | 358 (28.3%) | 3.04 |
| Single Male/Father | 28 (2.2%) | 4.50 |
| Single Female/Mother | 236 (18.7%) | 2.77 |
| Non-family | 641 (50.7%) | 1.05 |
| Total Households | 1,263 (100.0%) | 2.01 |
Household Size by Marriage Status in Bonifay
Out of a total of 1,263 households in Bonifay, 622 (49.2%) are family households, while 641 (50.7%) are nonfamily households. The most numerous type of family households are 2-person households, comprising 221, and the most common type of nonfamily households are 1-person households, comprising 609.
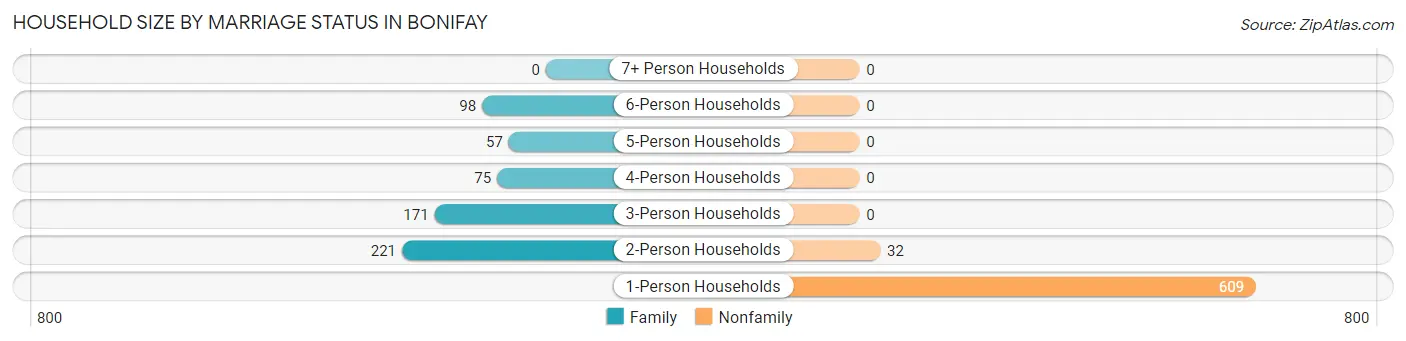
| Household Size | Family Households | Nonfamily Households |
| 1-Person Households | - | 609 (48.2%) |
| 2-Person Households | 221 (17.5%) | 32 (2.5%) |
| 3-Person Households | 171 (13.5%) | 0 (0.0%) |
| 4-Person Households | 75 (5.9%) | 0 (0.0%) |
| 5-Person Households | 57 (4.5%) | 0 (0.0%) |
| 6-Person Households | 98 (7.8%) | 0 (0.0%) |
| 7+ Person Households | 0 (0.0%) | 0 (0.0%) |
| Total | 622 (49.2%) | 641 (50.7%) |
Female Fertility in Bonifay
Fertility by Age in Bonifay
Average fertility rate in Bonifay is 145.0 births per 1,000 women. Women in the age bracket of 20 to 34 years have the highest fertility rate with 239.0 births per 1,000 women. Women in the age bracket of 20 to 34 years acount for 100.0% of all women with births.
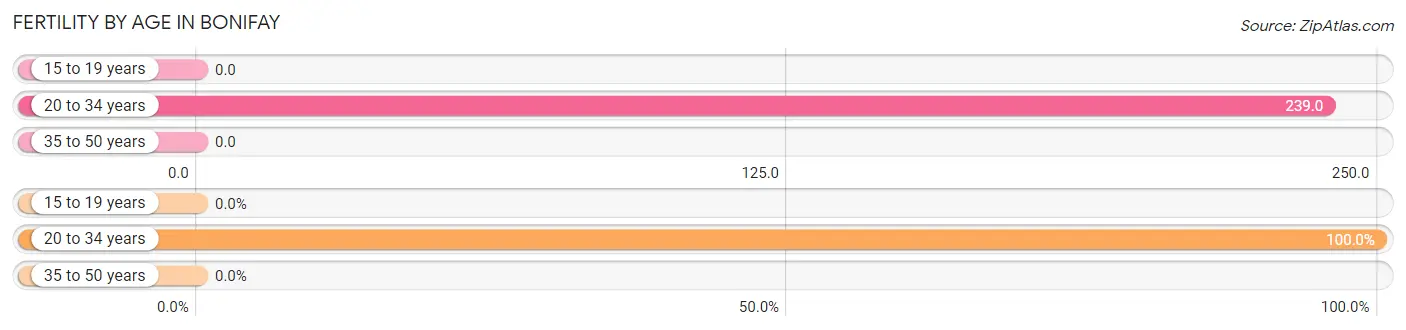
| Age Bracket | Women with Births | Births / 1,000 Women |
| 15 to 19 years | 0 (0.0%) | 0.0 |
| 20 to 34 years | 90 (100.0%) | 239.0 |
| 35 to 50 years | 0 (0.0%) | 0.0 |
| Total | 90 (100.0%) | 145.0 |
Fertility by Age by Marriage Status in Bonifay
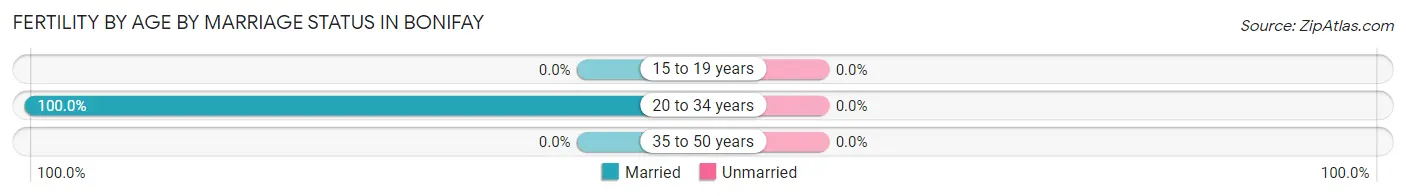
| Age Bracket | Married | Unmarried |
| 15 to 19 years | 0 (0.0%) | 0 (0.0%) |
| 20 to 34 years | 90 (100.0%) | 0 (0.0%) |
| 35 to 50 years | 0 (0.0%) | 0 (0.0%) |
| Total | 90 (100.0%) | 0 (0.0%) |
Fertility by Education in Bonifay
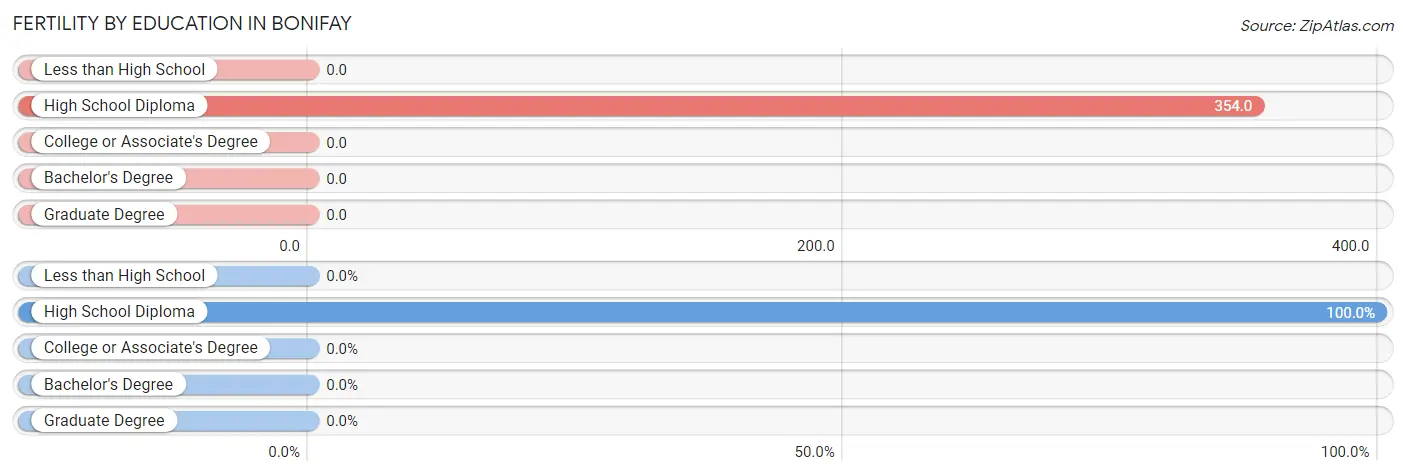
| Educational Attainment | Women with Births | Births / 1,000 Women |
| Less than High School | 0 (0.0%) | 0.0 |
| High School Diploma | 90 (100.0%) | 354.0 |
| College or Associate's Degree | 0 (0.0%) | 0.0 |
| Bachelor's Degree | 0 (0.0%) | 0.0 |
| Graduate Degree | 0 (0.0%) | 0.0 |
| Total | 90 (100.0%) | 145.0 |
Fertility by Education by Marriage Status in Bonifay
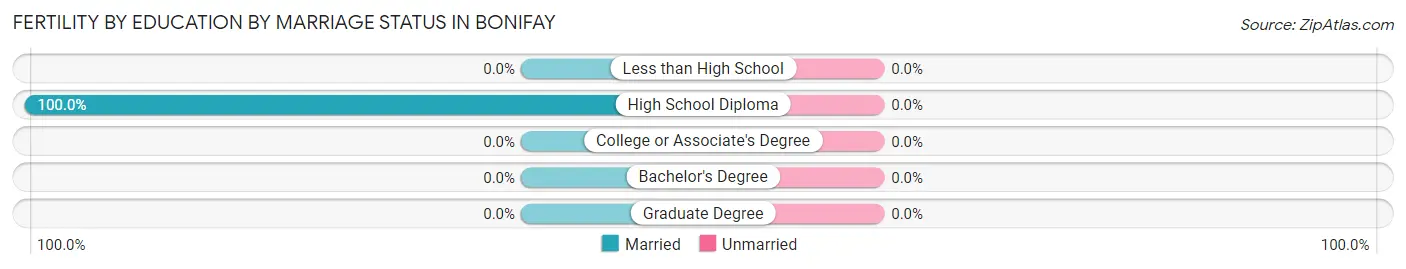
| Educational Attainment | Married | Unmarried |
| Less than High School | 0 (0.0%) | 0 (0.0%) |
| High School Diploma | 90 (100.0%) | 0 (0.0%) |
| College or Associate's Degree | 0 (0.0%) | 0 (0.0%) |
| Bachelor's Degree | 0 (0.0%) | 0 (0.0%) |
| Graduate Degree | 0 (0.0%) | 0 (0.0%) |
| Total | 90 (100.0%) | 0 (0.0%) |
Employment Characteristics in Bonifay
Employment by Class of Employer in Bonifay
Among the 873 employed individuals in Bonifay, private company employees (522 | 59.8%), federal government employees (106 | 12.1%), and state government employees (80 | 9.2%) make up the most common classes of employment.
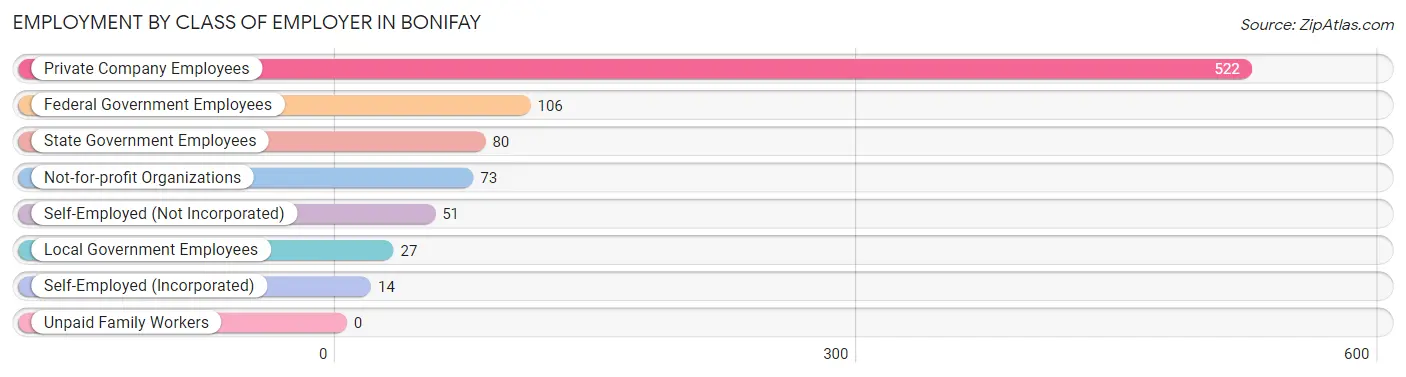
| Employer Class | # Employees | % Employees |
| Private Company Employees | 522 | 59.8% |
| Self-Employed (Incorporated) | 14 | 1.6% |
| Self-Employed (Not Incorporated) | 51 | 5.8% |
| Not-for-profit Organizations | 73 | 8.4% |
| Local Government Employees | 27 | 3.1% |
| State Government Employees | 80 | 9.2% |
| Federal Government Employees | 106 | 12.1% |
| Unpaid Family Workers | 0 | 0.0% |
| Total | 873 | 100.0% |
Employment Status by Age in Bonifay
According to the labor force statistics for Bonifay, out of the total population over 16 years of age (2,204), 43.3% or 954 individuals are in the labor force, with 8.5% or 81 of them unemployed. The age group with the highest labor force participation rate is 25 to 29 years, with 92.7% or 101 individuals in the labor force. Within the labor force, the 20 to 24 years age range has the highest percentage of unemployed individuals, with 40.2% or 53 of them being unemployed.
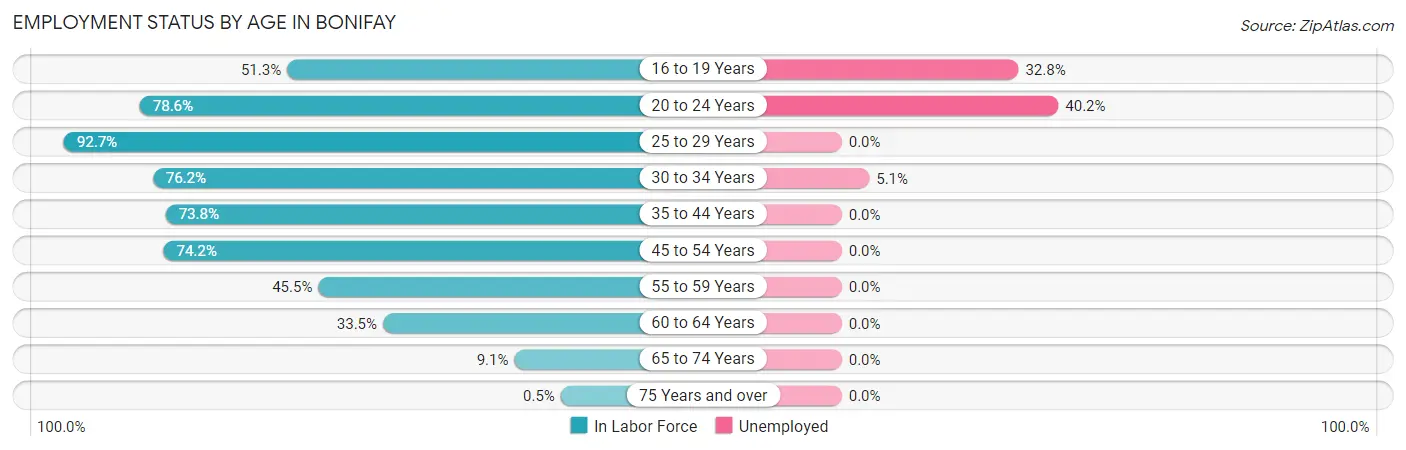
| Age Bracket | In Labor Force | Unemployed |
| 16 to 19 Years | 58 (51.3%) | 19 (32.8%) |
| 20 to 24 Years | 132 (78.6%) | 53 (40.2%) |
| 25 to 29 Years | 101 (92.7%) | 0 (0.0%) |
| 30 to 34 Years | 176 (76.2%) | 9 (5.1%) |
| 35 to 44 Years | 144 (73.8%) | 0 (0.0%) |
| 45 to 54 Years | 184 (74.2%) | 0 (0.0%) |
| 55 to 59 Years | 56 (45.5%) | 0 (0.0%) |
| 60 to 64 Years | 65 (33.5%) | 0 (0.0%) |
| 65 to 74 Years | 36 (9.1%) | 0 (0.0%) |
| 75 Years and over | 2 (0.5%) | 0 (0.0%) |
| Total | 954 (43.3%) | 81 (8.5%) |
Employment Status by Educational Attainment in Bonifay
According to labor force statistics for Bonifay, 66.0% of individuals (726) out of the total population between 25 and 64 years of age (1,100) are in the labor force, with 1.2% or 9 of them being unemployed. The group with the highest labor force participation rate are those with the educational attainment of bachelor's degree or higher, with 88.0% or 110 individuals in the labor force. Within the labor force, individuals with high school diploma education have the highest percentage of unemployment, with 2.5% or 9 of them being unemployed.
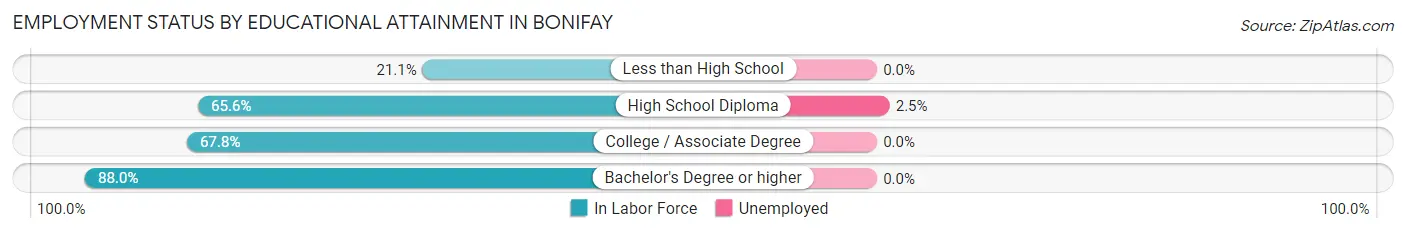
| Educational Attainment | In Labor Force | Unemployed |
| Less than High School | 15 (21.1%) | 0 (0.0%) |
| High School Diploma | 359 (65.6%) | 14 (2.5%) |
| College / Associate Degree | 242 (67.8%) | 0 (0.0%) |
| Bachelor's Degree or higher | 110 (88.0%) | 0 (0.0%) |
| Total | 726 (66.0%) | 13 (1.2%) |
Employment Occupations by Sex in Bonifay
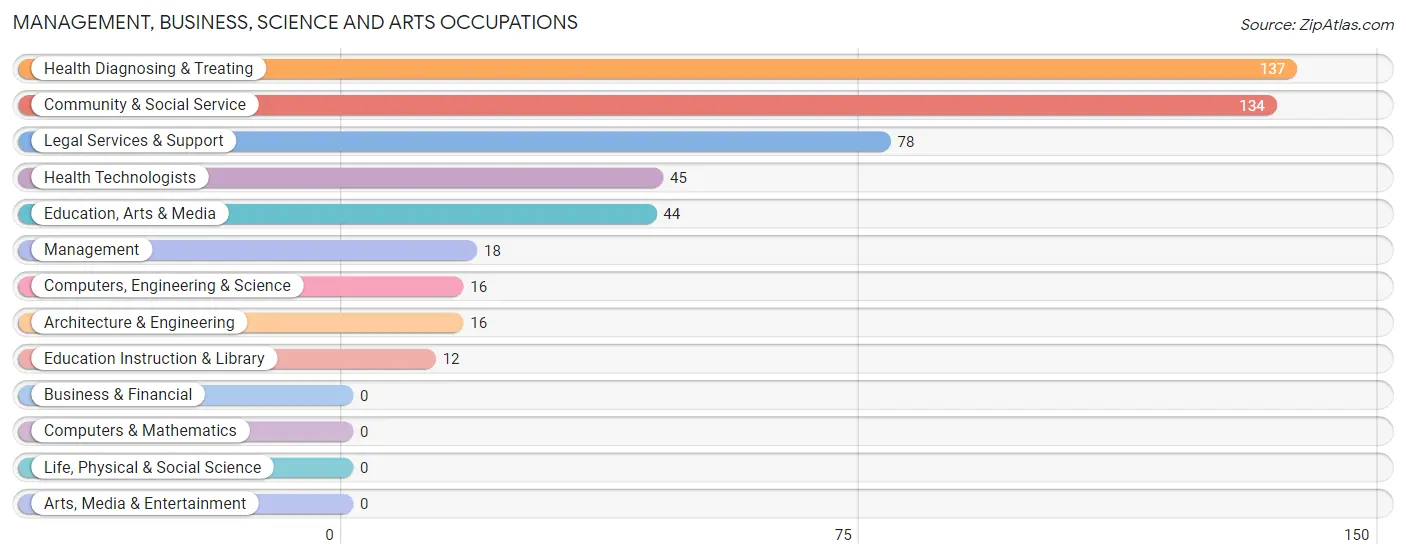
Management, Business, Science and Arts Occupations
The most common Management, Business, Science and Arts occupations in Bonifay are Health Diagnosing & Treating (137 | 15.7%), Community & Social Service (134 | 15.3%), Legal Services & Support (78 | 8.9%), Health Technologists (45 | 5.1%), and Education, Arts & Media (44 | 5.0%).
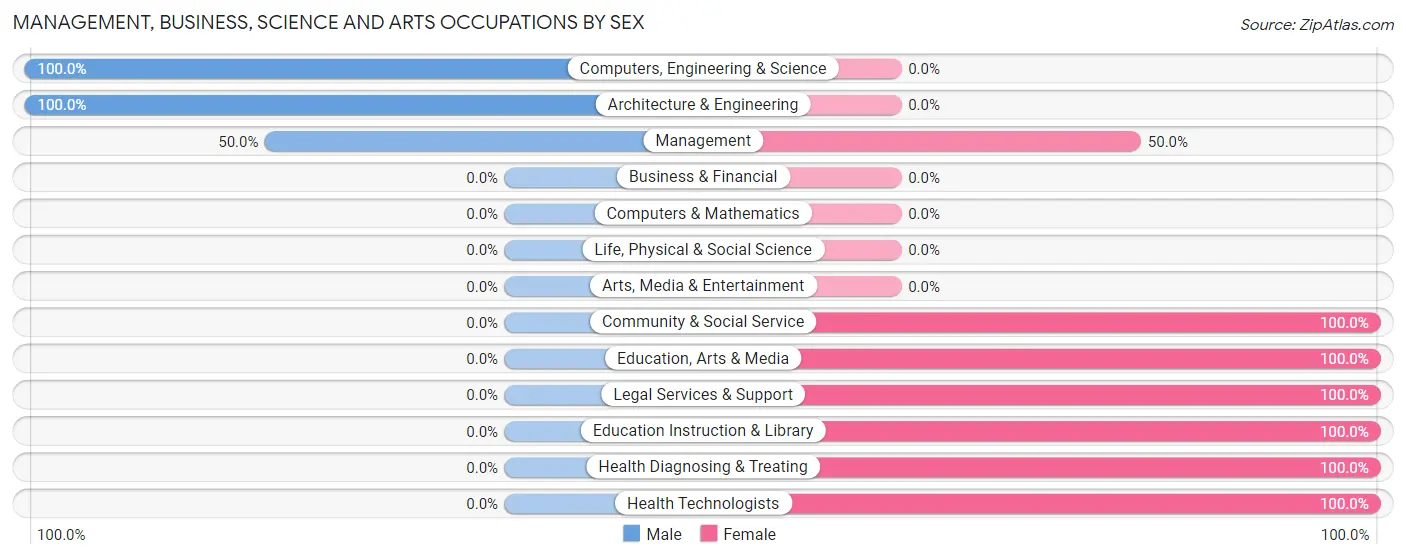
Management, Business, Science and Arts Occupations by Sex
Within the Management, Business, Science and Arts occupations in Bonifay, the most male-oriented occupations are Computers, Engineering & Science (100.0%), Architecture & Engineering (100.0%), and Management (50.0%), while the most female-oriented occupations are Community & Social Service (100.0%), Education, Arts & Media (100.0%), and Legal Services & Support (100.0%).
| Occupation | Male | Female |
| Management | 9 (50.0%) | 9 (50.0%) |
| Business & Financial | 0 (0.0%) | 0 (0.0%) |
| Computers, Engineering & Science | 16 (100.0%) | 0 (0.0%) |
| Computers & Mathematics | 0 (0.0%) | 0 (0.0%) |
| Architecture & Engineering | 16 (100.0%) | 0 (0.0%) |
| Life, Physical & Social Science | 0 (0.0%) | 0 (0.0%) |
| Community & Social Service | 0 (0.0%) | 134 (100.0%) |
| Education, Arts & Media | 0 (0.0%) | 44 (100.0%) |
| Legal Services & Support | 0 (0.0%) | 78 (100.0%) |
| Education Instruction & Library | 0 (0.0%) | 12 (100.0%) |
| Arts, Media & Entertainment | 0 (0.0%) | 0 (0.0%) |
| Health Diagnosing & Treating | 0 (0.0%) | 137 (100.0%) |
| Health Technologists | 0 (0.0%) | 45 (100.0%) |
| Total (Category) | 25 (8.2%) | 280 (91.8%) |
| Total (Overall) | 263 (30.1%) | 610 (69.9%) |
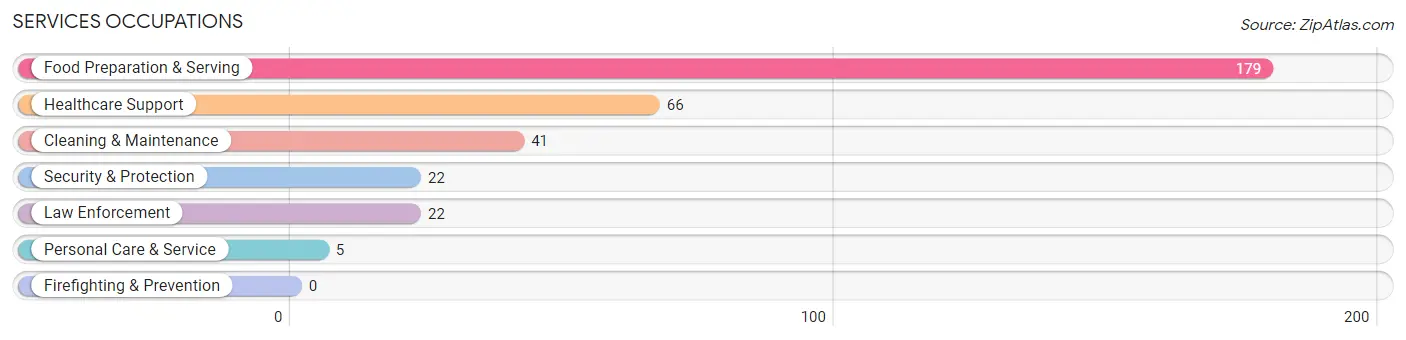
Services Occupations
The most common Services occupations in Bonifay are Food Preparation & Serving (179 | 20.5%), Healthcare Support (66 | 7.6%), Cleaning & Maintenance (41 | 4.7%), Security & Protection (22 | 2.5%), and Law Enforcement (22 | 2.5%).
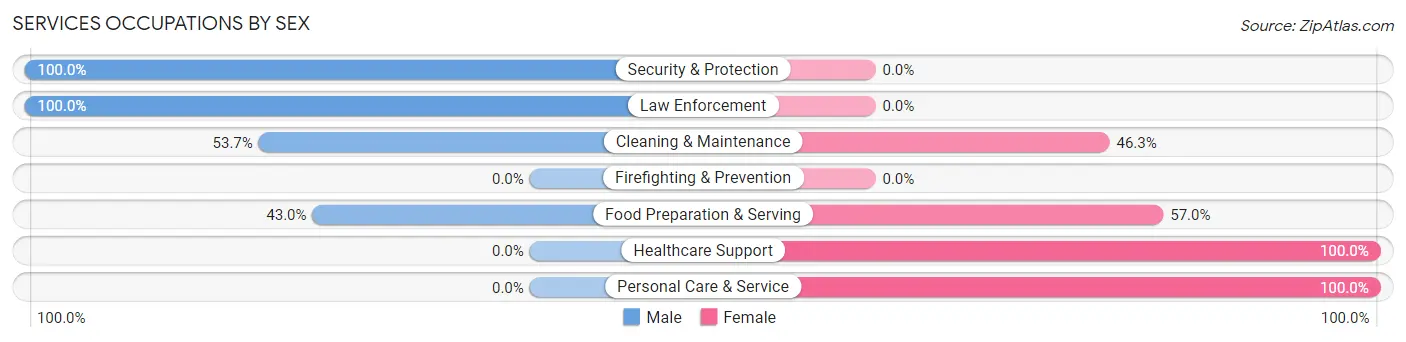
Services Occupations by Sex
Within the Services occupations in Bonifay, the most male-oriented occupations are Security & Protection (100.0%), Law Enforcement (100.0%), and Cleaning & Maintenance (53.7%), while the most female-oriented occupations are Healthcare Support (100.0%), Personal Care & Service (100.0%), and Food Preparation & Serving (57.0%).
| Occupation | Male | Female |
| Healthcare Support | 0 (0.0%) | 66 (100.0%) |
| Security & Protection | 22 (100.0%) | 0 (0.0%) |
| Firefighting & Prevention | 0 (0.0%) | 0 (0.0%) |
| Law Enforcement | 22 (100.0%) | 0 (0.0%) |
| Food Preparation & Serving | 77 (43.0%) | 102 (57.0%) |
| Cleaning & Maintenance | 22 (53.7%) | 19 (46.3%) |
| Personal Care & Service | 0 (0.0%) | 5 (100.0%) |
| Total (Category) | 121 (38.7%) | 192 (61.3%) |
| Total (Overall) | 263 (30.1%) | 610 (69.9%) |
Sales and Office Occupations
The most common Sales and Office occupations in Bonifay are Sales & Related (76 | 8.7%), and Office & Administration (75 | 8.6%).
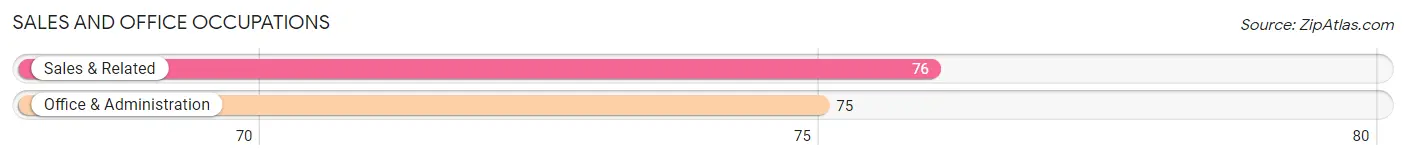
Sales and Office Occupations by Sex
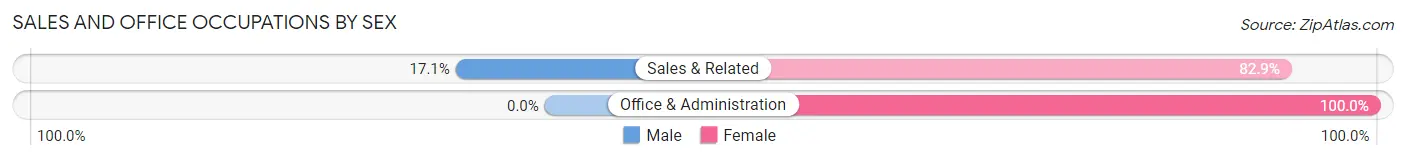
| Occupation | Male | Female |
| Sales & Related | 13 (17.1%) | 63 (82.9%) |
| Office & Administration | 0 (0.0%) | 75 (100.0%) |
| Total (Category) | 13 (8.6%) | 138 (91.4%) |
| Total (Overall) | 263 (30.1%) | 610 (69.9%) |
Natural Resources, Construction and Maintenance Occupations
The most common Natural Resources, Construction and Maintenance occupations in Bonifay are Installation, Maintenance & Repair (14 | 1.6%), and Construction & Extraction (4 | 0.5%).
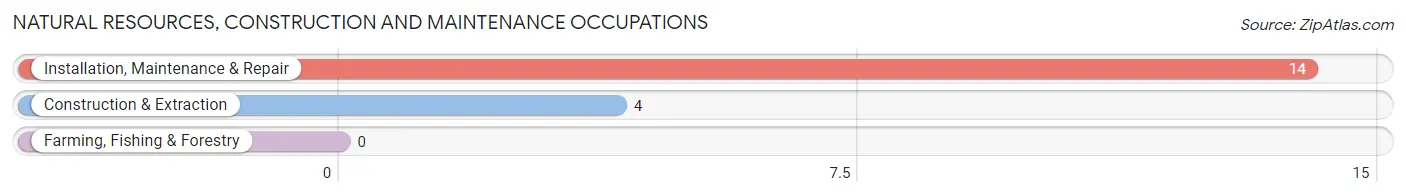
Natural Resources, Construction and Maintenance Occupations by Sex
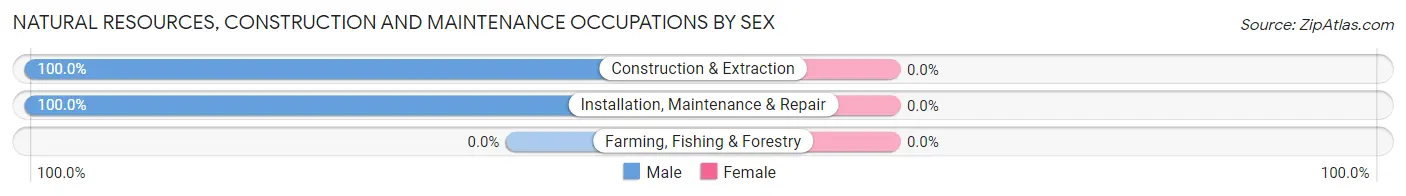
| Occupation | Male | Female |
| Farming, Fishing & Forestry | 0 (0.0%) | 0 (0.0%) |
| Construction & Extraction | 4 (100.0%) | 0 (0.0%) |
| Installation, Maintenance & Repair | 14 (100.0%) | 0 (0.0%) |
| Total (Category) | 18 (100.0%) | 0 (0.0%) |
| Total (Overall) | 263 (30.1%) | 610 (69.9%) |
Production, Transportation and Moving Occupations
The most common Production, Transportation and Moving occupations in Bonifay are Transportation (55 | 6.3%), and Material Moving (31 | 3.5%).
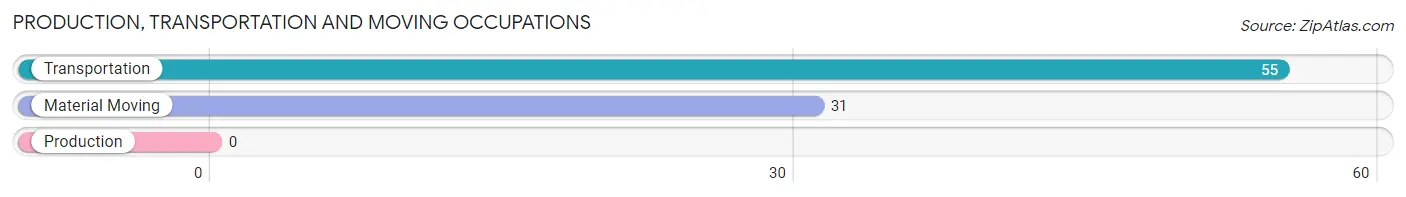
Production, Transportation and Moving Occupations by Sex
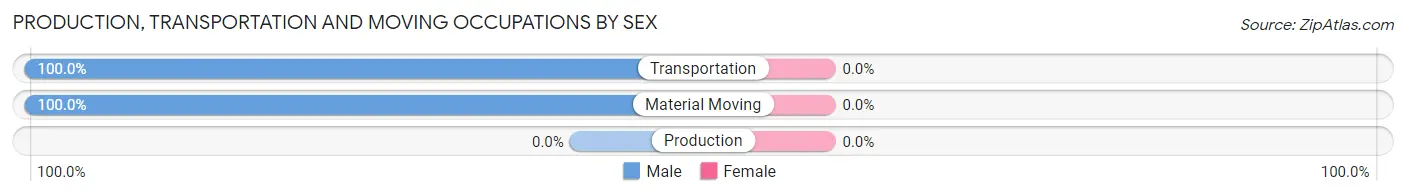
| Occupation | Male | Female |
| Production | 0 (0.0%) | 0 (0.0%) |
| Transportation | 55 (100.0%) | 0 (0.0%) |
| Material Moving | 31 (100.0%) | 0 (0.0%) |
| Total (Category) | 86 (100.0%) | 0 (0.0%) |
| Total (Overall) | 263 (30.1%) | 610 (69.9%) |
Employment Industries by Sex in Bonifay
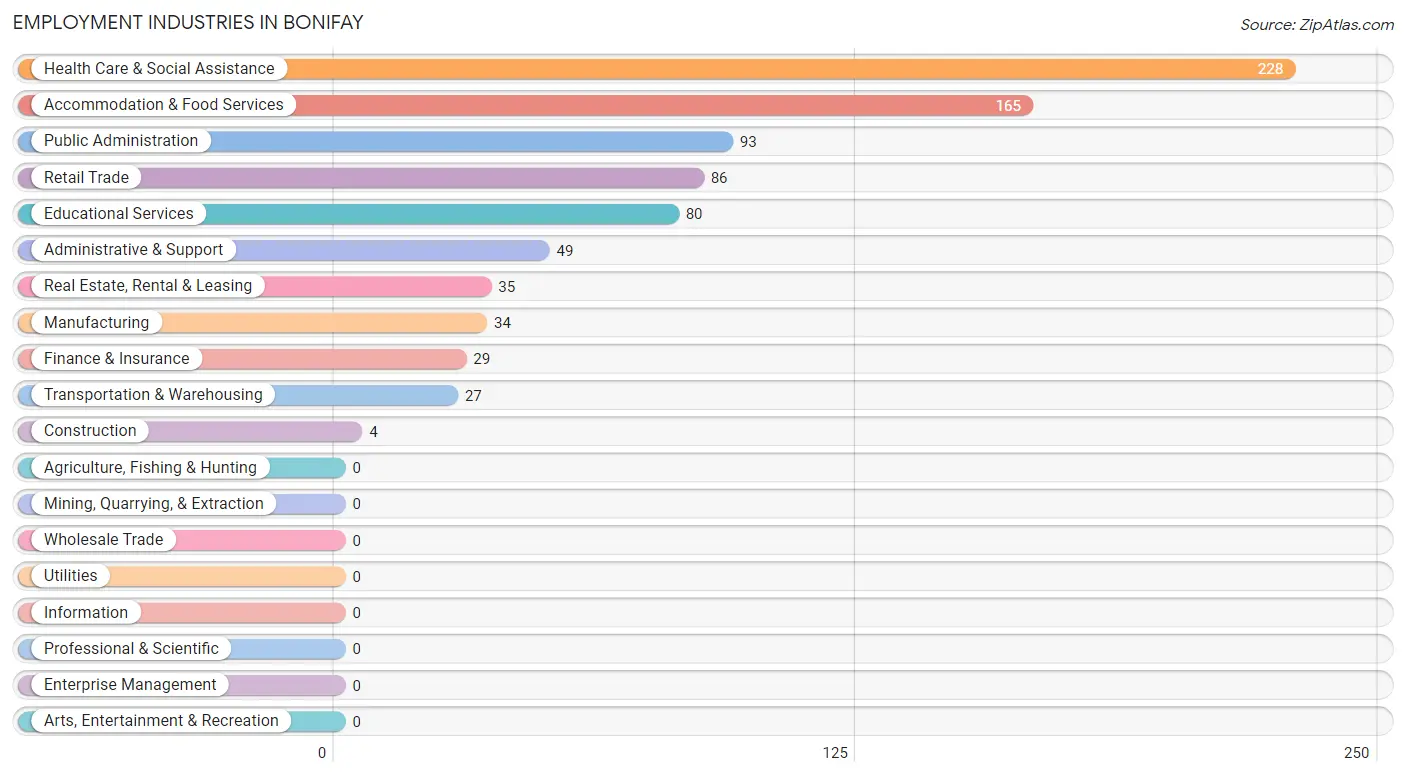
Employment Industries in Bonifay
The major employment industries in Bonifay include Health Care & Social Assistance (228 | 26.1%), Accommodation & Food Services (165 | 18.9%), Public Administration (93 | 10.6%), Retail Trade (86 | 9.9%), and Educational Services (80 | 9.2%).
Employment Industries by Sex in Bonifay
The Bonifay industries that see more men than women are Construction (100.0%), Transportation & Warehousing (100.0%), and Administrative & Support (98.0%), whereas the industries that tend to have a higher number of women are Manufacturing (100.0%), Health Care & Social Assistance (98.3%), and Finance & Insurance (93.1%).
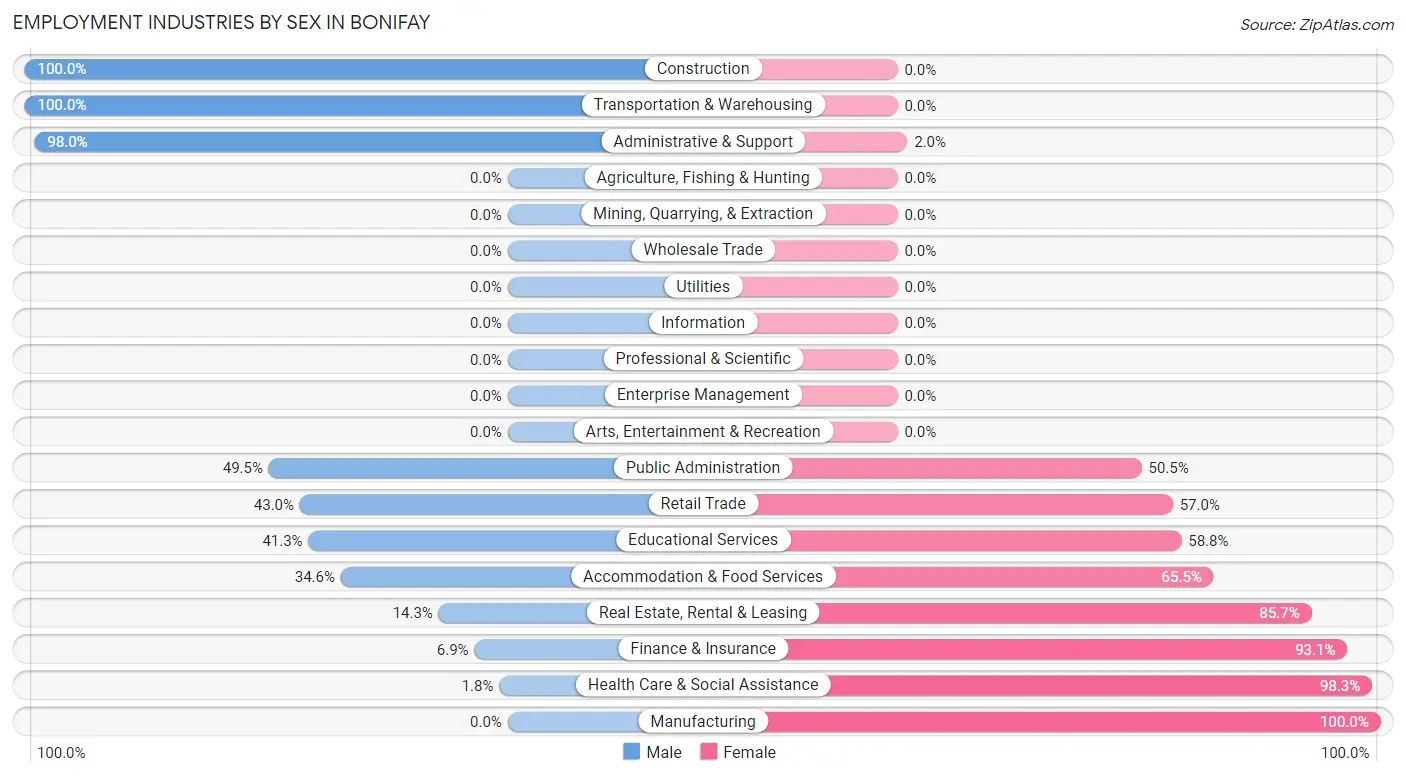
| Industry | Male | Female |
| Agriculture, Fishing & Hunting | 0 (0.0%) | 0 (0.0%) |
| Mining, Quarrying, & Extraction | 0 (0.0%) | 0 (0.0%) |
| Construction | 4 (100.0%) | 0 (0.0%) |
| Manufacturing | 0 (0.0%) | 34 (100.0%) |
| Wholesale Trade | 0 (0.0%) | 0 (0.0%) |
| Retail Trade | 37 (43.0%) | 49 (57.0%) |
| Transportation & Warehousing | 27 (100.0%) | 0 (0.0%) |
| Utilities | 0 (0.0%) | 0 (0.0%) |
| Information | 0 (0.0%) | 0 (0.0%) |
| Finance & Insurance | 2 (6.9%) | 27 (93.1%) |
| Real Estate, Rental & Leasing | 5 (14.3%) | 30 (85.7%) |
| Professional & Scientific | 0 (0.0%) | 0 (0.0%) |
| Enterprise Management | 0 (0.0%) | 0 (0.0%) |
| Administrative & Support | 48 (98.0%) | 1 (2.0%) |
| Educational Services | 33 (41.2%) | 47 (58.8%) |
| Health Care & Social Assistance | 4 (1.8%) | 224 (98.3%) |
| Arts, Entertainment & Recreation | 0 (0.0%) | 0 (0.0%) |
| Accommodation & Food Services | 57 (34.5%) | 108 (65.4%) |
| Public Administration | 46 (49.5%) | 47 (50.5%) |
| Total | 263 (30.1%) | 610 (69.9%) |
Education in Bonifay
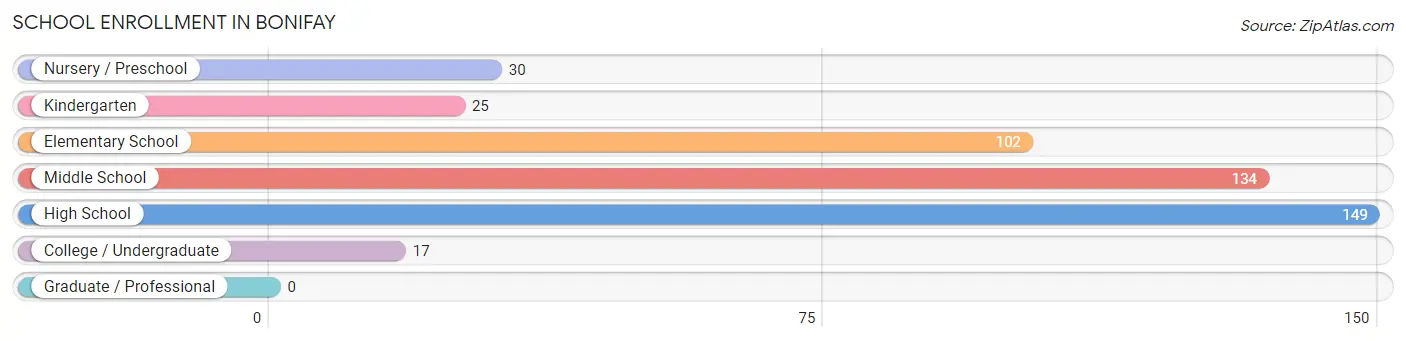
School Enrollment in Bonifay
The most common levels of schooling among the 457 students in Bonifay are high school (149 | 32.6%), middle school (134 | 29.3%), and elementary school (102 | 22.3%).
| School Level | # Students | % Students |
| Nursery / Preschool | 30 | 6.6% |
| Kindergarten | 25 | 5.5% |
| Elementary School | 102 | 22.3% |
| Middle School | 134 | 29.3% |
| High School | 149 | 32.6% |
| College / Undergraduate | 17 | 3.7% |
| Graduate / Professional | 0 | 0.0% |
| Total | 457 | 100.0% |
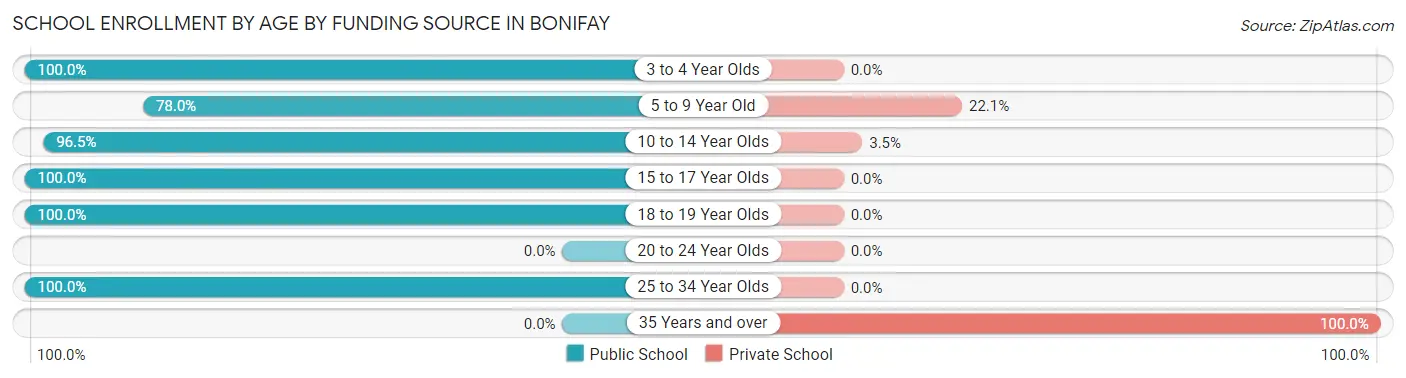
School Enrollment by Age by Funding Source in Bonifay
Out of a total of 457 students who are enrolled in schools in Bonifay, 41 (9.0%) attend a private institution, while the remaining 416 (91.0%) are enrolled in public schools. The age group of 35 years and over has the highest likelihood of being enrolled in private schools, with 6 (100.0% in the age bracket) enrolled. Conversely, the age group of 3 to 4 year olds has the lowest likelihood of being enrolled in a private school, with 11 (100.0% in the age bracket) attending a public institution.
| Age Bracket | Public School | Private School |
| 3 to 4 Year Olds | 11 (100.0%) | 0 (0.0%) |
| 5 to 9 Year Old | 99 (77.9%) | 28 (22.1%) |
| 10 to 14 Year Olds | 195 (96.5%) | 7 (3.5%) |
| 15 to 17 Year Olds | 95 (100.0%) | 0 (0.0%) |
| 18 to 19 Year Olds | 5 (100.0%) | 0 (0.0%) |
| 20 to 24 Year Olds | 0 (0.0%) | 0 (0.0%) |
| 25 to 34 Year Olds | 11 (100.0%) | 0 (0.0%) |
| 35 Years and over | 0 (0.0%) | 6 (100.0%) |
| Total | 416 (91.0%) | 41 (9.0%) |
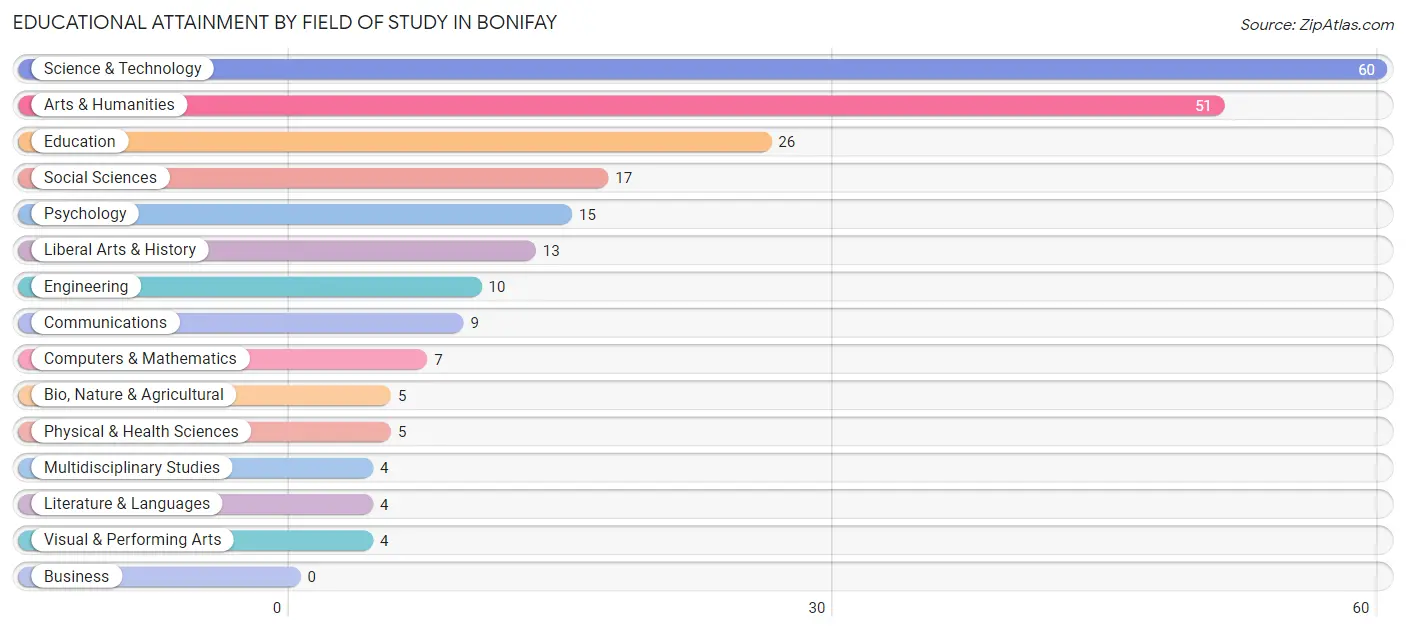
Educational Attainment by Field of Study in Bonifay
Science & technology (60 | 26.1%), arts & humanities (51 | 22.2%), education (26 | 11.3%), social sciences (17 | 7.4%), and psychology (15 | 6.5%) are the most common fields of study among 230 individuals in Bonifay who have obtained a bachelor's degree or higher.
| Field of Study | # Graduates | % Graduates |
| Computers & Mathematics | 7 | 3.0% |
| Bio, Nature & Agricultural | 5 | 2.2% |
| Physical & Health Sciences | 5 | 2.2% |
| Psychology | 15 | 6.5% |
| Social Sciences | 17 | 7.4% |
| Engineering | 10 | 4.3% |
| Multidisciplinary Studies | 4 | 1.7% |
| Science & Technology | 60 | 26.1% |
| Business | 0 | 0.0% |
| Education | 26 | 11.3% |
| Literature & Languages | 4 | 1.7% |
| Liberal Arts & History | 13 | 5.7% |
| Visual & Performing Arts | 4 | 1.7% |
| Communications | 9 | 3.9% |
| Arts & Humanities | 51 | 22.2% |
| Total | 230 | 100.0% |
Transportation & Commute in Bonifay
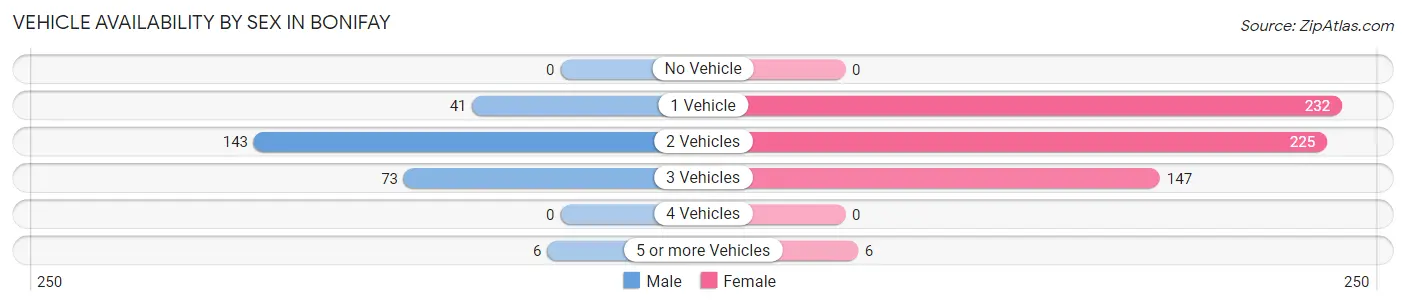
Vehicle Availability by Sex in Bonifay
The most prevalent vehicle ownership categories in Bonifay are males with 2 vehicles (143, accounting for 54.4%) and females with 2 vehicles (225, making up 23.4%).
| Vehicles Available | Male | Female |
| No Vehicle | 0 (0.0%) | 0 (0.0%) |
| 1 Vehicle | 41 (15.6%) | 232 (38.0%) |
| 2 Vehicles | 143 (54.4%) | 225 (36.9%) |
| 3 Vehicles | 73 (27.8%) | 147 (24.1%) |
| 4 Vehicles | 0 (0.0%) | 0 (0.0%) |
| 5 or more Vehicles | 6 (2.3%) | 6 (1.0%) |
| Total | 263 (100.0%) | 610 (100.0%) |
Commute Time in Bonifay
The most frequently occuring commute durations in Bonifay are 10 to 14 minutes (181 commuters, 22.5%), 15 to 19 minutes (168 commuters, 20.8%), and 45 to 59 minutes (122 commuters, 15.1%).
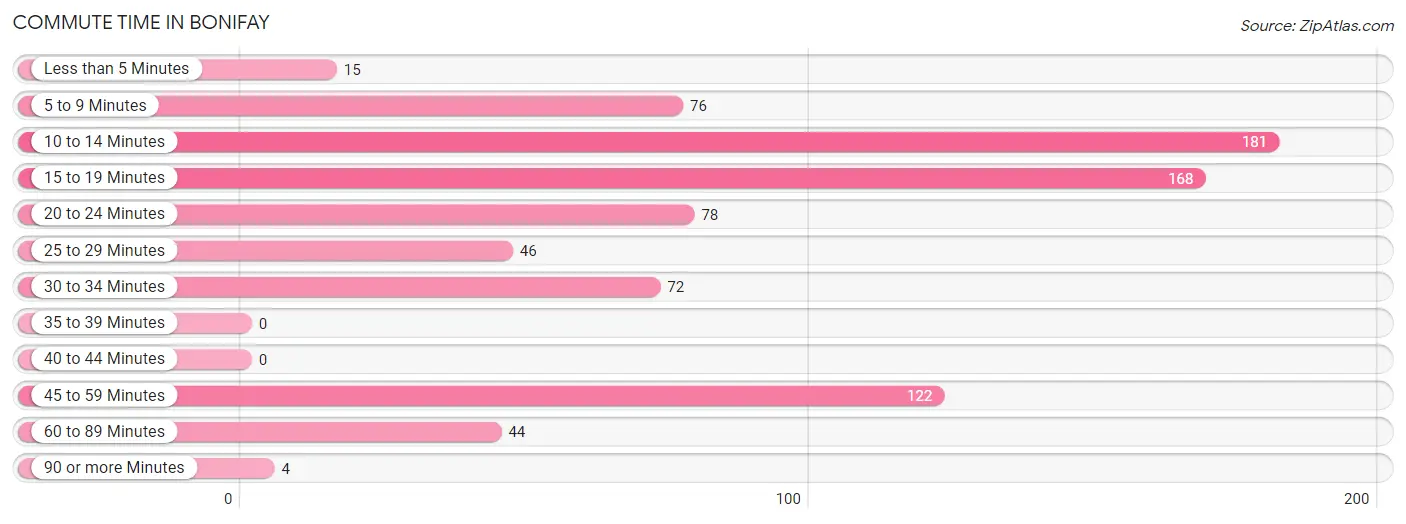
| Commute Time | # Commuters | % Commuters |
| Less than 5 Minutes | 15 | 1.9% |
| 5 to 9 Minutes | 76 | 9.4% |
| 10 to 14 Minutes | 181 | 22.5% |
| 15 to 19 Minutes | 168 | 20.8% |
| 20 to 24 Minutes | 78 | 9.7% |
| 25 to 29 Minutes | 46 | 5.7% |
| 30 to 34 Minutes | 72 | 8.9% |
| 35 to 39 Minutes | 0 | 0.0% |
| 40 to 44 Minutes | 0 | 0.0% |
| 45 to 59 Minutes | 122 | 15.1% |
| 60 to 89 Minutes | 44 | 5.5% |
| 90 or more Minutes | 4 | 0.5% |
Commute Time by Sex in Bonifay
The most common commute times in Bonifay are 45 to 59 minutes (43 commuters, 18.6%) for males and 10 to 14 minutes (150 commuters, 26.1%) for females.
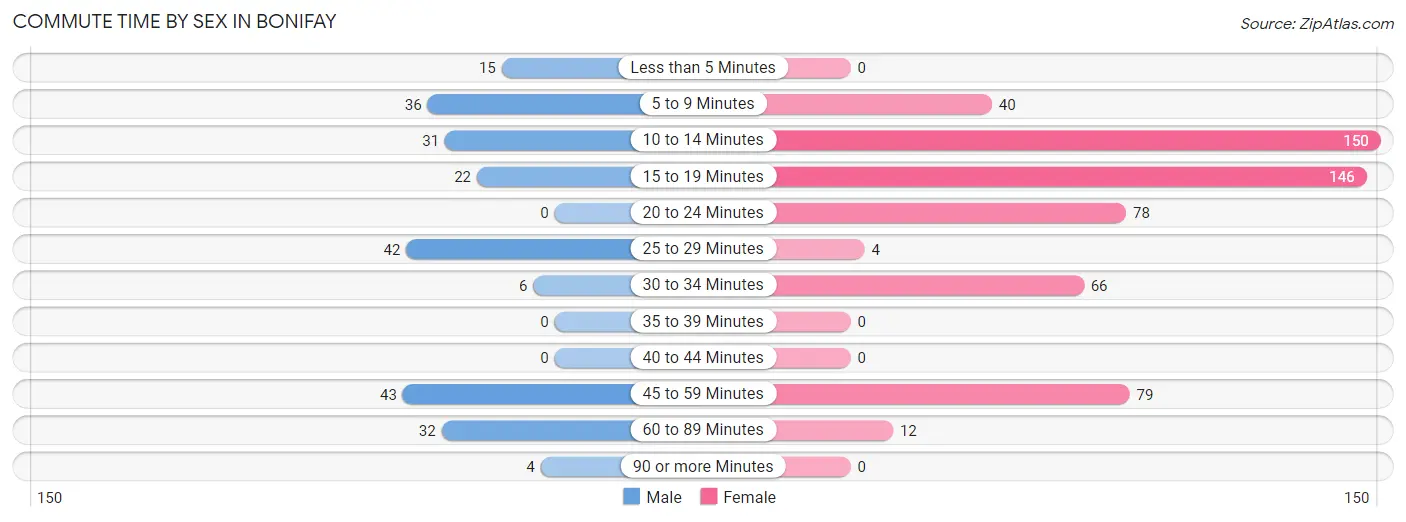
| Commute Time | Male | Female |
| Less than 5 Minutes | 15 (6.5%) | 0 (0.0%) |
| 5 to 9 Minutes | 36 (15.6%) | 40 (7.0%) |
| 10 to 14 Minutes | 31 (13.4%) | 150 (26.1%) |
| 15 to 19 Minutes | 22 (9.5%) | 146 (25.4%) |
| 20 to 24 Minutes | 0 (0.0%) | 78 (13.6%) |
| 25 to 29 Minutes | 42 (18.2%) | 4 (0.7%) |
| 30 to 34 Minutes | 6 (2.6%) | 66 (11.5%) |
| 35 to 39 Minutes | 0 (0.0%) | 0 (0.0%) |
| 40 to 44 Minutes | 0 (0.0%) | 0 (0.0%) |
| 45 to 59 Minutes | 43 (18.6%) | 79 (13.7%) |
| 60 to 89 Minutes | 32 (13.9%) | 12 (2.1%) |
| 90 or more Minutes | 4 (1.7%) | 0 (0.0%) |
Time of Departure to Work by Sex in Bonifay
The most frequent times of departure to work in Bonifay are 8:00 AM to 8:29 AM (45, 19.5%) for males and 6:30 AM to 6:59 AM (154, 26.8%) for females.
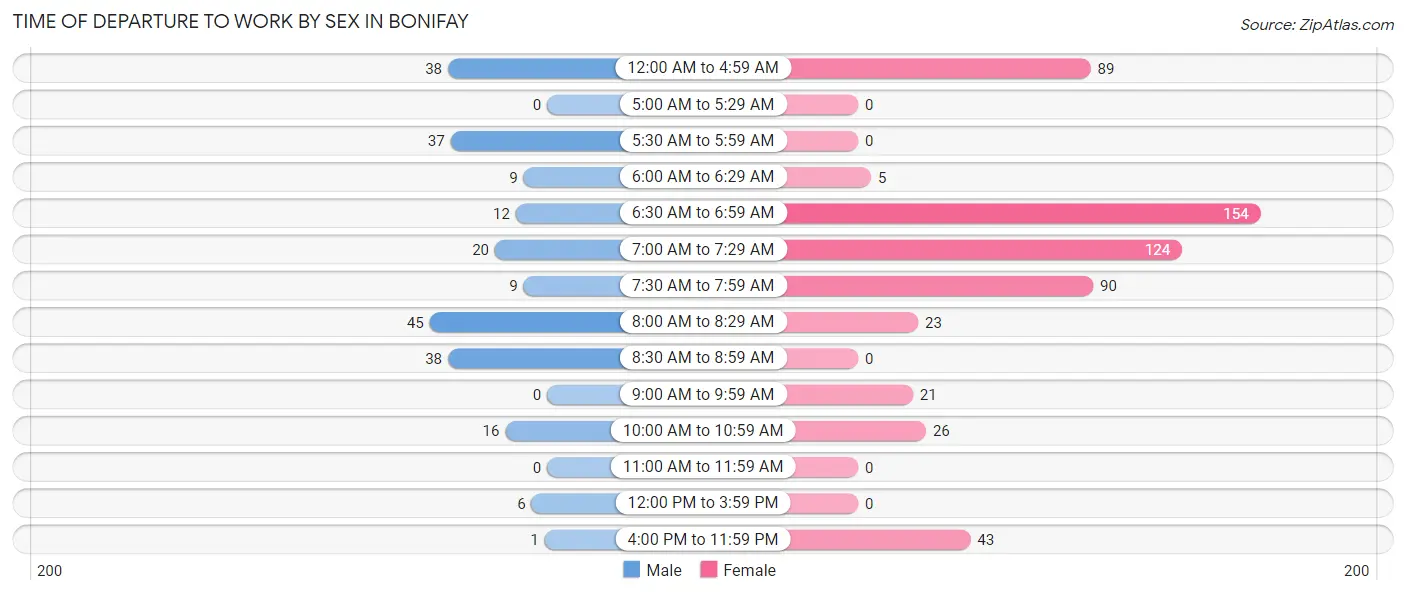
| Time of Departure | Male | Female |
| 12:00 AM to 4:59 AM | 38 (16.5%) | 89 (15.5%) |
| 5:00 AM to 5:29 AM | 0 (0.0%) | 0 (0.0%) |
| 5:30 AM to 5:59 AM | 37 (16.0%) | 0 (0.0%) |
| 6:00 AM to 6:29 AM | 9 (3.9%) | 5 (0.9%) |
| 6:30 AM to 6:59 AM | 12 (5.2%) | 154 (26.8%) |
| 7:00 AM to 7:29 AM | 20 (8.7%) | 124 (21.6%) |
| 7:30 AM to 7:59 AM | 9 (3.9%) | 90 (15.7%) |
| 8:00 AM to 8:29 AM | 45 (19.5%) | 23 (4.0%) |
| 8:30 AM to 8:59 AM | 38 (16.5%) | 0 (0.0%) |
| 9:00 AM to 9:59 AM | 0 (0.0%) | 21 (3.6%) |
| 10:00 AM to 10:59 AM | 16 (6.9%) | 26 (4.5%) |
| 11:00 AM to 11:59 AM | 0 (0.0%) | 0 (0.0%) |
| 12:00 PM to 3:59 PM | 6 (2.6%) | 0 (0.0%) |
| 4:00 PM to 11:59 PM | 1 (0.4%) | 43 (7.5%) |
| Total | 231 (100.0%) | 575 (100.0%) |
Housing Occupancy in Bonifay
Occupancy by Ownership in Bonifay
Of the total 1,263 dwellings in Bonifay, owner-occupied units account for 708 (56.1%), while renter-occupied units make up 555 (43.9%).
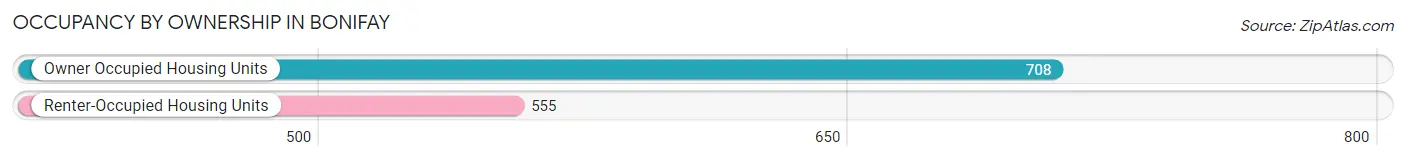
| Occupancy | # Housing Units | % Housing Units |
| Owner Occupied Housing Units | 708 | 56.1% |
| Renter-Occupied Housing Units | 555 | 43.9% |
| Total Occupied Housing Units | 1,263 | 100.0% |
Occupancy by Household Size in Bonifay
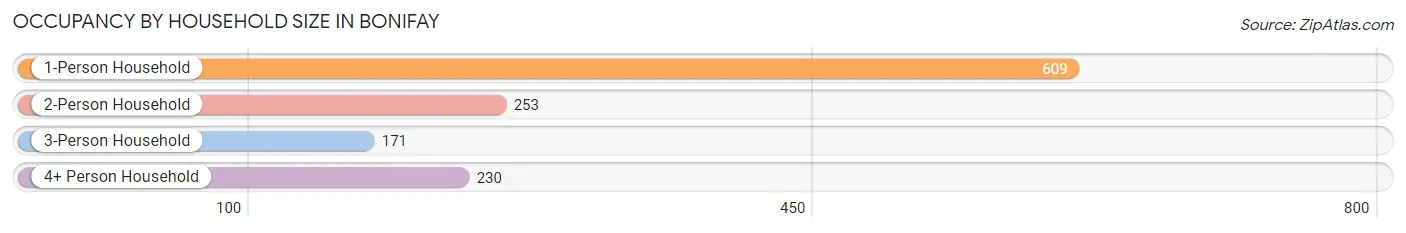
| Household Size | # Housing Units | % Housing Units |
| 1-Person Household | 609 | 48.2% |
| 2-Person Household | 253 | 20.0% |
| 3-Person Household | 171 | 13.5% |
| 4+ Person Household | 230 | 18.2% |
| Total Housing Units | 1,263 | 100.0% |
Occupancy by Ownership by Household Size in Bonifay
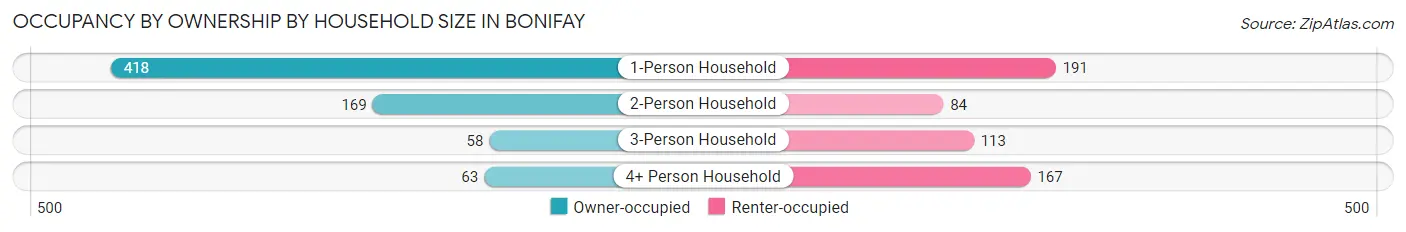
| Household Size | Owner-occupied | Renter-occupied |
| 1-Person Household | 418 (68.6%) | 191 (31.4%) |
| 2-Person Household | 169 (66.8%) | 84 (33.2%) |
| 3-Person Household | 58 (33.9%) | 113 (66.1%) |
| 4+ Person Household | 63 (27.4%) | 167 (72.6%) |
| Total Housing Units | 708 (56.1%) | 555 (43.9%) |
Occupancy by Educational Attainment in Bonifay
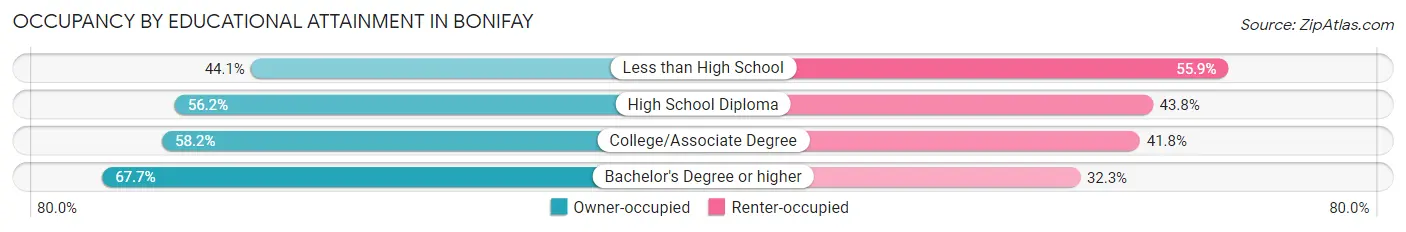
| Household Size | Owner-occupied | Renter-occupied |
| Less than High School | 98 (44.1%) | 124 (55.9%) |
| High School Diploma | 314 (56.2%) | 245 (43.8%) |
| College/Associate Degree | 185 (58.2%) | 133 (41.8%) |
| Bachelor's Degree or higher | 111 (67.7%) | 53 (32.3%) |
Occupancy by Age of Householder in Bonifay
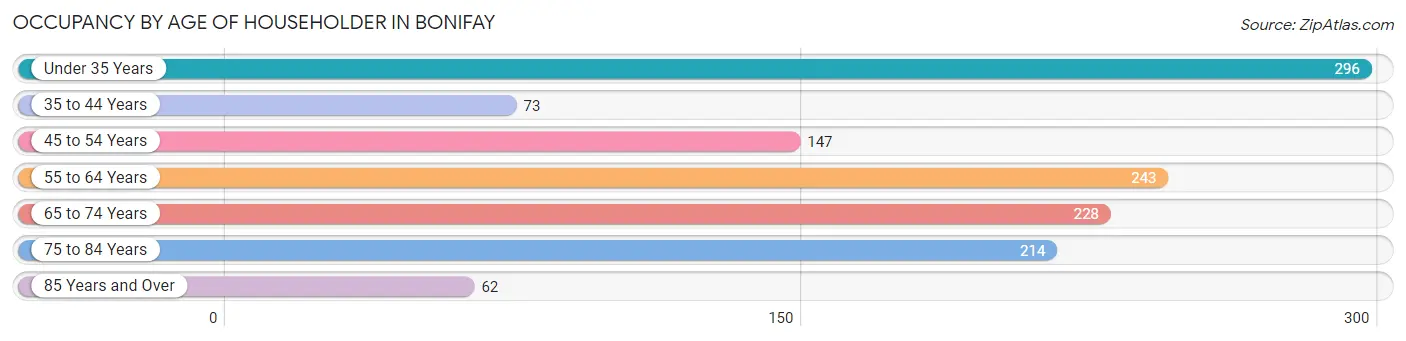
| Age Bracket | # Households | % Households |
| Under 35 Years | 296 | 23.4% |
| 35 to 44 Years | 73 | 5.8% |
| 45 to 54 Years | 147 | 11.6% |
| 55 to 64 Years | 243 | 19.2% |
| 65 to 74 Years | 228 | 18.0% |
| 75 to 84 Years | 214 | 16.9% |
| 85 Years and Over | 62 | 4.9% |
| Total | 1,263 | 100.0% |
Housing Finances in Bonifay
Median Income by Occupancy in Bonifay
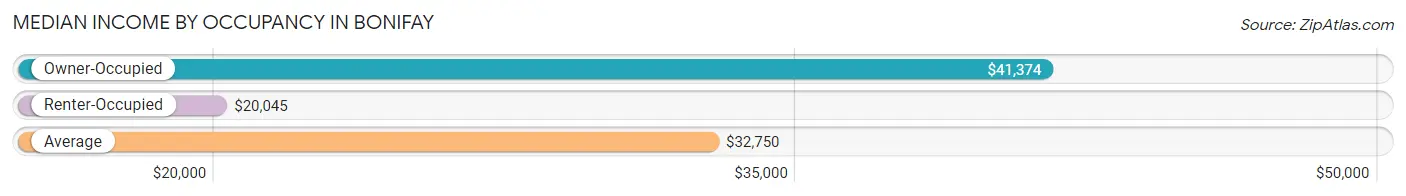
| Occupancy Type | # Households | Median Income |
| Owner-Occupied | 708 (56.1%) | $41,374 |
| Renter-Occupied | 555 (43.9%) | $20,045 |
| Average | 1,263 (100.0%) | $32,750 |
Occupancy by Householder Income Bracket in Bonifay
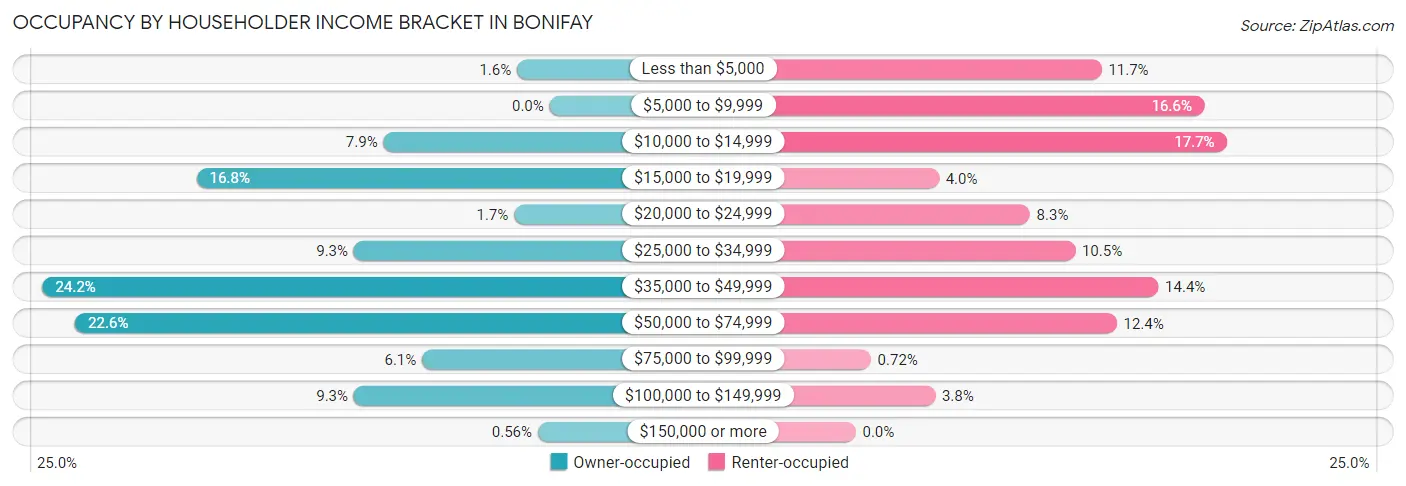
| Income Bracket | Owner-occupied | Renter-occupied |
| Less than $5,000 | 11 (1.5%) | 65 (11.7%) |
| $5,000 to $9,999 | 0 (0.0%) | 92 (16.6%) |
| $10,000 to $14,999 | 56 (7.9%) | 98 (17.7%) |
| $15,000 to $19,999 | 119 (16.8%) | 22 (4.0%) |
| $20,000 to $24,999 | 12 (1.7%) | 46 (8.3%) |
| $25,000 to $34,999 | 66 (9.3%) | 58 (10.4%) |
| $35,000 to $49,999 | 171 (24.1%) | 80 (14.4%) |
| $50,000 to $74,999 | 160 (22.6%) | 69 (12.4%) |
| $75,000 to $99,999 | 43 (6.1%) | 4 (0.7%) |
| $100,000 to $149,999 | 66 (9.3%) | 21 (3.8%) |
| $150,000 or more | 4 (0.6%) | 0 (0.0%) |
| Total | 708 (100.0%) | 555 (100.0%) |
Monthly Housing Cost Tiers in Bonifay
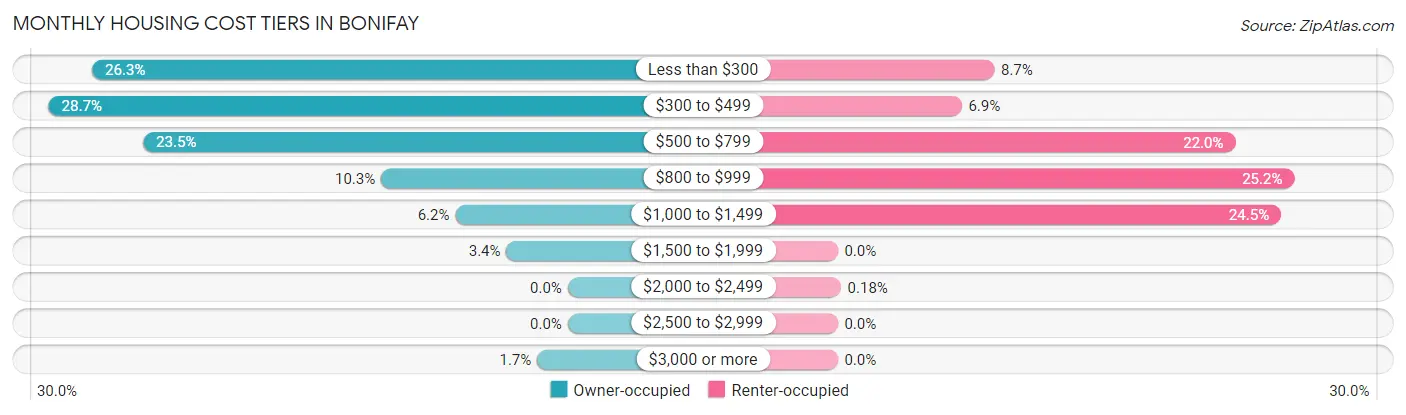
| Monthly Cost | Owner-occupied | Renter-occupied |
| Less than $300 | 186 (26.3%) | 48 (8.6%) |
| $300 to $499 | 203 (28.7%) | 38 (6.9%) |
| $500 to $799 | 166 (23.4%) | 122 (22.0%) |
| $800 to $999 | 73 (10.3%) | 140 (25.2%) |
| $1,000 to $1,499 | 44 (6.2%) | 136 (24.5%) |
| $1,500 to $1,999 | 24 (3.4%) | 0 (0.0%) |
| $2,000 to $2,499 | 0 (0.0%) | 1 (0.2%) |
| $2,500 to $2,999 | 0 (0.0%) | 0 (0.0%) |
| $3,000 or more | 12 (1.7%) | 0 (0.0%) |
| Total | 708 (100.0%) | 555 (100.0%) |
Physical Housing Characteristics in Bonifay
Housing Structures in Bonifay
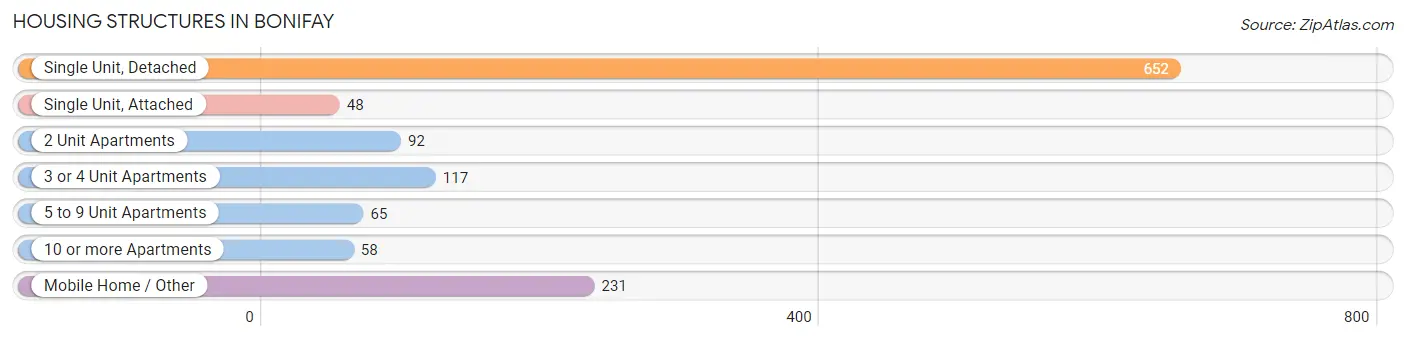
| Structure Type | # Housing Units | % Housing Units |
| Single Unit, Detached | 652 | 51.6% |
| Single Unit, Attached | 48 | 3.8% |
| 2 Unit Apartments | 92 | 7.3% |
| 3 or 4 Unit Apartments | 117 | 9.3% |
| 5 to 9 Unit Apartments | 65 | 5.1% |
| 10 or more Apartments | 58 | 4.6% |
| Mobile Home / Other | 231 | 18.3% |
| Total | 1,263 | 100.0% |
Housing Structures by Occupancy in Bonifay
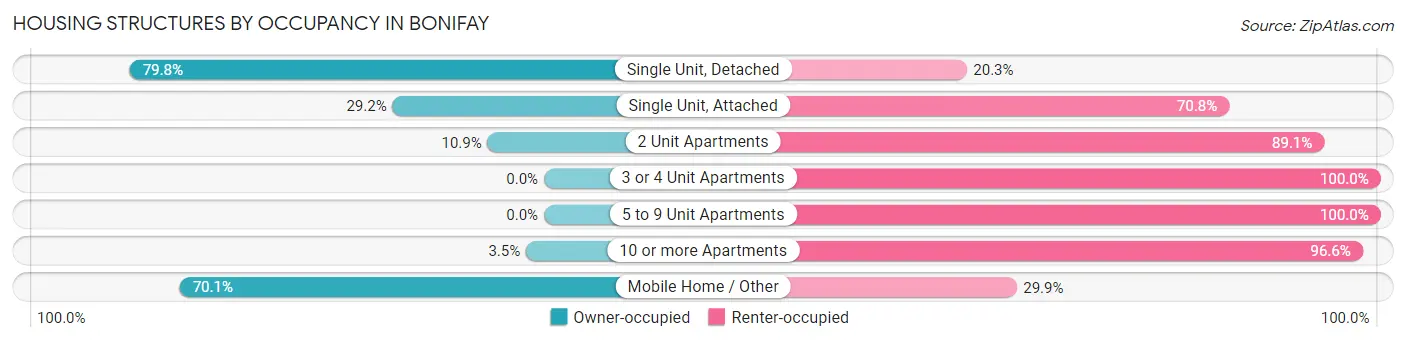
| Structure Type | Owner-occupied | Renter-occupied |
| Single Unit, Detached | 520 (79.7%) | 132 (20.3%) |
| Single Unit, Attached | 14 (29.2%) | 34 (70.8%) |
| 2 Unit Apartments | 10 (10.9%) | 82 (89.1%) |
| 3 or 4 Unit Apartments | 0 (0.0%) | 117 (100.0%) |
| 5 to 9 Unit Apartments | 0 (0.0%) | 65 (100.0%) |
| 10 or more Apartments | 2 (3.5%) | 56 (96.6%) |
| Mobile Home / Other | 162 (70.1%) | 69 (29.9%) |
| Total | 708 (56.1%) | 555 (43.9%) |
Housing Structures by Number of Rooms in Bonifay
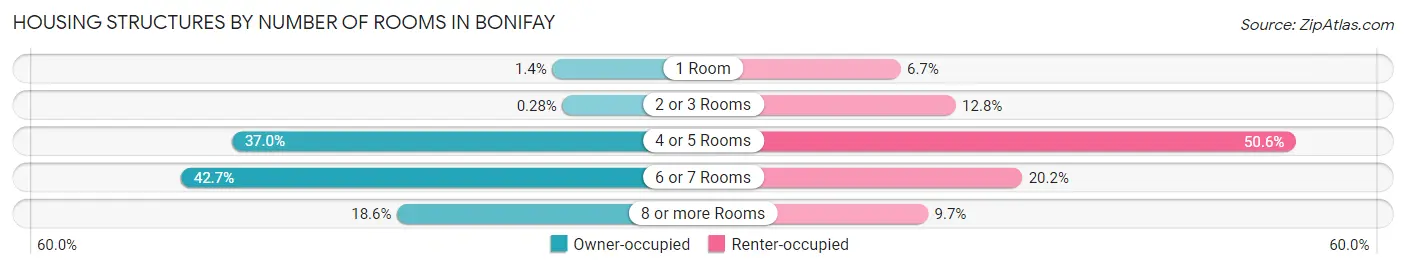
| Number of Rooms | Owner-occupied | Renter-occupied |
| 1 Room | 10 (1.4%) | 37 (6.7%) |
| 2 or 3 Rooms | 2 (0.3%) | 71 (12.8%) |
| 4 or 5 Rooms | 262 (37.0%) | 281 (50.6%) |
| 6 or 7 Rooms | 302 (42.7%) | 112 (20.2%) |
| 8 or more Rooms | 132 (18.6%) | 54 (9.7%) |
| Total | 708 (100.0%) | 555 (100.0%) |
Housing Structure by Heating Type in Bonifay
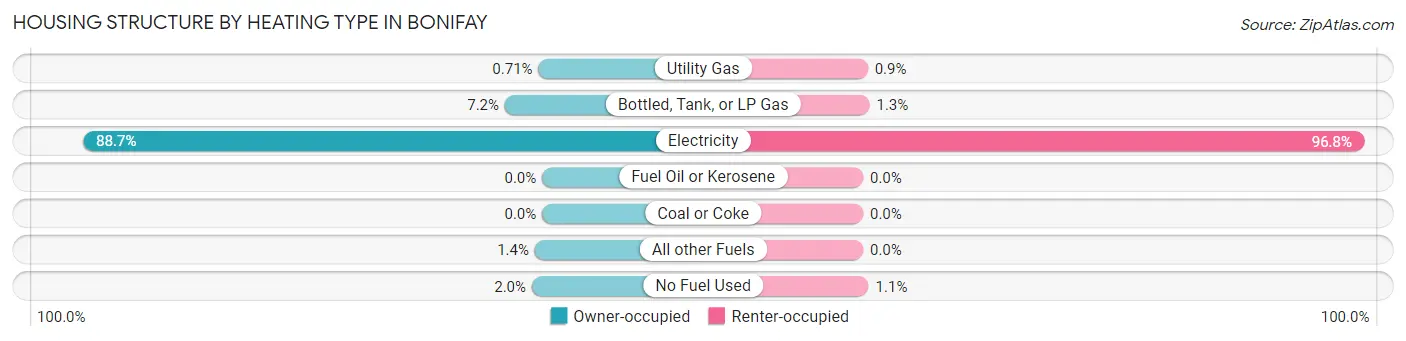
| Heating Type | Owner-occupied | Renter-occupied |
| Utility Gas | 5 (0.7%) | 5 (0.9%) |
| Bottled, Tank, or LP Gas | 51 (7.2%) | 7 (1.3%) |
| Electricity | 628 (88.7%) | 537 (96.8%) |
| Fuel Oil or Kerosene | 0 (0.0%) | 0 (0.0%) |
| Coal or Coke | 0 (0.0%) | 0 (0.0%) |
| All other Fuels | 10 (1.4%) | 0 (0.0%) |
| No Fuel Used | 14 (2.0%) | 6 (1.1%) |
| Total | 708 (100.0%) | 555 (100.0%) |
Household Vehicle Usage in Bonifay
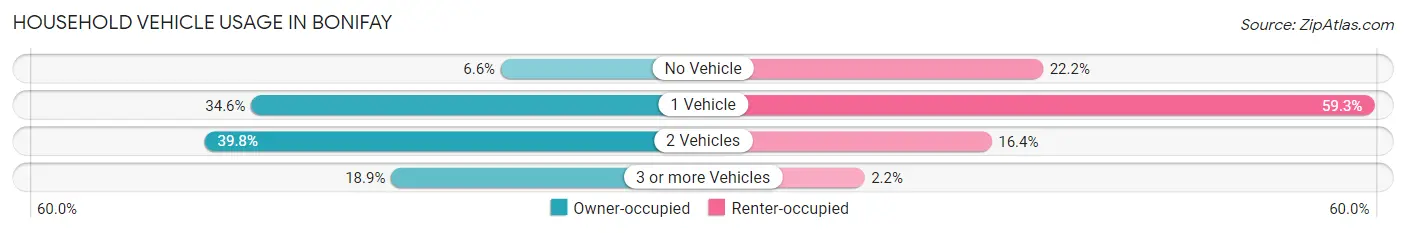
| Vehicles per Household | Owner-occupied | Renter-occupied |
| No Vehicle | 47 (6.6%) | 123 (22.2%) |
| 1 Vehicle | 245 (34.6%) | 329 (59.3%) |
| 2 Vehicles | 282 (39.8%) | 91 (16.4%) |
| 3 or more Vehicles | 134 (18.9%) | 12 (2.2%) |
| Total | 708 (100.0%) | 555 (100.0%) |
Real Estate & Mortgages in Bonifay
Real Estate and Mortgage Overview in Bonifay
| Characteristic | Without Mortgage | With Mortgage |
| Housing Units | 531 | 177 |
| Median Property Value | $108,400 | $130,700 |
| Median Household Income | $39,659 | $0 |
| Monthly Housing Costs | $360 | $10 |
| Real Estate Taxes | $630 | $10 |
Property Value by Mortgage Status in Bonifay
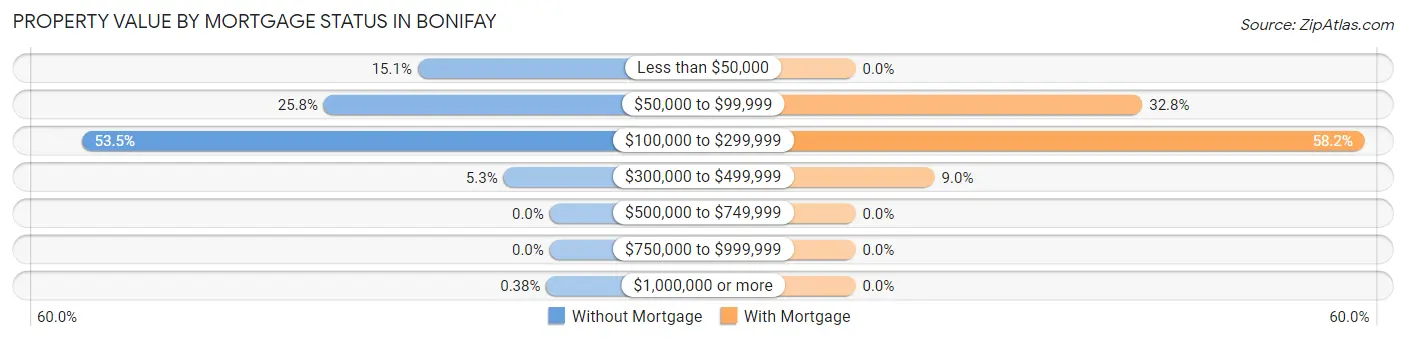
| Property Value | Without Mortgage | With Mortgage |
| Less than $50,000 | 80 (15.1%) | 0 (0.0%) |
| $50,000 to $99,999 | 137 (25.8%) | 58 (32.8%) |
| $100,000 to $299,999 | 284 (53.5%) | 103 (58.2%) |
| $300,000 to $499,999 | 28 (5.3%) | 16 (9.0%) |
| $500,000 to $749,999 | 0 (0.0%) | 0 (0.0%) |
| $750,000 to $999,999 | 0 (0.0%) | 0 (0.0%) |
| $1,000,000 or more | 2 (0.4%) | 0 (0.0%) |
| Total | 531 (100.0%) | 177 (100.0%) |
Household Income by Mortgage Status in Bonifay
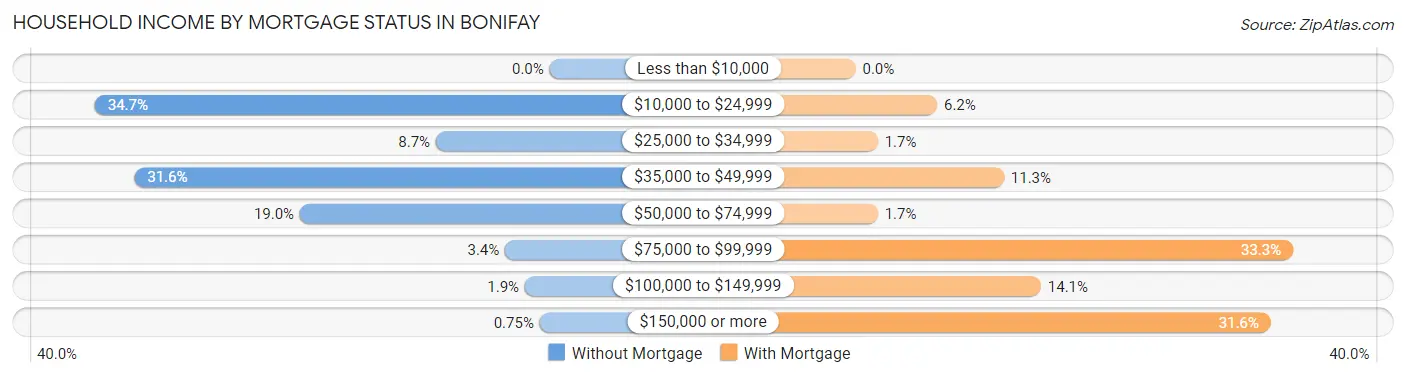
| Household Income | Without Mortgage | With Mortgage |
| Less than $10,000 | 0 (0.0%) | 0 (0.0%) |
| $10,000 to $24,999 | 184 (34.6%) | 11 (6.2%) |
| $25,000 to $34,999 | 46 (8.7%) | 3 (1.7%) |
| $35,000 to $49,999 | 168 (31.6%) | 20 (11.3%) |
| $50,000 to $74,999 | 101 (19.0%) | 3 (1.7%) |
| $75,000 to $99,999 | 18 (3.4%) | 59 (33.3%) |
| $100,000 to $149,999 | 10 (1.9%) | 25 (14.1%) |
| $150,000 or more | 4 (0.7%) | 56 (31.6%) |
| Total | 531 (100.0%) | 177 (100.0%) |
Property Value to Household Income Ratio in Bonifay
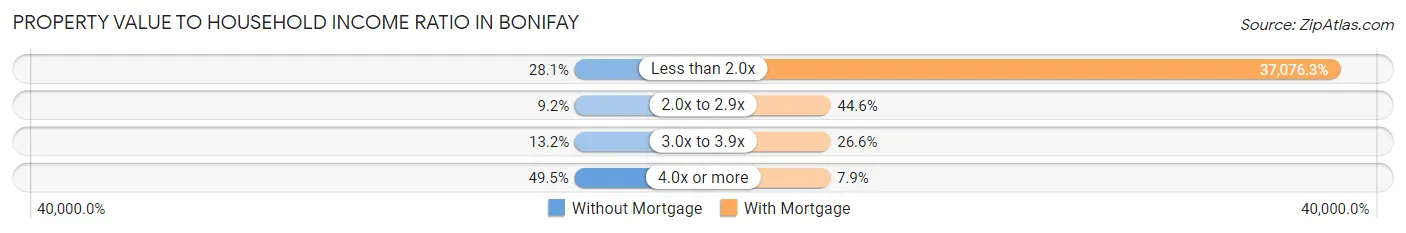
| Value-to-Income Ratio | Without Mortgage | With Mortgage |
| Less than 2.0x | 149 (28.1%) | 65,625 (37,076.3%) |
| 2.0x to 2.9x | 49 (9.2%) | 79 (44.6%) |
| 3.0x to 3.9x | 70 (13.2%) | 47 (26.6%) |
| 4.0x or more | 263 (49.5%) | 14 (7.9%) |
| Total | 531 (100.0%) | 177 (100.0%) |
Real Estate Taxes by Mortgage Status in Bonifay
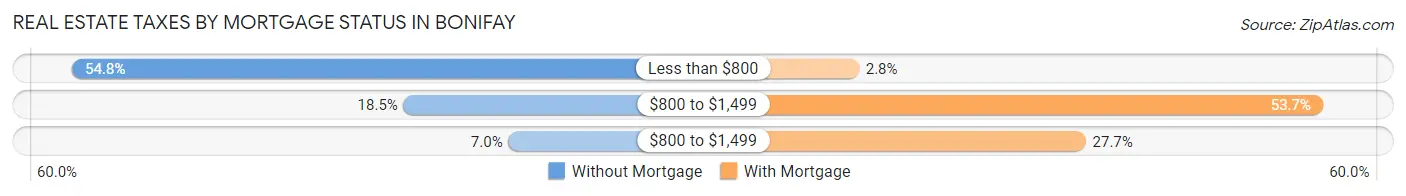
| Property Taxes | Without Mortgage | With Mortgage |
| Less than $800 | 291 (54.8%) | 5 (2.8%) |
| $800 to $1,499 | 98 (18.5%) | 95 (53.7%) |
| $800 to $1,499 | 37 (7.0%) | 49 (27.7%) |
| Total | 531 (100.0%) | 177 (100.0%) |
Health & Disability in Bonifay
Health Insurance Coverage by Age in Bonifay
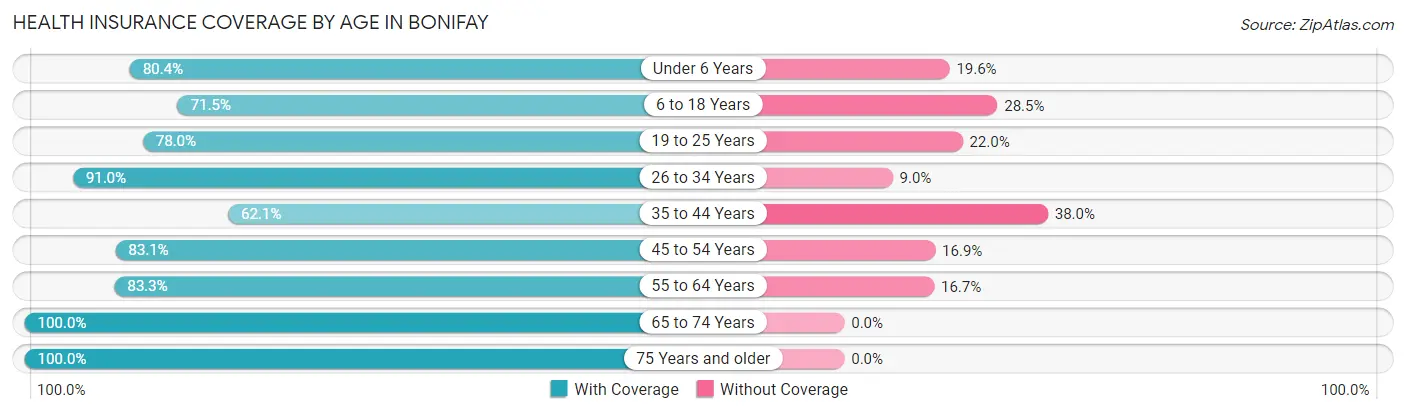
| Age Bracket | With Coverage | Without Coverage |
| Under 6 Years | 164 (80.4%) | 40 (19.6%) |
| 6 to 18 Years | 298 (71.5%) | 119 (28.5%) |
| 19 to 25 Years | 191 (78.0%) | 54 (22.0%) |
| 26 to 34 Years | 283 (91.0%) | 28 (9.0%) |
| 35 to 44 Years | 121 (62.1%) | 74 (38.0%) |
| 45 to 54 Years | 206 (83.1%) | 42 (16.9%) |
| 55 to 64 Years | 234 (83.3%) | 47 (16.7%) |
| 65 to 74 Years | 334 (100.0%) | 0 (0.0%) |
| 75 Years and older | 312 (100.0%) | 0 (0.0%) |
| Total | 2,143 (84.1%) | 404 (15.9%) |
Health Insurance Coverage by Citizenship Status in Bonifay
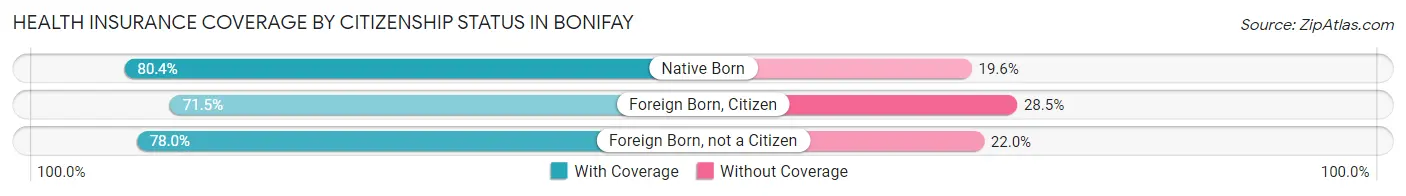
| Citizenship Status | With Coverage | Without Coverage |
| Native Born | 164 (80.4%) | 40 (19.6%) |
| Foreign Born, Citizen | 298 (71.5%) | 119 (28.5%) |
| Foreign Born, not a Citizen | 191 (78.0%) | 54 (22.0%) |
Health Insurance Coverage by Household Income in Bonifay
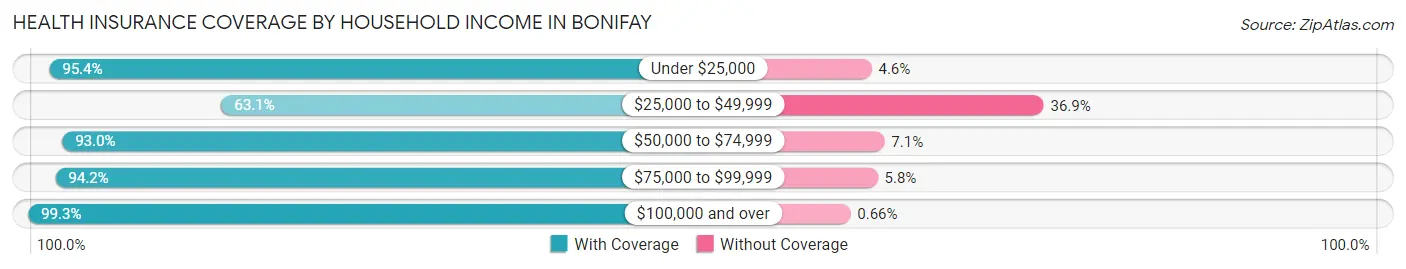
| Household Income | With Coverage | Without Coverage |
| Under $25,000 | 742 (95.4%) | 36 (4.6%) |
| $25,000 to $49,999 | 560 (63.1%) | 327 (36.9%) |
| $50,000 to $74,999 | 435 (92.9%) | 33 (7.0%) |
| $75,000 to $99,999 | 98 (94.2%) | 6 (5.8%) |
| $100,000 and over | 303 (99.3%) | 2 (0.7%) |
Public vs Private Health Insurance Coverage by Age in Bonifay
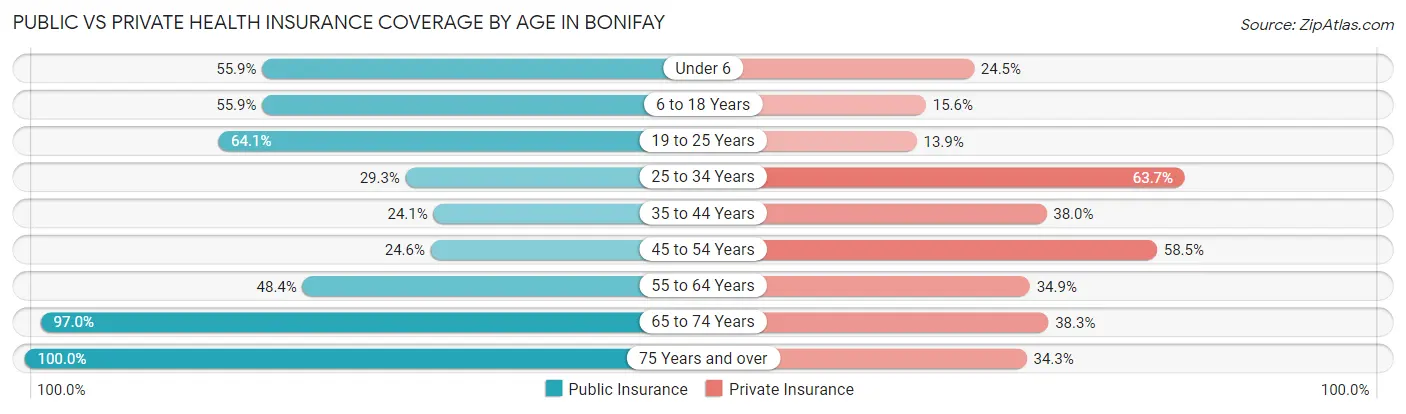
| Age Bracket | Public Insurance | Private Insurance |
| Under 6 | 114 (55.9%) | 50 (24.5%) |
| 6 to 18 Years | 233 (55.9%) | 65 (15.6%) |
| 19 to 25 Years | 157 (64.1%) | 34 (13.9%) |
| 25 to 34 Years | 91 (29.3%) | 198 (63.7%) |
| 35 to 44 Years | 47 (24.1%) | 74 (38.0%) |
| 45 to 54 Years | 61 (24.6%) | 145 (58.5%) |
| 55 to 64 Years | 136 (48.4%) | 98 (34.9%) |
| 65 to 74 Years | 324 (97.0%) | 128 (38.3%) |
| 75 Years and over | 312 (100.0%) | 107 (34.3%) |
| Total | 1,475 (57.9%) | 899 (35.3%) |
Disability Status by Sex by Age in Bonifay
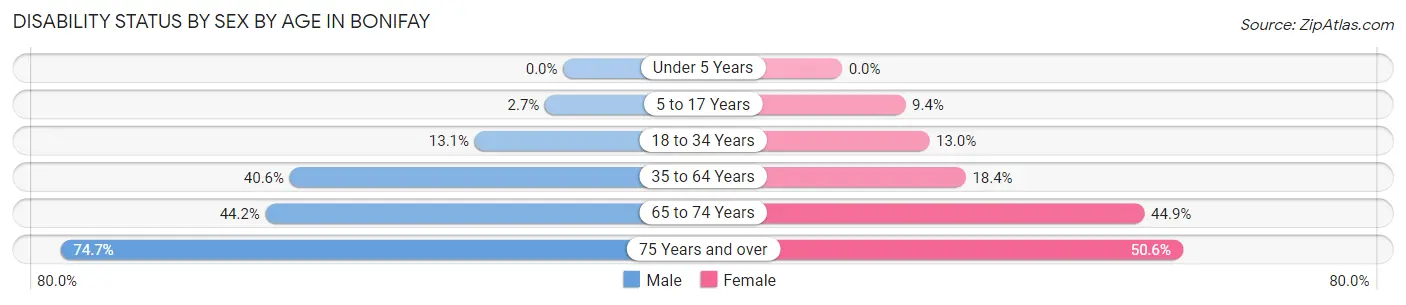
| Age Bracket | Male | Female |
| Under 5 Years | 0 (0.0%) | 0 (0.0%) |
| 5 to 17 Years | 6 (2.7%) | 22 (9.4%) |
| 18 to 34 Years | 23 (13.1%) | 50 (13.0%) |
| 35 to 64 Years | 106 (40.6%) | 85 (18.4%) |
| 65 to 74 Years | 61 (44.2%) | 88 (44.9%) |
| 75 Years and over | 115 (74.7%) | 80 (50.6%) |
Disability Class by Sex by Age in Bonifay
Disability Class: Hearing Difficulty
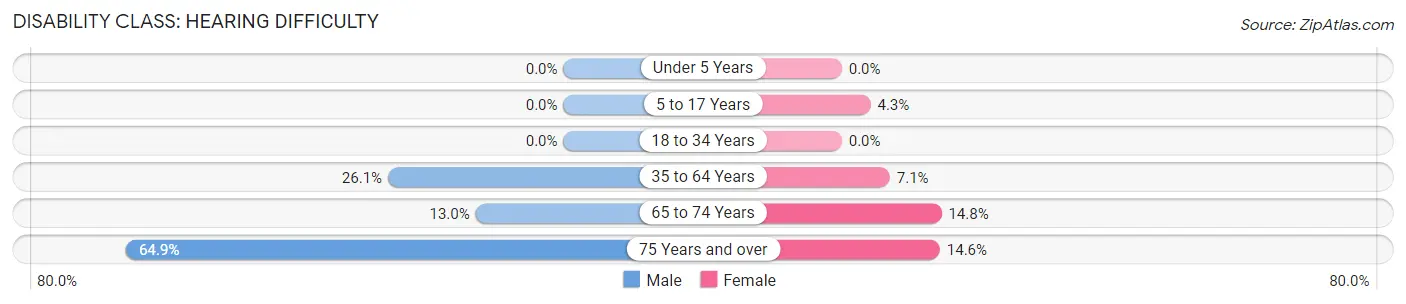
| Age Bracket | Male | Female |
| Under 5 Years | 0 (0.0%) | 0 (0.0%) |
| 5 to 17 Years | 0 (0.0%) | 10 (4.3%) |
| 18 to 34 Years | 0 (0.0%) | 0 (0.0%) |
| 35 to 64 Years | 68 (26.1%) | 33 (7.1%) |
| 65 to 74 Years | 18 (13.0%) | 29 (14.8%) |
| 75 Years and over | 100 (64.9%) | 23 (14.6%) |
Disability Class: Vision Difficulty
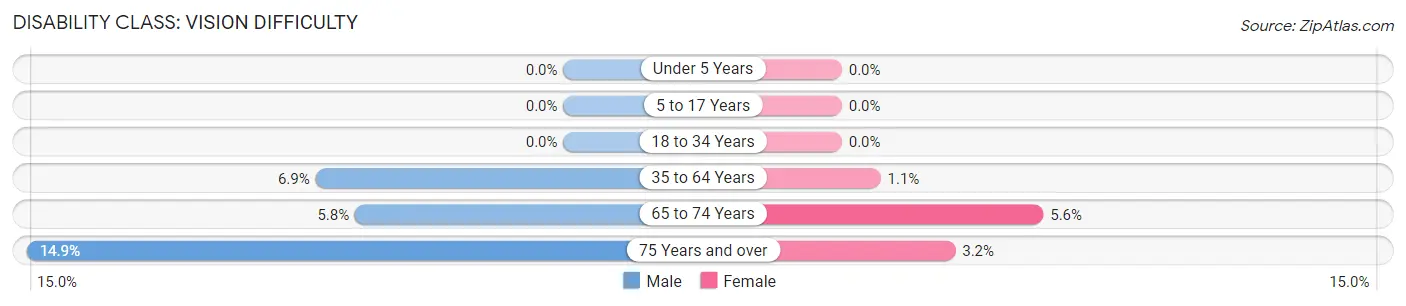
| Age Bracket | Male | Female |
| Under 5 Years | 0 (0.0%) | 0 (0.0%) |
| 5 to 17 Years | 0 (0.0%) | 0 (0.0%) |
| 18 to 34 Years | 0 (0.0%) | 0 (0.0%) |
| 35 to 64 Years | 18 (6.9%) | 5 (1.1%) |
| 65 to 74 Years | 8 (5.8%) | 11 (5.6%) |
| 75 Years and over | 23 (14.9%) | 5 (3.2%) |
Disability Class: Cognitive Difficulty
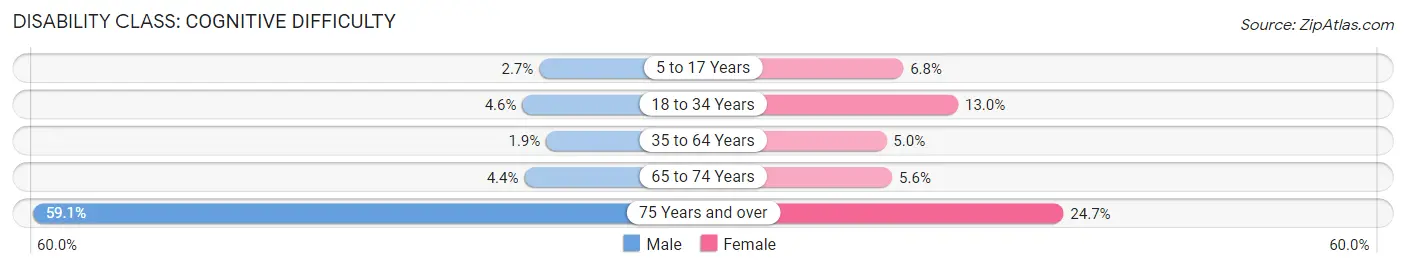
| Age Bracket | Male | Female |
| 5 to 17 Years | 6 (2.7%) | 16 (6.8%) |
| 18 to 34 Years | 8 (4.6%) | 50 (13.0%) |
| 35 to 64 Years | 5 (1.9%) | 23 (5.0%) |
| 65 to 74 Years | 6 (4.3%) | 11 (5.6%) |
| 75 Years and over | 91 (59.1%) | 39 (24.7%) |
Disability Class: Ambulatory Difficulty
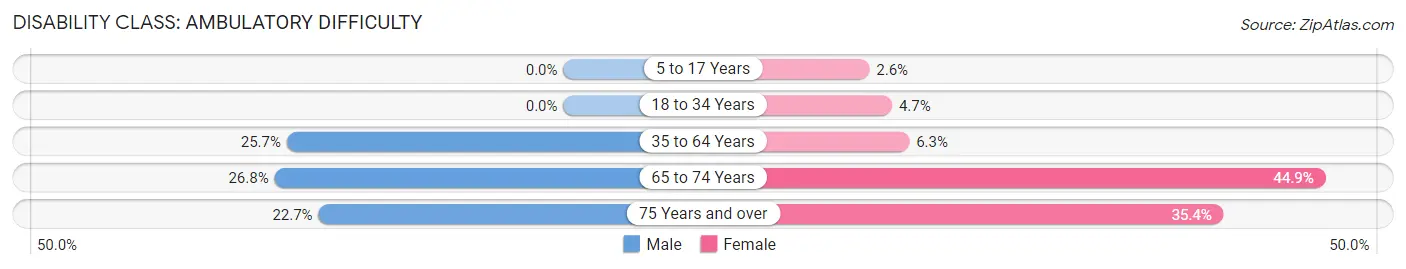
| Age Bracket | Male | Female |
| 5 to 17 Years | 0 (0.0%) | 6 (2.6%) |
| 18 to 34 Years | 0 (0.0%) | 18 (4.7%) |
| 35 to 64 Years | 67 (25.7%) | 29 (6.3%) |
| 65 to 74 Years | 37 (26.8%) | 88 (44.9%) |
| 75 Years and over | 35 (22.7%) | 56 (35.4%) |
Disability Class: Self-Care Difficulty
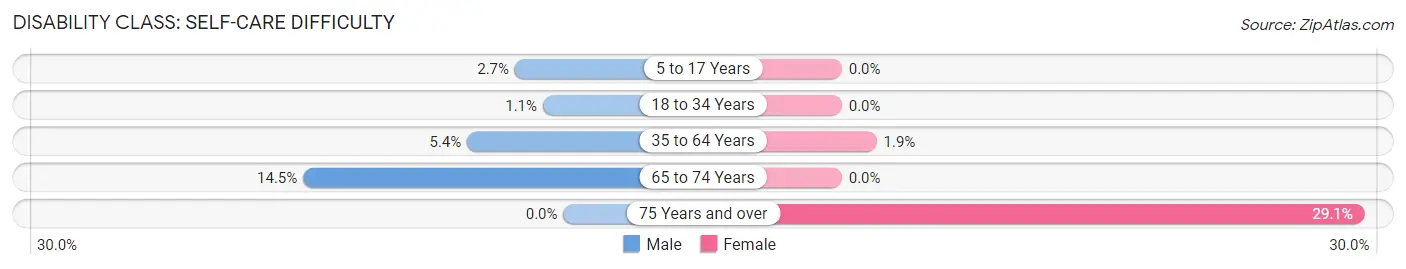
| Age Bracket | Male | Female |
| 5 to 17 Years | 6 (2.7%) | 0 (0.0%) |
| 18 to 34 Years | 2 (1.1%) | 0 (0.0%) |
| 35 to 64 Years | 14 (5.4%) | 9 (1.9%) |
| 65 to 74 Years | 20 (14.5%) | 0 (0.0%) |
| 75 Years and over | 0 (0.0%) | 46 (29.1%) |
Technology Access in Bonifay
Computing Device Access in Bonifay
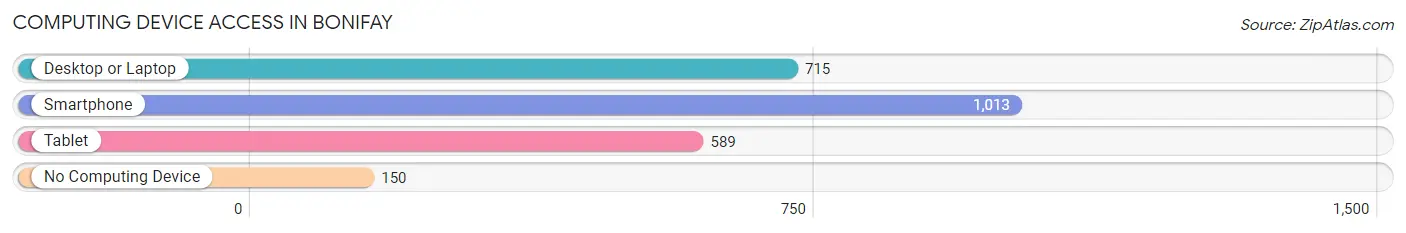
| Device Type | # Households | % Households |
| Desktop or Laptop | 715 | 56.6% |
| Smartphone | 1,013 | 80.2% |
| Tablet | 589 | 46.6% |
| No Computing Device | 150 | 11.9% |
| Total | 1,263 | 100.0% |
Internet Access in Bonifay
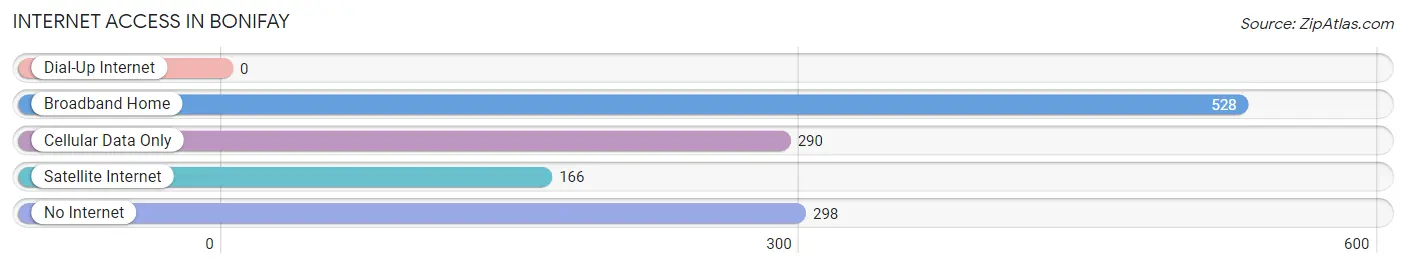
| Internet Type | # Households | % Households |
| Dial-Up Internet | 0 | 0.0% |
| Broadband Home | 528 | 41.8% |
| Cellular Data Only | 290 | 23.0% |
| Satellite Internet | 166 | 13.1% |
| No Internet | 298 | 23.6% |
| Total | 1,263 | 100.0% |
Bonifay Summary
Bonifay, Florida is a small town located in the panhandle of Florida, approximately 30 miles west of the state capital of Tallahassee. It is the county seat of Holmes County, and is part of the Chipley, Florida Metropolitan Statistical Area. The town was founded in 1882 and has a population of approximately 2,500 people.
History
Bonifay was founded in 1882 by a group of settlers from Georgia and Alabama. The town was named after a local creek, which was named after a Seminole Indian chief named Bonifay. The town was incorporated in 1885 and was the first county seat of Holmes County.
The town was a major center for the timber industry in the late 19th and early 20th centuries. The timber industry was a major source of employment for the town, and the town was home to several sawmills and lumber companies.
In the early 20th century, the town was a major center for the turpentine industry. The turpentine industry was a major source of employment for the town, and the town was home to several turpentine stills.
The town was also home to several cotton gins and cotton mills. The cotton industry was a major source of employment for the town, and the town was home to several cotton gins and cotton mills.
The town was also home to several brickyards. The brickyards were a major source of employment for the town, and the town was home to several brickyards.
Geography
Bonifay is located in the panhandle of Florida, approximately 30 miles west of the state capital of Tallahassee. The town is located in Holmes County, and is part of the Chipley, Florida Metropolitan Statistical Area. The town is located at an elevation of approximately 100 feet above sea level.
The town is located in a rural area, and is surrounded by farmland and forests. The town is located near the Choctawhatchee River, and is located near several lakes, including Lake Bonifay, Lake Jackson, and Lake Talquin.
Economy
The economy of Bonifay is largely based on agriculture and forestry. The town is home to several farms, and the surrounding area is home to several timber companies. The town is also home to several manufacturing companies, including a furniture manufacturer and a plastics manufacturer.
The town is also home to several retail stores, including a grocery store, a hardware store, and a clothing store. The town is also home to several restaurants, including a Mexican restaurant, a Chinese restaurant, and a pizza restaurant.
Demographics
As of the 2010 census, the population of Bonifay was 2,500 people. The racial makeup of the town was 79.2% White, 17.2% African American, 0.4% Native American, 0.4% Asian, 0.2% Pacific Islander, 1.2% from other races, and 1.6% from two or more races. Hispanic or Latino of any race were 3.2% of the population.
The median household income in Bonifay was $30,000, and the median family income was $35,000. The per capita income in Bonifay was $14,000. Approximately 17.2% of the population was below the poverty line.
Common Questions
What is Per Capita Income in Bonifay?
Per Capita income in Bonifay is $19,419.
What is the Median Family Income in Bonifay?
Median Family Income in Bonifay is $38,100.
What is the Median Household income in Bonifay?
Median Household Income in Bonifay is $32,750.
What is Income or Wage Gap in Bonifay?
Income or Wage Gap in Bonifay is 18.8%.
Women in Bonifay earn 81.2 cents for every dollar earned by a man.
What is Family Income Deficit in Bonifay?
Family Income Deficit in Bonifay is $12,811.
Families that are below poverty line in Bonifay earn $12,811 less on average than the poverty threshold level.
What is Inequality or Gini Index in Bonifay?
Inequality or Gini Index in Bonifay is 0.43.
What is the Total Population of Bonifay?
Total Population of Bonifay is 2,760.
What is the Total Male Population of Bonifay?
Total Male Population of Bonifay is 1,145.
What is the Total Female Population of Bonifay?
Total Female Population of Bonifay is 1,615.
What is the Ratio of Males per 100 Females in Bonifay?
There are 70.90 Males per 100 Females in Bonifay.
What is the Ratio of Females per 100 Males in Bonifay?
There are 141.05 Females per 100 Males in Bonifay.
What is the Median Population Age in Bonifay?
Median Population Age in Bonifay is 45.1 Years.
What is the Average Family Size in Bonifay
Average Family Size in Bonifay is 2.9 People.
What is the Average Household Size in Bonifay
Average Household Size in Bonifay is 2.0 People.
How Large is the Labor Force in Bonifay?
There are 954 People in the Labor Forcein in Bonifay.
What is the Percentage of People in the Labor Force in Bonifay?
43.3% of People are in the Labor Force in Bonifay.
What is the Unemployment Rate in Bonifay?
Unemployment Rate in Bonifay is 8.5%.