Bokeelia, FL Map & Demographics
Bokeelia Map
Bokeelia Overview
$49,671
PER CAPITA INCOME
$63,640
AVG FAMILY INCOME
$66,691
AVG HOUSEHOLD INCOME
34.9%
WAGE / INCOME GAP [ % ]
65.1¢/ $1
WAGE / INCOME GAP [ $ ]
0.52
INEQUALITY / GINI INDEX
2,230
TOTAL POPULATION
1,144
MALE POPULATION
1,086
FEMALE POPULATION
105.34
MALES / 100 FEMALES
94.93
FEMALES / 100 MALES
59.2
MEDIAN AGE
2.7
AVG FAMILY SIZE
2.4
AVG HOUSEHOLD SIZE
663
LABOR FORCE [ PEOPLE ]
35.4%
PERCENT IN LABOR FORCE
6.2%
UNEMPLOYMENT RATE
Bokeelia Zip Codes
Income in Bokeelia
Income Overview in Bokeelia
Per Capita Income in Bokeelia is $49,671, while median incomes of families and households are $63,640 and $66,691 respectively.
| Characteristic | Number | Measure |
| Per Capita Income | 2,230 | $49,671 |
| Median Family Income | 683 | $63,640 |
| Mean Family Income | 683 | $113,651 |
| Median Household Income | 925 | $66,691 |
| Mean Household Income | 925 | $115,746 |
| Income Deficit | 683 | $0 |
| Wage / Income Gap (%) | 2,230 | 34.88% |
| Wage / Income Gap ($) | 2,230 | 65.12¢ per $1 |
| Gini / Inequality Index | 2,230 | 0.52 |
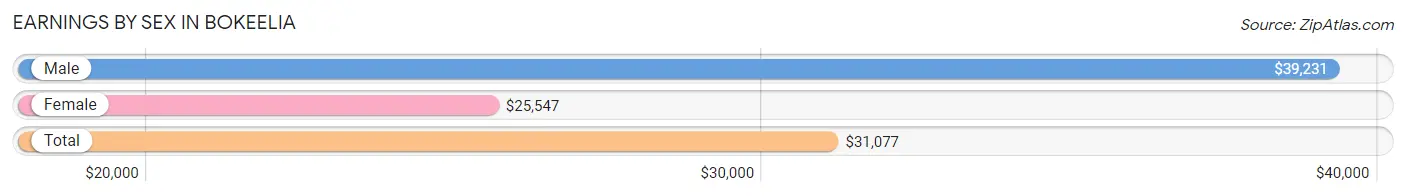
Earnings by Sex in Bokeelia
Average Earnings in Bokeelia are $31,077, $39,231 for men and $25,547 for women, a difference of 34.9%.
| Sex | Number | Average Earnings |
| Male | 388 (54.2%) | $39,231 |
| Female | 328 (45.8%) | $25,547 |
| Total | 716 (100.0%) | $31,077 |
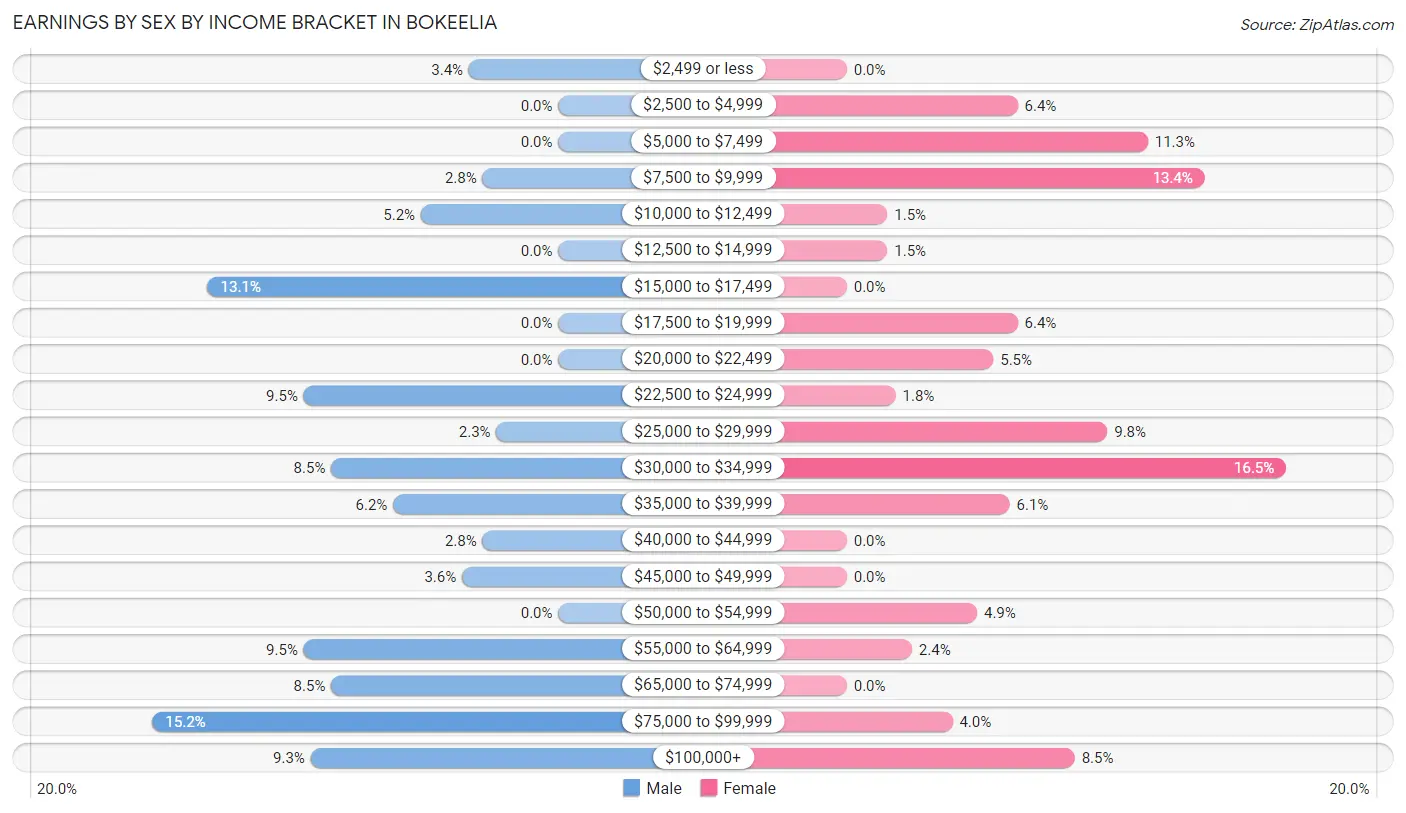
Earnings by Sex by Income Bracket in Bokeelia
The most common earnings brackets in Bokeelia are $75,000 to $99,999 for men (59 | 15.2%) and $30,000 to $34,999 for women (54 | 16.5%).
| Income | Male | Female |
| $2,499 or less | 13 (3.4%) | 0 (0.0%) |
| $2,500 to $4,999 | 0 (0.0%) | 21 (6.4%) |
| $5,000 to $7,499 | 0 (0.0%) | 37 (11.3%) |
| $7,500 to $9,999 | 11 (2.8%) | 44 (13.4%) |
| $10,000 to $12,499 | 20 (5.1%) | 5 (1.5%) |
| $12,500 to $14,999 | 0 (0.0%) | 5 (1.5%) |
| $15,000 to $17,499 | 51 (13.1%) | 0 (0.0%) |
| $17,500 to $19,999 | 0 (0.0%) | 21 (6.4%) |
| $20,000 to $22,499 | 0 (0.0%) | 18 (5.5%) |
| $22,500 to $24,999 | 37 (9.5%) | 6 (1.8%) |
| $25,000 to $29,999 | 9 (2.3%) | 32 (9.8%) |
| $30,000 to $34,999 | 33 (8.5%) | 54 (16.5%) |
| $35,000 to $39,999 | 24 (6.2%) | 20 (6.1%) |
| $40,000 to $44,999 | 11 (2.8%) | 0 (0.0%) |
| $45,000 to $49,999 | 14 (3.6%) | 0 (0.0%) |
| $50,000 to $54,999 | 0 (0.0%) | 16 (4.9%) |
| $55,000 to $64,999 | 37 (9.5%) | 8 (2.4%) |
| $65,000 to $74,999 | 33 (8.5%) | 0 (0.0%) |
| $75,000 to $99,999 | 59 (15.2%) | 13 (4.0%) |
| $100,000+ | 36 (9.3%) | 28 (8.5%) |
| Total | 388 (100.0%) | 328 (100.0%) |
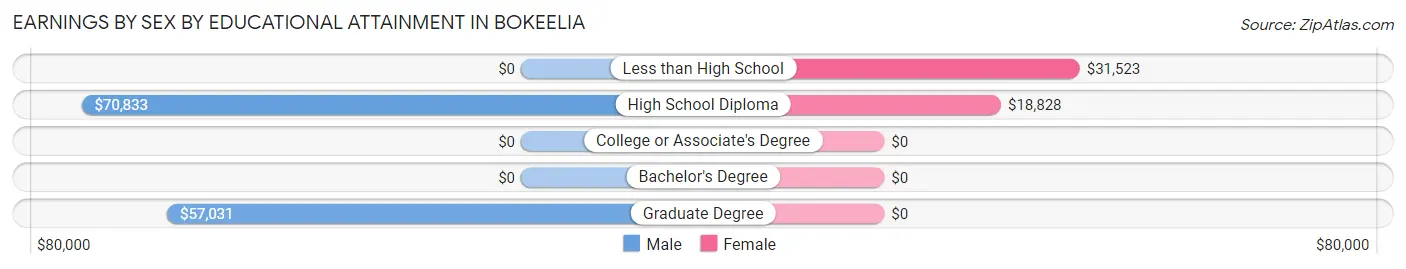
Earnings by Sex by Educational Attainment in Bokeelia
Average earnings in Bokeelia are $49,531 for men and $26,875 for women, a difference of 45.7%. Men with an educational attainment of high school diploma enjoy the highest average annual earnings of $70,833, while those with graduate degree education earn the least with $57,031. Women with an educational attainment of less than high school earn the most with the average annual earnings of $31,523, while those with high school diploma education have the smallest earnings of $18,828.
| Educational Attainment | Male Income | Female Income |
| Less than High School | - | - |
| High School Diploma | $70,833 | $18,828 |
| College or Associate's Degree | - | - |
| Bachelor's Degree | - | - |
| Graduate Degree | $57,031 | $0 |
| Total | $49,531 | $26,875 |
Family Income in Bokeelia
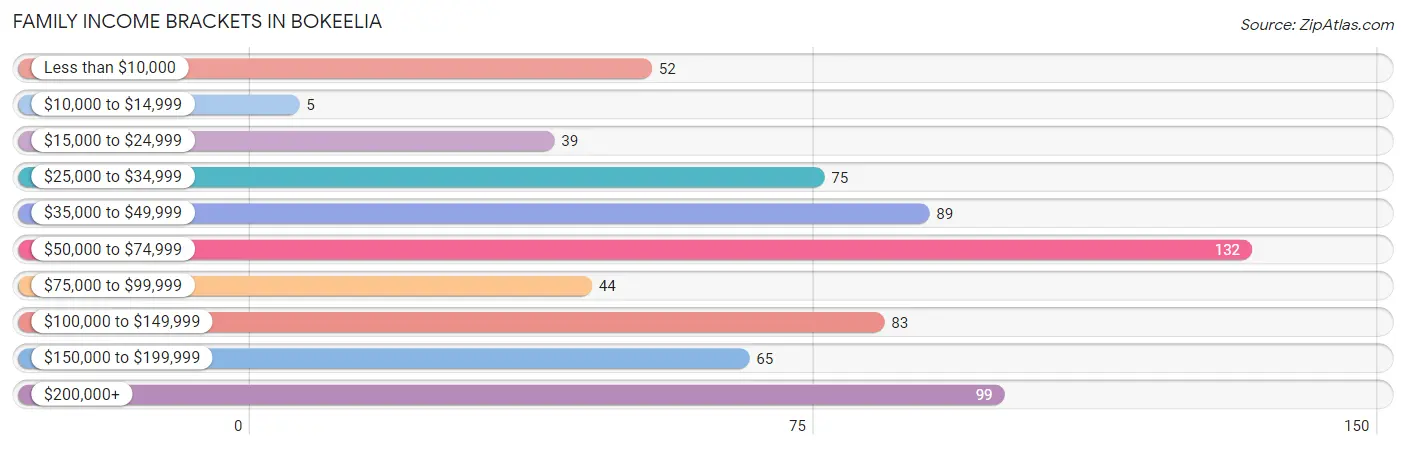
Family Income Brackets in Bokeelia
According to the Bokeelia family income data, there are 132 families falling into the $50,000 to $74,999 income range, which is the most common income bracket and makes up 19.3% of all families. Conversely, the $10,000 to $14,999 income bracket is the least frequent group with only 5 families (0.7%) belonging to this category.
| Income Bracket | # Families | % Families |
| Less than $10,000 | 52 | 7.6% |
| $10,000 to $14,999 | 5 | 0.7% |
| $15,000 to $24,999 | 39 | 5.7% |
| $25,000 to $34,999 | 75 | 11.0% |
| $35,000 to $49,999 | 89 | 13.0% |
| $50,000 to $74,999 | 132 | 19.3% |
| $75,000 to $99,999 | 44 | 6.4% |
| $100,000 to $149,999 | 83 | 12.2% |
| $150,000 to $199,999 | 65 | 9.5% |
| $200,000+ | 99 | 14.5% |
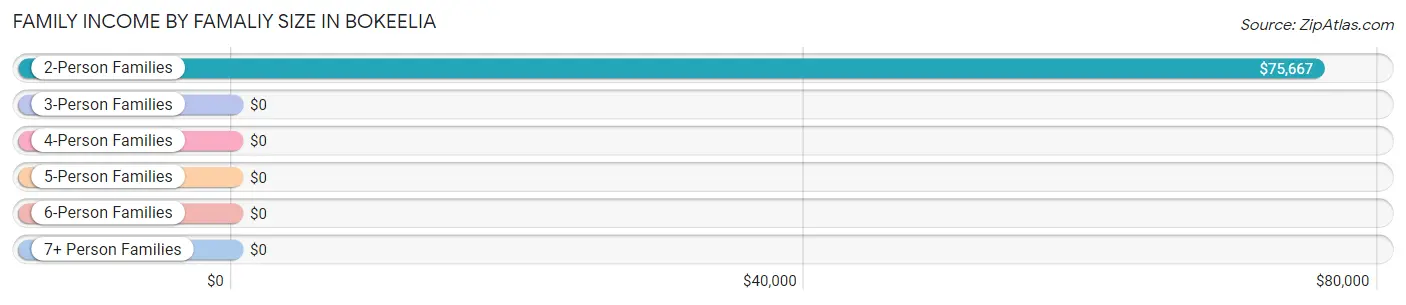
Family Income by Famaliy Size in Bokeelia
2-person families (522 | 76.4%) account for the highest median family income in Bokeelia with $75,667 per family, while 2-person families (522 | 76.4%) have the highest median income of $37,834 per family member.
| Income Bracket | # Families | Median Income |
| 2-Person Families | 522 (76.4%) | $75,667 |
| 3-Person Families | 120 (17.6%) | $0 |
| 4-Person Families | 7 (1.0%) | $0 |
| 5-Person Families | 9 (1.3%) | $0 |
| 6-Person Families | 8 (1.2%) | $0 |
| 7+ Person Families | 17 (2.5%) | $0 |
| Total | 683 (100.0%) | $63,640 |
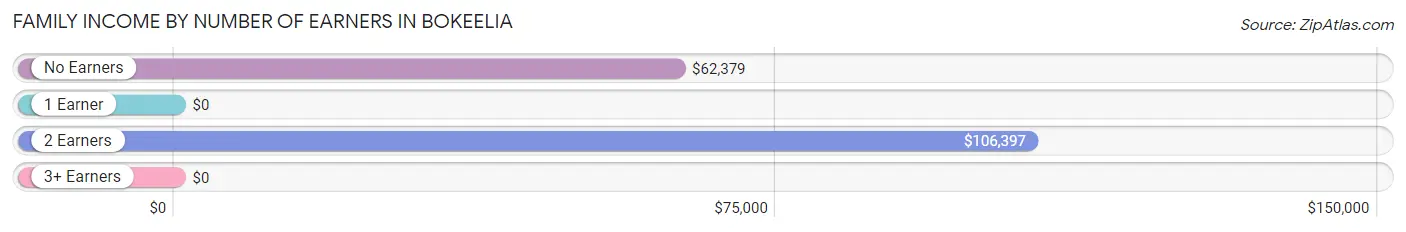
Family Income by Number of Earners in Bokeelia
| Number of Earners | # Families | Median Income |
| No Earners | 423 (61.9%) | $62,379 |
| 1 Earner | 135 (19.8%) | $0 |
| 2 Earners | 89 (13.0%) | $106,397 |
| 3+ Earners | 36 (5.3%) | $0 |
| Total | 683 (100.0%) | $63,640 |
Household Income in Bokeelia
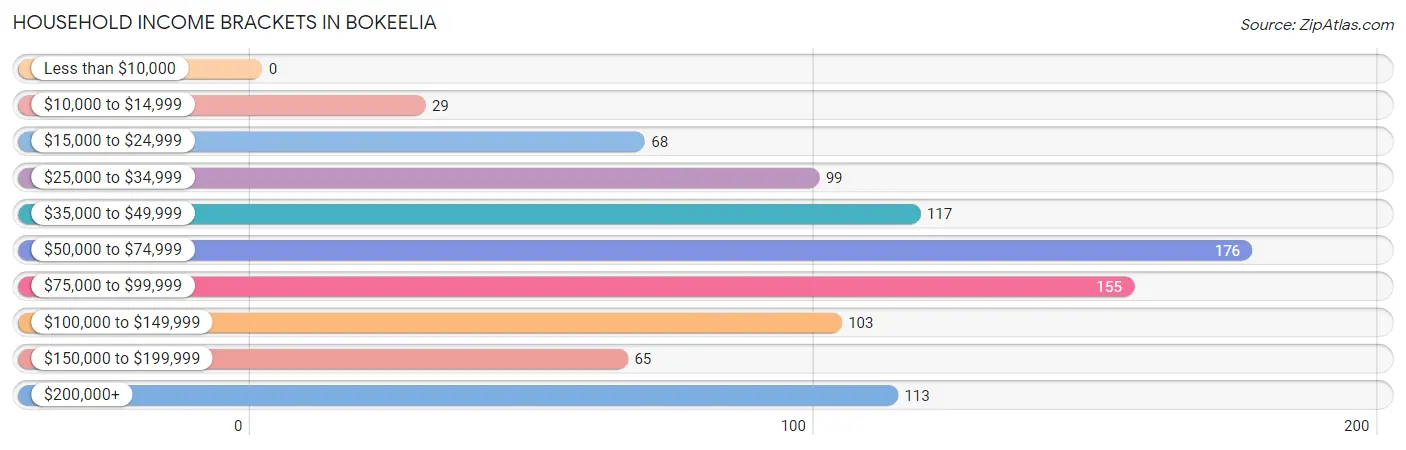
Household Income Brackets in Bokeelia
With 176 households falling in the category, the $50,000 to $74,999 income range is the most frequent in Bokeelia, accounting for 19.0% of all households.
| Income Bracket | # Households | % Households |
| Less than $10,000 | 0 | 0.0% |
| $10,000 to $14,999 | 29 | 3.1% |
| $15,000 to $24,999 | 68 | 7.4% |
| $25,000 to $34,999 | 99 | 10.7% |
| $35,000 to $49,999 | 117 | 12.6% |
| $50,000 to $74,999 | 176 | 19.0% |
| $75,000 to $99,999 | 155 | 16.8% |
| $100,000 to $149,999 | 103 | 11.1% |
| $150,000 to $199,999 | 65 | 7.0% |
| $200,000+ | 113 | 12.2% |
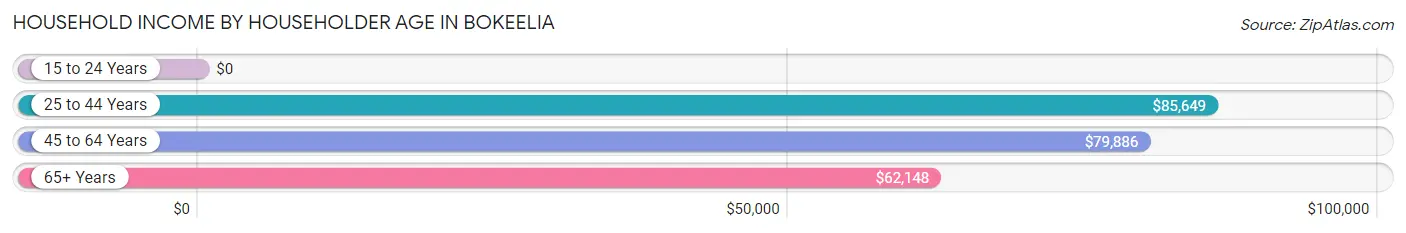
Household Income by Householder Age in Bokeelia
The median household income in Bokeelia is $66,691, with the highest median household income of $85,649 found in the 25 to 44 years age bracket for the primary householder. A total of 127 households (13.7%) fall into this category. Meanwhile, the 15 to 24 years age bracket for the primary householder has the lowest median household income of $0, with 26 households (2.8%) in this group.
| Income Bracket | # Households | Median Income |
| 15 to 24 Years | 26 (2.8%) | $0 |
| 25 to 44 Years | 127 (13.7%) | $85,649 |
| 45 to 64 Years | 277 (29.9%) | $79,886 |
| 65+ Years | 495 (53.5%) | $62,148 |
| Total | 925 (100.0%) | $66,691 |
Poverty in Bokeelia
Income Below Poverty by Sex and Age in Bokeelia
With 13.6% poverty level for males and 13.8% for females among the residents of Bokeelia, under 5 year old males and 25 to 34 year old females are the most vulnerable to poverty, with 126 males (75.0%) and 71 females (50.0%) in their respective age groups living below the poverty level.
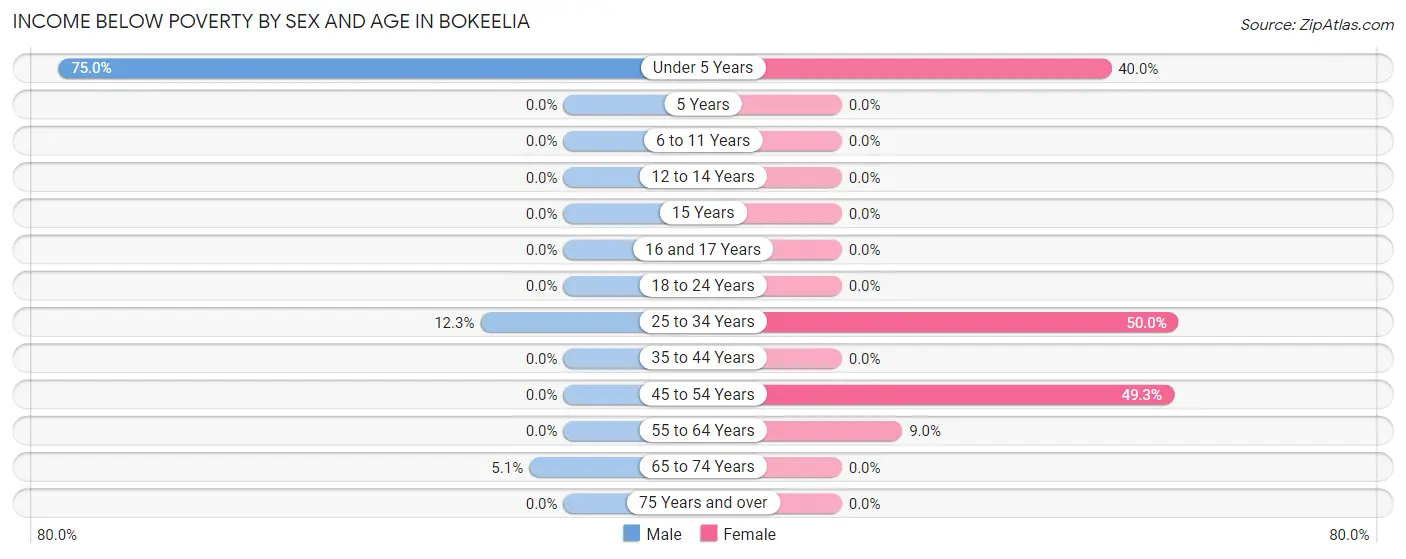
| Age Bracket | Male | Female |
| Under 5 Years | 126 (75.0%) | 24 (40.0%) |
| 5 Years | 0 (0.0%) | 0 (0.0%) |
| 6 to 11 Years | 0 (0.0%) | 0 (0.0%) |
| 12 to 14 Years | 0 (0.0%) | 0 (0.0%) |
| 15 Years | 0 (0.0%) | 0 (0.0%) |
| 16 and 17 Years | 0 (0.0%) | 0 (0.0%) |
| 18 to 24 Years | 0 (0.0%) | 0 (0.0%) |
| 25 to 34 Years | 19 (12.3%) | 71 (50.0%) |
| 35 to 44 Years | 0 (0.0%) | 0 (0.0%) |
| 45 to 54 Years | 0 (0.0%) | 35 (49.3%) |
| 55 to 64 Years | 0 (0.0%) | 20 (9.0%) |
| 65 to 74 Years | 10 (5.1%) | 0 (0.0%) |
| 75 Years and over | 0 (0.0%) | 0 (0.0%) |
| Total | 155 (13.6%) | 150 (13.8%) |
Income Above Poverty by Sex and Age in Bokeelia
According to the poverty statistics in Bokeelia, males aged 6 to 11 years and females aged 5 years are the age groups that are most secure financially, with 100.0% of males and 100.0% of females in these age groups living above the poverty line.
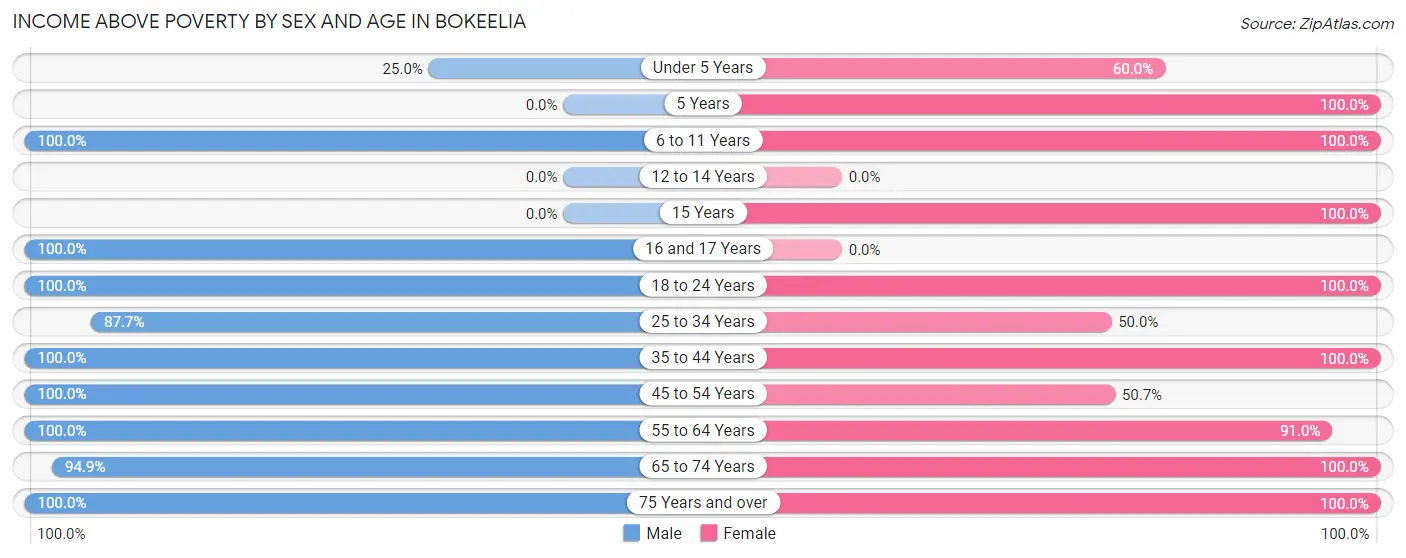
| Age Bracket | Male | Female |
| Under 5 Years | 42 (25.0%) | 36 (60.0%) |
| 5 Years | 0 (0.0%) | 19 (100.0%) |
| 6 to 11 Years | 62 (100.0%) | 29 (100.0%) |
| 12 to 14 Years | 0 (0.0%) | 0 (0.0%) |
| 15 Years | 0 (0.0%) | 19 (100.0%) |
| 16 and 17 Years | 8 (100.0%) | 0 (0.0%) |
| 18 to 24 Years | 55 (100.0%) | 45 (100.0%) |
| 25 to 34 Years | 135 (87.7%) | 71 (50.0%) |
| 35 to 44 Years | 9 (100.0%) | 29 (100.0%) |
| 45 to 54 Years | 41 (100.0%) | 36 (50.7%) |
| 55 to 64 Years | 187 (100.0%) | 203 (91.0%) |
| 65 to 74 Years | 186 (94.9%) | 240 (100.0%) |
| 75 Years and over | 264 (100.0%) | 209 (100.0%) |
| Total | 989 (86.5%) | 936 (86.2%) |
Income Below Poverty Among Married-Couple Families in Bokeelia
The poverty statistics for married-couple families in Bokeelia show that 4.2% or 24 of the total 570 families live below the poverty line. Families with 1 or 2 children have the highest poverty rate of 73.1%, comprising of 19 families. On the other hand, families with 3 or 4 children have the lowest poverty rate of 0.0%, which includes 0 families.
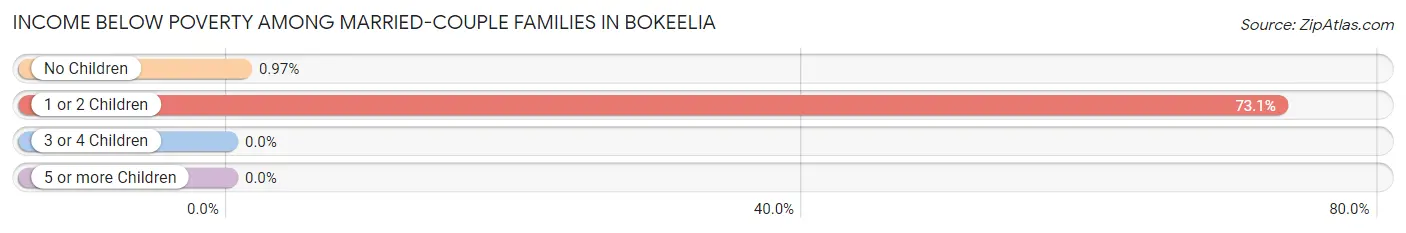
| Children | Above Poverty | Below Poverty |
| No Children | 513 (99.0%) | 5 (1.0%) |
| 1 or 2 Children | 7 (26.9%) | 19 (73.1%) |
| 3 or 4 Children | 9 (100.0%) | 0 (0.0%) |
| 5 or more Children | 17 (100.0%) | 0 (0.0%) |
| Total | 546 (95.8%) | 24 (4.2%) |
Income Below Poverty Among Single-Parent Households in Bokeelia
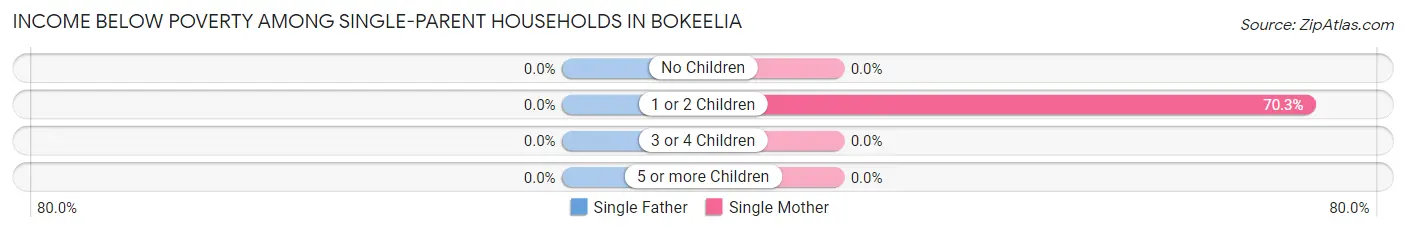
| Children | Single Father | Single Mother |
| No Children | 0 (0.0%) | 0 (0.0%) |
| 1 or 2 Children | 0 (0.0%) | 52 (70.3%) |
| 3 or 4 Children | 0 (0.0%) | 0 (0.0%) |
| 5 or more Children | 0 (0.0%) | 0 (0.0%) |
| Total | 0 (0.0%) | 52 (49.5%) |
Income Below Poverty Among Married-Couple vs Single-Parent Households in Bokeelia
The poverty data for Bokeelia shows that 24 of the married-couple family households (4.2%) and 52 of the single-parent households (46.0%) are living below the poverty level. Within the married-couple family households, those with 1 or 2 children have the highest poverty rate, with 19 households (73.1%) falling below the poverty line. Among the single-parent households, those with 1 or 2 children have the highest poverty rate, with 52 household (70.3%) living below poverty.
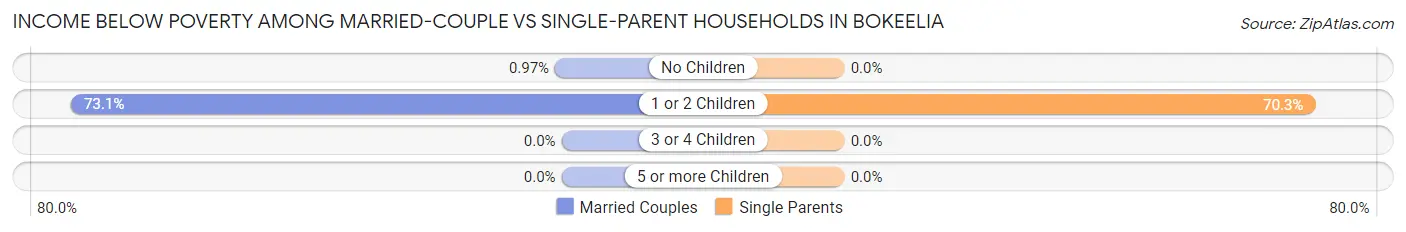
| Children | Married-Couple Families | Single-Parent Households |
| No Children | 5 (1.0%) | 0 (0.0%) |
| 1 or 2 Children | 19 (73.1%) | 52 (70.3%) |
| 3 or 4 Children | 0 (0.0%) | 0 (0.0%) |
| 5 or more Children | 0 (0.0%) | 0 (0.0%) |
| Total | 24 (4.2%) | 52 (46.0%) |
Race in Bokeelia
The most populous races in Bokeelia are White / Caucasian (1,792 | 80.4%), Hispanic or Latino (450 | 20.2%), and Two or more Races (328 | 14.7%).
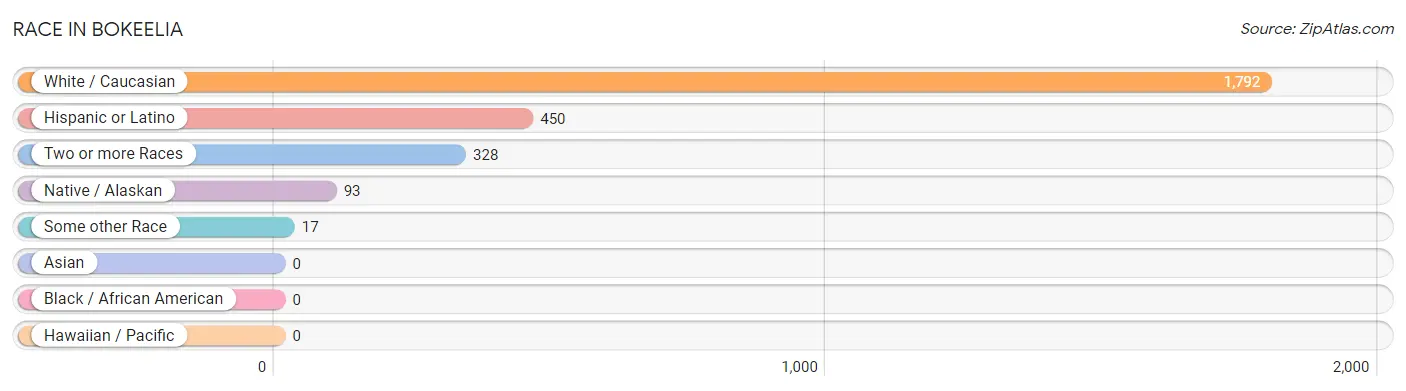
| Race | # Population | % Population |
| Asian | 0 | 0.0% |
| Black / African American | 0 | 0.0% |
| Hawaiian / Pacific | 0 | 0.0% |
| Hispanic or Latino | 450 | 20.2% |
| Native / Alaskan | 93 | 4.2% |
| White / Caucasian | 1,792 | 80.4% |
| Two or more Races | 328 | 14.7% |
| Some other Race | 17 | 0.8% |
| Total | 2,230 | 100.0% |
Ancestry in Bokeelia
The most populous ancestries reported in Bokeelia are American (398 | 17.8%), German (348 | 15.6%), Central American (275 | 12.3%), Guatemalan (275 | 12.3%), and English (214 | 9.6%), together accounting for 67.7% of all Bokeelia residents.
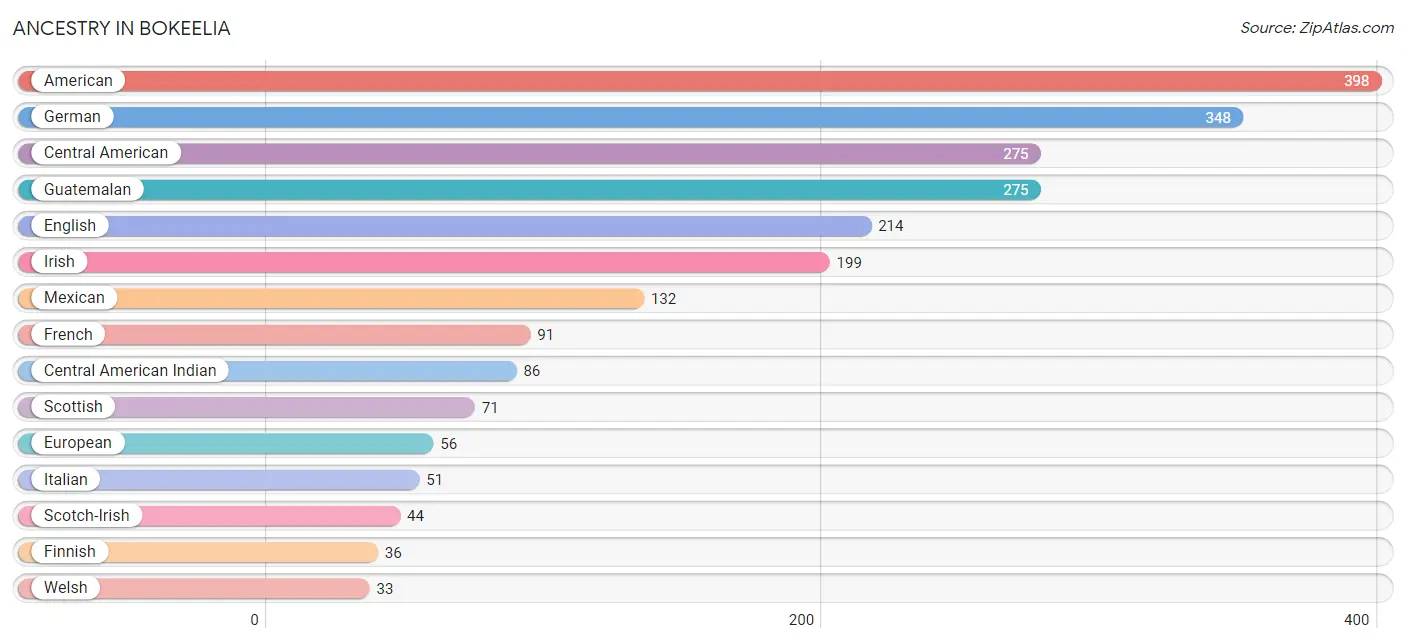
| Ancestry | # Population | % Population |
| American | 398 | 17.8% |
| Arab | 4 | 0.2% |
| British | 15 | 0.7% |
| Canadian | 6 | 0.3% |
| Central American | 275 | 12.3% |
| Central American Indian | 86 | 3.9% |
| Cherokee | 7 | 0.3% |
| Czech | 6 | 0.3% |
| Dutch | 7 | 0.3% |
| Egyptian | 4 | 0.2% |
| English | 214 | 9.6% |
| European | 56 | 2.5% |
| Finnish | 36 | 1.6% |
| French | 91 | 4.1% |
| French Canadian | 6 | 0.3% |
| German | 348 | 15.6% |
| Greek | 6 | 0.3% |
| Guatemalan | 275 | 12.3% |
| Irish | 199 | 8.9% |
| Italian | 51 | 2.3% |
| Lithuanian | 7 | 0.3% |
| Mexican | 132 | 5.9% |
| Norwegian | 25 | 1.1% |
| Polish | 15 | 0.7% |
| Puerto Rican | 17 | 0.8% |
| Scotch-Irish | 44 | 2.0% |
| Scottish | 71 | 3.2% |
| Spaniard | 26 | 1.2% |
| Swedish | 17 | 0.8% |
| Swiss | 28 | 1.3% |
| Welsh | 33 | 1.5% | View All 31 Rows |
Immigrants in Bokeelia
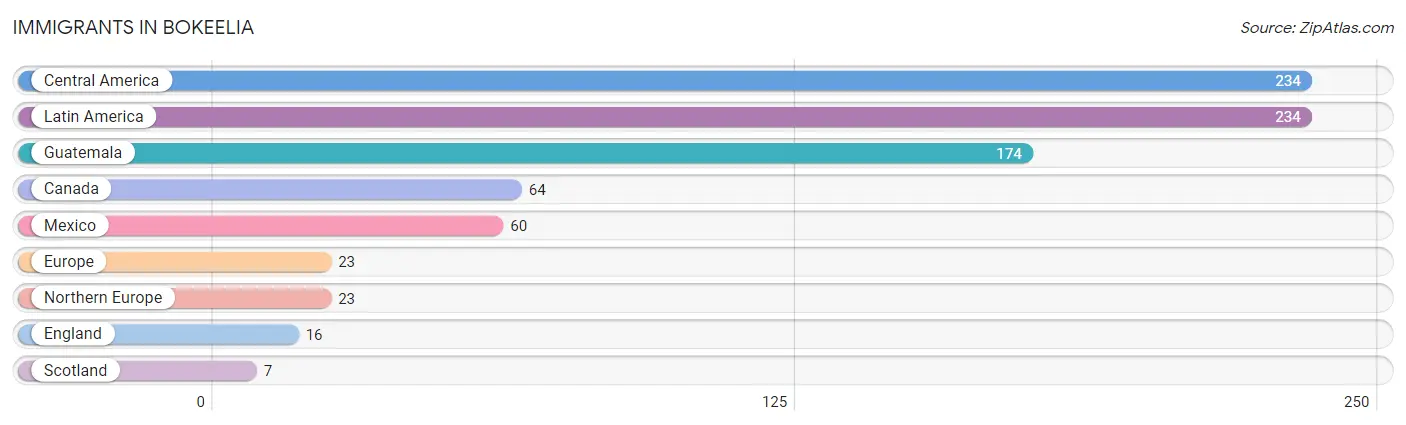
The most numerous immigrant groups reported in Bokeelia came from Central America (234 | 10.5%), Latin America (234 | 10.5%), Guatemala (174 | 7.8%), Canada (64 | 2.9%), and Mexico (60 | 2.7%), together accounting for 34.3% of all Bokeelia residents.
| Immigration Origin | # Population | % Population |
| Canada | 64 | 2.9% |
| Central America | 234 | 10.5% |
| England | 16 | 0.7% |
| Europe | 23 | 1.0% |
| Guatemala | 174 | 7.8% |
| Latin America | 234 | 10.5% |
| Mexico | 60 | 2.7% |
| Northern Europe | 23 | 1.0% |
| Scotland | 7 | 0.3% | View All 9 Rows |
Sex and Age in Bokeelia
Sex and Age in Bokeelia
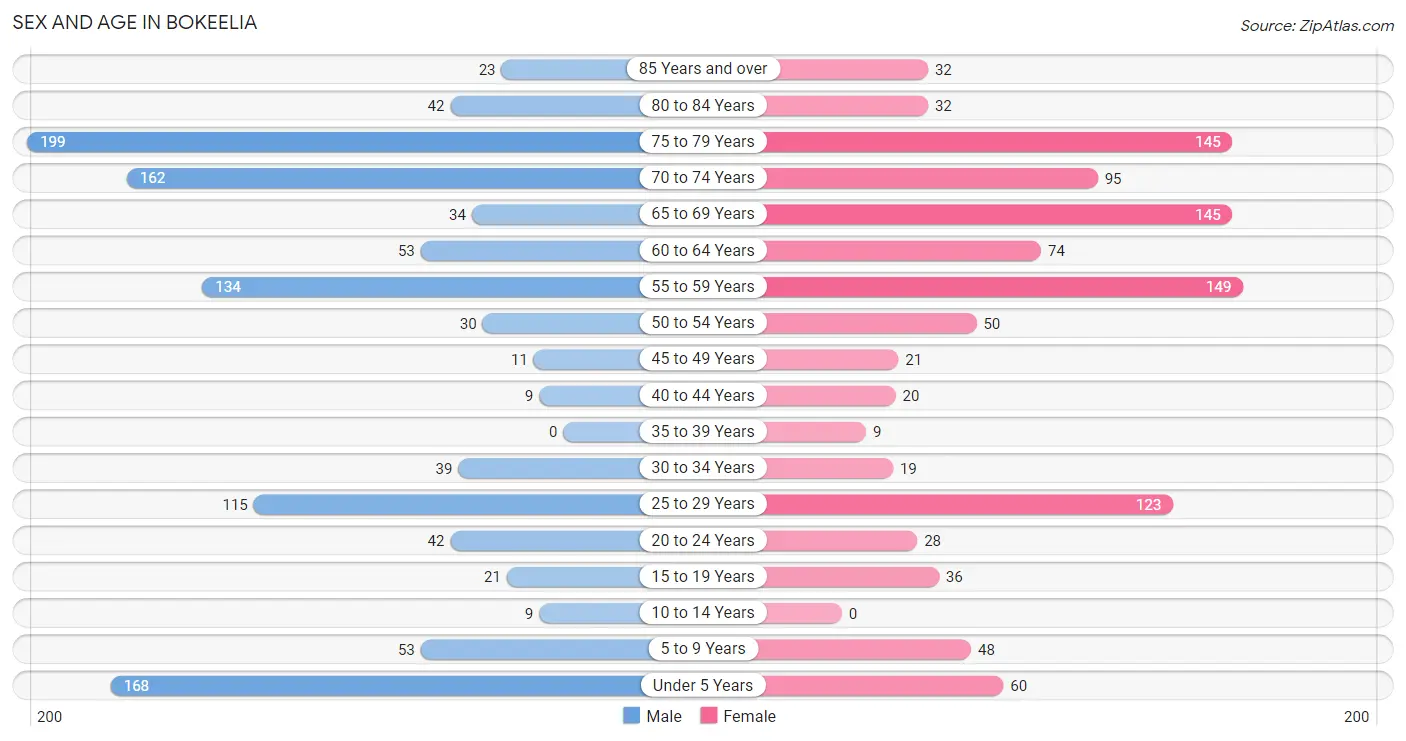
The most populous age groups in Bokeelia are 75 to 79 Years (199 | 17.4%) for men and 55 to 59 Years (149 | 13.7%) for women.
| Age Bracket | Male | Female |
| Under 5 Years | 168 (14.7%) | 60 (5.5%) |
| 5 to 9 Years | 53 (4.6%) | 48 (4.4%) |
| 10 to 14 Years | 9 (0.8%) | 0 (0.0%) |
| 15 to 19 Years | 21 (1.8%) | 36 (3.3%) |
| 20 to 24 Years | 42 (3.7%) | 28 (2.6%) |
| 25 to 29 Years | 115 (10.1%) | 123 (11.3%) |
| 30 to 34 Years | 39 (3.4%) | 19 (1.8%) |
| 35 to 39 Years | 0 (0.0%) | 9 (0.8%) |
| 40 to 44 Years | 9 (0.8%) | 20 (1.8%) |
| 45 to 49 Years | 11 (1.0%) | 21 (1.9%) |
| 50 to 54 Years | 30 (2.6%) | 50 (4.6%) |
| 55 to 59 Years | 134 (11.7%) | 149 (13.7%) |
| 60 to 64 Years | 53 (4.6%) | 74 (6.8%) |
| 65 to 69 Years | 34 (3.0%) | 145 (13.4%) |
| 70 to 74 Years | 162 (14.2%) | 95 (8.7%) |
| 75 to 79 Years | 199 (17.4%) | 145 (13.4%) |
| 80 to 84 Years | 42 (3.7%) | 32 (2.9%) |
| 85 Years and over | 23 (2.0%) | 32 (2.9%) |
| Total | 1,144 (100.0%) | 1,086 (100.0%) |
Families and Households in Bokeelia
Median Family Size in Bokeelia
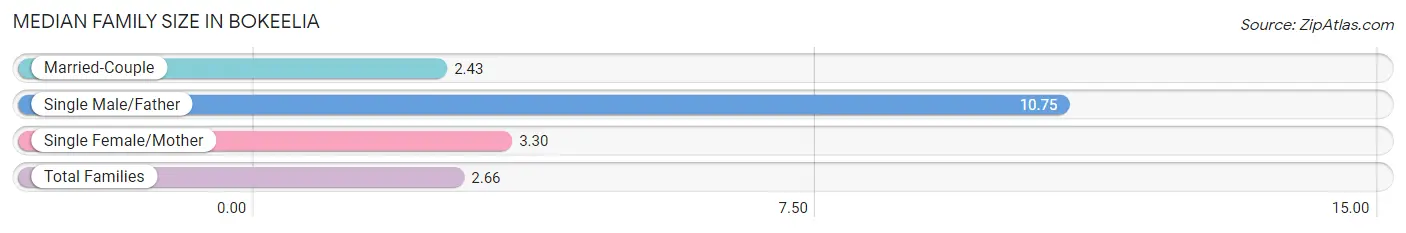
The median family size in Bokeelia is 2.66 persons per family, with single male/father families (8 | 1.2%) accounting for the largest median family size of 10.75 persons per family. On the other hand, married-couple families (570 | 83.5%) represent the smallest median family size with 2.43 persons per family.
| Family Type | # Families | Family Size |
| Married-Couple | 570 (83.5%) | 2.43 |
| Single Male/Father | 8 (1.2%) | 10.75 |
| Single Female/Mother | 105 (15.4%) | 3.30 |
| Total Families | 683 (100.0%) | 2.66 |
Median Household Size in Bokeelia
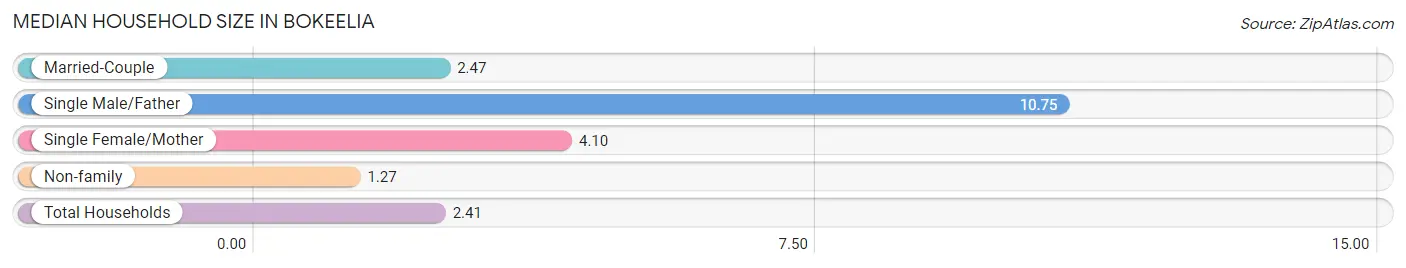
The median household size in Bokeelia is 2.41 persons per household, with single male/father households (8 | 0.9%) accounting for the largest median household size of 10.75 persons per household. non-family households (242 | 26.2%) represent the smallest median household size with 1.27 persons per household.
| Household Type | # Households | Household Size |
| Married-Couple | 570 (61.6%) | 2.47 |
| Single Male/Father | 8 (0.9%) | 10.75 |
| Single Female/Mother | 105 (11.4%) | 4.10 |
| Non-family | 242 (26.2%) | 1.27 |
| Total Households | 925 (100.0%) | 2.41 |
Household Size by Marriage Status in Bokeelia
Out of a total of 925 households in Bokeelia, 683 (73.8%) are family households, while 242 (26.2%) are nonfamily households. The most numerous type of family households are 2-person households, comprising 518, and the most common type of nonfamily households are 1-person households, comprising 188.
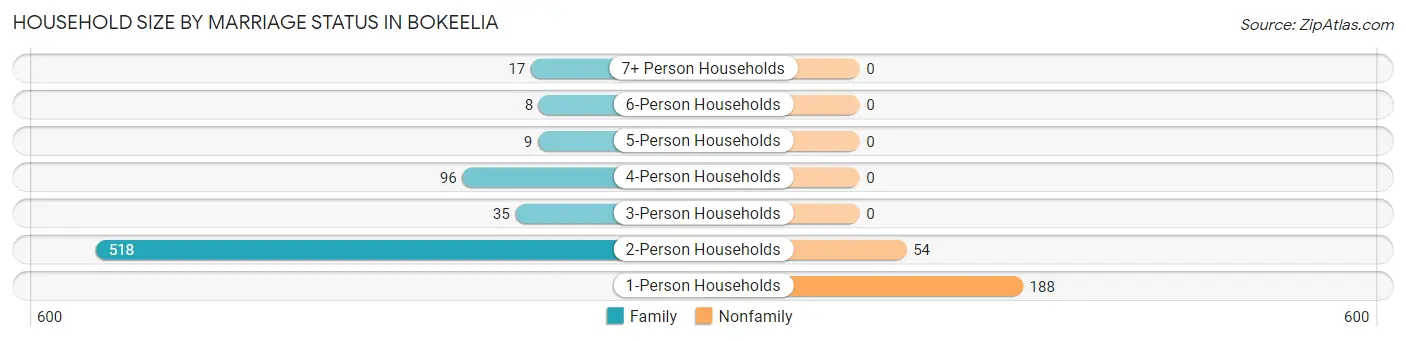
| Household Size | Family Households | Nonfamily Households |
| 1-Person Households | - | 188 (20.3%) |
| 2-Person Households | 518 (56.0%) | 54 (5.8%) |
| 3-Person Households | 35 (3.8%) | 0 (0.0%) |
| 4-Person Households | 96 (10.4%) | 0 (0.0%) |
| 5-Person Households | 9 (1.0%) | 0 (0.0%) |
| 6-Person Households | 8 (0.9%) | 0 (0.0%) |
| 7+ Person Households | 17 (1.8%) | 0 (0.0%) |
| Total | 683 (73.8%) | 242 (26.2%) |
Female Fertility in Bokeelia
Fertility by Age in Bokeelia
| Age Bracket | Women with Births | Births / 1,000 Women |
| 15 to 19 years | 0 (0.0%) | 0.0 |
| 20 to 34 years | 0 (0.0%) | 0.0 |
| 35 to 50 years | 0 (0.0%) | 0.0 |
| Total | 0 (0.0%) | 0.0 |
Fertility by Age by Marriage Status in Bokeelia
| Age Bracket | Married | Unmarried |
| 15 to 19 years | 0 (0.0%) | 0 (0.0%) |
| 20 to 34 years | 0 (0.0%) | 0 (0.0%) |
| 35 to 50 years | 0 (0.0%) | 0 (0.0%) |
| Total | 0 (0.0%) | 0 (0.0%) |
Fertility by Education in Bokeelia
| Educational Attainment | Women with Births | Births / 1,000 Women |
| Less than High School | 0 (0.0%) | 0.0 |
| High School Diploma | 0 (0.0%) | 0.0 |
| College or Associate's Degree | 0 (0.0%) | 0.0 |
| Bachelor's Degree | 0 (0.0%) | 0.0 |
| Graduate Degree | 0 (0.0%) | 0.0 |
| Total | 0 (0.0%) | 0.0 |
Fertility by Education by Marriage Status in Bokeelia
| Educational Attainment | Married | Unmarried |
| Less than High School | 0 (0.0%) | 0 (0.0%) |
| High School Diploma | 0 (0.0%) | 0 (0.0%) |
| College or Associate's Degree | 0 (0.0%) | 0 (0.0%) |
| Bachelor's Degree | 0 (0.0%) | 0 (0.0%) |
| Graduate Degree | 0 (0.0%) | 0 (0.0%) |
| Total | 0 (0.0%) | 0 (0.0%) |
Employment Characteristics in Bokeelia
Employment by Class of Employer in Bokeelia
Among the 573 employed individuals in Bokeelia, private company employees (401 | 70.0%), self-employed (incorporated) (95 | 16.6%), and not-for-profit organizations (25 | 4.4%) make up the most common classes of employment.
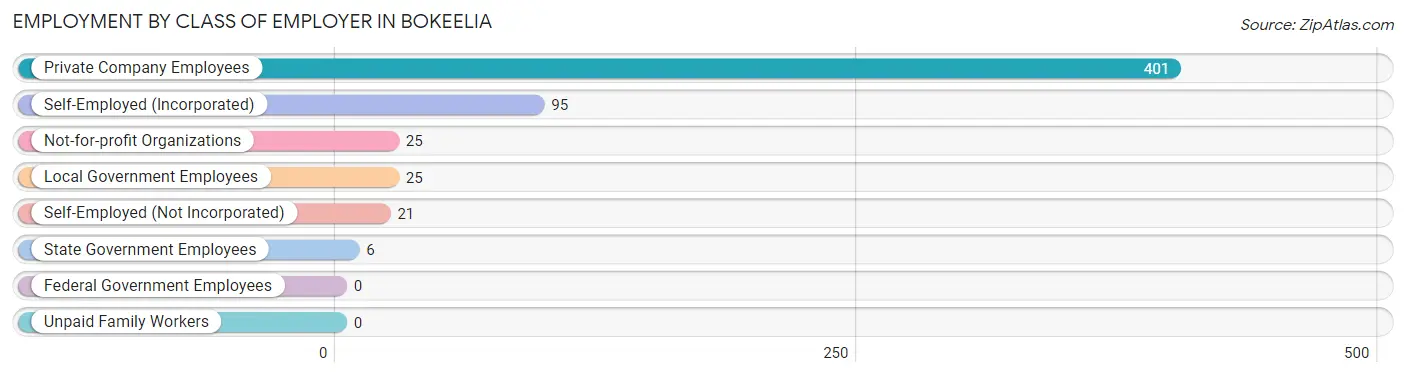
| Employer Class | # Employees | % Employees |
| Private Company Employees | 401 | 70.0% |
| Self-Employed (Incorporated) | 95 | 16.6% |
| Self-Employed (Not Incorporated) | 21 | 3.7% |
| Not-for-profit Organizations | 25 | 4.4% |
| Local Government Employees | 25 | 4.4% |
| State Government Employees | 6 | 1.1% |
| Federal Government Employees | 0 | 0.0% |
| Unpaid Family Workers | 0 | 0.0% |
| Total | 573 | 100.0% |
Employment Status by Age in Bokeelia
According to the labor force statistics for Bokeelia, out of the total population over 16 years of age (1,873), 35.4% or 663 individuals are in the labor force, with 6.2% or 41 of them unemployed. The age group with the highest labor force participation rate is 20 to 24 years, with 84.3% or 59 individuals in the labor force. Within the labor force, the 16 to 19 years age range has the highest percentage of unemployed individuals, with 56.7% or 17 of them being unemployed.
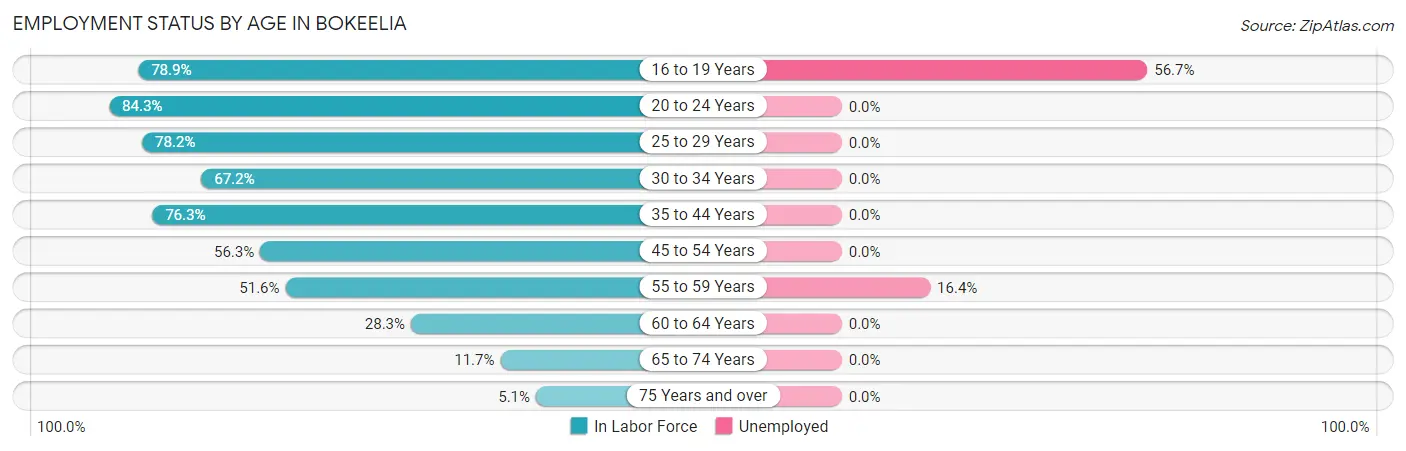
| Age Bracket | In Labor Force | Unemployed |
| 16 to 19 Years | 30 (78.9%) | 17 (56.7%) |
| 20 to 24 Years | 59 (84.3%) | 0 (0.0%) |
| 25 to 29 Years | 186 (78.2%) | 0 (0.0%) |
| 30 to 34 Years | 39 (67.2%) | 0 (0.0%) |
| 35 to 44 Years | 29 (76.3%) | 0 (0.0%) |
| 45 to 54 Years | 63 (56.3%) | 0 (0.0%) |
| 55 to 59 Years | 146 (51.6%) | 24 (16.4%) |
| 60 to 64 Years | 36 (28.3%) | 0 (0.0%) |
| 65 to 74 Years | 51 (11.7%) | 0 (0.0%) |
| 75 Years and over | 24 (5.1%) | 0 (0.0%) |
| Total | 663 (35.4%) | 41 (6.2%) |
Employment Status by Educational Attainment in Bokeelia
According to labor force statistics for Bokeelia, 58.3% of individuals (499) out of the total population between 25 and 64 years of age (856) are in the labor force, with 4.8% or 24 of them being unemployed. The group with the highest labor force participation rate are those with the educational attainment of less than high school, with 78.3% or 159 individuals in the labor force. Within the labor force, individuals with college / associate degree education have the highest percentage of unemployment, with 42.9% or 15 of them being unemployed.
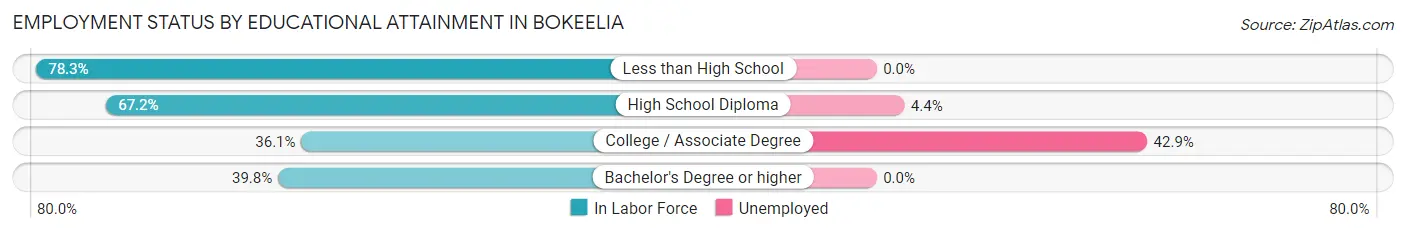
| Educational Attainment | In Labor Force | Unemployed |
| Less than High School | 159 (78.3%) | 0 (0.0%) |
| High School Diploma | 205 (67.2%) | 13 (4.4%) |
| College / Associate Degree | 35 (36.1%) | 42 (42.9%) |
| Bachelor's Degree or higher | 100 (39.8%) | 0 (0.0%) |
| Total | 499 (58.3%) | 41 (4.8%) |
Employment Occupations by Sex in Bokeelia
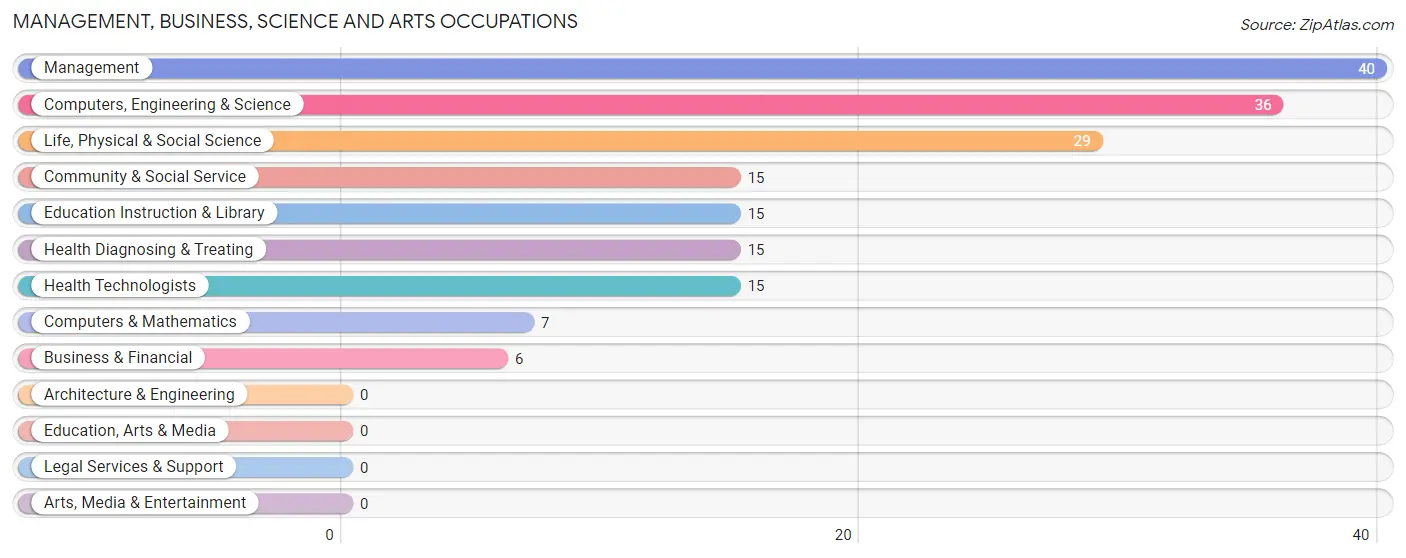
Management, Business, Science and Arts Occupations
The most common Management, Business, Science and Arts occupations in Bokeelia are Management (40 | 6.4%), Computers, Engineering & Science (36 | 5.8%), Life, Physical & Social Science (29 | 4.7%), Community & Social Service (15 | 2.4%), and Education Instruction & Library (15 | 2.4%).
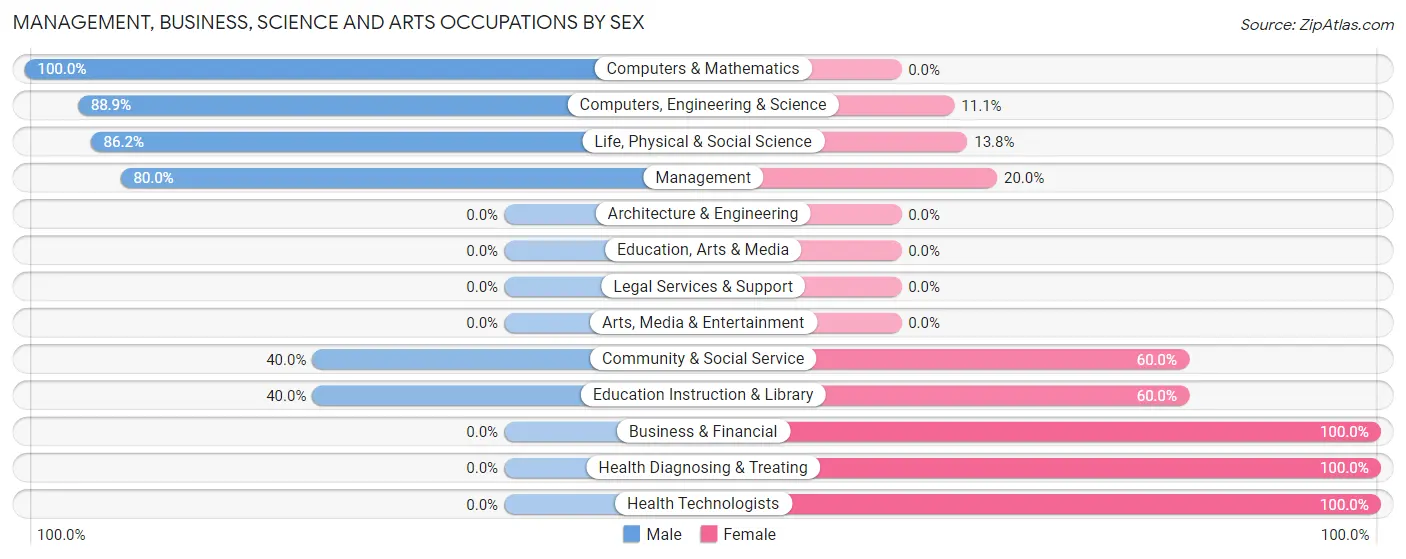
Management, Business, Science and Arts Occupations by Sex
Within the Management, Business, Science and Arts occupations in Bokeelia, the most male-oriented occupations are Computers & Mathematics (100.0%), Computers, Engineering & Science (88.9%), and Life, Physical & Social Science (86.2%), while the most female-oriented occupations are Business & Financial (100.0%), Health Diagnosing & Treating (100.0%), and Health Technologists (100.0%).
| Occupation | Male | Female |
| Management | 32 (80.0%) | 8 (20.0%) |
| Business & Financial | 0 (0.0%) | 6 (100.0%) |
| Computers, Engineering & Science | 32 (88.9%) | 4 (11.1%) |
| Computers & Mathematics | 7 (100.0%) | 0 (0.0%) |
| Architecture & Engineering | 0 (0.0%) | 0 (0.0%) |
| Life, Physical & Social Science | 25 (86.2%) | 4 (13.8%) |
| Community & Social Service | 6 (40.0%) | 9 (60.0%) |
| Education, Arts & Media | 0 (0.0%) | 0 (0.0%) |
| Legal Services & Support | 0 (0.0%) | 0 (0.0%) |
| Education Instruction & Library | 6 (40.0%) | 9 (60.0%) |
| Arts, Media & Entertainment | 0 (0.0%) | 0 (0.0%) |
| Health Diagnosing & Treating | 0 (0.0%) | 15 (100.0%) |
| Health Technologists | 0 (0.0%) | 15 (100.0%) |
| Total (Category) | 70 (62.5%) | 42 (37.5%) |
| Total (Overall) | 378 (60.8%) | 244 (39.2%) |
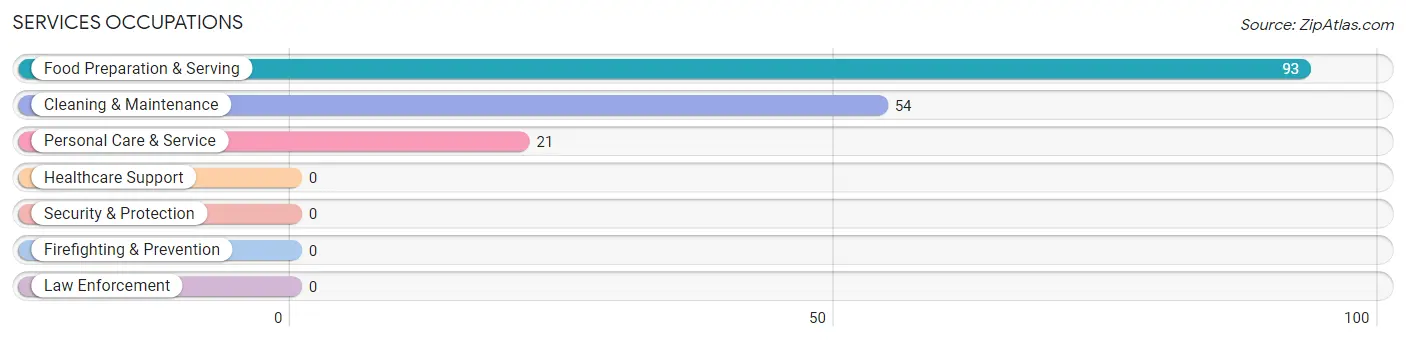
Services Occupations
The most common Services occupations in Bokeelia are Food Preparation & Serving (93 | 14.9%), Cleaning & Maintenance (54 | 8.7%), and Personal Care & Service (21 | 3.4%).
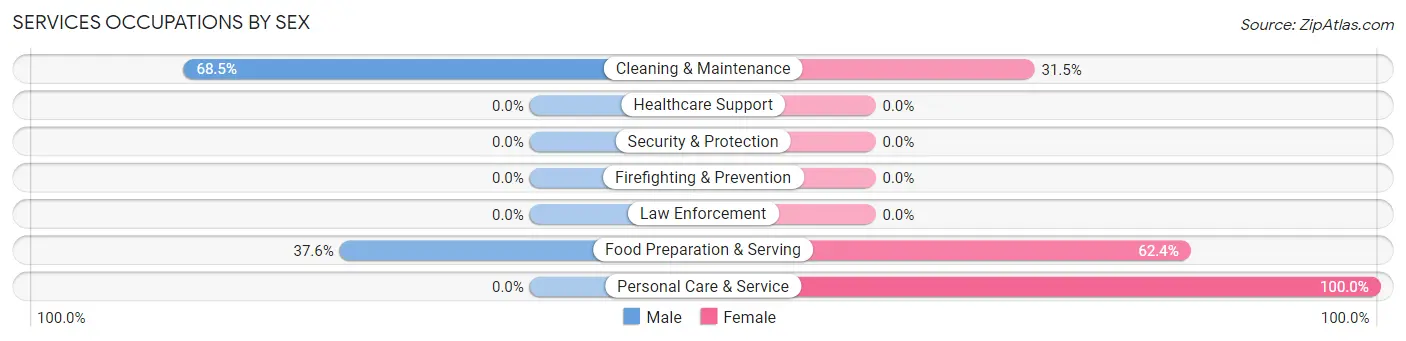
Services Occupations by Sex
Within the Services occupations in Bokeelia, the most male-oriented occupations are Cleaning & Maintenance (68.5%), and Food Preparation & Serving (37.6%), while the most female-oriented occupations are Personal Care & Service (100.0%), Food Preparation & Serving (62.4%), and Cleaning & Maintenance (31.5%).
| Occupation | Male | Female |
| Healthcare Support | 0 (0.0%) | 0 (0.0%) |
| Security & Protection | 0 (0.0%) | 0 (0.0%) |
| Firefighting & Prevention | 0 (0.0%) | 0 (0.0%) |
| Law Enforcement | 0 (0.0%) | 0 (0.0%) |
| Food Preparation & Serving | 35 (37.6%) | 58 (62.4%) |
| Cleaning & Maintenance | 37 (68.5%) | 17 (31.5%) |
| Personal Care & Service | 0 (0.0%) | 21 (100.0%) |
| Total (Category) | 72 (42.9%) | 96 (57.1%) |
| Total (Overall) | 378 (60.8%) | 244 (39.2%) |
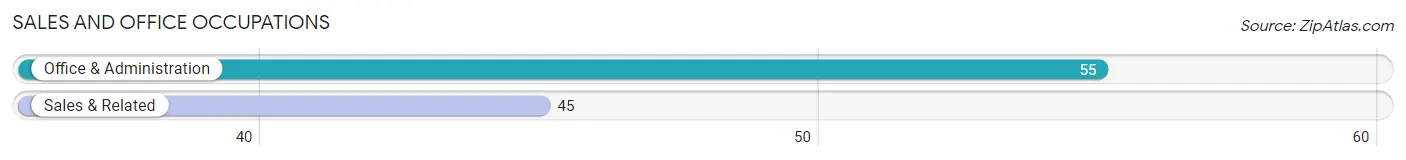
Sales and Office Occupations
The most common Sales and Office occupations in Bokeelia are Office & Administration (55 | 8.8%), and Sales & Related (45 | 7.2%).
Sales and Office Occupations by Sex
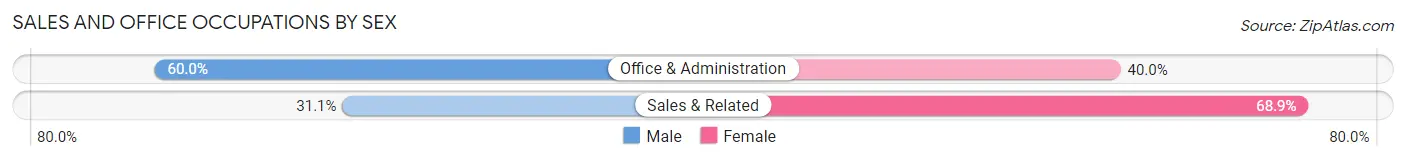
| Occupation | Male | Female |
| Sales & Related | 14 (31.1%) | 31 (68.9%) |
| Office & Administration | 33 (60.0%) | 22 (40.0%) |
| Total (Category) | 47 (47.0%) | 53 (53.0%) |
| Total (Overall) | 378 (60.8%) | 244 (39.2%) |
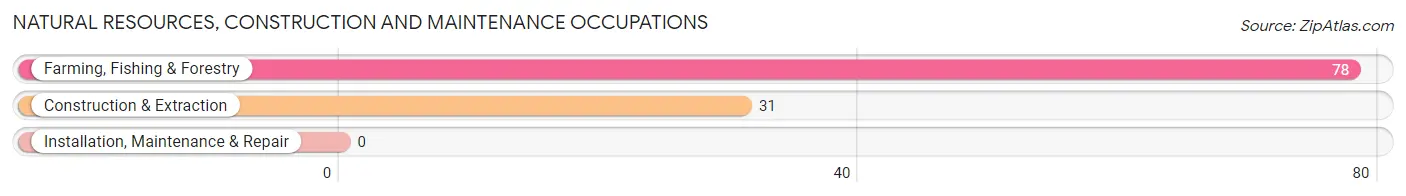
Natural Resources, Construction and Maintenance Occupations
The most common Natural Resources, Construction and Maintenance occupations in Bokeelia are Farming, Fishing & Forestry (78 | 12.5%), and Construction & Extraction (31 | 5.0%).
Natural Resources, Construction and Maintenance Occupations by Sex
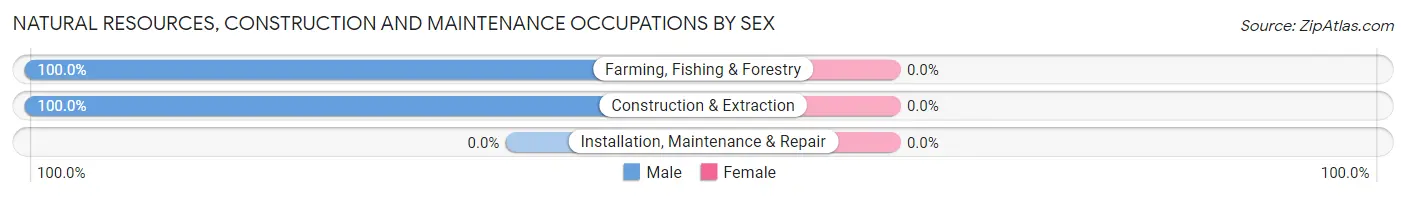
| Occupation | Male | Female |
| Farming, Fishing & Forestry | 78 (100.0%) | 0 (0.0%) |
| Construction & Extraction | 31 (100.0%) | 0 (0.0%) |
| Installation, Maintenance & Repair | 0 (0.0%) | 0 (0.0%) |
| Total (Category) | 109 (100.0%) | 0 (0.0%) |
| Total (Overall) | 378 (60.8%) | 244 (39.2%) |
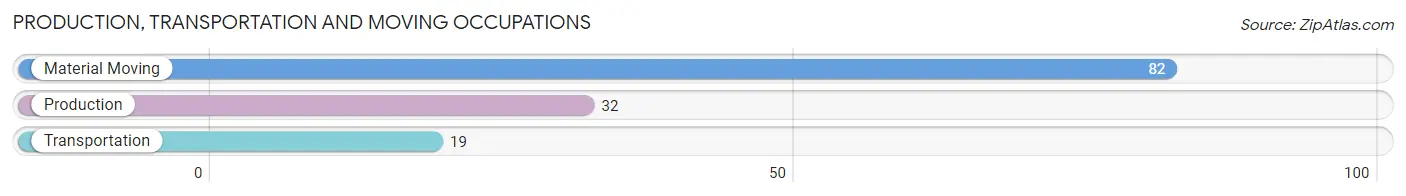
Production, Transportation and Moving Occupations
The most common Production, Transportation and Moving occupations in Bokeelia are Material Moving (82 | 13.2%), Production (32 | 5.1%), and Transportation (19 | 3.0%).
Production, Transportation and Moving Occupations by Sex
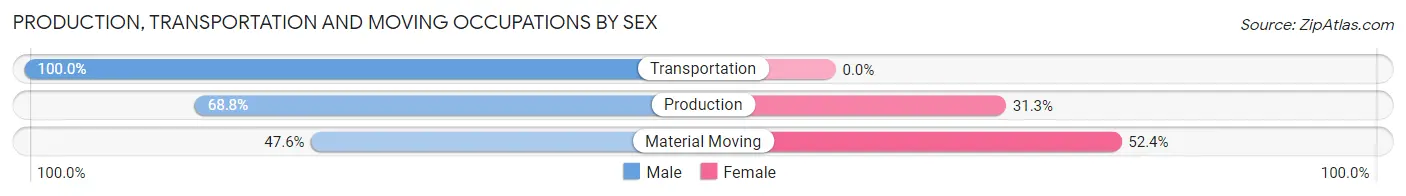
| Occupation | Male | Female |
| Production | 22 (68.8%) | 10 (31.2%) |
| Transportation | 19 (100.0%) | 0 (0.0%) |
| Material Moving | 39 (47.6%) | 43 (52.4%) |
| Total (Category) | 80 (60.2%) | 53 (39.9%) |
| Total (Overall) | 378 (60.8%) | 244 (39.2%) |
Employment Industries by Sex in Bokeelia
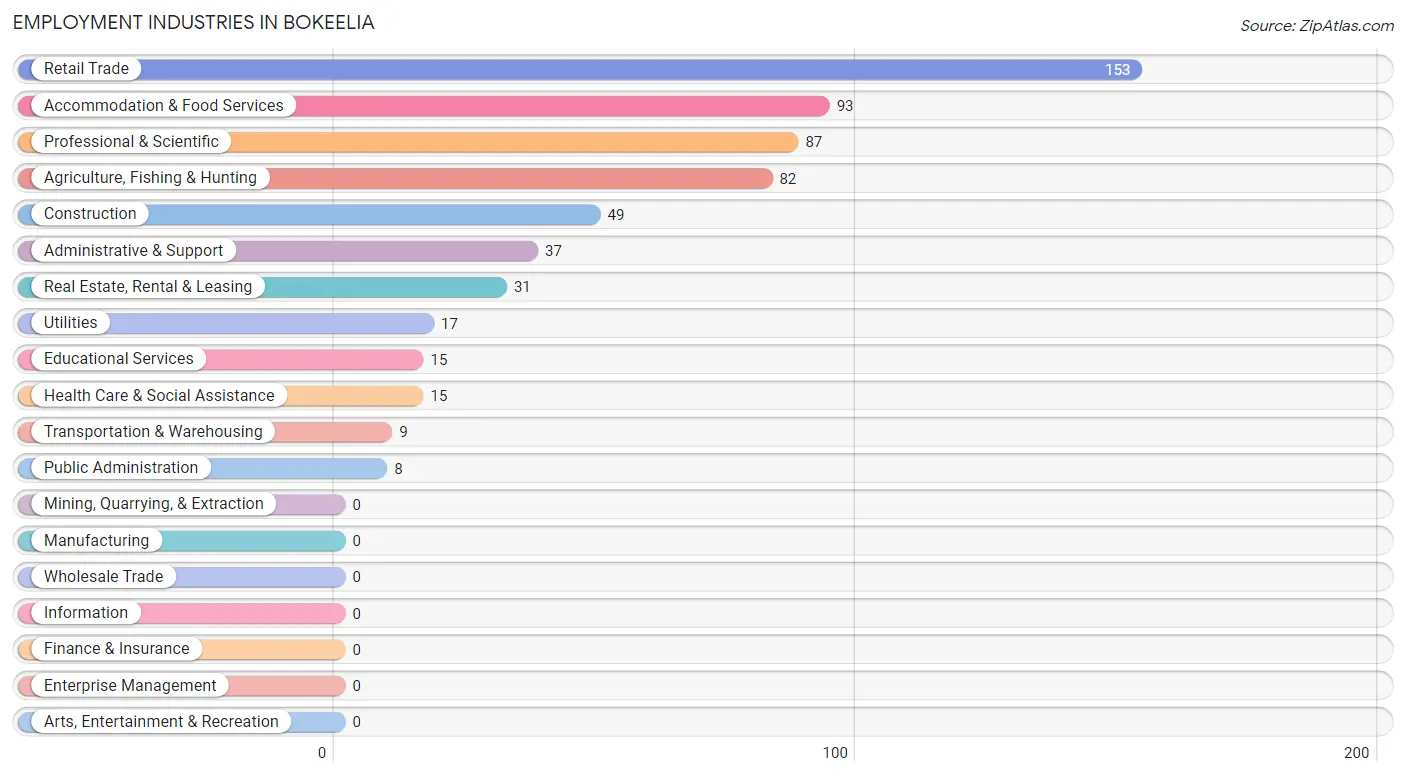
Employment Industries in Bokeelia
The major employment industries in Bokeelia include Retail Trade (153 | 24.6%), Accommodation & Food Services (93 | 14.9%), Professional & Scientific (87 | 14.0%), Agriculture, Fishing & Hunting (82 | 13.2%), and Construction (49 | 7.9%).
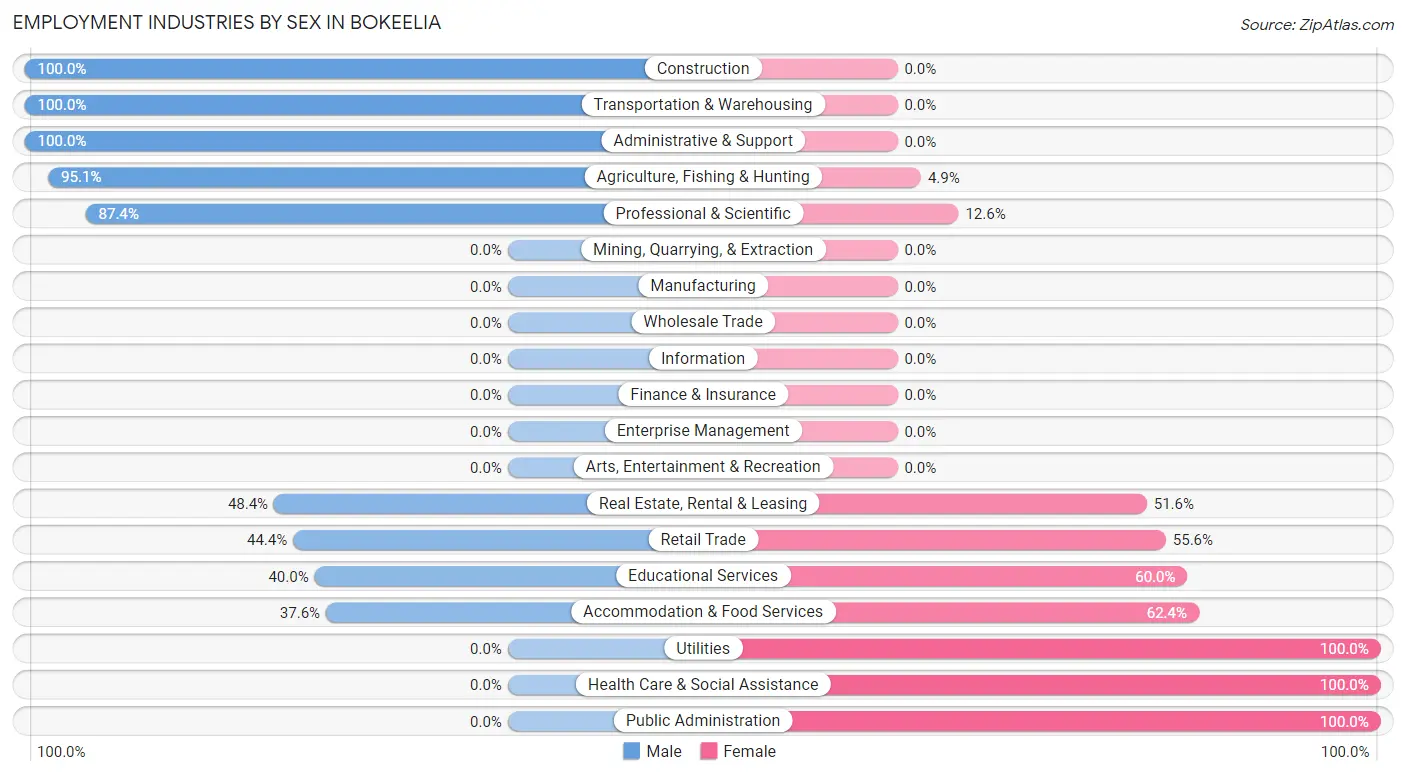
Employment Industries by Sex in Bokeelia
The Bokeelia industries that see more men than women are Construction (100.0%), Transportation & Warehousing (100.0%), and Administrative & Support (100.0%), whereas the industries that tend to have a higher number of women are Utilities (100.0%), Health Care & Social Assistance (100.0%), and Public Administration (100.0%).
| Industry | Male | Female |
| Agriculture, Fishing & Hunting | 78 (95.1%) | 4 (4.9%) |
| Mining, Quarrying, & Extraction | 0 (0.0%) | 0 (0.0%) |
| Construction | 49 (100.0%) | 0 (0.0%) |
| Manufacturing | 0 (0.0%) | 0 (0.0%) |
| Wholesale Trade | 0 (0.0%) | 0 (0.0%) |
| Retail Trade | 68 (44.4%) | 85 (55.6%) |
| Transportation & Warehousing | 9 (100.0%) | 0 (0.0%) |
| Utilities | 0 (0.0%) | 17 (100.0%) |
| Information | 0 (0.0%) | 0 (0.0%) |
| Finance & Insurance | 0 (0.0%) | 0 (0.0%) |
| Real Estate, Rental & Leasing | 15 (48.4%) | 16 (51.6%) |
| Professional & Scientific | 76 (87.4%) | 11 (12.6%) |
| Enterprise Management | 0 (0.0%) | 0 (0.0%) |
| Administrative & Support | 37 (100.0%) | 0 (0.0%) |
| Educational Services | 6 (40.0%) | 9 (60.0%) |
| Health Care & Social Assistance | 0 (0.0%) | 15 (100.0%) |
| Arts, Entertainment & Recreation | 0 (0.0%) | 0 (0.0%) |
| Accommodation & Food Services | 35 (37.6%) | 58 (62.4%) |
| Public Administration | 0 (0.0%) | 8 (100.0%) |
| Total | 378 (60.8%) | 244 (39.2%) |
Education in Bokeelia
School Enrollment in Bokeelia
The most common levels of schooling among the 230 students in Bokeelia are elementary school (71 | 30.9%), nursery / preschool (63 | 27.4%), and kindergarten (39 | 17.0%).
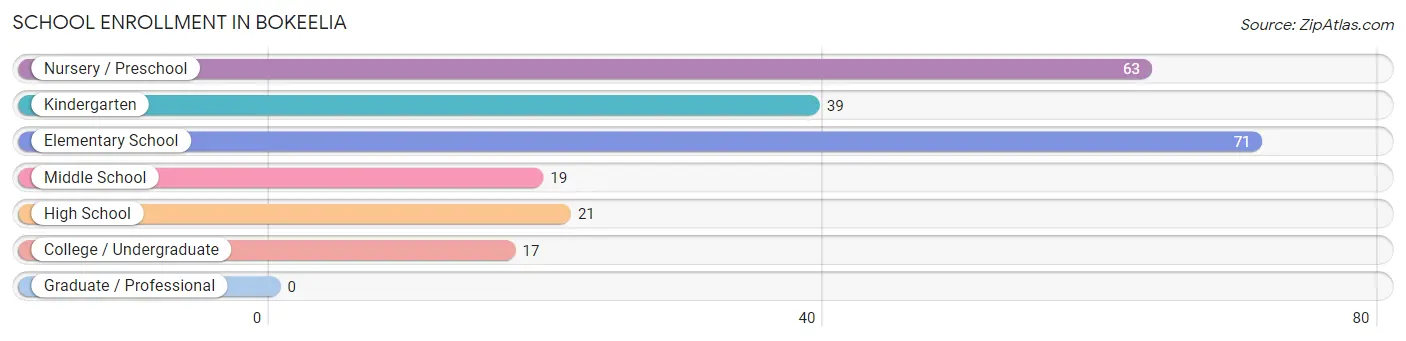
| School Level | # Students | % Students |
| Nursery / Preschool | 63 | 27.4% |
| Kindergarten | 39 | 17.0% |
| Elementary School | 71 | 30.9% |
| Middle School | 19 | 8.3% |
| High School | 21 | 9.1% |
| College / Undergraduate | 17 | 7.4% |
| Graduate / Professional | 0 | 0.0% |
| Total | 230 | 100.0% |
School Enrollment by Age by Funding Source in Bokeelia
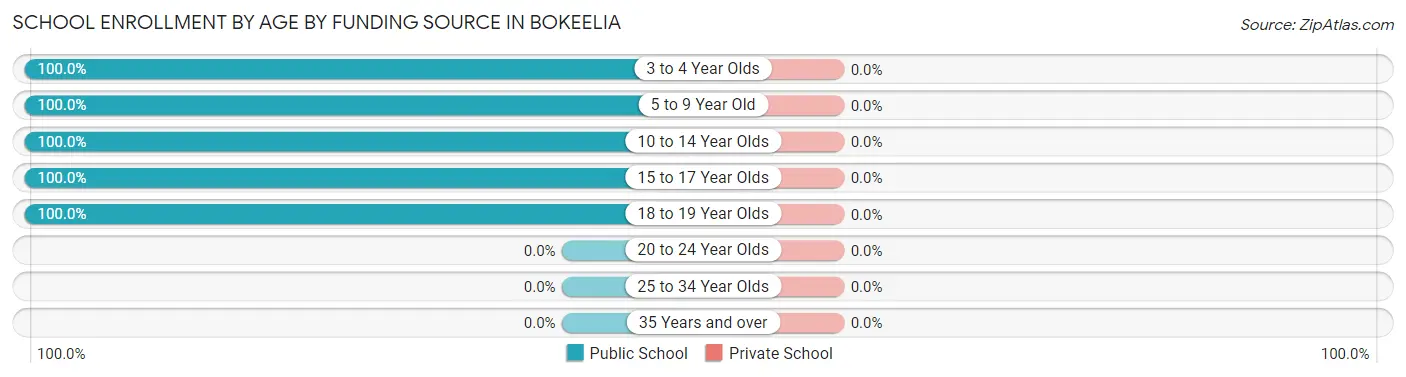
| Age Bracket | Public School | Private School |
| 3 to 4 Year Olds | 63 (100.0%) | 0 (0.0%) |
| 5 to 9 Year Old | 101 (100.0%) | 0 (0.0%) |
| 10 to 14 Year Olds | 9 (100.0%) | 0 (0.0%) |
| 15 to 17 Year Olds | 27 (100.0%) | 0 (0.0%) |
| 18 to 19 Year Olds | 30 (100.0%) | 0 (0.0%) |
| 20 to 24 Year Olds | 0 (0.0%) | 0 (0.0%) |
| 25 to 34 Year Olds | 0 (0.0%) | 0 (0.0%) |
| 35 Years and over | 0 (0.0%) | 0 (0.0%) |
| Total | 230 (100.0%) | 0 (0.0%) |
Educational Attainment by Field of Study in Bokeelia
Business (259 | 39.4%), science & technology (97 | 14.8%), social sciences (59 | 9.0%), education (59 | 9.0%), and literature & languages (57 | 8.7%) are the most common fields of study among 657 individuals in Bokeelia who have obtained a bachelor's degree or higher.
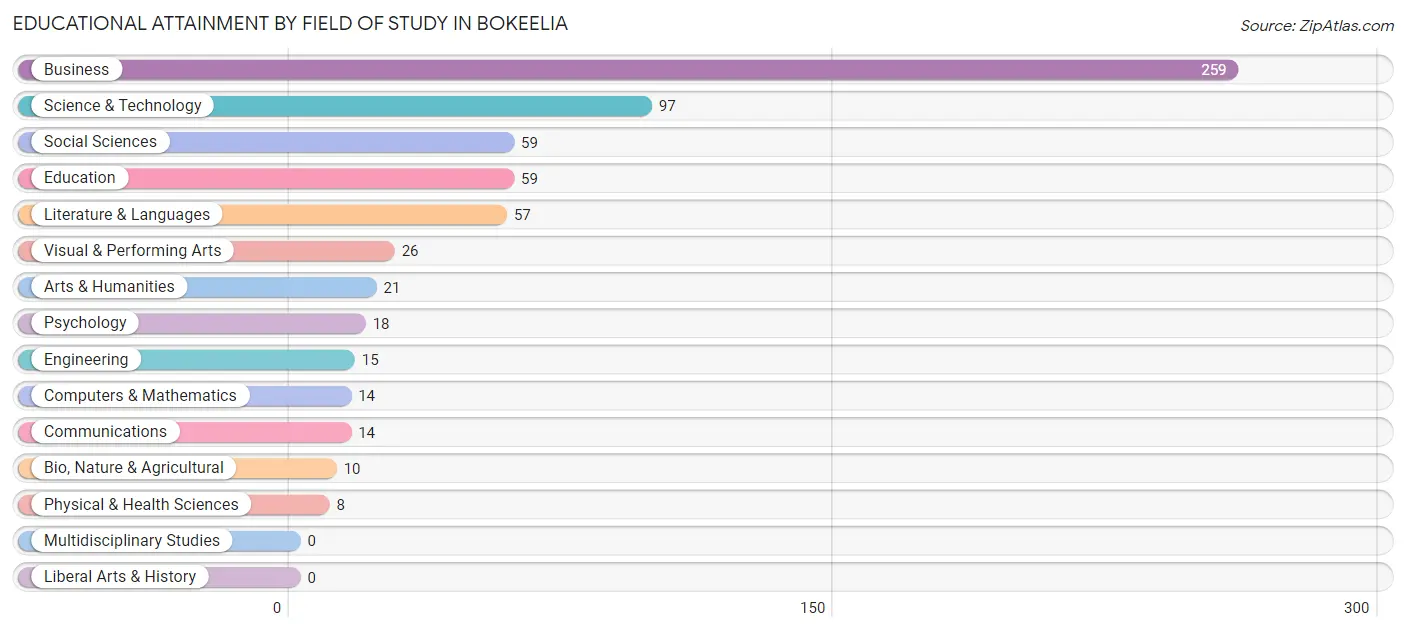
| Field of Study | # Graduates | % Graduates |
| Computers & Mathematics | 14 | 2.1% |
| Bio, Nature & Agricultural | 10 | 1.5% |
| Physical & Health Sciences | 8 | 1.2% |
| Psychology | 18 | 2.7% |
| Social Sciences | 59 | 9.0% |
| Engineering | 15 | 2.3% |
| Multidisciplinary Studies | 0 | 0.0% |
| Science & Technology | 97 | 14.8% |
| Business | 259 | 39.4% |
| Education | 59 | 9.0% |
| Literature & Languages | 57 | 8.7% |
| Liberal Arts & History | 0 | 0.0% |
| Visual & Performing Arts | 26 | 4.0% |
| Communications | 14 | 2.1% |
| Arts & Humanities | 21 | 3.2% |
| Total | 657 | 100.0% |
Transportation & Commute in Bokeelia
Vehicle Availability by Sex in Bokeelia
The most prevalent vehicle ownership categories in Bokeelia are males with 2 vehicles (166, accounting for 48.1%) and females with 2 vehicles (150, making up 72.8%).
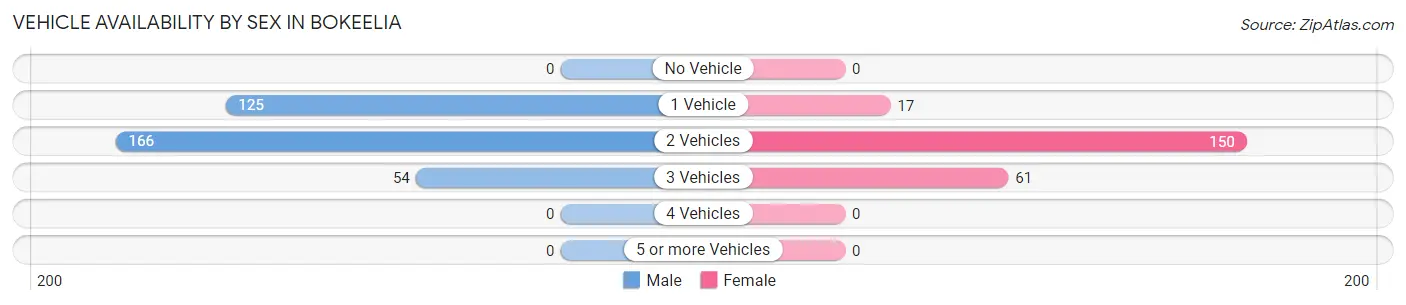
| Vehicles Available | Male | Female |
| No Vehicle | 0 (0.0%) | 0 (0.0%) |
| 1 Vehicle | 125 (36.2%) | 17 (7.5%) |
| 2 Vehicles | 166 (48.1%) | 150 (65.8%) |
| 3 Vehicles | 54 (15.7%) | 61 (26.8%) |
| 4 Vehicles | 0 (0.0%) | 0 (0.0%) |
| 5 or more Vehicles | 0 (0.0%) | 0 (0.0%) |
| Total | 345 (100.0%) | 228 (100.0%) |
Commute Time in Bokeelia
The most frequently occuring commute durations in Bokeelia are 5 to 9 minutes (129 commuters, 23.9%), 30 to 34 minutes (106 commuters, 19.7%), and 20 to 24 minutes (103 commuters, 19.1%).
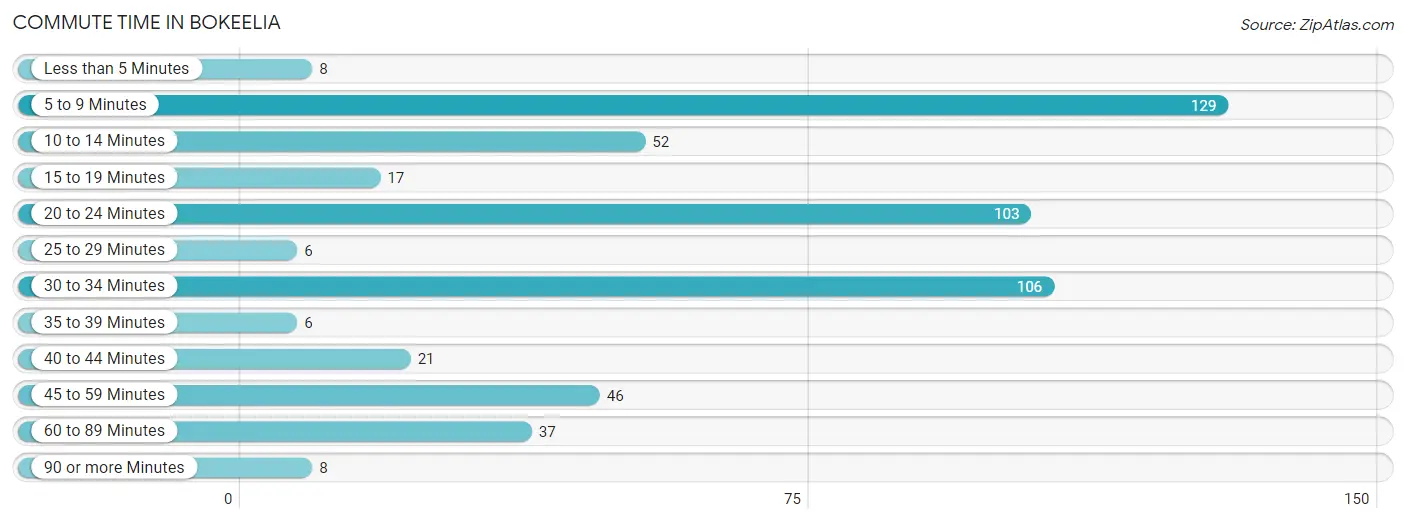
| Commute Time | # Commuters | % Commuters |
| Less than 5 Minutes | 8 | 1.5% |
| 5 to 9 Minutes | 129 | 23.9% |
| 10 to 14 Minutes | 52 | 9.7% |
| 15 to 19 Minutes | 17 | 3.2% |
| 20 to 24 Minutes | 103 | 19.1% |
| 25 to 29 Minutes | 6 | 1.1% |
| 30 to 34 Minutes | 106 | 19.7% |
| 35 to 39 Minutes | 6 | 1.1% |
| 40 to 44 Minutes | 21 | 3.9% |
| 45 to 59 Minutes | 46 | 8.5% |
| 60 to 89 Minutes | 37 | 6.9% |
| 90 or more Minutes | 8 | 1.5% |
Commute Time by Sex in Bokeelia
The most common commute times in Bokeelia are 30 to 34 minutes (85 commuters, 25.6%) for males and 5 to 9 minutes (49 commuters, 23.7%) for females.
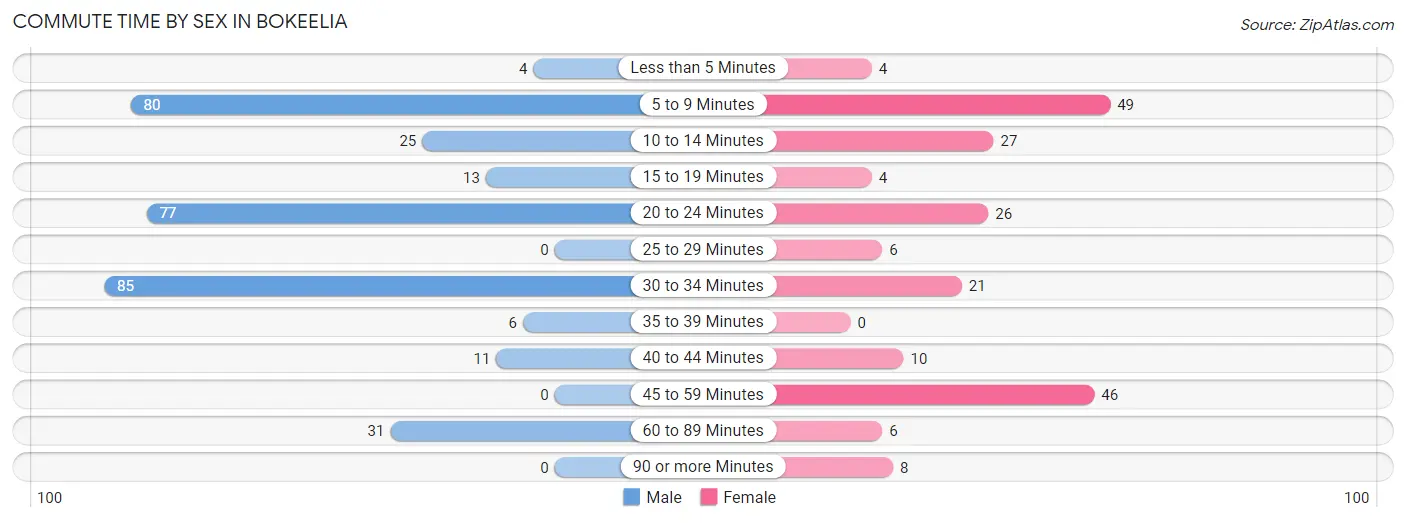
| Commute Time | Male | Female |
| Less than 5 Minutes | 4 (1.2%) | 4 (1.9%) |
| 5 to 9 Minutes | 80 (24.1%) | 49 (23.7%) |
| 10 to 14 Minutes | 25 (7.5%) | 27 (13.0%) |
| 15 to 19 Minutes | 13 (3.9%) | 4 (1.9%) |
| 20 to 24 Minutes | 77 (23.2%) | 26 (12.6%) |
| 25 to 29 Minutes | 0 (0.0%) | 6 (2.9%) |
| 30 to 34 Minutes | 85 (25.6%) | 21 (10.1%) |
| 35 to 39 Minutes | 6 (1.8%) | 0 (0.0%) |
| 40 to 44 Minutes | 11 (3.3%) | 10 (4.8%) |
| 45 to 59 Minutes | 0 (0.0%) | 46 (22.2%) |
| 60 to 89 Minutes | 31 (9.3%) | 6 (2.9%) |
| 90 or more Minutes | 0 (0.0%) | 8 (3.9%) |
Time of Departure to Work by Sex in Bokeelia
The most frequent times of departure to work in Bokeelia are 6:30 AM to 6:59 AM (68, 20.5%) for males and 7:00 AM to 7:29 AM (55, 26.6%) for females.
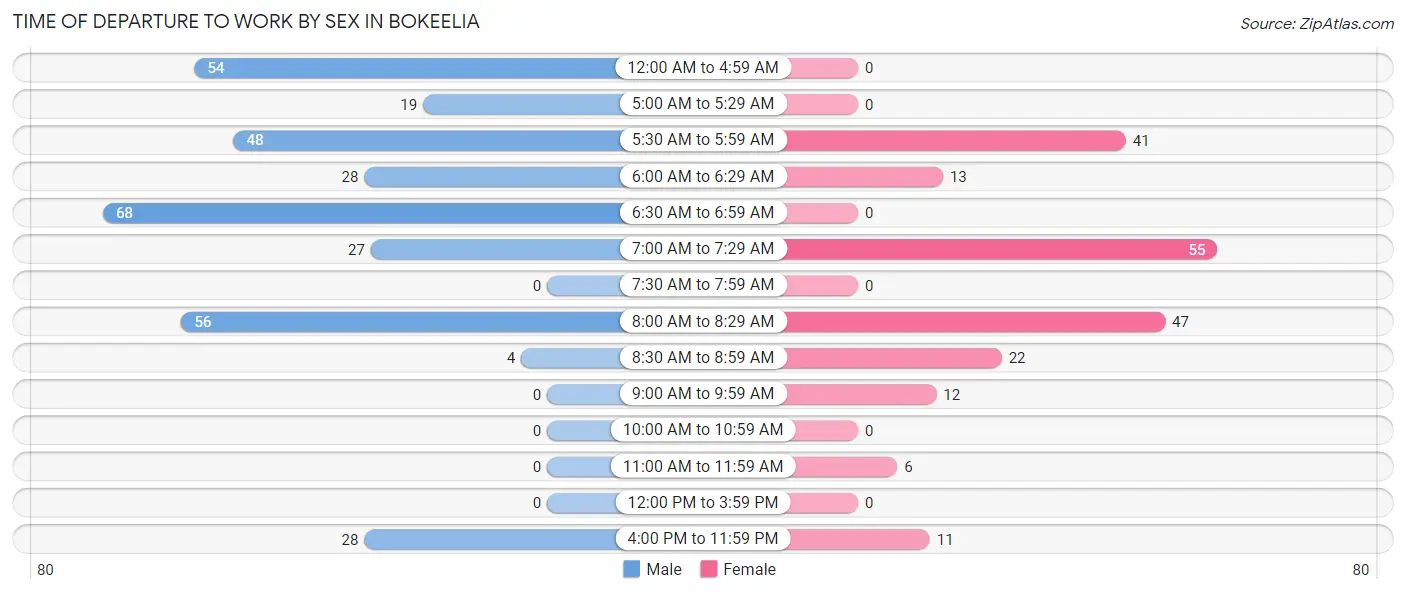
| Time of Departure | Male | Female |
| 12:00 AM to 4:59 AM | 54 (16.3%) | 0 (0.0%) |
| 5:00 AM to 5:29 AM | 19 (5.7%) | 0 (0.0%) |
| 5:30 AM to 5:59 AM | 48 (14.5%) | 41 (19.8%) |
| 6:00 AM to 6:29 AM | 28 (8.4%) | 13 (6.3%) |
| 6:30 AM to 6:59 AM | 68 (20.5%) | 0 (0.0%) |
| 7:00 AM to 7:29 AM | 27 (8.1%) | 55 (26.6%) |
| 7:30 AM to 7:59 AM | 0 (0.0%) | 0 (0.0%) |
| 8:00 AM to 8:29 AM | 56 (16.9%) | 47 (22.7%) |
| 8:30 AM to 8:59 AM | 4 (1.2%) | 22 (10.6%) |
| 9:00 AM to 9:59 AM | 0 (0.0%) | 12 (5.8%) |
| 10:00 AM to 10:59 AM | 0 (0.0%) | 0 (0.0%) |
| 11:00 AM to 11:59 AM | 0 (0.0%) | 6 (2.9%) |
| 12:00 PM to 3:59 PM | 0 (0.0%) | 0 (0.0%) |
| 4:00 PM to 11:59 PM | 28 (8.4%) | 11 (5.3%) |
| Total | 332 (100.0%) | 207 (100.0%) |
Housing Occupancy in Bokeelia
Occupancy by Ownership in Bokeelia
Of the total 925 dwellings in Bokeelia, owner-occupied units account for 824 (89.1%), while renter-occupied units make up 101 (10.9%).
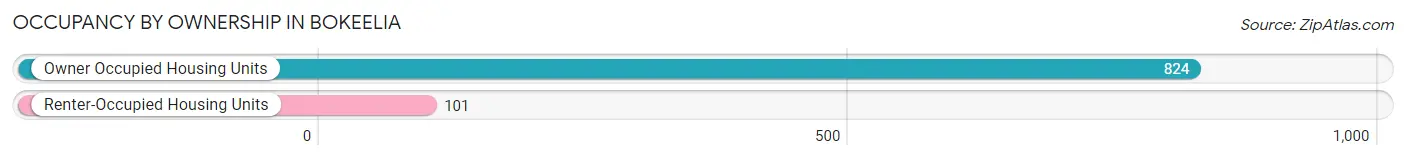
| Occupancy | # Housing Units | % Housing Units |
| Owner Occupied Housing Units | 824 | 89.1% |
| Renter-Occupied Housing Units | 101 | 10.9% |
| Total Occupied Housing Units | 925 | 100.0% |
Occupancy by Household Size in Bokeelia
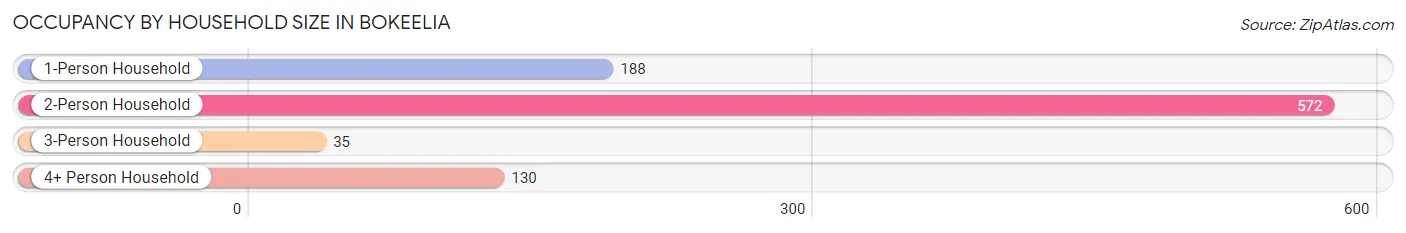
| Household Size | # Housing Units | % Housing Units |
| 1-Person Household | 188 | 20.3% |
| 2-Person Household | 572 | 61.8% |
| 3-Person Household | 35 | 3.8% |
| 4+ Person Household | 130 | 14.1% |
| Total Housing Units | 925 | 100.0% |
Occupancy by Ownership by Household Size in Bokeelia
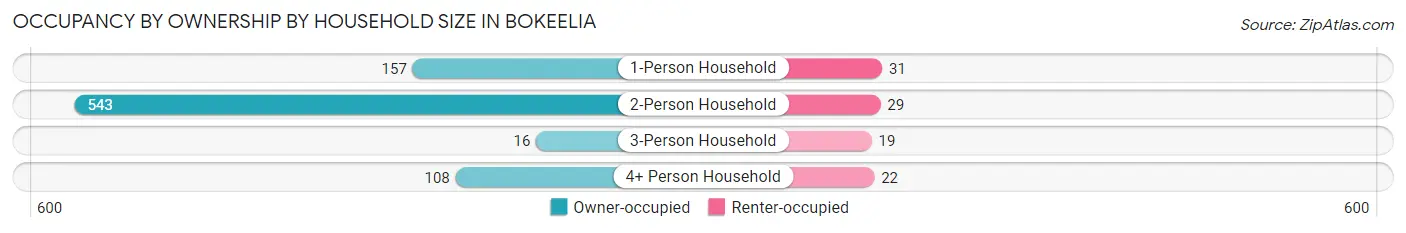
| Household Size | Owner-occupied | Renter-occupied |
| 1-Person Household | 157 (83.5%) | 31 (16.5%) |
| 2-Person Household | 543 (94.9%) | 29 (5.1%) |
| 3-Person Household | 16 (45.7%) | 19 (54.3%) |
| 4+ Person Household | 108 (83.1%) | 22 (16.9%) |
| Total Housing Units | 824 (89.1%) | 101 (10.9%) |
Occupancy by Educational Attainment in Bokeelia
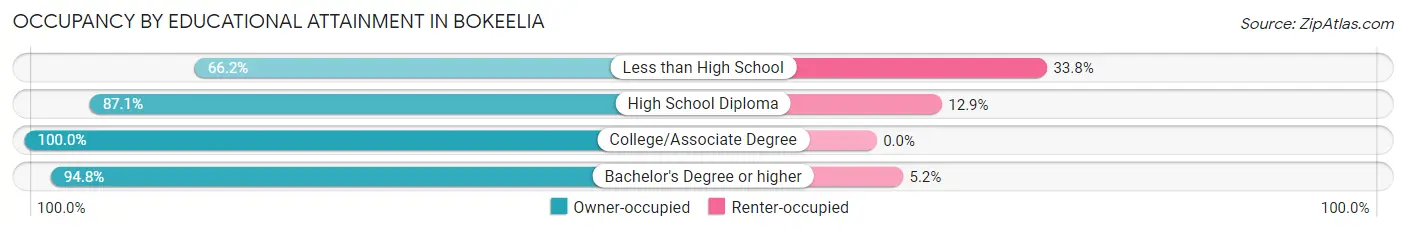
| Household Size | Owner-occupied | Renter-occupied |
| Less than High School | 102 (66.2%) | 52 (33.8%) |
| High School Diploma | 209 (87.1%) | 31 (12.9%) |
| College/Associate Degree | 186 (100.0%) | 0 (0.0%) |
| Bachelor's Degree or higher | 327 (94.8%) | 18 (5.2%) |
Occupancy by Age of Householder in Bokeelia
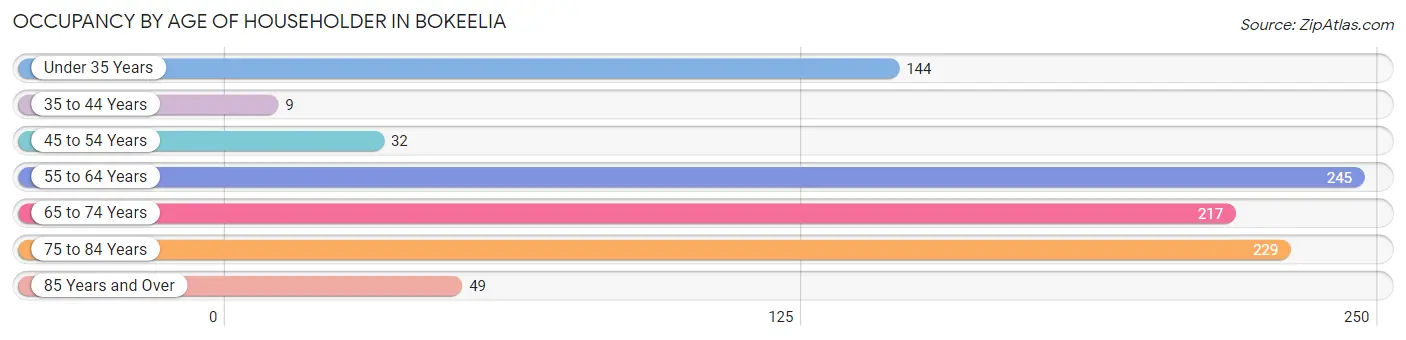
| Age Bracket | # Households | % Households |
| Under 35 Years | 144 | 15.6% |
| 35 to 44 Years | 9 | 1.0% |
| 45 to 54 Years | 32 | 3.5% |
| 55 to 64 Years | 245 | 26.5% |
| 65 to 74 Years | 217 | 23.5% |
| 75 to 84 Years | 229 | 24.8% |
| 85 Years and Over | 49 | 5.3% |
| Total | 925 | 100.0% |
Housing Finances in Bokeelia
Median Income by Occupancy in Bokeelia
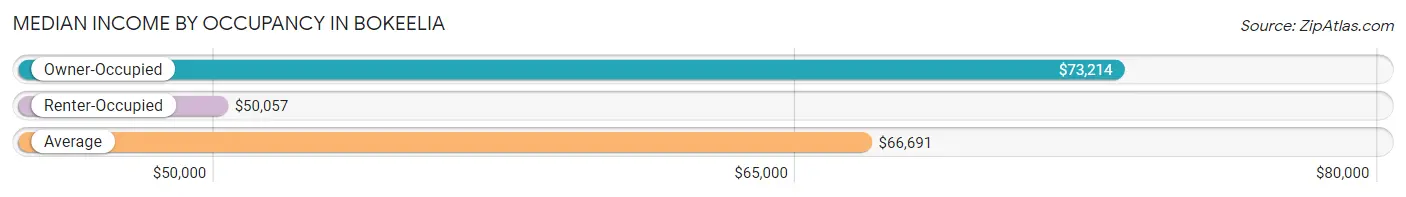
| Occupancy Type | # Households | Median Income |
| Owner-Occupied | 824 (89.1%) | $73,214 |
| Renter-Occupied | 101 (10.9%) | $50,057 |
| Average | 925 (100.0%) | $66,691 |
Occupancy by Householder Income Bracket in Bokeelia
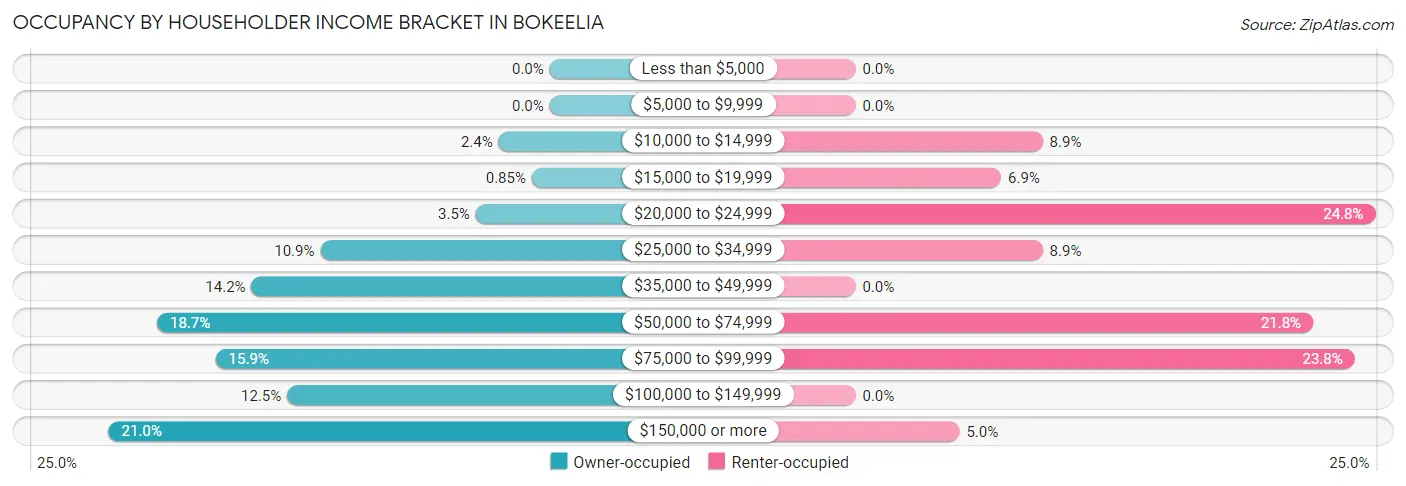
| Income Bracket | Owner-occupied | Renter-occupied |
| Less than $5,000 | 0 (0.0%) | 0 (0.0%) |
| $5,000 to $9,999 | 0 (0.0%) | 0 (0.0%) |
| $10,000 to $14,999 | 20 (2.4%) | 9 (8.9%) |
| $15,000 to $19,999 | 7 (0.9%) | 7 (6.9%) |
| $20,000 to $24,999 | 29 (3.5%) | 25 (24.7%) |
| $25,000 to $34,999 | 90 (10.9%) | 9 (8.9%) |
| $35,000 to $49,999 | 117 (14.2%) | 0 (0.0%) |
| $50,000 to $74,999 | 154 (18.7%) | 22 (21.8%) |
| $75,000 to $99,999 | 131 (15.9%) | 24 (23.8%) |
| $100,000 to $149,999 | 103 (12.5%) | 0 (0.0%) |
| $150,000 or more | 173 (21.0%) | 5 (5.0%) |
| Total | 824 (100.0%) | 101 (100.0%) |
Monthly Housing Cost Tiers in Bokeelia
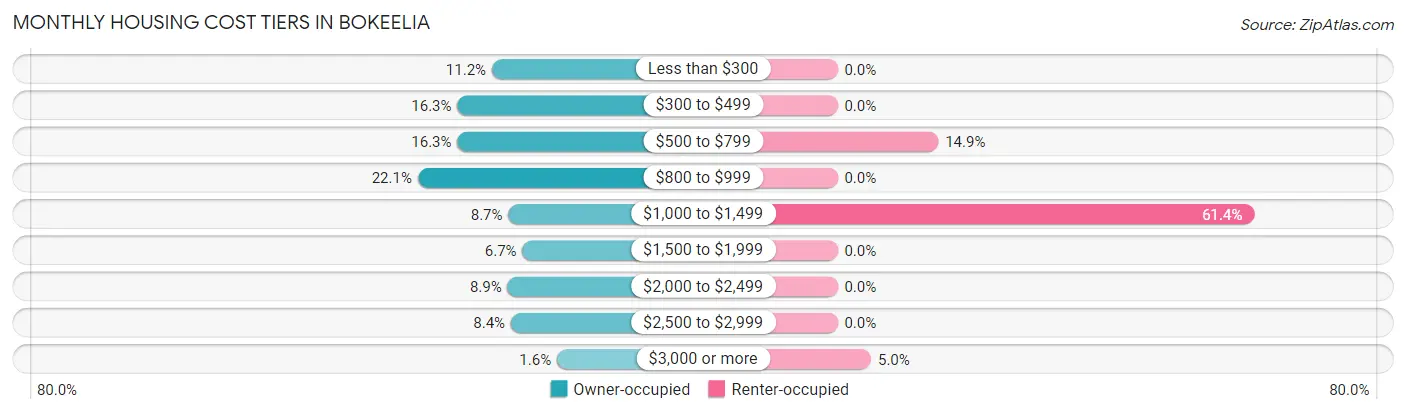
| Monthly Cost | Owner-occupied | Renter-occupied |
| Less than $300 | 92 (11.2%) | 0 (0.0%) |
| $300 to $499 | 134 (16.3%) | 0 (0.0%) |
| $500 to $799 | 134 (16.3%) | 15 (14.8%) |
| $800 to $999 | 182 (22.1%) | 0 (0.0%) |
| $1,000 to $1,499 | 72 (8.7%) | 62 (61.4%) |
| $1,500 to $1,999 | 55 (6.7%) | 0 (0.0%) |
| $2,000 to $2,499 | 73 (8.9%) | 0 (0.0%) |
| $2,500 to $2,999 | 69 (8.4%) | 0 (0.0%) |
| $3,000 or more | 13 (1.6%) | 5 (5.0%) |
| Total | 824 (100.0%) | 101 (100.0%) |
Physical Housing Characteristics in Bokeelia
Housing Structures in Bokeelia
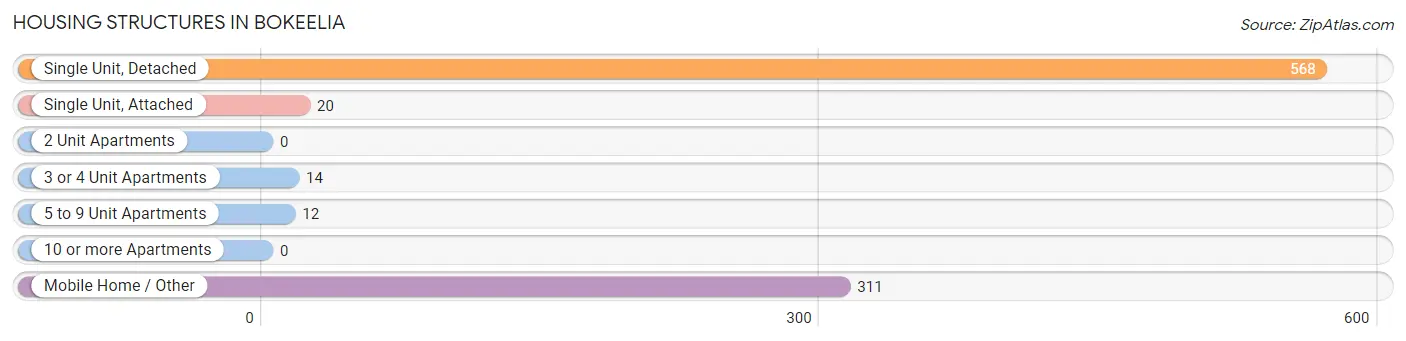
| Structure Type | # Housing Units | % Housing Units |
| Single Unit, Detached | 568 | 61.4% |
| Single Unit, Attached | 20 | 2.2% |
| 2 Unit Apartments | 0 | 0.0% |
| 3 or 4 Unit Apartments | 14 | 1.5% |
| 5 to 9 Unit Apartments | 12 | 1.3% |
| 10 or more Apartments | 0 | 0.0% |
| Mobile Home / Other | 311 | 33.6% |
| Total | 925 | 100.0% |
Housing Structures by Occupancy in Bokeelia
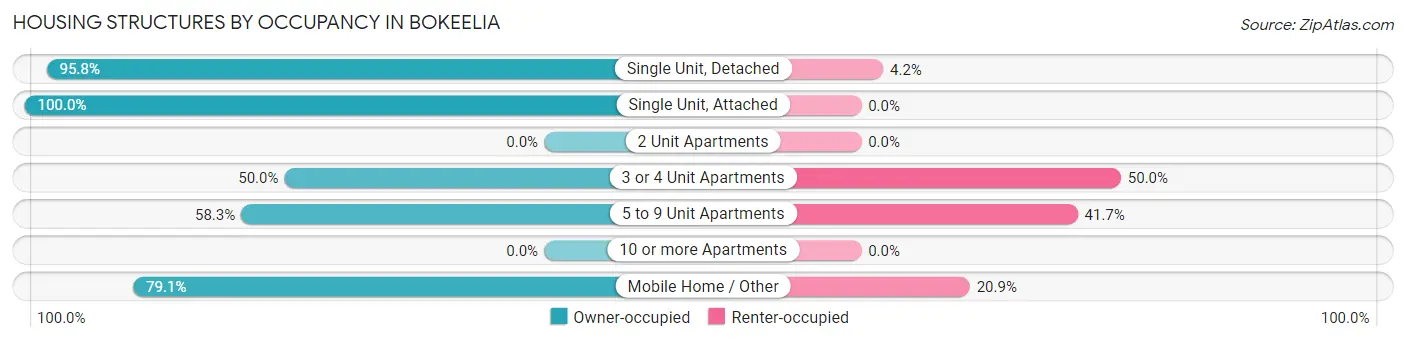
| Structure Type | Owner-occupied | Renter-occupied |
| Single Unit, Detached | 544 (95.8%) | 24 (4.2%) |
| Single Unit, Attached | 20 (100.0%) | 0 (0.0%) |
| 2 Unit Apartments | 0 (0.0%) | 0 (0.0%) |
| 3 or 4 Unit Apartments | 7 (50.0%) | 7 (50.0%) |
| 5 to 9 Unit Apartments | 7 (58.3%) | 5 (41.7%) |
| 10 or more Apartments | 0 (0.0%) | 0 (0.0%) |
| Mobile Home / Other | 246 (79.1%) | 65 (20.9%) |
| Total | 824 (89.1%) | 101 (10.9%) |
Housing Structures by Number of Rooms in Bokeelia
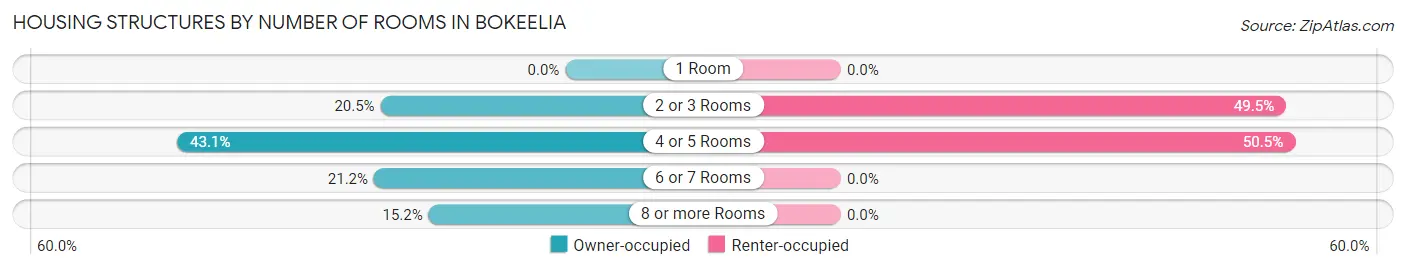
| Number of Rooms | Owner-occupied | Renter-occupied |
| 1 Room | 0 (0.0%) | 0 (0.0%) |
| 2 or 3 Rooms | 169 (20.5%) | 50 (49.5%) |
| 4 or 5 Rooms | 355 (43.1%) | 51 (50.5%) |
| 6 or 7 Rooms | 175 (21.2%) | 0 (0.0%) |
| 8 or more Rooms | 125 (15.2%) | 0 (0.0%) |
| Total | 824 (100.0%) | 101 (100.0%) |
Housing Structure by Heating Type in Bokeelia
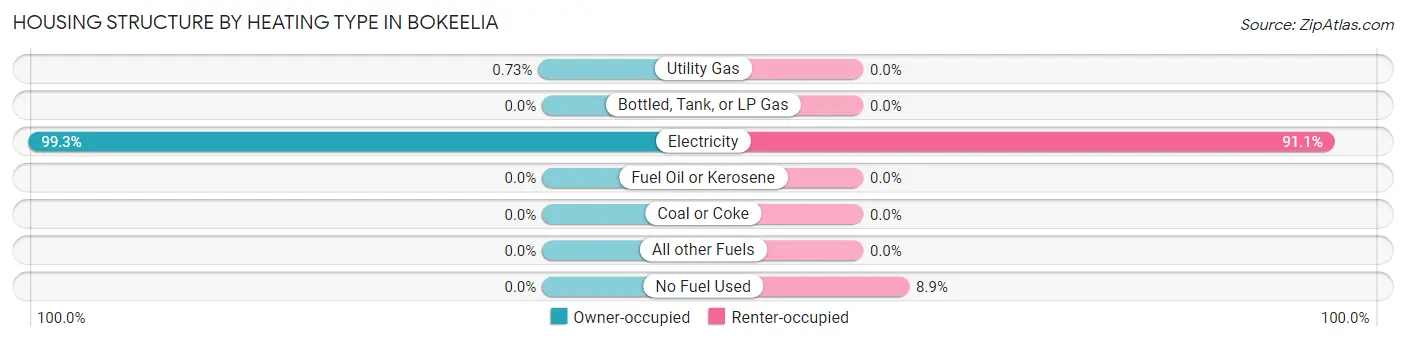
| Heating Type | Owner-occupied | Renter-occupied |
| Utility Gas | 6 (0.7%) | 0 (0.0%) |
| Bottled, Tank, or LP Gas | 0 (0.0%) | 0 (0.0%) |
| Electricity | 818 (99.3%) | 92 (91.1%) |
| Fuel Oil or Kerosene | 0 (0.0%) | 0 (0.0%) |
| Coal or Coke | 0 (0.0%) | 0 (0.0%) |
| All other Fuels | 0 (0.0%) | 0 (0.0%) |
| No Fuel Used | 0 (0.0%) | 9 (8.9%) |
| Total | 824 (100.0%) | 101 (100.0%) |
Household Vehicle Usage in Bokeelia
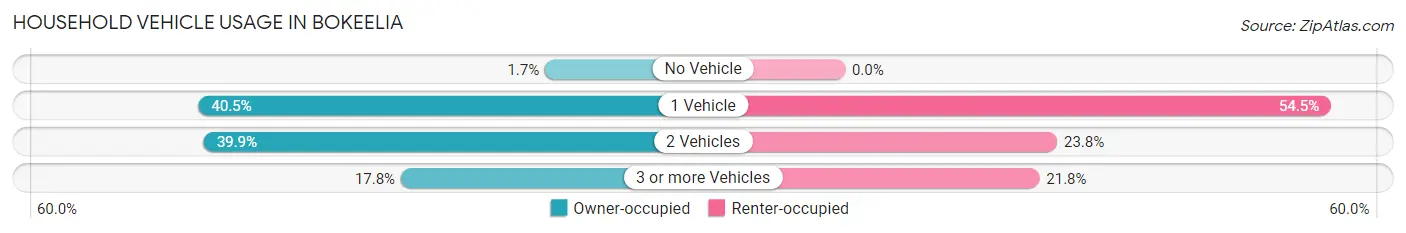
| Vehicles per Household | Owner-occupied | Renter-occupied |
| No Vehicle | 14 (1.7%) | 0 (0.0%) |
| 1 Vehicle | 334 (40.5%) | 55 (54.5%) |
| 2 Vehicles | 329 (39.9%) | 24 (23.8%) |
| 3 or more Vehicles | 147 (17.8%) | 22 (21.8%) |
| Total | 824 (100.0%) | 101 (100.0%) |
Real Estate & Mortgages in Bokeelia
Real Estate and Mortgage Overview in Bokeelia
| Characteristic | Without Mortgage | With Mortgage |
| Housing Units | 604 | 220 |
| Median Property Value | $238,600 | $396,700 |
| Median Household Income | $62,273 | $11 |
| Monthly Housing Costs | $664 | $0 |
| Real Estate Taxes | $3,434 | $15 |
Property Value by Mortgage Status in Bokeelia
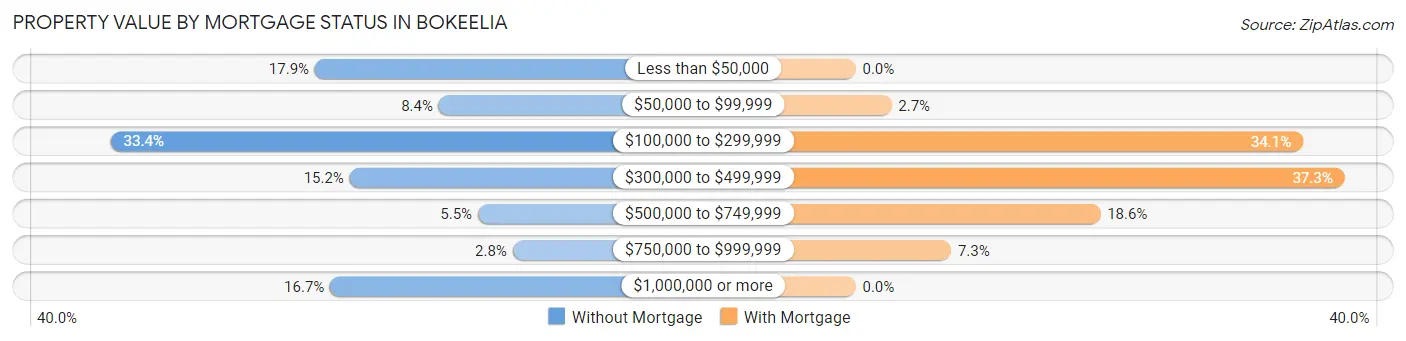
| Property Value | Without Mortgage | With Mortgage |
| Less than $50,000 | 108 (17.9%) | 0 (0.0%) |
| $50,000 to $99,999 | 51 (8.4%) | 6 (2.7%) |
| $100,000 to $299,999 | 202 (33.4%) | 75 (34.1%) |
| $300,000 to $499,999 | 92 (15.2%) | 82 (37.3%) |
| $500,000 to $749,999 | 33 (5.5%) | 41 (18.6%) |
| $750,000 to $999,999 | 17 (2.8%) | 16 (7.3%) |
| $1,000,000 or more | 101 (16.7%) | 0 (0.0%) |
| Total | 604 (100.0%) | 220 (100.0%) |
Household Income by Mortgage Status in Bokeelia
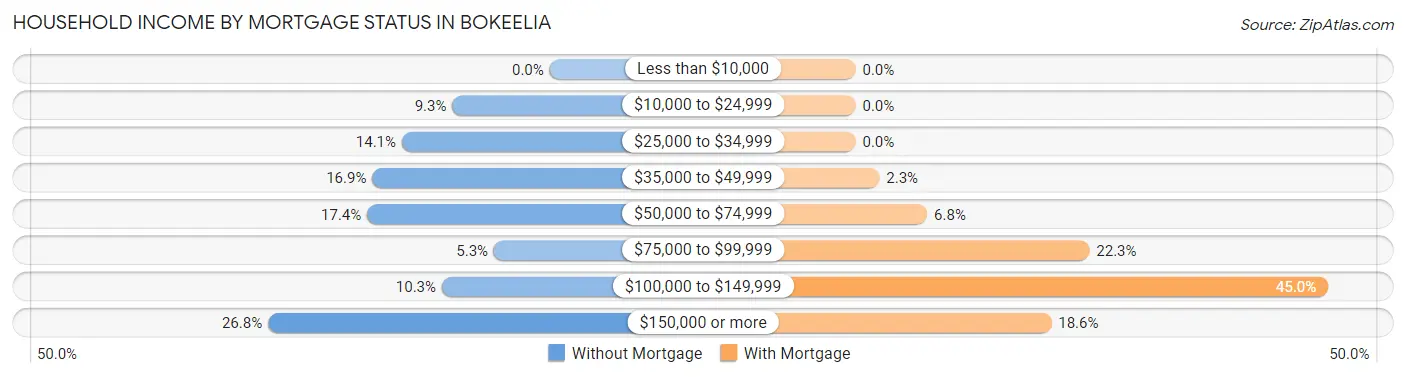
| Household Income | Without Mortgage | With Mortgage |
| Less than $10,000 | 0 (0.0%) | 0 (0.0%) |
| $10,000 to $24,999 | 56 (9.3%) | 0 (0.0%) |
| $25,000 to $34,999 | 85 (14.1%) | 0 (0.0%) |
| $35,000 to $49,999 | 102 (16.9%) | 5 (2.3%) |
| $50,000 to $74,999 | 105 (17.4%) | 15 (6.8%) |
| $75,000 to $99,999 | 32 (5.3%) | 49 (22.3%) |
| $100,000 to $149,999 | 62 (10.3%) | 99 (45.0%) |
| $150,000 or more | 162 (26.8%) | 41 (18.6%) |
| Total | 604 (100.0%) | 220 (100.0%) |
Property Value to Household Income Ratio in Bokeelia
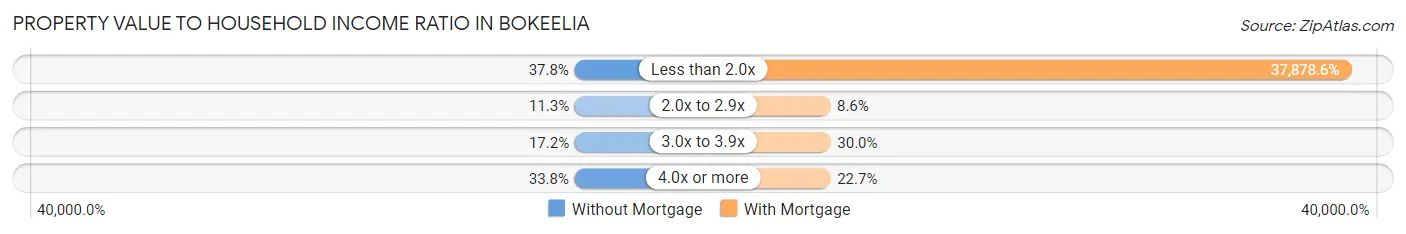
| Value-to-Income Ratio | Without Mortgage | With Mortgage |
| Less than 2.0x | 228 (37.8%) | 83,333 (37,878.6%) |
| 2.0x to 2.9x | 68 (11.3%) | 19 (8.6%) |
| 3.0x to 3.9x | 104 (17.2%) | 66 (30.0%) |
| 4.0x or more | 204 (33.8%) | 50 (22.7%) |
| Total | 604 (100.0%) | 220 (100.0%) |
Real Estate Taxes by Mortgage Status in Bokeelia
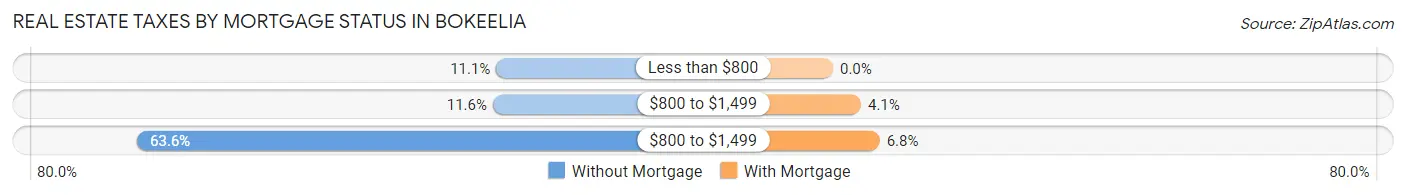
| Property Taxes | Without Mortgage | With Mortgage |
| Less than $800 | 67 (11.1%) | 0 (0.0%) |
| $800 to $1,499 | 70 (11.6%) | 9 (4.1%) |
| $800 to $1,499 | 384 (63.6%) | 15 (6.8%) |
| Total | 604 (100.0%) | 220 (100.0%) |
Health & Disability in Bokeelia
Health Insurance Coverage by Age in Bokeelia
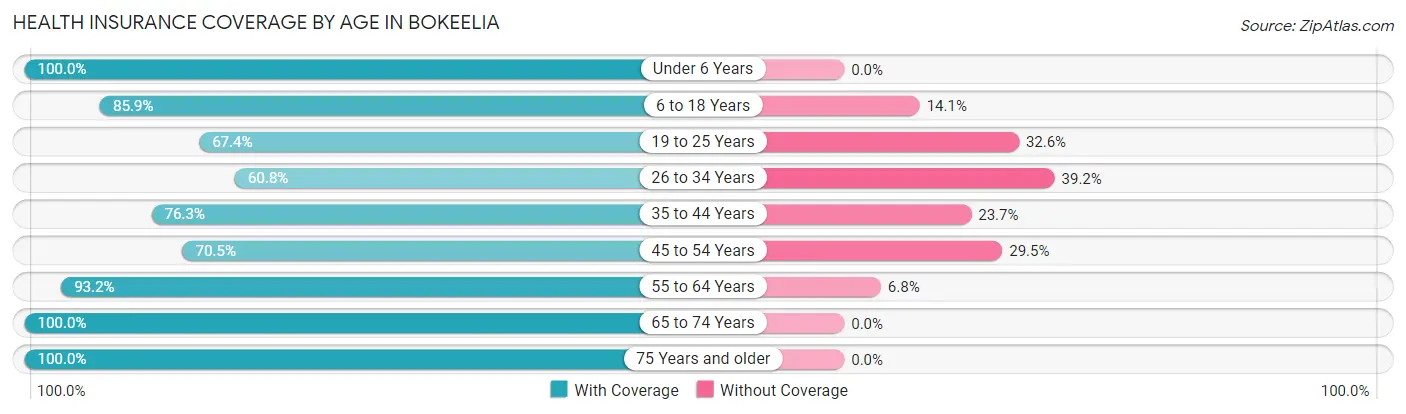
| Age Bracket | With Coverage | Without Coverage |
| Under 6 Years | 247 (100.0%) | 0 (0.0%) |
| 6 to 18 Years | 116 (85.9%) | 19 (14.1%) |
| 19 to 25 Years | 118 (67.4%) | 57 (32.6%) |
| 26 to 34 Years | 124 (60.8%) | 80 (39.2%) |
| 35 to 44 Years | 29 (76.3%) | 9 (23.7%) |
| 45 to 54 Years | 79 (70.5%) | 33 (29.5%) |
| 55 to 64 Years | 382 (93.2%) | 28 (6.8%) |
| 65 to 74 Years | 436 (100.0%) | 0 (0.0%) |
| 75 Years and older | 473 (100.0%) | 0 (0.0%) |
| Total | 2,004 (89.9%) | 226 (10.1%) |
Health Insurance Coverage by Citizenship Status in Bokeelia
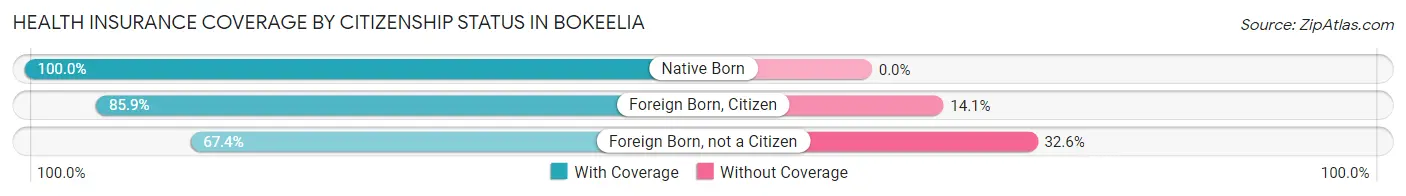
| Citizenship Status | With Coverage | Without Coverage |
| Native Born | 247 (100.0%) | 0 (0.0%) |
| Foreign Born, Citizen | 116 (85.9%) | 19 (14.1%) |
| Foreign Born, not a Citizen | 118 (67.4%) | 57 (32.6%) |
Health Insurance Coverage by Household Income in Bokeelia
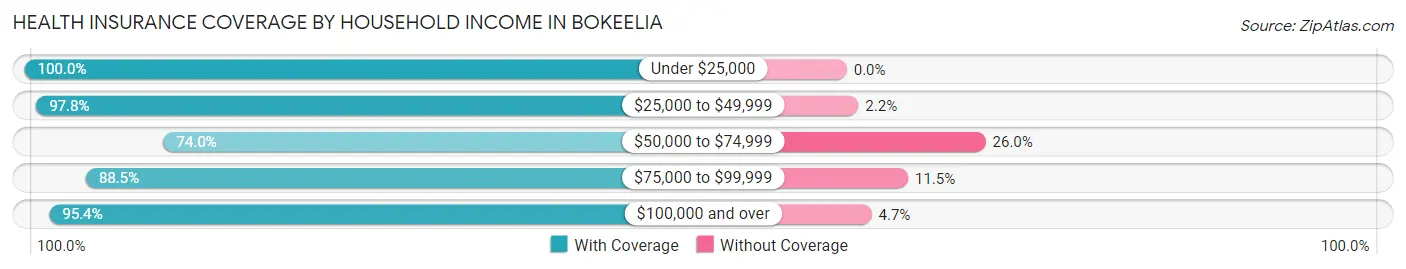
| Household Income | With Coverage | Without Coverage |
| Under $25,000 | 175 (100.0%) | 0 (0.0%) |
| $25,000 to $49,999 | 403 (97.8%) | 9 (2.2%) |
| $50,000 to $74,999 | 384 (74.0%) | 135 (26.0%) |
| $75,000 to $99,999 | 386 (88.5%) | 50 (11.5%) |
| $100,000 and over | 656 (95.4%) | 32 (4.6%) |
Public vs Private Health Insurance Coverage by Age in Bokeelia
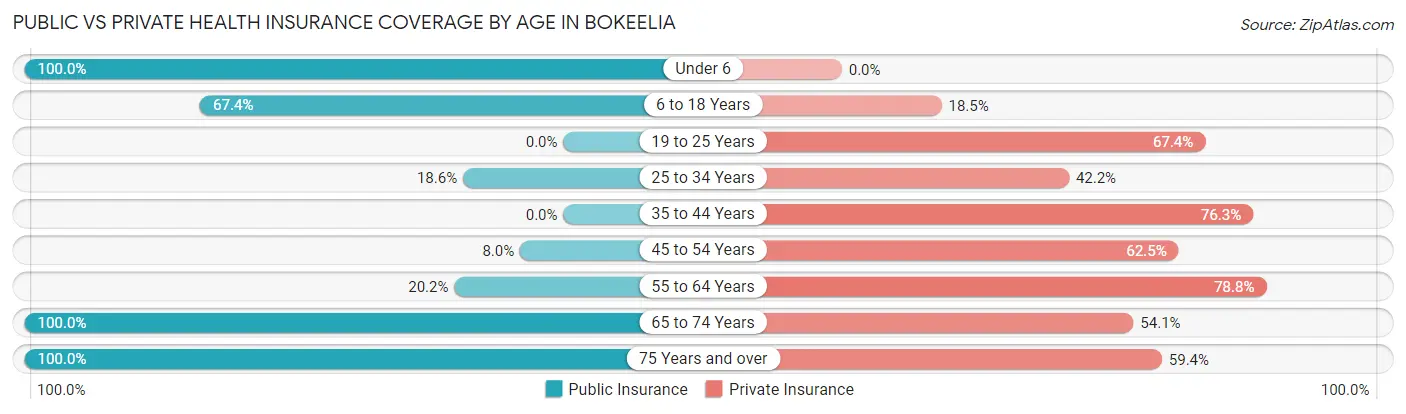
| Age Bracket | Public Insurance | Private Insurance |
| Under 6 | 247 (100.0%) | 0 (0.0%) |
| 6 to 18 Years | 91 (67.4%) | 25 (18.5%) |
| 19 to 25 Years | 0 (0.0%) | 118 (67.4%) |
| 25 to 34 Years | 38 (18.6%) | 86 (42.2%) |
| 35 to 44 Years | 0 (0.0%) | 29 (76.3%) |
| 45 to 54 Years | 9 (8.0%) | 70 (62.5%) |
| 55 to 64 Years | 83 (20.2%) | 323 (78.8%) |
| 65 to 74 Years | 436 (100.0%) | 236 (54.1%) |
| 75 Years and over | 473 (100.0%) | 281 (59.4%) |
| Total | 1,377 (61.8%) | 1,168 (52.4%) |
Disability Status by Sex by Age in Bokeelia
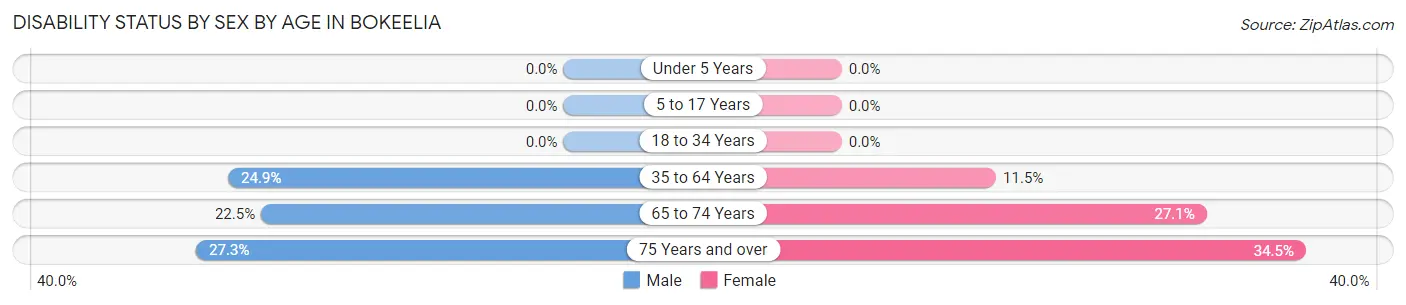
| Age Bracket | Male | Female |
| Under 5 Years | 0 (0.0%) | 0 (0.0%) |
| 5 to 17 Years | 0 (0.0%) | 0 (0.0%) |
| 18 to 34 Years | 0 (0.0%) | 0 (0.0%) |
| 35 to 64 Years | 59 (24.9%) | 37 (11.5%) |
| 65 to 74 Years | 44 (22.5%) | 65 (27.1%) |
| 75 Years and over | 72 (27.3%) | 72 (34.4%) |
Disability Class by Sex by Age in Bokeelia
Disability Class: Hearing Difficulty
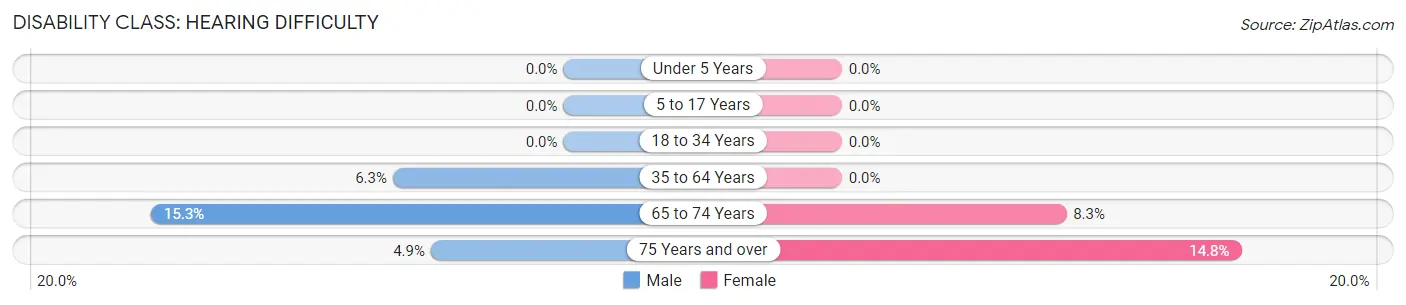
| Age Bracket | Male | Female |
| Under 5 Years | 0 (0.0%) | 0 (0.0%) |
| 5 to 17 Years | 0 (0.0%) | 0 (0.0%) |
| 18 to 34 Years | 0 (0.0%) | 0 (0.0%) |
| 35 to 64 Years | 15 (6.3%) | 0 (0.0%) |
| 65 to 74 Years | 30 (15.3%) | 20 (8.3%) |
| 75 Years and over | 13 (4.9%) | 31 (14.8%) |
Disability Class: Vision Difficulty
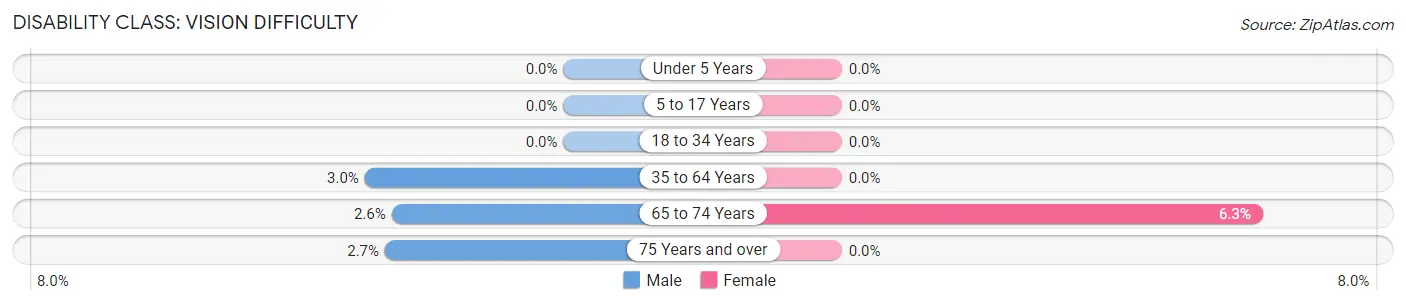
| Age Bracket | Male | Female |
| Under 5 Years | 0 (0.0%) | 0 (0.0%) |
| 5 to 17 Years | 0 (0.0%) | 0 (0.0%) |
| 18 to 34 Years | 0 (0.0%) | 0 (0.0%) |
| 35 to 64 Years | 7 (2.9%) | 0 (0.0%) |
| 65 to 74 Years | 5 (2.5%) | 15 (6.2%) |
| 75 Years and over | 7 (2.6%) | 0 (0.0%) |
Disability Class: Cognitive Difficulty
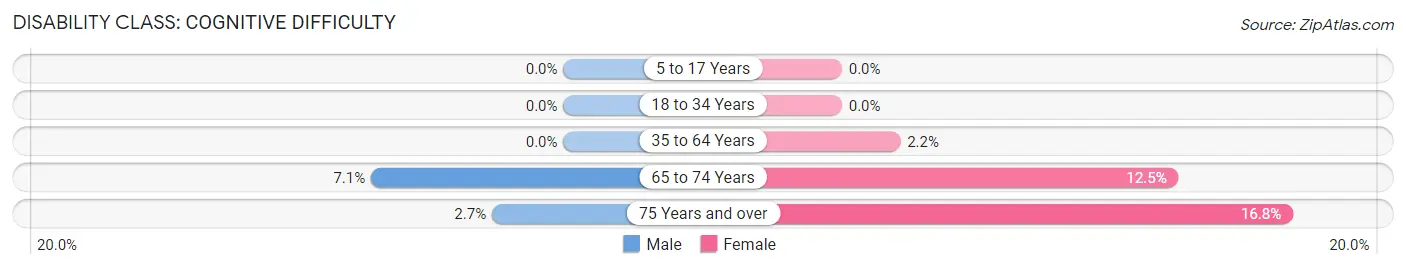
| Age Bracket | Male | Female |
| 5 to 17 Years | 0 (0.0%) | 0 (0.0%) |
| 18 to 34 Years | 0 (0.0%) | 0 (0.0%) |
| 35 to 64 Years | 0 (0.0%) | 7 (2.2%) |
| 65 to 74 Years | 14 (7.1%) | 30 (12.5%) |
| 75 Years and over | 7 (2.6%) | 35 (16.8%) |
Disability Class: Ambulatory Difficulty
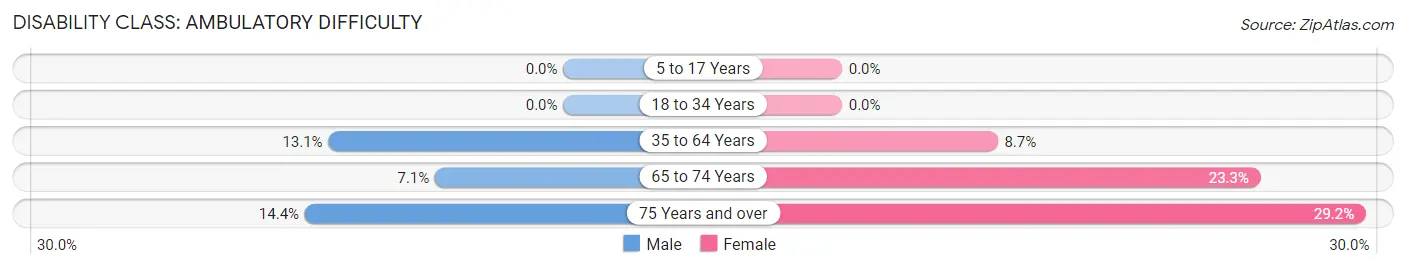
| Age Bracket | Male | Female |
| 5 to 17 Years | 0 (0.0%) | 0 (0.0%) |
| 18 to 34 Years | 0 (0.0%) | 0 (0.0%) |
| 35 to 64 Years | 31 (13.1%) | 28 (8.7%) |
| 65 to 74 Years | 14 (7.1%) | 56 (23.3%) |
| 75 Years and over | 38 (14.4%) | 61 (29.2%) |
Disability Class: Self-Care Difficulty
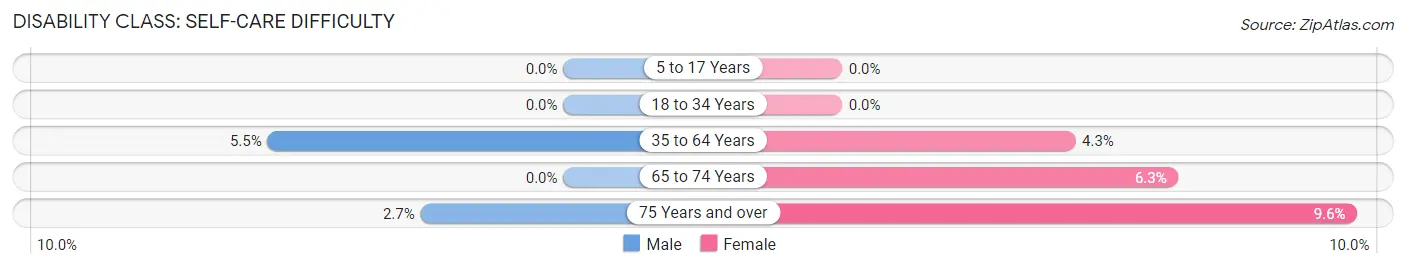
| Age Bracket | Male | Female |
| 5 to 17 Years | 0 (0.0%) | 0 (0.0%) |
| 18 to 34 Years | 0 (0.0%) | 0 (0.0%) |
| 35 to 64 Years | 13 (5.5%) | 14 (4.3%) |
| 65 to 74 Years | 0 (0.0%) | 15 (6.2%) |
| 75 Years and over | 7 (2.6%) | 20 (9.6%) |
Technology Access in Bokeelia
Computing Device Access in Bokeelia
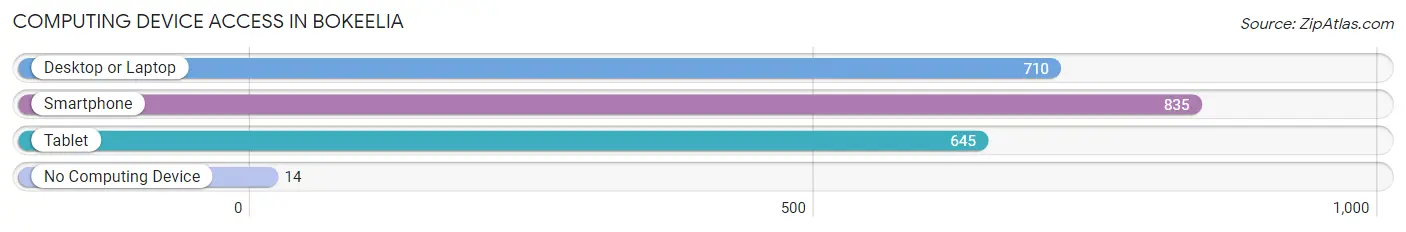
| Device Type | # Households | % Households |
| Desktop or Laptop | 710 | 76.8% |
| Smartphone | 835 | 90.3% |
| Tablet | 645 | 69.7% |
| No Computing Device | 14 | 1.5% |
| Total | 925 | 100.0% |
Internet Access in Bokeelia
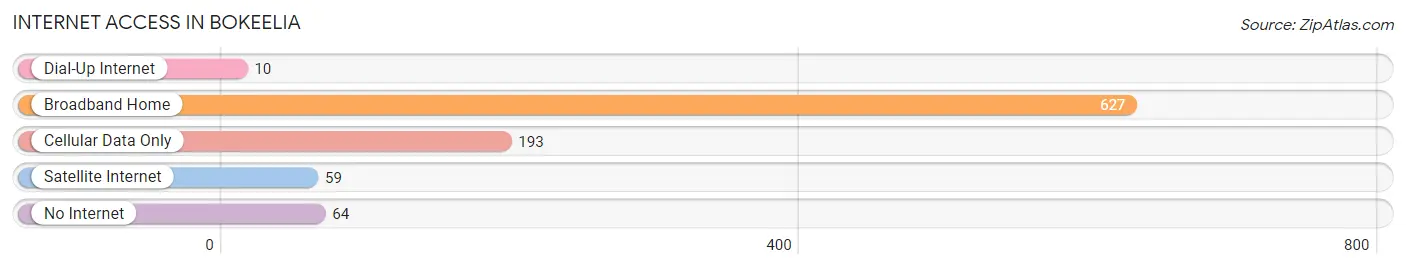
| Internet Type | # Households | % Households |
| Dial-Up Internet | 10 | 1.1% |
| Broadband Home | 627 | 67.8% |
| Cellular Data Only | 193 | 20.9% |
| Satellite Internet | 59 | 6.4% |
| No Internet | 64 | 6.9% |
| Total | 925 | 100.0% |
Bokeelia Summary
Bokeelia is an unincorporated community located in Lee County, Florida, United States. It is located on Pine Island, a barrier island in the Gulf of Mexico. The population was 1,845 at the 2010 census.
History
The area now known as Bokeelia was originally inhabited by the Calusa Indians. The first European settlers arrived in the area in the late 19th century. The town was named after a local family, the Bokeelias, who were among the first settlers.
The town was incorporated in 1911 and was a popular fishing and farming community. In the 1950s, the town began to experience a population boom as more people moved to the area to take advantage of the fishing and farming opportunities.
Geography
Bokeelia is located at 26°45'N 82°2'W (26.75, -82.03). It is located on Pine Island, a barrier island in the Gulf of Mexico. The island is approximately 12 miles long and 2 miles wide.
The town is bordered by the Matlacha Pass Aquatic Preserve to the north, Pine Island Sound to the east, Charlotte Harbor to the south, and Pine Island Sound to the west.
Economy
The economy of Bokeelia is largely based on fishing and tourism. The town is home to several marinas, boat ramps, and fishing charters. There are also several restaurants, bars, and shops in the area.
The town is also home to several art galleries which feature works by local artists
Demographics
As of the 2010 census, there were 1,845 people, 845 households, and 486 families residing in the town. The population density was 545.3 people per square mile (210.9/km2). There were 1,039 housing units at an average density of 308.3 per square mile (119.1/km2). The racial makeup of the town was 94.2% White, 1.2% African American, 0.7% Native American, 0.7% Asian, 0.1% Pacific Islander, 1.7% from other races, and 1.5% from two or more races. Hispanic or Latino of any race were 5.2% of the population.
There were 845 households, out of which 17.2% had children under the age of 18 living with them, 44.2% were married couples living together, 9.2% had a female householder with no husband present, and 42.7% were non-families. 35.2% of all households were made up of individuals, and 16.2% had someone living alone who was 65 years of age or older. The average household size was 2.17 and the average family size was 2.77.
In the town, the population was spread out, with 17.2% under the age of 18, 5.7% from 18 to 24, 22.2% from 25 to 44, 28.2% from 45 to 64, and 26.7% who were 65 years of age or older. The median age was 48 years. For every 100 females, there were 97.2 males. For every 100 females age 18 and over, there were 94.2 males.
The median income for a household in the town was $37,917, and the median income for a family was $45,000. Males had a median income of $31,250 versus $25,000 for females. The per capita income for the town was $20,945. About 8.2% of families and 11.2% of the population were below the poverty line, including 16.7% of those under age 18 and 8.3% of those age 65 or over.
Common Questions
What is Per Capita Income in Bokeelia?
Per Capita income in Bokeelia is $49,671.
What is the Median Family Income in Bokeelia?
Median Family Income in Bokeelia is $63,640.
What is the Median Household income in Bokeelia?
Median Household Income in Bokeelia is $66,691.
What is Income or Wage Gap in Bokeelia?
Income or Wage Gap in Bokeelia is 34.9%.
Women in Bokeelia earn 65.1 cents for every dollar earned by a man.
What is Inequality or Gini Index in Bokeelia?
Inequality or Gini Index in Bokeelia is 0.52.
What is the Total Population of Bokeelia?
Total Population of Bokeelia is 2,230.
What is the Total Male Population of Bokeelia?
Total Male Population of Bokeelia is 1,144.
What is the Total Female Population of Bokeelia?
Total Female Population of Bokeelia is 1,086.
What is the Ratio of Males per 100 Females in Bokeelia?
There are 105.34 Males per 100 Females in Bokeelia.
What is the Ratio of Females per 100 Males in Bokeelia?
There are 94.93 Females per 100 Males in Bokeelia.
What is the Median Population Age in Bokeelia?
Median Population Age in Bokeelia is 59.2 Years.
What is the Average Family Size in Bokeelia
Average Family Size in Bokeelia is 2.7 People.
What is the Average Household Size in Bokeelia
Average Household Size in Bokeelia is 2.4 People.
How Large is the Labor Force in Bokeelia?
There are 663 People in the Labor Forcein in Bokeelia.
What is the Percentage of People in the Labor Force in Bokeelia?
35.4% of People are in the Labor Force in Bokeelia.
What is the Unemployment Rate in Bokeelia?
Unemployment Rate in Bokeelia is 6.2%.