Bascom, FL Map & Demographics
Bascom Map
Bascom Overview
$45,809
PER CAPITA INCOME
$68,000
AVG HOUSEHOLD INCOME
51.8%
WAGE / INCOME GAP [ % ]
48.2¢/ $1
WAGE / INCOME GAP [ $ ]
0.35
INEQUALITY / GINI INDEX
123
TOTAL POPULATION
69
MALE POPULATION
54
FEMALE POPULATION
127.78
MALES / 100 FEMALES
78.26
FEMALES / 100 MALES
48.8
MEDIAN AGE
2.6
AVG FAMILY SIZE
2.0
AVG HOUSEHOLD SIZE
70
LABOR FORCE [ PEOPLE ]
64.2%
PERCENT IN LABOR FORCE
1.4%
UNEMPLOYMENT RATE
Bascom Zip Codes
Bascom Area Codes
Income in Bascom
Income Overview in Bascom
| Characteristic | Number | Measure |
| Per Capita Income | 123 | $45,809 |
| Median Family Income | 38 | $0 |
| Mean Family Income | 38 | $101,645 |
| Median Household Income | 62 | $68,000 |
| Mean Household Income | 62 | $79,158 |
| Income Deficit | 38 | $0 |
| Wage / Income Gap (%) | 123 | 51.80% |
| Wage / Income Gap ($) | 123 | 48.20¢ per $1 |
| Gini / Inequality Index | 123 | 0.35 |
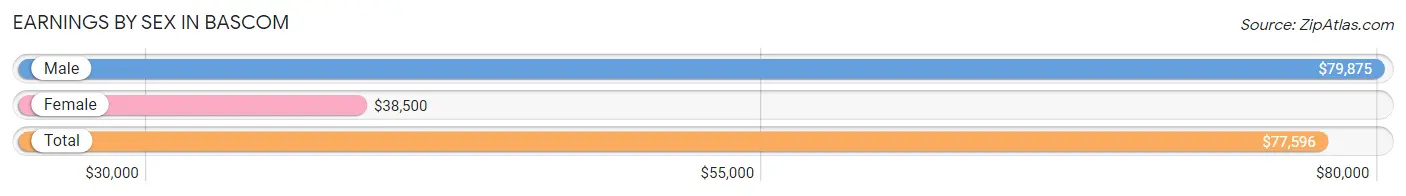
Earnings by Sex in Bascom
Average Earnings in Bascom are $77,596, $79,875 for men and $38,500 for women, a difference of 51.8%.
| Sex | Number | Average Earnings |
| Male | 45 (65.2%) | $79,875 |
| Female | 24 (34.8%) | $38,500 |
| Total | 69 (100.0%) | $77,596 |
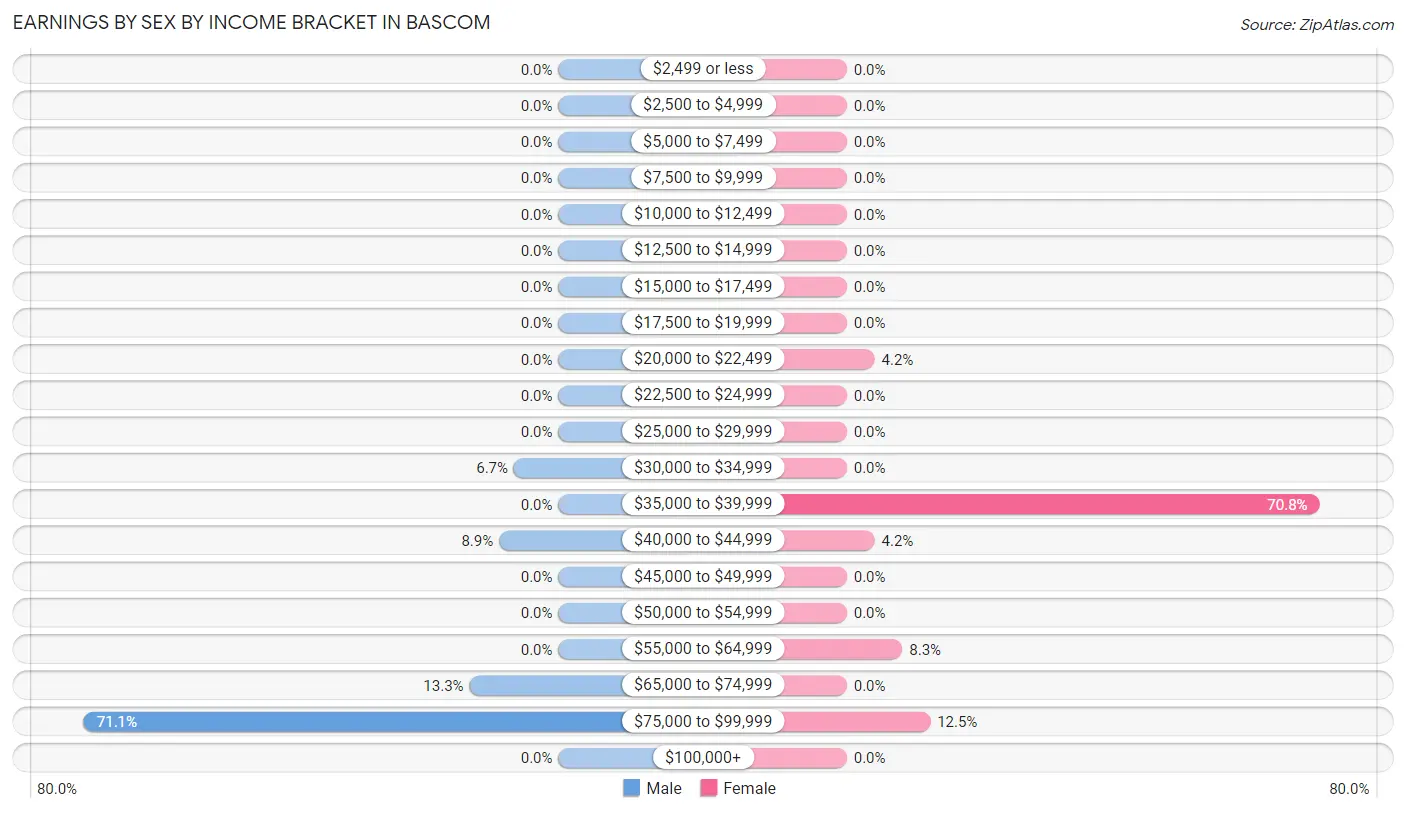
Earnings by Sex by Income Bracket in Bascom
The most common earnings brackets in Bascom are $75,000 to $99,999 for men (32 | 71.1%) and $35,000 to $39,999 for women (17 | 70.8%).
| Income | Male | Female |
| $2,499 or less | 0 (0.0%) | 0 (0.0%) |
| $2,500 to $4,999 | 0 (0.0%) | 0 (0.0%) |
| $5,000 to $7,499 | 0 (0.0%) | 0 (0.0%) |
| $7,500 to $9,999 | 0 (0.0%) | 0 (0.0%) |
| $10,000 to $12,499 | 0 (0.0%) | 0 (0.0%) |
| $12,500 to $14,999 | 0 (0.0%) | 0 (0.0%) |
| $15,000 to $17,499 | 0 (0.0%) | 0 (0.0%) |
| $17,500 to $19,999 | 0 (0.0%) | 0 (0.0%) |
| $20,000 to $22,499 | 0 (0.0%) | 1 (4.2%) |
| $22,500 to $24,999 | 0 (0.0%) | 0 (0.0%) |
| $25,000 to $29,999 | 0 (0.0%) | 0 (0.0%) |
| $30,000 to $34,999 | 3 (6.7%) | 0 (0.0%) |
| $35,000 to $39,999 | 0 (0.0%) | 17 (70.8%) |
| $40,000 to $44,999 | 4 (8.9%) | 1 (4.2%) |
| $45,000 to $49,999 | 0 (0.0%) | 0 (0.0%) |
| $50,000 to $54,999 | 0 (0.0%) | 0 (0.0%) |
| $55,000 to $64,999 | 0 (0.0%) | 2 (8.3%) |
| $65,000 to $74,999 | 6 (13.3%) | 0 (0.0%) |
| $75,000 to $99,999 | 32 (71.1%) | 3 (12.5%) |
| $100,000+ | 0 (0.0%) | 0 (0.0%) |
| Total | 45 (100.0%) | 24 (100.0%) |
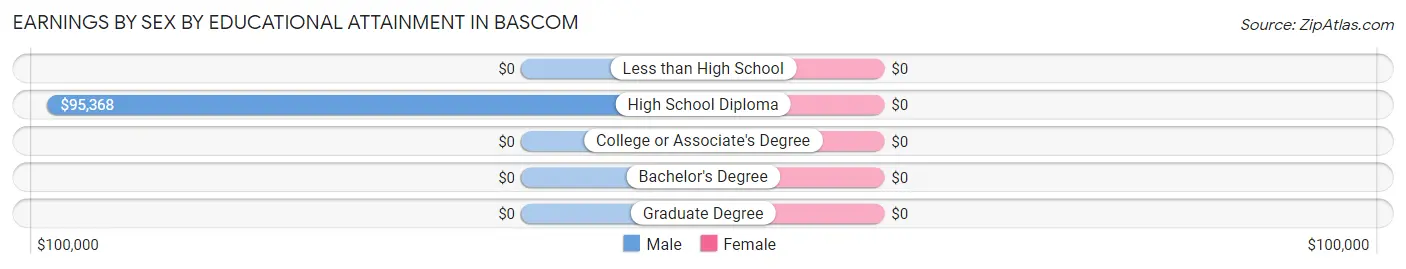
Earnings by Sex by Educational Attainment in Bascom
| Educational Attainment | Male Income | Female Income |
| Less than High School | - | - |
| High School Diploma | $95,368 | $0 |
| College or Associate's Degree | - | - |
| Bachelor's Degree | - | - |
| Graduate Degree | - | - |
| Total | $79,875 | $39,375 |
Family Income in Bascom
Family Income Brackets in Bascom
According to the Bascom family income data, there are 11 families falling into the $75,000 to $99,999 income range, which is the most common income bracket and makes up 28.9% of all families.
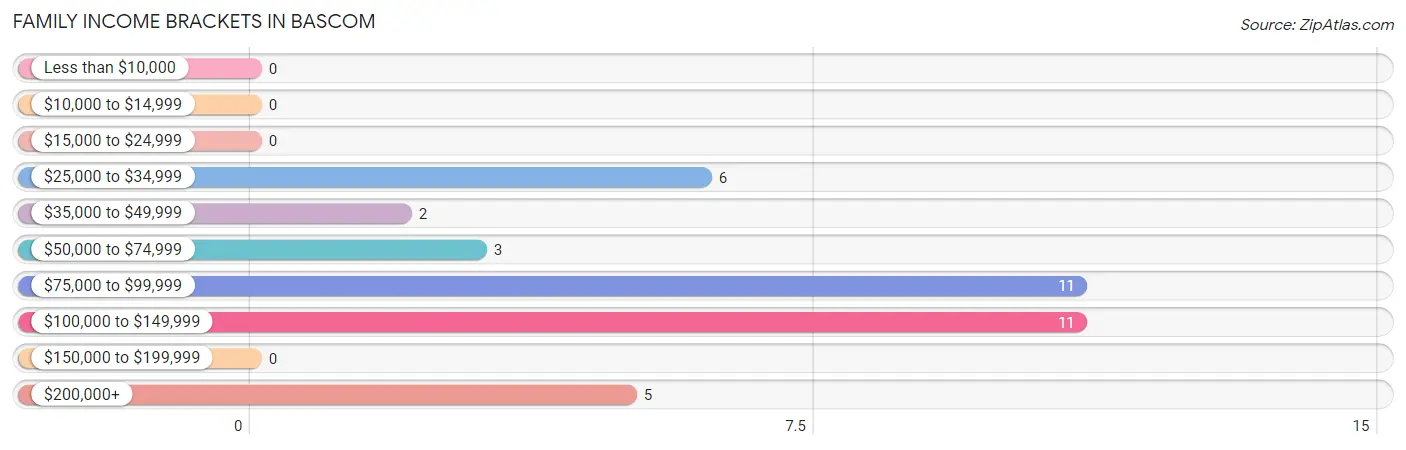
| Income Bracket | # Families | % Families |
| Less than $10,000 | 0 | 0.0% |
| $10,000 to $14,999 | 0 | 0.0% |
| $15,000 to $24,999 | 0 | 0.0% |
| $25,000 to $34,999 | 6 | 15.8% |
| $35,000 to $49,999 | 2 | 5.3% |
| $50,000 to $74,999 | 3 | 7.9% |
| $75,000 to $99,999 | 11 | 28.9% |
| $100,000 to $149,999 | 11 | 28.9% |
| $150,000 to $199,999 | 0 | 0.0% |
| $200,000+ | 5 | 13.2% |
Family Income by Famaliy Size in Bascom
2-person families (27 | 71.1%) account for the highest median family income in Bascom with $79,375 per family, while 2-person families (27 | 71.1%) have the highest median income of $39,688 per family member.
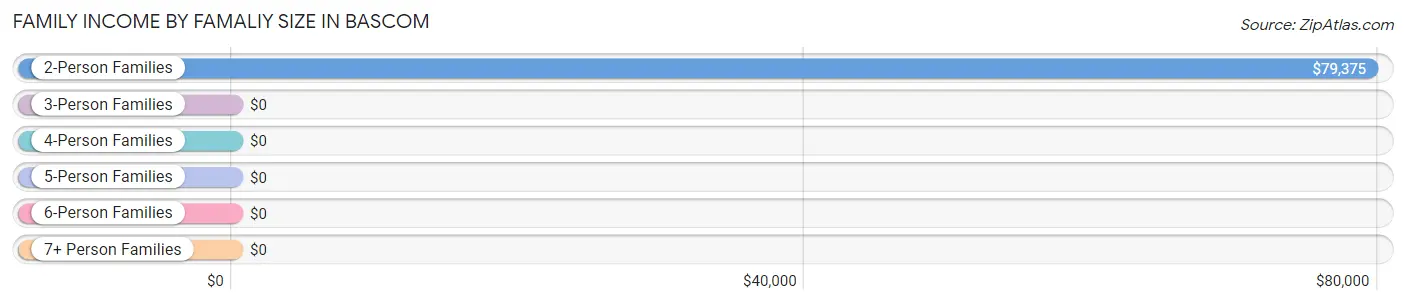
| Income Bracket | # Families | Median Income |
| 2-Person Families | 27 (71.1%) | $79,375 |
| 3-Person Families | 3 (7.9%) | $0 |
| 4-Person Families | 5 (13.2%) | $0 |
| 5-Person Families | 3 (7.9%) | $0 |
| 6-Person Families | 0 (0.0%) | $0 |
| 7+ Person Families | 0 (0.0%) | $0 |
| Total | 38 (100.0%) | $0 |
Family Income by Number of Earners in Bascom
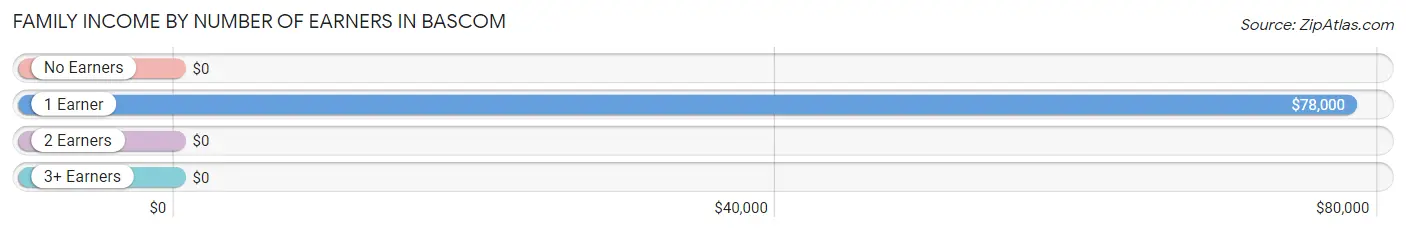
| Number of Earners | # Families | Median Income |
| No Earners | 3 (7.9%) | $0 |
| 1 Earner | 20 (52.6%) | $78,000 |
| 2 Earners | 10 (26.3%) | $0 |
| 3+ Earners | 5 (13.2%) | $0 |
| Total | 38 (100.0%) | $0 |
Household Income in Bascom
Household Income Brackets in Bascom
With 12 households falling in the category, the $35,000 to $49,999 income range is the most frequent in Bascom, accounting for 19.4% of all households.
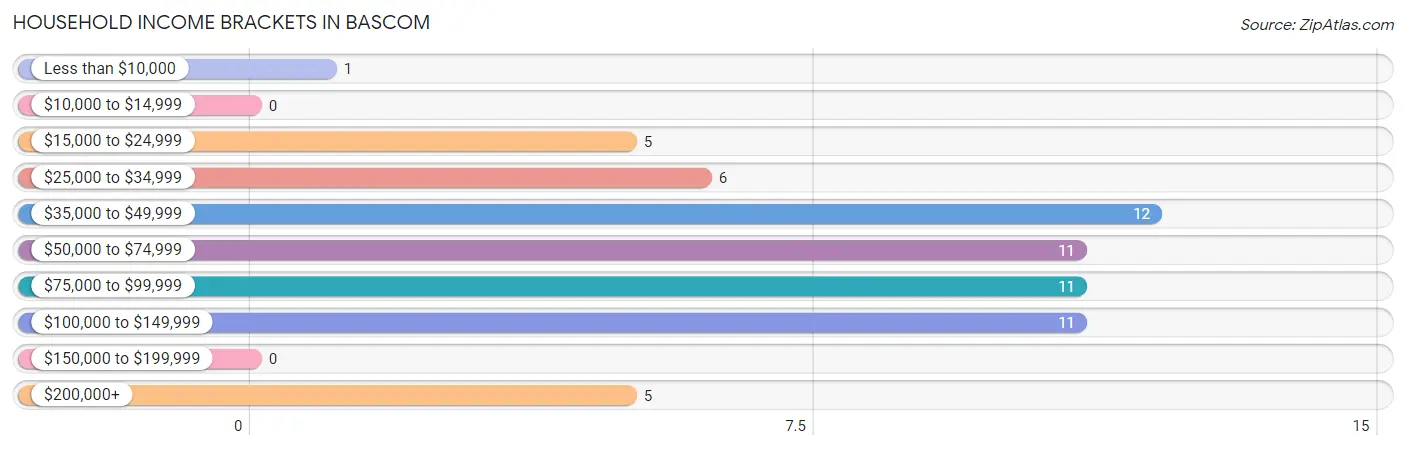
| Income Bracket | # Households | % Households |
| Less than $10,000 | 1 | 1.6% |
| $10,000 to $14,999 | 0 | 0.0% |
| $15,000 to $24,999 | 5 | 8.1% |
| $25,000 to $34,999 | 6 | 9.7% |
| $35,000 to $49,999 | 12 | 19.4% |
| $50,000 to $74,999 | 11 | 17.7% |
| $75,000 to $99,999 | 11 | 17.7% |
| $100,000 to $149,999 | 11 | 17.7% |
| $150,000 to $199,999 | 0 | 0.0% |
| $200,000+ | 5 | 8.1% |
Household Income by Householder Age in Bascom
The median household income in Bascom is $68,000, with the highest median household income of $78,875 found in the 45 to 64 years age bracket for the primary householder. A total of 31 households (50.0%) fall into this category.
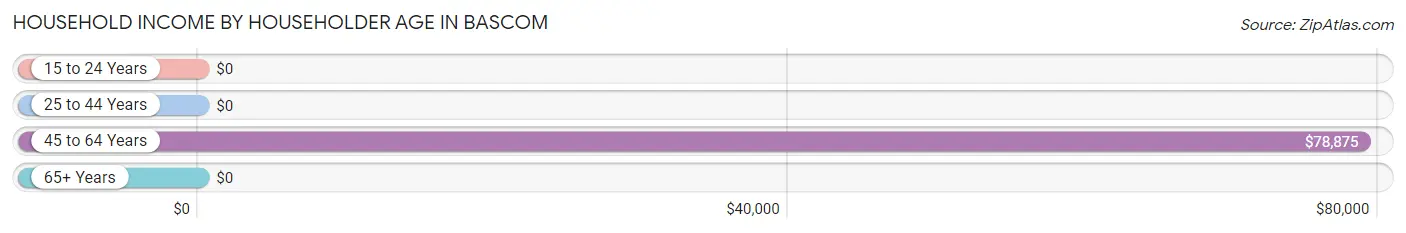
| Income Bracket | # Households | Median Income |
| 15 to 24 Years | 0 (0.0%) | $0 |
| 25 to 44 Years | 5 (8.1%) | $0 |
| 45 to 64 Years | 31 (50.0%) | $78,875 |
| 65+ Years | 26 (41.9%) | $0 |
| Total | 62 (100.0%) | $68,000 |
Poverty in Bascom
Income Below Poverty by Sex and Age in Bascom
With 8.7% poverty level for males and 9.3% for females among the residents of Bascom, 6 to 11 year old males and 6 to 11 year old females are the most vulnerable to poverty, with 2 males (100.0%) and 2 females (100.0%) in their respective age groups living below the poverty level.
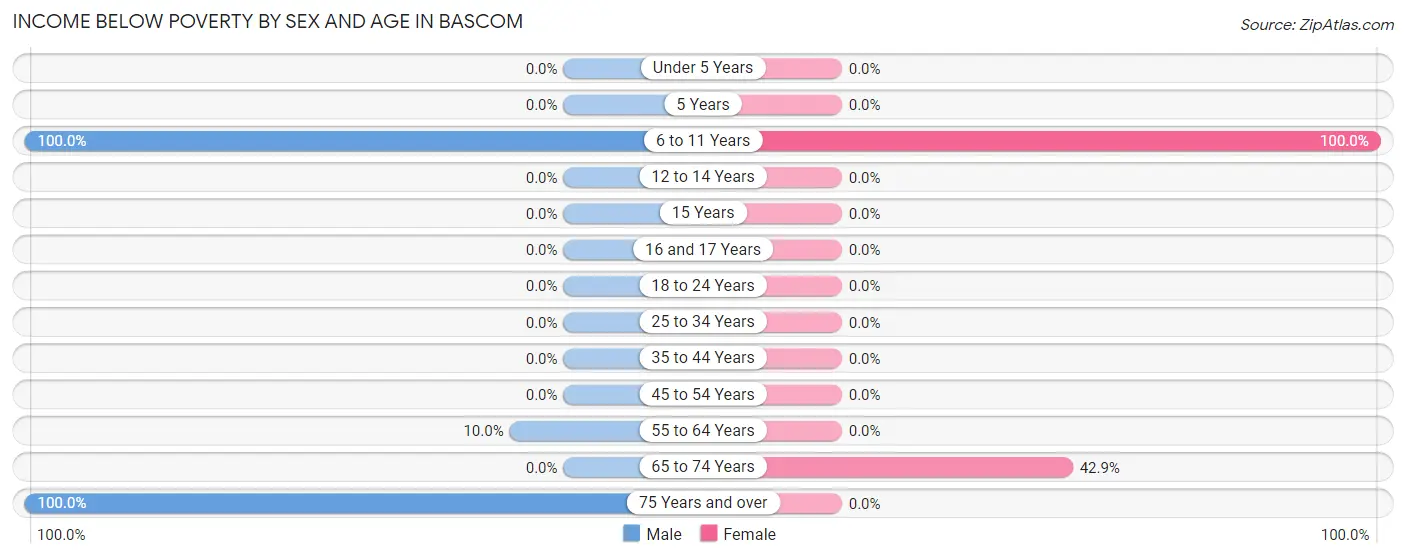
| Age Bracket | Male | Female |
| Under 5 Years | 0 (0.0%) | 0 (0.0%) |
| 5 Years | 0 (0.0%) | 0 (0.0%) |
| 6 to 11 Years | 2 (100.0%) | 2 (100.0%) |
| 12 to 14 Years | 0 (0.0%) | 0 (0.0%) |
| 15 Years | 0 (0.0%) | 0 (0.0%) |
| 16 and 17 Years | 0 (0.0%) | 0 (0.0%) |
| 18 to 24 Years | 0 (0.0%) | 0 (0.0%) |
| 25 to 34 Years | 0 (0.0%) | 0 (0.0%) |
| 35 to 44 Years | 0 (0.0%) | 0 (0.0%) |
| 45 to 54 Years | 0 (0.0%) | 0 (0.0%) |
| 55 to 64 Years | 1 (10.0%) | 0 (0.0%) |
| 65 to 74 Years | 0 (0.0%) | 3 (42.9%) |
| 75 Years and over | 3 (100.0%) | 0 (0.0%) |
| Total | 6 (8.7%) | 5 (9.3%) |
Income Above Poverty by Sex and Age in Bascom
According to the poverty statistics in Bascom, males aged 12 to 14 years and females aged 15 years are the age groups that are most secure financially, with 100.0% of males and 100.0% of females in these age groups living above the poverty line.
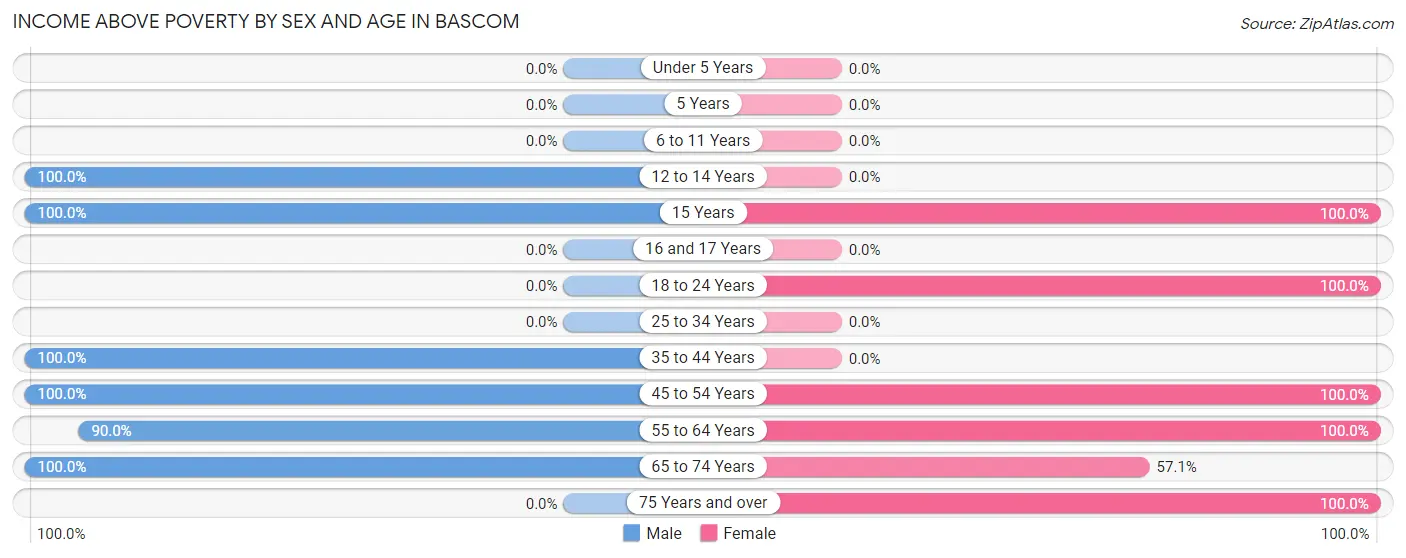
| Age Bracket | Male | Female |
| Under 5 Years | 0 (0.0%) | 0 (0.0%) |
| 5 Years | 0 (0.0%) | 0 (0.0%) |
| 6 to 11 Years | 0 (0.0%) | 0 (0.0%) |
| 12 to 14 Years | 4 (100.0%) | 0 (0.0%) |
| 15 Years | 5 (100.0%) | 1 (100.0%) |
| 16 and 17 Years | 0 (0.0%) | 0 (0.0%) |
| 18 to 24 Years | 0 (0.0%) | 7 (100.0%) |
| 25 to 34 Years | 0 (0.0%) | 0 (0.0%) |
| 35 to 44 Years | 5 (100.0%) | 0 (0.0%) |
| 45 to 54 Years | 28 (100.0%) | 22 (100.0%) |
| 55 to 64 Years | 9 (90.0%) | 6 (100.0%) |
| 65 to 74 Years | 12 (100.0%) | 4 (57.1%) |
| 75 Years and over | 0 (0.0%) | 9 (100.0%) |
| Total | 63 (91.3%) | 49 (90.7%) |
Income Below Poverty Among Married-Couple Families in Bascom
The poverty statistics for married-couple families in Bascom show that 8.6% or 3 of the total 35 families live below the poverty line. Families with 3 or 4 children have the highest poverty rate of 100.0%, comprising of 3 families. On the other hand, families with no children have the lowest poverty rate of 0.0%, which includes 0 families.
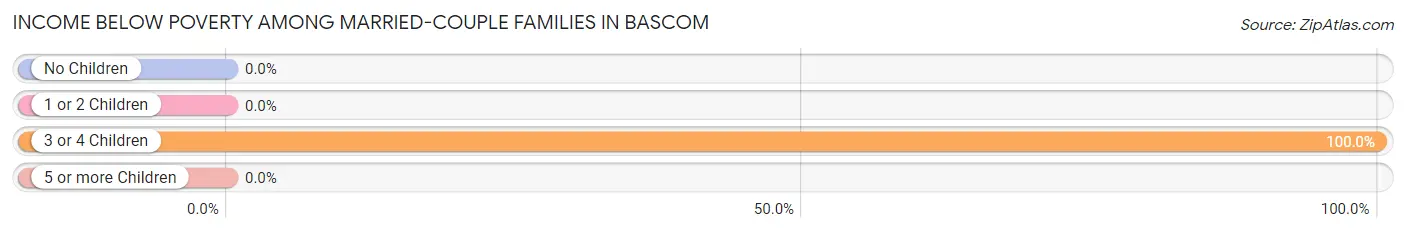
| Children | Above Poverty | Below Poverty |
| No Children | 25 (100.0%) | 0 (0.0%) |
| 1 or 2 Children | 7 (100.0%) | 0 (0.0%) |
| 3 or 4 Children | 0 (0.0%) | 3 (100.0%) |
| 5 or more Children | 0 (0.0%) | 0 (0.0%) |
| Total | 32 (91.4%) | 3 (8.6%) |
Income Below Poverty Among Single-Parent Households in Bascom
| Children | Single Father | Single Mother |
| No Children | 0 (0.0%) | 0 (0.0%) |
| 1 or 2 Children | 0 (0.0%) | 0 (0.0%) |
| 3 or 4 Children | 0 (0.0%) | 0 (0.0%) |
| 5 or more Children | 0 (0.0%) | 0 (0.0%) |
| Total | 0 (0.0%) | 0 (0.0%) |
Income Below Poverty Among Married-Couple vs Single-Parent Households in Bascom
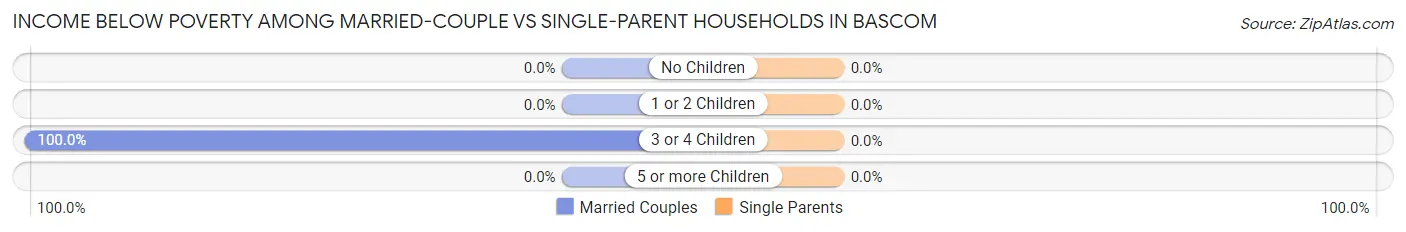
| Children | Married-Couple Families | Single-Parent Households |
| No Children | 0 (0.0%) | 0 (0.0%) |
| 1 or 2 Children | 0 (0.0%) | 0 (0.0%) |
| 3 or 4 Children | 3 (100.0%) | 0 (0.0%) |
| 5 or more Children | 0 (0.0%) | 0 (0.0%) |
| Total | 3 (8.6%) | 0 (0.0%) |
Race in Bascom
The most populous races in Bascom are White / Caucasian (117 | 95.1%), Hispanic or Latino (6 | 4.9%), and Some other Race (6 | 4.9%).
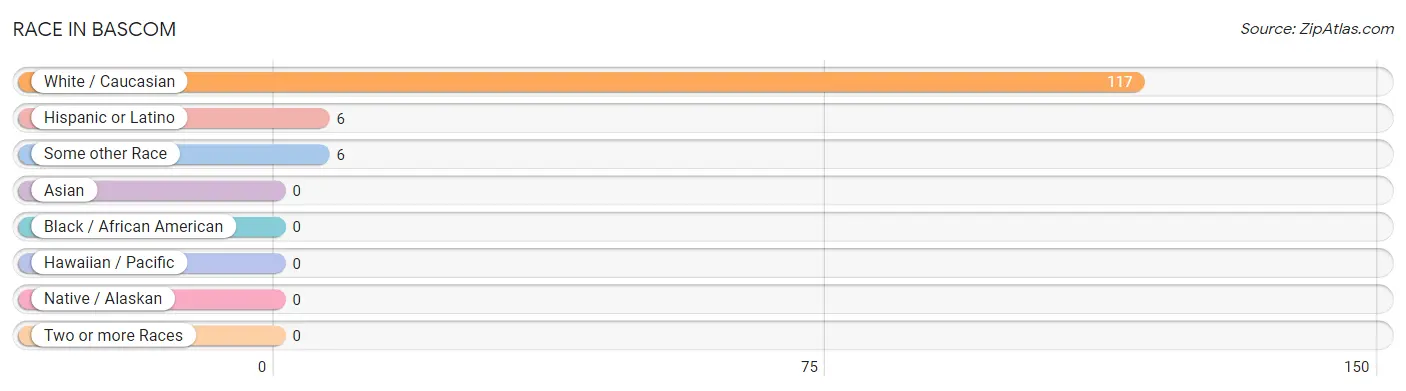
| Race | # Population | % Population |
| Asian | 0 | 0.0% |
| Black / African American | 0 | 0.0% |
| Hawaiian / Pacific | 0 | 0.0% |
| Hispanic or Latino | 6 | 4.9% |
| Native / Alaskan | 0 | 0.0% |
| White / Caucasian | 117 | 95.1% |
| Two or more Races | 0 | 0.0% |
| Some other Race | 6 | 4.9% |
| Total | 123 | 100.0% |
Ancestry in Bascom
The most populous ancestries reported in Bascom are American (58 | 47.1%), Irish (14 | 11.4%), Mexican (6 | 4.9%), English (4 | 3.3%), and Scotch-Irish (3 | 2.4%), together accounting for 69.1% of all Bascom residents.
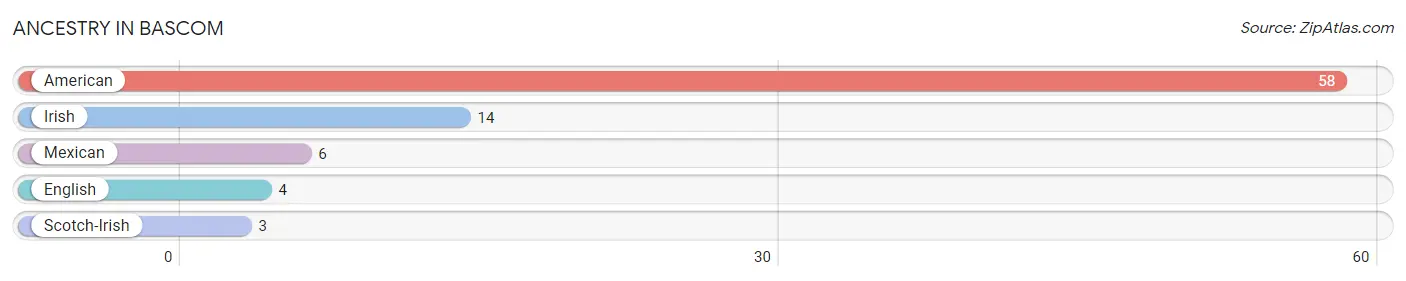
| Ancestry | # Population | % Population |
| American | 58 | 47.1% |
| English | 4 | 3.3% |
| Irish | 14 | 11.4% |
| Mexican | 6 | 4.9% |
| Scotch-Irish | 3 | 2.4% | View All 5 Rows |
Immigrants in Bascom
The most numerous immigrant groups reported in Bascom came from Central America (6 | 4.9%), Latin America (6 | 4.9%), and Mexico (6 | 4.9%), together accounting for 14.6% of all Bascom residents.
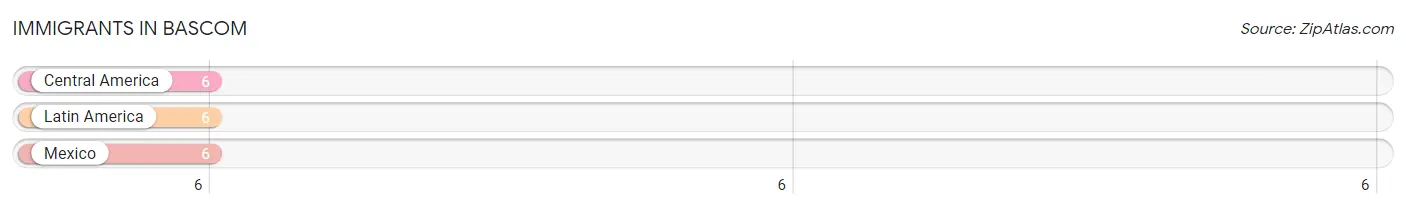
| Immigration Origin | # Population | % Population |
| Central America | 6 | 4.9% |
| Latin America | 6 | 4.9% |
| Mexico | 6 | 4.9% | View All 3 Rows |
Sex and Age in Bascom
Sex and Age in Bascom
The most populous age groups in Bascom are 45 to 49 Years (27 | 39.1%) for men and 45 to 49 Years (11 | 20.4%) for women.
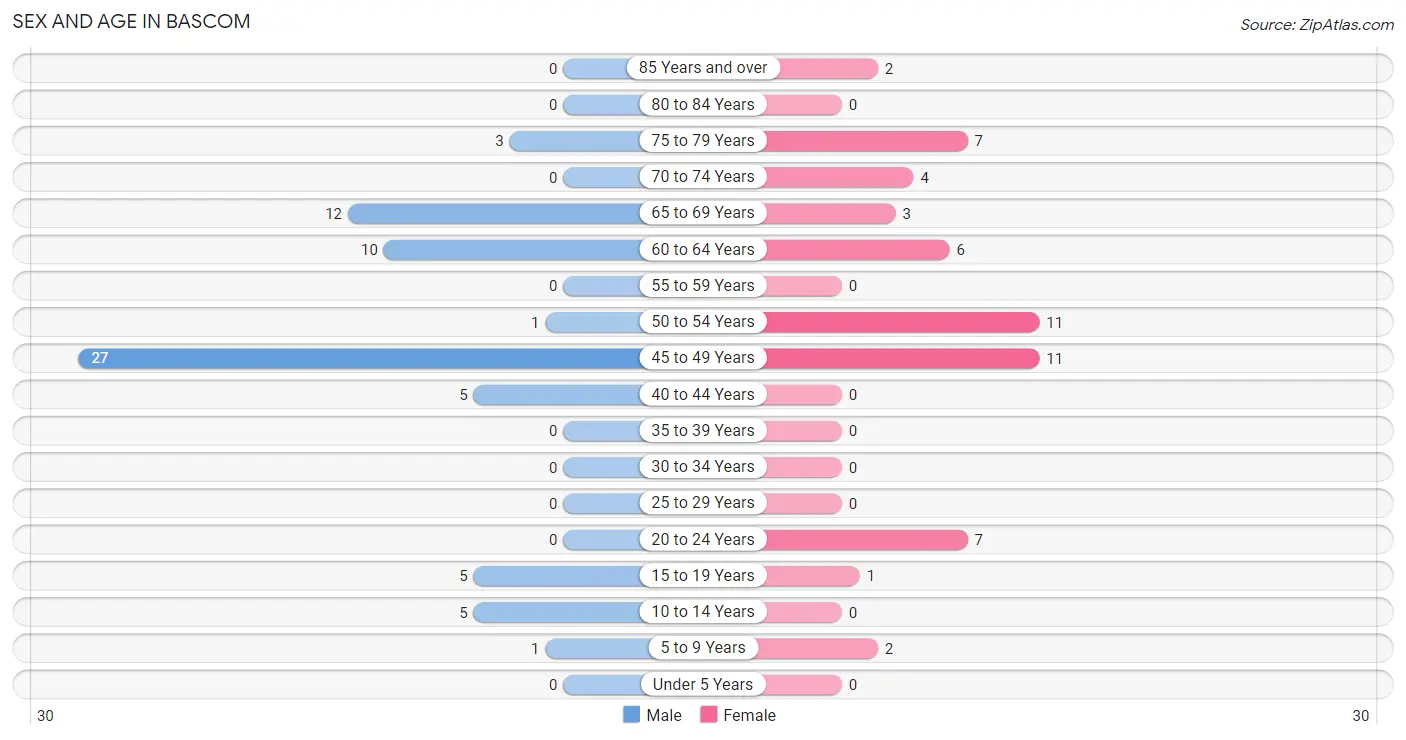
| Age Bracket | Male | Female |
| Under 5 Years | 0 (0.0%) | 0 (0.0%) |
| 5 to 9 Years | 1 (1.5%) | 2 (3.7%) |
| 10 to 14 Years | 5 (7.2%) | 0 (0.0%) |
| 15 to 19 Years | 5 (7.2%) | 1 (1.8%) |
| 20 to 24 Years | 0 (0.0%) | 7 (13.0%) |
| 25 to 29 Years | 0 (0.0%) | 0 (0.0%) |
| 30 to 34 Years | 0 (0.0%) | 0 (0.0%) |
| 35 to 39 Years | 0 (0.0%) | 0 (0.0%) |
| 40 to 44 Years | 5 (7.2%) | 0 (0.0%) |
| 45 to 49 Years | 27 (39.1%) | 11 (20.4%) |
| 50 to 54 Years | 1 (1.5%) | 11 (20.4%) |
| 55 to 59 Years | 0 (0.0%) | 0 (0.0%) |
| 60 to 64 Years | 10 (14.5%) | 6 (11.1%) |
| 65 to 69 Years | 12 (17.4%) | 3 (5.6%) |
| 70 to 74 Years | 0 (0.0%) | 4 (7.4%) |
| 75 to 79 Years | 3 (4.3%) | 7 (13.0%) |
| 80 to 84 Years | 0 (0.0%) | 0 (0.0%) |
| 85 Years and over | 0 (0.0%) | 2 (3.7%) |
| Total | 69 (100.0%) | 54 (100.0%) |
Families and Households in Bascom
Median Family Size in Bascom
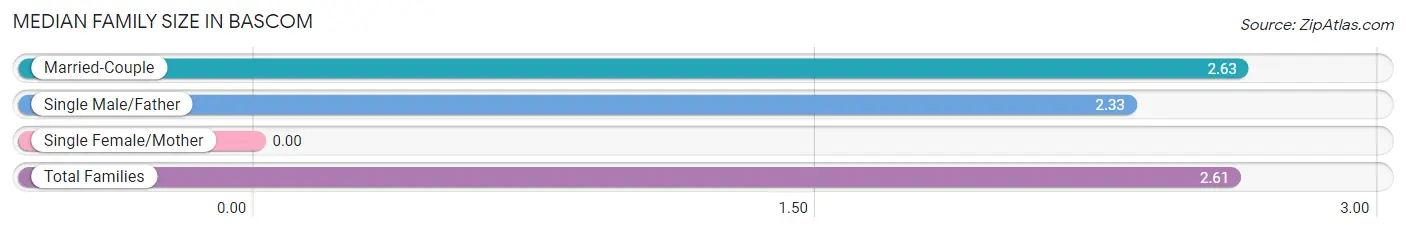
| Family Type | # Families | Family Size |
| Married-Couple | 35 (92.1%) | 2.63 |
| Single Male/Father | 3 (7.9%) | 2.33 |
| Single Female/Mother | 0 (0.0%) | - |
| Total Families | 38 (100.0%) | 2.61 |
Median Household Size in Bascom
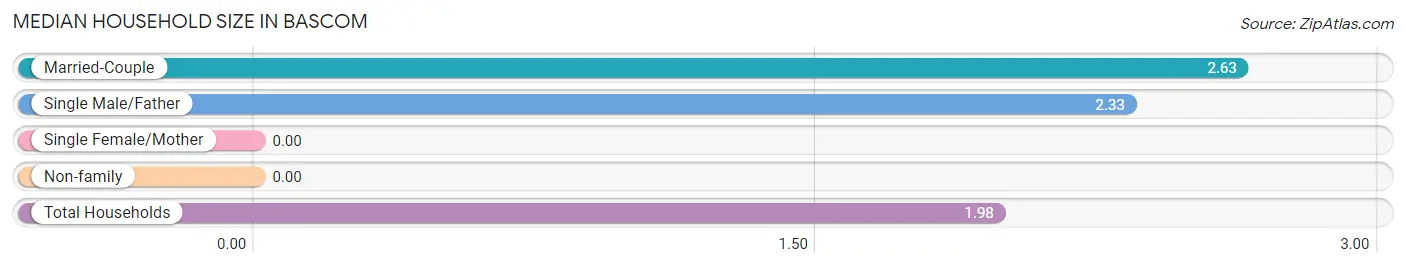
| Household Type | # Households | Household Size |
| Married-Couple | 35 (56.5%) | 2.63 |
| Single Male/Father | 3 (4.8%) | 2.33 |
| Single Female/Mother | 0 (0.0%) | - |
| Non-family | 24 (38.7%) | - |
| Total Households | 62 (100.0%) | 1.98 |
Household Size by Marriage Status in Bascom
Out of a total of 62 households in Bascom, 38 (61.3%) are family households, while 24 (38.7%) are nonfamily households. The most numerous type of family households are 2-person households, comprising 27, and the most common type of nonfamily households are 1-person households, comprising 24.
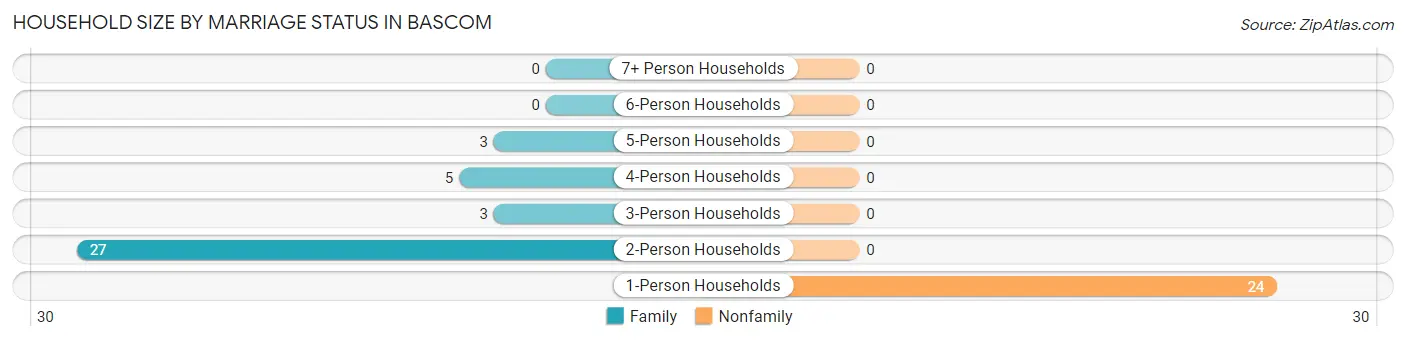
| Household Size | Family Households | Nonfamily Households |
| 1-Person Households | - | 24 (38.7%) |
| 2-Person Households | 27 (43.5%) | 0 (0.0%) |
| 3-Person Households | 3 (4.8%) | 0 (0.0%) |
| 4-Person Households | 5 (8.1%) | 0 (0.0%) |
| 5-Person Households | 3 (4.8%) | 0 (0.0%) |
| 6-Person Households | 0 (0.0%) | 0 (0.0%) |
| 7+ Person Households | 0 (0.0%) | 0 (0.0%) |
| Total | 38 (61.3%) | 24 (38.7%) |
Female Fertility in Bascom
Fertility by Age in Bascom
| Age Bracket | Women with Births | Births / 1,000 Women |
| 15 to 19 years | 0 (0.0%) | 0.0 |
| 20 to 34 years | 0 (0.0%) | 0.0 |
| 35 to 50 years | 0 (0.0%) | 0.0 |
| Total | 0 (0.0%) | 0.0 |
Fertility by Age by Marriage Status in Bascom
| Age Bracket | Married | Unmarried |
| 15 to 19 years | 0 (0.0%) | 0 (0.0%) |
| 20 to 34 years | 0 (0.0%) | 0 (0.0%) |
| 35 to 50 years | 0 (0.0%) | 0 (0.0%) |
| Total | 0 (0.0%) | 0 (0.0%) |
Fertility by Education in Bascom
| Educational Attainment | Women with Births | Births / 1,000 Women |
| Less than High School | 0 (0.0%) | 0.0 |
| High School Diploma | 0 (0.0%) | 0.0 |
| College or Associate's Degree | 0 (0.0%) | 0.0 |
| Bachelor's Degree | 0 (0.0%) | 0.0 |
| Graduate Degree | 0 (0.0%) | 0.0 |
| Total | 0 (0.0%) | 0.0 |
Fertility by Education by Marriage Status in Bascom
| Educational Attainment | Married | Unmarried |
| Less than High School | 0 (0.0%) | 0 (0.0%) |
| High School Diploma | 0 (0.0%) | 0 (0.0%) |
| College or Associate's Degree | 0 (0.0%) | 0 (0.0%) |
| Bachelor's Degree | 0 (0.0%) | 0 (0.0%) |
| Graduate Degree | 0 (0.0%) | 0 (0.0%) |
| Total | 0 (0.0%) | 0 (0.0%) |
Employment Characteristics in Bascom
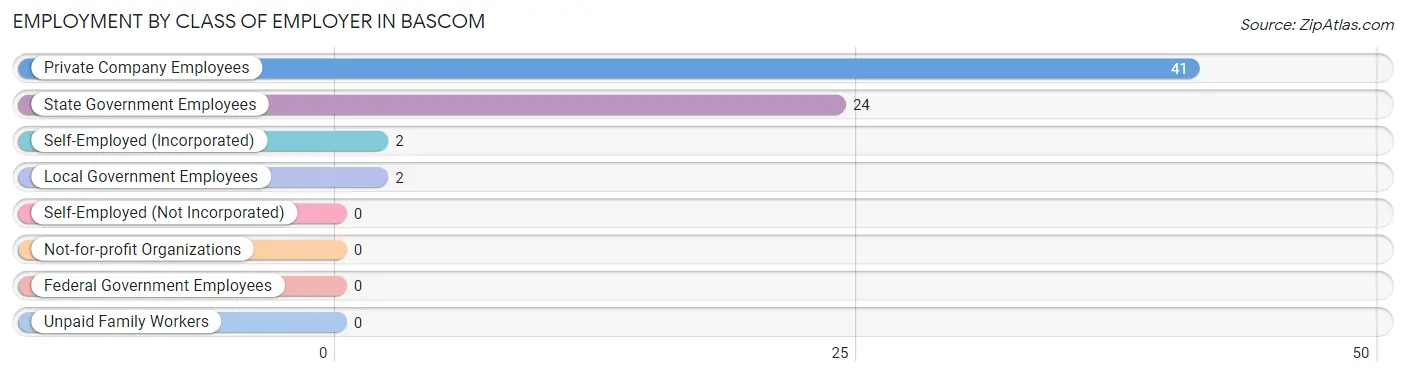
Employment by Class of Employer in Bascom
Among the 69 employed individuals in Bascom, private company employees (41 | 59.4%), state government employees (24 | 34.8%), and self-employed (incorporated) (2 | 2.9%) make up the most common classes of employment.
| Employer Class | # Employees | % Employees |
| Private Company Employees | 41 | 59.4% |
| Self-Employed (Incorporated) | 2 | 2.9% |
| Self-Employed (Not Incorporated) | 0 | 0.0% |
| Not-for-profit Organizations | 0 | 0.0% |
| Local Government Employees | 2 | 2.9% |
| State Government Employees | 24 | 34.8% |
| Federal Government Employees | 0 | 0.0% |
| Unpaid Family Workers | 0 | 0.0% |
| Total | 69 | 100.0% |
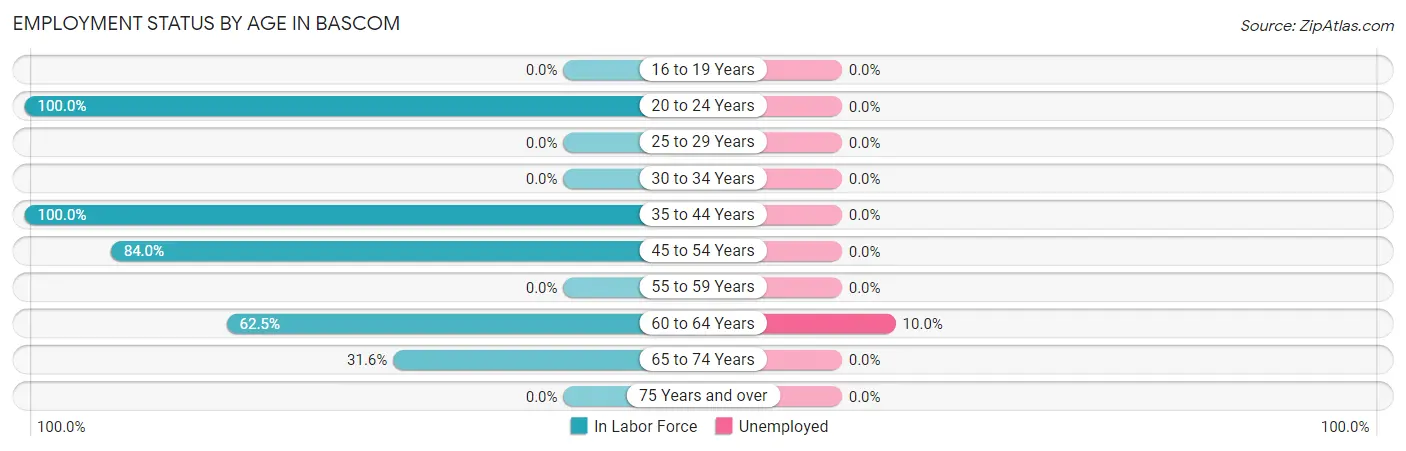
Employment Status by Age in Bascom
According to the labor force statistics for Bascom, out of the total population over 16 years of age (109), 64.2% or 70 individuals are in the labor force, with 1.4% or 1 of them unemployed. The age group with the highest labor force participation rate is 20 to 24 years, with 100.0% or 7 individuals in the labor force. Within the labor force, the 60 to 64 years age range has the highest percentage of unemployed individuals, with 10.0% or 1 of them being unemployed.
| Age Bracket | In Labor Force | Unemployed |
| 16 to 19 Years | 0 (0.0%) | 0 (0.0%) |
| 20 to 24 Years | 7 (100.0%) | 0 (0.0%) |
| 25 to 29 Years | 0 (0.0%) | 0 (0.0%) |
| 30 to 34 Years | 0 (0.0%) | 0 (0.0%) |
| 35 to 44 Years | 5 (100.0%) | 0 (0.0%) |
| 45 to 54 Years | 42 (84.0%) | 0 (0.0%) |
| 55 to 59 Years | 0 (0.0%) | 0 (0.0%) |
| 60 to 64 Years | 10 (62.5%) | 1 (10.0%) |
| 65 to 74 Years | 6 (31.6%) | 0 (0.0%) |
| 75 Years and over | 0 (0.0%) | 0 (0.0%) |
| Total | 70 (64.2%) | 1 (1.4%) |
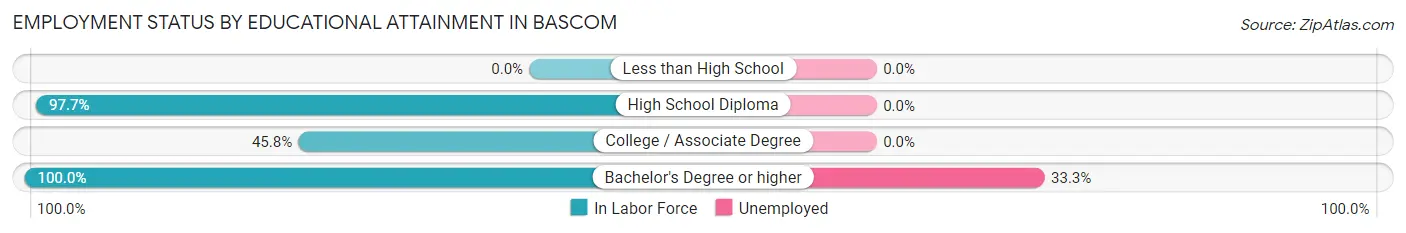
Employment Status by Educational Attainment in Bascom
According to labor force statistics for Bascom, 80.3% of individuals (57) out of the total population between 25 and 64 years of age (71) are in the labor force, with 1.8% or 1 of them being unemployed. The group with the highest labor force participation rate are those with the educational attainment of bachelor's degree or higher, with 100.0% or 3 individuals in the labor force. Within the labor force, individuals with bachelor's degree or higher education have the highest percentage of unemployment, with 33.3% or 1 of them being unemployed.
| Educational Attainment | In Labor Force | Unemployed |
| Less than High School | 0 (0.0%) | 0 (0.0%) |
| High School Diploma | 43 (97.7%) | 0 (0.0%) |
| College / Associate Degree | 11 (45.8%) | 0 (0.0%) |
| Bachelor's Degree or higher | 3 (100.0%) | 1 (33.3%) |
| Total | 57 (80.3%) | 1 (1.8%) |
Employment Occupations by Sex in Bascom
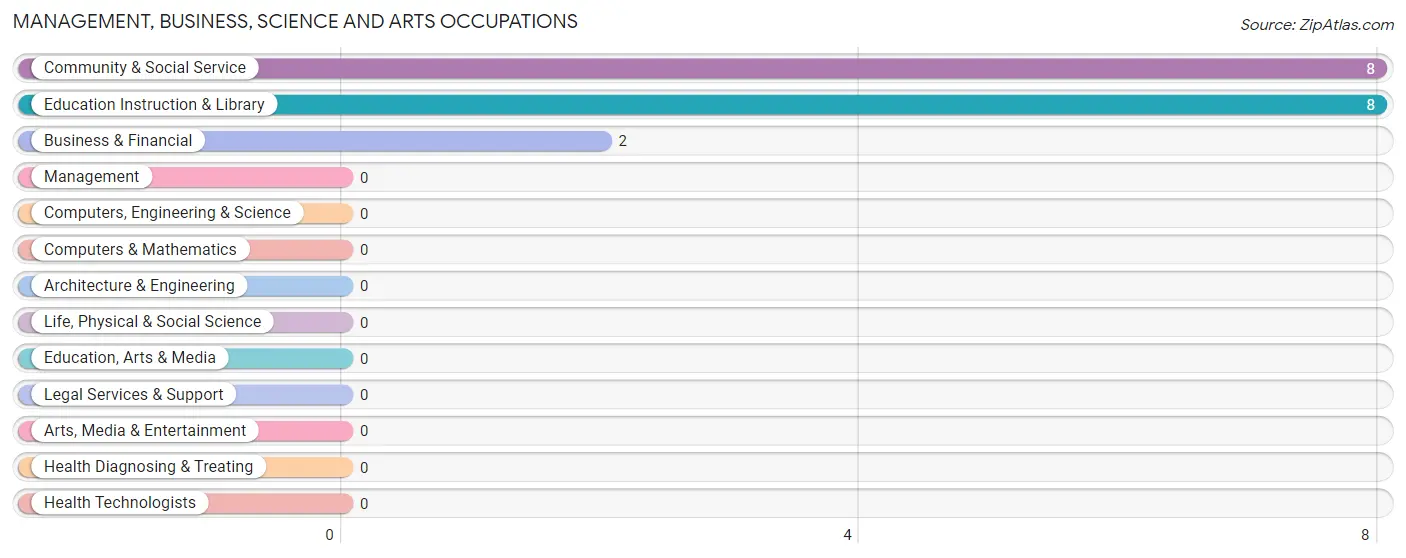
Management, Business, Science and Arts Occupations
The most common Management, Business, Science and Arts occupations in Bascom are Community & Social Service (8 | 11.6%), Education Instruction & Library (8 | 11.6%), and Business & Financial (2 | 2.9%).
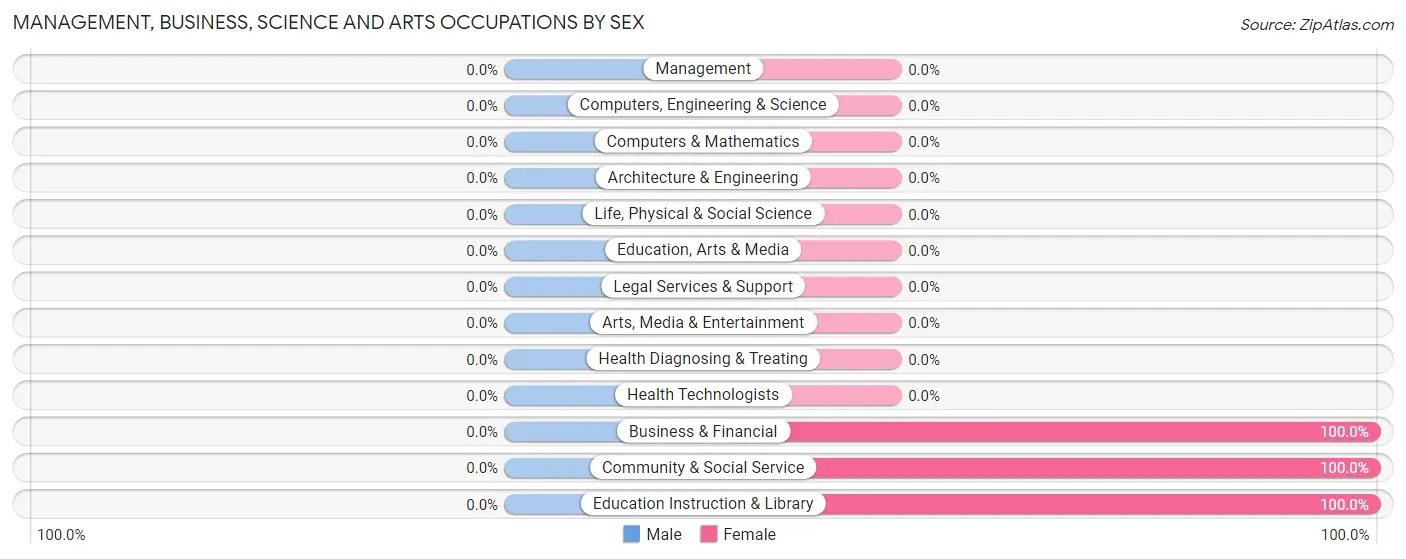
Management, Business, Science and Arts Occupations by Sex
| Occupation | Male | Female |
| Management | 0 (0.0%) | 0 (0.0%) |
| Business & Financial | 0 (0.0%) | 2 (100.0%) |
| Computers, Engineering & Science | 0 (0.0%) | 0 (0.0%) |
| Computers & Mathematics | 0 (0.0%) | 0 (0.0%) |
| Architecture & Engineering | 0 (0.0%) | 0 (0.0%) |
| Life, Physical & Social Science | 0 (0.0%) | 0 (0.0%) |
| Community & Social Service | 0 (0.0%) | 8 (100.0%) |
| Education, Arts & Media | 0 (0.0%) | 0 (0.0%) |
| Legal Services & Support | 0 (0.0%) | 0 (0.0%) |
| Education Instruction & Library | 0 (0.0%) | 8 (100.0%) |
| Arts, Media & Entertainment | 0 (0.0%) | 0 (0.0%) |
| Health Diagnosing & Treating | 0 (0.0%) | 0 (0.0%) |
| Health Technologists | 0 (0.0%) | 0 (0.0%) |
| Total (Category) | 0 (0.0%) | 10 (100.0%) |
| Total (Overall) | 45 (65.2%) | 24 (34.8%) |
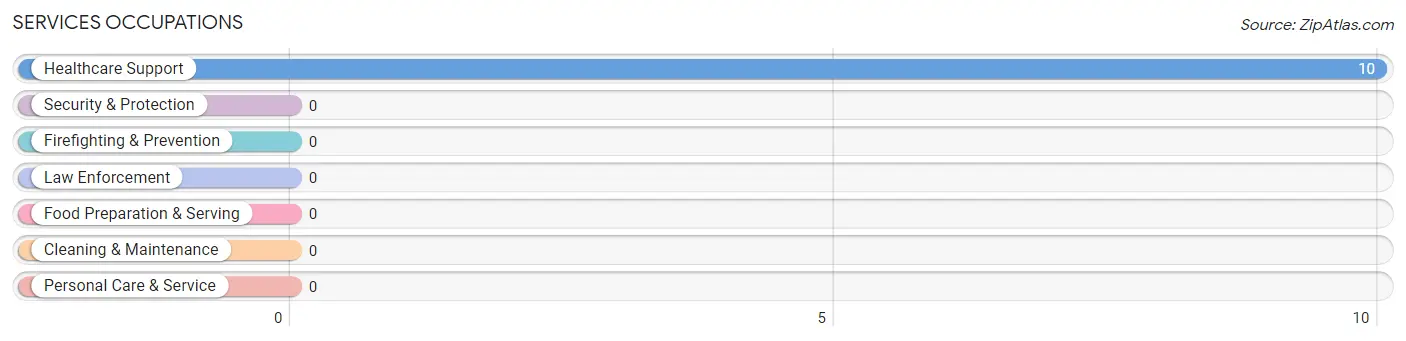
Services Occupations
The most common Services occupations in Bascom are , and Healthcare Support (10 | 14.5%).
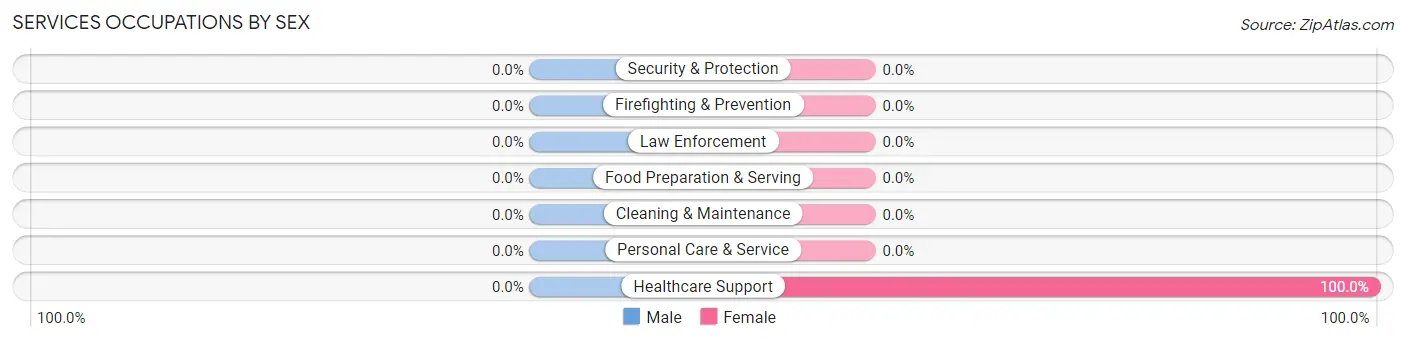
Services Occupations by Sex
| Occupation | Male | Female |
| Healthcare Support | 0 (0.0%) | 10 (100.0%) |
| Security & Protection | 0 (0.0%) | 0 (0.0%) |
| Firefighting & Prevention | 0 (0.0%) | 0 (0.0%) |
| Law Enforcement | 0 (0.0%) | 0 (0.0%) |
| Food Preparation & Serving | 0 (0.0%) | 0 (0.0%) |
| Cleaning & Maintenance | 0 (0.0%) | 0 (0.0%) |
| Personal Care & Service | 0 (0.0%) | 0 (0.0%) |
| Total (Category) | 0 (0.0%) | 10 (100.0%) |
| Total (Overall) | 45 (65.2%) | 24 (34.8%) |
Sales and Office Occupations
The most common Sales and Office occupations in Bascom are , and Office & Administration (4 | 5.8%).
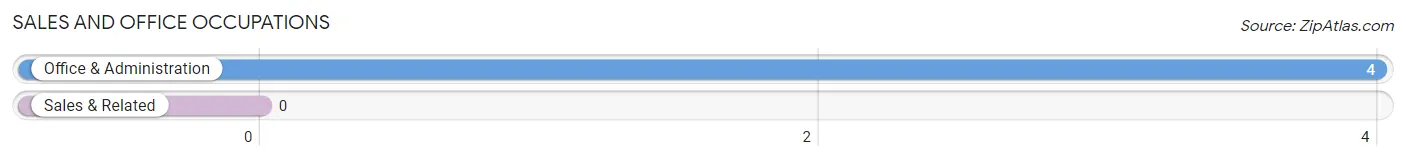
Sales and Office Occupations by Sex

| Occupation | Male | Female |
| Sales & Related | 0 (0.0%) | 0 (0.0%) |
| Office & Administration | 0 (0.0%) | 4 (100.0%) |
| Total (Category) | 0 (0.0%) | 4 (100.0%) |
| Total (Overall) | 45 (65.2%) | 24 (34.8%) |
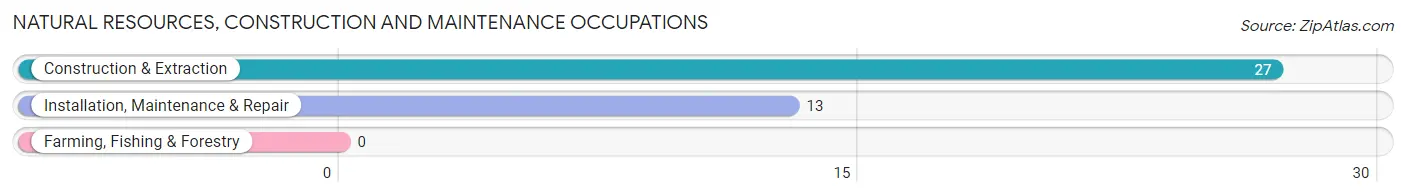
Natural Resources, Construction and Maintenance Occupations
The most common Natural Resources, Construction and Maintenance occupations in Bascom are Construction & Extraction (27 | 39.1%), and Installation, Maintenance & Repair (13 | 18.8%).
Natural Resources, Construction and Maintenance Occupations by Sex
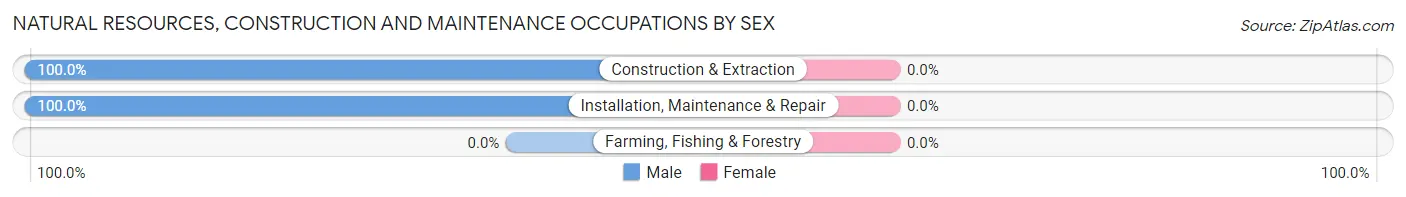
| Occupation | Male | Female |
| Farming, Fishing & Forestry | 0 (0.0%) | 0 (0.0%) |
| Construction & Extraction | 27 (100.0%) | 0 (0.0%) |
| Installation, Maintenance & Repair | 13 (100.0%) | 0 (0.0%) |
| Total (Category) | 40 (100.0%) | 0 (0.0%) |
| Total (Overall) | 45 (65.2%) | 24 (34.8%) |
Production, Transportation and Moving Occupations
The most common Production, Transportation and Moving occupations in Bascom are , and Production (5 | 7.2%).
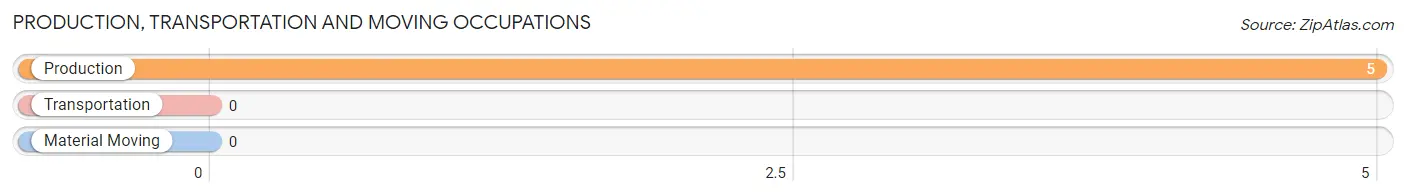
Production, Transportation and Moving Occupations by Sex
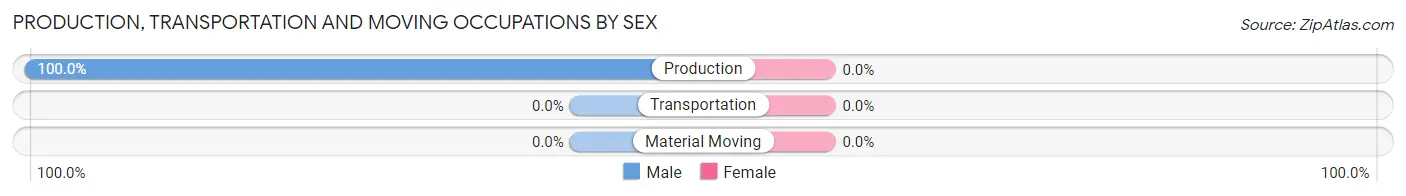
| Occupation | Male | Female |
| Production | 5 (100.0%) | 0 (0.0%) |
| Transportation | 0 (0.0%) | 0 (0.0%) |
| Material Moving | 0 (0.0%) | 0 (0.0%) |
| Total (Category) | 5 (100.0%) | 0 (0.0%) |
| Total (Overall) | 45 (65.2%) | 24 (34.8%) |
Employment Industries by Sex in Bascom
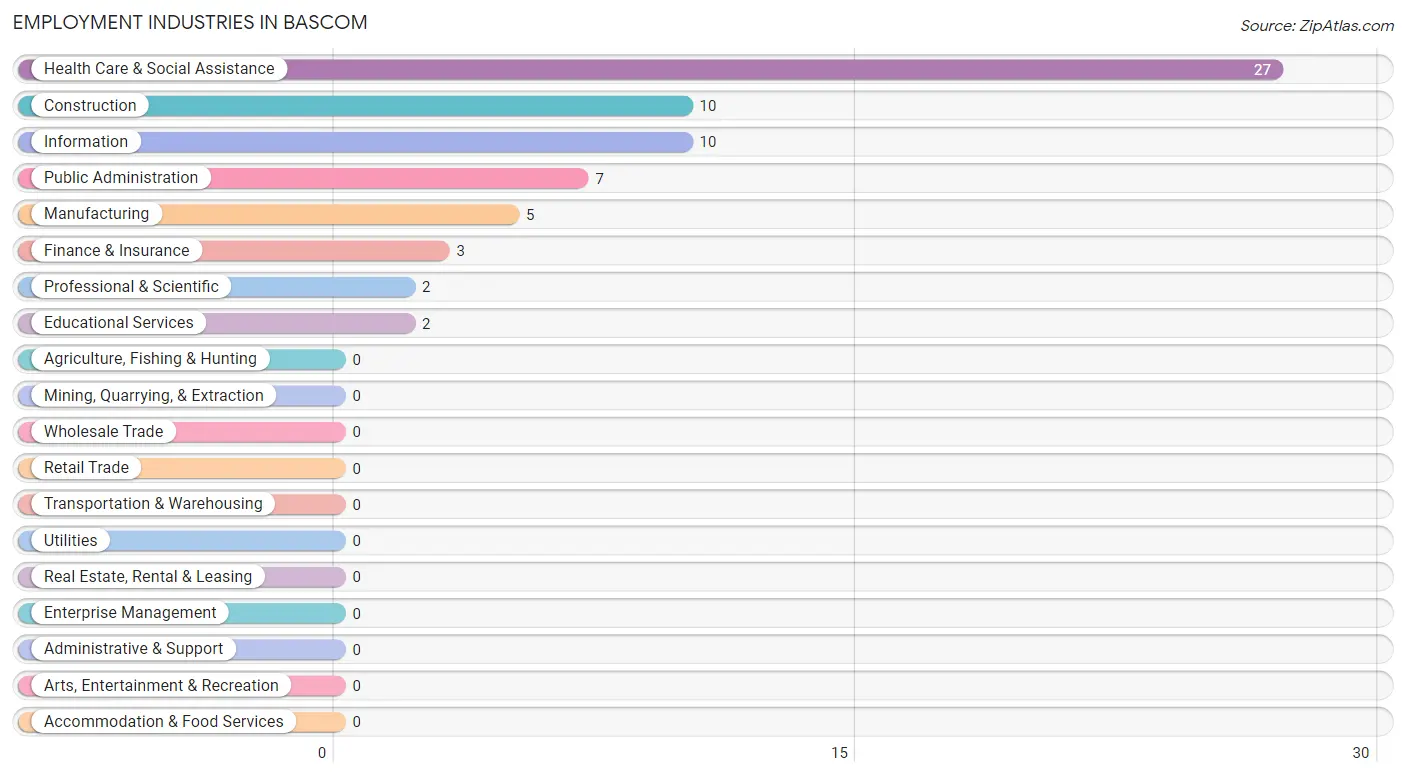
Employment Industries in Bascom
The major employment industries in Bascom include Health Care & Social Assistance (27 | 39.1%), Construction (10 | 14.5%), Information (10 | 14.5%), Public Administration (7 | 10.1%), and Manufacturing (5 | 7.2%).
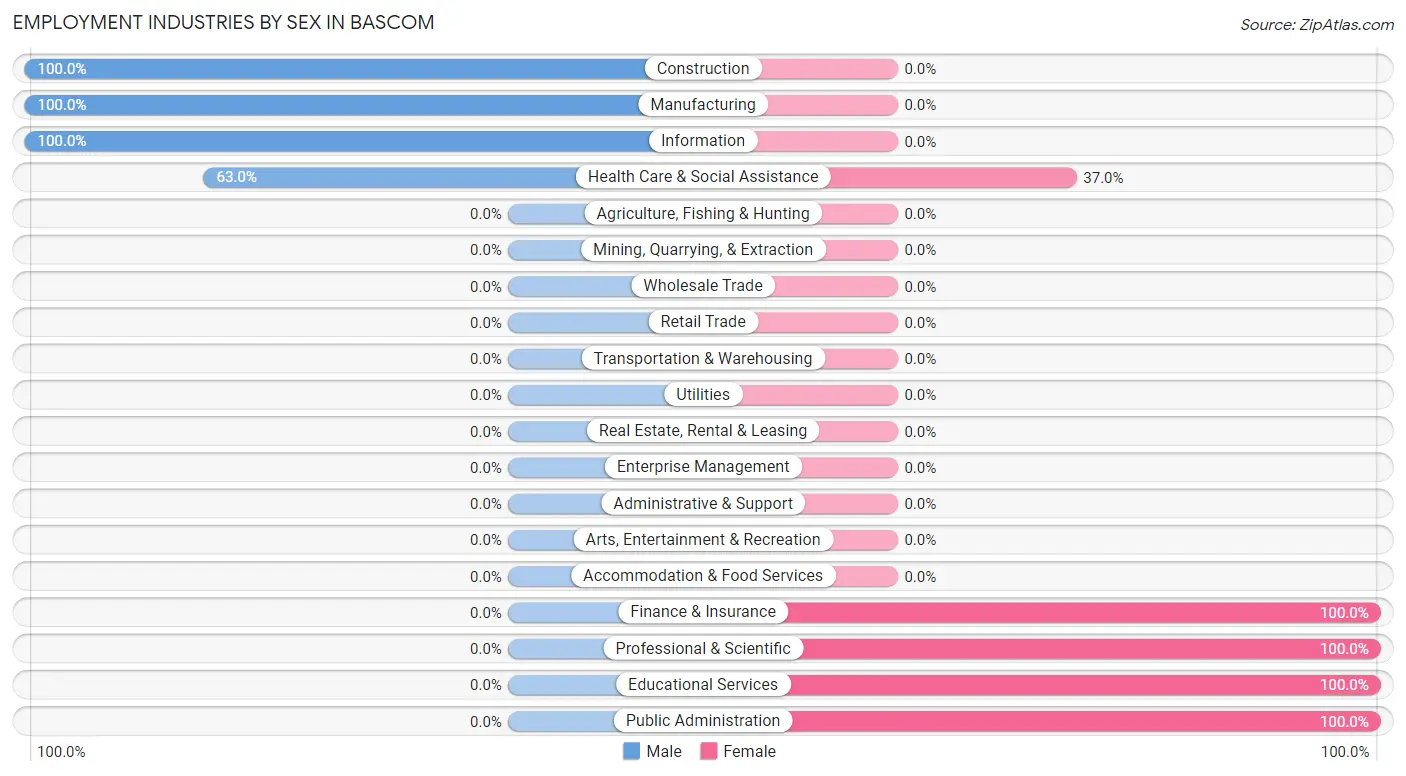
Employment Industries by Sex in Bascom
The Bascom industries that see more men than women are Construction (100.0%), Manufacturing (100.0%), and Information (100.0%), whereas the industries that tend to have a higher number of women are Finance & Insurance (100.0%), Professional & Scientific (100.0%), and Educational Services (100.0%).
| Industry | Male | Female |
| Agriculture, Fishing & Hunting | 0 (0.0%) | 0 (0.0%) |
| Mining, Quarrying, & Extraction | 0 (0.0%) | 0 (0.0%) |
| Construction | 10 (100.0%) | 0 (0.0%) |
| Manufacturing | 5 (100.0%) | 0 (0.0%) |
| Wholesale Trade | 0 (0.0%) | 0 (0.0%) |
| Retail Trade | 0 (0.0%) | 0 (0.0%) |
| Transportation & Warehousing | 0 (0.0%) | 0 (0.0%) |
| Utilities | 0 (0.0%) | 0 (0.0%) |
| Information | 10 (100.0%) | 0 (0.0%) |
| Finance & Insurance | 0 (0.0%) | 3 (100.0%) |
| Real Estate, Rental & Leasing | 0 (0.0%) | 0 (0.0%) |
| Professional & Scientific | 0 (0.0%) | 2 (100.0%) |
| Enterprise Management | 0 (0.0%) | 0 (0.0%) |
| Administrative & Support | 0 (0.0%) | 0 (0.0%) |
| Educational Services | 0 (0.0%) | 2 (100.0%) |
| Health Care & Social Assistance | 17 (63.0%) | 10 (37.0%) |
| Arts, Entertainment & Recreation | 0 (0.0%) | 0 (0.0%) |
| Accommodation & Food Services | 0 (0.0%) | 0 (0.0%) |
| Public Administration | 0 (0.0%) | 7 (100.0%) |
| Total | 45 (65.2%) | 24 (34.8%) |
Education in Bascom
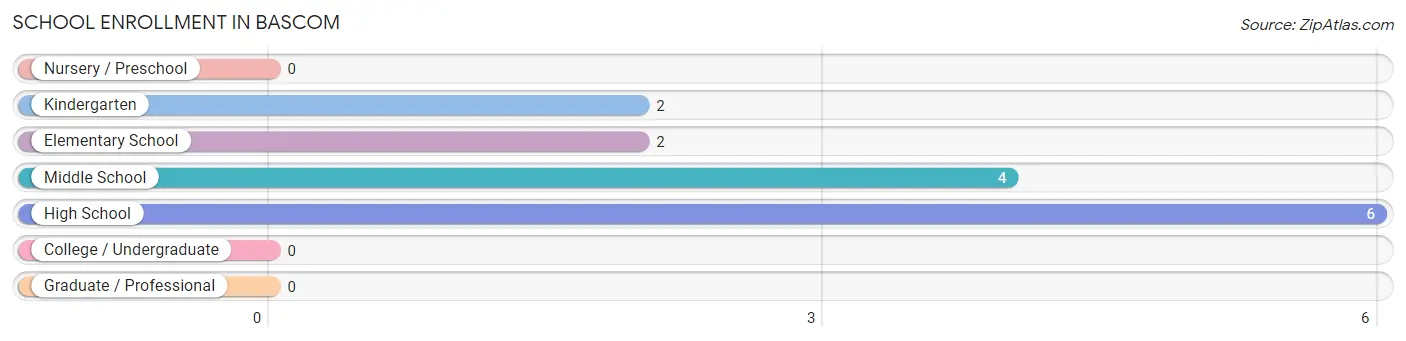
School Enrollment in Bascom
The most common levels of schooling among the 14 students in Bascom are high school (6 | 42.9%), middle school (4 | 28.6%), and kindergarten (2 | 14.3%).
| School Level | # Students | % Students |
| Nursery / Preschool | 0 | 0.0% |
| Kindergarten | 2 | 14.3% |
| Elementary School | 2 | 14.3% |
| Middle School | 4 | 28.6% |
| High School | 6 | 42.9% |
| College / Undergraduate | 0 | 0.0% |
| Graduate / Professional | 0 | 0.0% |
| Total | 14 | 100.0% |
School Enrollment by Age by Funding Source in Bascom
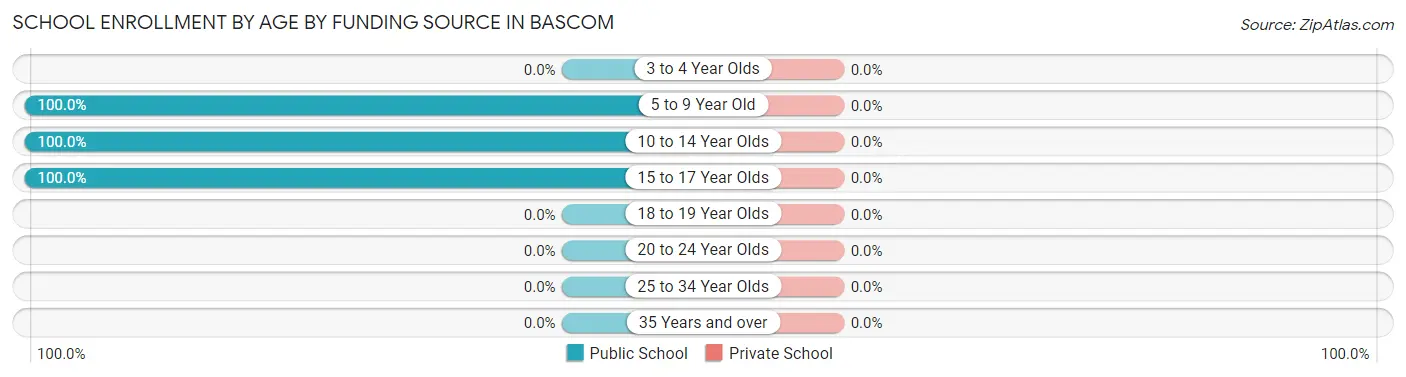
| Age Bracket | Public School | Private School |
| 3 to 4 Year Olds | 0 (0.0%) | 0 (0.0%) |
| 5 to 9 Year Old | 3 (100.0%) | 0 (0.0%) |
| 10 to 14 Year Olds | 5 (100.0%) | 0 (0.0%) |
| 15 to 17 Year Olds | 6 (100.0%) | 0 (0.0%) |
| 18 to 19 Year Olds | 0 (0.0%) | 0 (0.0%) |
| 20 to 24 Year Olds | 0 (0.0%) | 0 (0.0%) |
| 25 to 34 Year Olds | 0 (0.0%) | 0 (0.0%) |
| 35 Years and over | 0 (0.0%) | 0 (0.0%) |
| Total | 14 (100.0%) | 0 (0.0%) |
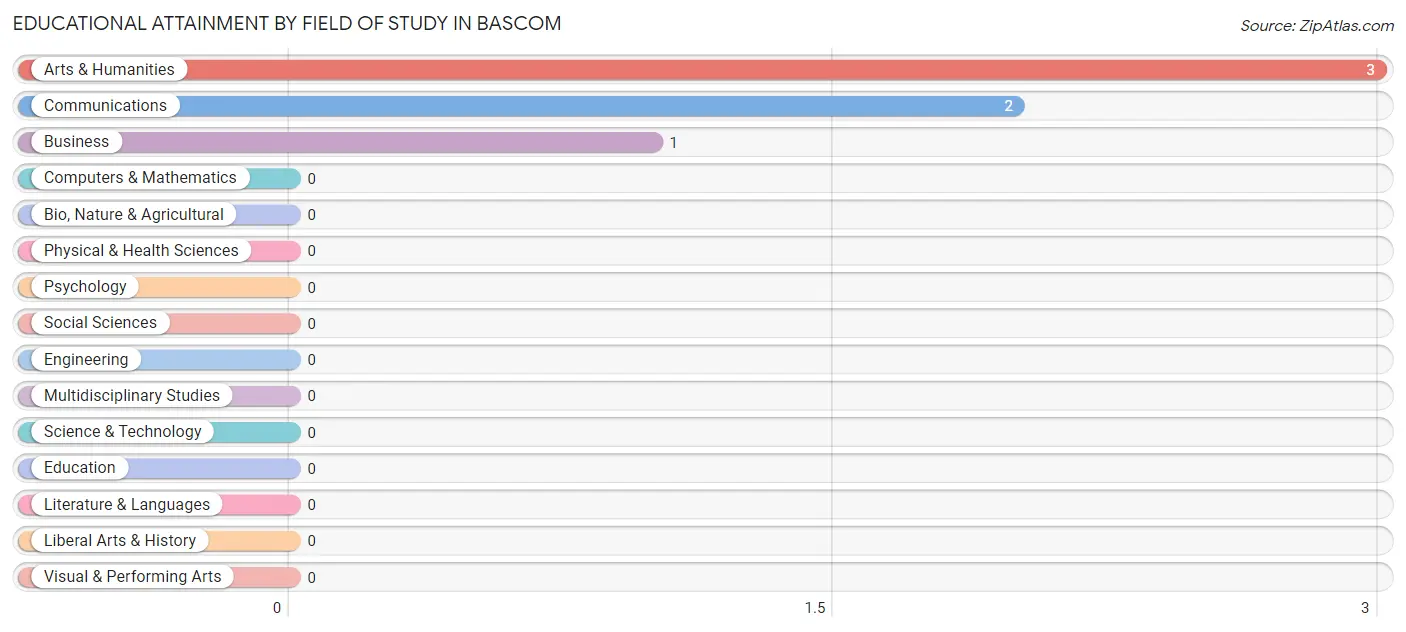
Educational Attainment by Field of Study in Bascom
Arts & humanities (3 | 50.0%), communications (2 | 33.3%), and business (1 | 16.7%) are the most common fields of study among 6 individuals in Bascom who have obtained a bachelor's degree or higher.
| Field of Study | # Graduates | % Graduates |
| Computers & Mathematics | 0 | 0.0% |
| Bio, Nature & Agricultural | 0 | 0.0% |
| Physical & Health Sciences | 0 | 0.0% |
| Psychology | 0 | 0.0% |
| Social Sciences | 0 | 0.0% |
| Engineering | 0 | 0.0% |
| Multidisciplinary Studies | 0 | 0.0% |
| Science & Technology | 0 | 0.0% |
| Business | 1 | 16.7% |
| Education | 0 | 0.0% |
| Literature & Languages | 0 | 0.0% |
| Liberal Arts & History | 0 | 0.0% |
| Visual & Performing Arts | 0 | 0.0% |
| Communications | 2 | 33.3% |
| Arts & Humanities | 3 | 50.0% |
| Total | 6 | 100.0% |
Transportation & Commute in Bascom
Vehicle Availability by Sex in Bascom
The most prevalent vehicle ownership categories in Bascom are males with 3 vehicles (22, accounting for 48.9%) and females with 3 vehicles (20, making up 91.7%).
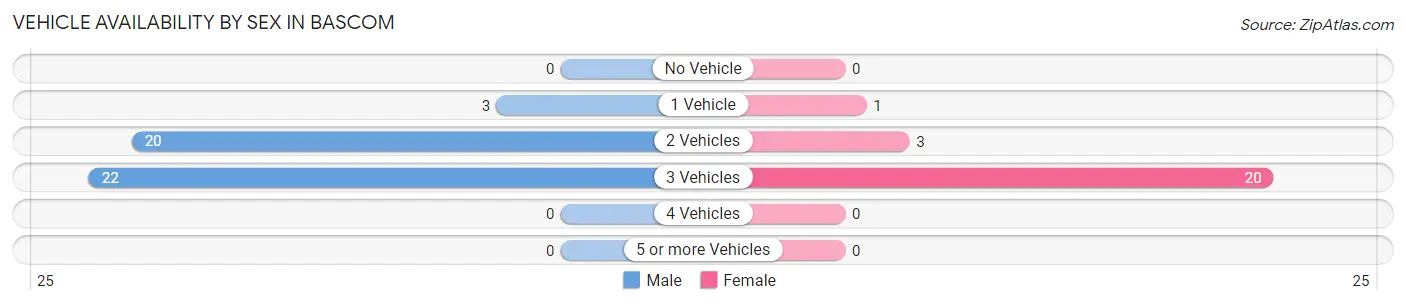
| Vehicles Available | Male | Female |
| No Vehicle | 0 (0.0%) | 0 (0.0%) |
| 1 Vehicle | 3 (6.7%) | 1 (4.2%) |
| 2 Vehicles | 20 (44.4%) | 3 (12.5%) |
| 3 Vehicles | 22 (48.9%) | 20 (83.3%) |
| 4 Vehicles | 0 (0.0%) | 0 (0.0%) |
| 5 or more Vehicles | 0 (0.0%) | 0 (0.0%) |
| Total | 45 (100.0%) | 24 (100.0%) |
Commute Time in Bascom
The most frequently occuring commute durations in Bascom are 30 to 34 minutes (44 commuters, 63.8%), 45 to 59 minutes (7 commuters, 10.1%), and 15 to 19 minutes (6 commuters, 8.7%).
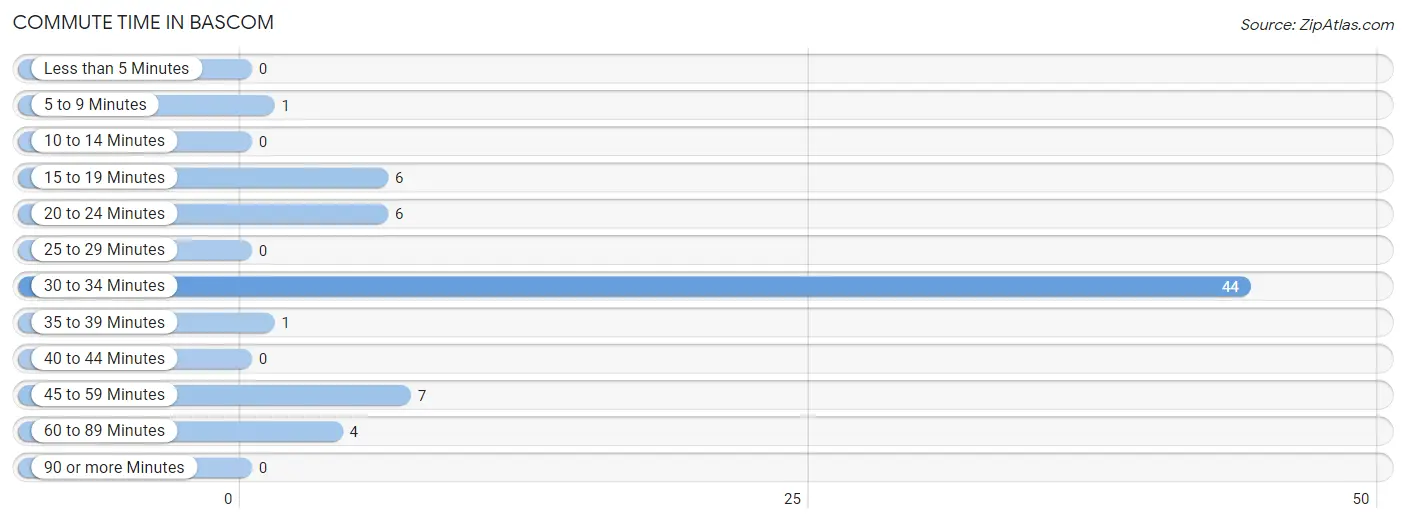
| Commute Time | # Commuters | % Commuters |
| Less than 5 Minutes | 0 | 0.0% |
| 5 to 9 Minutes | 1 | 1.5% |
| 10 to 14 Minutes | 0 | 0.0% |
| 15 to 19 Minutes | 6 | 8.7% |
| 20 to 24 Minutes | 6 | 8.7% |
| 25 to 29 Minutes | 0 | 0.0% |
| 30 to 34 Minutes | 44 | 63.8% |
| 35 to 39 Minutes | 1 | 1.5% |
| 40 to 44 Minutes | 0 | 0.0% |
| 45 to 59 Minutes | 7 | 10.1% |
| 60 to 89 Minutes | 4 | 5.8% |
| 90 or more Minutes | 0 | 0.0% |
Commute Time by Sex in Bascom
The most common commute times in Bascom are 30 to 34 minutes (32 commuters, 71.1%) for males and 30 to 34 minutes (12 commuters, 50.0%) for females.
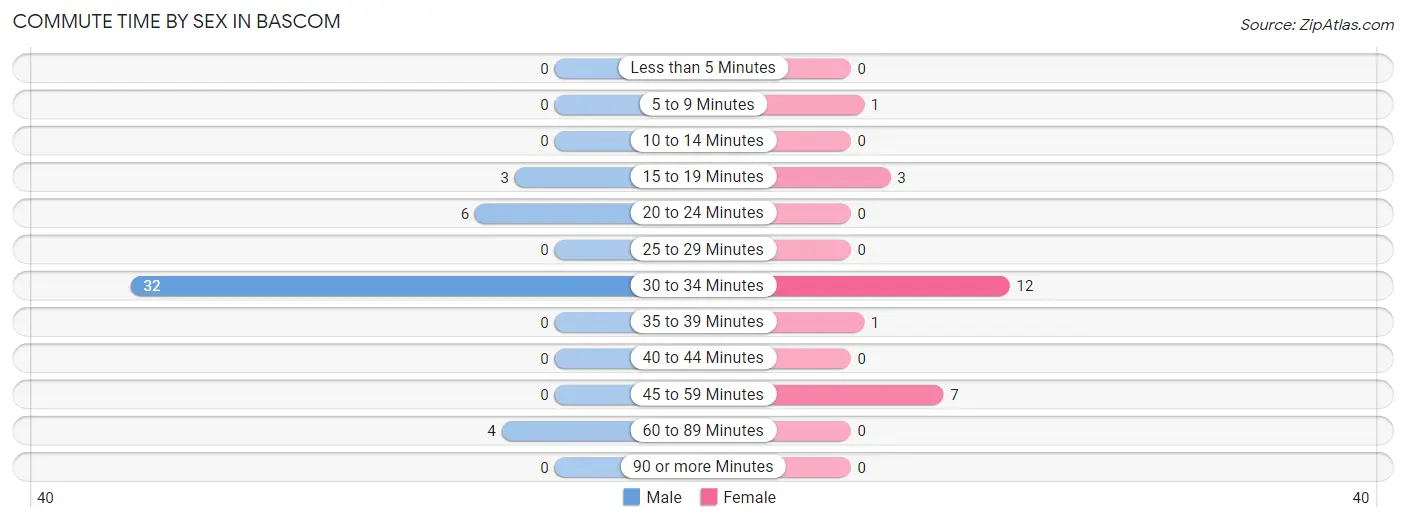
| Commute Time | Male | Female |
| Less than 5 Minutes | 0 (0.0%) | 0 (0.0%) |
| 5 to 9 Minutes | 0 (0.0%) | 1 (4.2%) |
| 10 to 14 Minutes | 0 (0.0%) | 0 (0.0%) |
| 15 to 19 Minutes | 3 (6.7%) | 3 (12.5%) |
| 20 to 24 Minutes | 6 (13.3%) | 0 (0.0%) |
| 25 to 29 Minutes | 0 (0.0%) | 0 (0.0%) |
| 30 to 34 Minutes | 32 (71.1%) | 12 (50.0%) |
| 35 to 39 Minutes | 0 (0.0%) | 1 (4.2%) |
| 40 to 44 Minutes | 0 (0.0%) | 0 (0.0%) |
| 45 to 59 Minutes | 0 (0.0%) | 7 (29.2%) |
| 60 to 89 Minutes | 4 (8.9%) | 0 (0.0%) |
| 90 or more Minutes | 0 (0.0%) | 0 (0.0%) |
Time of Departure to Work by Sex in Bascom
The most frequent times of departure to work in Bascom are 6:00 AM to 6:29 AM (27, 60.0%) for males and 6:00 AM to 6:29 AM (10, 41.7%) for females.
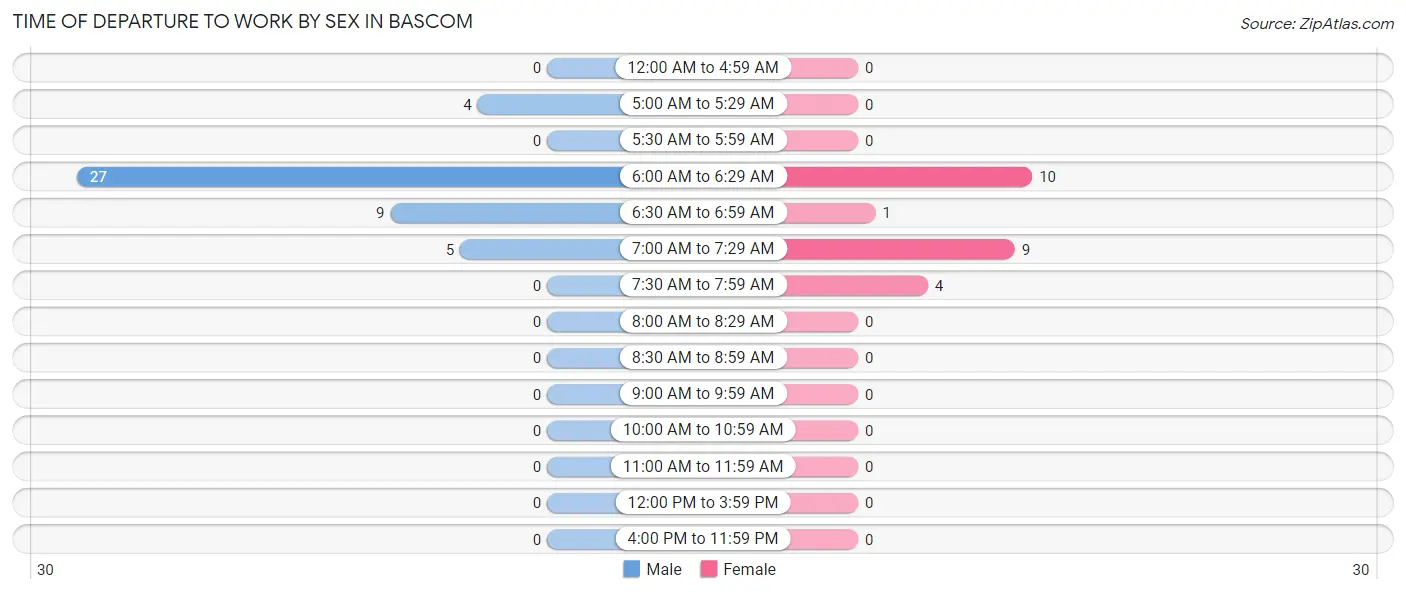
| Time of Departure | Male | Female |
| 12:00 AM to 4:59 AM | 0 (0.0%) | 0 (0.0%) |
| 5:00 AM to 5:29 AM | 4 (8.9%) | 0 (0.0%) |
| 5:30 AM to 5:59 AM | 0 (0.0%) | 0 (0.0%) |
| 6:00 AM to 6:29 AM | 27 (60.0%) | 10 (41.7%) |
| 6:30 AM to 6:59 AM | 9 (20.0%) | 1 (4.2%) |
| 7:00 AM to 7:29 AM | 5 (11.1%) | 9 (37.5%) |
| 7:30 AM to 7:59 AM | 0 (0.0%) | 4 (16.7%) |
| 8:00 AM to 8:29 AM | 0 (0.0%) | 0 (0.0%) |
| 8:30 AM to 8:59 AM | 0 (0.0%) | 0 (0.0%) |
| 9:00 AM to 9:59 AM | 0 (0.0%) | 0 (0.0%) |
| 10:00 AM to 10:59 AM | 0 (0.0%) | 0 (0.0%) |
| 11:00 AM to 11:59 AM | 0 (0.0%) | 0 (0.0%) |
| 12:00 PM to 3:59 PM | 0 (0.0%) | 0 (0.0%) |
| 4:00 PM to 11:59 PM | 0 (0.0%) | 0 (0.0%) |
| Total | 45 (100.0%) | 24 (100.0%) |
Housing Occupancy in Bascom
Occupancy by Ownership in Bascom
Of the total 62 dwellings in Bascom, owner-occupied units account for 52 (83.9%), while renter-occupied units make up 10 (16.1%).
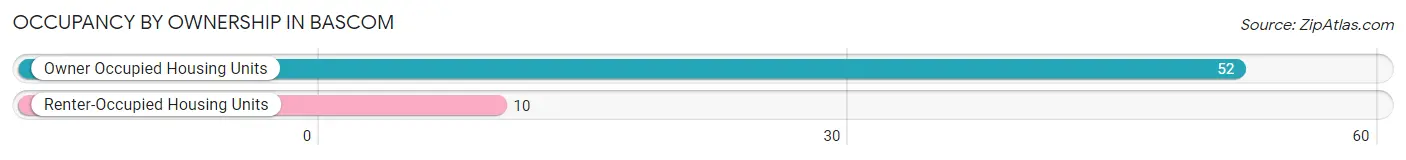
| Occupancy | # Housing Units | % Housing Units |
| Owner Occupied Housing Units | 52 | 83.9% |
| Renter-Occupied Housing Units | 10 | 16.1% |
| Total Occupied Housing Units | 62 | 100.0% |
Occupancy by Household Size in Bascom
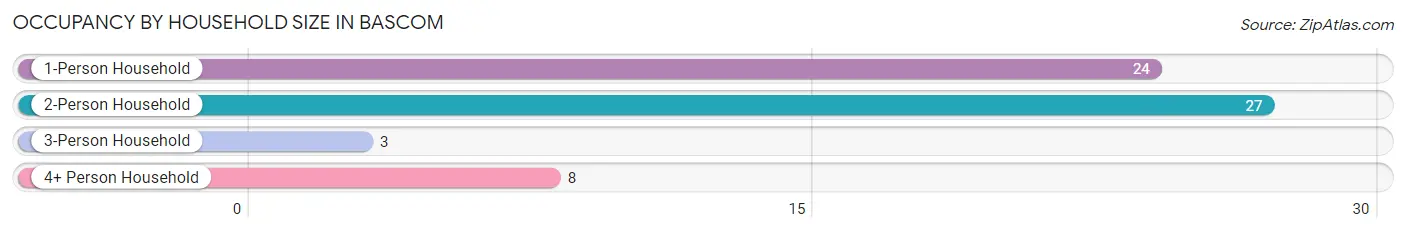
| Household Size | # Housing Units | % Housing Units |
| 1-Person Household | 24 | 38.7% |
| 2-Person Household | 27 | 43.5% |
| 3-Person Household | 3 | 4.8% |
| 4+ Person Household | 8 | 12.9% |
| Total Housing Units | 62 | 100.0% |
Occupancy by Ownership by Household Size in Bascom
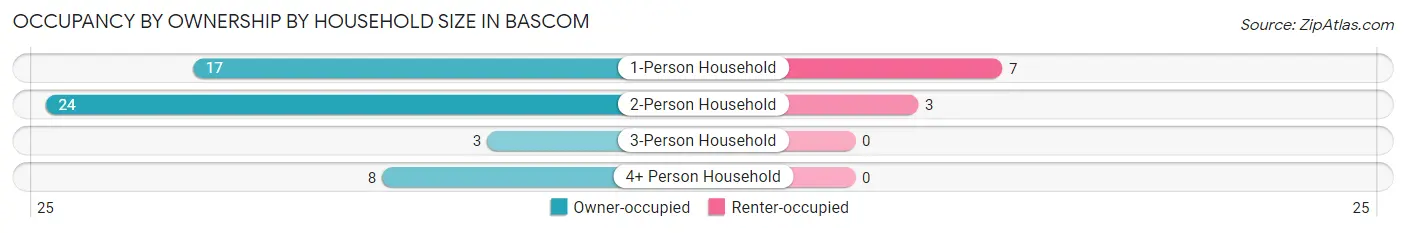
| Household Size | Owner-occupied | Renter-occupied |
| 1-Person Household | 17 (70.8%) | 7 (29.2%) |
| 2-Person Household | 24 (88.9%) | 3 (11.1%) |
| 3-Person Household | 3 (100.0%) | 0 (0.0%) |
| 4+ Person Household | 8 (100.0%) | 0 (0.0%) |
| Total Housing Units | 52 (83.9%) | 10 (16.1%) |
Occupancy by Educational Attainment in Bascom
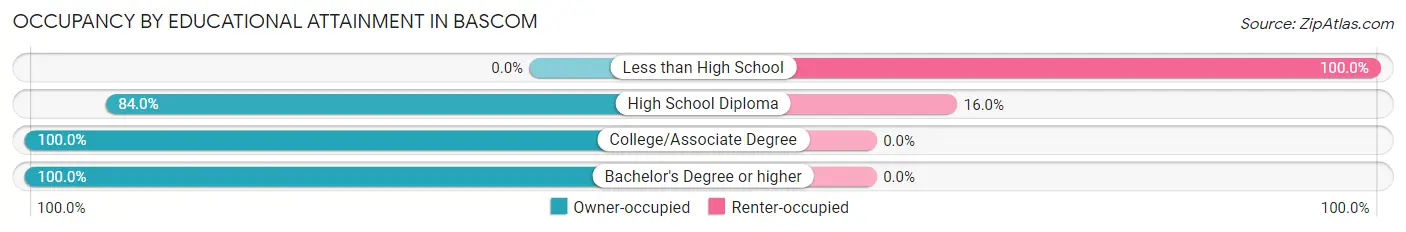
| Household Size | Owner-occupied | Renter-occupied |
| Less than High School | 0 (0.0%) | 6 (100.0%) |
| High School Diploma | 21 (84.0%) | 4 (16.0%) |
| College/Associate Degree | 27 (100.0%) | 0 (0.0%) |
| Bachelor's Degree or higher | 4 (100.0%) | 0 (0.0%) |
Occupancy by Age of Householder in Bascom
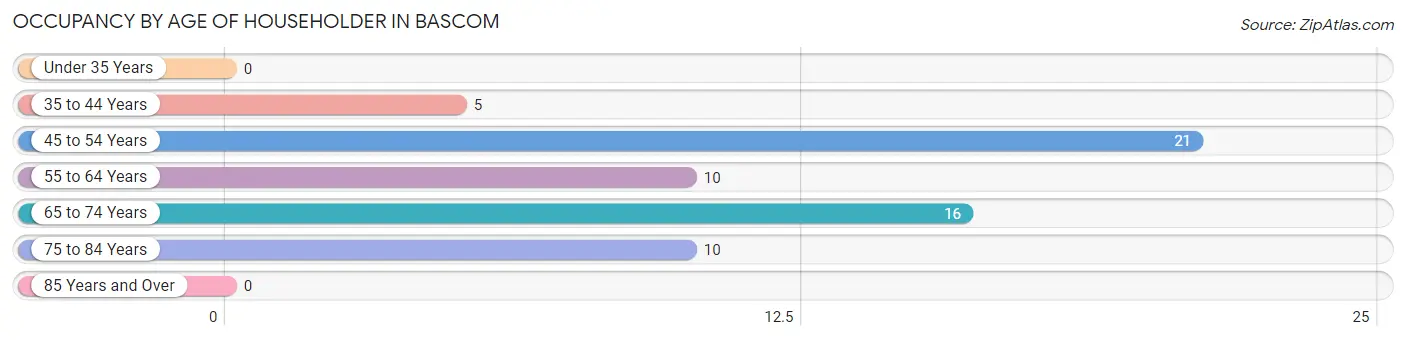
| Age Bracket | # Households | % Households |
| Under 35 Years | 0 | 0.0% |
| 35 to 44 Years | 5 | 8.1% |
| 45 to 54 Years | 21 | 33.9% |
| 55 to 64 Years | 10 | 16.1% |
| 65 to 74 Years | 16 | 25.8% |
| 75 to 84 Years | 10 | 16.1% |
| 85 Years and Over | 0 | 0.0% |
| Total | 62 | 100.0% |
Housing Finances in Bascom
Median Income by Occupancy in Bascom
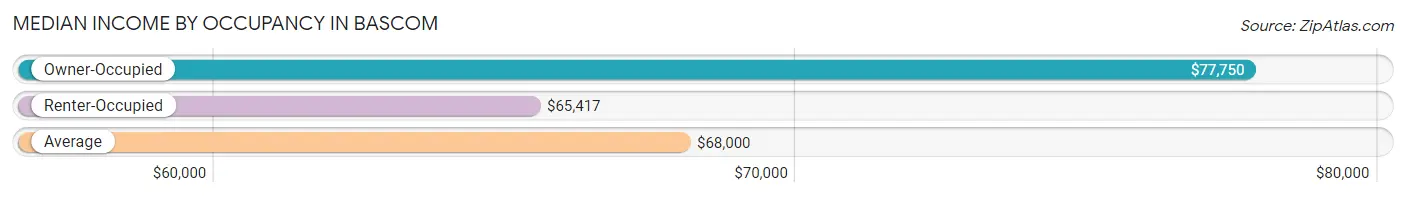
| Occupancy Type | # Households | Median Income |
| Owner-Occupied | 52 (83.9%) | $77,750 |
| Renter-Occupied | 10 (16.1%) | $65,417 |
| Average | 62 (100.0%) | $68,000 |
Occupancy by Householder Income Bracket in Bascom
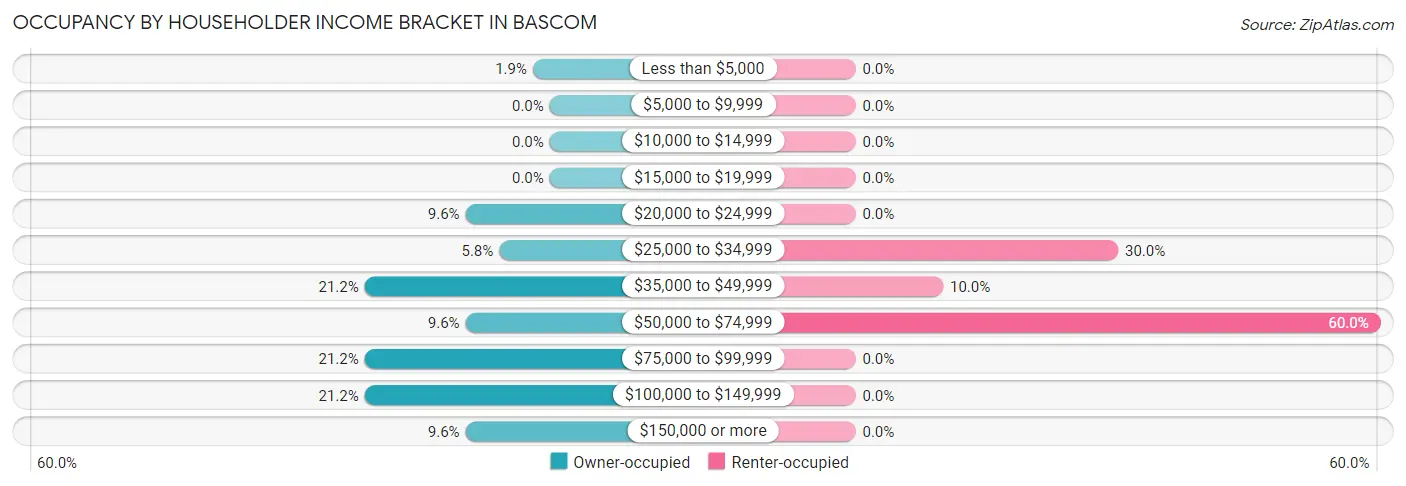
| Income Bracket | Owner-occupied | Renter-occupied |
| Less than $5,000 | 1 (1.9%) | 0 (0.0%) |
| $5,000 to $9,999 | 0 (0.0%) | 0 (0.0%) |
| $10,000 to $14,999 | 0 (0.0%) | 0 (0.0%) |
| $15,000 to $19,999 | 0 (0.0%) | 0 (0.0%) |
| $20,000 to $24,999 | 5 (9.6%) | 0 (0.0%) |
| $25,000 to $34,999 | 3 (5.8%) | 3 (30.0%) |
| $35,000 to $49,999 | 11 (21.1%) | 1 (10.0%) |
| $50,000 to $74,999 | 5 (9.6%) | 6 (60.0%) |
| $75,000 to $99,999 | 11 (21.1%) | 0 (0.0%) |
| $100,000 to $149,999 | 11 (21.1%) | 0 (0.0%) |
| $150,000 or more | 5 (9.6%) | 0 (0.0%) |
| Total | 52 (100.0%) | 10 (100.0%) |
Monthly Housing Cost Tiers in Bascom
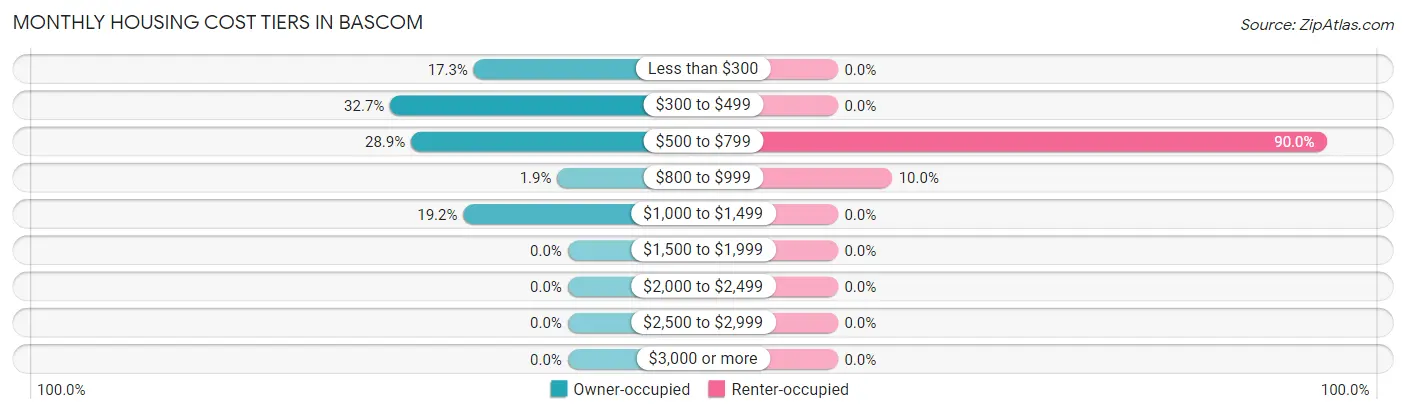
| Monthly Cost | Owner-occupied | Renter-occupied |
| Less than $300 | 9 (17.3%) | 0 (0.0%) |
| $300 to $499 | 17 (32.7%) | 0 (0.0%) |
| $500 to $799 | 15 (28.8%) | 9 (90.0%) |
| $800 to $999 | 1 (1.9%) | 1 (10.0%) |
| $1,000 to $1,499 | 10 (19.2%) | 0 (0.0%) |
| $1,500 to $1,999 | 0 (0.0%) | 0 (0.0%) |
| $2,000 to $2,499 | 0 (0.0%) | 0 (0.0%) |
| $2,500 to $2,999 | 0 (0.0%) | 0 (0.0%) |
| $3,000 or more | 0 (0.0%) | 0 (0.0%) |
| Total | 52 (100.0%) | 10 (100.0%) |
Physical Housing Characteristics in Bascom
Housing Structures in Bascom
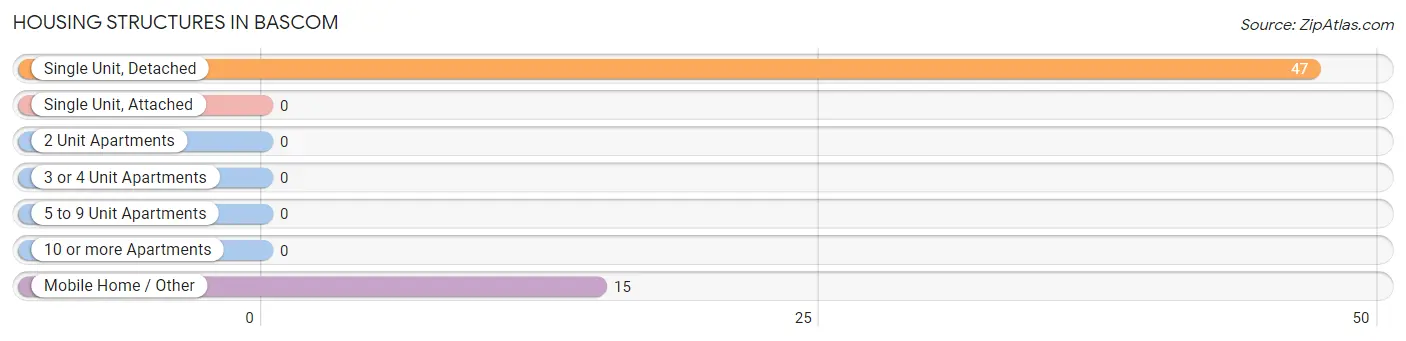
| Structure Type | # Housing Units | % Housing Units |
| Single Unit, Detached | 47 | 75.8% |
| Single Unit, Attached | 0 | 0.0% |
| 2 Unit Apartments | 0 | 0.0% |
| 3 or 4 Unit Apartments | 0 | 0.0% |
| 5 to 9 Unit Apartments | 0 | 0.0% |
| 10 or more Apartments | 0 | 0.0% |
| Mobile Home / Other | 15 | 24.2% |
| Total | 62 | 100.0% |
Housing Structures by Occupancy in Bascom
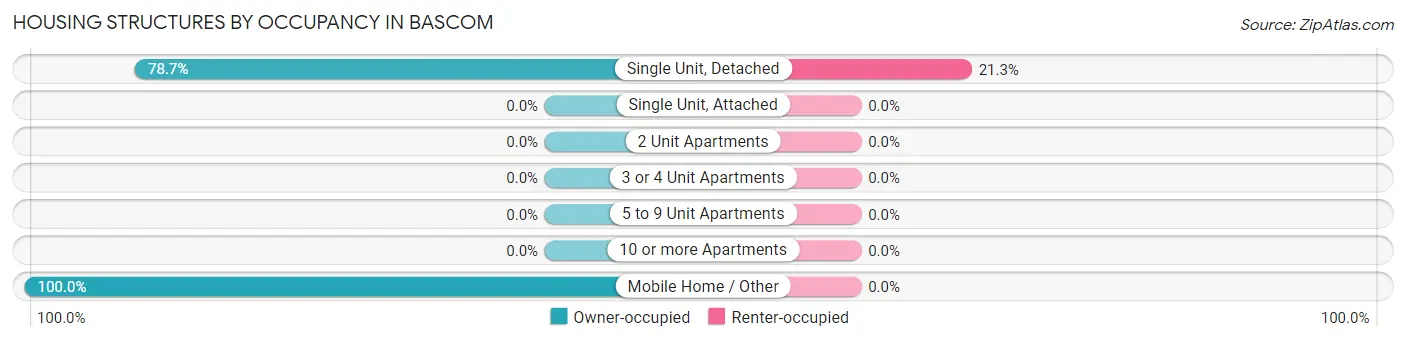
| Structure Type | Owner-occupied | Renter-occupied |
| Single Unit, Detached | 37 (78.7%) | 10 (21.3%) |
| Single Unit, Attached | 0 (0.0%) | 0 (0.0%) |
| 2 Unit Apartments | 0 (0.0%) | 0 (0.0%) |
| 3 or 4 Unit Apartments | 0 (0.0%) | 0 (0.0%) |
| 5 to 9 Unit Apartments | 0 (0.0%) | 0 (0.0%) |
| 10 or more Apartments | 0 (0.0%) | 0 (0.0%) |
| Mobile Home / Other | 15 (100.0%) | 0 (0.0%) |
| Total | 52 (83.9%) | 10 (16.1%) |
Housing Structures by Number of Rooms in Bascom
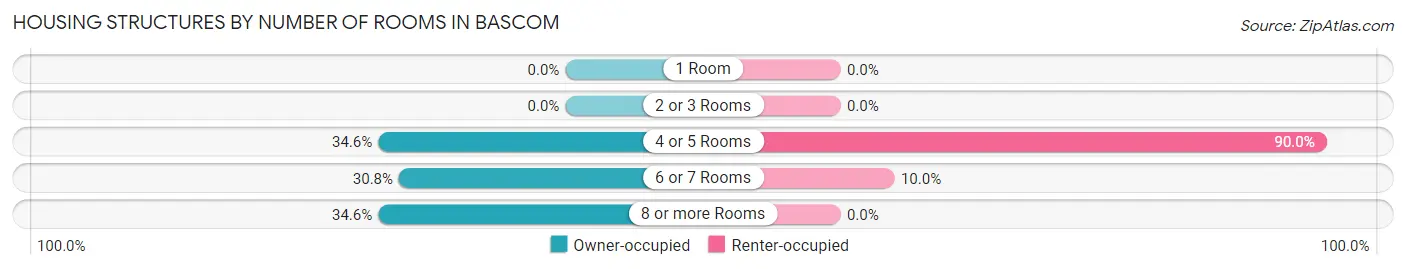
| Number of Rooms | Owner-occupied | Renter-occupied |
| 1 Room | 0 (0.0%) | 0 (0.0%) |
| 2 or 3 Rooms | 0 (0.0%) | 0 (0.0%) |
| 4 or 5 Rooms | 18 (34.6%) | 9 (90.0%) |
| 6 or 7 Rooms | 16 (30.8%) | 1 (10.0%) |
| 8 or more Rooms | 18 (34.6%) | 0 (0.0%) |
| Total | 52 (100.0%) | 10 (100.0%) |
Housing Structure by Heating Type in Bascom
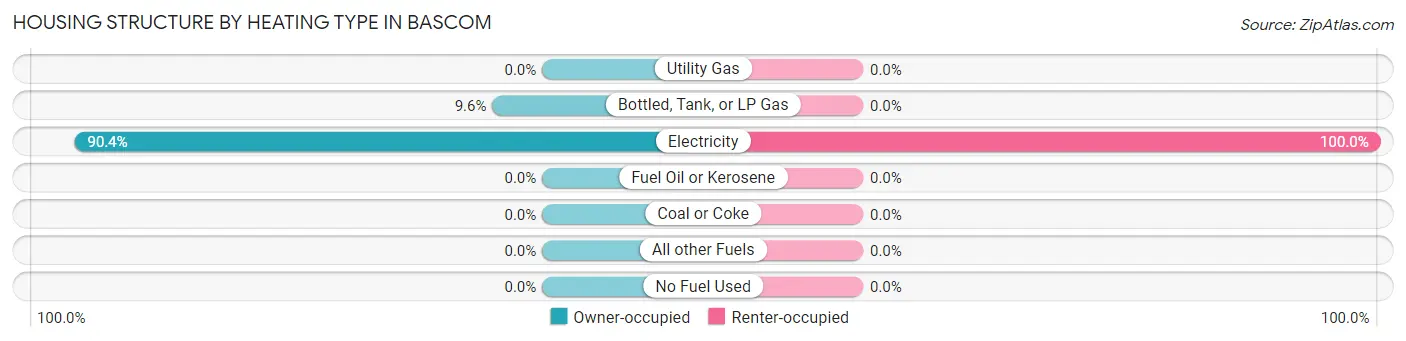
| Heating Type | Owner-occupied | Renter-occupied |
| Utility Gas | 0 (0.0%) | 0 (0.0%) |
| Bottled, Tank, or LP Gas | 5 (9.6%) | 0 (0.0%) |
| Electricity | 47 (90.4%) | 10 (100.0%) |
| Fuel Oil or Kerosene | 0 (0.0%) | 0 (0.0%) |
| Coal or Coke | 0 (0.0%) | 0 (0.0%) |
| All other Fuels | 0 (0.0%) | 0 (0.0%) |
| No Fuel Used | 0 (0.0%) | 0 (0.0%) |
| Total | 52 (100.0%) | 10 (100.0%) |
Household Vehicle Usage in Bascom
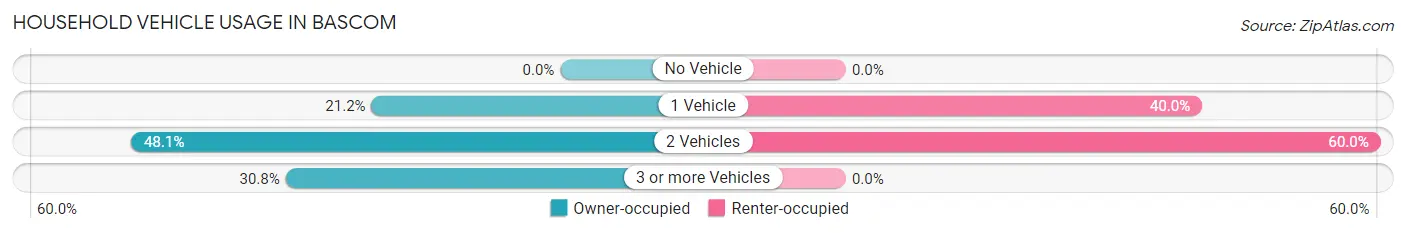
| Vehicles per Household | Owner-occupied | Renter-occupied |
| No Vehicle | 0 (0.0%) | 0 (0.0%) |
| 1 Vehicle | 11 (21.1%) | 4 (40.0%) |
| 2 Vehicles | 25 (48.1%) | 6 (60.0%) |
| 3 or more Vehicles | 16 (30.8%) | 0 (0.0%) |
| Total | 52 (100.0%) | 10 (100.0%) |
Real Estate & Mortgages in Bascom
Real Estate and Mortgage Overview in Bascom
| Characteristic | Without Mortgage | With Mortgage |
| Housing Units | 31 | 21 |
| Median Property Value | $55,000 | $99,500 |
| Median Household Income | $40,750 | $0 |
| Monthly Housing Costs | $327 | $0 |
| Real Estate Taxes | $471 | $0 |
Property Value by Mortgage Status in Bascom
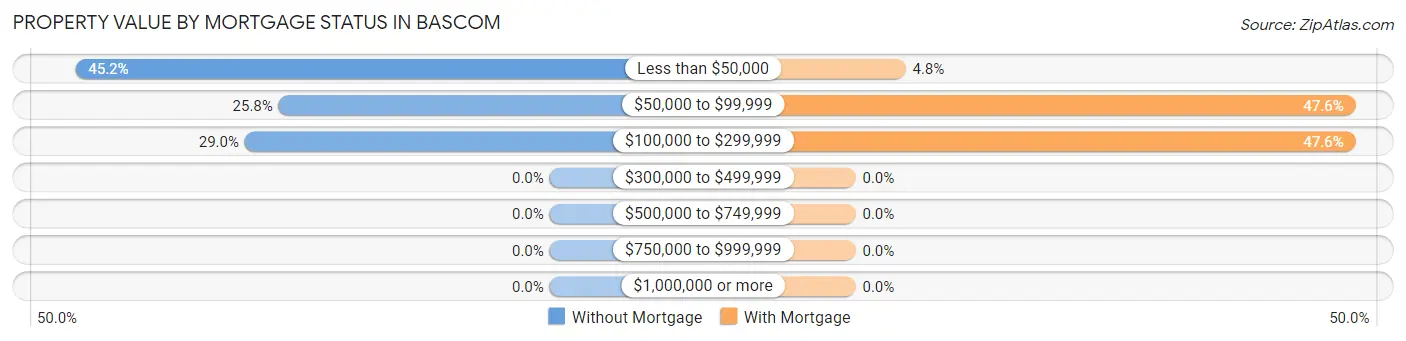
| Property Value | Without Mortgage | With Mortgage |
| Less than $50,000 | 14 (45.2%) | 1 (4.8%) |
| $50,000 to $99,999 | 8 (25.8%) | 10 (47.6%) |
| $100,000 to $299,999 | 9 (29.0%) | 10 (47.6%) |
| $300,000 to $499,999 | 0 (0.0%) | 0 (0.0%) |
| $500,000 to $749,999 | 0 (0.0%) | 0 (0.0%) |
| $750,000 to $999,999 | 0 (0.0%) | 0 (0.0%) |
| $1,000,000 or more | 0 (0.0%) | 0 (0.0%) |
| Total | 31 (100.0%) | 21 (100.0%) |
Household Income by Mortgage Status in Bascom
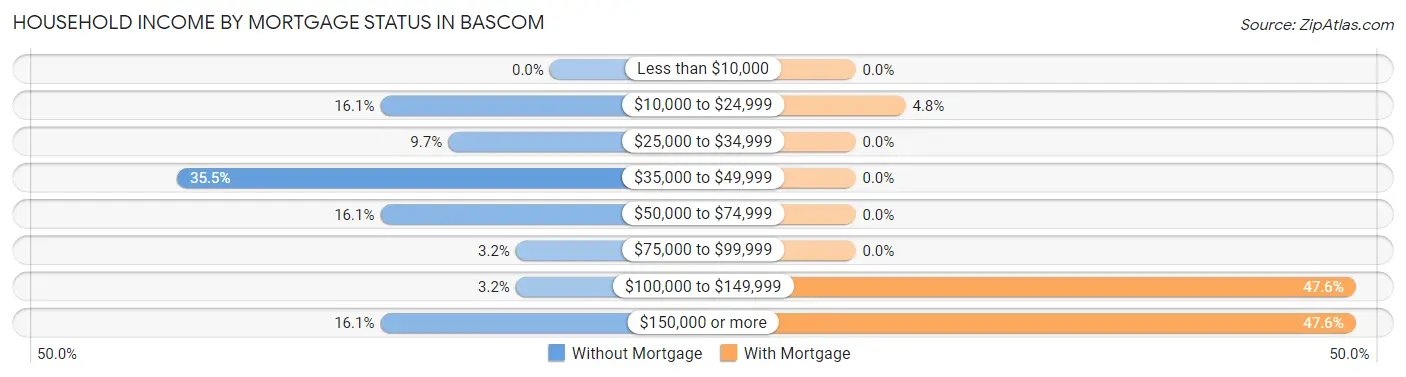
| Household Income | Without Mortgage | With Mortgage |
| Less than $10,000 | 0 (0.0%) | 0 (0.0%) |
| $10,000 to $24,999 | 5 (16.1%) | 1 (4.8%) |
| $25,000 to $34,999 | 3 (9.7%) | 0 (0.0%) |
| $35,000 to $49,999 | 11 (35.5%) | 0 (0.0%) |
| $50,000 to $74,999 | 5 (16.1%) | 0 (0.0%) |
| $75,000 to $99,999 | 1 (3.2%) | 0 (0.0%) |
| $100,000 to $149,999 | 1 (3.2%) | 10 (47.6%) |
| $150,000 or more | 5 (16.1%) | 10 (47.6%) |
| Total | 31 (100.0%) | 21 (100.0%) |
Property Value to Household Income Ratio in Bascom
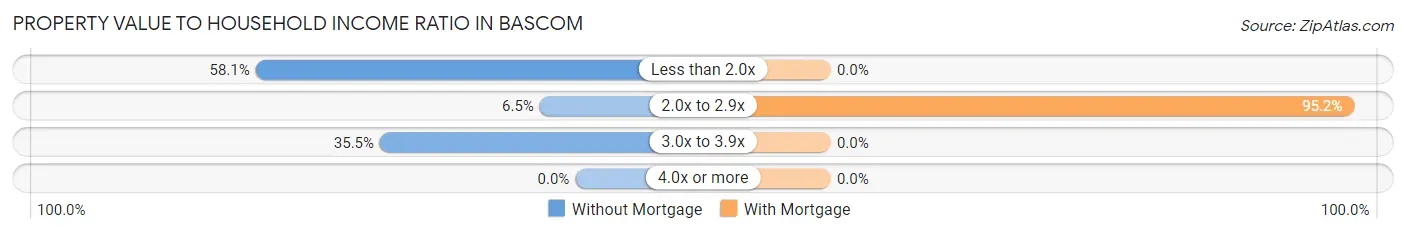
| Value-to-Income Ratio | Without Mortgage | With Mortgage |
| Less than 2.0x | 18 (58.1%) | 0 (0.0%) |
| 2.0x to 2.9x | 2 (6.5%) | 20 (95.2%) |
| 3.0x to 3.9x | 11 (35.5%) | 0 (0.0%) |
| 4.0x or more | 0 (0.0%) | 0 (0.0%) |
| Total | 31 (100.0%) | 21 (100.0%) |
Real Estate Taxes by Mortgage Status in Bascom
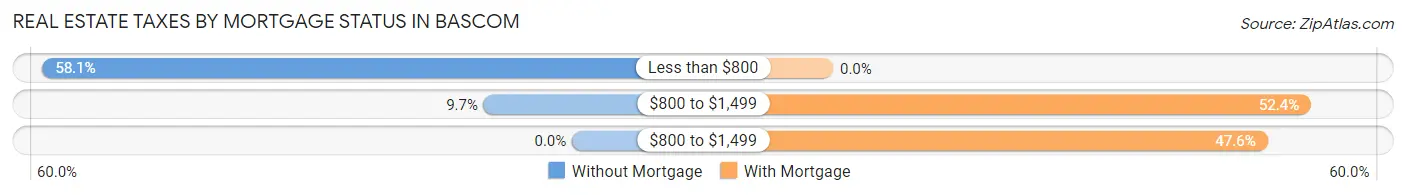
| Property Taxes | Without Mortgage | With Mortgage |
| Less than $800 | 18 (58.1%) | 0 (0.0%) |
| $800 to $1,499 | 3 (9.7%) | 11 (52.4%) |
| $800 to $1,499 | 0 (0.0%) | 10 (47.6%) |
| Total | 31 (100.0%) | 21 (100.0%) |
Health & Disability in Bascom
Health Insurance Coverage by Age in Bascom
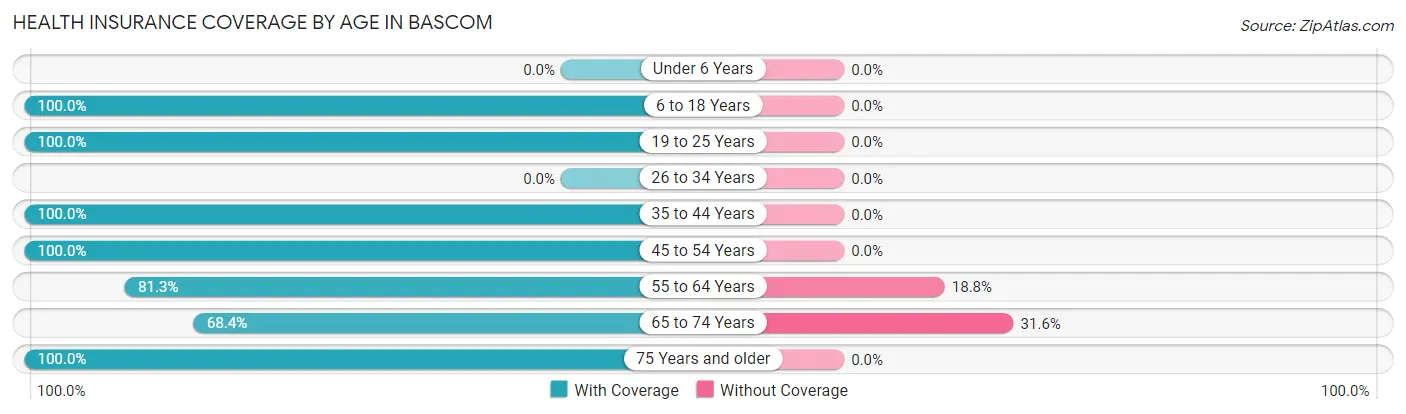
| Age Bracket | With Coverage | Without Coverage |
| Under 6 Years | 0 (0.0%) | 0 (0.0%) |
| 6 to 18 Years | 14 (100.0%) | 0 (0.0%) |
| 19 to 25 Years | 7 (100.0%) | 0 (0.0%) |
| 26 to 34 Years | 0 (0.0%) | 0 (0.0%) |
| 35 to 44 Years | 5 (100.0%) | 0 (0.0%) |
| 45 to 54 Years | 50 (100.0%) | 0 (0.0%) |
| 55 to 64 Years | 13 (81.2%) | 3 (18.8%) |
| 65 to 74 Years | 13 (68.4%) | 6 (31.6%) |
| 75 Years and older | 12 (100.0%) | 0 (0.0%) |
| Total | 114 (92.7%) | 9 (7.3%) |
Health Insurance Coverage by Citizenship Status in Bascom
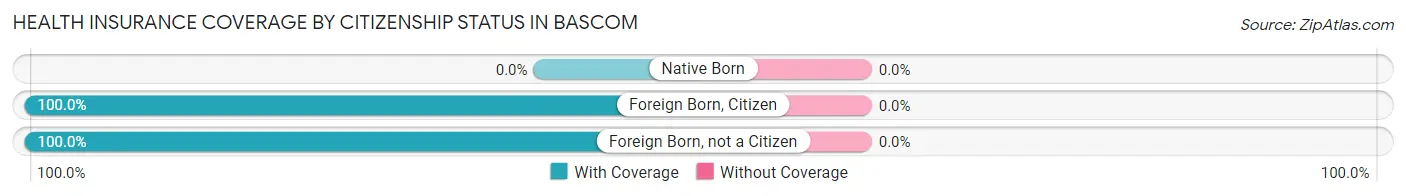
| Citizenship Status | With Coverage | Without Coverage |
| Native Born | 0 (0.0%) | 0 (0.0%) |
| Foreign Born, Citizen | 14 (100.0%) | 0 (0.0%) |
| Foreign Born, not a Citizen | 7 (100.0%) | 0 (0.0%) |
Health Insurance Coverage by Household Income in Bascom
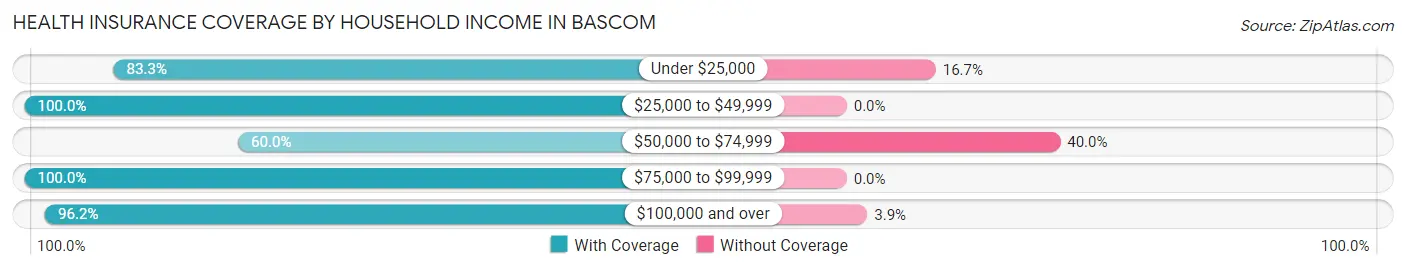
| Household Income | With Coverage | Without Coverage |
| Under $25,000 | 5 (83.3%) | 1 (16.7%) |
| $25,000 to $49,999 | 31 (100.0%) | 0 (0.0%) |
| $50,000 to $74,999 | 9 (60.0%) | 6 (40.0%) |
| $75,000 to $99,999 | 19 (100.0%) | 0 (0.0%) |
| $100,000 and over | 50 (96.2%) | 2 (3.8%) |
Public vs Private Health Insurance Coverage by Age in Bascom
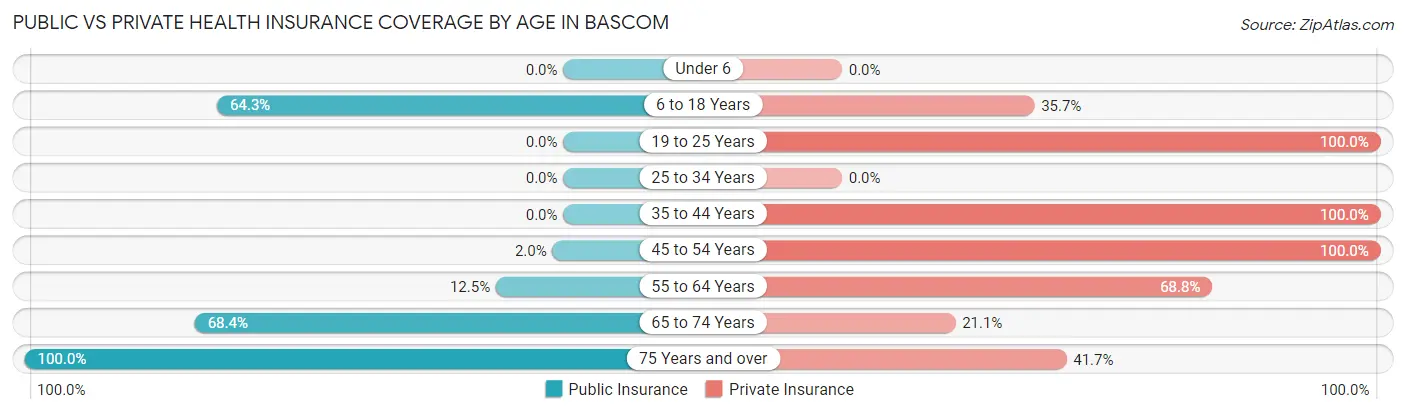
| Age Bracket | Public Insurance | Private Insurance |
| Under 6 | 0 (0.0%) | 0 (0.0%) |
| 6 to 18 Years | 9 (64.3%) | 5 (35.7%) |
| 19 to 25 Years | 0 (0.0%) | 7 (100.0%) |
| 25 to 34 Years | 0 (0.0%) | 0 (0.0%) |
| 35 to 44 Years | 0 (0.0%) | 5 (100.0%) |
| 45 to 54 Years | 1 (2.0%) | 50 (100.0%) |
| 55 to 64 Years | 2 (12.5%) | 11 (68.8%) |
| 65 to 74 Years | 13 (68.4%) | 4 (21.0%) |
| 75 Years and over | 12 (100.0%) | 5 (41.7%) |
| Total | 37 (30.1%) | 87 (70.7%) |
Disability Status by Sex by Age in Bascom
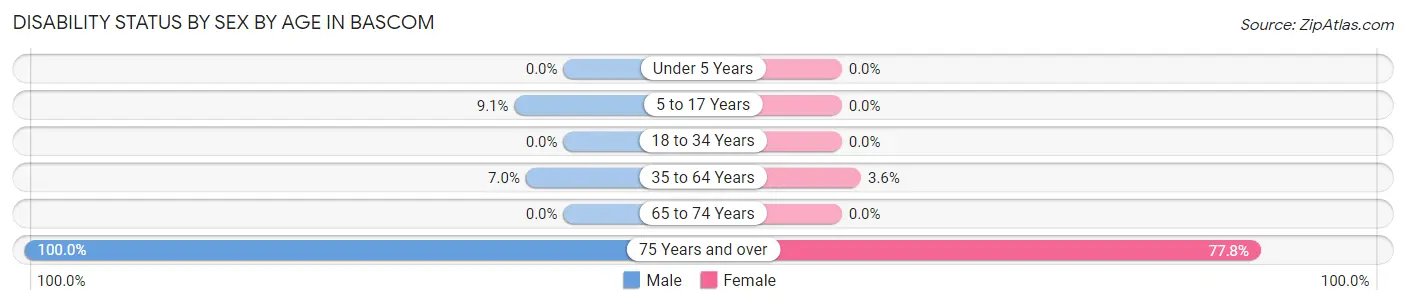
| Age Bracket | Male | Female |
| Under 5 Years | 0 (0.0%) | 0 (0.0%) |
| 5 to 17 Years | 1 (9.1%) | 0 (0.0%) |
| 18 to 34 Years | 0 (0.0%) | 0 (0.0%) |
| 35 to 64 Years | 3 (7.0%) | 1 (3.6%) |
| 65 to 74 Years | 0 (0.0%) | 0 (0.0%) |
| 75 Years and over | 3 (100.0%) | 7 (77.8%) |
Disability Class by Sex by Age in Bascom
Disability Class: Hearing Difficulty
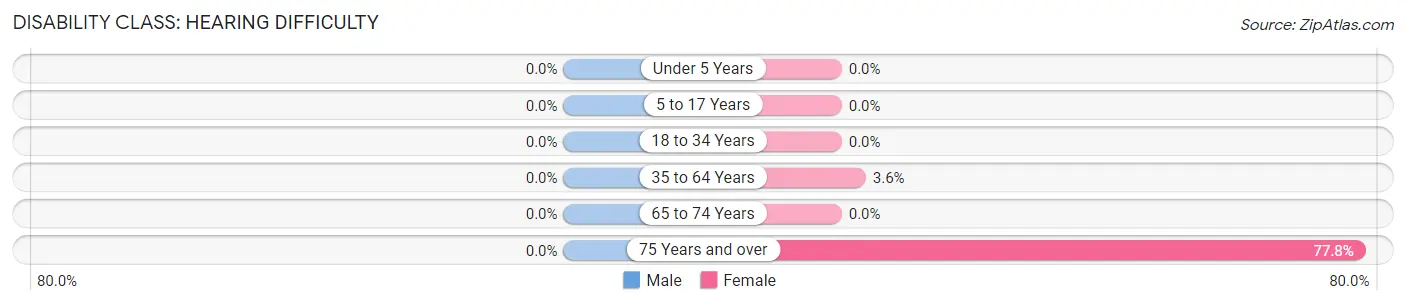
| Age Bracket | Male | Female |
| Under 5 Years | 0 (0.0%) | 0 (0.0%) |
| 5 to 17 Years | 0 (0.0%) | 0 (0.0%) |
| 18 to 34 Years | 0 (0.0%) | 0 (0.0%) |
| 35 to 64 Years | 0 (0.0%) | 1 (3.6%) |
| 65 to 74 Years | 0 (0.0%) | 0 (0.0%) |
| 75 Years and over | 0 (0.0%) | 7 (77.8%) |
Disability Class: Vision Difficulty
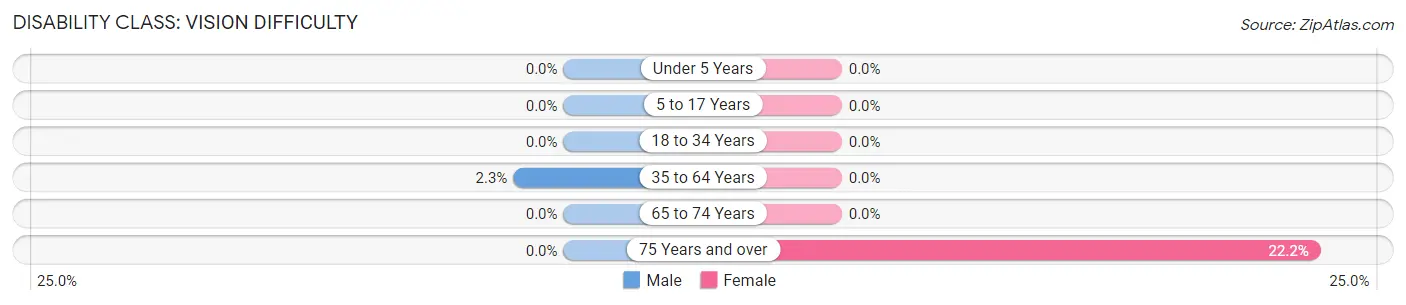
| Age Bracket | Male | Female |
| Under 5 Years | 0 (0.0%) | 0 (0.0%) |
| 5 to 17 Years | 0 (0.0%) | 0 (0.0%) |
| 18 to 34 Years | 0 (0.0%) | 0 (0.0%) |
| 35 to 64 Years | 1 (2.3%) | 0 (0.0%) |
| 65 to 74 Years | 0 (0.0%) | 0 (0.0%) |
| 75 Years and over | 0 (0.0%) | 2 (22.2%) |
Disability Class: Cognitive Difficulty
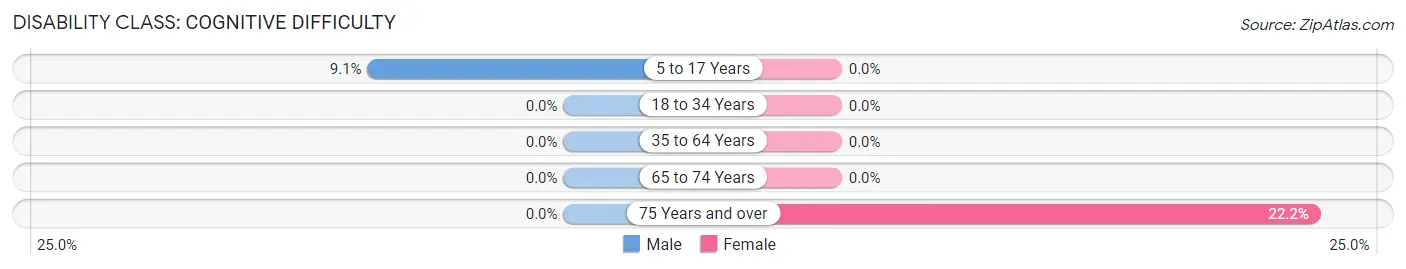
| Age Bracket | Male | Female |
| 5 to 17 Years | 1 (9.1%) | 0 (0.0%) |
| 18 to 34 Years | 0 (0.0%) | 0 (0.0%) |
| 35 to 64 Years | 0 (0.0%) | 0 (0.0%) |
| 65 to 74 Years | 0 (0.0%) | 0 (0.0%) |
| 75 Years and over | 0 (0.0%) | 2 (22.2%) |
Disability Class: Ambulatory Difficulty
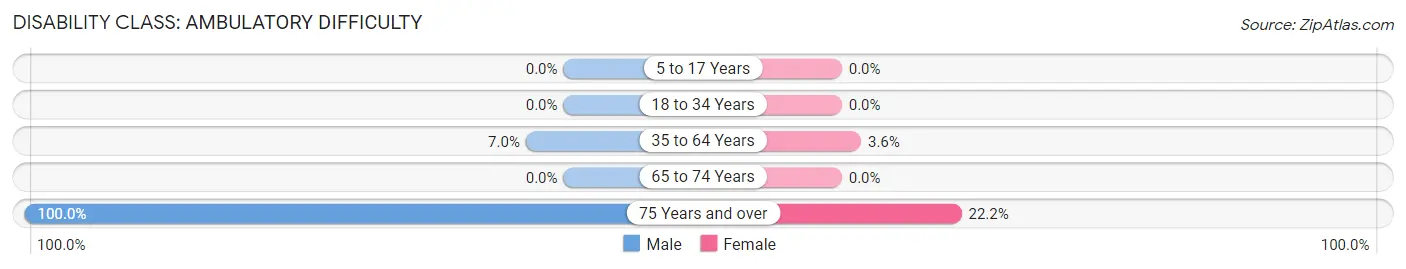
| Age Bracket | Male | Female |
| 5 to 17 Years | 0 (0.0%) | 0 (0.0%) |
| 18 to 34 Years | 0 (0.0%) | 0 (0.0%) |
| 35 to 64 Years | 3 (7.0%) | 1 (3.6%) |
| 65 to 74 Years | 0 (0.0%) | 0 (0.0%) |
| 75 Years and over | 3 (100.0%) | 2 (22.2%) |
Disability Class: Self-Care Difficulty
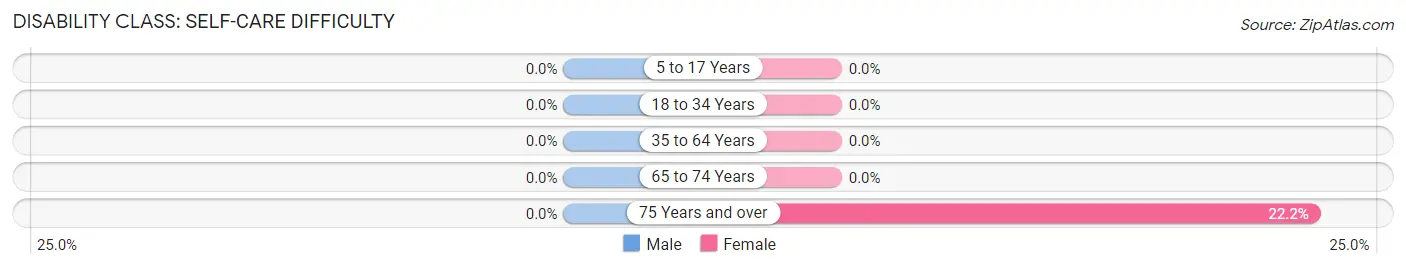
| Age Bracket | Male | Female |
| 5 to 17 Years | 0 (0.0%) | 0 (0.0%) |
| 18 to 34 Years | 0 (0.0%) | 0 (0.0%) |
| 35 to 64 Years | 0 (0.0%) | 0 (0.0%) |
| 65 to 74 Years | 0 (0.0%) | 0 (0.0%) |
| 75 Years and over | 0 (0.0%) | 2 (22.2%) |
Technology Access in Bascom
Computing Device Access in Bascom
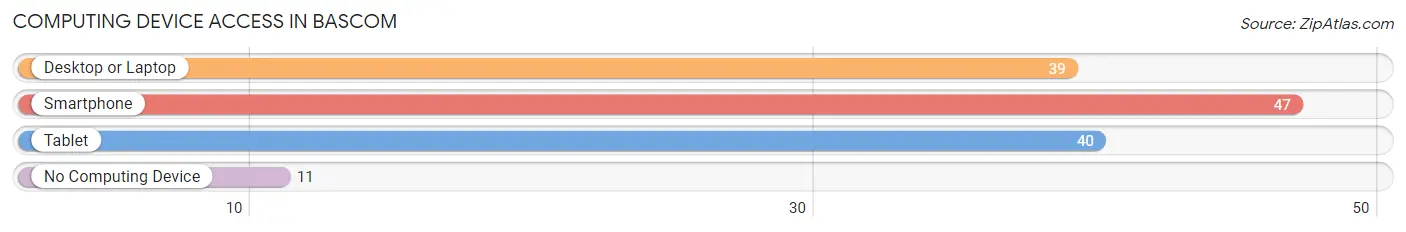
| Device Type | # Households | % Households |
| Desktop or Laptop | 39 | 62.9% |
| Smartphone | 47 | 75.8% |
| Tablet | 40 | 64.5% |
| No Computing Device | 11 | 17.7% |
| Total | 62 | 100.0% |
Internet Access in Bascom
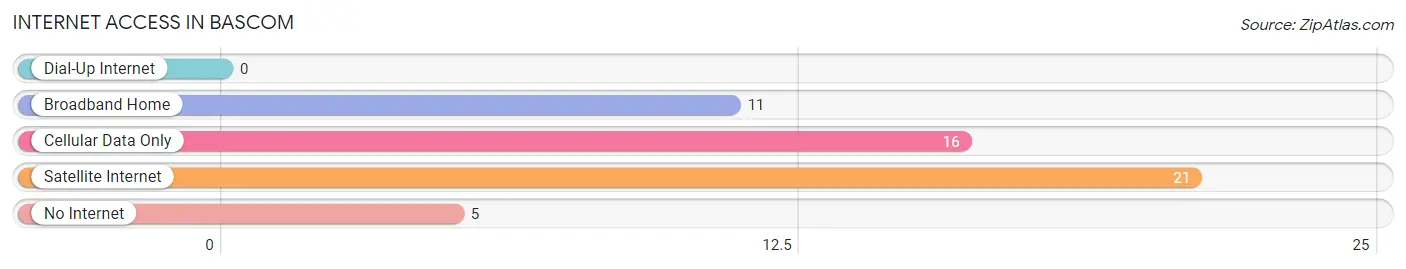
| Internet Type | # Households | % Households |
| Dial-Up Internet | 0 | 0.0% |
| Broadband Home | 11 | 17.7% |
| Cellular Data Only | 16 | 25.8% |
| Satellite Internet | 21 | 33.9% |
| No Internet | 5 | 8.1% |
| Total | 62 | 100.0% |
Bascom Summary
Bascom, Florida is a small unincorporated community located in Jackson County, Florida. It is situated in the panhandle of the state, approximately 20 miles north of the state capital, Tallahassee. The population of Bascom was estimated to be around 500 in 2020.
History
Bascom was founded in 1883 by a group of settlers from Georgia. The town was named after the Bascom family, who were among the first settlers. The Bascoms were farmers and the town was initially a farming community. The town grew slowly over the years, and by the early 1900s, it had a population of around 200.
In the early 1900s, Bascom became a popular destination for tourists. The town was known for its natural beauty and its proximity to the Gulf of Mexico. The town was also known for its fishing and hunting opportunities.
In the 1950s, Bascom began to experience a decline in population. This was due to the decline of the farming industry in the area and the increasing popularity of nearby cities such as Panama City and Pensacola. By the 1970s, the population of Bascom had dropped to around 200.
Geography
Bascom is located in the panhandle of Florida, approximately 20 miles north of the state capital, Tallahassee. The town is situated on the banks of the Chipola River, which flows through the area. The town is surrounded by forests and wetlands, and is home to a variety of wildlife.
The climate in Bascom is humid subtropical, with hot summers and mild winters. The average temperature in the summer is around 90 degrees Fahrenheit, and the average temperature in the winter is around 50 degrees Fahrenheit.
Economy
The economy of Bascom is largely based on agriculture. The town is home to several farms, which produce a variety of crops, including corn, soybeans, cotton, and peanuts. The town is also home to several timber companies, which harvest timber from the surrounding forests.
In addition to agriculture, Bascom is home to several small businesses, including restaurants, convenience stores, and gas stations. The town is also home to a few manufacturing companies, which produce a variety of products, including furniture and clothing.
Demographics
As of 2020, the population of Bascom was estimated to be around 500. The town is predominantly white, with around 95% of the population being white. The remaining 5% of the population is made up of African Americans, Hispanics, and other ethnicities.
The median household income in Bascom is around $35,000, which is lower than the national average. The town has a poverty rate of around 20%, which is higher than the national average. The town also has a high unemployment rate, with around 10% of the population being unemployed.
Conclusion
Bascom, Florida is a small unincorporated community located in Jackson County, Florida. It is situated in the panhandle of the state, approximately 20 miles north of the state capital, Tallahassee. The population of Bascom was estimated to be around 500 in 2020. The town was founded in 1883 by a group of settlers from Georgia and is known for its natural beauty and its proximity to the Gulf of Mexico. The economy of Bascom is largely based on agriculture, and the town is home to several small businesses. The population of Bascom is predominantly white, with around 95% of the population being white. The median household income in Bascom is around $35,000, which is lower than the national average. The town also has a high poverty rate and a high unemployment rate.
Common Questions
What is Per Capita Income in Bascom?
Per Capita income in Bascom is $45,809.
What is the Median Household income in Bascom?
Median Household Income in Bascom is $68,000.
What is Income or Wage Gap in Bascom?
Income or Wage Gap in Bascom is 51.8%.
Women in Bascom earn 48.2 cents for every dollar earned by a man.
What is Inequality or Gini Index in Bascom?
Inequality or Gini Index in Bascom is 0.35.
What is the Total Population of Bascom?
Total Population of Bascom is 123.
What is the Total Male Population of Bascom?
Total Male Population of Bascom is 69.
What is the Total Female Population of Bascom?
Total Female Population of Bascom is 54.
What is the Ratio of Males per 100 Females in Bascom?
There are 127.78 Males per 100 Females in Bascom.
What is the Ratio of Females per 100 Males in Bascom?
There are 78.26 Females per 100 Males in Bascom.
What is the Median Population Age in Bascom?
Median Population Age in Bascom is 48.8 Years.
What is the Average Family Size in Bascom
Average Family Size in Bascom is 2.6 People.
What is the Average Household Size in Bascom
Average Household Size in Bascom is 2.0 People.
How Large is the Labor Force in Bascom?
There are 70 People in the Labor Forcein in Bascom.
What is the Percentage of People in the Labor Force in Bascom?
64.2% of People are in the Labor Force in Bascom.
What is the Unemployment Rate in Bascom?
Unemployment Rate in Bascom is 1.4%.