Bartow, FL Map & Demographics
Bartow Map
Bartow Overview
$29,728
PER CAPITA INCOME
$83,918
AVG FAMILY INCOME
$60,974
AVG HOUSEHOLD INCOME
18.9%
WAGE / INCOME GAP [ % ]
81.1¢/ $1
WAGE / INCOME GAP [ $ ]
0.45
INEQUALITY / GINI INDEX
19,424
TOTAL POPULATION
9,821
MALE POPULATION
9,603
FEMALE POPULATION
102.27
MALES / 100 FEMALES
97.78
FEMALES / 100 MALES
36.5
MEDIAN AGE
3.3
AVG FAMILY SIZE
2.7
AVG HOUSEHOLD SIZE
10,185
LABOR FORCE [ PEOPLE ]
64.3%
PERCENT IN LABOR FORCE
4.0%
UNEMPLOYMENT RATE
Bartow Zip Codes
Bartow Area Codes
Income in Bartow
Income Overview in Bartow
Per Capita Income in Bartow is $29,728, while median incomes of families and households are $83,918 and $60,974 respectively.
| Characteristic | Number | Measure |
| Per Capita Income | 19,424 | $29,728 |
| Median Family Income | 4,589 | $83,918 |
| Mean Family Income | 4,589 | $96,226 |
| Median Household Income | 6,921 | $60,974 |
| Mean Household Income | 6,921 | $78,218 |
| Income Deficit | 4,589 | $0 |
| Wage / Income Gap (%) | 19,424 | 18.92% |
| Wage / Income Gap ($) | 19,424 | 81.08¢ per $1 |
| Gini / Inequality Index | 19,424 | 0.45 |
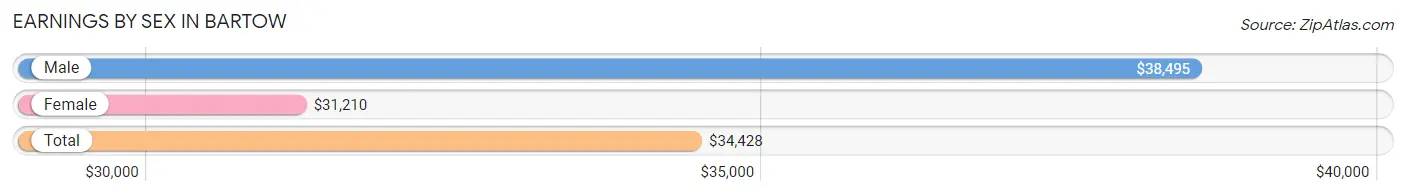
Earnings by Sex in Bartow
Average Earnings in Bartow are $34,428, $38,495 for men and $31,210 for women, a difference of 18.9%.
| Sex | Number | Average Earnings |
| Male | 5,231 (50.2%) | $38,495 |
| Female | 5,179 (49.7%) | $31,210 |
| Total | 10,410 (100.0%) | $34,428 |
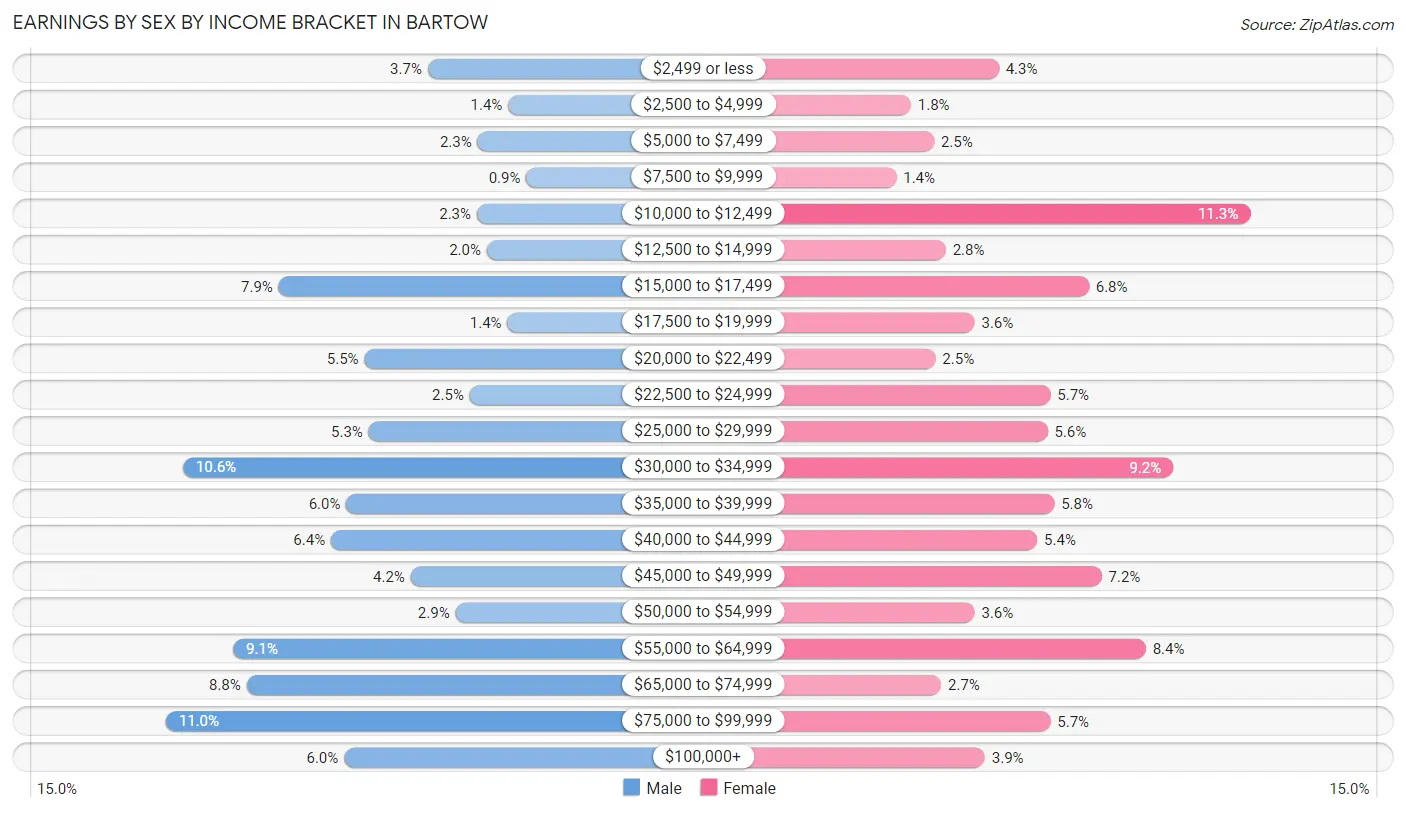
Earnings by Sex by Income Bracket in Bartow
The most common earnings brackets in Bartow are $75,000 to $99,999 for men (577 | 11.0%) and $10,000 to $12,499 for women (587 | 11.3%).
| Income | Male | Female |
| $2,499 or less | 192 (3.7%) | 221 (4.3%) |
| $2,500 to $4,999 | 74 (1.4%) | 93 (1.8%) |
| $5,000 to $7,499 | 119 (2.3%) | 127 (2.5%) |
| $7,500 to $9,999 | 47 (0.9%) | 72 (1.4%) |
| $10,000 to $12,499 | 120 (2.3%) | 587 (11.3%) |
| $12,500 to $14,999 | 105 (2.0%) | 144 (2.8%) |
| $15,000 to $17,499 | 411 (7.9%) | 352 (6.8%) |
| $17,500 to $19,999 | 75 (1.4%) | 186 (3.6%) |
| $20,000 to $22,499 | 285 (5.4%) | 129 (2.5%) |
| $22,500 to $24,999 | 130 (2.5%) | 296 (5.7%) |
| $25,000 to $29,999 | 279 (5.3%) | 292 (5.6%) |
| $30,000 to $34,999 | 552 (10.5%) | 475 (9.2%) |
| $35,000 to $39,999 | 312 (6.0%) | 302 (5.8%) |
| $40,000 to $44,999 | 334 (6.4%) | 277 (5.3%) |
| $45,000 to $49,999 | 217 (4.2%) | 371 (7.2%) |
| $50,000 to $54,999 | 151 (2.9%) | 186 (3.6%) |
| $55,000 to $64,999 | 478 (9.1%) | 435 (8.4%) |
| $65,000 to $74,999 | 458 (8.8%) | 137 (2.6%) |
| $75,000 to $99,999 | 577 (11.0%) | 296 (5.7%) |
| $100,000+ | 315 (6.0%) | 201 (3.9%) |
| Total | 5,231 (100.0%) | 5,179 (100.0%) |
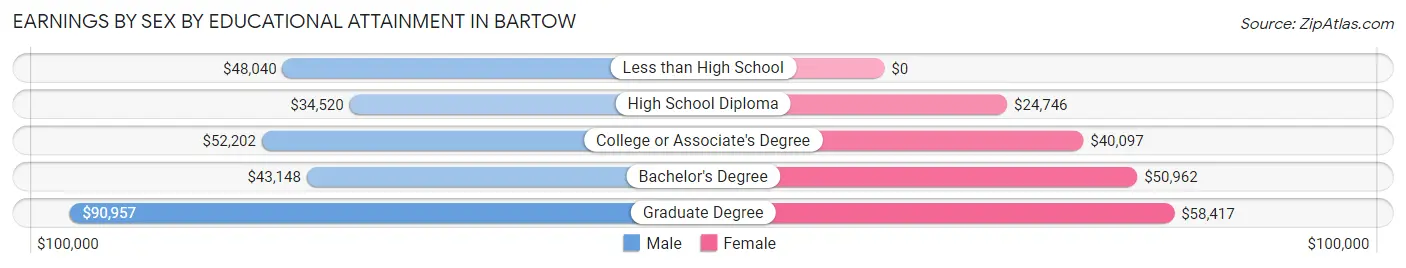
Earnings by Sex by Educational Attainment in Bartow
Average earnings in Bartow are $43,114 for men and $35,656 for women, a difference of 17.3%. Men with an educational attainment of graduate degree enjoy the highest average annual earnings of $90,957, while those with high school diploma education earn the least with $34,520. Women with an educational attainment of graduate degree earn the most with the average annual earnings of $58,417, while those with high school diploma education have the smallest earnings of $24,746.
| Educational Attainment | Male Income | Female Income |
| Less than High School | $48,040 | $0 |
| High School Diploma | $34,520 | $24,746 |
| College or Associate's Degree | $52,202 | $40,097 |
| Bachelor's Degree | $43,148 | $50,962 |
| Graduate Degree | $90,957 | $58,417 |
| Total | $43,114 | $35,656 |
Family Income in Bartow
Family Income Brackets in Bartow
According to the Bartow family income data, there are 1,051 families falling into the $100,000 to $149,999 income range, which is the most common income bracket and makes up 22.9% of all families. Conversely, the $10,000 to $14,999 income bracket is the least frequent group with only 32 families (0.7%) belonging to this category.
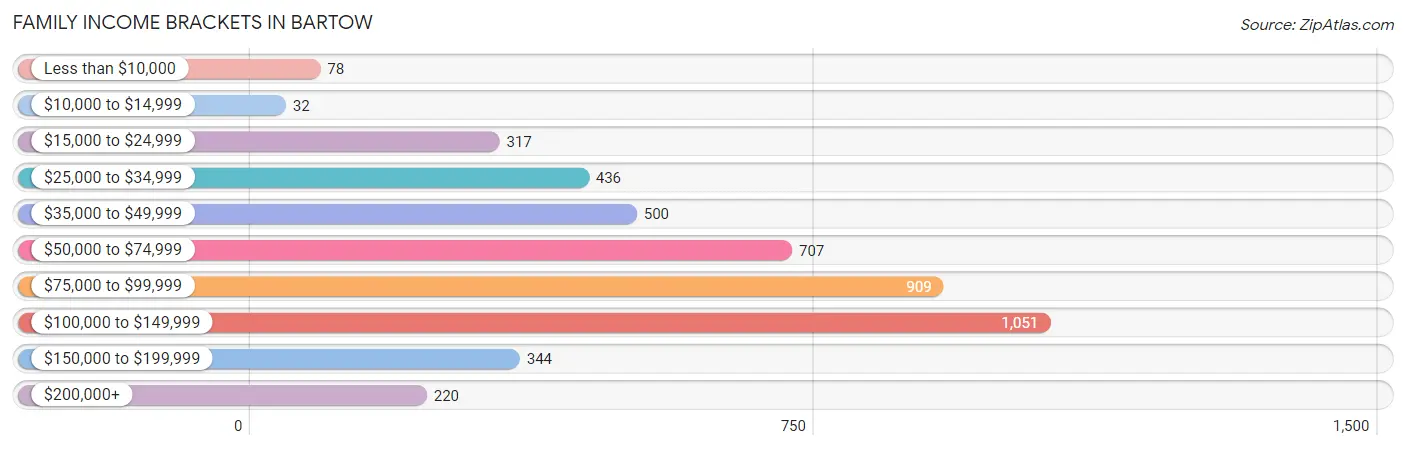
| Income Bracket | # Families | % Families |
| Less than $10,000 | 78 | 1.7% |
| $10,000 to $14,999 | 32 | 0.7% |
| $15,000 to $24,999 | 317 | 6.9% |
| $25,000 to $34,999 | 436 | 9.5% |
| $35,000 to $49,999 | 500 | 10.9% |
| $50,000 to $74,999 | 707 | 15.4% |
| $75,000 to $99,999 | 909 | 19.8% |
| $100,000 to $149,999 | 1,051 | 22.9% |
| $150,000 to $199,999 | 344 | 7.5% |
| $200,000+ | 220 | 4.8% |
Family Income by Famaliy Size in Bartow
5-person families (545 | 11.9%) account for the highest median family income in Bartow with $136,838 per family, while 2-person families (2,202 | 48.0%) have the highest median income of $34,244 per family member.
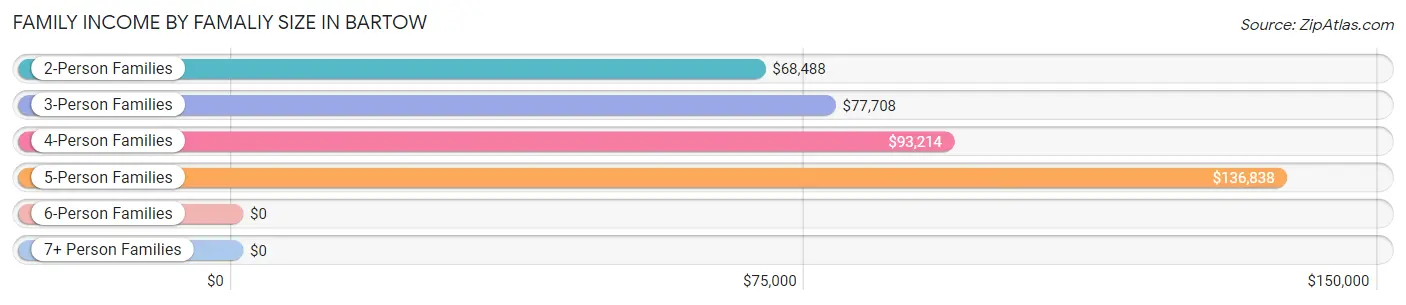
| Income Bracket | # Families | Median Income |
| 2-Person Families | 2,202 (48.0%) | $68,488 |
| 3-Person Families | 899 (19.6%) | $77,708 |
| 4-Person Families | 790 (17.2%) | $93,214 |
| 5-Person Families | 545 (11.9%) | $136,838 |
| 6-Person Families | 115 (2.5%) | $0 |
| 7+ Person Families | 38 (0.8%) | $0 |
| Total | 4,589 (100.0%) | $83,918 |
Family Income by Number of Earners in Bartow
The median family income in Bartow is $83,918, with families comprising 3+ earners (640) having the highest median family income of $145,123, while families with no earners (478) have the lowest median family income of $35,938, accounting for 14.0% and 10.4% of families, respectively.
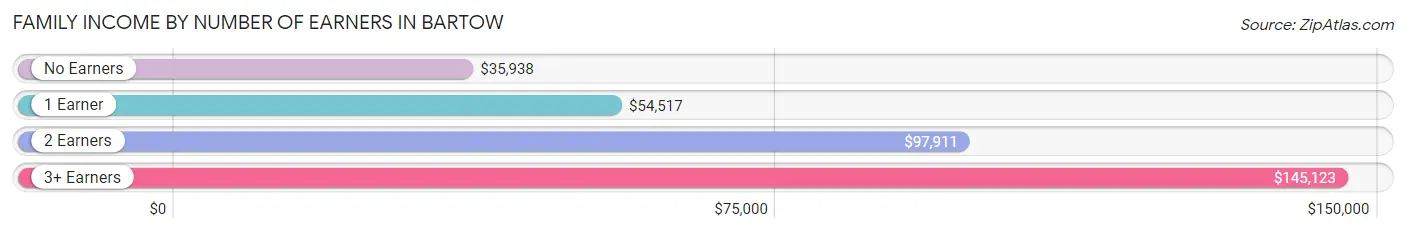
| Number of Earners | # Families | Median Income |
| No Earners | 478 (10.4%) | $35,938 |
| 1 Earner | 1,663 (36.2%) | $54,517 |
| 2 Earners | 1,808 (39.4%) | $97,911 |
| 3+ Earners | 640 (14.0%) | $145,123 |
| Total | 4,589 (100.0%) | $83,918 |
Household Income in Bartow
Household Income Brackets in Bartow
With 1,246 households falling in the category, the $100,000 to $149,999 income range is the most frequent in Bartow, accounting for 18.0% of all households. In contrast, only 242 households (3.5%) fall into the $200,000+ income bracket, making it the least populous group.
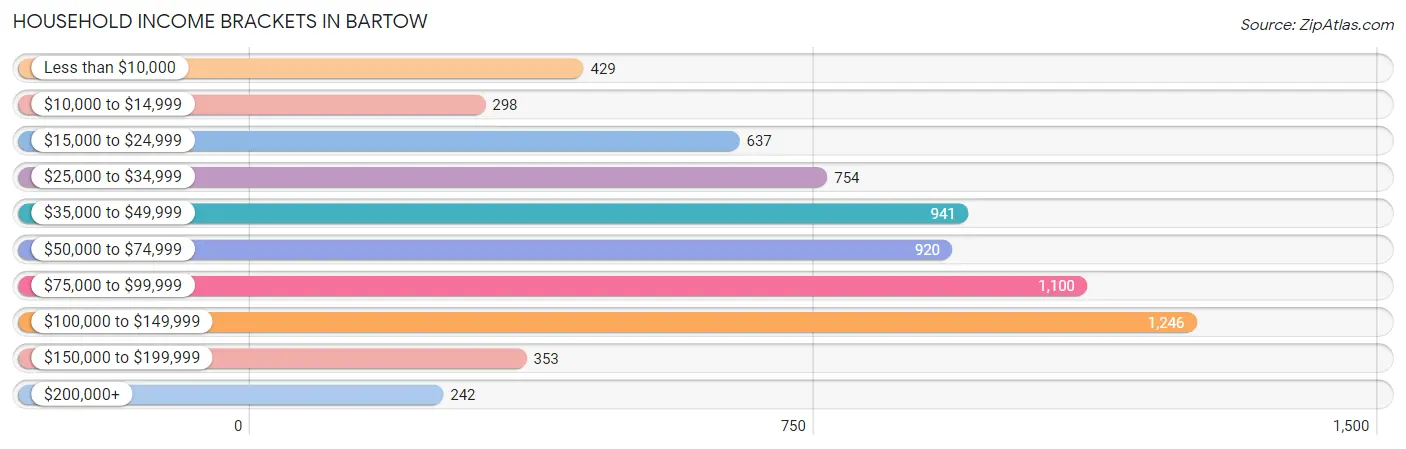
| Income Bracket | # Households | % Households |
| Less than $10,000 | 429 | 6.2% |
| $10,000 to $14,999 | 298 | 4.3% |
| $15,000 to $24,999 | 637 | 9.2% |
| $25,000 to $34,999 | 754 | 10.9% |
| $35,000 to $49,999 | 941 | 13.6% |
| $50,000 to $74,999 | 920 | 13.3% |
| $75,000 to $99,999 | 1,100 | 15.9% |
| $100,000 to $149,999 | 1,246 | 18.0% |
| $150,000 to $199,999 | 353 | 5.1% |
| $200,000+ | 242 | 3.5% |
Household Income by Householder Age in Bartow
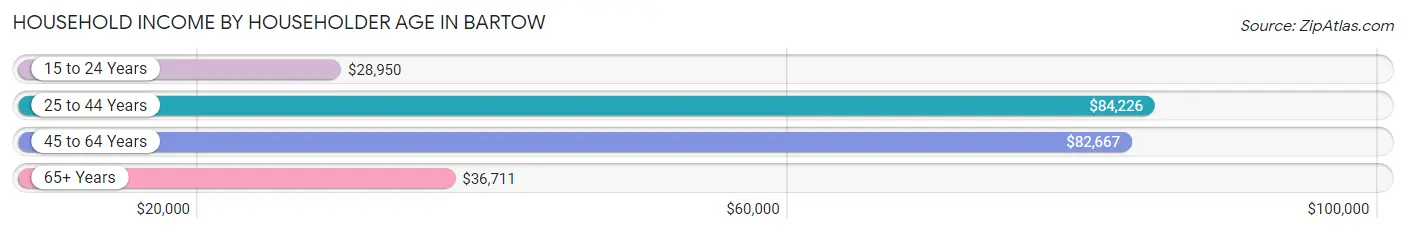
The median household income in Bartow is $60,974, with the highest median household income of $84,226 found in the 25 to 44 years age bracket for the primary householder. A total of 2,218 households (32.1%) fall into this category. Meanwhile, the 15 to 24 years age bracket for the primary householder has the lowest median household income of $28,950, with 305 households (4.4%) in this group.
| Income Bracket | # Households | Median Income |
| 15 to 24 Years | 305 (4.4%) | $28,950 |
| 25 to 44 Years | 2,218 (32.1%) | $84,226 |
| 45 to 64 Years | 2,208 (31.9%) | $82,667 |
| 65+ Years | 2,190 (31.6%) | $36,711 |
| Total | 6,921 (100.0%) | $60,974 |
Poverty in Bartow
Income Below Poverty by Sex and Age in Bartow
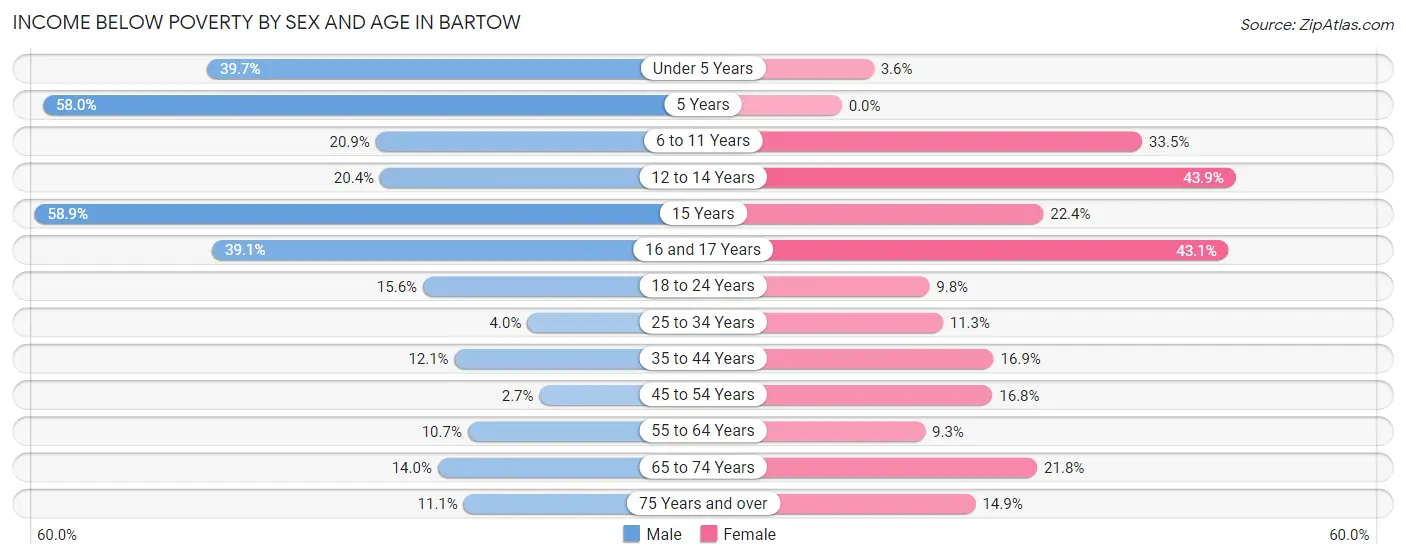
With 14.8% poverty level for males and 16.2% for females among the residents of Bartow, 15 year old males and 12 to 14 year old females are the most vulnerable to poverty, with 63 males (58.9%) and 171 females (43.9%) in their respective age groups living below the poverty level.
| Age Bracket | Male | Female |
| Under 5 Years | 319 (39.7%) | 13 (3.5%) |
| 5 Years | 51 (58.0%) | 0 (0.0%) |
| 6 to 11 Years | 136 (20.9%) | 99 (33.5%) |
| 12 to 14 Years | 105 (20.4%) | 171 (43.9%) |
| 15 Years | 63 (58.9%) | 46 (22.4%) |
| 16 and 17 Years | 97 (39.1%) | 87 (43.1%) |
| 18 to 24 Years | 117 (15.6%) | 95 (9.8%) |
| 25 to 34 Years | 68 (4.0%) | 186 (11.3%) |
| 35 to 44 Years | 106 (12.1%) | 185 (16.9%) |
| 45 to 54 Years | 33 (2.7%) | 185 (16.8%) |
| 55 to 64 Years | 115 (10.6%) | 102 (9.3%) |
| 65 to 74 Years | 127 (14.0%) | 210 (21.8%) |
| 75 Years and over | 46 (11.1%) | 113 (14.9%) |
| Total | 1,383 (14.8%) | 1,492 (16.2%) |
Income Above Poverty by Sex and Age in Bartow
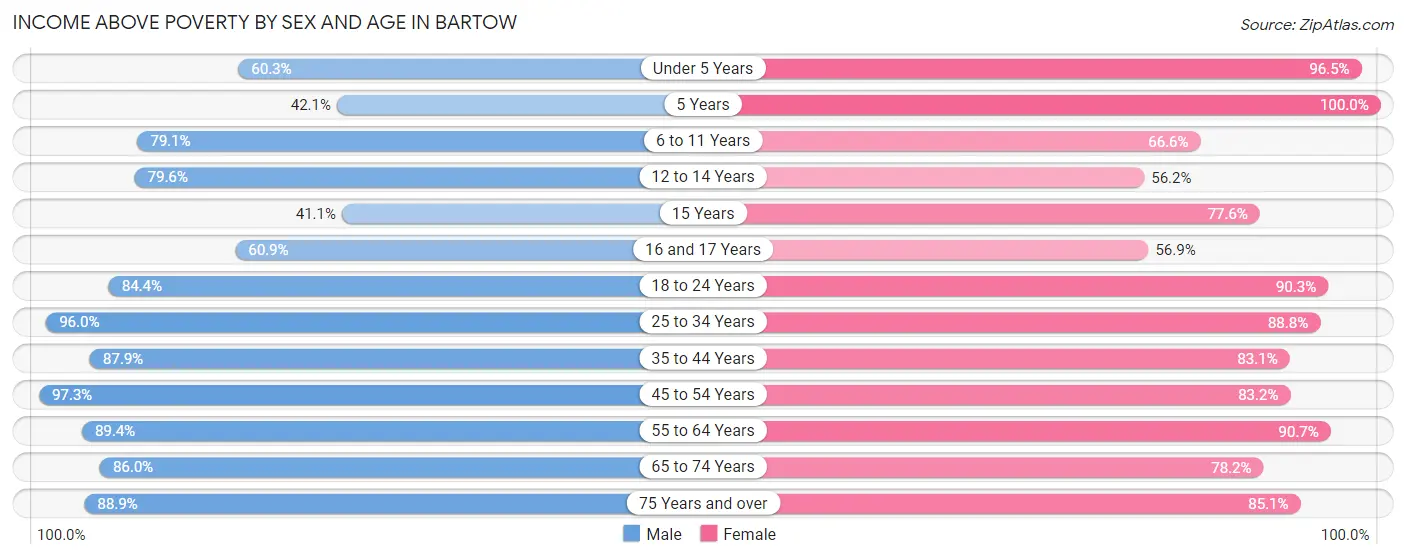
According to the poverty statistics in Bartow, males aged 45 to 54 years and females aged 5 years are the age groups that are most secure financially, with 97.3% of males and 100.0% of females in these age groups living above the poverty line.
| Age Bracket | Male | Female |
| Under 5 Years | 485 (60.3%) | 353 (96.5%) |
| 5 Years | 37 (42.0%) | 115 (100.0%) |
| 6 to 11 Years | 514 (79.1%) | 197 (66.5%) |
| 12 to 14 Years | 409 (79.6%) | 219 (56.1%) |
| 15 Years | 44 (41.1%) | 159 (77.6%) |
| 16 and 17 Years | 151 (60.9%) | 115 (56.9%) |
| 18 to 24 Years | 631 (84.4%) | 879 (90.2%) |
| 25 to 34 Years | 1,622 (96.0%) | 1,468 (88.7%) |
| 35 to 44 Years | 768 (87.9%) | 909 (83.1%) |
| 45 to 54 Years | 1,201 (97.3%) | 918 (83.2%) |
| 55 to 64 Years | 965 (89.3%) | 997 (90.7%) |
| 65 to 74 Years | 781 (86.0%) | 755 (78.2%) |
| 75 Years and over | 368 (88.9%) | 646 (85.1%) |
| Total | 7,976 (85.2%) | 7,730 (83.8%) |
Income Below Poverty Among Married-Couple Families in Bartow
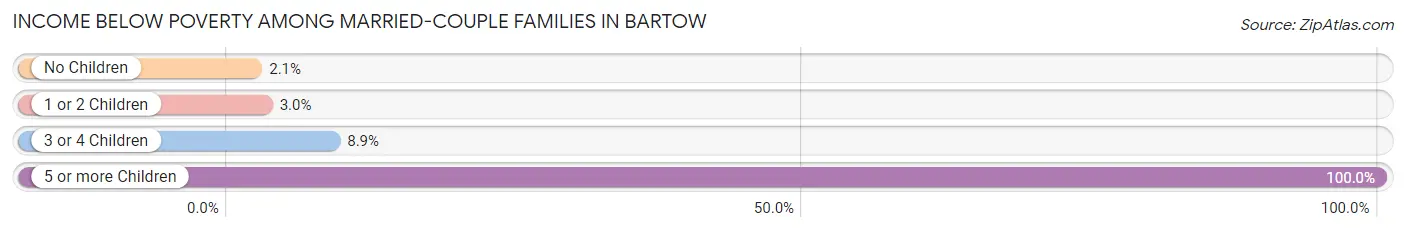
The poverty statistics for married-couple families in Bartow show that 4.1% or 125 of the total 3,029 families live below the poverty line. Families with 5 or more children have the highest poverty rate of 100.0%, comprising of 38 families. On the other hand, families with no children have the lowest poverty rate of 2.1%, which includes 40 families.
| Children | Above Poverty | Below Poverty |
| No Children | 1,855 (97.9%) | 40 (2.1%) |
| 1 or 2 Children | 834 (97.0%) | 26 (3.0%) |
| 3 or 4 Children | 215 (91.1%) | 21 (8.9%) |
| 5 or more Children | 0 (0.0%) | 38 (100.0%) |
| Total | 2,904 (95.9%) | 125 (4.1%) |
Income Below Poverty Among Single-Parent Households in Bartow
According to the poverty data in Bartow, 2.4% or 7 single-father households and 17.4% or 221 single-mother households are living below the poverty line. Among single-father households, those with 1 or 2 children have the highest poverty rate, with 7 households (3.6%) experiencing poverty. Likewise, among single-mother households, those with 5 or more children have the highest poverty rate, with 24 households (100.0%) falling below the poverty line.
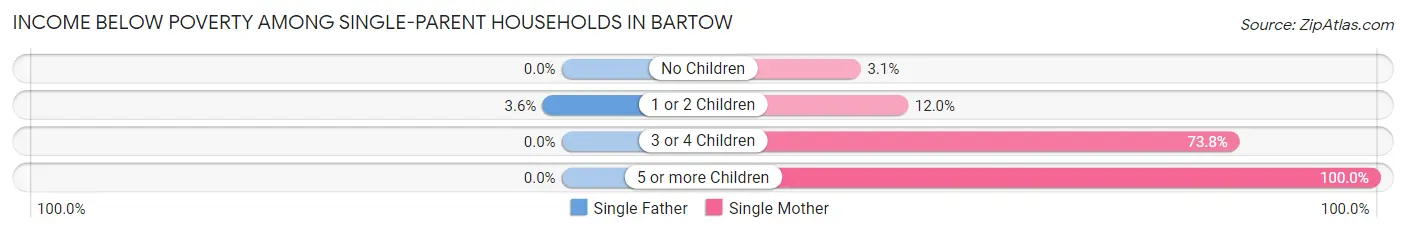
| Children | Single Father | Single Mother |
| No Children | 0 (0.0%) | 18 (3.1%) |
| 1 or 2 Children | 7 (3.6%) | 61 (12.0%) |
| 3 or 4 Children | 0 (0.0%) | 118 (73.8%) |
| 5 or more Children | 0 (0.0%) | 24 (100.0%) |
| Total | 7 (2.4%) | 221 (17.4%) |
Income Below Poverty Among Married-Couple vs Single-Parent Households in Bartow
The poverty data for Bartow shows that 125 of the married-couple family households (4.1%) and 228 of the single-parent households (14.6%) are living below the poverty level. Within the married-couple family households, those with 5 or more children have the highest poverty rate, with 38 households (100.0%) falling below the poverty line. Among the single-parent households, those with 5 or more children have the highest poverty rate, with 24 household (100.0%) living below poverty.
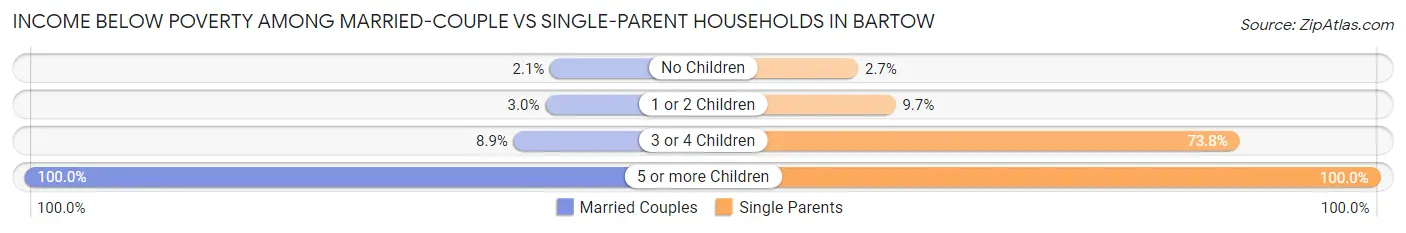
| Children | Married-Couple Families | Single-Parent Households |
| No Children | 40 (2.1%) | 18 (2.7%) |
| 1 or 2 Children | 26 (3.0%) | 68 (9.7%) |
| 3 or 4 Children | 21 (8.9%) | 118 (73.8%) |
| 5 or more Children | 38 (100.0%) | 24 (100.0%) |
| Total | 125 (4.1%) | 228 (14.6%) |
Race in Bartow
The most populous races in Bartow are White / Caucasian (11,642 | 59.9%), Black / African American (4,666 | 24.0%), and Hispanic or Latino (2,910 | 15.0%).
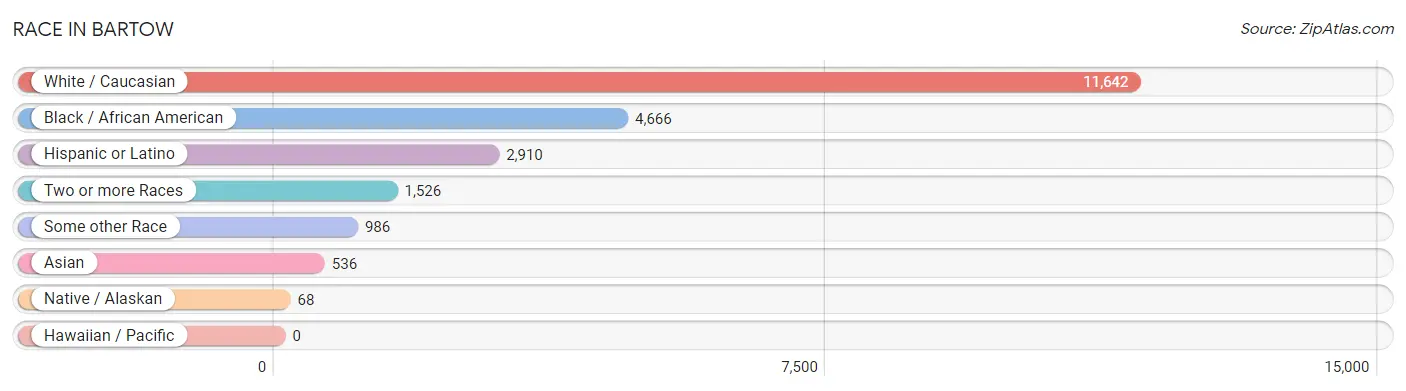
| Race | # Population | % Population |
| Asian | 536 | 2.8% |
| Black / African American | 4,666 | 24.0% |
| Hawaiian / Pacific | 0 | 0.0% |
| Hispanic or Latino | 2,910 | 15.0% |
| Native / Alaskan | 68 | 0.4% |
| White / Caucasian | 11,642 | 59.9% |
| Two or more Races | 1,526 | 7.9% |
| Some other Race | 986 | 5.1% |
| Total | 19,424 | 100.0% |
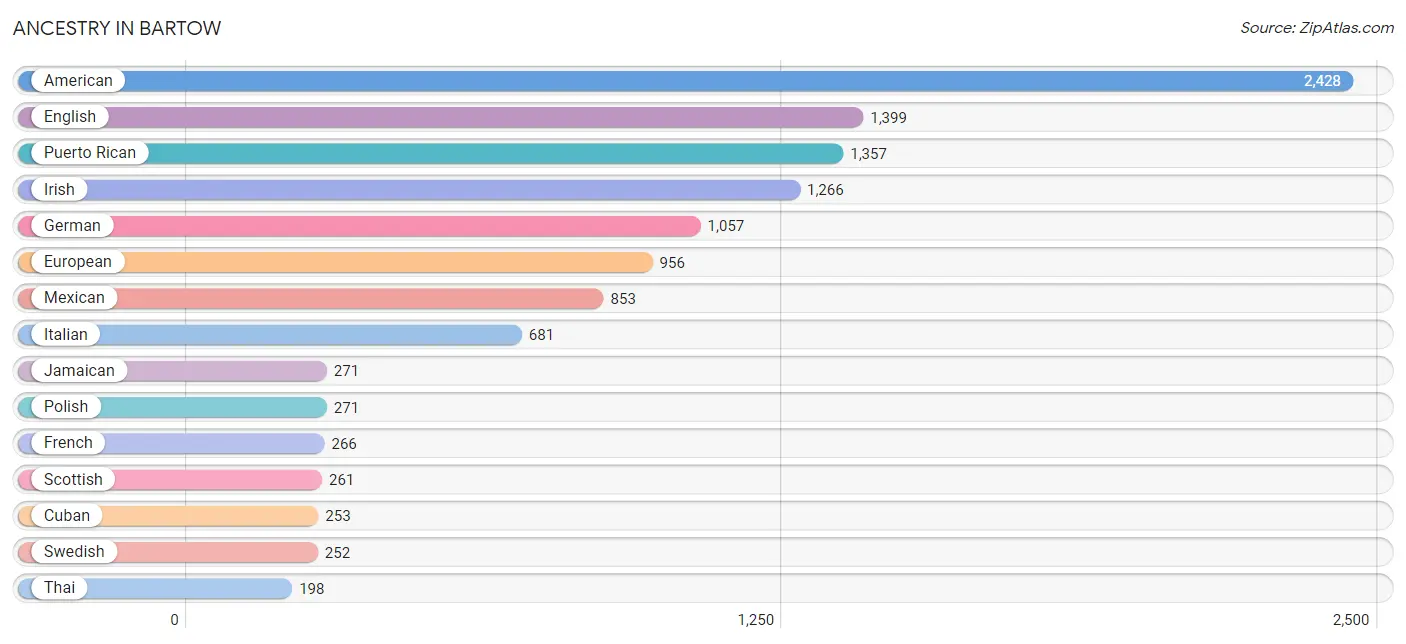
Ancestry in Bartow
The most populous ancestries reported in Bartow are American (2,428 | 12.5%), English (1,399 | 7.2%), Puerto Rican (1,357 | 7.0%), Irish (1,266 | 6.5%), and German (1,057 | 5.4%), together accounting for 38.7% of all Bartow residents.
| Ancestry | # Population | % Population |
| African | 32 | 0.2% |
| American | 2,428 | 12.5% |
| Arab | 57 | 0.3% |
| Armenian | 7 | 0.0% |
| Bahamian | 11 | 0.1% |
| Belgian | 10 | 0.1% |
| Bhutanese | 8 | 0.0% |
| Blackfeet | 12 | 0.1% |
| British | 54 | 0.3% |
| British West Indian | 57 | 0.3% |
| Burmese | 121 | 0.6% |
| Canadian | 44 | 0.2% |
| Central American | 162 | 0.8% |
| Cherokee | 28 | 0.1% |
| Colombian | 94 | 0.5% |
| Croatian | 9 | 0.1% |
| Cuban | 253 | 1.3% |
| Czech | 23 | 0.1% |
| Danish | 10 | 0.1% |
| Delaware | 9 | 0.1% |
| Dominican | 16 | 0.1% |
| Dutch | 59 | 0.3% |
| English | 1,399 | 7.2% |
| European | 956 | 4.9% |
| Finnish | 16 | 0.1% |
| French | 266 | 1.4% |
| French Canadian | 9 | 0.1% |
| German | 1,057 | 5.4% |
| Greek | 13 | 0.1% |
| Guatemalan | 91 | 0.5% |
| Haitian | 10 | 0.1% |
| Honduran | 71 | 0.4% |
| Hungarian | 68 | 0.4% |
| Indian (Asian) | 60 | 0.3% |
| Iraqi | 52 | 0.3% |
| Irish | 1,266 | 6.5% |
| Italian | 681 | 3.5% |
| Jamaican | 271 | 1.4% |
| Korean | 119 | 0.6% |
| Lithuanian | 10 | 0.1% |
| Malaysian | 38 | 0.2% |
| Mexican | 853 | 4.4% |
| Mexican American Indian | 41 | 0.2% |
| Native Hawaiian | 12 | 0.1% |
| Norwegian | 128 | 0.7% |
| Pakistani | 13 | 0.1% |
| Pennsylvania German | 9 | 0.1% |
| Peruvian | 78 | 0.4% |
| Polish | 271 | 1.4% |
| Puerto Rican | 1,357 | 7.0% |
| Scandinavian | 9 | 0.1% |
| Scotch-Irish | 165 | 0.9% |
| Scottish | 261 | 1.3% |
| Seminole | 9 | 0.1% |
| Sierra Leonean | 12 | 0.1% |
| Slavic | 31 | 0.2% |
| Slovak | 11 | 0.1% |
| Slovene | 3 | 0.0% |
| South American | 172 | 0.9% |
| Spaniard | 53 | 0.3% |
| Spanish | 32 | 0.2% |
| Sri Lankan | 35 | 0.2% |
| Subsaharan African | 44 | 0.2% |
| Swedish | 252 | 1.3% |
| Swiss | 18 | 0.1% |
| Syrian | 5 | 0.0% |
| Thai | 198 | 1.0% |
| Turkish | 9 | 0.1% |
| Ukrainian | 30 | 0.2% |
| Welsh | 93 | 0.5% |
| West Indian | 18 | 0.1% | View All 71 Rows |
Immigrants in Bartow
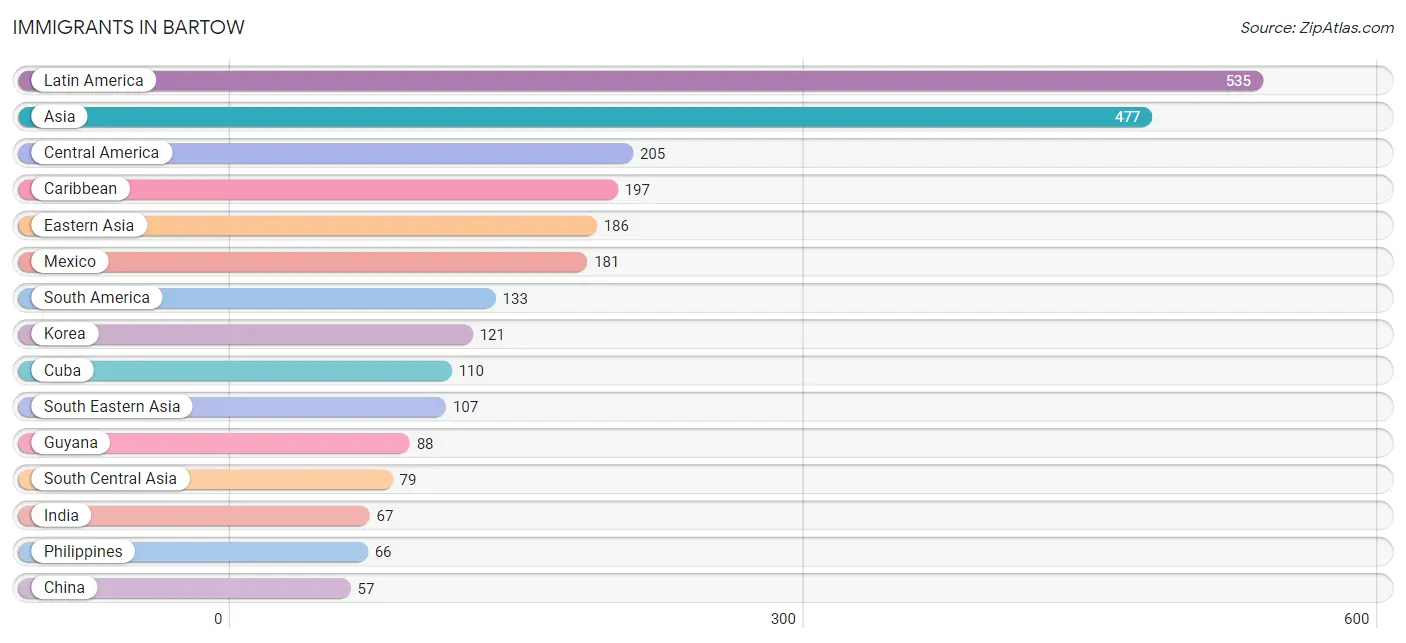
The most numerous immigrant groups reported in Bartow came from Latin America (535 | 2.8%), Asia (477 | 2.5%), Central America (205 | 1.1%), Caribbean (197 | 1.0%), and Eastern Asia (186 | 1.0%), together accounting for 8.2% of all Bartow residents.
| Immigration Origin | # Population | % Population |
| Asia | 477 | 2.5% |
| Bahamas | 2 | 0.0% |
| Caribbean | 197 | 1.0% |
| Central America | 205 | 1.1% |
| Chile | 5 | 0.0% |
| China | 57 | 0.3% |
| Colombia | 40 | 0.2% |
| Cuba | 110 | 0.6% |
| Dominican Republic | 16 | 0.1% |
| Eastern Asia | 186 | 1.0% |
| Eastern Europe | 7 | 0.0% |
| England | 20 | 0.1% |
| Europe | 35 | 0.2% |
| Germany | 8 | 0.0% |
| Grenada | 18 | 0.1% |
| Guatemala | 13 | 0.1% |
| Guyana | 88 | 0.4% |
| Haiti | 10 | 0.1% |
| Honduras | 11 | 0.1% |
| India | 67 | 0.3% |
| Iraq | 41 | 0.2% |
| Jamaica | 41 | 0.2% |
| Japan | 8 | 0.0% |
| Kazakhstan | 12 | 0.1% |
| Korea | 121 | 0.6% |
| Laos | 28 | 0.1% |
| Latin America | 535 | 2.8% |
| Mexico | 181 | 0.9% |
| Northern Europe | 20 | 0.1% |
| Philippines | 66 | 0.3% |
| South America | 133 | 0.7% |
| South Central Asia | 79 | 0.4% |
| South Eastern Asia | 107 | 0.5% |
| Turkey | 9 | 0.1% |
| Ukraine | 7 | 0.0% |
| Vietnam | 13 | 0.1% |
| Western Asia | 50 | 0.3% |
| Western Europe | 8 | 0.0% | View All 38 Rows |
Sex and Age in Bartow
Sex and Age in Bartow
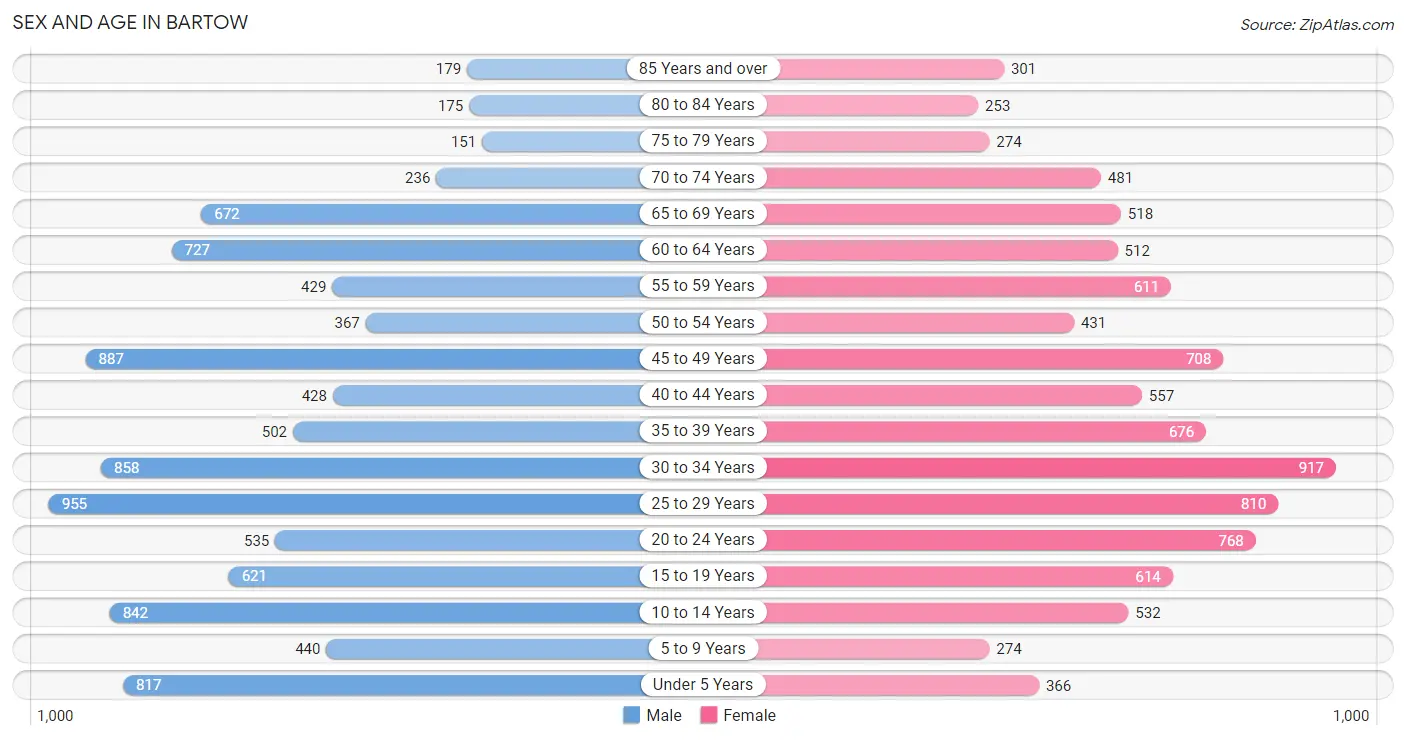
The most populous age groups in Bartow are 25 to 29 Years (955 | 9.7%) for men and 30 to 34 Years (917 | 9.6%) for women.
| Age Bracket | Male | Female |
| Under 5 Years | 817 (8.3%) | 366 (3.8%) |
| 5 to 9 Years | 440 (4.5%) | 274 (2.9%) |
| 10 to 14 Years | 842 (8.6%) | 532 (5.5%) |
| 15 to 19 Years | 621 (6.3%) | 614 (6.4%) |
| 20 to 24 Years | 535 (5.4%) | 768 (8.0%) |
| 25 to 29 Years | 955 (9.7%) | 810 (8.4%) |
| 30 to 34 Years | 858 (8.7%) | 917 (9.6%) |
| 35 to 39 Years | 502 (5.1%) | 676 (7.0%) |
| 40 to 44 Years | 428 (4.4%) | 557 (5.8%) |
| 45 to 49 Years | 887 (9.0%) | 708 (7.4%) |
| 50 to 54 Years | 367 (3.7%) | 431 (4.5%) |
| 55 to 59 Years | 429 (4.4%) | 611 (6.4%) |
| 60 to 64 Years | 727 (7.4%) | 512 (5.3%) |
| 65 to 69 Years | 672 (6.8%) | 518 (5.4%) |
| 70 to 74 Years | 236 (2.4%) | 481 (5.0%) |
| 75 to 79 Years | 151 (1.5%) | 274 (2.9%) |
| 80 to 84 Years | 175 (1.8%) | 253 (2.6%) |
| 85 Years and over | 179 (1.8%) | 301 (3.1%) |
| Total | 9,821 (100.0%) | 9,603 (100.0%) |
Families and Households in Bartow
Median Family Size in Bartow
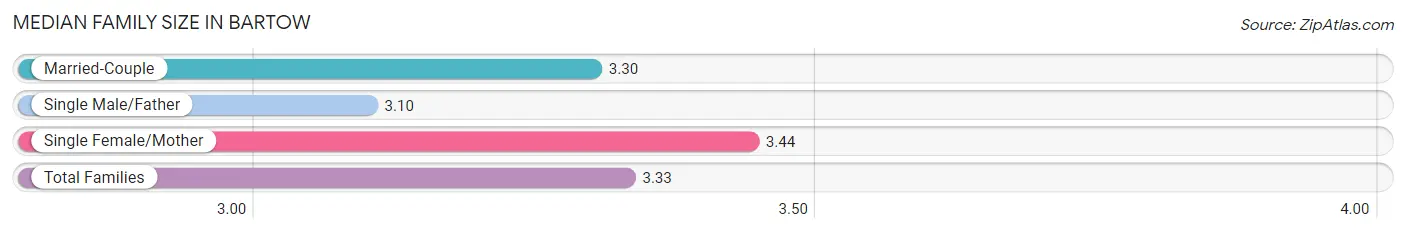
The median family size in Bartow is 3.33 persons per family, with single female/mother families (1,269 | 27.7%) accounting for the largest median family size of 3.44 persons per family. On the other hand, single male/father families (291 | 6.3%) represent the smallest median family size with 3.10 persons per family.
| Family Type | # Families | Family Size |
| Married-Couple | 3,029 (66.0%) | 3.30 |
| Single Male/Father | 291 (6.3%) | 3.10 |
| Single Female/Mother | 1,269 (27.7%) | 3.44 |
| Total Families | 4,589 (100.0%) | 3.33 |
Median Household Size in Bartow
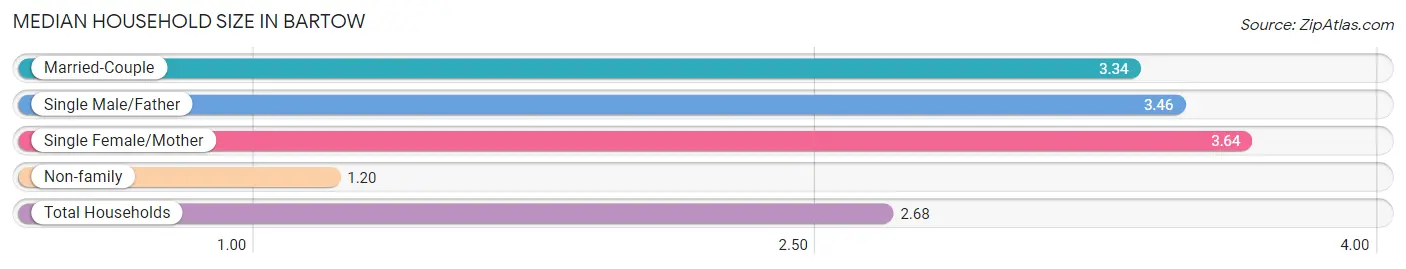
The median household size in Bartow is 2.68 persons per household, with single female/mother households (1,269 | 18.3%) accounting for the largest median household size of 3.64 persons per household. non-family households (2,332 | 33.7%) represent the smallest median household size with 1.20 persons per household.
| Household Type | # Households | Household Size |
| Married-Couple | 3,029 (43.8%) | 3.34 |
| Single Male/Father | 291 (4.2%) | 3.46 |
| Single Female/Mother | 1,269 (18.3%) | 3.64 |
| Non-family | 2,332 (33.7%) | 1.20 |
| Total Households | 6,921 (100.0%) | 2.68 |
Household Size by Marriage Status in Bartow
Out of a total of 6,921 households in Bartow, 4,589 (66.3%) are family households, while 2,332 (33.7%) are nonfamily households. The most numerous type of family households are 2-person households, comprising 2,026, and the most common type of nonfamily households are 1-person households, comprising 1,969.
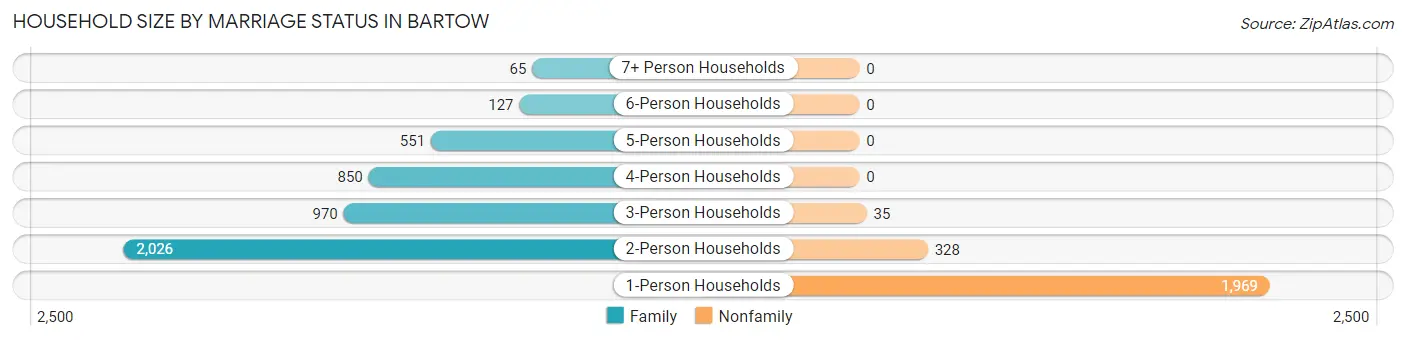
| Household Size | Family Households | Nonfamily Households |
| 1-Person Households | - | 1,969 (28.4%) |
| 2-Person Households | 2,026 (29.3%) | 328 (4.7%) |
| 3-Person Households | 970 (14.0%) | 35 (0.5%) |
| 4-Person Households | 850 (12.3%) | 0 (0.0%) |
| 5-Person Households | 551 (8.0%) | 0 (0.0%) |
| 6-Person Households | 127 (1.8%) | 0 (0.0%) |
| 7+ Person Households | 65 (0.9%) | 0 (0.0%) |
| Total | 4,589 (66.3%) | 2,332 (33.7%) |
Female Fertility in Bartow
Fertility by Age in Bartow
Average fertility rate in Bartow is 57.0 births per 1,000 women. Women in the age bracket of 20 to 34 years have the highest fertility rate with 81.0 births per 1,000 women. Women in the age bracket of 20 to 34 years acount for 68.8% of all women with births.
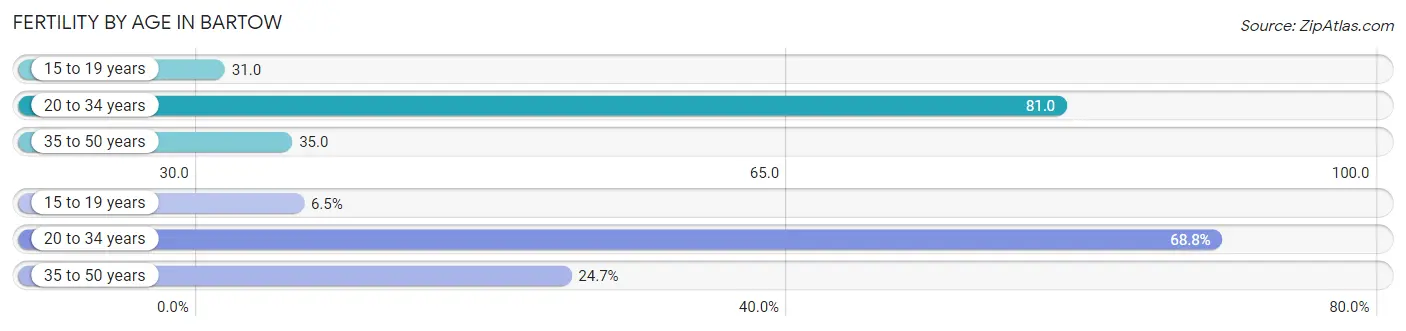
| Age Bracket | Women with Births | Births / 1,000 Women |
| 15 to 19 years | 19 (6.5%) | 31.0 |
| 20 to 34 years | 201 (68.8%) | 81.0 |
| 35 to 50 years | 72 (24.7%) | 35.0 |
| Total | 292 (100.0%) | 57.0 |
Fertility by Age by Marriage Status in Bartow
62.7% of women with births (292) in Bartow are married. The highest percentage of unmarried women with births falls into 35 to 50 years age bracket with 91.7% of them unmarried at the time of birth, while the lowest percentage of unmarried women with births belong to 15 to 19 years age bracket with 0.0% of them unmarried.
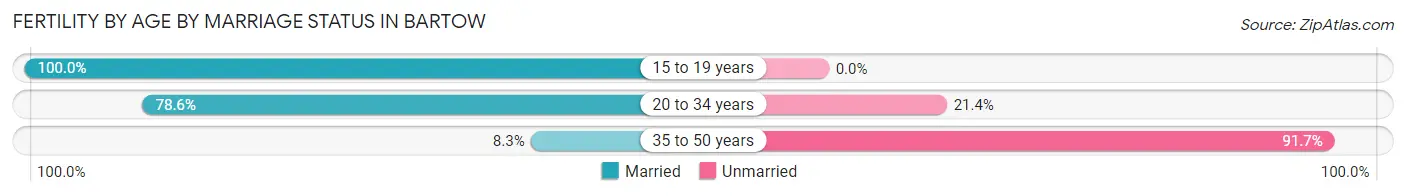
| Age Bracket | Married | Unmarried |
| 15 to 19 years | 19 (100.0%) | 0 (0.0%) |
| 20 to 34 years | 158 (78.6%) | 43 (21.4%) |
| 35 to 50 years | 6 (8.3%) | 66 (91.7%) |
| Total | 183 (62.7%) | 109 (37.3%) |
Fertility by Education in Bartow
Average fertility rate in Bartow is 57.0 births per 1,000 women. Women with the education attainment of bachelor's degree have the highest fertility rate of 92.0 births per 1,000 women, while women with the education attainment of graduate degree have the lowest fertility at 26.0 births per 1,000 women. Women with the education attainment of high school diploma represent 31.2% of all women with births.
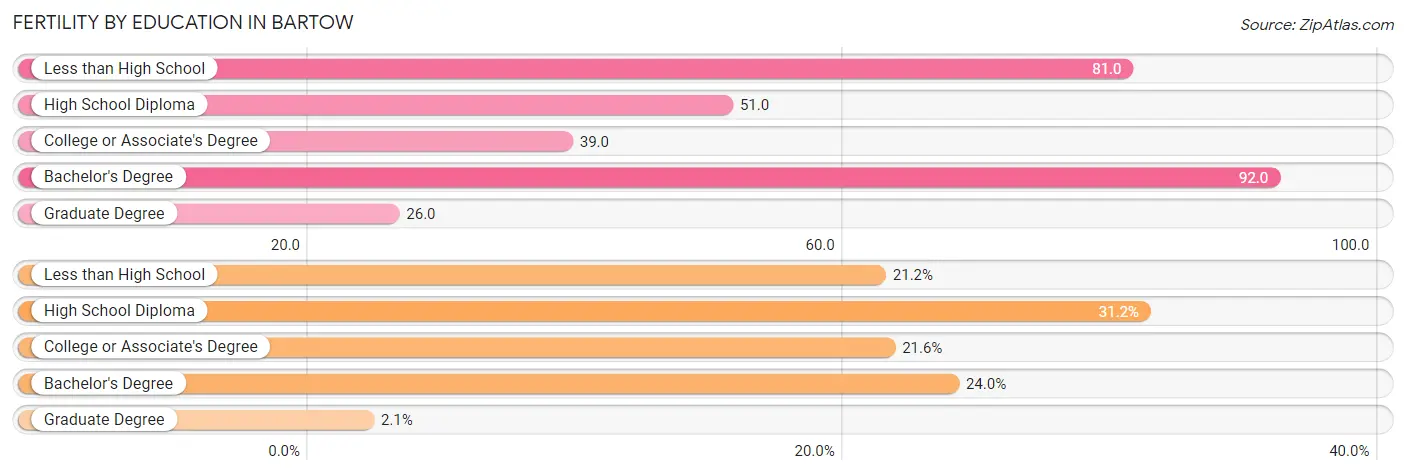
| Educational Attainment | Women with Births | Births / 1,000 Women |
| Less than High School | 62 (21.2%) | 81.0 |
| High School Diploma | 91 (31.2%) | 51.0 |
| College or Associate's Degree | 63 (21.6%) | 39.0 |
| Bachelor's Degree | 70 (24.0%) | 92.0 |
| Graduate Degree | 6 (2.1%) | 26.0 |
| Total | 292 (100.0%) | 57.0 |
Fertility by Education by Marriage Status in Bartow
37.3% of women with births in Bartow are unmarried. Women with the educational attainment of bachelor's degree are most likely to be married with 100.0% of them married at childbirth, while women with the educational attainment of less than high school are least likely to be married with 100.0% of them unmarried at childbirth.
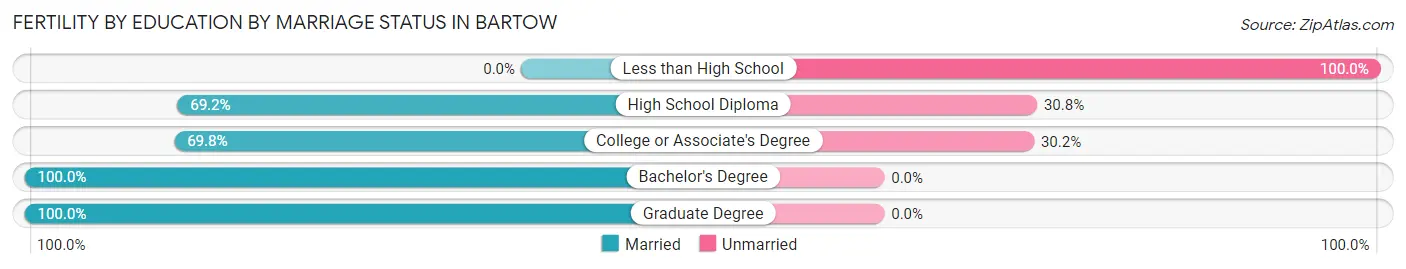
| Educational Attainment | Married | Unmarried |
| Less than High School | 0 (0.0%) | 62 (100.0%) |
| High School Diploma | 63 (69.2%) | 28 (30.8%) |
| College or Associate's Degree | 44 (69.8%) | 19 (30.2%) |
| Bachelor's Degree | 70 (100.0%) | 0 (0.0%) |
| Graduate Degree | 6 (100.0%) | 0 (0.0%) |
| Total | 183 (62.7%) | 109 (37.3%) |
Employment Characteristics in Bartow
Employment by Class of Employer in Bartow
Among the 9,616 employed individuals in Bartow, private company employees (6,957 | 72.4%), local government employees (986 | 10.2%), and state government employees (593 | 6.2%) make up the most common classes of employment.
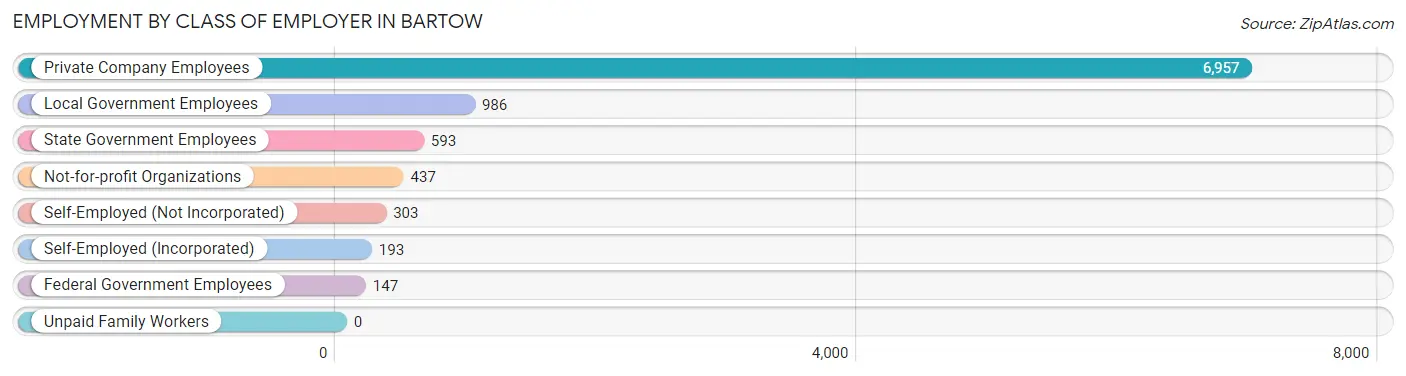
| Employer Class | # Employees | % Employees |
| Private Company Employees | 6,957 | 72.4% |
| Self-Employed (Incorporated) | 193 | 2.0% |
| Self-Employed (Not Incorporated) | 303 | 3.2% |
| Not-for-profit Organizations | 437 | 4.5% |
| Local Government Employees | 986 | 10.2% |
| State Government Employees | 593 | 6.2% |
| Federal Government Employees | 147 | 1.5% |
| Unpaid Family Workers | 0 | 0.0% |
| Total | 9,616 | 100.0% |
Employment Status by Age in Bartow
According to the labor force statistics for Bartow, out of the total population over 16 years of age (15,840), 64.3% or 10,185 individuals are in the labor force, with 4.0% or 407 of them unemployed. The age group with the highest labor force participation rate is 25 to 29 years, with 87.6% or 1,546 individuals in the labor force. Within the labor force, the 16 to 19 years age range has the highest percentage of unemployed individuals, with 13.8% or 62 of them being unemployed.
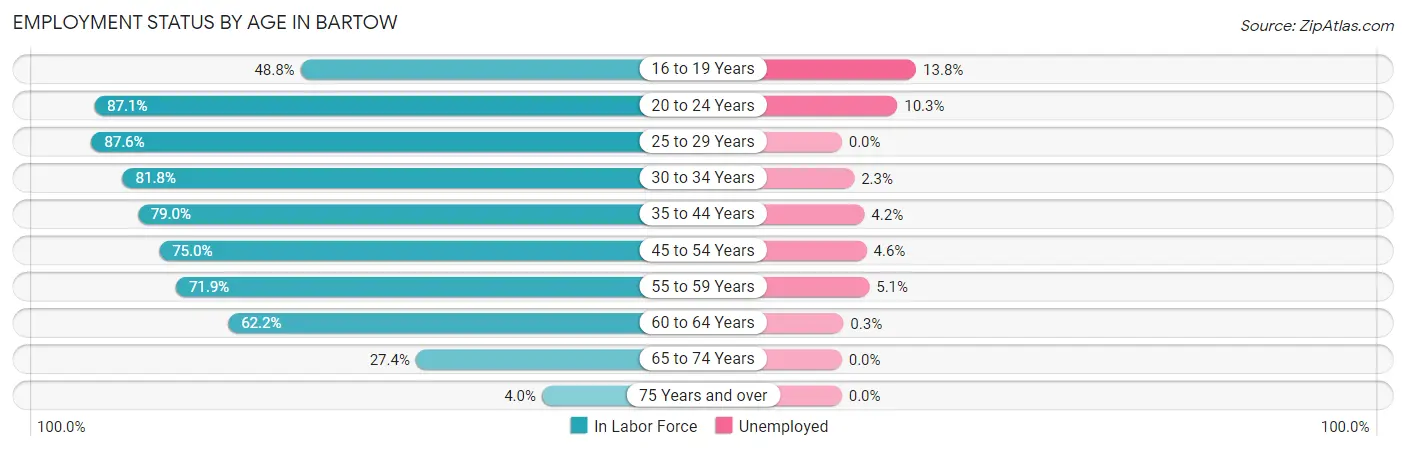
| Age Bracket | In Labor Force | Unemployed |
| 16 to 19 Years | 450 (48.8%) | 62 (13.8%) |
| 20 to 24 Years | 1,135 (87.1%) | 117 (10.3%) |
| 25 to 29 Years | 1,546 (87.6%) | 0 (0.0%) |
| 30 to 34 Years | 1,452 (81.8%) | 33 (2.3%) |
| 35 to 44 Years | 1,709 (79.0%) | 72 (4.2%) |
| 45 to 54 Years | 1,795 (75.0%) | 83 (4.6%) |
| 55 to 59 Years | 748 (71.9%) | 38 (5.1%) |
| 60 to 64 Years | 771 (62.2%) | 2 (0.3%) |
| 65 to 74 Years | 523 (27.4%) | 0 (0.0%) |
| 75 Years and over | 53 (4.0%) | 0 (0.0%) |
| Total | 10,185 (64.3%) | 407 (4.0%) |
Employment Status by Educational Attainment in Bartow
According to labor force statistics for Bartow, 77.3% of individuals (8,020) out of the total population between 25 and 64 years of age (10,375) are in the labor force, with 2.8% or 225 of them being unemployed. The group with the highest labor force participation rate are those with the educational attainment of bachelor's degree or higher, with 89.9% or 1,976 individuals in the labor force. Within the labor force, individuals with less than high school education have the highest percentage of unemployment, with 9.3% or 36 of them being unemployed.
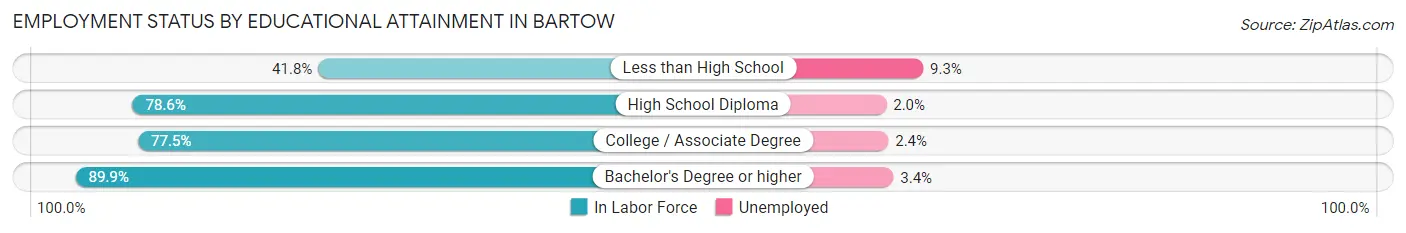
| Educational Attainment | In Labor Force | Unemployed |
| Less than High School | 387 (41.8%) | 86 (9.3%) |
| High School Diploma | 2,864 (78.6%) | 73 (2.0%) |
| College / Associate Degree | 2,796 (77.5%) | 87 (2.4%) |
| Bachelor's Degree or higher | 1,976 (89.9%) | 75 (3.4%) |
| Total | 8,020 (77.3%) | 290 (2.8%) |
Employment Occupations by Sex in Bartow
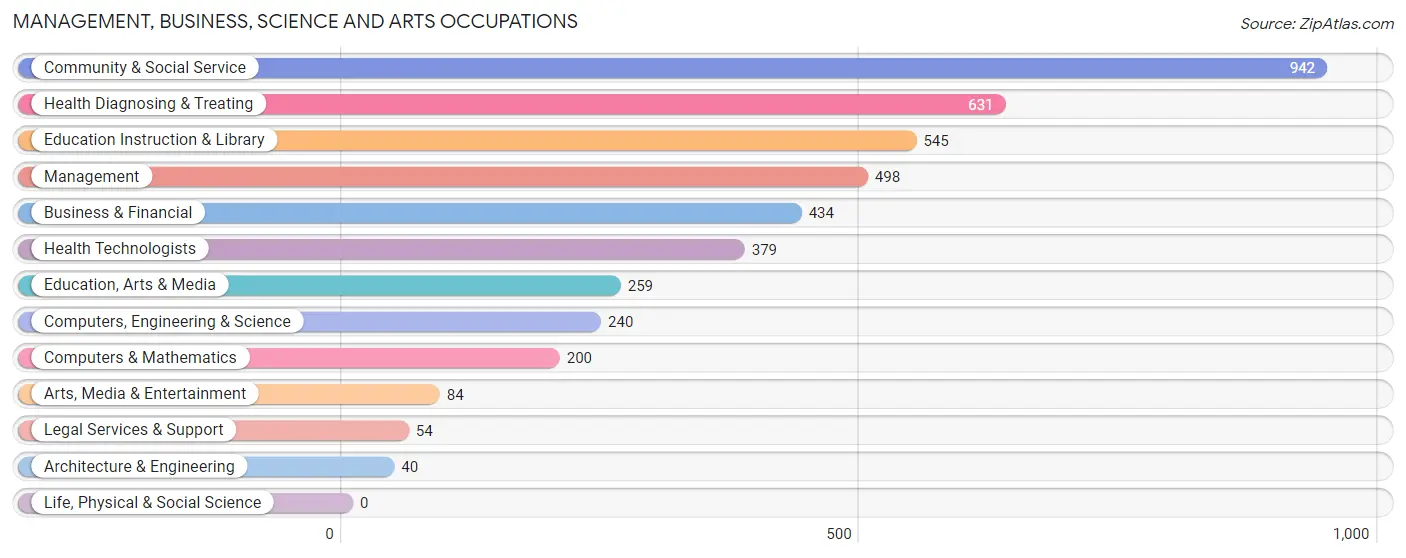
Management, Business, Science and Arts Occupations
The most common Management, Business, Science and Arts occupations in Bartow are Community & Social Service (942 | 9.7%), Health Diagnosing & Treating (631 | 6.5%), Education Instruction & Library (545 | 5.6%), Management (498 | 5.1%), and Business & Financial (434 | 4.4%).
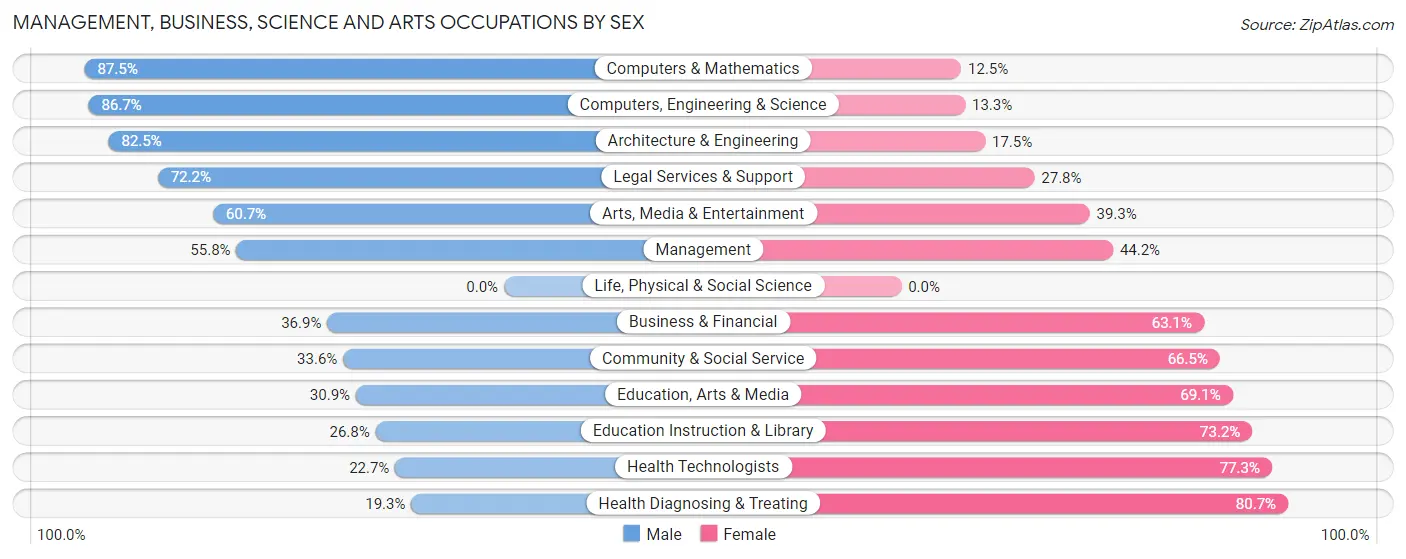
Management, Business, Science and Arts Occupations by Sex
Within the Management, Business, Science and Arts occupations in Bartow, the most male-oriented occupations are Computers & Mathematics (87.5%), Computers, Engineering & Science (86.7%), and Architecture & Engineering (82.5%), while the most female-oriented occupations are Health Diagnosing & Treating (80.7%), Health Technologists (77.3%), and Education Instruction & Library (73.2%).
| Occupation | Male | Female |
| Management | 278 (55.8%) | 220 (44.2%) |
| Business & Financial | 160 (36.9%) | 274 (63.1%) |
| Computers, Engineering & Science | 208 (86.7%) | 32 (13.3%) |
| Computers & Mathematics | 175 (87.5%) | 25 (12.5%) |
| Architecture & Engineering | 33 (82.5%) | 7 (17.5%) |
| Life, Physical & Social Science | 0 (0.0%) | 0 (0.0%) |
| Community & Social Service | 316 (33.6%) | 626 (66.4%) |
| Education, Arts & Media | 80 (30.9%) | 179 (69.1%) |
| Legal Services & Support | 39 (72.2%) | 15 (27.8%) |
| Education Instruction & Library | 146 (26.8%) | 399 (73.2%) |
| Arts, Media & Entertainment | 51 (60.7%) | 33 (39.3%) |
| Health Diagnosing & Treating | 122 (19.3%) | 509 (80.7%) |
| Health Technologists | 86 (22.7%) | 293 (77.3%) |
| Total (Category) | 1,084 (39.5%) | 1,661 (60.5%) |
| Total (Overall) | 4,927 (50.5%) | 4,825 (49.5%) |
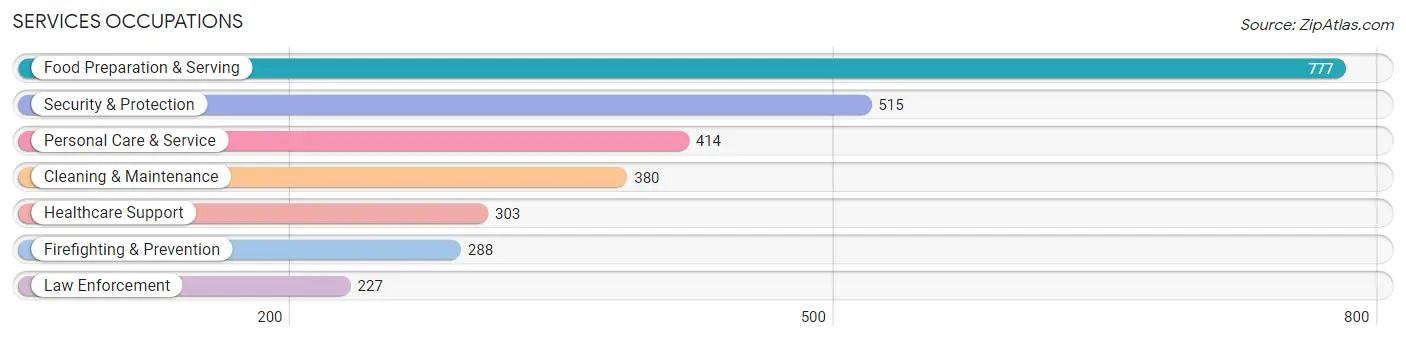
Services Occupations
The most common Services occupations in Bartow are Food Preparation & Serving (777 | 8.0%), Security & Protection (515 | 5.3%), Personal Care & Service (414 | 4.3%), Cleaning & Maintenance (380 | 3.9%), and Healthcare Support (303 | 3.1%).
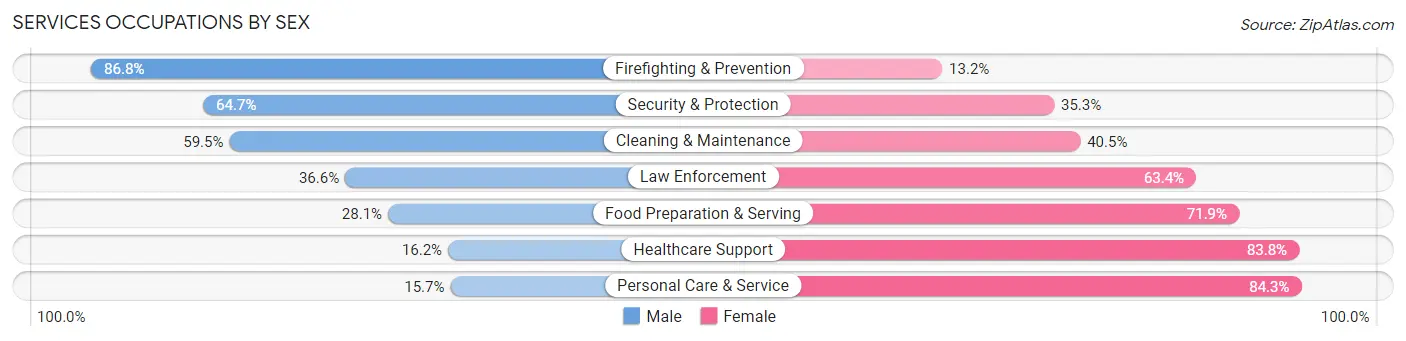
Services Occupations by Sex
Within the Services occupations in Bartow, the most male-oriented occupations are Firefighting & Prevention (86.8%), Security & Protection (64.7%), and Cleaning & Maintenance (59.5%), while the most female-oriented occupations are Personal Care & Service (84.3%), Healthcare Support (83.8%), and Food Preparation & Serving (71.9%).
| Occupation | Male | Female |
| Healthcare Support | 49 (16.2%) | 254 (83.8%) |
| Security & Protection | 333 (64.7%) | 182 (35.3%) |
| Firefighting & Prevention | 250 (86.8%) | 38 (13.2%) |
| Law Enforcement | 83 (36.6%) | 144 (63.4%) |
| Food Preparation & Serving | 218 (28.1%) | 559 (71.9%) |
| Cleaning & Maintenance | 226 (59.5%) | 154 (40.5%) |
| Personal Care & Service | 65 (15.7%) | 349 (84.3%) |
| Total (Category) | 891 (37.3%) | 1,498 (62.7%) |
| Total (Overall) | 4,927 (50.5%) | 4,825 (49.5%) |
Sales and Office Occupations
The most common Sales and Office occupations in Bartow are Office & Administration (1,037 | 10.6%), and Sales & Related (890 | 9.1%).

Sales and Office Occupations by Sex
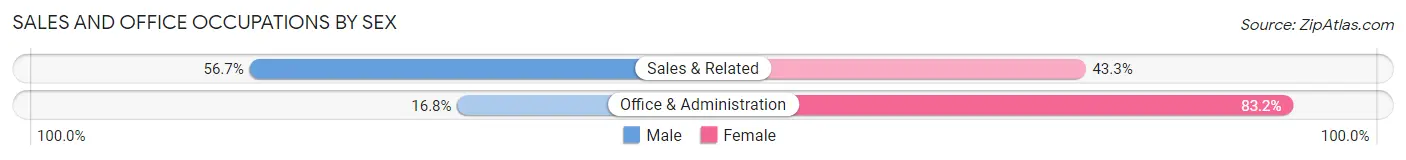
| Occupation | Male | Female |
| Sales & Related | 505 (56.7%) | 385 (43.3%) |
| Office & Administration | 174 (16.8%) | 863 (83.2%) |
| Total (Category) | 679 (35.2%) | 1,248 (64.8%) |
| Total (Overall) | 4,927 (50.5%) | 4,825 (49.5%) |
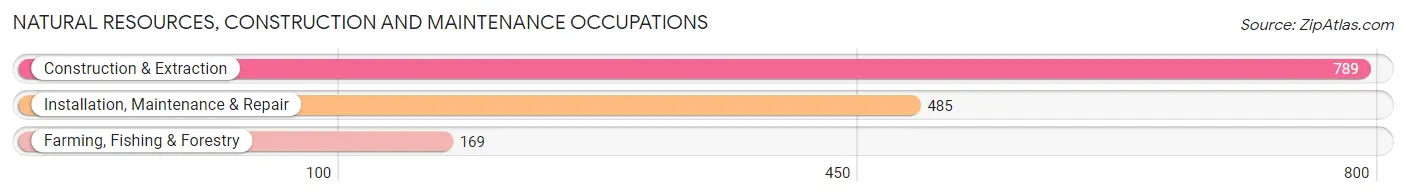
Natural Resources, Construction and Maintenance Occupations
The most common Natural Resources, Construction and Maintenance occupations in Bartow are Construction & Extraction (789 | 8.1%), Installation, Maintenance & Repair (485 | 5.0%), and Farming, Fishing & Forestry (169 | 1.7%).
Natural Resources, Construction and Maintenance Occupations by Sex
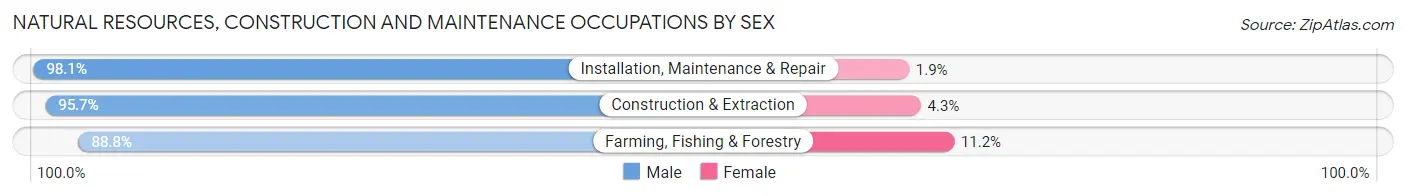
| Occupation | Male | Female |
| Farming, Fishing & Forestry | 150 (88.8%) | 19 (11.2%) |
| Construction & Extraction | 755 (95.7%) | 34 (4.3%) |
| Installation, Maintenance & Repair | 476 (98.1%) | 9 (1.9%) |
| Total (Category) | 1,381 (95.7%) | 62 (4.3%) |
| Total (Overall) | 4,927 (50.5%) | 4,825 (49.5%) |
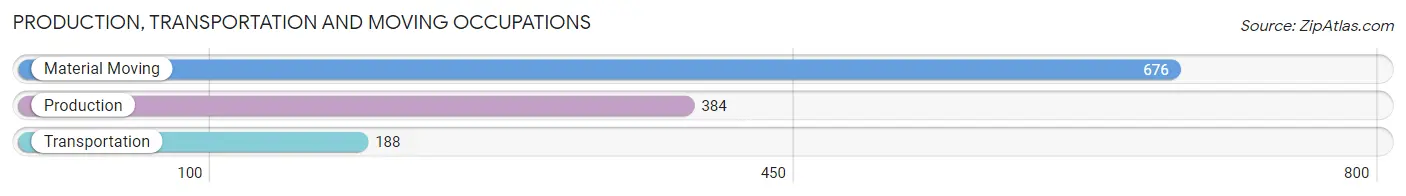
Production, Transportation and Moving Occupations
The most common Production, Transportation and Moving occupations in Bartow are Material Moving (676 | 6.9%), Production (384 | 3.9%), and Transportation (188 | 1.9%).
Production, Transportation and Moving Occupations by Sex
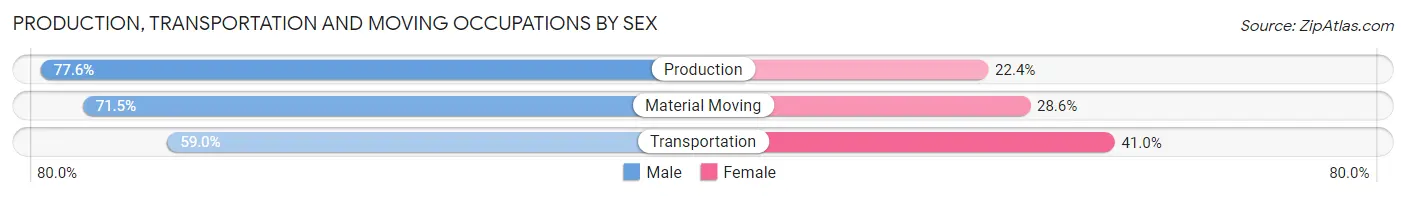
| Occupation | Male | Female |
| Production | 298 (77.6%) | 86 (22.4%) |
| Transportation | 111 (59.0%) | 77 (41.0%) |
| Material Moving | 483 (71.5%) | 193 (28.5%) |
| Total (Category) | 892 (71.5%) | 356 (28.5%) |
| Total (Overall) | 4,927 (50.5%) | 4,825 (49.5%) |
Employment Industries by Sex in Bartow
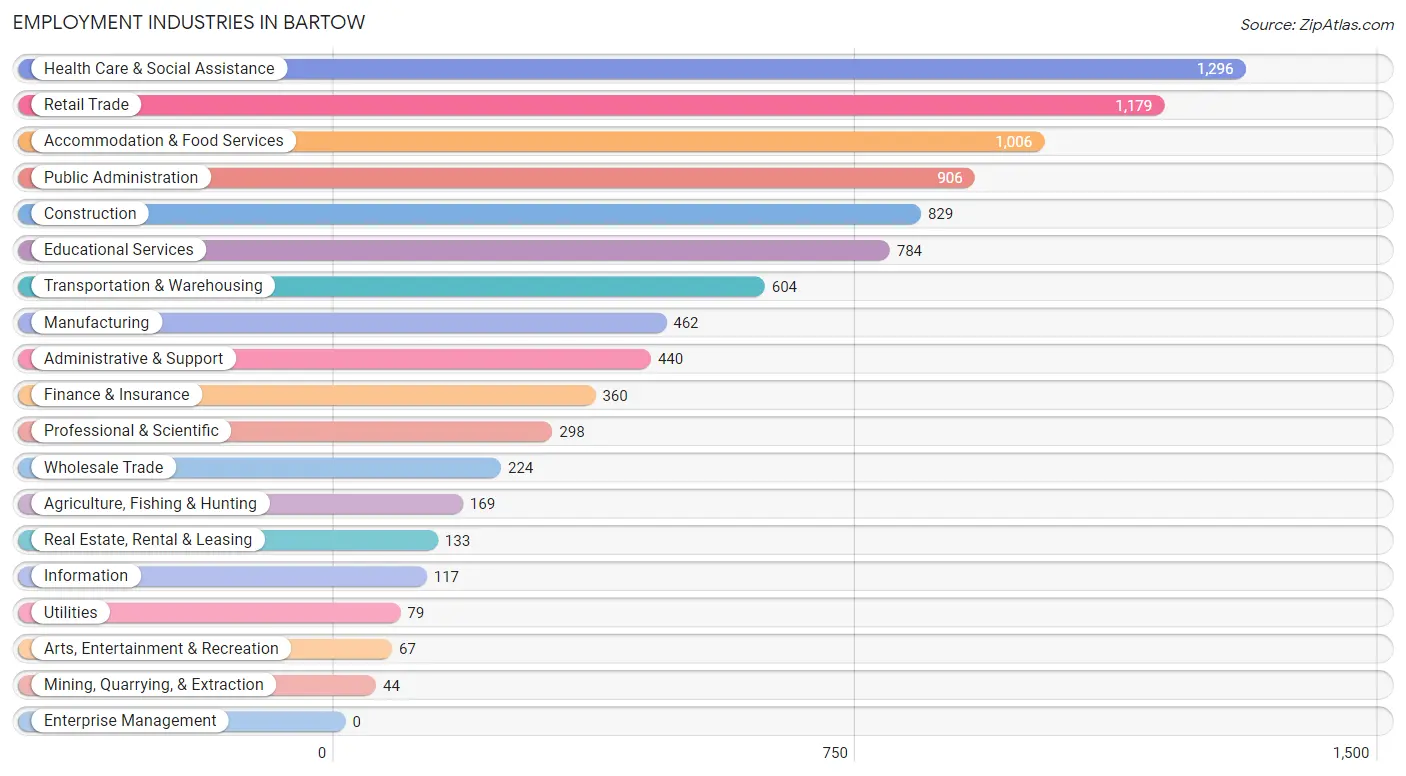
Employment Industries in Bartow
The major employment industries in Bartow include Health Care & Social Assistance (1,296 | 13.3%), Retail Trade (1,179 | 12.1%), Accommodation & Food Services (1,006 | 10.3%), Public Administration (906 | 9.3%), and Construction (829 | 8.5%).
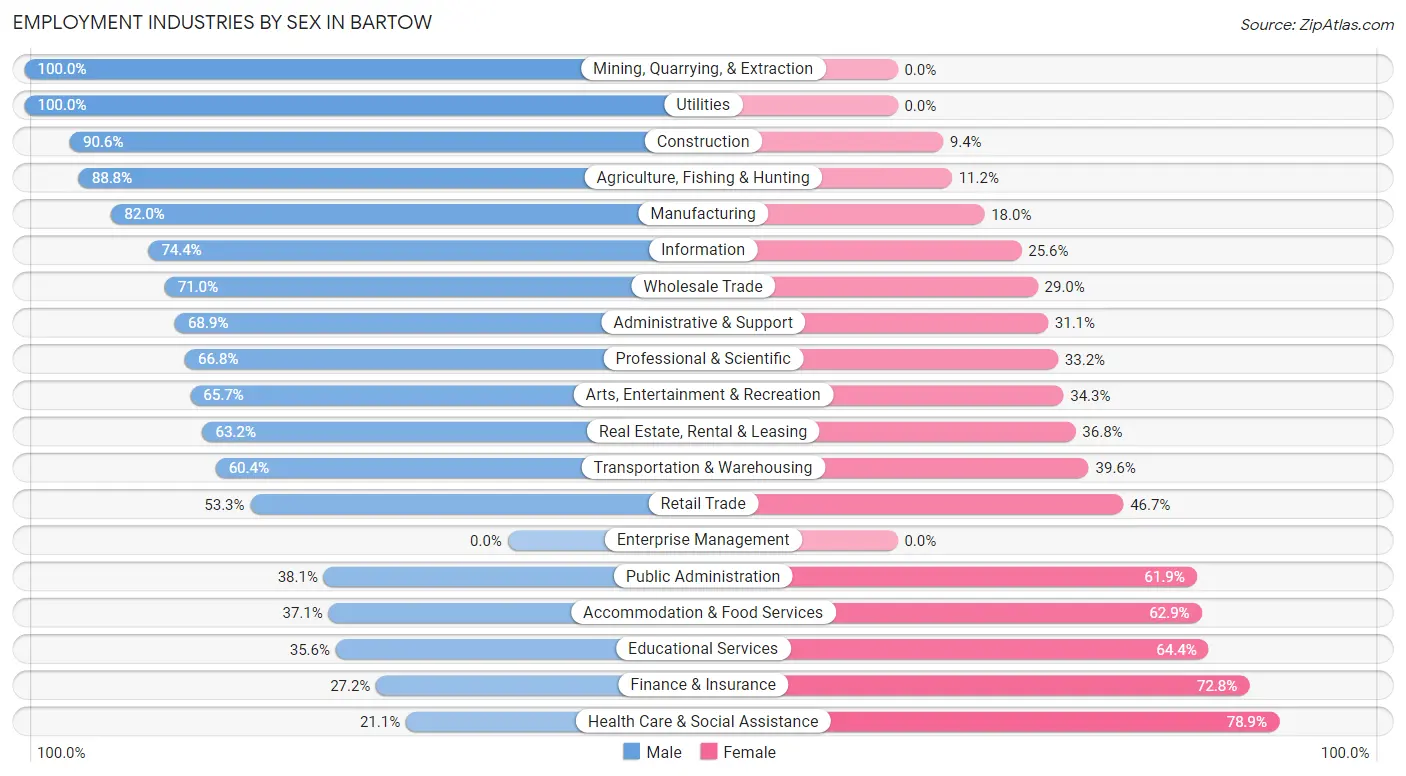
Employment Industries by Sex in Bartow
The Bartow industries that see more men than women are Mining, Quarrying, & Extraction (100.0%), Utilities (100.0%), and Construction (90.6%), whereas the industries that tend to have a higher number of women are Health Care & Social Assistance (78.9%), Finance & Insurance (72.8%), and Educational Services (64.4%).
| Industry | Male | Female |
| Agriculture, Fishing & Hunting | 150 (88.8%) | 19 (11.2%) |
| Mining, Quarrying, & Extraction | 44 (100.0%) | 0 (0.0%) |
| Construction | 751 (90.6%) | 78 (9.4%) |
| Manufacturing | 379 (82.0%) | 83 (18.0%) |
| Wholesale Trade | 159 (71.0%) | 65 (29.0%) |
| Retail Trade | 628 (53.3%) | 551 (46.7%) |
| Transportation & Warehousing | 365 (60.4%) | 239 (39.6%) |
| Utilities | 79 (100.0%) | 0 (0.0%) |
| Information | 87 (74.4%) | 30 (25.6%) |
| Finance & Insurance | 98 (27.2%) | 262 (72.8%) |
| Real Estate, Rental & Leasing | 84 (63.2%) | 49 (36.8%) |
| Professional & Scientific | 199 (66.8%) | 99 (33.2%) |
| Enterprise Management | 0 (0.0%) | 0 (0.0%) |
| Administrative & Support | 303 (68.9%) | 137 (31.1%) |
| Educational Services | 279 (35.6%) | 505 (64.4%) |
| Health Care & Social Assistance | 273 (21.1%) | 1,023 (78.9%) |
| Arts, Entertainment & Recreation | 44 (65.7%) | 23 (34.3%) |
| Accommodation & Food Services | 373 (37.1%) | 633 (62.9%) |
| Public Administration | 345 (38.1%) | 561 (61.9%) |
| Total | 4,927 (50.5%) | 4,825 (49.5%) |
Education in Bartow
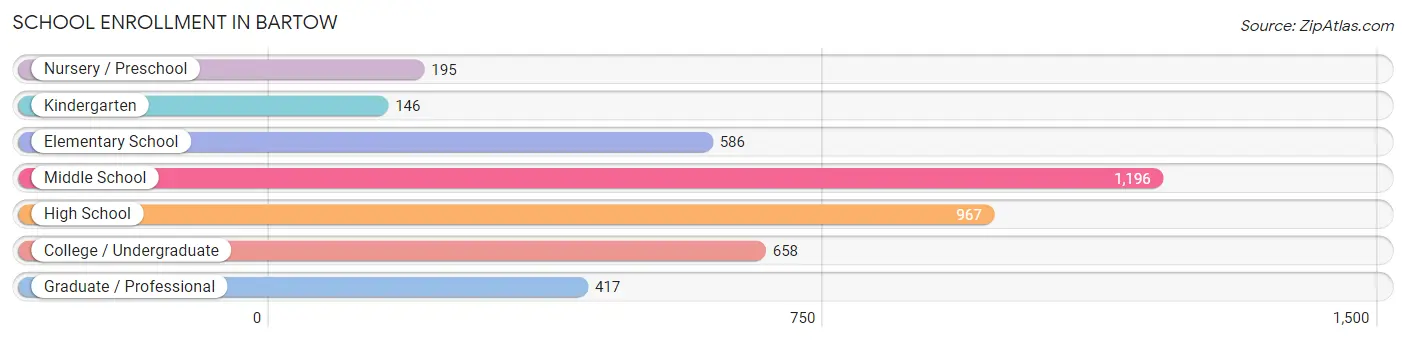
School Enrollment in Bartow
The most common levels of schooling among the 4,165 students in Bartow are middle school (1,196 | 28.7%), high school (967 | 23.2%), and college / undergraduate (658 | 15.8%).
| School Level | # Students | % Students |
| Nursery / Preschool | 195 | 4.7% |
| Kindergarten | 146 | 3.5% |
| Elementary School | 586 | 14.1% |
| Middle School | 1,196 | 28.7% |
| High School | 967 | 23.2% |
| College / Undergraduate | 658 | 15.8% |
| Graduate / Professional | 417 | 10.0% |
| Total | 4,165 | 100.0% |
School Enrollment by Age by Funding Source in Bartow
Out of a total of 4,165 students who are enrolled in schools in Bartow, 466 (11.2%) attend a private institution, while the remaining 3,699 (88.8%) are enrolled in public schools. The age group of 3 to 4 year olds has the highest likelihood of being enrolled in private schools, with 50 (46.3% in the age bracket) enrolled. Conversely, the age group of 20 to 24 year olds has the lowest likelihood of being enrolled in a private school, with 300 (96.5% in the age bracket) attending a public institution.
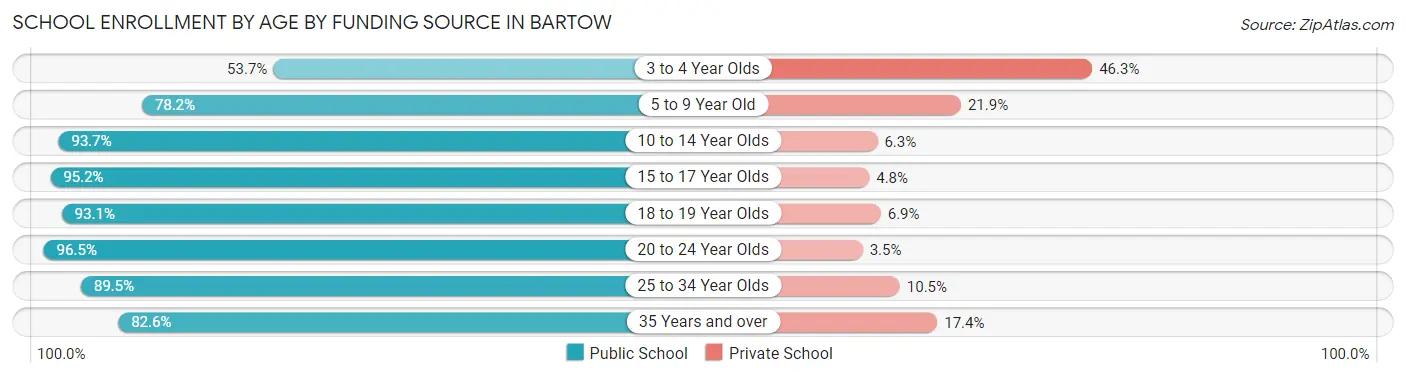
| Age Bracket | Public School | Private School |
| 3 to 4 Year Olds | 58 (53.7%) | 50 (46.3%) |
| 5 to 9 Year Old | 558 (78.1%) | 156 (21.8%) |
| 10 to 14 Year Olds | 1,282 (93.7%) | 86 (6.3%) |
| 15 to 17 Year Olds | 679 (95.2%) | 34 (4.8%) |
| 18 to 19 Year Olds | 202 (93.1%) | 15 (6.9%) |
| 20 to 24 Year Olds | 300 (96.5%) | 11 (3.5%) |
| 25 to 34 Year Olds | 154 (89.5%) | 18 (10.5%) |
| 35 Years and over | 464 (82.6%) | 98 (17.4%) |
| Total | 3,699 (88.8%) | 466 (11.2%) |
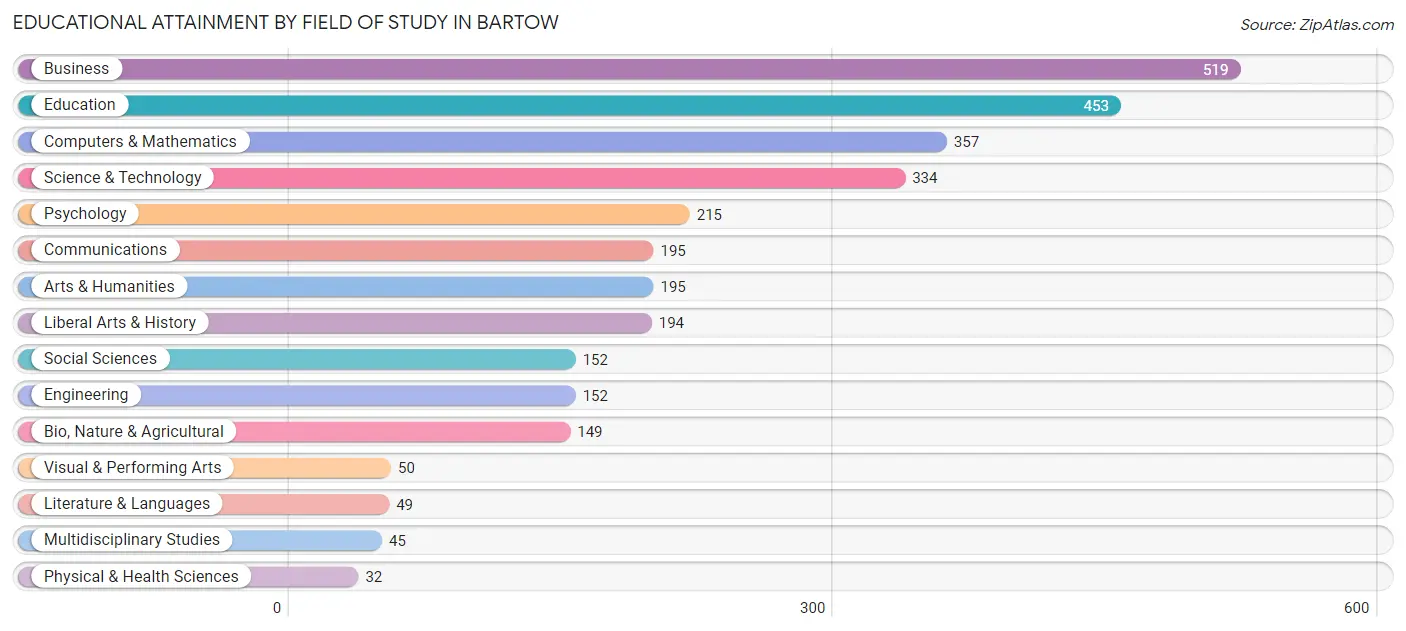
Educational Attainment by Field of Study in Bartow
Business (519 | 16.8%), education (453 | 14.7%), computers & mathematics (357 | 11.6%), science & technology (334 | 10.8%), and psychology (215 | 7.0%) are the most common fields of study among 3,091 individuals in Bartow who have obtained a bachelor's degree or higher.
| Field of Study | # Graduates | % Graduates |
| Computers & Mathematics | 357 | 11.6% |
| Bio, Nature & Agricultural | 149 | 4.8% |
| Physical & Health Sciences | 32 | 1.0% |
| Psychology | 215 | 7.0% |
| Social Sciences | 152 | 4.9% |
| Engineering | 152 | 4.9% |
| Multidisciplinary Studies | 45 | 1.5% |
| Science & Technology | 334 | 10.8% |
| Business | 519 | 16.8% |
| Education | 453 | 14.7% |
| Literature & Languages | 49 | 1.6% |
| Liberal Arts & History | 194 | 6.3% |
| Visual & Performing Arts | 50 | 1.6% |
| Communications | 195 | 6.3% |
| Arts & Humanities | 195 | 6.3% |
| Total | 3,091 | 100.0% |
Transportation & Commute in Bartow
Vehicle Availability by Sex in Bartow
The most prevalent vehicle ownership categories in Bartow are males with 2 vehicles (1,984, accounting for 41.2%) and females with 2 vehicles (1,648, making up 41.4%).
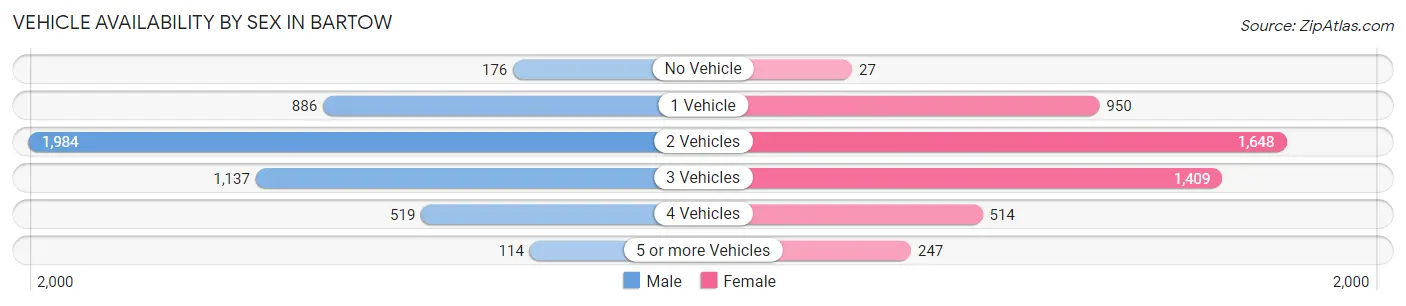
| Vehicles Available | Male | Female |
| No Vehicle | 176 (3.6%) | 27 (0.6%) |
| 1 Vehicle | 886 (18.4%) | 950 (19.8%) |
| 2 Vehicles | 1,984 (41.2%) | 1,648 (34.4%) |
| 3 Vehicles | 1,137 (23.6%) | 1,409 (29.4%) |
| 4 Vehicles | 519 (10.8%) | 514 (10.7%) |
| 5 or more Vehicles | 114 (2.4%) | 247 (5.1%) |
| Total | 4,816 (100.0%) | 4,795 (100.0%) |
Commute Time in Bartow
The most frequently occuring commute durations in Bartow are 20 to 24 minutes (1,518 commuters, 16.8%), 10 to 14 minutes (1,260 commuters, 14.0%), and 15 to 19 minutes (1,182 commuters, 13.1%).
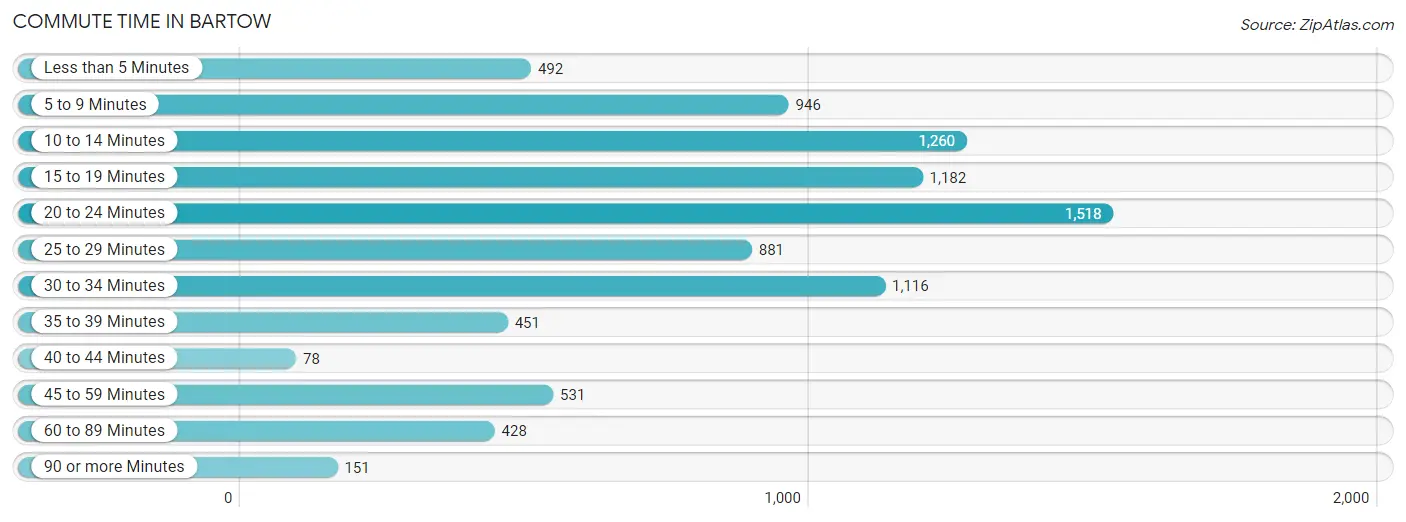
| Commute Time | # Commuters | % Commuters |
| Less than 5 Minutes | 492 | 5.4% |
| 5 to 9 Minutes | 946 | 10.5% |
| 10 to 14 Minutes | 1,260 | 14.0% |
| 15 to 19 Minutes | 1,182 | 13.1% |
| 20 to 24 Minutes | 1,518 | 16.8% |
| 25 to 29 Minutes | 881 | 9.8% |
| 30 to 34 Minutes | 1,116 | 12.3% |
| 35 to 39 Minutes | 451 | 5.0% |
| 40 to 44 Minutes | 78 | 0.9% |
| 45 to 59 Minutes | 531 | 5.9% |
| 60 to 89 Minutes | 428 | 4.7% |
| 90 or more Minutes | 151 | 1.7% |
Commute Time by Sex in Bartow
The most common commute times in Bartow are 15 to 19 minutes (662 commuters, 14.5%) for males and 20 to 24 minutes (916 commuters, 20.5%) for females.
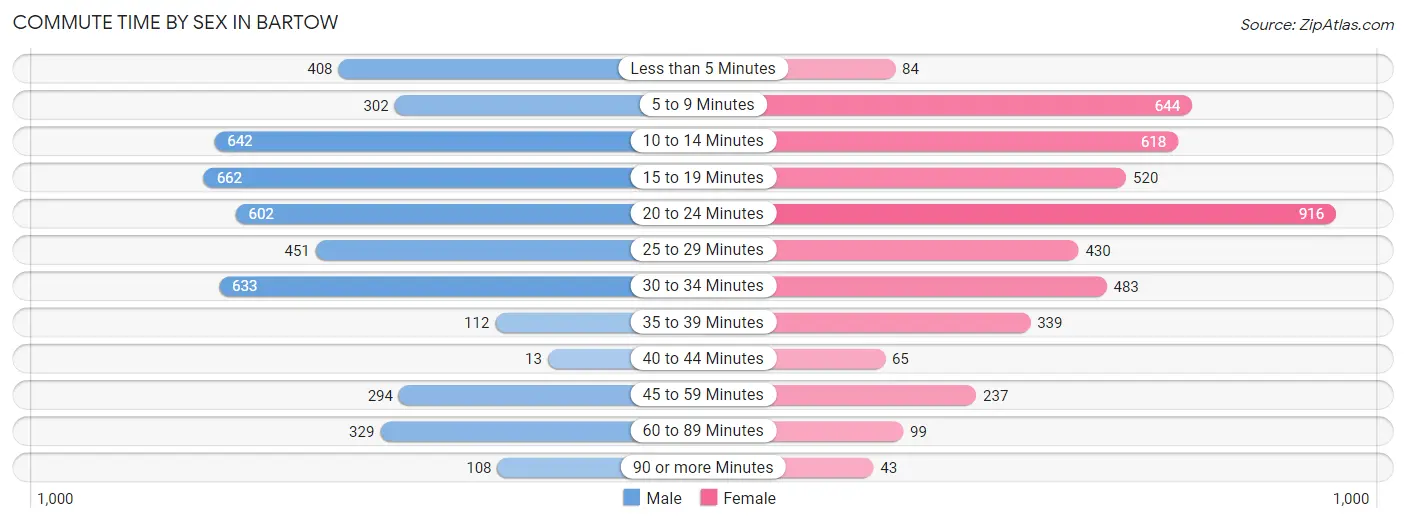
| Commute Time | Male | Female |
| Less than 5 Minutes | 408 (9.0%) | 84 (1.9%) |
| 5 to 9 Minutes | 302 (6.6%) | 644 (14.4%) |
| 10 to 14 Minutes | 642 (14.1%) | 618 (13.8%) |
| 15 to 19 Minutes | 662 (14.5%) | 520 (11.6%) |
| 20 to 24 Minutes | 602 (13.2%) | 916 (20.5%) |
| 25 to 29 Minutes | 451 (9.9%) | 430 (9.6%) |
| 30 to 34 Minutes | 633 (13.9%) | 483 (10.8%) |
| 35 to 39 Minutes | 112 (2.5%) | 339 (7.6%) |
| 40 to 44 Minutes | 13 (0.3%) | 65 (1.5%) |
| 45 to 59 Minutes | 294 (6.5%) | 237 (5.3%) |
| 60 to 89 Minutes | 329 (7.2%) | 99 (2.2%) |
| 90 or more Minutes | 108 (2.4%) | 43 (1.0%) |
Time of Departure to Work by Sex in Bartow
The most frequent times of departure to work in Bartow are 5:30 AM to 5:59 AM (746, 16.4%) for males and 7:00 AM to 7:29 AM (757, 16.9%) for females.
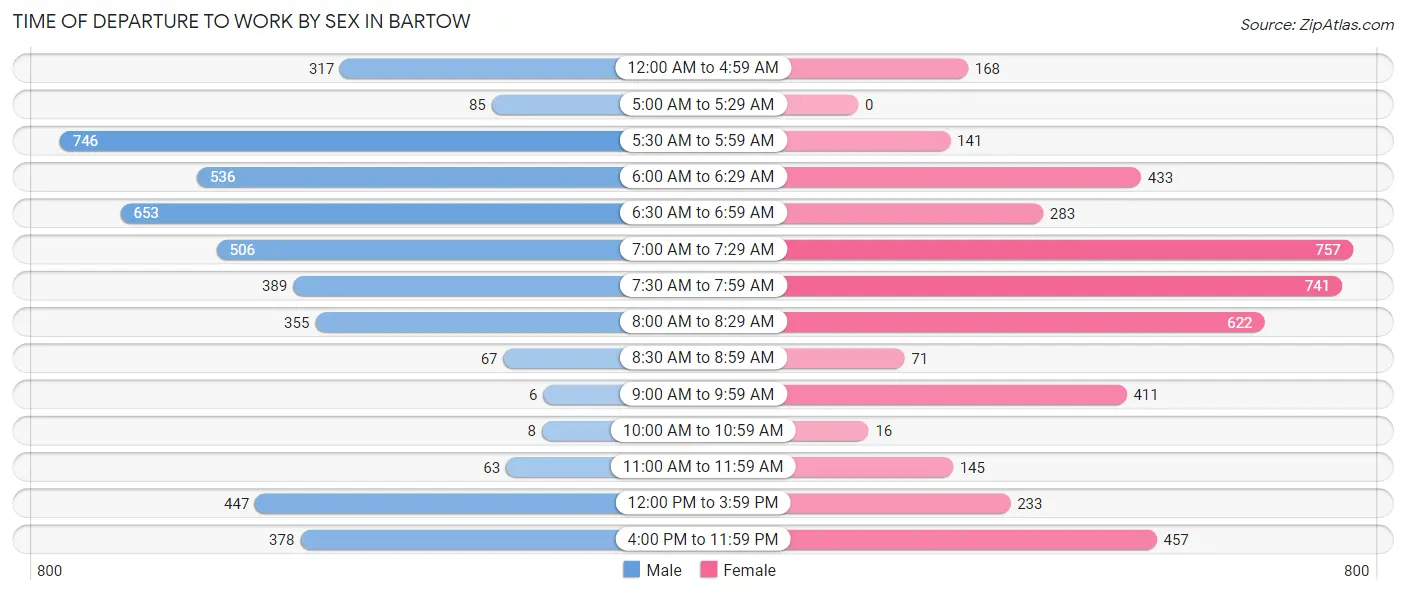
| Time of Departure | Male | Female |
| 12:00 AM to 4:59 AM | 317 (7.0%) | 168 (3.7%) |
| 5:00 AM to 5:29 AM | 85 (1.9%) | 0 (0.0%) |
| 5:30 AM to 5:59 AM | 746 (16.4%) | 141 (3.2%) |
| 6:00 AM to 6:29 AM | 536 (11.8%) | 433 (9.7%) |
| 6:30 AM to 6:59 AM | 653 (14.3%) | 283 (6.3%) |
| 7:00 AM to 7:29 AM | 506 (11.1%) | 757 (16.9%) |
| 7:30 AM to 7:59 AM | 389 (8.5%) | 741 (16.6%) |
| 8:00 AM to 8:29 AM | 355 (7.8%) | 622 (13.9%) |
| 8:30 AM to 8:59 AM | 67 (1.5%) | 71 (1.6%) |
| 9:00 AM to 9:59 AM | 6 (0.1%) | 411 (9.2%) |
| 10:00 AM to 10:59 AM | 8 (0.2%) | 16 (0.4%) |
| 11:00 AM to 11:59 AM | 63 (1.4%) | 145 (3.2%) |
| 12:00 PM to 3:59 PM | 447 (9.8%) | 233 (5.2%) |
| 4:00 PM to 11:59 PM | 378 (8.3%) | 457 (10.2%) |
| Total | 4,556 (100.0%) | 4,478 (100.0%) |
Housing Occupancy in Bartow
Occupancy by Ownership in Bartow
Of the total 6,921 dwellings in Bartow, owner-occupied units account for 4,349 (62.8%), while renter-occupied units make up 2,572 (37.2%).
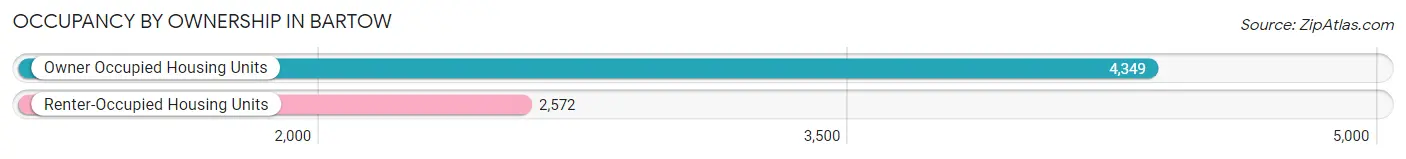
| Occupancy | # Housing Units | % Housing Units |
| Owner Occupied Housing Units | 4,349 | 62.8% |
| Renter-Occupied Housing Units | 2,572 | 37.2% |
| Total Occupied Housing Units | 6,921 | 100.0% |
Occupancy by Household Size in Bartow
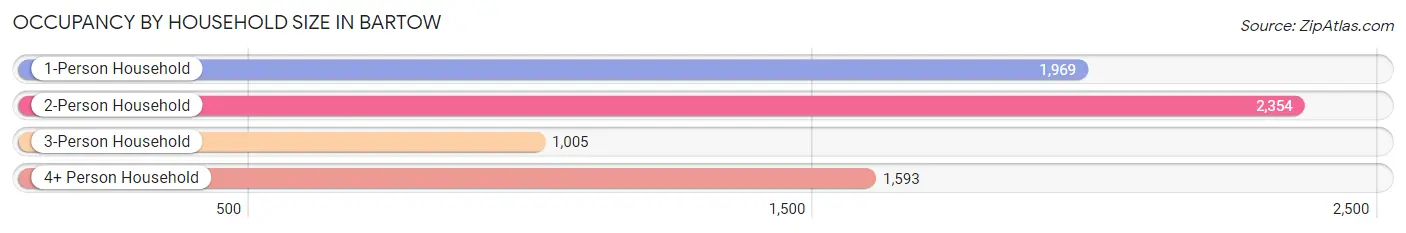
| Household Size | # Housing Units | % Housing Units |
| 1-Person Household | 1,969 | 28.4% |
| 2-Person Household | 2,354 | 34.0% |
| 3-Person Household | 1,005 | 14.5% |
| 4+ Person Household | 1,593 | 23.0% |
| Total Housing Units | 6,921 | 100.0% |
Occupancy by Ownership by Household Size in Bartow
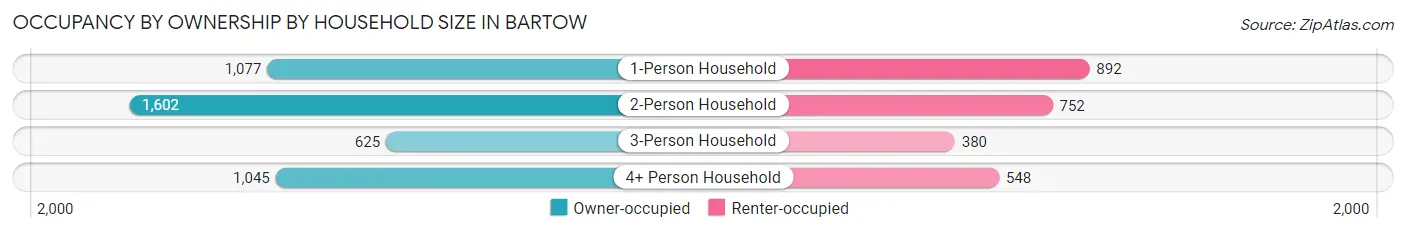
| Household Size | Owner-occupied | Renter-occupied |
| 1-Person Household | 1,077 (54.7%) | 892 (45.3%) |
| 2-Person Household | 1,602 (68.0%) | 752 (32.0%) |
| 3-Person Household | 625 (62.2%) | 380 (37.8%) |
| 4+ Person Household | 1,045 (65.6%) | 548 (34.4%) |
| Total Housing Units | 4,349 (62.8%) | 2,572 (37.2%) |
Occupancy by Educational Attainment in Bartow
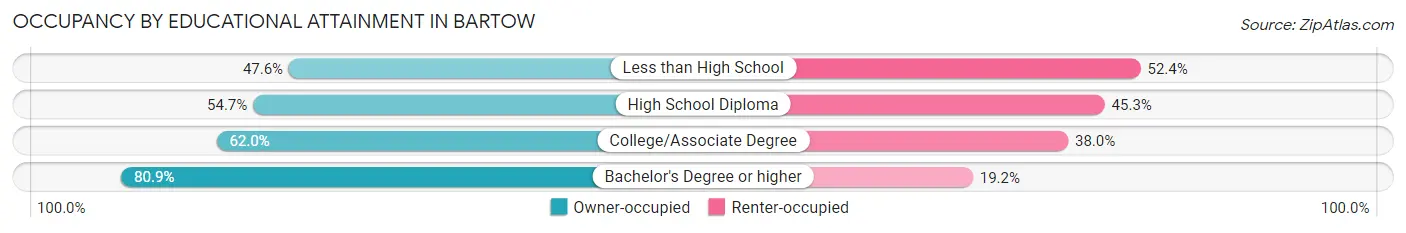
| Household Size | Owner-occupied | Renter-occupied |
| Less than High School | 217 (47.6%) | 239 (52.4%) |
| High School Diploma | 1,227 (54.7%) | 1,016 (45.3%) |
| College/Associate Degree | 1,668 (62.0%) | 1,024 (38.0%) |
| Bachelor's Degree or higher | 1,237 (80.8%) | 293 (19.2%) |
Occupancy by Age of Householder in Bartow
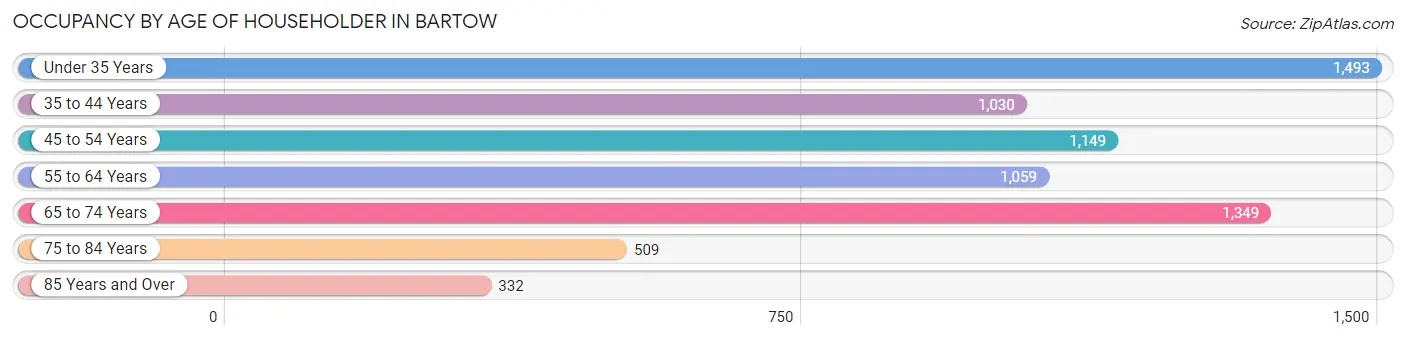
| Age Bracket | # Households | % Households |
| Under 35 Years | 1,493 | 21.6% |
| 35 to 44 Years | 1,030 | 14.9% |
| 45 to 54 Years | 1,149 | 16.6% |
| 55 to 64 Years | 1,059 | 15.3% |
| 65 to 74 Years | 1,349 | 19.5% |
| 75 to 84 Years | 509 | 7.3% |
| 85 Years and Over | 332 | 4.8% |
| Total | 6,921 | 100.0% |
Housing Finances in Bartow
Median Income by Occupancy in Bartow
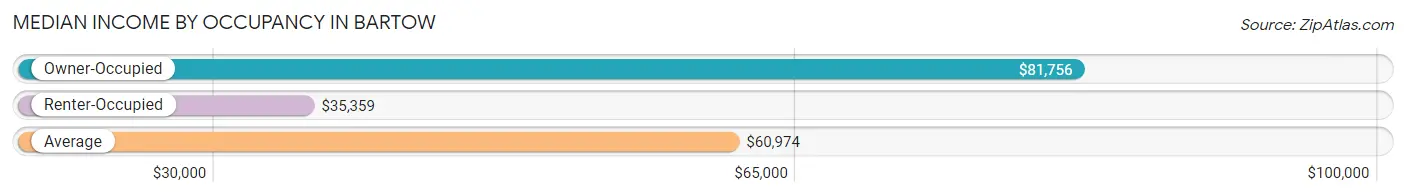
| Occupancy Type | # Households | Median Income |
| Owner-Occupied | 4,349 (62.8%) | $81,756 |
| Renter-Occupied | 2,572 (37.2%) | $35,359 |
| Average | 6,921 (100.0%) | $60,974 |
Occupancy by Householder Income Bracket in Bartow
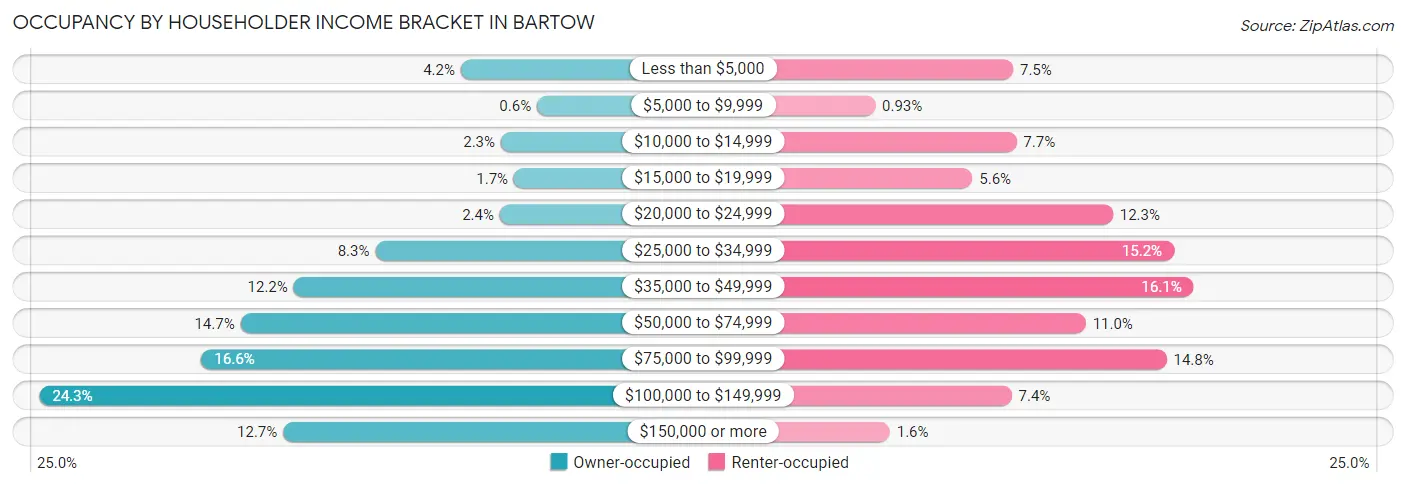
| Income Bracket | Owner-occupied | Renter-occupied |
| Less than $5,000 | 184 (4.2%) | 193 (7.5%) |
| $5,000 to $9,999 | 26 (0.6%) | 24 (0.9%) |
| $10,000 to $14,999 | 101 (2.3%) | 197 (7.7%) |
| $15,000 to $19,999 | 74 (1.7%) | 143 (5.6%) |
| $20,000 to $24,999 | 103 (2.4%) | 315 (12.2%) |
| $25,000 to $34,999 | 361 (8.3%) | 390 (15.2%) |
| $35,000 to $49,999 | 530 (12.2%) | 414 (16.1%) |
| $50,000 to $74,999 | 640 (14.7%) | 282 (11.0%) |
| $75,000 to $99,999 | 721 (16.6%) | 381 (14.8%) |
| $100,000 to $149,999 | 1,057 (24.3%) | 191 (7.4%) |
| $150,000 or more | 552 (12.7%) | 42 (1.6%) |
| Total | 4,349 (100.0%) | 2,572 (100.0%) |
Monthly Housing Cost Tiers in Bartow
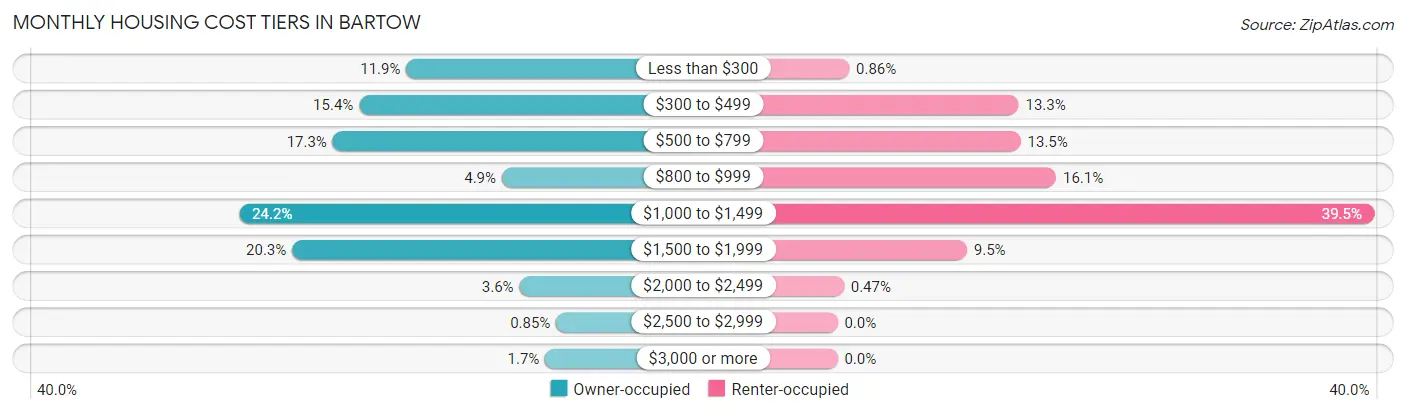
| Monthly Cost | Owner-occupied | Renter-occupied |
| Less than $300 | 517 (11.9%) | 22 (0.9%) |
| $300 to $499 | 668 (15.4%) | 343 (13.3%) |
| $500 to $799 | 753 (17.3%) | 347 (13.5%) |
| $800 to $999 | 211 (4.9%) | 414 (16.1%) |
| $1,000 to $1,499 | 1,053 (24.2%) | 1,016 (39.5%) |
| $1,500 to $1,999 | 883 (20.3%) | 245 (9.5%) |
| $2,000 to $2,499 | 155 (3.6%) | 12 (0.5%) |
| $2,500 to $2,999 | 37 (0.9%) | 0 (0.0%) |
| $3,000 or more | 72 (1.7%) | 0 (0.0%) |
| Total | 4,349 (100.0%) | 2,572 (100.0%) |
Physical Housing Characteristics in Bartow
Housing Structures in Bartow
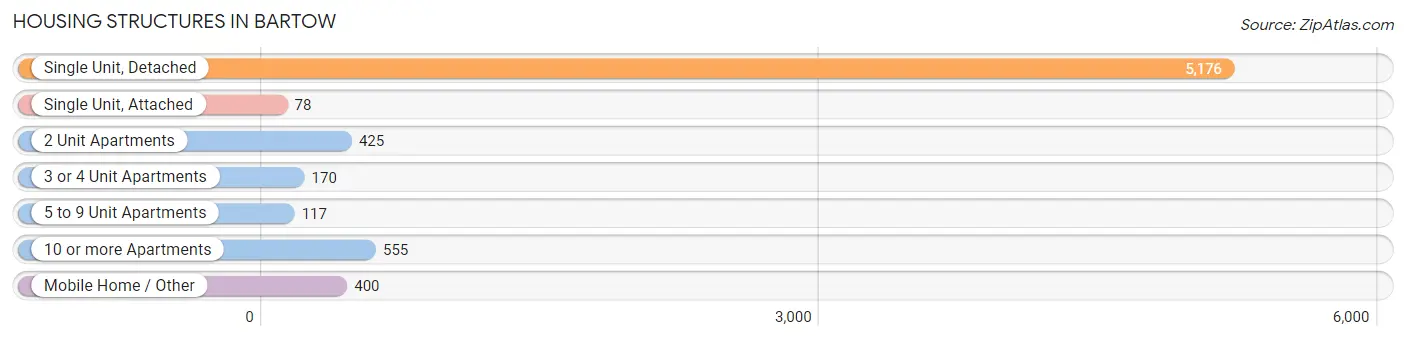
| Structure Type | # Housing Units | % Housing Units |
| Single Unit, Detached | 5,176 | 74.8% |
| Single Unit, Attached | 78 | 1.1% |
| 2 Unit Apartments | 425 | 6.1% |
| 3 or 4 Unit Apartments | 170 | 2.5% |
| 5 to 9 Unit Apartments | 117 | 1.7% |
| 10 or more Apartments | 555 | 8.0% |
| Mobile Home / Other | 400 | 5.8% |
| Total | 6,921 | 100.0% |
Housing Structures by Occupancy in Bartow
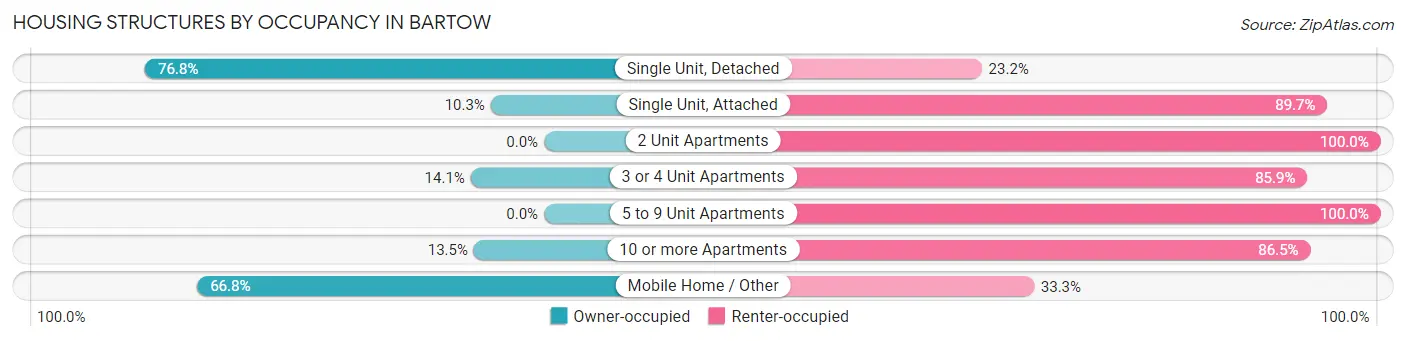
| Structure Type | Owner-occupied | Renter-occupied |
| Single Unit, Detached | 3,975 (76.8%) | 1,201 (23.2%) |
| Single Unit, Attached | 8 (10.3%) | 70 (89.7%) |
| 2 Unit Apartments | 0 (0.0%) | 425 (100.0%) |
| 3 or 4 Unit Apartments | 24 (14.1%) | 146 (85.9%) |
| 5 to 9 Unit Apartments | 0 (0.0%) | 117 (100.0%) |
| 10 or more Apartments | 75 (13.5%) | 480 (86.5%) |
| Mobile Home / Other | 267 (66.7%) | 133 (33.3%) |
| Total | 4,349 (62.8%) | 2,572 (37.2%) |
Housing Structures by Number of Rooms in Bartow
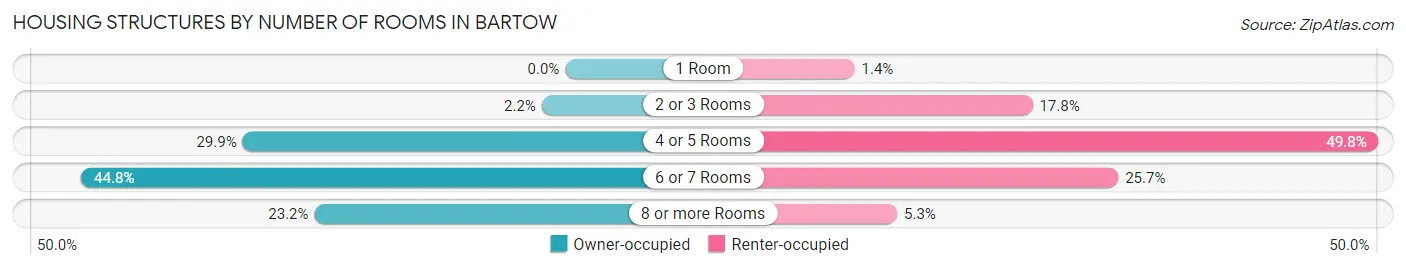
| Number of Rooms | Owner-occupied | Renter-occupied |
| 1 Room | 0 (0.0%) | 35 (1.4%) |
| 2 or 3 Rooms | 95 (2.2%) | 458 (17.8%) |
| 4 or 5 Rooms | 1,298 (29.8%) | 1,281 (49.8%) |
| 6 or 7 Rooms | 1,947 (44.8%) | 662 (25.7%) |
| 8 or more Rooms | 1,009 (23.2%) | 136 (5.3%) |
| Total | 4,349 (100.0%) | 2,572 (100.0%) |
Housing Structure by Heating Type in Bartow
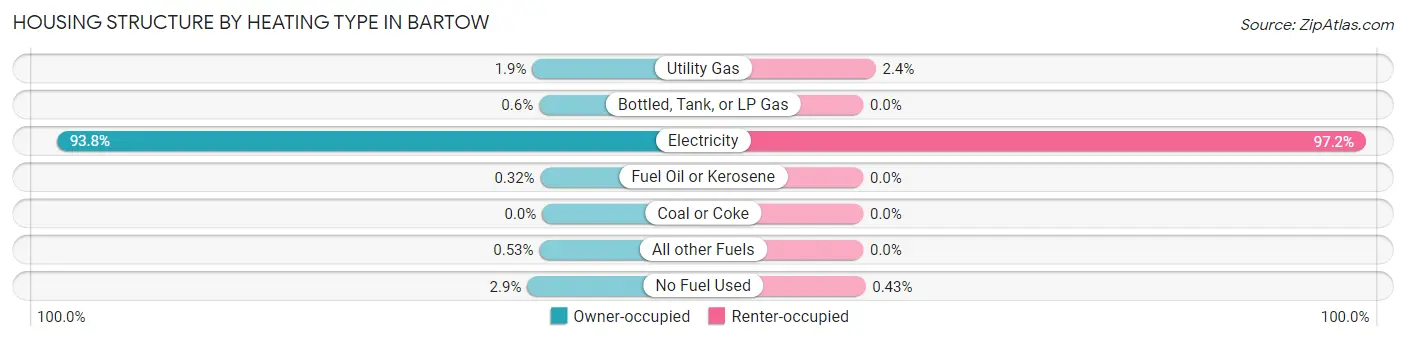
| Heating Type | Owner-occupied | Renter-occupied |
| Utility Gas | 82 (1.9%) | 62 (2.4%) |
| Bottled, Tank, or LP Gas | 26 (0.6%) | 0 (0.0%) |
| Electricity | 4,079 (93.8%) | 2,499 (97.2%) |
| Fuel Oil or Kerosene | 14 (0.3%) | 0 (0.0%) |
| Coal or Coke | 0 (0.0%) | 0 (0.0%) |
| All other Fuels | 23 (0.5%) | 0 (0.0%) |
| No Fuel Used | 125 (2.9%) | 11 (0.4%) |
| Total | 4,349 (100.0%) | 2,572 (100.0%) |
Household Vehicle Usage in Bartow
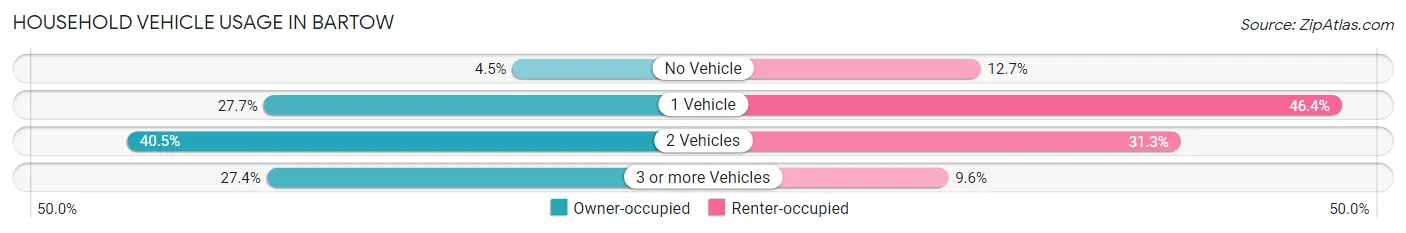
| Vehicles per Household | Owner-occupied | Renter-occupied |
| No Vehicle | 194 (4.5%) | 326 (12.7%) |
| 1 Vehicle | 1,204 (27.7%) | 1,192 (46.4%) |
| 2 Vehicles | 1,759 (40.5%) | 806 (31.3%) |
| 3 or more Vehicles | 1,192 (27.4%) | 248 (9.6%) |
| Total | 4,349 (100.0%) | 2,572 (100.0%) |
Real Estate & Mortgages in Bartow
Real Estate and Mortgage Overview in Bartow
| Characteristic | Without Mortgage | With Mortgage |
| Housing Units | 1,866 | 2,483 |
| Median Property Value | $165,900 | $213,000 |
| Median Household Income | $59,659 | $369 |
| Monthly Housing Costs | $414 | $72 |
| Real Estate Taxes | $741 | $74 |
Property Value by Mortgage Status in Bartow
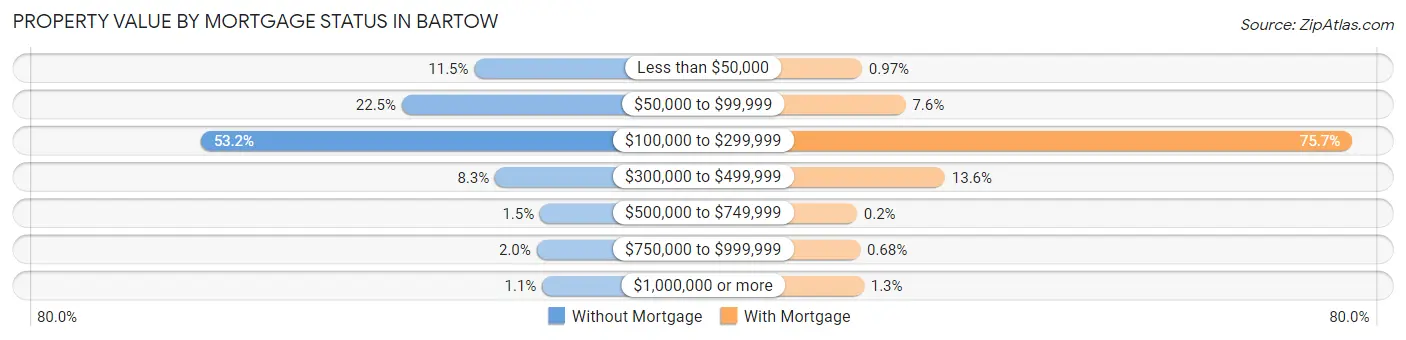
| Property Value | Without Mortgage | With Mortgage |
| Less than $50,000 | 214 (11.5%) | 24 (1.0%) |
| $50,000 to $99,999 | 420 (22.5%) | 189 (7.6%) |
| $100,000 to $299,999 | 992 (53.2%) | 1,879 (75.7%) |
| $300,000 to $499,999 | 155 (8.3%) | 338 (13.6%) |
| $500,000 to $749,999 | 27 (1.5%) | 5 (0.2%) |
| $750,000 to $999,999 | 37 (2.0%) | 17 (0.7%) |
| $1,000,000 or more | 21 (1.1%) | 31 (1.3%) |
| Total | 1,866 (100.0%) | 2,483 (100.0%) |
Household Income by Mortgage Status in Bartow
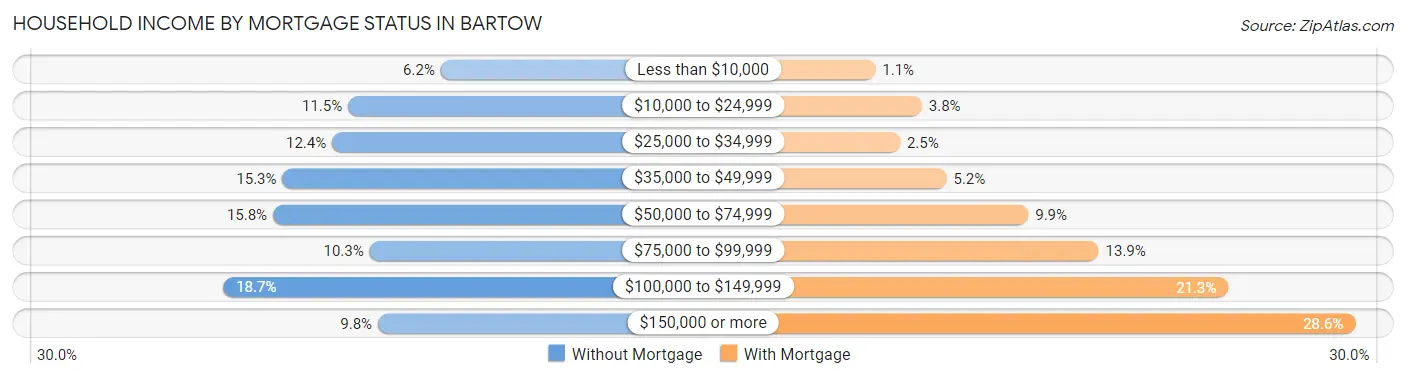
| Household Income | Without Mortgage | With Mortgage |
| Less than $10,000 | 116 (6.2%) | 28 (1.1%) |
| $10,000 to $24,999 | 215 (11.5%) | 94 (3.8%) |
| $25,000 to $34,999 | 232 (12.4%) | 63 (2.5%) |
| $35,000 to $49,999 | 285 (15.3%) | 129 (5.2%) |
| $50,000 to $74,999 | 295 (15.8%) | 245 (9.9%) |
| $75,000 to $99,999 | 192 (10.3%) | 345 (13.9%) |
| $100,000 to $149,999 | 348 (18.6%) | 529 (21.3%) |
| $150,000 or more | 183 (9.8%) | 709 (28.5%) |
| Total | 1,866 (100.0%) | 2,483 (100.0%) |
Property Value to Household Income Ratio in Bartow
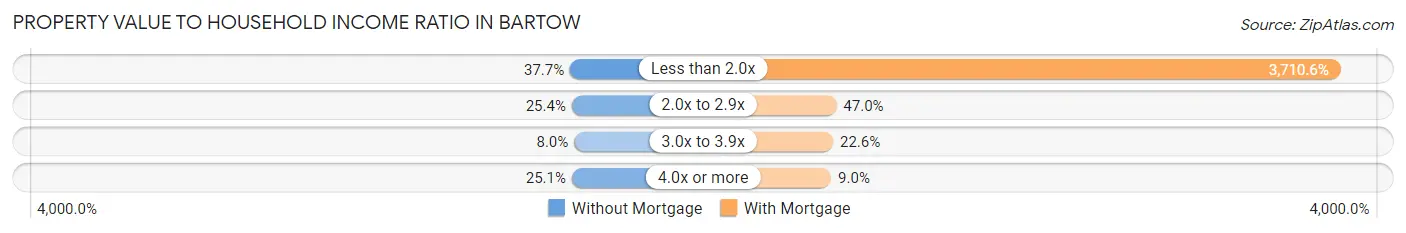
| Value-to-Income Ratio | Without Mortgage | With Mortgage |
| Less than 2.0x | 704 (37.7%) | 92,134 (3,710.6%) |
| 2.0x to 2.9x | 474 (25.4%) | 1,167 (47.0%) |
| 3.0x to 3.9x | 150 (8.0%) | 560 (22.6%) |
| 4.0x or more | 468 (25.1%) | 224 (9.0%) |
| Total | 1,866 (100.0%) | 2,483 (100.0%) |
Real Estate Taxes by Mortgage Status in Bartow
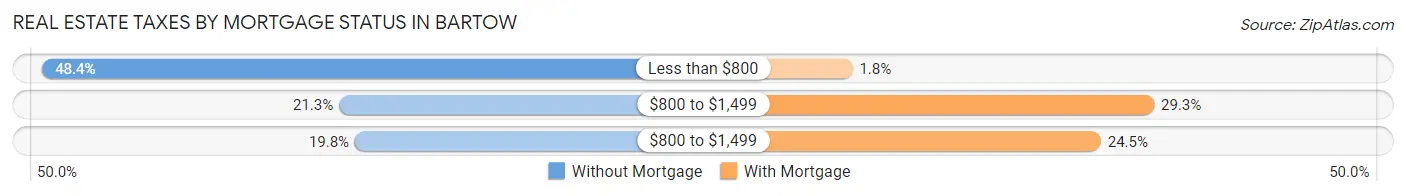
| Property Taxes | Without Mortgage | With Mortgage |
| Less than $800 | 903 (48.4%) | 44 (1.8%) |
| $800 to $1,499 | 397 (21.3%) | 728 (29.3%) |
| $800 to $1,499 | 370 (19.8%) | 607 (24.4%) |
| Total | 1,866 (100.0%) | 2,483 (100.0%) |
Health & Disability in Bartow
Health Insurance Coverage by Age in Bartow
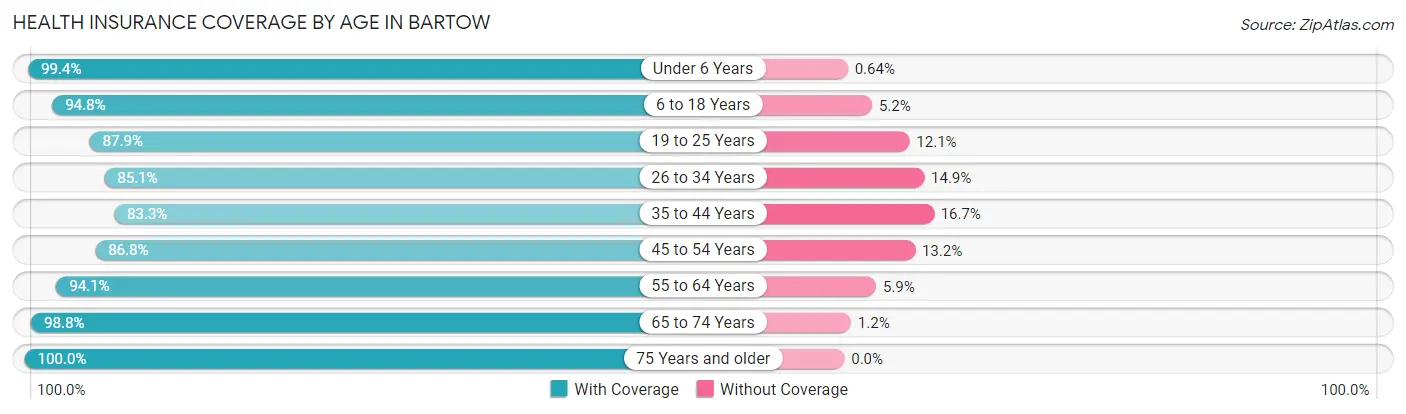
| Age Bracket | With Coverage | Without Coverage |
| Under 6 Years | 1,387 (99.4%) | 9 (0.6%) |
| 6 to 18 Years | 2,794 (94.8%) | 152 (5.2%) |
| 19 to 25 Years | 1,729 (87.9%) | 239 (12.1%) |
| 26 to 34 Years | 2,357 (85.1%) | 412 (14.9%) |
| 35 to 44 Years | 1,640 (83.3%) | 328 (16.7%) |
| 45 to 54 Years | 2,015 (86.8%) | 306 (13.2%) |
| 55 to 64 Years | 2,050 (94.1%) | 129 (5.9%) |
| 65 to 74 Years | 1,850 (98.8%) | 23 (1.2%) |
| 75 Years and older | 1,173 (100.0%) | 0 (0.0%) |
| Total | 16,995 (91.4%) | 1,598 (8.6%) |
Health Insurance Coverage by Citizenship Status in Bartow
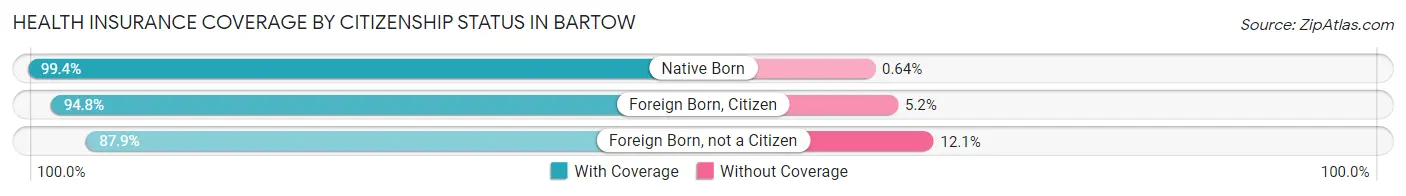
| Citizenship Status | With Coverage | Without Coverage |
| Native Born | 1,387 (99.4%) | 9 (0.6%) |
| Foreign Born, Citizen | 2,794 (94.8%) | 152 (5.2%) |
| Foreign Born, not a Citizen | 1,729 (87.9%) | 239 (12.1%) |
Health Insurance Coverage by Household Income in Bartow
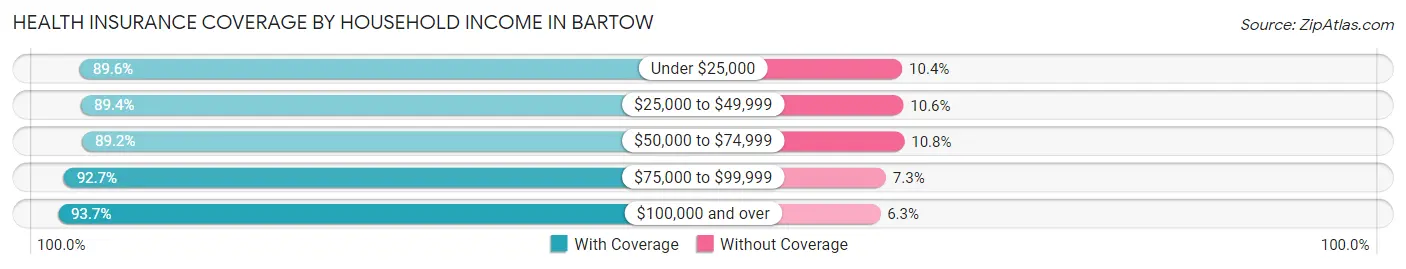
| Household Income | With Coverage | Without Coverage |
| Under $25,000 | 1,902 (89.6%) | 220 (10.4%) |
| $25,000 to $49,999 | 3,686 (89.4%) | 437 (10.6%) |
| $50,000 to $74,999 | 2,243 (89.2%) | 271 (10.8%) |
| $75,000 to $99,999 | 3,137 (92.7%) | 248 (7.3%) |
| $100,000 and over | 5,977 (93.7%) | 399 (6.3%) |
Public vs Private Health Insurance Coverage by Age in Bartow
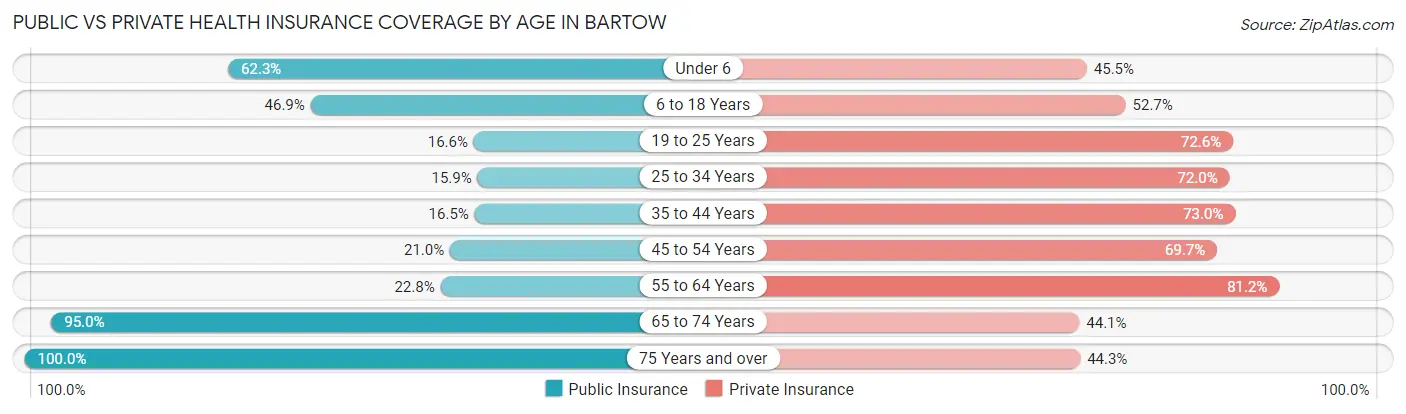
| Age Bracket | Public Insurance | Private Insurance |
| Under 6 | 869 (62.3%) | 635 (45.5%) |
| 6 to 18 Years | 1,382 (46.9%) | 1,552 (52.7%) |
| 19 to 25 Years | 327 (16.6%) | 1,429 (72.6%) |
| 25 to 34 Years | 441 (15.9%) | 1,993 (72.0%) |
| 35 to 44 Years | 324 (16.5%) | 1,437 (73.0%) |
| 45 to 54 Years | 488 (21.0%) | 1,617 (69.7%) |
| 55 to 64 Years | 497 (22.8%) | 1,769 (81.2%) |
| 65 to 74 Years | 1,780 (95.0%) | 826 (44.1%) |
| 75 Years and over | 1,173 (100.0%) | 519 (44.3%) |
| Total | 7,281 (39.2%) | 11,777 (63.3%) |
Disability Status by Sex by Age in Bartow
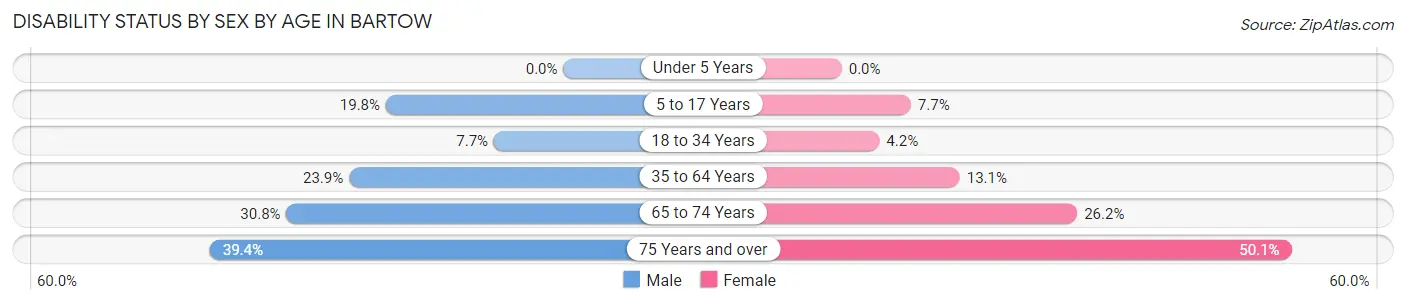
| Age Bracket | Male | Female |
| Under 5 Years | 0 (0.0%) | 0 (0.0%) |
| 5 to 17 Years | 322 (19.8%) | 93 (7.7%) |
| 18 to 34 Years | 188 (7.7%) | 110 (4.2%) |
| 35 to 64 Years | 757 (23.9%) | 433 (13.1%) |
| 65 to 74 Years | 280 (30.8%) | 253 (26.2%) |
| 75 Years and over | 163 (39.4%) | 380 (50.1%) |
Disability Class by Sex by Age in Bartow
Disability Class: Hearing Difficulty
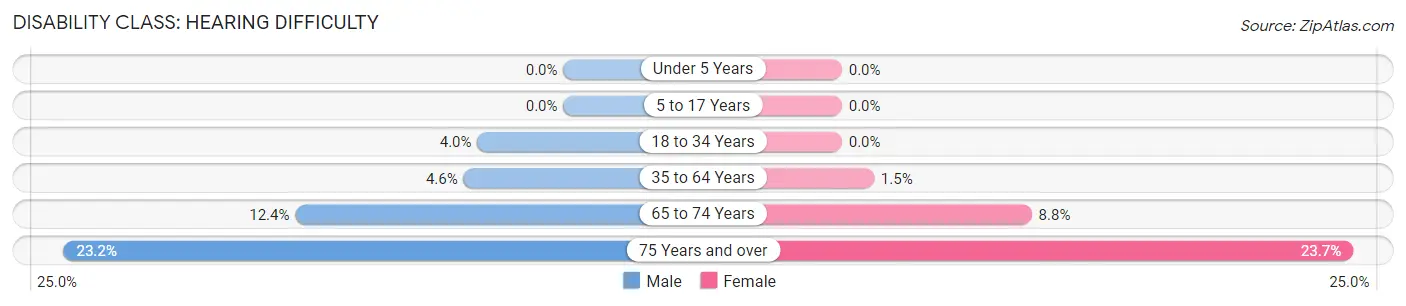
| Age Bracket | Male | Female |
| Under 5 Years | 0 (0.0%) | 0 (0.0%) |
| 5 to 17 Years | 0 (0.0%) | 0 (0.0%) |
| 18 to 34 Years | 97 (4.0%) | 0 (0.0%) |
| 35 to 64 Years | 147 (4.6%) | 49 (1.5%) |
| 65 to 74 Years | 113 (12.4%) | 85 (8.8%) |
| 75 Years and over | 96 (23.2%) | 180 (23.7%) |
Disability Class: Vision Difficulty
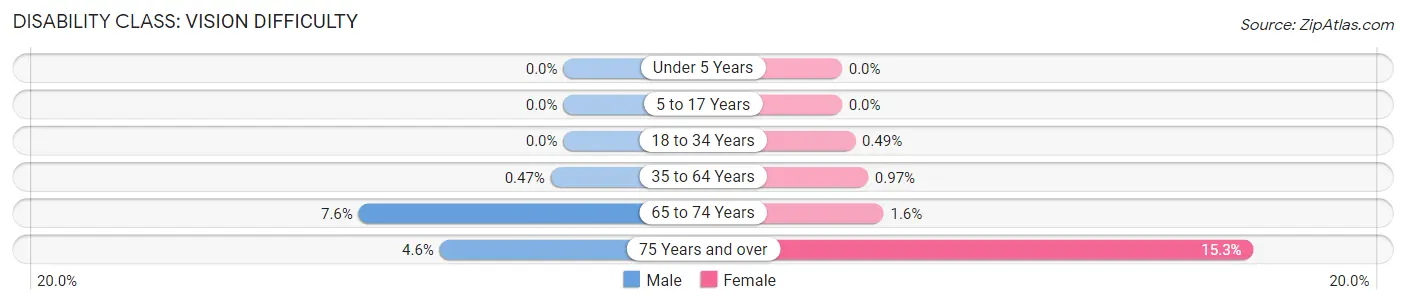
| Age Bracket | Male | Female |
| Under 5 Years | 0 (0.0%) | 0 (0.0%) |
| 5 to 17 Years | 0 (0.0%) | 0 (0.0%) |
| 18 to 34 Years | 0 (0.0%) | 13 (0.5%) |
| 35 to 64 Years | 15 (0.5%) | 32 (1.0%) |
| 65 to 74 Years | 69 (7.6%) | 15 (1.5%) |
| 75 Years and over | 19 (4.6%) | 116 (15.3%) |
Disability Class: Cognitive Difficulty
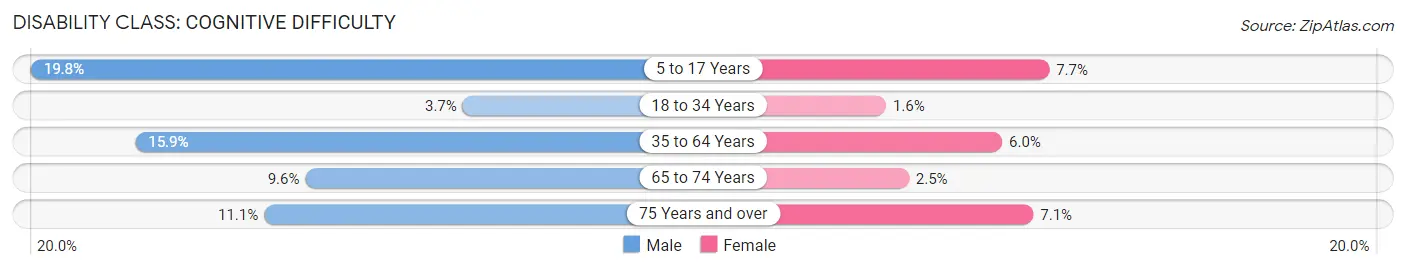
| Age Bracket | Male | Female |
| 5 to 17 Years | 322 (19.8%) | 93 (7.7%) |
| 18 to 34 Years | 91 (3.7%) | 43 (1.6%) |
| 35 to 64 Years | 504 (15.9%) | 196 (5.9%) |
| 65 to 74 Years | 87 (9.6%) | 24 (2.5%) |
| 75 Years and over | 46 (11.1%) | 54 (7.1%) |
Disability Class: Ambulatory Difficulty
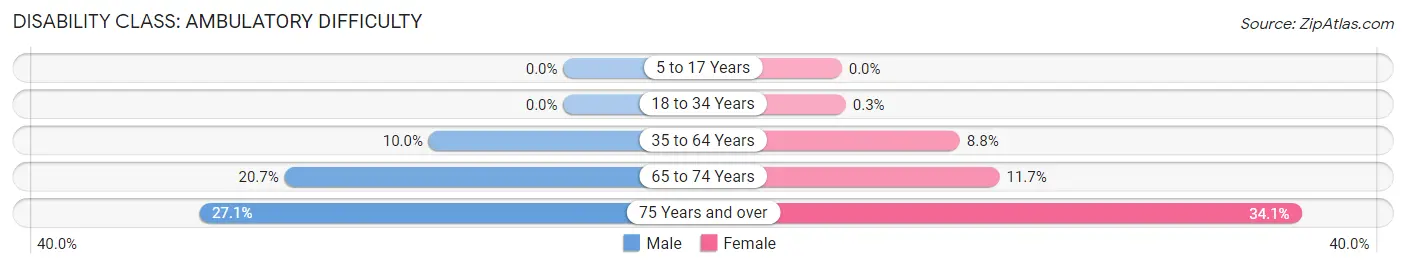
| Age Bracket | Male | Female |
| 5 to 17 Years | 0 (0.0%) | 0 (0.0%) |
| 18 to 34 Years | 0 (0.0%) | 8 (0.3%) |
| 35 to 64 Years | 317 (10.0%) | 289 (8.8%) |
| 65 to 74 Years | 188 (20.7%) | 113 (11.7%) |
| 75 Years and over | 112 (27.1%) | 259 (34.1%) |
Disability Class: Self-Care Difficulty
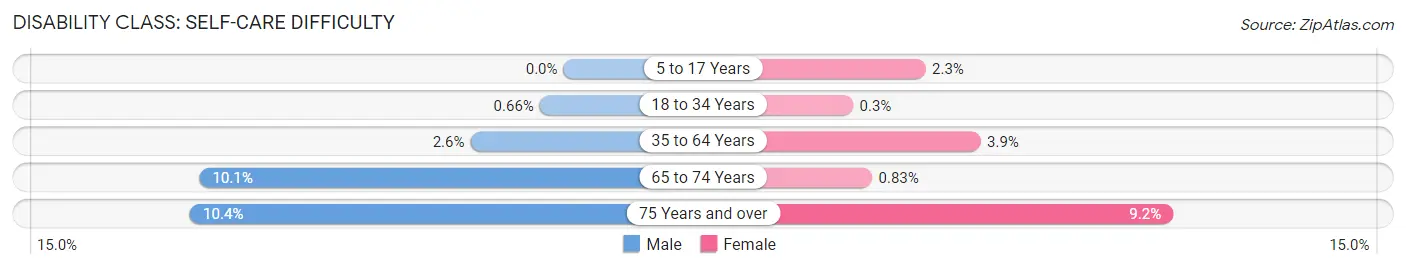
| Age Bracket | Male | Female |
| 5 to 17 Years | 0 (0.0%) | 28 (2.3%) |
| 18 to 34 Years | 16 (0.7%) | 8 (0.3%) |
| 35 to 64 Years | 82 (2.6%) | 127 (3.8%) |
| 65 to 74 Years | 92 (10.1%) | 8 (0.8%) |
| 75 Years and over | 43 (10.4%) | 70 (9.2%) |
Technology Access in Bartow
Computing Device Access in Bartow
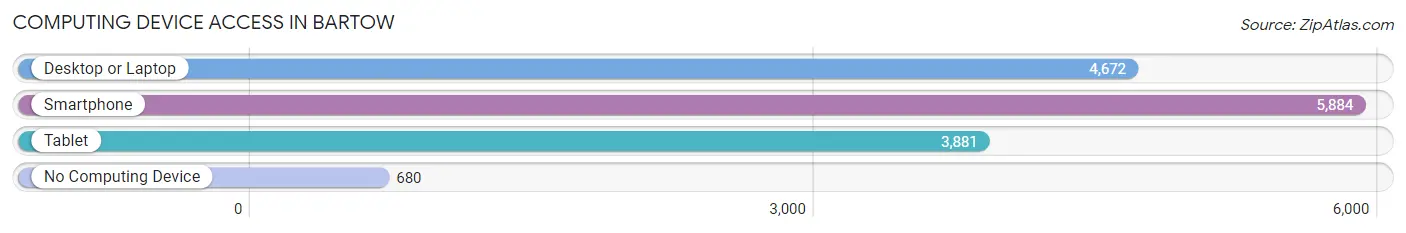
| Device Type | # Households | % Households |
| Desktop or Laptop | 4,672 | 67.5% |
| Smartphone | 5,884 | 85.0% |
| Tablet | 3,881 | 56.1% |
| No Computing Device | 680 | 9.8% |
| Total | 6,921 | 100.0% |
Internet Access in Bartow
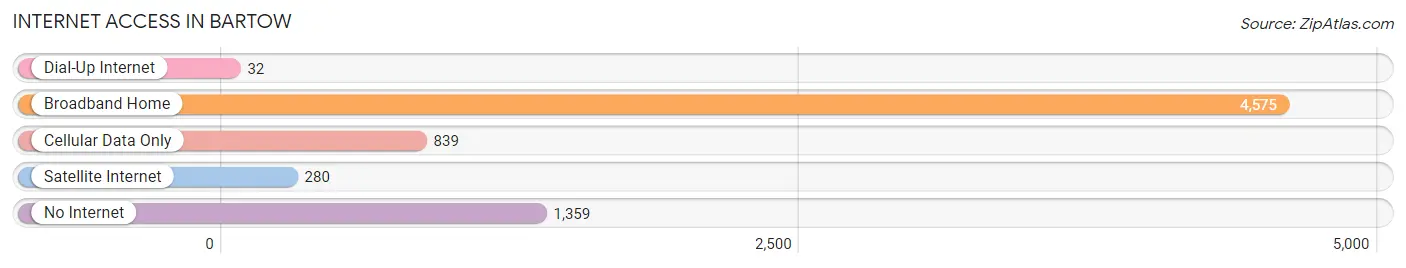
| Internet Type | # Households | % Households |
| Dial-Up Internet | 32 | 0.5% |
| Broadband Home | 4,575 | 66.1% |
| Cellular Data Only | 839 | 12.1% |
| Satellite Internet | 280 | 4.1% |
| No Internet | 1,359 | 19.6% |
| Total | 6,921 | 100.0% |
Bartow Summary
Bartow, Florida is a city located in Polk County, Florida. It is the county seat of Polk County and is located approximately 50 miles east of Tampa. The city has a population of approximately 17,000 people and is part of the Lakeland-Winter Haven Metropolitan Statistical Area.
History
Bartow was founded in 1851 by Redding Blount, a former Confederate soldier. The city was named after Francis S. Bartow, a Confederate general who was killed in the Battle of Manassas. The city was incorporated in 1882 and was the first county seat of Polk County.
In the late 19th century, Bartow was a major center for the phosphate industry. The city was home to several phosphate processing plants and was the site of the first phosphate processing plant in the United States. The phosphate industry was a major contributor to the city’s economy until the late 20th century.
Geography
Bartow is located in central Florida, approximately 50 miles east of Tampa. The city is situated on the Peace River and is surrounded by several lakes, including Lake Hancock, Lake Pierce, and Lake Arbuckle. The city has a total area of 8.3 square miles, of which 8.2 square miles is land and 0.1 square miles is water.
Economy
Bartow’s economy is largely based on agriculture and manufacturing. The city is home to several large agricultural operations, including citrus groves, cattle ranches, and vegetable farms. The city is also home to several manufacturing companies, including a paper mill, a plastics plant, and a metal fabrication plant.
The city is also home to several retail stores, restaurants, and other businesses. The city is home to several large employers, including the Polk County School Board, the Polk County Sheriff’s Office, and the Polk County Health Department.
Demographics
As of the 2010 census, Bartow had a population of 17,298 people. The racial makeup of the city was 68.3% White, 24.2% African American, 0.5% Native American, 1.2% Asian, 0.1% Pacific Islander, 3.2% from other races, and 2.7% from two or more races. Hispanic or Latino of any race were 8.3% of the population.
The median income for a household in the city was $37,845, and the median income for a family was $45,945. The per capita income for the city was $19,945. About 17.2% of families and 20.3% of the population were below the poverty line, including 28.2% of those under age 18 and 11.2% of those age 65 or over.
Bartow is a diverse city with a rich history and a vibrant economy. The city is home to several large employers and is a major center for agriculture and manufacturing. The city has a population of approximately 17,000 people and is part of the Lakeland-Winter Haven Metropolitan Statistical Area.
Common Questions
What is Per Capita Income in Bartow?
Per Capita income in Bartow is $29,728.
What is the Median Family Income in Bartow?
Median Family Income in Bartow is $83,918.
What is the Median Household income in Bartow?
Median Household Income in Bartow is $60,974.
What is Income or Wage Gap in Bartow?
Income or Wage Gap in Bartow is 18.9%.
Women in Bartow earn 81.1 cents for every dollar earned by a man.
What is Inequality or Gini Index in Bartow?
Inequality or Gini Index in Bartow is 0.45.
What is the Total Population of Bartow?
Total Population of Bartow is 19,424.
What is the Total Male Population of Bartow?
Total Male Population of Bartow is 9,821.
What is the Total Female Population of Bartow?
Total Female Population of Bartow is 9,603.
What is the Ratio of Males per 100 Females in Bartow?
There are 102.27 Males per 100 Females in Bartow.
What is the Ratio of Females per 100 Males in Bartow?
There are 97.78 Females per 100 Males in Bartow.
What is the Median Population Age in Bartow?
Median Population Age in Bartow is 36.5 Years.
What is the Average Family Size in Bartow
Average Family Size in Bartow is 3.3 People.
What is the Average Household Size in Bartow
Average Household Size in Bartow is 2.7 People.
How Large is the Labor Force in Bartow?
There are 10,185 People in the Labor Forcein in Bartow.
What is the Percentage of People in the Labor Force in Bartow?
64.3% of People are in the Labor Force in Bartow.
What is the Unemployment Rate in Bartow?
Unemployment Rate in Bartow is 4.0%.