Arcadia, FL Map & Demographics
Arcadia Map
Arcadia Overview
$18,504
PER CAPITA INCOME
$38,039
AVG FAMILY INCOME
$34,598
AVG HOUSEHOLD INCOME
26.6%
WAGE / INCOME GAP [ % ]
73.4¢/ $1
WAGE / INCOME GAP [ $ ]
$14,482
FAMILY INCOME DEFICIT
0.45
INEQUALITY / GINI INDEX
7,480
TOTAL POPULATION
3,576
MALE POPULATION
3,904
FEMALE POPULATION
91.60
MALES / 100 FEMALES
109.17
FEMALES / 100 MALES
34.1
MEDIAN AGE
3.1
AVG FAMILY SIZE
2.4
AVG HOUSEHOLD SIZE
3,421
LABOR FORCE [ PEOPLE ]
58.4%
PERCENT IN LABOR FORCE
8.3%
UNEMPLOYMENT RATE
Arcadia Area Codes
Income in Arcadia
Income Overview in Arcadia
Per Capita Income in Arcadia is $18,504, while median incomes of families and households are $38,039 and $34,598 respectively.
| Characteristic | Number | Measure |
| Per Capita Income | 7,480 | $18,504 |
| Median Family Income | 1,562 | $38,039 |
| Mean Family Income | 1,562 | $47,150 |
| Median Household Income | 3,015 | $34,598 |
| Mean Household Income | 3,015 | $41,134 |
| Income Deficit | 1,562 | $14,482 |
| Wage / Income Gap (%) | 7,480 | 26.62% |
| Wage / Income Gap ($) | 7,480 | 73.38¢ per $1 |
| Gini / Inequality Index | 7,480 | 0.45 |
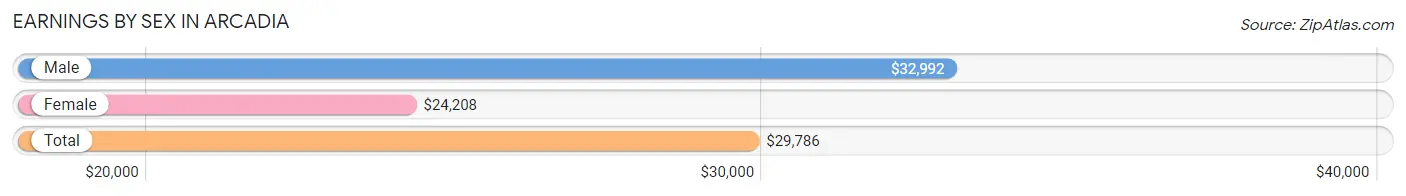
Earnings by Sex in Arcadia
Average Earnings in Arcadia are $29,786, $32,992 for men and $24,208 for women, a difference of 26.6%.
| Sex | Number | Average Earnings |
| Male | 1,902 (55.0%) | $32,992 |
| Female | 1,553 (45.0%) | $24,208 |
| Total | 3,455 (100.0%) | $29,786 |
Earnings by Sex by Income Bracket in Arcadia
The most common earnings brackets in Arcadia are $30,000 to $34,999 for men (365 | 19.2%) and $25,000 to $29,999 for women (189 | 12.2%).

| Income | Male | Female |
| $2,499 or less | 127 (6.7%) | 98 (6.3%) |
| $2,500 to $4,999 | 0 (0.0%) | 69 (4.4%) |
| $5,000 to $7,499 | 156 (8.2%) | 37 (2.4%) |
| $7,500 to $9,999 | 32 (1.7%) | 20 (1.3%) |
| $10,000 to $12,499 | 15 (0.8%) | 58 (3.7%) |
| $12,500 to $14,999 | 25 (1.3%) | 164 (10.6%) |
| $15,000 to $17,499 | 145 (7.6%) | 112 (7.2%) |
| $17,500 to $19,999 | 59 (3.1%) | 114 (7.3%) |
| $20,000 to $22,499 | 6 (0.3%) | 28 (1.8%) |
| $22,500 to $24,999 | 28 (1.5%) | 112 (7.2%) |
| $25,000 to $29,999 | 148 (7.8%) | 189 (12.2%) |
| $30,000 to $34,999 | 365 (19.2%) | 121 (7.8%) |
| $35,000 to $39,999 | 175 (9.2%) | 119 (7.7%) |
| $40,000 to $44,999 | 211 (11.1%) | 44 (2.8%) |
| $45,000 to $49,999 | 201 (10.6%) | 144 (9.3%) |
| $50,000 to $54,999 | 37 (1.9%) | 21 (1.3%) |
| $55,000 to $64,999 | 68 (3.6%) | 27 (1.7%) |
| $65,000 to $74,999 | 30 (1.6%) | 20 (1.3%) |
| $75,000 to $99,999 | 58 (3.0%) | 38 (2.5%) |
| $100,000+ | 16 (0.8%) | 18 (1.2%) |
| Total | 1,902 (100.0%) | 1,553 (100.0%) |
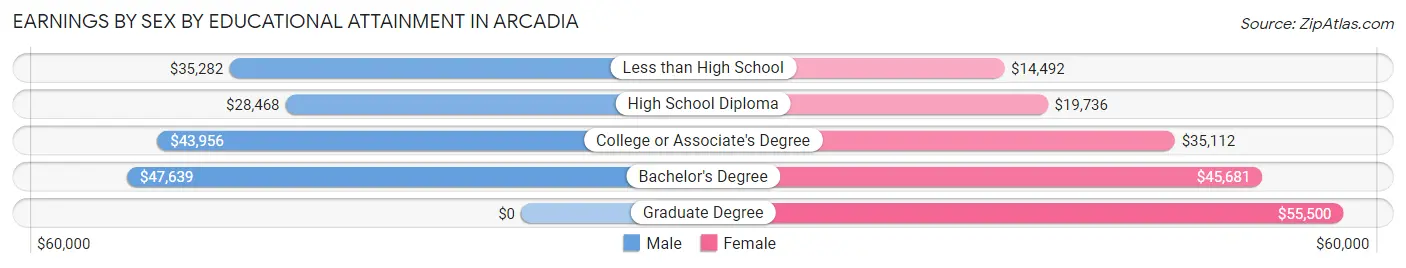
Earnings by Sex by Educational Attainment in Arcadia
Average earnings in Arcadia are $34,301 for men and $27,746 for women, a difference of 19.1%. Men with an educational attainment of bachelor's degree enjoy the highest average annual earnings of $47,639, while those with high school diploma education earn the least with $28,468. Women with an educational attainment of graduate degree earn the most with the average annual earnings of $55,500, while those with less than high school education have the smallest earnings of $14,492.
| Educational Attainment | Male Income | Female Income |
| Less than High School | $35,282 | $14,492 |
| High School Diploma | $28,468 | $19,736 |
| College or Associate's Degree | $43,956 | $35,112 |
| Bachelor's Degree | $47,639 | $45,681 |
| Graduate Degree | - | - |
| Total | $34,301 | $27,746 |
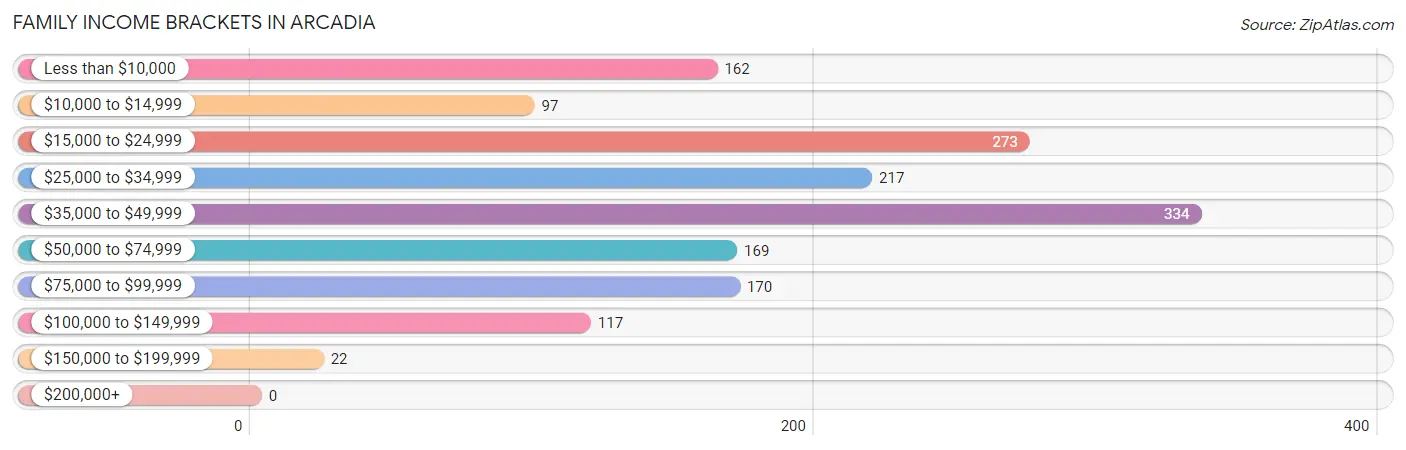
Family Income in Arcadia
Family Income Brackets in Arcadia
According to the Arcadia family income data, there are 334 families falling into the $35,000 to $49,999 income range, which is the most common income bracket and makes up 21.4% of all families.
| Income Bracket | # Families | % Families |
| Less than $10,000 | 162 | 10.4% |
| $10,000 to $14,999 | 97 | 6.2% |
| $15,000 to $24,999 | 273 | 17.5% |
| $25,000 to $34,999 | 217 | 13.9% |
| $35,000 to $49,999 | 334 | 21.4% |
| $50,000 to $74,999 | 169 | 10.8% |
| $75,000 to $99,999 | 170 | 10.9% |
| $100,000 to $149,999 | 117 | 7.5% |
| $150,000 to $199,999 | 22 | 1.4% |
| $200,000+ | 0 | 0.0% |
Family Income by Famaliy Size in Arcadia
4-person families (286 | 18.3%) account for the highest median family income in Arcadia with $43,167 per family, while 2-person families (733 | 46.9%) have the highest median income of $16,088 per family member.
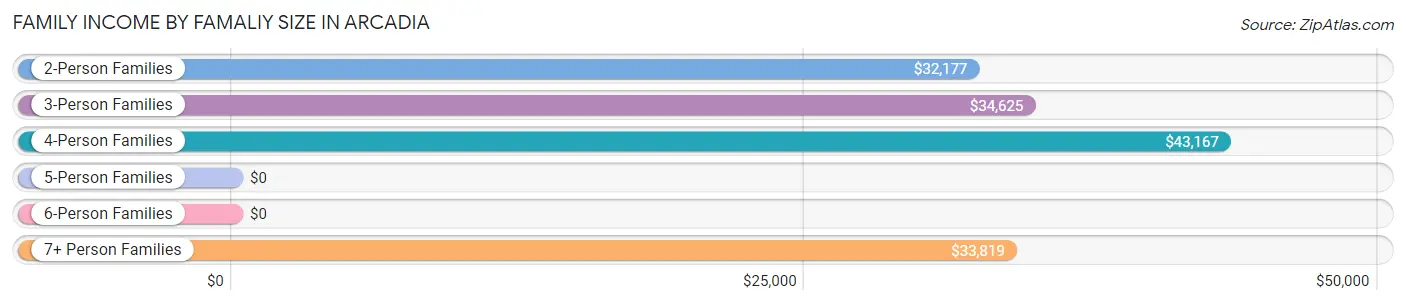
| Income Bracket | # Families | Median Income |
| 2-Person Families | 733 (46.9%) | $32,177 |
| 3-Person Families | 307 (19.7%) | $34,625 |
| 4-Person Families | 286 (18.3%) | $43,167 |
| 5-Person Families | 21 (1.3%) | $0 |
| 6-Person Families | 144 (9.2%) | $0 |
| 7+ Person Families | 71 (4.5%) | $33,819 |
| Total | 1,562 (100.0%) | $38,039 |
Family Income by Number of Earners in Arcadia
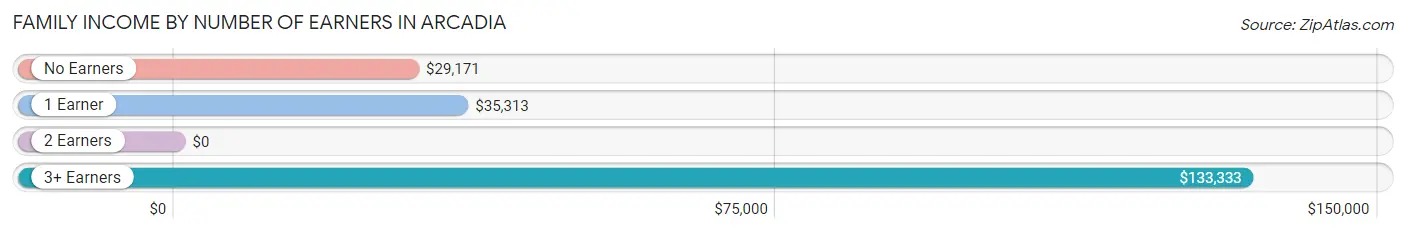
| Number of Earners | # Families | Median Income |
| No Earners | 283 (18.1%) | $29,171 |
| 1 Earner | 799 (51.1%) | $35,313 |
| 2 Earners | 356 (22.8%) | $0 |
| 3+ Earners | 124 (7.9%) | $133,333 |
| Total | 1,562 (100.0%) | $38,039 |
Household Income in Arcadia
Household Income Brackets in Arcadia
With 757 households falling in the category, the $35,000 to $49,999 income range is the most frequent in Arcadia, accounting for 25.1% of all households.
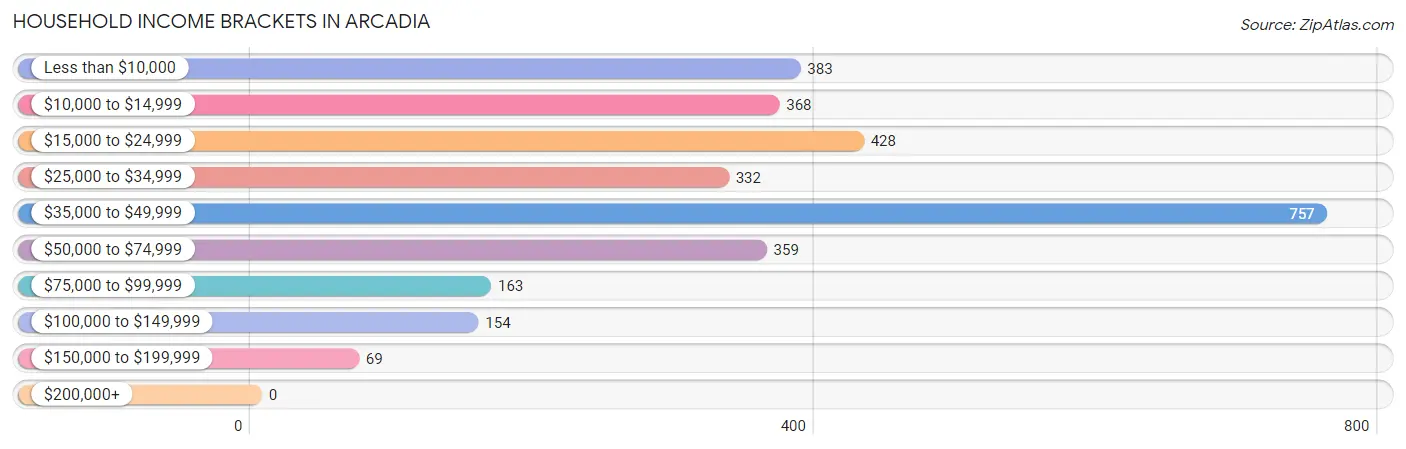
| Income Bracket | # Households | % Households |
| Less than $10,000 | 383 | 12.7% |
| $10,000 to $14,999 | 368 | 12.2% |
| $15,000 to $24,999 | 428 | 14.2% |
| $25,000 to $34,999 | 332 | 11.0% |
| $35,000 to $49,999 | 757 | 25.1% |
| $50,000 to $74,999 | 359 | 11.9% |
| $75,000 to $99,999 | 163 | 5.4% |
| $100,000 to $149,999 | 154 | 5.1% |
| $150,000 to $199,999 | 69 | 2.3% |
| $200,000+ | 0 | 0.0% |
Household Income by Householder Age in Arcadia
The median household income in Arcadia is $34,598, with the highest median household income of $44,803 found in the 25 to 44 years age bracket for the primary householder. A total of 1,010 households (33.5%) fall into this category. Meanwhile, the 15 to 24 years age bracket for the primary householder has the lowest median household income of $16,179, with 266 households (8.8%) in this group.
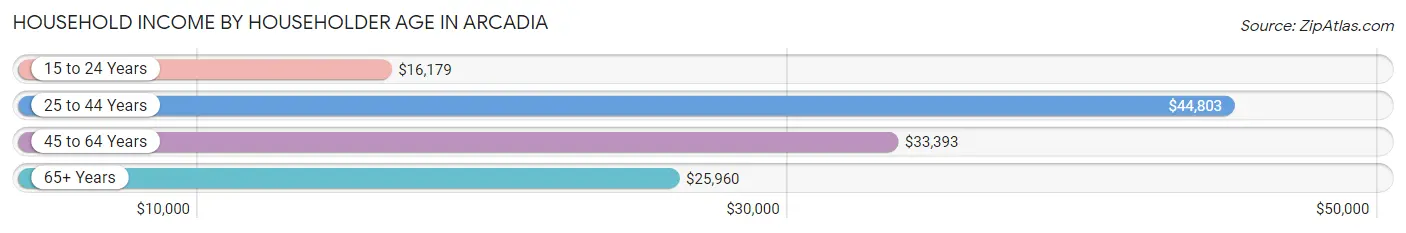
| Income Bracket | # Households | Median Income |
| 15 to 24 Years | 266 (8.8%) | $16,179 |
| 25 to 44 Years | 1,010 (33.5%) | $44,803 |
| 45 to 64 Years | 904 (30.0%) | $33,393 |
| 65+ Years | 835 (27.7%) | $25,960 |
| Total | 3,015 (100.0%) | $34,598 |
Poverty in Arcadia
Income Below Poverty by Sex and Age in Arcadia
With 31.9% poverty level for males and 38.1% for females among the residents of Arcadia, 5 year old males and 15 year old females are the most vulnerable to poverty, with 22 males (100.0%) and 72 females (77.4%) in their respective age groups living below the poverty level.
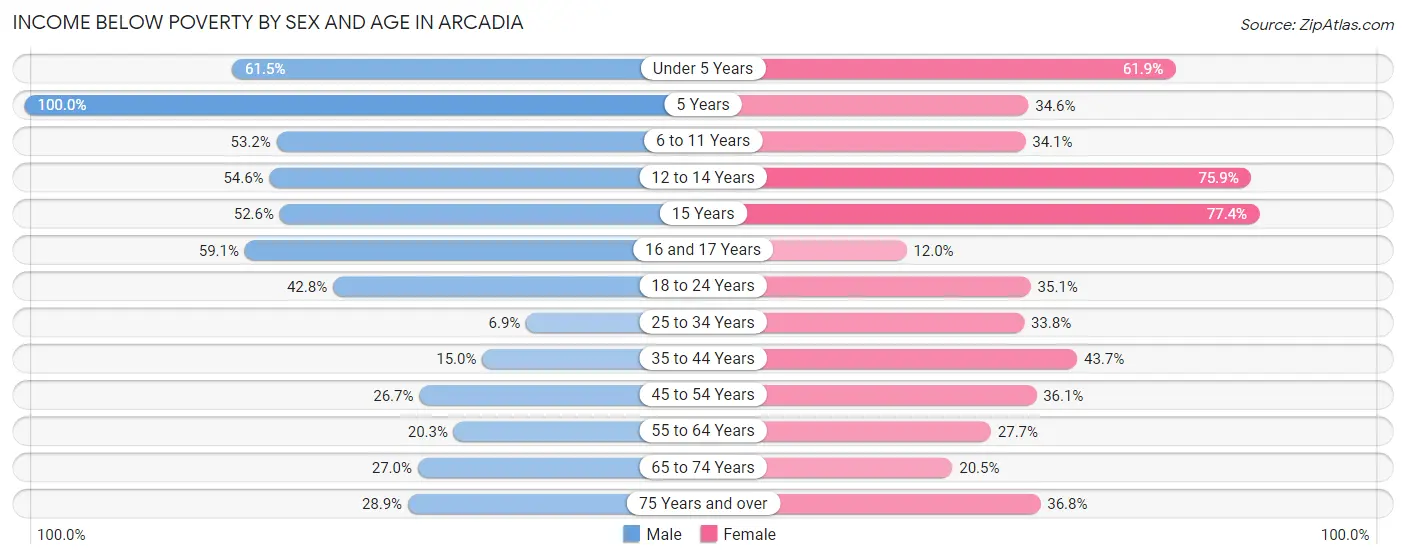
| Age Bracket | Male | Female |
| Under 5 Years | 107 (61.5%) | 201 (61.9%) |
| 5 Years | 22 (100.0%) | 9 (34.6%) |
| 6 to 11 Years | 189 (53.2%) | 94 (34.1%) |
| 12 to 14 Years | 60 (54.5%) | 110 (75.9%) |
| 15 Years | 30 (52.6%) | 72 (77.4%) |
| 16 and 17 Years | 68 (59.1%) | 6 (12.0%) |
| 18 to 24 Years | 180 (42.8%) | 210 (35.1%) |
| 25 to 34 Years | 32 (6.9%) | 162 (33.8%) |
| 35 to 44 Years | 54 (15.0%) | 179 (43.7%) |
| 45 to 54 Years | 138 (26.7%) | 149 (36.1%) |
| 55 to 64 Years | 60 (20.3%) | 114 (27.7%) |
| 65 to 74 Years | 67 (27.0%) | 88 (20.5%) |
| 75 Years and over | 73 (28.8%) | 70 (36.8%) |
| Total | 1,080 (31.9%) | 1,464 (38.1%) |
Income Above Poverty by Sex and Age in Arcadia
According to the poverty statistics in Arcadia, males aged 25 to 34 years and females aged 16 and 17 years are the age groups that are most secure financially, with 93.1% of males and 88.0% of females in these age groups living above the poverty line.
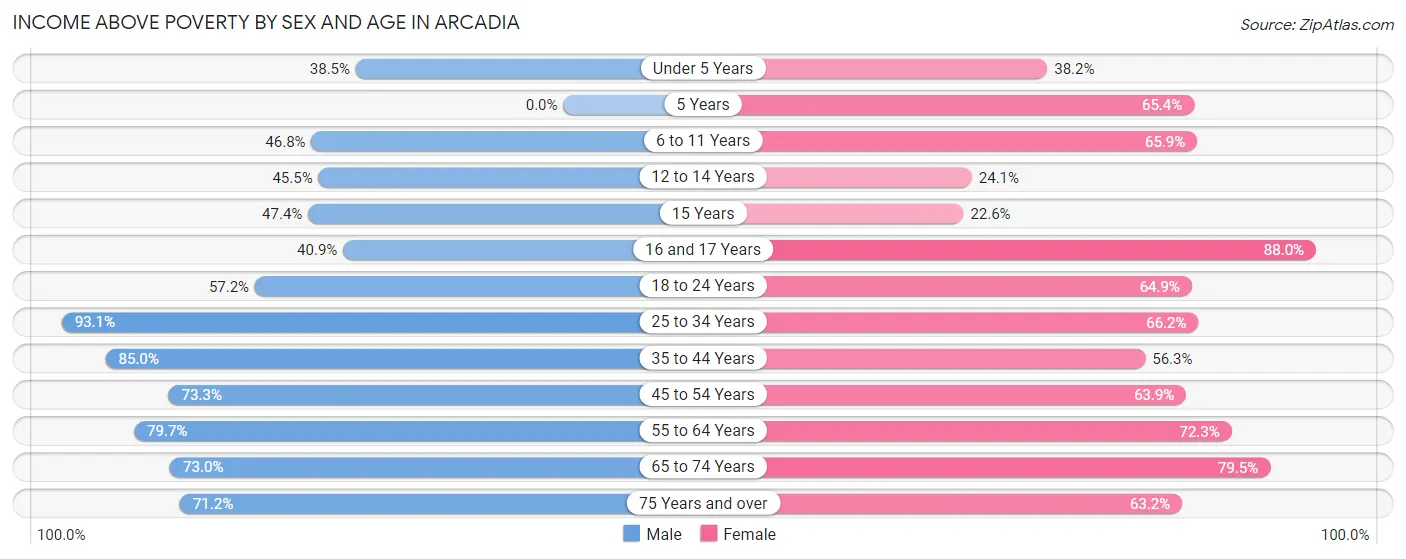
| Age Bracket | Male | Female |
| Under 5 Years | 67 (38.5%) | 124 (38.2%) |
| 5 Years | 0 (0.0%) | 17 (65.4%) |
| 6 to 11 Years | 166 (46.8%) | 182 (65.9%) |
| 12 to 14 Years | 50 (45.5%) | 35 (24.1%) |
| 15 Years | 27 (47.4%) | 21 (22.6%) |
| 16 and 17 Years | 47 (40.9%) | 44 (88.0%) |
| 18 to 24 Years | 241 (57.2%) | 389 (64.9%) |
| 25 to 34 Years | 432 (93.1%) | 317 (66.2%) |
| 35 to 44 Years | 305 (85.0%) | 231 (56.3%) |
| 45 to 54 Years | 378 (73.3%) | 264 (63.9%) |
| 55 to 64 Years | 235 (79.7%) | 298 (72.3%) |
| 65 to 74 Years | 181 (73.0%) | 341 (79.5%) |
| 75 Years and over | 180 (71.2%) | 120 (63.2%) |
| Total | 2,309 (68.1%) | 2,383 (61.9%) |
Income Below Poverty Among Married-Couple Families in Arcadia
The poverty statistics for married-couple families in Arcadia show that 12.7% or 74 of the total 584 families live below the poverty line. Families with 5 or more children have the highest poverty rate of 100.0%, comprising of 45 families. On the other hand, families with 1 or 2 children have the lowest poverty rate of 0.0%, which includes 0 families.
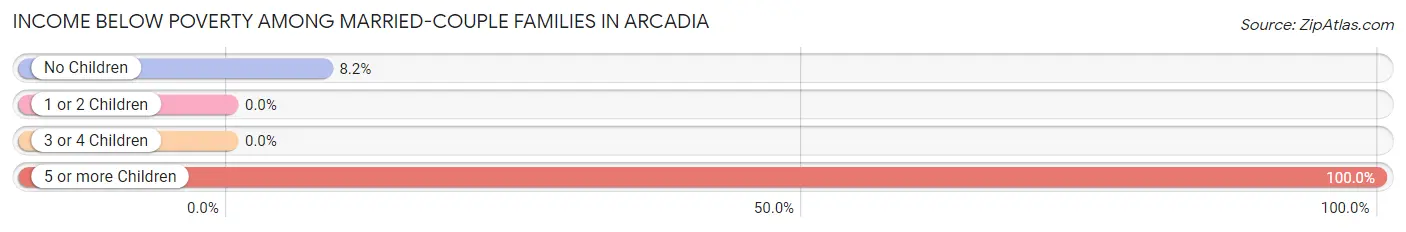
| Children | Above Poverty | Below Poverty |
| No Children | 324 (91.8%) | 29 (8.2%) |
| 1 or 2 Children | 171 (100.0%) | 0 (0.0%) |
| 3 or 4 Children | 15 (100.0%) | 0 (0.0%) |
| 5 or more Children | 0 (0.0%) | 45 (100.0%) |
| Total | 510 (87.3%) | 74 (12.7%) |
Income Below Poverty Among Single-Parent Households in Arcadia
According to the poverty data in Arcadia, 30.5% or 40 single-father households and 40.3% or 341 single-mother households are living below the poverty line. Among single-father households, those with no children have the highest poverty rate, with 25 households (44.6%) experiencing poverty. Likewise, among single-mother households, those with 5 or more children have the highest poverty rate, with 26 households (100.0%) falling below the poverty line.
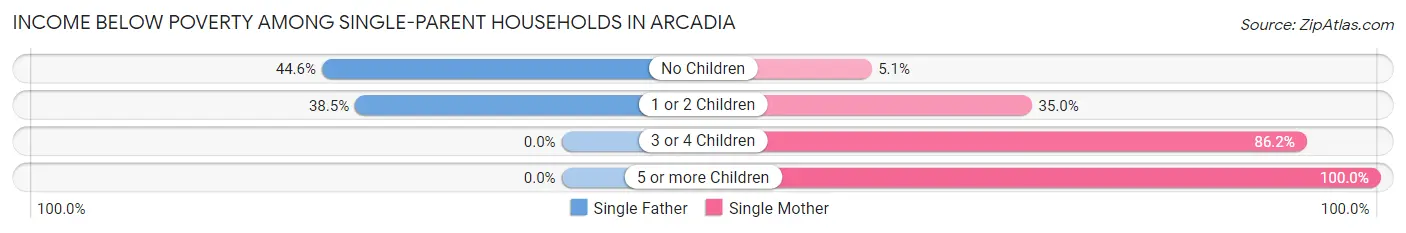
| Children | Single Father | Single Mother |
| No Children | 25 (44.6%) | 8 (5.1%) |
| 1 or 2 Children | 15 (38.5%) | 182 (35.0%) |
| 3 or 4 Children | 0 (0.0%) | 125 (86.2%) |
| 5 or more Children | 0 (0.0%) | 26 (100.0%) |
| Total | 40 (30.5%) | 341 (40.3%) |
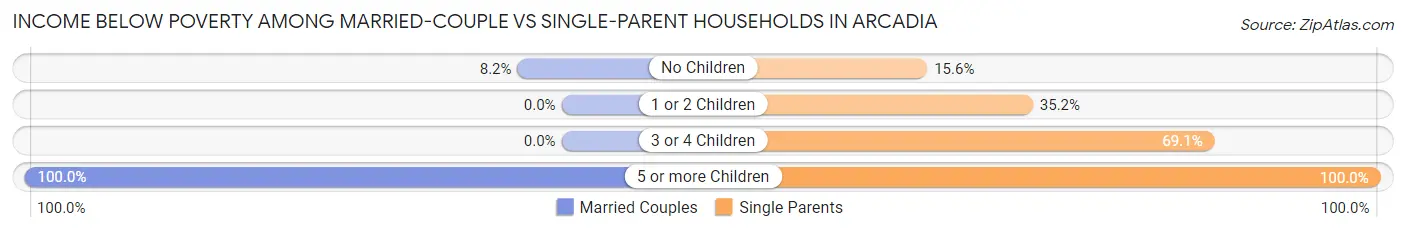
Income Below Poverty Among Married-Couple vs Single-Parent Households in Arcadia
The poverty data for Arcadia shows that 74 of the married-couple family households (12.7%) and 381 of the single-parent households (39.0%) are living below the poverty level. Within the married-couple family households, those with 5 or more children have the highest poverty rate, with 45 households (100.0%) falling below the poverty line. Among the single-parent households, those with 5 or more children have the highest poverty rate, with 26 household (100.0%) living below poverty.
| Children | Married-Couple Families | Single-Parent Households |
| No Children | 29 (8.2%) | 33 (15.6%) |
| 1 or 2 Children | 0 (0.0%) | 197 (35.2%) |
| 3 or 4 Children | 0 (0.0%) | 125 (69.1%) |
| 5 or more Children | 45 (100.0%) | 26 (100.0%) |
| Total | 74 (12.7%) | 381 (39.0%) |
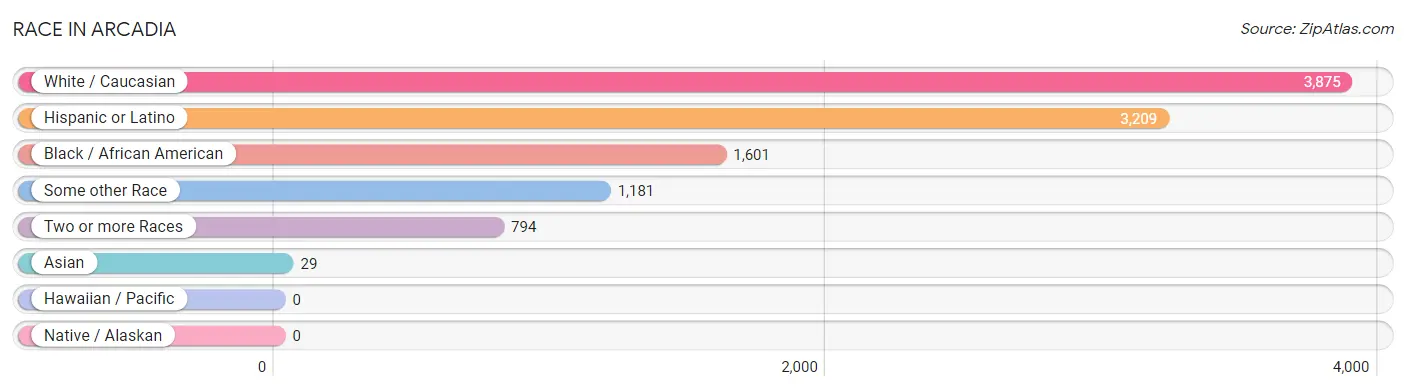
Race in Arcadia
The most populous races in Arcadia are White / Caucasian (3,875 | 51.8%), Hispanic or Latino (3,209 | 42.9%), and Black / African American (1,601 | 21.4%).
| Race | # Population | % Population |
| Asian | 29 | 0.4% |
| Black / African American | 1,601 | 21.4% |
| Hawaiian / Pacific | 0 | 0.0% |
| Hispanic or Latino | 3,209 | 42.9% |
| Native / Alaskan | 0 | 0.0% |
| White / Caucasian | 3,875 | 51.8% |
| Two or more Races | 794 | 10.6% |
| Some other Race | 1,181 | 15.8% |
| Total | 7,480 | 100.0% |
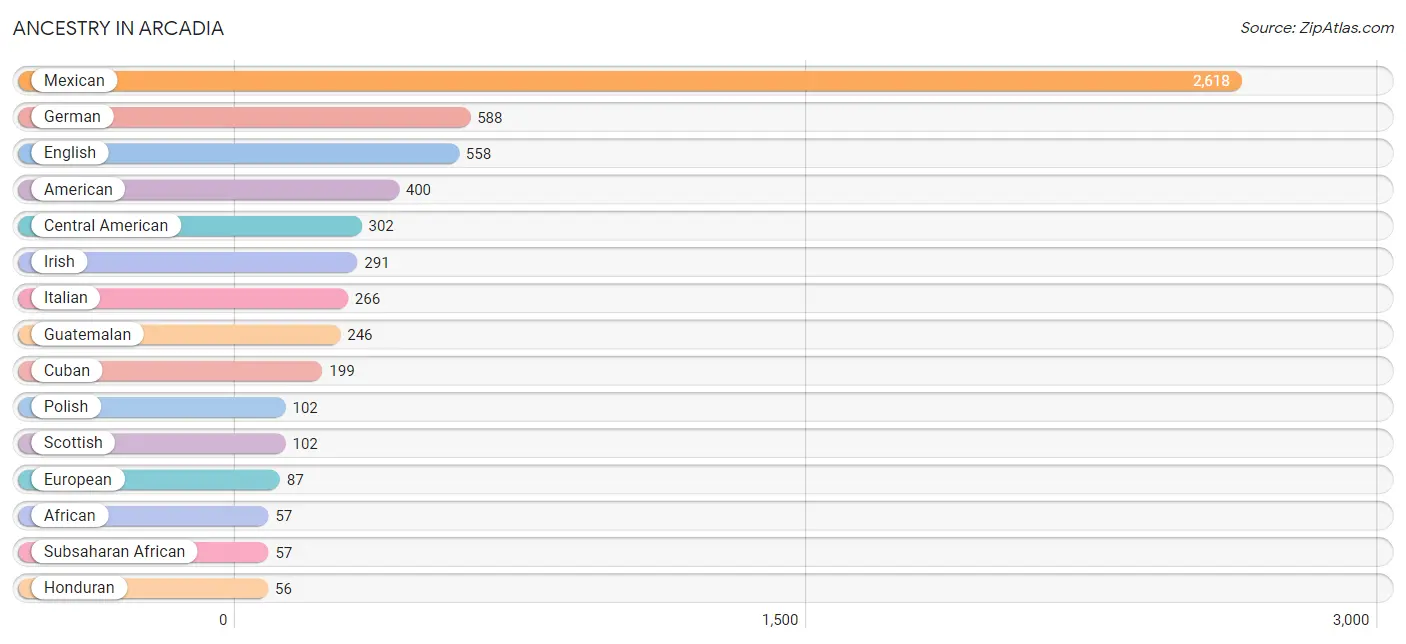
Ancestry in Arcadia
The most populous ancestries reported in Arcadia are Mexican (2,618 | 35.0%), German (588 | 7.9%), English (558 | 7.5%), American (400 | 5.3%), and Central American (302 | 4.0%), together accounting for 59.7% of all Arcadia residents.
| Ancestry | # Population | % Population |
| African | 57 | 0.8% |
| American | 400 | 5.3% |
| Arab | 31 | 0.4% |
| Central American | 302 | 4.0% |
| Colombian | 12 | 0.2% |
| Cuban | 199 | 2.7% |
| Czech | 8 | 0.1% |
| Dominican | 46 | 0.6% |
| Dutch | 51 | 0.7% |
| Ecuadorian | 8 | 0.1% |
| English | 558 | 7.5% |
| European | 87 | 1.2% |
| French | 39 | 0.5% |
| French Canadian | 17 | 0.2% |
| German | 588 | 7.9% |
| Guatemalan | 246 | 3.3% |
| Haitian | 1 | 0.0% |
| Honduran | 56 | 0.7% |
| Hungarian | 7 | 0.1% |
| Irish | 291 | 3.9% |
| Italian | 266 | 3.6% |
| Jamaican | 21 | 0.3% |
| Korean | 41 | 0.5% |
| Lebanese | 31 | 0.4% |
| Maltese | 7 | 0.1% |
| Mexican | 2,618 | 35.0% |
| Norwegian | 21 | 0.3% |
| Polish | 102 | 1.4% |
| Puerto Rican | 24 | 0.3% |
| Scandinavian | 32 | 0.4% |
| Scotch-Irish | 31 | 0.4% |
| Scottish | 102 | 1.4% |
| South American | 20 | 0.3% |
| Subsaharan African | 57 | 0.8% |
| Swedish | 12 | 0.2% | View All 35 Rows |
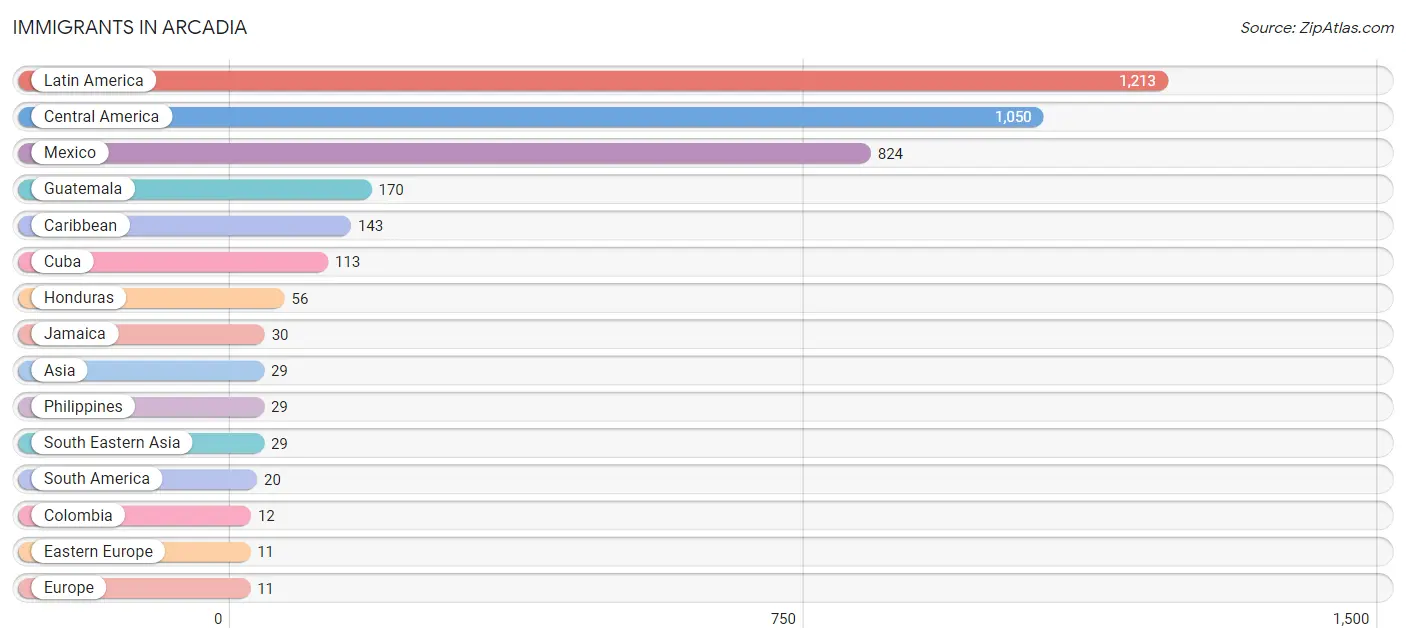
Immigrants in Arcadia
The most numerous immigrant groups reported in Arcadia came from Latin America (1,213 | 16.2%), Central America (1,050 | 14.0%), Mexico (824 | 11.0%), Guatemala (170 | 2.3%), and Caribbean (143 | 1.9%), together accounting for 45.5% of all Arcadia residents.
| Immigration Origin | # Population | % Population |
| Asia | 29 | 0.4% |
| Caribbean | 143 | 1.9% |
| Central America | 1,050 | 14.0% |
| Colombia | 12 | 0.2% |
| Cuba | 113 | 1.5% |
| Eastern Europe | 11 | 0.2% |
| Ecuador | 8 | 0.1% |
| Europe | 11 | 0.2% |
| Guatemala | 170 | 2.3% |
| Honduras | 56 | 0.7% |
| Jamaica | 30 | 0.4% |
| Latin America | 1,213 | 16.2% |
| Mexico | 824 | 11.0% |
| Philippines | 29 | 0.4% |
| Russia | 11 | 0.2% |
| South America | 20 | 0.3% |
| South Eastern Asia | 29 | 0.4% | View All 17 Rows |
Sex and Age in Arcadia
Sex and Age in Arcadia
The most populous age groups in Arcadia are 25 to 29 Years (369 | 10.3%) for men and 20 to 24 Years (466 | 11.9%) for women.
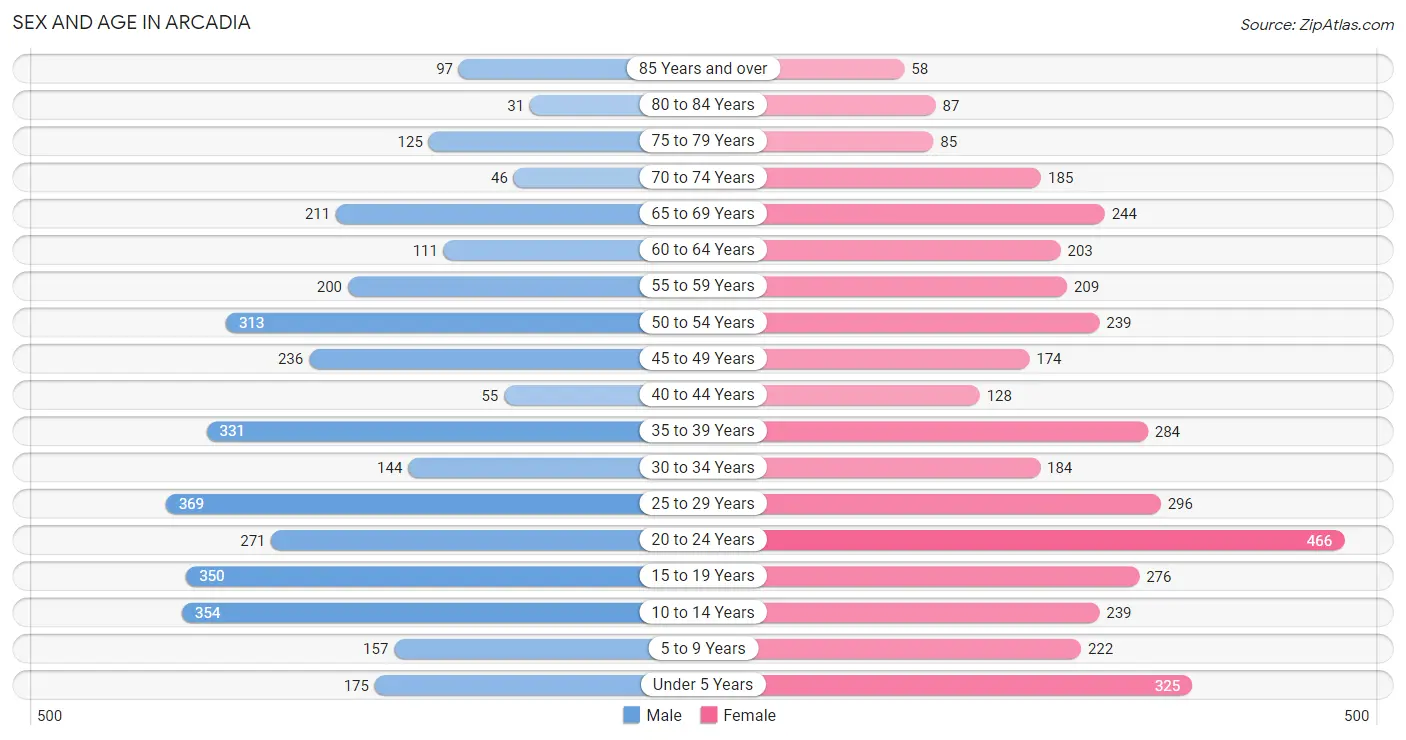
| Age Bracket | Male | Female |
| Under 5 Years | 175 (4.9%) | 325 (8.3%) |
| 5 to 9 Years | 157 (4.4%) | 222 (5.7%) |
| 10 to 14 Years | 354 (9.9%) | 239 (6.1%) |
| 15 to 19 Years | 350 (9.8%) | 276 (7.1%) |
| 20 to 24 Years | 271 (7.6%) | 466 (11.9%) |
| 25 to 29 Years | 369 (10.3%) | 296 (7.6%) |
| 30 to 34 Years | 144 (4.0%) | 184 (4.7%) |
| 35 to 39 Years | 331 (9.3%) | 284 (7.3%) |
| 40 to 44 Years | 55 (1.5%) | 128 (3.3%) |
| 45 to 49 Years | 236 (6.6%) | 174 (4.5%) |
| 50 to 54 Years | 313 (8.7%) | 239 (6.1%) |
| 55 to 59 Years | 200 (5.6%) | 209 (5.3%) |
| 60 to 64 Years | 111 (3.1%) | 203 (5.2%) |
| 65 to 69 Years | 211 (5.9%) | 244 (6.2%) |
| 70 to 74 Years | 46 (1.3%) | 185 (4.7%) |
| 75 to 79 Years | 125 (3.5%) | 85 (2.2%) |
| 80 to 84 Years | 31 (0.9%) | 87 (2.2%) |
| 85 Years and over | 97 (2.7%) | 58 (1.5%) |
| Total | 3,576 (100.0%) | 3,904 (100.0%) |
Families and Households in Arcadia
Median Family Size in Arcadia
The median family size in Arcadia is 3.07 persons per family, with single male/father families (131 | 8.4%) accounting for the largest median family size of 3.49 persons per family. On the other hand, married-couple families (584 | 37.4%) represent the smallest median family size with 2.76 persons per family.
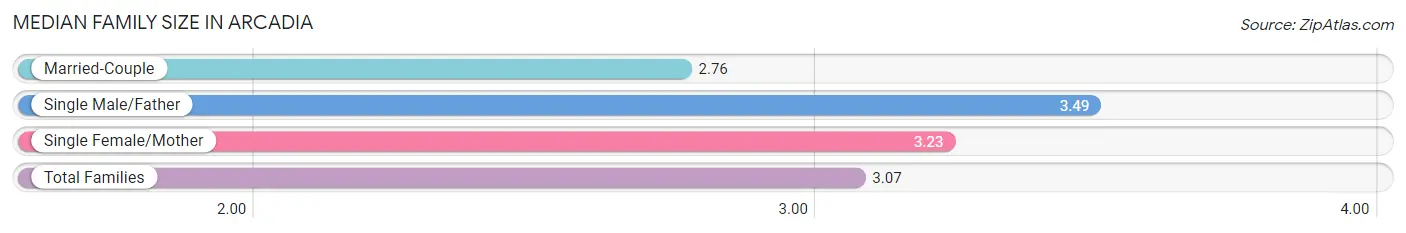
| Family Type | # Families | Family Size |
| Married-Couple | 584 (37.4%) | 2.76 |
| Single Male/Father | 131 (8.4%) | 3.49 |
| Single Female/Mother | 847 (54.2%) | 3.23 |
| Total Families | 1,562 (100.0%) | 3.07 |
Median Household Size in Arcadia
The median household size in Arcadia is 2.37 persons per household, with single male/father households (131 | 4.3%) accounting for the largest median household size of 4.2 persons per household. non-family households (1,453 | 48.2%) represent the smallest median household size with 1.24 persons per household.
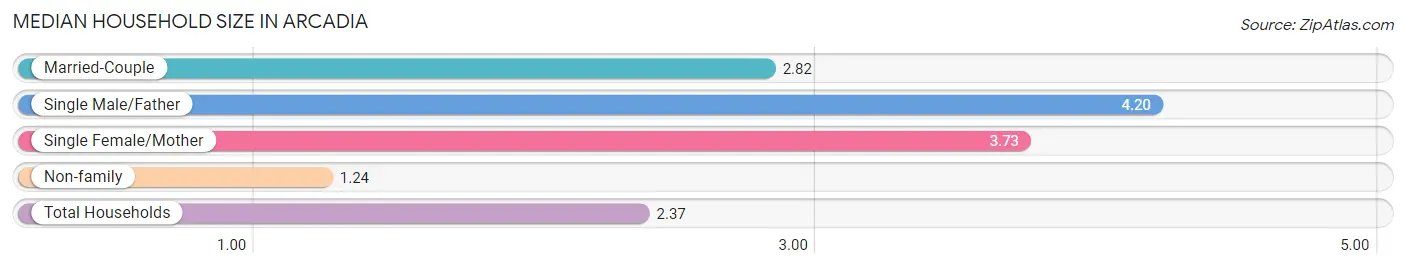
| Household Type | # Households | Household Size |
| Married-Couple | 584 (19.4%) | 2.82 |
| Single Male/Father | 131 (4.3%) | 4.20 |
| Single Female/Mother | 847 (28.1%) | 3.73 |
| Non-family | 1,453 (48.2%) | 1.24 |
| Total Households | 3,015 (100.0%) | 2.37 |
Household Size by Marriage Status in Arcadia
Out of a total of 3,015 households in Arcadia, 1,562 (51.8%) are family households, while 1,453 (48.2%) are nonfamily households. The most numerous type of family households are 2-person households, comprising 609, and the most common type of nonfamily households are 1-person households, comprising 1,173.
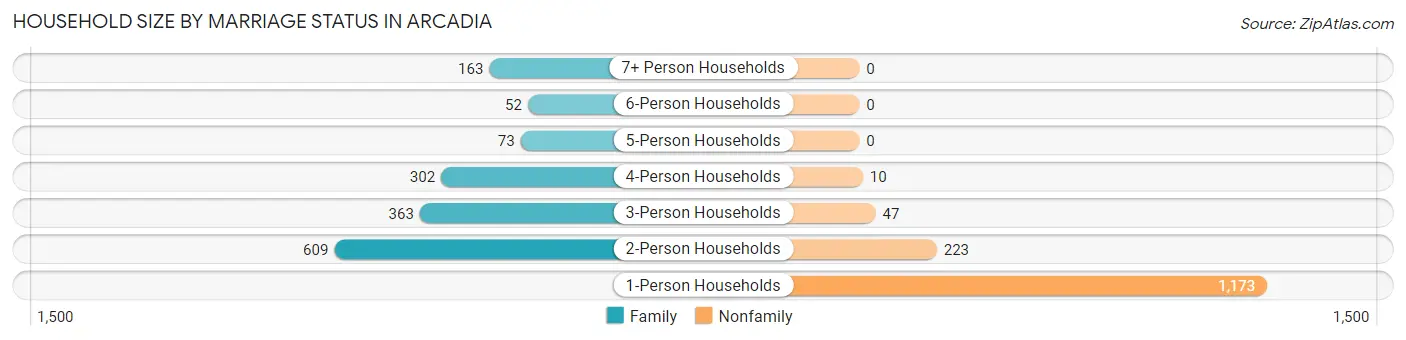
| Household Size | Family Households | Nonfamily Households |
| 1-Person Households | - | 1,173 (38.9%) |
| 2-Person Households | 609 (20.2%) | 223 (7.4%) |
| 3-Person Households | 363 (12.0%) | 47 (1.6%) |
| 4-Person Households | 302 (10.0%) | 10 (0.3%) |
| 5-Person Households | 73 (2.4%) | 0 (0.0%) |
| 6-Person Households | 52 (1.7%) | 0 (0.0%) |
| 7+ Person Households | 163 (5.4%) | 0 (0.0%) |
| Total | 1,562 (51.8%) | 1,453 (48.2%) |
Female Fertility in Arcadia
Fertility by Age in Arcadia
Average fertility rate in Arcadia is 43.0 births per 1,000 women. Women in the age bracket of 20 to 34 years have the highest fertility rate with 85.0 births per 1,000 women. Women in the age bracket of 20 to 34 years acount for 100.0% of all women with births.
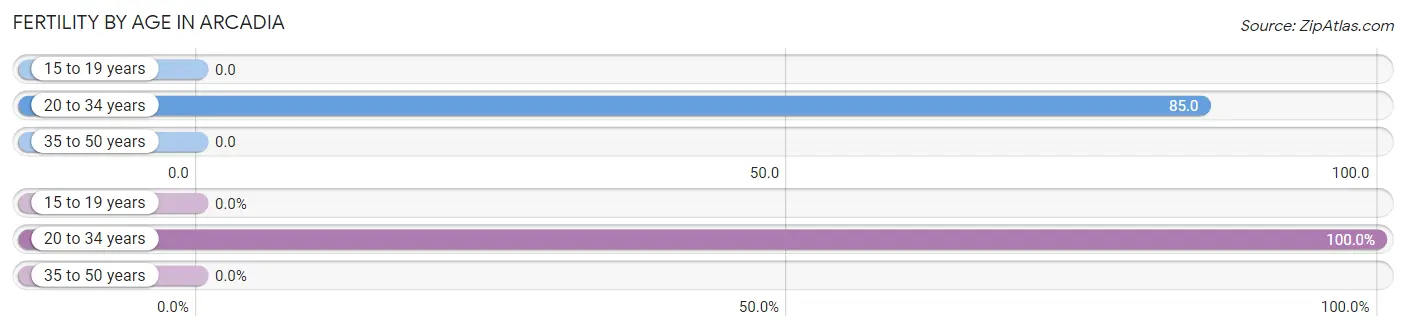
| Age Bracket | Women with Births | Births / 1,000 Women |
| 15 to 19 years | 0 (0.0%) | 0.0 |
| 20 to 34 years | 80 (100.0%) | 85.0 |
| 35 to 50 years | 0 (0.0%) | 0.0 |
| Total | 80 (100.0%) | 43.0 |
Fertility by Age by Marriage Status in Arcadia
13.8% of women with births (80) in Arcadia are married. The highest percentage of unmarried women with births falls into 20 to 34 years age bracket with 86.3% of them unmarried at the time of birth, while the lowest percentage of unmarried women with births belong to 20 to 34 years age bracket with 86.3% of them unmarried.
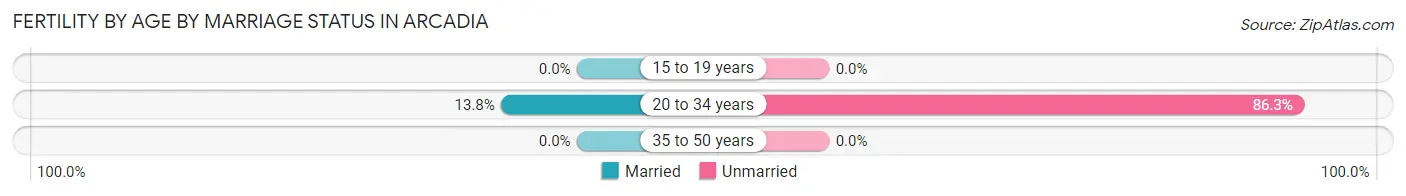
| Age Bracket | Married | Unmarried |
| 15 to 19 years | 0 (0.0%) | 0 (0.0%) |
| 20 to 34 years | 11 (13.8%) | 69 (86.3%) |
| 35 to 50 years | 0 (0.0%) | 0 (0.0%) |
| Total | 11 (13.8%) | 69 (86.3%) |
Fertility by Education in Arcadia
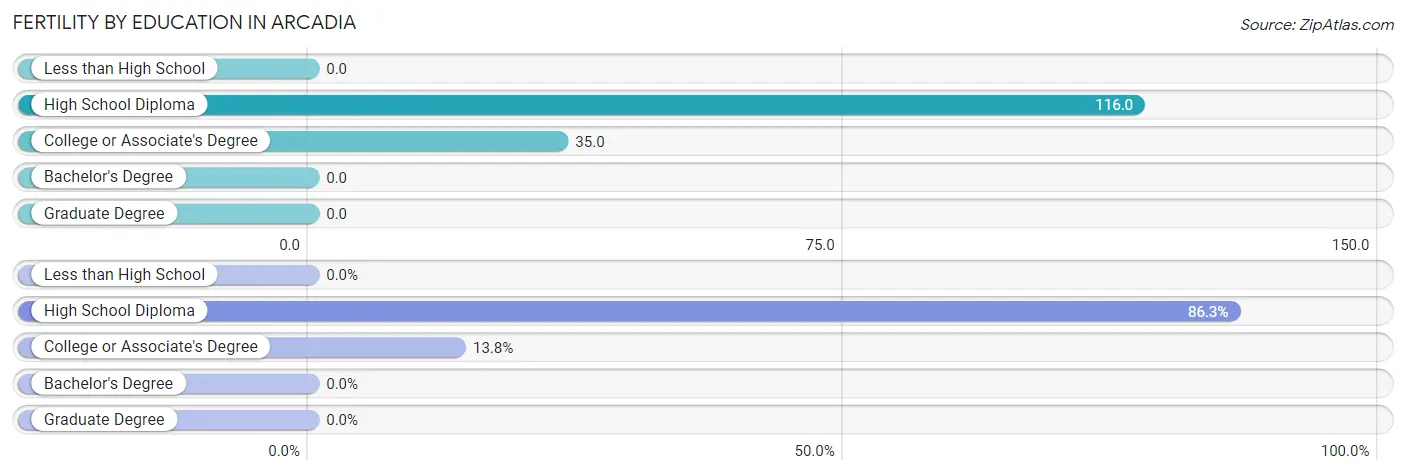
| Educational Attainment | Women with Births | Births / 1,000 Women |
| Less than High School | 0 (0.0%) | 0.0 |
| High School Diploma | 69 (86.3%) | 116.0 |
| College or Associate's Degree | 11 (13.8%) | 35.0 |
| Bachelor's Degree | 0 (0.0%) | 0.0 |
| Graduate Degree | 0 (0.0%) | 0.0 |
| Total | 80 (100.0%) | 43.0 |
Fertility by Education by Marriage Status in Arcadia
86.3% of women with births in Arcadia are unmarried. Women with the educational attainment of college or associate's degree are most likely to be married with 100.0% of them married at childbirth, while women with the educational attainment of high school diploma are least likely to be married with 100.0% of them unmarried at childbirth.
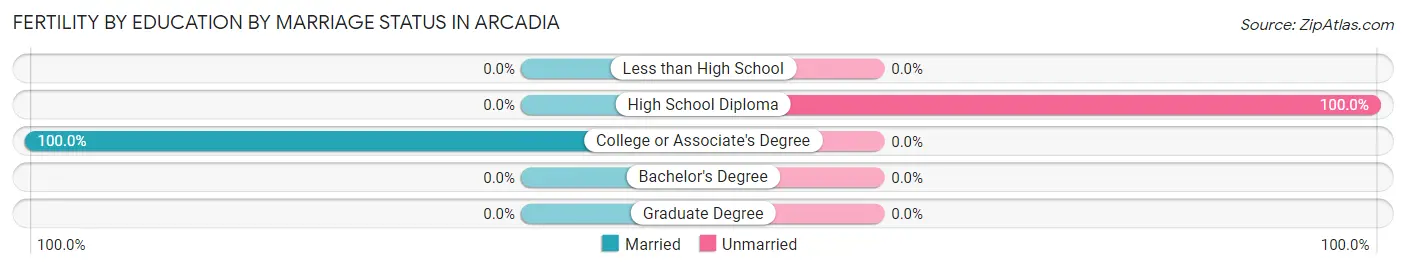
| Educational Attainment | Married | Unmarried |
| Less than High School | 0 (0.0%) | 0 (0.0%) |
| High School Diploma | 0 (0.0%) | 69 (100.0%) |
| College or Associate's Degree | 11 (100.0%) | 0 (0.0%) |
| Bachelor's Degree | 0 (0.0%) | 0 (0.0%) |
| Graduate Degree | 0 (0.0%) | 0 (0.0%) |
| Total | 11 (13.8%) | 69 (86.3%) |
Employment Characteristics in Arcadia
Employment by Class of Employer in Arcadia
Among the 2,981 employed individuals in Arcadia, private company employees (1,989 | 66.7%), local government employees (375 | 12.6%), and not-for-profit organizations (317 | 10.6%) make up the most common classes of employment.
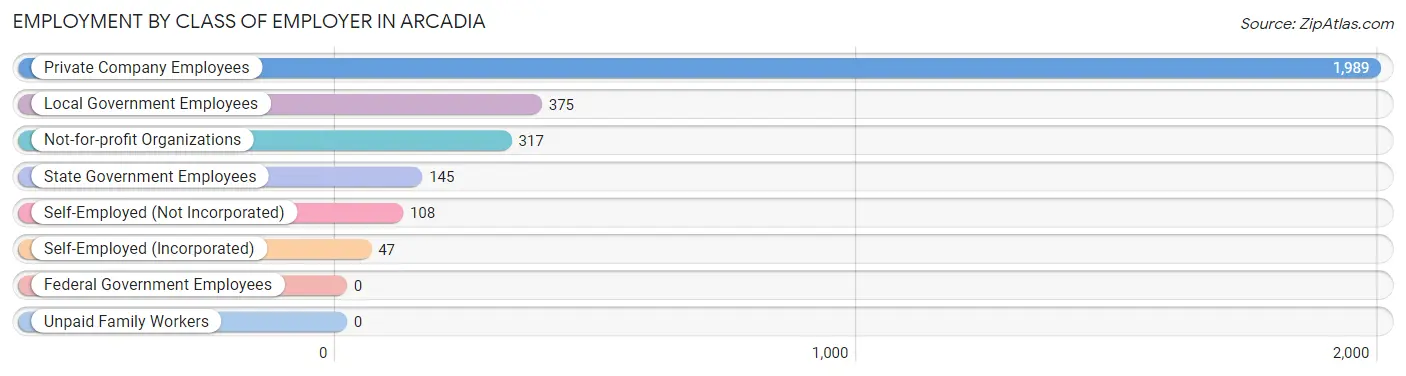
| Employer Class | # Employees | % Employees |
| Private Company Employees | 1,989 | 66.7% |
| Self-Employed (Incorporated) | 47 | 1.6% |
| Self-Employed (Not Incorporated) | 108 | 3.6% |
| Not-for-profit Organizations | 317 | 10.6% |
| Local Government Employees | 375 | 12.6% |
| State Government Employees | 145 | 4.9% |
| Federal Government Employees | 0 | 0.0% |
| Unpaid Family Workers | 0 | 0.0% |
| Total | 2,981 | 100.0% |
Employment Status by Age in Arcadia
According to the labor force statistics for Arcadia, out of the total population over 16 years of age (5,858), 58.4% or 3,421 individuals are in the labor force, with 8.3% or 284 of them unemployed. The age group with the highest labor force participation rate is 25 to 29 years, with 89.9% or 598 individuals in the labor force. Within the labor force, the 20 to 24 years age range has the highest percentage of unemployed individuals, with 15.1% or 92 of them being unemployed.
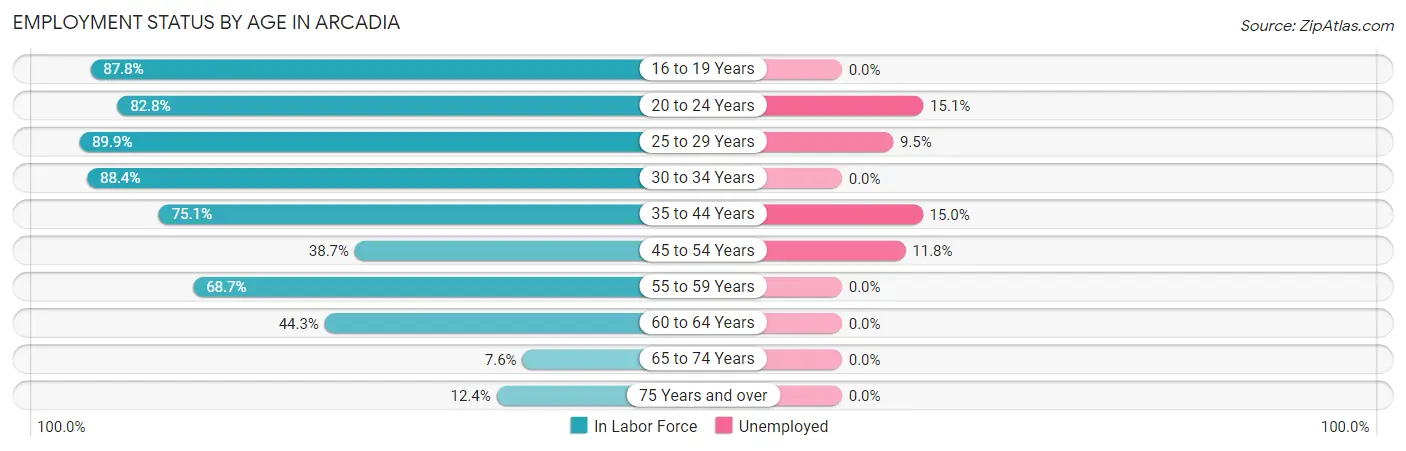
| Age Bracket | In Labor Force | Unemployed |
| 16 to 19 Years | 418 (87.8%) | 0 (0.0%) |
| 20 to 24 Years | 610 (82.8%) | 92 (15.1%) |
| 25 to 29 Years | 598 (89.9%) | 57 (9.5%) |
| 30 to 34 Years | 290 (88.4%) | 0 (0.0%) |
| 35 to 44 Years | 599 (75.1%) | 90 (15.0%) |
| 45 to 54 Years | 372 (38.7%) | 44 (11.8%) |
| 55 to 59 Years | 281 (68.7%) | 0 (0.0%) |
| 60 to 64 Years | 139 (44.3%) | 0 (0.0%) |
| 65 to 74 Years | 52 (7.6%) | 0 (0.0%) |
| 75 Years and over | 60 (12.4%) | 0 (0.0%) |
| Total | 3,421 (58.4%) | 284 (8.3%) |
Employment Status by Educational Attainment in Arcadia
According to labor force statistics for Arcadia, 65.6% of individuals (2,280) out of the total population between 25 and 64 years of age (3,476) are in the labor force, with 8.4% or 192 of them being unemployed. The group with the highest labor force participation rate are those with the educational attainment of bachelor's degree or higher, with 89.8% or 432 individuals in the labor force. Within the labor force, individuals with high school diploma education have the highest percentage of unemployment, with 11.5% or 91 of them being unemployed.

| Educational Attainment | In Labor Force | Unemployed |
| Less than High School | 558 (61.3%) | 49 (5.4%) |
| High School Diploma | 789 (57.0%) | 159 (11.5%) |
| College / Associate Degree | 500 (71.4%) | 76 (10.8%) |
| Bachelor's Degree or higher | 432 (89.8%) | 18 (3.7%) |
| Total | 2,280 (65.6%) | 292 (8.4%) |
Employment Occupations by Sex in Arcadia
Management, Business, Science and Arts Occupations
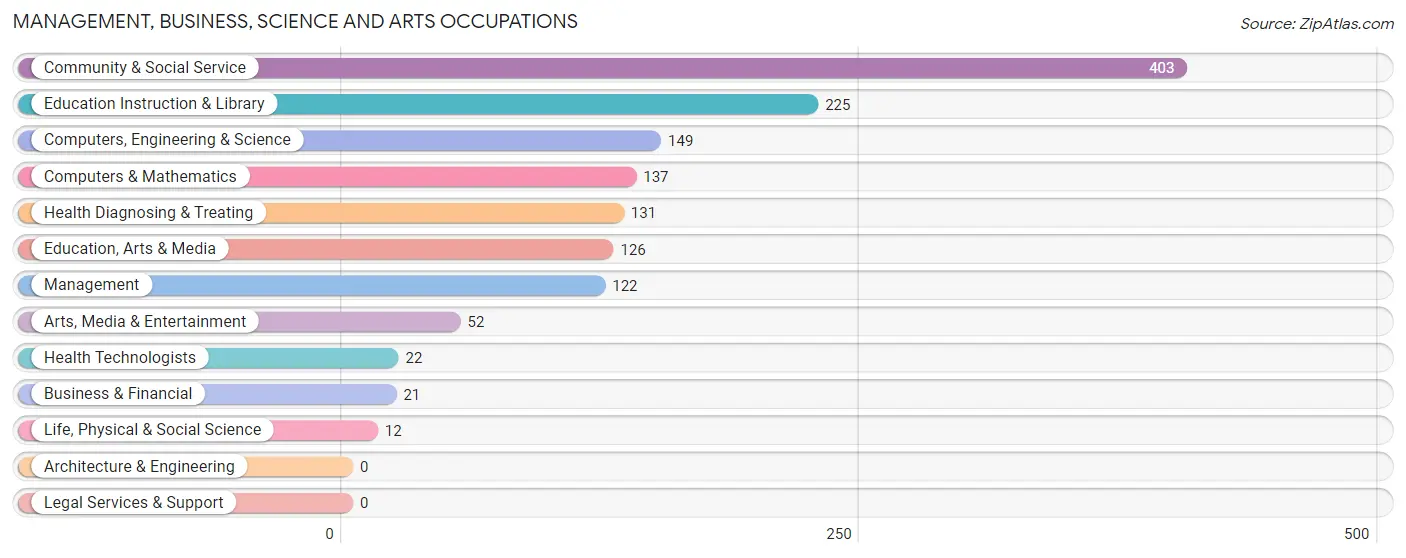
The most common Management, Business, Science and Arts occupations in Arcadia are Community & Social Service (403 | 12.9%), Education Instruction & Library (225 | 7.2%), Computers, Engineering & Science (149 | 4.8%), Computers & Mathematics (137 | 4.4%), and Health Diagnosing & Treating (131 | 4.2%).
Management, Business, Science and Arts Occupations by Sex
Within the Management, Business, Science and Arts occupations in Arcadia, the most male-oriented occupations are Computers, Engineering & Science (100.0%), Computers & Mathematics (100.0%), and Life, Physical & Social Science (100.0%), while the most female-oriented occupations are Business & Financial (100.0%), Education Instruction & Library (100.0%), and Health Technologists (100.0%).
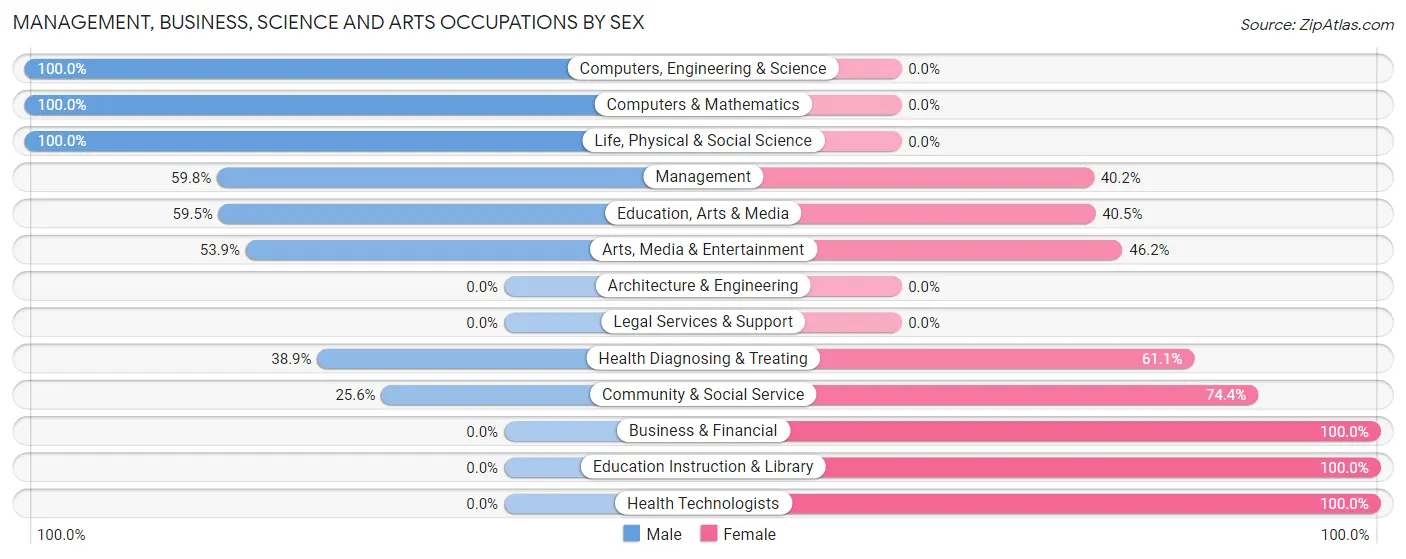
| Occupation | Male | Female |
| Management | 73 (59.8%) | 49 (40.2%) |
| Business & Financial | 0 (0.0%) | 21 (100.0%) |
| Computers, Engineering & Science | 149 (100.0%) | 0 (0.0%) |
| Computers & Mathematics | 137 (100.0%) | 0 (0.0%) |
| Architecture & Engineering | 0 (0.0%) | 0 (0.0%) |
| Life, Physical & Social Science | 12 (100.0%) | 0 (0.0%) |
| Community & Social Service | 103 (25.6%) | 300 (74.4%) |
| Education, Arts & Media | 75 (59.5%) | 51 (40.5%) |
| Legal Services & Support | 0 (0.0%) | 0 (0.0%) |
| Education Instruction & Library | 0 (0.0%) | 225 (100.0%) |
| Arts, Media & Entertainment | 28 (53.8%) | 24 (46.2%) |
| Health Diagnosing & Treating | 51 (38.9%) | 80 (61.1%) |
| Health Technologists | 0 (0.0%) | 22 (100.0%) |
| Total (Category) | 376 (45.5%) | 450 (54.5%) |
| Total (Overall) | 1,755 (56.0%) | 1,381 (44.0%) |
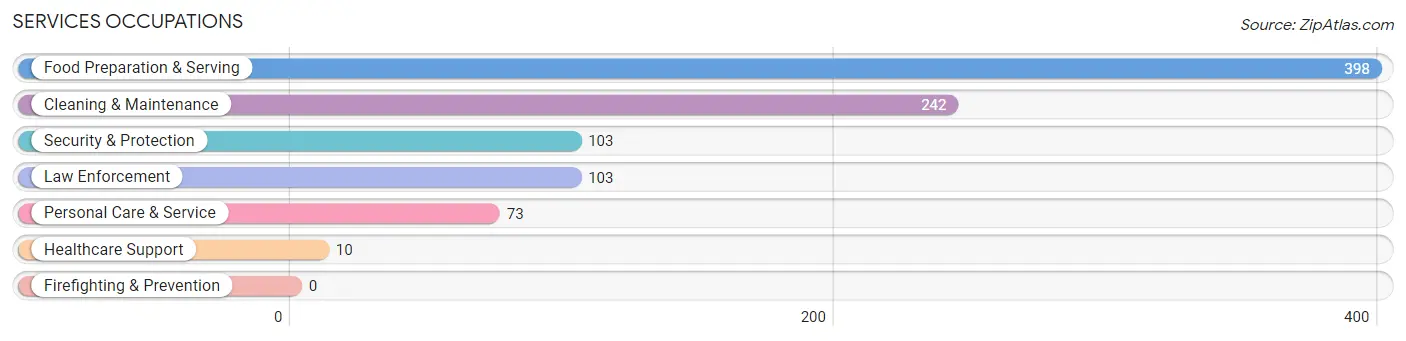
Services Occupations
The most common Services occupations in Arcadia are Food Preparation & Serving (398 | 12.7%), Cleaning & Maintenance (242 | 7.7%), Security & Protection (103 | 3.3%), Law Enforcement (103 | 3.3%), and Personal Care & Service (73 | 2.3%).
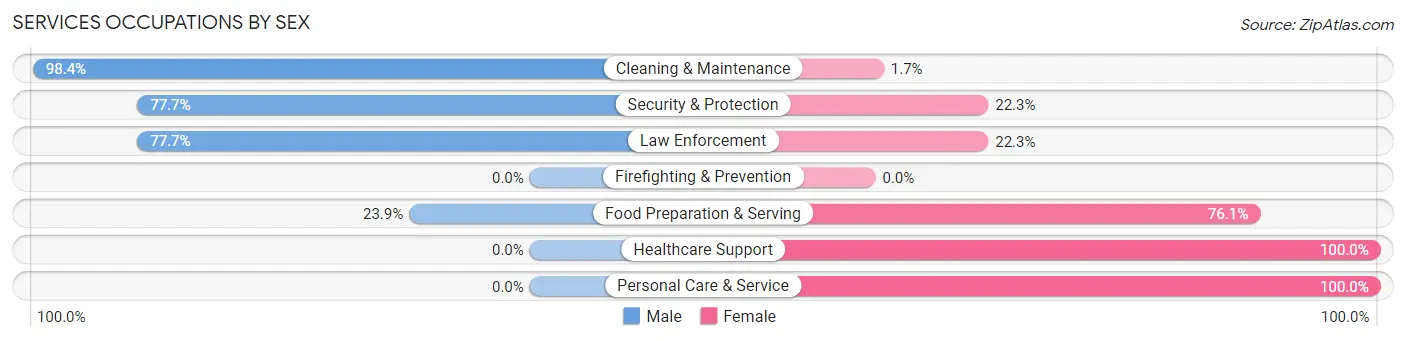
Services Occupations by Sex
Within the Services occupations in Arcadia, the most male-oriented occupations are Cleaning & Maintenance (98.4%), Security & Protection (77.7%), and Law Enforcement (77.7%), while the most female-oriented occupations are Healthcare Support (100.0%), Personal Care & Service (100.0%), and Food Preparation & Serving (76.1%).
| Occupation | Male | Female |
| Healthcare Support | 0 (0.0%) | 10 (100.0%) |
| Security & Protection | 80 (77.7%) | 23 (22.3%) |
| Firefighting & Prevention | 0 (0.0%) | 0 (0.0%) |
| Law Enforcement | 80 (77.7%) | 23 (22.3%) |
| Food Preparation & Serving | 95 (23.9%) | 303 (76.1%) |
| Cleaning & Maintenance | 238 (98.4%) | 4 (1.7%) |
| Personal Care & Service | 0 (0.0%) | 73 (100.0%) |
| Total (Category) | 413 (50.0%) | 413 (50.0%) |
| Total (Overall) | 1,755 (56.0%) | 1,381 (44.0%) |
Sales and Office Occupations
The most common Sales and Office occupations in Arcadia are Office & Administration (289 | 9.2%), and Sales & Related (184 | 5.9%).

Sales and Office Occupations by Sex

| Occupation | Male | Female |
| Sales & Related | 105 (57.1%) | 79 (42.9%) |
| Office & Administration | 97 (33.6%) | 192 (66.4%) |
| Total (Category) | 202 (42.7%) | 271 (57.3%) |
| Total (Overall) | 1,755 (56.0%) | 1,381 (44.0%) |
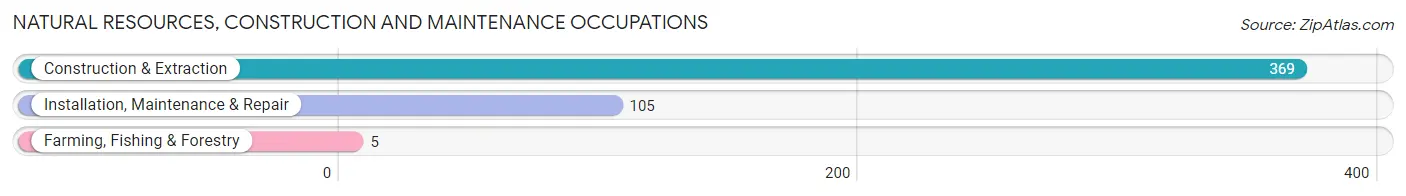
Natural Resources, Construction and Maintenance Occupations
The most common Natural Resources, Construction and Maintenance occupations in Arcadia are Construction & Extraction (369 | 11.8%), Installation, Maintenance & Repair (105 | 3.4%), and Farming, Fishing & Forestry (5 | 0.2%).
Natural Resources, Construction and Maintenance Occupations by Sex

| Occupation | Male | Female |
| Farming, Fishing & Forestry | 5 (100.0%) | 0 (0.0%) |
| Construction & Extraction | 364 (98.6%) | 5 (1.4%) |
| Installation, Maintenance & Repair | 105 (100.0%) | 0 (0.0%) |
| Total (Category) | 474 (99.0%) | 5 (1.0%) |
| Total (Overall) | 1,755 (56.0%) | 1,381 (44.0%) |
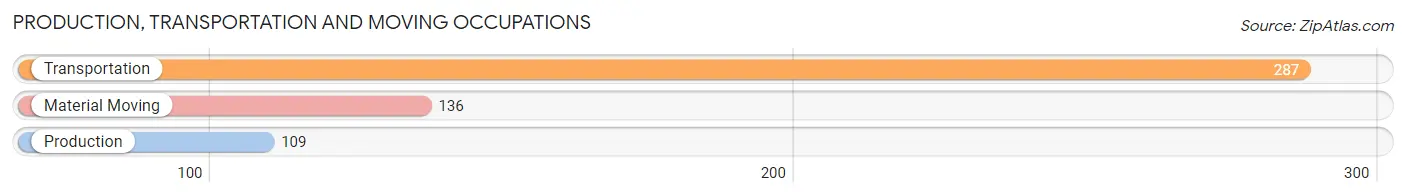
Production, Transportation and Moving Occupations
The most common Production, Transportation and Moving occupations in Arcadia are Transportation (287 | 9.1%), Material Moving (136 | 4.3%), and Production (109 | 3.5%).
Production, Transportation and Moving Occupations by Sex
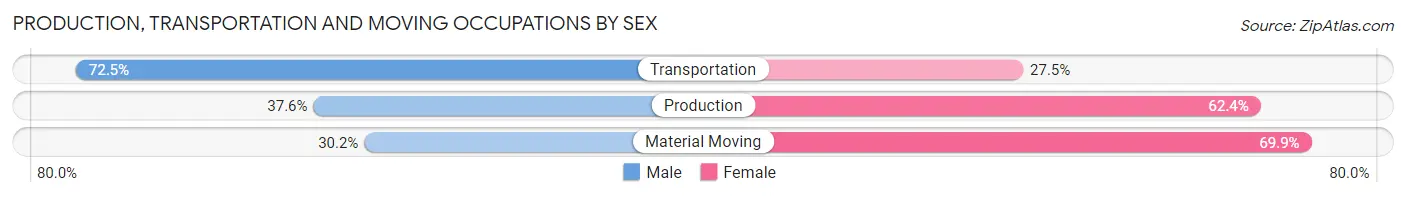
| Occupation | Male | Female |
| Production | 41 (37.6%) | 68 (62.4%) |
| Transportation | 208 (72.5%) | 79 (27.5%) |
| Material Moving | 41 (30.1%) | 95 (69.9%) |
| Total (Category) | 290 (54.5%) | 242 (45.5%) |
| Total (Overall) | 1,755 (56.0%) | 1,381 (44.0%) |
Employment Industries by Sex in Arcadia
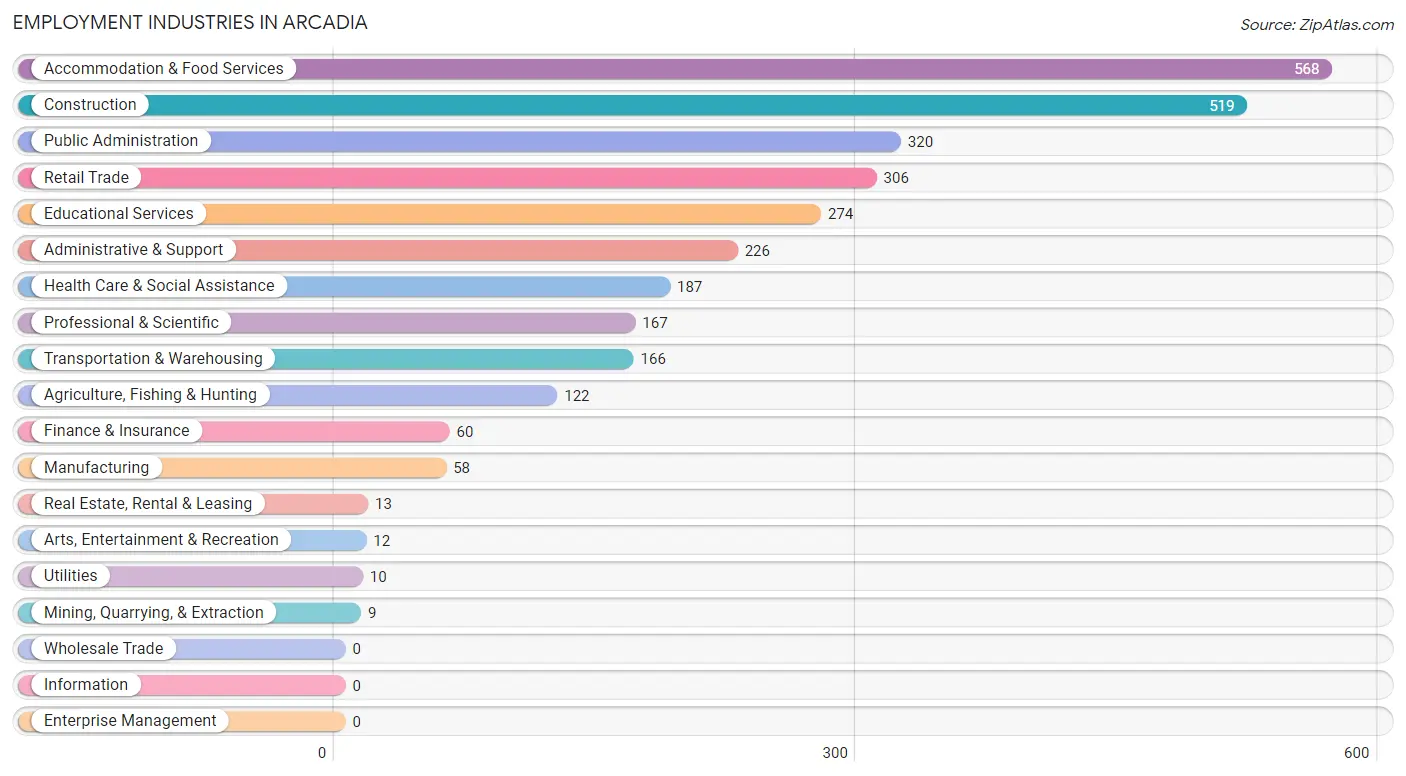
Employment Industries in Arcadia
The major employment industries in Arcadia include Accommodation & Food Services (568 | 18.1%), Construction (519 | 16.6%), Public Administration (320 | 10.2%), Retail Trade (306 | 9.8%), and Educational Services (274 | 8.7%).
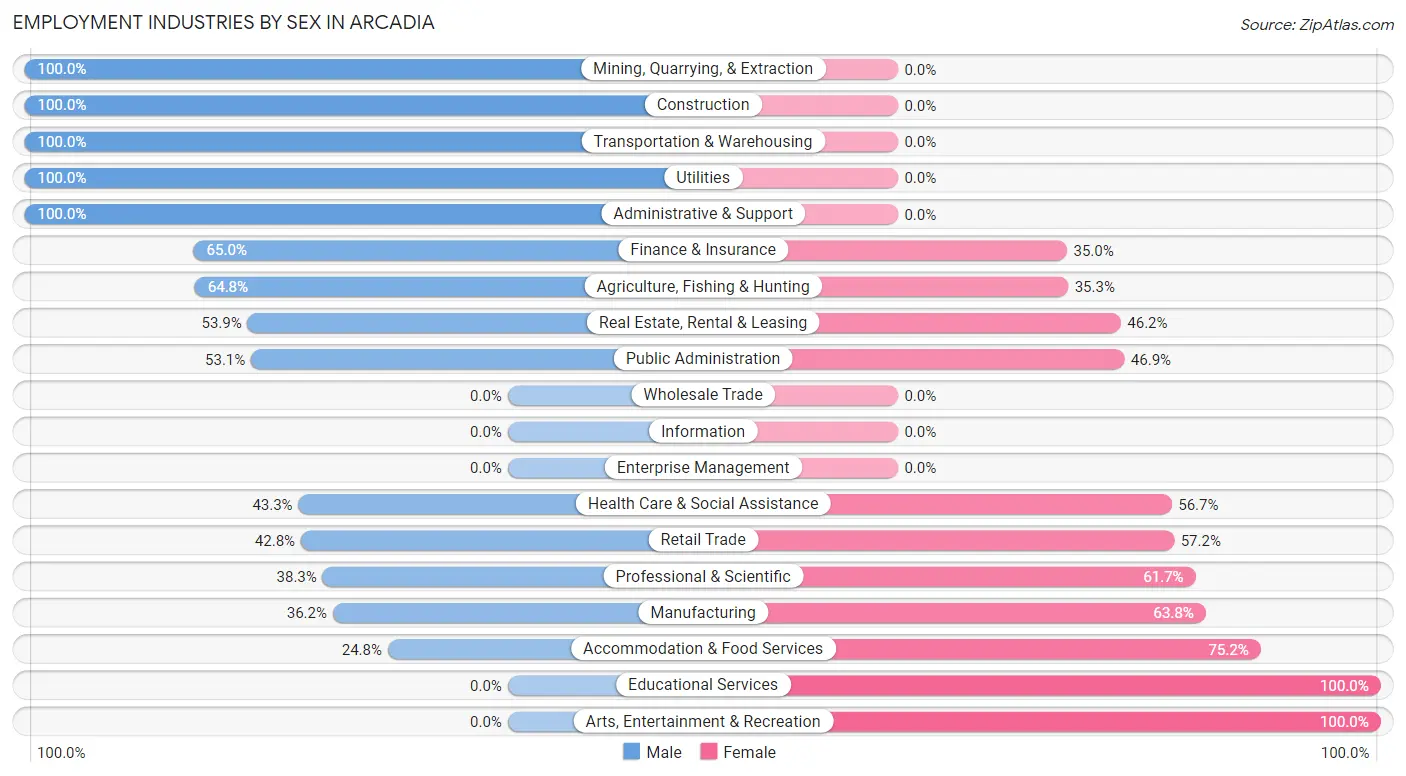
Employment Industries by Sex in Arcadia
The Arcadia industries that see more men than women are Mining, Quarrying, & Extraction (100.0%), Construction (100.0%), and Transportation & Warehousing (100.0%), whereas the industries that tend to have a higher number of women are Educational Services (100.0%), Arts, Entertainment & Recreation (100.0%), and Accommodation & Food Services (75.2%).
| Industry | Male | Female |
| Agriculture, Fishing & Hunting | 79 (64.7%) | 43 (35.2%) |
| Mining, Quarrying, & Extraction | 9 (100.0%) | 0 (0.0%) |
| Construction | 519 (100.0%) | 0 (0.0%) |
| Manufacturing | 21 (36.2%) | 37 (63.8%) |
| Wholesale Trade | 0 (0.0%) | 0 (0.0%) |
| Retail Trade | 131 (42.8%) | 175 (57.2%) |
| Transportation & Warehousing | 166 (100.0%) | 0 (0.0%) |
| Utilities | 10 (100.0%) | 0 (0.0%) |
| Information | 0 (0.0%) | 0 (0.0%) |
| Finance & Insurance | 39 (65.0%) | 21 (35.0%) |
| Real Estate, Rental & Leasing | 7 (53.8%) | 6 (46.2%) |
| Professional & Scientific | 64 (38.3%) | 103 (61.7%) |
| Enterprise Management | 0 (0.0%) | 0 (0.0%) |
| Administrative & Support | 226 (100.0%) | 0 (0.0%) |
| Educational Services | 0 (0.0%) | 274 (100.0%) |
| Health Care & Social Assistance | 81 (43.3%) | 106 (56.7%) |
| Arts, Entertainment & Recreation | 0 (0.0%) | 12 (100.0%) |
| Accommodation & Food Services | 141 (24.8%) | 427 (75.2%) |
| Public Administration | 170 (53.1%) | 150 (46.9%) |
| Total | 1,755 (56.0%) | 1,381 (44.0%) |
Education in Arcadia
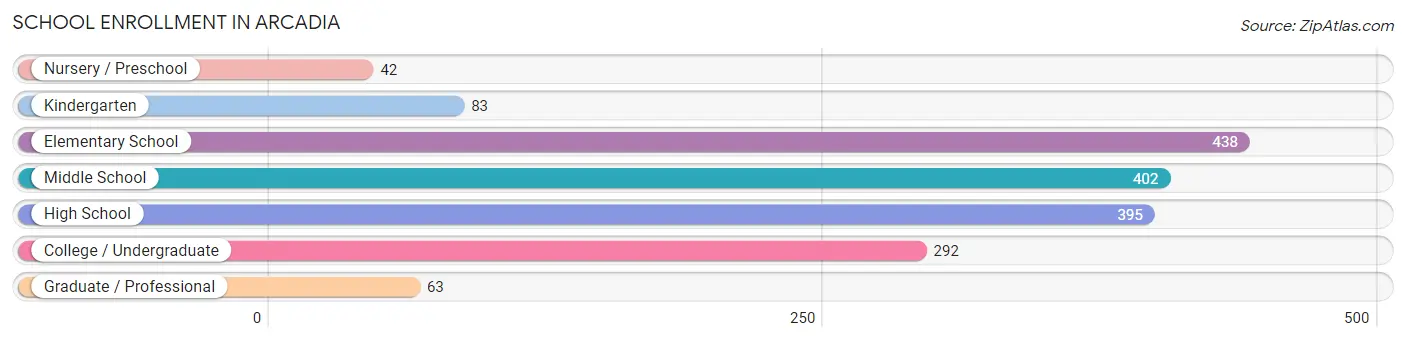
School Enrollment in Arcadia
The most common levels of schooling among the 1,715 students in Arcadia are elementary school (438 | 25.5%), middle school (402 | 23.4%), and high school (395 | 23.0%).
| School Level | # Students | % Students |
| Nursery / Preschool | 42 | 2.5% |
| Kindergarten | 83 | 4.8% |
| Elementary School | 438 | 25.5% |
| Middle School | 402 | 23.4% |
| High School | 395 | 23.0% |
| College / Undergraduate | 292 | 17.0% |
| Graduate / Professional | 63 | 3.7% |
| Total | 1,715 | 100.0% |
School Enrollment by Age by Funding Source in Arcadia
Out of a total of 1,715 students who are enrolled in schools in Arcadia, 129 (7.5%) attend a private institution, while the remaining 1,586 (92.5%) are enrolled in public schools. The age group of 35 years and over has the highest likelihood of being enrolled in private schools, with 19 (38.8% in the age bracket) enrolled. Conversely, the age group of 3 to 4 year olds has the lowest likelihood of being enrolled in a private school, with 70 (100.0% in the age bracket) attending a public institution.
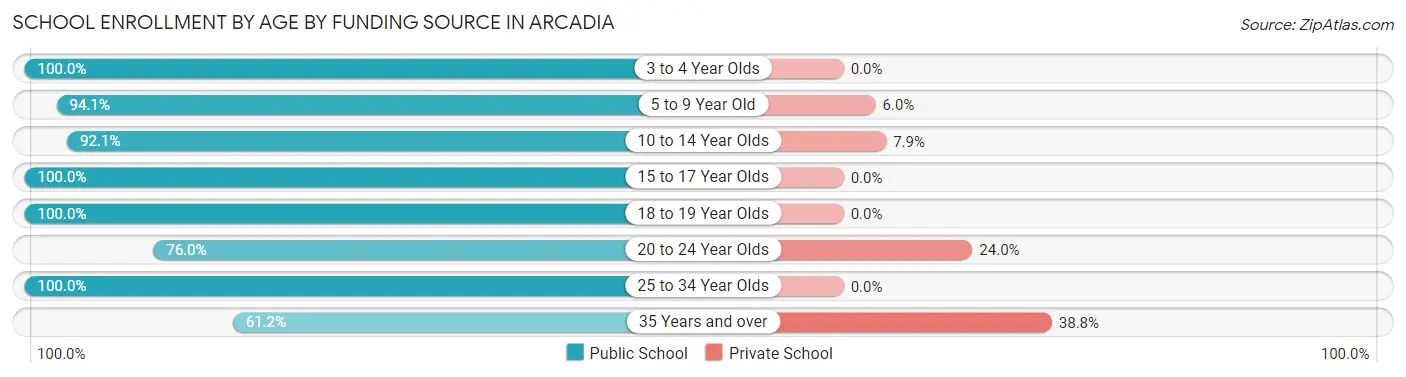
| Age Bracket | Public School | Private School |
| 3 to 4 Year Olds | 70 (100.0%) | 0 (0.0%) |
| 5 to 9 Year Old | 332 (94.1%) | 21 (5.9%) |
| 10 to 14 Year Olds | 546 (92.1%) | 47 (7.9%) |
| 15 to 17 Year Olds | 317 (100.0%) | 0 (0.0%) |
| 18 to 19 Year Olds | 101 (100.0%) | 0 (0.0%) |
| 20 to 24 Year Olds | 130 (76.0%) | 41 (24.0%) |
| 25 to 34 Year Olds | 61 (100.0%) | 0 (0.0%) |
| 35 Years and over | 30 (61.2%) | 19 (38.8%) |
| Total | 1,586 (92.5%) | 129 (7.5%) |
Educational Attainment by Field of Study in Arcadia
Education (190 | 26.5%), liberal arts & history (132 | 18.4%), arts & humanities (95 | 13.2%), social sciences (66 | 9.2%), and psychology (64 | 8.9%) are the most common fields of study among 718 individuals in Arcadia who have obtained a bachelor's degree or higher.
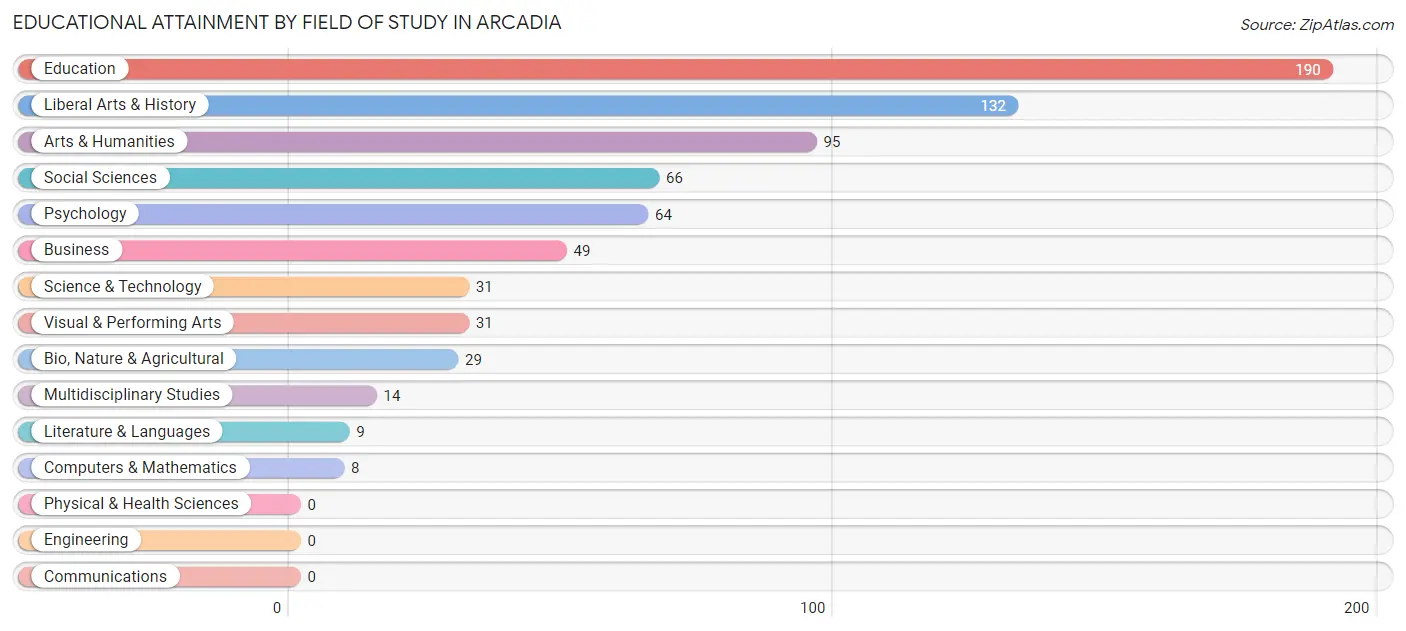
| Field of Study | # Graduates | % Graduates |
| Computers & Mathematics | 8 | 1.1% |
| Bio, Nature & Agricultural | 29 | 4.0% |
| Physical & Health Sciences | 0 | 0.0% |
| Psychology | 64 | 8.9% |
| Social Sciences | 66 | 9.2% |
| Engineering | 0 | 0.0% |
| Multidisciplinary Studies | 14 | 1.9% |
| Science & Technology | 31 | 4.3% |
| Business | 49 | 6.8% |
| Education | 190 | 26.5% |
| Literature & Languages | 9 | 1.3% |
| Liberal Arts & History | 132 | 18.4% |
| Visual & Performing Arts | 31 | 4.3% |
| Communications | 0 | 0.0% |
| Arts & Humanities | 95 | 13.2% |
| Total | 718 | 100.0% |
Transportation & Commute in Arcadia
Vehicle Availability by Sex in Arcadia
The most prevalent vehicle ownership categories in Arcadia are males with 2 vehicles (507, accounting for 30.7%) and females with 2 vehicles (319, making up 41.2%).
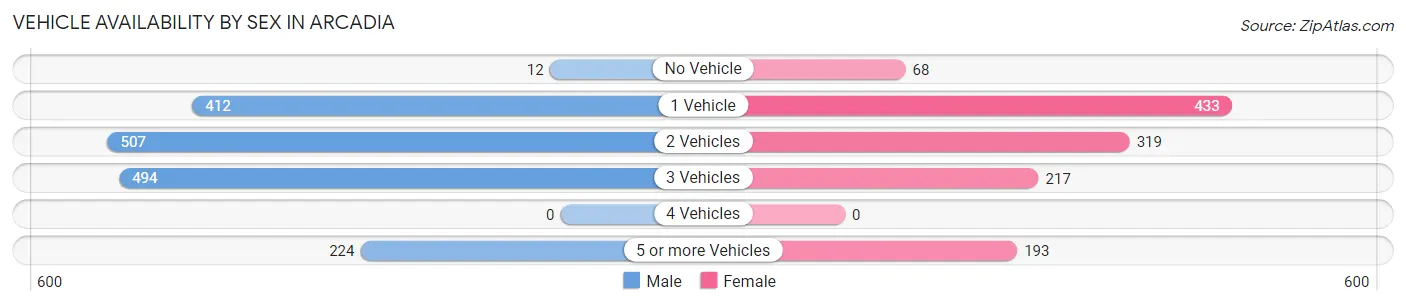
| Vehicles Available | Male | Female |
| No Vehicle | 12 (0.7%) | 68 (5.5%) |
| 1 Vehicle | 412 (25.0%) | 433 (35.2%) |
| 2 Vehicles | 507 (30.7%) | 319 (25.9%) |
| 3 Vehicles | 494 (30.0%) | 217 (17.6%) |
| 4 Vehicles | 0 (0.0%) | 0 (0.0%) |
| 5 or more Vehicles | 224 (13.6%) | 193 (15.7%) |
| Total | 1,649 (100.0%) | 1,230 (100.0%) |
Commute Time in Arcadia
The most frequently occuring commute durations in Arcadia are 5 to 9 minutes (840 commuters, 29.0%), 60 to 89 minutes (545 commuters, 18.8%), and 15 to 19 minutes (308 commuters, 10.6%).
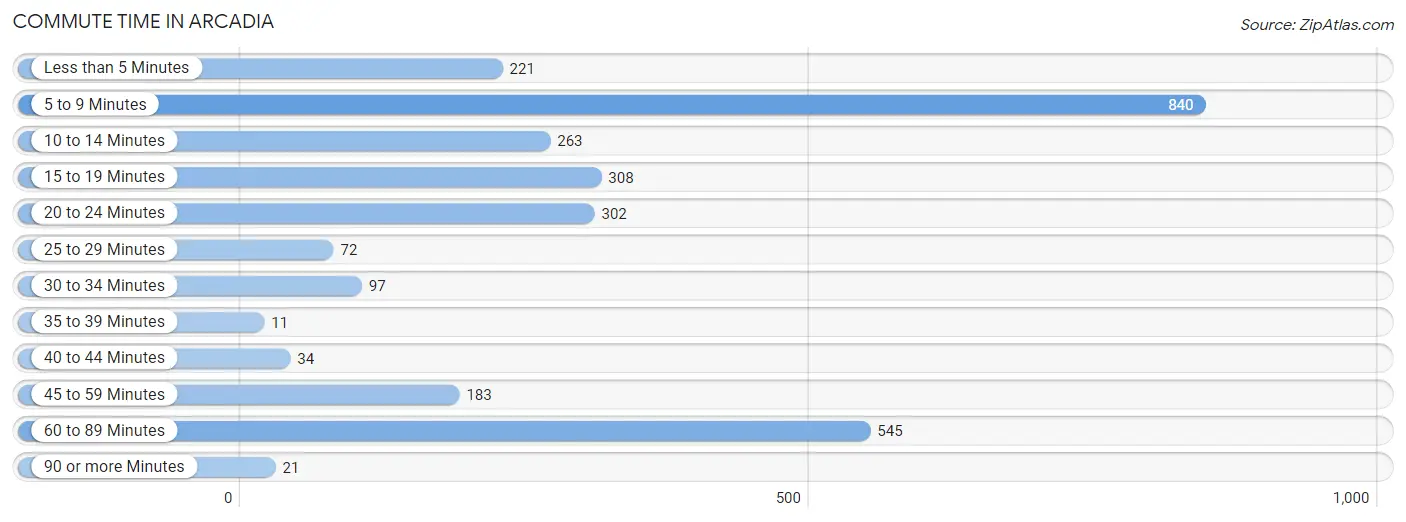
| Commute Time | # Commuters | % Commuters |
| Less than 5 Minutes | 221 | 7.6% |
| 5 to 9 Minutes | 840 | 29.0% |
| 10 to 14 Minutes | 263 | 9.1% |
| 15 to 19 Minutes | 308 | 10.6% |
| 20 to 24 Minutes | 302 | 10.4% |
| 25 to 29 Minutes | 72 | 2.5% |
| 30 to 34 Minutes | 97 | 3.4% |
| 35 to 39 Minutes | 11 | 0.4% |
| 40 to 44 Minutes | 34 | 1.2% |
| 45 to 59 Minutes | 183 | 6.3% |
| 60 to 89 Minutes | 545 | 18.8% |
| 90 or more Minutes | 21 | 0.7% |
Commute Time by Sex in Arcadia
The most common commute times in Arcadia are 60 to 89 minutes (503 commuters, 30.4%) for males and 5 to 9 minutes (460 commuters, 37.0%) for females.
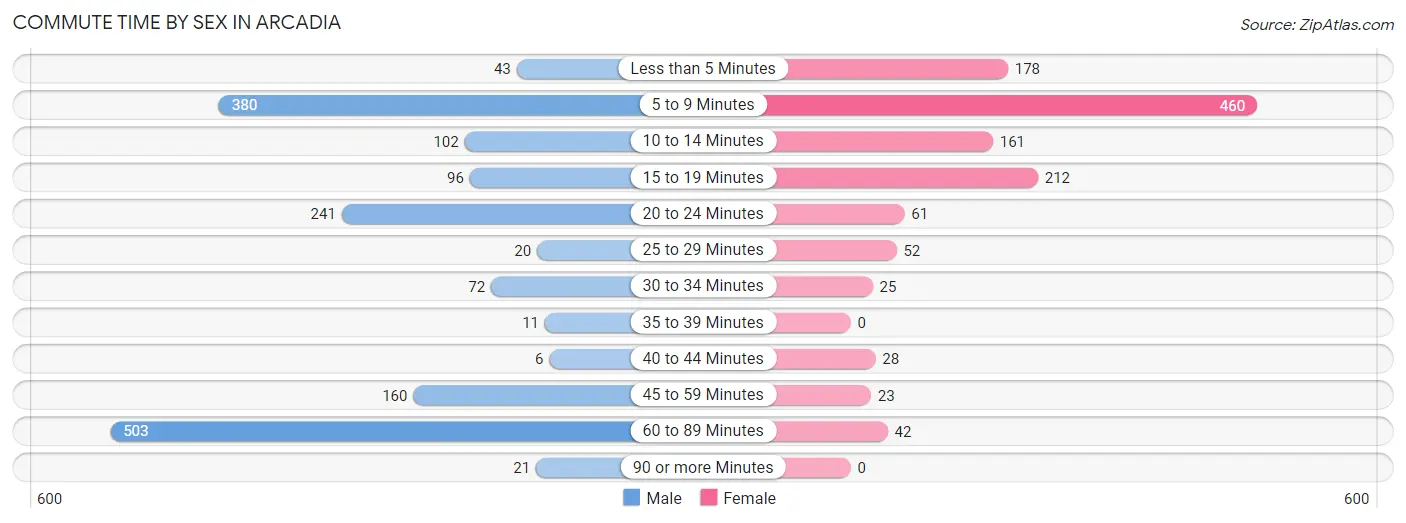
| Commute Time | Male | Female |
| Less than 5 Minutes | 43 (2.6%) | 178 (14.3%) |
| 5 to 9 Minutes | 380 (23.0%) | 460 (37.0%) |
| 10 to 14 Minutes | 102 (6.2%) | 161 (13.0%) |
| 15 to 19 Minutes | 96 (5.8%) | 212 (17.1%) |
| 20 to 24 Minutes | 241 (14.6%) | 61 (4.9%) |
| 25 to 29 Minutes | 20 (1.2%) | 52 (4.2%) |
| 30 to 34 Minutes | 72 (4.3%) | 25 (2.0%) |
| 35 to 39 Minutes | 11 (0.7%) | 0 (0.0%) |
| 40 to 44 Minutes | 6 (0.4%) | 28 (2.2%) |
| 45 to 59 Minutes | 160 (9.7%) | 23 (1.8%) |
| 60 to 89 Minutes | 503 (30.4%) | 42 (3.4%) |
| 90 or more Minutes | 21 (1.3%) | 0 (0.0%) |
Time of Departure to Work by Sex in Arcadia
The most frequent times of departure to work in Arcadia are 5:30 AM to 5:59 AM (519, 31.4%) for males and 8:00 AM to 8:29 AM (413, 33.3%) for females.
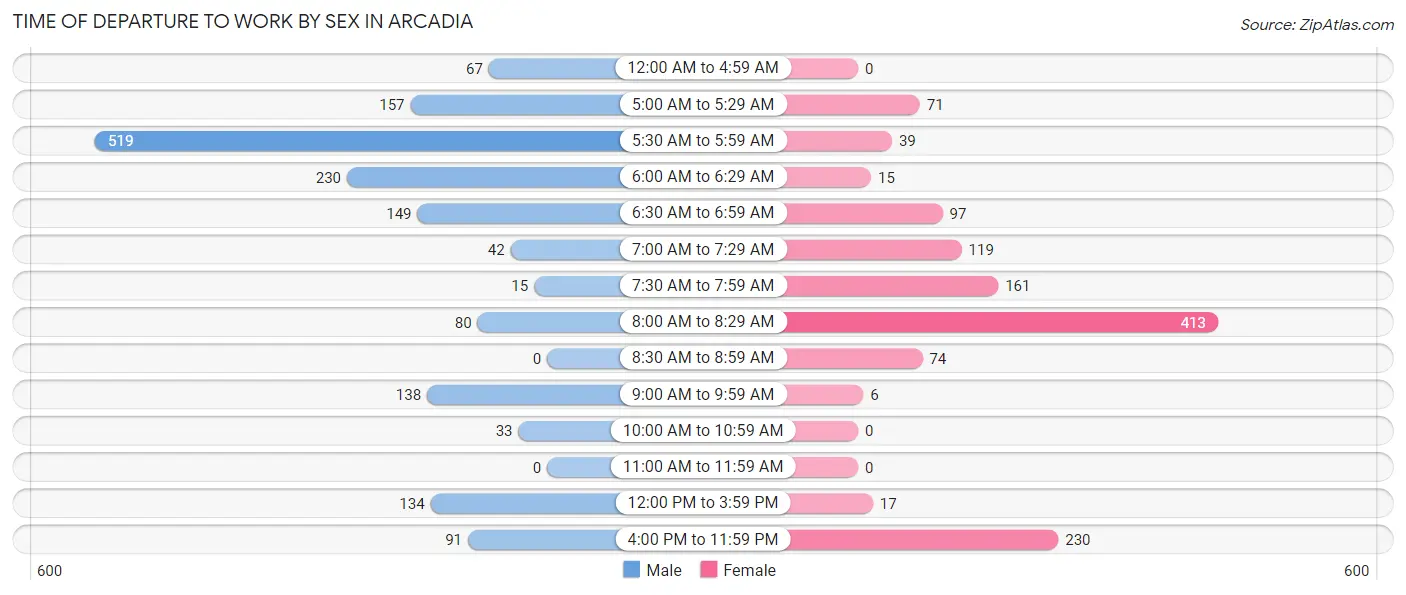
| Time of Departure | Male | Female |
| 12:00 AM to 4:59 AM | 67 (4.1%) | 0 (0.0%) |
| 5:00 AM to 5:29 AM | 157 (9.5%) | 71 (5.7%) |
| 5:30 AM to 5:59 AM | 519 (31.4%) | 39 (3.1%) |
| 6:00 AM to 6:29 AM | 230 (13.9%) | 15 (1.2%) |
| 6:30 AM to 6:59 AM | 149 (9.0%) | 97 (7.8%) |
| 7:00 AM to 7:29 AM | 42 (2.5%) | 119 (9.6%) |
| 7:30 AM to 7:59 AM | 15 (0.9%) | 161 (13.0%) |
| 8:00 AM to 8:29 AM | 80 (4.8%) | 413 (33.3%) |
| 8:30 AM to 8:59 AM | 0 (0.0%) | 74 (6.0%) |
| 9:00 AM to 9:59 AM | 138 (8.3%) | 6 (0.5%) |
| 10:00 AM to 10:59 AM | 33 (2.0%) | 0 (0.0%) |
| 11:00 AM to 11:59 AM | 0 (0.0%) | 0 (0.0%) |
| 12:00 PM to 3:59 PM | 134 (8.1%) | 17 (1.4%) |
| 4:00 PM to 11:59 PM | 91 (5.5%) | 230 (18.5%) |
| Total | 1,655 (100.0%) | 1,242 (100.0%) |
Housing Occupancy in Arcadia
Occupancy by Ownership in Arcadia
Of the total 3,015 dwellings in Arcadia, owner-occupied units account for 1,592 (52.8%), while renter-occupied units make up 1,423 (47.2%).
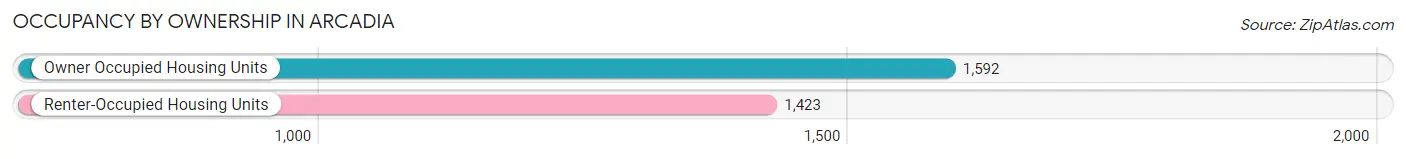
| Occupancy | # Housing Units | % Housing Units |
| Owner Occupied Housing Units | 1,592 | 52.8% |
| Renter-Occupied Housing Units | 1,423 | 47.2% |
| Total Occupied Housing Units | 3,015 | 100.0% |
Occupancy by Household Size in Arcadia
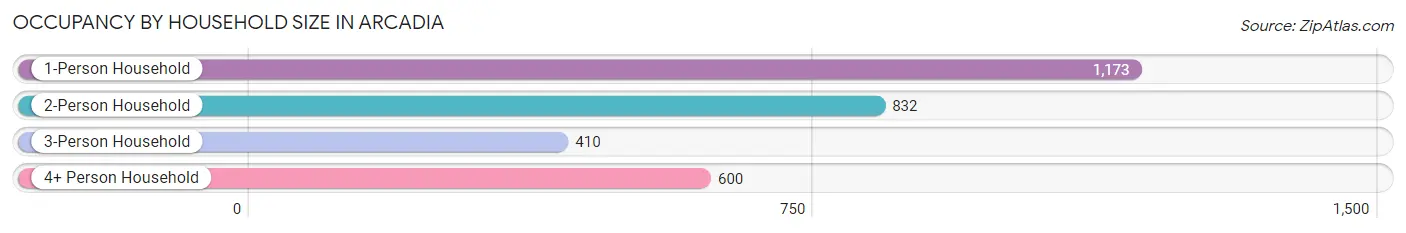
| Household Size | # Housing Units | % Housing Units |
| 1-Person Household | 1,173 | 38.9% |
| 2-Person Household | 832 | 27.6% |
| 3-Person Household | 410 | 13.6% |
| 4+ Person Household | 600 | 19.9% |
| Total Housing Units | 3,015 | 100.0% |
Occupancy by Ownership by Household Size in Arcadia
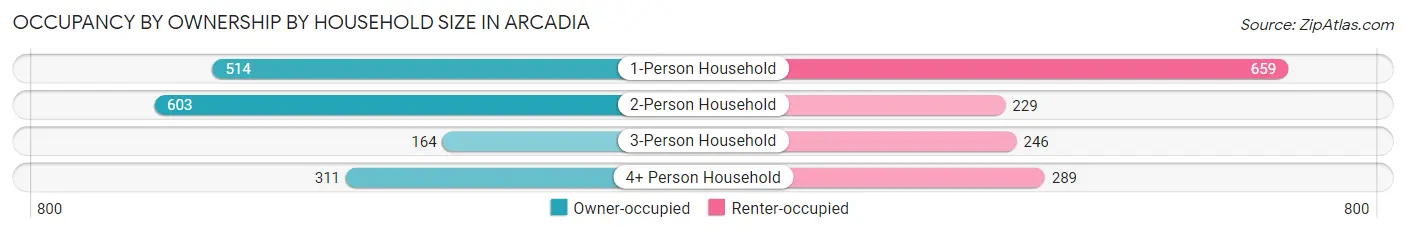
| Household Size | Owner-occupied | Renter-occupied |
| 1-Person Household | 514 (43.8%) | 659 (56.2%) |
| 2-Person Household | 603 (72.5%) | 229 (27.5%) |
| 3-Person Household | 164 (40.0%) | 246 (60.0%) |
| 4+ Person Household | 311 (51.8%) | 289 (48.2%) |
| Total Housing Units | 1,592 (52.8%) | 1,423 (47.2%) |
Occupancy by Educational Attainment in Arcadia
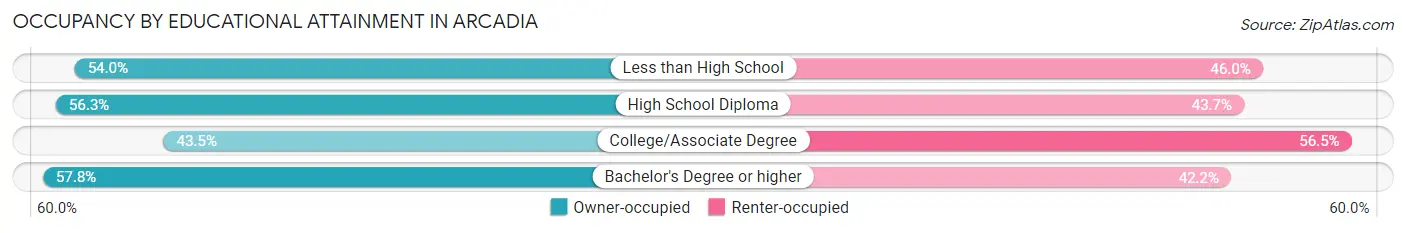
| Household Size | Owner-occupied | Renter-occupied |
| Less than High School | 402 (54.0%) | 342 (46.0%) |
| High School Diploma | 597 (56.3%) | 464 (43.7%) |
| College/Associate Degree | 323 (43.5%) | 420 (56.5%) |
| Bachelor's Degree or higher | 270 (57.8%) | 197 (42.2%) |
Occupancy by Age of Householder in Arcadia
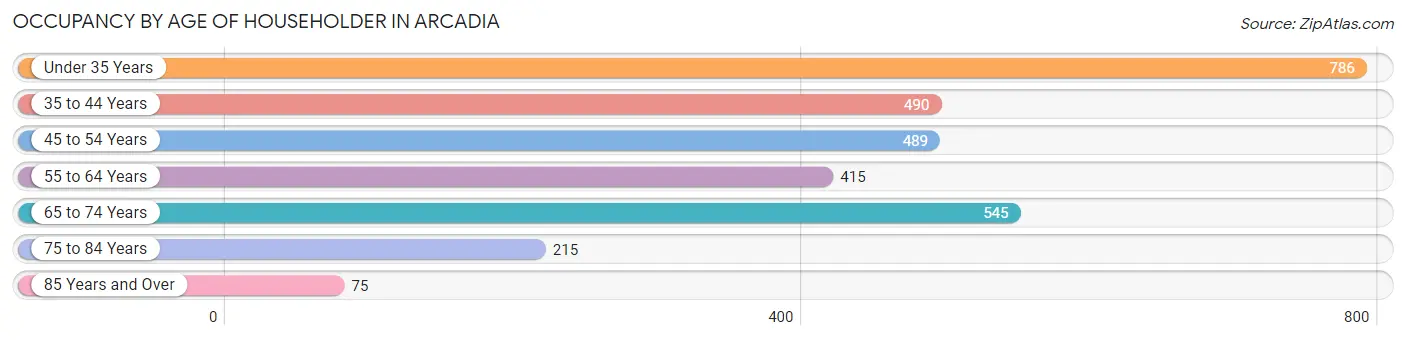
| Age Bracket | # Households | % Households |
| Under 35 Years | 786 | 26.1% |
| 35 to 44 Years | 490 | 16.3% |
| 45 to 54 Years | 489 | 16.2% |
| 55 to 64 Years | 415 | 13.8% |
| 65 to 74 Years | 545 | 18.1% |
| 75 to 84 Years | 215 | 7.1% |
| 85 Years and Over | 75 | 2.5% |
| Total | 3,015 | 100.0% |
Housing Finances in Arcadia
Median Income by Occupancy in Arcadia
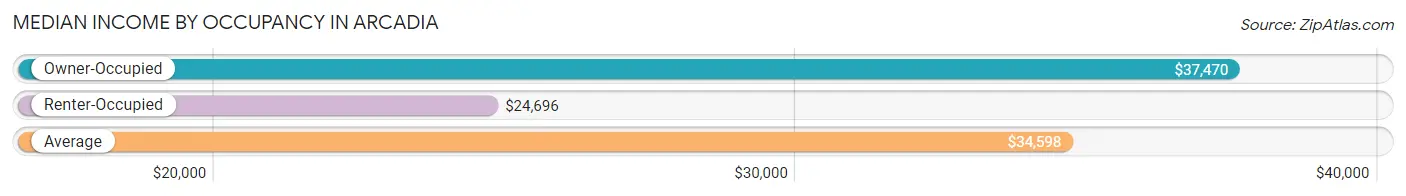
| Occupancy Type | # Households | Median Income |
| Owner-Occupied | 1,592 (52.8%) | $37,470 |
| Renter-Occupied | 1,423 (47.2%) | $24,696 |
| Average | 3,015 (100.0%) | $34,598 |
Occupancy by Householder Income Bracket in Arcadia
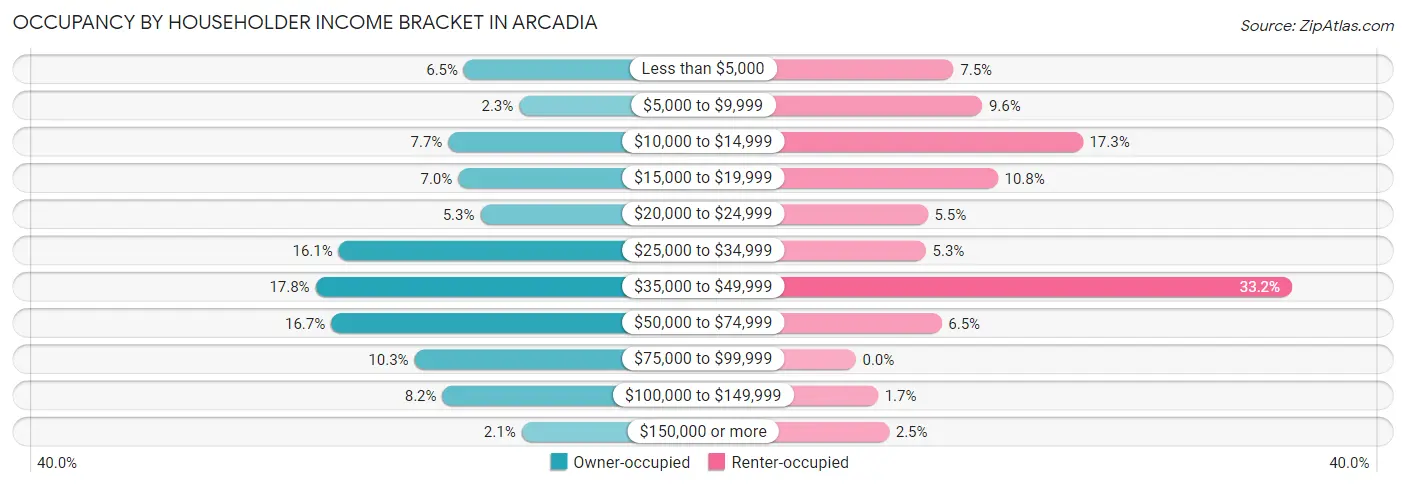
| Income Bracket | Owner-occupied | Renter-occupied |
| Less than $5,000 | 104 (6.5%) | 106 (7.4%) |
| $5,000 to $9,999 | 37 (2.3%) | 137 (9.6%) |
| $10,000 to $14,999 | 123 (7.7%) | 246 (17.3%) |
| $15,000 to $19,999 | 111 (7.0%) | 154 (10.8%) |
| $20,000 to $24,999 | 84 (5.3%) | 78 (5.5%) |
| $25,000 to $34,999 | 256 (16.1%) | 76 (5.3%) |
| $35,000 to $49,999 | 284 (17.8%) | 473 (33.2%) |
| $50,000 to $74,999 | 265 (16.7%) | 93 (6.5%) |
| $75,000 to $99,999 | 164 (10.3%) | 0 (0.0%) |
| $100,000 to $149,999 | 130 (8.2%) | 24 (1.7%) |
| $150,000 or more | 34 (2.1%) | 36 (2.5%) |
| Total | 1,592 (100.0%) | 1,423 (100.0%) |
Monthly Housing Cost Tiers in Arcadia
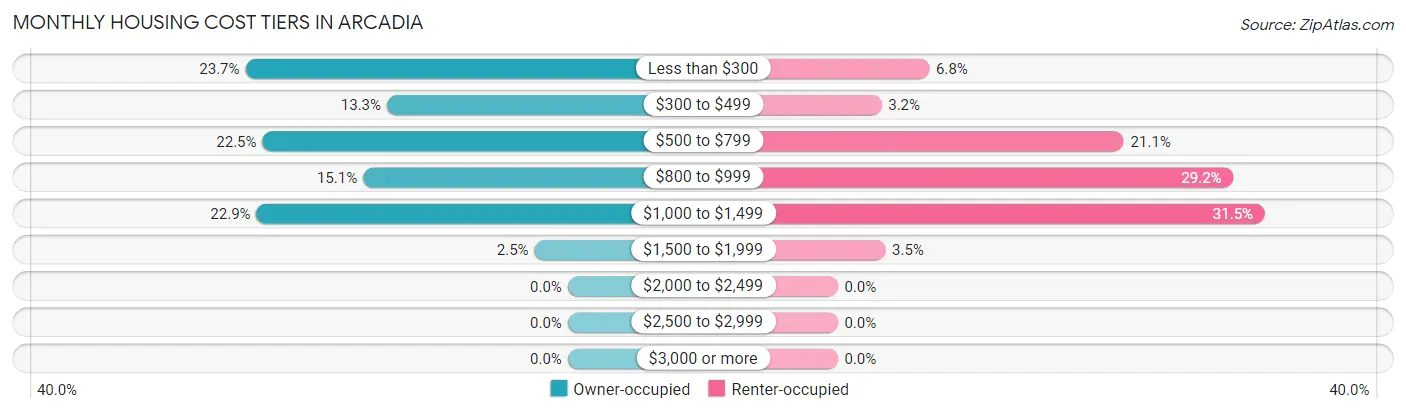
| Monthly Cost | Owner-occupied | Renter-occupied |
| Less than $300 | 378 (23.7%) | 96 (6.8%) |
| $300 to $499 | 212 (13.3%) | 46 (3.2%) |
| $500 to $799 | 358 (22.5%) | 300 (21.1%) |
| $800 to $999 | 240 (15.1%) | 415 (29.2%) |
| $1,000 to $1,499 | 365 (22.9%) | 448 (31.5%) |
| $1,500 to $1,999 | 39 (2.5%) | 50 (3.5%) |
| $2,000 to $2,499 | 0 (0.0%) | 0 (0.0%) |
| $2,500 to $2,999 | 0 (0.0%) | 0 (0.0%) |
| $3,000 or more | 0 (0.0%) | 0 (0.0%) |
| Total | 1,592 (100.0%) | 1,423 (100.0%) |
Physical Housing Characteristics in Arcadia
Housing Structures in Arcadia
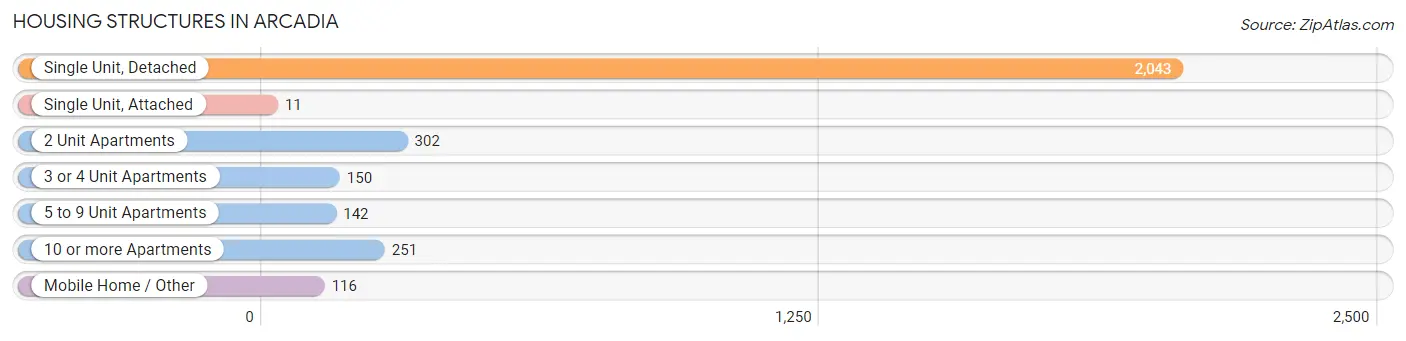
| Structure Type | # Housing Units | % Housing Units |
| Single Unit, Detached | 2,043 | 67.8% |
| Single Unit, Attached | 11 | 0.4% |
| 2 Unit Apartments | 302 | 10.0% |
| 3 or 4 Unit Apartments | 150 | 5.0% |
| 5 to 9 Unit Apartments | 142 | 4.7% |
| 10 or more Apartments | 251 | 8.3% |
| Mobile Home / Other | 116 | 3.8% |
| Total | 3,015 | 100.0% |
Housing Structures by Occupancy in Arcadia
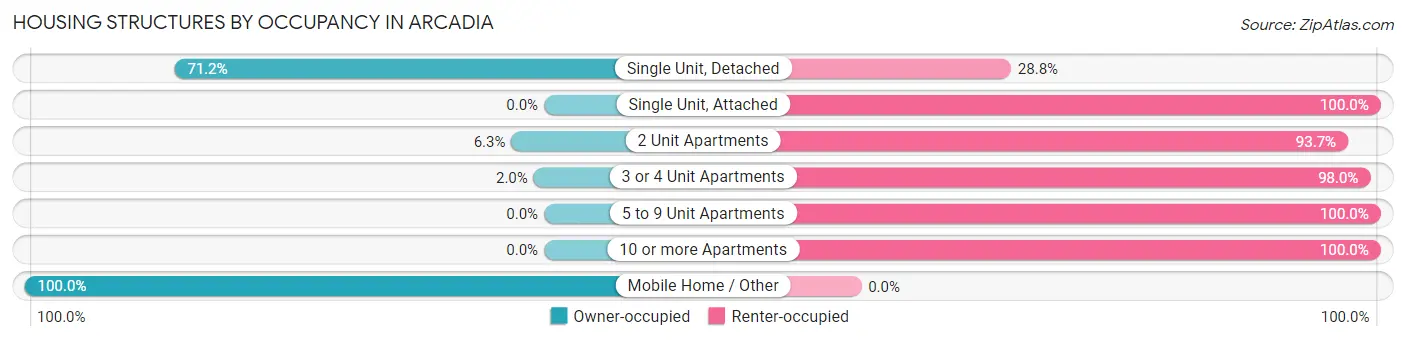
| Structure Type | Owner-occupied | Renter-occupied |
| Single Unit, Detached | 1,454 (71.2%) | 589 (28.8%) |
| Single Unit, Attached | 0 (0.0%) | 11 (100.0%) |
| 2 Unit Apartments | 19 (6.3%) | 283 (93.7%) |
| 3 or 4 Unit Apartments | 3 (2.0%) | 147 (98.0%) |
| 5 to 9 Unit Apartments | 0 (0.0%) | 142 (100.0%) |
| 10 or more Apartments | 0 (0.0%) | 251 (100.0%) |
| Mobile Home / Other | 116 (100.0%) | 0 (0.0%) |
| Total | 1,592 (52.8%) | 1,423 (47.2%) |
Housing Structures by Number of Rooms in Arcadia
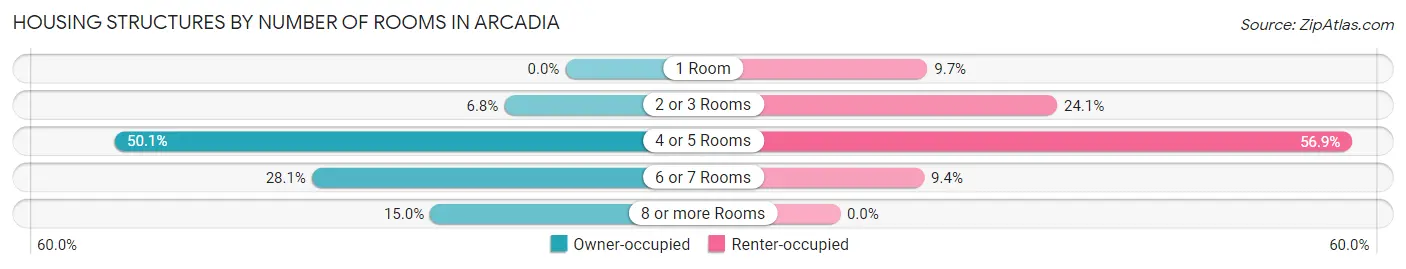
| Number of Rooms | Owner-occupied | Renter-occupied |
| 1 Room | 0 (0.0%) | 138 (9.7%) |
| 2 or 3 Rooms | 108 (6.8%) | 343 (24.1%) |
| 4 or 5 Rooms | 797 (50.1%) | 809 (56.9%) |
| 6 or 7 Rooms | 448 (28.1%) | 133 (9.3%) |
| 8 or more Rooms | 239 (15.0%) | 0 (0.0%) |
| Total | 1,592 (100.0%) | 1,423 (100.0%) |
Housing Structure by Heating Type in Arcadia
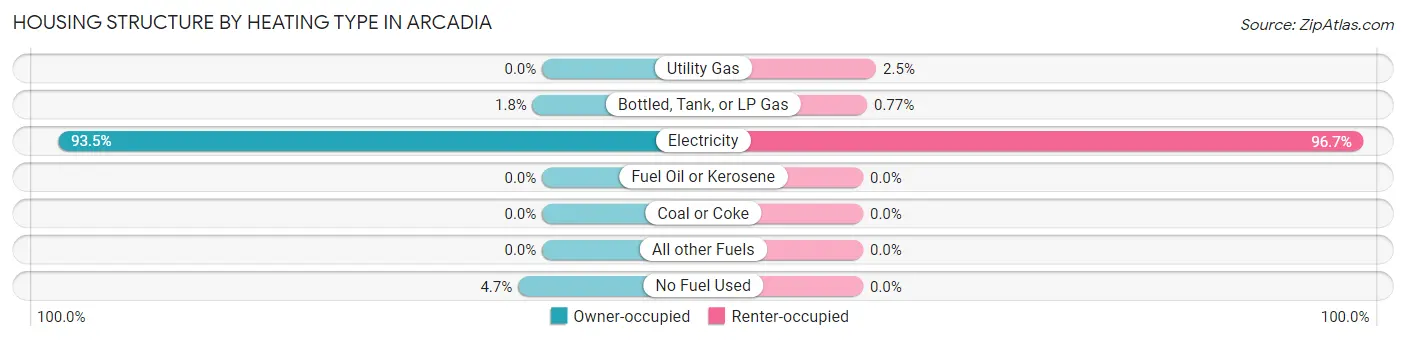
| Heating Type | Owner-occupied | Renter-occupied |
| Utility Gas | 0 (0.0%) | 36 (2.5%) |
| Bottled, Tank, or LP Gas | 29 (1.8%) | 11 (0.8%) |
| Electricity | 1,489 (93.5%) | 1,376 (96.7%) |
| Fuel Oil or Kerosene | 0 (0.0%) | 0 (0.0%) |
| Coal or Coke | 0 (0.0%) | 0 (0.0%) |
| All other Fuels | 0 (0.0%) | 0 (0.0%) |
| No Fuel Used | 74 (4.6%) | 0 (0.0%) |
| Total | 1,592 (100.0%) | 1,423 (100.0%) |
Household Vehicle Usage in Arcadia
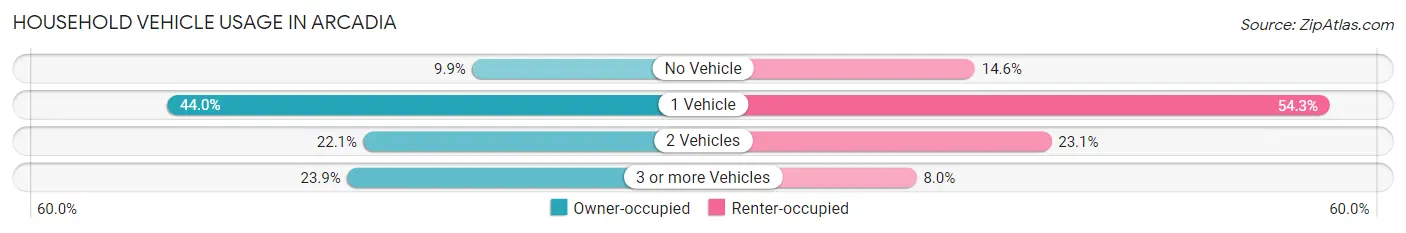
| Vehicles per Household | Owner-occupied | Renter-occupied |
| No Vehicle | 158 (9.9%) | 207 (14.5%) |
| 1 Vehicle | 701 (44.0%) | 773 (54.3%) |
| 2 Vehicles | 352 (22.1%) | 329 (23.1%) |
| 3 or more Vehicles | 381 (23.9%) | 114 (8.0%) |
| Total | 1,592 (100.0%) | 1,423 (100.0%) |
Real Estate & Mortgages in Arcadia
Real Estate and Mortgage Overview in Arcadia
| Characteristic | Without Mortgage | With Mortgage |
| Housing Units | 822 | 770 |
| Median Property Value | $128,100 | $158,100 |
| Median Household Income | $27,398 | $28 |
| Monthly Housing Costs | $339 | $0 |
| Real Estate Taxes | $861 | $30 |
Property Value by Mortgage Status in Arcadia
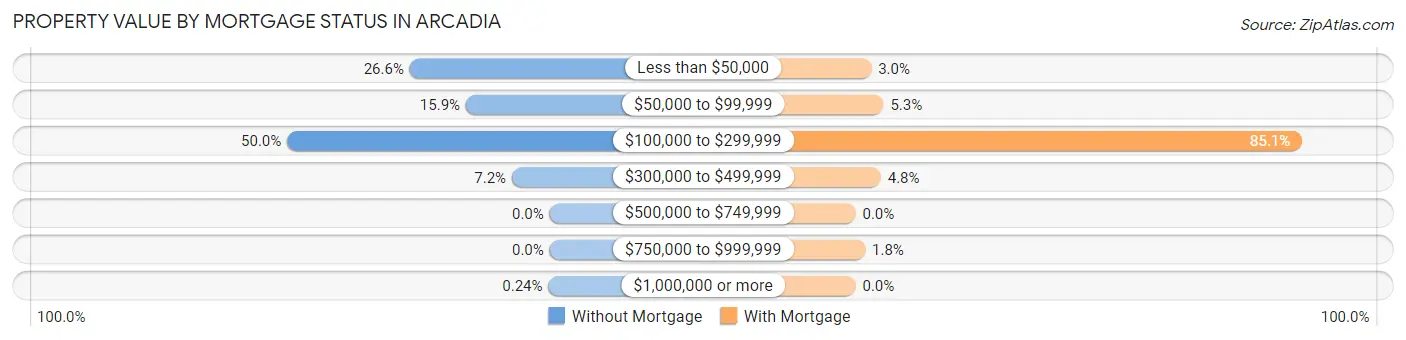
| Property Value | Without Mortgage | With Mortgage |
| Less than $50,000 | 219 (26.6%) | 23 (3.0%) |
| $50,000 to $99,999 | 131 (15.9%) | 41 (5.3%) |
| $100,000 to $299,999 | 411 (50.0%) | 655 (85.1%) |
| $300,000 to $499,999 | 59 (7.2%) | 37 (4.8%) |
| $500,000 to $749,999 | 0 (0.0%) | 0 (0.0%) |
| $750,000 to $999,999 | 0 (0.0%) | 14 (1.8%) |
| $1,000,000 or more | 2 (0.2%) | 0 (0.0%) |
| Total | 822 (100.0%) | 770 (100.0%) |
Household Income by Mortgage Status in Arcadia
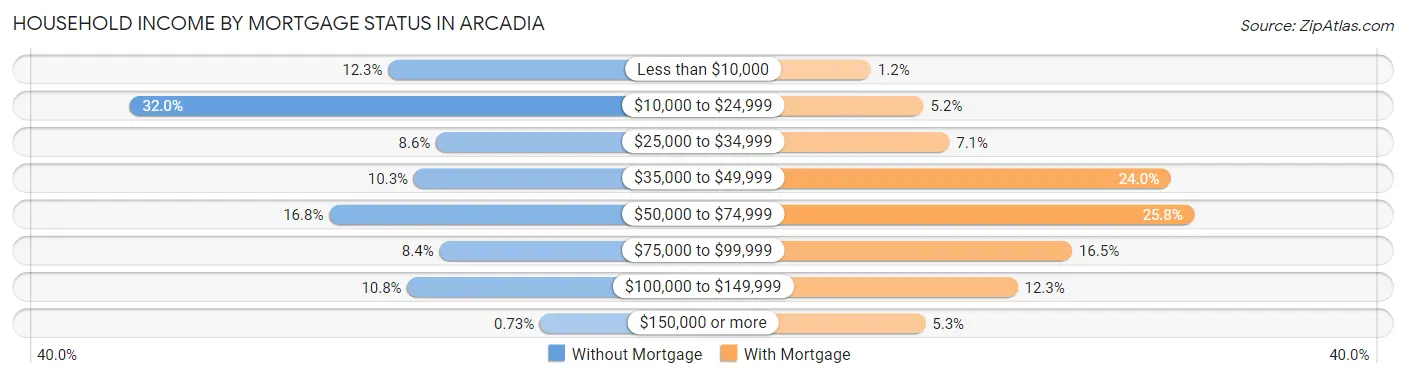
| Household Income | Without Mortgage | With Mortgage |
| Less than $10,000 | 101 (12.3%) | 9 (1.2%) |
| $10,000 to $24,999 | 263 (32.0%) | 40 (5.2%) |
| $25,000 to $34,999 | 71 (8.6%) | 55 (7.1%) |
| $35,000 to $49,999 | 85 (10.3%) | 185 (24.0%) |
| $50,000 to $74,999 | 138 (16.8%) | 199 (25.8%) |
| $75,000 to $99,999 | 69 (8.4%) | 127 (16.5%) |
| $100,000 to $149,999 | 89 (10.8%) | 95 (12.3%) |
| $150,000 or more | 6 (0.7%) | 41 (5.3%) |
| Total | 822 (100.0%) | 770 (100.0%) |
Property Value to Household Income Ratio in Arcadia
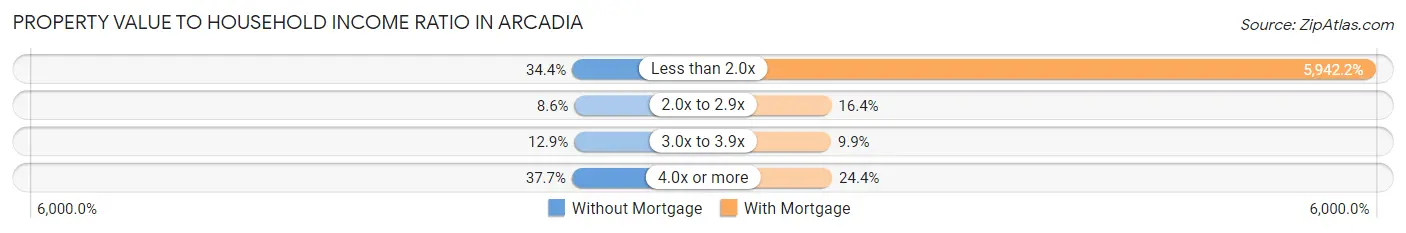
| Value-to-Income Ratio | Without Mortgage | With Mortgage |
| Less than 2.0x | 283 (34.4%) | 45,755 (5,942.2%) |
| 2.0x to 2.9x | 71 (8.6%) | 126 (16.4%) |
| 3.0x to 3.9x | 106 (12.9%) | 76 (9.9%) |
| 4.0x or more | 310 (37.7%) | 188 (24.4%) |
| Total | 822 (100.0%) | 770 (100.0%) |
Real Estate Taxes by Mortgage Status in Arcadia
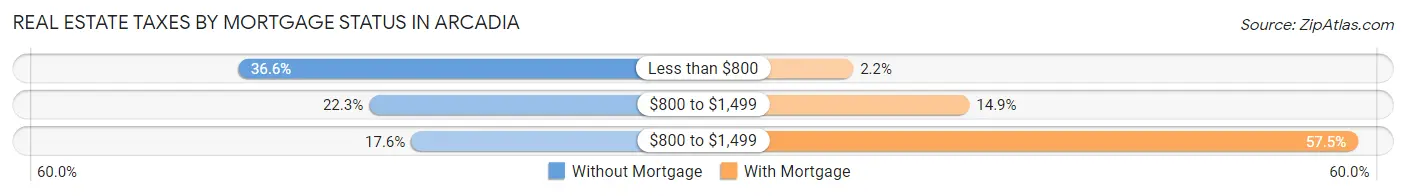
| Property Taxes | Without Mortgage | With Mortgage |
| Less than $800 | 301 (36.6%) | 17 (2.2%) |
| $800 to $1,499 | 183 (22.3%) | 115 (14.9%) |
| $800 to $1,499 | 145 (17.6%) | 443 (57.5%) |
| Total | 822 (100.0%) | 770 (100.0%) |
Health & Disability in Arcadia
Health Insurance Coverage by Age in Arcadia
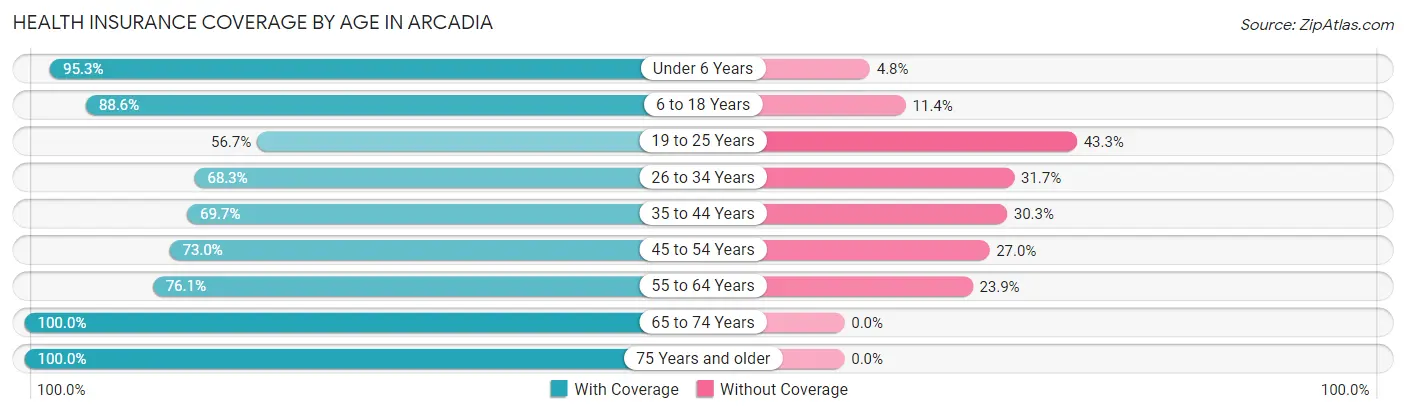
| Age Bracket | With Coverage | Without Coverage |
| Under 6 Years | 521 (95.3%) | 26 (4.8%) |
| 6 to 18 Years | 1,185 (88.6%) | 153 (11.4%) |
| 19 to 25 Years | 549 (56.7%) | 420 (43.3%) |
| 26 to 34 Years | 611 (68.3%) | 283 (31.7%) |
| 35 to 44 Years | 536 (69.7%) | 233 (30.3%) |
| 45 to 54 Years | 678 (73.0%) | 251 (27.0%) |
| 55 to 64 Years | 538 (76.1%) | 169 (23.9%) |
| 65 to 74 Years | 677 (100.0%) | 0 (0.0%) |
| 75 Years and older | 443 (100.0%) | 0 (0.0%) |
| Total | 5,738 (78.9%) | 1,535 (21.1%) |
Health Insurance Coverage by Citizenship Status in Arcadia

| Citizenship Status | With Coverage | Without Coverage |
| Native Born | 521 (95.3%) | 26 (4.8%) |
| Foreign Born, Citizen | 1,185 (88.6%) | 153 (11.4%) |
| Foreign Born, not a Citizen | 549 (56.7%) | 420 (43.3%) |
Health Insurance Coverage by Household Income in Arcadia
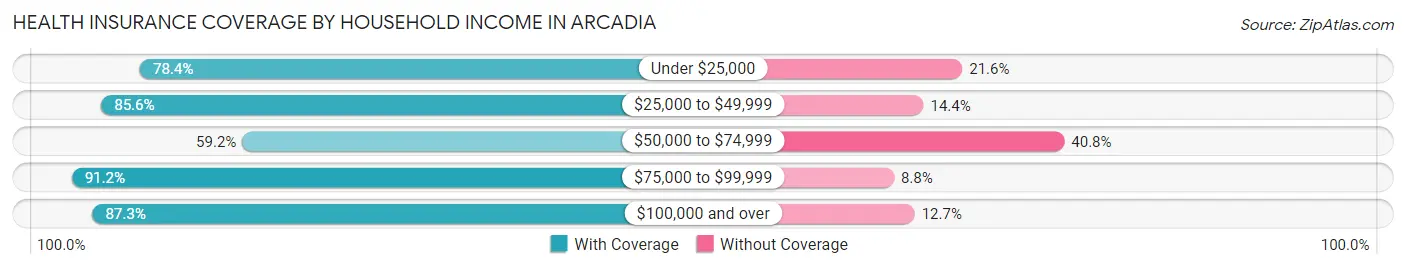
| Household Income | With Coverage | Without Coverage |
| Under $25,000 | 1,568 (78.4%) | 433 (21.6%) |
| $25,000 to $49,999 | 1,971 (85.6%) | 331 (14.4%) |
| $50,000 to $74,999 | 888 (59.2%) | 611 (40.8%) |
| $75,000 to $99,999 | 299 (91.2%) | 29 (8.8%) |
| $100,000 and over | 898 (87.3%) | 131 (12.7%) |
Public vs Private Health Insurance Coverage by Age in Arcadia
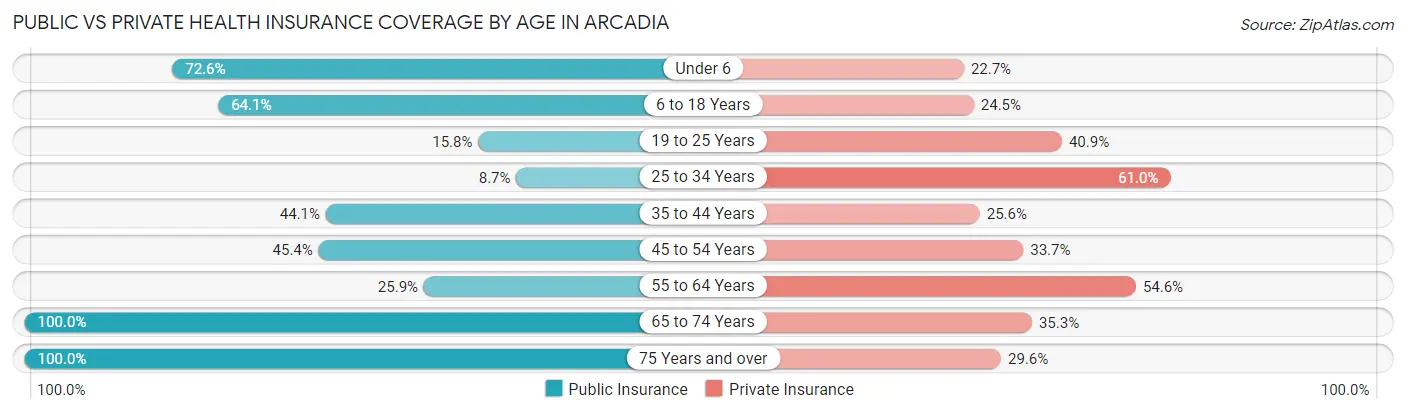
| Age Bracket | Public Insurance | Private Insurance |
| Under 6 | 397 (72.6%) | 124 (22.7%) |
| 6 to 18 Years | 857 (64.0%) | 328 (24.5%) |
| 19 to 25 Years | 153 (15.8%) | 396 (40.9%) |
| 25 to 34 Years | 78 (8.7%) | 545 (61.0%) |
| 35 to 44 Years | 339 (44.1%) | 197 (25.6%) |
| 45 to 54 Years | 422 (45.4%) | 313 (33.7%) |
| 55 to 64 Years | 183 (25.9%) | 386 (54.6%) |
| 65 to 74 Years | 677 (100.0%) | 239 (35.3%) |
| 75 Years and over | 443 (100.0%) | 131 (29.6%) |
| Total | 3,549 (48.8%) | 2,659 (36.6%) |
Disability Status by Sex by Age in Arcadia
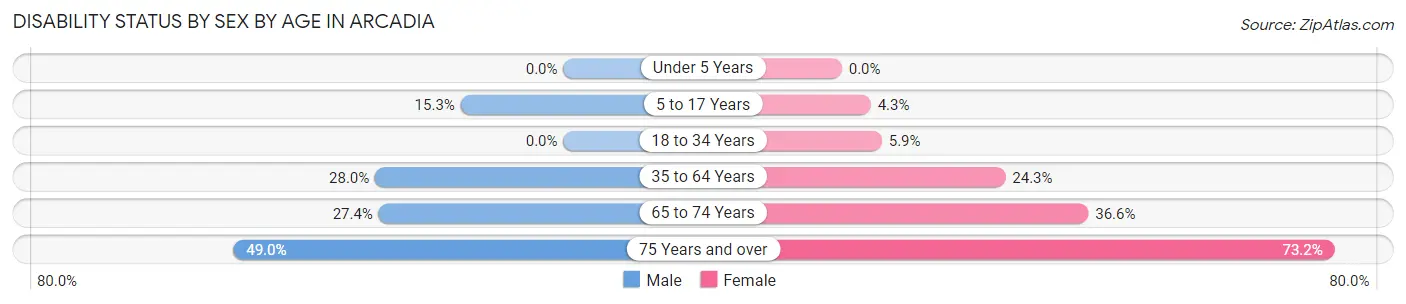
| Age Bracket | Male | Female |
| Under 5 Years | 0 (0.0%) | 0 (0.0%) |
| 5 to 17 Years | 104 (15.2%) | 26 (4.3%) |
| 18 to 34 Years | 0 (0.0%) | 64 (5.9%) |
| 35 to 64 Years | 327 (28.0%) | 300 (24.3%) |
| 65 to 74 Years | 68 (27.4%) | 157 (36.6%) |
| 75 Years and over | 124 (49.0%) | 139 (73.2%) |
Disability Class by Sex by Age in Arcadia
Disability Class: Hearing Difficulty
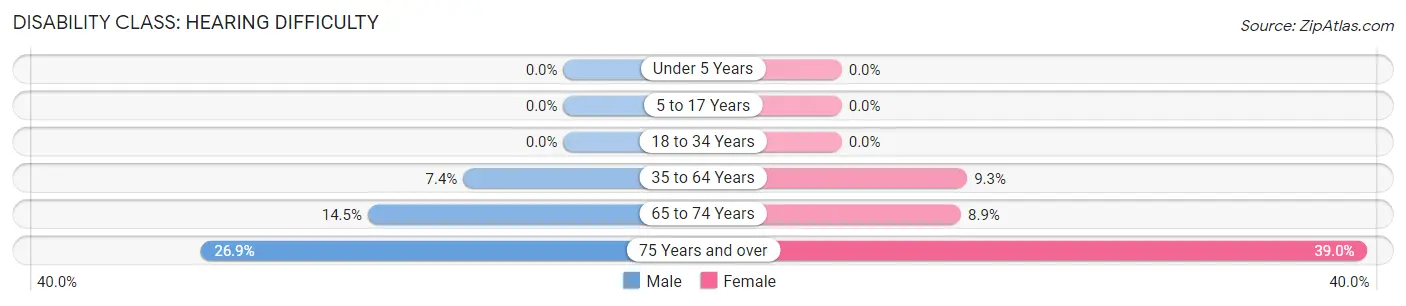
| Age Bracket | Male | Female |
| Under 5 Years | 0 (0.0%) | 0 (0.0%) |
| 5 to 17 Years | 0 (0.0%) | 0 (0.0%) |
| 18 to 34 Years | 0 (0.0%) | 0 (0.0%) |
| 35 to 64 Years | 87 (7.4%) | 115 (9.3%) |
| 65 to 74 Years | 36 (14.5%) | 38 (8.9%) |
| 75 Years and over | 68 (26.9%) | 74 (39.0%) |
Disability Class: Vision Difficulty
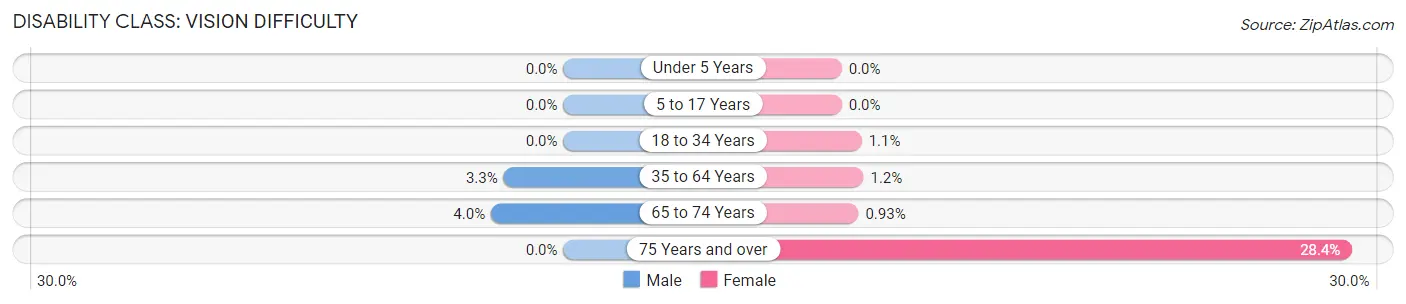
| Age Bracket | Male | Female |
| Under 5 Years | 0 (0.0%) | 0 (0.0%) |
| 5 to 17 Years | 0 (0.0%) | 0 (0.0%) |
| 18 to 34 Years | 0 (0.0%) | 12 (1.1%) |
| 35 to 64 Years | 39 (3.3%) | 15 (1.2%) |
| 65 to 74 Years | 10 (4.0%) | 4 (0.9%) |
| 75 Years and over | 0 (0.0%) | 54 (28.4%) |
Disability Class: Cognitive Difficulty
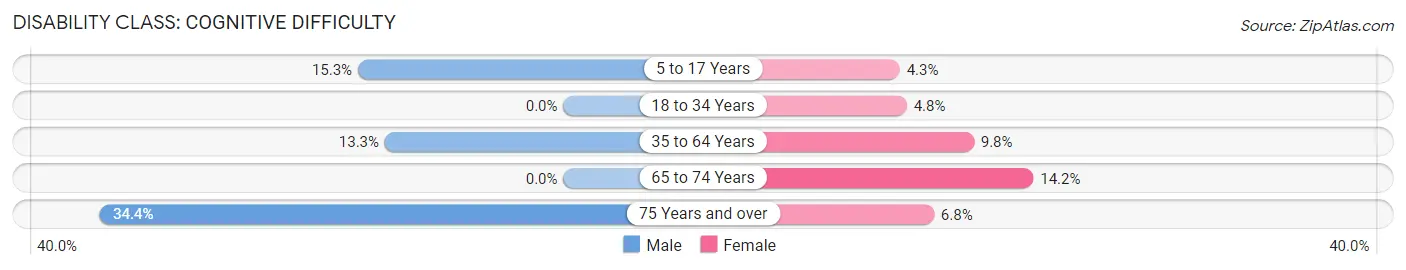
| Age Bracket | Male | Female |
| 5 to 17 Years | 104 (15.2%) | 26 (4.3%) |
| 18 to 34 Years | 0 (0.0%) | 52 (4.8%) |
| 35 to 64 Years | 155 (13.3%) | 121 (9.8%) |
| 65 to 74 Years | 0 (0.0%) | 61 (14.2%) |
| 75 Years and over | 87 (34.4%) | 13 (6.8%) |
Disability Class: Ambulatory Difficulty
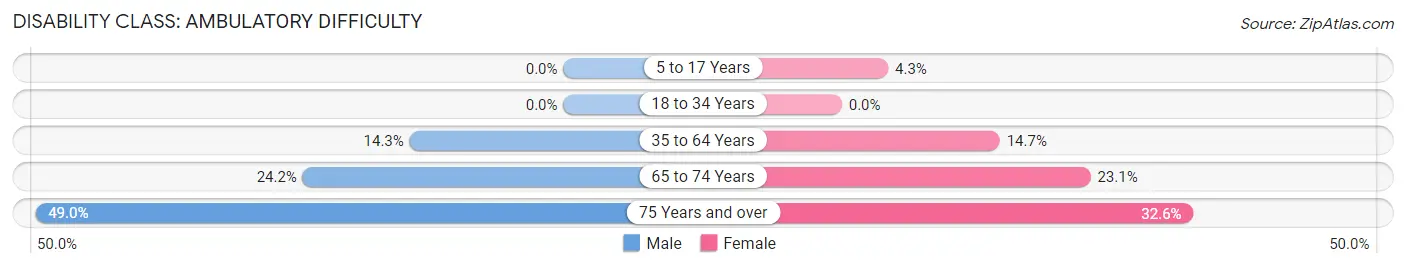
| Age Bracket | Male | Female |
| 5 to 17 Years | 0 (0.0%) | 26 (4.3%) |
| 18 to 34 Years | 0 (0.0%) | 0 (0.0%) |
| 35 to 64 Years | 167 (14.3%) | 181 (14.7%) |
| 65 to 74 Years | 60 (24.2%) | 99 (23.1%) |
| 75 Years and over | 124 (49.0%) | 62 (32.6%) |
Disability Class: Self-Care Difficulty
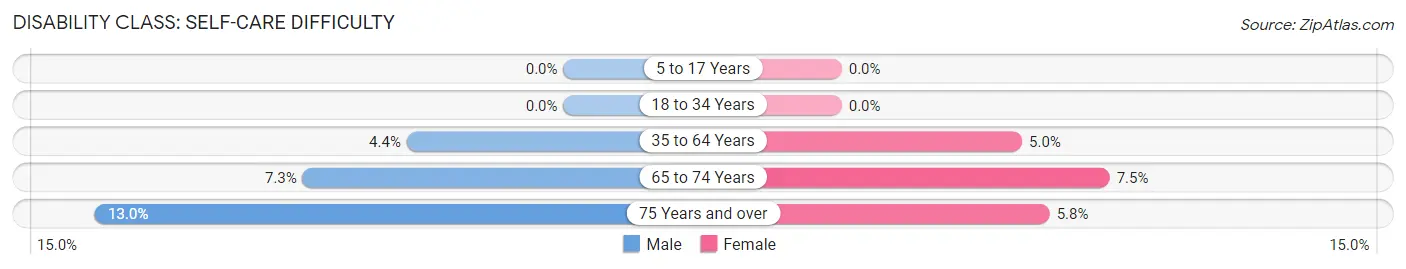
| Age Bracket | Male | Female |
| 5 to 17 Years | 0 (0.0%) | 0 (0.0%) |
| 18 to 34 Years | 0 (0.0%) | 0 (0.0%) |
| 35 to 64 Years | 51 (4.4%) | 62 (5.0%) |
| 65 to 74 Years | 18 (7.3%) | 32 (7.5%) |
| 75 Years and over | 33 (13.0%) | 11 (5.8%) |
Technology Access in Arcadia
Computing Device Access in Arcadia
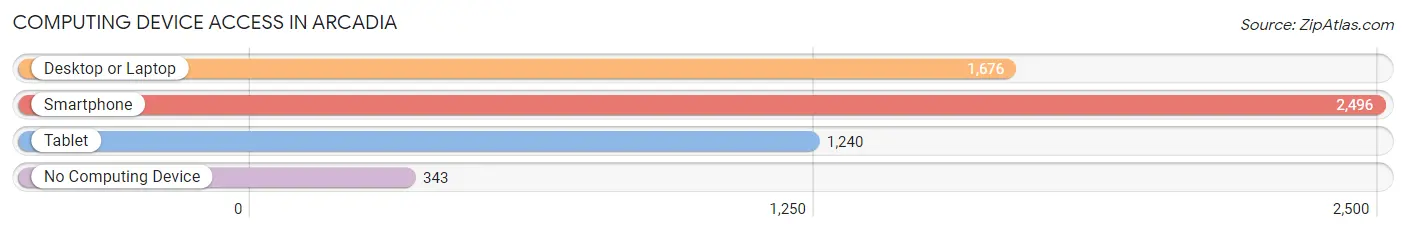
| Device Type | # Households | % Households |
| Desktop or Laptop | 1,676 | 55.6% |
| Smartphone | 2,496 | 82.8% |
| Tablet | 1,240 | 41.1% |
| No Computing Device | 343 | 11.4% |
| Total | 3,015 | 100.0% |
Internet Access in Arcadia
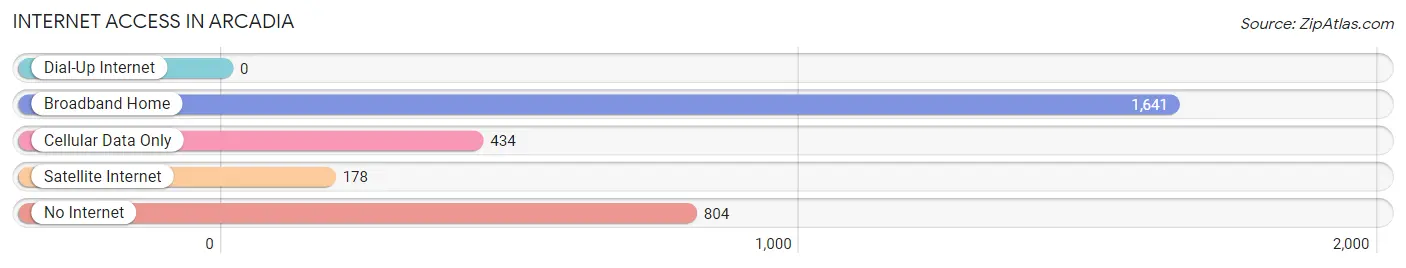
| Internet Type | # Households | % Households |
| Dial-Up Internet | 0 | 0.0% |
| Broadband Home | 1,641 | 54.4% |
| Cellular Data Only | 434 | 14.4% |
| Satellite Internet | 178 | 5.9% |
| No Internet | 804 | 26.7% |
| Total | 3,015 | 100.0% |
Arcadia Summary
Arcadia, Florida is a small city located in DeSoto County, Florida. It is situated in the heart of the state, approximately halfway between Tampa and Fort Myers. The city is known for its historic downtown area, which is home to a variety of shops, restaurants, and other attractions. Arcadia is also home to a number of parks and recreational areas, making it a popular destination for outdoor enthusiasts.
History
Arcadia was founded in 1883 by a group of settlers from Arcadia, Indiana. The city was named after the Greek city of Arcadia, which was known for its beauty and tranquility. The settlers were attracted to the area due to its abundant natural resources, including timber and phosphate. The city was incorporated in 1887 and quickly grew to become a major center for the phosphate industry.
Geography
Arcadia is located in the center of DeSoto County, Florida. It is situated approximately halfway between Tampa and Fort Myers. The city is bordered by the Peace River to the north, the Myakka River to the east, and the Charlotte Harbor to the south. The city covers an area of approximately 8.5 square miles and has a population of approximately 7,000 people.
The city is located in a flat, low-lying area, with an elevation of just over 100 feet. The climate is subtropical, with hot, humid summers and mild winters. The average annual temperature is around 75 degrees Fahrenheit.
Economy
Arcadia’s economy is largely based on agriculture and tourism. The city is home to a number of large farms, which produce a variety of crops, including citrus, vegetables, and hay. The city is also home to a number of tourist attractions, including the Peace River Wildlife Center, the Arcadia Historic District, and the DeSoto County Fairgrounds.
The city is also home to a number of manufacturing and industrial businesses, including a phosphate processing plant and a paper mill. The city is also home to a number of retail stores, restaurants, and other businesses.
Demographics
As of the 2010 census, Arcadia had a population of 7,637 people. The racial makeup of the city was 79.2% White, 15.3% African American, 0.4% Native American, 0.7% Asian, 0.1% Pacific Islander, and 4.3% from other races. Hispanic or Latino of any race were 11.3% of the population.
The median household income in Arcadia was $31,945, and the median family income was $41,945. The per capita income for the city was $17,845. About 17.2% of families and 21.2% of the population were below the poverty line, including 28.2% of those under age 18 and 14.2% of those age 65 or over.
Arcadia is a small city with a rich history and a vibrant economy. It is home to a variety of attractions, businesses, and recreational areas, making it a popular destination for tourists and residents alike. The city is also home to a diverse population, with a variety of racial and ethnic backgrounds.
Common Questions
What is Per Capita Income in Arcadia?
Per Capita income in Arcadia is $18,504.
What is the Median Family Income in Arcadia?
Median Family Income in Arcadia is $38,039.
What is the Median Household income in Arcadia?
Median Household Income in Arcadia is $34,598.
What is Income or Wage Gap in Arcadia?
Income or Wage Gap in Arcadia is 26.6%.
Women in Arcadia earn 73.4 cents for every dollar earned by a man.
What is Family Income Deficit in Arcadia?
Family Income Deficit in Arcadia is $14,482.
Families that are below poverty line in Arcadia earn $14,482 less on average than the poverty threshold level.
What is Inequality or Gini Index in Arcadia?
Inequality or Gini Index in Arcadia is 0.45.
What is the Total Population of Arcadia?
Total Population of Arcadia is 7,480.
What is the Total Male Population of Arcadia?
Total Male Population of Arcadia is 3,576.
What is the Total Female Population of Arcadia?
Total Female Population of Arcadia is 3,904.
What is the Ratio of Males per 100 Females in Arcadia?
There are 91.60 Males per 100 Females in Arcadia.
What is the Ratio of Females per 100 Males in Arcadia?
There are 109.17 Females per 100 Males in Arcadia.
What is the Median Population Age in Arcadia?
Median Population Age in Arcadia is 34.1 Years.
What is the Average Family Size in Arcadia
Average Family Size in Arcadia is 3.1 People.
What is the Average Household Size in Arcadia
Average Household Size in Arcadia is 2.4 People.
How Large is the Labor Force in Arcadia?
There are 3,421 People in the Labor Forcein in Arcadia.
What is the Percentage of People in the Labor Force in Arcadia?
58.4% of People are in the Labor Force in Arcadia.
What is the Unemployment Rate in Arcadia?
Unemployment Rate in Arcadia is 8.3%.