Alva, FL Map & Demographics
Alva Map
Alva Overview
$38,966
PER CAPITA INCOME
$97,637
AVG FAMILY INCOME
$81,361
AVG HOUSEHOLD INCOME
42.4%
WAGE / INCOME GAP [ % ]
57.6¢/ $1
WAGE / INCOME GAP [ $ ]
$10,386
FAMILY INCOME DEFICIT
0.40
INEQUALITY / GINI INDEX
2,986
TOTAL POPULATION
1,573
MALE POPULATION
1,413
FEMALE POPULATION
111.32
MALES / 100 FEMALES
89.83
FEMALES / 100 MALES
52.6
MEDIAN AGE
2.9
AVG FAMILY SIZE
2.5
AVG HOUSEHOLD SIZE
1,236
LABOR FORCE [ PEOPLE ]
49.1%
PERCENT IN LABOR FORCE
0.9%
UNEMPLOYMENT RATE
Alva Zip Codes
Alva Area Codes
Income in Alva
Income Overview in Alva
Per Capita Income in Alva is $38,966, while median incomes of families and households are $97,637 and $81,361 respectively.
| Characteristic | Number | Measure |
| Per Capita Income | 2,986 | $38,966 |
| Median Family Income | 827 | $97,637 |
| Mean Family Income | 827 | $110,611 |
| Median Household Income | 1,201 | $81,361 |
| Mean Household Income | 1,201 | $92,785 |
| Income Deficit | 827 | $10,386 |
| Wage / Income Gap (%) | 2,986 | 42.38% |
| Wage / Income Gap ($) | 2,986 | 57.62¢ per $1 |
| Gini / Inequality Index | 2,986 | 0.40 |
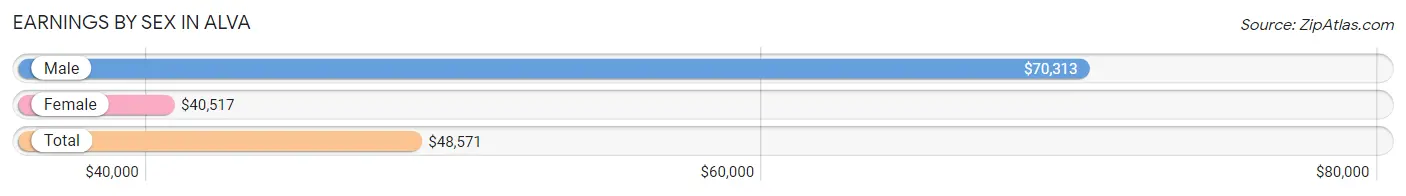
Earnings by Sex in Alva
Average Earnings in Alva are $48,571, $70,313 for men and $40,517 for women, a difference of 42.4%.
| Sex | Number | Average Earnings |
| Male | 645 (47.5%) | $70,313 |
| Female | 713 (52.5%) | $40,517 |
| Total | 1,358 (100.0%) | $48,571 |
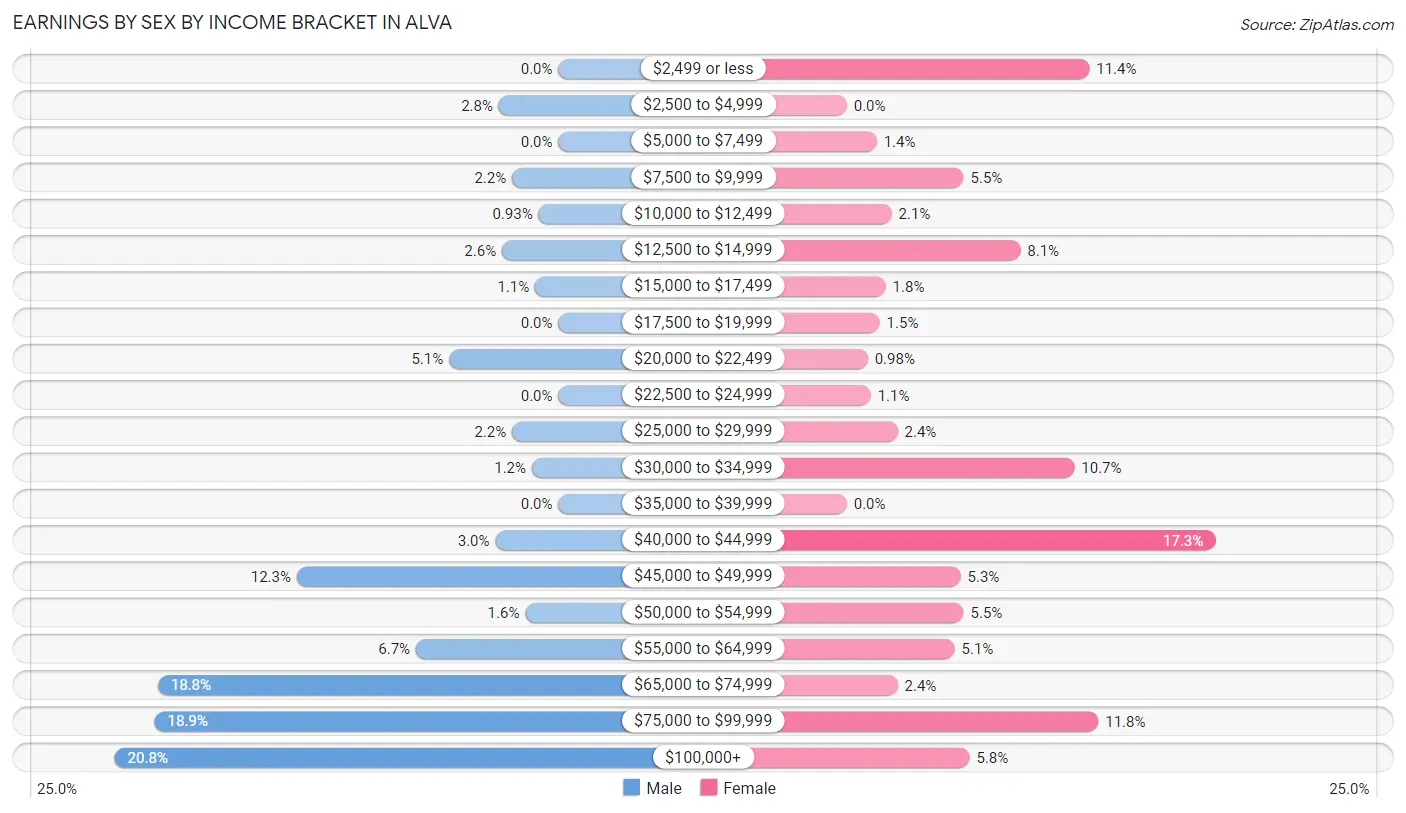
Earnings by Sex by Income Bracket in Alva
The most common earnings brackets in Alva are $100,000+ for men (134 | 20.8%) and $40,000 to $44,999 for women (123 | 17.2%).
| Income | Male | Female |
| $2,499 or less | 0 (0.0%) | 81 (11.4%) |
| $2,500 to $4,999 | 18 (2.8%) | 0 (0.0%) |
| $5,000 to $7,499 | 0 (0.0%) | 10 (1.4%) |
| $7,500 to $9,999 | 14 (2.2%) | 39 (5.5%) |
| $10,000 to $12,499 | 6 (0.9%) | 15 (2.1%) |
| $12,500 to $14,999 | 17 (2.6%) | 58 (8.1%) |
| $15,000 to $17,499 | 7 (1.1%) | 13 (1.8%) |
| $17,500 to $19,999 | 0 (0.0%) | 11 (1.5%) |
| $20,000 to $22,499 | 33 (5.1%) | 7 (1.0%) |
| $22,500 to $24,999 | 0 (0.0%) | 8 (1.1%) |
| $25,000 to $29,999 | 14 (2.2%) | 17 (2.4%) |
| $30,000 to $34,999 | 8 (1.2%) | 76 (10.7%) |
| $35,000 to $39,999 | 0 (0.0%) | 0 (0.0%) |
| $40,000 to $44,999 | 19 (2.9%) | 123 (17.2%) |
| $45,000 to $49,999 | 79 (12.2%) | 38 (5.3%) |
| $50,000 to $54,999 | 10 (1.5%) | 39 (5.5%) |
| $55,000 to $64,999 | 43 (6.7%) | 36 (5.1%) |
| $65,000 to $74,999 | 121 (18.8%) | 17 (2.4%) |
| $75,000 to $99,999 | 122 (18.9%) | 84 (11.8%) |
| $100,000+ | 134 (20.8%) | 41 (5.8%) |
| Total | 645 (100.0%) | 713 (100.0%) |
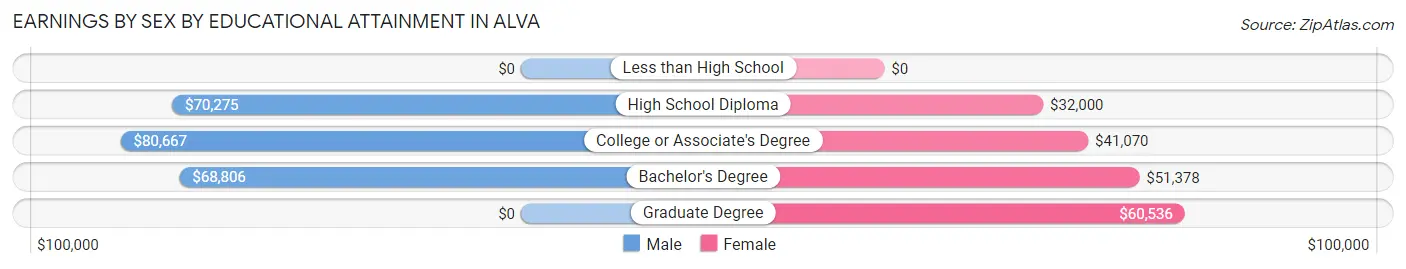
Earnings by Sex by Educational Attainment in Alva
Average earnings in Alva are $70,313 for men and $41,935 for women, a difference of 40.4%. Men with an educational attainment of college or associate's degree enjoy the highest average annual earnings of $80,667, while those with bachelor's degree education earn the least with $68,806. Women with an educational attainment of graduate degree earn the most with the average annual earnings of $60,536, while those with high school diploma education have the smallest earnings of $32,000.
| Educational Attainment | Male Income | Female Income |
| Less than High School | - | - |
| High School Diploma | $70,275 | $32,000 |
| College or Associate's Degree | $80,667 | $41,070 |
| Bachelor's Degree | $68,806 | $51,378 |
| Graduate Degree | - | - |
| Total | $70,313 | $41,935 |
Family Income in Alva
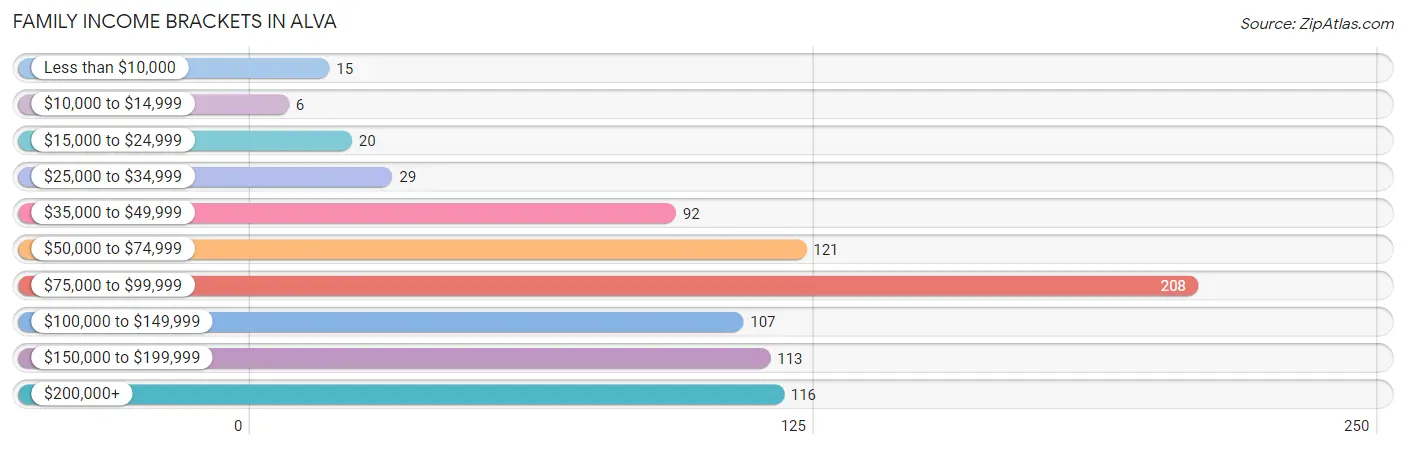
Family Income Brackets in Alva
According to the Alva family income data, there are 208 families falling into the $75,000 to $99,999 income range, which is the most common income bracket and makes up 25.2% of all families. Conversely, the $10,000 to $14,999 income bracket is the least frequent group with only 6 families (0.7%) belonging to this category.
| Income Bracket | # Families | % Families |
| Less than $10,000 | 15 | 1.8% |
| $10,000 to $14,999 | 6 | 0.7% |
| $15,000 to $24,999 | 20 | 2.4% |
| $25,000 to $34,999 | 29 | 3.5% |
| $35,000 to $49,999 | 92 | 11.1% |
| $50,000 to $74,999 | 121 | 14.6% |
| $75,000 to $99,999 | 208 | 25.2% |
| $100,000 to $149,999 | 107 | 12.9% |
| $150,000 to $199,999 | 113 | 13.7% |
| $200,000+ | 116 | 14.0% |
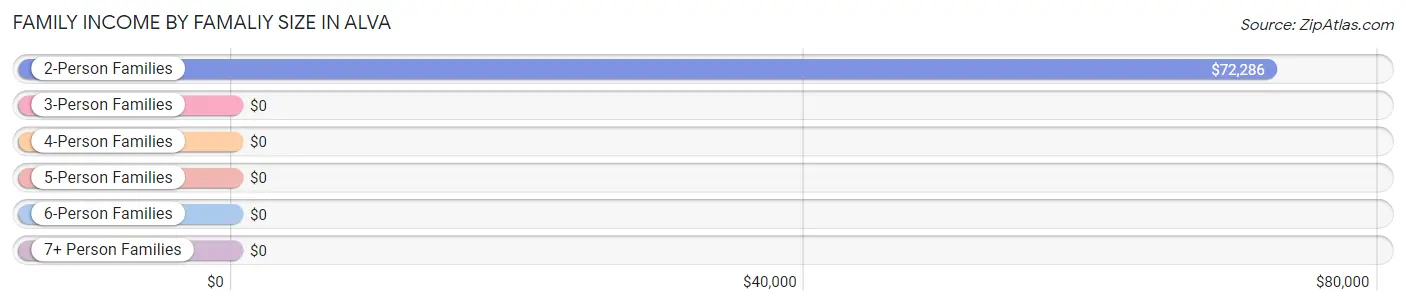
Family Income by Famaliy Size in Alva
2-person families (534 | 64.6%) account for the highest median family income in Alva with $72,286 per family, while 2-person families (534 | 64.6%) have the highest median income of $36,143 per family member.
| Income Bracket | # Families | Median Income |
| 2-Person Families | 534 (64.6%) | $72,286 |
| 3-Person Families | 129 (15.6%) | $0 |
| 4-Person Families | 61 (7.4%) | $0 |
| 5-Person Families | 45 (5.4%) | $0 |
| 6-Person Families | 45 (5.4%) | $0 |
| 7+ Person Families | 13 (1.6%) | $0 |
| Total | 827 (100.0%) | $97,637 |
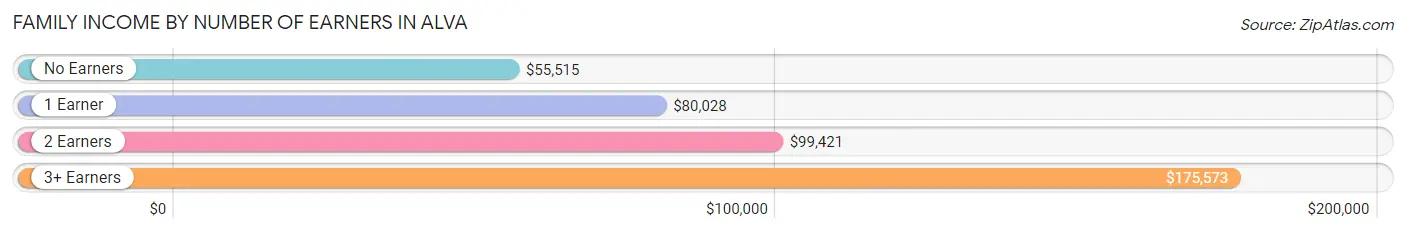
Family Income by Number of Earners in Alva
The median family income in Alva is $97,637, with families comprising 3+ earners (63) having the highest median family income of $175,573, while families with no earners (193) have the lowest median family income of $55,515, accounting for 7.6% and 23.3% of families, respectively.
| Number of Earners | # Families | Median Income |
| No Earners | 193 (23.3%) | $55,515 |
| 1 Earner | 273 (33.0%) | $80,028 |
| 2 Earners | 298 (36.0%) | $99,421 |
| 3+ Earners | 63 (7.6%) | $175,573 |
| Total | 827 (100.0%) | $97,637 |
Household Income in Alva
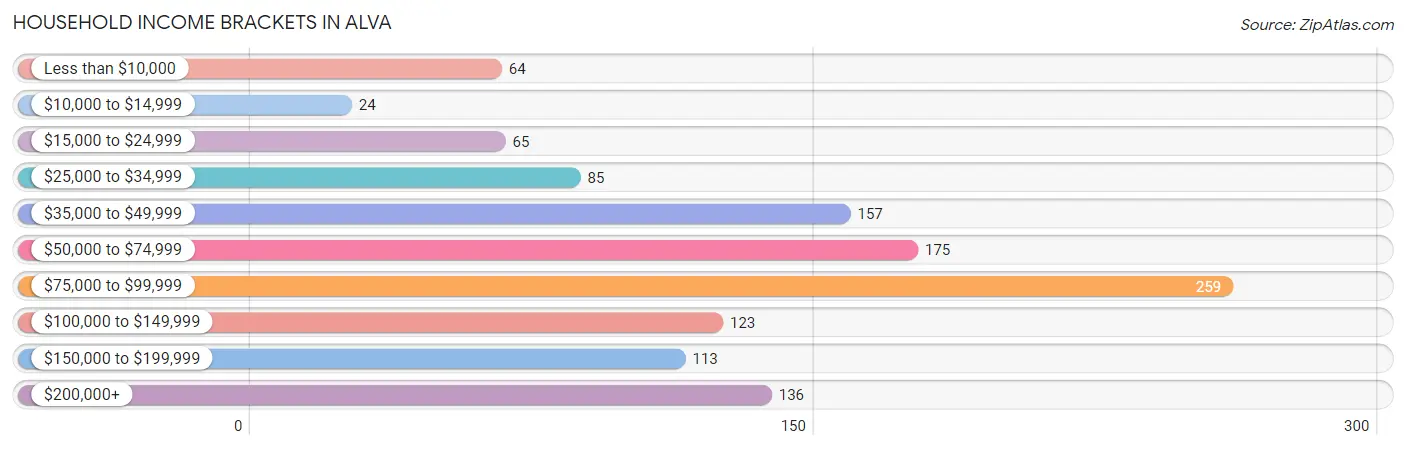
Household Income Brackets in Alva
With 259 households falling in the category, the $75,000 to $99,999 income range is the most frequent in Alva, accounting for 21.6% of all households. In contrast, only 24 households (2.0%) fall into the $10,000 to $14,999 income bracket, making it the least populous group.
| Income Bracket | # Households | % Households |
| Less than $10,000 | 64 | 5.3% |
| $10,000 to $14,999 | 24 | 2.0% |
| $15,000 to $24,999 | 65 | 5.4% |
| $25,000 to $34,999 | 85 | 7.1% |
| $35,000 to $49,999 | 157 | 13.1% |
| $50,000 to $74,999 | 175 | 14.6% |
| $75,000 to $99,999 | 259 | 21.6% |
| $100,000 to $149,999 | 123 | 10.2% |
| $150,000 to $199,999 | 113 | 9.4% |
| $200,000+ | 136 | 11.3% |
Household Income by Householder Age in Alva
The median household income in Alva is $81,361, with the highest median household income of $98,750 found in the 25 to 44 years age bracket for the primary householder. A total of 161 households (13.4%) fall into this category. Meanwhile, the 15 to 24 years age bracket for the primary householder has the lowest median household income of $0, with 30 households (2.5%) in this group.
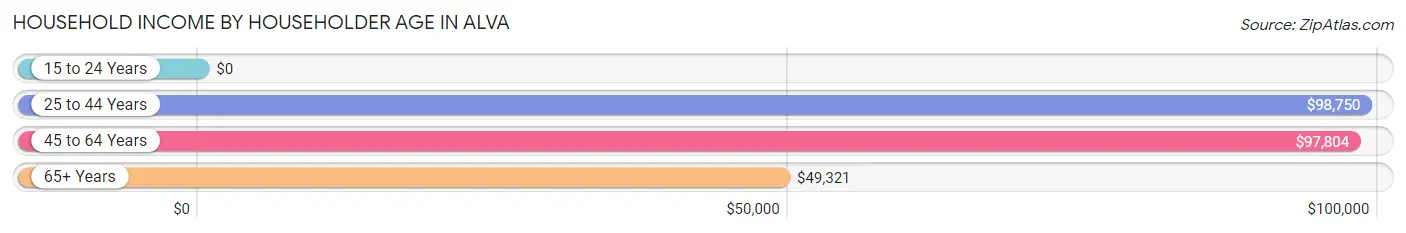
| Income Bracket | # Households | Median Income |
| 15 to 24 Years | 30 (2.5%) | $0 |
| 25 to 44 Years | 161 (13.4%) | $98,750 |
| 45 to 64 Years | 491 (40.9%) | $97,804 |
| 65+ Years | 519 (43.2%) | $49,321 |
| Total | 1,201 (100.0%) | $81,361 |
Poverty in Alva
Income Below Poverty by Sex and Age in Alva
With 4.3% poverty level for males and 8.5% for females among the residents of Alva, 55 to 64 year old males and 75 year old and over females are the most vulnerable to poverty, with 31 males (13.3%) and 28 females (17.5%) in their respective age groups living below the poverty level.
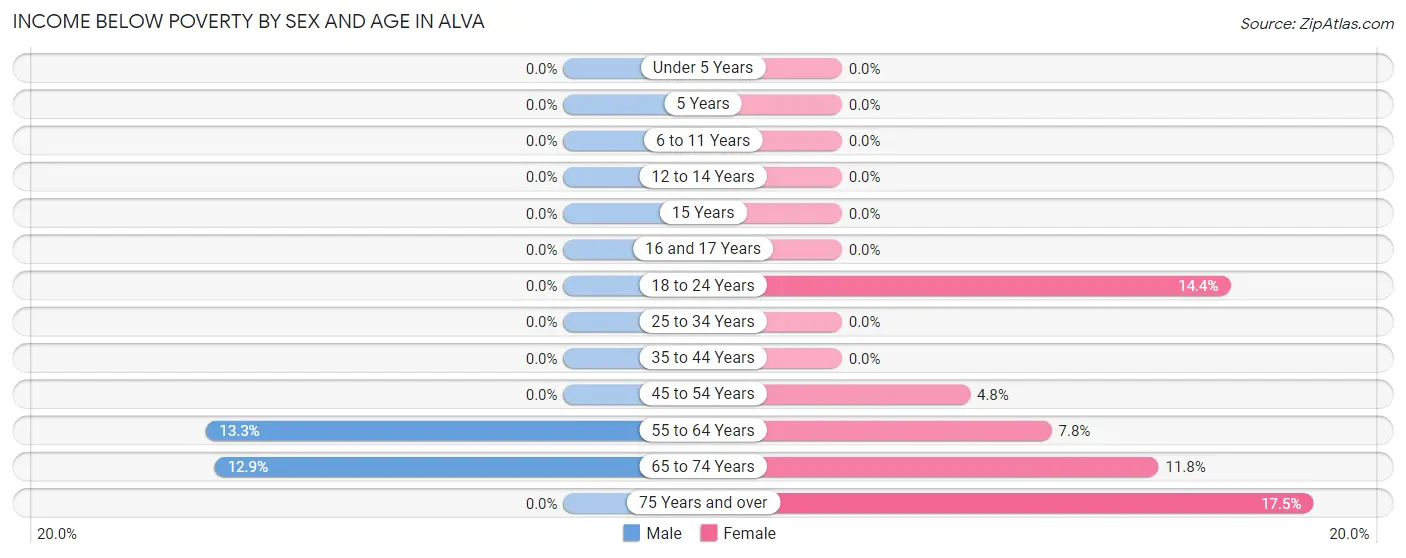
| Age Bracket | Male | Female |
| Under 5 Years | 0 (0.0%) | 0 (0.0%) |
| 5 Years | 0 (0.0%) | 0 (0.0%) |
| 6 to 11 Years | 0 (0.0%) | 0 (0.0%) |
| 12 to 14 Years | 0 (0.0%) | 0 (0.0%) |
| 15 Years | 0 (0.0%) | 0 (0.0%) |
| 16 and 17 Years | 0 (0.0%) | 0 (0.0%) |
| 18 to 24 Years | 0 (0.0%) | 30 (14.4%) |
| 25 to 34 Years | 0 (0.0%) | 0 (0.0%) |
| 35 to 44 Years | 0 (0.0%) | 0 (0.0%) |
| 45 to 54 Years | 0 (0.0%) | 10 (4.8%) |
| 55 to 64 Years | 31 (13.3%) | 12 (7.8%) |
| 65 to 74 Years | 37 (12.9%) | 38 (11.8%) |
| 75 Years and over | 0 (0.0%) | 28 (17.5%) |
| Total | 68 (4.3%) | 118 (8.5%) |
Income Above Poverty by Sex and Age in Alva
According to the poverty statistics in Alva, males aged under 5 years and females aged under 5 years are the age groups that are most secure financially, with 100.0% of males and 100.0% of females in these age groups living above the poverty line.
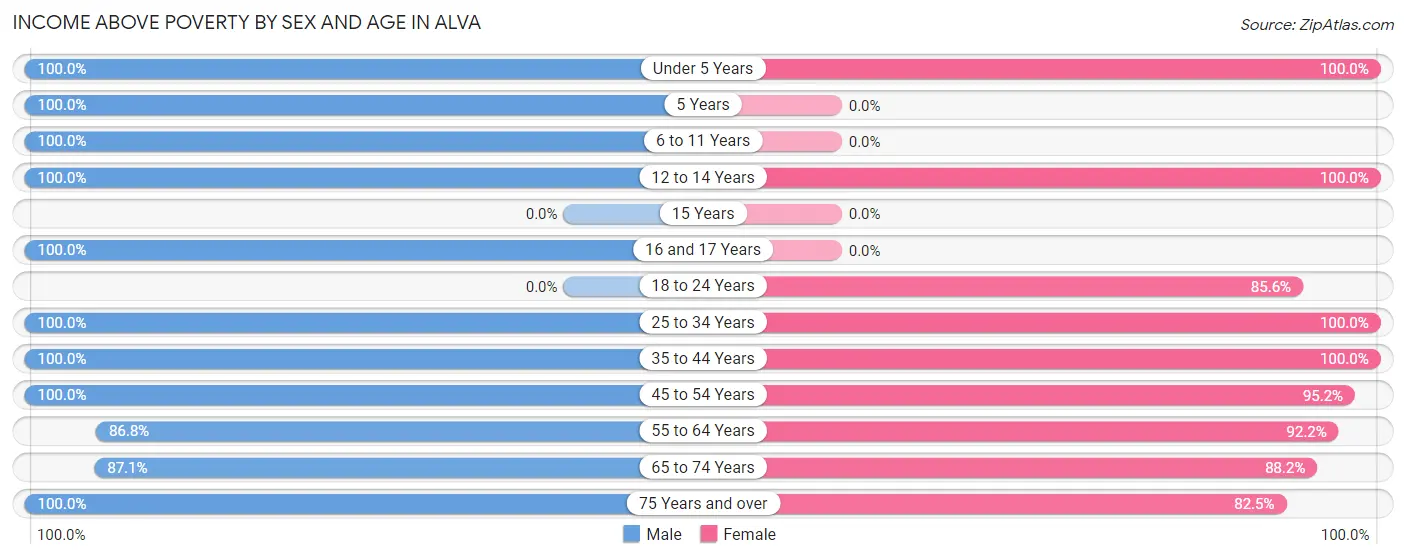
| Age Bracket | Male | Female |
| Under 5 Years | 15 (100.0%) | 37 (100.0%) |
| 5 Years | 87 (100.0%) | 0 (0.0%) |
| 6 to 11 Years | 147 (100.0%) | 0 (0.0%) |
| 12 to 14 Years | 104 (100.0%) | 61 (100.0%) |
| 15 Years | 0 (0.0%) | 0 (0.0%) |
| 16 and 17 Years | 79 (100.0%) | 0 (0.0%) |
| 18 to 24 Years | 0 (0.0%) | 178 (85.6%) |
| 25 to 34 Years | 29 (100.0%) | 26 (100.0%) |
| 35 to 44 Years | 129 (100.0%) | 216 (100.0%) |
| 45 to 54 Years | 246 (100.0%) | 200 (95.2%) |
| 55 to 64 Years | 203 (86.8%) | 142 (92.2%) |
| 65 to 74 Years | 249 (87.1%) | 285 (88.2%) |
| 75 Years and over | 217 (100.0%) | 132 (82.5%) |
| Total | 1,505 (95.7%) | 1,277 (91.5%) |
Income Below Poverty Among Married-Couple Families in Alva
The poverty statistics for married-couple families in Alva show that 4.0% or 28 of the total 698 families live below the poverty line. Families with no children have the highest poverty rate of 5.0%, comprising of 28 families. On the other hand, families with 1 or 2 children have the lowest poverty rate of 0.0%, which includes 0 families.
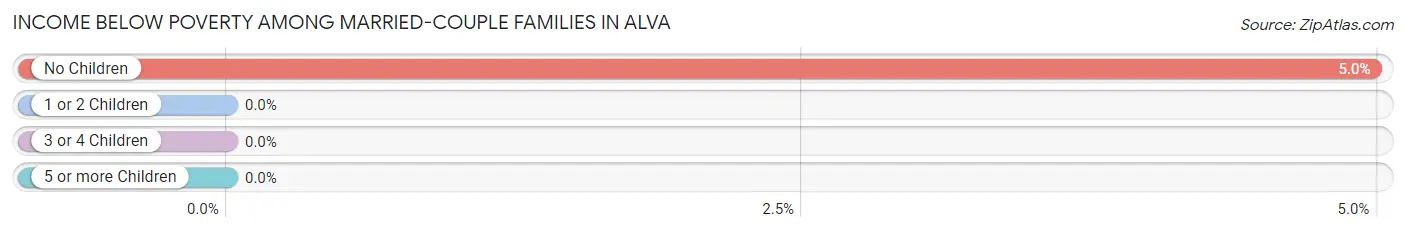
| Children | Above Poverty | Below Poverty |
| No Children | 534 (95.0%) | 28 (5.0%) |
| 1 or 2 Children | 78 (100.0%) | 0 (0.0%) |
| 3 or 4 Children | 58 (100.0%) | 0 (0.0%) |
| 5 or more Children | 0 (0.0%) | 0 (0.0%) |
| Total | 670 (96.0%) | 28 (4.0%) |
Income Below Poverty Among Single-Parent Households in Alva
| Children | Single Father | Single Mother |
| No Children | 0 (0.0%) | 0 (0.0%) |
| 1 or 2 Children | 0 (0.0%) | 0 (0.0%) |
| 3 or 4 Children | 0 (0.0%) | 0 (0.0%) |
| 5 or more Children | 0 (0.0%) | 0 (0.0%) |
| Total | 0 (0.0%) | 0 (0.0%) |
Income Below Poverty Among Married-Couple vs Single-Parent Households in Alva
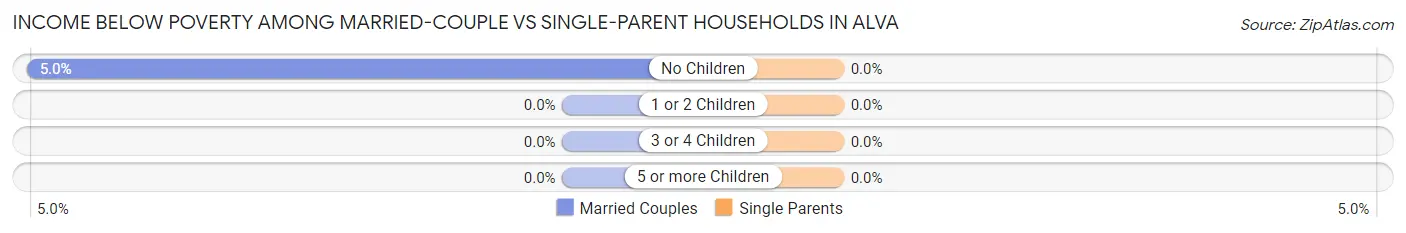
| Children | Married-Couple Families | Single-Parent Households |
| No Children | 28 (5.0%) | 0 (0.0%) |
| 1 or 2 Children | 0 (0.0%) | 0 (0.0%) |
| 3 or 4 Children | 0 (0.0%) | 0 (0.0%) |
| 5 or more Children | 0 (0.0%) | 0 (0.0%) |
| Total | 28 (4.0%) | 0 (0.0%) |
Race in Alva
The most populous races in Alva are White / Caucasian (2,735 | 91.6%), Hispanic or Latino (176 | 5.9%), and Asian (134 | 4.5%).
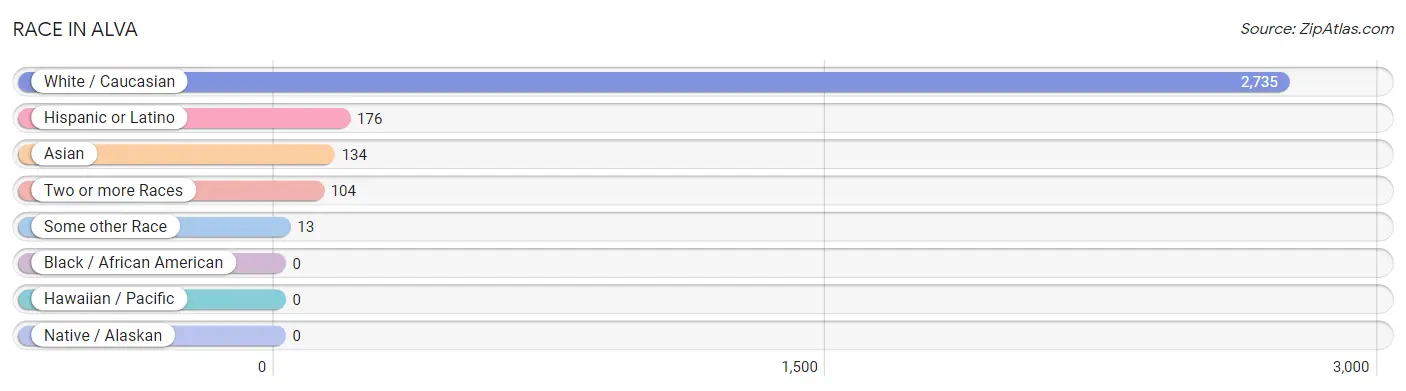
| Race | # Population | % Population |
| Asian | 134 | 4.5% |
| Black / African American | 0 | 0.0% |
| Hawaiian / Pacific | 0 | 0.0% |
| Hispanic or Latino | 176 | 5.9% |
| Native / Alaskan | 0 | 0.0% |
| White / Caucasian | 2,735 | 91.6% |
| Two or more Races | 104 | 3.5% |
| Some other Race | 13 | 0.4% |
| Total | 2,986 | 100.0% |
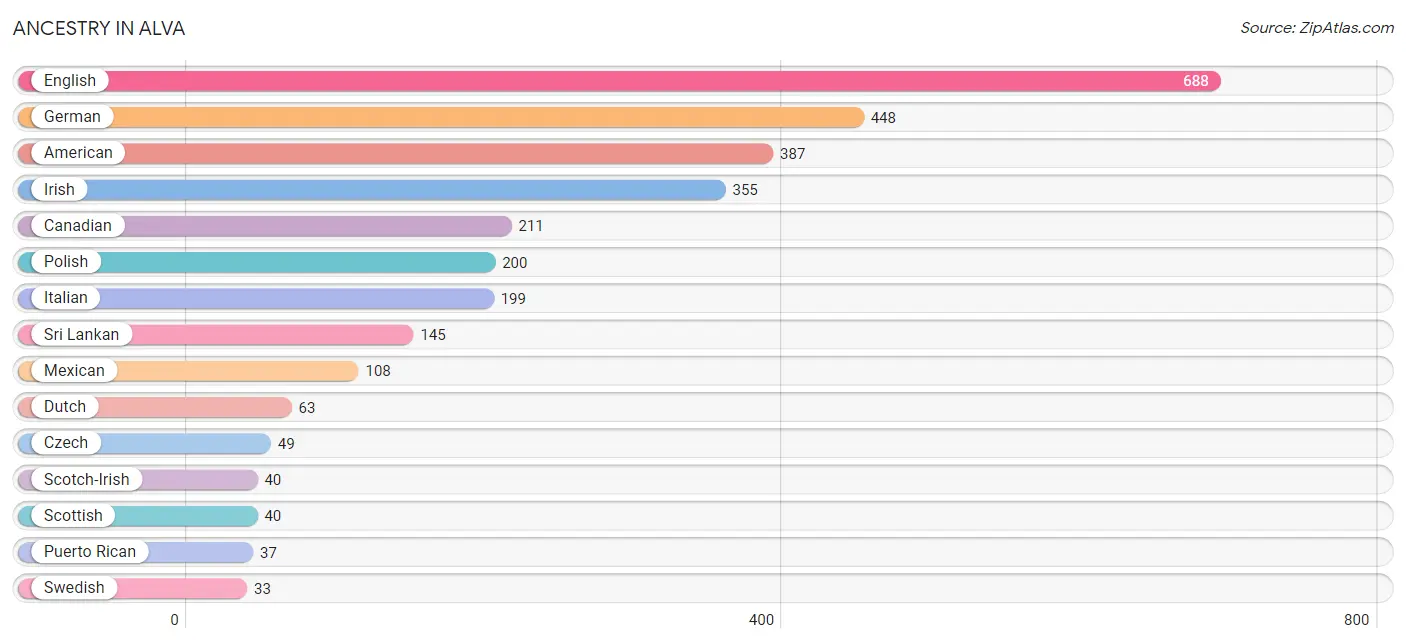
Ancestry in Alva
The most populous ancestries reported in Alva are English (688 | 23.0%), German (448 | 15.0%), American (387 | 13.0%), Irish (355 | 11.9%), and Canadian (211 | 7.1%), together accounting for 70.0% of all Alva residents.
| Ancestry | # Population | % Population |
| American | 387 | 13.0% |
| Austrian | 7 | 0.2% |
| Bhutanese | 19 | 0.6% |
| Burmese | 19 | 0.6% |
| Canadian | 211 | 7.1% |
| Colombian | 18 | 0.6% |
| Cuban | 13 | 0.4% |
| Czech | 49 | 1.6% |
| Dutch | 63 | 2.1% |
| English | 688 | 23.0% |
| French | 23 | 0.8% |
| German | 448 | 15.0% |
| Greek | 22 | 0.7% |
| Hungarian | 7 | 0.2% |
| Irish | 355 | 11.9% |
| Italian | 199 | 6.7% |
| Korean | 8 | 0.3% |
| Mexican | 108 | 3.6% |
| Norwegian | 18 | 0.6% |
| Polish | 200 | 6.7% |
| Portuguese | 15 | 0.5% |
| Puerto Rican | 37 | 1.2% |
| Scandinavian | 13 | 0.4% |
| Scotch-Irish | 40 | 1.3% |
| Scottish | 40 | 1.3% |
| South American | 18 | 0.6% |
| Sri Lankan | 145 | 4.9% |
| Swedish | 33 | 1.1% |
| Welsh | 21 | 0.7% | View All 29 Rows |
Immigrants in Alva
The most numerous immigrant groups reported in Alva came from Asia (134 | 4.5%), South Eastern Asia (134 | 4.5%), Vietnam (134 | 4.5%), Canada (45 | 1.5%), and Europe (34 | 1.1%), together accounting for 16.1% of all Alva residents.
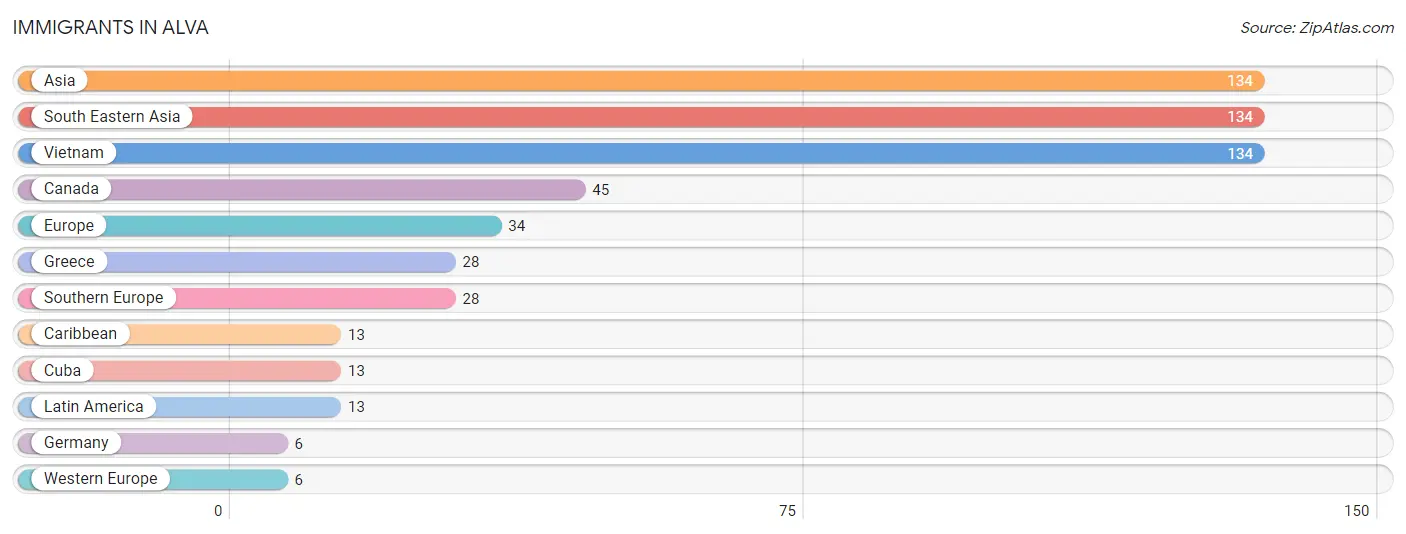
| Immigration Origin | # Population | % Population |
| Asia | 134 | 4.5% |
| Canada | 45 | 1.5% |
| Caribbean | 13 | 0.4% |
| Cuba | 13 | 0.4% |
| Europe | 34 | 1.1% |
| Germany | 6 | 0.2% |
| Greece | 28 | 0.9% |
| Latin America | 13 | 0.4% |
| South Eastern Asia | 134 | 4.5% |
| Southern Europe | 28 | 0.9% |
| Vietnam | 134 | 4.5% |
| Western Europe | 6 | 0.2% | View All 12 Rows |
Sex and Age in Alva
Sex and Age in Alva
The most populous age groups in Alva are 10 to 14 Years (234 | 14.9%) for men and 65 to 69 Years (222 | 15.7%) for women.
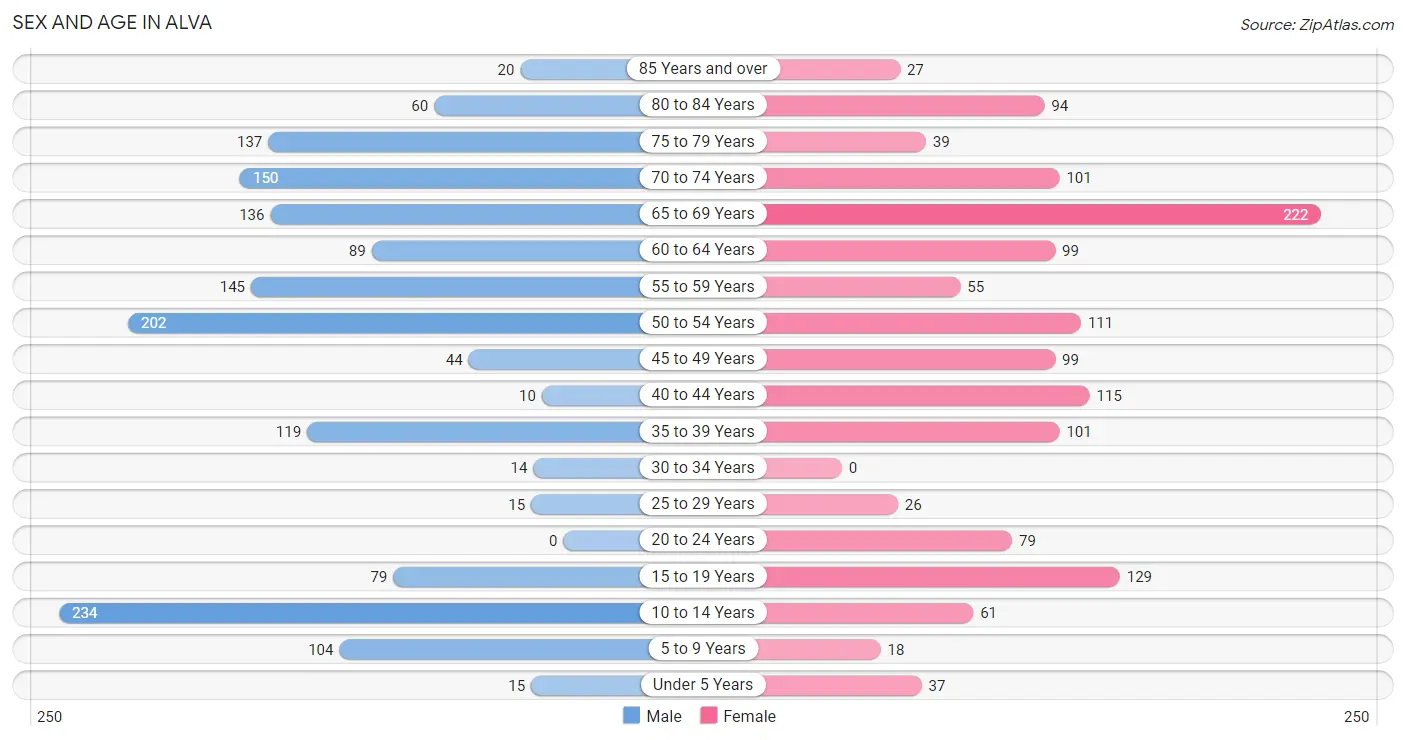
| Age Bracket | Male | Female |
| Under 5 Years | 15 (0.9%) | 37 (2.6%) |
| 5 to 9 Years | 104 (6.6%) | 18 (1.3%) |
| 10 to 14 Years | 234 (14.9%) | 61 (4.3%) |
| 15 to 19 Years | 79 (5.0%) | 129 (9.1%) |
| 20 to 24 Years | 0 (0.0%) | 79 (5.6%) |
| 25 to 29 Years | 15 (0.9%) | 26 (1.8%) |
| 30 to 34 Years | 14 (0.9%) | 0 (0.0%) |
| 35 to 39 Years | 119 (7.6%) | 101 (7.1%) |
| 40 to 44 Years | 10 (0.6%) | 115 (8.1%) |
| 45 to 49 Years | 44 (2.8%) | 99 (7.0%) |
| 50 to 54 Years | 202 (12.8%) | 111 (7.9%) |
| 55 to 59 Years | 145 (9.2%) | 55 (3.9%) |
| 60 to 64 Years | 89 (5.7%) | 99 (7.0%) |
| 65 to 69 Years | 136 (8.6%) | 222 (15.7%) |
| 70 to 74 Years | 150 (9.5%) | 101 (7.1%) |
| 75 to 79 Years | 137 (8.7%) | 39 (2.8%) |
| 80 to 84 Years | 60 (3.8%) | 94 (6.7%) |
| 85 Years and over | 20 (1.3%) | 27 (1.9%) |
| Total | 1,573 (100.0%) | 1,413 (100.0%) |
Families and Households in Alva
Median Family Size in Alva
The median family size in Alva is 2.91 persons per family, with single male/father families (116 | 14.0%) accounting for the largest median family size of 3.36 persons per family. On the other hand, married-couple families (698 | 84.4%) represent the smallest median family size with 2.83 persons per family.
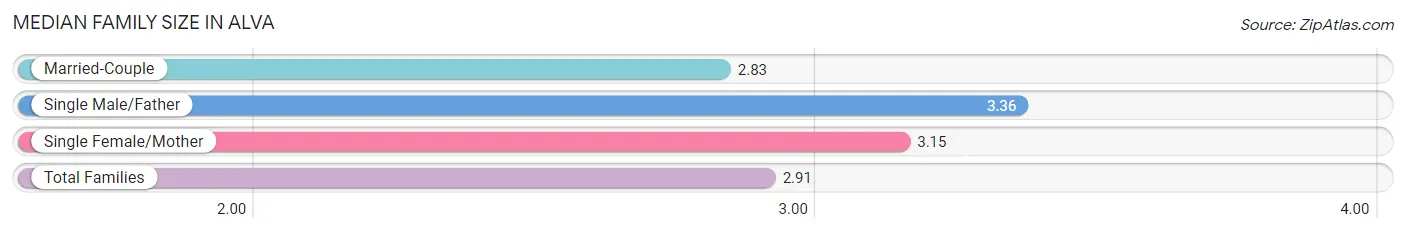
| Family Type | # Families | Family Size |
| Married-Couple | 698 (84.4%) | 2.83 |
| Single Male/Father | 116 (14.0%) | 3.36 |
| Single Female/Mother | 13 (1.6%) | 3.15 |
| Total Families | 827 (100.0%) | 2.91 |
Median Household Size in Alva
The median household size in Alva is 2.49 persons per household, with single male/father households (116 | 9.7%) accounting for the largest median household size of 3.36 persons per household. non-family households (374 | 31.1%) represent the smallest median household size with 1.55 persons per household.
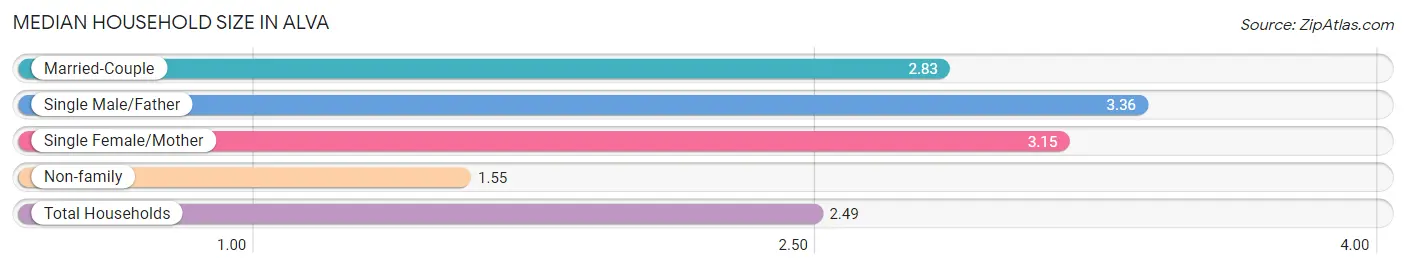
| Household Type | # Households | Household Size |
| Married-Couple | 698 (58.1%) | 2.83 |
| Single Male/Father | 116 (9.7%) | 3.36 |
| Single Female/Mother | 13 (1.1%) | 3.15 |
| Non-family | 374 (31.1%) | 1.55 |
| Total Households | 1,201 (100.0%) | 2.49 |
Household Size by Marriage Status in Alva
Out of a total of 1,201 households in Alva, 827 (68.9%) are family households, while 374 (31.1%) are nonfamily households. The most numerous type of family households are 2-person households, comprising 534, and the most common type of nonfamily households are 1-person households, comprising 275.
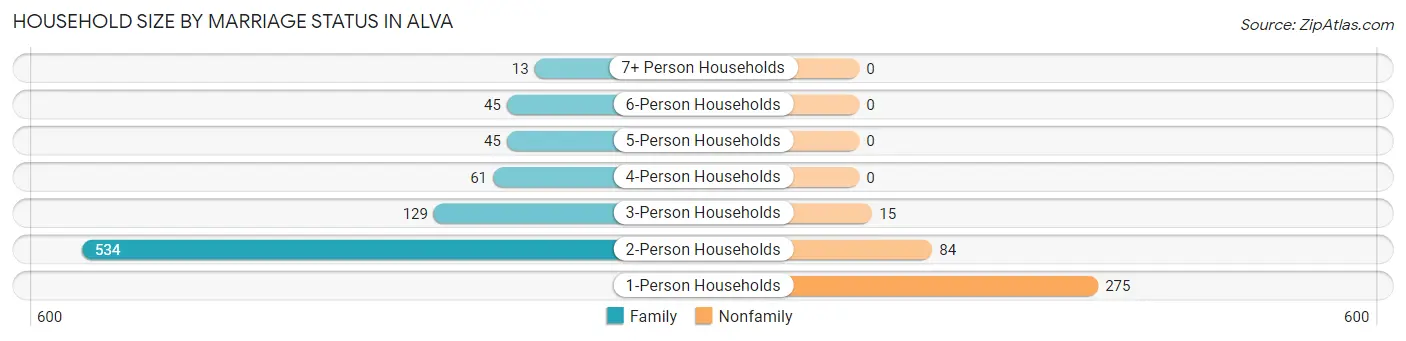
| Household Size | Family Households | Nonfamily Households |
| 1-Person Households | - | 275 (22.9%) |
| 2-Person Households | 534 (44.5%) | 84 (7.0%) |
| 3-Person Households | 129 (10.7%) | 15 (1.3%) |
| 4-Person Households | 61 (5.1%) | 0 (0.0%) |
| 5-Person Households | 45 (3.7%) | 0 (0.0%) |
| 6-Person Households | 45 (3.7%) | 0 (0.0%) |
| 7+ Person Households | 13 (1.1%) | 0 (0.0%) |
| Total | 827 (68.9%) | 374 (31.1%) |
Female Fertility in Alva
Fertility by Age in Alva
Average fertility rate in Alva is 25.0 births per 1,000 women. Women in the age bracket of 35 to 50 years have the highest fertility rate with 44.0 births per 1,000 women. Women in the age bracket of 35 to 50 years acount for 100.0% of all women with births.
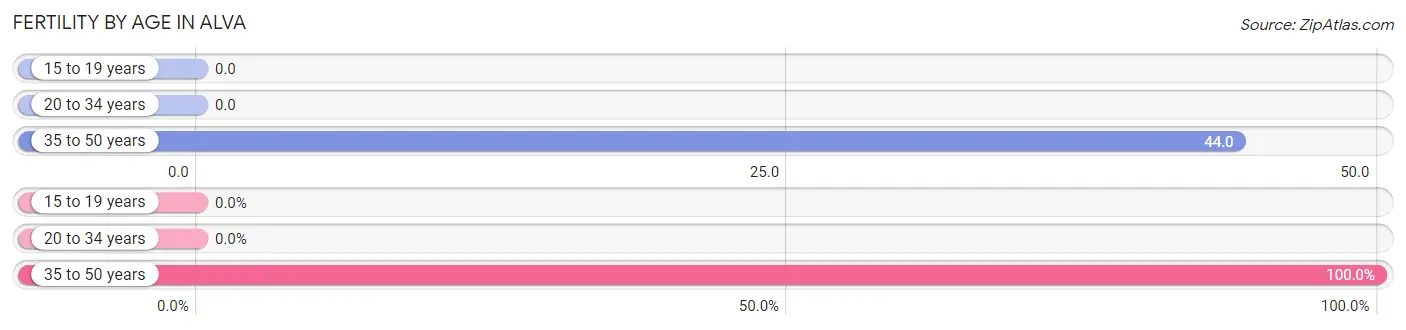
| Age Bracket | Women with Births | Births / 1,000 Women |
| 15 to 19 years | 0 (0.0%) | 0.0 |
| 20 to 34 years | 0 (0.0%) | 0.0 |
| 35 to 50 years | 14 (100.0%) | 44.0 |
| Total | 14 (100.0%) | 25.0 |
Fertility by Age by Marriage Status in Alva
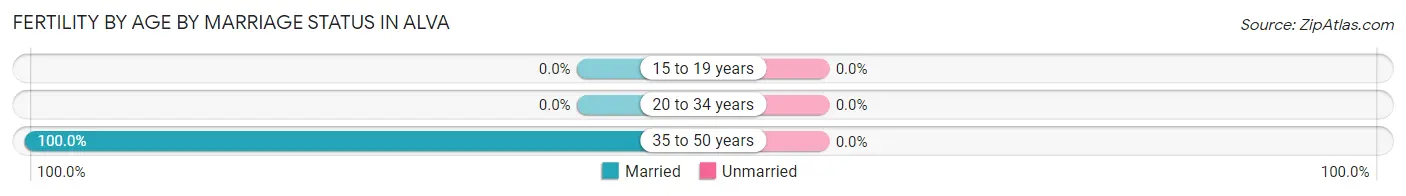
| Age Bracket | Married | Unmarried |
| 15 to 19 years | 0 (0.0%) | 0 (0.0%) |
| 20 to 34 years | 0 (0.0%) | 0 (0.0%) |
| 35 to 50 years | 14 (100.0%) | 0 (0.0%) |
| Total | 14 (100.0%) | 0 (0.0%) |
Fertility by Education in Alva
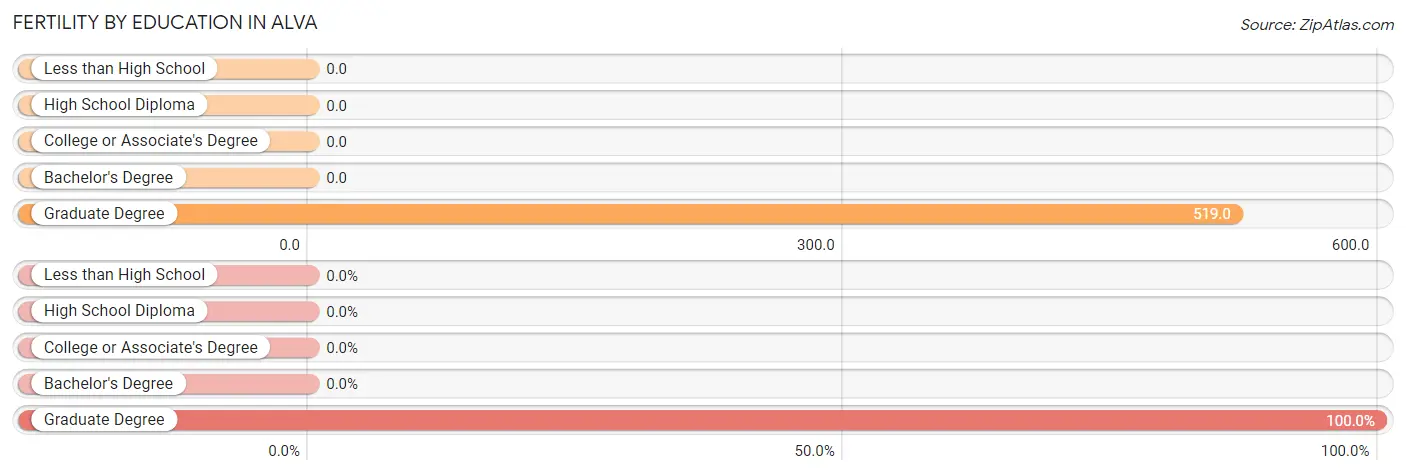
| Educational Attainment | Women with Births | Births / 1,000 Women |
| Less than High School | 0 (0.0%) | 0.0 |
| High School Diploma | 0 (0.0%) | 0.0 |
| College or Associate's Degree | 0 (0.0%) | 0.0 |
| Bachelor's Degree | 0 (0.0%) | 0.0 |
| Graduate Degree | 14 (100.0%) | 519.0 |
| Total | 14 (100.0%) | 25.0 |
Fertility by Education by Marriage Status in Alva
| Educational Attainment | Married | Unmarried |
| Less than High School | 0 (0.0%) | 0 (0.0%) |
| High School Diploma | 0 (0.0%) | 0 (0.0%) |
| College or Associate's Degree | 0 (0.0%) | 0 (0.0%) |
| Bachelor's Degree | 0 (0.0%) | 0 (0.0%) |
| Graduate Degree | 14 (100.0%) | 0 (0.0%) |
| Total | 14 (100.0%) | 0 (0.0%) |
Employment Characteristics in Alva
Employment by Class of Employer in Alva
Among the 1,192 employed individuals in Alva, private company employees (554 | 46.5%), self-employed (not incorporated) (205 | 17.2%), and local government employees (137 | 11.5%) make up the most common classes of employment.
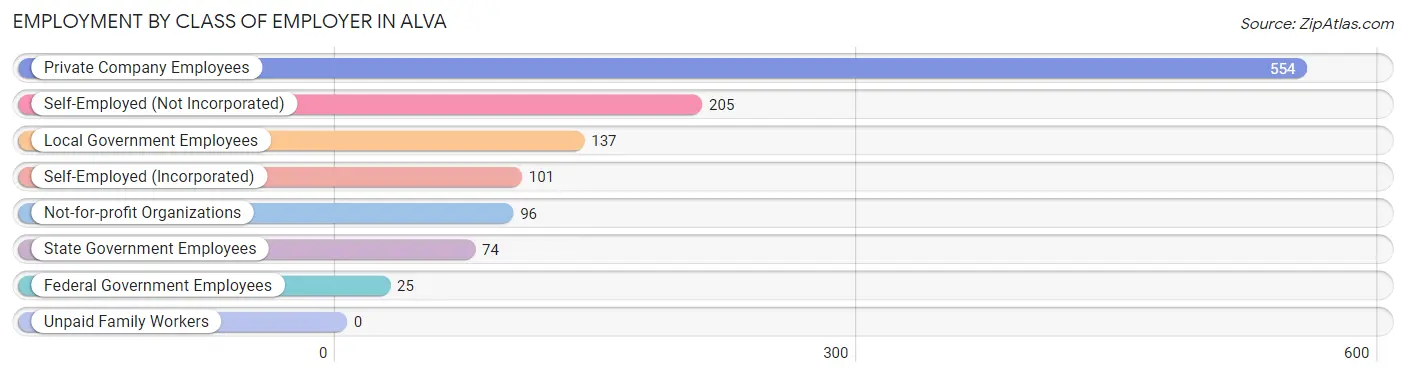
| Employer Class | # Employees | % Employees |
| Private Company Employees | 554 | 46.5% |
| Self-Employed (Incorporated) | 101 | 8.5% |
| Self-Employed (Not Incorporated) | 205 | 17.2% |
| Not-for-profit Organizations | 96 | 8.1% |
| Local Government Employees | 137 | 11.5% |
| State Government Employees | 74 | 6.2% |
| Federal Government Employees | 25 | 2.1% |
| Unpaid Family Workers | 0 | 0.0% |
| Total | 1,192 | 100.0% |
Employment Status by Age in Alva
According to the labor force statistics for Alva, out of the total population over 16 years of age (2,517), 49.1% or 1,236 individuals are in the labor force, with 0.9% or 11 of them unemployed. The age group with the highest labor force participation rate is 25 to 29 years, with 100.0% or 41 individuals in the labor force. Within the labor force, the 35 to 44 years age range has the highest percentage of unemployed individuals, with 3.2% or 11 of them being unemployed.
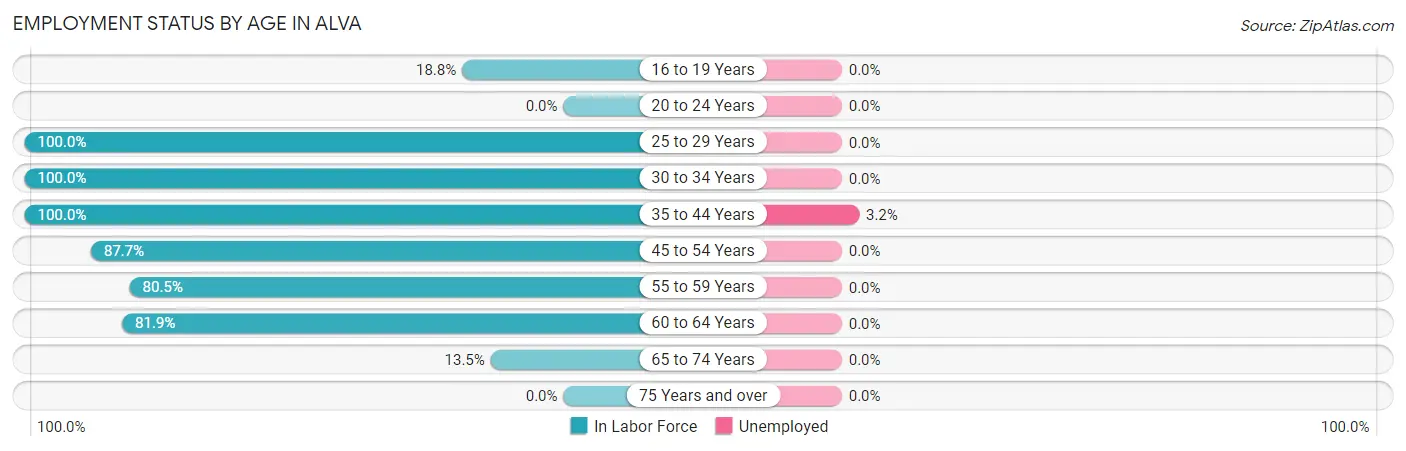
| Age Bracket | In Labor Force | Unemployed |
| 16 to 19 Years | 39 (18.8%) | 0 (0.0%) |
| 20 to 24 Years | 0 (0.0%) | 0 (0.0%) |
| 25 to 29 Years | 41 (100.0%) | 0 (0.0%) |
| 30 to 34 Years | 14 (100.0%) | 0 (0.0%) |
| 35 to 44 Years | 345 (100.0%) | 11 (3.2%) |
| 45 to 54 Years | 400 (87.7%) | 0 (0.0%) |
| 55 to 59 Years | 161 (80.5%) | 0 (0.0%) |
| 60 to 64 Years | 154 (81.9%) | 0 (0.0%) |
| 65 to 74 Years | 82 (13.5%) | 0 (0.0%) |
| 75 Years and over | 0 (0.0%) | 0 (0.0%) |
| Total | 1,236 (49.1%) | 11 (0.9%) |
Employment Status by Educational Attainment in Alva
According to labor force statistics for Alva, 89.6% of individuals (1,115) out of the total population between 25 and 64 years of age (1,244) are in the labor force, with 1.0% or 11 of them being unemployed. The group with the highest labor force participation rate are those with the educational attainment of less than high school, with 100.0% or 17 individuals in the labor force. Within the labor force, individuals with college / associate degree education have the highest percentage of unemployment, with 2.1% or 11 of them being unemployed.
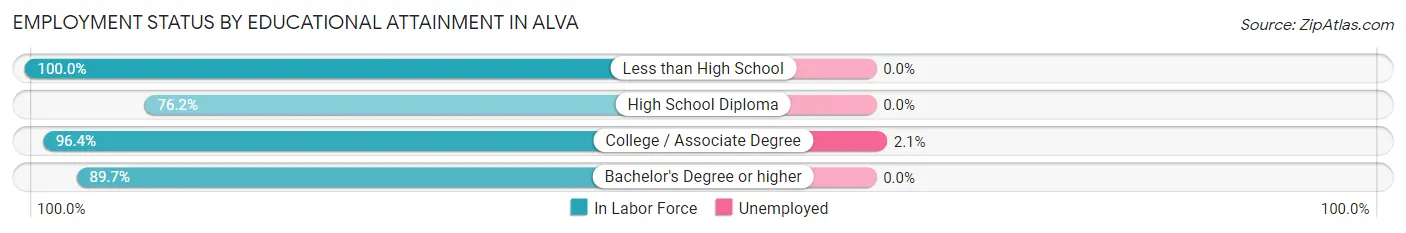
| Educational Attainment | In Labor Force | Unemployed |
| Less than High School | 17 (100.0%) | 0 (0.0%) |
| High School Diploma | 221 (76.2%) | 0 (0.0%) |
| College / Associate Degree | 528 (96.4%) | 12 (2.1%) |
| Bachelor's Degree or higher | 349 (89.7%) | 0 (0.0%) |
| Total | 1,115 (89.6%) | 12 (1.0%) |
Employment Occupations by Sex in Alva
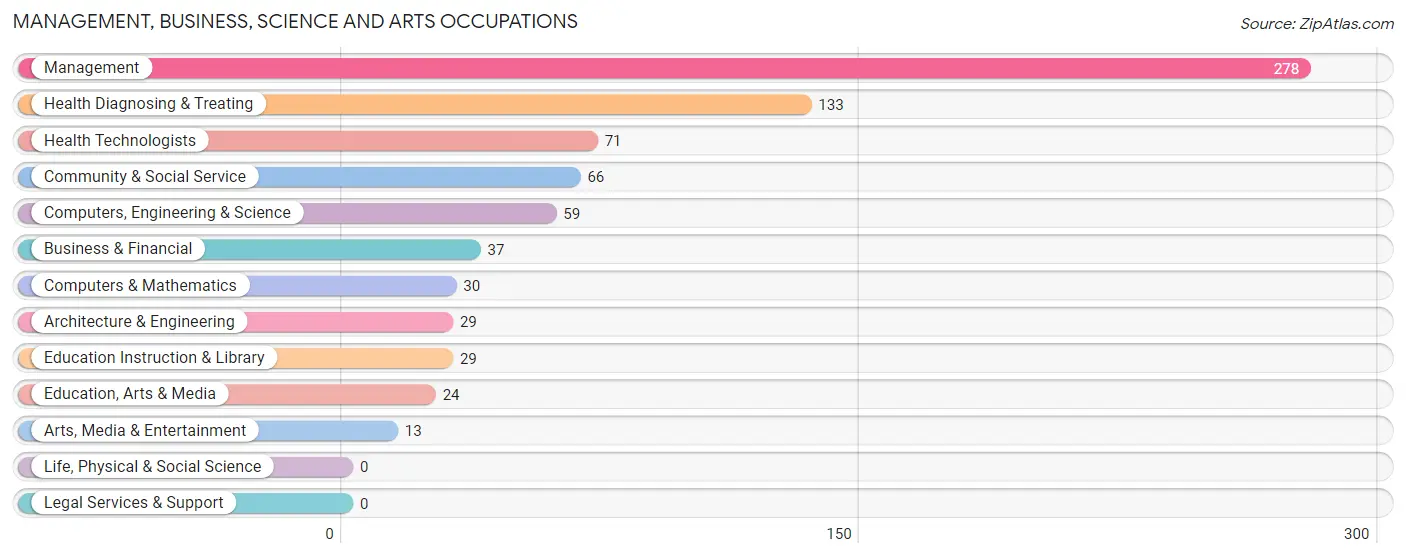
Management, Business, Science and Arts Occupations
The most common Management, Business, Science and Arts occupations in Alva are Management (278 | 22.7%), Health Diagnosing & Treating (133 | 10.9%), Health Technologists (71 | 5.8%), Community & Social Service (66 | 5.4%), and Computers, Engineering & Science (59 | 4.8%).
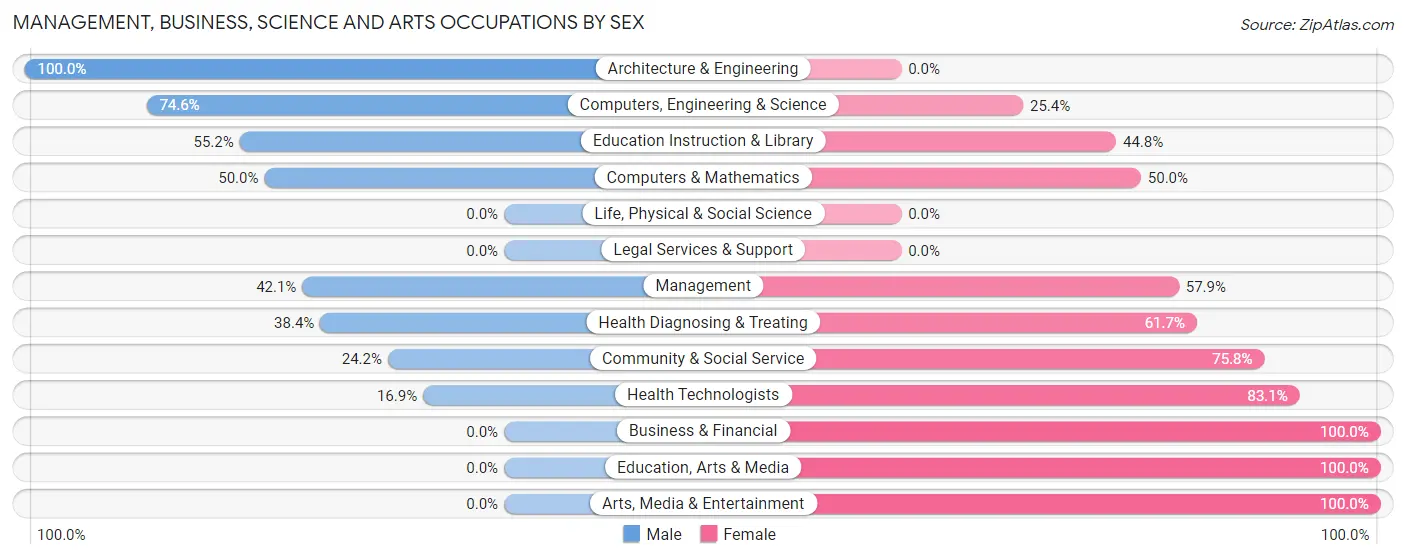
Management, Business, Science and Arts Occupations by Sex
Within the Management, Business, Science and Arts occupations in Alva, the most male-oriented occupations are Architecture & Engineering (100.0%), Computers, Engineering & Science (74.6%), and Education Instruction & Library (55.2%), while the most female-oriented occupations are Business & Financial (100.0%), Education, Arts & Media (100.0%), and Arts, Media & Entertainment (100.0%).
| Occupation | Male | Female |
| Management | 117 (42.1%) | 161 (57.9%) |
| Business & Financial | 0 (0.0%) | 37 (100.0%) |
| Computers, Engineering & Science | 44 (74.6%) | 15 (25.4%) |
| Computers & Mathematics | 15 (50.0%) | 15 (50.0%) |
| Architecture & Engineering | 29 (100.0%) | 0 (0.0%) |
| Life, Physical & Social Science | 0 (0.0%) | 0 (0.0%) |
| Community & Social Service | 16 (24.2%) | 50 (75.8%) |
| Education, Arts & Media | 0 (0.0%) | 24 (100.0%) |
| Legal Services & Support | 0 (0.0%) | 0 (0.0%) |
| Education Instruction & Library | 16 (55.2%) | 13 (44.8%) |
| Arts, Media & Entertainment | 0 (0.0%) | 13 (100.0%) |
| Health Diagnosing & Treating | 51 (38.4%) | 82 (61.7%) |
| Health Technologists | 12 (16.9%) | 59 (83.1%) |
| Total (Category) | 228 (39.8%) | 345 (60.2%) |
| Total (Overall) | 645 (52.6%) | 580 (47.3%) |
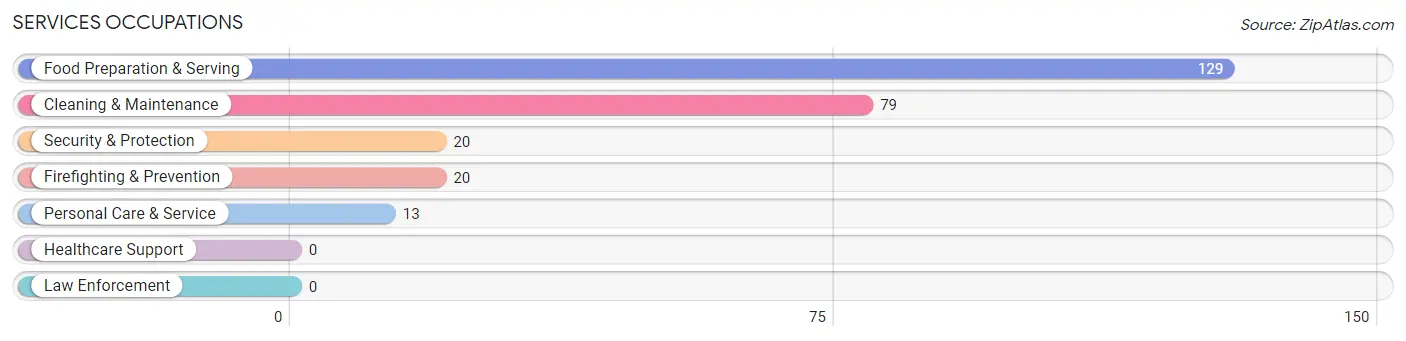
Services Occupations
The most common Services occupations in Alva are Food Preparation & Serving (129 | 10.5%), Cleaning & Maintenance (79 | 6.5%), Security & Protection (20 | 1.6%), Firefighting & Prevention (20 | 1.6%), and Personal Care & Service (13 | 1.1%).
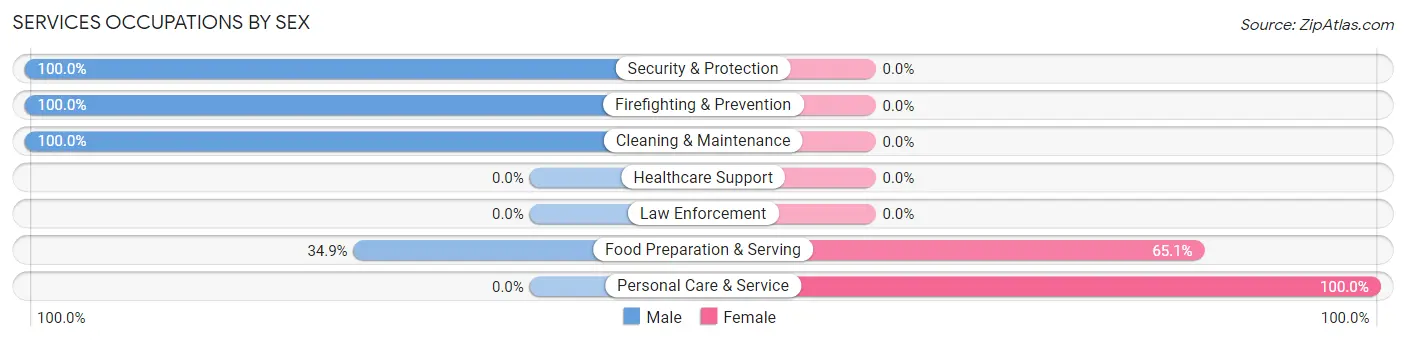
Services Occupations by Sex
Within the Services occupations in Alva, the most male-oriented occupations are Security & Protection (100.0%), Firefighting & Prevention (100.0%), and Cleaning & Maintenance (100.0%), while the most female-oriented occupations are Personal Care & Service (100.0%), and Food Preparation & Serving (65.1%).
| Occupation | Male | Female |
| Healthcare Support | 0 (0.0%) | 0 (0.0%) |
| Security & Protection | 20 (100.0%) | 0 (0.0%) |
| Firefighting & Prevention | 20 (100.0%) | 0 (0.0%) |
| Law Enforcement | 0 (0.0%) | 0 (0.0%) |
| Food Preparation & Serving | 45 (34.9%) | 84 (65.1%) |
| Cleaning & Maintenance | 79 (100.0%) | 0 (0.0%) |
| Personal Care & Service | 0 (0.0%) | 13 (100.0%) |
| Total (Category) | 144 (59.8%) | 97 (40.3%) |
| Total (Overall) | 645 (52.6%) | 580 (47.3%) |
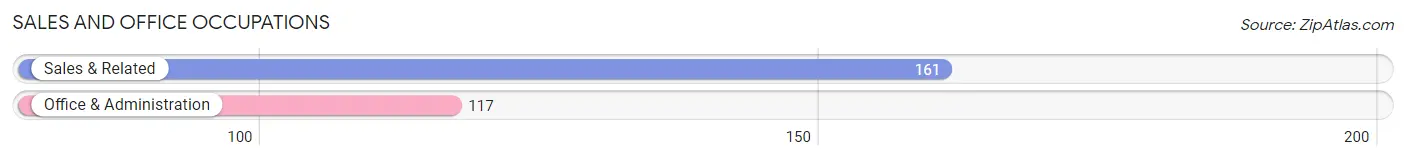
Sales and Office Occupations
The most common Sales and Office occupations in Alva are Sales & Related (161 | 13.1%), and Office & Administration (117 | 9.6%).
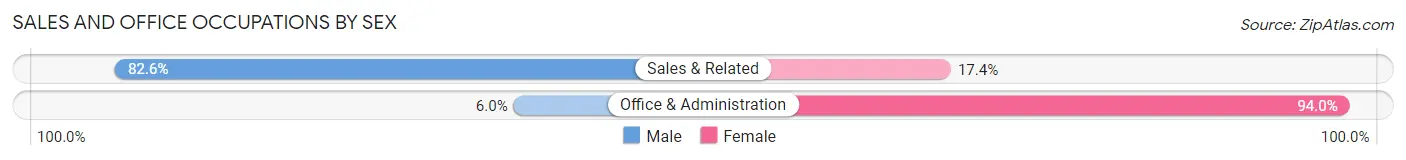
Sales and Office Occupations by Sex
| Occupation | Male | Female |
| Sales & Related | 133 (82.6%) | 28 (17.4%) |
| Office & Administration | 7 (6.0%) | 110 (94.0%) |
| Total (Category) | 140 (50.4%) | 138 (49.6%) |
| Total (Overall) | 645 (52.6%) | 580 (47.3%) |
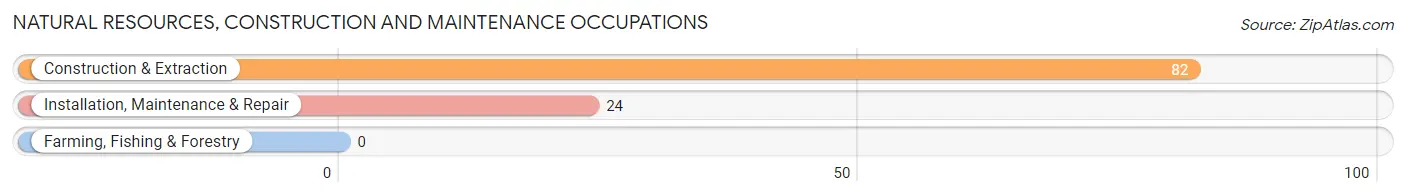
Natural Resources, Construction and Maintenance Occupations
The most common Natural Resources, Construction and Maintenance occupations in Alva are Construction & Extraction (82 | 6.7%), and Installation, Maintenance & Repair (24 | 2.0%).
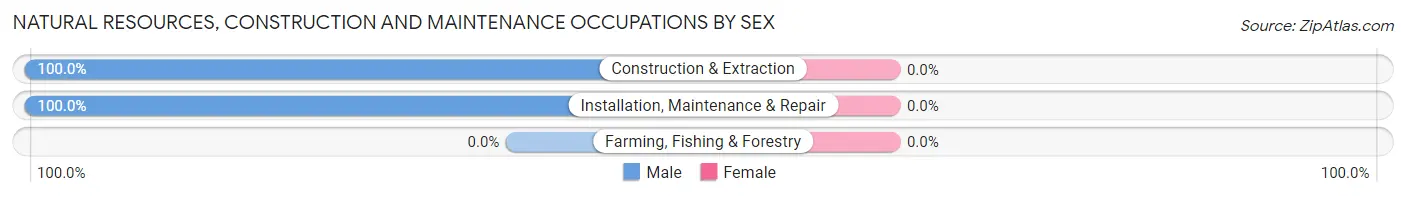
Natural Resources, Construction and Maintenance Occupations by Sex
| Occupation | Male | Female |
| Farming, Fishing & Forestry | 0 (0.0%) | 0 (0.0%) |
| Construction & Extraction | 82 (100.0%) | 0 (0.0%) |
| Installation, Maintenance & Repair | 24 (100.0%) | 0 (0.0%) |
| Total (Category) | 106 (100.0%) | 0 (0.0%) |
| Total (Overall) | 645 (52.6%) | 580 (47.3%) |
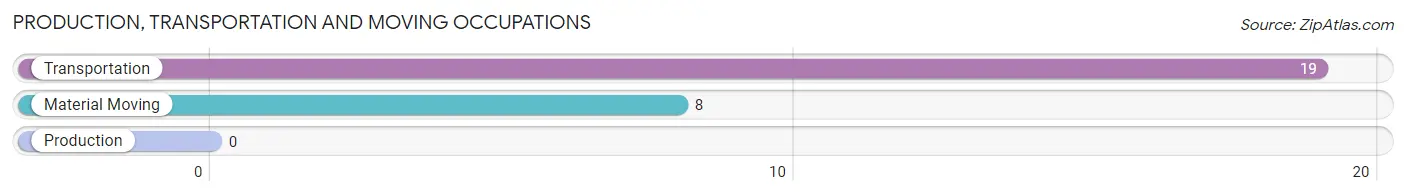
Production, Transportation and Moving Occupations
The most common Production, Transportation and Moving occupations in Alva are Transportation (19 | 1.5%), and Material Moving (8 | 0.6%).
Production, Transportation and Moving Occupations by Sex
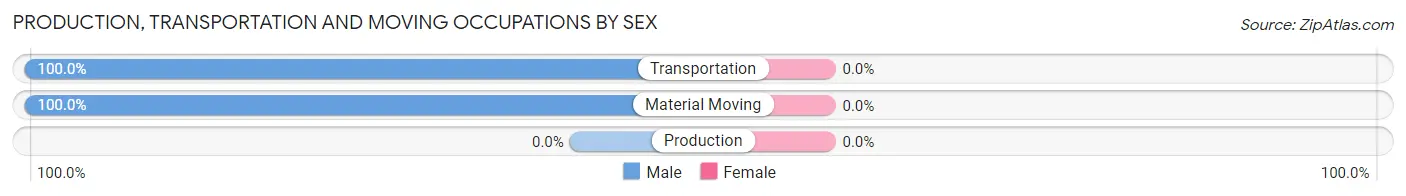
| Occupation | Male | Female |
| Production | 0 (0.0%) | 0 (0.0%) |
| Transportation | 19 (100.0%) | 0 (0.0%) |
| Material Moving | 8 (100.0%) | 0 (0.0%) |
| Total (Category) | 27 (100.0%) | 0 (0.0%) |
| Total (Overall) | 645 (52.6%) | 580 (47.3%) |
Employment Industries by Sex in Alva
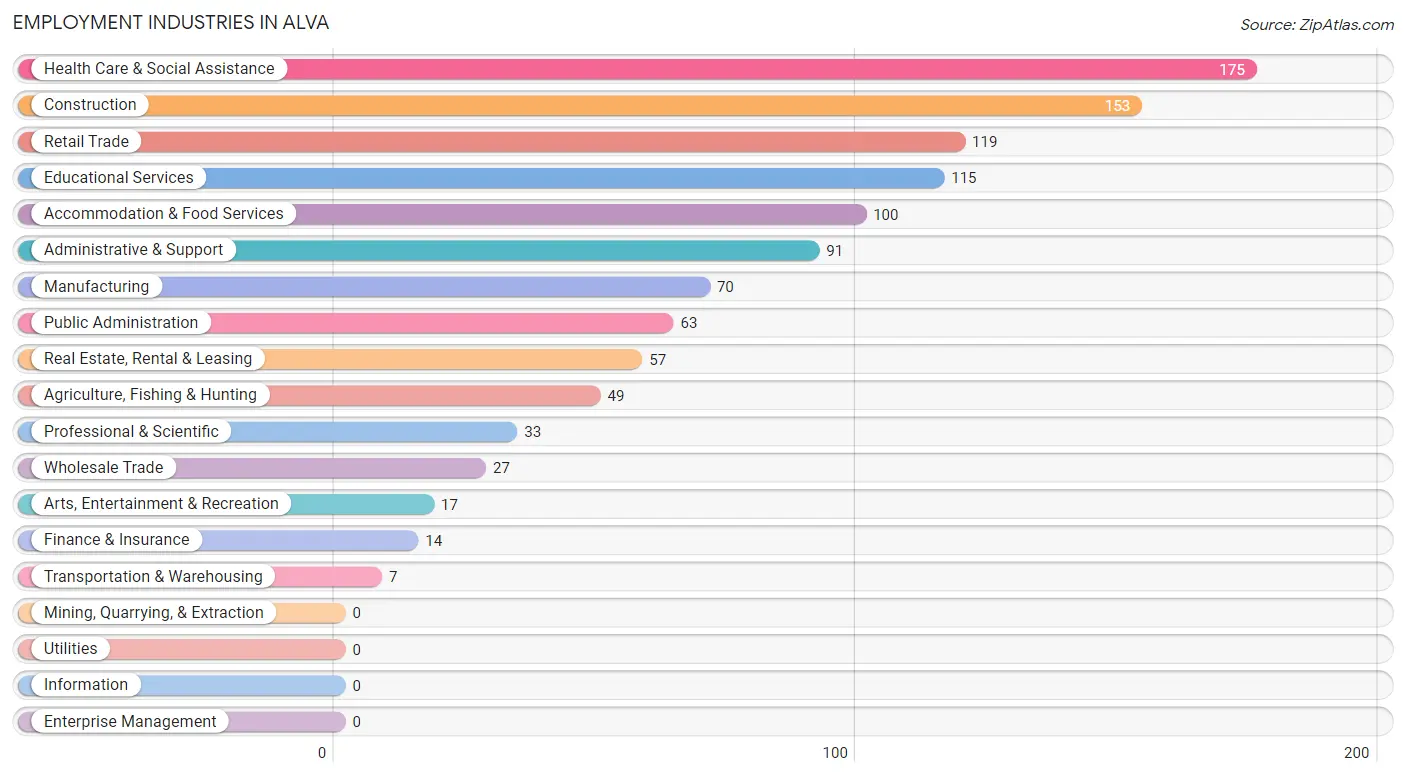
Employment Industries in Alva
The major employment industries in Alva include Health Care & Social Assistance (175 | 14.3%), Construction (153 | 12.5%), Retail Trade (119 | 9.7%), Educational Services (115 | 9.4%), and Accommodation & Food Services (100 | 8.2%).
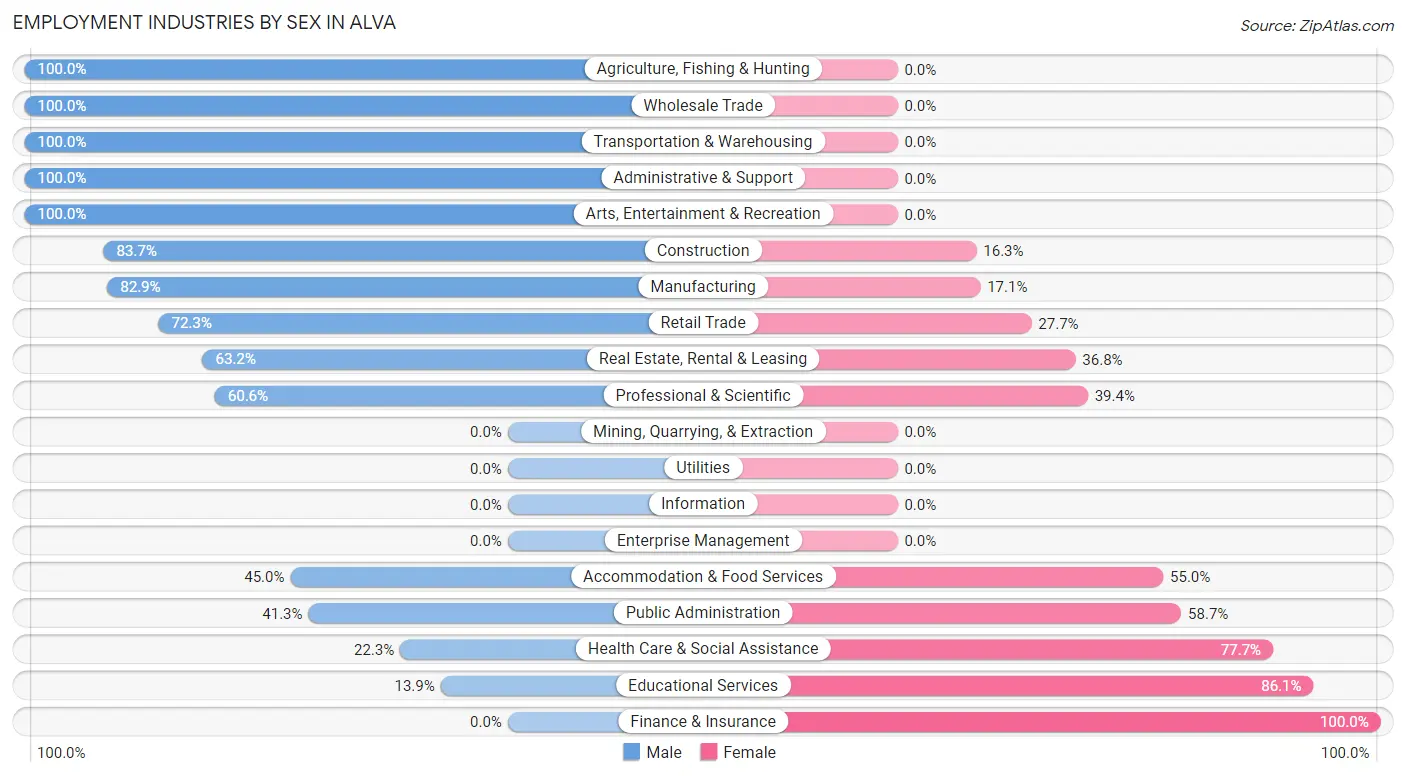
Employment Industries by Sex in Alva
The Alva industries that see more men than women are Agriculture, Fishing & Hunting (100.0%), Wholesale Trade (100.0%), and Transportation & Warehousing (100.0%), whereas the industries that tend to have a higher number of women are Finance & Insurance (100.0%), Educational Services (86.1%), and Health Care & Social Assistance (77.7%).
| Industry | Male | Female |
| Agriculture, Fishing & Hunting | 49 (100.0%) | 0 (0.0%) |
| Mining, Quarrying, & Extraction | 0 (0.0%) | 0 (0.0%) |
| Construction | 128 (83.7%) | 25 (16.3%) |
| Manufacturing | 58 (82.9%) | 12 (17.1%) |
| Wholesale Trade | 27 (100.0%) | 0 (0.0%) |
| Retail Trade | 86 (72.3%) | 33 (27.7%) |
| Transportation & Warehousing | 7 (100.0%) | 0 (0.0%) |
| Utilities | 0 (0.0%) | 0 (0.0%) |
| Information | 0 (0.0%) | 0 (0.0%) |
| Finance & Insurance | 0 (0.0%) | 14 (100.0%) |
| Real Estate, Rental & Leasing | 36 (63.2%) | 21 (36.8%) |
| Professional & Scientific | 20 (60.6%) | 13 (39.4%) |
| Enterprise Management | 0 (0.0%) | 0 (0.0%) |
| Administrative & Support | 91 (100.0%) | 0 (0.0%) |
| Educational Services | 16 (13.9%) | 99 (86.1%) |
| Health Care & Social Assistance | 39 (22.3%) | 136 (77.7%) |
| Arts, Entertainment & Recreation | 17 (100.0%) | 0 (0.0%) |
| Accommodation & Food Services | 45 (45.0%) | 55 (55.0%) |
| Public Administration | 26 (41.3%) | 37 (58.7%) |
| Total | 645 (52.6%) | 580 (47.3%) |
Education in Alva
School Enrollment in Alva
The most common levels of schooling among the 791 students in Alva are high school (241 | 30.5%), college / undergraduate (188 | 23.8%), and middle school (123 | 15.5%).
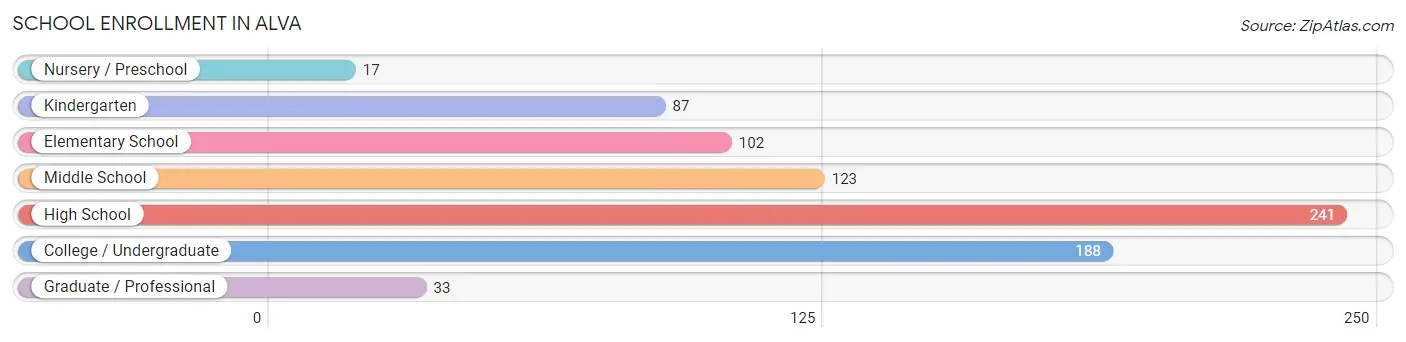
| School Level | # Students | % Students |
| Nursery / Preschool | 17 | 2.1% |
| Kindergarten | 87 | 11.0% |
| Elementary School | 102 | 12.9% |
| Middle School | 123 | 15.5% |
| High School | 241 | 30.5% |
| College / Undergraduate | 188 | 23.8% |
| Graduate / Professional | 33 | 4.2% |
| Total | 791 | 100.0% |
School Enrollment by Age by Funding Source in Alva
Out of a total of 791 students who are enrolled in schools in Alva, 90 (11.4%) attend a private institution, while the remaining 701 (88.6%) are enrolled in public schools. The age group of 10 to 14 year olds has the highest likelihood of being enrolled in private schools, with 75 (25.4% in the age bracket) enrolled. Conversely, the age group of 3 to 4 year olds has the lowest likelihood of being enrolled in a private school, with 17 (100.0% in the age bracket) attending a public institution.
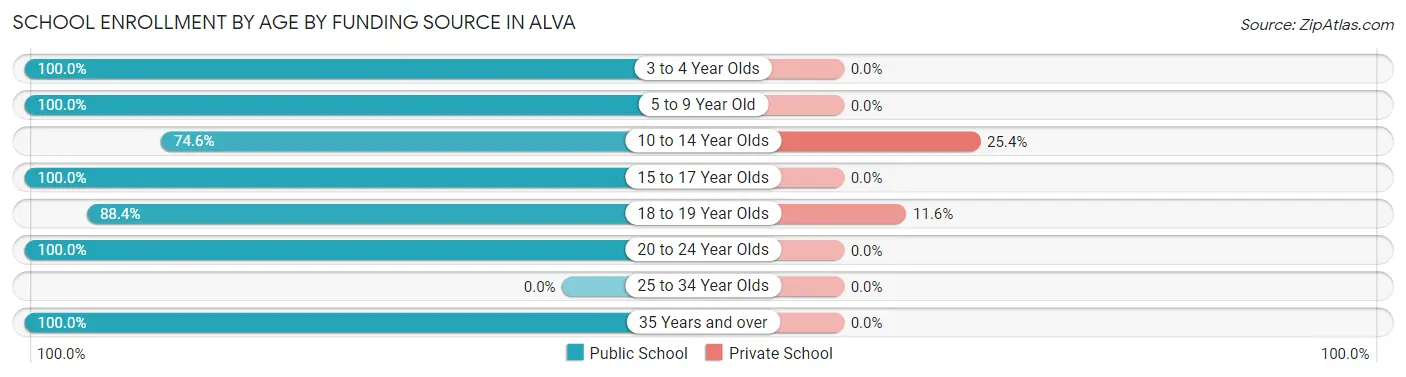
| Age Bracket | Public School | Private School |
| 3 to 4 Year Olds | 17 (100.0%) | 0 (0.0%) |
| 5 to 9 Year Old | 104 (100.0%) | 0 (0.0%) |
| 10 to 14 Year Olds | 220 (74.6%) | 75 (25.4%) |
| 15 to 17 Year Olds | 79 (100.0%) | 0 (0.0%) |
| 18 to 19 Year Olds | 114 (88.4%) | 15 (11.6%) |
| 20 to 24 Year Olds | 79 (100.0%) | 0 (0.0%) |
| 25 to 34 Year Olds | 0 (0.0%) | 0 (0.0%) |
| 35 Years and over | 88 (100.0%) | 0 (0.0%) |
| Total | 701 (88.6%) | 90 (11.4%) |
Educational Attainment by Field of Study in Alva
Social sciences (87 | 14.8%), engineering (82 | 14.0%), education (81 | 13.8%), business (70 | 11.9%), and science & technology (66 | 11.2%) are the most common fields of study among 587 individuals in Alva who have obtained a bachelor's degree or higher.
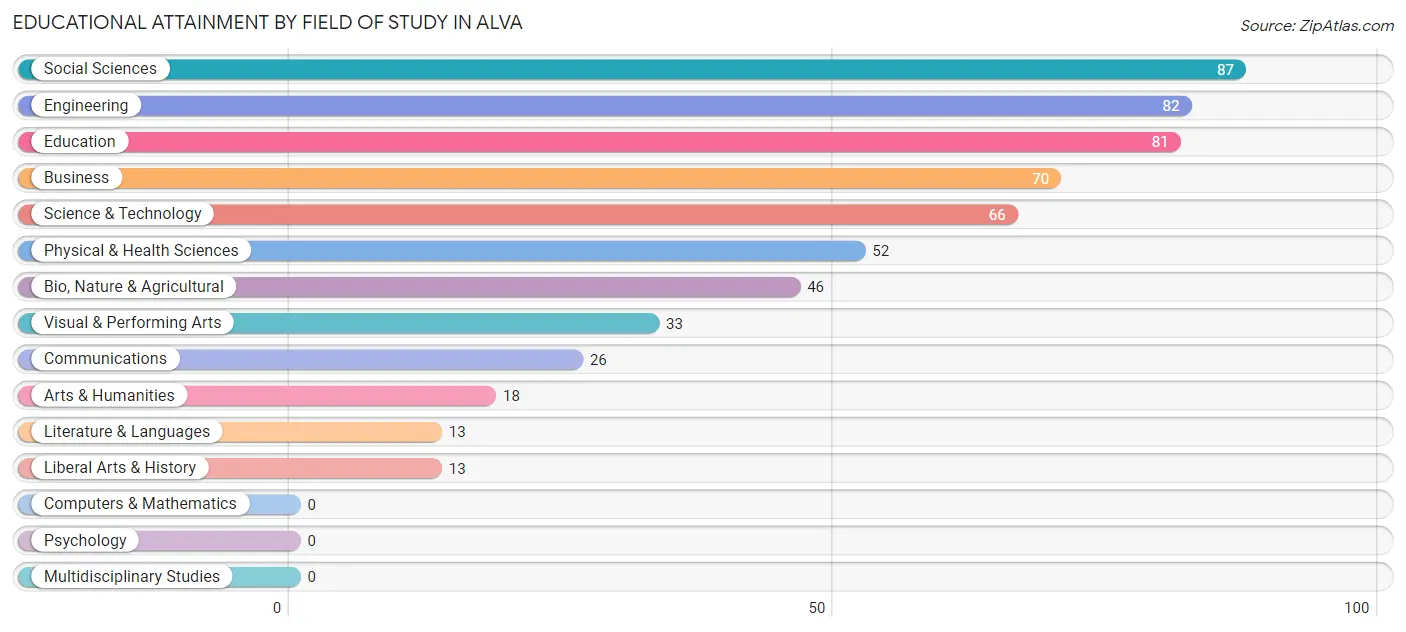
| Field of Study | # Graduates | % Graduates |
| Computers & Mathematics | 0 | 0.0% |
| Bio, Nature & Agricultural | 46 | 7.8% |
| Physical & Health Sciences | 52 | 8.9% |
| Psychology | 0 | 0.0% |
| Social Sciences | 87 | 14.8% |
| Engineering | 82 | 14.0% |
| Multidisciplinary Studies | 0 | 0.0% |
| Science & Technology | 66 | 11.2% |
| Business | 70 | 11.9% |
| Education | 81 | 13.8% |
| Literature & Languages | 13 | 2.2% |
| Liberal Arts & History | 13 | 2.2% |
| Visual & Performing Arts | 33 | 5.6% |
| Communications | 26 | 4.4% |
| Arts & Humanities | 18 | 3.1% |
| Total | 587 | 100.0% |
Transportation & Commute in Alva
Vehicle Availability by Sex in Alva
The most prevalent vehicle ownership categories in Alva are males with 2 vehicles (335, accounting for 52.8%) and females with 2 vehicles (196, making up 60.1%).
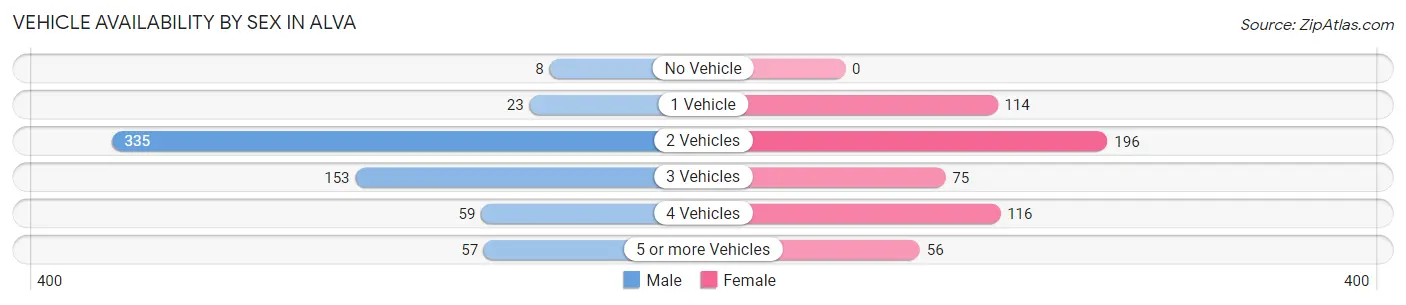
| Vehicles Available | Male | Female |
| No Vehicle | 8 (1.3%) | 0 (0.0%) |
| 1 Vehicle | 23 (3.6%) | 114 (20.5%) |
| 2 Vehicles | 335 (52.8%) | 196 (35.2%) |
| 3 Vehicles | 153 (24.1%) | 75 (13.5%) |
| 4 Vehicles | 59 (9.3%) | 116 (20.8%) |
| 5 or more Vehicles | 57 (9.0%) | 56 (10.1%) |
| Total | 635 (100.0%) | 557 (100.0%) |
Commute Time in Alva
The most frequently occuring commute durations in Alva are 30 to 34 minutes (314 commuters, 29.6%), 60 to 89 minutes (156 commuters, 14.7%), and 45 to 59 minutes (149 commuters, 14.0%).
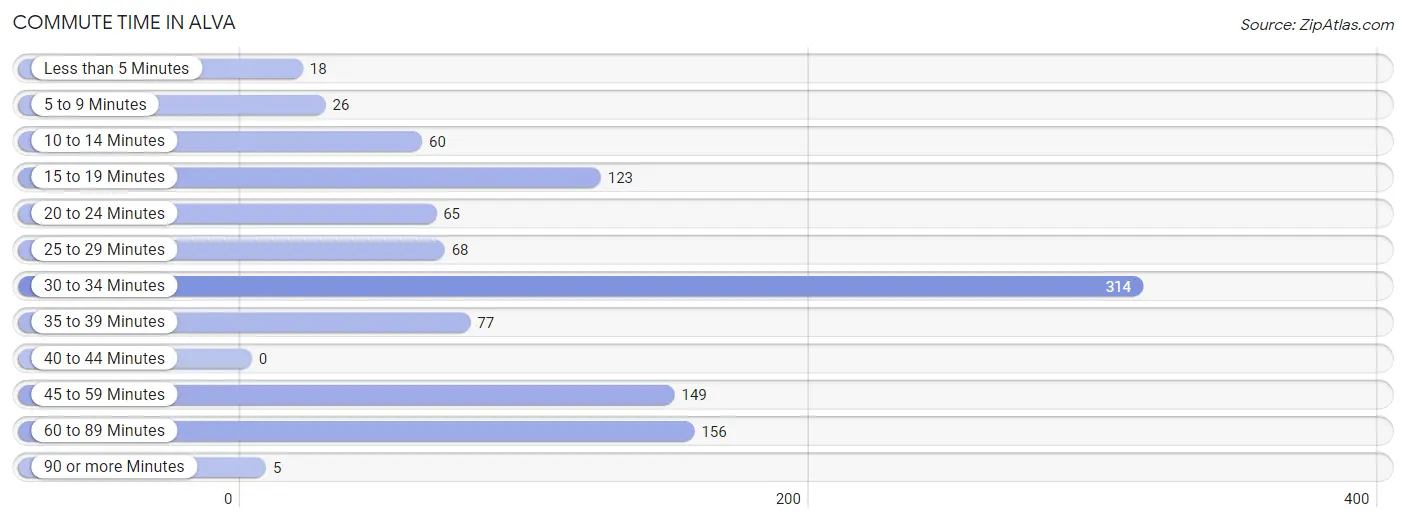
| Commute Time | # Commuters | % Commuters |
| Less than 5 Minutes | 18 | 1.7% |
| 5 to 9 Minutes | 26 | 2.5% |
| 10 to 14 Minutes | 60 | 5.7% |
| 15 to 19 Minutes | 123 | 11.6% |
| 20 to 24 Minutes | 65 | 6.1% |
| 25 to 29 Minutes | 68 | 6.4% |
| 30 to 34 Minutes | 314 | 29.6% |
| 35 to 39 Minutes | 77 | 7.3% |
| 40 to 44 Minutes | 0 | 0.0% |
| 45 to 59 Minutes | 149 | 14.0% |
| 60 to 89 Minutes | 156 | 14.7% |
| 90 or more Minutes | 5 | 0.5% |
Commute Time by Sex in Alva
The most common commute times in Alva are 30 to 34 minutes (145 commuters, 25.9%) for males and 30 to 34 minutes (169 commuters, 33.7%) for females.
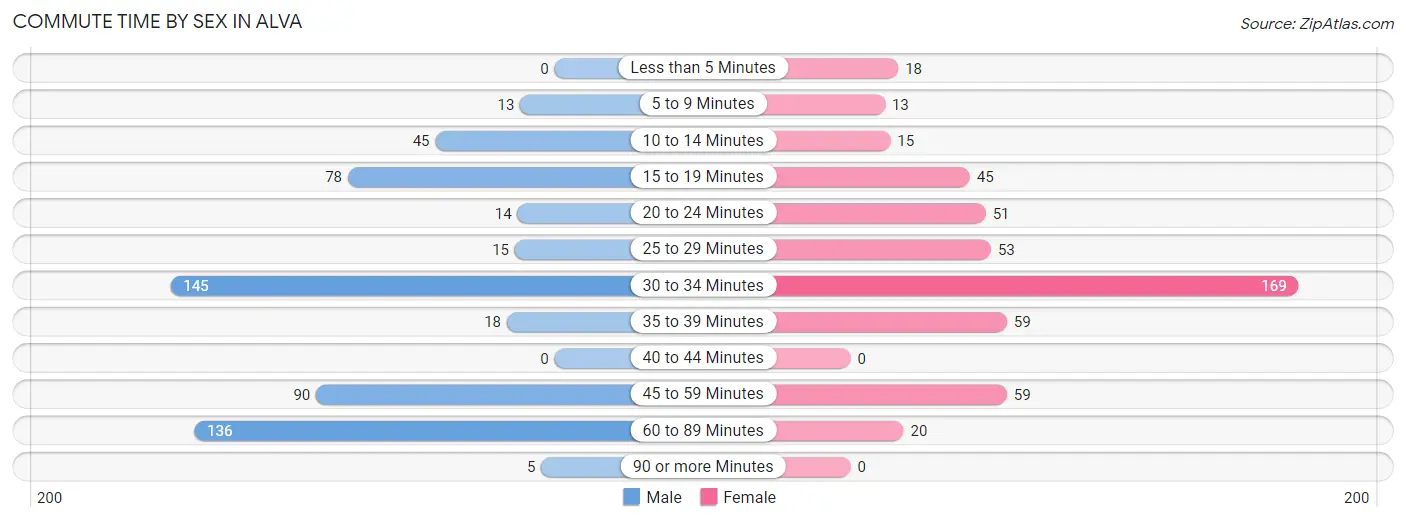
| Commute Time | Male | Female |
| Less than 5 Minutes | 0 (0.0%) | 18 (3.6%) |
| 5 to 9 Minutes | 13 (2.3%) | 13 (2.6%) |
| 10 to 14 Minutes | 45 (8.1%) | 15 (3.0%) |
| 15 to 19 Minutes | 78 (14.0%) | 45 (9.0%) |
| 20 to 24 Minutes | 14 (2.5%) | 51 (10.2%) |
| 25 to 29 Minutes | 15 (2.7%) | 53 (10.6%) |
| 30 to 34 Minutes | 145 (25.9%) | 169 (33.7%) |
| 35 to 39 Minutes | 18 (3.2%) | 59 (11.7%) |
| 40 to 44 Minutes | 0 (0.0%) | 0 (0.0%) |
| 45 to 59 Minutes | 90 (16.1%) | 59 (11.7%) |
| 60 to 89 Minutes | 136 (24.3%) | 20 (4.0%) |
| 90 or more Minutes | 5 (0.9%) | 0 (0.0%) |
Time of Departure to Work by Sex in Alva
The most frequent times of departure to work in Alva are 6:00 AM to 6:29 AM (137, 24.5%) for males and 8:00 AM to 8:29 AM (183, 36.4%) for females.
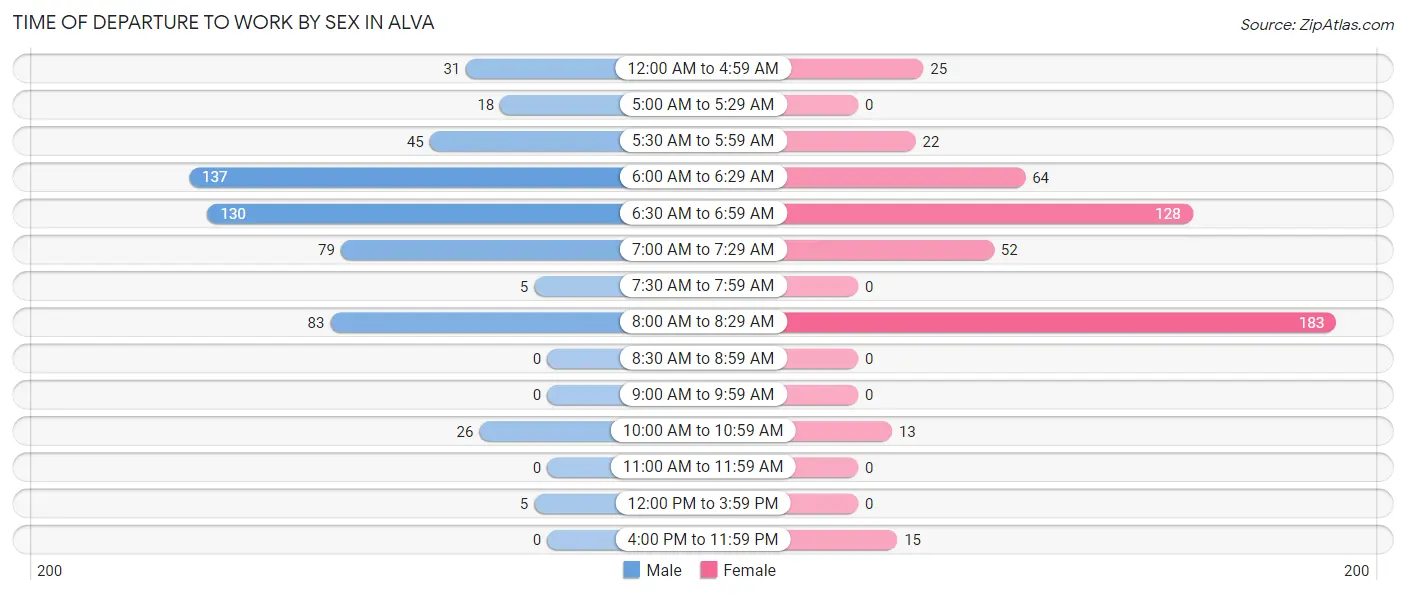
| Time of Departure | Male | Female |
| 12:00 AM to 4:59 AM | 31 (5.6%) | 25 (5.0%) |
| 5:00 AM to 5:29 AM | 18 (3.2%) | 0 (0.0%) |
| 5:30 AM to 5:59 AM | 45 (8.1%) | 22 (4.4%) |
| 6:00 AM to 6:29 AM | 137 (24.5%) | 64 (12.8%) |
| 6:30 AM to 6:59 AM | 130 (23.3%) | 128 (25.5%) |
| 7:00 AM to 7:29 AM | 79 (14.1%) | 52 (10.4%) |
| 7:30 AM to 7:59 AM | 5 (0.9%) | 0 (0.0%) |
| 8:00 AM to 8:29 AM | 83 (14.8%) | 183 (36.4%) |
| 8:30 AM to 8:59 AM | 0 (0.0%) | 0 (0.0%) |
| 9:00 AM to 9:59 AM | 0 (0.0%) | 0 (0.0%) |
| 10:00 AM to 10:59 AM | 26 (4.6%) | 13 (2.6%) |
| 11:00 AM to 11:59 AM | 0 (0.0%) | 0 (0.0%) |
| 12:00 PM to 3:59 PM | 5 (0.9%) | 0 (0.0%) |
| 4:00 PM to 11:59 PM | 0 (0.0%) | 15 (3.0%) |
| Total | 559 (100.0%) | 502 (100.0%) |
Housing Occupancy in Alva
Occupancy by Ownership in Alva
Of the total 1,201 dwellings in Alva, owner-occupied units account for 1,125 (93.7%), while renter-occupied units make up 76 (6.3%).
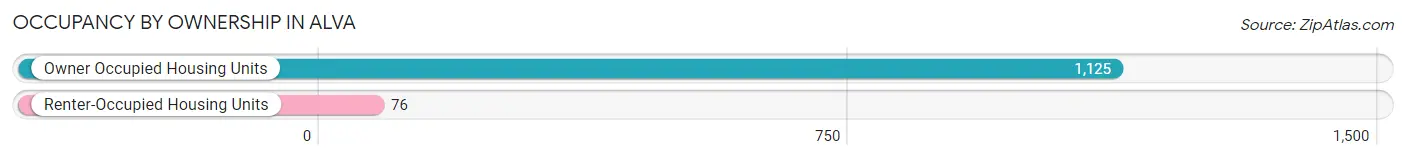
| Occupancy | # Housing Units | % Housing Units |
| Owner Occupied Housing Units | 1,125 | 93.7% |
| Renter-Occupied Housing Units | 76 | 6.3% |
| Total Occupied Housing Units | 1,201 | 100.0% |
Occupancy by Household Size in Alva
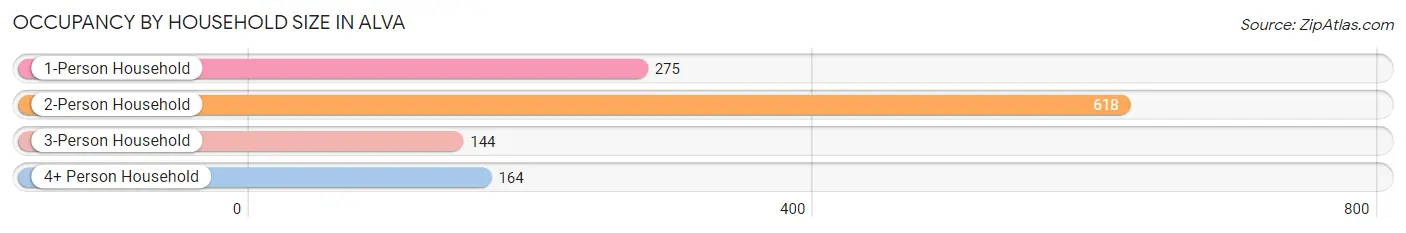
| Household Size | # Housing Units | % Housing Units |
| 1-Person Household | 275 | 22.9% |
| 2-Person Household | 618 | 51.5% |
| 3-Person Household | 144 | 12.0% |
| 4+ Person Household | 164 | 13.7% |
| Total Housing Units | 1,201 | 100.0% |
Occupancy by Ownership by Household Size in Alva
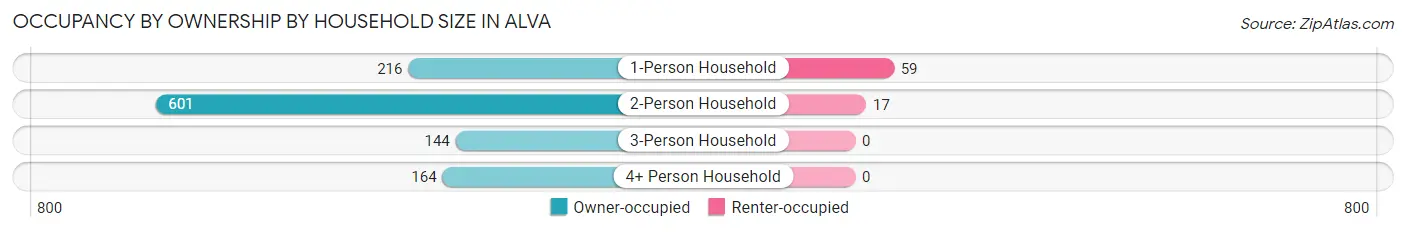
| Household Size | Owner-occupied | Renter-occupied |
| 1-Person Household | 216 (78.5%) | 59 (21.4%) |
| 2-Person Household | 601 (97.3%) | 17 (2.8%) |
| 3-Person Household | 144 (100.0%) | 0 (0.0%) |
| 4+ Person Household | 164 (100.0%) | 0 (0.0%) |
| Total Housing Units | 1,125 (93.7%) | 76 (6.3%) |
Occupancy by Educational Attainment in Alva
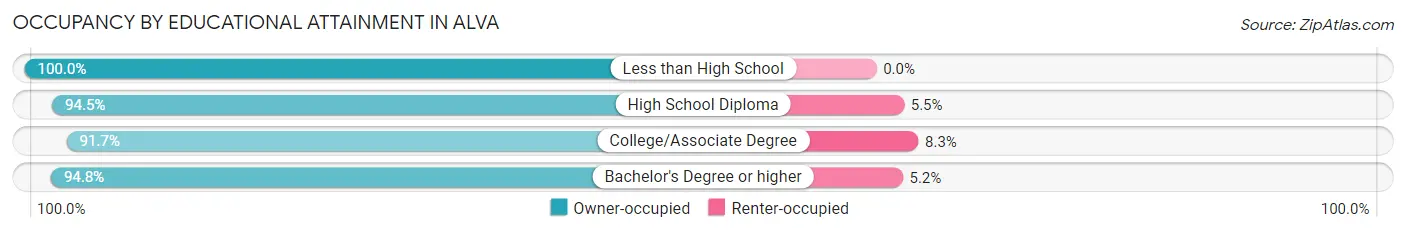
| Household Size | Owner-occupied | Renter-occupied |
| Less than High School | 47 (100.0%) | 0 (0.0%) |
| High School Diploma | 311 (94.5%) | 18 (5.5%) |
| College/Associate Degree | 441 (91.7%) | 40 (8.3%) |
| Bachelor's Degree or higher | 326 (94.8%) | 18 (5.2%) |
Occupancy by Age of Householder in Alva
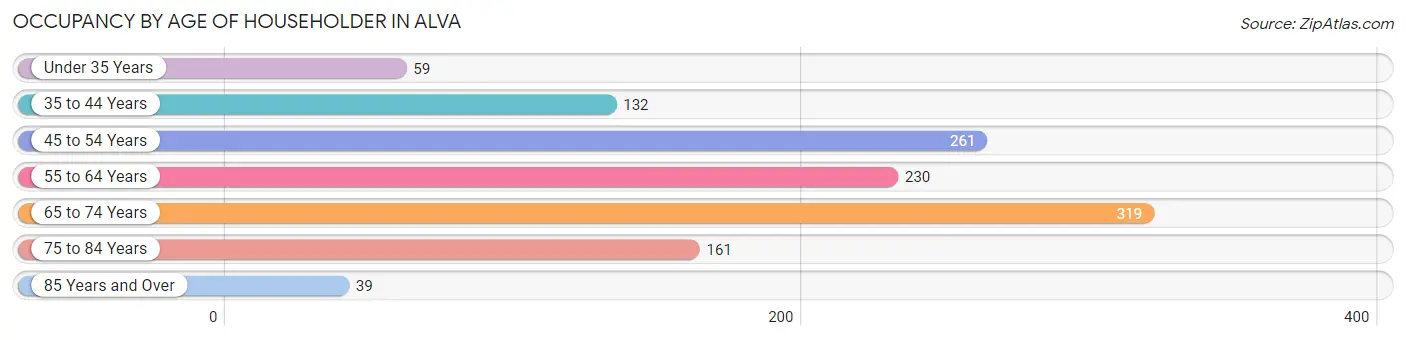
| Age Bracket | # Households | % Households |
| Under 35 Years | 59 | 4.9% |
| 35 to 44 Years | 132 | 11.0% |
| 45 to 54 Years | 261 | 21.7% |
| 55 to 64 Years | 230 | 19.2% |
| 65 to 74 Years | 319 | 26.6% |
| 75 to 84 Years | 161 | 13.4% |
| 85 Years and Over | 39 | 3.3% |
| Total | 1,201 | 100.0% |
Housing Finances in Alva
Median Income by Occupancy in Alva
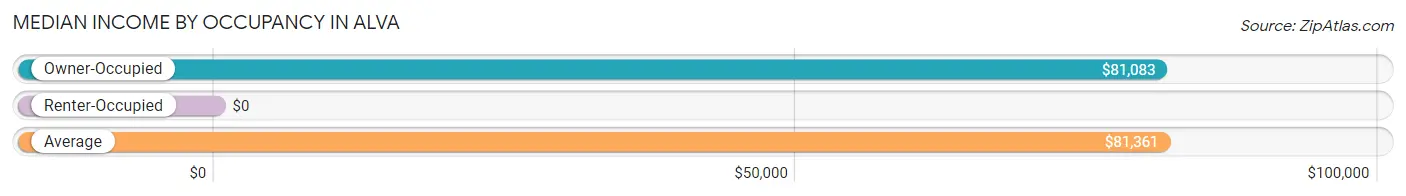
| Occupancy Type | # Households | Median Income |
| Owner-Occupied | 1,125 (93.7%) | $81,083 |
| Renter-Occupied | 76 (6.3%) | $0 |
| Average | 1,201 (100.0%) | $81,361 |
Occupancy by Householder Income Bracket in Alva
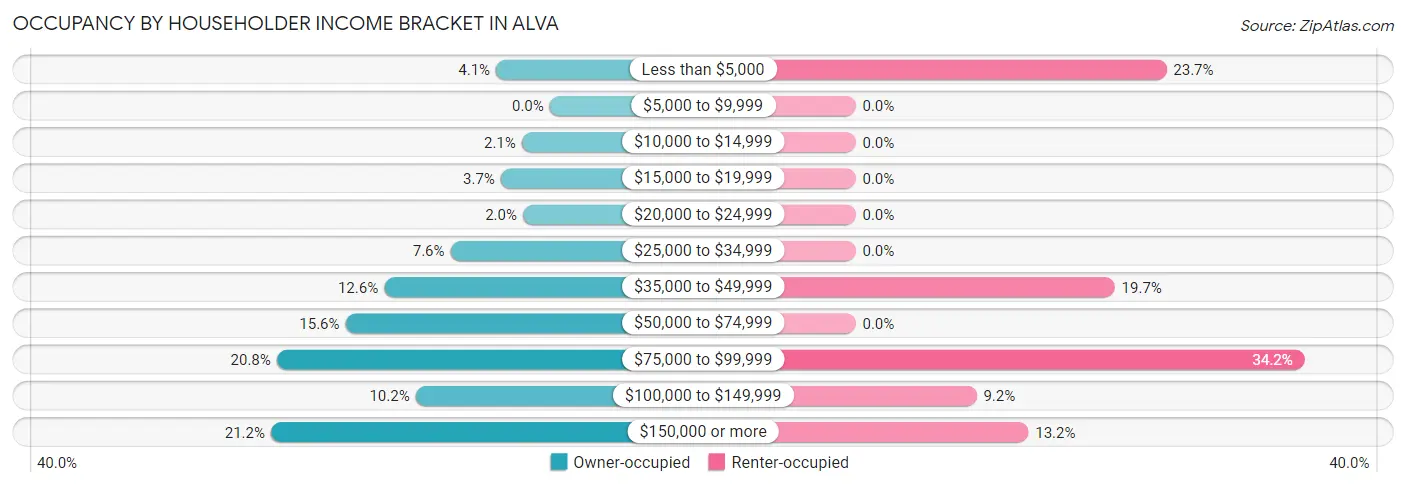
| Income Bracket | Owner-occupied | Renter-occupied |
| Less than $5,000 | 46 (4.1%) | 18 (23.7%) |
| $5,000 to $9,999 | 0 (0.0%) | 0 (0.0%) |
| $10,000 to $14,999 | 24 (2.1%) | 0 (0.0%) |
| $15,000 to $19,999 | 42 (3.7%) | 0 (0.0%) |
| $20,000 to $24,999 | 23 (2.0%) | 0 (0.0%) |
| $25,000 to $34,999 | 85 (7.6%) | 0 (0.0%) |
| $35,000 to $49,999 | 142 (12.6%) | 15 (19.7%) |
| $50,000 to $74,999 | 175 (15.6%) | 0 (0.0%) |
| $75,000 to $99,999 | 234 (20.8%) | 26 (34.2%) |
| $100,000 to $149,999 | 115 (10.2%) | 7 (9.2%) |
| $150,000 or more | 239 (21.2%) | 10 (13.2%) |
| Total | 1,125 (100.0%) | 76 (100.0%) |
Monthly Housing Cost Tiers in Alva
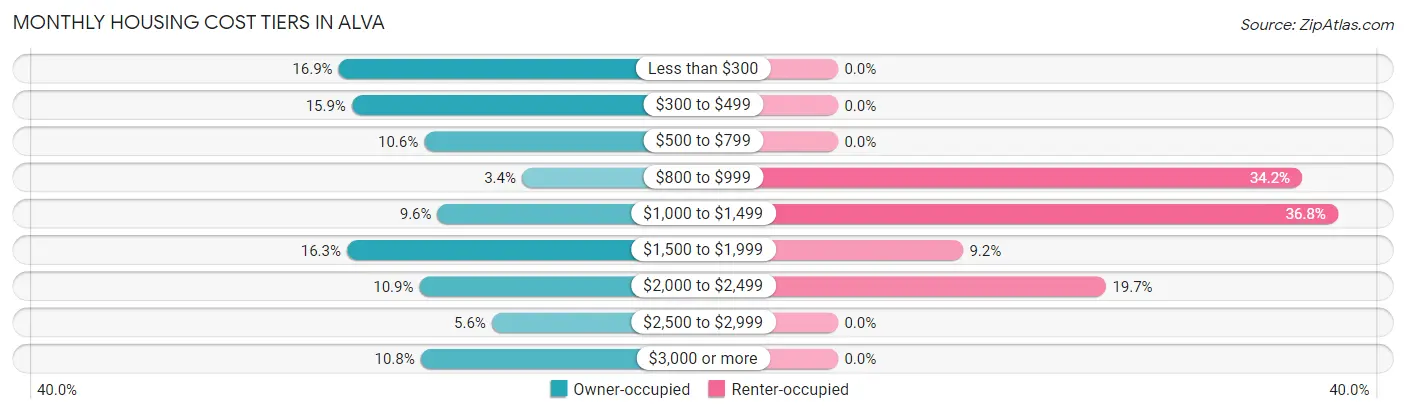
| Monthly Cost | Owner-occupied | Renter-occupied |
| Less than $300 | 190 (16.9%) | 0 (0.0%) |
| $300 to $499 | 179 (15.9%) | 0 (0.0%) |
| $500 to $799 | 119 (10.6%) | 0 (0.0%) |
| $800 to $999 | 38 (3.4%) | 26 (34.2%) |
| $1,000 to $1,499 | 108 (9.6%) | 28 (36.8%) |
| $1,500 to $1,999 | 183 (16.3%) | 7 (9.2%) |
| $2,000 to $2,499 | 123 (10.9%) | 15 (19.7%) |
| $2,500 to $2,999 | 63 (5.6%) | 0 (0.0%) |
| $3,000 or more | 122 (10.8%) | 0 (0.0%) |
| Total | 1,125 (100.0%) | 76 (100.0%) |
Physical Housing Characteristics in Alva
Housing Structures in Alva
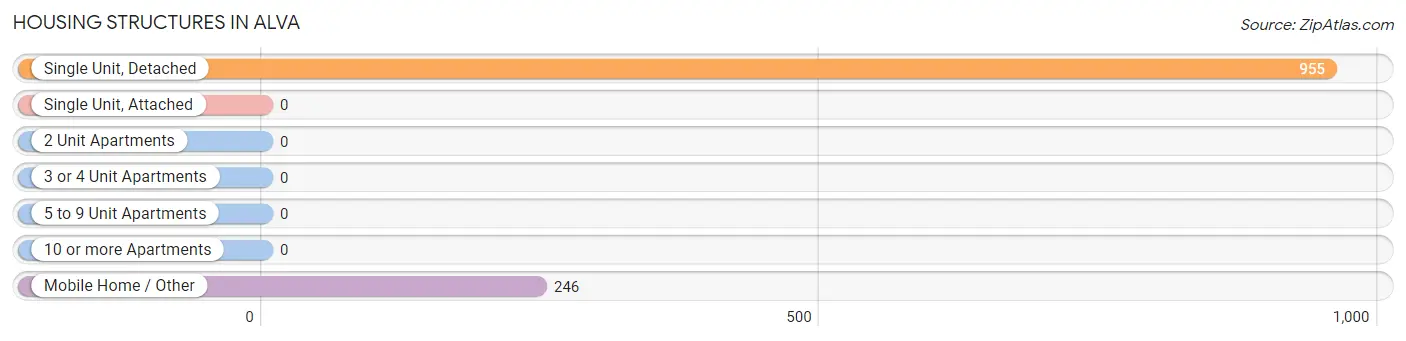
| Structure Type | # Housing Units | % Housing Units |
| Single Unit, Detached | 955 | 79.5% |
| Single Unit, Attached | 0 | 0.0% |
| 2 Unit Apartments | 0 | 0.0% |
| 3 or 4 Unit Apartments | 0 | 0.0% |
| 5 to 9 Unit Apartments | 0 | 0.0% |
| 10 or more Apartments | 0 | 0.0% |
| Mobile Home / Other | 246 | 20.5% |
| Total | 1,201 | 100.0% |
Housing Structures by Occupancy in Alva
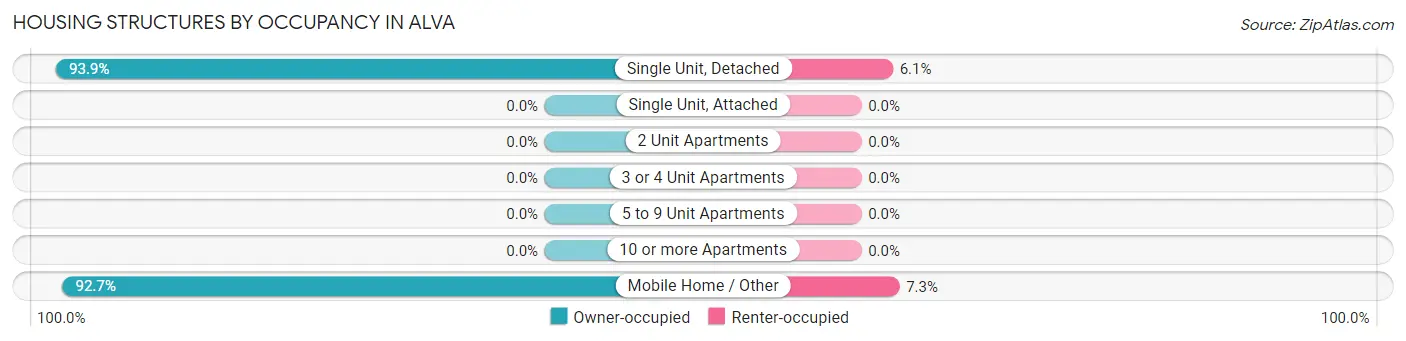
| Structure Type | Owner-occupied | Renter-occupied |
| Single Unit, Detached | 897 (93.9%) | 58 (6.1%) |
| Single Unit, Attached | 0 (0.0%) | 0 (0.0%) |
| 2 Unit Apartments | 0 (0.0%) | 0 (0.0%) |
| 3 or 4 Unit Apartments | 0 (0.0%) | 0 (0.0%) |
| 5 to 9 Unit Apartments | 0 (0.0%) | 0 (0.0%) |
| 10 or more Apartments | 0 (0.0%) | 0 (0.0%) |
| Mobile Home / Other | 228 (92.7%) | 18 (7.3%) |
| Total | 1,125 (93.7%) | 76 (6.3%) |
Housing Structures by Number of Rooms in Alva
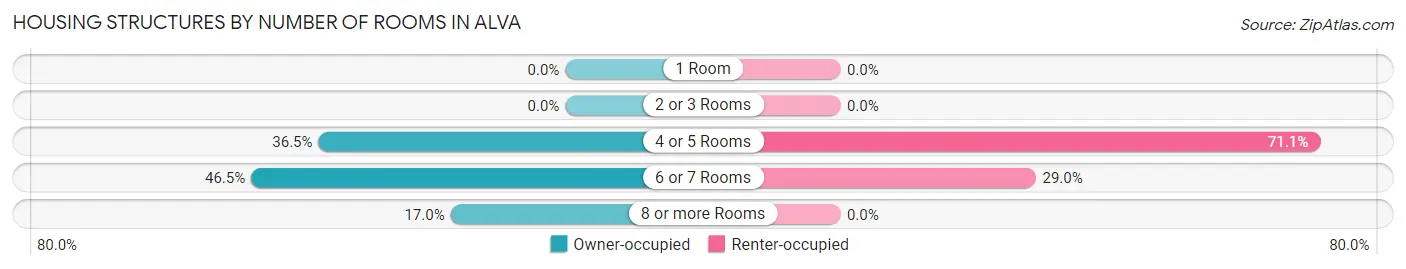
| Number of Rooms | Owner-occupied | Renter-occupied |
| 1 Room | 0 (0.0%) | 0 (0.0%) |
| 2 or 3 Rooms | 0 (0.0%) | 0 (0.0%) |
| 4 or 5 Rooms | 411 (36.5%) | 54 (71.1%) |
| 6 or 7 Rooms | 523 (46.5%) | 22 (28.9%) |
| 8 or more Rooms | 191 (17.0%) | 0 (0.0%) |
| Total | 1,125 (100.0%) | 76 (100.0%) |
Housing Structure by Heating Type in Alva
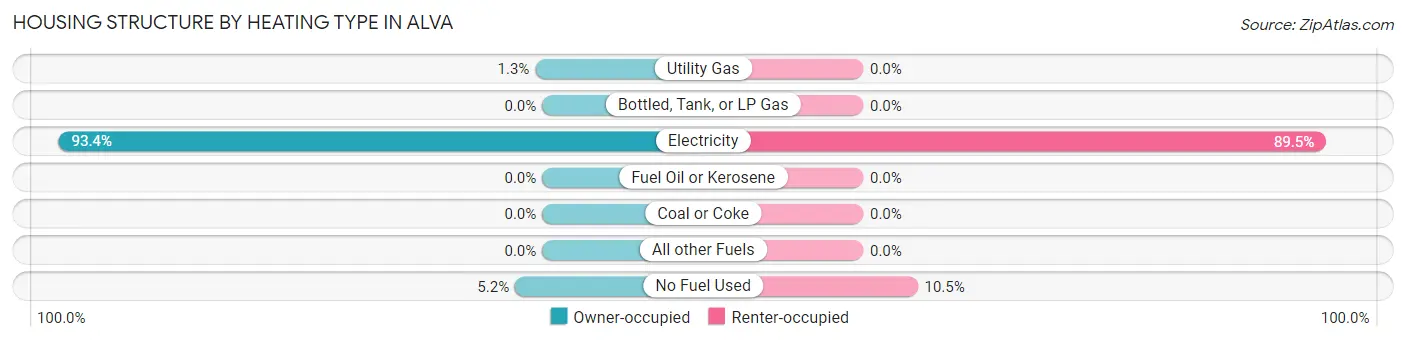
| Heating Type | Owner-occupied | Renter-occupied |
| Utility Gas | 15 (1.3%) | 0 (0.0%) |
| Bottled, Tank, or LP Gas | 0 (0.0%) | 0 (0.0%) |
| Electricity | 1,051 (93.4%) | 68 (89.5%) |
| Fuel Oil or Kerosene | 0 (0.0%) | 0 (0.0%) |
| Coal or Coke | 0 (0.0%) | 0 (0.0%) |
| All other Fuels | 0 (0.0%) | 0 (0.0%) |
| No Fuel Used | 59 (5.2%) | 8 (10.5%) |
| Total | 1,125 (100.0%) | 76 (100.0%) |
Household Vehicle Usage in Alva
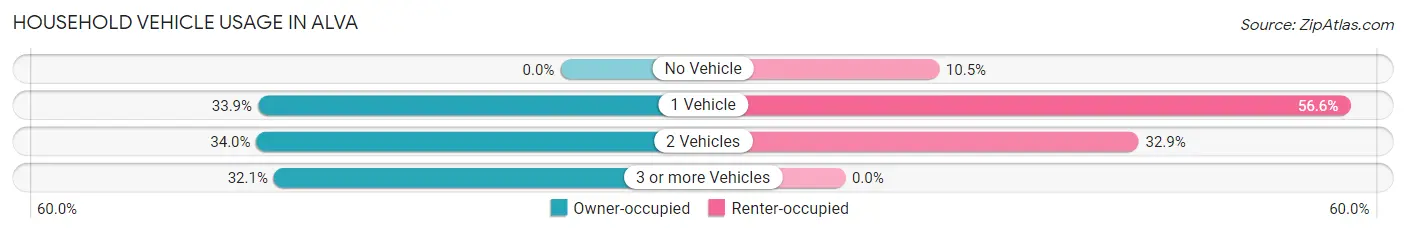
| Vehicles per Household | Owner-occupied | Renter-occupied |
| No Vehicle | 0 (0.0%) | 8 (10.5%) |
| 1 Vehicle | 381 (33.9%) | 43 (56.6%) |
| 2 Vehicles | 383 (34.0%) | 25 (32.9%) |
| 3 or more Vehicles | 361 (32.1%) | 0 (0.0%) |
| Total | 1,125 (100.0%) | 76 (100.0%) |
Real Estate & Mortgages in Alva
Real Estate and Mortgage Overview in Alva
| Characteristic | Without Mortgage | With Mortgage |
| Housing Units | 576 | 549 |
| Median Property Value | $170,500 | $434,800 |
| Median Household Income | $55,588 | $191 |
| Monthly Housing Costs | $376 | $122 |
| Real Estate Taxes | $942 | $0 |
Property Value by Mortgage Status in Alva
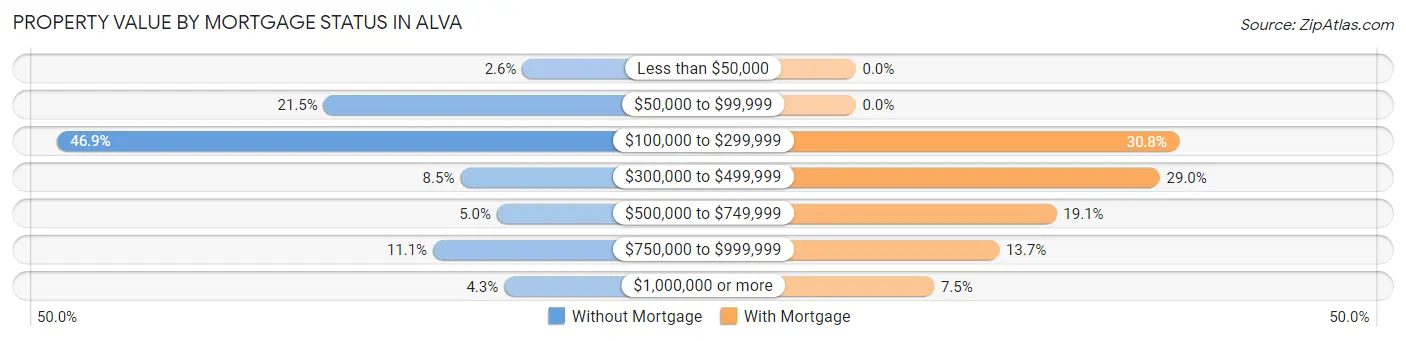
| Property Value | Without Mortgage | With Mortgage |
| Less than $50,000 | 15 (2.6%) | 0 (0.0%) |
| $50,000 to $99,999 | 124 (21.5%) | 0 (0.0%) |
| $100,000 to $299,999 | 270 (46.9%) | 169 (30.8%) |
| $300,000 to $499,999 | 49 (8.5%) | 159 (29.0%) |
| $500,000 to $749,999 | 29 (5.0%) | 105 (19.1%) |
| $750,000 to $999,999 | 64 (11.1%) | 75 (13.7%) |
| $1,000,000 or more | 25 (4.3%) | 41 (7.5%) |
| Total | 576 (100.0%) | 549 (100.0%) |
Household Income by Mortgage Status in Alva
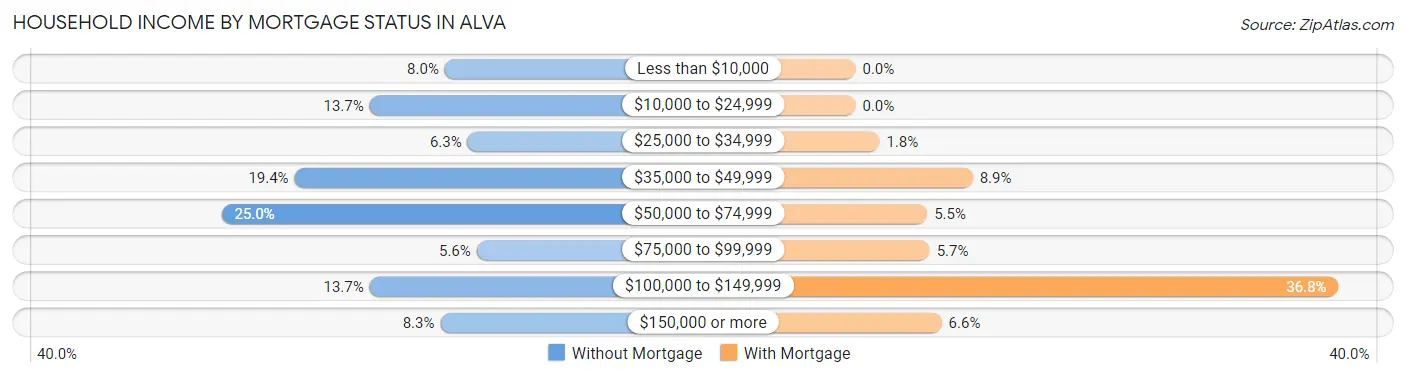
| Household Income | Without Mortgage | With Mortgage |
| Less than $10,000 | 46 (8.0%) | 0 (0.0%) |
| $10,000 to $24,999 | 79 (13.7%) | 0 (0.0%) |
| $25,000 to $34,999 | 36 (6.2%) | 10 (1.8%) |
| $35,000 to $49,999 | 112 (19.4%) | 49 (8.9%) |
| $50,000 to $74,999 | 144 (25.0%) | 30 (5.5%) |
| $75,000 to $99,999 | 32 (5.6%) | 31 (5.7%) |
| $100,000 to $149,999 | 79 (13.7%) | 202 (36.8%) |
| $150,000 or more | 48 (8.3%) | 36 (6.6%) |
| Total | 576 (100.0%) | 549 (100.0%) |
Property Value to Household Income Ratio in Alva
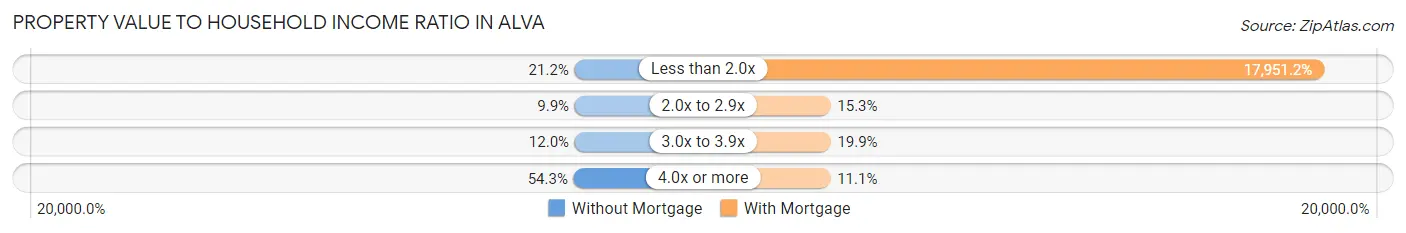
| Value-to-Income Ratio | Without Mortgage | With Mortgage |
| Less than 2.0x | 122 (21.2%) | 98,552 (17,951.2%) |
| 2.0x to 2.9x | 57 (9.9%) | 84 (15.3%) |
| 3.0x to 3.9x | 69 (12.0%) | 109 (19.9%) |
| 4.0x or more | 313 (54.3%) | 61 (11.1%) |
| Total | 576 (100.0%) | 549 (100.0%) |
Real Estate Taxes by Mortgage Status in Alva
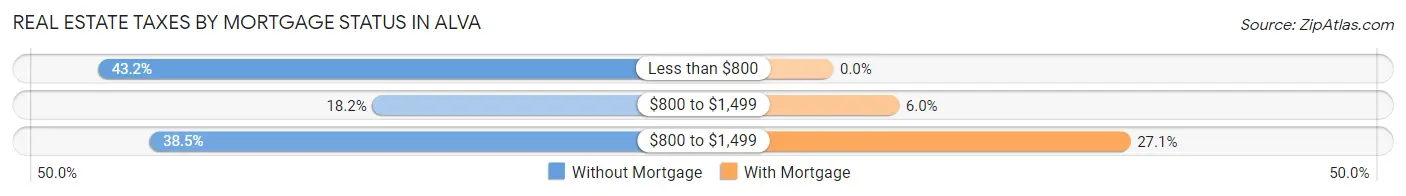
| Property Taxes | Without Mortgage | With Mortgage |
| Less than $800 | 249 (43.2%) | 0 (0.0%) |
| $800 to $1,499 | 105 (18.2%) | 33 (6.0%) |
| $800 to $1,499 | 222 (38.5%) | 149 (27.1%) |
| Total | 576 (100.0%) | 549 (100.0%) |
Health & Disability in Alva
Health Insurance Coverage by Age in Alva
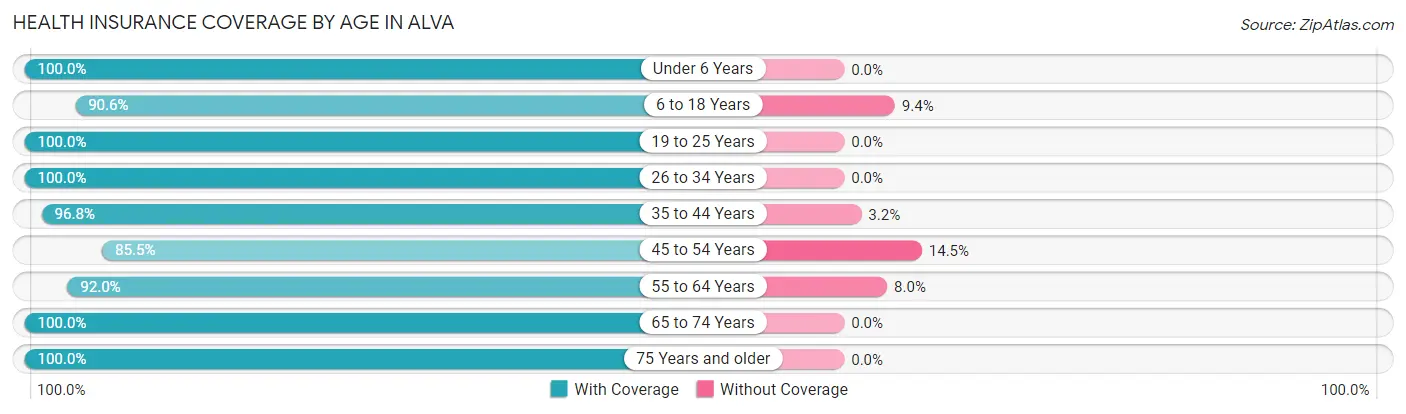
| Age Bracket | With Coverage | Without Coverage |
| Under 6 Years | 157 (100.0%) | 0 (0.0%) |
| 6 to 18 Years | 422 (90.6%) | 44 (9.4%) |
| 19 to 25 Years | 133 (100.0%) | 0 (0.0%) |
| 26 to 34 Years | 55 (100.0%) | 0 (0.0%) |
| 35 to 44 Years | 334 (96.8%) | 11 (3.2%) |
| 45 to 54 Years | 390 (85.5%) | 66 (14.5%) |
| 55 to 64 Years | 357 (92.0%) | 31 (8.0%) |
| 65 to 74 Years | 609 (100.0%) | 0 (0.0%) |
| 75 Years and older | 377 (100.0%) | 0 (0.0%) |
| Total | 2,834 (94.9%) | 152 (5.1%) |
Health Insurance Coverage by Citizenship Status in Alva
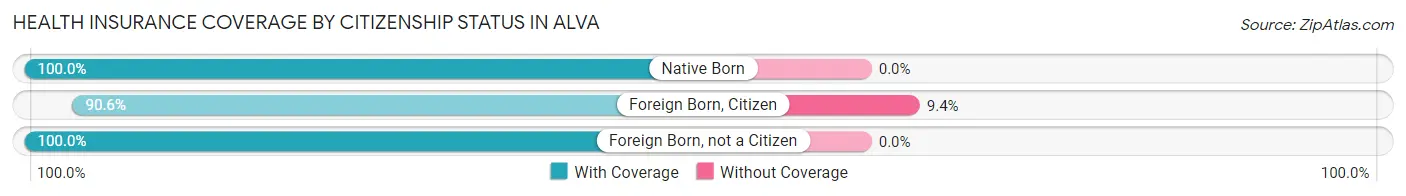
| Citizenship Status | With Coverage | Without Coverage |
| Native Born | 157 (100.0%) | 0 (0.0%) |
| Foreign Born, Citizen | 422 (90.6%) | 44 (9.4%) |
| Foreign Born, not a Citizen | 133 (100.0%) | 0 (0.0%) |
Health Insurance Coverage by Household Income in Alva
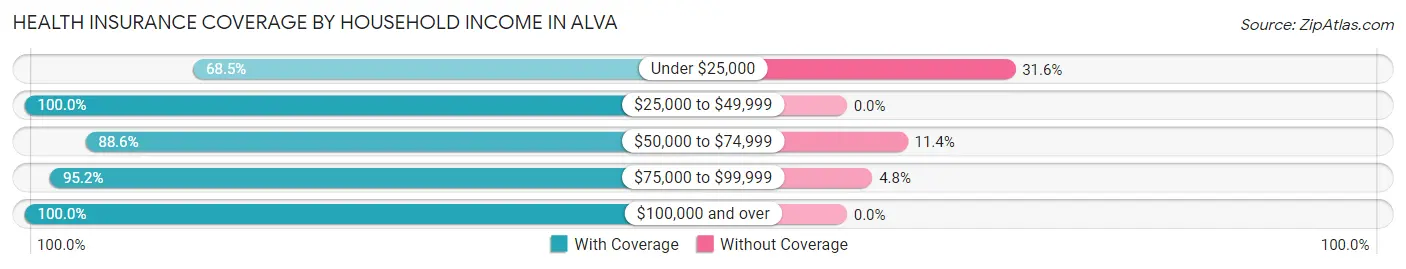
| Household Income | With Coverage | Without Coverage |
| Under $25,000 | 141 (68.4%) | 65 (31.6%) |
| $25,000 to $49,999 | 498 (100.0%) | 0 (0.0%) |
| $50,000 to $74,999 | 335 (88.6%) | 43 (11.4%) |
| $75,000 to $99,999 | 881 (95.2%) | 44 (4.8%) |
| $100,000 and over | 979 (100.0%) | 0 (0.0%) |
Public vs Private Health Insurance Coverage by Age in Alva
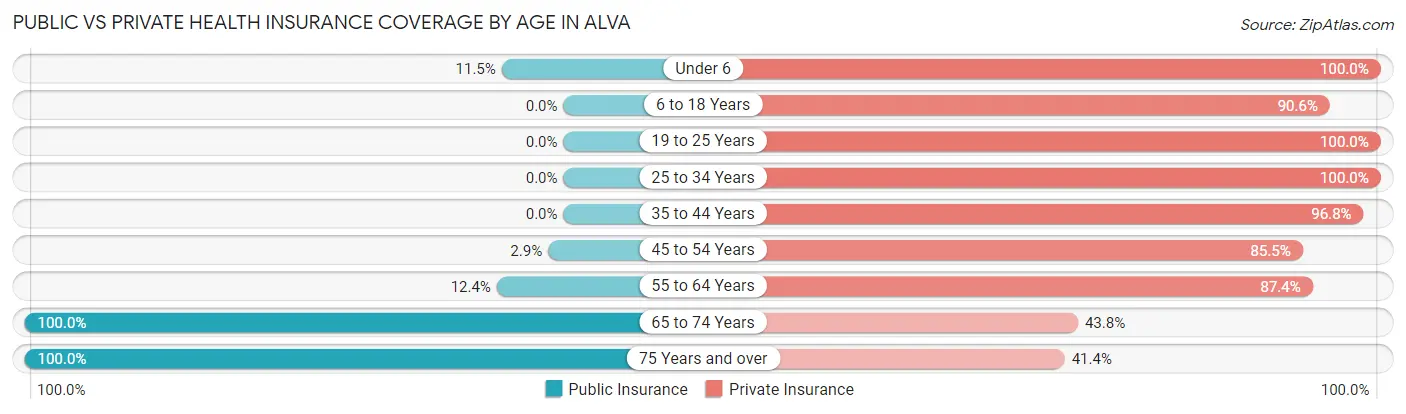
| Age Bracket | Public Insurance | Private Insurance |
| Under 6 | 18 (11.5%) | 157 (100.0%) |
| 6 to 18 Years | 0 (0.0%) | 422 (90.6%) |
| 19 to 25 Years | 0 (0.0%) | 133 (100.0%) |
| 25 to 34 Years | 0 (0.0%) | 55 (100.0%) |
| 35 to 44 Years | 0 (0.0%) | 334 (96.8%) |
| 45 to 54 Years | 13 (2.9%) | 390 (85.5%) |
| 55 to 64 Years | 48 (12.4%) | 339 (87.4%) |
| 65 to 74 Years | 609 (100.0%) | 267 (43.8%) |
| 75 Years and over | 377 (100.0%) | 156 (41.4%) |
| Total | 1,065 (35.7%) | 2,253 (75.4%) |
Disability Status by Sex by Age in Alva
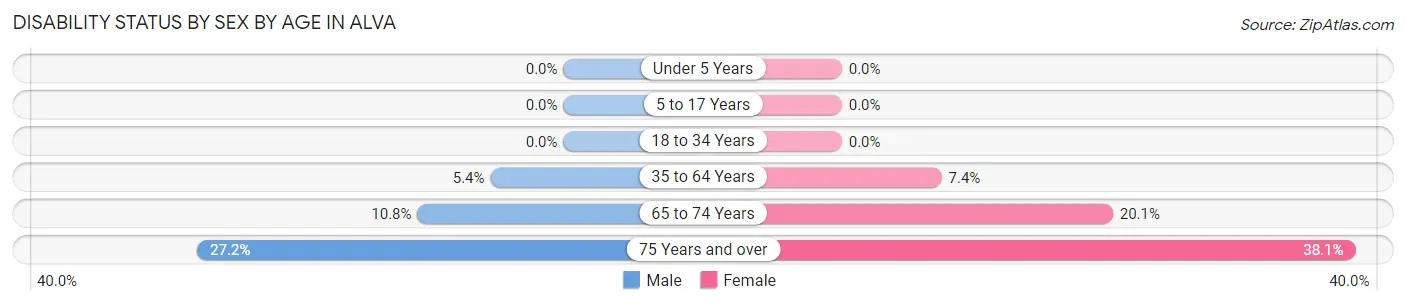
| Age Bracket | Male | Female |
| Under 5 Years | 0 (0.0%) | 0 (0.0%) |
| 5 to 17 Years | 0 (0.0%) | 0 (0.0%) |
| 18 to 34 Years | 0 (0.0%) | 0 (0.0%) |
| 35 to 64 Years | 33 (5.4%) | 43 (7.4%) |
| 65 to 74 Years | 31 (10.8%) | 65 (20.1%) |
| 75 Years and over | 59 (27.2%) | 61 (38.1%) |
Disability Class by Sex by Age in Alva
Disability Class: Hearing Difficulty
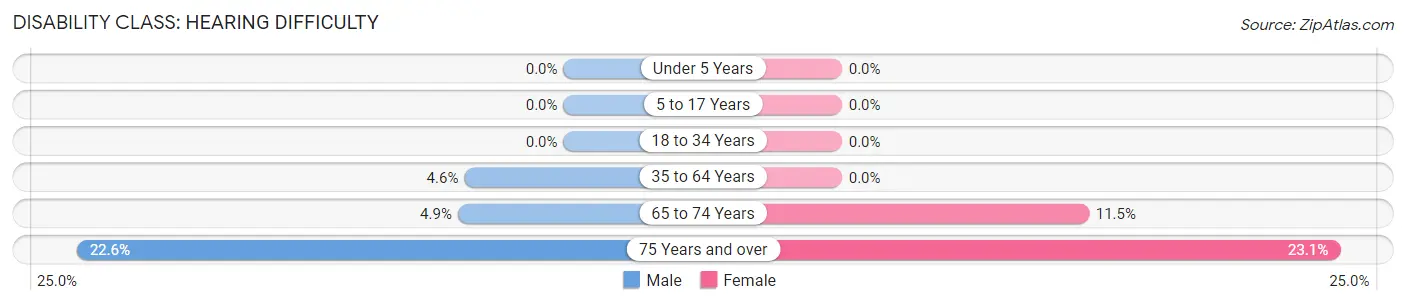
| Age Bracket | Male | Female |
| Under 5 Years | 0 (0.0%) | 0 (0.0%) |
| 5 to 17 Years | 0 (0.0%) | 0 (0.0%) |
| 18 to 34 Years | 0 (0.0%) | 0 (0.0%) |
| 35 to 64 Years | 28 (4.6%) | 0 (0.0%) |
| 65 to 74 Years | 14 (4.9%) | 37 (11.5%) |
| 75 Years and over | 49 (22.6%) | 37 (23.1%) |
Disability Class: Vision Difficulty
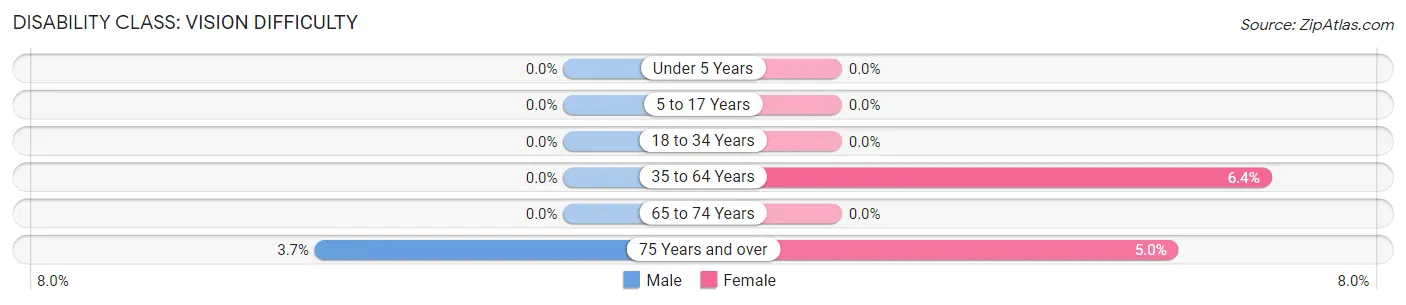
| Age Bracket | Male | Female |
| Under 5 Years | 0 (0.0%) | 0 (0.0%) |
| 5 to 17 Years | 0 (0.0%) | 0 (0.0%) |
| 18 to 34 Years | 0 (0.0%) | 0 (0.0%) |
| 35 to 64 Years | 0 (0.0%) | 37 (6.4%) |
| 65 to 74 Years | 0 (0.0%) | 0 (0.0%) |
| 75 Years and over | 8 (3.7%) | 8 (5.0%) |
Disability Class: Cognitive Difficulty
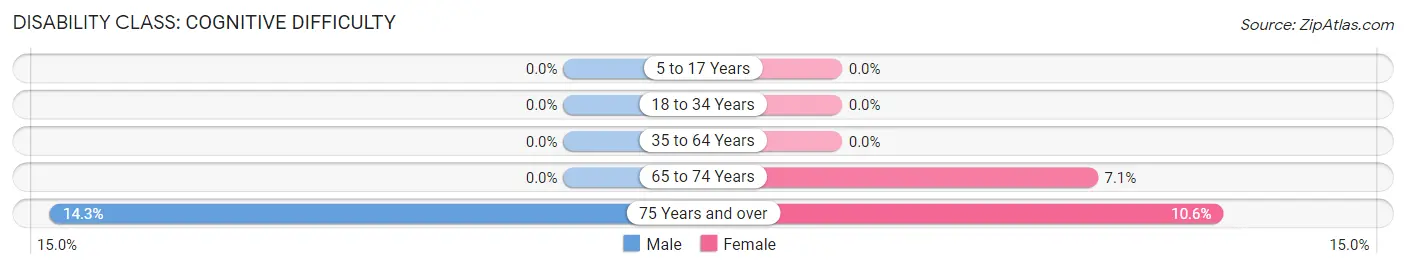
| Age Bracket | Male | Female |
| 5 to 17 Years | 0 (0.0%) | 0 (0.0%) |
| 18 to 34 Years | 0 (0.0%) | 0 (0.0%) |
| 35 to 64 Years | 0 (0.0%) | 0 (0.0%) |
| 65 to 74 Years | 0 (0.0%) | 23 (7.1%) |
| 75 Years and over | 31 (14.3%) | 17 (10.6%) |
Disability Class: Ambulatory Difficulty
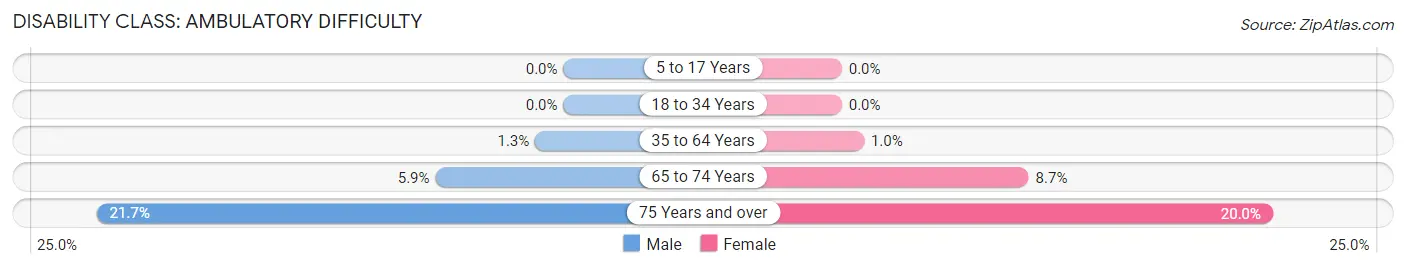
| Age Bracket | Male | Female |
| 5 to 17 Years | 0 (0.0%) | 0 (0.0%) |
| 18 to 34 Years | 0 (0.0%) | 0 (0.0%) |
| 35 to 64 Years | 8 (1.3%) | 6 (1.0%) |
| 65 to 74 Years | 17 (5.9%) | 28 (8.7%) |
| 75 Years and over | 47 (21.7%) | 32 (20.0%) |
Disability Class: Self-Care Difficulty
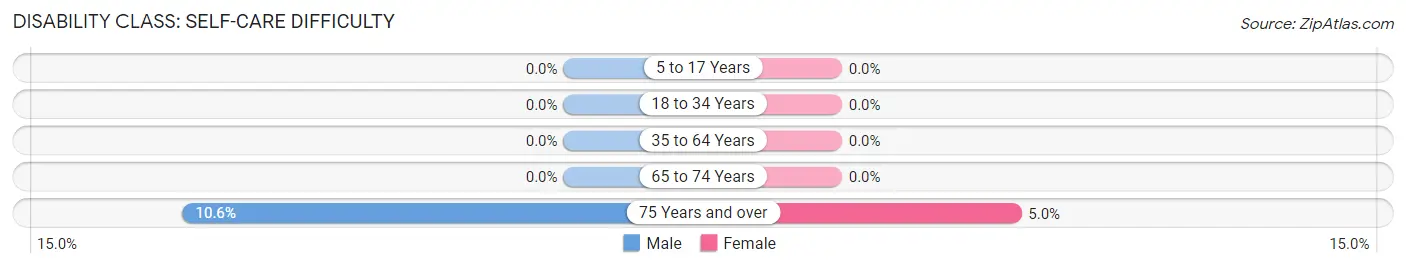
| Age Bracket | Male | Female |
| 5 to 17 Years | 0 (0.0%) | 0 (0.0%) |
| 18 to 34 Years | 0 (0.0%) | 0 (0.0%) |
| 35 to 64 Years | 0 (0.0%) | 0 (0.0%) |
| 65 to 74 Years | 0 (0.0%) | 0 (0.0%) |
| 75 Years and over | 23 (10.6%) | 8 (5.0%) |
Technology Access in Alva
Computing Device Access in Alva
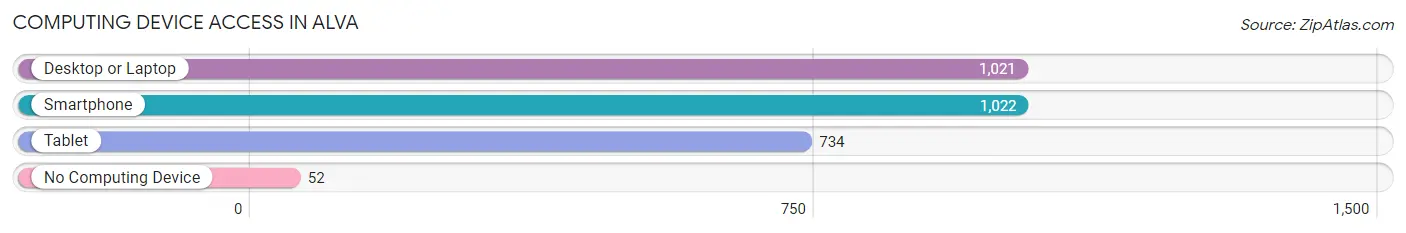
| Device Type | # Households | % Households |
| Desktop or Laptop | 1,021 | 85.0% |
| Smartphone | 1,022 | 85.1% |
| Tablet | 734 | 61.1% |
| No Computing Device | 52 | 4.3% |
| Total | 1,201 | 100.0% |
Internet Access in Alva
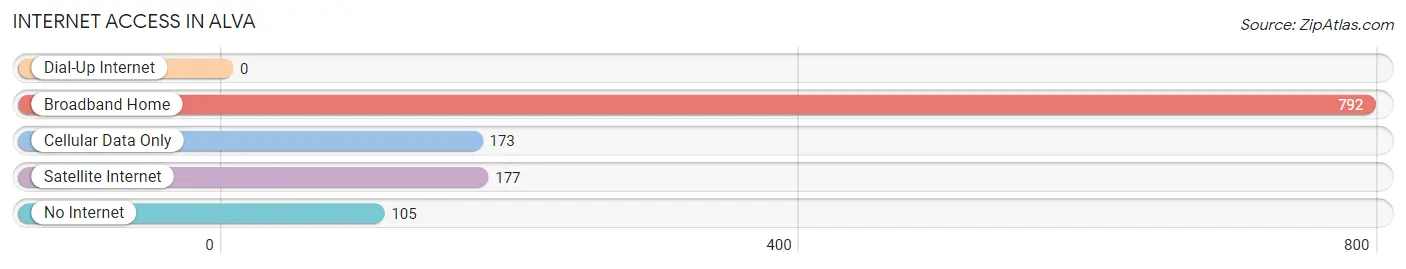
| Internet Type | # Households | % Households |
| Dial-Up Internet | 0 | 0.0% |
| Broadband Home | 792 | 65.9% |
| Cellular Data Only | 173 | 14.4% |
| Satellite Internet | 177 | 14.7% |
| No Internet | 105 | 8.7% |
| Total | 1,201 | 100.0% |
Alva Summary
Alva is a small unincorporated community located in Lee County, Florida. It is situated on the Caloosahatchee River, approximately 20 miles east of Fort Myers. The population of Alva was estimated to be 1,845 in 2019.
History
Alva was first settled in the late 1800s by settlers from the Midwest. The town was named after Alva Adams, the first postmaster of the area. The first post office was established in 1887.
In the early 1900s, Alva was a thriving agricultural community. The town was known for its citrus groves, cattle ranches, and vegetable farms. The town also had a sawmill and a turpentine still.
In the 1920s, Alva began to experience a population boom. The town was incorporated in 1925 and the first mayor was elected in 1926.
In the 1950s, Alva began to experience a decline in population. The town was unincorporated in 1959 and the post office closed in 1960.
Geography
Alva is located in Lee County, Florida. It is situated on the Caloosahatchee River, approximately 20 miles east of Fort Myers. The town is bordered by the Caloosahatchee River to the north, the Alva Canal to the east, and the Caloosahatchee River to the south.
The town has a total area of 4.2 square miles, all of which is land. The terrain is mostly flat and the soil is sandy.
Economy
Alva is primarily a residential community. The town does not have any major industries or businesses.
The town is home to several small businesses, including a grocery store, a hardware store, and a few restaurants. The town also has a few small farms and ranches.
Demographics
As of 2019, the population of Alva was estimated to be 1,845. The racial makeup of the town was 94.3% White, 2.2% African American, 0.7% Native American, 0.7% Asian, 0.3% Pacific Islander, and 1.9% from other races.
The median household income in Alva was $45,000 in 2019. The median home value was $150,000. The median age of the population was 44.
Conclusion
Alva is a small unincorporated community located in Lee County, Florida. It is situated on the Caloosahatchee River, approximately 20 miles east of Fort Myers. The population of Alva was estimated to be 1,845 in 2019. The town has a total area of 4.2 square miles, all of which is land. The terrain is mostly flat and the soil is sandy. Alva is primarily a residential community and does not have any major industries or businesses. The median household income in Alva was $45,000 in 2019. The median home value was $150,000. The median age of the population was 44.
Common Questions
What is Per Capita Income in Alva?
Per Capita income in Alva is $38,966.
What is the Median Family Income in Alva?
Median Family Income in Alva is $97,637.
What is the Median Household income in Alva?
Median Household Income in Alva is $81,361.
What is Income or Wage Gap in Alva?
Income or Wage Gap in Alva is 42.4%.
Women in Alva earn 57.6 cents for every dollar earned by a man.
What is Family Income Deficit in Alva?
Family Income Deficit in Alva is $10,386.
Families that are below poverty line in Alva earn $10,386 less on average than the poverty threshold level.
What is Inequality or Gini Index in Alva?
Inequality or Gini Index in Alva is 0.40.
What is the Total Population of Alva?
Total Population of Alva is 2,986.
What is the Total Male Population of Alva?
Total Male Population of Alva is 1,573.
What is the Total Female Population of Alva?
Total Female Population of Alva is 1,413.
What is the Ratio of Males per 100 Females in Alva?
There are 111.32 Males per 100 Females in Alva.
What is the Ratio of Females per 100 Males in Alva?
There are 89.83 Females per 100 Males in Alva.
What is the Median Population Age in Alva?
Median Population Age in Alva is 52.6 Years.
What is the Average Family Size in Alva
Average Family Size in Alva is 2.9 People.
What is the Average Household Size in Alva
Average Household Size in Alva is 2.5 People.
How Large is the Labor Force in Alva?
There are 1,236 People in the Labor Forcein in Alva.
What is the Percentage of People in the Labor Force in Alva?
49.1% of People are in the Labor Force in Alva.
What is the Unemployment Rate in Alva?
Unemployment Rate in Alva is 0.9%.