Zip Codes with the Highest Percentage of Population Employed in Farming, Fishing & Forestry in Colorado
RELATED REPORTS & OPTIONS
Farming, Fishing & Forestry
Colorado
Compare Zip Codes
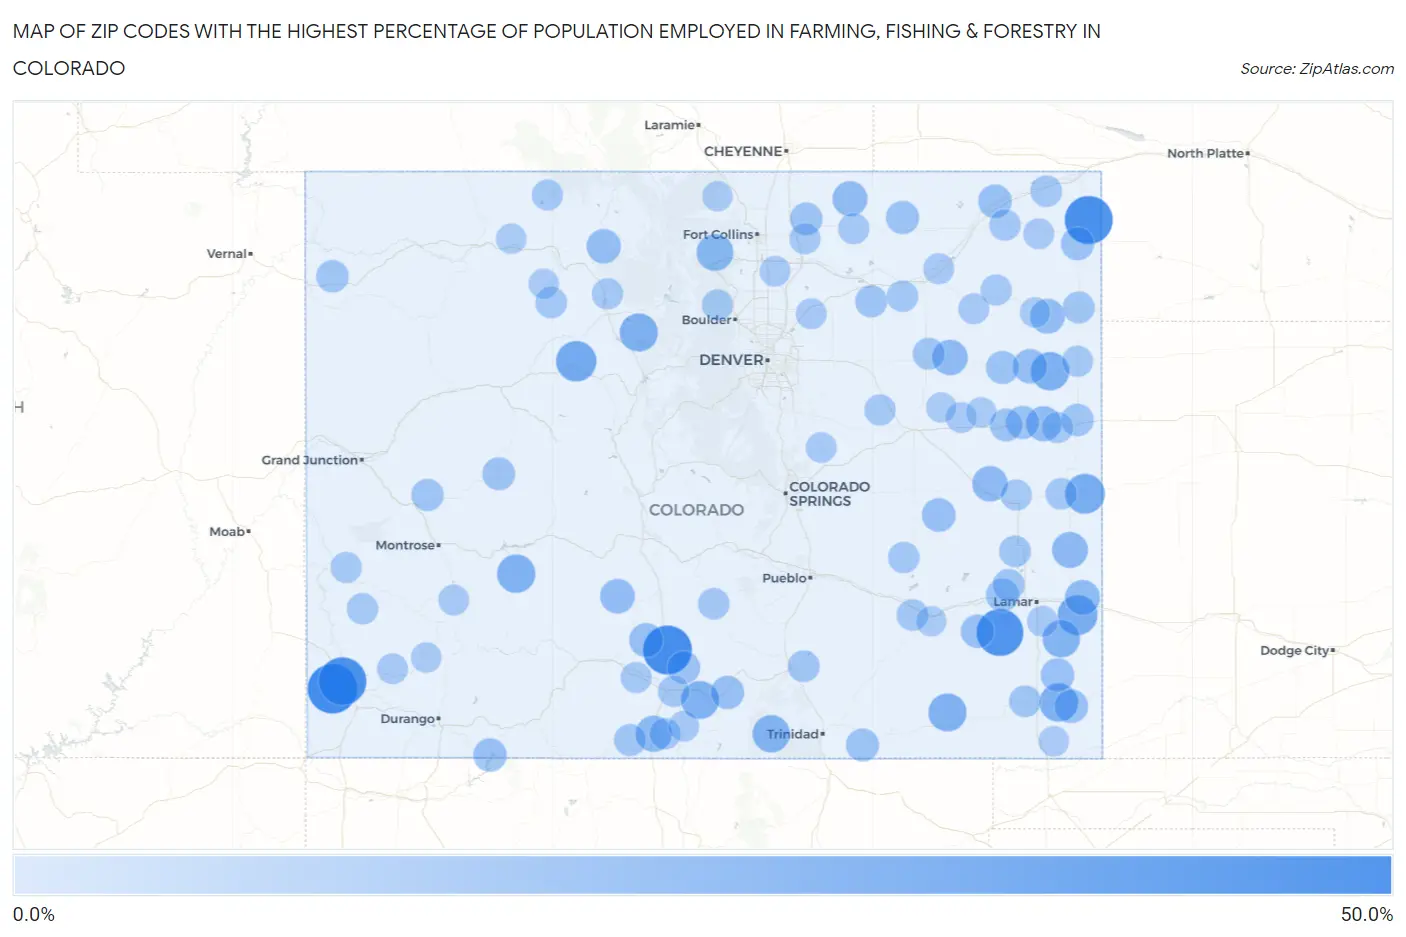
Map of Zip Codes with the Highest Percentage of Population Employed in Farming, Fishing & Forestry in Colorado
0.0%
50.0%
Zip Codes with the Highest Percentage of Population Employed in Farming, Fishing & Forestry in Colorado
| Zip Code | % Employed | vs State | vs National | |
| 1. | 81331 | 44.6% | 0.49%(+44.1)#1 | 0.61%(+43.9)#71 |
| 2. | 81136 | 42.9% | 0.49%(+42.4)#2 | 0.61%(+42.3)#86 |
| 3. | 80721 | 41.0% | 0.49%(+40.5)#3 | 0.61%(+40.4)#93 |
| 4. | 81335 | 40.7% | 0.49%(+40.3)#4 | 0.61%(+40.1)#97 |
| 5. | 81044 | 38.5% | 0.49%(+38.0)#5 | 0.61%(+37.9)#113 |
| 6. | 81655 | 24.2% | 0.49%(+23.7)#6 | 0.61%(+23.6)#298 |
| 7. | 81047 | 23.0% | 0.49%(+22.5)#7 | 0.61%(+22.4)#316 |
| 8. | 80802 | 22.9% | 0.49%(+22.4)#8 | 0.61%(+22.3)#322 |
| 9. | 81087 | 20.3% | 0.49%(+19.8)#9 | 0.61%(+19.7)#390 |
| 10. | 80824 | 20.3% | 0.49%(+19.8)#10 | 0.61%(+19.7)#392 |
| 11. | 81243 | 19.7% | 0.49%(+19.2)#11 | 0.61%(+19.1)#417 |
| 12. | 80468 | 19.1% | 0.49%(+18.7)#12 | 0.61%(+18.5)#442 |
| 13. | 81049 | 19.1% | 0.49%(+18.6)#13 | 0.61%(+18.5)#443 |
| 14. | 81123 | 19.0% | 0.49%(+18.5)#14 | 0.61%(+18.4)#446 |
| 15. | 81041 | 17.6% | 0.49%(+17.1)#15 | 0.61%(+17.0)#494 |
| 16. | 81091 | 17.5% | 0.49%(+17.0)#16 | 0.61%(+16.9)#502 |
| 17. | 80532 | 16.3% | 0.49%(+15.8)#17 | 0.61%(+15.7)#569 |
| 18. | 81148 | 15.1% | 0.49%(+14.6)#18 | 0.61%(+14.5)#643 |
| 19. | 81071 | 14.6% | 0.49%(+14.1)#19 | 0.61%(+14.0)#673 |
| 20. | 80862 | 13.6% | 0.49%(+13.1)#20 | 0.61%(+13.0)#754 |
| 21. | 80740 | 13.5% | 0.49%(+13.0)#21 | 0.61%(+12.9)#774 |
| 22. | 80836 | 12.8% | 0.49%(+12.3)#22 | 0.61%(+12.2)#833 |
| 23. | 81043 | 12.5% | 0.49%(+12.0)#23 | 0.61%(+11.9)#876 |
| 24. | 80729 | 12.4% | 0.49%(+12.0)#24 | 0.61%(+11.8)#881 |
| 25. | 80727 | 11.9% | 0.49%(+11.4)#25 | 0.61%(+11.3)#938 |
| 26. | 81149 | 11.7% | 0.49%(+11.2)#26 | 0.61%(+11.1)#962 |
| 27. | 80430 | 11.1% | 0.49%(+10.6)#27 | 0.61%(+10.5)#1,038 |
| 28. | 80822 | 10.9% | 0.49%(+10.5)#28 | 0.61%(+10.3)#1,053 |
| 29. | 81125 | 10.2% | 0.49%(+9.73)#29 | 0.61%(+9.61)#1,179 |
| 30. | 80823 | 9.7% | 0.49%(+9.19)#30 | 0.61%(+9.07)#1,262 |
| 31. | 81090 | 9.4% | 0.49%(+8.89)#31 | 0.61%(+8.77)#1,323 |
| 32. | 80736 | 9.3% | 0.49%(+8.83)#32 | 0.61%(+8.71)#1,335 |
| 33. | 81121 | 9.2% | 0.49%(+8.68)#33 | 0.61%(+8.56)#1,367 |
| 34. | 81084 | 9.1% | 0.49%(+8.60)#34 | 0.61%(+8.49)#1,387 |
| 35. | 81133 | 9.0% | 0.49%(+8.52)#35 | 0.61%(+8.40)#1,403 |
| 36. | 81054 | 8.9% | 0.49%(+8.43)#36 | 0.61%(+8.31)#1,423 |
| 37. | 80742 | 8.6% | 0.49%(+8.15)#37 | 0.61%(+8.04)#1,492 |
| 38. | 80861 | 8.6% | 0.49%(+8.07)#38 | 0.61%(+7.95)#1,515 |
| 39. | 80734 | 8.4% | 0.49%(+7.92)#39 | 0.61%(+7.80)#1,542 |
| 40. | 80812 | 8.2% | 0.49%(+7.73)#40 | 0.61%(+7.61)#1,598 |
| 41. | 81057 | 8.2% | 0.49%(+7.72)#41 | 0.61%(+7.60)#1,606 |
| 42. | 81081 | 8.1% | 0.49%(+7.62)#42 | 0.61%(+7.50)#1,633 |
| 43. | 81434 | 7.7% | 0.49%(+7.21)#43 | 0.61%(+7.09)#1,762 |
| 44. | 81146 | 7.5% | 0.49%(+7.05)#44 | 0.61%(+6.93)#1,810 |
| 45. | 80834 | 7.4% | 0.49%(+6.95)#45 | 0.61%(+6.83)#1,840 |
| 46. | 80610 | 7.1% | 0.49%(+6.61)#46 | 0.61%(+6.49)#1,944 |
| 47. | 81610 | 7.1% | 0.49%(+6.56)#47 | 0.61%(+6.45)#1,959 |
| 48. | 80807 | 7.0% | 0.49%(+6.51)#48 | 0.61%(+6.39)#1,979 |
| 49. | 81410 | 6.8% | 0.49%(+6.29)#49 | 0.61%(+6.18)#2,065 |
| 50. | 80654 | 6.3% | 0.49%(+5.82)#50 | 0.61%(+5.70)#2,231 |
| 51. | 80757 | 6.1% | 0.49%(+5.57)#51 | 0.61%(+5.46)#2,367 |
| 52. | 81092 | 6.0% | 0.49%(+5.47)#52 | 0.61%(+5.35)#2,409 |
| 53. | 81120 | 5.9% | 0.49%(+5.41)#53 | 0.61%(+5.29)#2,446 |
| 54. | 80758 | 5.8% | 0.49%(+5.33)#54 | 0.61%(+5.21)#2,485 |
| 55. | 81089 | 5.6% | 0.49%(+5.08)#55 | 0.61%(+4.96)#2,614 |
| 56. | 81073 | 5.5% | 0.49%(+5.02)#56 | 0.61%(+4.91)#2,648 |
| 57. | 81036 | 5.5% | 0.49%(+5.00)#57 | 0.61%(+4.88)#2,657 |
| 58. | 81067 | 5.3% | 0.49%(+4.85)#58 | 0.61%(+4.73)#2,724 |
| 59. | 80749 | 5.0% | 0.49%(+4.55)#59 | 0.61%(+4.43)#2,905 |
| 60. | 80483 | 4.9% | 0.49%(+4.46)#60 | 0.61%(+4.34)#2,963 |
| 61. | 80701 | 4.9% | 0.49%(+4.38)#61 | 0.61%(+4.26)#3,025 |
| 62. | 81252 | 4.9% | 0.49%(+4.37)#62 | 0.61%(+4.26)#3,029 |
| 63. | 81063 | 4.8% | 0.49%(+4.29)#63 | 0.61%(+4.17)#3,091 |
| 64. | 80810 | 4.7% | 0.49%(+4.26)#64 | 0.61%(+4.14)#3,121 |
| 65. | 81101 | 4.7% | 0.49%(+4.26)#65 | 0.61%(+4.14)#3,122 |
| 66. | 80728 | 4.7% | 0.49%(+4.21)#66 | 0.61%(+4.10)#3,152 |
| 67. | 81141 | 4.5% | 0.49%(+4.00)#67 | 0.61%(+3.88)#3,320 |
| 68. | 80805 | 4.4% | 0.49%(+3.96)#68 | 0.61%(+3.84)#3,353 |
| 69. | 81423 | 4.4% | 0.49%(+3.95)#69 | 0.61%(+3.83)#3,360 |
| 70. | 80459 | 4.3% | 0.49%(+3.77)#70 | 0.61%(+3.65)#3,492 |
| 71. | 80455 | 4.2% | 0.49%(+3.71)#71 | 0.61%(+3.60)#3,545 |
| 72. | 81422 | 4.2% | 0.49%(+3.68)#72 | 0.61%(+3.56)#3,569 |
| 73. | 80101 | 4.2% | 0.49%(+3.68)#73 | 0.61%(+3.56)#3,572 |
| 74. | 80743 | 4.2% | 0.49%(+3.67)#74 | 0.61%(+3.55)#3,577 |
| 75. | 80611 | 4.1% | 0.49%(+3.62)#75 | 0.61%(+3.50)#3,628 |
| 76. | 80735 | 4.1% | 0.49%(+3.58)#76 | 0.61%(+3.46)#3,668 |
| 77. | 80825 | 4.0% | 0.49%(+3.47)#77 | 0.61%(+3.35)#3,751 |
| 78. | 81144 | 3.9% | 0.49%(+3.39)#78 | 0.61%(+3.27)#3,829 |
| 79. | 80615 | 3.9% | 0.49%(+3.37)#79 | 0.61%(+3.25)#3,851 |
| 80. | 80428 | 3.8% | 0.49%(+3.29)#80 | 0.61%(+3.18)#3,917 |
| 81. | 80720 | 3.5% | 0.49%(+3.02)#81 | 0.61%(+2.90)#4,197 |
| 82. | 80733 | 3.5% | 0.49%(+3.01)#82 | 0.61%(+2.90)#4,203 |
| 83. | 81052 | 3.5% | 0.49%(+2.97)#83 | 0.61%(+2.85)#4,246 |
| 84. | 80642 | 3.4% | 0.49%(+2.95)#84 | 0.61%(+2.83)#4,277 |
| 85. | 80731 | 3.4% | 0.49%(+2.92)#85 | 0.61%(+2.80)#4,328 |
| 86. | 81151 | 3.4% | 0.49%(+2.91)#86 | 0.61%(+2.80)#4,331 |
| 87. | 81323 | 3.4% | 0.49%(+2.90)#87 | 0.61%(+2.78)#4,345 |
| 88. | 80106 | 3.4% | 0.49%(+2.88)#88 | 0.61%(+2.77)#4,362 |
| 89. | 81432 | 3.3% | 0.49%(+2.82)#89 | 0.61%(+2.70)#4,436 |
| 90. | 80804 | 3.2% | 0.49%(+2.69)#90 | 0.61%(+2.57)#4,590 |
| 91. | 80534 | 3.1% | 0.49%(+2.60)#91 | 0.61%(+2.48)#4,706 |
| 92. | 80759 | 2.7% | 0.49%(+2.23)#92 | 0.61%(+2.11)#5,220 |
| 93. | 80815 | 2.6% | 0.49%(+2.15)#93 | 0.61%(+2.03)#5,329 |
| 94. | 81029 | 2.6% | 0.49%(+2.14)#94 | 0.61%(+2.03)#5,346 |
| 95. | 81639 | 2.6% | 0.49%(+2.13)#95 | 0.61%(+2.01)#5,353 |
| 96. | 81332 | 2.6% | 0.49%(+2.10)#96 | 0.61%(+1.98)#5,411 |
| 97. | 80818 | 2.6% | 0.49%(+2.08)#97 | 0.61%(+1.96)#5,448 |
| 98. | 80467 | 2.5% | 0.49%(+2.05)#98 | 0.61%(+1.93)#5,482 |
| 99. | 80536 | 2.5% | 0.49%(+1.98)#99 | 0.61%(+1.86)#5,603 |
| 100. | 81050 | 2.5% | 0.49%(+1.96)#100 | 0.61%(+1.85)#5,628 |
Common Questions
What are the Top 10 Zip Codes with the Highest Percentage of Population Employed in Farming, Fishing & Forestry in Colorado?
Top 10 Zip Codes with the Highest Percentage of Population Employed in Farming, Fishing & Forestry in Colorado are:
What zip code has the Highest Percentage of Population Employed in Farming, Fishing & Forestry in Colorado?
81331 has the Highest Percentage of Population Employed in Farming, Fishing & Forestry in Colorado with 44.6%.
What is the Percentage of Population Employed in Farming, Fishing & Forestry in the State of Colorado?
Percentage of Population Employed in Farming, Fishing & Forestry in Colorado is 0.49%.
What is the Percentage of Population Employed in Farming, Fishing & Forestry in the United States?
Percentage of Population Employed in Farming, Fishing & Forestry in the United States is 0.61%.