Wray, CO Map & Demographics
Wray Map
Wray Overview
$31,376
PER CAPITA INCOME
$76,406
AVG FAMILY INCOME
$67,596
AVG HOUSEHOLD INCOME
18.8%
WAGE / INCOME GAP [ % ]
81.2¢/ $1
WAGE / INCOME GAP [ $ ]
0.41
INEQUALITY / GINI INDEX
2,461
TOTAL POPULATION
1,305
MALE POPULATION
1,156
FEMALE POPULATION
112.89
MALES / 100 FEMALES
88.58
FEMALES / 100 MALES
38.1
MEDIAN AGE
3.3
AVG FAMILY SIZE
2.5
AVG HOUSEHOLD SIZE
1,230
LABOR FORCE [ PEOPLE ]
67.2%
PERCENT IN LABOR FORCE
5.7%
UNEMPLOYMENT RATE
Wray Zip Codes
Wray Area Codes
Income in Wray
Income Overview in Wray
Per Capita Income in Wray is $31,376, while median incomes of families and households are $76,406 and $67,596 respectively.
| Characteristic | Number | Measure |
| Per Capita Income | 2,461 | $31,376 |
| Median Family Income | 567 | $76,406 |
| Mean Family Income | 567 | $91,374 |
| Median Household Income | 951 | $67,596 |
| Mean Household Income | 951 | $77,956 |
| Income Deficit | 567 | $0 |
| Wage / Income Gap (%) | 2,461 | 18.77% |
| Wage / Income Gap ($) | 2,461 | 81.23¢ per $1 |
| Gini / Inequality Index | 2,461 | 0.41 |
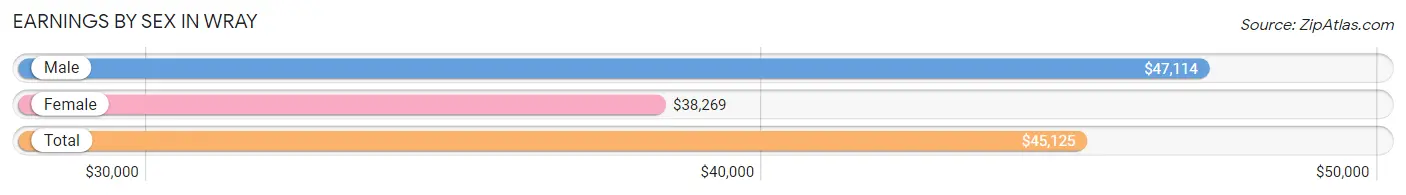
Earnings by Sex in Wray
Average Earnings in Wray are $45,125, $47,114 for men and $38,269 for women, a difference of 18.8%.
| Sex | Number | Average Earnings |
| Male | 695 (54.2%) | $47,114 |
| Female | 586 (45.8%) | $38,269 |
| Total | 1,281 (100.0%) | $45,125 |
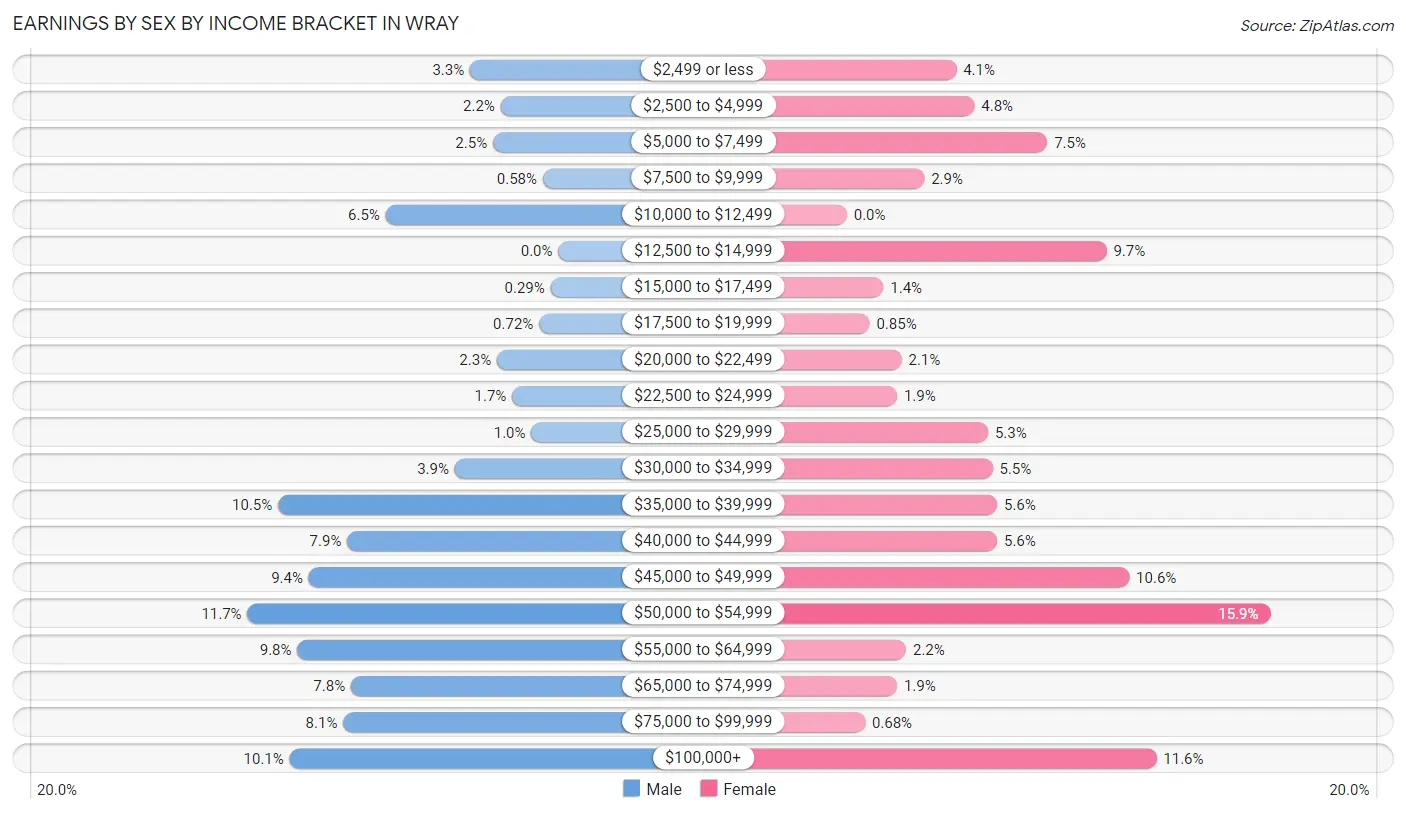
Earnings by Sex by Income Bracket in Wray
The most common earnings brackets in Wray are $50,000 to $54,999 for men (81 | 11.7%) and $50,000 to $54,999 for women (93 | 15.9%).
| Income | Male | Female |
| $2,499 or less | 23 (3.3%) | 24 (4.1%) |
| $2,500 to $4,999 | 15 (2.2%) | 28 (4.8%) |
| $5,000 to $7,499 | 17 (2.5%) | 44 (7.5%) |
| $7,500 to $9,999 | 4 (0.6%) | 17 (2.9%) |
| $10,000 to $12,499 | 45 (6.5%) | 0 (0.0%) |
| $12,500 to $14,999 | 0 (0.0%) | 57 (9.7%) |
| $15,000 to $17,499 | 2 (0.3%) | 8 (1.4%) |
| $17,500 to $19,999 | 5 (0.7%) | 5 (0.9%) |
| $20,000 to $22,499 | 16 (2.3%) | 12 (2.1%) |
| $22,500 to $24,999 | 12 (1.7%) | 11 (1.9%) |
| $25,000 to $29,999 | 7 (1.0%) | 31 (5.3%) |
| $30,000 to $34,999 | 27 (3.9%) | 32 (5.5%) |
| $35,000 to $39,999 | 73 (10.5%) | 33 (5.6%) |
| $40,000 to $44,999 | 55 (7.9%) | 33 (5.6%) |
| $45,000 to $49,999 | 65 (9.3%) | 62 (10.6%) |
| $50,000 to $54,999 | 81 (11.7%) | 93 (15.9%) |
| $55,000 to $64,999 | 68 (9.8%) | 13 (2.2%) |
| $65,000 to $74,999 | 54 (7.8%) | 11 (1.9%) |
| $75,000 to $99,999 | 56 (8.1%) | 4 (0.7%) |
| $100,000+ | 70 (10.1%) | 68 (11.6%) |
| Total | 695 (100.0%) | 586 (100.0%) |
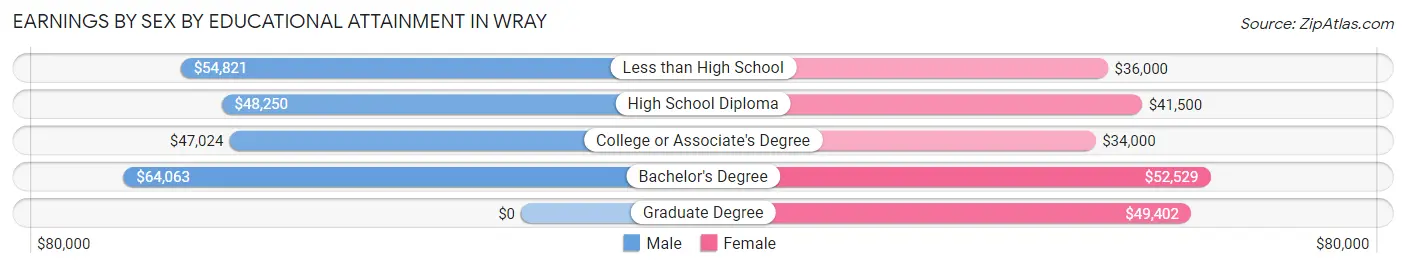
Earnings by Sex by Educational Attainment in Wray
Average earnings in Wray are $52,988 for men and $45,000 for women, a difference of 15.1%. Men with an educational attainment of bachelor's degree enjoy the highest average annual earnings of $64,063, while those with college or associate's degree education earn the least with $47,024. Women with an educational attainment of bachelor's degree earn the most with the average annual earnings of $52,529, while those with college or associate's degree education have the smallest earnings of $34,000.
| Educational Attainment | Male Income | Female Income |
| Less than High School | $54,821 | $36,000 |
| High School Diploma | $48,250 | $41,500 |
| College or Associate's Degree | $47,024 | $34,000 |
| Bachelor's Degree | $64,063 | $52,529 |
| Graduate Degree | - | - |
| Total | $52,988 | $45,000 |
Family Income in Wray
Family Income Brackets in Wray
According to the Wray family income data, there are 147 families falling into the $100,000 to $149,999 income range, which is the most common income bracket and makes up 25.9% of all families. Conversely, the less than $10,000 income bracket is the least frequent group with only 12 families (2.1%) belonging to this category.
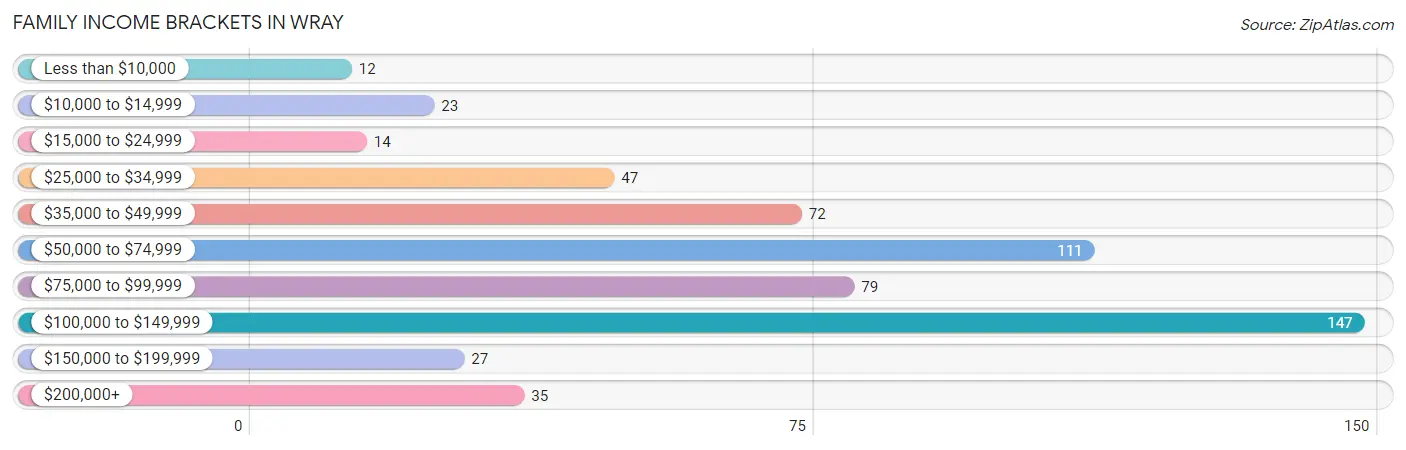
| Income Bracket | # Families | % Families |
| Less than $10,000 | 12 | 2.1% |
| $10,000 to $14,999 | 23 | 4.1% |
| $15,000 to $24,999 | 14 | 2.5% |
| $25,000 to $34,999 | 47 | 8.3% |
| $35,000 to $49,999 | 72 | 12.7% |
| $50,000 to $74,999 | 111 | 19.6% |
| $75,000 to $99,999 | 79 | 13.9% |
| $100,000 to $149,999 | 147 | 25.9% |
| $150,000 to $199,999 | 27 | 4.8% |
| $200,000+ | 35 | 6.2% |
Family Income by Famaliy Size in Wray
5-person families (82 | 14.5%) account for the highest median family income in Wray with $105,583 per family, while 2-person families (219 | 38.6%) have the highest median income of $35,125 per family member.
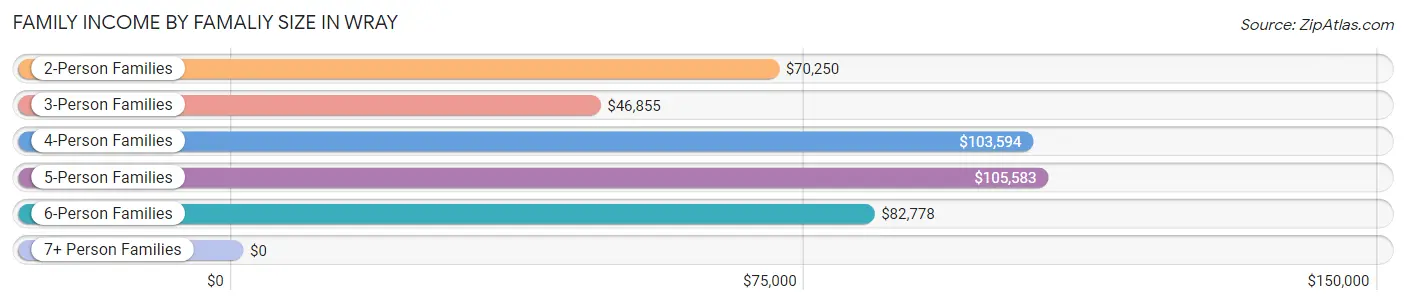
| Income Bracket | # Families | Median Income |
| 2-Person Families | 219 (38.6%) | $70,250 |
| 3-Person Families | 166 (29.3%) | $46,855 |
| 4-Person Families | 57 (10.1%) | $103,594 |
| 5-Person Families | 82 (14.5%) | $105,583 |
| 6-Person Families | 26 (4.6%) | $82,778 |
| 7+ Person Families | 17 (3.0%) | $0 |
| Total | 567 (100.0%) | $76,406 |
Family Income by Number of Earners in Wray
The median family income in Wray is $76,406, with families comprising 3+ earners (48) having the highest median family income of $128,542, while families with 1 earner (172) have the lowest median family income of $45,273, accounting for 8.5% and 30.3% of families, respectively.
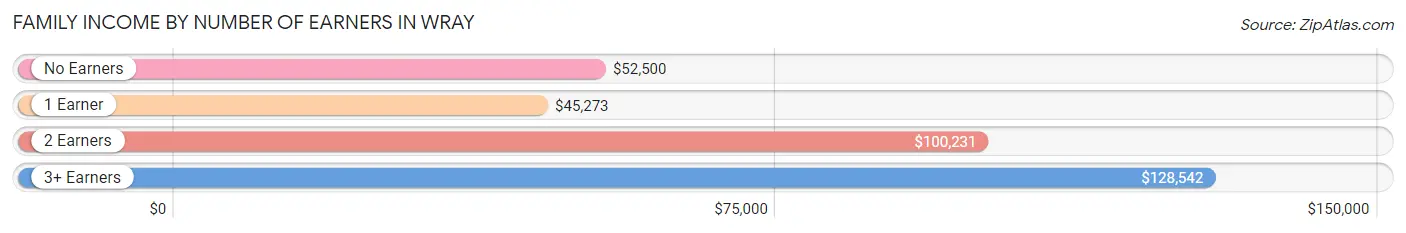
| Number of Earners | # Families | Median Income |
| No Earners | 60 (10.6%) | $52,500 |
| 1 Earner | 172 (30.3%) | $45,273 |
| 2 Earners | 287 (50.6%) | $100,231 |
| 3+ Earners | 48 (8.5%) | $128,542 |
| Total | 567 (100.0%) | $76,406 |
Household Income in Wray
Household Income Brackets in Wray
With 225 households falling in the category, the $100,000 to $149,999 income range is the most frequent in Wray, accounting for 23.7% of all households. In contrast, only 16 households (1.7%) fall into the $15,000 to $24,999 income bracket, making it the least populous group.
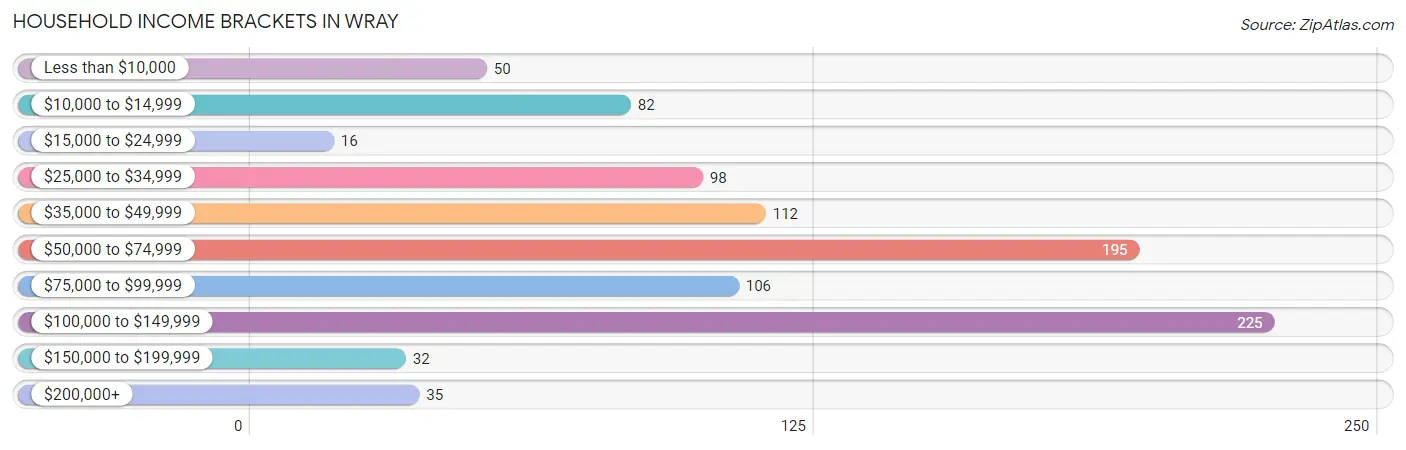
| Income Bracket | # Households | % Households |
| Less than $10,000 | 50 | 5.3% |
| $10,000 to $14,999 | 82 | 8.6% |
| $15,000 to $24,999 | 16 | 1.7% |
| $25,000 to $34,999 | 98 | 10.3% |
| $35,000 to $49,999 | 112 | 11.8% |
| $50,000 to $74,999 | 195 | 20.5% |
| $75,000 to $99,999 | 106 | 11.1% |
| $100,000 to $149,999 | 225 | 23.7% |
| $150,000 to $199,999 | 32 | 3.4% |
| $200,000+ | 35 | 3.7% |
Household Income by Householder Age in Wray
The median household income in Wray is $67,596, with the highest median household income of $77,031 found in the 25 to 44 years age bracket for the primary householder. A total of 279 households (29.3%) fall into this category. Meanwhile, the 15 to 24 years age bracket for the primary householder has the lowest median household income of $36,250, with 64 households (6.7%) in this group.
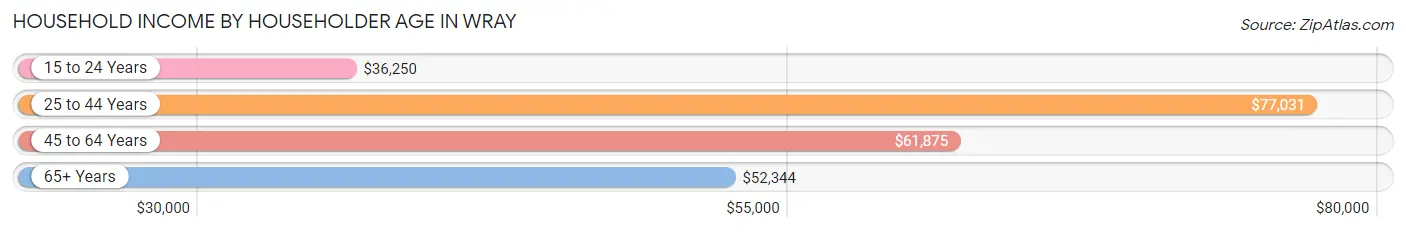
| Income Bracket | # Households | Median Income |
| 15 to 24 Years | 64 (6.7%) | $36,250 |
| 25 to 44 Years | 279 (29.3%) | $77,031 |
| 45 to 64 Years | 381 (40.1%) | $61,875 |
| 65+ Years | 227 (23.9%) | $52,344 |
| Total | 951 (100.0%) | $67,596 |
Poverty in Wray
Income Below Poverty by Sex and Age in Wray
With 12.9% poverty level for males and 15.8% for females among the residents of Wray, 15 year old males and 15 year old females are the most vulnerable to poverty, with 22 males (88.0%) and 18 females (58.1%) in their respective age groups living below the poverty level.
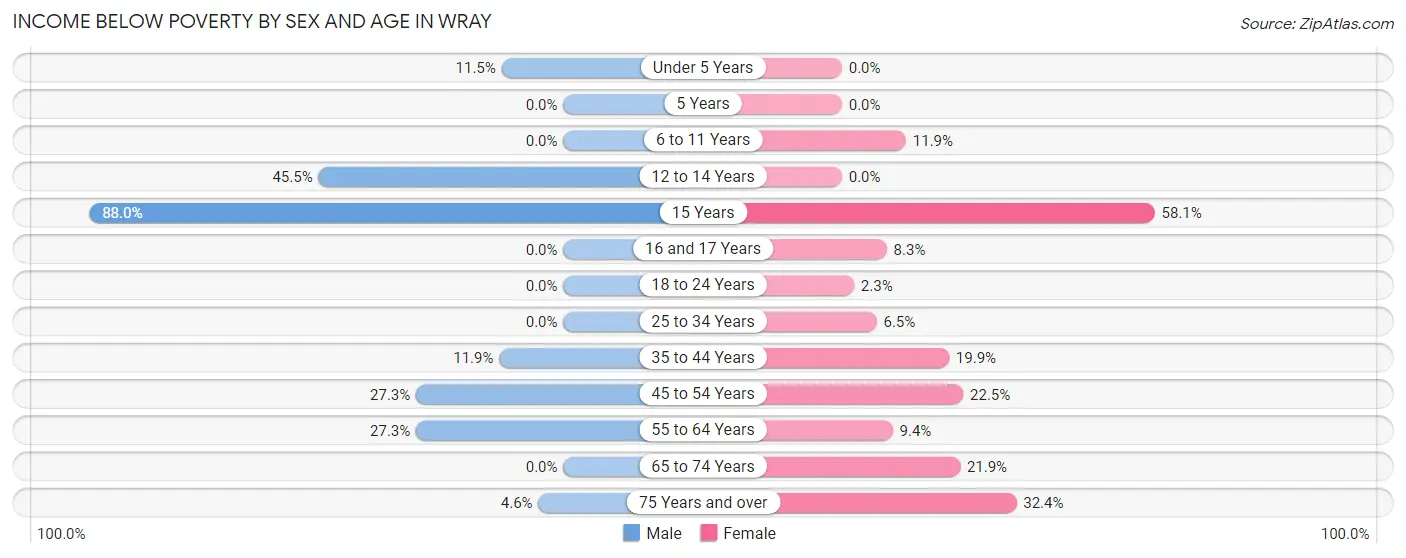
| Age Bracket | Male | Female |
| Under 5 Years | 11 (11.5%) | 0 (0.0%) |
| 5 Years | 0 (0.0%) | 0 (0.0%) |
| 6 to 11 Years | 0 (0.0%) | 22 (11.9%) |
| 12 to 14 Years | 15 (45.5%) | 0 (0.0%) |
| 15 Years | 22 (88.0%) | 18 (58.1%) |
| 16 and 17 Years | 0 (0.0%) | 4 (8.3%) |
| 18 to 24 Years | 0 (0.0%) | 2 (2.2%) |
| 25 to 34 Years | 0 (0.0%) | 6 (6.5%) |
| 35 to 44 Years | 22 (11.9%) | 33 (19.9%) |
| 45 to 54 Years | 41 (27.3%) | 34 (22.5%) |
| 55 to 64 Years | 47 (27.3%) | 10 (9.4%) |
| 65 to 74 Years | 0 (0.0%) | 25 (21.9%) |
| 75 Years and over | 3 (4.6%) | 23 (32.4%) |
| Total | 161 (12.9%) | 177 (15.8%) |
Income Above Poverty by Sex and Age in Wray
According to the poverty statistics in Wray, males aged 5 years and females aged under 5 years are the age groups that are most secure financially, with 100.0% of males and 100.0% of females in these age groups living above the poverty line.
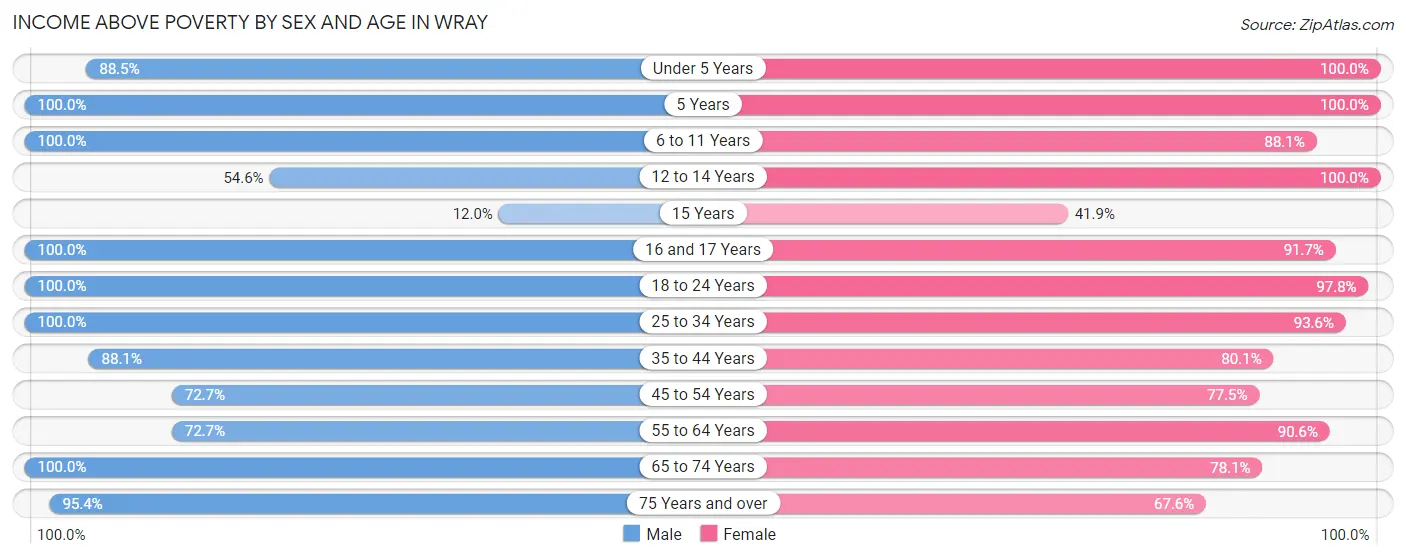
| Age Bracket | Male | Female |
| Under 5 Years | 85 (88.5%) | 26 (100.0%) |
| 5 Years | 40 (100.0%) | 5 (100.0%) |
| 6 to 11 Years | 148 (100.0%) | 163 (88.1%) |
| 12 to 14 Years | 18 (54.5%) | 36 (100.0%) |
| 15 Years | 3 (12.0%) | 13 (41.9%) |
| 16 and 17 Years | 36 (100.0%) | 44 (91.7%) |
| 18 to 24 Years | 65 (100.0%) | 87 (97.8%) |
| 25 to 34 Years | 123 (100.0%) | 87 (93.5%) |
| 35 to 44 Years | 163 (88.1%) | 133 (80.1%) |
| 45 to 54 Years | 109 (72.7%) | 117 (77.5%) |
| 55 to 64 Years | 125 (72.7%) | 96 (90.6%) |
| 65 to 74 Years | 106 (100.0%) | 89 (78.1%) |
| 75 Years and over | 62 (95.4%) | 48 (67.6%) |
| Total | 1,083 (87.1%) | 944 (84.2%) |
Income Below Poverty Among Married-Couple Families in Wray
The poverty statistics for married-couple families in Wray show that 12.4% or 56 of the total 450 families live below the poverty line. Families with 1 or 2 children have the highest poverty rate of 29.7%, comprising of 47 families. On the other hand, families with no children have the lowest poverty rate of 1.5%, which includes 3 families.
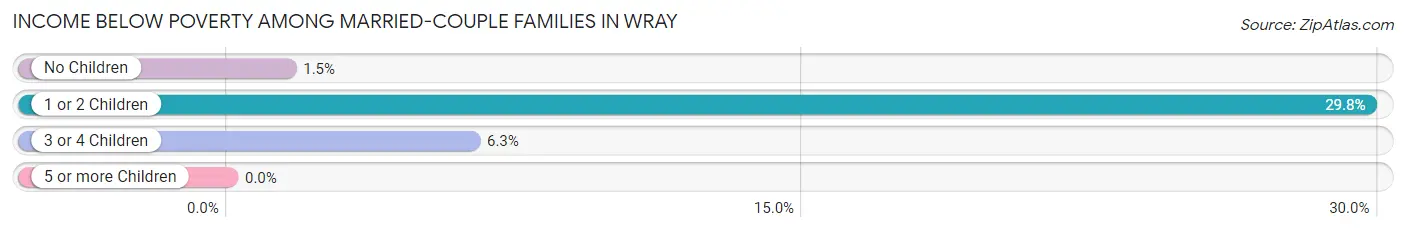
| Children | Above Poverty | Below Poverty |
| No Children | 194 (98.5%) | 3 (1.5%) |
| 1 or 2 Children | 111 (70.3%) | 47 (29.7%) |
| 3 or 4 Children | 89 (93.7%) | 6 (6.3%) |
| 5 or more Children | 0 (0.0%) | 0 (0.0%) |
| Total | 394 (87.6%) | 56 (12.4%) |
Income Below Poverty Among Single-Parent Households in Wray
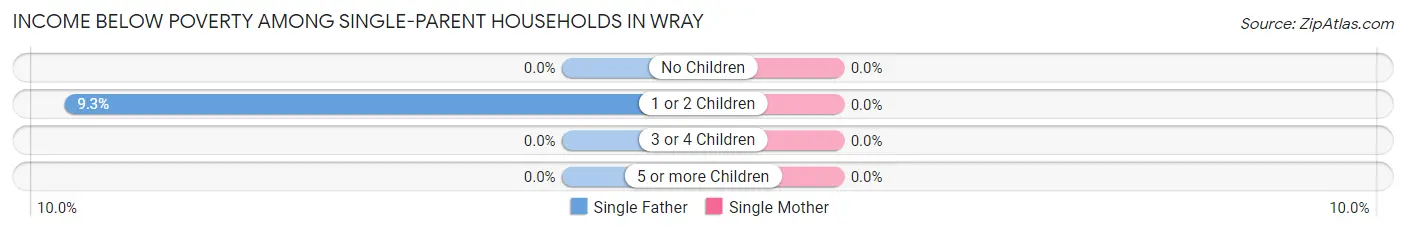
| Children | Single Father | Single Mother |
| No Children | 0 (0.0%) | 0 (0.0%) |
| 1 or 2 Children | 5 (9.3%) | 0 (0.0%) |
| 3 or 4 Children | 0 (0.0%) | 0 (0.0%) |
| 5 or more Children | 0 (0.0%) | 0 (0.0%) |
| Total | 5 (7.1%) | 0 (0.0%) |
Income Below Poverty Among Married-Couple vs Single-Parent Households in Wray
The poverty data for Wray shows that 56 of the married-couple family households (12.4%) and 5 of the single-parent households (4.3%) are living below the poverty level. Within the married-couple family households, those with 1 or 2 children have the highest poverty rate, with 47 households (29.7%) falling below the poverty line. Among the single-parent households, those with 1 or 2 children have the highest poverty rate, with 5 household (5.0%) living below poverty.
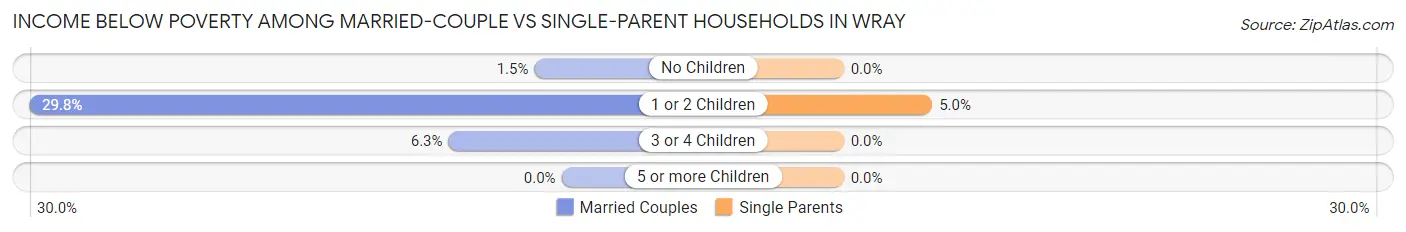
| Children | Married-Couple Families | Single-Parent Households |
| No Children | 3 (1.5%) | 0 (0.0%) |
| 1 or 2 Children | 47 (29.7%) | 5 (5.0%) |
| 3 or 4 Children | 6 (6.3%) | 0 (0.0%) |
| 5 or more Children | 0 (0.0%) | 0 (0.0%) |
| Total | 56 (12.4%) | 5 (4.3%) |
Race in Wray
The most populous races in Wray are White / Caucasian (2,182 | 88.7%), Hispanic or Latino (485 | 19.7%), and Two or more Races (132 | 5.4%).
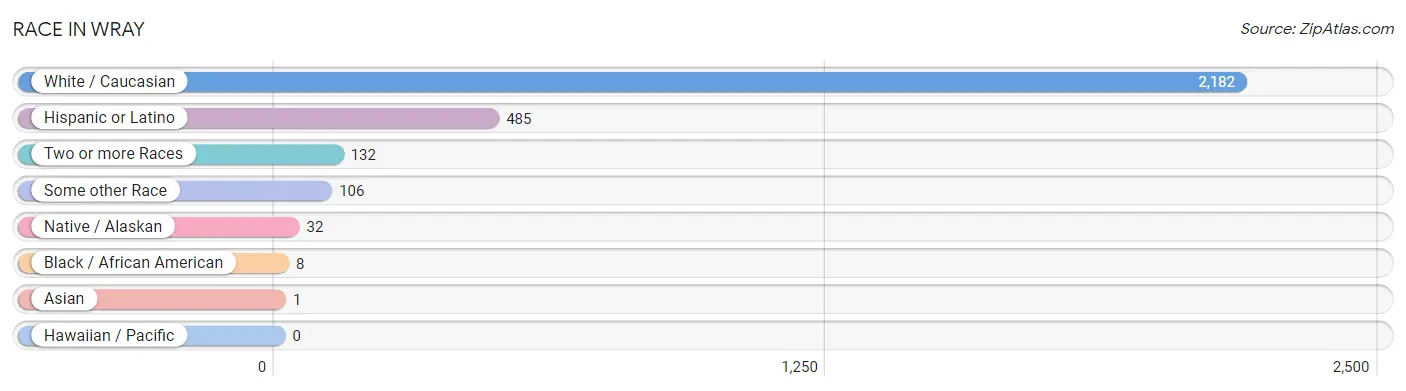
| Race | # Population | % Population |
| Asian | 1 | 0.0% |
| Black / African American | 8 | 0.3% |
| Hawaiian / Pacific | 0 | 0.0% |
| Hispanic or Latino | 485 | 19.7% |
| Native / Alaskan | 32 | 1.3% |
| White / Caucasian | 2,182 | 88.7% |
| Two or more Races | 132 | 5.4% |
| Some other Race | 106 | 4.3% |
| Total | 2,461 | 100.0% |
Ancestry in Wray
The most populous ancestries reported in Wray are German (611 | 24.8%), Mexican (463 | 18.8%), English (369 | 15.0%), Irish (214 | 8.7%), and American (181 | 7.3%), together accounting for 74.7% of all Wray residents.
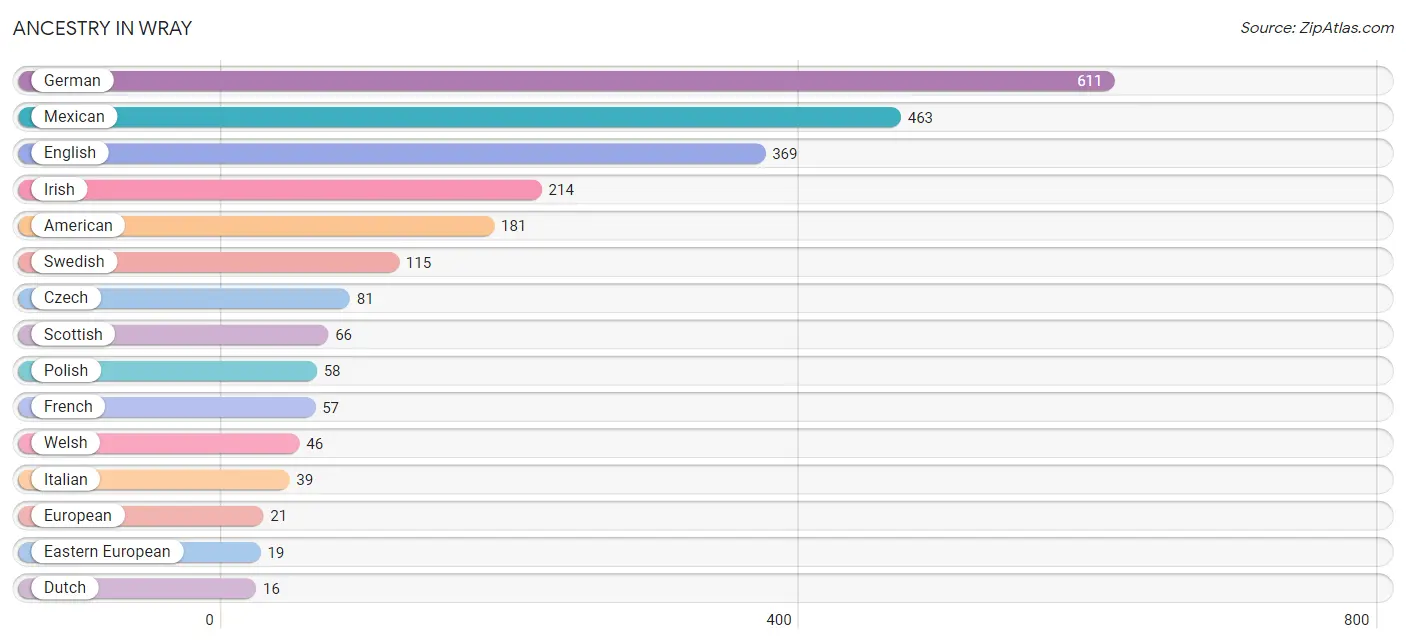
| Ancestry | # Population | % Population |
| American | 181 | 7.3% |
| Arab | 1 | 0.0% |
| British | 5 | 0.2% |
| Creek | 1 | 0.0% |
| Czech | 81 | 3.3% |
| Dutch | 16 | 0.6% |
| Eastern European | 19 | 0.8% |
| English | 369 | 15.0% |
| European | 21 | 0.9% |
| French | 57 | 2.3% |
| German | 611 | 24.8% |
| Indian (Asian) | 1 | 0.0% |
| Irish | 214 | 8.7% |
| Italian | 39 | 1.6% |
| Maltese | 6 | 0.2% |
| Mexican | 463 | 18.8% |
| Moroccan | 1 | 0.0% |
| Northern European | 9 | 0.4% |
| Norwegian | 5 | 0.2% |
| Polish | 58 | 2.4% |
| Russian | 13 | 0.5% |
| Scandinavian | 5 | 0.2% |
| Scotch-Irish | 13 | 0.5% |
| Scottish | 66 | 2.7% |
| Spaniard | 2 | 0.1% |
| Spanish | 2 | 0.1% |
| Swedish | 115 | 4.7% |
| Swiss | 5 | 0.2% |
| Welsh | 46 | 1.9% | View All 29 Rows |
Immigrants in Wray
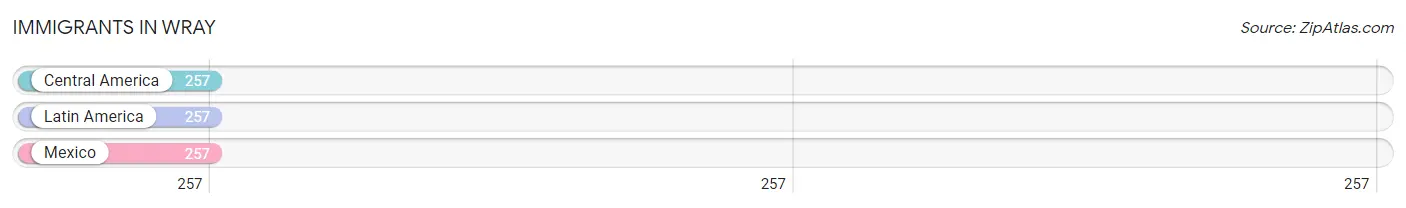
The most numerous immigrant groups reported in Wray came from Central America (257 | 10.4%), Latin America (257 | 10.4%), and Mexico (257 | 10.4%), together accounting for 31.3% of all Wray residents.
| Immigration Origin | # Population | % Population |
| Central America | 257 | 10.4% |
| Latin America | 257 | 10.4% |
| Mexico | 257 | 10.4% | View All 3 Rows |
Sex and Age in Wray
Sex and Age in Wray
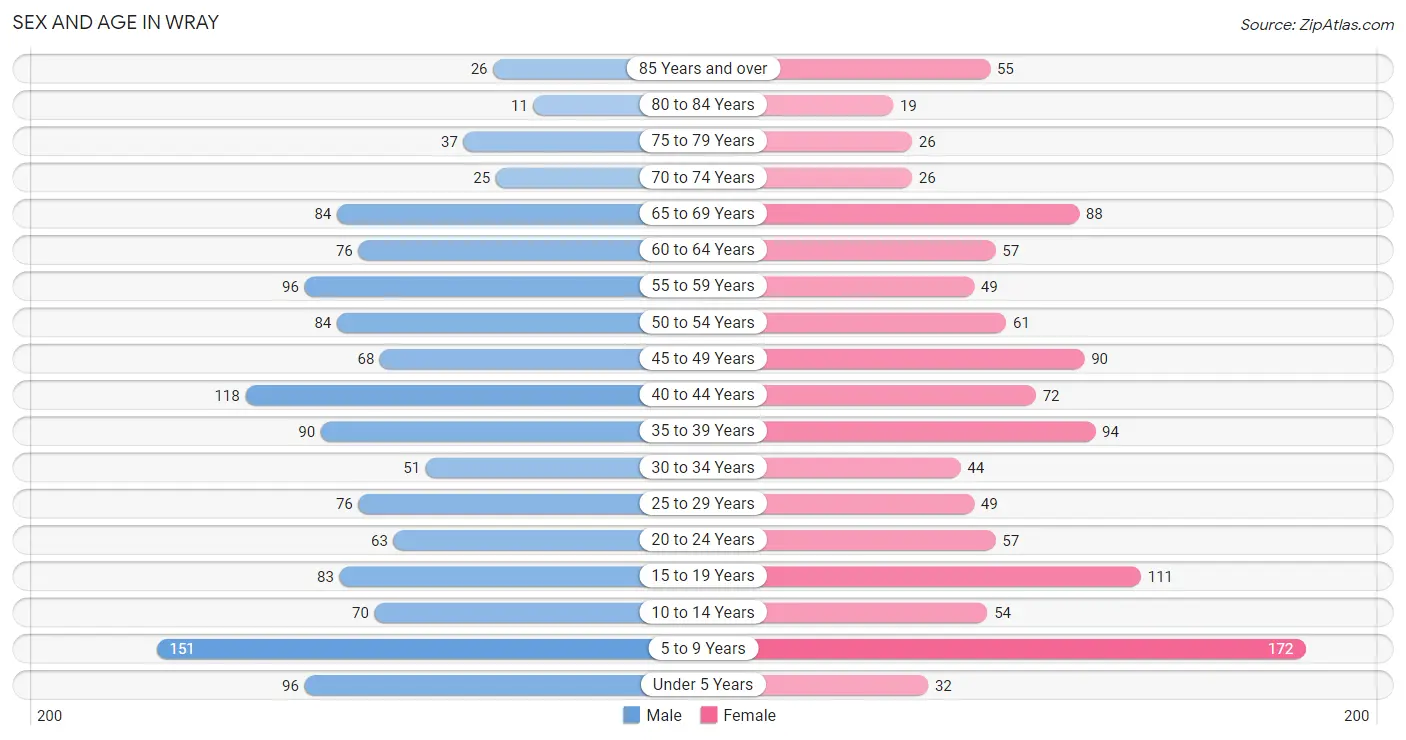
The most populous age groups in Wray are 5 to 9 Years (151 | 11.6%) for men and 5 to 9 Years (172 | 14.9%) for women.
| Age Bracket | Male | Female |
| Under 5 Years | 96 (7.4%) | 32 (2.8%) |
| 5 to 9 Years | 151 (11.6%) | 172 (14.9%) |
| 10 to 14 Years | 70 (5.4%) | 54 (4.7%) |
| 15 to 19 Years | 83 (6.4%) | 111 (9.6%) |
| 20 to 24 Years | 63 (4.8%) | 57 (4.9%) |
| 25 to 29 Years | 76 (5.8%) | 49 (4.2%) |
| 30 to 34 Years | 51 (3.9%) | 44 (3.8%) |
| 35 to 39 Years | 90 (6.9%) | 94 (8.1%) |
| 40 to 44 Years | 118 (9.0%) | 72 (6.2%) |
| 45 to 49 Years | 68 (5.2%) | 90 (7.8%) |
| 50 to 54 Years | 84 (6.4%) | 61 (5.3%) |
| 55 to 59 Years | 96 (7.4%) | 49 (4.2%) |
| 60 to 64 Years | 76 (5.8%) | 57 (4.9%) |
| 65 to 69 Years | 84 (6.4%) | 88 (7.6%) |
| 70 to 74 Years | 25 (1.9%) | 26 (2.2%) |
| 75 to 79 Years | 37 (2.8%) | 26 (2.2%) |
| 80 to 84 Years | 11 (0.8%) | 19 (1.6%) |
| 85 Years and over | 26 (2.0%) | 55 (4.8%) |
| Total | 1,305 (100.0%) | 1,156 (100.0%) |
Families and Households in Wray
Median Family Size in Wray
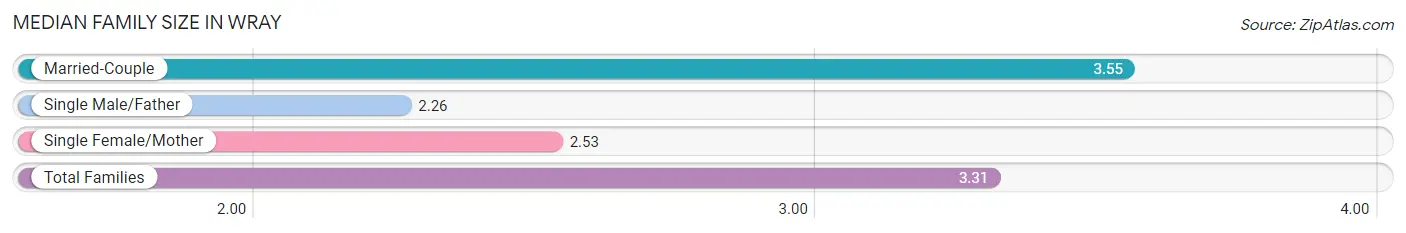
The median family size in Wray is 3.31 persons per family, with married-couple families (450 | 79.4%) accounting for the largest median family size of 3.55 persons per family. On the other hand, single male/father families (70 | 12.3%) represent the smallest median family size with 2.26 persons per family.
| Family Type | # Families | Family Size |
| Married-Couple | 450 (79.4%) | 3.55 |
| Single Male/Father | 70 (12.3%) | 2.26 |
| Single Female/Mother | 47 (8.3%) | 2.53 |
| Total Families | 567 (100.0%) | 3.31 |
Median Household Size in Wray
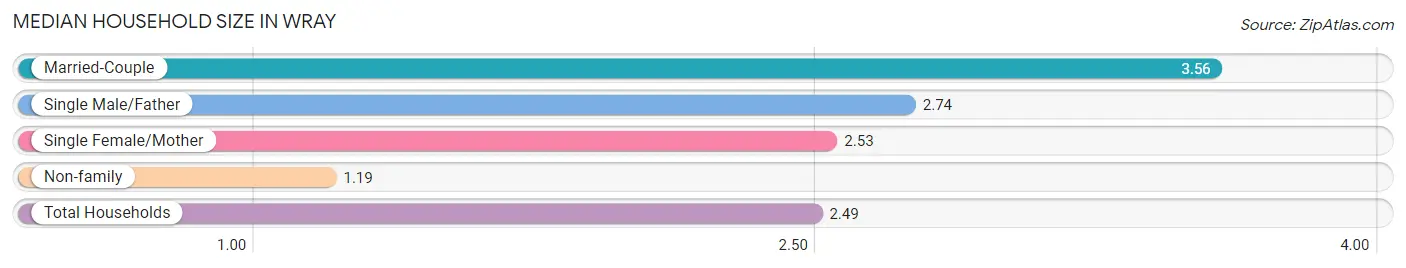
The median household size in Wray is 2.49 persons per household, with married-couple households (450 | 47.3%) accounting for the largest median household size of 3.56 persons per household. non-family households (384 | 40.4%) represent the smallest median household size with 1.19 persons per household.
| Household Type | # Households | Household Size |
| Married-Couple | 450 (47.3%) | 3.56 |
| Single Male/Father | 70 (7.4%) | 2.74 |
| Single Female/Mother | 47 (4.9%) | 2.53 |
| Non-family | 384 (40.4%) | 1.19 |
| Total Households | 951 (100.0%) | 2.49 |
Household Size by Marriage Status in Wray
Out of a total of 951 households in Wray, 567 (59.6%) are family households, while 384 (40.4%) are nonfamily households. The most numerous type of family households are 2-person households, comprising 200, and the most common type of nonfamily households are 1-person households, comprising 318.
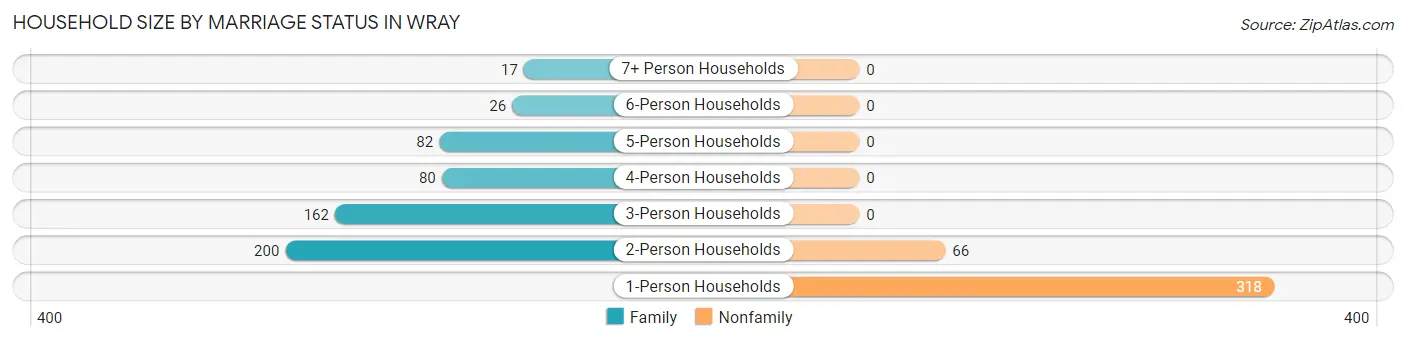
| Household Size | Family Households | Nonfamily Households |
| 1-Person Households | - | 318 (33.4%) |
| 2-Person Households | 200 (21.0%) | 66 (6.9%) |
| 3-Person Households | 162 (17.0%) | 0 (0.0%) |
| 4-Person Households | 80 (8.4%) | 0 (0.0%) |
| 5-Person Households | 82 (8.6%) | 0 (0.0%) |
| 6-Person Households | 26 (2.7%) | 0 (0.0%) |
| 7+ Person Households | 17 (1.8%) | 0 (0.0%) |
| Total | 567 (59.6%) | 384 (40.4%) |
Female Fertility in Wray
Fertility by Age in Wray
Average fertility rate in Wray is 51.0 births per 1,000 women. Women in the age bracket of 20 to 34 years have the highest fertility rate with 180.0 births per 1,000 women. Women in the age bracket of 20 to 34 years acount for 100.0% of all women with births.
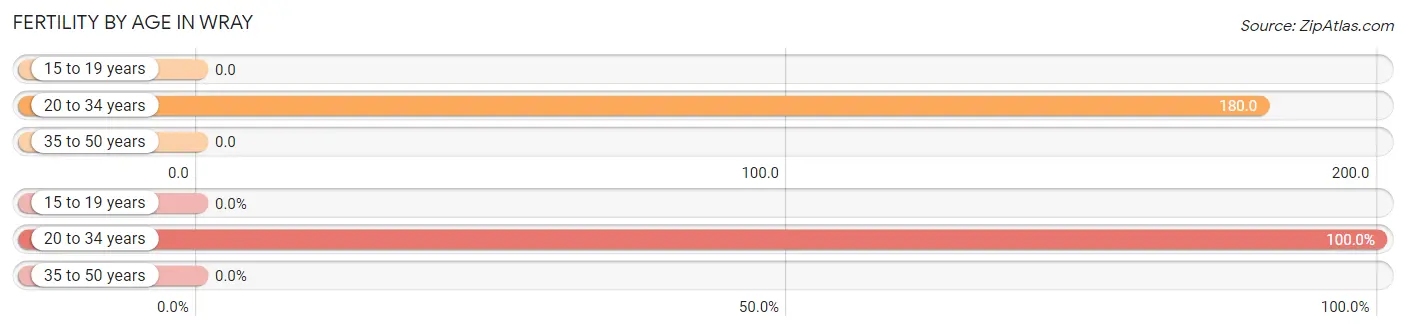
| Age Bracket | Women with Births | Births / 1,000 Women |
| 15 to 19 years | 0 (0.0%) | 0.0 |
| 20 to 34 years | 27 (100.0%) | 180.0 |
| 35 to 50 years | 0 (0.0%) | 0.0 |
| Total | 27 (100.0%) | 51.0 |
Fertility by Age by Marriage Status in Wray
81.5% of women with births (27) in Wray are married. The highest percentage of unmarried women with births falls into 20 to 34 years age bracket with 18.5% of them unmarried at the time of birth, while the lowest percentage of unmarried women with births belong to 20 to 34 years age bracket with 18.5% of them unmarried.
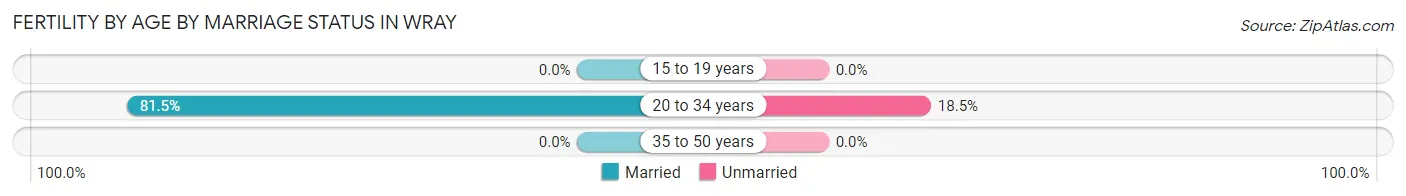
| Age Bracket | Married | Unmarried |
| 15 to 19 years | 0 (0.0%) | 0 (0.0%) |
| 20 to 34 years | 22 (81.5%) | 5 (18.5%) |
| 35 to 50 years | 0 (0.0%) | 0 (0.0%) |
| Total | 22 (81.5%) | 5 (18.5%) |
Fertility by Education in Wray
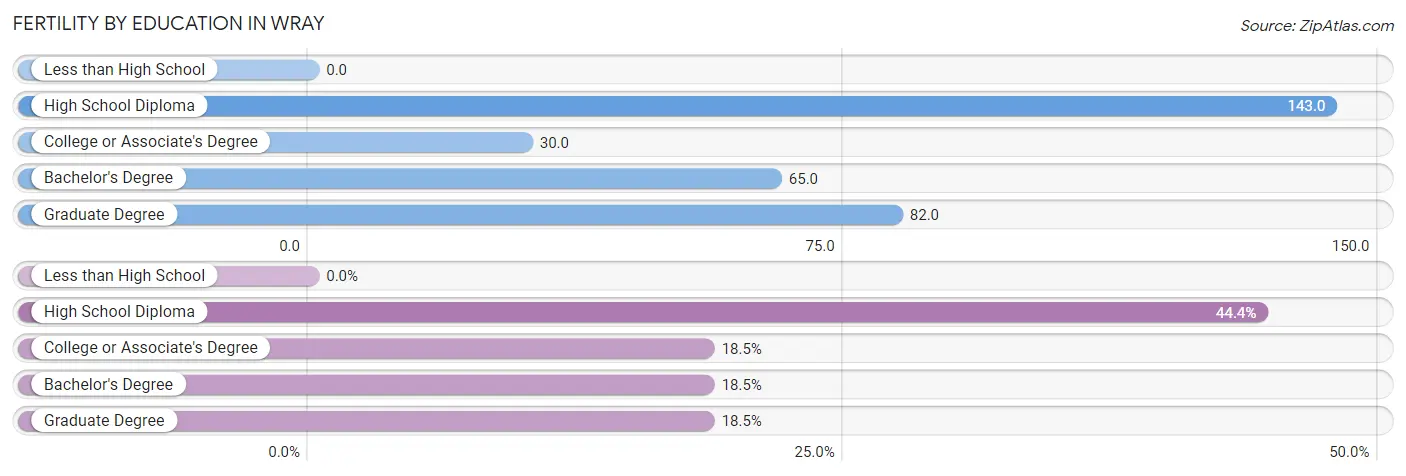
| Educational Attainment | Women with Births | Births / 1,000 Women |
| Less than High School | 0 (0.0%) | 0.0 |
| High School Diploma | 12 (44.4%) | 143.0 |
| College or Associate's Degree | 5 (18.5%) | 30.0 |
| Bachelor's Degree | 5 (18.5%) | 65.0 |
| Graduate Degree | 5 (18.5%) | 82.0 |
| Total | 27 (100.0%) | 51.0 |
Fertility by Education by Marriage Status in Wray
18.5% of women with births in Wray are unmarried. Women with the educational attainment of college or associate's degree are most likely to be married with 100.0% of them married at childbirth, while women with the educational attainment of high school diploma are least likely to be married with 41.7% of them unmarried at childbirth.
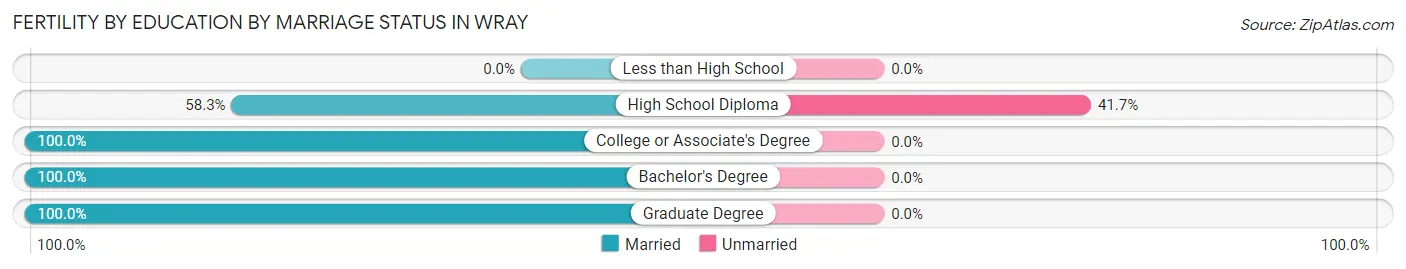
| Educational Attainment | Married | Unmarried |
| Less than High School | 0 (0.0%) | 0 (0.0%) |
| High School Diploma | 7 (58.3%) | 5 (41.7%) |
| College or Associate's Degree | 5 (100.0%) | 0 (0.0%) |
| Bachelor's Degree | 5 (100.0%) | 0 (0.0%) |
| Graduate Degree | 5 (100.0%) | 0 (0.0%) |
| Total | 22 (81.5%) | 5 (18.5%) |
Employment Characteristics in Wray
Employment by Class of Employer in Wray
Among the 1,111 employed individuals in Wray, private company employees (608 | 54.7%), local government employees (182 | 16.4%), and self-employed (not incorporated) (131 | 11.8%) make up the most common classes of employment.
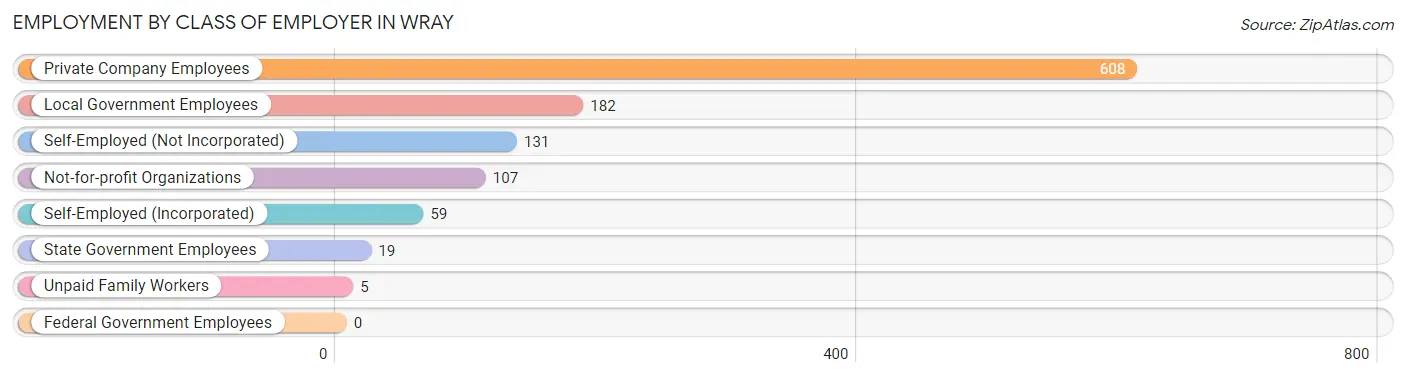
| Employer Class | # Employees | % Employees |
| Private Company Employees | 608 | 54.7% |
| Self-Employed (Incorporated) | 59 | 5.3% |
| Self-Employed (Not Incorporated) | 131 | 11.8% |
| Not-for-profit Organizations | 107 | 9.6% |
| Local Government Employees | 182 | 16.4% |
| State Government Employees | 19 | 1.7% |
| Federal Government Employees | 0 | 0.0% |
| Unpaid Family Workers | 5 | 0.4% |
| Total | 1,111 | 100.0% |
Employment Status by Age in Wray
According to the labor force statistics for Wray, out of the total population over 16 years of age (1,830), 67.2% or 1,230 individuals are in the labor force, with 5.7% or 70 of them unemployed. The age group with the highest labor force participation rate is 25 to 29 years, with 93.6% or 117 individuals in the labor force. Within the labor force, the 75 years and over age range has the highest percentage of unemployed individuals, with 28.0% or 7 of them being unemployed.
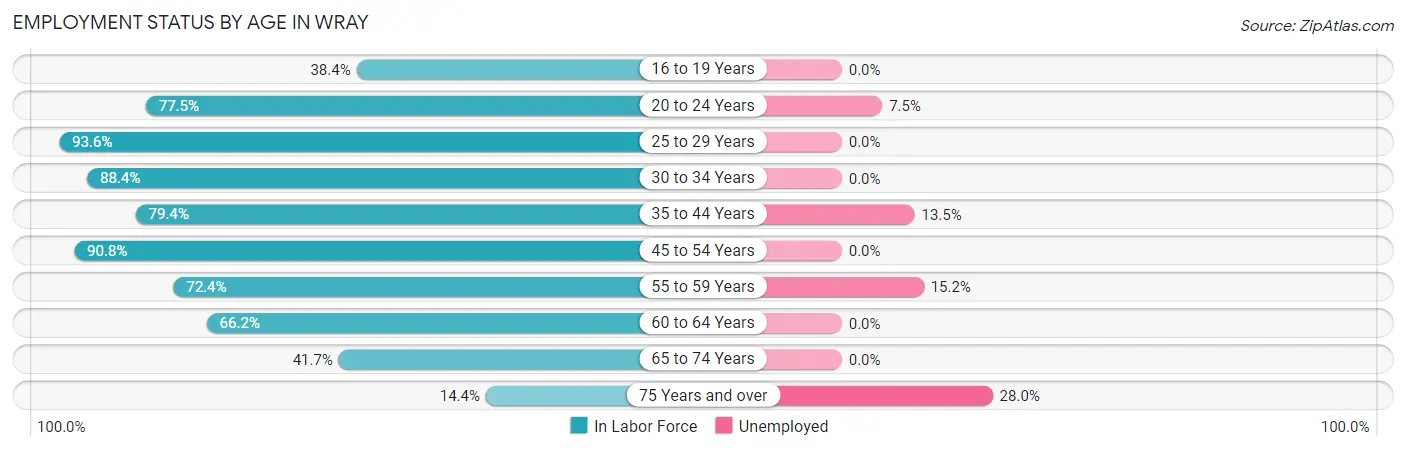
| Age Bracket | In Labor Force | Unemployed |
| 16 to 19 Years | 53 (38.4%) | 0 (0.0%) |
| 20 to 24 Years | 93 (77.5%) | 7 (7.5%) |
| 25 to 29 Years | 117 (93.6%) | 0 (0.0%) |
| 30 to 34 Years | 84 (88.4%) | 0 (0.0%) |
| 35 to 44 Years | 297 (79.4%) | 40 (13.5%) |
| 45 to 54 Years | 275 (90.8%) | 0 (0.0%) |
| 55 to 59 Years | 105 (72.4%) | 16 (15.2%) |
| 60 to 64 Years | 88 (66.2%) | 0 (0.0%) |
| 65 to 74 Years | 93 (41.7%) | 0 (0.0%) |
| 75 Years and over | 25 (14.4%) | 7 (28.0%) |
| Total | 1,230 (67.2%) | 70 (5.7%) |
Employment Status by Educational Attainment in Wray
According to labor force statistics for Wray, 82.2% of individuals (966) out of the total population between 25 and 64 years of age (1,175) are in the labor force, with 5.8% or 56 of them being unemployed. The group with the highest labor force participation rate are those with the educational attainment of high school diploma, with 92.6% or 250 individuals in the labor force. Within the labor force, individuals with high school diploma education have the highest percentage of unemployment, with 13.2% or 33 of them being unemployed.
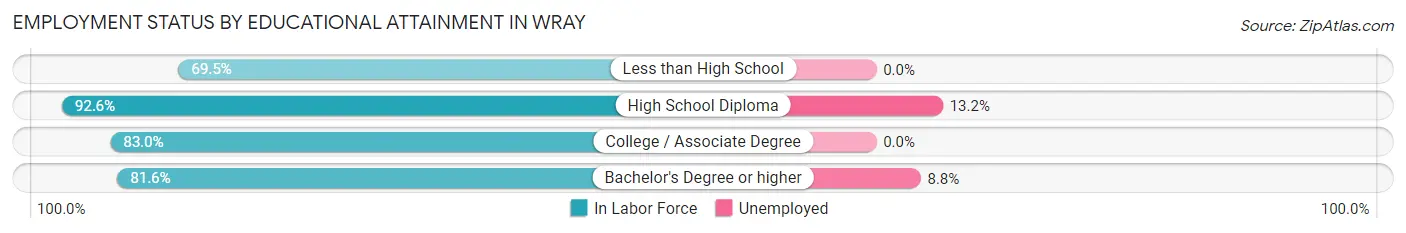
| Educational Attainment | In Labor Force | Unemployed |
| Less than High School | 157 (69.5%) | 0 (0.0%) |
| High School Diploma | 250 (92.6%) | 36 (13.2%) |
| College / Associate Degree | 298 (83.0%) | 0 (0.0%) |
| Bachelor's Degree or higher | 261 (81.6%) | 28 (8.8%) |
| Total | 966 (82.2%) | 68 (5.8%) |
Employment Occupations by Sex in Wray
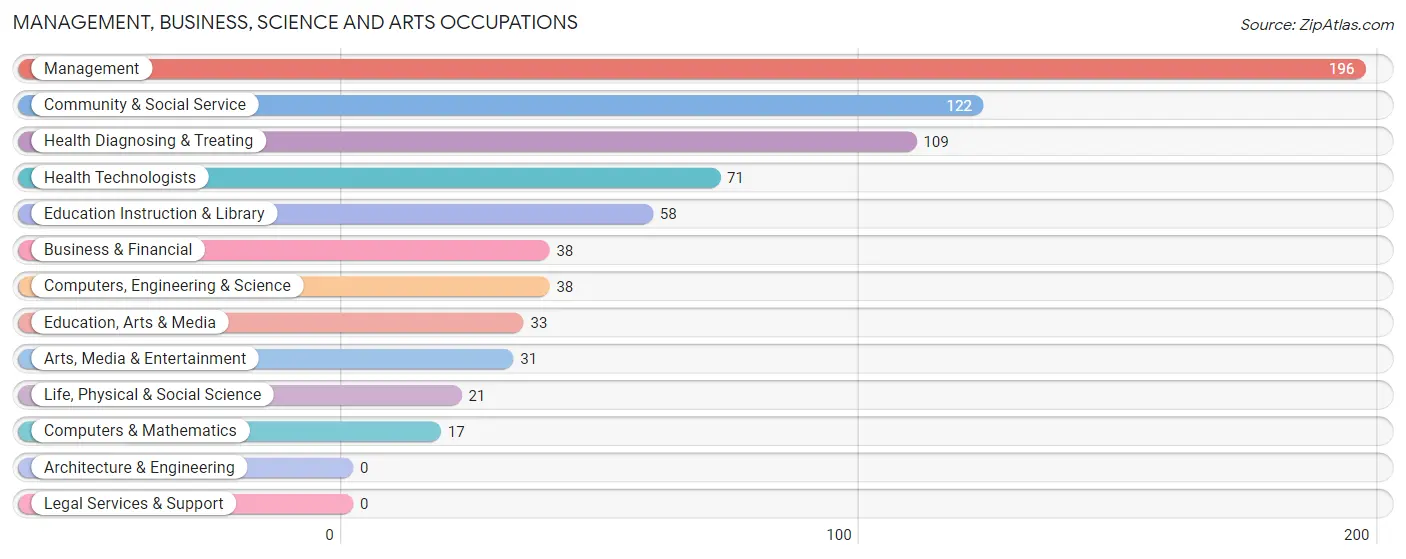
Management, Business, Science and Arts Occupations
The most common Management, Business, Science and Arts occupations in Wray are Management (196 | 16.9%), Community & Social Service (122 | 10.5%), Health Diagnosing & Treating (109 | 9.4%), Health Technologists (71 | 6.1%), and Education Instruction & Library (58 | 5.0%).
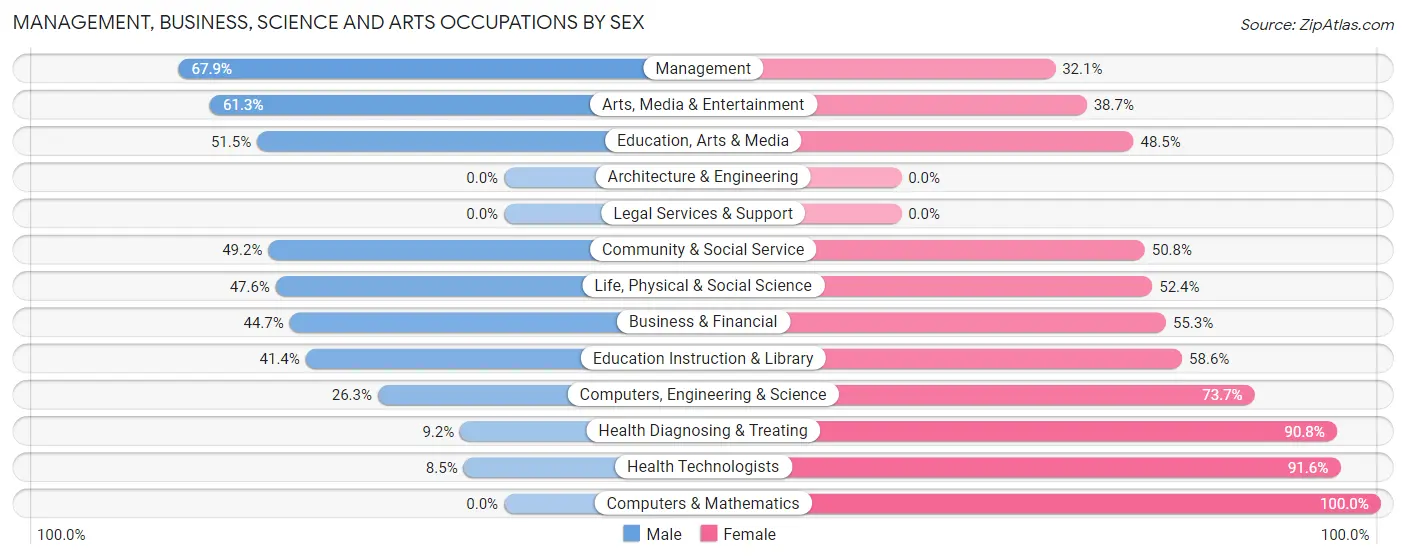
Management, Business, Science and Arts Occupations by Sex
Within the Management, Business, Science and Arts occupations in Wray, the most male-oriented occupations are Management (67.9%), Arts, Media & Entertainment (61.3%), and Education, Arts & Media (51.5%), while the most female-oriented occupations are Computers & Mathematics (100.0%), Health Technologists (91.5%), and Health Diagnosing & Treating (90.8%).
| Occupation | Male | Female |
| Management | 133 (67.9%) | 63 (32.1%) |
| Business & Financial | 17 (44.7%) | 21 (55.3%) |
| Computers, Engineering & Science | 10 (26.3%) | 28 (73.7%) |
| Computers & Mathematics | 0 (0.0%) | 17 (100.0%) |
| Architecture & Engineering | 0 (0.0%) | 0 (0.0%) |
| Life, Physical & Social Science | 10 (47.6%) | 11 (52.4%) |
| Community & Social Service | 60 (49.2%) | 62 (50.8%) |
| Education, Arts & Media | 17 (51.5%) | 16 (48.5%) |
| Legal Services & Support | 0 (0.0%) | 0 (0.0%) |
| Education Instruction & Library | 24 (41.4%) | 34 (58.6%) |
| Arts, Media & Entertainment | 19 (61.3%) | 12 (38.7%) |
| Health Diagnosing & Treating | 10 (9.2%) | 99 (90.8%) |
| Health Technologists | 6 (8.5%) | 65 (91.5%) |
| Total (Category) | 230 (45.7%) | 273 (54.3%) |
| Total (Overall) | 674 (58.1%) | 486 (41.9%) |
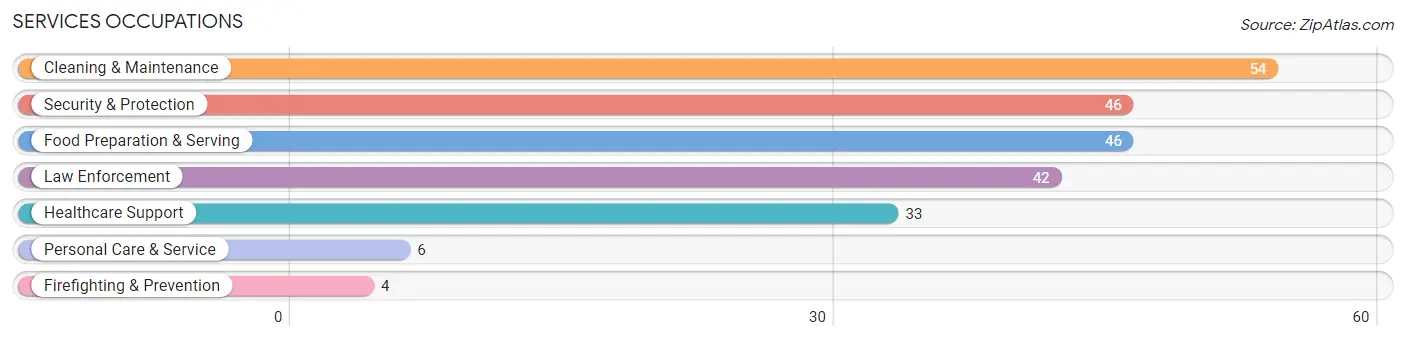
Services Occupations
The most common Services occupations in Wray are Cleaning & Maintenance (54 | 4.7%), Security & Protection (46 | 4.0%), Food Preparation & Serving (46 | 4.0%), Law Enforcement (42 | 3.6%), and Healthcare Support (33 | 2.8%).
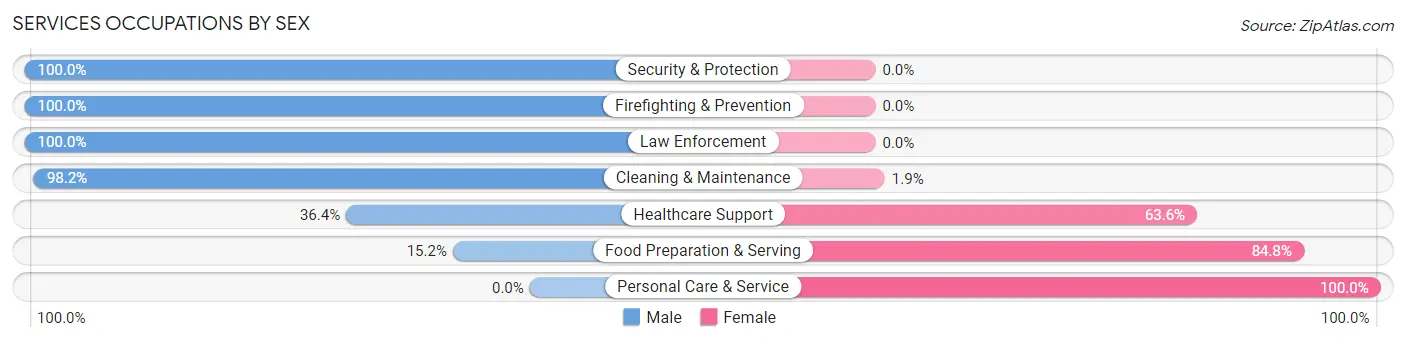
Services Occupations by Sex
Within the Services occupations in Wray, the most male-oriented occupations are Security & Protection (100.0%), Firefighting & Prevention (100.0%), and Law Enforcement (100.0%), while the most female-oriented occupations are Personal Care & Service (100.0%), Food Preparation & Serving (84.8%), and Healthcare Support (63.6%).
| Occupation | Male | Female |
| Healthcare Support | 12 (36.4%) | 21 (63.6%) |
| Security & Protection | 46 (100.0%) | 0 (0.0%) |
| Firefighting & Prevention | 4 (100.0%) | 0 (0.0%) |
| Law Enforcement | 42 (100.0%) | 0 (0.0%) |
| Food Preparation & Serving | 7 (15.2%) | 39 (84.8%) |
| Cleaning & Maintenance | 53 (98.2%) | 1 (1.8%) |
| Personal Care & Service | 0 (0.0%) | 6 (100.0%) |
| Total (Category) | 118 (63.8%) | 67 (36.2%) |
| Total (Overall) | 674 (58.1%) | 486 (41.9%) |
Sales and Office Occupations
The most common Sales and Office occupations in Wray are Office & Administration (91 | 7.8%), and Sales & Related (66 | 5.7%).
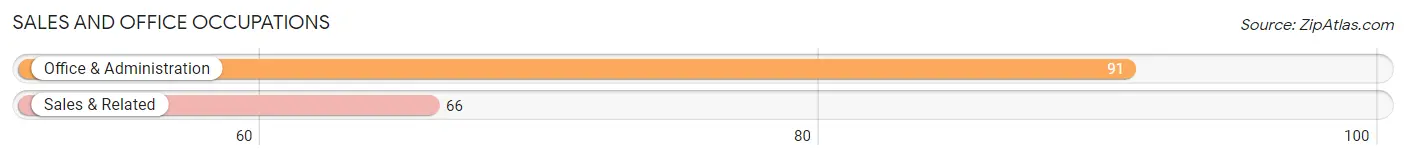
Sales and Office Occupations by Sex

| Occupation | Male | Female |
| Sales & Related | 38 (57.6%) | 28 (42.4%) |
| Office & Administration | 9 (9.9%) | 82 (90.1%) |
| Total (Category) | 47 (29.9%) | 110 (70.1%) |
| Total (Overall) | 674 (58.1%) | 486 (41.9%) |
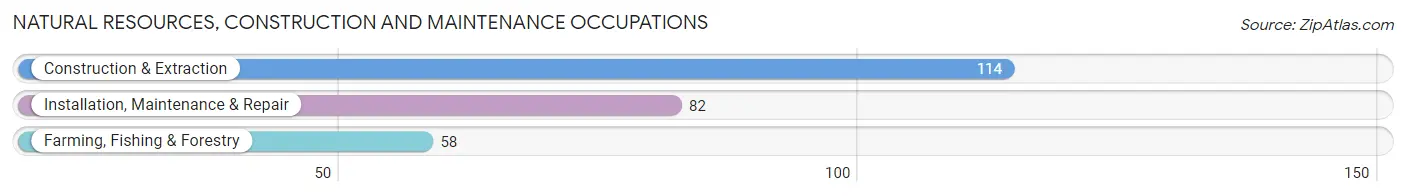
Natural Resources, Construction and Maintenance Occupations
The most common Natural Resources, Construction and Maintenance occupations in Wray are Construction & Extraction (114 | 9.8%), Installation, Maintenance & Repair (82 | 7.1%), and Farming, Fishing & Forestry (58 | 5.0%).
Natural Resources, Construction and Maintenance Occupations by Sex
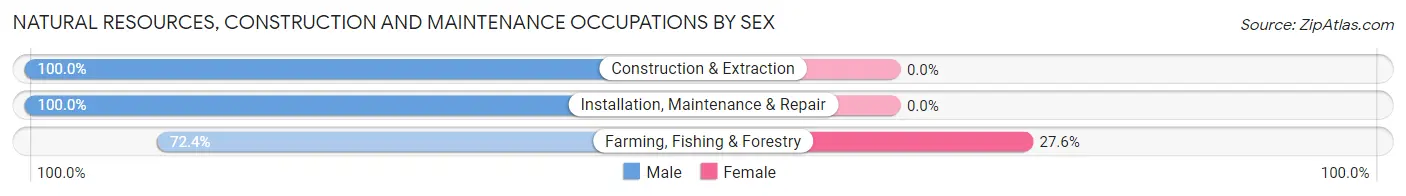
| Occupation | Male | Female |
| Farming, Fishing & Forestry | 42 (72.4%) | 16 (27.6%) |
| Construction & Extraction | 114 (100.0%) | 0 (0.0%) |
| Installation, Maintenance & Repair | 82 (100.0%) | 0 (0.0%) |
| Total (Category) | 238 (93.7%) | 16 (6.3%) |
| Total (Overall) | 674 (58.1%) | 486 (41.9%) |
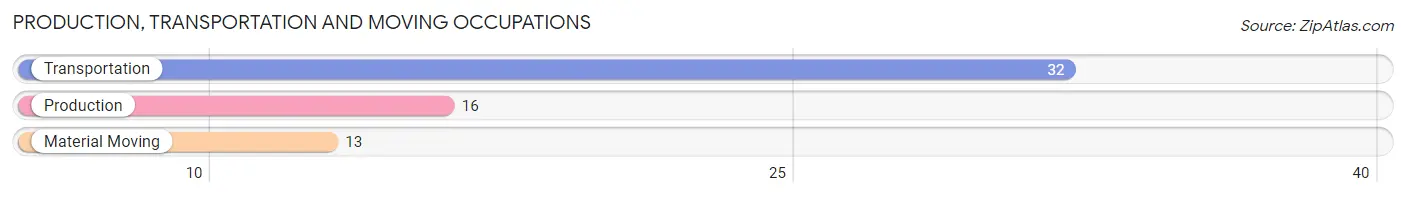
Production, Transportation and Moving Occupations
The most common Production, Transportation and Moving occupations in Wray are Transportation (32 | 2.8%), Production (16 | 1.4%), and Material Moving (13 | 1.1%).
Production, Transportation and Moving Occupations by Sex
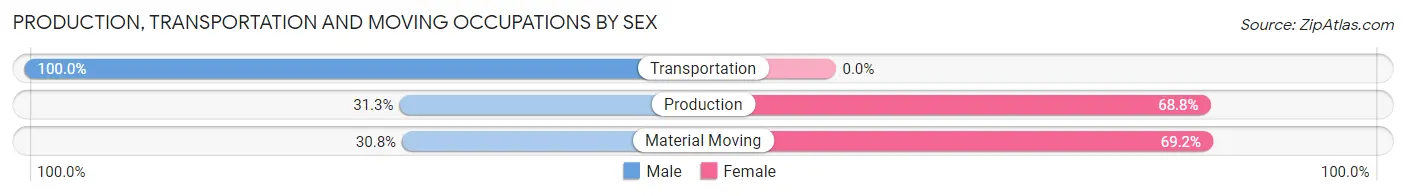
| Occupation | Male | Female |
| Production | 5 (31.2%) | 11 (68.8%) |
| Transportation | 32 (100.0%) | 0 (0.0%) |
| Material Moving | 4 (30.8%) | 9 (69.2%) |
| Total (Category) | 41 (67.2%) | 20 (32.8%) |
| Total (Overall) | 674 (58.1%) | 486 (41.9%) |
Employment Industries by Sex in Wray
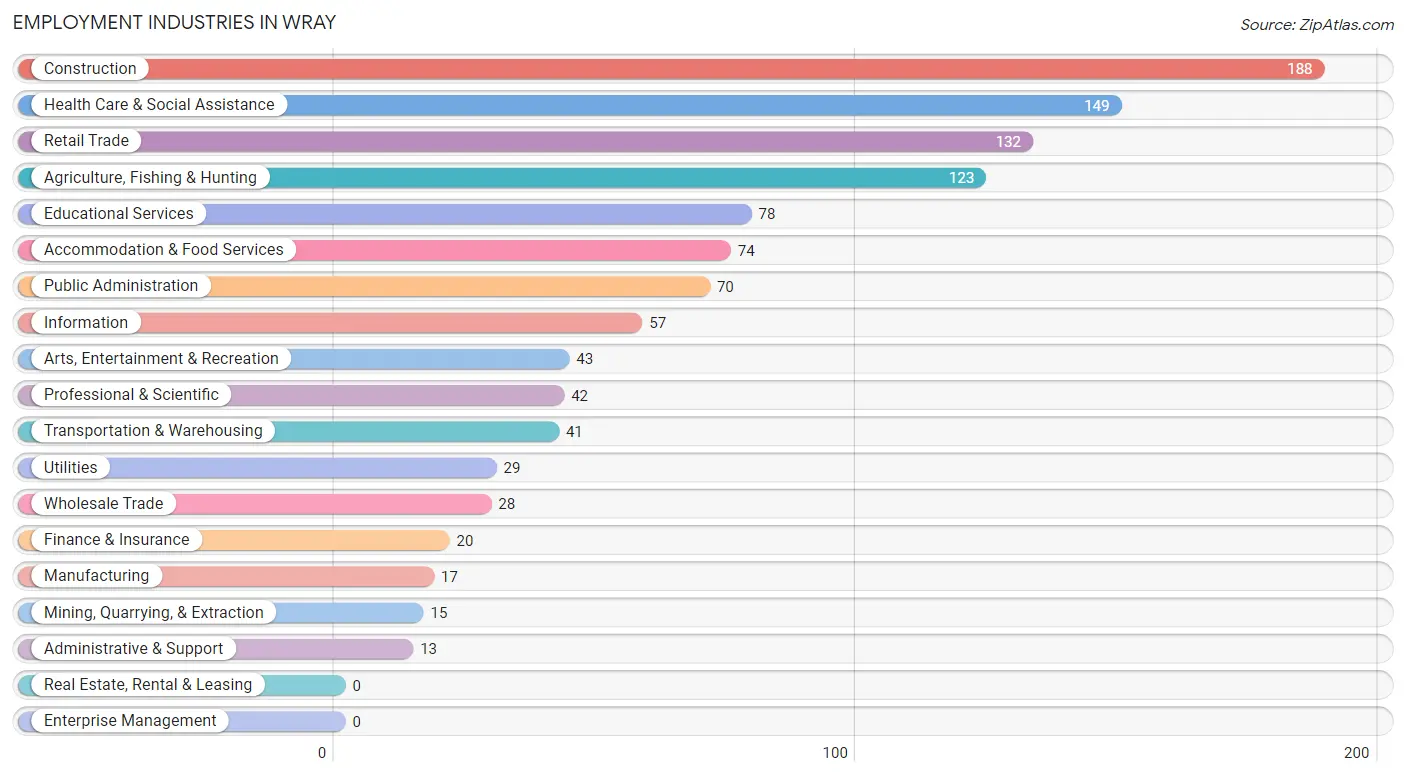
Employment Industries in Wray
The major employment industries in Wray include Construction (188 | 16.2%), Health Care & Social Assistance (149 | 12.8%), Retail Trade (132 | 11.4%), Agriculture, Fishing & Hunting (123 | 10.6%), and Educational Services (78 | 6.7%).
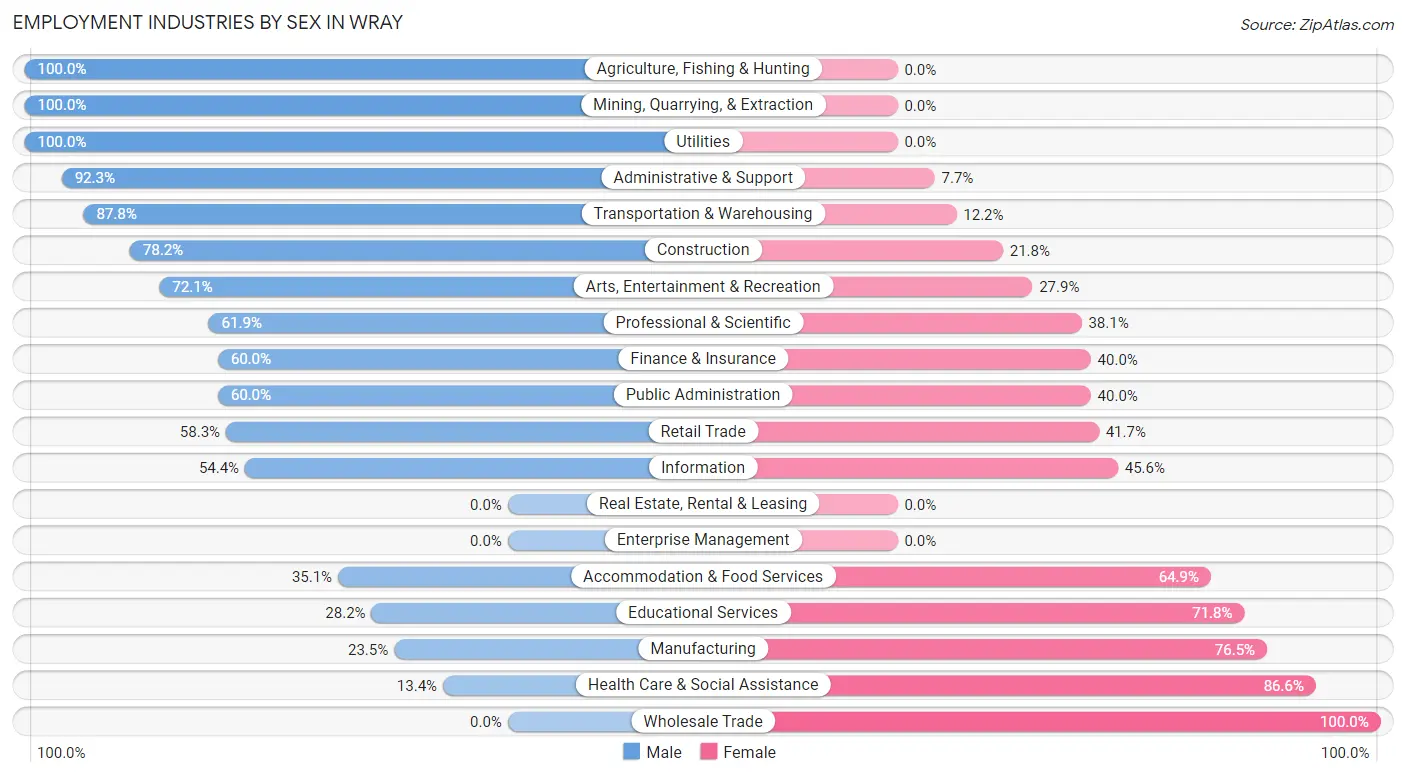
Employment Industries by Sex in Wray
The Wray industries that see more men than women are Agriculture, Fishing & Hunting (100.0%), Mining, Quarrying, & Extraction (100.0%), and Utilities (100.0%), whereas the industries that tend to have a higher number of women are Wholesale Trade (100.0%), Health Care & Social Assistance (86.6%), and Manufacturing (76.5%).
| Industry | Male | Female |
| Agriculture, Fishing & Hunting | 123 (100.0%) | 0 (0.0%) |
| Mining, Quarrying, & Extraction | 15 (100.0%) | 0 (0.0%) |
| Construction | 147 (78.2%) | 41 (21.8%) |
| Manufacturing | 4 (23.5%) | 13 (76.5%) |
| Wholesale Trade | 0 (0.0%) | 28 (100.0%) |
| Retail Trade | 77 (58.3%) | 55 (41.7%) |
| Transportation & Warehousing | 36 (87.8%) | 5 (12.2%) |
| Utilities | 29 (100.0%) | 0 (0.0%) |
| Information | 31 (54.4%) | 26 (45.6%) |
| Finance & Insurance | 12 (60.0%) | 8 (40.0%) |
| Real Estate, Rental & Leasing | 0 (0.0%) | 0 (0.0%) |
| Professional & Scientific | 26 (61.9%) | 16 (38.1%) |
| Enterprise Management | 0 (0.0%) | 0 (0.0%) |
| Administrative & Support | 12 (92.3%) | 1 (7.7%) |
| Educational Services | 22 (28.2%) | 56 (71.8%) |
| Health Care & Social Assistance | 20 (13.4%) | 129 (86.6%) |
| Arts, Entertainment & Recreation | 31 (72.1%) | 12 (27.9%) |
| Accommodation & Food Services | 26 (35.1%) | 48 (64.9%) |
| Public Administration | 42 (60.0%) | 28 (40.0%) |
| Total | 674 (58.1%) | 486 (41.9%) |
Education in Wray
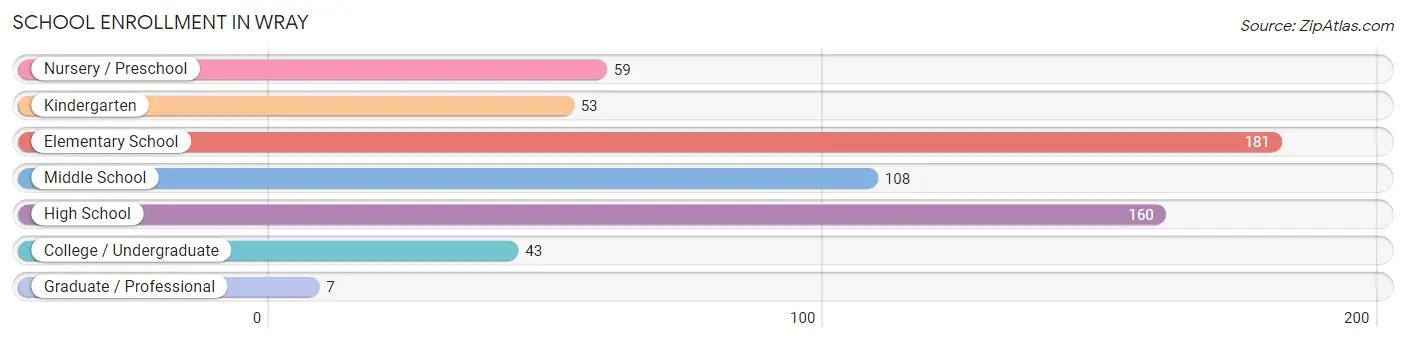
School Enrollment in Wray
The most common levels of schooling among the 611 students in Wray are elementary school (181 | 29.6%), high school (160 | 26.2%), and middle school (108 | 17.7%).
| School Level | # Students | % Students |
| Nursery / Preschool | 59 | 9.7% |
| Kindergarten | 53 | 8.7% |
| Elementary School | 181 | 29.6% |
| Middle School | 108 | 17.7% |
| High School | 160 | 26.2% |
| College / Undergraduate | 43 | 7.0% |
| Graduate / Professional | 7 | 1.1% |
| Total | 611 | 100.0% |
School Enrollment by Age by Funding Source in Wray
Out of a total of 611 students who are enrolled in schools in Wray, 58 (9.5%) attend a private institution, while the remaining 553 (90.5%) are enrolled in public schools. The age group of 20 to 24 year olds has the highest likelihood of being enrolled in private schools, with 4 (40.0% in the age bracket) enrolled. Conversely, the age group of 15 to 17 year olds has the lowest likelihood of being enrolled in a private school, with 140 (100.0% in the age bracket) attending a public institution.
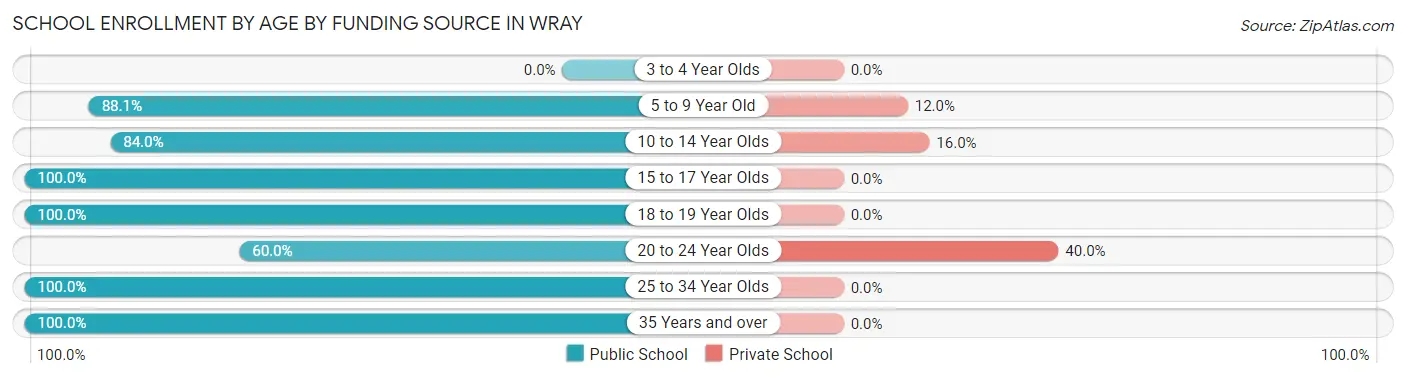
| Age Bracket | Public School | Private School |
| 3 to 4 Year Olds | 0 (0.0%) | 0 (0.0%) |
| 5 to 9 Year Old | 258 (88.0%) | 35 (11.9%) |
| 10 to 14 Year Olds | 100 (84.0%) | 19 (16.0%) |
| 15 to 17 Year Olds | 140 (100.0%) | 0 (0.0%) |
| 18 to 19 Year Olds | 32 (100.0%) | 0 (0.0%) |
| 20 to 24 Year Olds | 6 (60.0%) | 4 (40.0%) |
| 25 to 34 Year Olds | 10 (100.0%) | 0 (0.0%) |
| 35 Years and over | 7 (100.0%) | 0 (0.0%) |
| Total | 553 (90.5%) | 58 (9.5%) |
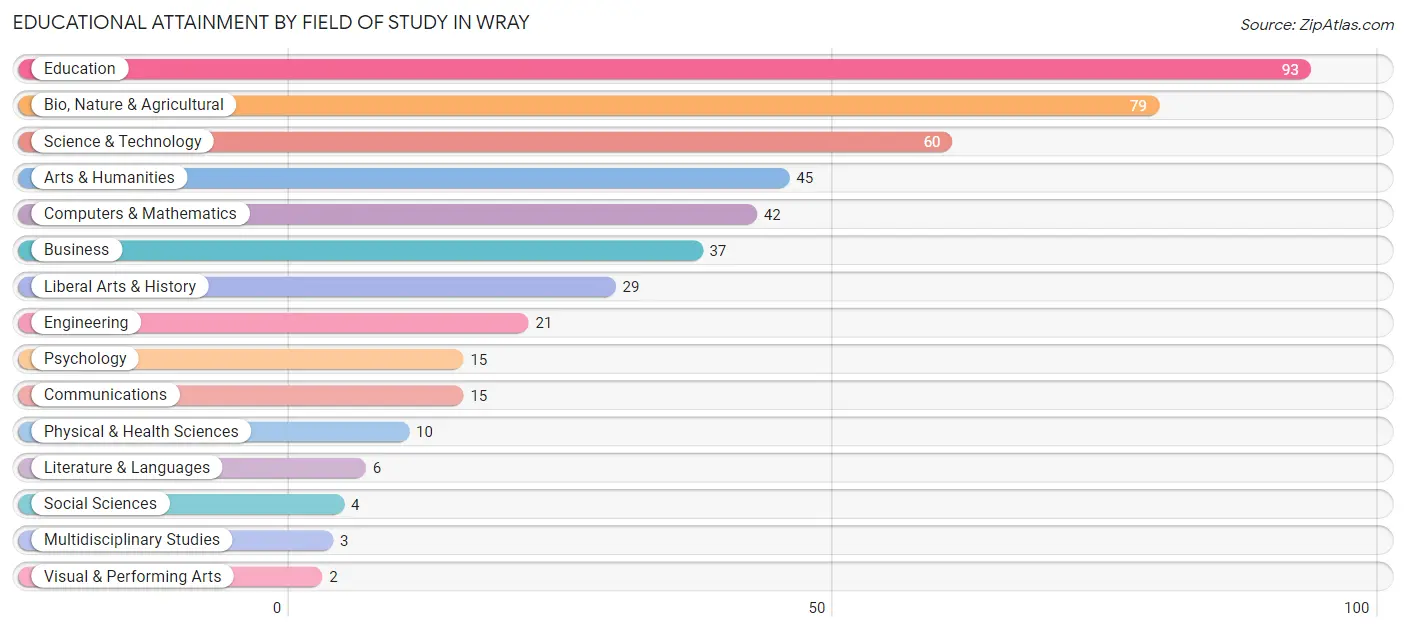
Educational Attainment by Field of Study in Wray
Education (93 | 20.2%), bio, nature & agricultural (79 | 17.1%), science & technology (60 | 13.0%), arts & humanities (45 | 9.8%), and computers & mathematics (42 | 9.1%) are the most common fields of study among 461 individuals in Wray who have obtained a bachelor's degree or higher.
| Field of Study | # Graduates | % Graduates |
| Computers & Mathematics | 42 | 9.1% |
| Bio, Nature & Agricultural | 79 | 17.1% |
| Physical & Health Sciences | 10 | 2.2% |
| Psychology | 15 | 3.3% |
| Social Sciences | 4 | 0.9% |
| Engineering | 21 | 4.6% |
| Multidisciplinary Studies | 3 | 0.6% |
| Science & Technology | 60 | 13.0% |
| Business | 37 | 8.0% |
| Education | 93 | 20.2% |
| Literature & Languages | 6 | 1.3% |
| Liberal Arts & History | 29 | 6.3% |
| Visual & Performing Arts | 2 | 0.4% |
| Communications | 15 | 3.3% |
| Arts & Humanities | 45 | 9.8% |
| Total | 461 | 100.0% |
Transportation & Commute in Wray
Vehicle Availability by Sex in Wray
The most prevalent vehicle ownership categories in Wray are males with 2 vehicles (234, accounting for 35.5%) and females with 2 vehicles (182, making up 51.8%).
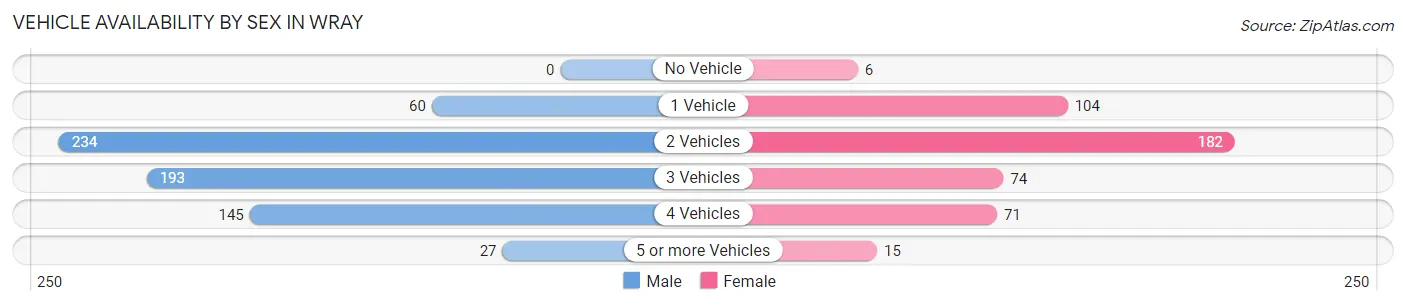
| Vehicles Available | Male | Female |
| No Vehicle | 0 (0.0%) | 6 (1.3%) |
| 1 Vehicle | 60 (9.1%) | 104 (23.0%) |
| 2 Vehicles | 234 (35.5%) | 182 (40.3%) |
| 3 Vehicles | 193 (29.3%) | 74 (16.4%) |
| 4 Vehicles | 145 (22.0%) | 71 (15.7%) |
| 5 or more Vehicles | 27 (4.1%) | 15 (3.3%) |
| Total | 659 (100.0%) | 452 (100.0%) |
Commute Time in Wray
The most frequently occuring commute durations in Wray are 5 to 9 minutes (473 commuters, 44.5%), less than 5 minutes (321 commuters, 30.2%), and 10 to 14 minutes (48 commuters, 4.5%).
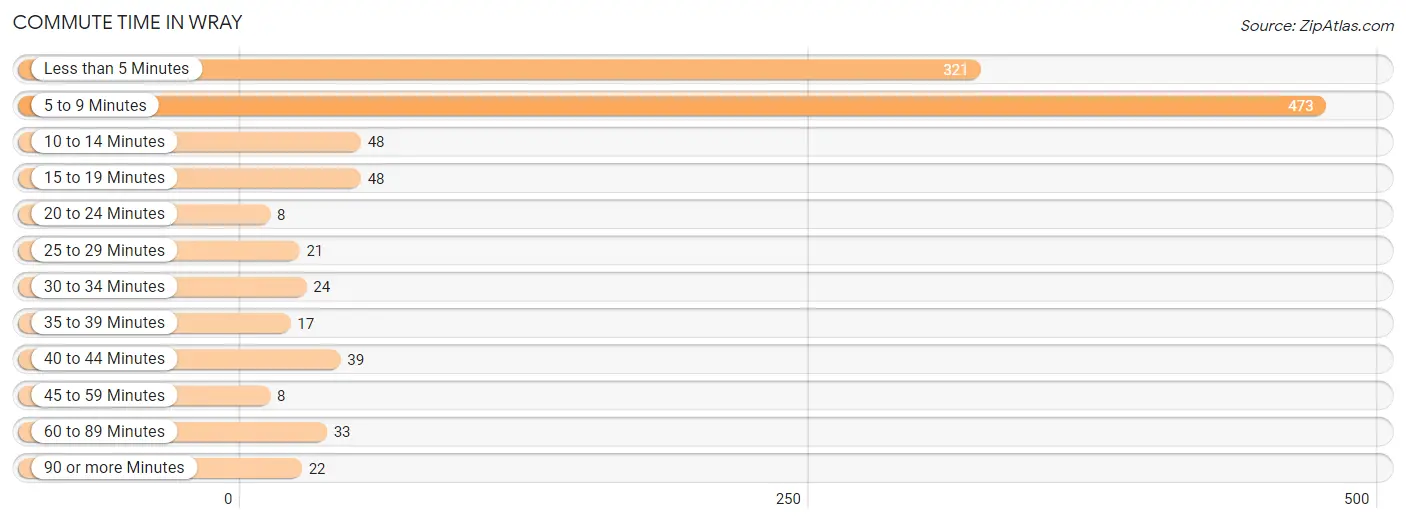
| Commute Time | # Commuters | % Commuters |
| Less than 5 Minutes | 321 | 30.2% |
| 5 to 9 Minutes | 473 | 44.5% |
| 10 to 14 Minutes | 48 | 4.5% |
| 15 to 19 Minutes | 48 | 4.5% |
| 20 to 24 Minutes | 8 | 0.7% |
| 25 to 29 Minutes | 21 | 2.0% |
| 30 to 34 Minutes | 24 | 2.3% |
| 35 to 39 Minutes | 17 | 1.6% |
| 40 to 44 Minutes | 39 | 3.7% |
| 45 to 59 Minutes | 8 | 0.7% |
| 60 to 89 Minutes | 33 | 3.1% |
| 90 or more Minutes | 22 | 2.1% |
Commute Time by Sex in Wray
The most common commute times in Wray are 5 to 9 minutes (257 commuters, 40.2%) for males and 5 to 9 minutes (216 commuters, 51.2%) for females.
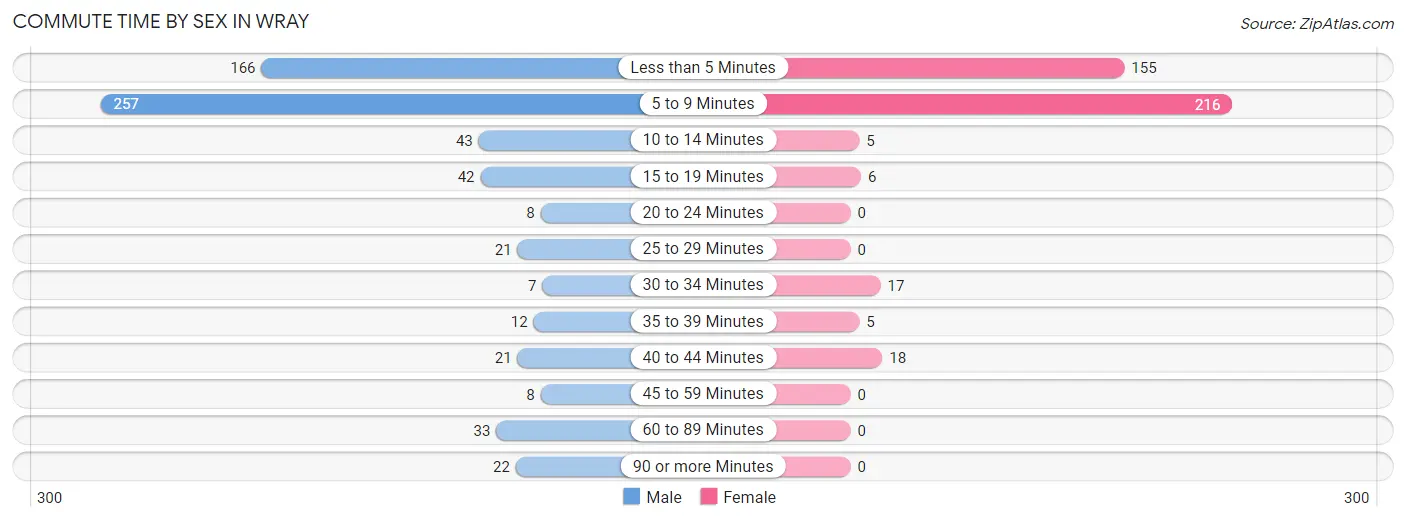
| Commute Time | Male | Female |
| Less than 5 Minutes | 166 (25.9%) | 155 (36.7%) |
| 5 to 9 Minutes | 257 (40.2%) | 216 (51.2%) |
| 10 to 14 Minutes | 43 (6.7%) | 5 (1.2%) |
| 15 to 19 Minutes | 42 (6.6%) | 6 (1.4%) |
| 20 to 24 Minutes | 8 (1.3%) | 0 (0.0%) |
| 25 to 29 Minutes | 21 (3.3%) | 0 (0.0%) |
| 30 to 34 Minutes | 7 (1.1%) | 17 (4.0%) |
| 35 to 39 Minutes | 12 (1.9%) | 5 (1.2%) |
| 40 to 44 Minutes | 21 (3.3%) | 18 (4.3%) |
| 45 to 59 Minutes | 8 (1.3%) | 0 (0.0%) |
| 60 to 89 Minutes | 33 (5.2%) | 0 (0.0%) |
| 90 or more Minutes | 22 (3.4%) | 0 (0.0%) |
Time of Departure to Work by Sex in Wray
The most frequent times of departure to work in Wray are 7:30 AM to 7:59 AM (113, 17.7%) for males and 7:00 AM to 7:29 AM (87, 20.6%) for females.
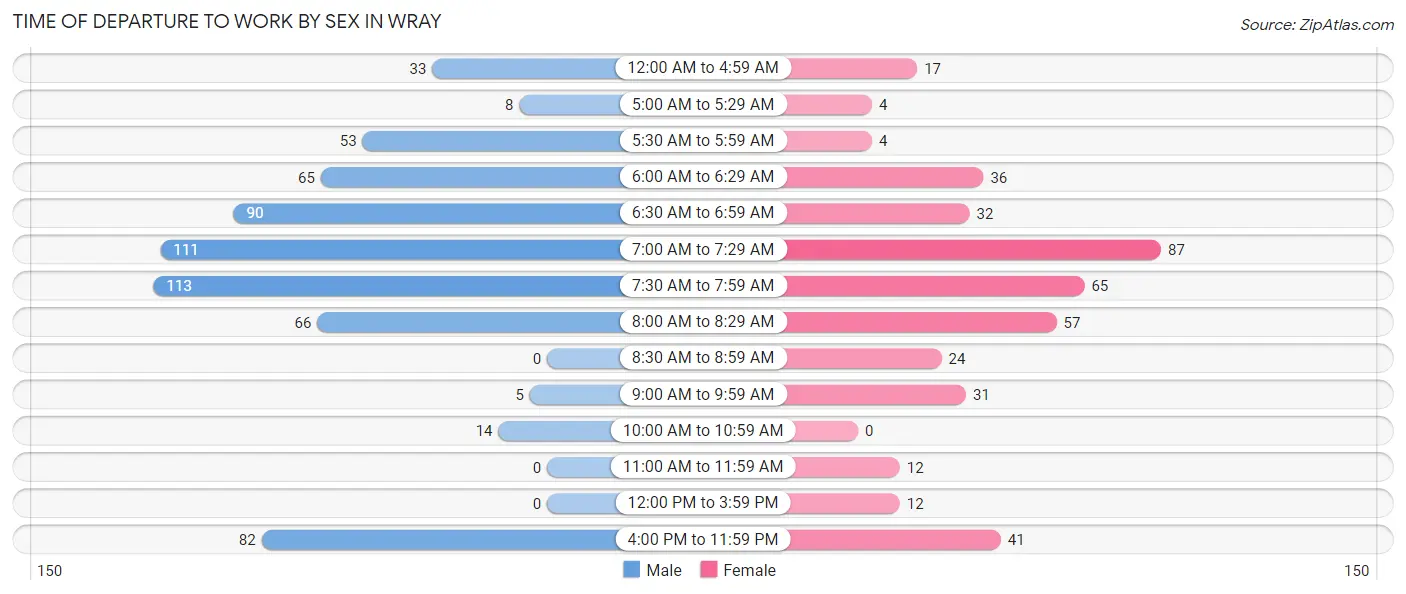
| Time of Departure | Male | Female |
| 12:00 AM to 4:59 AM | 33 (5.2%) | 17 (4.0%) |
| 5:00 AM to 5:29 AM | 8 (1.3%) | 4 (0.9%) |
| 5:30 AM to 5:59 AM | 53 (8.3%) | 4 (0.9%) |
| 6:00 AM to 6:29 AM | 65 (10.2%) | 36 (8.5%) |
| 6:30 AM to 6:59 AM | 90 (14.1%) | 32 (7.6%) |
| 7:00 AM to 7:29 AM | 111 (17.3%) | 87 (20.6%) |
| 7:30 AM to 7:59 AM | 113 (17.7%) | 65 (15.4%) |
| 8:00 AM to 8:29 AM | 66 (10.3%) | 57 (13.5%) |
| 8:30 AM to 8:59 AM | 0 (0.0%) | 24 (5.7%) |
| 9:00 AM to 9:59 AM | 5 (0.8%) | 31 (7.3%) |
| 10:00 AM to 10:59 AM | 14 (2.2%) | 0 (0.0%) |
| 11:00 AM to 11:59 AM | 0 (0.0%) | 12 (2.8%) |
| 12:00 PM to 3:59 PM | 0 (0.0%) | 12 (2.8%) |
| 4:00 PM to 11:59 PM | 82 (12.8%) | 41 (9.7%) |
| Total | 640 (100.0%) | 422 (100.0%) |
Housing Occupancy in Wray
Occupancy by Ownership in Wray
Of the total 951 dwellings in Wray, owner-occupied units account for 644 (67.7%), while renter-occupied units make up 307 (32.3%).
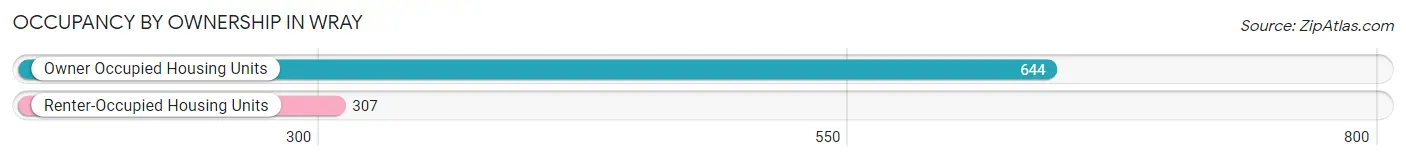
| Occupancy | # Housing Units | % Housing Units |
| Owner Occupied Housing Units | 644 | 67.7% |
| Renter-Occupied Housing Units | 307 | 32.3% |
| Total Occupied Housing Units | 951 | 100.0% |
Occupancy by Household Size in Wray
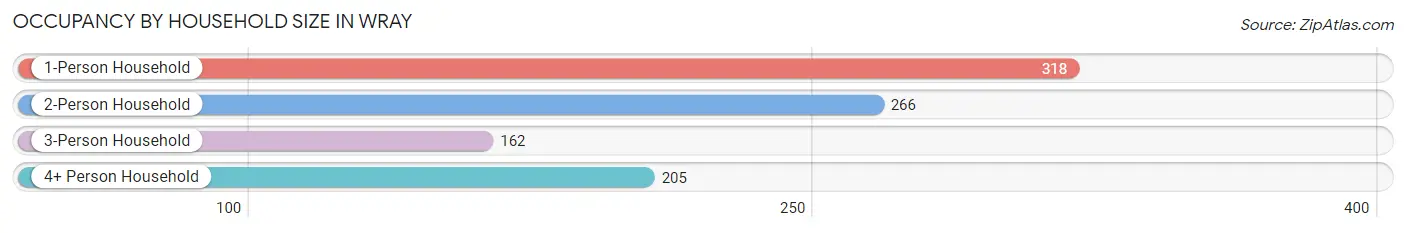
| Household Size | # Housing Units | % Housing Units |
| 1-Person Household | 318 | 33.4% |
| 2-Person Household | 266 | 28.0% |
| 3-Person Household | 162 | 17.0% |
| 4+ Person Household | 205 | 21.6% |
| Total Housing Units | 951 | 100.0% |
Occupancy by Ownership by Household Size in Wray
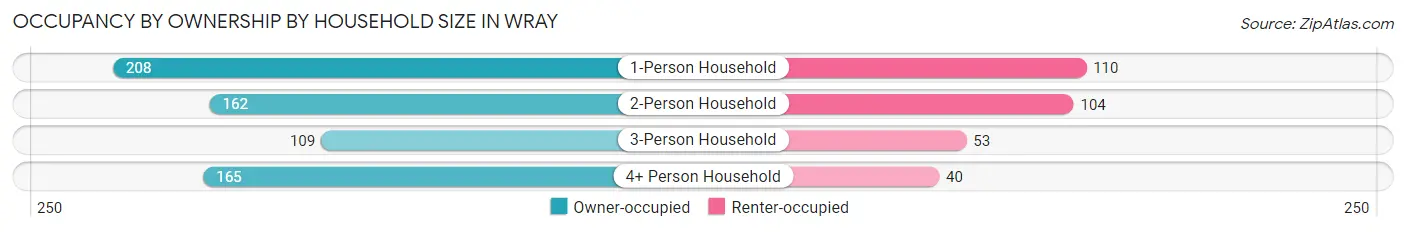
| Household Size | Owner-occupied | Renter-occupied |
| 1-Person Household | 208 (65.4%) | 110 (34.6%) |
| 2-Person Household | 162 (60.9%) | 104 (39.1%) |
| 3-Person Household | 109 (67.3%) | 53 (32.7%) |
| 4+ Person Household | 165 (80.5%) | 40 (19.5%) |
| Total Housing Units | 644 (67.7%) | 307 (32.3%) |
Occupancy by Educational Attainment in Wray
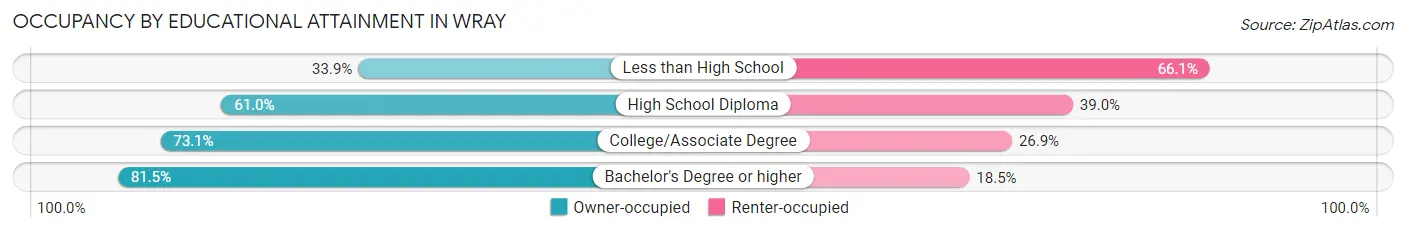
| Household Size | Owner-occupied | Renter-occupied |
| Less than High School | 42 (33.9%) | 82 (66.1%) |
| High School Diploma | 136 (61.0%) | 87 (39.0%) |
| College/Associate Degree | 228 (73.1%) | 84 (26.9%) |
| Bachelor's Degree or higher | 238 (81.5%) | 54 (18.5%) |
Occupancy by Age of Householder in Wray
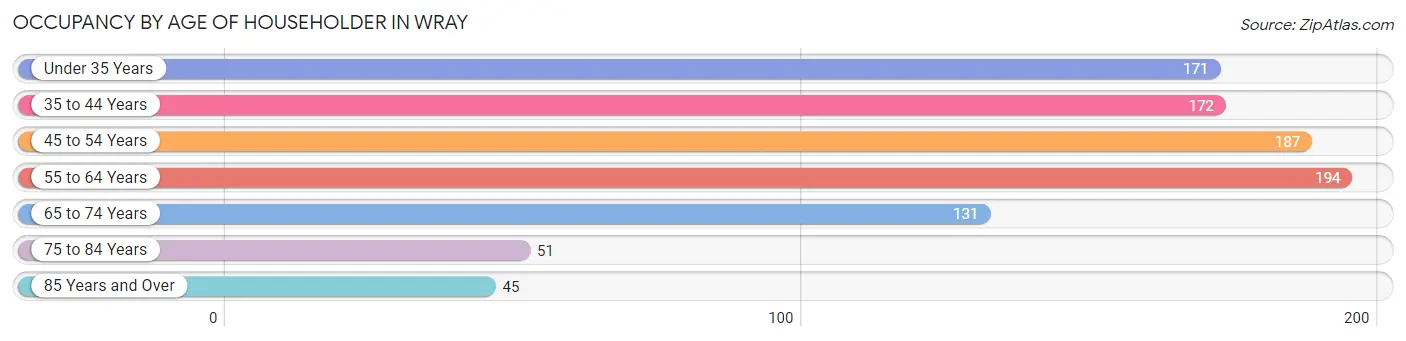
| Age Bracket | # Households | % Households |
| Under 35 Years | 171 | 18.0% |
| 35 to 44 Years | 172 | 18.1% |
| 45 to 54 Years | 187 | 19.7% |
| 55 to 64 Years | 194 | 20.4% |
| 65 to 74 Years | 131 | 13.8% |
| 75 to 84 Years | 51 | 5.4% |
| 85 Years and Over | 45 | 4.7% |
| Total | 951 | 100.0% |
Housing Finances in Wray
Median Income by Occupancy in Wray
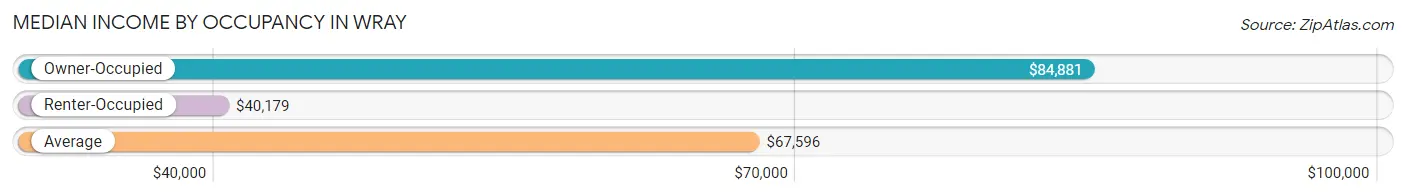
| Occupancy Type | # Households | Median Income |
| Owner-Occupied | 644 (67.7%) | $84,881 |
| Renter-Occupied | 307 (32.3%) | $40,179 |
| Average | 951 (100.0%) | $67,596 |
Occupancy by Householder Income Bracket in Wray
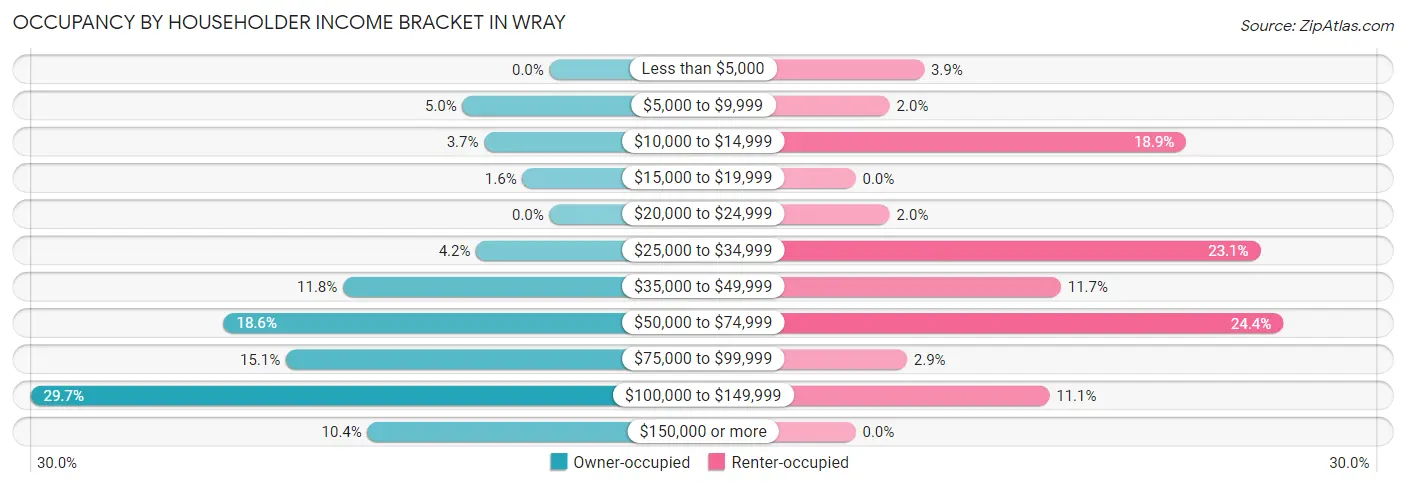
| Income Bracket | Owner-occupied | Renter-occupied |
| Less than $5,000 | 0 (0.0%) | 12 (3.9%) |
| $5,000 to $9,999 | 32 (5.0%) | 6 (1.9%) |
| $10,000 to $14,999 | 24 (3.7%) | 58 (18.9%) |
| $15,000 to $19,999 | 10 (1.5%) | 0 (0.0%) |
| $20,000 to $24,999 | 0 (0.0%) | 6 (1.9%) |
| $25,000 to $34,999 | 27 (4.2%) | 71 (23.1%) |
| $35,000 to $49,999 | 76 (11.8%) | 36 (11.7%) |
| $50,000 to $74,999 | 120 (18.6%) | 75 (24.4%) |
| $75,000 to $99,999 | 97 (15.1%) | 9 (2.9%) |
| $100,000 to $149,999 | 191 (29.7%) | 34 (11.1%) |
| $150,000 or more | 67 (10.4%) | 0 (0.0%) |
| Total | 644 (100.0%) | 307 (100.0%) |
Monthly Housing Cost Tiers in Wray
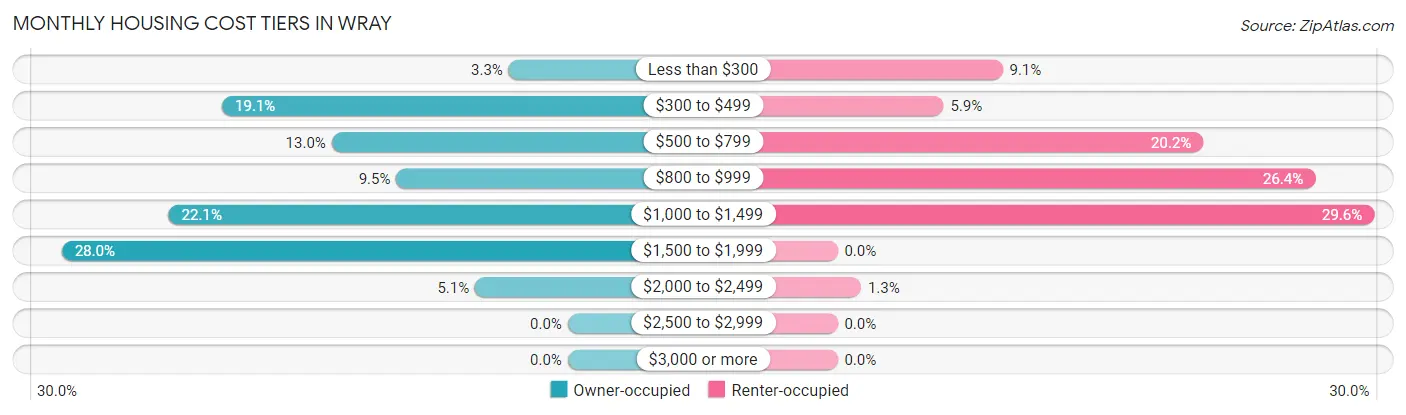
| Monthly Cost | Owner-occupied | Renter-occupied |
| Less than $300 | 21 (3.3%) | 28 (9.1%) |
| $300 to $499 | 123 (19.1%) | 18 (5.9%) |
| $500 to $799 | 84 (13.0%) | 62 (20.2%) |
| $800 to $999 | 61 (9.5%) | 81 (26.4%) |
| $1,000 to $1,499 | 142 (22.1%) | 91 (29.6%) |
| $1,500 to $1,999 | 180 (28.0%) | 0 (0.0%) |
| $2,000 to $2,499 | 33 (5.1%) | 4 (1.3%) |
| $2,500 to $2,999 | 0 (0.0%) | 0 (0.0%) |
| $3,000 or more | 0 (0.0%) | 0 (0.0%) |
| Total | 644 (100.0%) | 307 (100.0%) |
Physical Housing Characteristics in Wray
Housing Structures in Wray
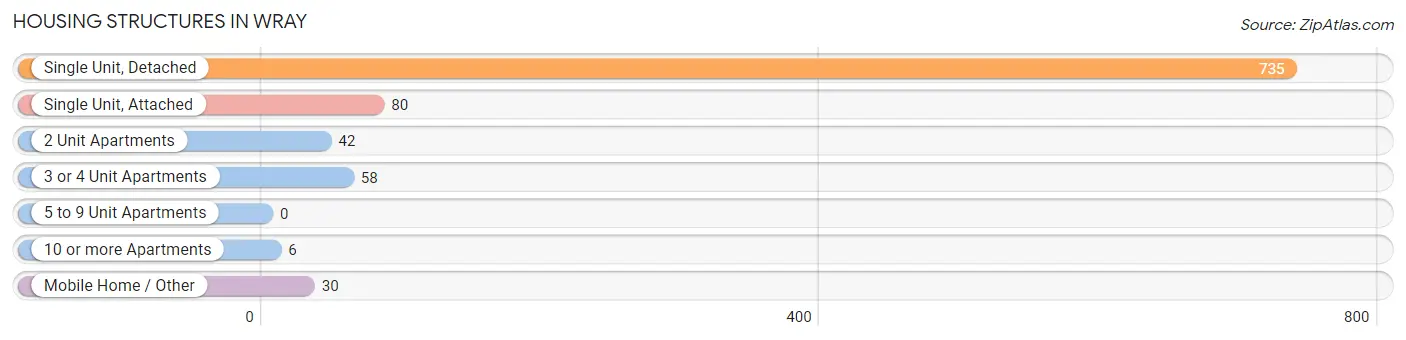
| Structure Type | # Housing Units | % Housing Units |
| Single Unit, Detached | 735 | 77.3% |
| Single Unit, Attached | 80 | 8.4% |
| 2 Unit Apartments | 42 | 4.4% |
| 3 or 4 Unit Apartments | 58 | 6.1% |
| 5 to 9 Unit Apartments | 0 | 0.0% |
| 10 or more Apartments | 6 | 0.6% |
| Mobile Home / Other | 30 | 3.2% |
| Total | 951 | 100.0% |
Housing Structures by Occupancy in Wray
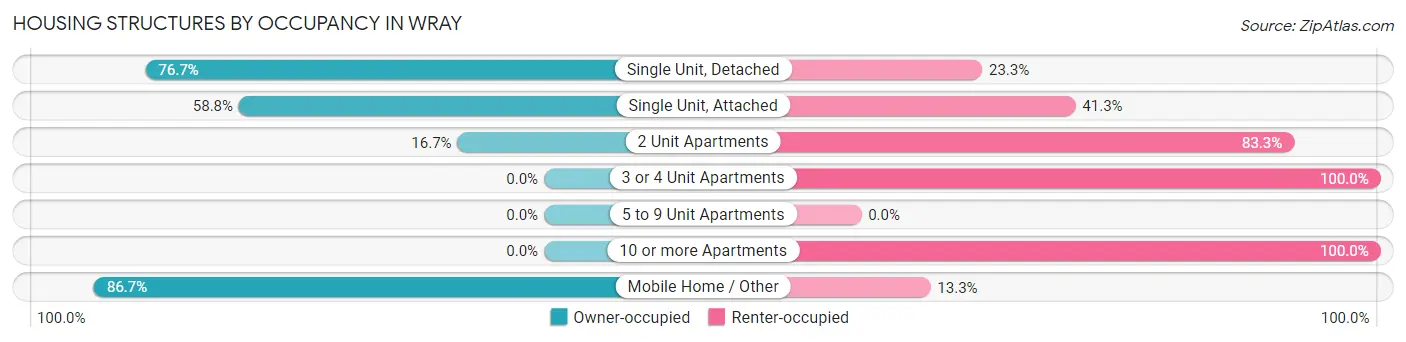
| Structure Type | Owner-occupied | Renter-occupied |
| Single Unit, Detached | 564 (76.7%) | 171 (23.3%) |
| Single Unit, Attached | 47 (58.8%) | 33 (41.2%) |
| 2 Unit Apartments | 7 (16.7%) | 35 (83.3%) |
| 3 or 4 Unit Apartments | 0 (0.0%) | 58 (100.0%) |
| 5 to 9 Unit Apartments | 0 (0.0%) | 0 (0.0%) |
| 10 or more Apartments | 0 (0.0%) | 6 (100.0%) |
| Mobile Home / Other | 26 (86.7%) | 4 (13.3%) |
| Total | 644 (67.7%) | 307 (32.3%) |
Housing Structures by Number of Rooms in Wray
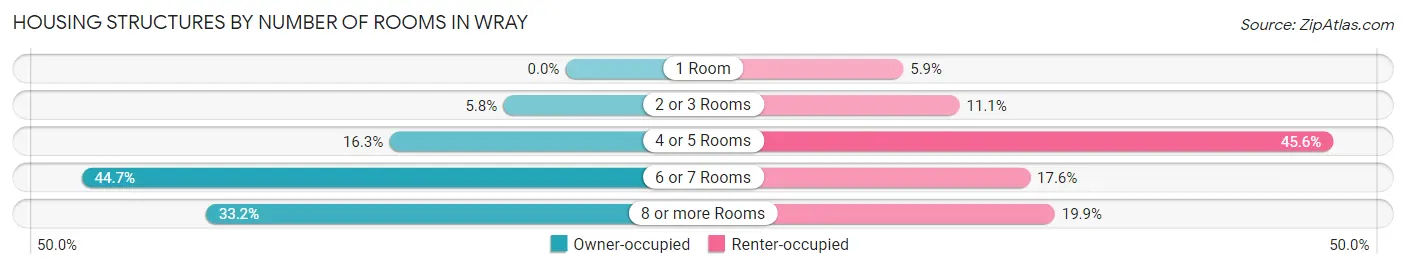
| Number of Rooms | Owner-occupied | Renter-occupied |
| 1 Room | 0 (0.0%) | 18 (5.9%) |
| 2 or 3 Rooms | 37 (5.8%) | 34 (11.1%) |
| 4 or 5 Rooms | 105 (16.3%) | 140 (45.6%) |
| 6 or 7 Rooms | 288 (44.7%) | 54 (17.6%) |
| 8 or more Rooms | 214 (33.2%) | 61 (19.9%) |
| Total | 644 (100.0%) | 307 (100.0%) |
Housing Structure by Heating Type in Wray
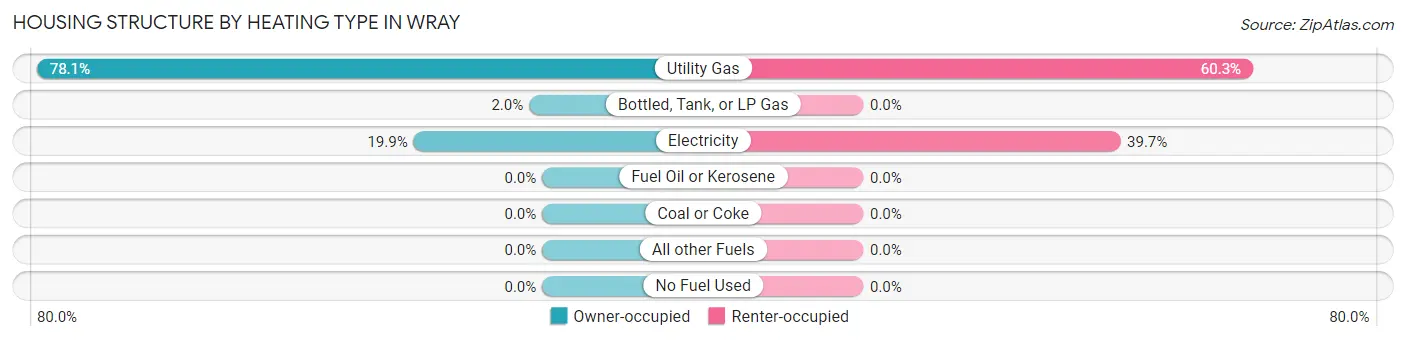
| Heating Type | Owner-occupied | Renter-occupied |
| Utility Gas | 503 (78.1%) | 185 (60.3%) |
| Bottled, Tank, or LP Gas | 13 (2.0%) | 0 (0.0%) |
| Electricity | 128 (19.9%) | 122 (39.7%) |
| Fuel Oil or Kerosene | 0 (0.0%) | 0 (0.0%) |
| Coal or Coke | 0 (0.0%) | 0 (0.0%) |
| All other Fuels | 0 (0.0%) | 0 (0.0%) |
| No Fuel Used | 0 (0.0%) | 0 (0.0%) |
| Total | 644 (100.0%) | 307 (100.0%) |
Household Vehicle Usage in Wray
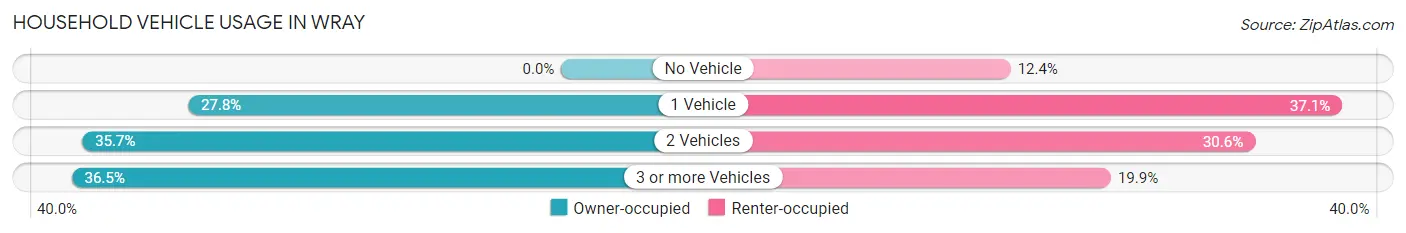
| Vehicles per Household | Owner-occupied | Renter-occupied |
| No Vehicle | 0 (0.0%) | 38 (12.4%) |
| 1 Vehicle | 179 (27.8%) | 114 (37.1%) |
| 2 Vehicles | 230 (35.7%) | 94 (30.6%) |
| 3 or more Vehicles | 235 (36.5%) | 61 (19.9%) |
| Total | 644 (100.0%) | 307 (100.0%) |
Real Estate & Mortgages in Wray
Real Estate and Mortgage Overview in Wray
| Characteristic | Without Mortgage | With Mortgage |
| Housing Units | 204 | 440 |
| Median Property Value | $158,300 | $211,000 |
| Median Household Income | $49,750 | $48 |
| Monthly Housing Costs | $455 | $0 |
| Real Estate Taxes | $785 | $0 |
Property Value by Mortgage Status in Wray
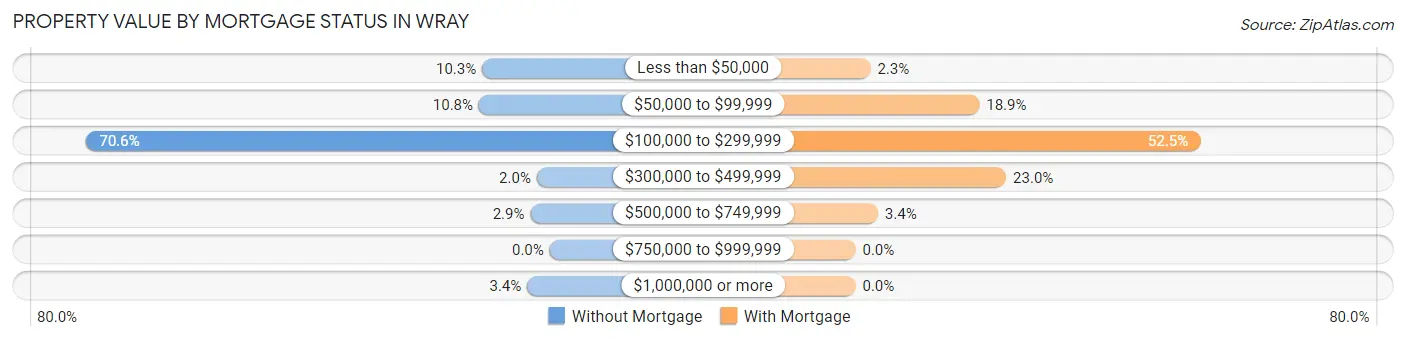
| Property Value | Without Mortgage | With Mortgage |
| Less than $50,000 | 21 (10.3%) | 10 (2.3%) |
| $50,000 to $99,999 | 22 (10.8%) | 83 (18.9%) |
| $100,000 to $299,999 | 144 (70.6%) | 231 (52.5%) |
| $300,000 to $499,999 | 4 (2.0%) | 101 (23.0%) |
| $500,000 to $749,999 | 6 (2.9%) | 15 (3.4%) |
| $750,000 to $999,999 | 0 (0.0%) | 0 (0.0%) |
| $1,000,000 or more | 7 (3.4%) | 0 (0.0%) |
| Total | 204 (100.0%) | 440 (100.0%) |
Household Income by Mortgage Status in Wray
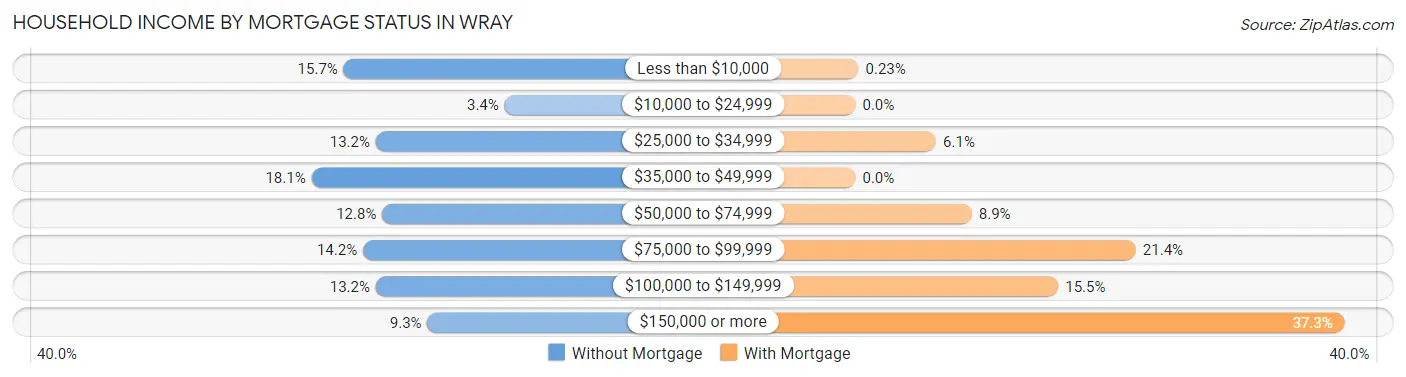
| Household Income | Without Mortgage | With Mortgage |
| Less than $10,000 | 32 (15.7%) | 1 (0.2%) |
| $10,000 to $24,999 | 7 (3.4%) | 0 (0.0%) |
| $25,000 to $34,999 | 27 (13.2%) | 27 (6.1%) |
| $35,000 to $49,999 | 37 (18.1%) | 0 (0.0%) |
| $50,000 to $74,999 | 26 (12.8%) | 39 (8.9%) |
| $75,000 to $99,999 | 29 (14.2%) | 94 (21.4%) |
| $100,000 to $149,999 | 27 (13.2%) | 68 (15.4%) |
| $150,000 or more | 19 (9.3%) | 164 (37.3%) |
| Total | 204 (100.0%) | 440 (100.0%) |
Property Value to Household Income Ratio in Wray
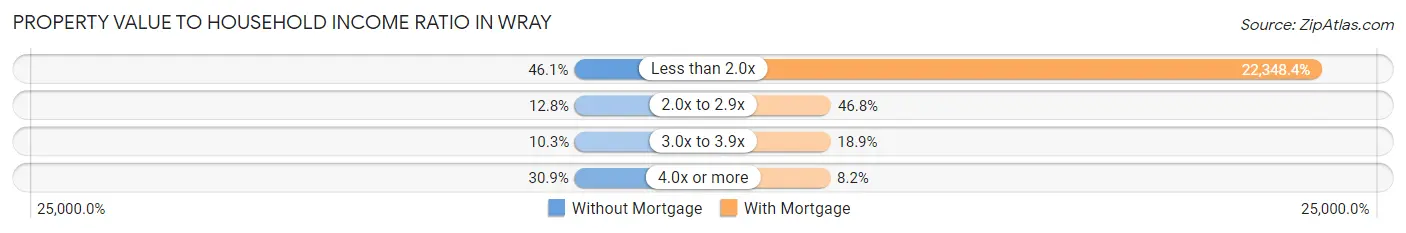
| Value-to-Income Ratio | Without Mortgage | With Mortgage |
| Less than 2.0x | 94 (46.1%) | 98,333 (22,348.4%) |
| 2.0x to 2.9x | 26 (12.8%) | 206 (46.8%) |
| 3.0x to 3.9x | 21 (10.3%) | 83 (18.9%) |
| 4.0x or more | 63 (30.9%) | 36 (8.2%) |
| Total | 204 (100.0%) | 440 (100.0%) |
Real Estate Taxes by Mortgage Status in Wray
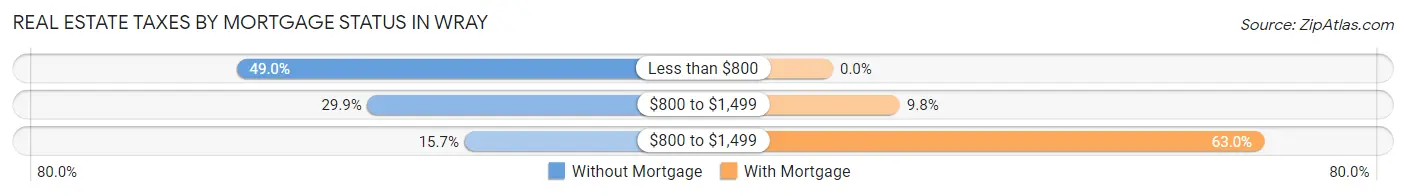
| Property Taxes | Without Mortgage | With Mortgage |
| Less than $800 | 100 (49.0%) | 0 (0.0%) |
| $800 to $1,499 | 61 (29.9%) | 43 (9.8%) |
| $800 to $1,499 | 32 (15.7%) | 277 (62.9%) |
| Total | 204 (100.0%) | 440 (100.0%) |
Health & Disability in Wray
Health Insurance Coverage by Age in Wray
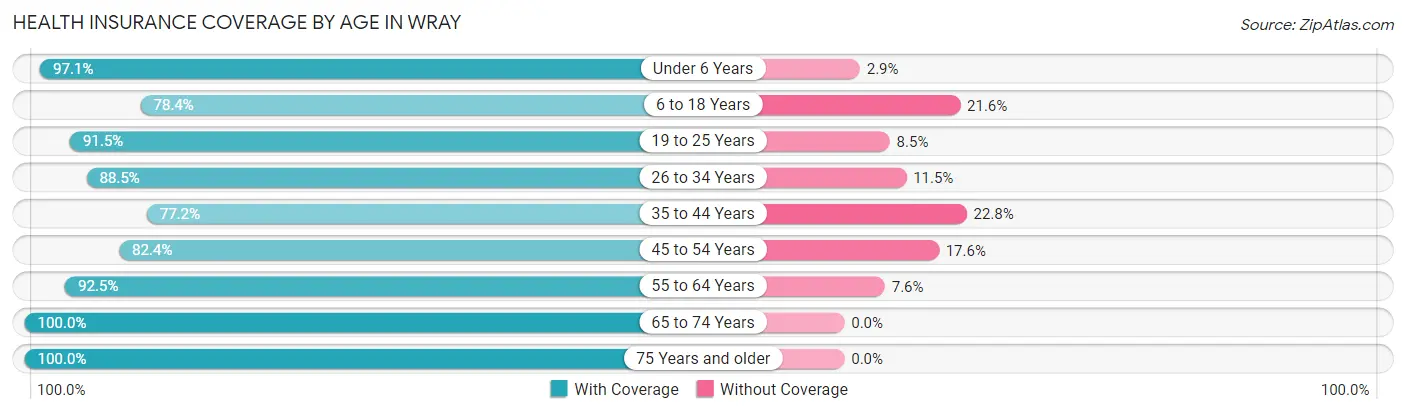
| Age Bracket | With Coverage | Without Coverage |
| Under 6 Years | 168 (97.1%) | 5 (2.9%) |
| 6 to 18 Years | 450 (78.4%) | 124 (21.6%) |
| 19 to 25 Years | 119 (91.5%) | 11 (8.5%) |
| 26 to 34 Years | 184 (88.5%) | 24 (11.5%) |
| 35 to 44 Years | 271 (77.2%) | 80 (22.8%) |
| 45 to 54 Years | 248 (82.4%) | 53 (17.6%) |
| 55 to 64 Years | 257 (92.4%) | 21 (7.5%) |
| 65 to 74 Years | 220 (100.0%) | 0 (0.0%) |
| 75 Years and older | 136 (100.0%) | 0 (0.0%) |
| Total | 2,053 (86.6%) | 318 (13.4%) |
Health Insurance Coverage by Citizenship Status in Wray
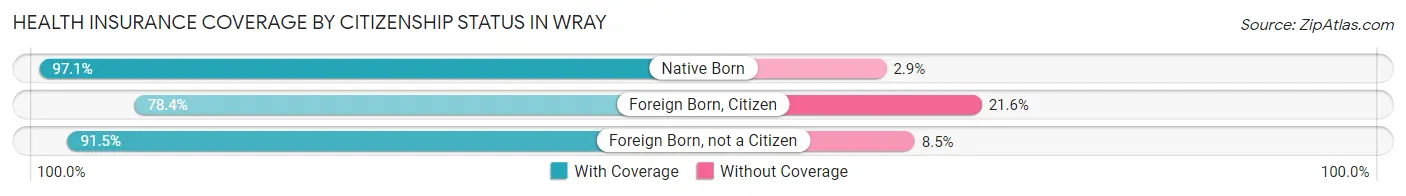
| Citizenship Status | With Coverage | Without Coverage |
| Native Born | 168 (97.1%) | 5 (2.9%) |
| Foreign Born, Citizen | 450 (78.4%) | 124 (21.6%) |
| Foreign Born, not a Citizen | 119 (91.5%) | 11 (8.5%) |
Health Insurance Coverage by Household Income in Wray
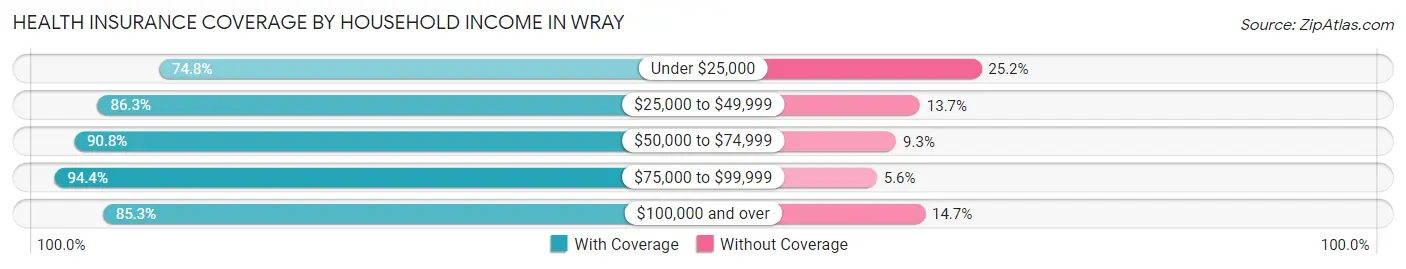
| Household Income | With Coverage | Without Coverage |
| Under $25,000 | 181 (74.8%) | 61 (25.2%) |
| $25,000 to $49,999 | 353 (86.3%) | 56 (13.7%) |
| $50,000 to $74,999 | 373 (90.7%) | 38 (9.2%) |
| $75,000 to $99,999 | 302 (94.4%) | 18 (5.6%) |
| $100,000 and over | 844 (85.3%) | 145 (14.7%) |
Public vs Private Health Insurance Coverage by Age in Wray
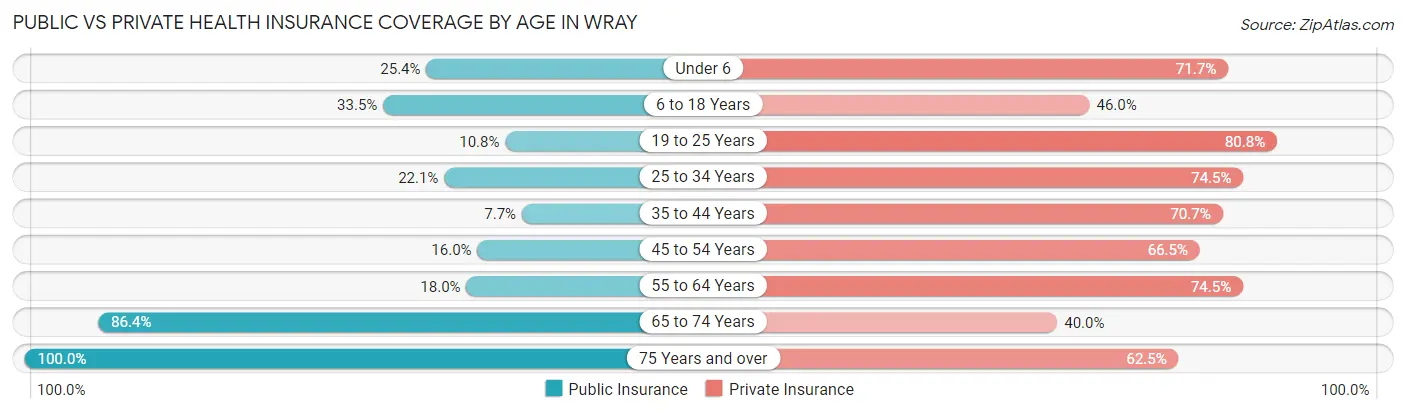
| Age Bracket | Public Insurance | Private Insurance |
| Under 6 | 44 (25.4%) | 124 (71.7%) |
| 6 to 18 Years | 192 (33.5%) | 264 (46.0%) |
| 19 to 25 Years | 14 (10.8%) | 105 (80.8%) |
| 25 to 34 Years | 46 (22.1%) | 155 (74.5%) |
| 35 to 44 Years | 27 (7.7%) | 248 (70.7%) |
| 45 to 54 Years | 48 (16.0%) | 200 (66.4%) |
| 55 to 64 Years | 50 (18.0%) | 207 (74.5%) |
| 65 to 74 Years | 190 (86.4%) | 88 (40.0%) |
| 75 Years and over | 136 (100.0%) | 85 (62.5%) |
| Total | 747 (31.5%) | 1,476 (62.3%) |
Disability Status by Sex by Age in Wray
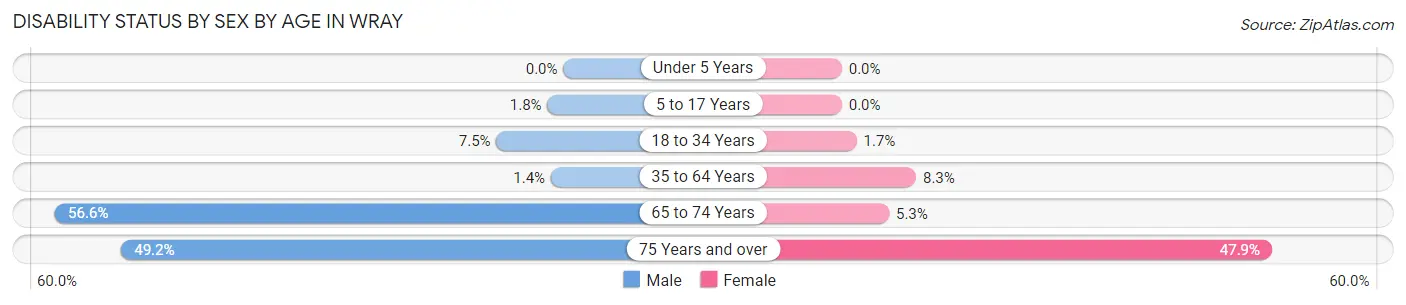
| Age Bracket | Male | Female |
| Under 5 Years | 0 (0.0%) | 0 (0.0%) |
| 5 to 17 Years | 5 (1.8%) | 0 (0.0%) |
| 18 to 34 Years | 14 (7.4%) | 3 (1.7%) |
| 35 to 64 Years | 7 (1.4%) | 35 (8.3%) |
| 65 to 74 Years | 60 (56.6%) | 6 (5.3%) |
| 75 Years and over | 32 (49.2%) | 34 (47.9%) |
Disability Class by Sex by Age in Wray
Disability Class: Hearing Difficulty
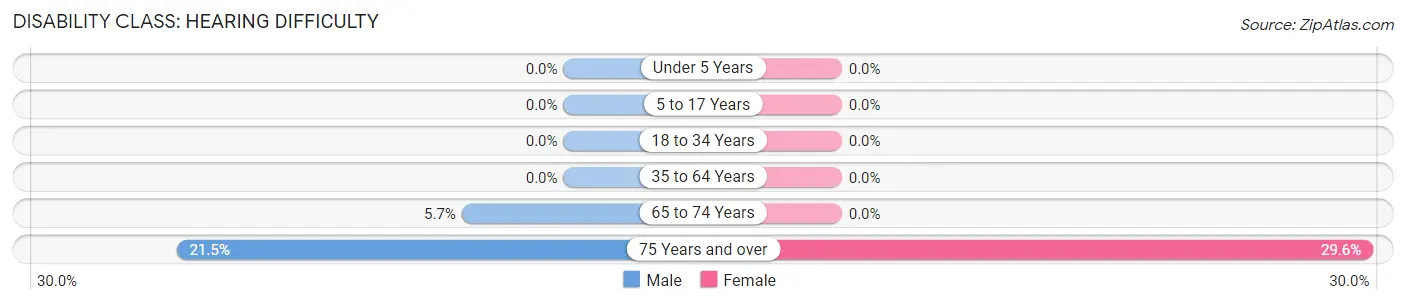
| Age Bracket | Male | Female |
| Under 5 Years | 0 (0.0%) | 0 (0.0%) |
| 5 to 17 Years | 0 (0.0%) | 0 (0.0%) |
| 18 to 34 Years | 0 (0.0%) | 0 (0.0%) |
| 35 to 64 Years | 0 (0.0%) | 0 (0.0%) |
| 65 to 74 Years | 6 (5.7%) | 0 (0.0%) |
| 75 Years and over | 14 (21.5%) | 21 (29.6%) |
Disability Class: Vision Difficulty
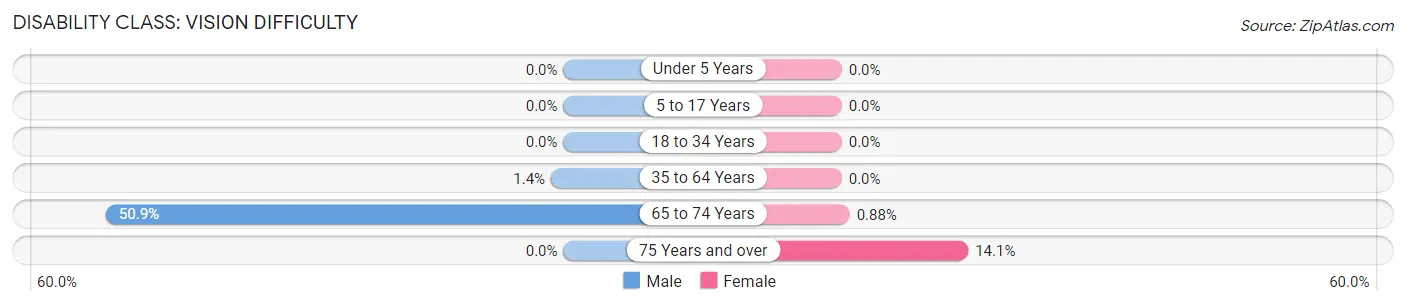
| Age Bracket | Male | Female |
| Under 5 Years | 0 (0.0%) | 0 (0.0%) |
| 5 to 17 Years | 0 (0.0%) | 0 (0.0%) |
| 18 to 34 Years | 0 (0.0%) | 0 (0.0%) |
| 35 to 64 Years | 7 (1.4%) | 0 (0.0%) |
| 65 to 74 Years | 54 (50.9%) | 1 (0.9%) |
| 75 Years and over | 0 (0.0%) | 10 (14.1%) |
Disability Class: Cognitive Difficulty
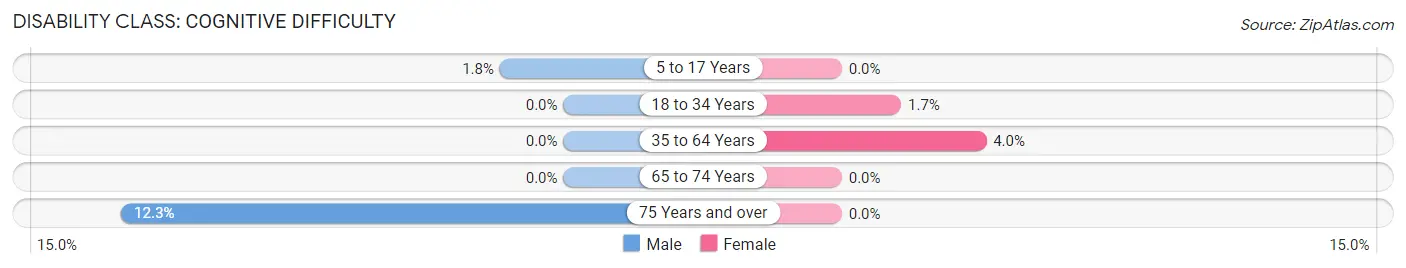
| Age Bracket | Male | Female |
| 5 to 17 Years | 5 (1.8%) | 0 (0.0%) |
| 18 to 34 Years | 0 (0.0%) | 3 (1.7%) |
| 35 to 64 Years | 0 (0.0%) | 17 (4.0%) |
| 65 to 74 Years | 0 (0.0%) | 0 (0.0%) |
| 75 Years and over | 8 (12.3%) | 0 (0.0%) |
Disability Class: Ambulatory Difficulty
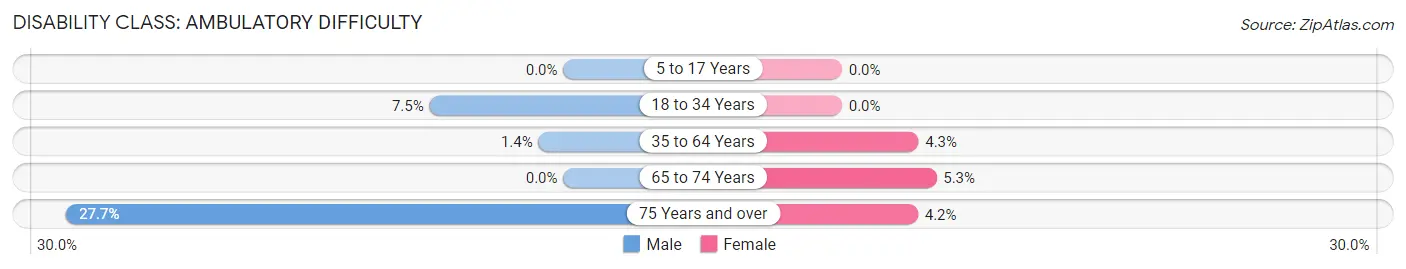
| Age Bracket | Male | Female |
| 5 to 17 Years | 0 (0.0%) | 0 (0.0%) |
| 18 to 34 Years | 14 (7.4%) | 0 (0.0%) |
| 35 to 64 Years | 7 (1.4%) | 18 (4.3%) |
| 65 to 74 Years | 0 (0.0%) | 6 (5.3%) |
| 75 Years and over | 18 (27.7%) | 3 (4.2%) |
Disability Class: Self-Care Difficulty
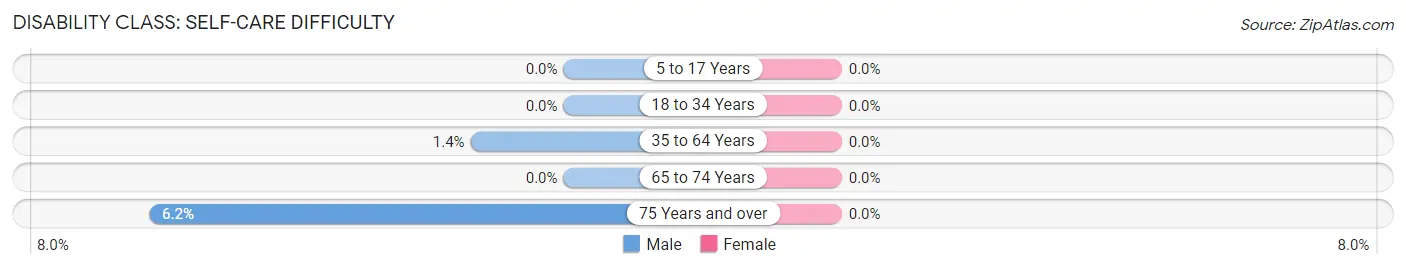
| Age Bracket | Male | Female |
| 5 to 17 Years | 0 (0.0%) | 0 (0.0%) |
| 18 to 34 Years | 0 (0.0%) | 0 (0.0%) |
| 35 to 64 Years | 7 (1.4%) | 0 (0.0%) |
| 65 to 74 Years | 0 (0.0%) | 0 (0.0%) |
| 75 Years and over | 4 (6.1%) | 0 (0.0%) |
Technology Access in Wray
Computing Device Access in Wray
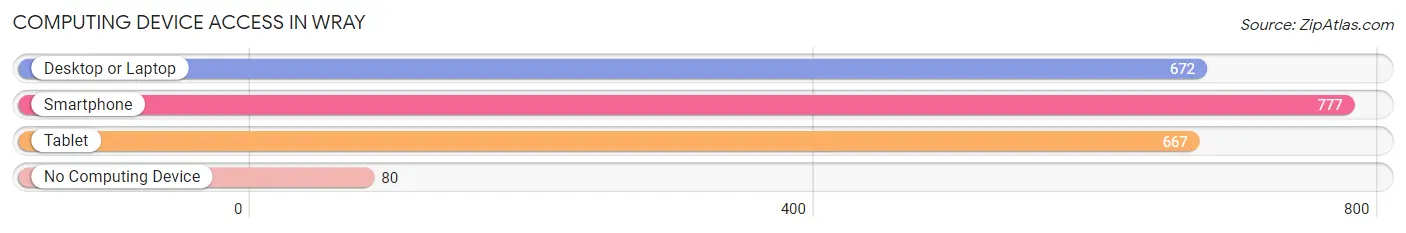
| Device Type | # Households | % Households |
| Desktop or Laptop | 672 | 70.7% |
| Smartphone | 777 | 81.7% |
| Tablet | 667 | 70.1% |
| No Computing Device | 80 | 8.4% |
| Total | 951 | 100.0% |
Internet Access in Wray
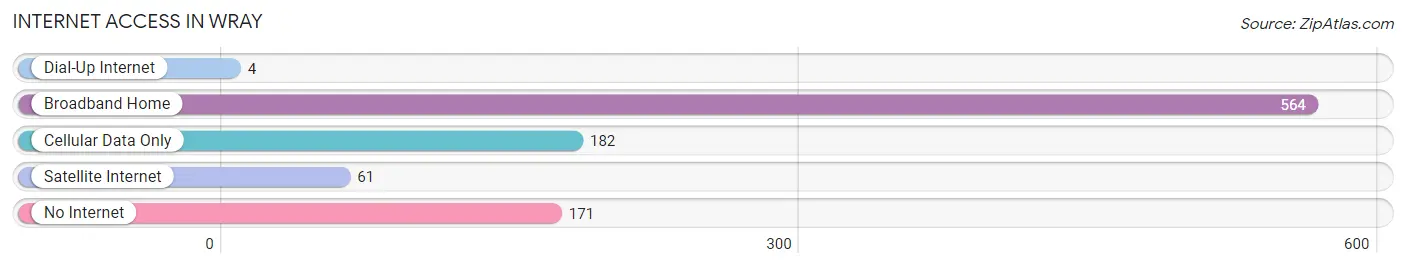
| Internet Type | # Households | % Households |
| Dial-Up Internet | 4 | 0.4% |
| Broadband Home | 564 | 59.3% |
| Cellular Data Only | 182 | 19.1% |
| Satellite Internet | 61 | 6.4% |
| No Internet | 171 | 18.0% |
| Total | 951 | 100.0% |
Wray Summary
Wray, Colorado is a small town located in Yuma County in the northeastern corner of the state. It is situated along the South Platte River, approximately 90 miles east of Denver. The town was founded in 1887 and has a population of approximately 2,000 people.
Geography
Wray is located in the High Plains region of Colorado, at an elevation of 4,092 feet. The town is situated on the South Platte River, which is a major tributary of the Platte River. The town is surrounded by rolling hills and prairies, and is located in an area of high agricultural productivity. The climate is semi-arid, with hot summers and cold winters.
Economy
The economy of Wray is largely based on agriculture. The town is home to several large farms and ranches, and the surrounding area is known for its production of wheat, corn, and other grains. The town is also home to several small businesses, including a grocery store, a hardware store, and a few restaurants.
Demographics
As of the 2010 census, the population of Wray was 2,039. The racial makeup of the town was 95.3% White, 0.3% African American, 0.7% Native American, 0.2% Asian, 0.1% Pacific Islander, 1.7% from other races, and 1.9% from two or more races. Hispanic or Latino of any race were 4.2% of the population.
The median income for a household in Wray was $37,917, and the median income for a family was $45,000. The per capita income for the town was $17,917. About 11.2% of families and 14.2% of the population were below the poverty line, including 17.2% of those under age 18 and 8.3% of those age 65 or over.
Conclusion
Wray, Colorado is a small town located in Yuma County in the northeastern corner of the state. It is situated along the South Platte River, approximately 90 miles east of Denver. The town was founded in 1887 and has a population of approximately 2,000 people. The economy of Wray is largely based on agriculture, and the town is home to several large farms and ranches. The racial makeup of the town is predominantly White, with a small percentage of African American, Native American, Asian, and Pacific Islander residents. The median income for a household in Wray is $37,917, and the per capita income for the town is $17,917.
Common Questions
What is Per Capita Income in Wray?
Per Capita income in Wray is $31,376.
What is the Median Family Income in Wray?
Median Family Income in Wray is $76,406.
What is the Median Household income in Wray?
Median Household Income in Wray is $67,596.
What is Income or Wage Gap in Wray?
Income or Wage Gap in Wray is 18.8%.
Women in Wray earn 81.2 cents for every dollar earned by a man.
What is Inequality or Gini Index in Wray?
Inequality or Gini Index in Wray is 0.41.
What is the Total Population of Wray?
Total Population of Wray is 2,461.
What is the Total Male Population of Wray?
Total Male Population of Wray is 1,305.
What is the Total Female Population of Wray?
Total Female Population of Wray is 1,156.
What is the Ratio of Males per 100 Females in Wray?
There are 112.89 Males per 100 Females in Wray.
What is the Ratio of Females per 100 Males in Wray?
There are 88.58 Females per 100 Males in Wray.
What is the Median Population Age in Wray?
Median Population Age in Wray is 38.1 Years.
What is the Average Family Size in Wray
Average Family Size in Wray is 3.3 People.
What is the Average Household Size in Wray
Average Household Size in Wray is 2.5 People.
How Large is the Labor Force in Wray?
There are 1,230 People in the Labor Forcein in Wray.
What is the Percentage of People in the Labor Force in Wray?
67.2% of People are in the Labor Force in Wray.
What is the Unemployment Rate in Wray?
Unemployment Rate in Wray is 5.7%.