Windsor, CO Map & Demographics
Windsor Map
Windsor Overview
$53,722
PER CAPITA INCOME
$142,143
AVG FAMILY INCOME
$121,754
AVG HOUSEHOLD INCOME
38.7%
WAGE / INCOME GAP [ % ]
61.3¢/ $1
WAGE / INCOME GAP [ $ ]
$8,053
FAMILY INCOME DEFICIT
0.38
INEQUALITY / GINI INDEX
33,905
TOTAL POPULATION
17,390
MALE POPULATION
16,515
FEMALE POPULATION
105.30
MALES / 100 FEMALES
94.97
FEMALES / 100 MALES
41.3
MEDIAN AGE
2.9
AVG FAMILY SIZE
2.6
AVG HOUSEHOLD SIZE
18,210
LABOR FORCE [ PEOPLE ]
68.3%
PERCENT IN LABOR FORCE
4.9%
UNEMPLOYMENT RATE
Windsor Zip Codes
Windsor Area Codes
Income in Windsor
Income Overview in Windsor
Per Capita Income in Windsor is $53,722, while median incomes of families and households are $142,143 and $121,754 respectively.
| Characteristic | Number | Measure |
| Per Capita Income | 33,905 | $53,722 |
| Median Family Income | 10,004 | $142,143 |
| Mean Family Income | 10,004 | $154,584 |
| Median Household Income | 13,112 | $121,754 |
| Mean Household Income | 13,112 | $137,600 |
| Income Deficit | 10,004 | $8,053 |
| Wage / Income Gap (%) | 33,905 | 38.68% |
| Wage / Income Gap ($) | 33,905 | 61.32¢ per $1 |
| Gini / Inequality Index | 33,905 | 0.38 |
Earnings by Sex in Windsor
Average Earnings in Windsor are $57,318, $72,064 for men and $44,191 for women, a difference of 38.7%.
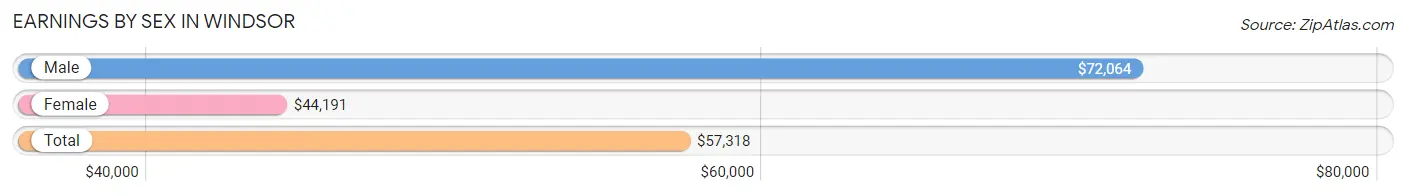
| Sex | Number | Average Earnings |
| Male | 10,365 (55.4%) | $72,064 |
| Female | 8,347 (44.6%) | $44,191 |
| Total | 18,712 (100.0%) | $57,318 |
Earnings by Sex by Income Bracket in Windsor
The most common earnings brackets in Windsor are $100,000+ for men (3,680 | 35.5%) and $75,000 to $99,999 for women (1,034 | 12.4%).
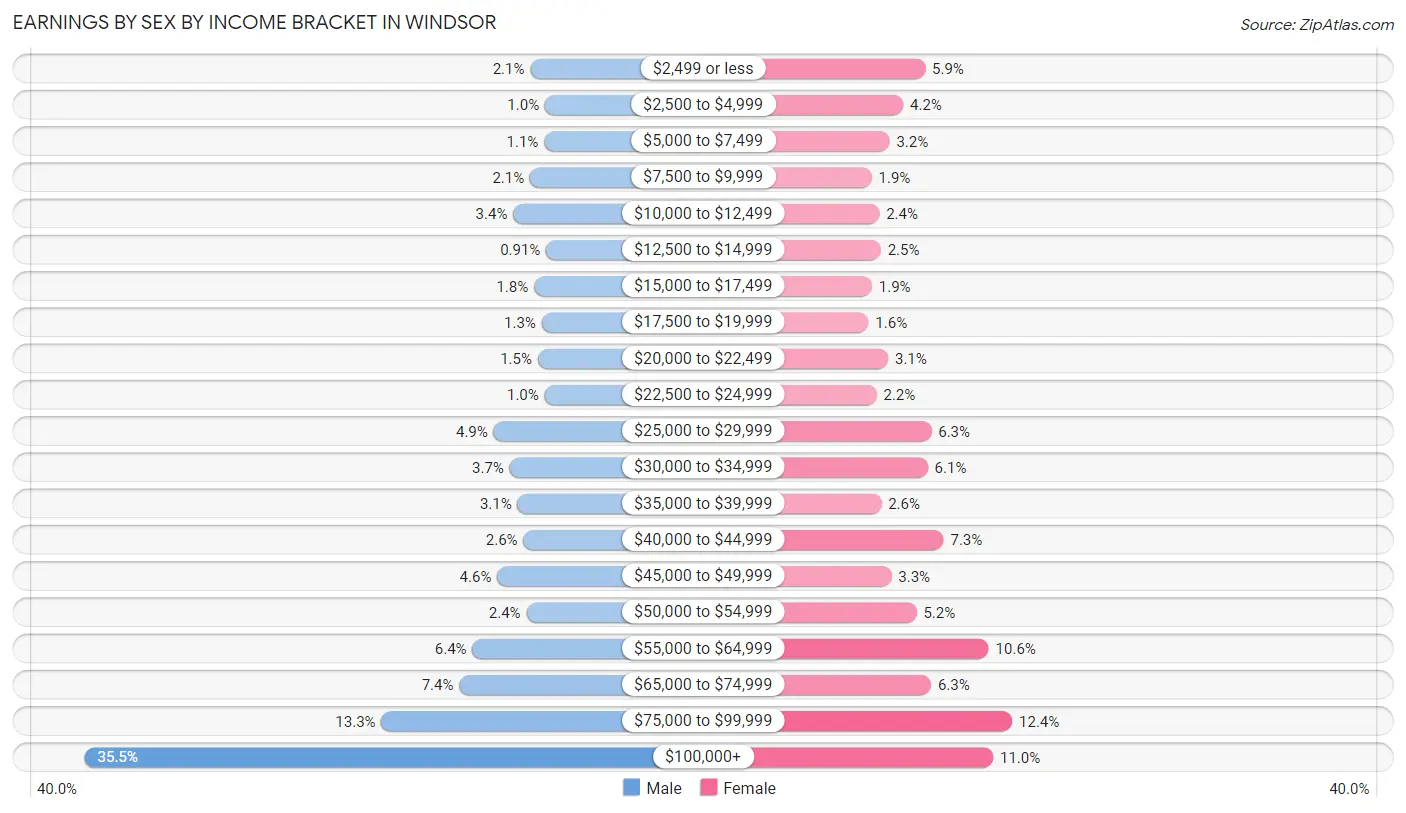
| Income | Male | Female |
| $2,499 or less | 218 (2.1%) | 490 (5.9%) |
| $2,500 to $4,999 | 104 (1.0%) | 352 (4.2%) |
| $5,000 to $7,499 | 110 (1.1%) | 267 (3.2%) |
| $7,500 to $9,999 | 220 (2.1%) | 155 (1.9%) |
| $10,000 to $12,499 | 350 (3.4%) | 203 (2.4%) |
| $12,500 to $14,999 | 94 (0.9%) | 212 (2.5%) |
| $15,000 to $17,499 | 189 (1.8%) | 157 (1.9%) |
| $17,500 to $19,999 | 130 (1.3%) | 135 (1.6%) |
| $20,000 to $22,499 | 160 (1.5%) | 258 (3.1%) |
| $22,500 to $24,999 | 107 (1.0%) | 186 (2.2%) |
| $25,000 to $29,999 | 503 (4.9%) | 528 (6.3%) |
| $30,000 to $34,999 | 378 (3.6%) | 506 (6.1%) |
| $35,000 to $39,999 | 317 (3.1%) | 215 (2.6%) |
| $40,000 to $44,999 | 272 (2.6%) | 605 (7.2%) |
| $45,000 to $49,999 | 475 (4.6%) | 279 (3.3%) |
| $50,000 to $54,999 | 248 (2.4%) | 436 (5.2%) |
| $55,000 to $64,999 | 667 (6.4%) | 887 (10.6%) |
| $65,000 to $74,999 | 769 (7.4%) | 527 (6.3%) |
| $75,000 to $99,999 | 1,374 (13.3%) | 1,034 (12.4%) |
| $100,000+ | 3,680 (35.5%) | 915 (11.0%) |
| Total | 10,365 (100.0%) | 8,347 (100.0%) |
Earnings by Sex by Educational Attainment in Windsor
Average earnings in Windsor are $81,738 for men and $49,258 for women, a difference of 39.7%. Men with an educational attainment of graduate degree enjoy the highest average annual earnings of $131,518, while those with college or associate's degree education earn the least with $58,722. Women with an educational attainment of graduate degree earn the most with the average annual earnings of $63,625, while those with high school diploma education have the smallest earnings of $36,452.
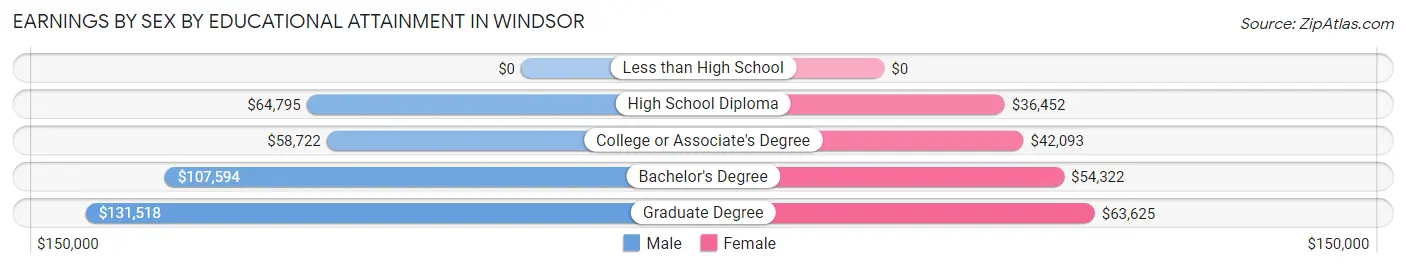
| Educational Attainment | Male Income | Female Income |
| Less than High School | - | - |
| High School Diploma | $64,795 | $36,452 |
| College or Associate's Degree | $58,722 | $42,093 |
| Bachelor's Degree | $107,594 | $54,322 |
| Graduate Degree | $131,518 | $63,625 |
| Total | $81,738 | $49,258 |
Family Income in Windsor
Family Income Brackets in Windsor
According to the Windsor family income data, there are 2,711 families falling into the $100,000 to $149,999 income range, which is the most common income bracket and makes up 27.1% of all families. Conversely, the less than $10,000 income bracket is the least frequent group with only 40 families (0.4%) belonging to this category.
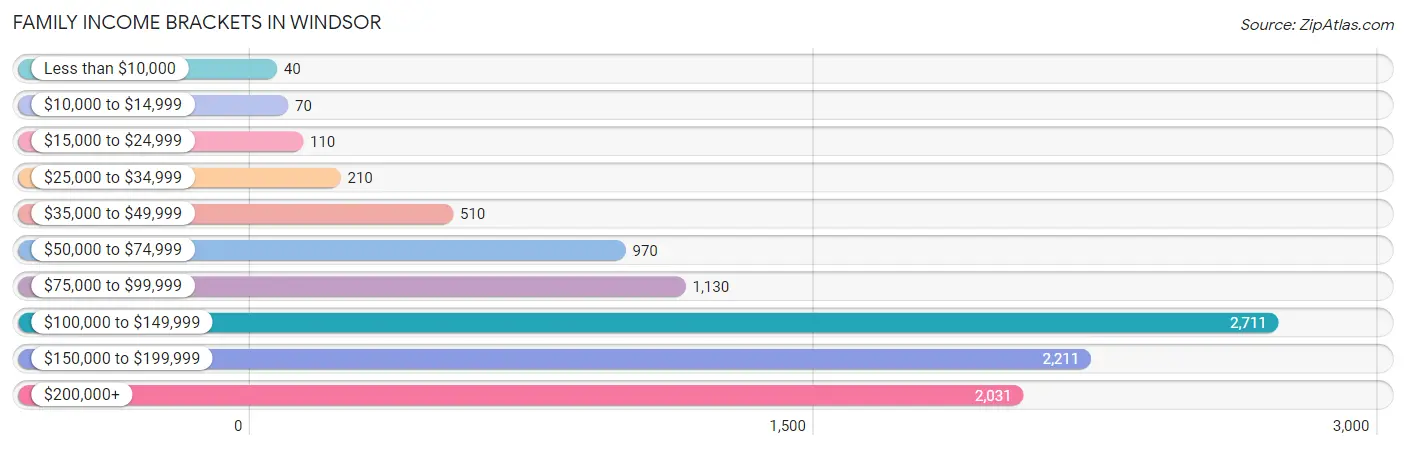
| Income Bracket | # Families | % Families |
| Less than $10,000 | 40 | 0.4% |
| $10,000 to $14,999 | 70 | 0.7% |
| $15,000 to $24,999 | 110 | 1.1% |
| $25,000 to $34,999 | 210 | 2.1% |
| $35,000 to $49,999 | 510 | 5.1% |
| $50,000 to $74,999 | 970 | 9.7% |
| $75,000 to $99,999 | 1,130 | 11.3% |
| $100,000 to $149,999 | 2,711 | 27.1% |
| $150,000 to $199,999 | 2,211 | 22.1% |
| $200,000+ | 2,031 | 20.3% |
Family Income by Famaliy Size in Windsor
7+ person families (24 | 0.2%) account for the highest median family income in Windsor with $250,001 per family, while 2-person families (4,994 | 49.9%) have the highest median income of $60,651 per family member.
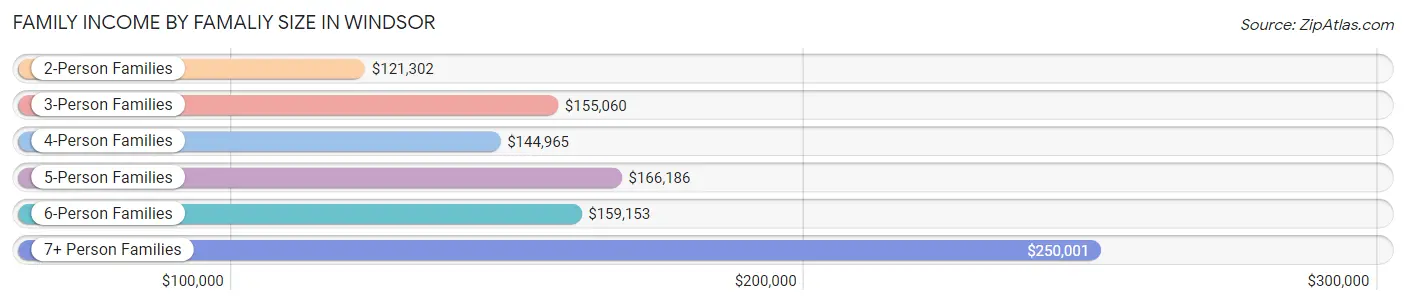
| Income Bracket | # Families | Median Income |
| 2-Person Families | 4,994 (49.9%) | $121,302 |
| 3-Person Families | 2,147 (21.5%) | $155,060 |
| 4-Person Families | 1,604 (16.0%) | $144,965 |
| 5-Person Families | 998 (10.0%) | $166,186 |
| 6-Person Families | 237 (2.4%) | $159,153 |
| 7+ Person Families | 24 (0.2%) | $250,001 |
| Total | 10,004 (100.0%) | $142,143 |
Family Income by Number of Earners in Windsor
The median family income in Windsor is $142,143, with families comprising 3+ earners (1,002) having the highest median family income of $192,647, while families with 1 earner (2,896) have the lowest median family income of $111,308, accounting for 10.0% and 28.9% of families, respectively.
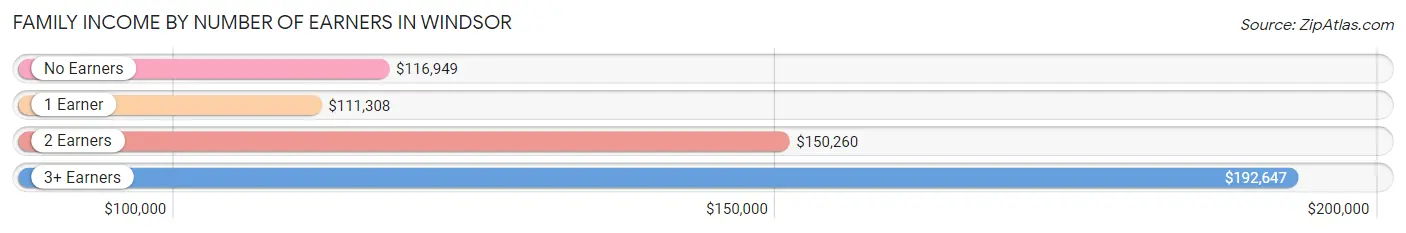
| Number of Earners | # Families | Median Income |
| No Earners | 1,237 (12.4%) | $116,949 |
| 1 Earner | 2,896 (28.9%) | $111,308 |
| 2 Earners | 4,869 (48.7%) | $150,260 |
| 3+ Earners | 1,002 (10.0%) | $192,647 |
| Total | 10,004 (100.0%) | $142,143 |
Household Income in Windsor
Household Income Brackets in Windsor
With 3,226 households falling in the category, the $100,000 to $149,999 income range is the most frequent in Windsor, accounting for 24.6% of all households. In contrast, only 223 households (1.7%) fall into the less than $10,000 income bracket, making it the least populous group.
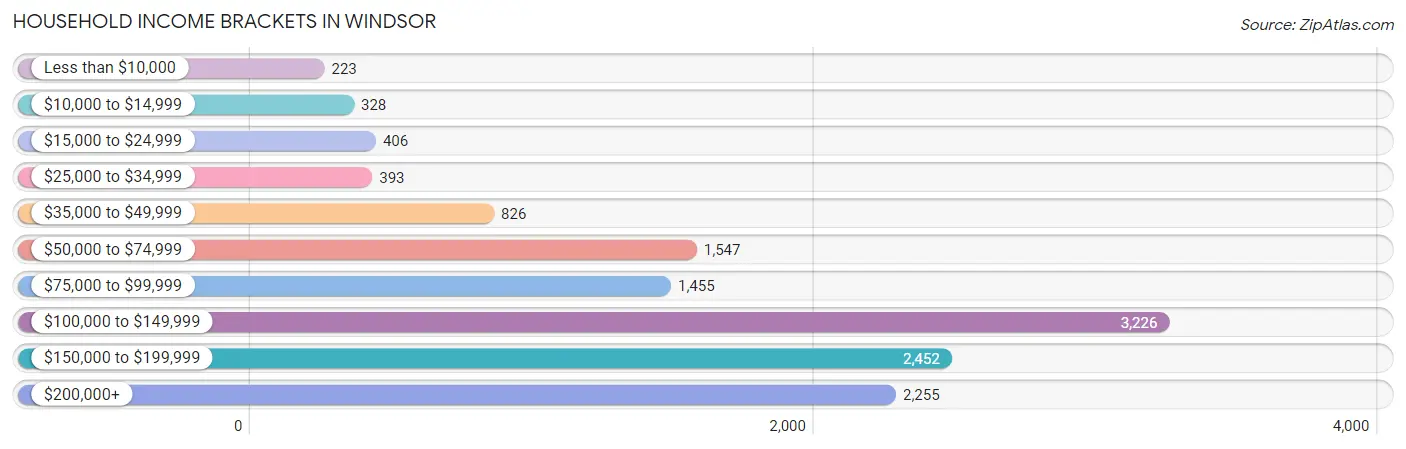
| Income Bracket | # Households | % Households |
| Less than $10,000 | 223 | 1.7% |
| $10,000 to $14,999 | 328 | 2.5% |
| $15,000 to $24,999 | 406 | 3.1% |
| $25,000 to $34,999 | 393 | 3.0% |
| $35,000 to $49,999 | 826 | 6.3% |
| $50,000 to $74,999 | 1,547 | 11.8% |
| $75,000 to $99,999 | 1,455 | 11.1% |
| $100,000 to $149,999 | 3,226 | 24.6% |
| $150,000 to $199,999 | 2,452 | 18.7% |
| $200,000+ | 2,255 | 17.2% |
Household Income by Householder Age in Windsor
The median household income in Windsor is $121,754, with the highest median household income of $140,587 found in the 45 to 64 years age bracket for the primary householder. A total of 5,535 households (42.2%) fall into this category. Meanwhile, the 15 to 24 years age bracket for the primary householder has the lowest median household income of $67,143, with 174 households (1.3%) in this group.
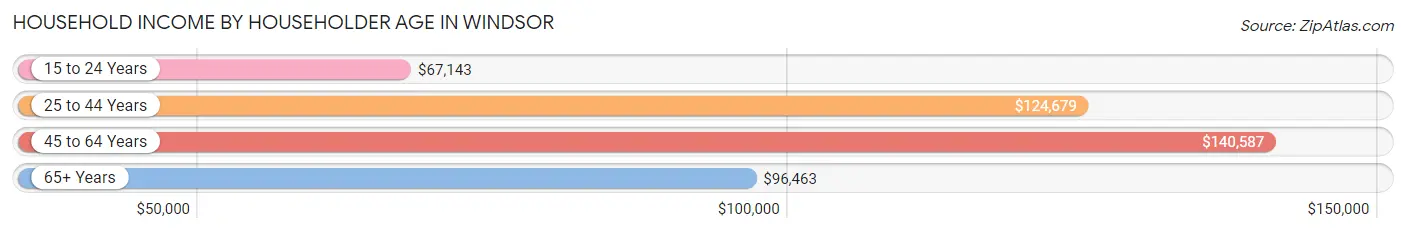
| Income Bracket | # Households | Median Income |
| 15 to 24 Years | 174 (1.3%) | $67,143 |
| 25 to 44 Years | 4,031 (30.7%) | $124,679 |
| 45 to 64 Years | 5,535 (42.2%) | $140,587 |
| 65+ Years | 3,372 (25.7%) | $96,463 |
| Total | 13,112 (100.0%) | $121,754 |
Poverty in Windsor
Income Below Poverty by Sex and Age in Windsor
With 3.2% poverty level for males and 4.4% for females among the residents of Windsor, 15 year old males and 18 to 24 year old females are the most vulnerable to poverty, with 52 males (13.2%) and 113 females (15.3%) in their respective age groups living below the poverty level.
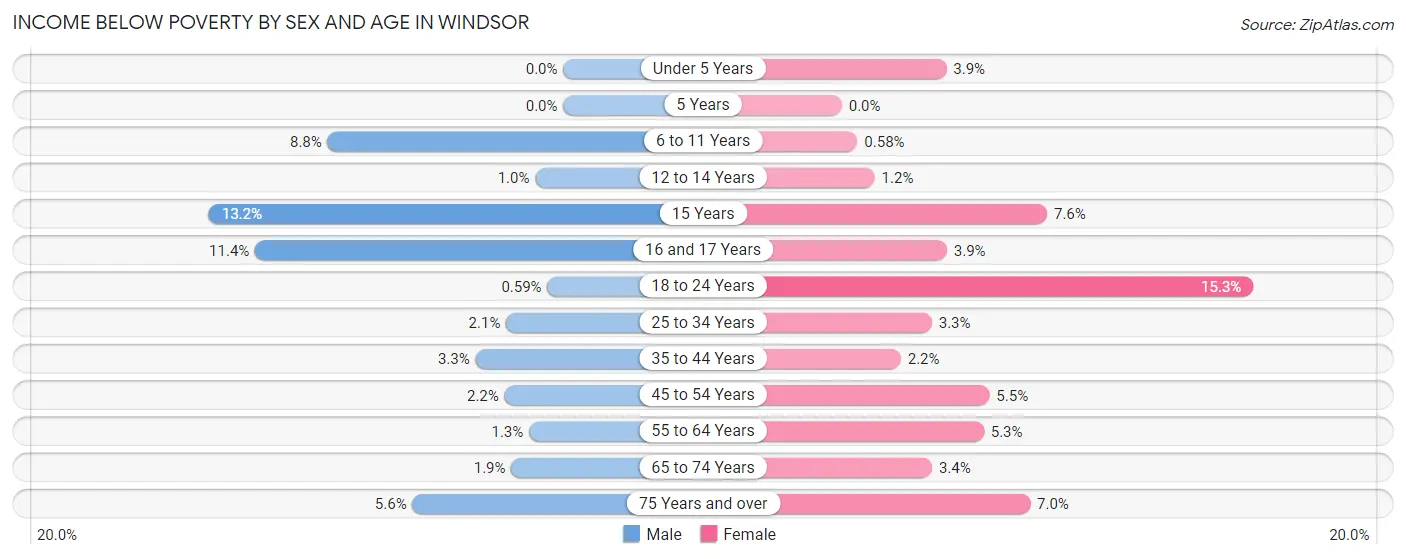
| Age Bracket | Male | Female |
| Under 5 Years | 0 (0.0%) | 25 (3.9%) |
| 5 Years | 0 (0.0%) | 0 (0.0%) |
| 6 to 11 Years | 128 (8.7%) | 8 (0.6%) |
| 12 to 14 Years | 10 (1.0%) | 11 (1.2%) |
| 15 Years | 52 (13.2%) | 17 (7.6%) |
| 16 and 17 Years | 66 (11.4%) | 15 (3.9%) |
| 18 to 24 Years | 6 (0.6%) | 113 (15.3%) |
| 25 to 34 Years | 48 (2.1%) | 64 (3.3%) |
| 35 to 44 Years | 76 (3.3%) | 48 (2.2%) |
| 45 to 54 Years | 53 (2.2%) | 149 (5.5%) |
| 55 to 64 Years | 27 (1.3%) | 113 (5.3%) |
| 65 to 74 Years | 31 (1.9%) | 49 (3.4%) |
| 75 Years and over | 61 (5.6%) | 107 (7.0%) |
| Total | 558 (3.2%) | 719 (4.4%) |
Income Above Poverty by Sex and Age in Windsor
According to the poverty statistics in Windsor, males aged under 5 years and females aged 5 years are the age groups that are most secure financially, with 100.0% of males and 100.0% of females in these age groups living above the poverty line.
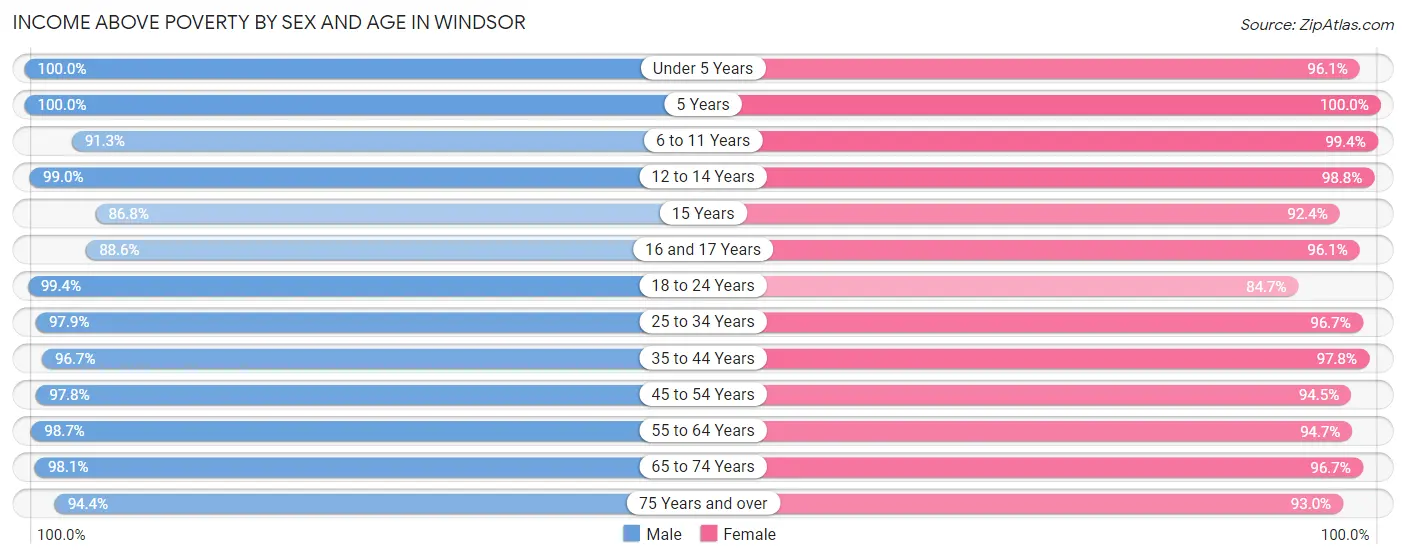
| Age Bracket | Male | Female |
| Under 5 Years | 768 (100.0%) | 619 (96.1%) |
| 5 Years | 271 (100.0%) | 201 (100.0%) |
| 6 to 11 Years | 1,335 (91.2%) | 1,373 (99.4%) |
| 12 to 14 Years | 953 (99.0%) | 890 (98.8%) |
| 15 Years | 343 (86.8%) | 206 (92.4%) |
| 16 and 17 Years | 511 (88.6%) | 370 (96.1%) |
| 18 to 24 Years | 1,018 (99.4%) | 627 (84.7%) |
| 25 to 34 Years | 2,218 (97.9%) | 1,850 (96.7%) |
| 35 to 44 Years | 2,256 (96.7%) | 2,146 (97.8%) |
| 45 to 54 Years | 2,380 (97.8%) | 2,571 (94.5%) |
| 55 to 64 Years | 2,091 (98.7%) | 2,033 (94.7%) |
| 65 to 74 Years | 1,575 (98.1%) | 1,414 (96.7%) |
| 75 Years and over | 1,028 (94.4%) | 1,424 (93.0%) |
| Total | 16,747 (96.8%) | 15,724 (95.6%) |
Income Below Poverty Among Married-Couple Families in Windsor
The poverty statistics for married-couple families in Windsor show that 0.8% or 65 of the total 8,192 families live below the poverty line. Families with 3 or 4 children have the highest poverty rate of 1.2%, comprising of 10 families. On the other hand, families with 5 or more children have the lowest poverty rate of 0.0%, which includes 0 families.
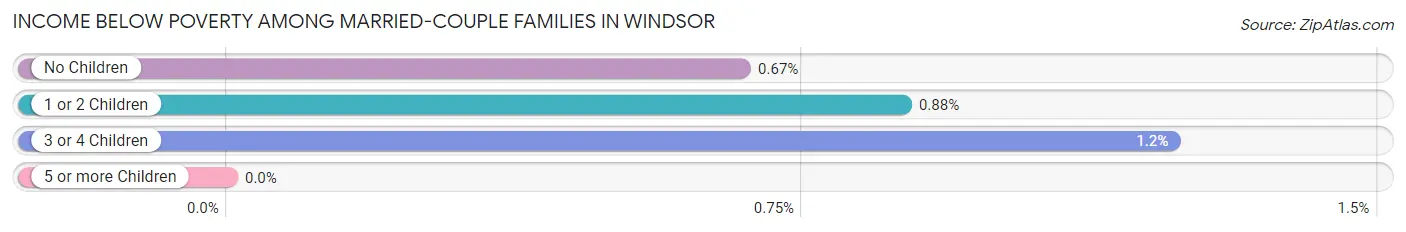
| Children | Above Poverty | Below Poverty |
| No Children | 4,610 (99.3%) | 31 (0.7%) |
| 1 or 2 Children | 2,705 (99.1%) | 24 (0.9%) |
| 3 or 4 Children | 804 (98.8%) | 10 (1.2%) |
| 5 or more Children | 8 (100.0%) | 0 (0.0%) |
| Total | 8,127 (99.2%) | 65 (0.8%) |
Income Below Poverty Among Single-Parent Households in Windsor
According to the poverty data in Windsor, 3.9% or 23 single-father households and 9.5% or 116 single-mother households are living below the poverty line. Among single-father households, those with no children have the highest poverty rate, with 23 households (7.2%) experiencing poverty. Likewise, among single-mother households, those with 3 or 4 children have the highest poverty rate, with 51 households (43.6%) falling below the poverty line.
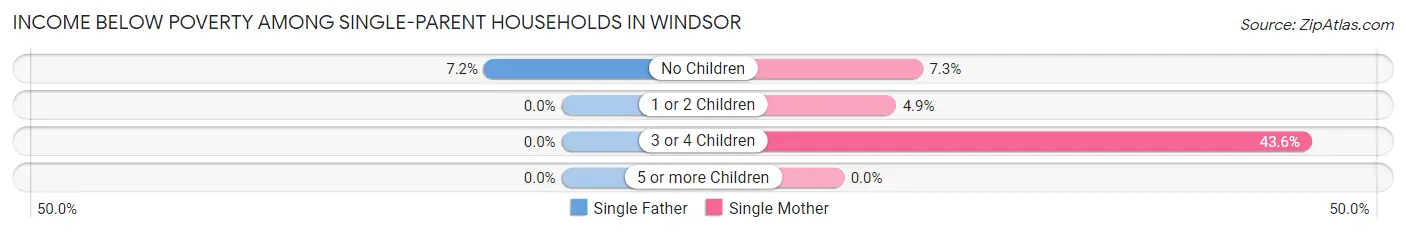
| Children | Single Father | Single Mother |
| No Children | 23 (7.2%) | 34 (7.3%) |
| 1 or 2 Children | 0 (0.0%) | 31 (4.9%) |
| 3 or 4 Children | 0 (0.0%) | 51 (43.6%) |
| 5 or more Children | 0 (0.0%) | 0 (0.0%) |
| Total | 23 (3.9%) | 116 (9.5%) |
Income Below Poverty Among Married-Couple vs Single-Parent Households in Windsor
The poverty data for Windsor shows that 65 of the married-couple family households (0.8%) and 139 of the single-parent households (7.7%) are living below the poverty level. Within the married-couple family households, those with 3 or 4 children have the highest poverty rate, with 10 households (1.2%) falling below the poverty line. Among the single-parent households, those with 3 or 4 children have the highest poverty rate, with 51 household (39.8%) living below poverty.
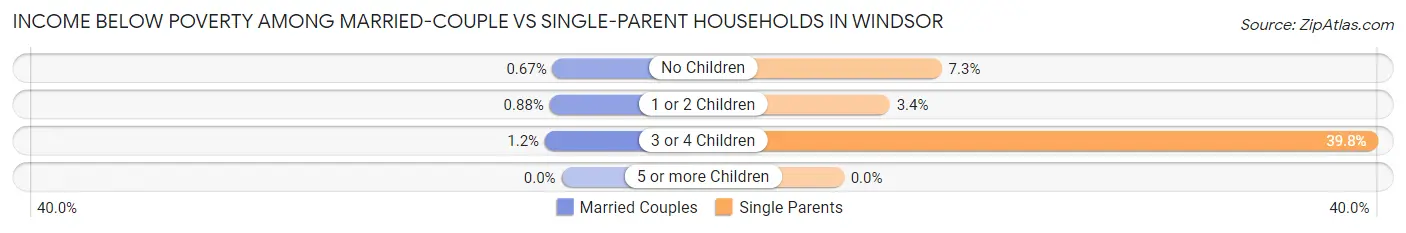
| Children | Married-Couple Families | Single-Parent Households |
| No Children | 31 (0.7%) | 57 (7.3%) |
| 1 or 2 Children | 24 (0.9%) | 31 (3.4%) |
| 3 or 4 Children | 10 (1.2%) | 51 (39.8%) |
| 5 or more Children | 0 (0.0%) | 0 (0.0%) |
| Total | 65 (0.8%) | 139 (7.7%) |
Race in Windsor
The most populous races in Windsor are White / Caucasian (30,454 | 89.8%), Hispanic or Latino (2,616 | 7.7%), and Two or more Races (1,854 | 5.5%).
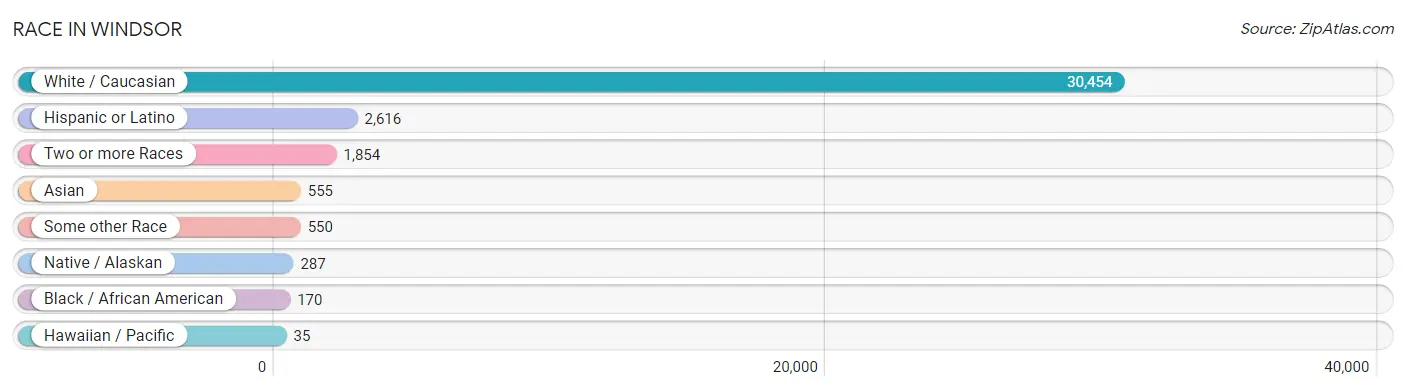
| Race | # Population | % Population |
| Asian | 555 | 1.6% |
| Black / African American | 170 | 0.5% |
| Hawaiian / Pacific | 35 | 0.1% |
| Hispanic or Latino | 2,616 | 7.7% |
| Native / Alaskan | 287 | 0.9% |
| White / Caucasian | 30,454 | 89.8% |
| Two or more Races | 1,854 | 5.5% |
| Some other Race | 550 | 1.6% |
| Total | 33,905 | 100.0% |
Ancestry in Windsor
The most populous ancestries reported in Windsor are German (9,736 | 28.7%), English (5,821 | 17.2%), Irish (3,814 | 11.3%), Mexican (1,730 | 5.1%), and Italian (1,725 | 5.1%), together accounting for 67.3% of all Windsor residents.
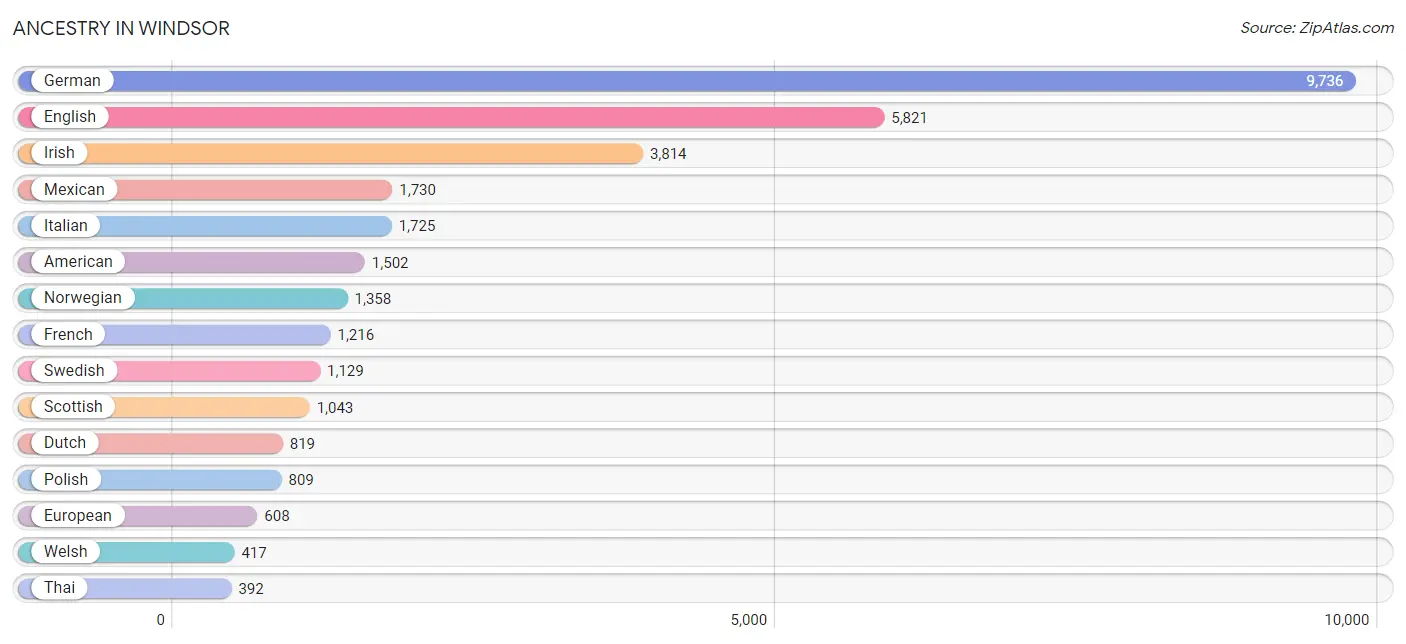
| Ancestry | # Population | % Population |
| American | 1,502 | 4.4% |
| Apache | 9 | 0.0% |
| Arab | 117 | 0.4% |
| Argentinean | 12 | 0.0% |
| Australian | 8 | 0.0% |
| Austrian | 167 | 0.5% |
| Bangladeshi | 17 | 0.1% |
| Belgian | 14 | 0.0% |
| Bhutanese | 47 | 0.1% |
| Brazilian | 10 | 0.0% |
| British | 196 | 0.6% |
| Burmese | 56 | 0.2% |
| Cajun | 39 | 0.1% |
| Canadian | 140 | 0.4% |
| Central American | 37 | 0.1% |
| Cherokee | 52 | 0.2% |
| Cheyenne | 22 | 0.1% |
| Chickasaw | 10 | 0.0% |
| Chinese | 13 | 0.0% |
| Chippewa | 4 | 0.0% |
| Choctaw | 22 | 0.1% |
| Comanche | 3 | 0.0% |
| Creek | 16 | 0.1% |
| Croatian | 33 | 0.1% |
| Czech | 192 | 0.6% |
| Czechoslovakian | 32 | 0.1% |
| Danish | 310 | 0.9% |
| Dutch | 819 | 2.4% |
| Eastern European | 91 | 0.3% |
| Ecuadorian | 10 | 0.0% |
| Egyptian | 98 | 0.3% |
| English | 5,821 | 17.2% |
| European | 608 | 1.8% |
| Filipino | 52 | 0.2% |
| Finnish | 104 | 0.3% |
| French | 1,216 | 3.6% |
| French Canadian | 103 | 0.3% |
| German | 9,736 | 28.7% |
| German Russian | 9 | 0.0% |
| Greek | 113 | 0.3% |
| Guamanian / Chamorro | 21 | 0.1% |
| Hungarian | 384 | 1.1% |
| Indian (Asian) | 93 | 0.3% |
| Iranian | 29 | 0.1% |
| Irish | 3,814 | 11.3% |
| Italian | 1,725 | 5.1% |
| Jamaican | 7 | 0.0% |
| Korean | 114 | 0.3% |
| Lebanese | 19 | 0.1% |
| Lithuanian | 65 | 0.2% |
| Luxembourger | 7 | 0.0% |
| Mexican | 1,730 | 5.1% |
| Mexican American Indian | 52 | 0.2% |
| Native Hawaiian | 51 | 0.2% |
| Navajo | 292 | 0.9% |
| Nicaraguan | 37 | 0.1% |
| Nigerian | 5 | 0.0% |
| Northern European | 215 | 0.6% |
| Norwegian | 1,358 | 4.0% |
| Pakistani | 33 | 0.1% |
| Polish | 809 | 2.4% |
| Portuguese | 35 | 0.1% |
| Pueblo | 8 | 0.0% |
| Puerto Rican | 64 | 0.2% |
| Romanian | 57 | 0.2% |
| Russian | 316 | 0.9% |
| Scandinavian | 213 | 0.6% |
| Scotch-Irish | 302 | 0.9% |
| Scottish | 1,043 | 3.1% |
| Sioux | 32 | 0.1% |
| Slavic | 83 | 0.2% |
| Slovak | 50 | 0.2% |
| Slovene | 10 | 0.0% |
| South American | 22 | 0.1% |
| Spaniard | 267 | 0.8% |
| Spanish | 326 | 1.0% |
| Sri Lankan | 38 | 0.1% |
| Subsaharan African | 5 | 0.0% |
| Swedish | 1,129 | 3.3% |
| Swiss | 137 | 0.4% |
| Thai | 392 | 1.2% |
| Ukrainian | 63 | 0.2% |
| Ute | 12 | 0.0% |
| Welsh | 417 | 1.2% |
| Yugoslavian | 9 | 0.0% | View All 85 Rows |
Immigrants in Windsor
The most numerous immigrant groups reported in Windsor came from Asia (349 | 1.0%), Europe (225 | 0.7%), South Central Asia (167 | 0.5%), India (137 | 0.4%), and Latin America (130 | 0.4%), together accounting for 3.0% of all Windsor residents.
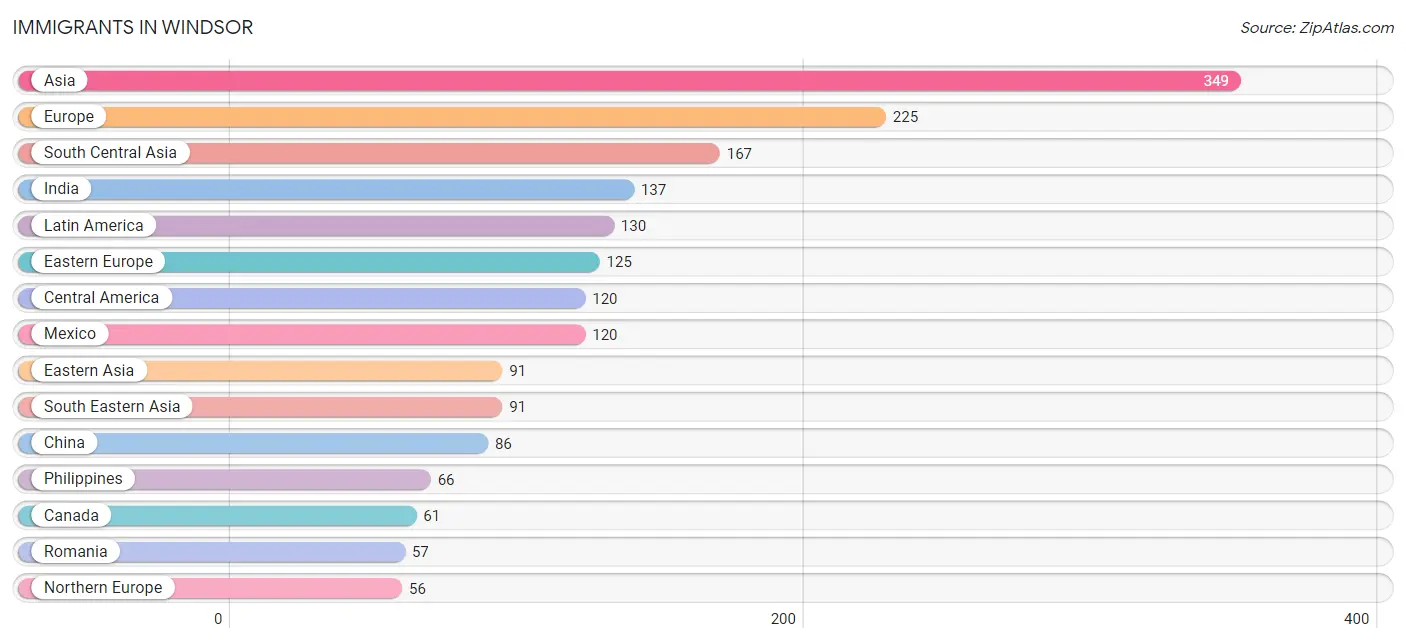
| Immigration Origin | # Population | % Population |
| Africa | 30 | 0.1% |
| Asia | 349 | 1.0% |
| Australia | 4 | 0.0% |
| Canada | 61 | 0.2% |
| Central America | 120 | 0.4% |
| China | 86 | 0.3% |
| Eastern Asia | 91 | 0.3% |
| Eastern Europe | 125 | 0.4% |
| Ecuador | 10 | 0.0% |
| Egypt | 25 | 0.1% |
| England | 27 | 0.1% |
| Europe | 225 | 0.7% |
| Germany | 18 | 0.1% |
| Hong Kong | 9 | 0.0% |
| Hungary | 26 | 0.1% |
| India | 137 | 0.4% |
| Iran | 25 | 0.1% |
| Korea | 5 | 0.0% |
| Laos | 17 | 0.1% |
| Latin America | 130 | 0.4% |
| Mexico | 120 | 0.4% |
| Netherlands | 26 | 0.1% |
| Northern Africa | 25 | 0.1% |
| Northern Europe | 56 | 0.2% |
| Oceania | 4 | 0.0% |
| Pakistan | 5 | 0.0% |
| Philippines | 66 | 0.2% |
| Poland | 11 | 0.0% |
| Romania | 57 | 0.2% |
| Russia | 8 | 0.0% |
| South Africa | 5 | 0.0% |
| South America | 10 | 0.0% |
| South Central Asia | 167 | 0.5% |
| South Eastern Asia | 91 | 0.3% |
| Taiwan | 52 | 0.2% |
| Ukraine | 23 | 0.1% |
| Vietnam | 8 | 0.0% |
| Western Europe | 44 | 0.1% | View All 38 Rows |
Sex and Age in Windsor
Sex and Age in Windsor
The most populous age groups in Windsor are 10 to 14 Years (1,641 | 9.4%) for men and 50 to 54 Years (1,629 | 9.9%) for women.
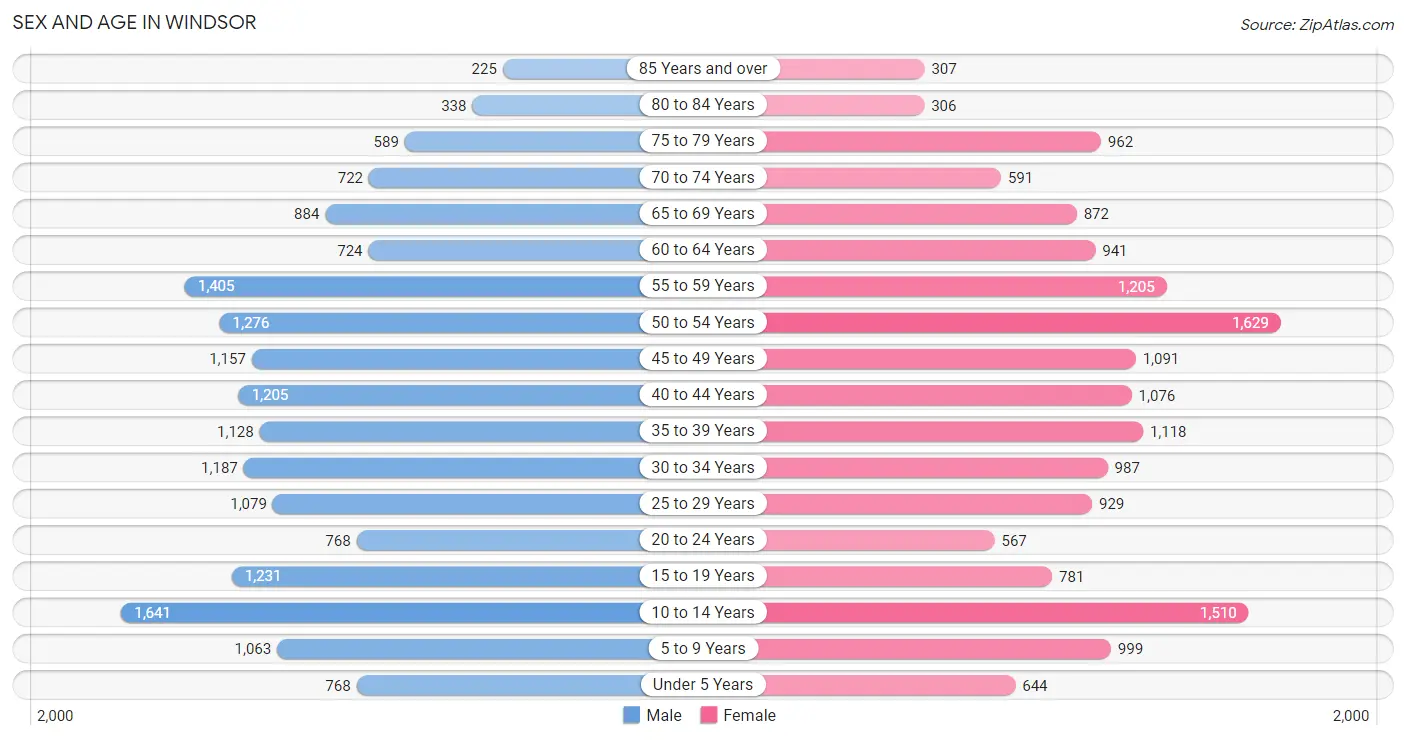
| Age Bracket | Male | Female |
| Under 5 Years | 768 (4.4%) | 644 (3.9%) |
| 5 to 9 Years | 1,063 (6.1%) | 999 (6.0%) |
| 10 to 14 Years | 1,641 (9.4%) | 1,510 (9.1%) |
| 15 to 19 Years | 1,231 (7.1%) | 781 (4.7%) |
| 20 to 24 Years | 768 (4.4%) | 567 (3.4%) |
| 25 to 29 Years | 1,079 (6.2%) | 929 (5.6%) |
| 30 to 34 Years | 1,187 (6.8%) | 987 (6.0%) |
| 35 to 39 Years | 1,128 (6.5%) | 1,118 (6.8%) |
| 40 to 44 Years | 1,205 (6.9%) | 1,076 (6.5%) |
| 45 to 49 Years | 1,157 (6.7%) | 1,091 (6.6%) |
| 50 to 54 Years | 1,276 (7.3%) | 1,629 (9.9%) |
| 55 to 59 Years | 1,405 (8.1%) | 1,205 (7.3%) |
| 60 to 64 Years | 724 (4.2%) | 941 (5.7%) |
| 65 to 69 Years | 884 (5.1%) | 872 (5.3%) |
| 70 to 74 Years | 722 (4.2%) | 591 (3.6%) |
| 75 to 79 Years | 589 (3.4%) | 962 (5.8%) |
| 80 to 84 Years | 338 (1.9%) | 306 (1.8%) |
| 85 Years and over | 225 (1.3%) | 307 (1.9%) |
| Total | 17,390 (100.0%) | 16,515 (100.0%) |
Families and Households in Windsor
Median Family Size in Windsor
The median family size in Windsor is 2.93 persons per family, with married-couple families (8,192 | 81.9%) accounting for the largest median family size of 2.97 persons per family. On the other hand, single male/father families (593 | 5.9%) represent the smallest median family size with 2.56 persons per family.
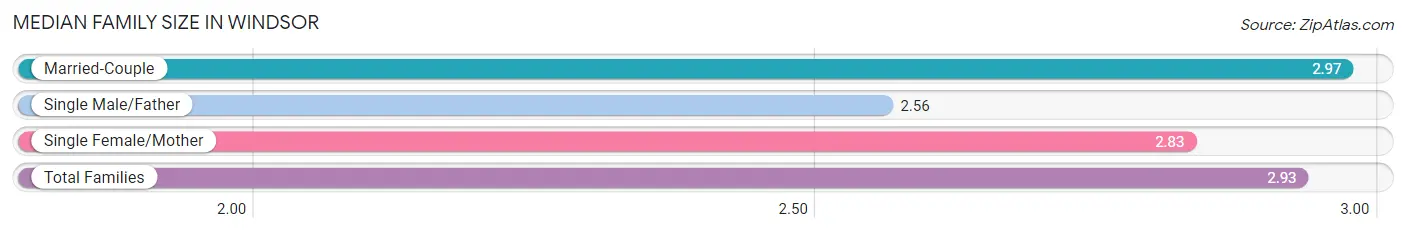
| Family Type | # Families | Family Size |
| Married-Couple | 8,192 (81.9%) | 2.97 |
| Single Male/Father | 593 (5.9%) | 2.56 |
| Single Female/Mother | 1,219 (12.2%) | 2.83 |
| Total Families | 10,004 (100.0%) | 2.93 |
Median Household Size in Windsor
The median household size in Windsor is 2.57 persons per household, with married-couple households (8,192 | 62.5%) accounting for the largest median household size of 2.99 persons per household. non-family households (3,108 | 23.7%) represent the smallest median household size with 1.27 persons per household.
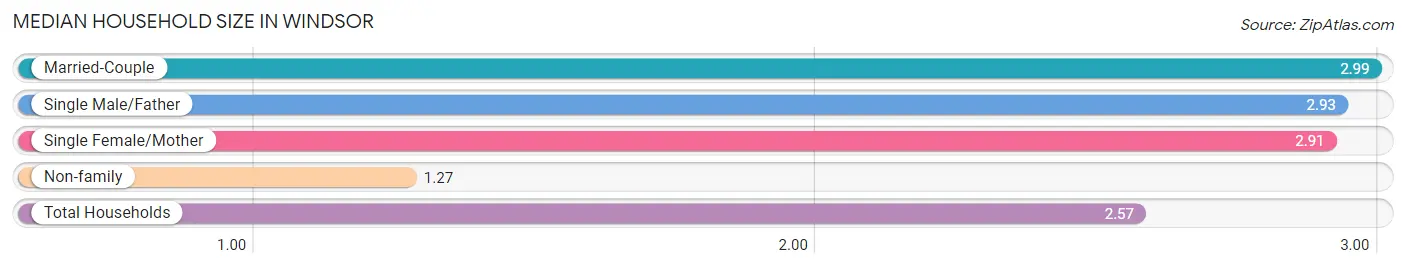
| Household Type | # Households | Household Size |
| Married-Couple | 8,192 (62.5%) | 2.99 |
| Single Male/Father | 593 (4.5%) | 2.93 |
| Single Female/Mother | 1,219 (9.3%) | 2.91 |
| Non-family | 3,108 (23.7%) | 1.27 |
| Total Households | 13,112 (100.0%) | 2.57 |
Household Size by Marriage Status in Windsor
Out of a total of 13,112 households in Windsor, 10,004 (76.3%) are family households, while 3,108 (23.7%) are nonfamily households. The most numerous type of family households are 2-person households, comprising 4,898, and the most common type of nonfamily households are 1-person households, comprising 2,391.
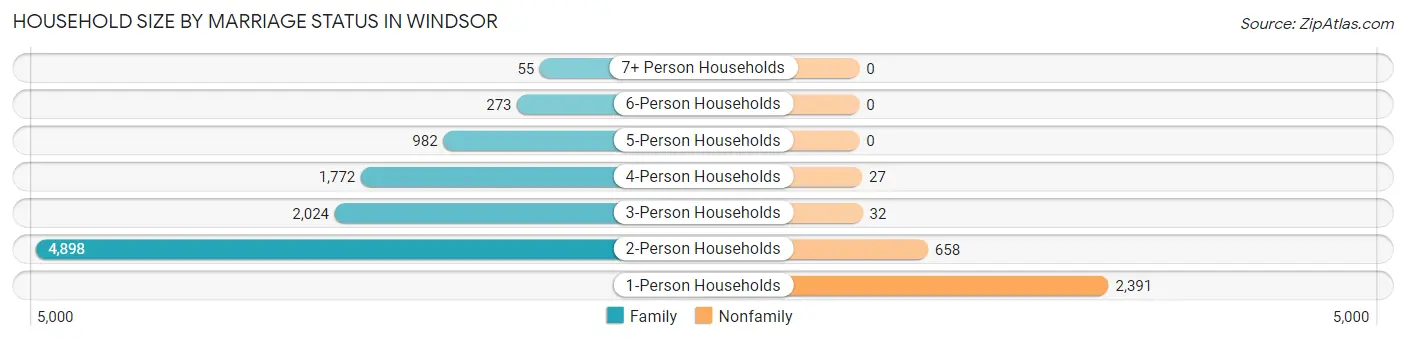
| Household Size | Family Households | Nonfamily Households |
| 1-Person Households | - | 2,391 (18.2%) |
| 2-Person Households | 4,898 (37.4%) | 658 (5.0%) |
| 3-Person Households | 2,024 (15.4%) | 32 (0.2%) |
| 4-Person Households | 1,772 (13.5%) | 27 (0.2%) |
| 5-Person Households | 982 (7.5%) | 0 (0.0%) |
| 6-Person Households | 273 (2.1%) | 0 (0.0%) |
| 7+ Person Households | 55 (0.4%) | 0 (0.0%) |
| Total | 10,004 (76.3%) | 3,108 (23.7%) |
Female Fertility in Windsor
Fertility by Age in Windsor
Average fertility rate in Windsor is 50.0 births per 1,000 women. Women in the age bracket of 20 to 34 years have the highest fertility rate with 124.0 births per 1,000 women. Women in the age bracket of 20 to 34 years acount for 88.0% of all women with births.
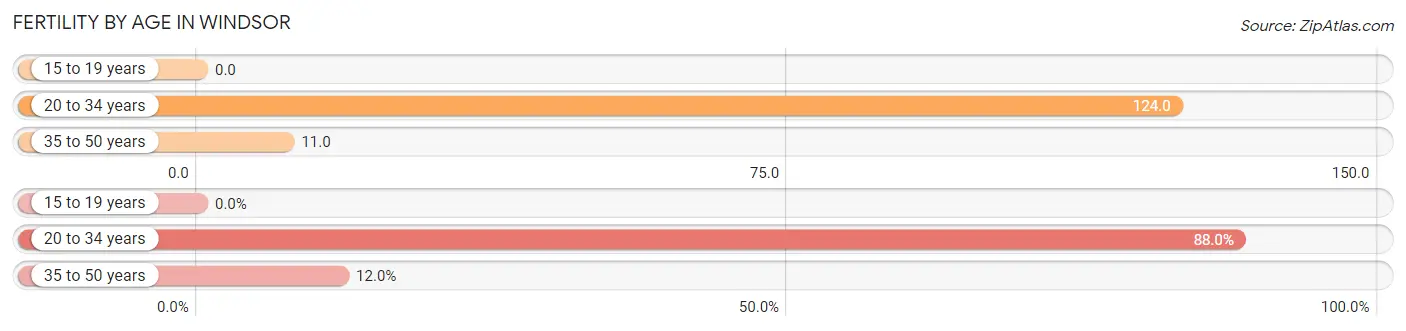
| Age Bracket | Women with Births | Births / 1,000 Women |
| 15 to 19 years | 0 (0.0%) | 0.0 |
| 20 to 34 years | 309 (88.0%) | 124.0 |
| 35 to 50 years | 42 (12.0%) | 11.0 |
| Total | 351 (100.0%) | 50.0 |
Fertility by Age by Marriage Status in Windsor
82.1% of women with births (351) in Windsor are married. The highest percentage of unmarried women with births falls into 35 to 50 years age bracket with 26.2% of them unmarried at the time of birth, while the lowest percentage of unmarried women with births belong to 20 to 34 years age bracket with 16.8% of them unmarried.
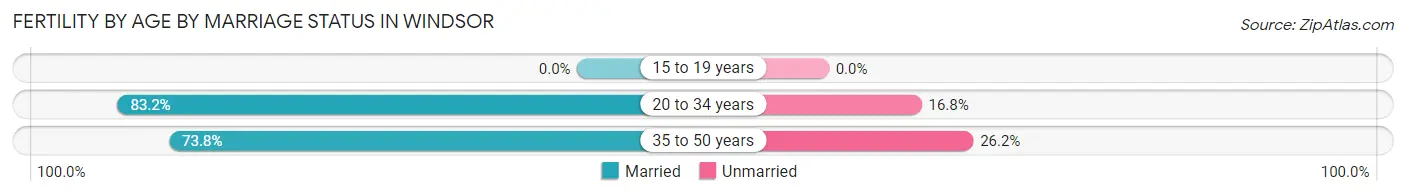
| Age Bracket | Married | Unmarried |
| 15 to 19 years | 0 (0.0%) | 0 (0.0%) |
| 20 to 34 years | 257 (83.2%) | 52 (16.8%) |
| 35 to 50 years | 31 (73.8%) | 11 (26.2%) |
| Total | 288 (82.1%) | 63 (17.9%) |
Fertility by Education in Windsor
Average fertility rate in Windsor is 50.0 births per 1,000 women. Women with the education attainment of high school diploma have the highest fertility rate of 91.0 births per 1,000 women, while women with the education attainment of less than high school have the lowest fertility at 9.0 births per 1,000 women. Women with the education attainment of bachelor's degree represent 32.8% of all women with births.
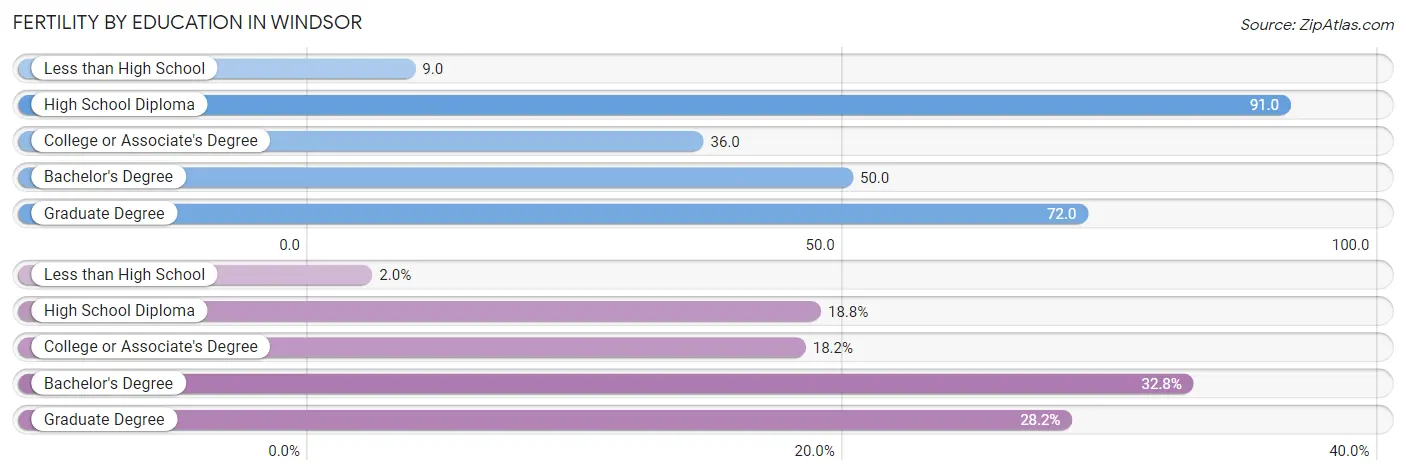
| Educational Attainment | Women with Births | Births / 1,000 Women |
| Less than High School | 7 (2.0%) | 9.0 |
| High School Diploma | 66 (18.8%) | 91.0 |
| College or Associate's Degree | 64 (18.2%) | 36.0 |
| Bachelor's Degree | 115 (32.8%) | 50.0 |
| Graduate Degree | 99 (28.2%) | 72.0 |
| Total | 351 (100.0%) | 50.0 |
Fertility by Education by Marriage Status in Windsor
17.9% of women with births in Windsor are unmarried. Women with the educational attainment of less than high school are most likely to be married with 100.0% of them married at childbirth, while women with the educational attainment of high school diploma are least likely to be married with 59.1% of them unmarried at childbirth.
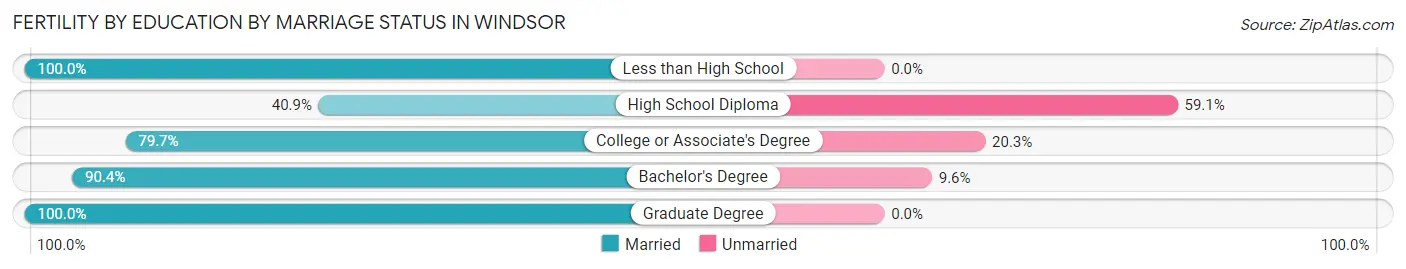
| Educational Attainment | Married | Unmarried |
| Less than High School | 7 (100.0%) | 0 (0.0%) |
| High School Diploma | 27 (40.9%) | 39 (59.1%) |
| College or Associate's Degree | 51 (79.7%) | 13 (20.3%) |
| Bachelor's Degree | 104 (90.4%) | 11 (9.6%) |
| Graduate Degree | 99 (100.0%) | 0 (0.0%) |
| Total | 288 (82.1%) | 63 (17.9%) |
Employment Characteristics in Windsor
Employment by Class of Employer in Windsor
Among the 17,181 employed individuals in Windsor, private company employees (11,015 | 64.1%), local government employees (1,646 | 9.6%), and not-for-profit organizations (1,307 | 7.6%) make up the most common classes of employment.
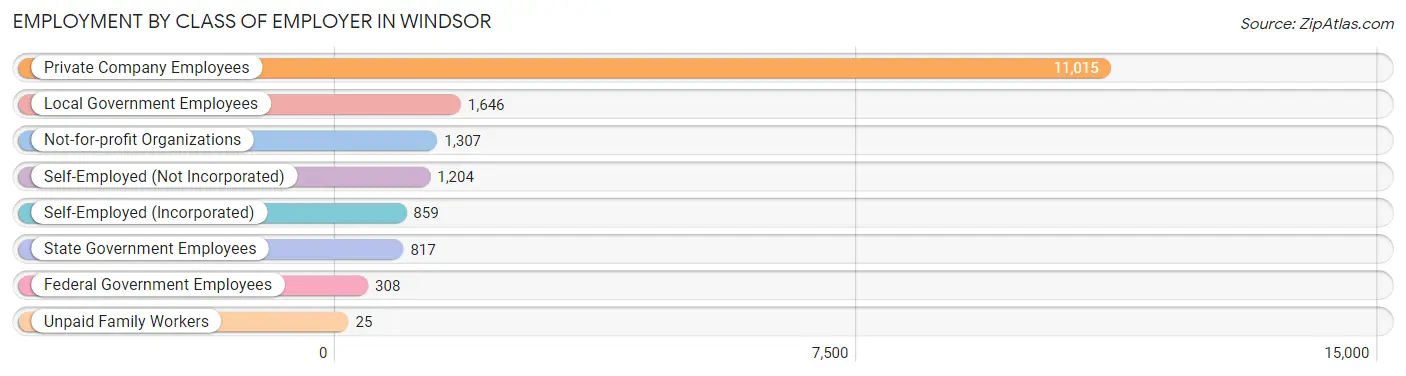
| Employer Class | # Employees | % Employees |
| Private Company Employees | 11,015 | 64.1% |
| Self-Employed (Incorporated) | 859 | 5.0% |
| Self-Employed (Not Incorporated) | 1,204 | 7.0% |
| Not-for-profit Organizations | 1,307 | 7.6% |
| Local Government Employees | 1,646 | 9.6% |
| State Government Employees | 817 | 4.8% |
| Federal Government Employees | 308 | 1.8% |
| Unpaid Family Workers | 25 | 0.2% |
| Total | 17,181 | 100.0% |
Employment Status by Age in Windsor
According to the labor force statistics for Windsor, out of the total population over 16 years of age (26,662), 68.3% or 18,210 individuals are in the labor force, with 4.9% or 892 of them unemployed. The age group with the highest labor force participation rate is 35 to 44 years, with 90.0% or 4,074 individuals in the labor force. Within the labor force, the 16 to 19 years age range has the highest percentage of unemployed individuals, with 18.2% or 105 of them being unemployed.
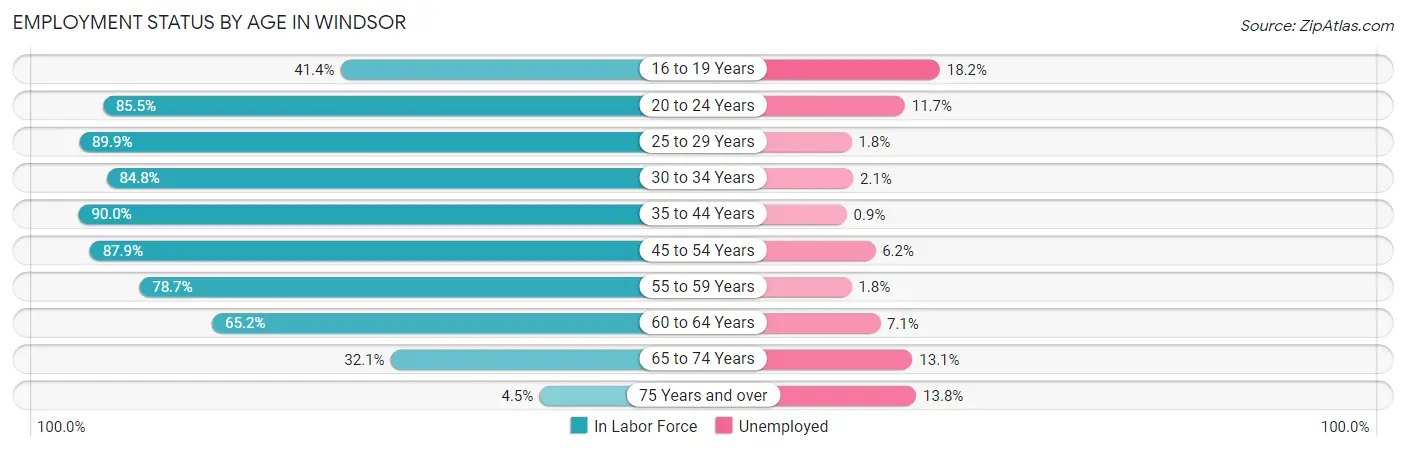
| Age Bracket | In Labor Force | Unemployed |
| 16 to 19 Years | 577 (41.4%) | 105 (18.2%) |
| 20 to 24 Years | 1,141 (85.5%) | 133 (11.7%) |
| 25 to 29 Years | 1,805 (89.9%) | 32 (1.8%) |
| 30 to 34 Years | 1,844 (84.8%) | 39 (2.1%) |
| 35 to 44 Years | 4,074 (90.0%) | 37 (0.9%) |
| 45 to 54 Years | 4,529 (87.9%) | 281 (6.2%) |
| 55 to 59 Years | 2,054 (78.7%) | 37 (1.8%) |
| 60 to 64 Years | 1,086 (65.2%) | 77 (7.1%) |
| 65 to 74 Years | 985 (32.1%) | 129 (13.1%) |
| 75 Years and over | 123 (4.5%) | 17 (13.8%) |
| Total | 18,210 (68.3%) | 892 (4.9%) |
Employment Status by Educational Attainment in Windsor
According to labor force statistics for Windsor, 84.9% of individuals (15,398) out of the total population between 25 and 64 years of age (18,137) are in the labor force, with 3.3% or 508 of them being unemployed. The group with the highest labor force participation rate are those with the educational attainment of bachelor's degree or higher, with 86.5% or 8,298 individuals in the labor force. Within the labor force, individuals with college / associate degree education have the highest percentage of unemployment, with 7.8% or 373 of them being unemployed.
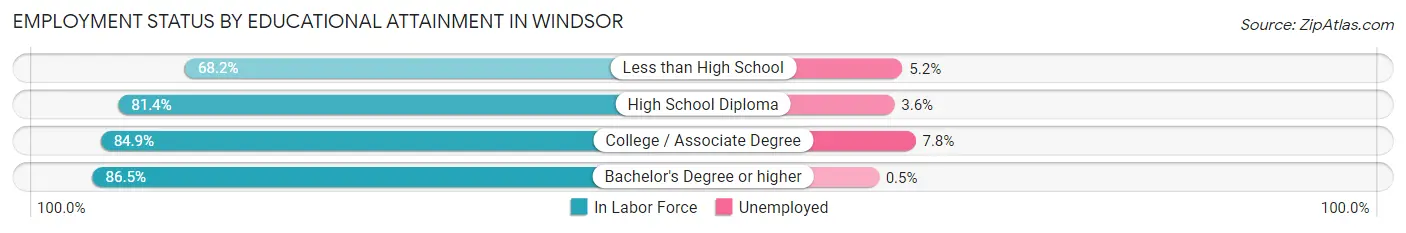
| Educational Attainment | In Labor Force | Unemployed |
| Less than High School | 305 (68.2%) | 23 (5.2%) |
| High School Diploma | 2,004 (81.4%) | 89 (3.6%) |
| College / Associate Degree | 4,784 (84.9%) | 440 (7.8%) |
| Bachelor's Degree or higher | 8,298 (86.5%) | 48 (0.5%) |
| Total | 15,398 (84.9%) | 599 (3.3%) |
Employment Occupations by Sex in Windsor
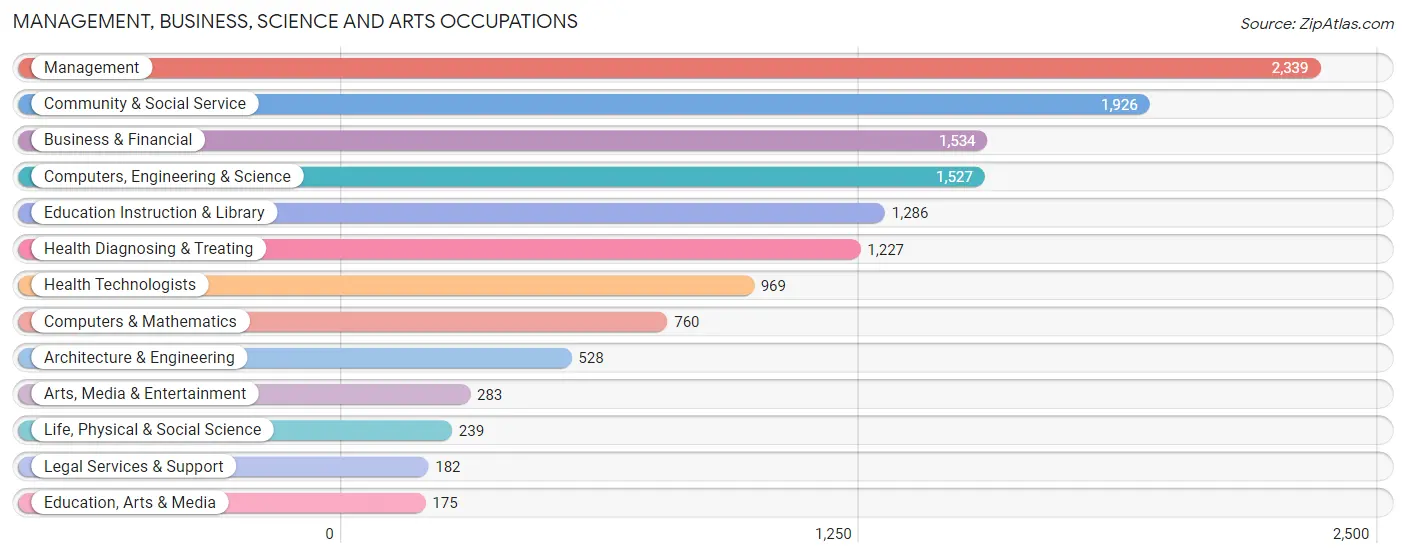
Management, Business, Science and Arts Occupations
The most common Management, Business, Science and Arts occupations in Windsor are Management (2,339 | 13.5%), Community & Social Service (1,926 | 11.1%), Business & Financial (1,534 | 8.9%), Computers, Engineering & Science (1,527 | 8.8%), and Education Instruction & Library (1,286 | 7.4%).
Management, Business, Science and Arts Occupations by Sex
Within the Management, Business, Science and Arts occupations in Windsor, the most male-oriented occupations are Architecture & Engineering (86.0%), Computers & Mathematics (79.9%), and Computers, Engineering & Science (78.9%), while the most female-oriented occupations are Health Diagnosing & Treating (78.5%), Health Technologists (78.3%), and Education Instruction & Library (71.2%).
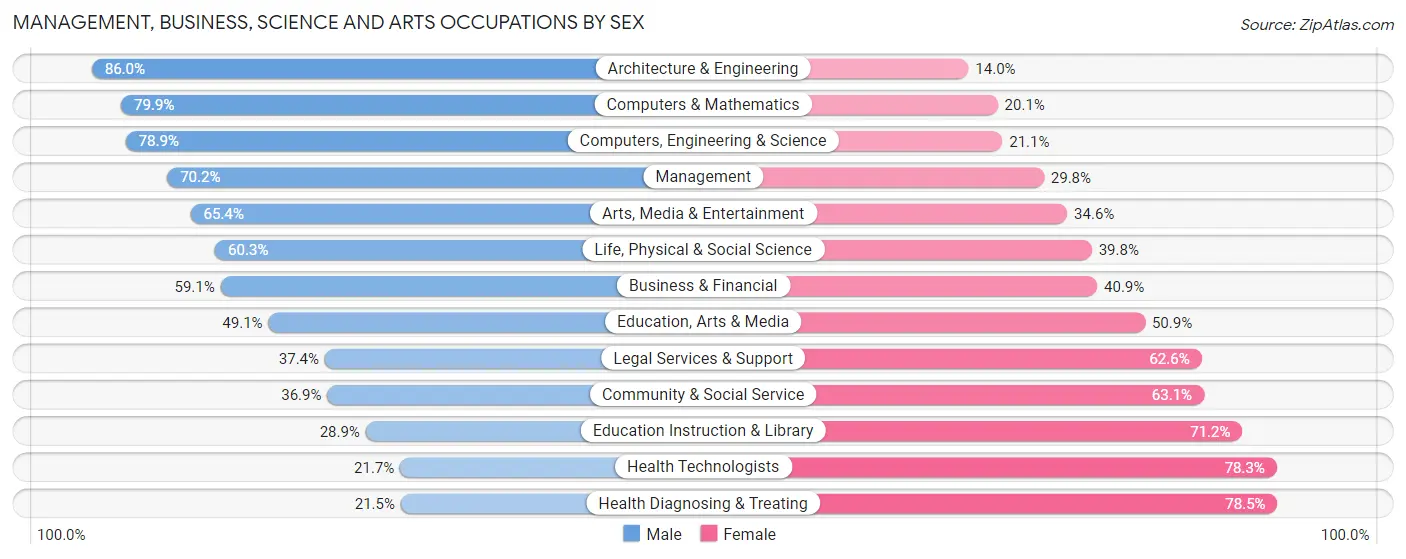
| Occupation | Male | Female |
| Management | 1,643 (70.2%) | 696 (29.8%) |
| Business & Financial | 907 (59.1%) | 627 (40.9%) |
| Computers, Engineering & Science | 1,205 (78.9%) | 322 (21.1%) |
| Computers & Mathematics | 607 (79.9%) | 153 (20.1%) |
| Architecture & Engineering | 454 (86.0%) | 74 (14.0%) |
| Life, Physical & Social Science | 144 (60.3%) | 95 (39.8%) |
| Community & Social Service | 710 (36.9%) | 1,216 (63.1%) |
| Education, Arts & Media | 86 (49.1%) | 89 (50.9%) |
| Legal Services & Support | 68 (37.4%) | 114 (62.6%) |
| Education Instruction & Library | 371 (28.8%) | 915 (71.2%) |
| Arts, Media & Entertainment | 185 (65.4%) | 98 (34.6%) |
| Health Diagnosing & Treating | 264 (21.5%) | 963 (78.5%) |
| Health Technologists | 210 (21.7%) | 759 (78.3%) |
| Total (Category) | 4,729 (55.3%) | 3,824 (44.7%) |
| Total (Overall) | 9,727 (56.2%) | 7,584 (43.8%) |
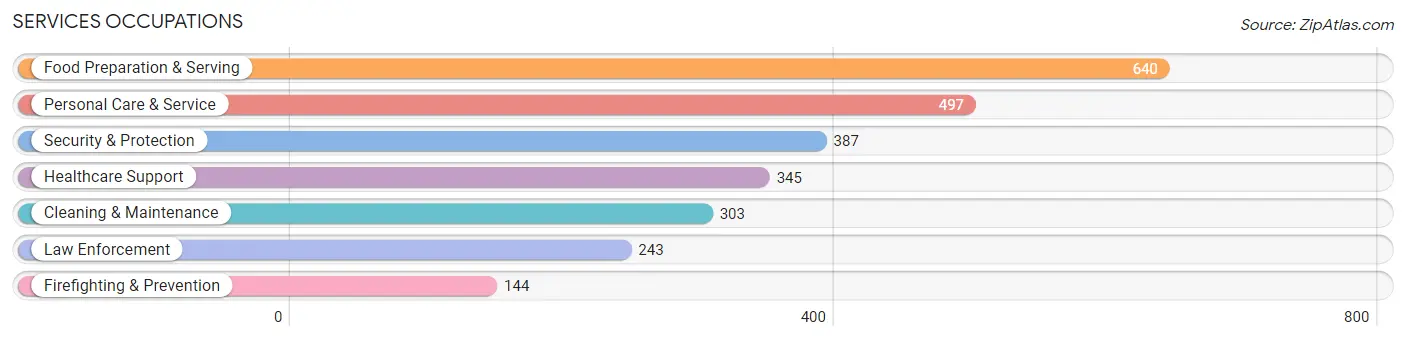
Services Occupations
The most common Services occupations in Windsor are Food Preparation & Serving (640 | 3.7%), Personal Care & Service (497 | 2.9%), Security & Protection (387 | 2.2%), Healthcare Support (345 | 2.0%), and Cleaning & Maintenance (303 | 1.8%).
Services Occupations by Sex
Within the Services occupations in Windsor, the most male-oriented occupations are Law Enforcement (84.8%), Cleaning & Maintenance (72.6%), and Security & Protection (68.7%), while the most female-oriented occupations are Personal Care & Service (95.4%), Healthcare Support (88.4%), and Firefighting & Prevention (58.3%).
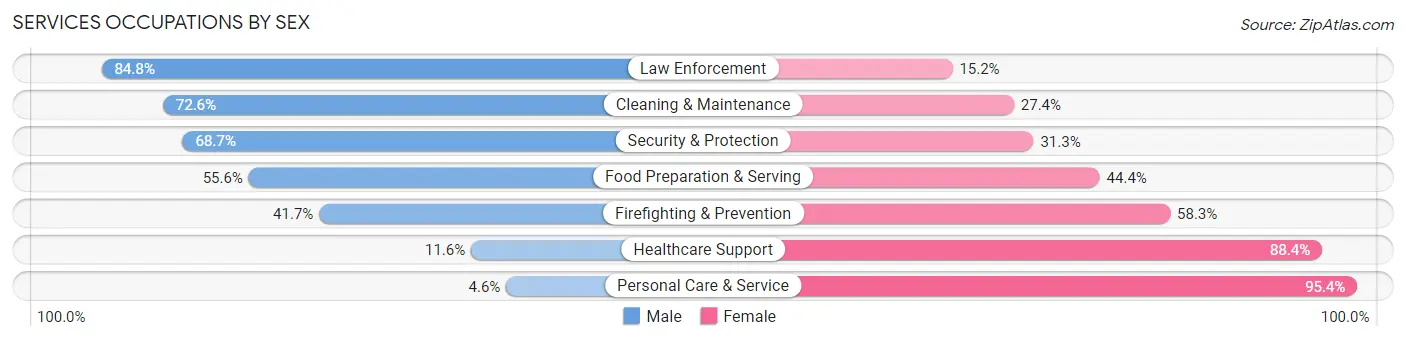
| Occupation | Male | Female |
| Healthcare Support | 40 (11.6%) | 305 (88.4%) |
| Security & Protection | 266 (68.7%) | 121 (31.3%) |
| Firefighting & Prevention | 60 (41.7%) | 84 (58.3%) |
| Law Enforcement | 206 (84.8%) | 37 (15.2%) |
| Food Preparation & Serving | 356 (55.6%) | 284 (44.4%) |
| Cleaning & Maintenance | 220 (72.6%) | 83 (27.4%) |
| Personal Care & Service | 23 (4.6%) | 474 (95.4%) |
| Total (Category) | 905 (41.7%) | 1,267 (58.3%) |
| Total (Overall) | 9,727 (56.2%) | 7,584 (43.8%) |
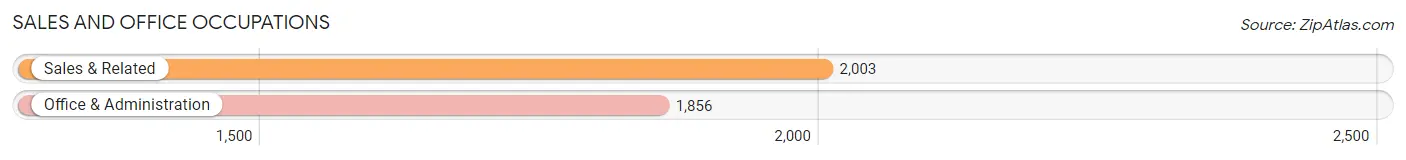
Sales and Office Occupations
The most common Sales and Office occupations in Windsor are Sales & Related (2,003 | 11.6%), and Office & Administration (1,856 | 10.7%).
Sales and Office Occupations by Sex
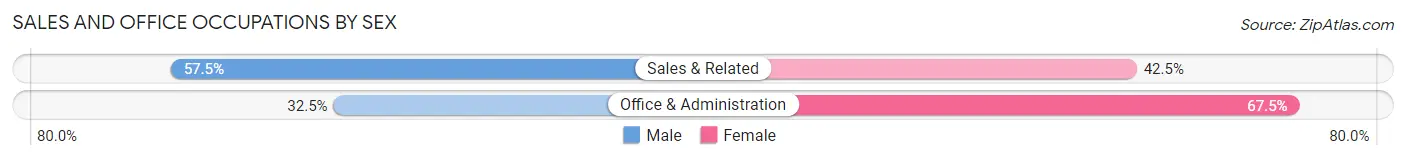
| Occupation | Male | Female |
| Sales & Related | 1,152 (57.5%) | 851 (42.5%) |
| Office & Administration | 603 (32.5%) | 1,253 (67.5%) |
| Total (Category) | 1,755 (45.5%) | 2,104 (54.5%) |
| Total (Overall) | 9,727 (56.2%) | 7,584 (43.8%) |
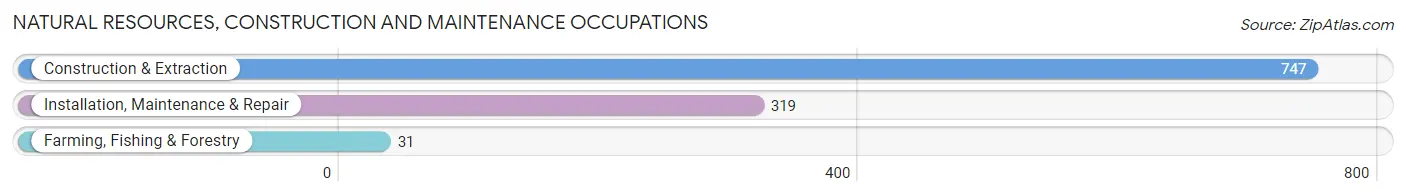
Natural Resources, Construction and Maintenance Occupations
The most common Natural Resources, Construction and Maintenance occupations in Windsor are Construction & Extraction (747 | 4.3%), Installation, Maintenance & Repair (319 | 1.8%), and Farming, Fishing & Forestry (31 | 0.2%).
Natural Resources, Construction and Maintenance Occupations by Sex
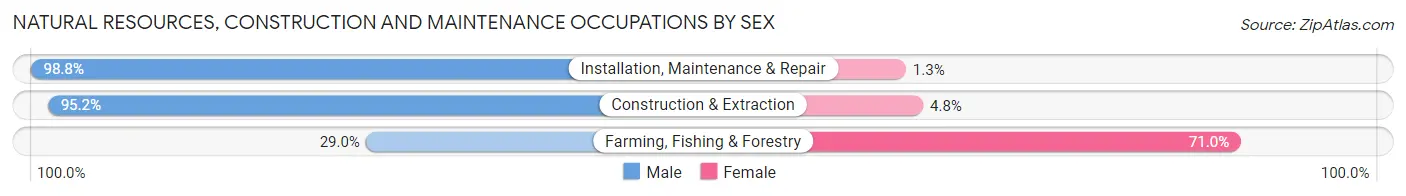
| Occupation | Male | Female |
| Farming, Fishing & Forestry | 9 (29.0%) | 22 (71.0%) |
| Construction & Extraction | 711 (95.2%) | 36 (4.8%) |
| Installation, Maintenance & Repair | 315 (98.8%) | 4 (1.3%) |
| Total (Category) | 1,035 (94.4%) | 62 (5.7%) |
| Total (Overall) | 9,727 (56.2%) | 7,584 (43.8%) |
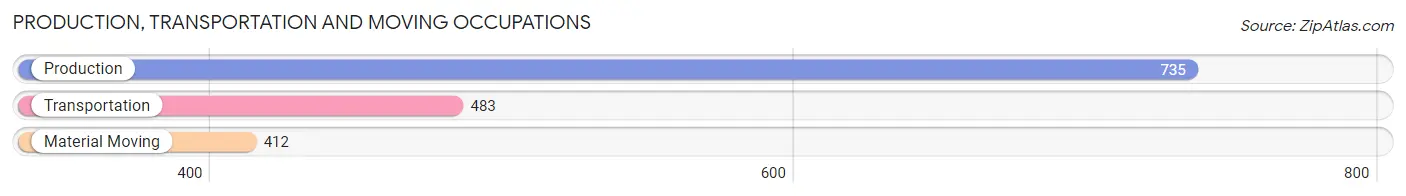
Production, Transportation and Moving Occupations
The most common Production, Transportation and Moving occupations in Windsor are Production (735 | 4.3%), Transportation (483 | 2.8%), and Material Moving (412 | 2.4%).
Production, Transportation and Moving Occupations by Sex
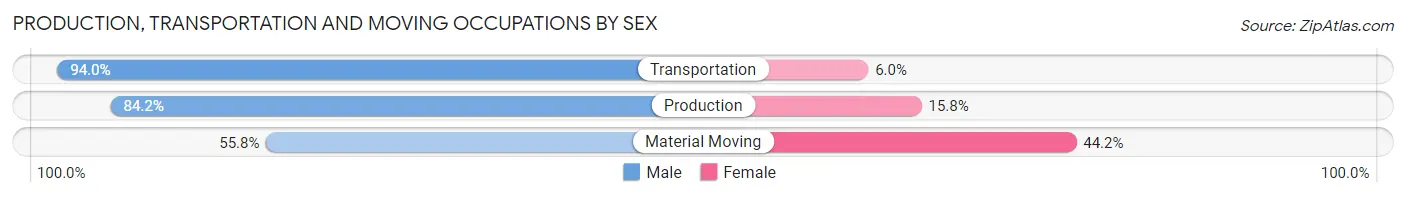
| Occupation | Male | Female |
| Production | 619 (84.2%) | 116 (15.8%) |
| Transportation | 454 (94.0%) | 29 (6.0%) |
| Material Moving | 230 (55.8%) | 182 (44.2%) |
| Total (Category) | 1,303 (79.9%) | 327 (20.1%) |
| Total (Overall) | 9,727 (56.2%) | 7,584 (43.8%) |
Employment Industries by Sex in Windsor
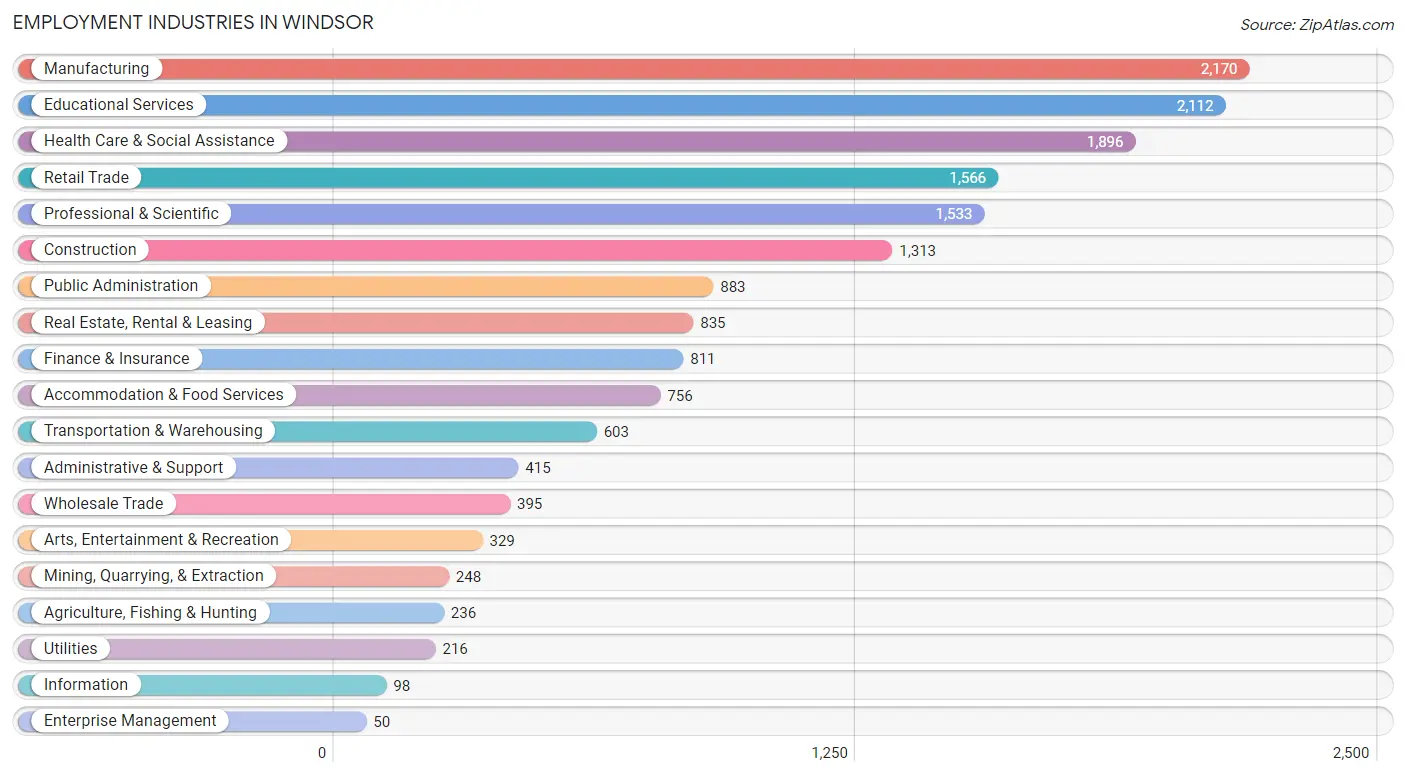
Employment Industries in Windsor
The major employment industries in Windsor include Manufacturing (2,170 | 12.5%), Educational Services (2,112 | 12.2%), Health Care & Social Assistance (1,896 | 11.0%), Retail Trade (1,566 | 9.0%), and Professional & Scientific (1,533 | 8.9%).
Employment Industries by Sex in Windsor
The Windsor industries that see more men than women are Utilities (88.4%), Wholesale Trade (88.3%), and Mining, Quarrying, & Extraction (86.3%), whereas the industries that tend to have a higher number of women are Health Care & Social Assistance (82.6%), Enterprise Management (66.0%), and Educational Services (63.7%).
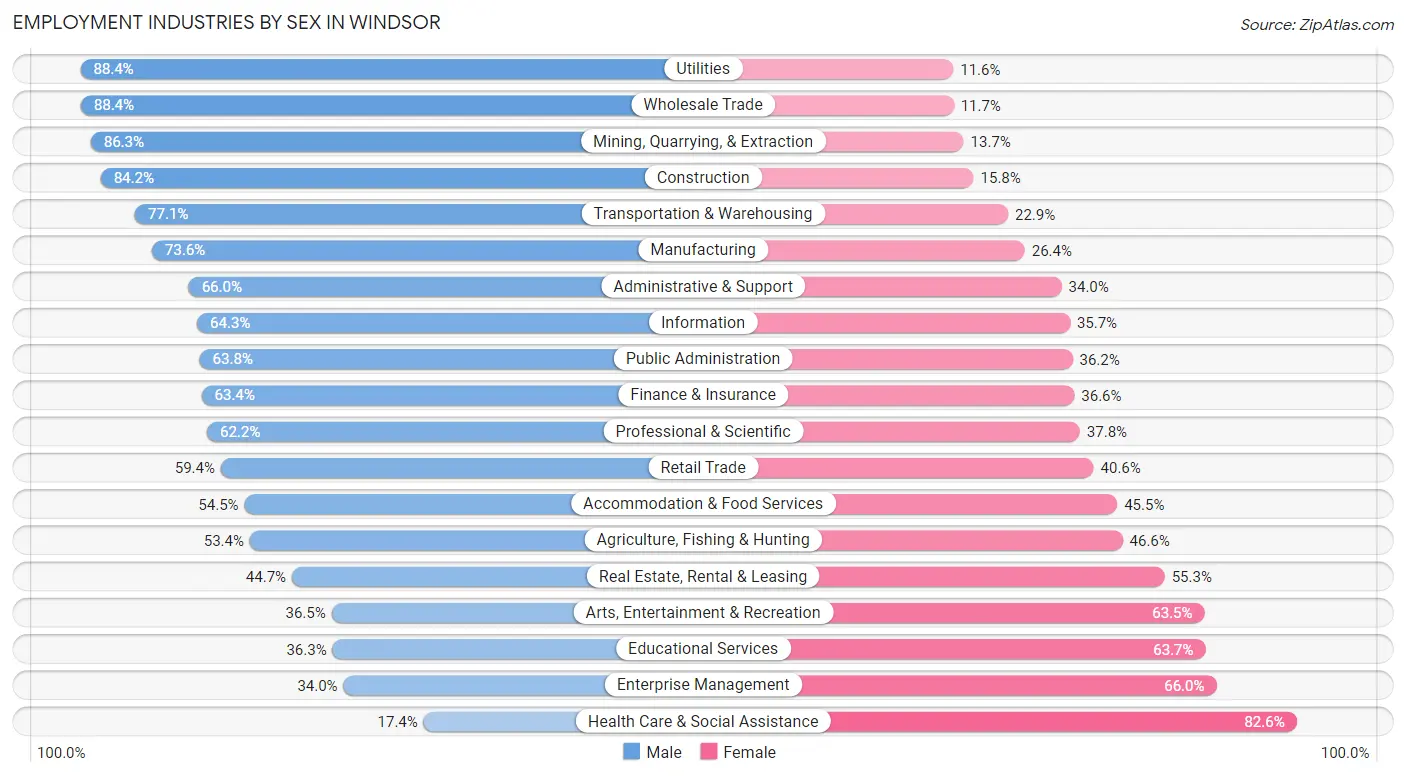
| Industry | Male | Female |
| Agriculture, Fishing & Hunting | 126 (53.4%) | 110 (46.6%) |
| Mining, Quarrying, & Extraction | 214 (86.3%) | 34 (13.7%) |
| Construction | 1,106 (84.2%) | 207 (15.8%) |
| Manufacturing | 1,598 (73.6%) | 572 (26.4%) |
| Wholesale Trade | 349 (88.3%) | 46 (11.7%) |
| Retail Trade | 930 (59.4%) | 636 (40.6%) |
| Transportation & Warehousing | 465 (77.1%) | 138 (22.9%) |
| Utilities | 191 (88.4%) | 25 (11.6%) |
| Information | 63 (64.3%) | 35 (35.7%) |
| Finance & Insurance | 514 (63.4%) | 297 (36.6%) |
| Real Estate, Rental & Leasing | 373 (44.7%) | 462 (55.3%) |
| Professional & Scientific | 954 (62.2%) | 579 (37.8%) |
| Enterprise Management | 17 (34.0%) | 33 (66.0%) |
| Administrative & Support | 274 (66.0%) | 141 (34.0%) |
| Educational Services | 766 (36.3%) | 1,346 (63.7%) |
| Health Care & Social Assistance | 330 (17.4%) | 1,566 (82.6%) |
| Arts, Entertainment & Recreation | 120 (36.5%) | 209 (63.5%) |
| Accommodation & Food Services | 412 (54.5%) | 344 (45.5%) |
| Public Administration | 563 (63.8%) | 320 (36.2%) |
| Total | 9,727 (56.2%) | 7,584 (43.8%) |
Education in Windsor
School Enrollment in Windsor
The most common levels of schooling among the 8,455 students in Windsor are middle school (2,466 | 29.2%), high school (2,000 | 23.6%), and elementary school (1,624 | 19.2%).
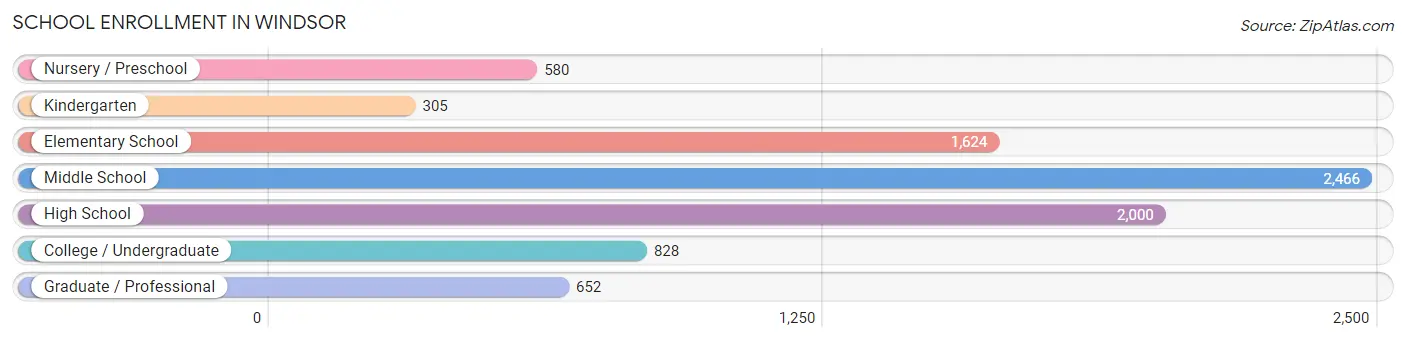
| School Level | # Students | % Students |
| Nursery / Preschool | 580 | 6.9% |
| Kindergarten | 305 | 3.6% |
| Elementary School | 1,624 | 19.2% |
| Middle School | 2,466 | 29.2% |
| High School | 2,000 | 23.6% |
| College / Undergraduate | 828 | 9.8% |
| Graduate / Professional | 652 | 7.7% |
| Total | 8,455 | 100.0% |
School Enrollment by Age by Funding Source in Windsor
Out of a total of 8,455 students who are enrolled in schools in Windsor, 1,327 (15.7%) attend a private institution, while the remaining 7,128 (84.3%) are enrolled in public schools. The age group of 3 to 4 year olds has the highest likelihood of being enrolled in private schools, with 171 (48.6% in the age bracket) enrolled. Conversely, the age group of 18 to 19 year olds has the lowest likelihood of being enrolled in a private school, with 310 (100.0% in the age bracket) attending a public institution.
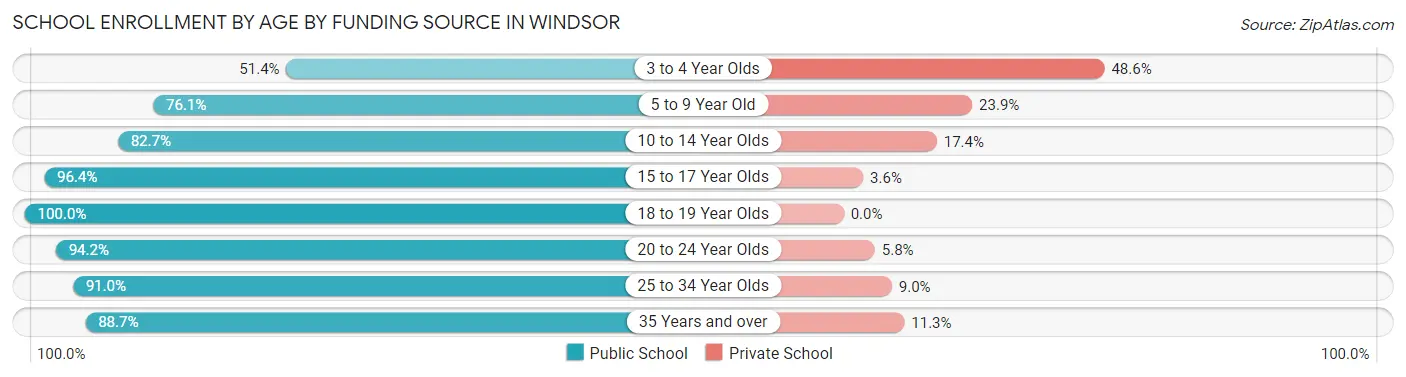
| Age Bracket | Public School | Private School |
| 3 to 4 Year Olds | 181 (51.4%) | 171 (48.6%) |
| 5 to 9 Year Old | 1,408 (76.1%) | 443 (23.9%) |
| 10 to 14 Year Olds | 2,573 (82.7%) | 540 (17.3%) |
| 15 to 17 Year Olds | 1,354 (96.4%) | 51 (3.6%) |
| 18 to 19 Year Olds | 310 (100.0%) | 0 (0.0%) |
| 20 to 24 Year Olds | 406 (94.2%) | 25 (5.8%) |
| 25 to 34 Year Olds | 477 (91.0%) | 47 (9.0%) |
| 35 Years and over | 416 (88.7%) | 53 (11.3%) |
| Total | 7,128 (84.3%) | 1,327 (15.7%) |
Educational Attainment by Field of Study in Windsor
Business (2,933 | 22.3%), education (1,668 | 12.7%), science & technology (1,264 | 9.6%), bio, nature & agricultural (1,230 | 9.3%), and engineering (1,121 | 8.5%) are the most common fields of study among 13,177 individuals in Windsor who have obtained a bachelor's degree or higher.
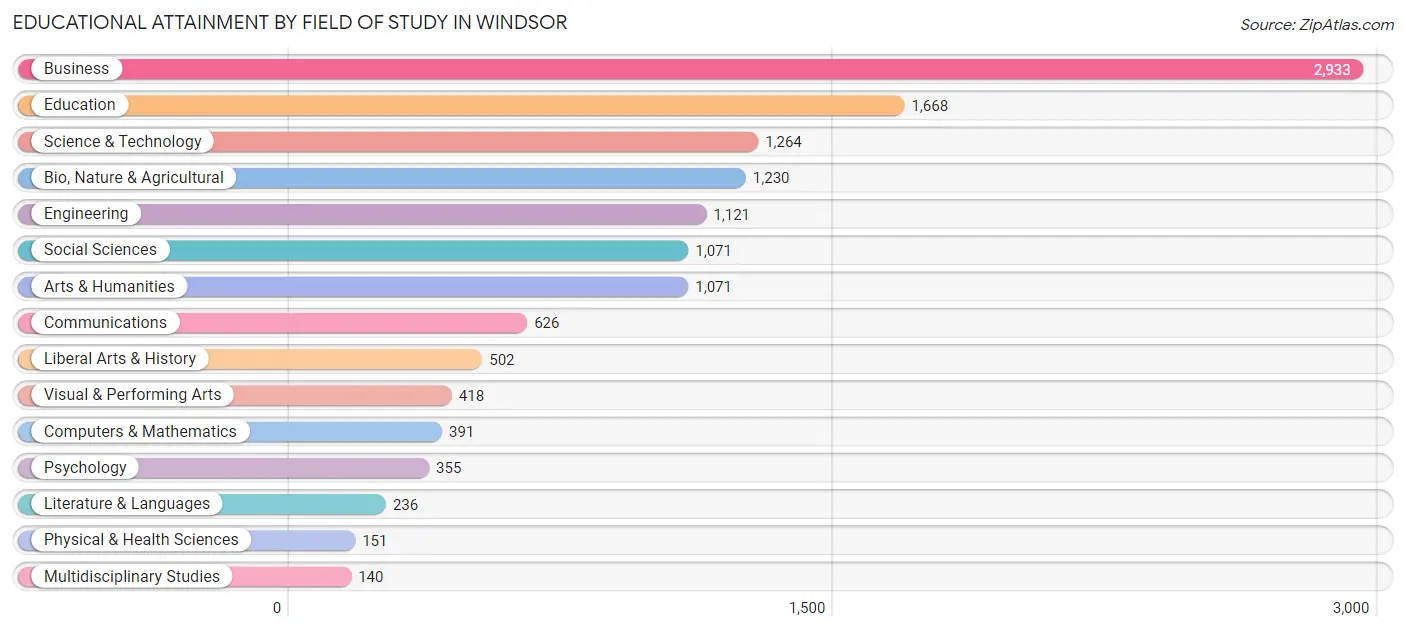
| Field of Study | # Graduates | % Graduates |
| Computers & Mathematics | 391 | 3.0% |
| Bio, Nature & Agricultural | 1,230 | 9.3% |
| Physical & Health Sciences | 151 | 1.1% |
| Psychology | 355 | 2.7% |
| Social Sciences | 1,071 | 8.1% |
| Engineering | 1,121 | 8.5% |
| Multidisciplinary Studies | 140 | 1.1% |
| Science & Technology | 1,264 | 9.6% |
| Business | 2,933 | 22.3% |
| Education | 1,668 | 12.7% |
| Literature & Languages | 236 | 1.8% |
| Liberal Arts & History | 502 | 3.8% |
| Visual & Performing Arts | 418 | 3.2% |
| Communications | 626 | 4.8% |
| Arts & Humanities | 1,071 | 8.1% |
| Total | 13,177 | 100.0% |
Transportation & Commute in Windsor
Vehicle Availability by Sex in Windsor
The most prevalent vehicle ownership categories in Windsor are males with 2 vehicles (4,382, accounting for 45.5%) and females with 2 vehicles (3,206, making up 58.1%).
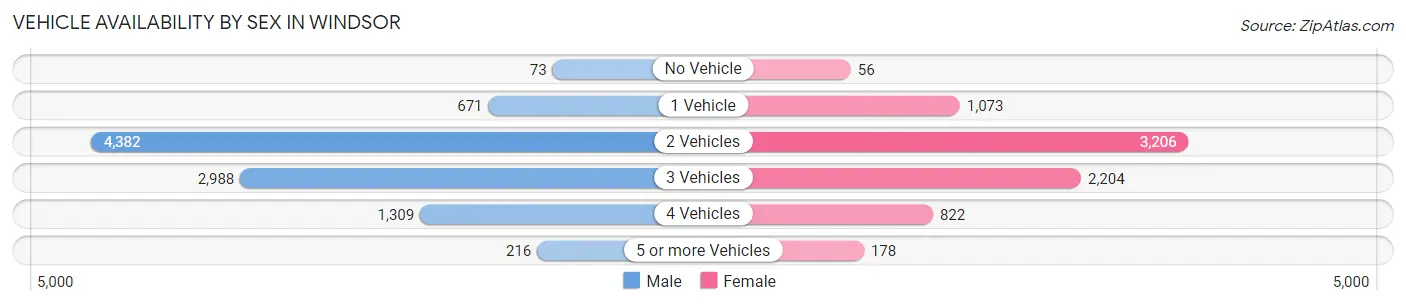
| Vehicles Available | Male | Female |
| No Vehicle | 73 (0.8%) | 56 (0.7%) |
| 1 Vehicle | 671 (7.0%) | 1,073 (14.2%) |
| 2 Vehicles | 4,382 (45.5%) | 3,206 (42.5%) |
| 3 Vehicles | 2,988 (31.0%) | 2,204 (29.2%) |
| 4 Vehicles | 1,309 (13.6%) | 822 (10.9%) |
| 5 or more Vehicles | 216 (2.2%) | 178 (2.4%) |
| Total | 9,639 (100.0%) | 7,539 (100.0%) |
Commute Time in Windsor
The most frequently occuring commute durations in Windsor are 20 to 24 minutes (2,290 commuters, 16.2%), 15 to 19 minutes (2,073 commuters, 14.7%), and 30 to 34 minutes (2,021 commuters, 14.3%).
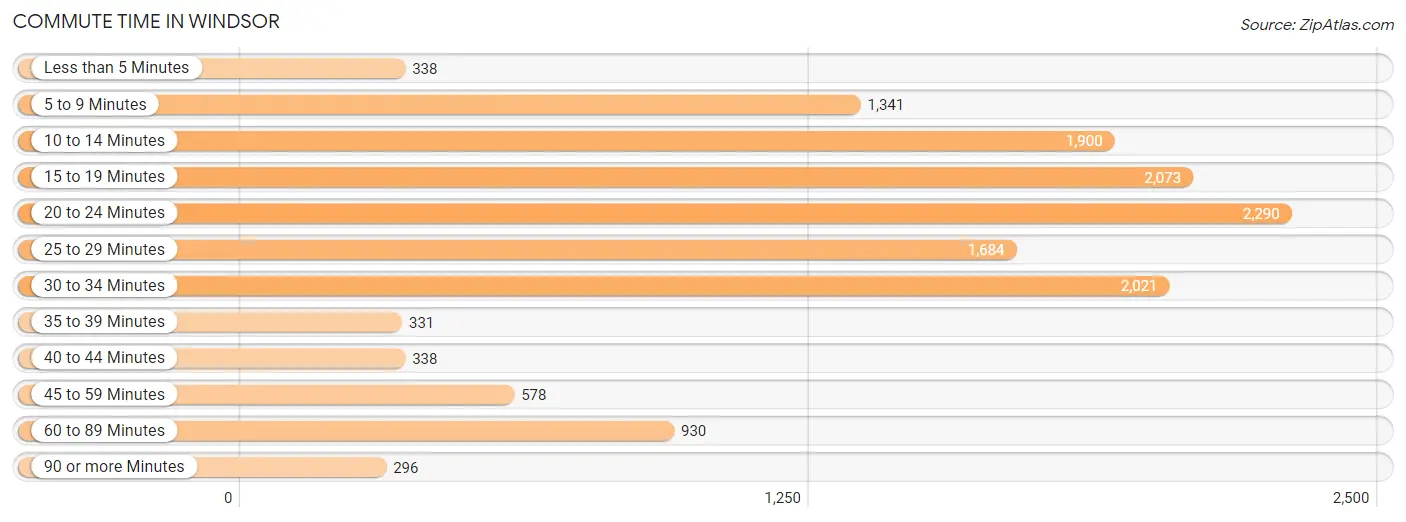
| Commute Time | # Commuters | % Commuters |
| Less than 5 Minutes | 338 | 2.4% |
| 5 to 9 Minutes | 1,341 | 9.5% |
| 10 to 14 Minutes | 1,900 | 13.5% |
| 15 to 19 Minutes | 2,073 | 14.7% |
| 20 to 24 Minutes | 2,290 | 16.2% |
| 25 to 29 Minutes | 1,684 | 11.9% |
| 30 to 34 Minutes | 2,021 | 14.3% |
| 35 to 39 Minutes | 331 | 2.3% |
| 40 to 44 Minutes | 338 | 2.4% |
| 45 to 59 Minutes | 578 | 4.1% |
| 60 to 89 Minutes | 930 | 6.6% |
| 90 or more Minutes | 296 | 2.1% |
Commute Time by Sex in Windsor
The most common commute times in Windsor are 20 to 24 minutes (1,272 commuters, 16.5%) for males and 20 to 24 minutes (1,018 commuters, 15.9%) for females.
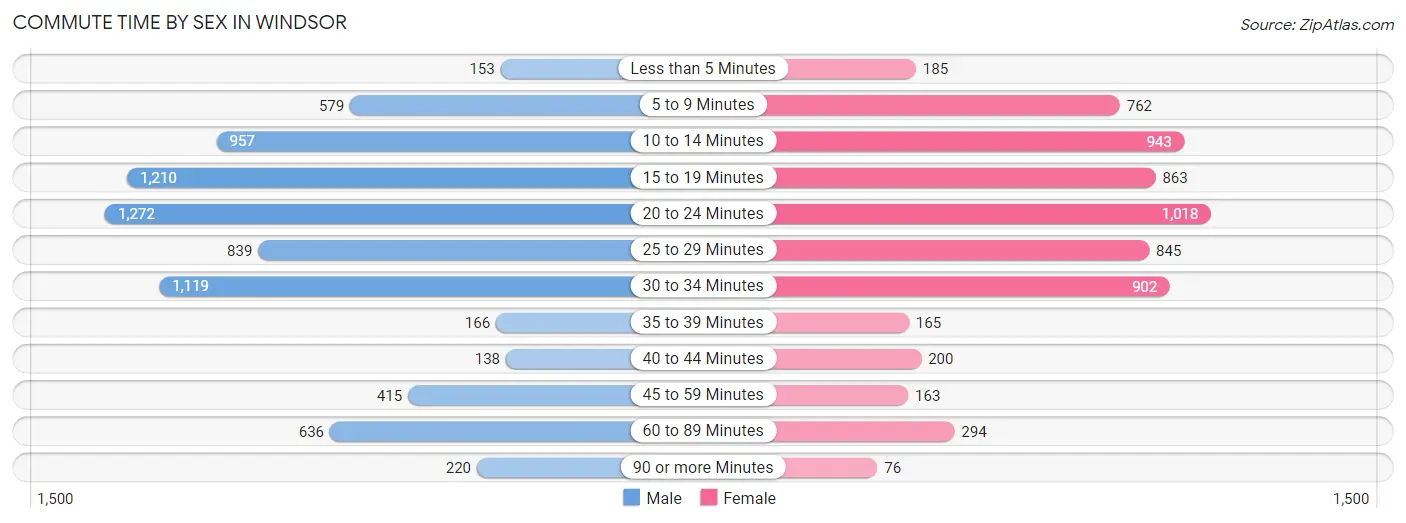
| Commute Time | Male | Female |
| Less than 5 Minutes | 153 (2.0%) | 185 (2.9%) |
| 5 to 9 Minutes | 579 (7.5%) | 762 (11.9%) |
| 10 to 14 Minutes | 957 (12.4%) | 943 (14.7%) |
| 15 to 19 Minutes | 1,210 (15.7%) | 863 (13.5%) |
| 20 to 24 Minutes | 1,272 (16.5%) | 1,018 (15.9%) |
| 25 to 29 Minutes | 839 (10.9%) | 845 (13.2%) |
| 30 to 34 Minutes | 1,119 (14.5%) | 902 (14.1%) |
| 35 to 39 Minutes | 166 (2.1%) | 165 (2.6%) |
| 40 to 44 Minutes | 138 (1.8%) | 200 (3.1%) |
| 45 to 59 Minutes | 415 (5.4%) | 163 (2.5%) |
| 60 to 89 Minutes | 636 (8.3%) | 294 (4.6%) |
| 90 or more Minutes | 220 (2.9%) | 76 (1.2%) |
Time of Departure to Work by Sex in Windsor
The most frequent times of departure to work in Windsor are 7:00 AM to 7:29 AM (1,338, 17.4%) for males and 7:30 AM to 7:59 AM (1,738, 27.1%) for females.
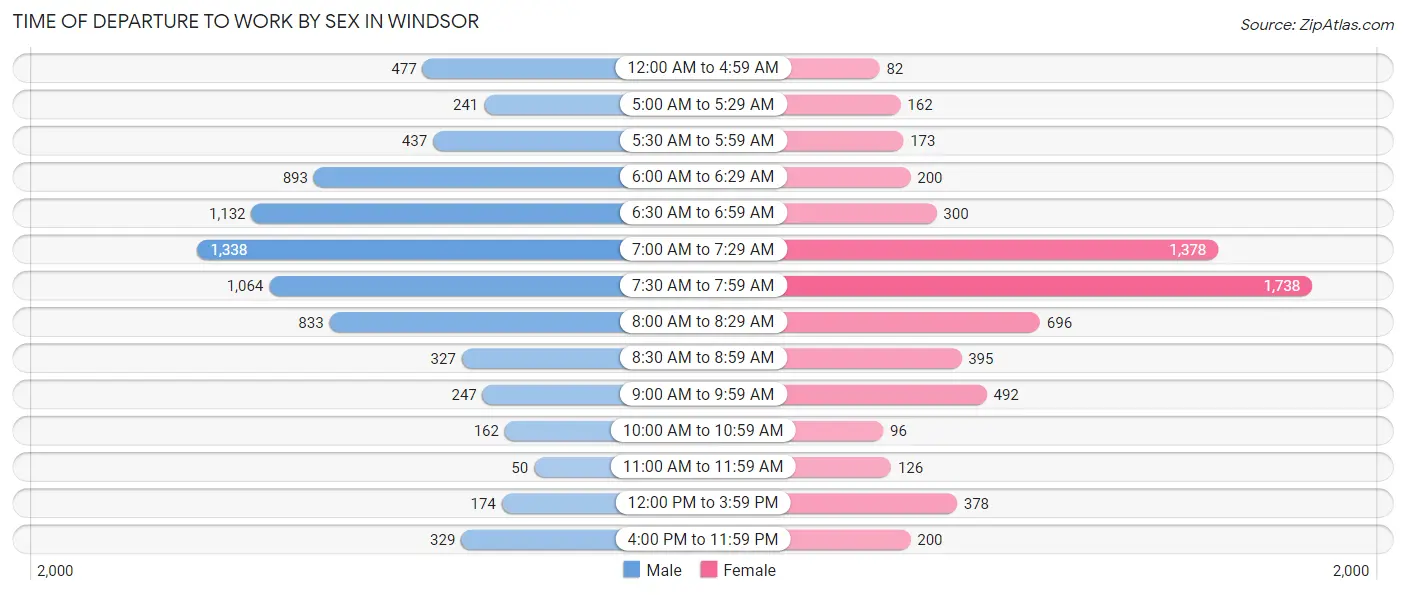
| Time of Departure | Male | Female |
| 12:00 AM to 4:59 AM | 477 (6.2%) | 82 (1.3%) |
| 5:00 AM to 5:29 AM | 241 (3.1%) | 162 (2.5%) |
| 5:30 AM to 5:59 AM | 437 (5.7%) | 173 (2.7%) |
| 6:00 AM to 6:29 AM | 893 (11.6%) | 200 (3.1%) |
| 6:30 AM to 6:59 AM | 1,132 (14.7%) | 300 (4.7%) |
| 7:00 AM to 7:29 AM | 1,338 (17.4%) | 1,378 (21.5%) |
| 7:30 AM to 7:59 AM | 1,064 (13.8%) | 1,738 (27.1%) |
| 8:00 AM to 8:29 AM | 833 (10.8%) | 696 (10.8%) |
| 8:30 AM to 8:59 AM | 327 (4.2%) | 395 (6.2%) |
| 9:00 AM to 9:59 AM | 247 (3.2%) | 492 (7.7%) |
| 10:00 AM to 10:59 AM | 162 (2.1%) | 96 (1.5%) |
| 11:00 AM to 11:59 AM | 50 (0.6%) | 126 (2.0%) |
| 12:00 PM to 3:59 PM | 174 (2.3%) | 378 (5.9%) |
| 4:00 PM to 11:59 PM | 329 (4.3%) | 200 (3.1%) |
| Total | 7,704 (100.0%) | 6,416 (100.0%) |
Housing Occupancy in Windsor
Occupancy by Ownership in Windsor
Of the total 13,112 dwellings in Windsor, owner-occupied units account for 10,297 (78.5%), while renter-occupied units make up 2,815 (21.5%).
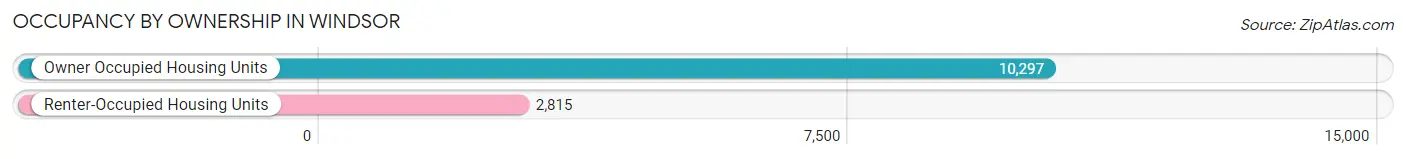
| Occupancy | # Housing Units | % Housing Units |
| Owner Occupied Housing Units | 10,297 | 78.5% |
| Renter-Occupied Housing Units | 2,815 | 21.5% |
| Total Occupied Housing Units | 13,112 | 100.0% |
Occupancy by Household Size in Windsor
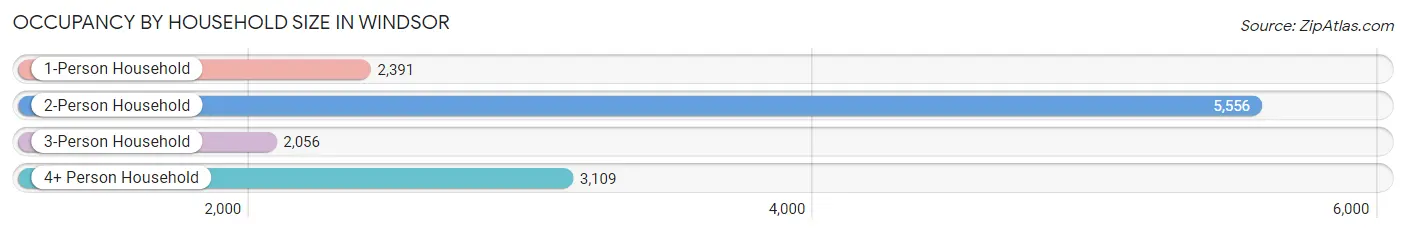
| Household Size | # Housing Units | % Housing Units |
| 1-Person Household | 2,391 | 18.2% |
| 2-Person Household | 5,556 | 42.4% |
| 3-Person Household | 2,056 | 15.7% |
| 4+ Person Household | 3,109 | 23.7% |
| Total Housing Units | 13,112 | 100.0% |
Occupancy by Ownership by Household Size in Windsor
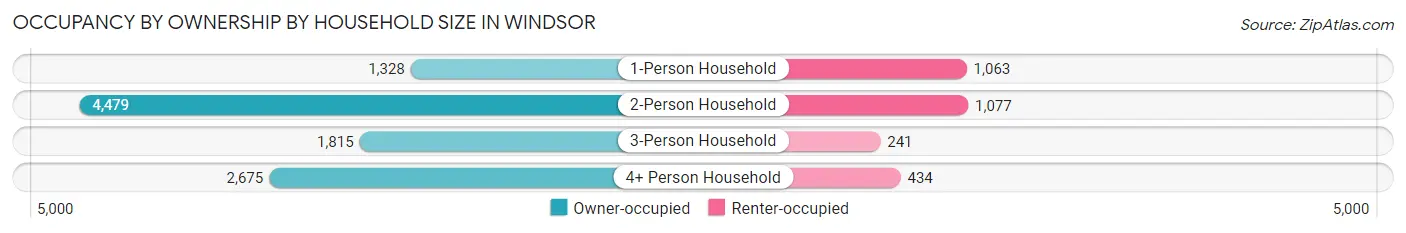
| Household Size | Owner-occupied | Renter-occupied |
| 1-Person Household | 1,328 (55.5%) | 1,063 (44.5%) |
| 2-Person Household | 4,479 (80.6%) | 1,077 (19.4%) |
| 3-Person Household | 1,815 (88.3%) | 241 (11.7%) |
| 4+ Person Household | 2,675 (86.0%) | 434 (14.0%) |
| Total Housing Units | 10,297 (78.5%) | 2,815 (21.5%) |
Occupancy by Educational Attainment in Windsor
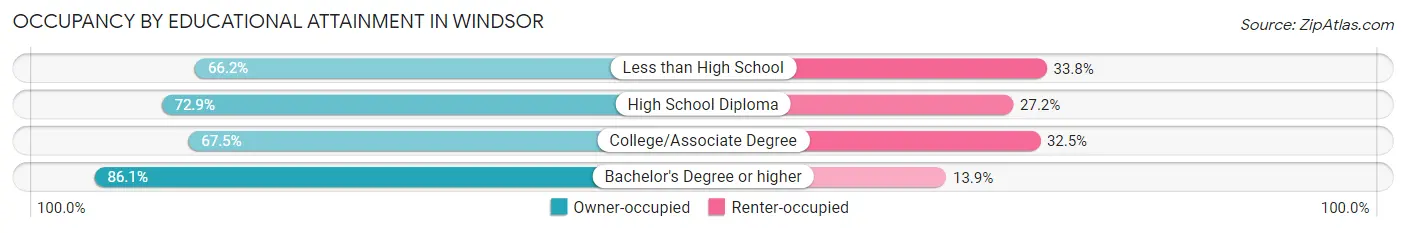
| Household Size | Owner-occupied | Renter-occupied |
| Less than High School | 149 (66.2%) | 76 (33.8%) |
| High School Diploma | 1,261 (72.9%) | 470 (27.2%) |
| College/Associate Degree | 2,623 (67.5%) | 1,261 (32.5%) |
| Bachelor's Degree or higher | 6,264 (86.1%) | 1,008 (13.9%) |
Occupancy by Age of Householder in Windsor
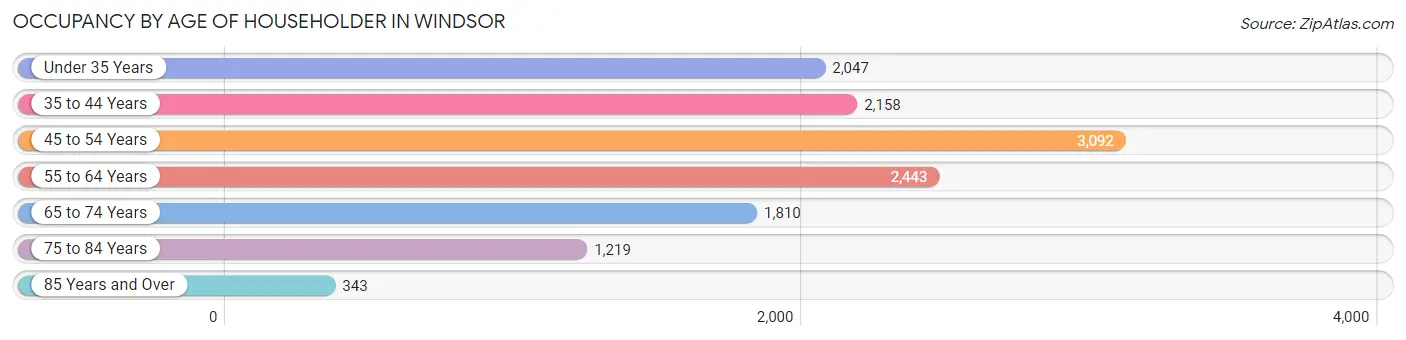
| Age Bracket | # Households | % Households |
| Under 35 Years | 2,047 | 15.6% |
| 35 to 44 Years | 2,158 | 16.5% |
| 45 to 54 Years | 3,092 | 23.6% |
| 55 to 64 Years | 2,443 | 18.6% |
| 65 to 74 Years | 1,810 | 13.8% |
| 75 to 84 Years | 1,219 | 9.3% |
| 85 Years and Over | 343 | 2.6% |
| Total | 13,112 | 100.0% |
Housing Finances in Windsor
Median Income by Occupancy in Windsor
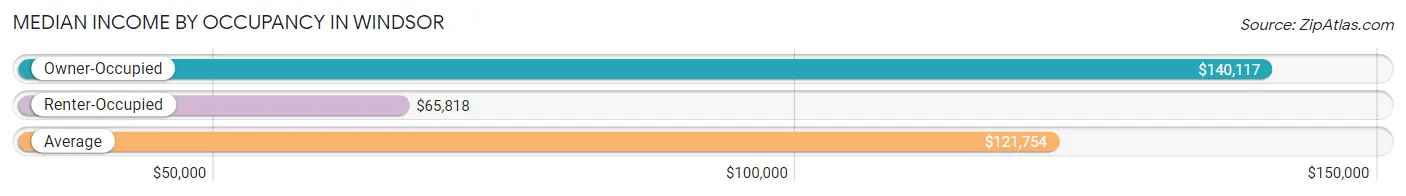
| Occupancy Type | # Households | Median Income |
| Owner-Occupied | 10,297 (78.5%) | $140,117 |
| Renter-Occupied | 2,815 (21.5%) | $65,818 |
| Average | 13,112 (100.0%) | $121,754 |
Occupancy by Householder Income Bracket in Windsor
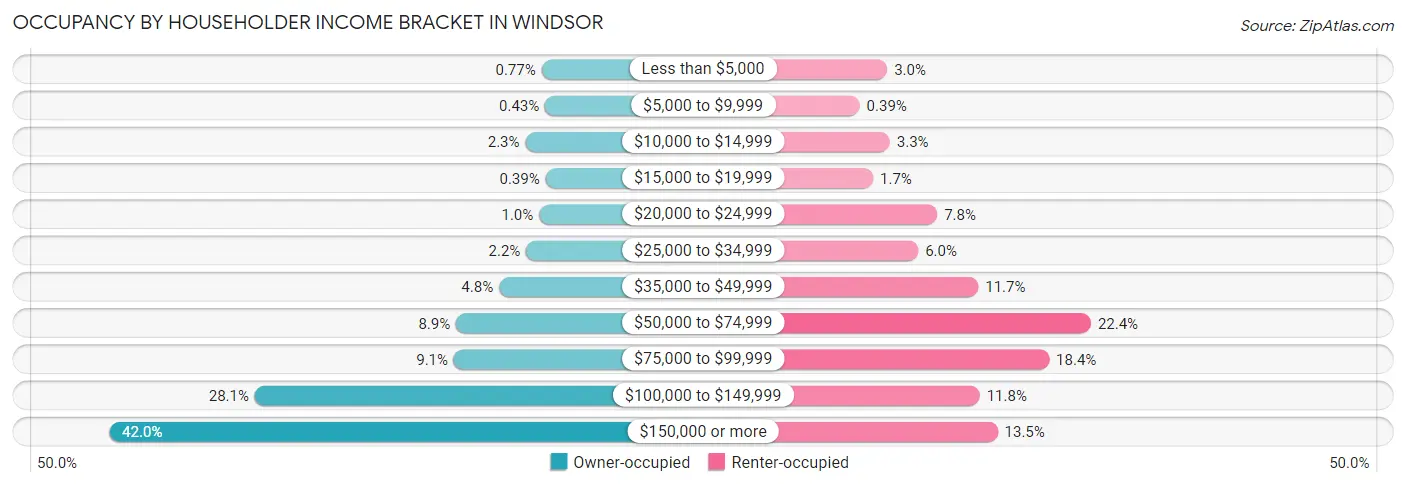
| Income Bracket | Owner-occupied | Renter-occupied |
| Less than $5,000 | 79 (0.8%) | 85 (3.0%) |
| $5,000 to $9,999 | 44 (0.4%) | 11 (0.4%) |
| $10,000 to $14,999 | 238 (2.3%) | 92 (3.3%) |
| $15,000 to $19,999 | 40 (0.4%) | 47 (1.7%) |
| $20,000 to $24,999 | 103 (1.0%) | 219 (7.8%) |
| $25,000 to $34,999 | 230 (2.2%) | 168 (6.0%) |
| $35,000 to $49,999 | 496 (4.8%) | 329 (11.7%) |
| $50,000 to $74,999 | 917 (8.9%) | 631 (22.4%) |
| $75,000 to $99,999 | 939 (9.1%) | 519 (18.4%) |
| $100,000 to $149,999 | 2,891 (28.1%) | 333 (11.8%) |
| $150,000 or more | 4,320 (41.9%) | 381 (13.5%) |
| Total | 10,297 (100.0%) | 2,815 (100.0%) |
Monthly Housing Cost Tiers in Windsor
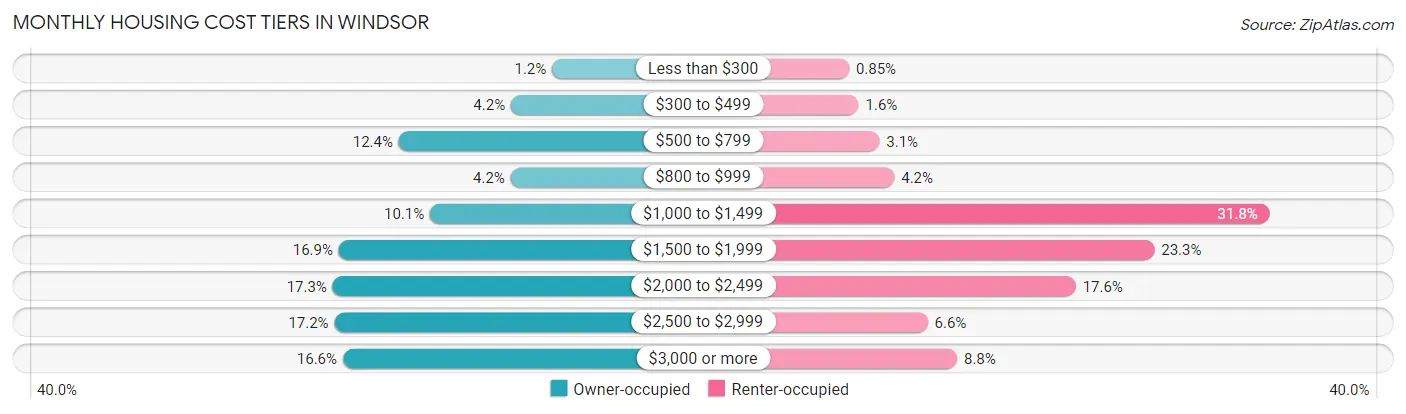
| Monthly Cost | Owner-occupied | Renter-occupied |
| Less than $300 | 118 (1.1%) | 24 (0.9%) |
| $300 to $499 | 430 (4.2%) | 44 (1.6%) |
| $500 to $799 | 1,281 (12.4%) | 87 (3.1%) |
| $800 to $999 | 432 (4.2%) | 118 (4.2%) |
| $1,000 to $1,499 | 1,044 (10.1%) | 896 (31.8%) |
| $1,500 to $1,999 | 1,736 (16.9%) | 657 (23.3%) |
| $2,000 to $2,499 | 1,782 (17.3%) | 494 (17.5%) |
| $2,500 to $2,999 | 1,769 (17.2%) | 187 (6.6%) |
| $3,000 or more | 1,705 (16.6%) | 248 (8.8%) |
| Total | 10,297 (100.0%) | 2,815 (100.0%) |
Physical Housing Characteristics in Windsor
Housing Structures in Windsor
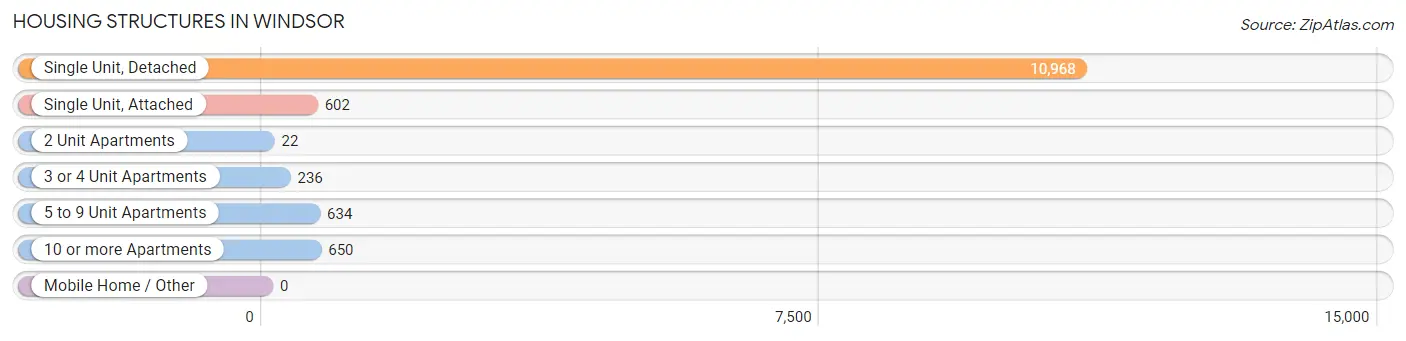
| Structure Type | # Housing Units | % Housing Units |
| Single Unit, Detached | 10,968 | 83.7% |
| Single Unit, Attached | 602 | 4.6% |
| 2 Unit Apartments | 22 | 0.2% |
| 3 or 4 Unit Apartments | 236 | 1.8% |
| 5 to 9 Unit Apartments | 634 | 4.8% |
| 10 or more Apartments | 650 | 5.0% |
| Mobile Home / Other | 0 | 0.0% |
| Total | 13,112 | 100.0% |
Housing Structures by Occupancy in Windsor
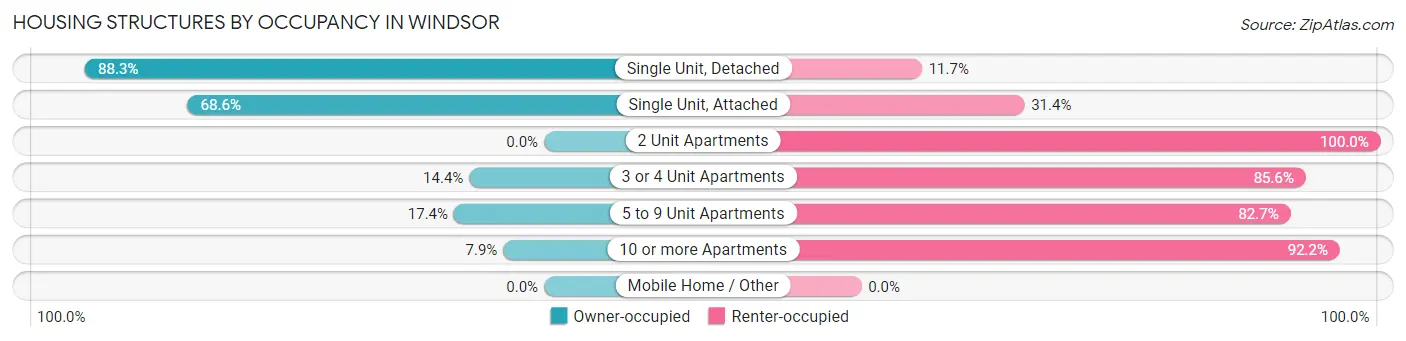
| Structure Type | Owner-occupied | Renter-occupied |
| Single Unit, Detached | 9,689 (88.3%) | 1,279 (11.7%) |
| Single Unit, Attached | 413 (68.6%) | 189 (31.4%) |
| 2 Unit Apartments | 0 (0.0%) | 22 (100.0%) |
| 3 or 4 Unit Apartments | 34 (14.4%) | 202 (85.6%) |
| 5 to 9 Unit Apartments | 110 (17.3%) | 524 (82.7%) |
| 10 or more Apartments | 51 (7.9%) | 599 (92.1%) |
| Mobile Home / Other | 0 (0.0%) | 0 (0.0%) |
| Total | 10,297 (78.5%) | 2,815 (21.5%) |
Housing Structures by Number of Rooms in Windsor
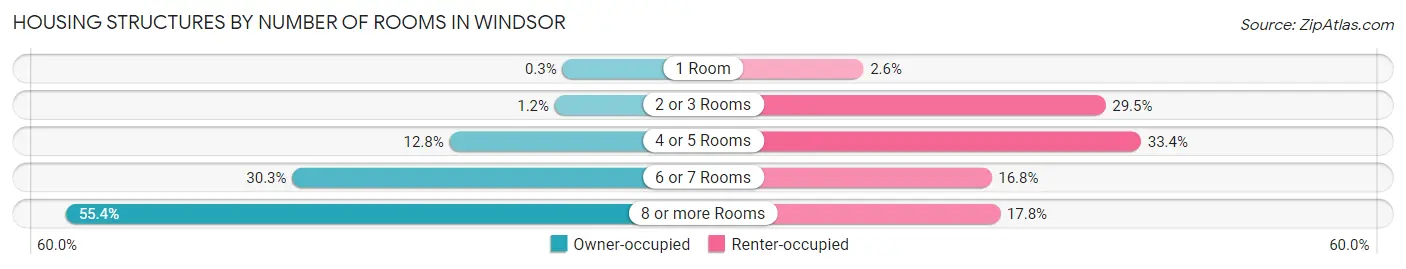
| Number of Rooms | Owner-occupied | Renter-occupied |
| 1 Room | 31 (0.3%) | 73 (2.6%) |
| 2 or 3 Rooms | 118 (1.1%) | 829 (29.4%) |
| 4 or 5 Rooms | 1,322 (12.8%) | 940 (33.4%) |
| 6 or 7 Rooms | 3,118 (30.3%) | 473 (16.8%) |
| 8 or more Rooms | 5,708 (55.4%) | 500 (17.8%) |
| Total | 10,297 (100.0%) | 2,815 (100.0%) |
Housing Structure by Heating Type in Windsor
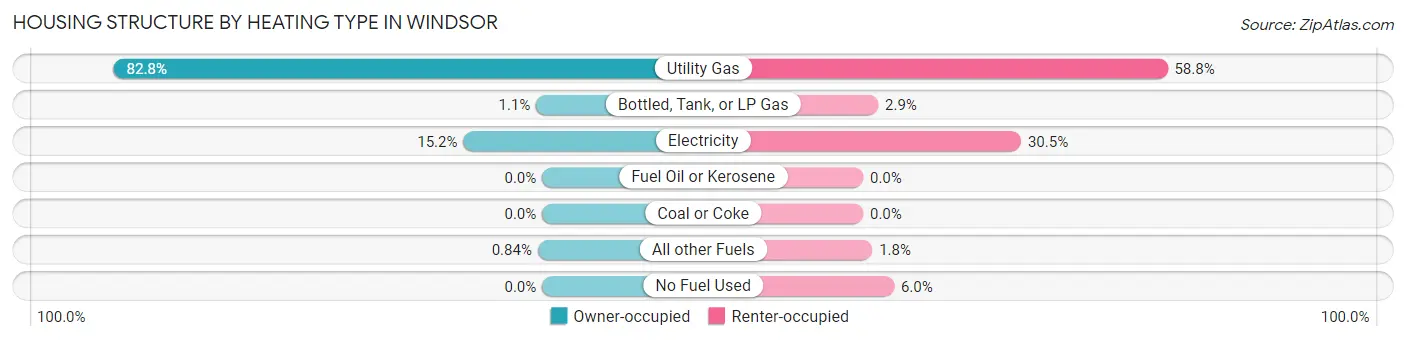
| Heating Type | Owner-occupied | Renter-occupied |
| Utility Gas | 8,525 (82.8%) | 1,656 (58.8%) |
| Bottled, Tank, or LP Gas | 117 (1.1%) | 82 (2.9%) |
| Electricity | 1,568 (15.2%) | 859 (30.5%) |
| Fuel Oil or Kerosene | 0 (0.0%) | 0 (0.0%) |
| Coal or Coke | 0 (0.0%) | 0 (0.0%) |
| All other Fuels | 87 (0.8%) | 50 (1.8%) |
| No Fuel Used | 0 (0.0%) | 168 (6.0%) |
| Total | 10,297 (100.0%) | 2,815 (100.0%) |
Household Vehicle Usage in Windsor
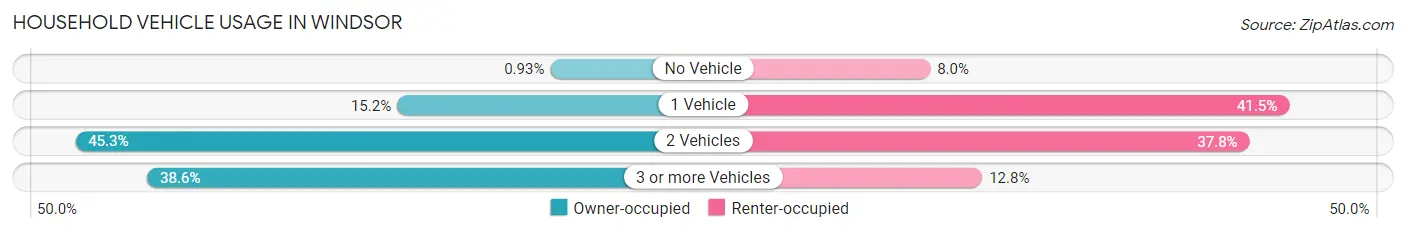
| Vehicles per Household | Owner-occupied | Renter-occupied |
| No Vehicle | 96 (0.9%) | 224 (8.0%) |
| 1 Vehicle | 1,569 (15.2%) | 1,167 (41.5%) |
| 2 Vehicles | 4,661 (45.3%) | 1,063 (37.8%) |
| 3 or more Vehicles | 3,971 (38.6%) | 361 (12.8%) |
| Total | 10,297 (100.0%) | 2,815 (100.0%) |
Real Estate & Mortgages in Windsor
Real Estate and Mortgage Overview in Windsor
| Characteristic | Without Mortgage | With Mortgage |
| Housing Units | 2,223 | 8,074 |
| Median Property Value | $563,900 | $524,200 |
| Median Household Income | $142,404 | $3,520 |
| Monthly Housing Costs | $707 | $1,705 |
| Real Estate Taxes | $3,680 | $84 |
Property Value by Mortgage Status in Windsor
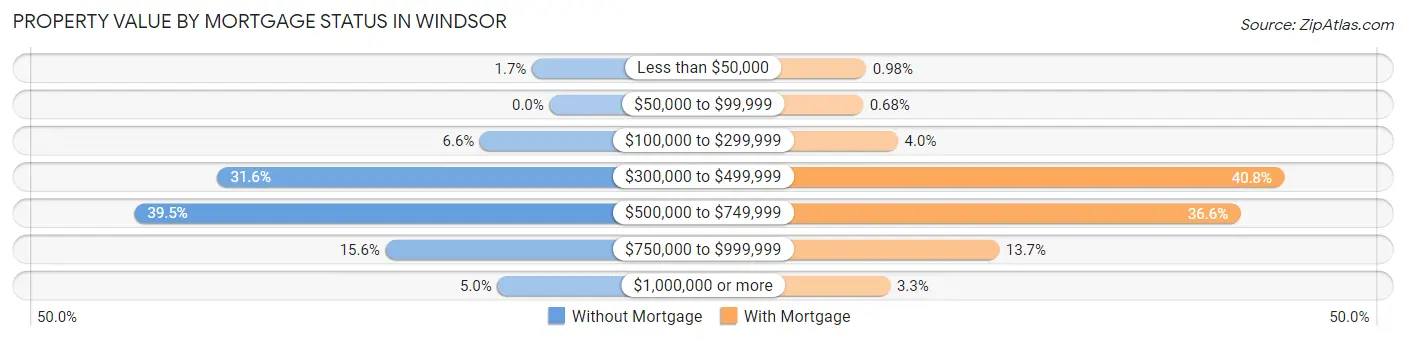
| Property Value | Without Mortgage | With Mortgage |
| Less than $50,000 | 37 (1.7%) | 79 (1.0%) |
| $50,000 to $99,999 | 0 (0.0%) | 55 (0.7%) |
| $100,000 to $299,999 | 147 (6.6%) | 324 (4.0%) |
| $300,000 to $499,999 | 703 (31.6%) | 3,293 (40.8%) |
| $500,000 to $749,999 | 879 (39.5%) | 2,956 (36.6%) |
| $750,000 to $999,999 | 347 (15.6%) | 1,102 (13.7%) |
| $1,000,000 or more | 110 (5.0%) | 265 (3.3%) |
| Total | 2,223 (100.0%) | 8,074 (100.0%) |
Household Income by Mortgage Status in Windsor
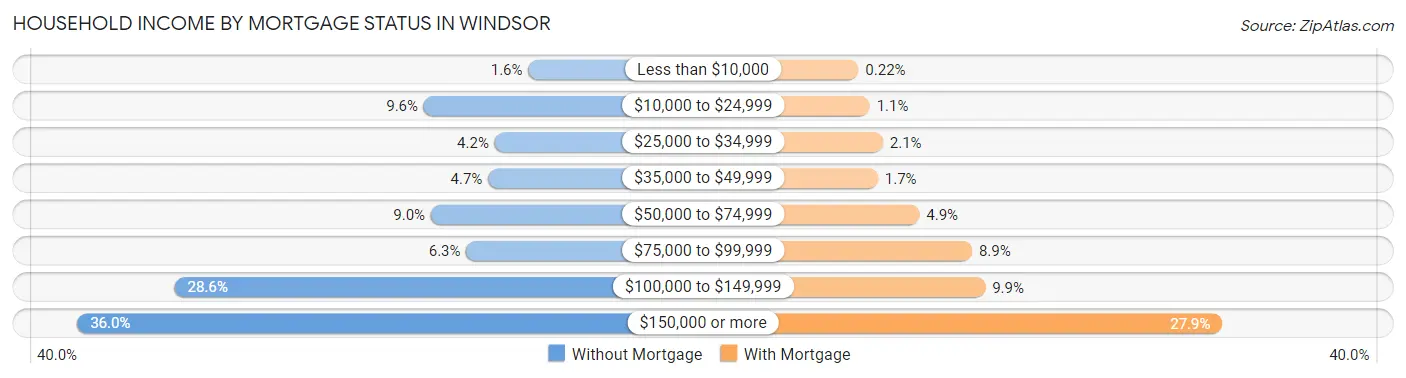
| Household Income | Without Mortgage | With Mortgage |
| Less than $10,000 | 36 (1.6%) | 18 (0.2%) |
| $10,000 to $24,999 | 213 (9.6%) | 87 (1.1%) |
| $25,000 to $34,999 | 93 (4.2%) | 168 (2.1%) |
| $35,000 to $49,999 | 104 (4.7%) | 137 (1.7%) |
| $50,000 to $74,999 | 201 (9.0%) | 392 (4.9%) |
| $75,000 to $99,999 | 141 (6.3%) | 716 (8.9%) |
| $100,000 to $149,999 | 635 (28.6%) | 798 (9.9%) |
| $150,000 or more | 800 (36.0%) | 2,256 (27.9%) |
| Total | 2,223 (100.0%) | 8,074 (100.0%) |
Property Value to Household Income Ratio in Windsor
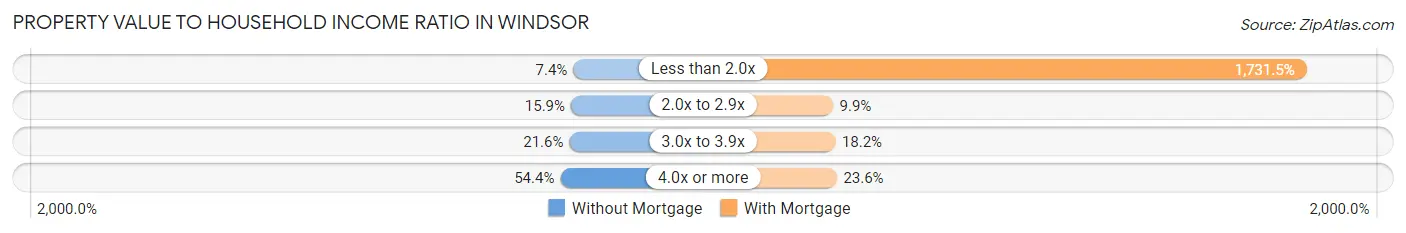
| Value-to-Income Ratio | Without Mortgage | With Mortgage |
| Less than 2.0x | 164 (7.4%) | 139,803 (1,731.5%) |
| 2.0x to 2.9x | 354 (15.9%) | 795 (9.9%) |
| 3.0x to 3.9x | 481 (21.6%) | 1,468 (18.2%) |
| 4.0x or more | 1,210 (54.4%) | 1,908 (23.6%) |
| Total | 2,223 (100.0%) | 8,074 (100.0%) |
Real Estate Taxes by Mortgage Status in Windsor
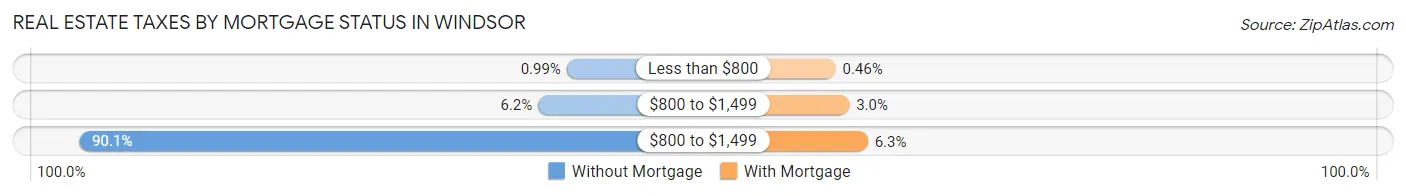
| Property Taxes | Without Mortgage | With Mortgage |
| Less than $800 | 22 (1.0%) | 37 (0.5%) |
| $800 to $1,499 | 138 (6.2%) | 238 (2.9%) |
| $800 to $1,499 | 2,002 (90.1%) | 511 (6.3%) |
| Total | 2,223 (100.0%) | 8,074 (100.0%) |
Health & Disability in Windsor
Health Insurance Coverage by Age in Windsor
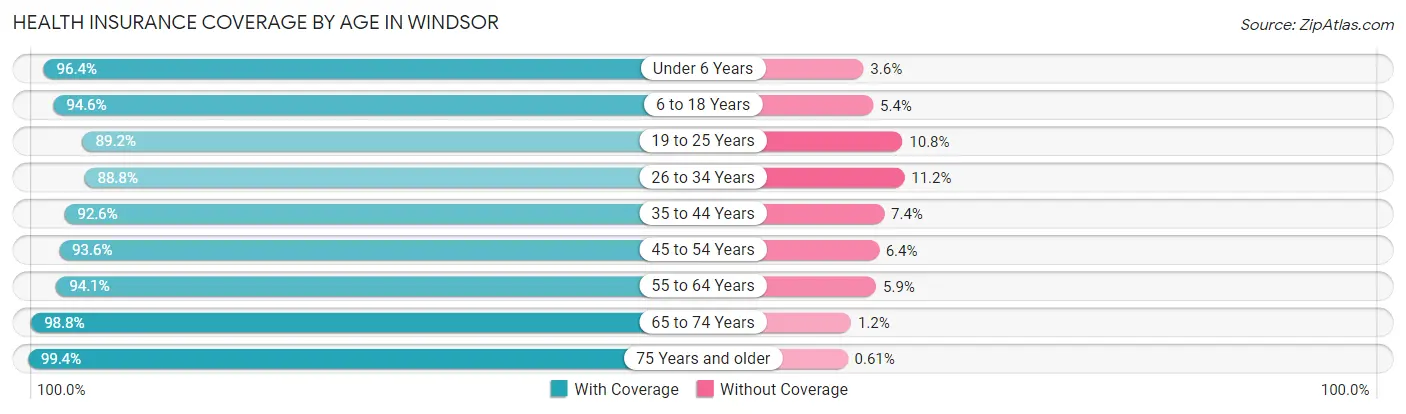
| Age Bracket | With Coverage | Without Coverage |
| Under 6 Years | 1,817 (96.4%) | 67 (3.6%) |
| 6 to 18 Years | 6,293 (94.6%) | 357 (5.4%) |
| 19 to 25 Years | 1,458 (89.2%) | 177 (10.8%) |
| 26 to 34 Years | 3,524 (88.8%) | 444 (11.2%) |
| 35 to 44 Years | 4,191 (92.6%) | 336 (7.4%) |
| 45 to 54 Years | 4,822 (93.6%) | 331 (6.4%) |
| 55 to 64 Years | 4,011 (94.1%) | 253 (5.9%) |
| 65 to 74 Years | 3,031 (98.8%) | 38 (1.2%) |
| 75 Years and older | 2,604 (99.4%) | 16 (0.6%) |
| Total | 31,751 (94.0%) | 2,019 (6.0%) |
Health Insurance Coverage by Citizenship Status in Windsor
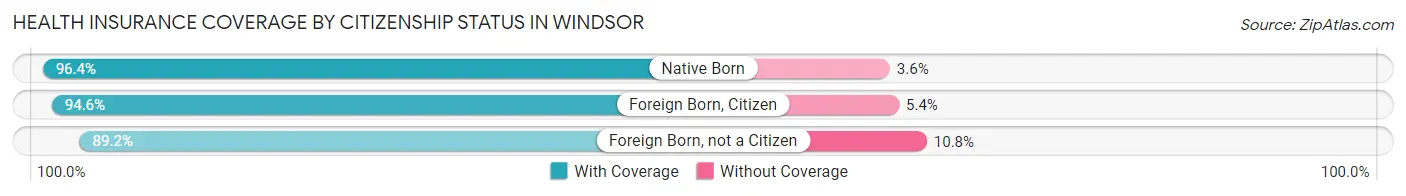
| Citizenship Status | With Coverage | Without Coverage |
| Native Born | 1,817 (96.4%) | 67 (3.6%) |
| Foreign Born, Citizen | 6,293 (94.6%) | 357 (5.4%) |
| Foreign Born, not a Citizen | 1,458 (89.2%) | 177 (10.8%) |
Health Insurance Coverage by Household Income in Windsor
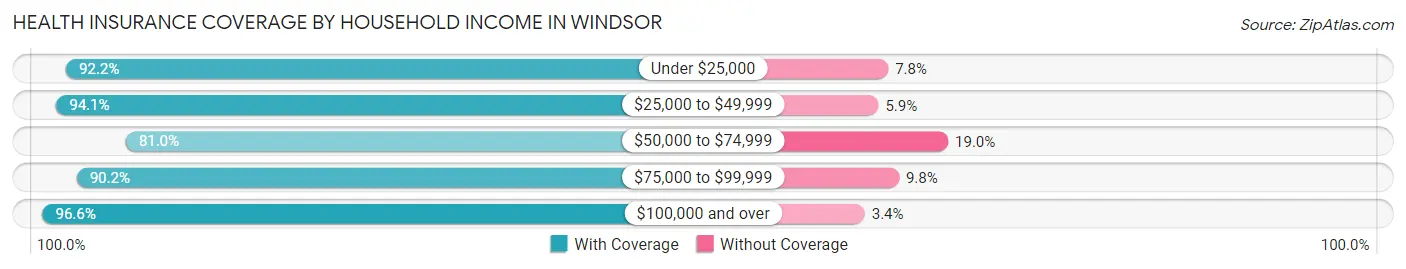
| Household Income | With Coverage | Without Coverage |
| Under $25,000 | 1,284 (92.2%) | 108 (7.8%) |
| $25,000 to $49,999 | 2,122 (94.1%) | 134 (5.9%) |
| $50,000 to $74,999 | 2,788 (81.0%) | 653 (19.0%) |
| $75,000 to $99,999 | 3,121 (90.2%) | 338 (9.8%) |
| $100,000 and over | 22,408 (96.6%) | 781 (3.4%) |
Public vs Private Health Insurance Coverage by Age in Windsor
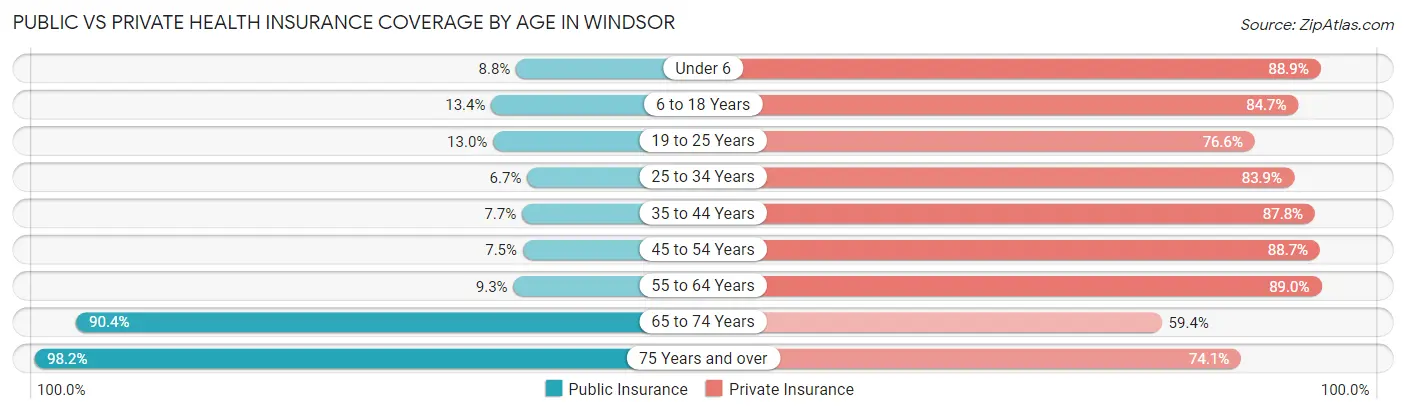
| Age Bracket | Public Insurance | Private Insurance |
| Under 6 | 165 (8.8%) | 1,674 (88.8%) |
| 6 to 18 Years | 889 (13.4%) | 5,634 (84.7%) |
| 19 to 25 Years | 213 (13.0%) | 1,253 (76.6%) |
| 25 to 34 Years | 266 (6.7%) | 3,329 (83.9%) |
| 35 to 44 Years | 347 (7.7%) | 3,975 (87.8%) |
| 45 to 54 Years | 387 (7.5%) | 4,573 (88.7%) |
| 55 to 64 Years | 395 (9.3%) | 3,794 (89.0%) |
| 65 to 74 Years | 2,775 (90.4%) | 1,822 (59.4%) |
| 75 Years and over | 2,574 (98.2%) | 1,942 (74.1%) |
| Total | 8,011 (23.7%) | 27,996 (82.9%) |
Disability Status by Sex by Age in Windsor
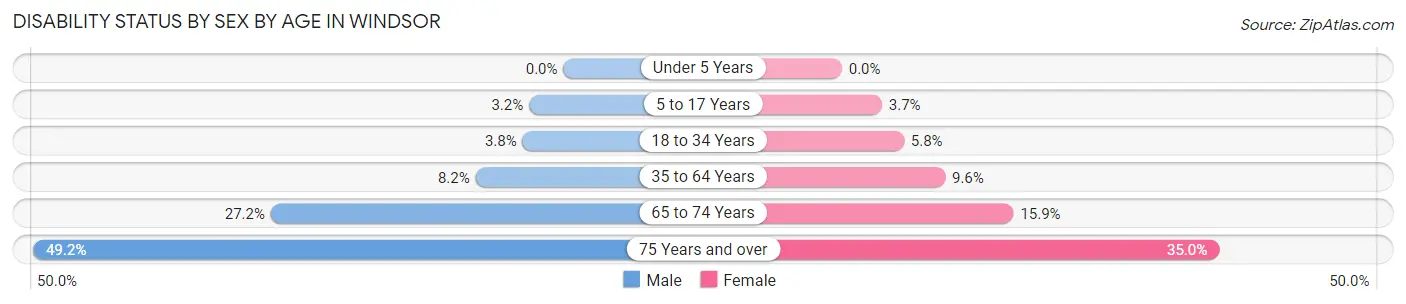
| Age Bracket | Male | Female |
| Under 5 Years | 0 (0.0%) | 0 (0.0%) |
| 5 to 17 Years | 117 (3.2%) | 116 (3.7%) |
| 18 to 34 Years | 124 (3.8%) | 153 (5.8%) |
| 35 to 64 Years | 561 (8.2%) | 676 (9.6%) |
| 65 to 74 Years | 436 (27.2%) | 233 (15.9%) |
| 75 Years and over | 536 (49.2%) | 536 (35.0%) |
Disability Class by Sex by Age in Windsor
Disability Class: Hearing Difficulty
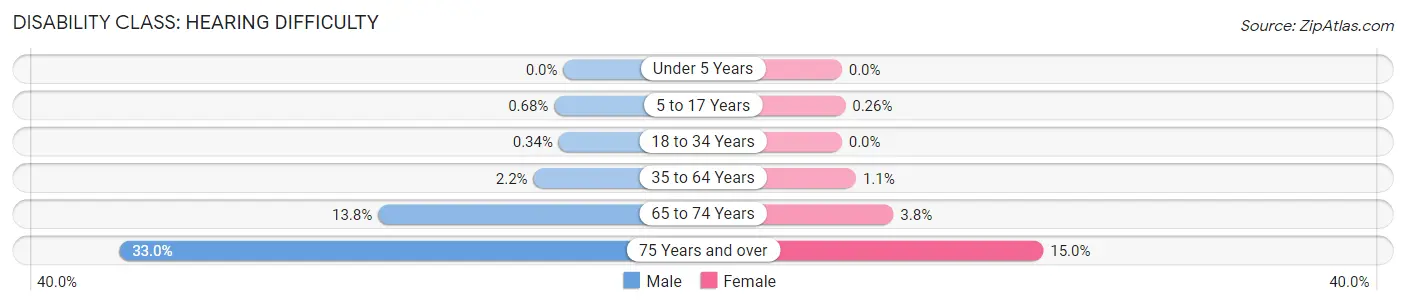
| Age Bracket | Male | Female |
| Under 5 Years | 0 (0.0%) | 0 (0.0%) |
| 5 to 17 Years | 25 (0.7%) | 8 (0.3%) |
| 18 to 34 Years | 11 (0.3%) | 0 (0.0%) |
| 35 to 64 Years | 153 (2.2%) | 74 (1.1%) |
| 65 to 74 Years | 221 (13.8%) | 56 (3.8%) |
| 75 Years and over | 359 (33.0%) | 229 (15.0%) |
Disability Class: Vision Difficulty
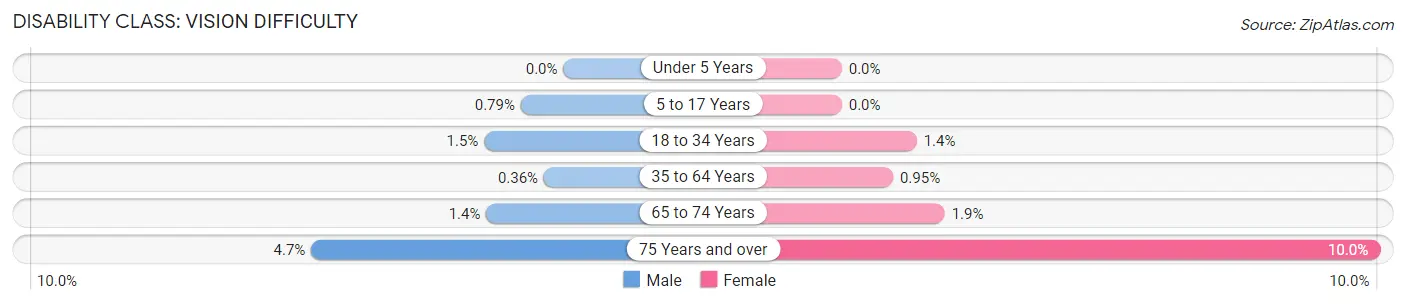
| Age Bracket | Male | Female |
| Under 5 Years | 0 (0.0%) | 0 (0.0%) |
| 5 to 17 Years | 29 (0.8%) | 0 (0.0%) |
| 18 to 34 Years | 48 (1.5%) | 37 (1.4%) |
| 35 to 64 Years | 25 (0.4%) | 67 (0.9%) |
| 65 to 74 Years | 23 (1.4%) | 28 (1.9%) |
| 75 Years and over | 51 (4.7%) | 153 (10.0%) |
Disability Class: Cognitive Difficulty
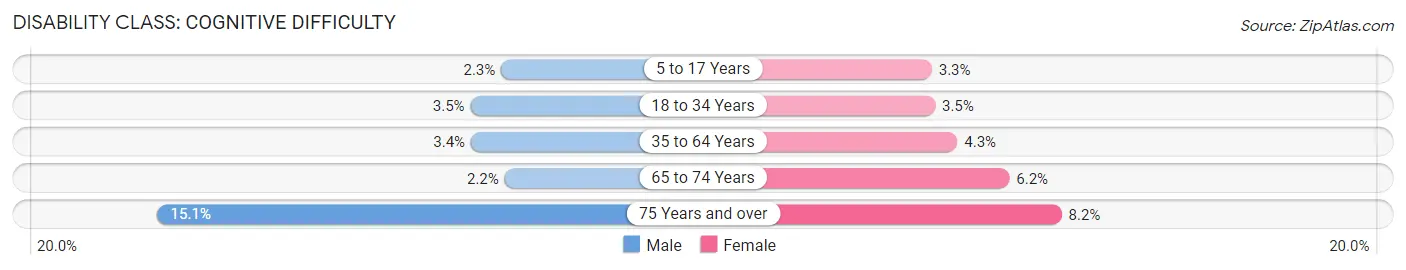
| Age Bracket | Male | Female |
| 5 to 17 Years | 85 (2.3%) | 104 (3.3%) |
| 18 to 34 Years | 113 (3.5%) | 92 (3.5%) |
| 35 to 64 Years | 236 (3.4%) | 303 (4.3%) |
| 65 to 74 Years | 35 (2.2%) | 91 (6.2%) |
| 75 Years and over | 164 (15.1%) | 125 (8.2%) |
Disability Class: Ambulatory Difficulty
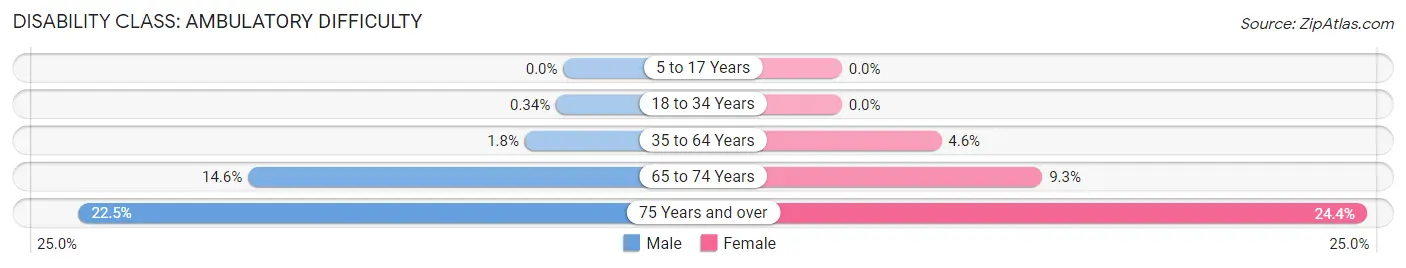
| Age Bracket | Male | Female |
| 5 to 17 Years | 0 (0.0%) | 0 (0.0%) |
| 18 to 34 Years | 11 (0.3%) | 0 (0.0%) |
| 35 to 64 Years | 123 (1.8%) | 326 (4.6%) |
| 65 to 74 Years | 235 (14.6%) | 136 (9.3%) |
| 75 Years and over | 245 (22.5%) | 373 (24.4%) |
Disability Class: Self-Care Difficulty
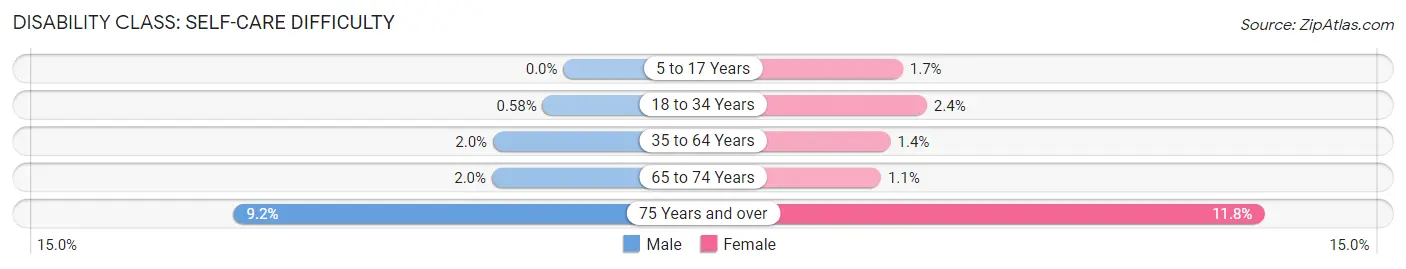
| Age Bracket | Male | Female |
| 5 to 17 Years | 0 (0.0%) | 53 (1.7%) |
| 18 to 34 Years | 19 (0.6%) | 63 (2.4%) |
| 35 to 64 Years | 135 (2.0%) | 96 (1.4%) |
| 65 to 74 Years | 32 (2.0%) | 16 (1.1%) |
| 75 Years and over | 100 (9.2%) | 180 (11.8%) |
Technology Access in Windsor
Computing Device Access in Windsor
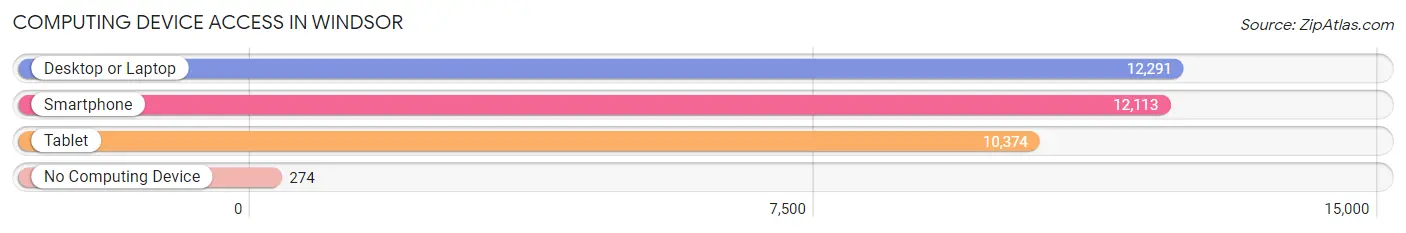
| Device Type | # Households | % Households |
| Desktop or Laptop | 12,291 | 93.7% |
| Smartphone | 12,113 | 92.4% |
| Tablet | 10,374 | 79.1% |
| No Computing Device | 274 | 2.1% |
| Total | 13,112 | 100.0% |
Internet Access in Windsor
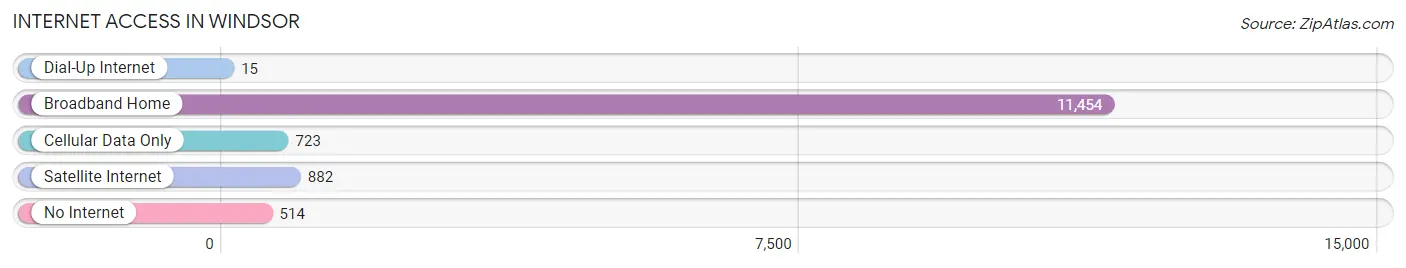
| Internet Type | # Households | % Households |
| Dial-Up Internet | 15 | 0.1% |
| Broadband Home | 11,454 | 87.4% |
| Cellular Data Only | 723 | 5.5% |
| Satellite Internet | 882 | 6.7% |
| No Internet | 514 | 3.9% |
| Total | 13,112 | 100.0% |
Windsor Summary
Windsor, Colorado is a small town located in the northern part of the state, just south of Fort Collins. It is a part of Weld County and is situated along the Cache la Poudre River. The town was founded in 1882 and has a population of approximately 25,000 people.
History
Windsor was founded in 1882 by a group of settlers from the Midwest. The town was named after the town of Windsor, England, and was originally intended to be a farming community. The town was incorporated in 1890 and quickly grew to become a thriving agricultural center. The town was also home to a number of businesses, including a flour mill, a creamery, and a brickyard.
In the early 1900s, Windsor experienced a period of growth and development. The town was connected to the Denver and Rio Grande Railroad, which allowed for the transportation of goods and people. The town also saw the construction of a number of new buildings, including a school, a library, and a hospital.
Geography
Windsor is located in the northern part of Colorado, just south of Fort Collins. It is situated along the Cache la Poudre River and is surrounded by rolling hills and plains. The town is located at an elevation of 5,000 feet and has a semi-arid climate.
Economy
Windsor’s economy is largely based on agriculture and tourism. The town is home to a number of farms and ranches, which produce a variety of crops, including corn, wheat, and hay. The town is also home to a number of wineries and breweries, which attract tourists from all over the state.
In addition to agriculture and tourism, Windsor is also home to a number of businesses, including manufacturing, retail, and healthcare. The town is also home to a number of technology companies, which have helped to diversify the local economy.
Demographics
As of the 2010 census, Windsor had a population of 25,000 people. The town is predominantly white, with a small Hispanic population. The median household income is $60,000, and the median home value is $250,000. The town has a low unemployment rate and a high rate of homeownership.
Windsor is a small town with a rich history and a vibrant economy. The town is home to a number of businesses, farms, and wineries, which attract tourists from all over the state. The town is also home to a diverse population, with a median household income of $60,000 and a median home value of $250,000.
Common Questions
What is Per Capita Income in Windsor?
Per Capita income in Windsor is $53,722.
What is the Median Family Income in Windsor?
Median Family Income in Windsor is $142,143.
What is the Median Household income in Windsor?
Median Household Income in Windsor is $121,754.
What is Income or Wage Gap in Windsor?
Income or Wage Gap in Windsor is 38.7%.
Women in Windsor earn 61.3 cents for every dollar earned by a man.
What is Family Income Deficit in Windsor?
Family Income Deficit in Windsor is $8,053.
Families that are below poverty line in Windsor earn $8,053 less on average than the poverty threshold level.
What is Inequality or Gini Index in Windsor?
Inequality or Gini Index in Windsor is 0.38.
What is the Total Population of Windsor?
Total Population of Windsor is 33,905.
What is the Total Male Population of Windsor?
Total Male Population of Windsor is 17,390.
What is the Total Female Population of Windsor?
Total Female Population of Windsor is 16,515.
What is the Ratio of Males per 100 Females in Windsor?
There are 105.30 Males per 100 Females in Windsor.
What is the Ratio of Females per 100 Males in Windsor?
There are 94.97 Females per 100 Males in Windsor.
What is the Median Population Age in Windsor?
Median Population Age in Windsor is 41.3 Years.
What is the Average Family Size in Windsor
Average Family Size in Windsor is 2.9 People.
What is the Average Household Size in Windsor
Average Household Size in Windsor is 2.6 People.
How Large is the Labor Force in Windsor?
There are 18,210 People in the Labor Forcein in Windsor.
What is the Percentage of People in the Labor Force in Windsor?
68.3% of People are in the Labor Force in Windsor.
What is the Unemployment Rate in Windsor?
Unemployment Rate in Windsor is 4.9%.