Wiggins, CO Map & Demographics
Wiggins Map
Wiggins Overview
$27,548
PER CAPITA INCOME
$81,094
AVG FAMILY INCOME
$77,083
AVG HOUSEHOLD INCOME
54.2%
WAGE / INCOME GAP [ % ]
45.8¢/ $1
WAGE / INCOME GAP [ $ ]
0.32
INEQUALITY / GINI INDEX
1,138
TOTAL POPULATION
533
MALE POPULATION
605
FEMALE POPULATION
88.10
MALES / 100 FEMALES
113.51
FEMALES / 100 MALES
30.4
MEDIAN AGE
3.6
AVG FAMILY SIZE
3.2
AVG HOUSEHOLD SIZE
562
LABOR FORCE [ PEOPLE ]
71.0%
PERCENT IN LABOR FORCE
7.3%
UNEMPLOYMENT RATE
Wiggins Zip Codes
Wiggins Area Codes
Income in Wiggins
Income Overview in Wiggins
Per Capita Income in Wiggins is $27,548, while median incomes of families and households are $81,094 and $77,083 respectively.
| Characteristic | Number | Measure |
| Per Capita Income | 1,138 | $27,548 |
| Median Family Income | 273 | $81,094 |
| Mean Family Income | 273 | $90,341 |
| Median Household Income | 357 | $77,083 |
| Mean Household Income | 357 | $88,377 |
| Income Deficit | 273 | $0 |
| Wage / Income Gap (%) | 1,138 | 54.15% |
| Wage / Income Gap ($) | 1,138 | 45.85¢ per $1 |
| Gini / Inequality Index | 1,138 | 0.32 |
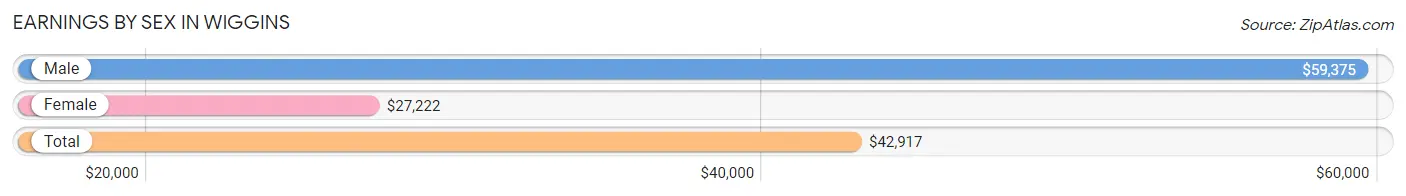
Earnings by Sex in Wiggins
Average Earnings in Wiggins are $42,917, $59,375 for men and $27,222 for women, a difference of 54.1%.
| Sex | Number | Average Earnings |
| Male | 326 (56.8%) | $59,375 |
| Female | 248 (43.2%) | $27,222 |
| Total | 574 (100.0%) | $42,917 |
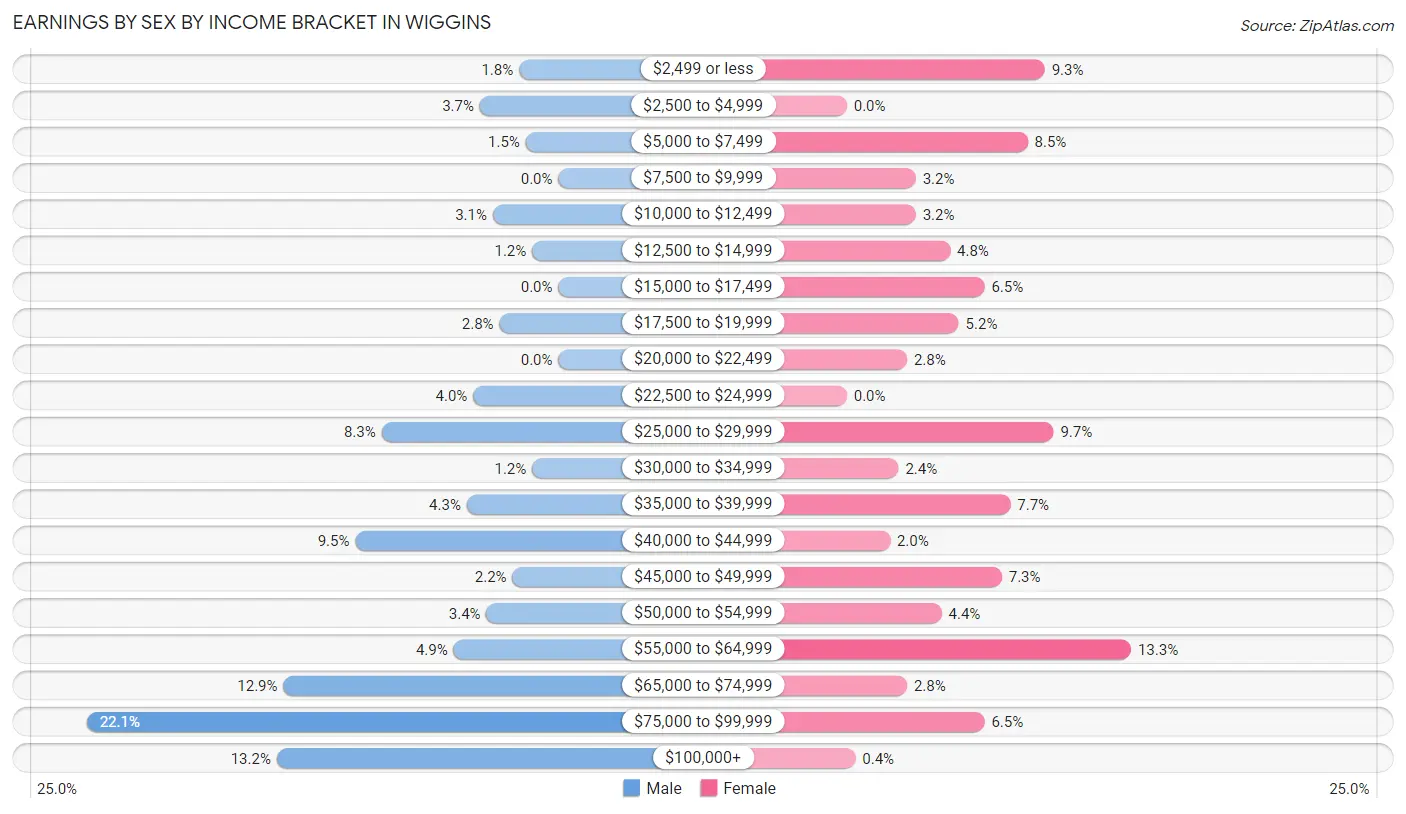
Earnings by Sex by Income Bracket in Wiggins
The most common earnings brackets in Wiggins are $75,000 to $99,999 for men (72 | 22.1%) and $55,000 to $64,999 for women (33 | 13.3%).
| Income | Male | Female |
| $2,499 or less | 6 (1.8%) | 23 (9.3%) |
| $2,500 to $4,999 | 12 (3.7%) | 0 (0.0%) |
| $5,000 to $7,499 | 5 (1.5%) | 21 (8.5%) |
| $7,500 to $9,999 | 0 (0.0%) | 8 (3.2%) |
| $10,000 to $12,499 | 10 (3.1%) | 8 (3.2%) |
| $12,500 to $14,999 | 4 (1.2%) | 12 (4.8%) |
| $15,000 to $17,499 | 0 (0.0%) | 16 (6.5%) |
| $17,500 to $19,999 | 9 (2.8%) | 13 (5.2%) |
| $20,000 to $22,499 | 0 (0.0%) | 7 (2.8%) |
| $22,500 to $24,999 | 13 (4.0%) | 0 (0.0%) |
| $25,000 to $29,999 | 27 (8.3%) | 24 (9.7%) |
| $30,000 to $34,999 | 4 (1.2%) | 6 (2.4%) |
| $35,000 to $39,999 | 14 (4.3%) | 19 (7.7%) |
| $40,000 to $44,999 | 31 (9.5%) | 5 (2.0%) |
| $45,000 to $49,999 | 7 (2.1%) | 18 (7.3%) |
| $50,000 to $54,999 | 11 (3.4%) | 11 (4.4%) |
| $55,000 to $64,999 | 16 (4.9%) | 33 (13.3%) |
| $65,000 to $74,999 | 42 (12.9%) | 7 (2.8%) |
| $75,000 to $99,999 | 72 (22.1%) | 16 (6.5%) |
| $100,000+ | 43 (13.2%) | 1 (0.4%) |
| Total | 326 (100.0%) | 248 (100.0%) |
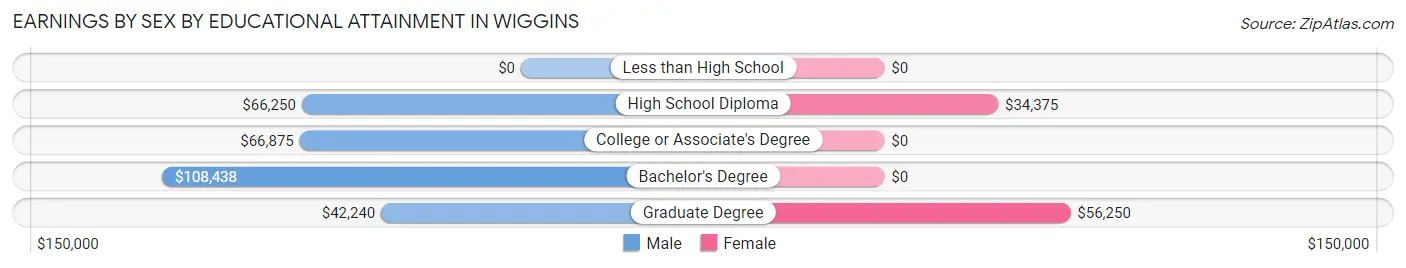
Earnings by Sex by Educational Attainment in Wiggins
Average earnings in Wiggins are $66,944 for men and $28,333 for women, a difference of 57.7%. Men with an educational attainment of bachelor's degree enjoy the highest average annual earnings of $108,438, while those with graduate degree education earn the least with $42,240. Women with an educational attainment of graduate degree earn the most with the average annual earnings of $56,250, while those with high school diploma education have the smallest earnings of $34,375.
| Educational Attainment | Male Income | Female Income |
| Less than High School | - | - |
| High School Diploma | $66,250 | $34,375 |
| College or Associate's Degree | $66,875 | $0 |
| Bachelor's Degree | $108,438 | $0 |
| Graduate Degree | $42,240 | $56,250 |
| Total | $66,944 | $28,333 |
Family Income in Wiggins
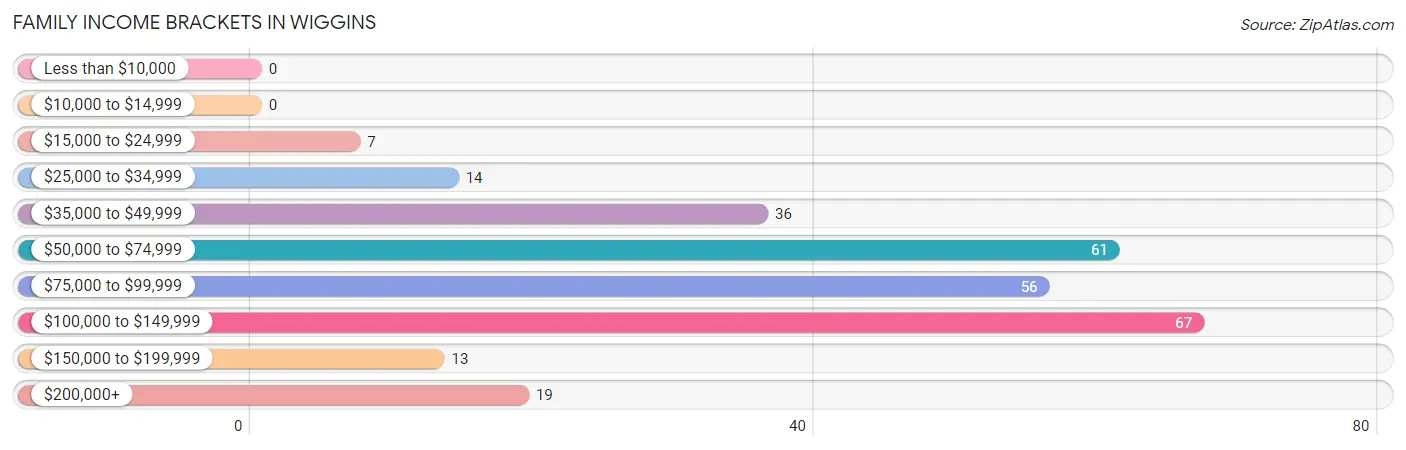
Family Income Brackets in Wiggins
According to the Wiggins family income data, there are 67 families falling into the $100,000 to $149,999 income range, which is the most common income bracket and makes up 24.5% of all families.
| Income Bracket | # Families | % Families |
| Less than $10,000 | 0 | 0.0% |
| $10,000 to $14,999 | 0 | 0.0% |
| $15,000 to $24,999 | 7 | 2.6% |
| $25,000 to $34,999 | 14 | 5.1% |
| $35,000 to $49,999 | 36 | 13.2% |
| $50,000 to $74,999 | 61 | 22.3% |
| $75,000 to $99,999 | 56 | 20.5% |
| $100,000 to $149,999 | 67 | 24.5% |
| $150,000 to $199,999 | 13 | 4.8% |
| $200,000+ | 19 | 7.0% |
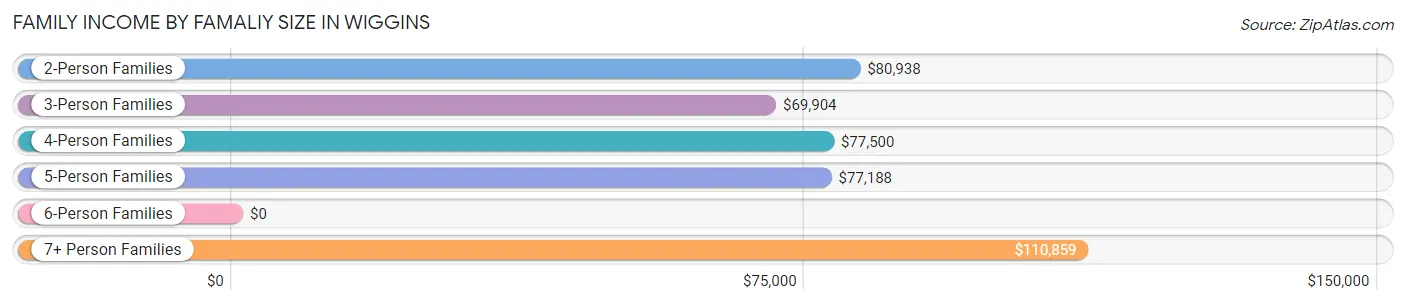
Family Income by Famaliy Size in Wiggins
7+ person families (21 | 7.7%) account for the highest median family income in Wiggins with $110,859 per family, while 2-person families (112 | 41.0%) have the highest median income of $40,469 per family member.
| Income Bracket | # Families | Median Income |
| 2-Person Families | 112 (41.0%) | $80,938 |
| 3-Person Families | 57 (20.9%) | $69,904 |
| 4-Person Families | 36 (13.2%) | $77,500 |
| 5-Person Families | 32 (11.7%) | $77,188 |
| 6-Person Families | 15 (5.5%) | $0 |
| 7+ Person Families | 21 (7.7%) | $110,859 |
| Total | 273 (100.0%) | $81,094 |
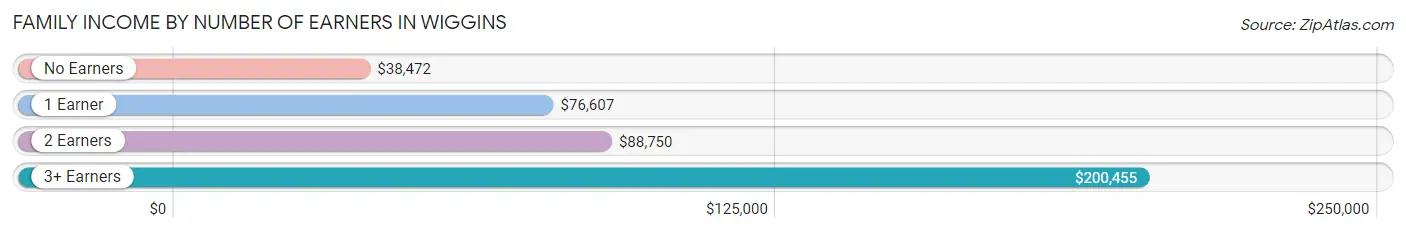
Family Income by Number of Earners in Wiggins
The median family income in Wiggins is $81,094, with families comprising 3+ earners (18) having the highest median family income of $200,455, while families with no earners (19) have the lowest median family income of $38,472, accounting for 6.6% and 7.0% of families, respectively.
| Number of Earners | # Families | Median Income |
| No Earners | 19 (7.0%) | $38,472 |
| 1 Earner | 63 (23.1%) | $76,607 |
| 2 Earners | 173 (63.4%) | $88,750 |
| 3+ Earners | 18 (6.6%) | $200,455 |
| Total | 273 (100.0%) | $81,094 |
Household Income in Wiggins
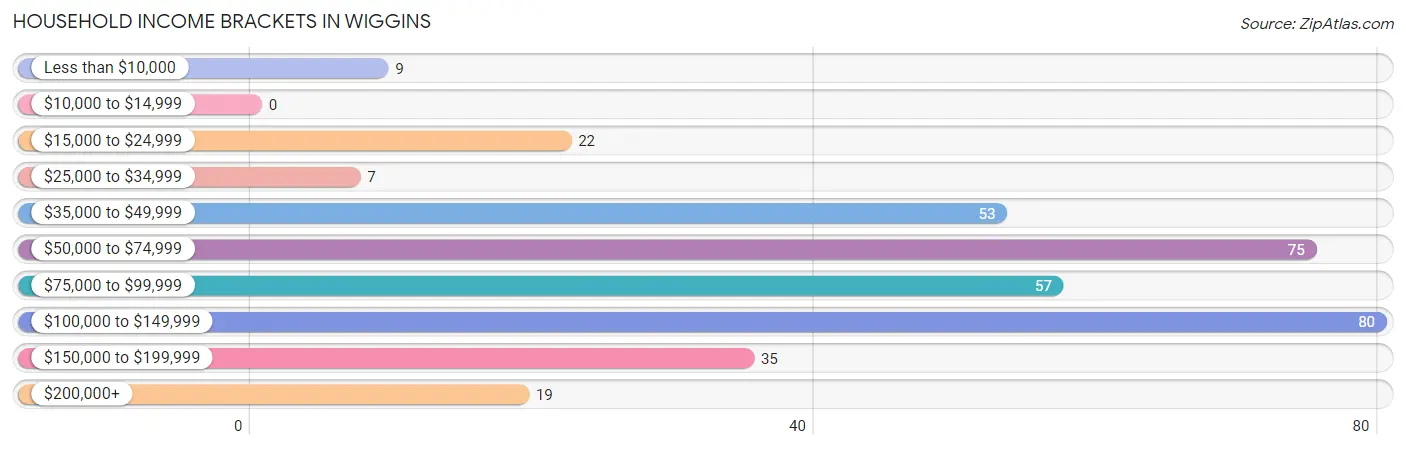
Household Income Brackets in Wiggins
With 80 households falling in the category, the $100,000 to $149,999 income range is the most frequent in Wiggins, accounting for 22.4% of all households.
| Income Bracket | # Households | % Households |
| Less than $10,000 | 9 | 2.5% |
| $10,000 to $14,999 | 0 | 0.0% |
| $15,000 to $24,999 | 22 | 6.2% |
| $25,000 to $34,999 | 7 | 2.0% |
| $35,000 to $49,999 | 53 | 14.8% |
| $50,000 to $74,999 | 75 | 21.0% |
| $75,000 to $99,999 | 57 | 16.0% |
| $100,000 to $149,999 | 80 | 22.4% |
| $150,000 to $199,999 | 35 | 9.8% |
| $200,000+ | 19 | 5.3% |
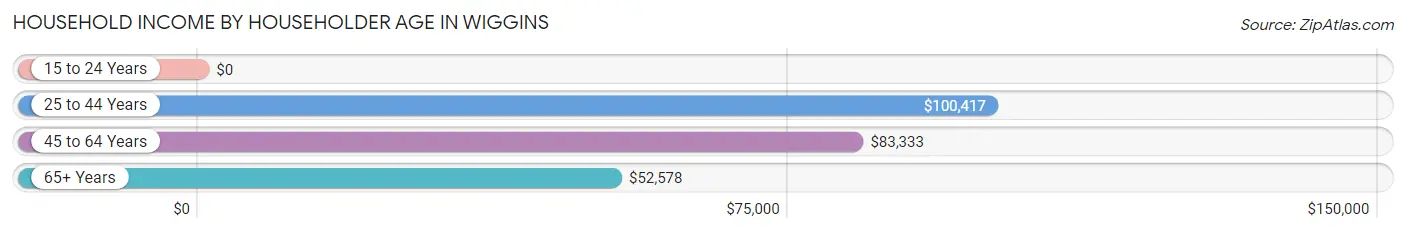
Household Income by Householder Age in Wiggins
The median household income in Wiggins is $77,083, with the highest median household income of $100,417 found in the 25 to 44 years age bracket for the primary householder. A total of 164 households (45.9%) fall into this category. Meanwhile, the 15 to 24 years age bracket for the primary householder has the lowest median household income of $0, with 16 households (4.5%) in this group.
| Income Bracket | # Households | Median Income |
| 15 to 24 Years | 16 (4.5%) | $0 |
| 25 to 44 Years | 164 (45.9%) | $100,417 |
| 45 to 64 Years | 104 (29.1%) | $83,333 |
| 65+ Years | 73 (20.4%) | $52,578 |
| Total | 357 (100.0%) | $77,083 |
Poverty in Wiggins
Income Below Poverty by Sex and Age in Wiggins
With 12.0% poverty level for males and 7.8% for females among the residents of Wiggins, 16 and 17 year old males and 45 to 54 year old females are the most vulnerable to poverty, with 12 males (57.1%) and 15 females (23.8%) in their respective age groups living below the poverty level.
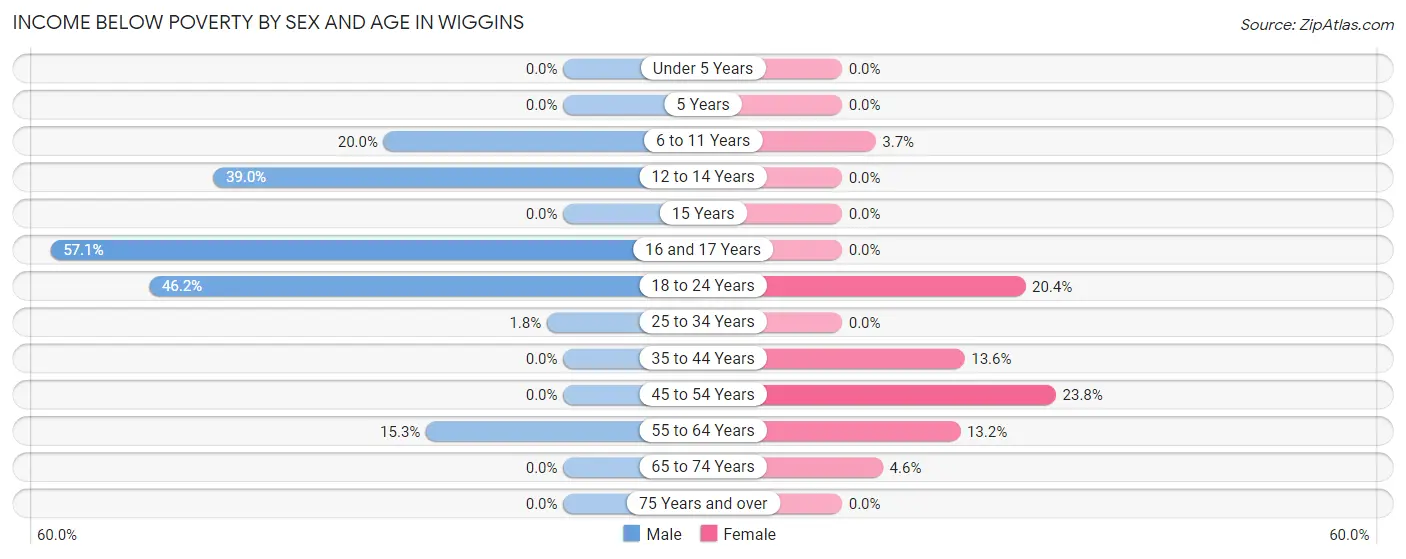
| Age Bracket | Male | Female |
| Under 5 Years | 0 (0.0%) | 0 (0.0%) |
| 5 Years | 0 (0.0%) | 0 (0.0%) |
| 6 to 11 Years | 11 (20.0%) | 4 (3.7%) |
| 12 to 14 Years | 16 (39.0%) | 0 (0.0%) |
| 15 Years | 0 (0.0%) | 0 (0.0%) |
| 16 and 17 Years | 12 (57.1%) | 0 (0.0%) |
| 18 to 24 Years | 12 (46.2%) | 10 (20.4%) |
| 25 to 34 Years | 2 (1.8%) | 0 (0.0%) |
| 35 to 44 Years | 0 (0.0%) | 6 (13.6%) |
| 45 to 54 Years | 0 (0.0%) | 15 (23.8%) |
| 55 to 64 Years | 11 (15.3%) | 10 (13.2%) |
| 65 to 74 Years | 0 (0.0%) | 2 (4.5%) |
| 75 Years and over | 0 (0.0%) | 0 (0.0%) |
| Total | 64 (12.0%) | 47 (7.8%) |
Income Above Poverty by Sex and Age in Wiggins
According to the poverty statistics in Wiggins, males aged under 5 years and females aged under 5 years are the age groups that are most secure financially, with 100.0% of males and 100.0% of females in these age groups living above the poverty line.
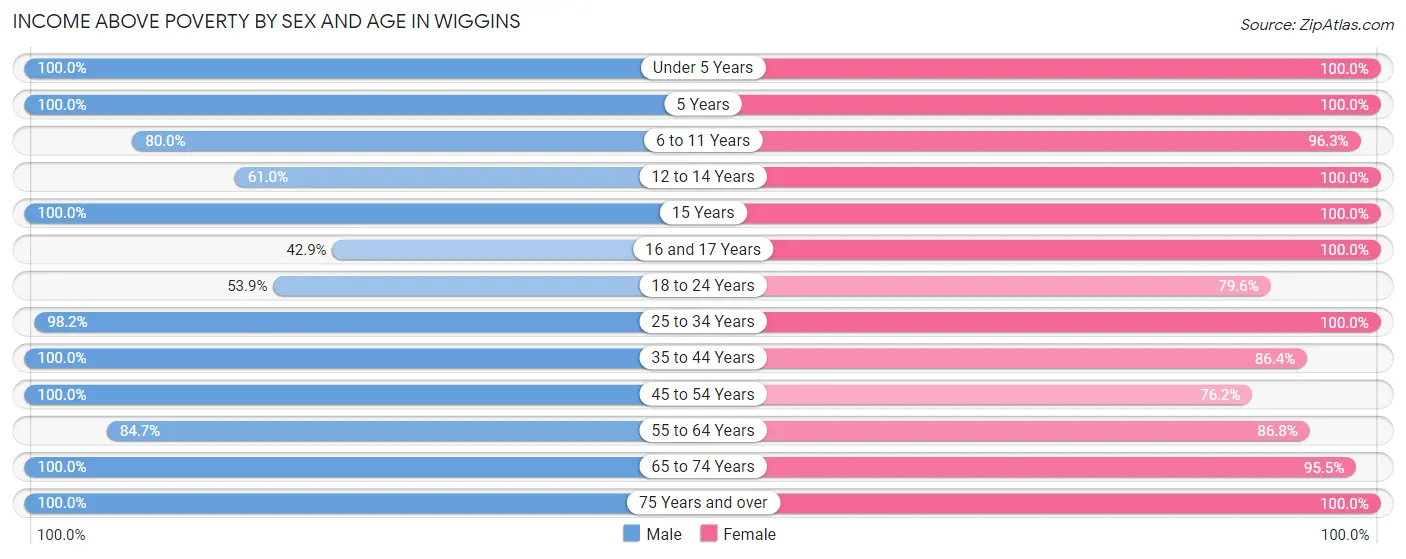
| Age Bracket | Male | Female |
| Under 5 Years | 25 (100.0%) | 49 (100.0%) |
| 5 Years | 29 (100.0%) | 4 (100.0%) |
| 6 to 11 Years | 44 (80.0%) | 103 (96.3%) |
| 12 to 14 Years | 25 (61.0%) | 20 (100.0%) |
| 15 Years | 5 (100.0%) | 12 (100.0%) |
| 16 and 17 Years | 9 (42.9%) | 15 (100.0%) |
| 18 to 24 Years | 14 (53.8%) | 39 (79.6%) |
| 25 to 34 Years | 108 (98.2%) | 106 (100.0%) |
| 35 to 44 Years | 65 (100.0%) | 38 (86.4%) |
| 45 to 54 Years | 31 (100.0%) | 48 (76.2%) |
| 55 to 64 Years | 61 (84.7%) | 66 (86.8%) |
| 65 to 74 Years | 46 (100.0%) | 42 (95.5%) |
| 75 Years and over | 7 (100.0%) | 16 (100.0%) |
| Total | 469 (88.0%) | 558 (92.2%) |
Income Below Poverty Among Married-Couple Families in Wiggins
The poverty statistics for married-couple families in Wiggins show that 5.4% or 11 of the total 205 families live below the poverty line. Families with 3 or 4 children have the highest poverty rate of 16.4%, comprising of 9 families. On the other hand, families with no children have the lowest poverty rate of 0.0%, which includes 0 families.
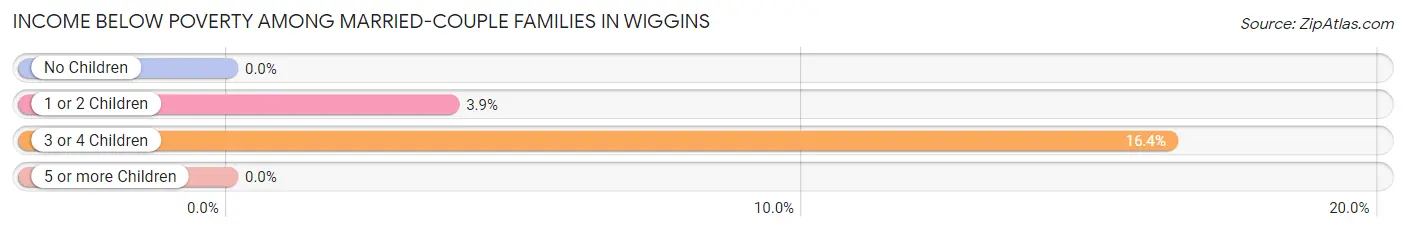
| Children | Above Poverty | Below Poverty |
| No Children | 97 (100.0%) | 0 (0.0%) |
| 1 or 2 Children | 50 (96.2%) | 2 (3.8%) |
| 3 or 4 Children | 46 (83.6%) | 9 (16.4%) |
| 5 or more Children | 1 (100.0%) | 0 (0.0%) |
| Total | 194 (94.6%) | 11 (5.4%) |
Income Below Poverty Among Single-Parent Households in Wiggins
| Children | Single Father | Single Mother |
| No Children | 0 (0.0%) | 0 (0.0%) |
| 1 or 2 Children | 0 (0.0%) | 0 (0.0%) |
| 3 or 4 Children | 0 (0.0%) | 0 (0.0%) |
| 5 or more Children | 0 (0.0%) | 0 (0.0%) |
| Total | 0 (0.0%) | 0 (0.0%) |
Income Below Poverty Among Married-Couple vs Single-Parent Households in Wiggins
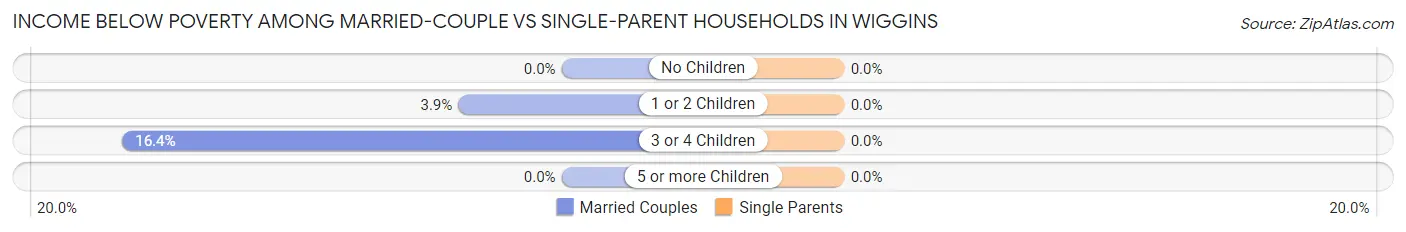
| Children | Married-Couple Families | Single-Parent Households |
| No Children | 0 (0.0%) | 0 (0.0%) |
| 1 or 2 Children | 2 (3.8%) | 0 (0.0%) |
| 3 or 4 Children | 9 (16.4%) | 0 (0.0%) |
| 5 or more Children | 0 (0.0%) | 0 (0.0%) |
| Total | 11 (5.4%) | 0 (0.0%) |
Race in Wiggins
The most populous races in Wiggins are White / Caucasian (926 | 81.4%), Hispanic or Latino (274 | 24.1%), and Two or more Races (134 | 11.8%).
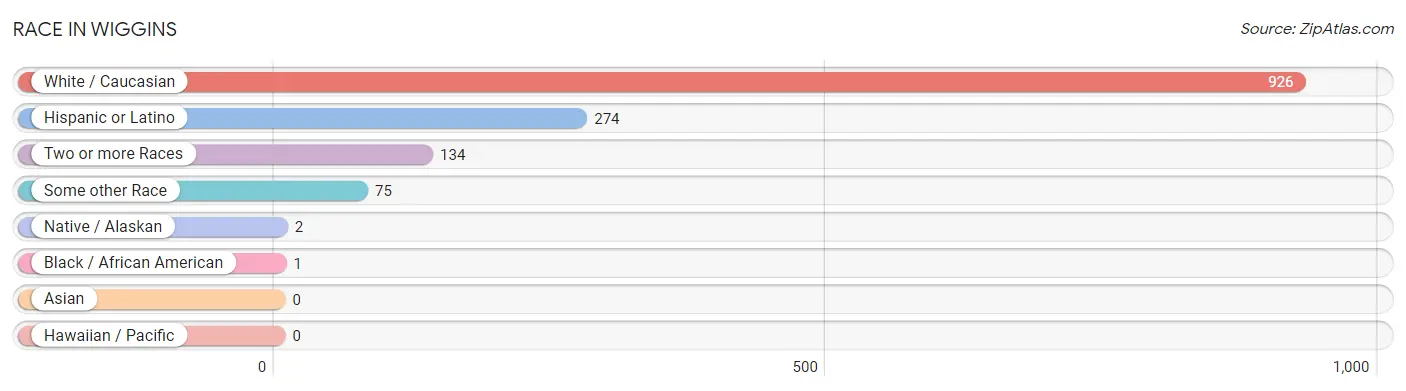
| Race | # Population | % Population |
| Asian | 0 | 0.0% |
| Black / African American | 1 | 0.1% |
| Hawaiian / Pacific | 0 | 0.0% |
| Hispanic or Latino | 274 | 24.1% |
| Native / Alaskan | 2 | 0.2% |
| White / Caucasian | 926 | 81.4% |
| Two or more Races | 134 | 11.8% |
| Some other Race | 75 | 6.6% |
| Total | 1,138 | 100.0% |
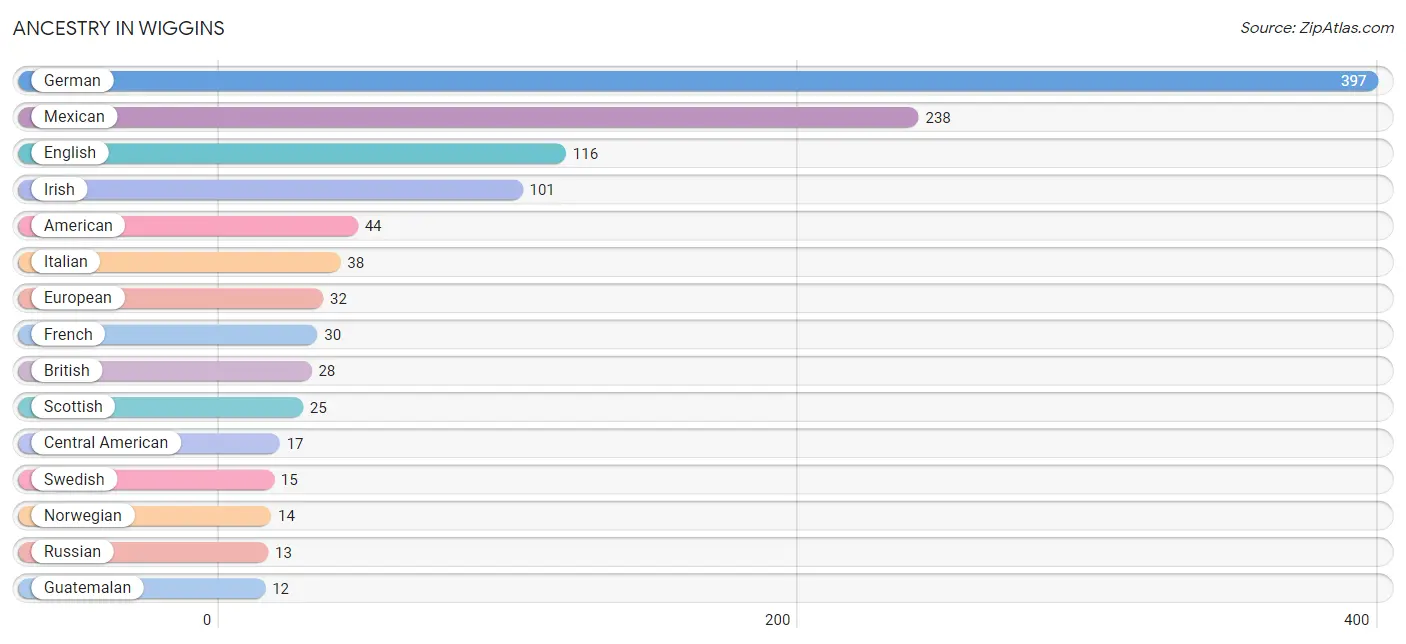
Ancestry in Wiggins
The most populous ancestries reported in Wiggins are German (397 | 34.9%), Mexican (238 | 20.9%), English (116 | 10.2%), Irish (101 | 8.9%), and American (44 | 3.9%), together accounting for 78.7% of all Wiggins residents.
| Ancestry | # Population | % Population |
| American | 44 | 3.9% |
| Arab | 7 | 0.6% |
| Belgian | 11 | 1.0% |
| British | 28 | 2.5% |
| Central American | 17 | 1.5% |
| Choctaw | 5 | 0.4% |
| Colombian | 5 | 0.4% |
| Czech | 9 | 0.8% |
| Czechoslovakian | 5 | 0.4% |
| Danish | 10 | 0.9% |
| Dominican | 3 | 0.3% |
| Dutch | 2 | 0.2% |
| Eastern European | 4 | 0.4% |
| English | 116 | 10.2% |
| European | 32 | 2.8% |
| French | 30 | 2.6% |
| German | 397 | 34.9% |
| Greek | 1 | 0.1% |
| Guatemalan | 12 | 1.1% |
| Hopi | 2 | 0.2% |
| Irish | 101 | 8.9% |
| Italian | 38 | 3.3% |
| Lebanese | 7 | 0.6% |
| Mexican | 238 | 20.9% |
| Navajo | 2 | 0.2% |
| Nicaraguan | 5 | 0.4% |
| Nigerian | 2 | 0.2% |
| Norwegian | 14 | 1.2% |
| Polish | 4 | 0.4% |
| Russian | 13 | 1.1% |
| Scotch-Irish | 8 | 0.7% |
| Scottish | 25 | 2.2% |
| South American | 5 | 0.4% |
| Subsaharan African | 2 | 0.2% |
| Swedish | 15 | 1.3% |
| Ukrainian | 3 | 0.3% |
| Welsh | 3 | 0.3% | View All 37 Rows |
Immigrants in Wiggins
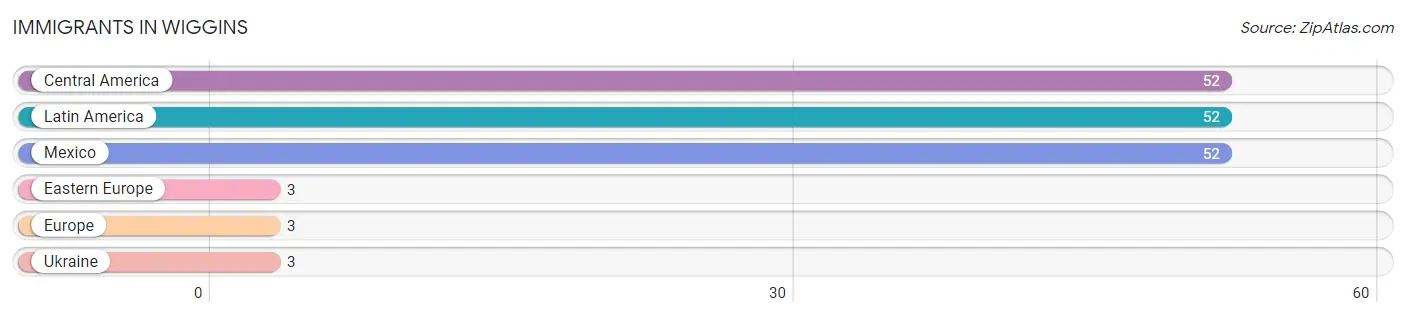
The most numerous immigrant groups reported in Wiggins came from Central America (52 | 4.6%), Latin America (52 | 4.6%), Mexico (52 | 4.6%), Eastern Europe (3 | 0.3%), and Europe (3 | 0.3%), together accounting for 14.2% of all Wiggins residents.
| Immigration Origin | # Population | % Population |
| Central America | 52 | 4.6% |
| Eastern Europe | 3 | 0.3% |
| Europe | 3 | 0.3% |
| Latin America | 52 | 4.6% |
| Mexico | 52 | 4.6% |
| Ukraine | 3 | 0.3% | View All 6 Rows |
Sex and Age in Wiggins
Sex and Age in Wiggins
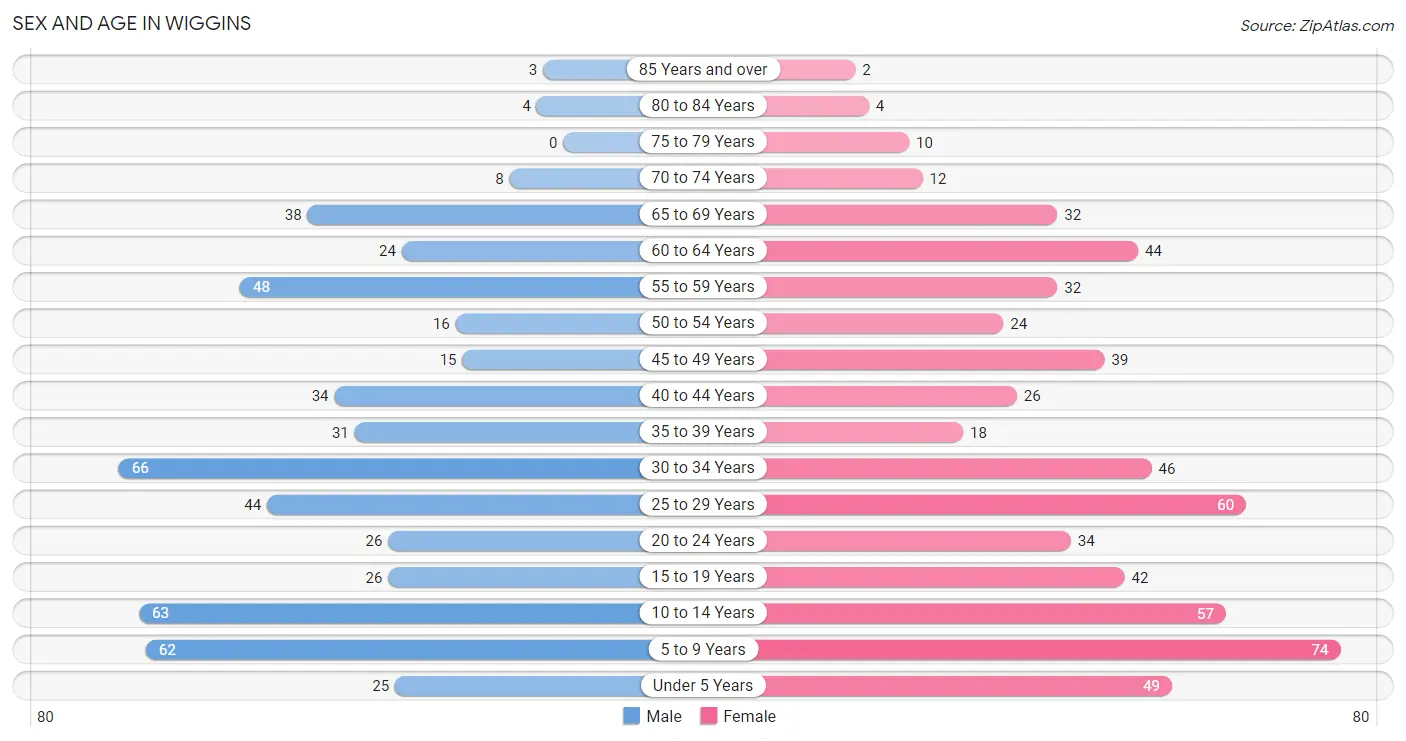
The most populous age groups in Wiggins are 30 to 34 Years (66 | 12.4%) for men and 5 to 9 Years (74 | 12.2%) for women.
| Age Bracket | Male | Female |
| Under 5 Years | 25 (4.7%) | 49 (8.1%) |
| 5 to 9 Years | 62 (11.6%) | 74 (12.2%) |
| 10 to 14 Years | 63 (11.8%) | 57 (9.4%) |
| 15 to 19 Years | 26 (4.9%) | 42 (6.9%) |
| 20 to 24 Years | 26 (4.9%) | 34 (5.6%) |
| 25 to 29 Years | 44 (8.3%) | 60 (9.9%) |
| 30 to 34 Years | 66 (12.4%) | 46 (7.6%) |
| 35 to 39 Years | 31 (5.8%) | 18 (3.0%) |
| 40 to 44 Years | 34 (6.4%) | 26 (4.3%) |
| 45 to 49 Years | 15 (2.8%) | 39 (6.5%) |
| 50 to 54 Years | 16 (3.0%) | 24 (4.0%) |
| 55 to 59 Years | 48 (9.0%) | 32 (5.3%) |
| 60 to 64 Years | 24 (4.5%) | 44 (7.3%) |
| 65 to 69 Years | 38 (7.1%) | 32 (5.3%) |
| 70 to 74 Years | 8 (1.5%) | 12 (2.0%) |
| 75 to 79 Years | 0 (0.0%) | 10 (1.7%) |
| 80 to 84 Years | 4 (0.7%) | 4 (0.7%) |
| 85 Years and over | 3 (0.6%) | 2 (0.3%) |
| Total | 533 (100.0%) | 605 (100.0%) |
Families and Households in Wiggins
Median Family Size in Wiggins
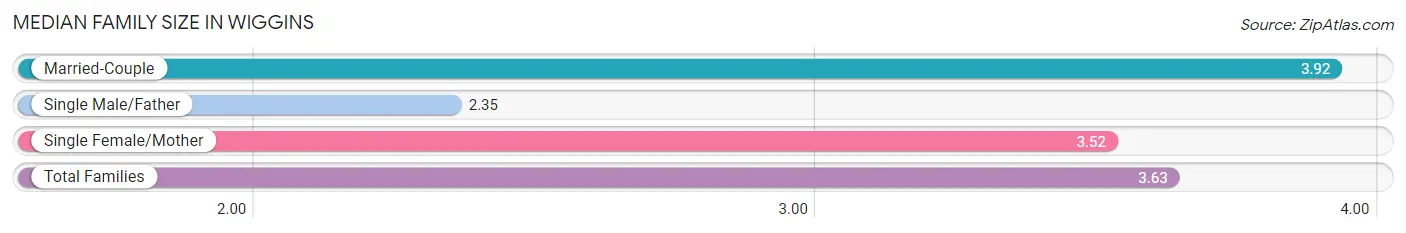
The median family size in Wiggins is 3.63 persons per family, with married-couple families (205 | 75.1%) accounting for the largest median family size of 3.92 persons per family. On the other hand, single male/father families (43 | 15.8%) represent the smallest median family size with 2.35 persons per family.
| Family Type | # Families | Family Size |
| Married-Couple | 205 (75.1%) | 3.92 |
| Single Male/Father | 43 (15.8%) | 2.35 |
| Single Female/Mother | 25 (9.2%) | 3.52 |
| Total Families | 273 (100.0%) | 3.63 |
Median Household Size in Wiggins
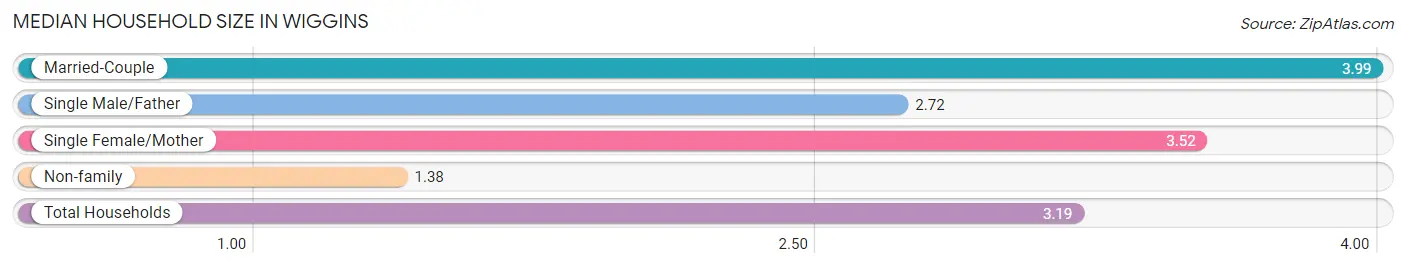
The median household size in Wiggins is 3.19 persons per household, with married-couple households (205 | 57.4%) accounting for the largest median household size of 3.99 persons per household. non-family households (84 | 23.5%) represent the smallest median household size with 1.38 persons per household.
| Household Type | # Households | Household Size |
| Married-Couple | 205 (57.4%) | 3.99 |
| Single Male/Father | 43 (12.0%) | 2.72 |
| Single Female/Mother | 25 (7.0%) | 3.52 |
| Non-family | 84 (23.5%) | 1.38 |
| Total Households | 357 (100.0%) | 3.19 |
Household Size by Marriage Status in Wiggins
Out of a total of 357 households in Wiggins, 273 (76.5%) are family households, while 84 (23.5%) are nonfamily households. The most numerous type of family households are 2-person households, comprising 100, and the most common type of nonfamily households are 1-person households, comprising 46.
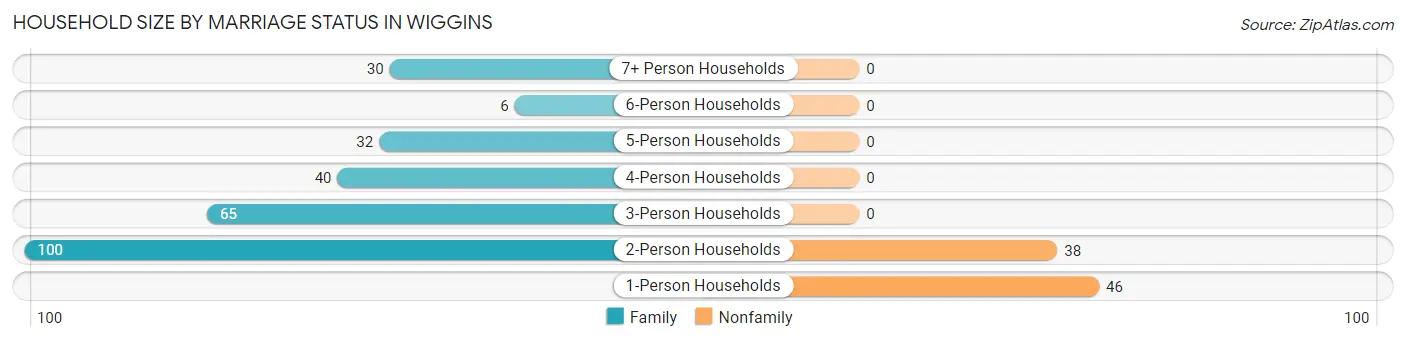
| Household Size | Family Households | Nonfamily Households |
| 1-Person Households | - | 46 (12.9%) |
| 2-Person Households | 100 (28.0%) | 38 (10.6%) |
| 3-Person Households | 65 (18.2%) | 0 (0.0%) |
| 4-Person Households | 40 (11.2%) | 0 (0.0%) |
| 5-Person Households | 32 (9.0%) | 0 (0.0%) |
| 6-Person Households | 6 (1.7%) | 0 (0.0%) |
| 7+ Person Households | 30 (8.4%) | 0 (0.0%) |
| Total | 273 (76.5%) | 84 (23.5%) |
Female Fertility in Wiggins
Fertility by Age in Wiggins
Average fertility rate in Wiggins is 38.0 births per 1,000 women. Women in the age bracket of 20 to 34 years have the highest fertility rate with 57.0 births per 1,000 women. Women in the age bracket of 20 to 34 years acount for 80.0% of all women with births.
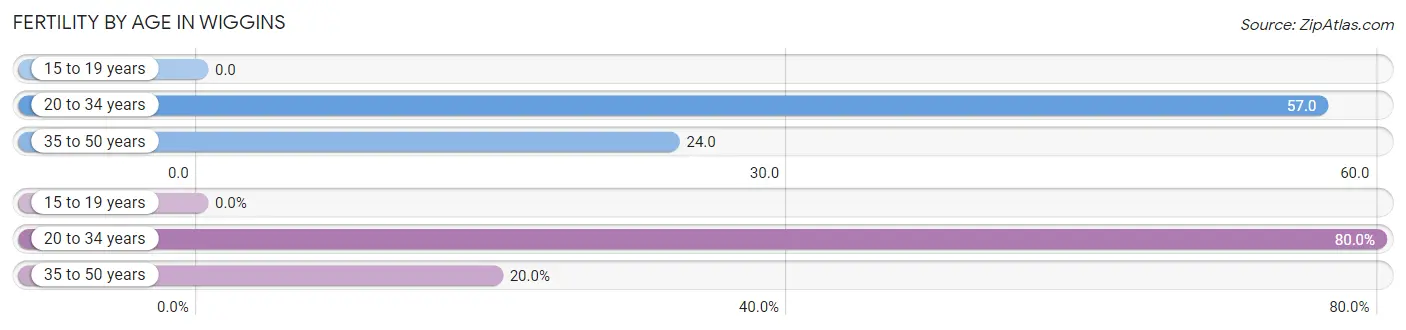
| Age Bracket | Women with Births | Births / 1,000 Women |
| 15 to 19 years | 0 (0.0%) | 0.0 |
| 20 to 34 years | 8 (80.0%) | 57.0 |
| 35 to 50 years | 2 (20.0%) | 24.0 |
| Total | 10 (100.0%) | 38.0 |
Fertility by Age by Marriage Status in Wiggins
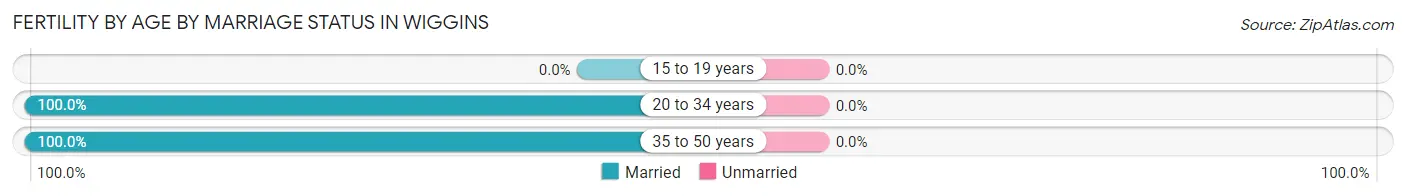
| Age Bracket | Married | Unmarried |
| 15 to 19 years | 0 (0.0%) | 0 (0.0%) |
| 20 to 34 years | 8 (100.0%) | 0 (0.0%) |
| 35 to 50 years | 2 (100.0%) | 0 (0.0%) |
| Total | 10 (100.0%) | 0 (0.0%) |
Fertility by Education in Wiggins
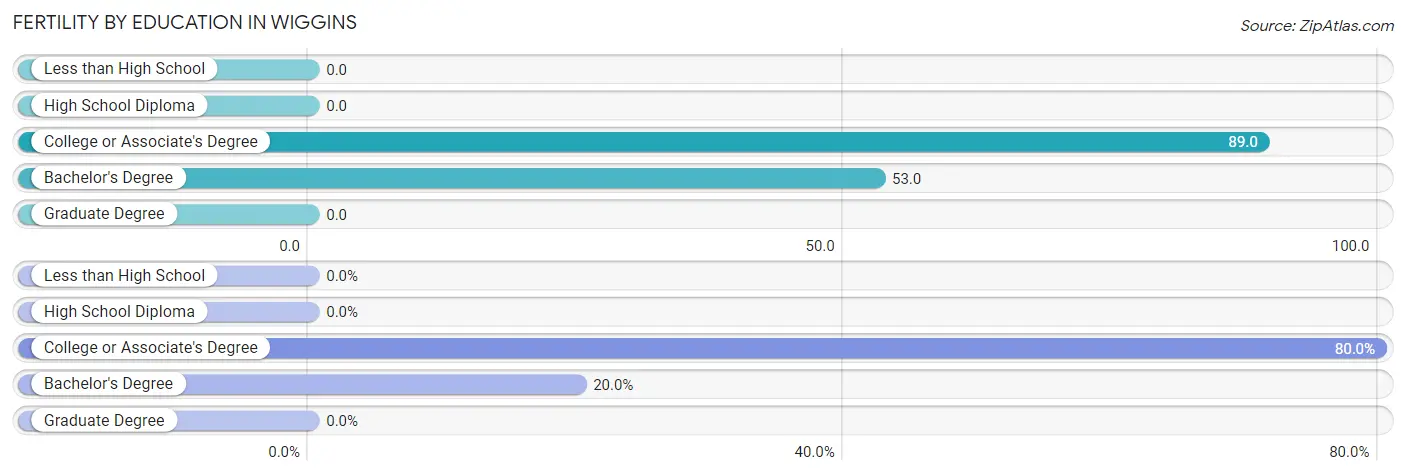
| Educational Attainment | Women with Births | Births / 1,000 Women |
| Less than High School | 0 (0.0%) | 0.0 |
| High School Diploma | 0 (0.0%) | 0.0 |
| College or Associate's Degree | 8 (80.0%) | 89.0 |
| Bachelor's Degree | 2 (20.0%) | 53.0 |
| Graduate Degree | 0 (0.0%) | 0.0 |
| Total | 10 (100.0%) | 38.0 |
Fertility by Education by Marriage Status in Wiggins
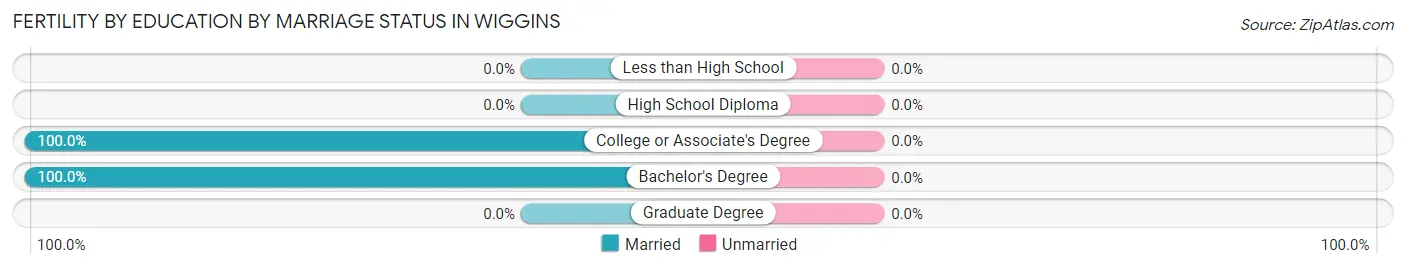
| Educational Attainment | Married | Unmarried |
| Less than High School | 0 (0.0%) | 0 (0.0%) |
| High School Diploma | 0 (0.0%) | 0 (0.0%) |
| College or Associate's Degree | 8 (100.0%) | 0 (0.0%) |
| Bachelor's Degree | 2 (100.0%) | 0 (0.0%) |
| Graduate Degree | 0 (0.0%) | 0 (0.0%) |
| Total | 10 (100.0%) | 0 (0.0%) |
Employment Characteristics in Wiggins
Employment by Class of Employer in Wiggins
Among the 520 employed individuals in Wiggins, private company employees (313 | 60.2%), self-employed (not incorporated) (83 | 16.0%), and state government employees (47 | 9.0%) make up the most common classes of employment.
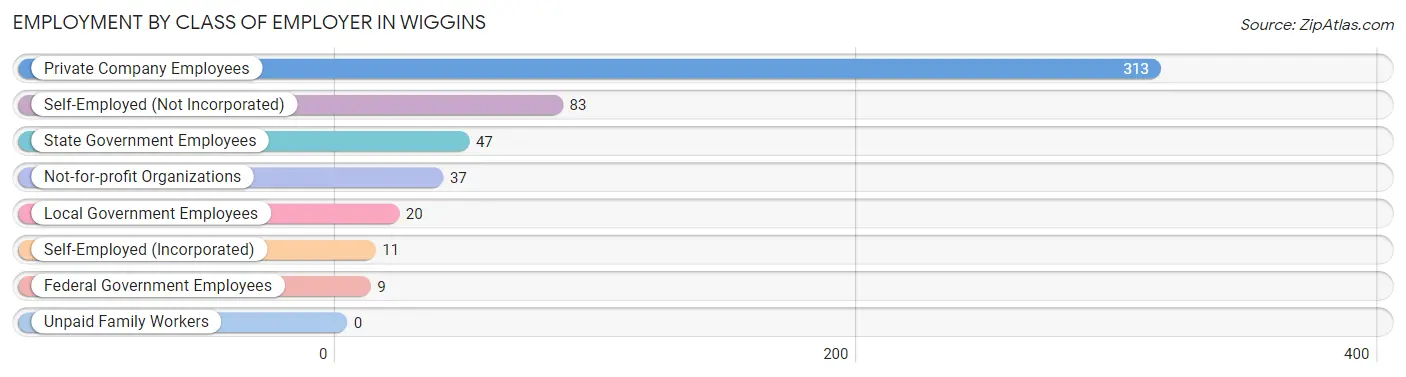
| Employer Class | # Employees | % Employees |
| Private Company Employees | 313 | 60.2% |
| Self-Employed (Incorporated) | 11 | 2.1% |
| Self-Employed (Not Incorporated) | 83 | 16.0% |
| Not-for-profit Organizations | 37 | 7.1% |
| Local Government Employees | 20 | 3.8% |
| State Government Employees | 47 | 9.0% |
| Federal Government Employees | 9 | 1.7% |
| Unpaid Family Workers | 0 | 0.0% |
| Total | 520 | 100.0% |
Employment Status by Age in Wiggins
According to the labor force statistics for Wiggins, out of the total population over 16 years of age (791), 71.0% or 562 individuals are in the labor force, with 7.3% or 41 of them unemployed. The age group with the highest labor force participation rate is 35 to 44 years, with 98.2% or 107 individuals in the labor force. Within the labor force, the 16 to 19 years age range has the highest percentage of unemployed individuals, with 35.3% or 6 of them being unemployed.
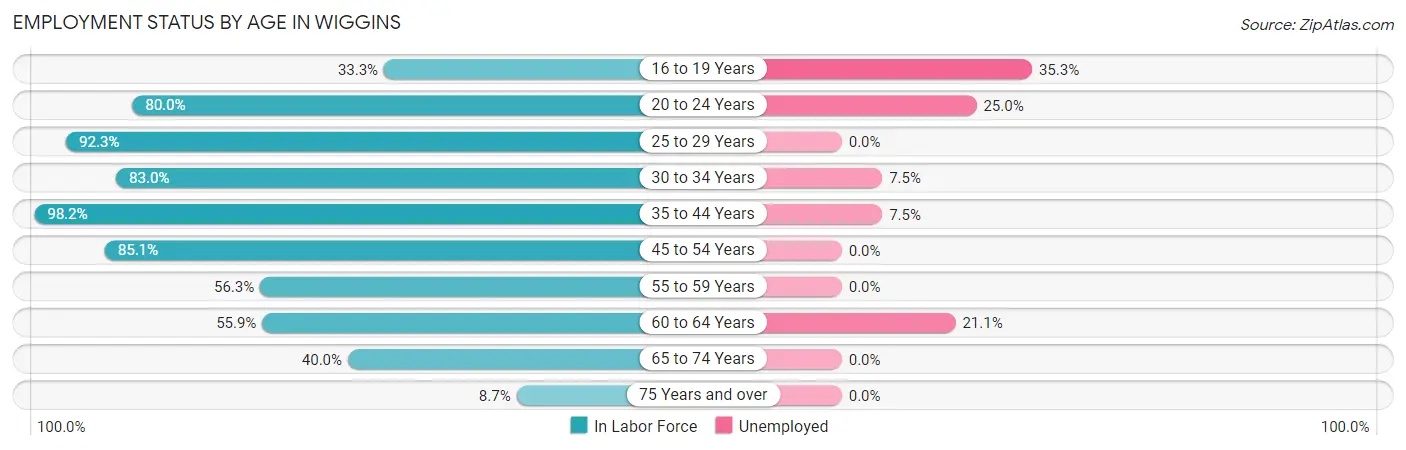
| Age Bracket | In Labor Force | Unemployed |
| 16 to 19 Years | 17 (33.3%) | 6 (35.3%) |
| 20 to 24 Years | 48 (80.0%) | 12 (25.0%) |
| 25 to 29 Years | 96 (92.3%) | 0 (0.0%) |
| 30 to 34 Years | 93 (83.0%) | 7 (7.5%) |
| 35 to 44 Years | 107 (98.2%) | 8 (7.5%) |
| 45 to 54 Years | 80 (85.1%) | 0 (0.0%) |
| 55 to 59 Years | 45 (56.3%) | 0 (0.0%) |
| 60 to 64 Years | 38 (55.9%) | 8 (21.1%) |
| 65 to 74 Years | 36 (40.0%) | 0 (0.0%) |
| 75 Years and over | 2 (8.7%) | 0 (0.0%) |
| Total | 562 (71.0%) | 41 (7.3%) |
Employment Status by Educational Attainment in Wiggins
According to labor force statistics for Wiggins, 81.0% of individuals (459) out of the total population between 25 and 64 years of age (567) are in the labor force, with 5.0% or 23 of them being unemployed. The group with the highest labor force participation rate are those with the educational attainment of less than high school, with 100.0% or 13 individuals in the labor force. Within the labor force, individuals with college / associate degree education have the highest percentage of unemployment, with 9.5% or 19 of them being unemployed.
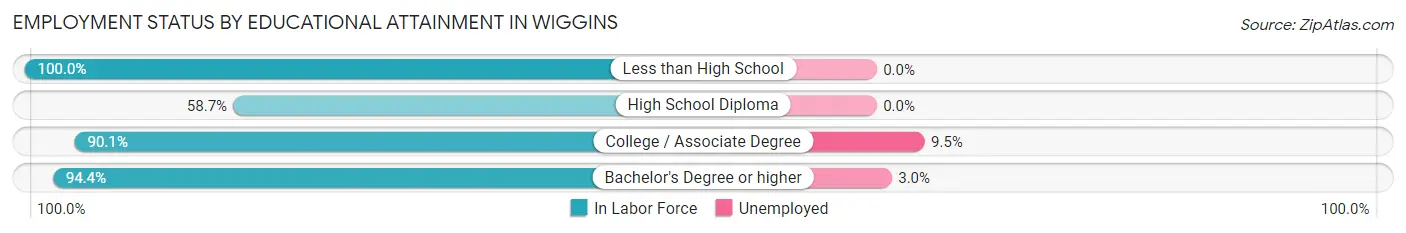
| Educational Attainment | In Labor Force | Unemployed |
| Less than High School | 13 (100.0%) | 0 (0.0%) |
| High School Diploma | 111 (58.7%) | 0 (0.0%) |
| College / Associate Degree | 201 (90.1%) | 21 (9.5%) |
| Bachelor's Degree or higher | 134 (94.4%) | 4 (3.0%) |
| Total | 459 (81.0%) | 28 (5.0%) |
Employment Occupations by Sex in Wiggins
Management, Business, Science and Arts Occupations
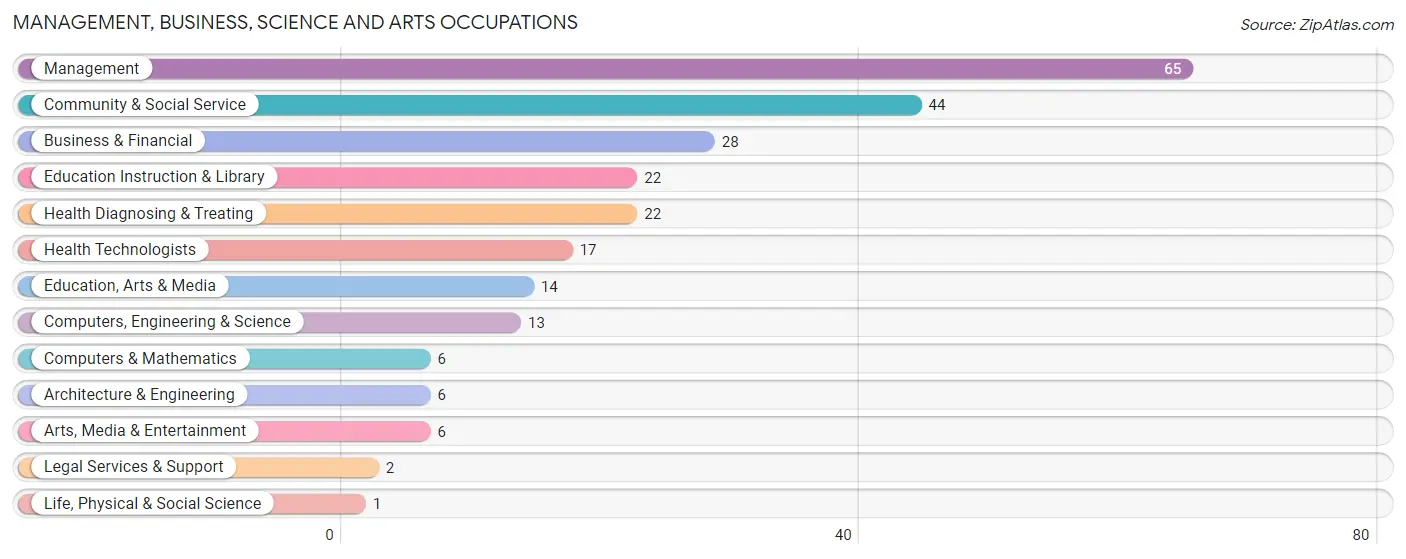
The most common Management, Business, Science and Arts occupations in Wiggins are Management (65 | 12.5%), Community & Social Service (44 | 8.5%), Business & Financial (28 | 5.4%), Education Instruction & Library (22 | 4.2%), and Health Diagnosing & Treating (22 | 4.2%).
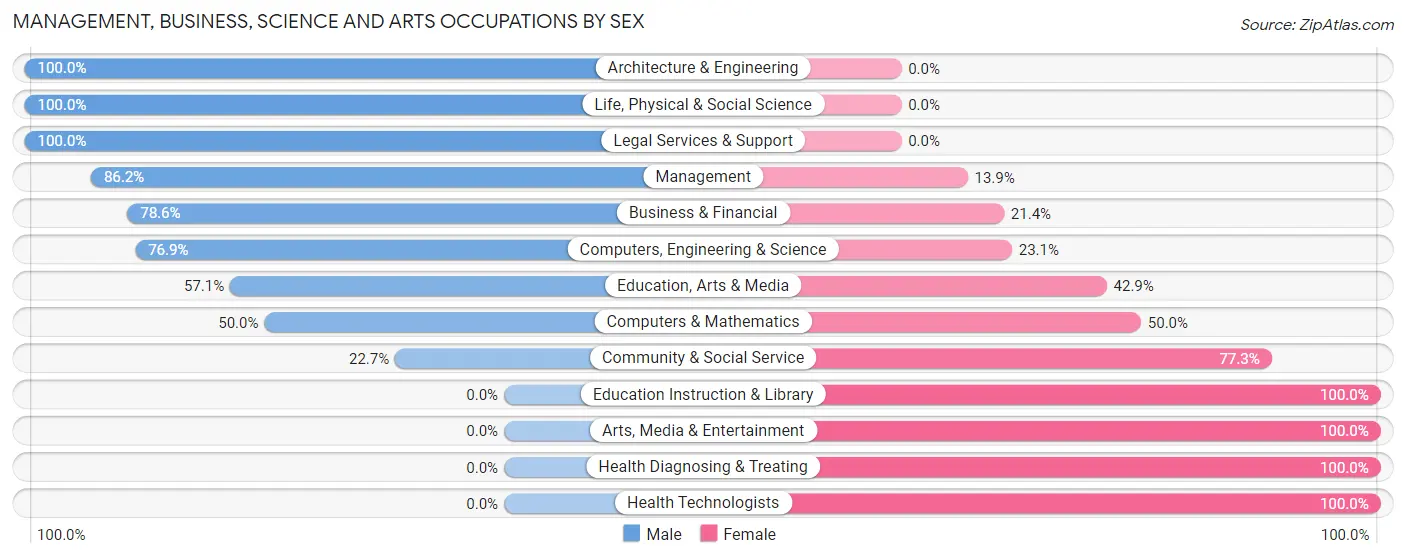
Management, Business, Science and Arts Occupations by Sex
Within the Management, Business, Science and Arts occupations in Wiggins, the most male-oriented occupations are Architecture & Engineering (100.0%), Life, Physical & Social Science (100.0%), and Legal Services & Support (100.0%), while the most female-oriented occupations are Education Instruction & Library (100.0%), Arts, Media & Entertainment (100.0%), and Health Diagnosing & Treating (100.0%).
| Occupation | Male | Female |
| Management | 56 (86.2%) | 9 (13.9%) |
| Business & Financial | 22 (78.6%) | 6 (21.4%) |
| Computers, Engineering & Science | 10 (76.9%) | 3 (23.1%) |
| Computers & Mathematics | 3 (50.0%) | 3 (50.0%) |
| Architecture & Engineering | 6 (100.0%) | 0 (0.0%) |
| Life, Physical & Social Science | 1 (100.0%) | 0 (0.0%) |
| Community & Social Service | 10 (22.7%) | 34 (77.3%) |
| Education, Arts & Media | 8 (57.1%) | 6 (42.9%) |
| Legal Services & Support | 2 (100.0%) | 0 (0.0%) |
| Education Instruction & Library | 0 (0.0%) | 22 (100.0%) |
| Arts, Media & Entertainment | 0 (0.0%) | 6 (100.0%) |
| Health Diagnosing & Treating | 0 (0.0%) | 22 (100.0%) |
| Health Technologists | 0 (0.0%) | 17 (100.0%) |
| Total (Category) | 98 (57.0%) | 74 (43.0%) |
| Total (Overall) | 305 (58.5%) | 216 (41.5%) |
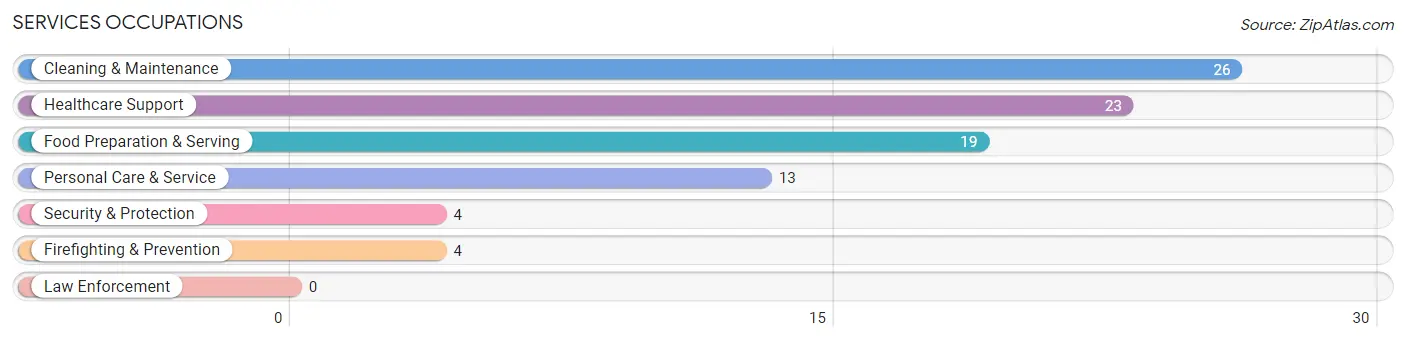
Services Occupations
The most common Services occupations in Wiggins are Cleaning & Maintenance (26 | 5.0%), Healthcare Support (23 | 4.4%), Food Preparation & Serving (19 | 3.6%), Personal Care & Service (13 | 2.5%), and Security & Protection (4 | 0.8%).
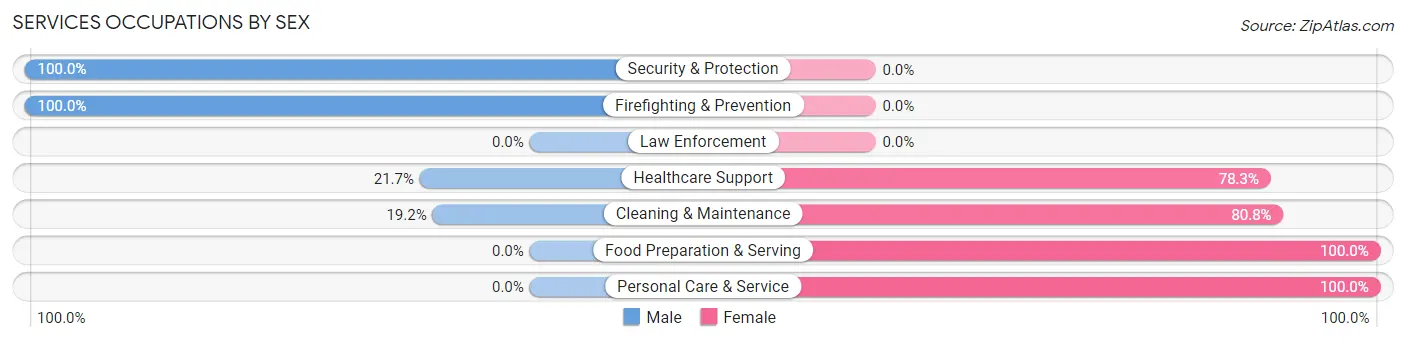
Services Occupations by Sex
Within the Services occupations in Wiggins, the most male-oriented occupations are Security & Protection (100.0%), Firefighting & Prevention (100.0%), and Healthcare Support (21.7%), while the most female-oriented occupations are Food Preparation & Serving (100.0%), Personal Care & Service (100.0%), and Cleaning & Maintenance (80.8%).
| Occupation | Male | Female |
| Healthcare Support | 5 (21.7%) | 18 (78.3%) |
| Security & Protection | 4 (100.0%) | 0 (0.0%) |
| Firefighting & Prevention | 4 (100.0%) | 0 (0.0%) |
| Law Enforcement | 0 (0.0%) | 0 (0.0%) |
| Food Preparation & Serving | 0 (0.0%) | 19 (100.0%) |
| Cleaning & Maintenance | 5 (19.2%) | 21 (80.8%) |
| Personal Care & Service | 0 (0.0%) | 13 (100.0%) |
| Total (Category) | 14 (16.5%) | 71 (83.5%) |
| Total (Overall) | 305 (58.5%) | 216 (41.5%) |
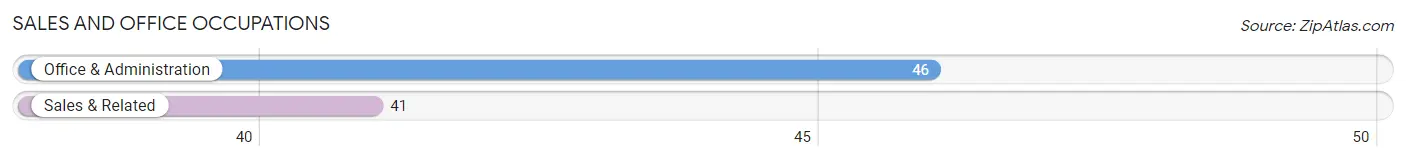
Sales and Office Occupations
The most common Sales and Office occupations in Wiggins are Office & Administration (46 | 8.8%), and Sales & Related (41 | 7.9%).
Sales and Office Occupations by Sex
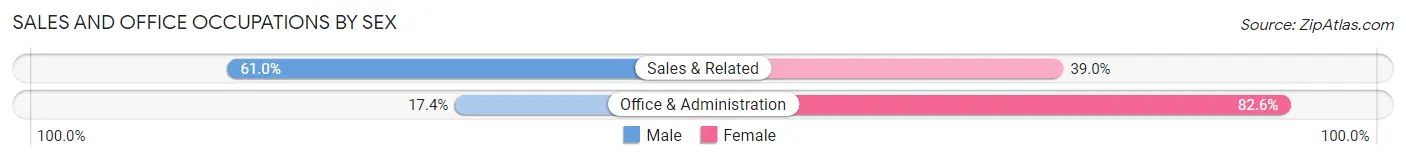
| Occupation | Male | Female |
| Sales & Related | 25 (61.0%) | 16 (39.0%) |
| Office & Administration | 8 (17.4%) | 38 (82.6%) |
| Total (Category) | 33 (37.9%) | 54 (62.1%) |
| Total (Overall) | 305 (58.5%) | 216 (41.5%) |
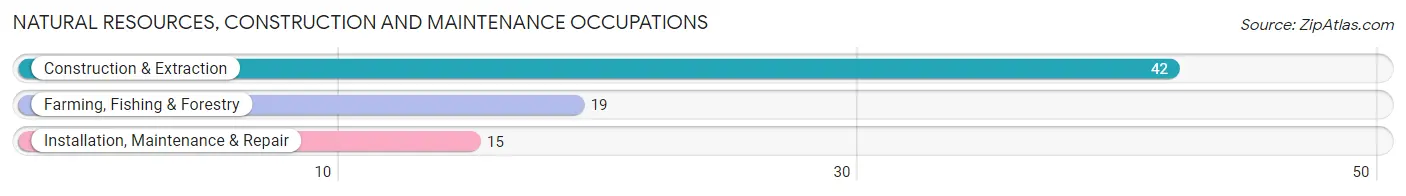
Natural Resources, Construction and Maintenance Occupations
The most common Natural Resources, Construction and Maintenance occupations in Wiggins are Construction & Extraction (42 | 8.1%), Farming, Fishing & Forestry (19 | 3.6%), and Installation, Maintenance & Repair (15 | 2.9%).
Natural Resources, Construction and Maintenance Occupations by Sex
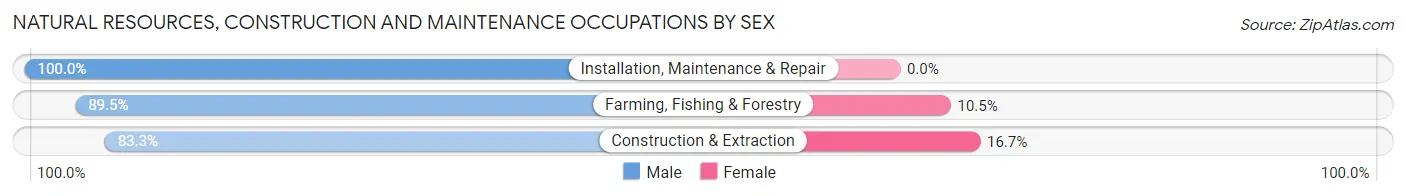
| Occupation | Male | Female |
| Farming, Fishing & Forestry | 17 (89.5%) | 2 (10.5%) |
| Construction & Extraction | 35 (83.3%) | 7 (16.7%) |
| Installation, Maintenance & Repair | 15 (100.0%) | 0 (0.0%) |
| Total (Category) | 67 (88.2%) | 9 (11.8%) |
| Total (Overall) | 305 (58.5%) | 216 (41.5%) |
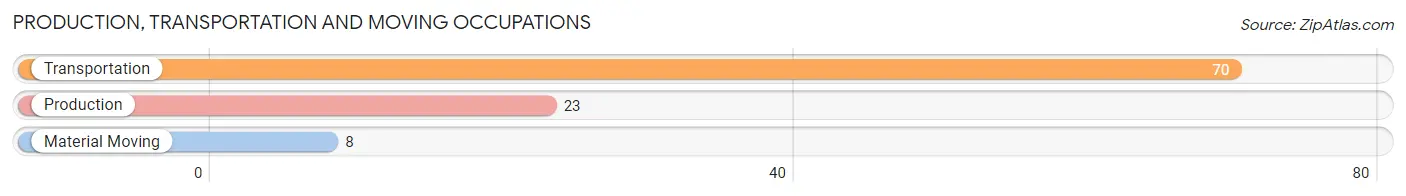
Production, Transportation and Moving Occupations
The most common Production, Transportation and Moving occupations in Wiggins are Transportation (70 | 13.4%), Production (23 | 4.4%), and Material Moving (8 | 1.5%).
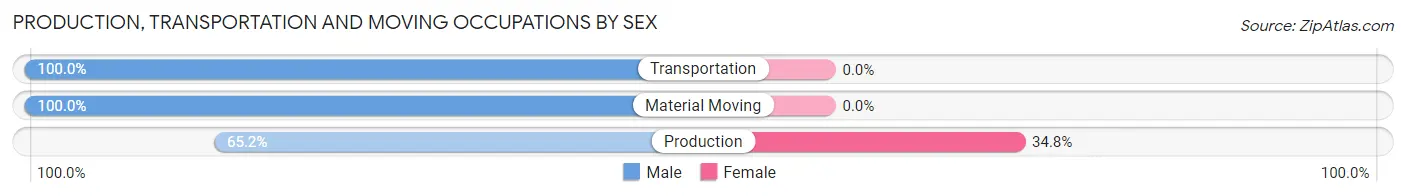
Production, Transportation and Moving Occupations by Sex
| Occupation | Male | Female |
| Production | 15 (65.2%) | 8 (34.8%) |
| Transportation | 70 (100.0%) | 0 (0.0%) |
| Material Moving | 8 (100.0%) | 0 (0.0%) |
| Total (Category) | 93 (92.1%) | 8 (7.9%) |
| Total (Overall) | 305 (58.5%) | 216 (41.5%) |
Employment Industries by Sex in Wiggins
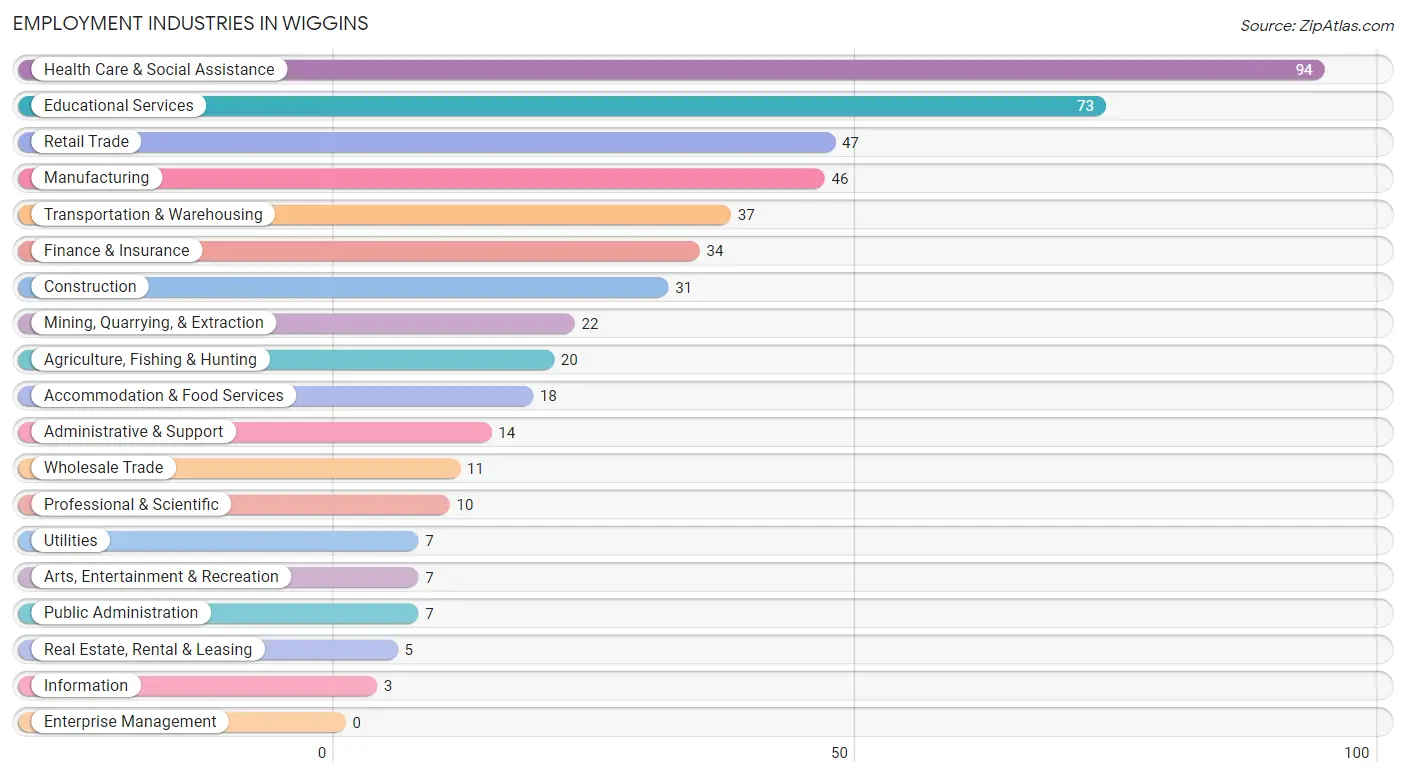
Employment Industries in Wiggins
The major employment industries in Wiggins include Health Care & Social Assistance (94 | 18.0%), Educational Services (73 | 14.0%), Retail Trade (47 | 9.0%), Manufacturing (46 | 8.8%), and Transportation & Warehousing (37 | 7.1%).
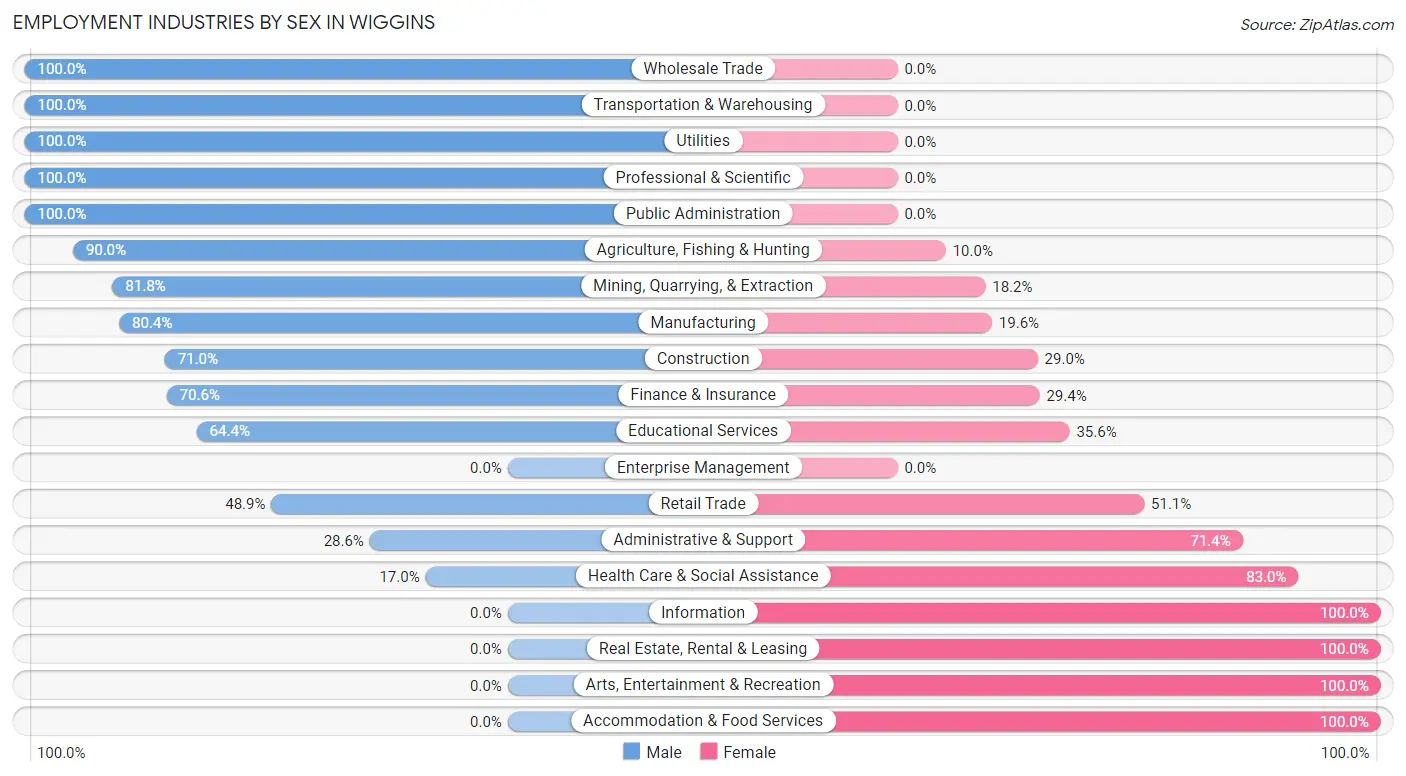
Employment Industries by Sex in Wiggins
The Wiggins industries that see more men than women are Wholesale Trade (100.0%), Transportation & Warehousing (100.0%), and Utilities (100.0%), whereas the industries that tend to have a higher number of women are Information (100.0%), Real Estate, Rental & Leasing (100.0%), and Arts, Entertainment & Recreation (100.0%).
| Industry | Male | Female |
| Agriculture, Fishing & Hunting | 18 (90.0%) | 2 (10.0%) |
| Mining, Quarrying, & Extraction | 18 (81.8%) | 4 (18.2%) |
| Construction | 22 (71.0%) | 9 (29.0%) |
| Manufacturing | 37 (80.4%) | 9 (19.6%) |
| Wholesale Trade | 11 (100.0%) | 0 (0.0%) |
| Retail Trade | 23 (48.9%) | 24 (51.1%) |
| Transportation & Warehousing | 37 (100.0%) | 0 (0.0%) |
| Utilities | 7 (100.0%) | 0 (0.0%) |
| Information | 0 (0.0%) | 3 (100.0%) |
| Finance & Insurance | 24 (70.6%) | 10 (29.4%) |
| Real Estate, Rental & Leasing | 0 (0.0%) | 5 (100.0%) |
| Professional & Scientific | 10 (100.0%) | 0 (0.0%) |
| Enterprise Management | 0 (0.0%) | 0 (0.0%) |
| Administrative & Support | 4 (28.6%) | 10 (71.4%) |
| Educational Services | 47 (64.4%) | 26 (35.6%) |
| Health Care & Social Assistance | 16 (17.0%) | 78 (83.0%) |
| Arts, Entertainment & Recreation | 0 (0.0%) | 7 (100.0%) |
| Accommodation & Food Services | 0 (0.0%) | 18 (100.0%) |
| Public Administration | 7 (100.0%) | 0 (0.0%) |
| Total | 305 (58.5%) | 216 (41.5%) |
Education in Wiggins
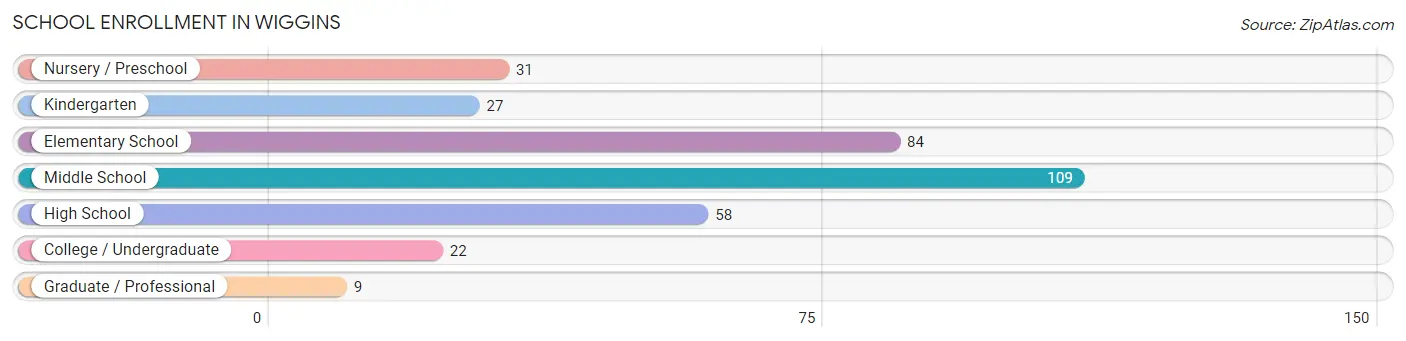
School Enrollment in Wiggins
The most common levels of schooling among the 340 students in Wiggins are middle school (109 | 32.1%), elementary school (84 | 24.7%), and high school (58 | 17.1%).
| School Level | # Students | % Students |
| Nursery / Preschool | 31 | 9.1% |
| Kindergarten | 27 | 7.9% |
| Elementary School | 84 | 24.7% |
| Middle School | 109 | 32.1% |
| High School | 58 | 17.1% |
| College / Undergraduate | 22 | 6.5% |
| Graduate / Professional | 9 | 2.6% |
| Total | 340 | 100.0% |
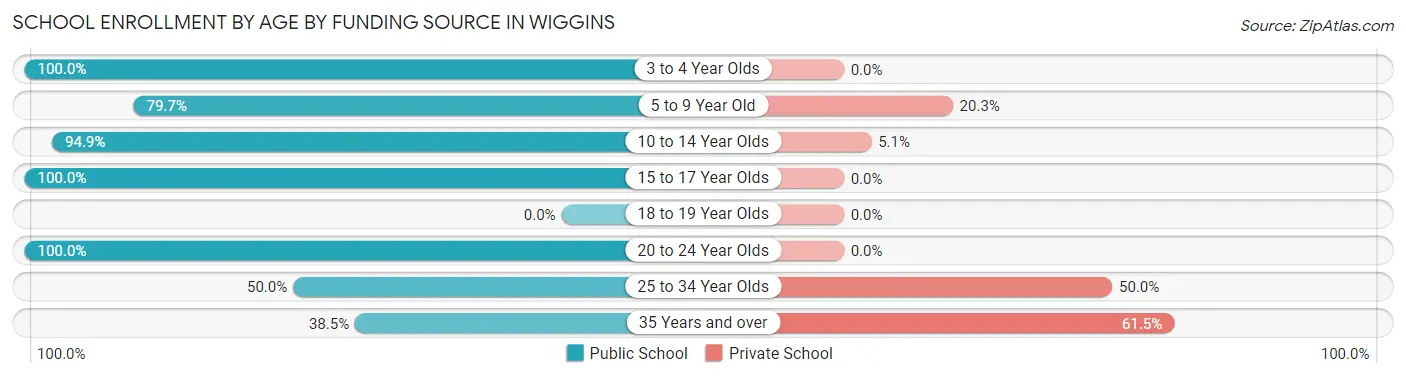
School Enrollment by Age by Funding Source in Wiggins
Out of a total of 340 students who are enrolled in schools in Wiggins, 48 (14.1%) attend a private institution, while the remaining 292 (85.9%) are enrolled in public schools. The age group of 35 years and over has the highest likelihood of being enrolled in private schools, with 8 (61.5% in the age bracket) enrolled. Conversely, the age group of 3 to 4 year olds has the lowest likelihood of being enrolled in a private school, with 6 (100.0% in the age bracket) attending a public institution.
| Age Bracket | Public School | Private School |
| 3 to 4 Year Olds | 6 (100.0%) | 0 (0.0%) |
| 5 to 9 Year Old | 106 (79.7%) | 27 (20.3%) |
| 10 to 14 Year Olds | 111 (94.9%) | 6 (5.1%) |
| 15 to 17 Year Olds | 53 (100.0%) | 0 (0.0%) |
| 18 to 19 Year Olds | 0 (0.0%) | 0 (0.0%) |
| 20 to 24 Year Olds | 4 (100.0%) | 0 (0.0%) |
| 25 to 34 Year Olds | 7 (50.0%) | 7 (50.0%) |
| 35 Years and over | 5 (38.5%) | 8 (61.5%) |
| Total | 292 (85.9%) | 48 (14.1%) |
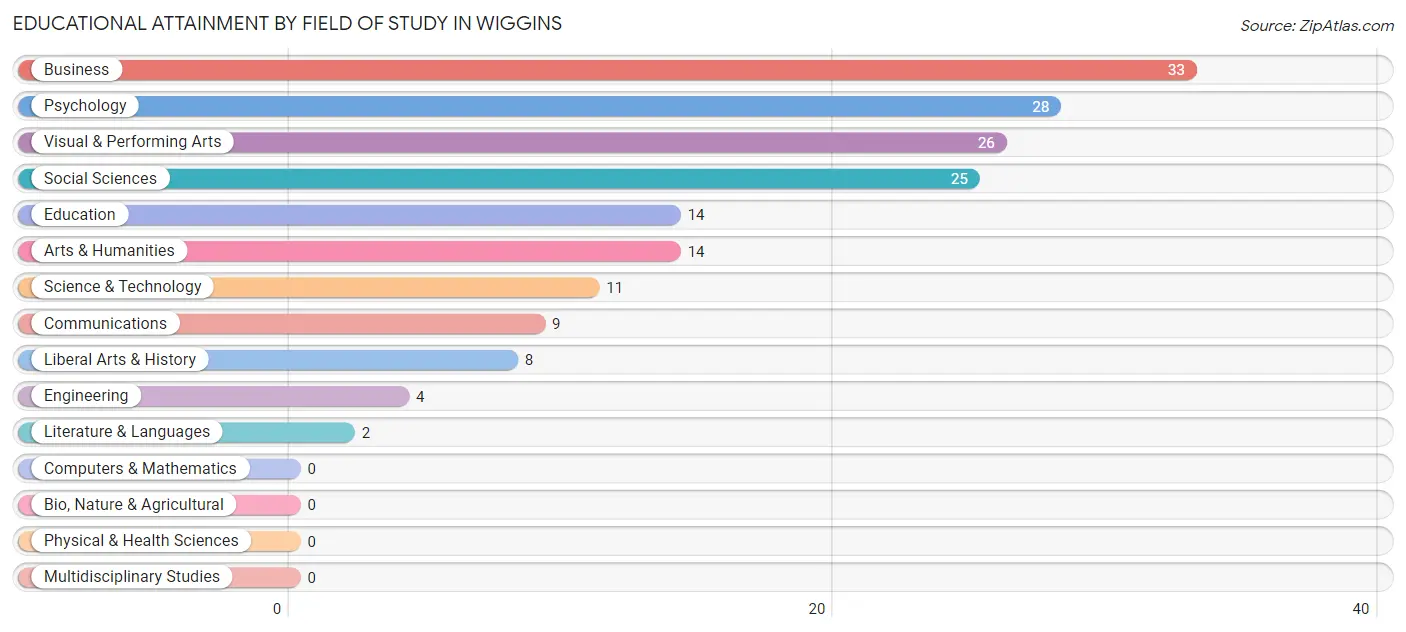
Educational Attainment by Field of Study in Wiggins
Business (33 | 19.0%), psychology (28 | 16.1%), visual & performing arts (26 | 14.9%), social sciences (25 | 14.4%), and education (14 | 8.1%) are the most common fields of study among 174 individuals in Wiggins who have obtained a bachelor's degree or higher.
| Field of Study | # Graduates | % Graduates |
| Computers & Mathematics | 0 | 0.0% |
| Bio, Nature & Agricultural | 0 | 0.0% |
| Physical & Health Sciences | 0 | 0.0% |
| Psychology | 28 | 16.1% |
| Social Sciences | 25 | 14.4% |
| Engineering | 4 | 2.3% |
| Multidisciplinary Studies | 0 | 0.0% |
| Science & Technology | 11 | 6.3% |
| Business | 33 | 19.0% |
| Education | 14 | 8.1% |
| Literature & Languages | 2 | 1.1% |
| Liberal Arts & History | 8 | 4.6% |
| Visual & Performing Arts | 26 | 14.9% |
| Communications | 9 | 5.2% |
| Arts & Humanities | 14 | 8.1% |
| Total | 174 | 100.0% |
Transportation & Commute in Wiggins
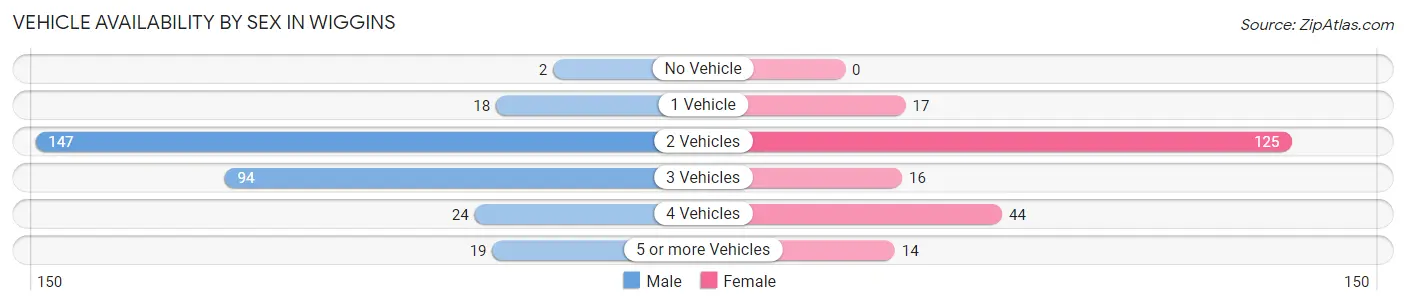
Vehicle Availability by Sex in Wiggins
The most prevalent vehicle ownership categories in Wiggins are males with 2 vehicles (147, accounting for 48.4%) and females with 2 vehicles (125, making up 68.1%).
| Vehicles Available | Male | Female |
| No Vehicle | 2 (0.7%) | 0 (0.0%) |
| 1 Vehicle | 18 (5.9%) | 17 (7.9%) |
| 2 Vehicles | 147 (48.4%) | 125 (57.9%) |
| 3 Vehicles | 94 (30.9%) | 16 (7.4%) |
| 4 Vehicles | 24 (7.9%) | 44 (20.4%) |
| 5 or more Vehicles | 19 (6.2%) | 14 (6.5%) |
| Total | 304 (100.0%) | 216 (100.0%) |
Commute Time in Wiggins
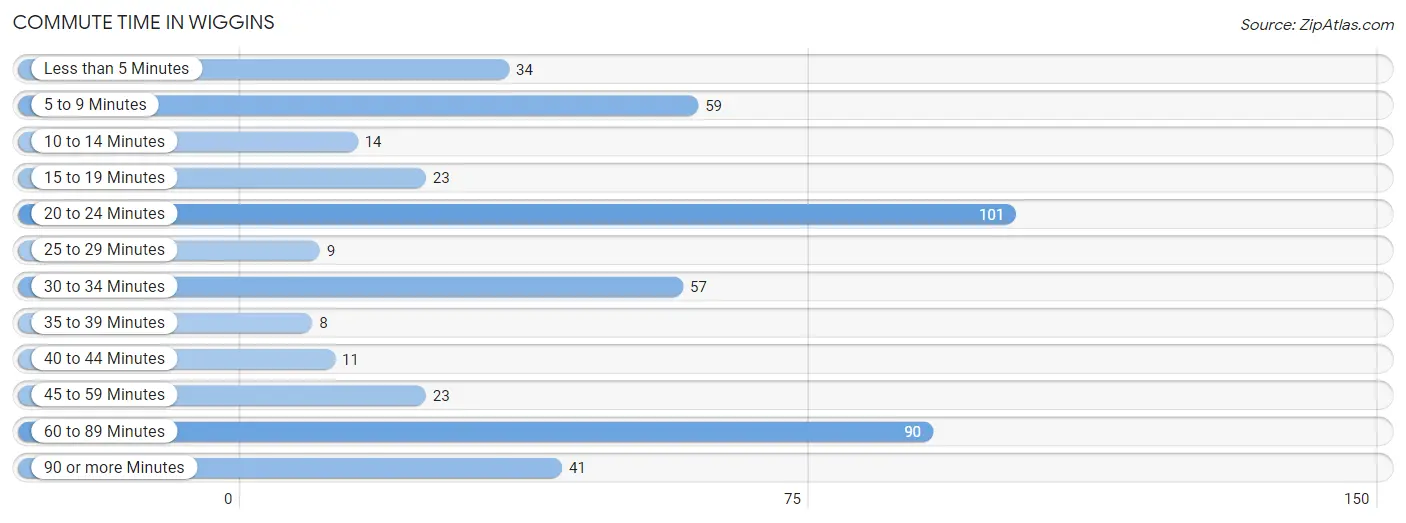
The most frequently occuring commute durations in Wiggins are 20 to 24 minutes (101 commuters, 21.5%), 60 to 89 minutes (90 commuters, 19.2%), and 5 to 9 minutes (59 commuters, 12.6%).
| Commute Time | # Commuters | % Commuters |
| Less than 5 Minutes | 34 | 7.2% |
| 5 to 9 Minutes | 59 | 12.6% |
| 10 to 14 Minutes | 14 | 3.0% |
| 15 to 19 Minutes | 23 | 4.9% |
| 20 to 24 Minutes | 101 | 21.5% |
| 25 to 29 Minutes | 9 | 1.9% |
| 30 to 34 Minutes | 57 | 12.1% |
| 35 to 39 Minutes | 8 | 1.7% |
| 40 to 44 Minutes | 11 | 2.3% |
| 45 to 59 Minutes | 23 | 4.9% |
| 60 to 89 Minutes | 90 | 19.2% |
| 90 or more Minutes | 41 | 8.7% |
Commute Time by Sex in Wiggins
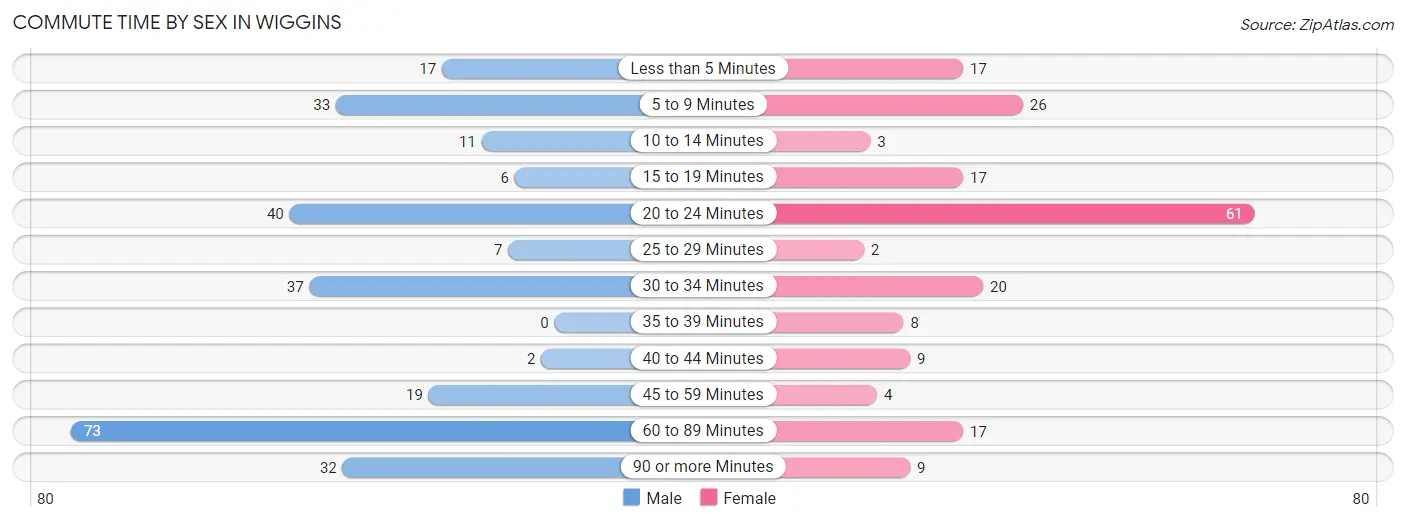
The most common commute times in Wiggins are 60 to 89 minutes (73 commuters, 26.4%) for males and 20 to 24 minutes (61 commuters, 31.6%) for females.
| Commute Time | Male | Female |
| Less than 5 Minutes | 17 (6.1%) | 17 (8.8%) |
| 5 to 9 Minutes | 33 (11.9%) | 26 (13.5%) |
| 10 to 14 Minutes | 11 (4.0%) | 3 (1.5%) |
| 15 to 19 Minutes | 6 (2.2%) | 17 (8.8%) |
| 20 to 24 Minutes | 40 (14.4%) | 61 (31.6%) |
| 25 to 29 Minutes | 7 (2.5%) | 2 (1.0%) |
| 30 to 34 Minutes | 37 (13.4%) | 20 (10.4%) |
| 35 to 39 Minutes | 0 (0.0%) | 8 (4.2%) |
| 40 to 44 Minutes | 2 (0.7%) | 9 (4.7%) |
| 45 to 59 Minutes | 19 (6.9%) | 4 (2.1%) |
| 60 to 89 Minutes | 73 (26.4%) | 17 (8.8%) |
| 90 or more Minutes | 32 (11.6%) | 9 (4.7%) |
Time of Departure to Work by Sex in Wiggins
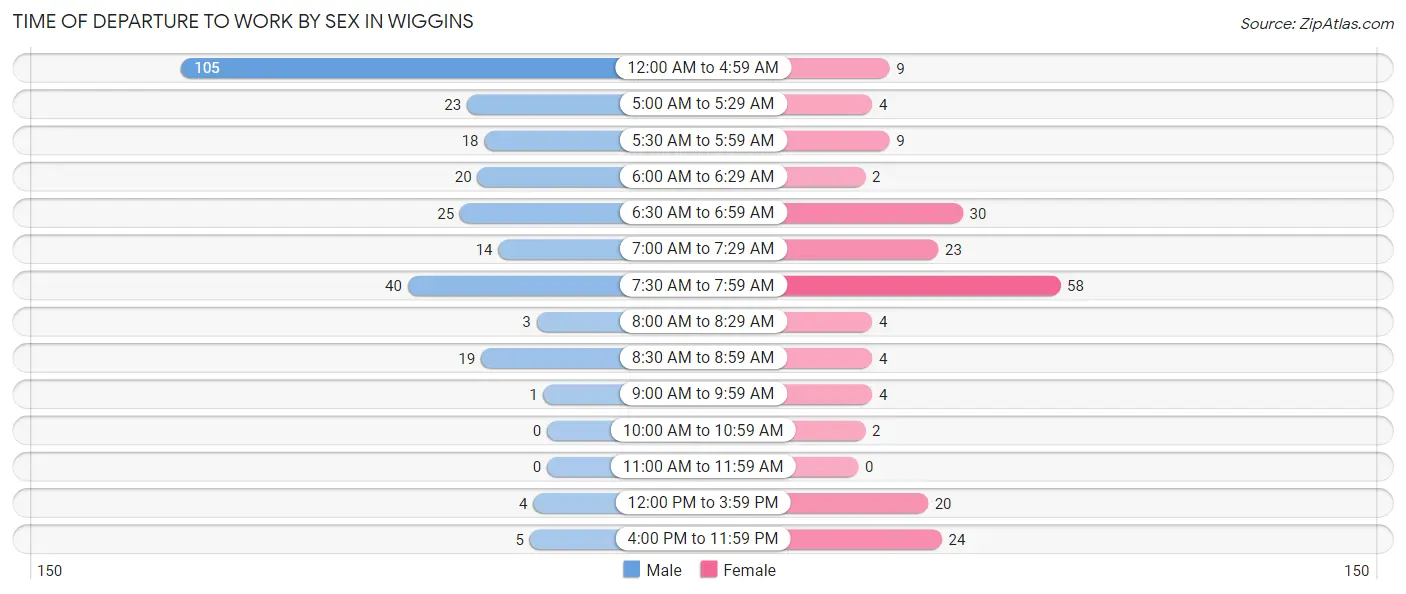
The most frequent times of departure to work in Wiggins are 12:00 AM to 4:59 AM (105, 37.9%) for males and 7:30 AM to 7:59 AM (58, 30.0%) for females.
| Time of Departure | Male | Female |
| 12:00 AM to 4:59 AM | 105 (37.9%) | 9 (4.7%) |
| 5:00 AM to 5:29 AM | 23 (8.3%) | 4 (2.1%) |
| 5:30 AM to 5:59 AM | 18 (6.5%) | 9 (4.7%) |
| 6:00 AM to 6:29 AM | 20 (7.2%) | 2 (1.0%) |
| 6:30 AM to 6:59 AM | 25 (9.0%) | 30 (15.5%) |
| 7:00 AM to 7:29 AM | 14 (5.1%) | 23 (11.9%) |
| 7:30 AM to 7:59 AM | 40 (14.4%) | 58 (30.0%) |
| 8:00 AM to 8:29 AM | 3 (1.1%) | 4 (2.1%) |
| 8:30 AM to 8:59 AM | 19 (6.9%) | 4 (2.1%) |
| 9:00 AM to 9:59 AM | 1 (0.4%) | 4 (2.1%) |
| 10:00 AM to 10:59 AM | 0 (0.0%) | 2 (1.0%) |
| 11:00 AM to 11:59 AM | 0 (0.0%) | 0 (0.0%) |
| 12:00 PM to 3:59 PM | 4 (1.4%) | 20 (10.4%) |
| 4:00 PM to 11:59 PM | 5 (1.8%) | 24 (12.4%) |
| Total | 277 (100.0%) | 193 (100.0%) |
Housing Occupancy in Wiggins
Occupancy by Ownership in Wiggins
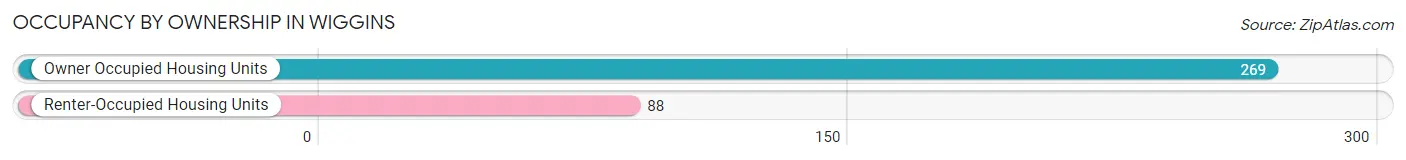
Of the total 357 dwellings in Wiggins, owner-occupied units account for 269 (75.3%), while renter-occupied units make up 88 (24.6%).
| Occupancy | # Housing Units | % Housing Units |
| Owner Occupied Housing Units | 269 | 75.3% |
| Renter-Occupied Housing Units | 88 | 24.6% |
| Total Occupied Housing Units | 357 | 100.0% |
Occupancy by Household Size in Wiggins
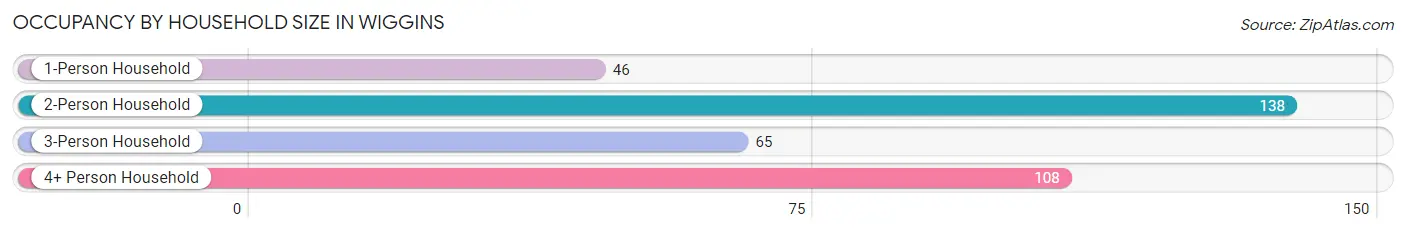
| Household Size | # Housing Units | % Housing Units |
| 1-Person Household | 46 | 12.9% |
| 2-Person Household | 138 | 38.7% |
| 3-Person Household | 65 | 18.2% |
| 4+ Person Household | 108 | 30.2% |
| Total Housing Units | 357 | 100.0% |
Occupancy by Ownership by Household Size in Wiggins
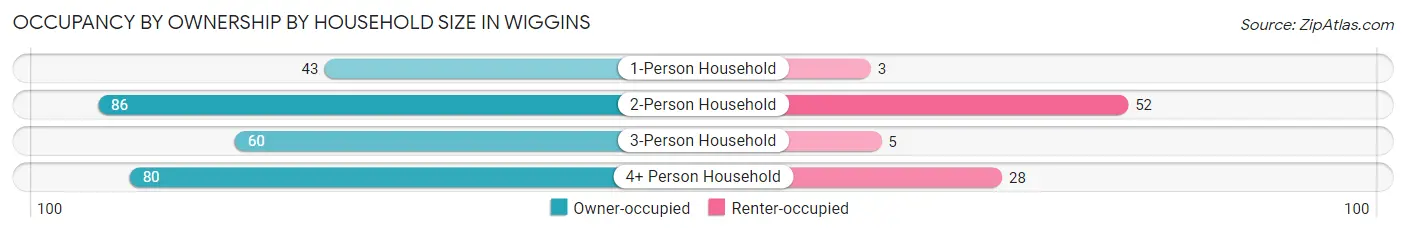
| Household Size | Owner-occupied | Renter-occupied |
| 1-Person Household | 43 (93.5%) | 3 (6.5%) |
| 2-Person Household | 86 (62.3%) | 52 (37.7%) |
| 3-Person Household | 60 (92.3%) | 5 (7.7%) |
| 4+ Person Household | 80 (74.1%) | 28 (25.9%) |
| Total Housing Units | 269 (75.3%) | 88 (24.6%) |
Occupancy by Educational Attainment in Wiggins
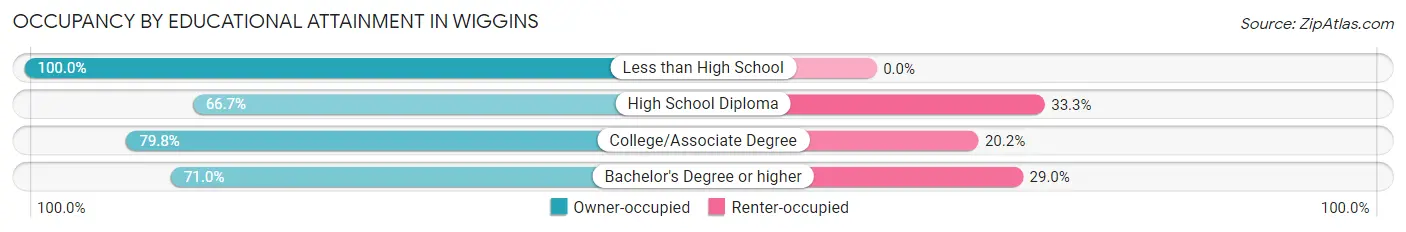
| Household Size | Owner-occupied | Renter-occupied |
| Less than High School | 3 (100.0%) | 0 (0.0%) |
| High School Diploma | 56 (66.7%) | 28 (33.3%) |
| College/Associate Degree | 166 (79.8%) | 42 (20.2%) |
| Bachelor's Degree or higher | 44 (71.0%) | 18 (29.0%) |
Occupancy by Age of Householder in Wiggins
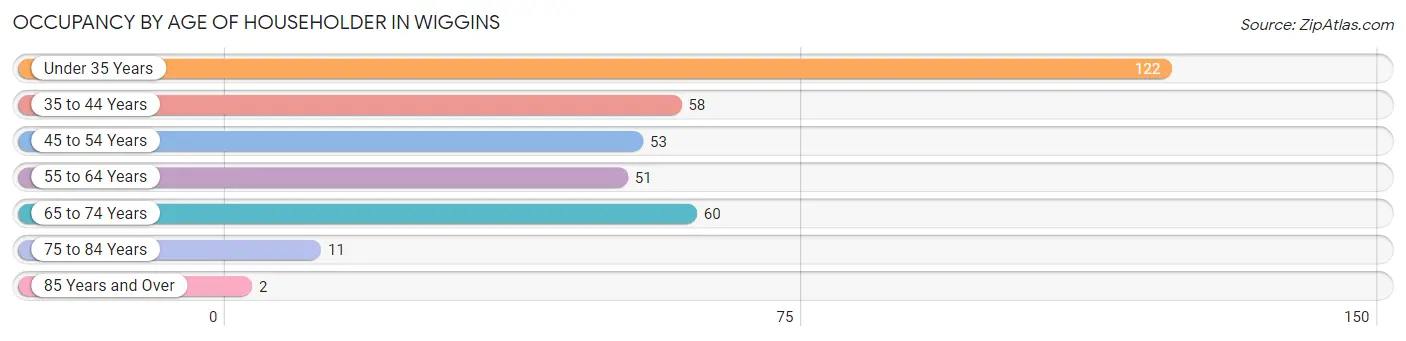
| Age Bracket | # Households | % Households |
| Under 35 Years | 122 | 34.2% |
| 35 to 44 Years | 58 | 16.3% |
| 45 to 54 Years | 53 | 14.8% |
| 55 to 64 Years | 51 | 14.3% |
| 65 to 74 Years | 60 | 16.8% |
| 75 to 84 Years | 11 | 3.1% |
| 85 Years and Over | 2 | 0.6% |
| Total | 357 | 100.0% |
Housing Finances in Wiggins
Median Income by Occupancy in Wiggins
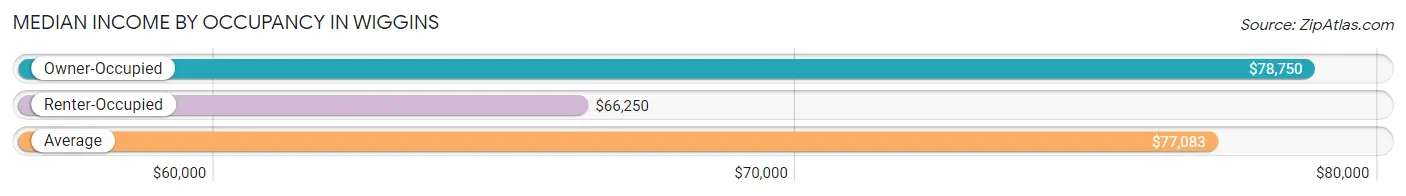
| Occupancy Type | # Households | Median Income |
| Owner-Occupied | 269 (75.3%) | $78,750 |
| Renter-Occupied | 88 (24.6%) | $66,250 |
| Average | 357 (100.0%) | $77,083 |
Occupancy by Householder Income Bracket in Wiggins
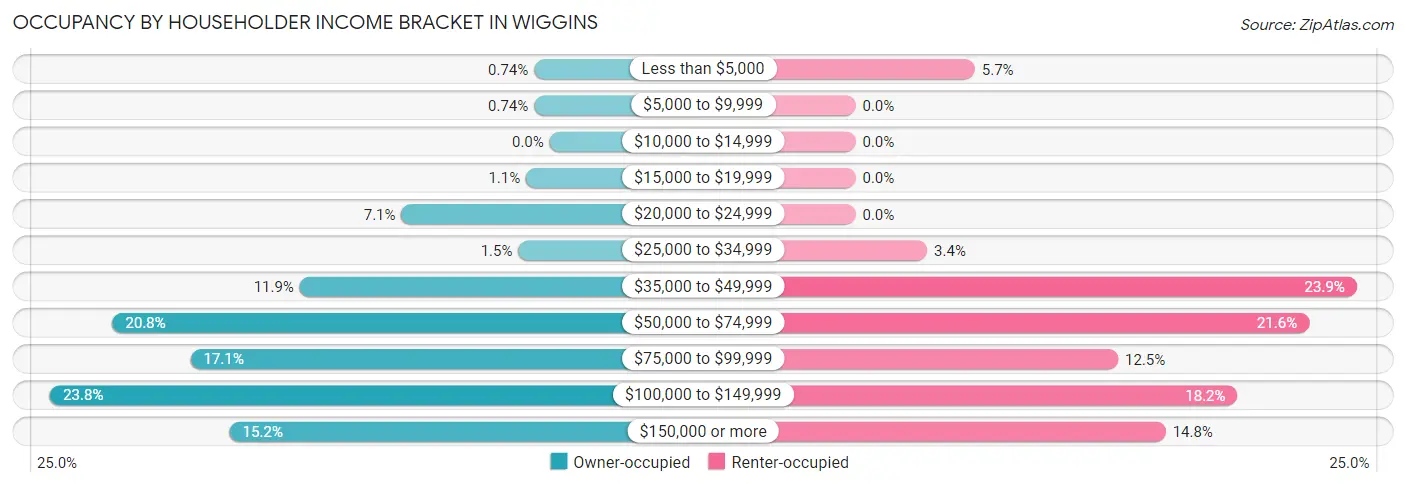
| Income Bracket | Owner-occupied | Renter-occupied |
| Less than $5,000 | 2 (0.7%) | 5 (5.7%) |
| $5,000 to $9,999 | 2 (0.7%) | 0 (0.0%) |
| $10,000 to $14,999 | 0 (0.0%) | 0 (0.0%) |
| $15,000 to $19,999 | 3 (1.1%) | 0 (0.0%) |
| $20,000 to $24,999 | 19 (7.1%) | 0 (0.0%) |
| $25,000 to $34,999 | 4 (1.5%) | 3 (3.4%) |
| $35,000 to $49,999 | 32 (11.9%) | 21 (23.9%) |
| $50,000 to $74,999 | 56 (20.8%) | 19 (21.6%) |
| $75,000 to $99,999 | 46 (17.1%) | 11 (12.5%) |
| $100,000 to $149,999 | 64 (23.8%) | 16 (18.2%) |
| $150,000 or more | 41 (15.2%) | 13 (14.8%) |
| Total | 269 (100.0%) | 88 (100.0%) |
Monthly Housing Cost Tiers in Wiggins
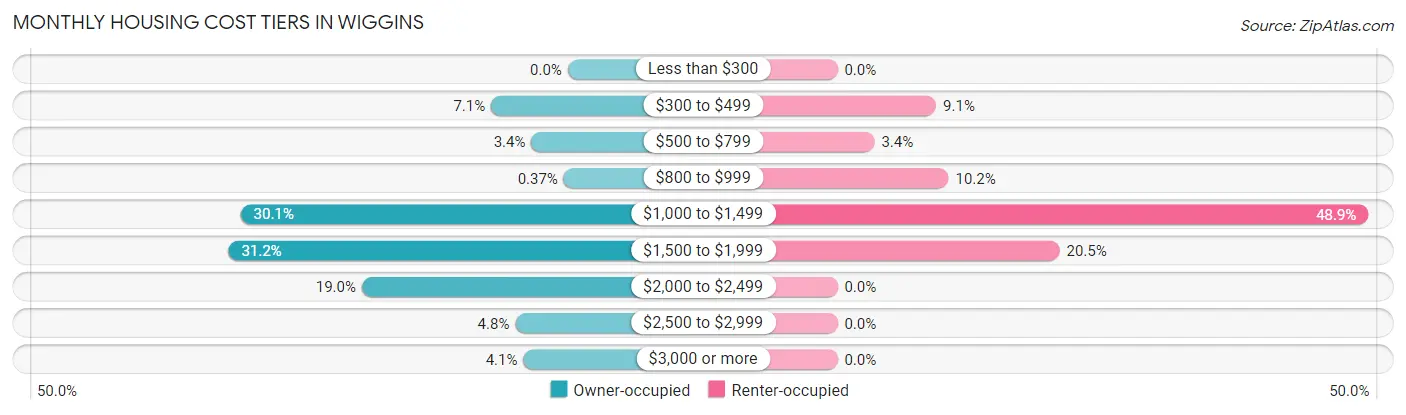
| Monthly Cost | Owner-occupied | Renter-occupied |
| Less than $300 | 0 (0.0%) | 0 (0.0%) |
| $300 to $499 | 19 (7.1%) | 8 (9.1%) |
| $500 to $799 | 9 (3.4%) | 3 (3.4%) |
| $800 to $999 | 1 (0.4%) | 9 (10.2%) |
| $1,000 to $1,499 | 81 (30.1%) | 43 (48.9%) |
| $1,500 to $1,999 | 84 (31.2%) | 18 (20.4%) |
| $2,000 to $2,499 | 51 (19.0%) | 0 (0.0%) |
| $2,500 to $2,999 | 13 (4.8%) | 0 (0.0%) |
| $3,000 or more | 11 (4.1%) | 0 (0.0%) |
| Total | 269 (100.0%) | 88 (100.0%) |
Physical Housing Characteristics in Wiggins
Housing Structures in Wiggins
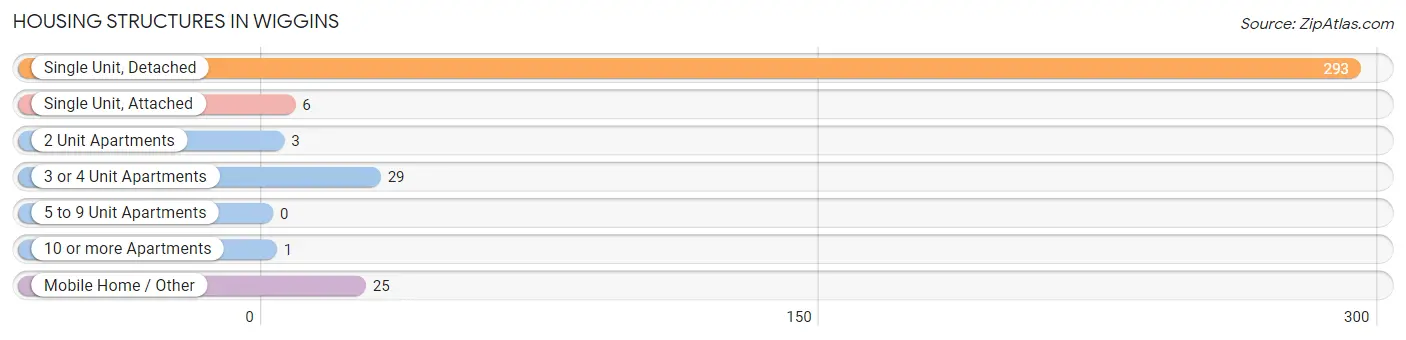
| Structure Type | # Housing Units | % Housing Units |
| Single Unit, Detached | 293 | 82.1% |
| Single Unit, Attached | 6 | 1.7% |
| 2 Unit Apartments | 3 | 0.8% |
| 3 or 4 Unit Apartments | 29 | 8.1% |
| 5 to 9 Unit Apartments | 0 | 0.0% |
| 10 or more Apartments | 1 | 0.3% |
| Mobile Home / Other | 25 | 7.0% |
| Total | 357 | 100.0% |
Housing Structures by Occupancy in Wiggins
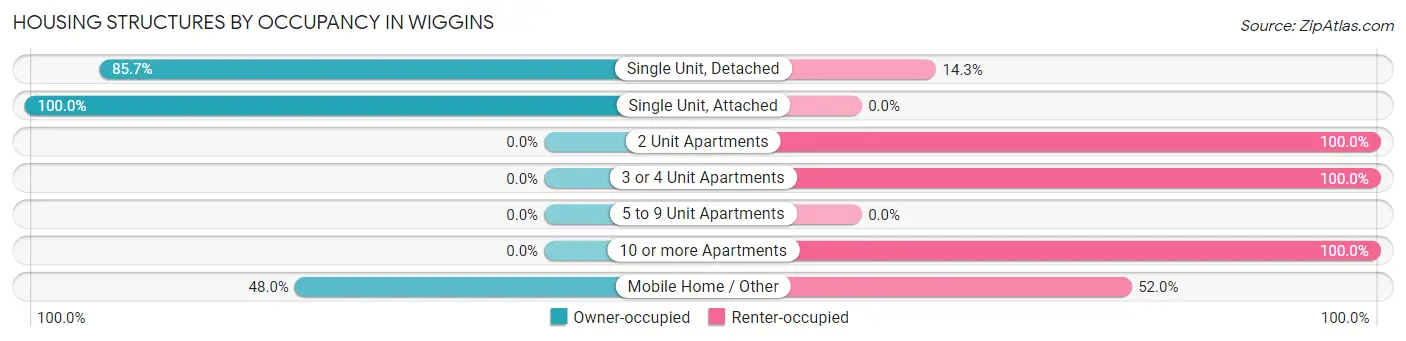
| Structure Type | Owner-occupied | Renter-occupied |
| Single Unit, Detached | 251 (85.7%) | 42 (14.3%) |
| Single Unit, Attached | 6 (100.0%) | 0 (0.0%) |
| 2 Unit Apartments | 0 (0.0%) | 3 (100.0%) |
| 3 or 4 Unit Apartments | 0 (0.0%) | 29 (100.0%) |
| 5 to 9 Unit Apartments | 0 (0.0%) | 0 (0.0%) |
| 10 or more Apartments | 0 (0.0%) | 1 (100.0%) |
| Mobile Home / Other | 12 (48.0%) | 13 (52.0%) |
| Total | 269 (75.3%) | 88 (24.6%) |
Housing Structures by Number of Rooms in Wiggins
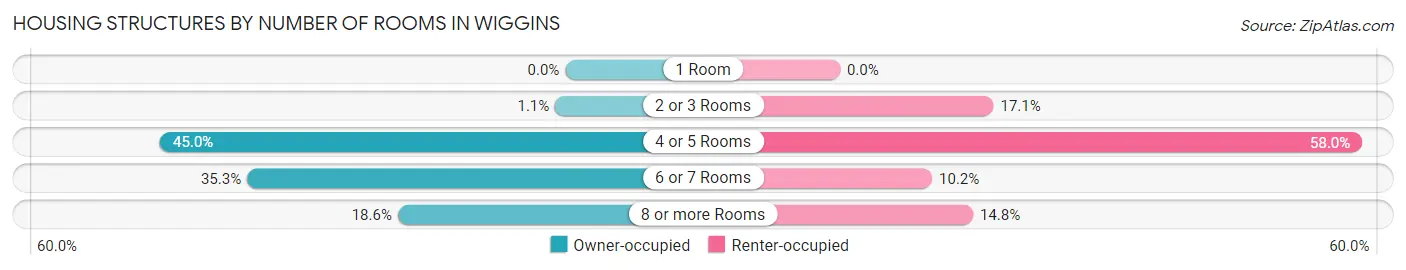
| Number of Rooms | Owner-occupied | Renter-occupied |
| 1 Room | 0 (0.0%) | 0 (0.0%) |
| 2 or 3 Rooms | 3 (1.1%) | 15 (17.1%) |
| 4 or 5 Rooms | 121 (45.0%) | 51 (58.0%) |
| 6 or 7 Rooms | 95 (35.3%) | 9 (10.2%) |
| 8 or more Rooms | 50 (18.6%) | 13 (14.8%) |
| Total | 269 (100.0%) | 88 (100.0%) |
Housing Structure by Heating Type in Wiggins
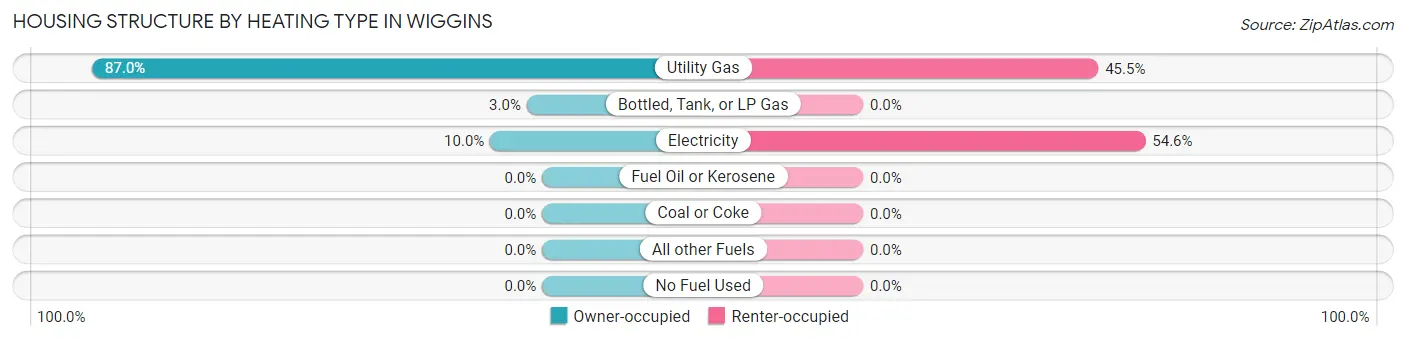
| Heating Type | Owner-occupied | Renter-occupied |
| Utility Gas | 234 (87.0%) | 40 (45.5%) |
| Bottled, Tank, or LP Gas | 8 (3.0%) | 0 (0.0%) |
| Electricity | 27 (10.0%) | 48 (54.5%) |
| Fuel Oil or Kerosene | 0 (0.0%) | 0 (0.0%) |
| Coal or Coke | 0 (0.0%) | 0 (0.0%) |
| All other Fuels | 0 (0.0%) | 0 (0.0%) |
| No Fuel Used | 0 (0.0%) | 0 (0.0%) |
| Total | 269 (100.0%) | 88 (100.0%) |
Household Vehicle Usage in Wiggins
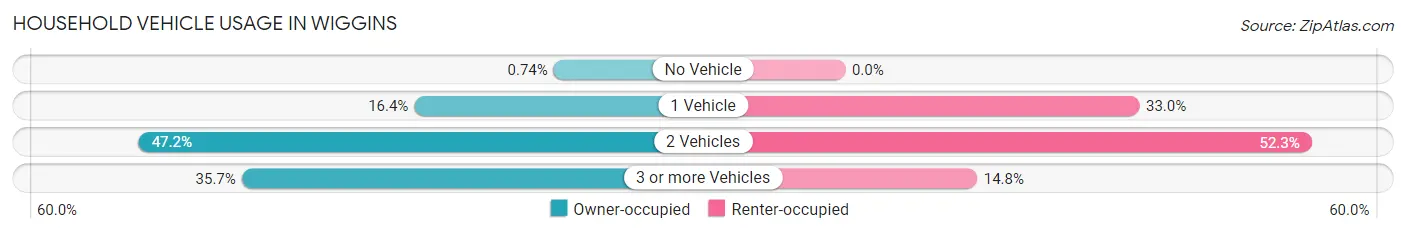
| Vehicles per Household | Owner-occupied | Renter-occupied |
| No Vehicle | 2 (0.7%) | 0 (0.0%) |
| 1 Vehicle | 44 (16.4%) | 29 (33.0%) |
| 2 Vehicles | 127 (47.2%) | 46 (52.3%) |
| 3 or more Vehicles | 96 (35.7%) | 13 (14.8%) |
| Total | 269 (100.0%) | 88 (100.0%) |
Real Estate & Mortgages in Wiggins
Real Estate and Mortgage Overview in Wiggins
| Characteristic | Without Mortgage | With Mortgage |
| Housing Units | 26 | 243 |
| Median Property Value | $237,500 | $298,700 |
| Median Household Income | $55,000 | $41 |
| Monthly Housing Costs | $464 | $11 |
| Real Estate Taxes | $1,350 | $9 |
Property Value by Mortgage Status in Wiggins
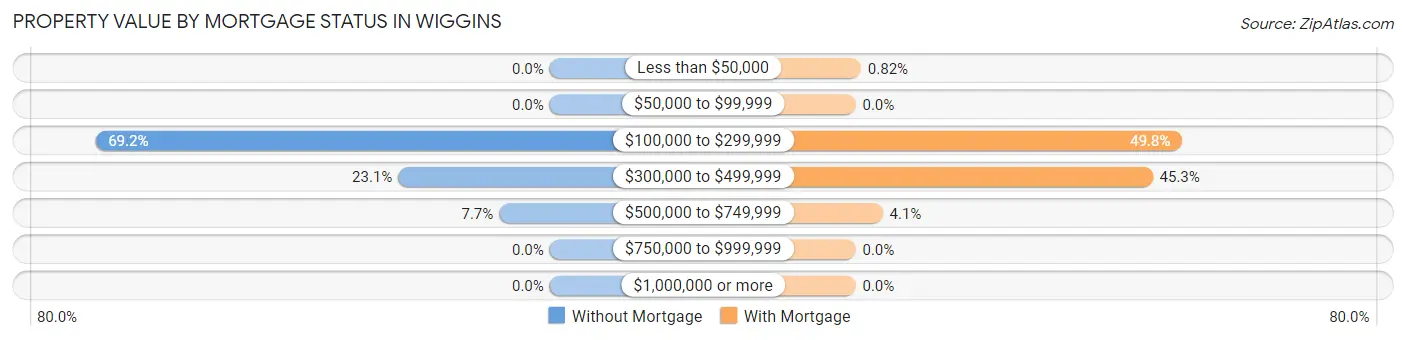
| Property Value | Without Mortgage | With Mortgage |
| Less than $50,000 | 0 (0.0%) | 2 (0.8%) |
| $50,000 to $99,999 | 0 (0.0%) | 0 (0.0%) |
| $100,000 to $299,999 | 18 (69.2%) | 121 (49.8%) |
| $300,000 to $499,999 | 6 (23.1%) | 110 (45.3%) |
| $500,000 to $749,999 | 2 (7.7%) | 10 (4.1%) |
| $750,000 to $999,999 | 0 (0.0%) | 0 (0.0%) |
| $1,000,000 or more | 0 (0.0%) | 0 (0.0%) |
| Total | 26 (100.0%) | 243 (100.0%) |
Household Income by Mortgage Status in Wiggins
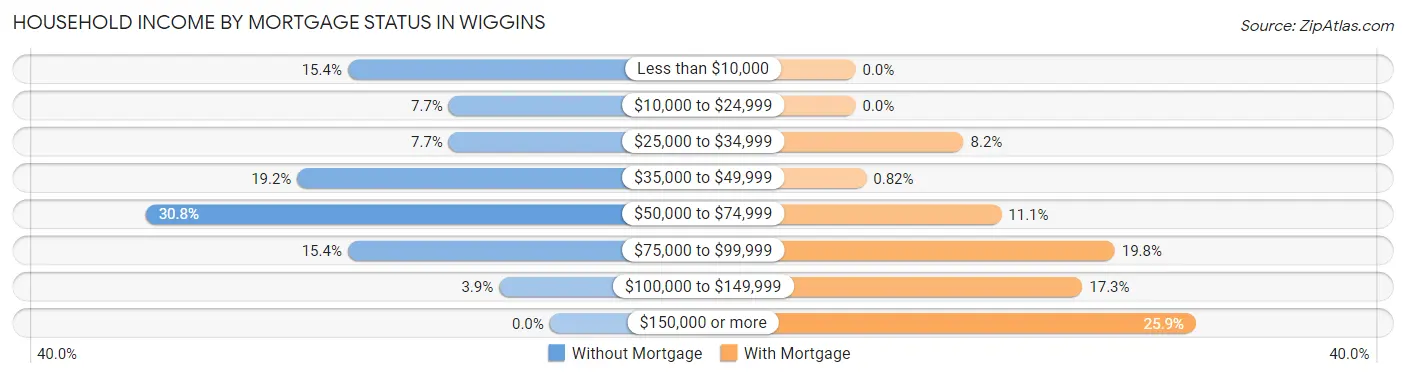
| Household Income | Without Mortgage | With Mortgage |
| Less than $10,000 | 4 (15.4%) | 0 (0.0%) |
| $10,000 to $24,999 | 2 (7.7%) | 0 (0.0%) |
| $25,000 to $34,999 | 2 (7.7%) | 20 (8.2%) |
| $35,000 to $49,999 | 5 (19.2%) | 2 (0.8%) |
| $50,000 to $74,999 | 8 (30.8%) | 27 (11.1%) |
| $75,000 to $99,999 | 4 (15.4%) | 48 (19.8%) |
| $100,000 to $149,999 | 1 (3.8%) | 42 (17.3%) |
| $150,000 or more | 0 (0.0%) | 63 (25.9%) |
| Total | 26 (100.0%) | 243 (100.0%) |
Property Value to Household Income Ratio in Wiggins
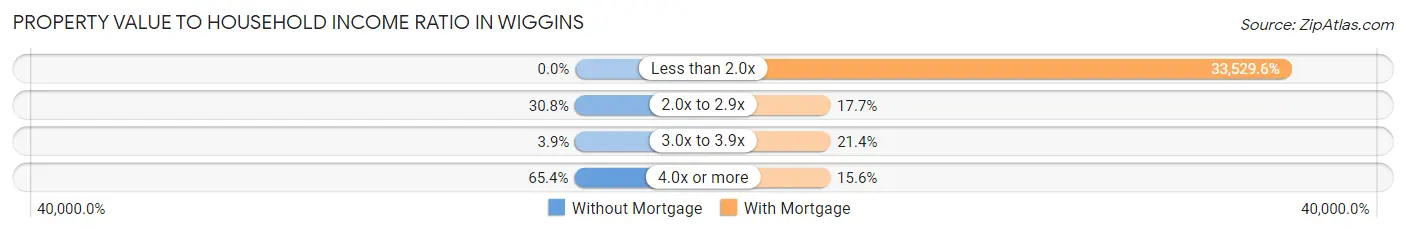
| Value-to-Income Ratio | Without Mortgage | With Mortgage |
| Less than 2.0x | 0 (0.0%) | 81,477 (33,529.6%) |
| 2.0x to 2.9x | 8 (30.8%) | 43 (17.7%) |
| 3.0x to 3.9x | 1 (3.8%) | 52 (21.4%) |
| 4.0x or more | 17 (65.4%) | 38 (15.6%) |
| Total | 26 (100.0%) | 243 (100.0%) |
Real Estate Taxes by Mortgage Status in Wiggins
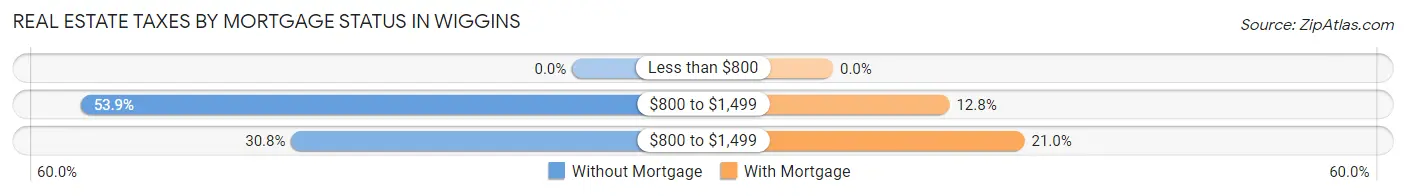
| Property Taxes | Without Mortgage | With Mortgage |
| Less than $800 | 0 (0.0%) | 0 (0.0%) |
| $800 to $1,499 | 14 (53.8%) | 31 (12.8%) |
| $800 to $1,499 | 8 (30.8%) | 51 (21.0%) |
| Total | 26 (100.0%) | 243 (100.0%) |
Health & Disability in Wiggins
Health Insurance Coverage by Age in Wiggins
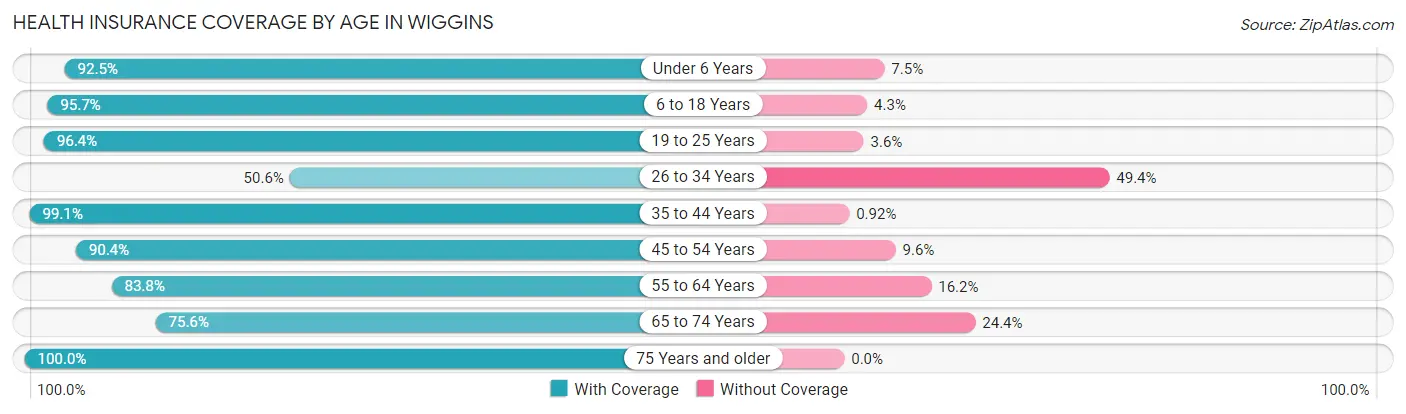
| Age Bracket | With Coverage | Without Coverage |
| Under 6 Years | 99 (92.5%) | 8 (7.5%) |
| 6 to 18 Years | 270 (95.7%) | 12 (4.3%) |
| 19 to 25 Years | 107 (96.4%) | 4 (3.6%) |
| 26 to 34 Years | 88 (50.6%) | 86 (49.4%) |
| 35 to 44 Years | 108 (99.1%) | 1 (0.9%) |
| 45 to 54 Years | 85 (90.4%) | 9 (9.6%) |
| 55 to 64 Years | 124 (83.8%) | 24 (16.2%) |
| 65 to 74 Years | 68 (75.6%) | 22 (24.4%) |
| 75 Years and older | 23 (100.0%) | 0 (0.0%) |
| Total | 972 (85.4%) | 166 (14.6%) |
Health Insurance Coverage by Citizenship Status in Wiggins
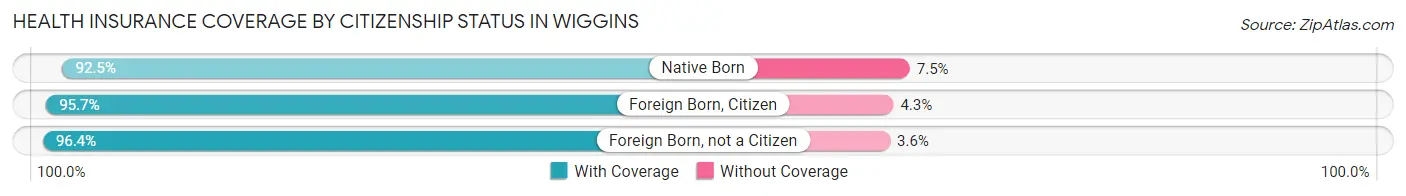
| Citizenship Status | With Coverage | Without Coverage |
| Native Born | 99 (92.5%) | 8 (7.5%) |
| Foreign Born, Citizen | 270 (95.7%) | 12 (4.3%) |
| Foreign Born, not a Citizen | 107 (96.4%) | 4 (3.6%) |
Health Insurance Coverage by Household Income in Wiggins
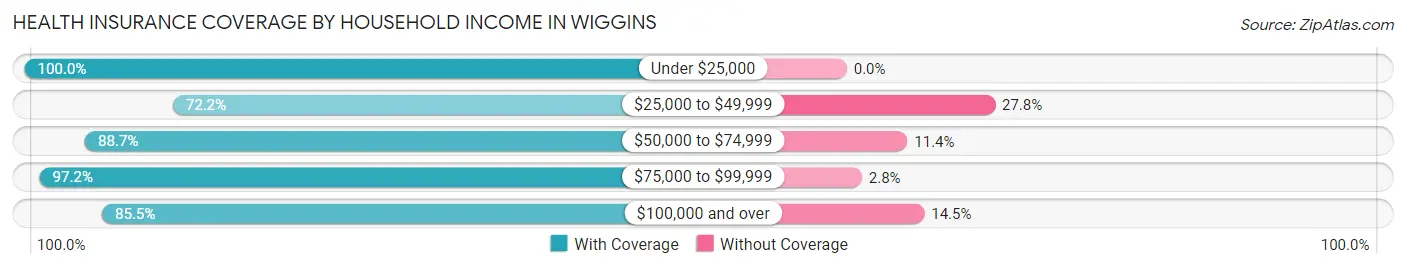
| Household Income | With Coverage | Without Coverage |
| Under $25,000 | 44 (100.0%) | 0 (0.0%) |
| $25,000 to $49,999 | 169 (72.2%) | 65 (27.8%) |
| $50,000 to $74,999 | 203 (88.6%) | 26 (11.4%) |
| $75,000 to $99,999 | 138 (97.2%) | 4 (2.8%) |
| $100,000 and over | 418 (85.5%) | 71 (14.5%) |
Public vs Private Health Insurance Coverage by Age in Wiggins
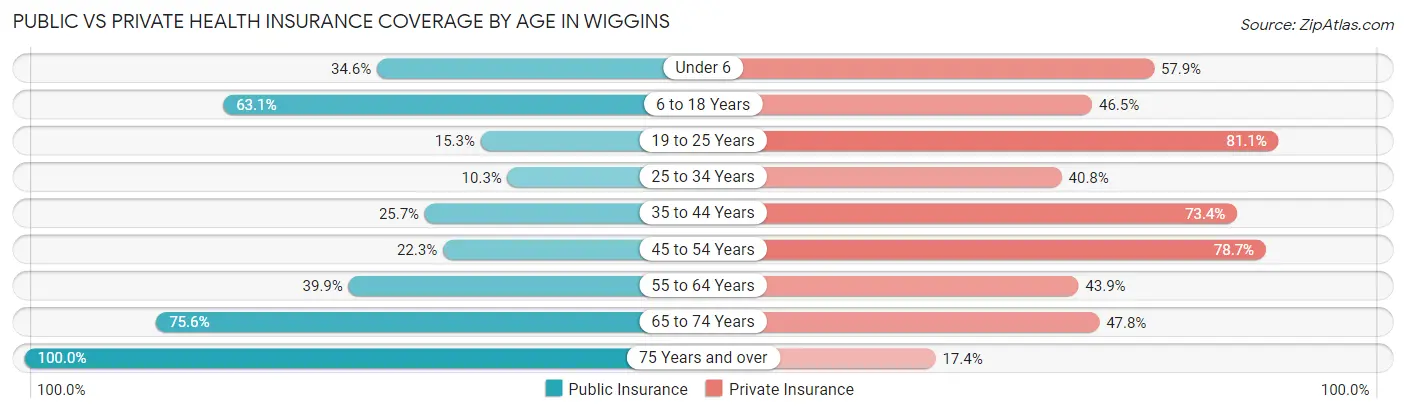
| Age Bracket | Public Insurance | Private Insurance |
| Under 6 | 37 (34.6%) | 62 (57.9%) |
| 6 to 18 Years | 178 (63.1%) | 131 (46.5%) |
| 19 to 25 Years | 17 (15.3%) | 90 (81.1%) |
| 25 to 34 Years | 18 (10.3%) | 71 (40.8%) |
| 35 to 44 Years | 28 (25.7%) | 80 (73.4%) |
| 45 to 54 Years | 21 (22.3%) | 74 (78.7%) |
| 55 to 64 Years | 59 (39.9%) | 65 (43.9%) |
| 65 to 74 Years | 68 (75.6%) | 43 (47.8%) |
| 75 Years and over | 23 (100.0%) | 4 (17.4%) |
| Total | 449 (39.5%) | 620 (54.5%) |
Disability Status by Sex by Age in Wiggins
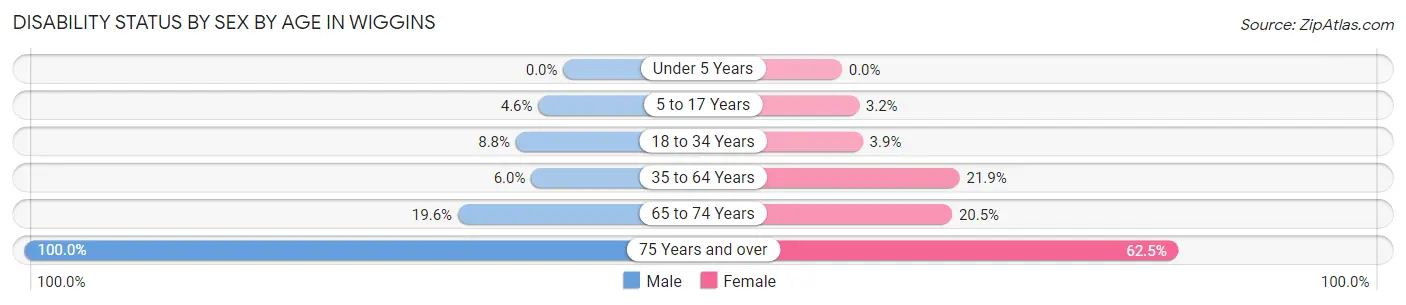
| Age Bracket | Male | Female |
| Under 5 Years | 0 (0.0%) | 0 (0.0%) |
| 5 to 17 Years | 7 (4.6%) | 5 (3.2%) |
| 18 to 34 Years | 12 (8.8%) | 6 (3.9%) |
| 35 to 64 Years | 10 (5.9%) | 40 (21.9%) |
| 65 to 74 Years | 9 (19.6%) | 9 (20.4%) |
| 75 Years and over | 7 (100.0%) | 10 (62.5%) |
Disability Class by Sex by Age in Wiggins
Disability Class: Hearing Difficulty
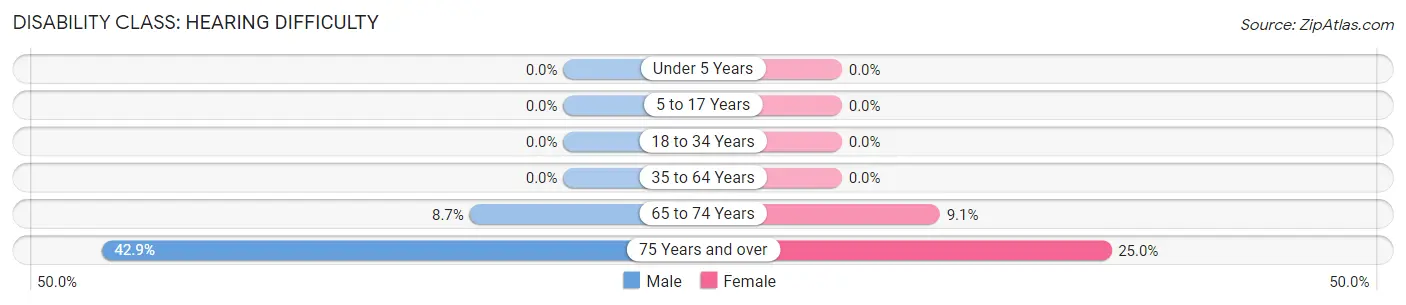
| Age Bracket | Male | Female |
| Under 5 Years | 0 (0.0%) | 0 (0.0%) |
| 5 to 17 Years | 0 (0.0%) | 0 (0.0%) |
| 18 to 34 Years | 0 (0.0%) | 0 (0.0%) |
| 35 to 64 Years | 0 (0.0%) | 0 (0.0%) |
| 65 to 74 Years | 4 (8.7%) | 4 (9.1%) |
| 75 Years and over | 3 (42.9%) | 4 (25.0%) |
Disability Class: Vision Difficulty
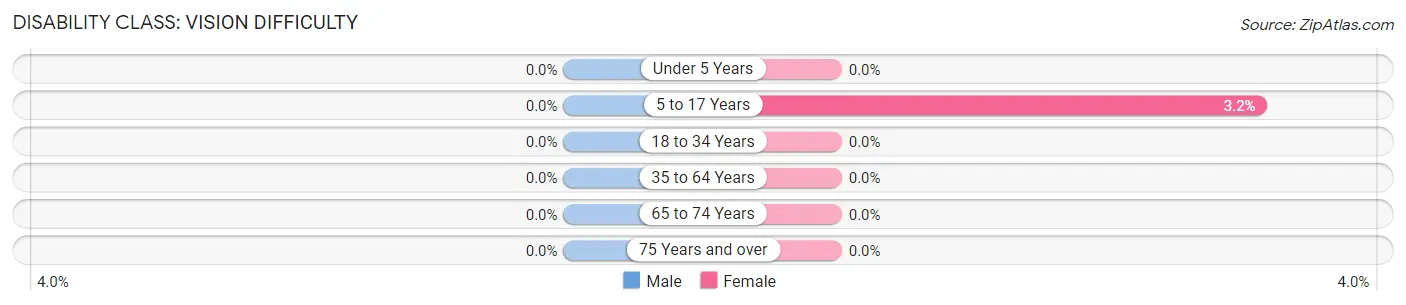
| Age Bracket | Male | Female |
| Under 5 Years | 0 (0.0%) | 0 (0.0%) |
| 5 to 17 Years | 0 (0.0%) | 5 (3.2%) |
| 18 to 34 Years | 0 (0.0%) | 0 (0.0%) |
| 35 to 64 Years | 0 (0.0%) | 0 (0.0%) |
| 65 to 74 Years | 0 (0.0%) | 0 (0.0%) |
| 75 Years and over | 0 (0.0%) | 0 (0.0%) |
Disability Class: Cognitive Difficulty
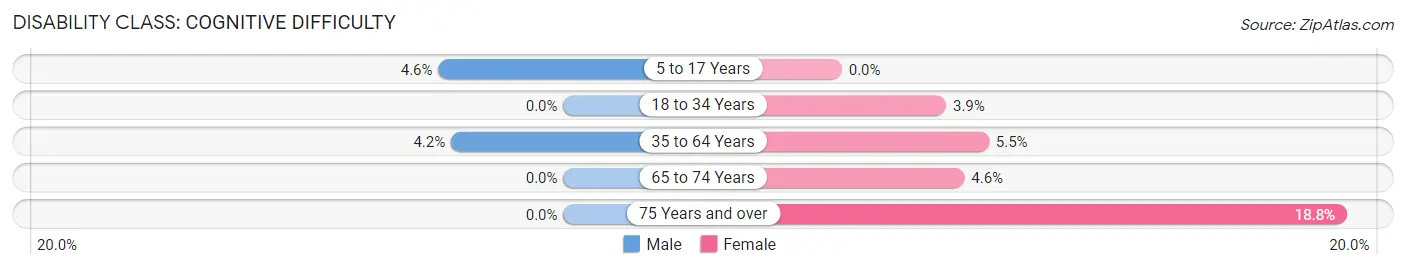
| Age Bracket | Male | Female |
| 5 to 17 Years | 7 (4.6%) | 0 (0.0%) |
| 18 to 34 Years | 0 (0.0%) | 6 (3.9%) |
| 35 to 64 Years | 7 (4.2%) | 10 (5.5%) |
| 65 to 74 Years | 0 (0.0%) | 2 (4.5%) |
| 75 Years and over | 0 (0.0%) | 3 (18.8%) |
Disability Class: Ambulatory Difficulty
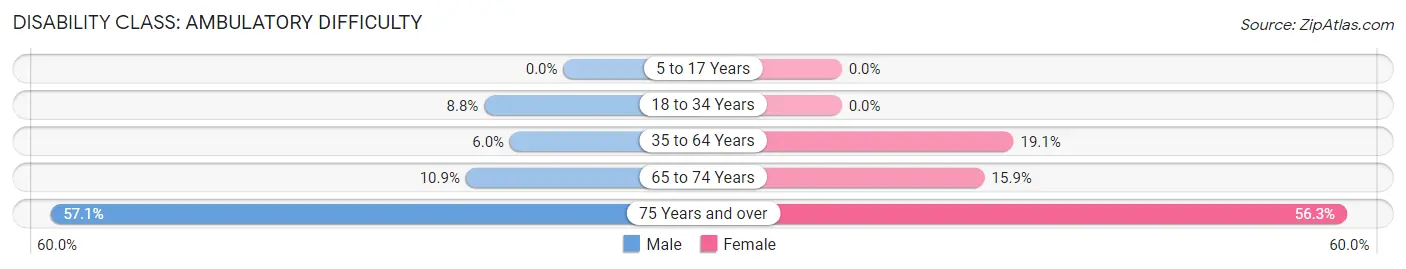
| Age Bracket | Male | Female |
| 5 to 17 Years | 0 (0.0%) | 0 (0.0%) |
| 18 to 34 Years | 12 (8.8%) | 0 (0.0%) |
| 35 to 64 Years | 10 (5.9%) | 35 (19.1%) |
| 65 to 74 Years | 5 (10.9%) | 7 (15.9%) |
| 75 Years and over | 4 (57.1%) | 9 (56.2%) |
Disability Class: Self-Care Difficulty
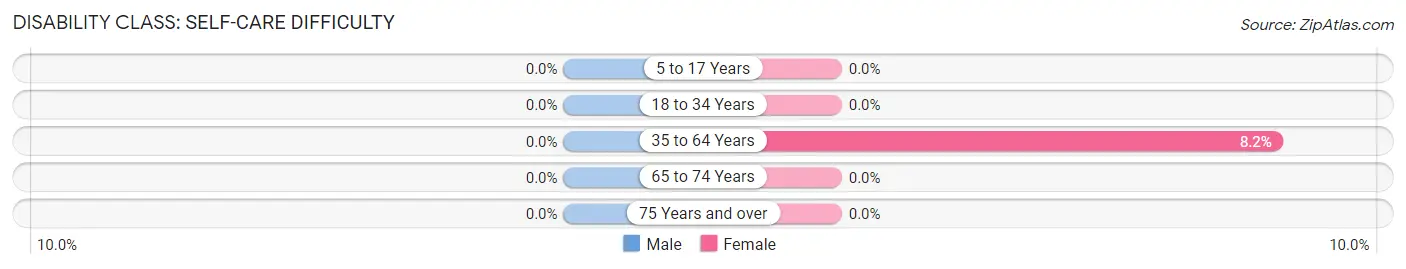
| Age Bracket | Male | Female |
| 5 to 17 Years | 0 (0.0%) | 0 (0.0%) |
| 18 to 34 Years | 0 (0.0%) | 0 (0.0%) |
| 35 to 64 Years | 0 (0.0%) | 15 (8.2%) |
| 65 to 74 Years | 0 (0.0%) | 0 (0.0%) |
| 75 Years and over | 0 (0.0%) | 0 (0.0%) |
Technology Access in Wiggins
Computing Device Access in Wiggins
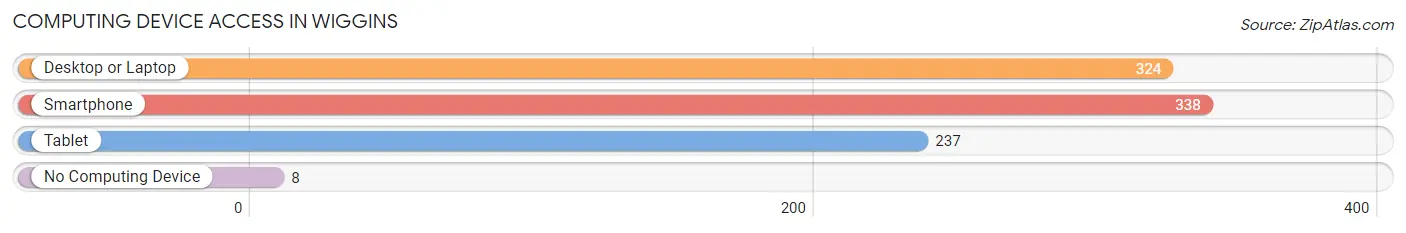
| Device Type | # Households | % Households |
| Desktop or Laptop | 324 | 90.8% |
| Smartphone | 338 | 94.7% |
| Tablet | 237 | 66.4% |
| No Computing Device | 8 | 2.2% |
| Total | 357 | 100.0% |
Internet Access in Wiggins
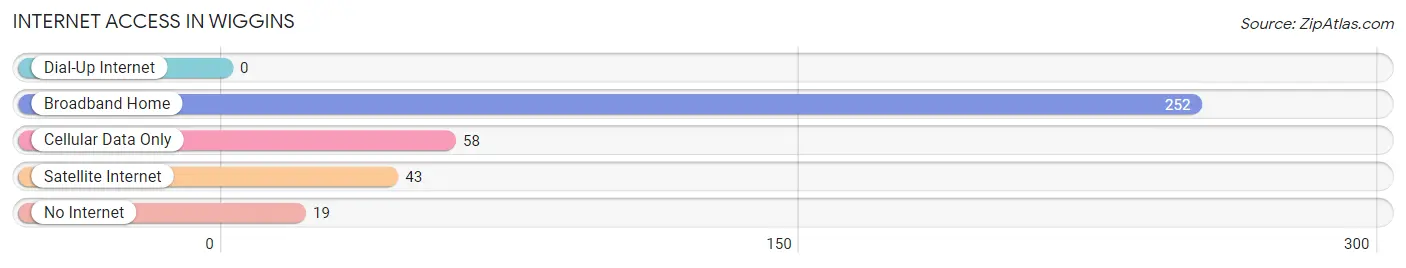
| Internet Type | # Households | % Households |
| Dial-Up Internet | 0 | 0.0% |
| Broadband Home | 252 | 70.6% |
| Cellular Data Only | 58 | 16.3% |
| Satellite Internet | 43 | 12.0% |
| No Internet | 19 | 5.3% |
| Total | 357 | 100.0% |
Wiggins Summary
Wiggins is a small town located in Morgan County, Colorado, United States. It is situated along the South Platte River, approximately 40 miles northeast of Denver. The town was founded in 1887 and named after the first postmaster, John Wiggins. The population was 1,068 at the 2010 census.
History
The town of Wiggins was founded in 1887 by John Wiggins, who was the first postmaster. The town was originally called "Wigginsville" but was later shortened to "Wiggins". The town was incorporated in 1891 and was the first town in Morgan County to be incorporated.
The town was originally a farming community, but in the early 1900s, the town began to grow and develop. The first bank was established in 1902, and the first school was built in 1903. The town also had a newspaper, the Wiggins News, which was published from 1906 to 1915.
In the 1920s, the town began to experience a period of growth and prosperity. The town was home to several businesses, including a hotel, a movie theater, a grocery store, and a hardware store. The town also had a train station, which was used to transport goods and passengers to and from Denver.
In the 1950s, the town began to decline as the railroad industry began to decline. The town's population decreased and many businesses closed. In the 1970s, the town began to experience a resurgence as new businesses opened and the population began to increase.
Geography
Wiggins is located in Morgan County, Colorado, at the intersection of State Highway 52 and County Road 8. The town is situated along the South Platte River, approximately 40 miles northeast of Denver. The town has a total area of 0.9 square miles, all of which is land.
Economy
The economy of Wiggins is largely based on agriculture and tourism. The town is home to several farms, which produce a variety of crops, including corn, wheat, and hay. The town is also home to several tourist attractions, including the Wiggins Museum, which features artifacts from the town's history, and the Wiggins Historical Park, which features a variety of historic buildings.
Demographics
As of the 2010 census, there were 1,068 people, 431 households, and 287 families residing in the town. The population density was 1,179.3 people per square mile. The racial makeup of the town was 94.2% White, 0.3% African American, 0.7% Native American, 0.3% Asian, 0.1% Pacific Islander, 2.3% from other races, and 2.3% from two or more races. Hispanic or Latino of any race were 5.2% of the population.
The median income for a household in the town was $37,500, and the median income for a family was $45,000. The per capita income for the town was $17,845. About 11.3% of families and 14.2% of the population were below the poverty line, including 18.2% of those under age 18 and 8.3% of those age 65 or over.
Common Questions
What is Per Capita Income in Wiggins?
Per Capita income in Wiggins is $27,548.
What is the Median Family Income in Wiggins?
Median Family Income in Wiggins is $81,094.
What is the Median Household income in Wiggins?
Median Household Income in Wiggins is $77,083.
What is Income or Wage Gap in Wiggins?
Income or Wage Gap in Wiggins is 54.2%.
Women in Wiggins earn 45.8 cents for every dollar earned by a man.
What is Inequality or Gini Index in Wiggins?
Inequality or Gini Index in Wiggins is 0.32.
What is the Total Population of Wiggins?
Total Population of Wiggins is 1,138.
What is the Total Male Population of Wiggins?
Total Male Population of Wiggins is 533.
What is the Total Female Population of Wiggins?
Total Female Population of Wiggins is 605.
What is the Ratio of Males per 100 Females in Wiggins?
There are 88.10 Males per 100 Females in Wiggins.
What is the Ratio of Females per 100 Males in Wiggins?
There are 113.51 Females per 100 Males in Wiggins.
What is the Median Population Age in Wiggins?
Median Population Age in Wiggins is 30.4 Years.
What is the Average Family Size in Wiggins
Average Family Size in Wiggins is 3.6 People.
What is the Average Household Size in Wiggins
Average Household Size in Wiggins is 3.2 People.
How Large is the Labor Force in Wiggins?
There are 562 People in the Labor Forcein in Wiggins.
What is the Percentage of People in the Labor Force in Wiggins?
71.0% of People are in the Labor Force in Wiggins.
What is the Unemployment Rate in Wiggins?
Unemployment Rate in Wiggins is 7.3%.