Walden, CO Map & Demographics
Walden Map
Walden Overview
$29,651
PER CAPITA INCOME
$35,556
AVG FAMILY INCOME
$35,278
AVG HOUSEHOLD INCOME
70.4%
WAGE / INCOME GAP [ % ]
29.6¢/ $1
WAGE / INCOME GAP [ $ ]
0.51
INEQUALITY / GINI INDEX
704
TOTAL POPULATION
362
MALE POPULATION
342
FEMALE POPULATION
105.85
MALES / 100 FEMALES
94.48
FEMALES / 100 MALES
51.1
MEDIAN AGE
3.2
AVG FAMILY SIZE
2.1
AVG HOUSEHOLD SIZE
338
LABOR FORCE [ PEOPLE ]
54.6%
PERCENT IN LABOR FORCE
Walden Zip Codes
Walden Area Codes
Income in Walden
Income Overview in Walden
Per Capita Income in Walden is $29,651, while median incomes of families and households are $35,556 and $35,278 respectively.
| Characteristic | Number | Measure |
| Per Capita Income | 704 | $29,651 |
| Median Family Income | 150 | $35,556 |
| Mean Family Income | 150 | $75,863 |
| Median Household Income | 324 | $35,278 |
| Mean Household Income | 324 | $64,164 |
| Income Deficit | 150 | $0 |
| Wage / Income Gap (%) | 704 | 70.41% |
| Wage / Income Gap ($) | 704 | 29.59¢ per $1 |
| Gini / Inequality Index | 704 | 0.51 |
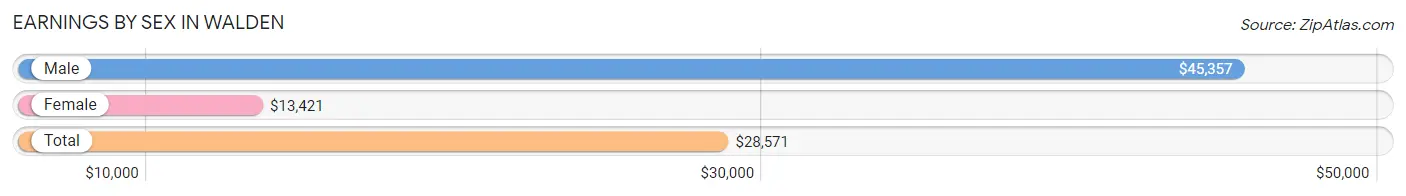
Earnings by Sex in Walden
Average Earnings in Walden are $28,571, $45,357 for men and $13,421 for women, a difference of 70.4%.
| Sex | Number | Average Earnings |
| Male | 200 (54.3%) | $45,357 |
| Female | 168 (45.7%) | $13,421 |
| Total | 368 (100.0%) | $28,571 |
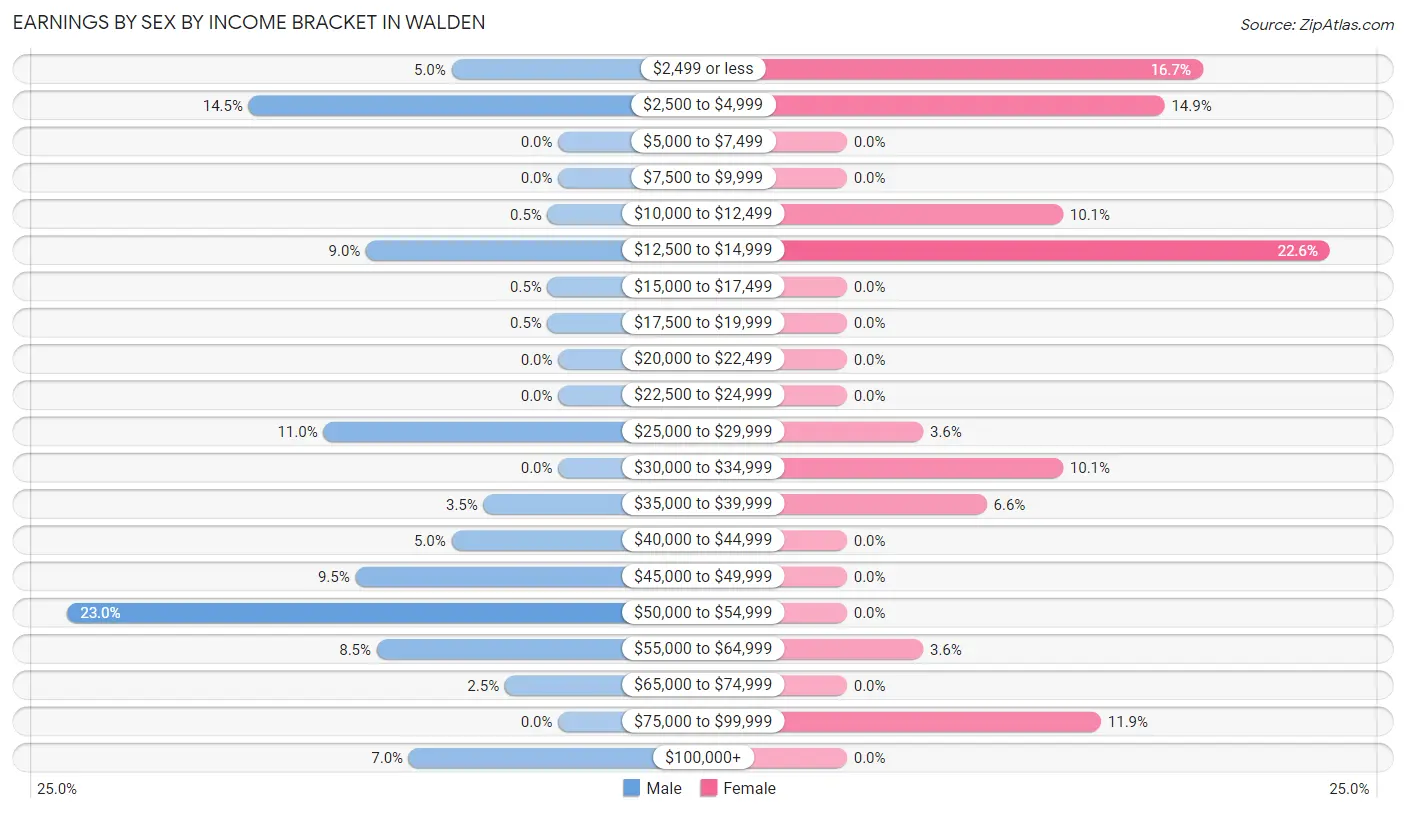
Earnings by Sex by Income Bracket in Walden
The most common earnings brackets in Walden are $50,000 to $54,999 for men (46 | 23.0%) and $12,500 to $14,999 for women (38 | 22.6%).
| Income | Male | Female |
| $2,499 or less | 10 (5.0%) | 28 (16.7%) |
| $2,500 to $4,999 | 29 (14.5%) | 25 (14.9%) |
| $5,000 to $7,499 | 0 (0.0%) | 0 (0.0%) |
| $7,500 to $9,999 | 0 (0.0%) | 0 (0.0%) |
| $10,000 to $12,499 | 1 (0.5%) | 17 (10.1%) |
| $12,500 to $14,999 | 18 (9.0%) | 38 (22.6%) |
| $15,000 to $17,499 | 1 (0.5%) | 0 (0.0%) |
| $17,500 to $19,999 | 1 (0.5%) | 0 (0.0%) |
| $20,000 to $22,499 | 0 (0.0%) | 0 (0.0%) |
| $22,500 to $24,999 | 0 (0.0%) | 0 (0.0%) |
| $25,000 to $29,999 | 22 (11.0%) | 6 (3.6%) |
| $30,000 to $34,999 | 0 (0.0%) | 17 (10.1%) |
| $35,000 to $39,999 | 7 (3.5%) | 11 (6.6%) |
| $40,000 to $44,999 | 10 (5.0%) | 0 (0.0%) |
| $45,000 to $49,999 | 19 (9.5%) | 0 (0.0%) |
| $50,000 to $54,999 | 46 (23.0%) | 0 (0.0%) |
| $55,000 to $64,999 | 17 (8.5%) | 6 (3.6%) |
| $65,000 to $74,999 | 5 (2.5%) | 0 (0.0%) |
| $75,000 to $99,999 | 0 (0.0%) | 20 (11.9%) |
| $100,000+ | 14 (7.0%) | 0 (0.0%) |
| Total | 200 (100.0%) | 168 (100.0%) |
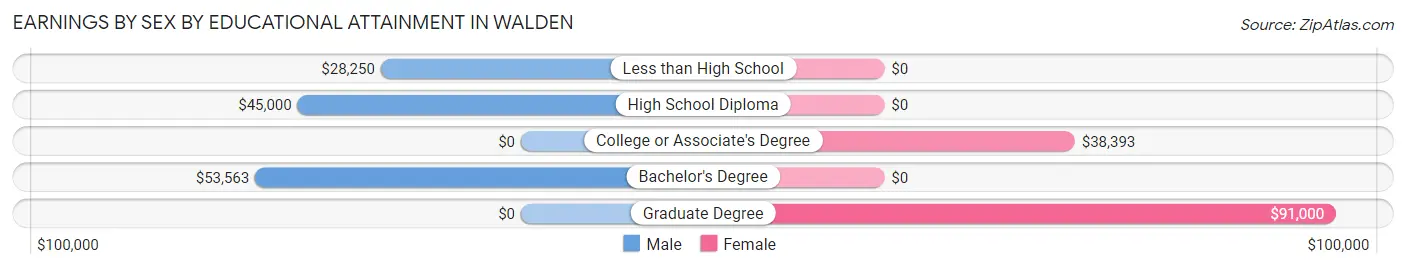
Earnings by Sex by Educational Attainment in Walden
| Educational Attainment | Male Income | Female Income |
| Less than High School | $28,250 | $0 |
| High School Diploma | $45,000 | $0 |
| College or Associate's Degree | - | - |
| Bachelor's Degree | $53,563 | $0 |
| Graduate Degree | - | - |
| Total | $46,786 | $0 |
Family Income in Walden
Family Income Brackets in Walden
According to the Walden family income data, there are 61 families falling into the $25,000 to $34,999 income range, which is the most common income bracket and makes up 40.7% of all families.
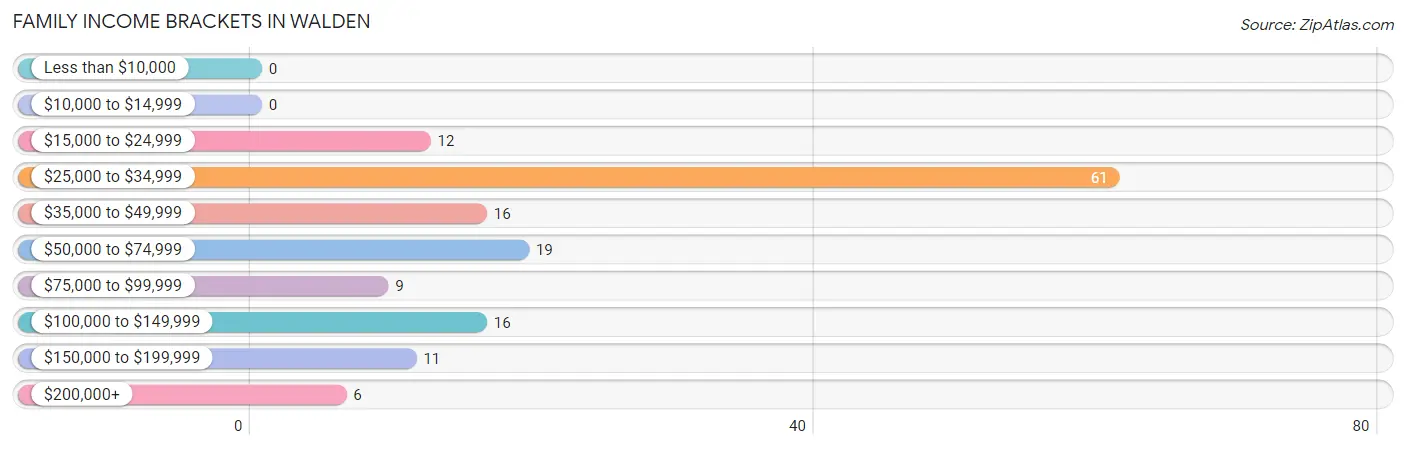
| Income Bracket | # Families | % Families |
| Less than $10,000 | 0 | 0.0% |
| $10,000 to $14,999 | 0 | 0.0% |
| $15,000 to $24,999 | 12 | 8.0% |
| $25,000 to $34,999 | 61 | 40.7% |
| $35,000 to $49,999 | 16 | 10.7% |
| $50,000 to $74,999 | 19 | 12.7% |
| $75,000 to $99,999 | 9 | 6.0% |
| $100,000 to $149,999 | 16 | 10.7% |
| $150,000 to $199,999 | 11 | 7.3% |
| $200,000+ | 6 | 4.0% |
Family Income by Famaliy Size in Walden
4-person families (46 | 30.7%) account for the highest median family income in Walden with $27,300 per family, while 4-person families (46 | 30.7%) have the highest median income of $6,825 per family member.
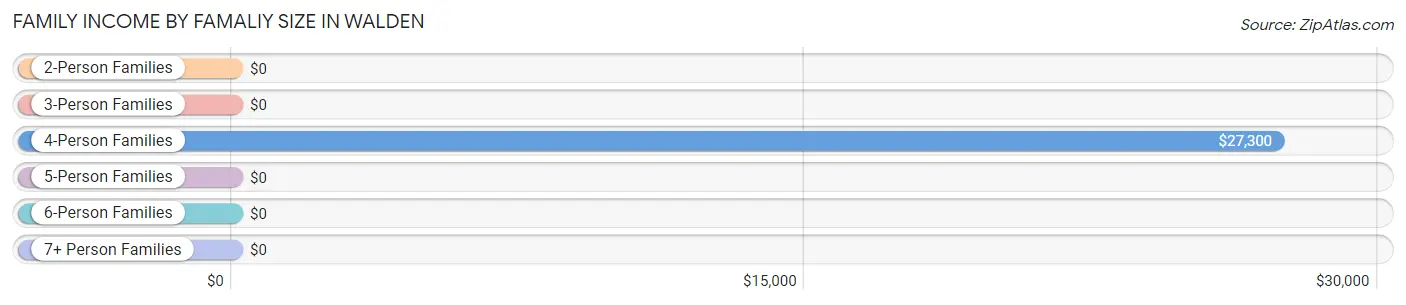
| Income Bracket | # Families | Median Income |
| 2-Person Families | 74 (49.3%) | $0 |
| 3-Person Families | 19 (12.7%) | $0 |
| 4-Person Families | 46 (30.7%) | $27,300 |
| 5-Person Families | 11 (7.3%) | $0 |
| 6-Person Families | 0 (0.0%) | $0 |
| 7+ Person Families | 0 (0.0%) | $0 |
| Total | 150 (100.0%) | $35,556 |
Family Income by Number of Earners in Walden
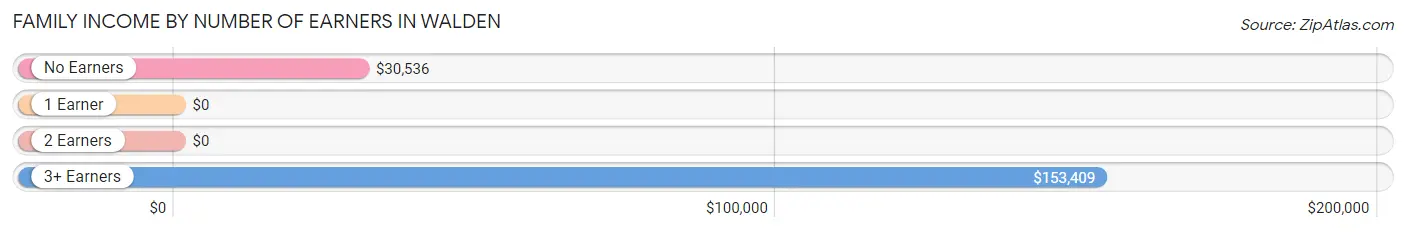
| Number of Earners | # Families | Median Income |
| No Earners | 33 (22.0%) | $30,536 |
| 1 Earner | 42 (28.0%) | $0 |
| 2 Earners | 49 (32.7%) | $0 |
| 3+ Earners | 26 (17.3%) | $153,409 |
| Total | 150 (100.0%) | $35,556 |
Household Income in Walden
Household Income Brackets in Walden
With 83 households falling in the category, the $25,000 to $34,999 income range is the most frequent in Walden, accounting for 25.6% of all households. In contrast, only 9 households (2.8%) fall into the less than $10,000 income bracket, making it the least populous group.
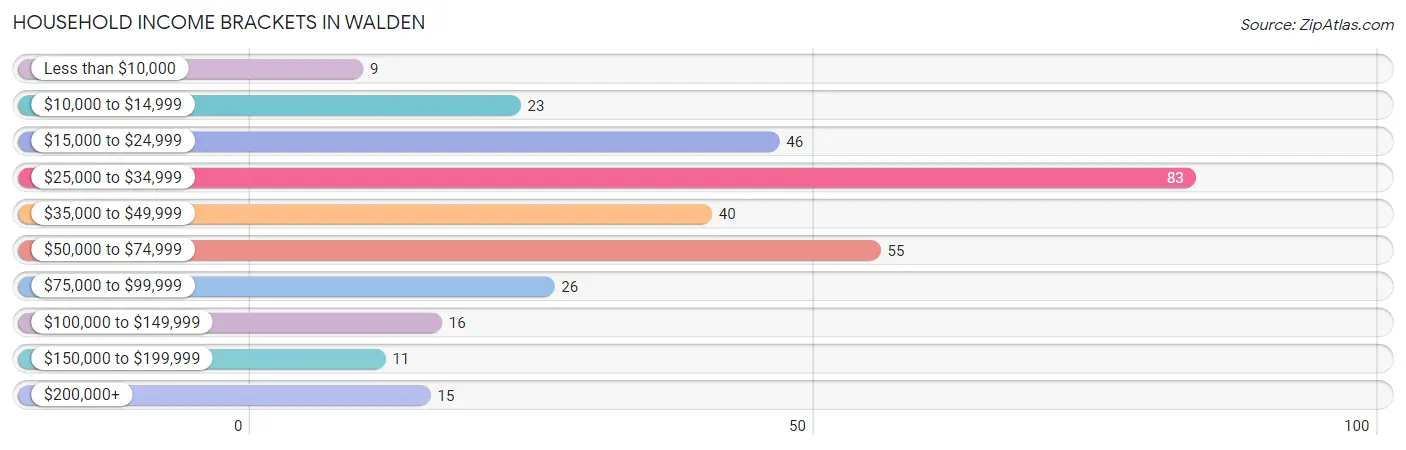
| Income Bracket | # Households | % Households |
| Less than $10,000 | 9 | 2.8% |
| $10,000 to $14,999 | 23 | 7.1% |
| $15,000 to $24,999 | 46 | 14.2% |
| $25,000 to $34,999 | 83 | 25.6% |
| $35,000 to $49,999 | 40 | 12.3% |
| $50,000 to $74,999 | 55 | 17.0% |
| $75,000 to $99,999 | 26 | 8.0% |
| $100,000 to $149,999 | 16 | 4.9% |
| $150,000 to $199,999 | 11 | 3.4% |
| $200,000+ | 15 | 4.6% |
Household Income by Householder Age in Walden
The median household income in Walden is $35,278, with the highest median household income of $53,938 found in the 25 to 44 years age bracket for the primary householder. A total of 55 households (17.0%) fall into this category.
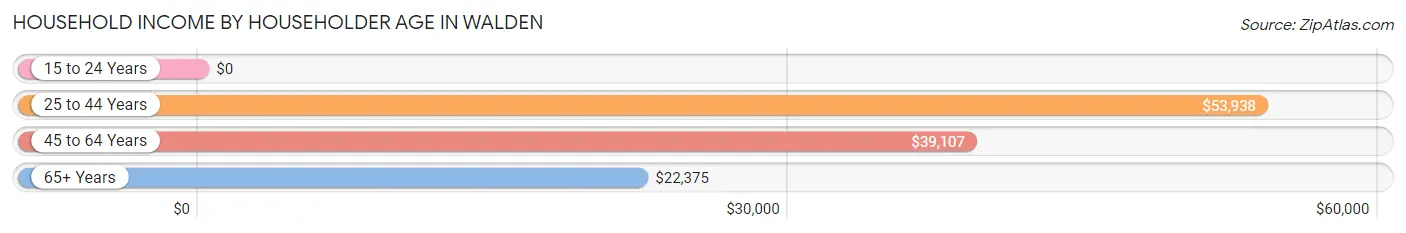
| Income Bracket | # Households | Median Income |
| 15 to 24 Years | 0 (0.0%) | $0 |
| 25 to 44 Years | 55 (17.0%) | $53,938 |
| 45 to 64 Years | 133 (41.0%) | $39,107 |
| 65+ Years | 136 (42.0%) | $22,375 |
| Total | 324 (100.0%) | $35,278 |
Poverty in Walden
Income Below Poverty by Sex and Age in Walden
With 20.2% poverty level for males and 31.6% for females among the residents of Walden, 6 to 11 year old males and 16 and 17 year old females are the most vulnerable to poverty, with 7 males (100.0%) and 26 females (59.1%) in their respective age groups living below the poverty level.
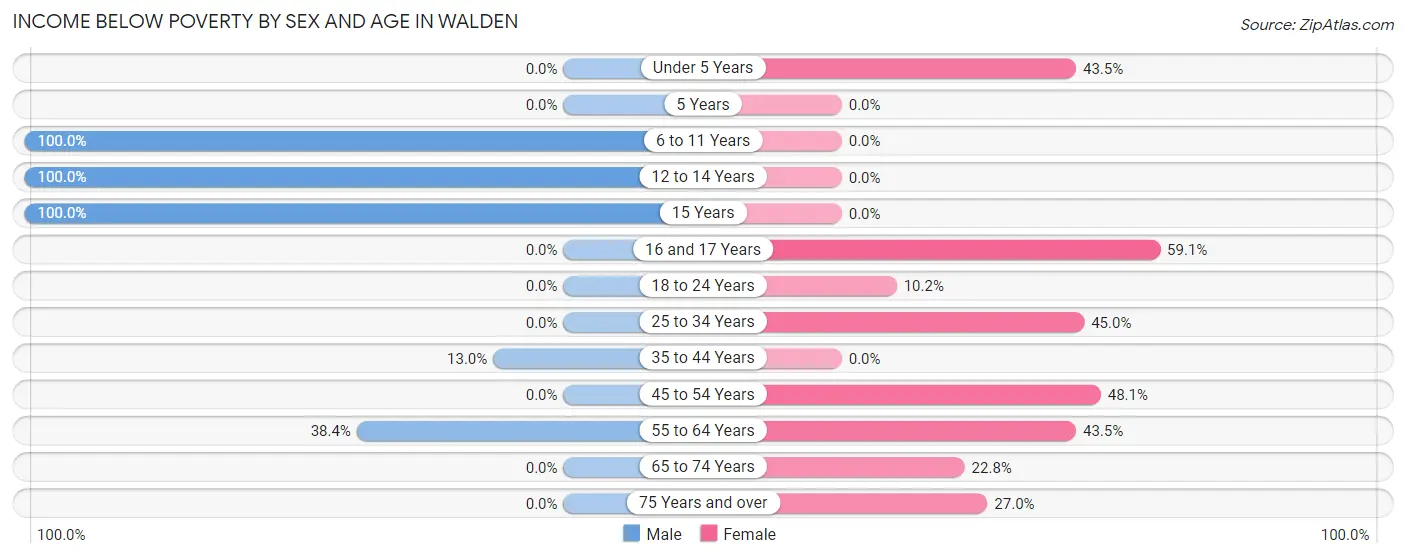
| Age Bracket | Male | Female |
| Under 5 Years | 0 (0.0%) | 10 (43.5%) |
| 5 Years | 0 (0.0%) | 0 (0.0%) |
| 6 to 11 Years | 7 (100.0%) | 0 (0.0%) |
| 12 to 14 Years | 30 (100.0%) | 0 (0.0%) |
| 15 Years | 4 (100.0%) | 0 (0.0%) |
| 16 and 17 Years | 0 (0.0%) | 26 (59.1%) |
| 18 to 24 Years | 0 (0.0%) | 5 (10.2%) |
| 25 to 34 Years | 0 (0.0%) | 9 (45.0%) |
| 35 to 44 Years | 3 (13.0%) | 0 (0.0%) |
| 45 to 54 Years | 0 (0.0%) | 25 (48.1%) |
| 55 to 64 Years | 28 (38.4%) | 10 (43.5%) |
| 65 to 74 Years | 0 (0.0%) | 13 (22.8%) |
| 75 Years and over | 0 (0.0%) | 10 (27.0%) |
| Total | 72 (20.2%) | 108 (31.6%) |
Income Above Poverty by Sex and Age in Walden
According to the poverty statistics in Walden, males aged 16 and 17 years and females aged 6 to 11 years are the age groups that are most secure financially, with 100.0% of males and 100.0% of females in these age groups living above the poverty line.
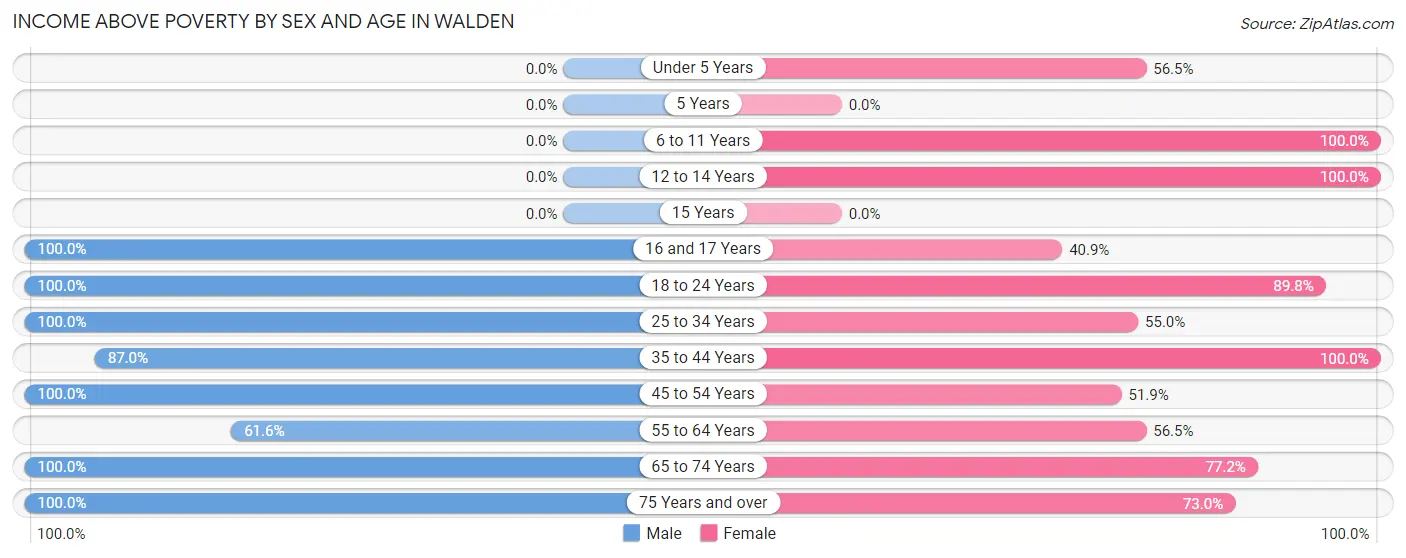
| Age Bracket | Male | Female |
| Under 5 Years | 0 (0.0%) | 13 (56.5%) |
| 5 Years | 0 (0.0%) | 0 (0.0%) |
| 6 to 11 Years | 0 (0.0%) | 11 (100.0%) |
| 12 to 14 Years | 0 (0.0%) | 10 (100.0%) |
| 15 Years | 0 (0.0%) | 0 (0.0%) |
| 16 and 17 Years | 7 (100.0%) | 18 (40.9%) |
| 18 to 24 Years | 21 (100.0%) | 44 (89.8%) |
| 25 to 34 Years | 31 (100.0%) | 11 (55.0%) |
| 35 to 44 Years | 20 (87.0%) | 16 (100.0%) |
| 45 to 54 Years | 55 (100.0%) | 27 (51.9%) |
| 55 to 64 Years | 45 (61.6%) | 13 (56.5%) |
| 65 to 74 Years | 69 (100.0%) | 44 (77.2%) |
| 75 Years and over | 36 (100.0%) | 27 (73.0%) |
| Total | 284 (79.8%) | 234 (68.4%) |
Income Below Poverty Among Married-Couple Families in Walden
The poverty statistics for married-couple families in Walden show that 20.7% or 25 of the total 121 families live below the poverty line. Families with 1 or 2 children have the highest poverty rate of 44.6%, comprising of 25 families. On the other hand, families with no children have the lowest poverty rate of 0.0%, which includes 0 families.
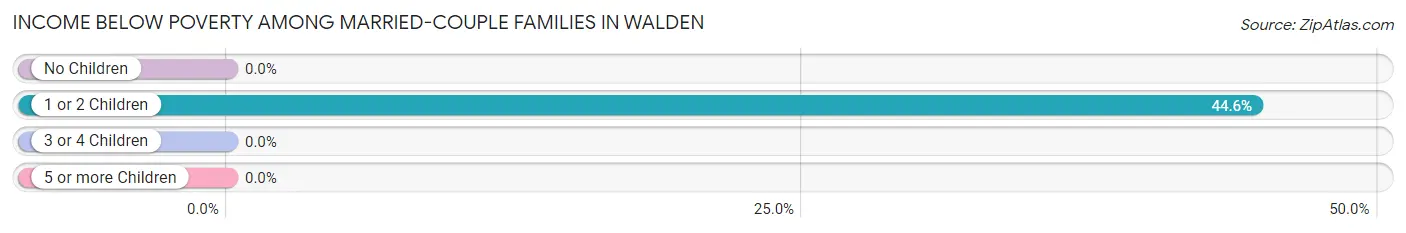
| Children | Above Poverty | Below Poverty |
| No Children | 65 (100.0%) | 0 (0.0%) |
| 1 or 2 Children | 31 (55.4%) | 25 (44.6%) |
| 3 or 4 Children | 0 (0.0%) | 0 (0.0%) |
| 5 or more Children | 0 (0.0%) | 0 (0.0%) |
| Total | 96 (79.3%) | 25 (20.7%) |
Income Below Poverty Among Single-Parent Households in Walden
According to the poverty data in Walden, 13.0% or 3 single-father households and 100.0% or 6 single-mother households are living below the poverty line. Among single-father households, those with 1 or 2 children have the highest poverty rate, with 3 households (100.0%) experiencing poverty. Likewise, among single-mother households, those with 3 or 4 children have the highest poverty rate, with 6 households (100.0%) falling below the poverty line.
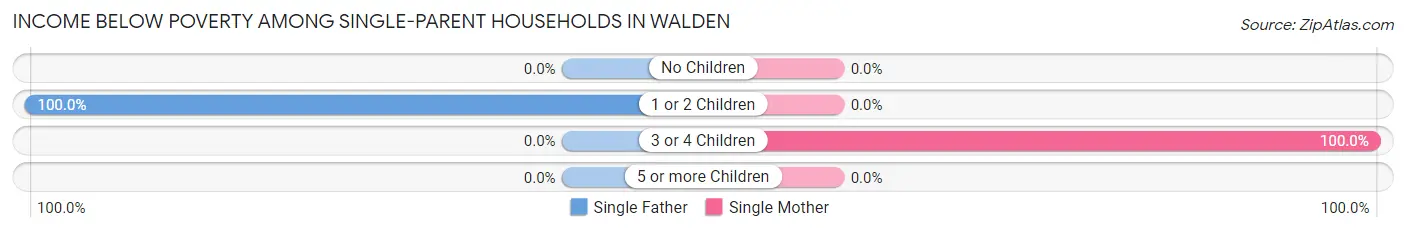
| Children | Single Father | Single Mother |
| No Children | 0 (0.0%) | 0 (0.0%) |
| 1 or 2 Children | 3 (100.0%) | 0 (0.0%) |
| 3 or 4 Children | 0 (0.0%) | 6 (100.0%) |
| 5 or more Children | 0 (0.0%) | 0 (0.0%) |
| Total | 3 (13.0%) | 6 (100.0%) |
Income Below Poverty Among Married-Couple vs Single-Parent Households in Walden
The poverty data for Walden shows that 25 of the married-couple family households (20.7%) and 9 of the single-parent households (31.0%) are living below the poverty level. Within the married-couple family households, those with 1 or 2 children have the highest poverty rate, with 25 households (44.6%) falling below the poverty line. Among the single-parent households, those with 1 or 2 children have the highest poverty rate, with 3 household (100.0%) living below poverty.
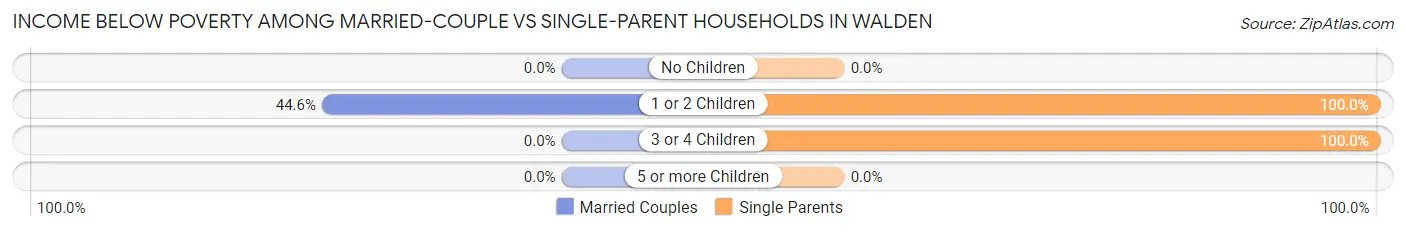
| Children | Married-Couple Families | Single-Parent Households |
| No Children | 0 (0.0%) | 0 (0.0%) |
| 1 or 2 Children | 25 (44.6%) | 3 (100.0%) |
| 3 or 4 Children | 0 (0.0%) | 6 (100.0%) |
| 5 or more Children | 0 (0.0%) | 0 (0.0%) |
| Total | 25 (20.7%) | 9 (31.0%) |
Race in Walden
The most populous races in Walden are White / Caucasian (620 | 88.1%), Hispanic or Latino (165 | 23.4%), and Two or more Races (84 | 11.9%).
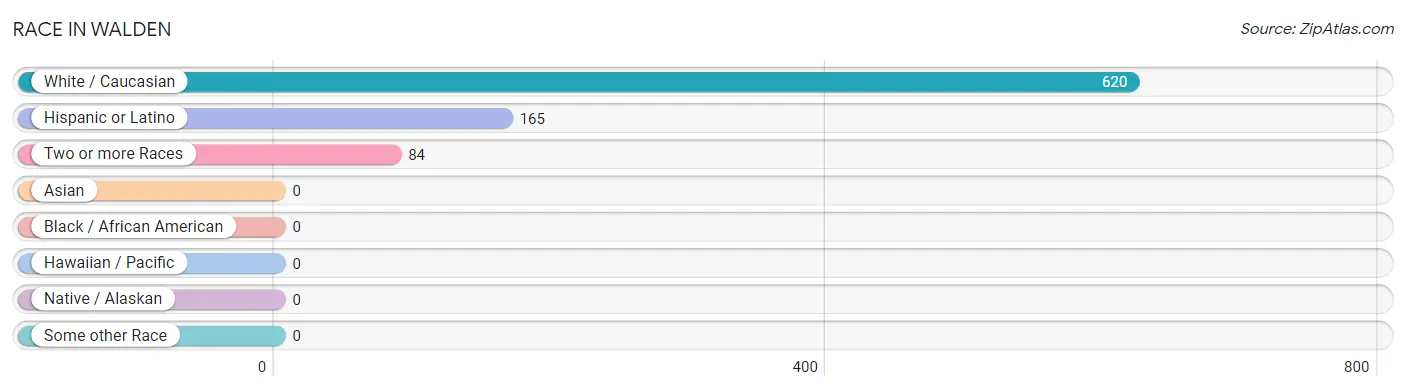
| Race | # Population | % Population |
| Asian | 0 | 0.0% |
| Black / African American | 0 | 0.0% |
| Hawaiian / Pacific | 0 | 0.0% |
| Hispanic or Latino | 165 | 23.4% |
| Native / Alaskan | 0 | 0.0% |
| White / Caucasian | 620 | 88.1% |
| Two or more Races | 84 | 11.9% |
| Some other Race | 0 | 0.0% |
| Total | 704 | 100.0% |
Ancestry in Walden
The most populous ancestries reported in Walden are Mexican (157 | 22.3%), German (139 | 19.7%), Irish (59 | 8.4%), English (32 | 4.5%), and Canadian (24 | 3.4%), together accounting for 58.4% of all Walden residents.
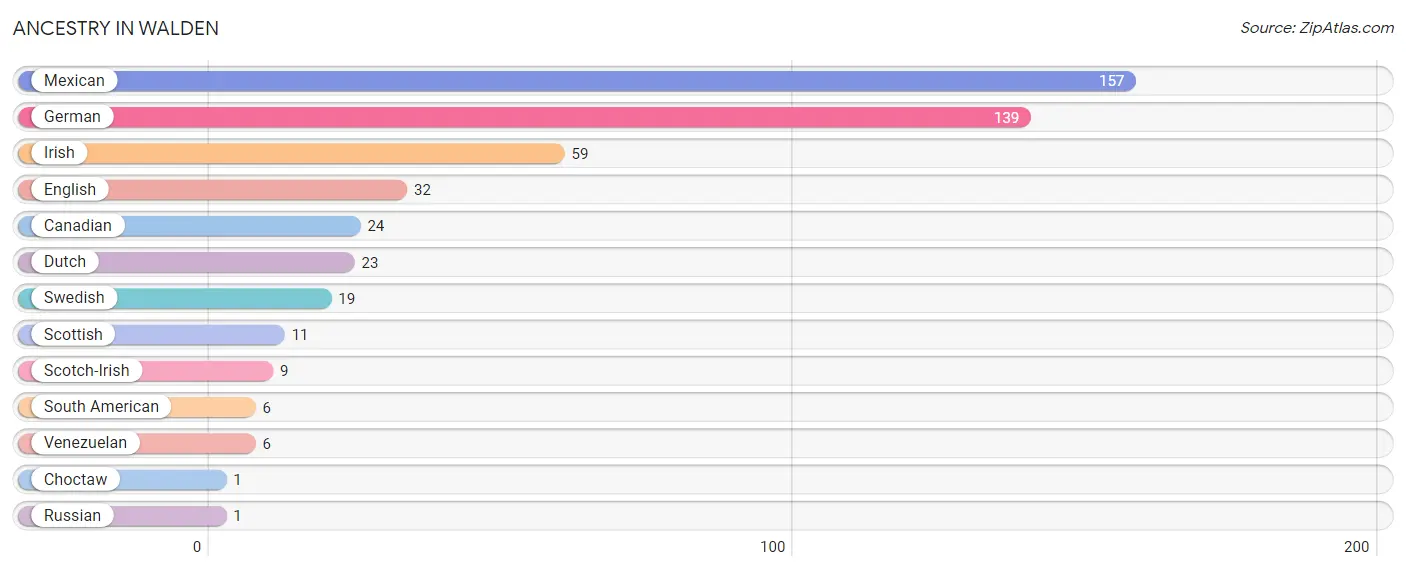
| Ancestry | # Population | % Population |
| Canadian | 24 | 3.4% |
| Choctaw | 1 | 0.1% |
| Dutch | 23 | 3.3% |
| English | 32 | 4.5% |
| German | 139 | 19.7% |
| Irish | 59 | 8.4% |
| Mexican | 157 | 22.3% |
| Russian | 1 | 0.1% |
| Scotch-Irish | 9 | 1.3% |
| Scottish | 11 | 1.6% |
| South American | 6 | 0.9% |
| Swedish | 19 | 2.7% |
| Venezuelan | 6 | 0.9% | View All 13 Rows |
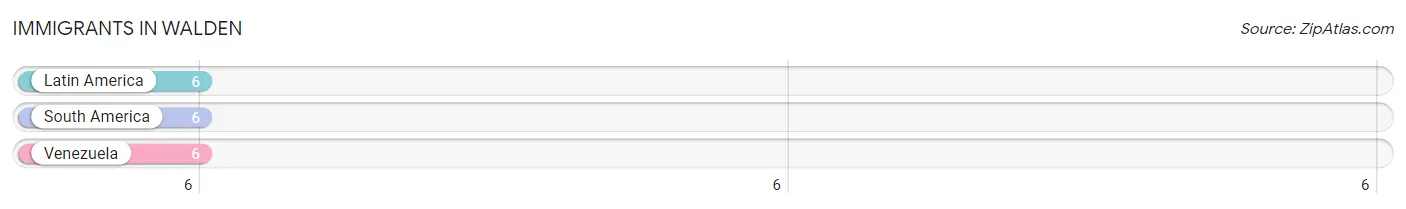
Immigrants in Walden
The most numerous immigrant groups reported in Walden came from Latin America (6 | 0.9%), South America (6 | 0.9%), and Venezuela (6 | 0.9%), together accounting for 2.6% of all Walden residents.
| Immigration Origin | # Population | % Population |
| Latin America | 6 | 0.9% |
| South America | 6 | 0.9% |
| Venezuela | 6 | 0.9% | View All 3 Rows |
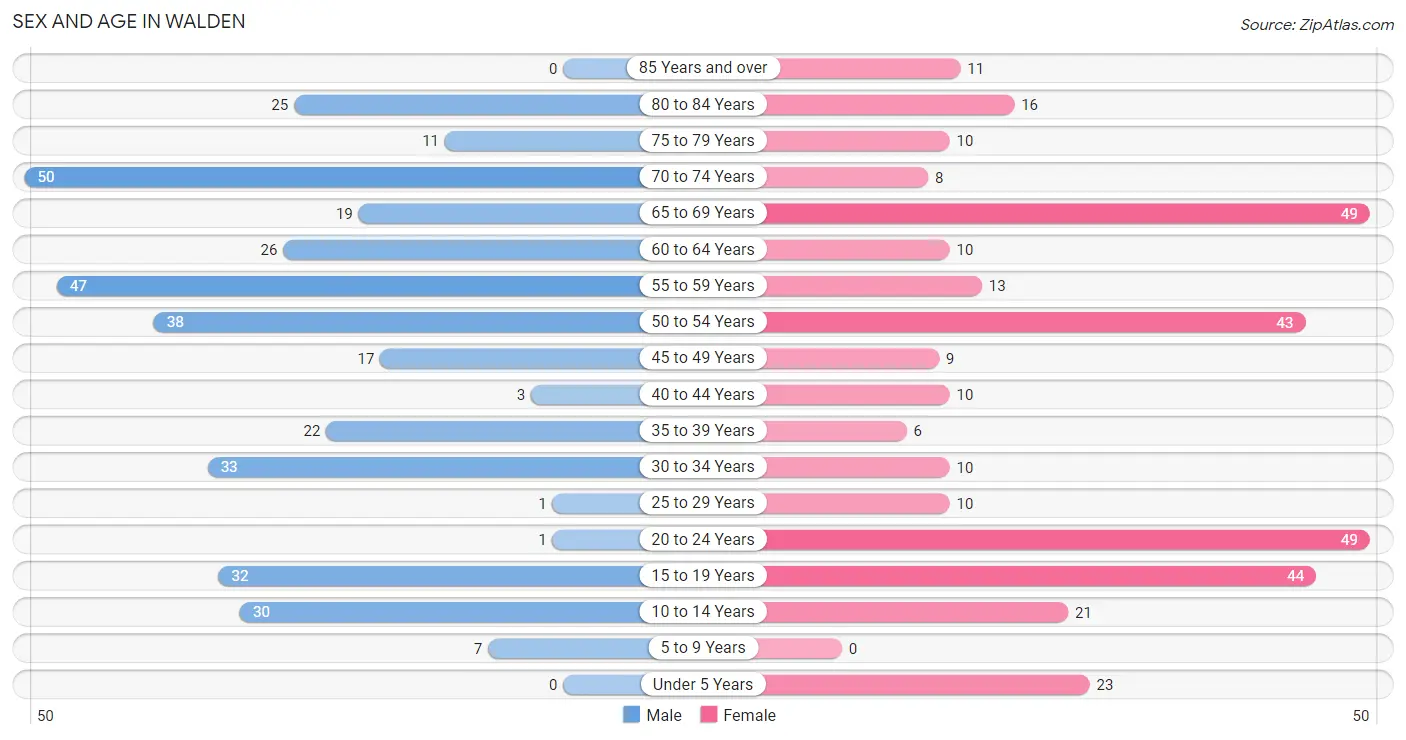
Sex and Age in Walden
Sex and Age in Walden
The most populous age groups in Walden are 70 to 74 Years (50 | 13.8%) for men and 20 to 24 Years (49 | 14.3%) for women.
| Age Bracket | Male | Female |
| Under 5 Years | 0 (0.0%) | 23 (6.7%) |
| 5 to 9 Years | 7 (1.9%) | 0 (0.0%) |
| 10 to 14 Years | 30 (8.3%) | 21 (6.1%) |
| 15 to 19 Years | 32 (8.8%) | 44 (12.9%) |
| 20 to 24 Years | 1 (0.3%) | 49 (14.3%) |
| 25 to 29 Years | 1 (0.3%) | 10 (2.9%) |
| 30 to 34 Years | 33 (9.1%) | 10 (2.9%) |
| 35 to 39 Years | 22 (6.1%) | 6 (1.8%) |
| 40 to 44 Years | 3 (0.8%) | 10 (2.9%) |
| 45 to 49 Years | 17 (4.7%) | 9 (2.6%) |
| 50 to 54 Years | 38 (10.5%) | 43 (12.6%) |
| 55 to 59 Years | 47 (13.0%) | 13 (3.8%) |
| 60 to 64 Years | 26 (7.2%) | 10 (2.9%) |
| 65 to 69 Years | 19 (5.2%) | 49 (14.3%) |
| 70 to 74 Years | 50 (13.8%) | 8 (2.3%) |
| 75 to 79 Years | 11 (3.0%) | 10 (2.9%) |
| 80 to 84 Years | 25 (6.9%) | 16 (4.7%) |
| 85 Years and over | 0 (0.0%) | 11 (3.2%) |
| Total | 362 (100.0%) | 342 (100.0%) |
Families and Households in Walden
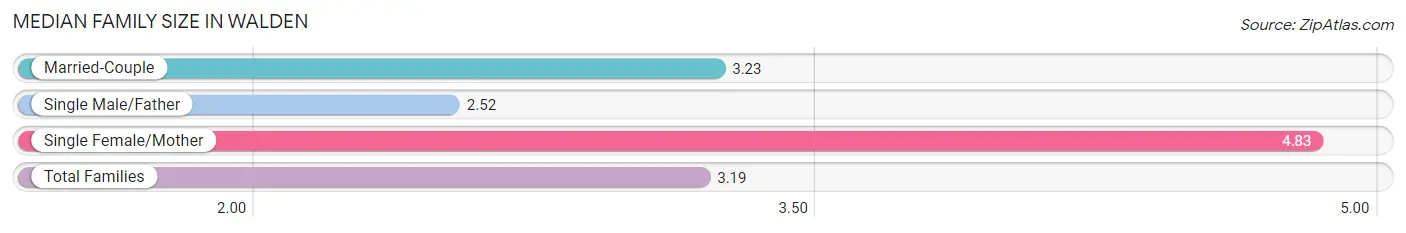
Median Family Size in Walden
The median family size in Walden is 3.19 persons per family, with single female/mother families (6 | 4.0%) accounting for the largest median family size of 4.83 persons per family. On the other hand, single male/father families (23 | 15.3%) represent the smallest median family size with 2.52 persons per family.
| Family Type | # Families | Family Size |
| Married-Couple | 121 (80.7%) | 3.23 |
| Single Male/Father | 23 (15.3%) | 2.52 |
| Single Female/Mother | 6 (4.0%) | 4.83 |
| Total Families | 150 (100.0%) | 3.19 |
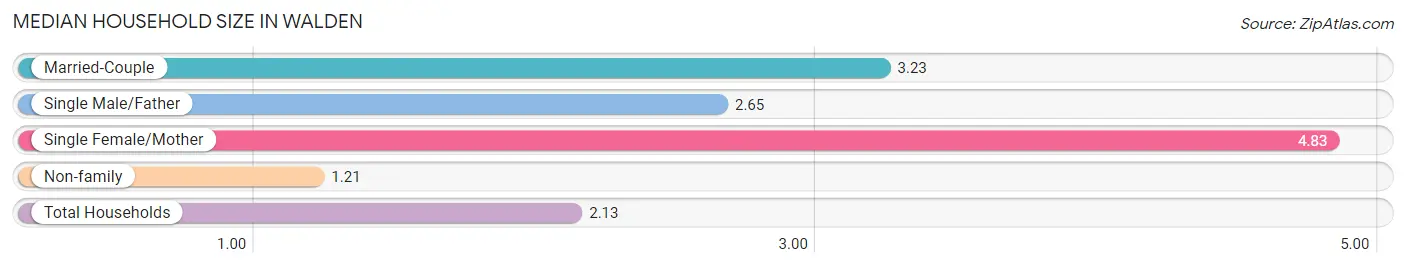
Median Household Size in Walden
The median household size in Walden is 2.13 persons per household, with single female/mother households (6 | 1.8%) accounting for the largest median household size of 4.83 persons per household. non-family households (174 | 53.7%) represent the smallest median household size with 1.21 persons per household.
| Household Type | # Households | Household Size |
| Married-Couple | 121 (37.3%) | 3.23 |
| Single Male/Father | 23 (7.1%) | 2.65 |
| Single Female/Mother | 6 (1.8%) | 4.83 |
| Non-family | 174 (53.7%) | 1.21 |
| Total Households | 324 (100.0%) | 2.13 |
Household Size by Marriage Status in Walden
Out of a total of 324 households in Walden, 150 (46.3%) are family households, while 174 (53.7%) are nonfamily households. The most numerous type of family households are 2-person households, comprising 74, and the most common type of nonfamily households are 1-person households, comprising 152.
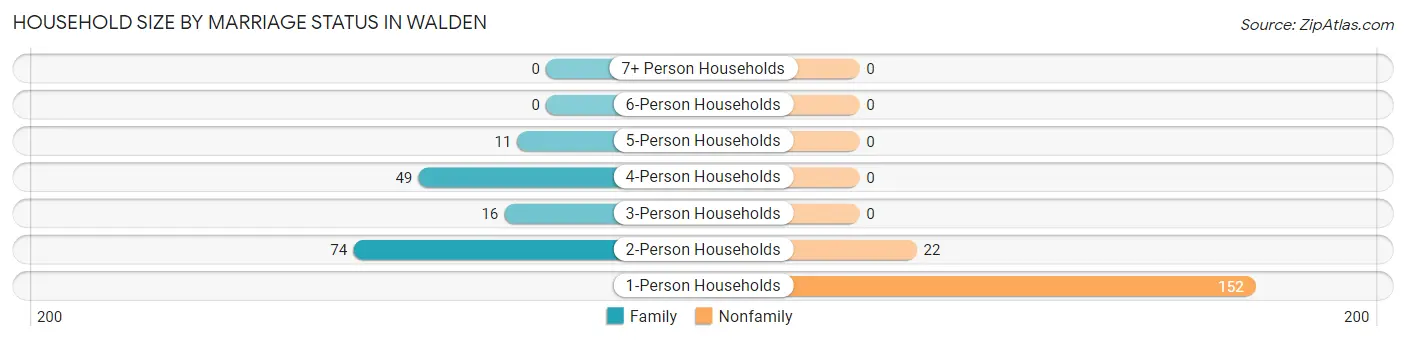
| Household Size | Family Households | Nonfamily Households |
| 1-Person Households | - | 152 (46.9%) |
| 2-Person Households | 74 (22.8%) | 22 (6.8%) |
| 3-Person Households | 16 (4.9%) | 0 (0.0%) |
| 4-Person Households | 49 (15.1%) | 0 (0.0%) |
| 5-Person Households | 11 (3.4%) | 0 (0.0%) |
| 6-Person Households | 0 (0.0%) | 0 (0.0%) |
| 7+ Person Households | 0 (0.0%) | 0 (0.0%) |
| Total | 150 (46.3%) | 174 (53.7%) |
Female Fertility in Walden
Fertility by Age in Walden
| Age Bracket | Women with Births | Births / 1,000 Women |
| 15 to 19 years | 0 (0.0%) | 0.0 |
| 20 to 34 years | 0 (0.0%) | 0.0 |
| 35 to 50 years | 0 (0.0%) | 0.0 |
| Total | 0 (0.0%) | 0.0 |
Fertility by Age by Marriage Status in Walden
| Age Bracket | Married | Unmarried |
| 15 to 19 years | 0 (0.0%) | 0 (0.0%) |
| 20 to 34 years | 0 (0.0%) | 0 (0.0%) |
| 35 to 50 years | 0 (0.0%) | 0 (0.0%) |
| Total | 0 (0.0%) | 0 (0.0%) |
Fertility by Education in Walden
| Educational Attainment | Women with Births | Births / 1,000 Women |
| Less than High School | 0 (0.0%) | 0.0 |
| High School Diploma | 0 (0.0%) | 0.0 |
| College or Associate's Degree | 0 (0.0%) | 0.0 |
| Bachelor's Degree | 0 (0.0%) | 0.0 |
| Graduate Degree | 0 (0.0%) | 0.0 |
| Total | 0 (0.0%) | 0.0 |
Fertility by Education by Marriage Status in Walden
| Educational Attainment | Married | Unmarried |
| Less than High School | 0 (0.0%) | 0 (0.0%) |
| High School Diploma | 0 (0.0%) | 0 (0.0%) |
| College or Associate's Degree | 0 (0.0%) | 0 (0.0%) |
| Bachelor's Degree | 0 (0.0%) | 0 (0.0%) |
| Graduate Degree | 0 (0.0%) | 0 (0.0%) |
| Total | 0 (0.0%) | 0 (0.0%) |
Employment Characteristics in Walden
Employment by Class of Employer in Walden
Among the 338 employed individuals in Walden, private company employees (163 | 48.2%), local government employees (86 | 25.4%), and not-for-profit organizations (39 | 11.5%) make up the most common classes of employment.
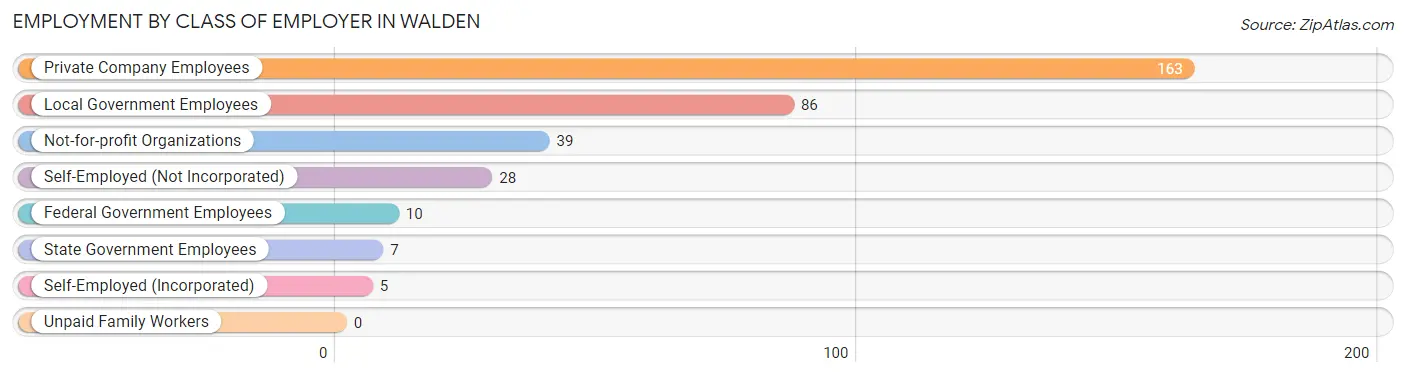
| Employer Class | # Employees | % Employees |
| Private Company Employees | 163 | 48.2% |
| Self-Employed (Incorporated) | 5 | 1.5% |
| Self-Employed (Not Incorporated) | 28 | 8.3% |
| Not-for-profit Organizations | 39 | 11.5% |
| Local Government Employees | 86 | 25.4% |
| State Government Employees | 7 | 2.1% |
| Federal Government Employees | 10 | 3.0% |
| Unpaid Family Workers | 0 | 0.0% |
| Total | 338 | 100.0% |
Employment Status by Age in Walden
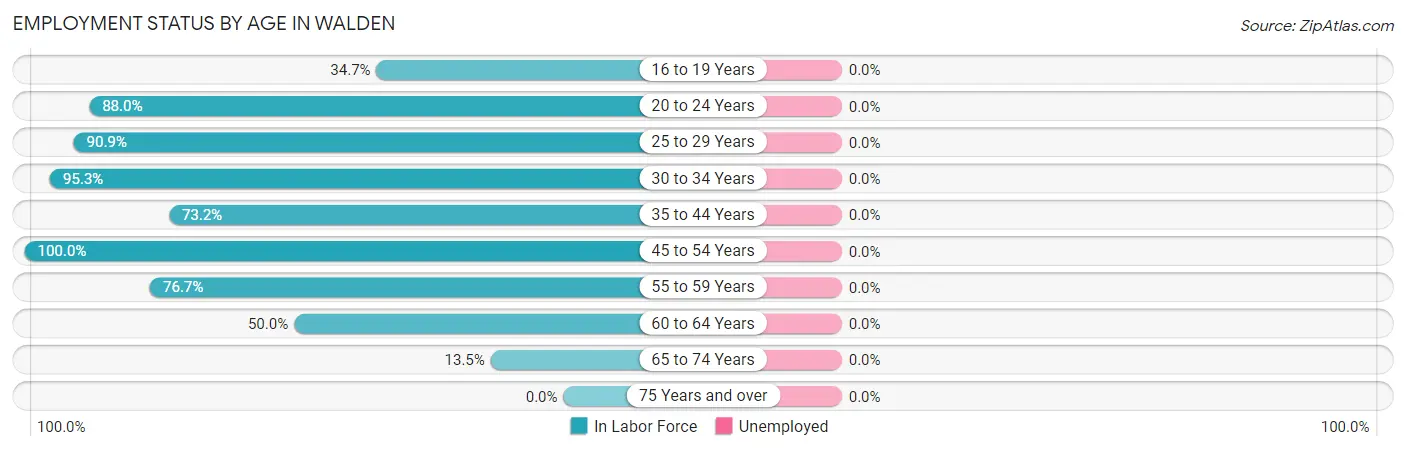
| Age Bracket | In Labor Force | Unemployed |
| 16 to 19 Years | 25 (34.7%) | 0 (0.0%) |
| 20 to 24 Years | 44 (88.0%) | 0 (0.0%) |
| 25 to 29 Years | 10 (90.9%) | 0 (0.0%) |
| 30 to 34 Years | 41 (95.3%) | 0 (0.0%) |
| 35 to 44 Years | 30 (73.2%) | 0 (0.0%) |
| 45 to 54 Years | 107 (100.0%) | 0 (0.0%) |
| 55 to 59 Years | 46 (76.7%) | 0 (0.0%) |
| 60 to 64 Years | 18 (50.0%) | 0 (0.0%) |
| 65 to 74 Years | 17 (13.5%) | 0 (0.0%) |
| 75 Years and over | 0 (0.0%) | 0 (0.0%) |
| Total | 338 (54.6%) | 0 (0.0%) |
Employment Status by Educational Attainment in Walden
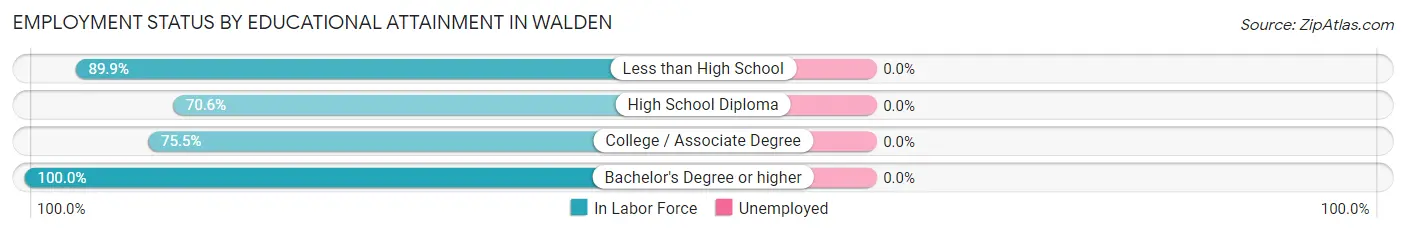
| Educational Attainment | In Labor Force | Unemployed |
| Less than High School | 71 (89.9%) | 0 (0.0%) |
| High School Diploma | 60 (70.6%) | 0 (0.0%) |
| College / Associate Degree | 40 (75.5%) | 0 (0.0%) |
| Bachelor's Degree or higher | 81 (100.0%) | 0 (0.0%) |
| Total | 252 (84.6%) | 0 (0.0%) |
Employment Occupations by Sex in Walden
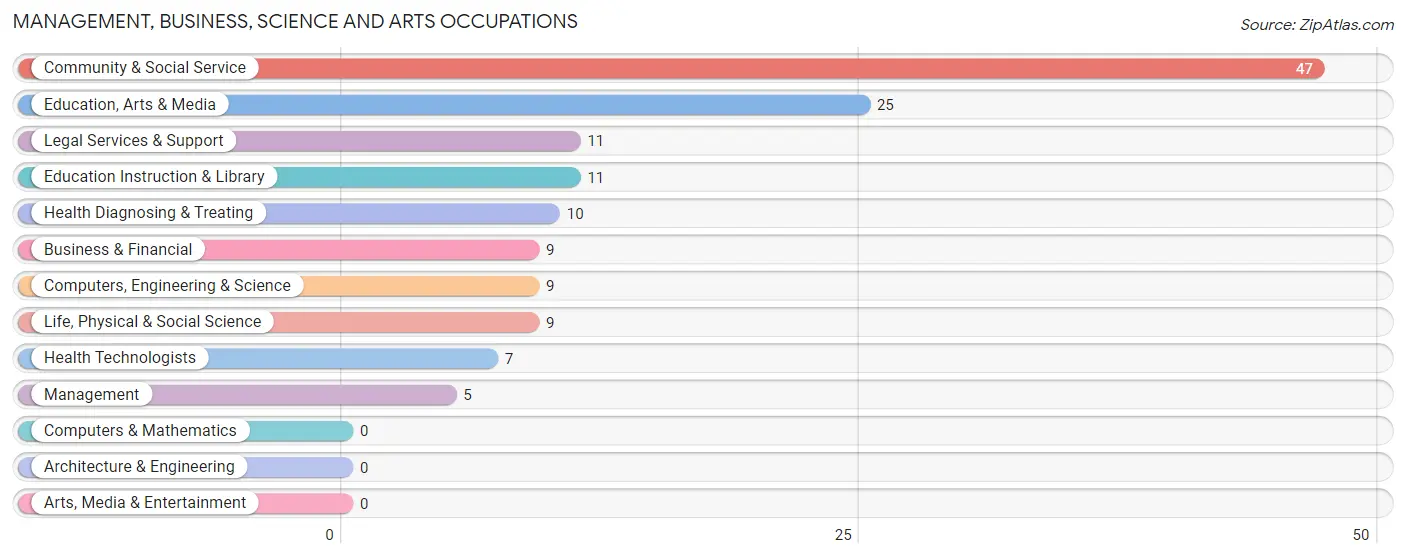
Management, Business, Science and Arts Occupations
The most common Management, Business, Science and Arts occupations in Walden are Community & Social Service (47 | 13.9%), Education, Arts & Media (25 | 7.4%), Legal Services & Support (11 | 3.3%), Education Instruction & Library (11 | 3.3%), and Health Diagnosing & Treating (10 | 3.0%).
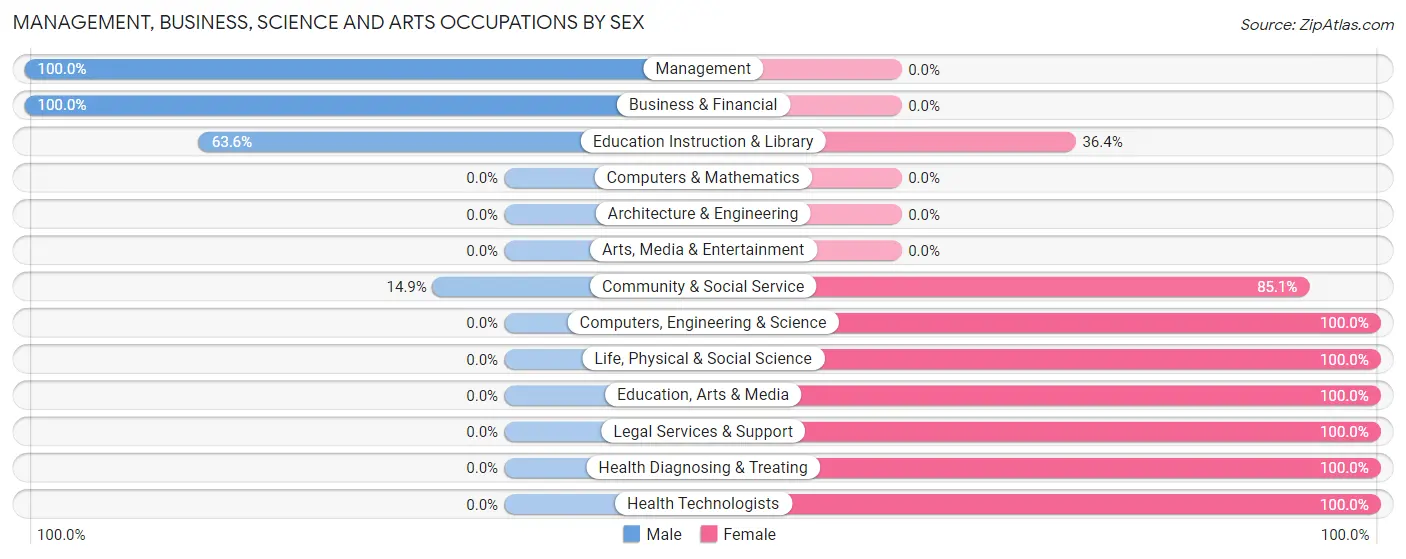
Management, Business, Science and Arts Occupations by Sex
Within the Management, Business, Science and Arts occupations in Walden, the most male-oriented occupations are Management (100.0%), Business & Financial (100.0%), and Education Instruction & Library (63.6%), while the most female-oriented occupations are Computers, Engineering & Science (100.0%), Life, Physical & Social Science (100.0%), and Education, Arts & Media (100.0%).
| Occupation | Male | Female |
| Management | 5 (100.0%) | 0 (0.0%) |
| Business & Financial | 9 (100.0%) | 0 (0.0%) |
| Computers, Engineering & Science | 0 (0.0%) | 9 (100.0%) |
| Computers & Mathematics | 0 (0.0%) | 0 (0.0%) |
| Architecture & Engineering | 0 (0.0%) | 0 (0.0%) |
| Life, Physical & Social Science | 0 (0.0%) | 9 (100.0%) |
| Community & Social Service | 7 (14.9%) | 40 (85.1%) |
| Education, Arts & Media | 0 (0.0%) | 25 (100.0%) |
| Legal Services & Support | 0 (0.0%) | 11 (100.0%) |
| Education Instruction & Library | 7 (63.6%) | 4 (36.4%) |
| Arts, Media & Entertainment | 0 (0.0%) | 0 (0.0%) |
| Health Diagnosing & Treating | 0 (0.0%) | 10 (100.0%) |
| Health Technologists | 0 (0.0%) | 7 (100.0%) |
| Total (Category) | 21 (26.3%) | 59 (73.8%) |
| Total (Overall) | 176 (52.1%) | 162 (47.9%) |
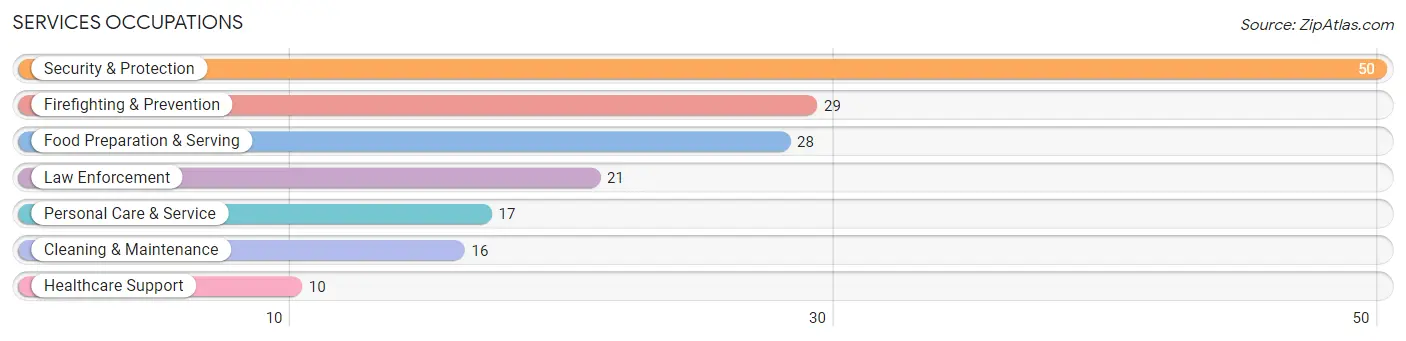
Services Occupations
The most common Services occupations in Walden are Security & Protection (50 | 14.8%), Firefighting & Prevention (29 | 8.6%), Food Preparation & Serving (28 | 8.3%), Law Enforcement (21 | 6.2%), and Personal Care & Service (17 | 5.0%).
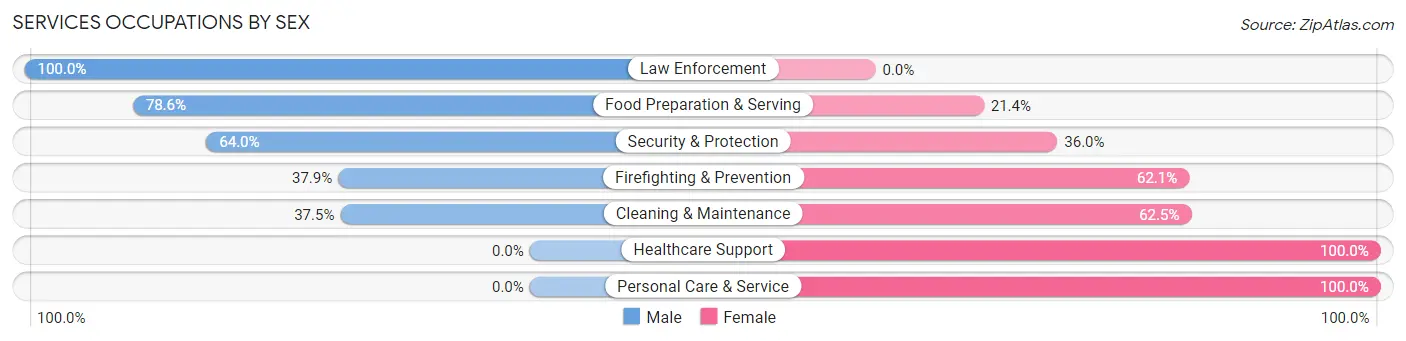
Services Occupations by Sex
Within the Services occupations in Walden, the most male-oriented occupations are Law Enforcement (100.0%), Food Preparation & Serving (78.6%), and Security & Protection (64.0%), while the most female-oriented occupations are Healthcare Support (100.0%), Personal Care & Service (100.0%), and Cleaning & Maintenance (62.5%).
| Occupation | Male | Female |
| Healthcare Support | 0 (0.0%) | 10 (100.0%) |
| Security & Protection | 32 (64.0%) | 18 (36.0%) |
| Firefighting & Prevention | 11 (37.9%) | 18 (62.1%) |
| Law Enforcement | 21 (100.0%) | 0 (0.0%) |
| Food Preparation & Serving | 22 (78.6%) | 6 (21.4%) |
| Cleaning & Maintenance | 6 (37.5%) | 10 (62.5%) |
| Personal Care & Service | 0 (0.0%) | 17 (100.0%) |
| Total (Category) | 60 (49.6%) | 61 (50.4%) |
| Total (Overall) | 176 (52.1%) | 162 (47.9%) |
Sales and Office Occupations
The most common Sales and Office occupations in Walden are Office & Administration (63 | 18.6%), and Sales & Related (12 | 3.5%).
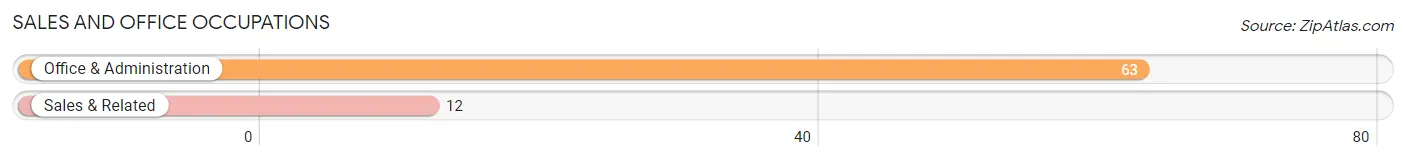
Sales and Office Occupations by Sex
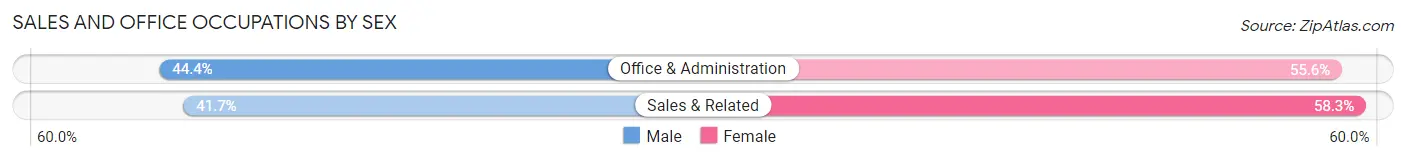
| Occupation | Male | Female |
| Sales & Related | 5 (41.7%) | 7 (58.3%) |
| Office & Administration | 28 (44.4%) | 35 (55.6%) |
| Total (Category) | 33 (44.0%) | 42 (56.0%) |
| Total (Overall) | 176 (52.1%) | 162 (47.9%) |
Natural Resources, Construction and Maintenance Occupations
The most common Natural Resources, Construction and Maintenance occupations in Walden are , and Construction & Extraction (55 | 16.3%).
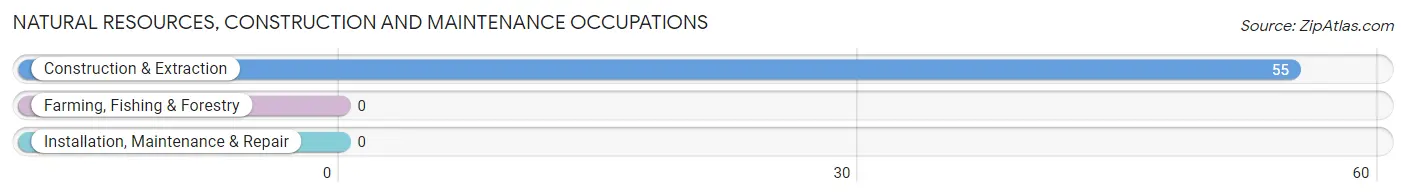
Natural Resources, Construction and Maintenance Occupations by Sex
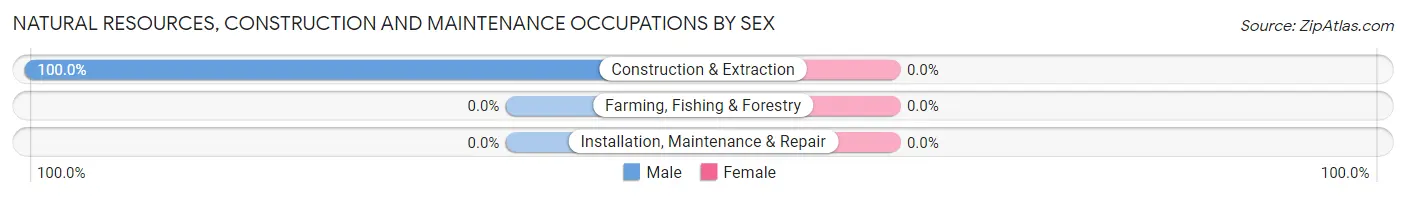
| Occupation | Male | Female |
| Farming, Fishing & Forestry | 0 (0.0%) | 0 (0.0%) |
| Construction & Extraction | 55 (100.0%) | 0 (0.0%) |
| Installation, Maintenance & Repair | 0 (0.0%) | 0 (0.0%) |
| Total (Category) | 55 (100.0%) | 0 (0.0%) |
| Total (Overall) | 176 (52.1%) | 162 (47.9%) |
Production, Transportation and Moving Occupations
The most common Production, Transportation and Moving occupations in Walden are , and Transportation (7 | 2.1%).
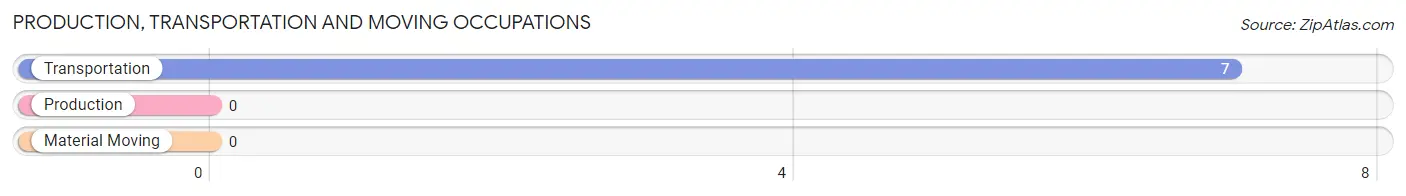
Production, Transportation and Moving Occupations by Sex
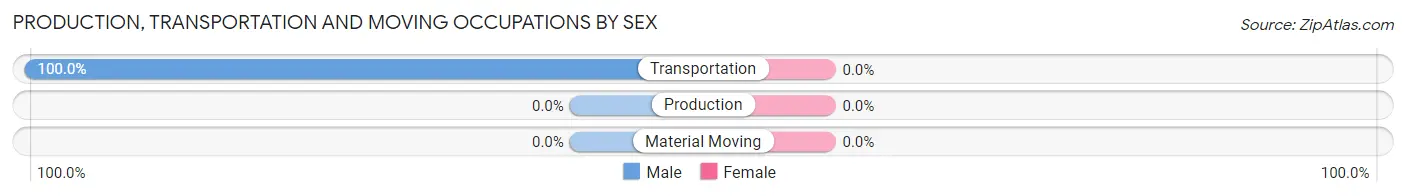
| Occupation | Male | Female |
| Production | 0 (0.0%) | 0 (0.0%) |
| Transportation | 7 (100.0%) | 0 (0.0%) |
| Material Moving | 0 (0.0%) | 0 (0.0%) |
| Total (Category) | 7 (100.0%) | 0 (0.0%) |
| Total (Overall) | 176 (52.1%) | 162 (47.9%) |
Employment Industries by Sex in Walden
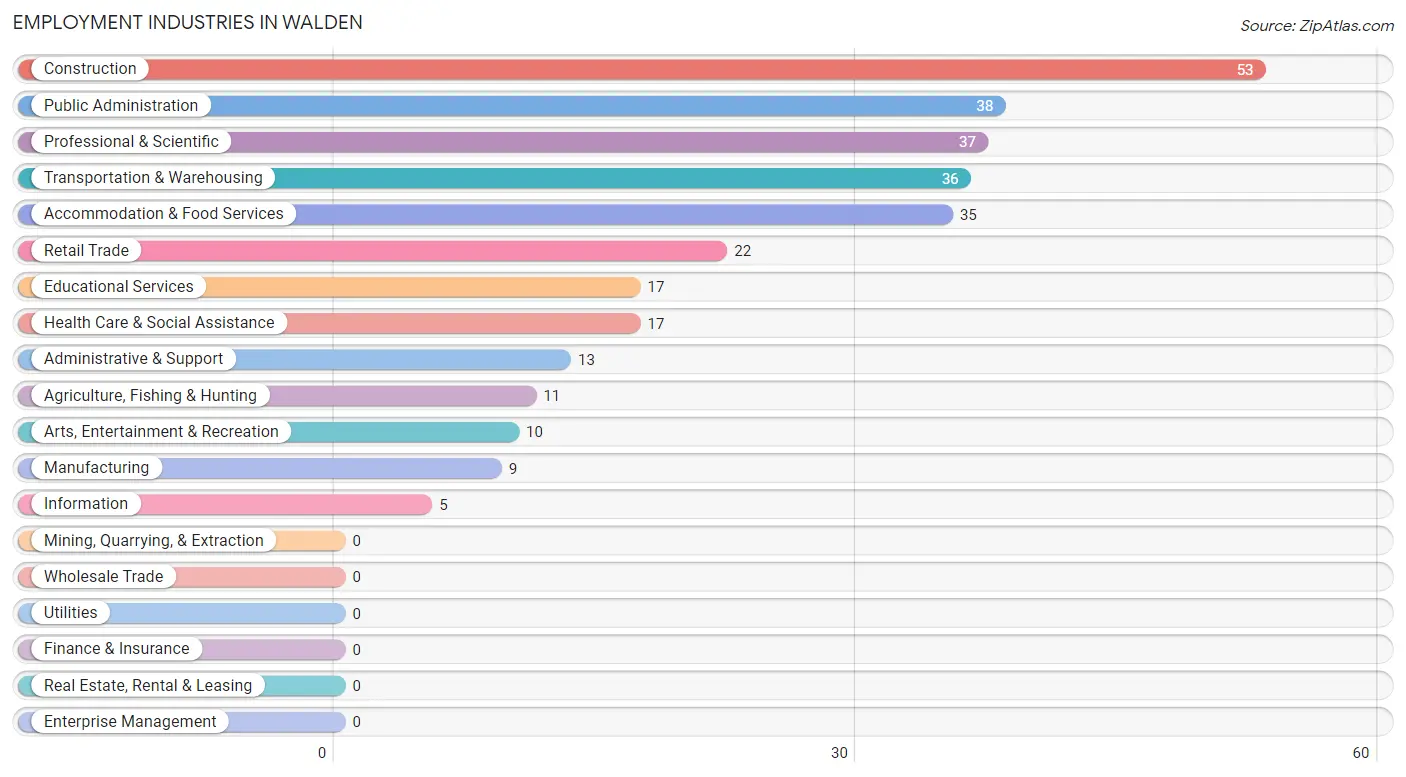
Employment Industries in Walden
The major employment industries in Walden include Construction (53 | 15.7%), Public Administration (38 | 11.2%), Professional & Scientific (37 | 11.0%), Transportation & Warehousing (36 | 10.6%), and Accommodation & Food Services (35 | 10.4%).
Employment Industries by Sex in Walden
The Walden industries that see more men than women are Construction (100.0%), Retail Trade (100.0%), and Information (100.0%), whereas the industries that tend to have a higher number of women are Agriculture, Fishing & Hunting (100.0%), Manufacturing (100.0%), and Health Care & Social Assistance (100.0%).
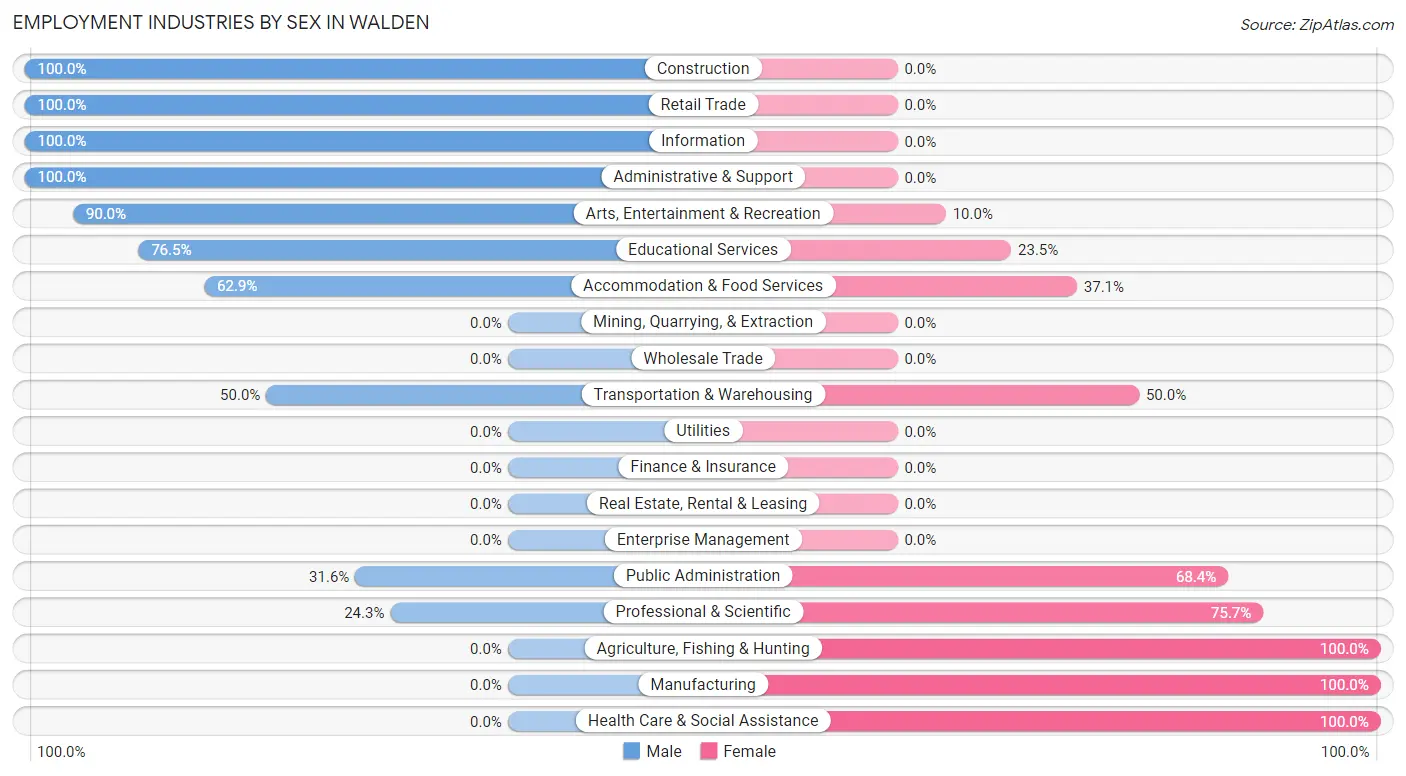
| Industry | Male | Female |
| Agriculture, Fishing & Hunting | 0 (0.0%) | 11 (100.0%) |
| Mining, Quarrying, & Extraction | 0 (0.0%) | 0 (0.0%) |
| Construction | 53 (100.0%) | 0 (0.0%) |
| Manufacturing | 0 (0.0%) | 9 (100.0%) |
| Wholesale Trade | 0 (0.0%) | 0 (0.0%) |
| Retail Trade | 22 (100.0%) | 0 (0.0%) |
| Transportation & Warehousing | 18 (50.0%) | 18 (50.0%) |
| Utilities | 0 (0.0%) | 0 (0.0%) |
| Information | 5 (100.0%) | 0 (0.0%) |
| Finance & Insurance | 0 (0.0%) | 0 (0.0%) |
| Real Estate, Rental & Leasing | 0 (0.0%) | 0 (0.0%) |
| Professional & Scientific | 9 (24.3%) | 28 (75.7%) |
| Enterprise Management | 0 (0.0%) | 0 (0.0%) |
| Administrative & Support | 13 (100.0%) | 0 (0.0%) |
| Educational Services | 13 (76.5%) | 4 (23.5%) |
| Health Care & Social Assistance | 0 (0.0%) | 17 (100.0%) |
| Arts, Entertainment & Recreation | 9 (90.0%) | 1 (10.0%) |
| Accommodation & Food Services | 22 (62.9%) | 13 (37.1%) |
| Public Administration | 12 (31.6%) | 26 (68.4%) |
| Total | 176 (52.1%) | 162 (47.9%) |
Education in Walden
School Enrollment in Walden
The most common levels of schooling among the 175 students in Walden are high school (79 | 45.1%), middle school (48 | 27.4%), and graduate / professional (25 | 14.3%).
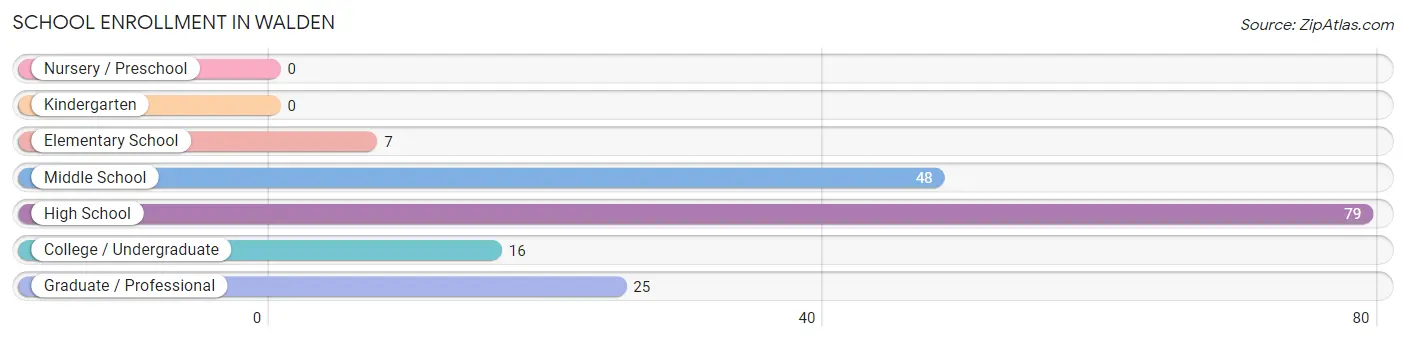
| School Level | # Students | % Students |
| Nursery / Preschool | 0 | 0.0% |
| Kindergarten | 0 | 0.0% |
| Elementary School | 7 | 4.0% |
| Middle School | 48 | 27.4% |
| High School | 79 | 45.1% |
| College / Undergraduate | 16 | 9.1% |
| Graduate / Professional | 25 | 14.3% |
| Total | 175 | 100.0% |
School Enrollment by Age by Funding Source in Walden
Out of a total of 175 students who are enrolled in schools in Walden, 25 (14.3%) attend a private institution, while the remaining 150 (85.7%) are enrolled in public schools. The age group of 20 to 24 year olds has the highest likelihood of being enrolled in private schools, with 18 (100.0% in the age bracket) enrolled. Conversely, the age group of 5 to 9 year old has the lowest likelihood of being enrolled in a private school, with 7 (100.0% in the age bracket) attending a public institution.
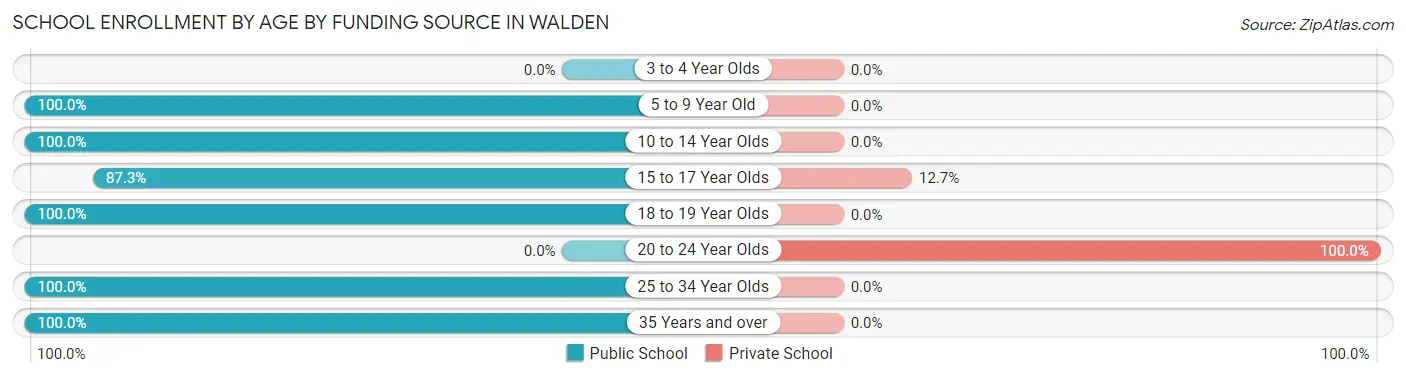
| Age Bracket | Public School | Private School |
| 3 to 4 Year Olds | 0 (0.0%) | 0 (0.0%) |
| 5 to 9 Year Old | 7 (100.0%) | 0 (0.0%) |
| 10 to 14 Year Olds | 51 (100.0%) | 0 (0.0%) |
| 15 to 17 Year Olds | 48 (87.3%) | 7 (12.7%) |
| 18 to 19 Year Olds | 21 (100.0%) | 0 (0.0%) |
| 20 to 24 Year Olds | 0 (0.0%) | 18 (100.0%) |
| 25 to 34 Year Olds | 7 (100.0%) | 0 (0.0%) |
| 35 Years and over | 16 (100.0%) | 0 (0.0%) |
| Total | 150 (85.7%) | 25 (14.3%) |
Educational Attainment by Field of Study in Walden
Business (35 | 26.1%), science & technology (34 | 25.4%), bio, nature & agricultural (18 | 13.4%), engineering (18 | 13.4%), and education (14 | 10.4%) are the most common fields of study among 134 individuals in Walden who have obtained a bachelor's degree or higher.
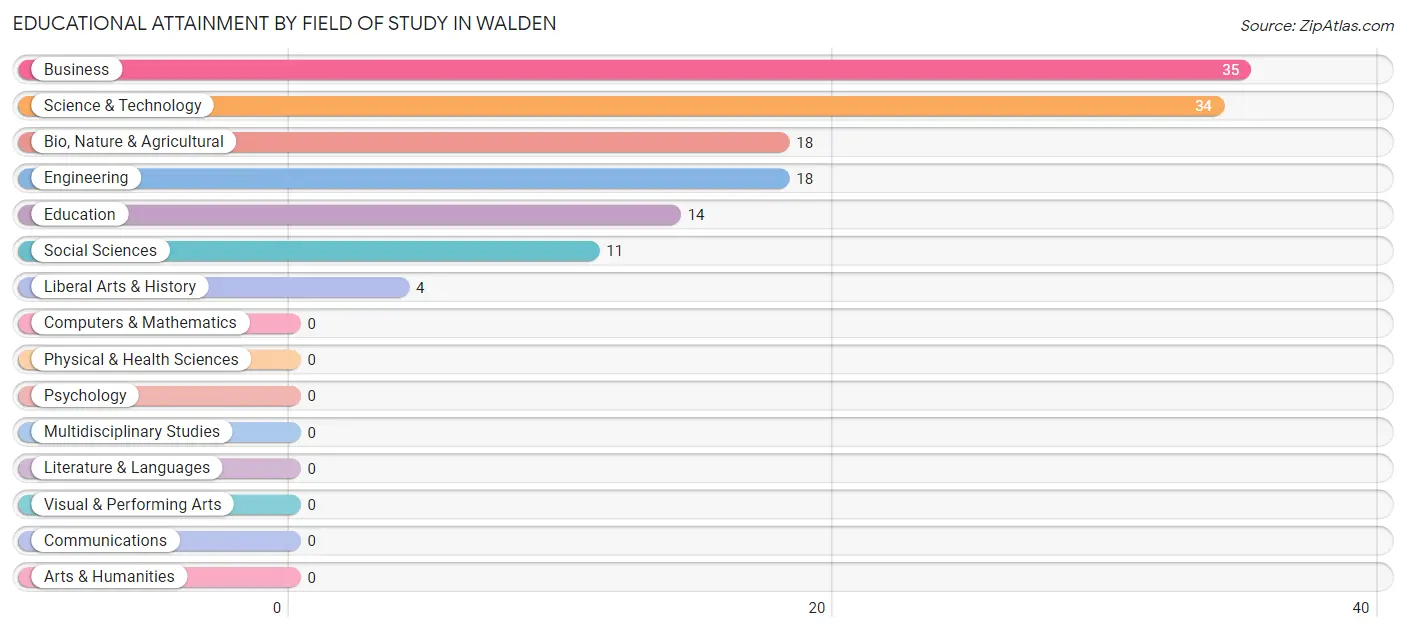
| Field of Study | # Graduates | % Graduates |
| Computers & Mathematics | 0 | 0.0% |
| Bio, Nature & Agricultural | 18 | 13.4% |
| Physical & Health Sciences | 0 | 0.0% |
| Psychology | 0 | 0.0% |
| Social Sciences | 11 | 8.2% |
| Engineering | 18 | 13.4% |
| Multidisciplinary Studies | 0 | 0.0% |
| Science & Technology | 34 | 25.4% |
| Business | 35 | 26.1% |
| Education | 14 | 10.4% |
| Literature & Languages | 0 | 0.0% |
| Liberal Arts & History | 4 | 3.0% |
| Visual & Performing Arts | 0 | 0.0% |
| Communications | 0 | 0.0% |
| Arts & Humanities | 0 | 0.0% |
| Total | 134 | 100.0% |
Transportation & Commute in Walden
Vehicle Availability by Sex in Walden
The most prevalent vehicle ownership categories in Walden are males with 2 vehicles (68, accounting for 38.6%) and females with 2 vehicles (48, making up 42.5%).
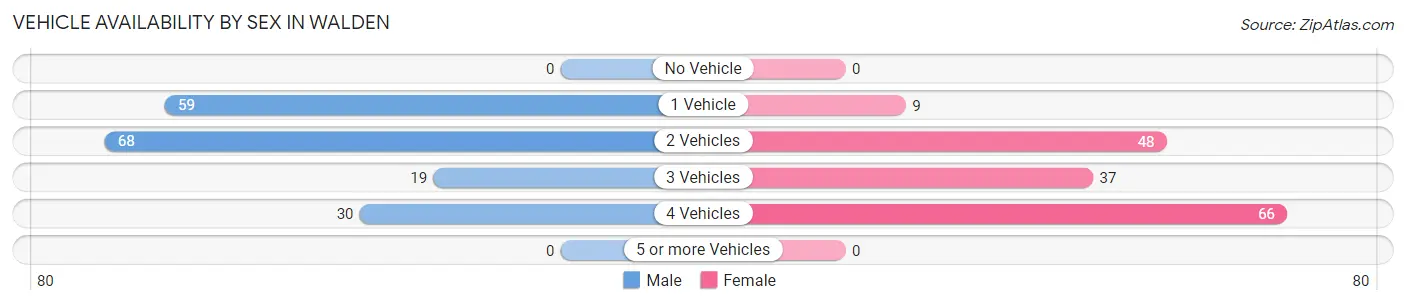
| Vehicles Available | Male | Female |
| No Vehicle | 0 (0.0%) | 0 (0.0%) |
| 1 Vehicle | 59 (33.5%) | 9 (5.6%) |
| 2 Vehicles | 68 (38.6%) | 48 (30.0%) |
| 3 Vehicles | 19 (10.8%) | 37 (23.1%) |
| 4 Vehicles | 30 (17.1%) | 66 (41.2%) |
| 5 or more Vehicles | 0 (0.0%) | 0 (0.0%) |
| Total | 176 (100.0%) | 160 (100.0%) |
Commute Time in Walden
The most frequently occuring commute durations in Walden are 5 to 9 minutes (197 commuters, 62.3%), 15 to 19 minutes (25 commuters, 7.9%), and 10 to 14 minutes (20 commuters, 6.3%).
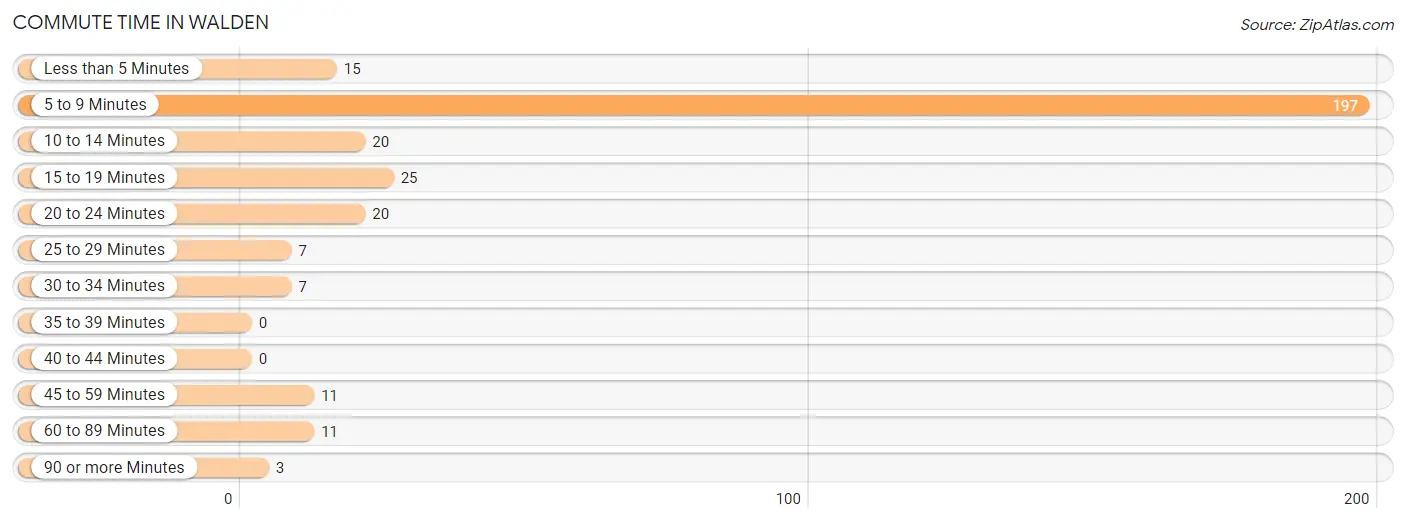
| Commute Time | # Commuters | % Commuters |
| Less than 5 Minutes | 15 | 4.8% |
| 5 to 9 Minutes | 197 | 62.3% |
| 10 to 14 Minutes | 20 | 6.3% |
| 15 to 19 Minutes | 25 | 7.9% |
| 20 to 24 Minutes | 20 | 6.3% |
| 25 to 29 Minutes | 7 | 2.2% |
| 30 to 34 Minutes | 7 | 2.2% |
| 35 to 39 Minutes | 0 | 0.0% |
| 40 to 44 Minutes | 0 | 0.0% |
| 45 to 59 Minutes | 11 | 3.5% |
| 60 to 89 Minutes | 11 | 3.5% |
| 90 or more Minutes | 3 | 0.9% |
Commute Time by Sex in Walden
The most common commute times in Walden are 5 to 9 minutes (79 commuters, 46.8%) for males and 5 to 9 minutes (118 commuters, 80.3%) for females.
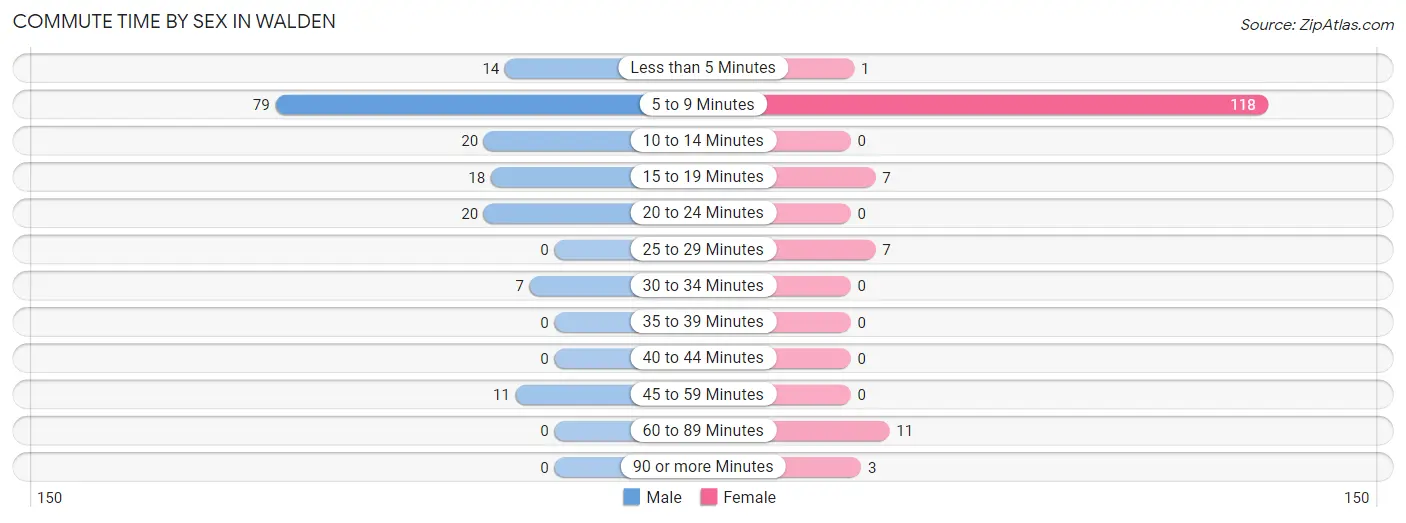
| Commute Time | Male | Female |
| Less than 5 Minutes | 14 (8.3%) | 1 (0.7%) |
| 5 to 9 Minutes | 79 (46.8%) | 118 (80.3%) |
| 10 to 14 Minutes | 20 (11.8%) | 0 (0.0%) |
| 15 to 19 Minutes | 18 (10.6%) | 7 (4.8%) |
| 20 to 24 Minutes | 20 (11.8%) | 0 (0.0%) |
| 25 to 29 Minutes | 0 (0.0%) | 7 (4.8%) |
| 30 to 34 Minutes | 7 (4.1%) | 0 (0.0%) |
| 35 to 39 Minutes | 0 (0.0%) | 0 (0.0%) |
| 40 to 44 Minutes | 0 (0.0%) | 0 (0.0%) |
| 45 to 59 Minutes | 11 (6.5%) | 0 (0.0%) |
| 60 to 89 Minutes | 0 (0.0%) | 11 (7.5%) |
| 90 or more Minutes | 0 (0.0%) | 3 (2.0%) |
Time of Departure to Work by Sex in Walden
The most frequent times of departure to work in Walden are 6:30 AM to 6:59 AM (45, 26.6%) for males and 8:30 AM to 8:59 AM (47, 32.0%) for females.
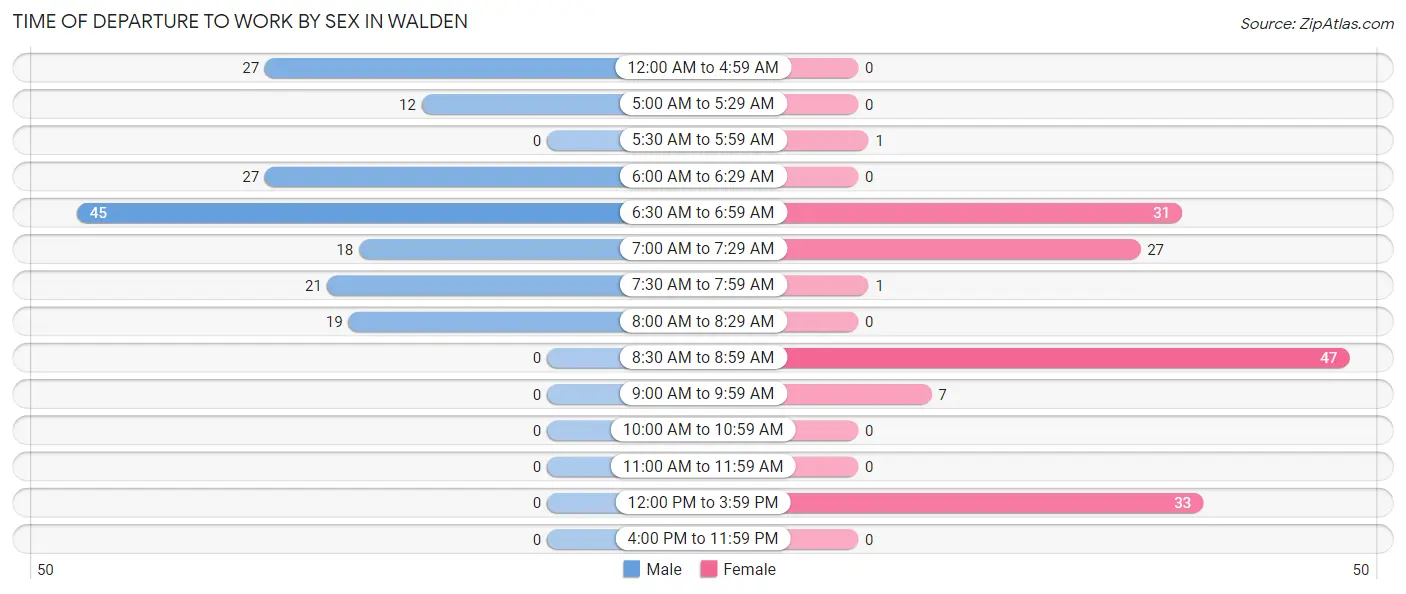
| Time of Departure | Male | Female |
| 12:00 AM to 4:59 AM | 27 (16.0%) | 0 (0.0%) |
| 5:00 AM to 5:29 AM | 12 (7.1%) | 0 (0.0%) |
| 5:30 AM to 5:59 AM | 0 (0.0%) | 1 (0.7%) |
| 6:00 AM to 6:29 AM | 27 (16.0%) | 0 (0.0%) |
| 6:30 AM to 6:59 AM | 45 (26.6%) | 31 (21.1%) |
| 7:00 AM to 7:29 AM | 18 (10.6%) | 27 (18.4%) |
| 7:30 AM to 7:59 AM | 21 (12.4%) | 1 (0.7%) |
| 8:00 AM to 8:29 AM | 19 (11.2%) | 0 (0.0%) |
| 8:30 AM to 8:59 AM | 0 (0.0%) | 47 (32.0%) |
| 9:00 AM to 9:59 AM | 0 (0.0%) | 7 (4.8%) |
| 10:00 AM to 10:59 AM | 0 (0.0%) | 0 (0.0%) |
| 11:00 AM to 11:59 AM | 0 (0.0%) | 0 (0.0%) |
| 12:00 PM to 3:59 PM | 0 (0.0%) | 33 (22.5%) |
| 4:00 PM to 11:59 PM | 0 (0.0%) | 0 (0.0%) |
| Total | 169 (100.0%) | 147 (100.0%) |
Housing Occupancy in Walden
Occupancy by Ownership in Walden
Of the total 324 dwellings in Walden, owner-occupied units account for 248 (76.5%), while renter-occupied units make up 76 (23.5%).
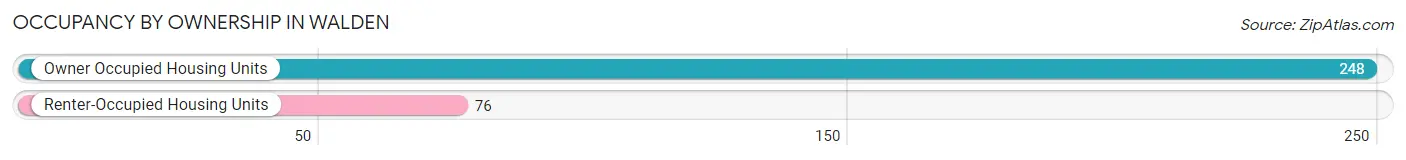
| Occupancy | # Housing Units | % Housing Units |
| Owner Occupied Housing Units | 248 | 76.5% |
| Renter-Occupied Housing Units | 76 | 23.5% |
| Total Occupied Housing Units | 324 | 100.0% |
Occupancy by Household Size in Walden
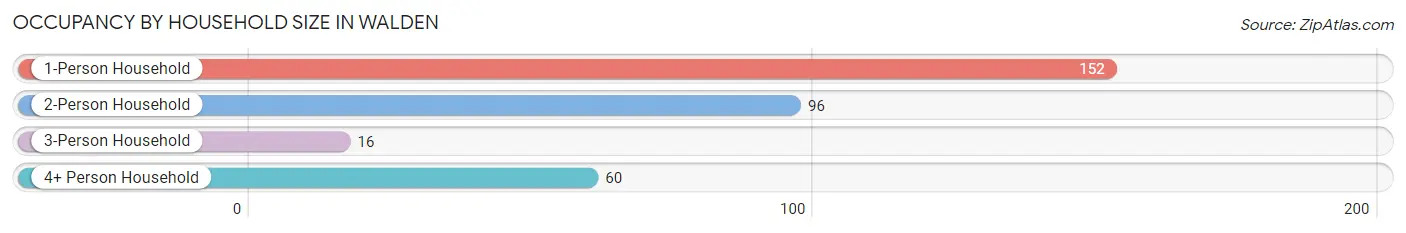
| Household Size | # Housing Units | % Housing Units |
| 1-Person Household | 152 | 46.9% |
| 2-Person Household | 96 | 29.6% |
| 3-Person Household | 16 | 4.9% |
| 4+ Person Household | 60 | 18.5% |
| Total Housing Units | 324 | 100.0% |
Occupancy by Ownership by Household Size in Walden
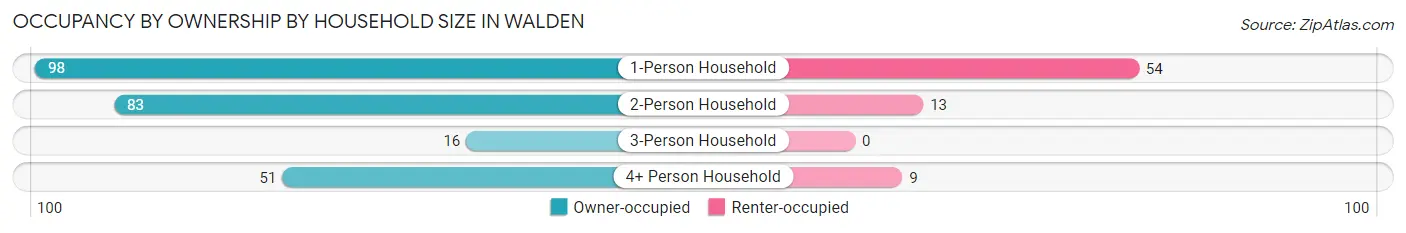
| Household Size | Owner-occupied | Renter-occupied |
| 1-Person Household | 98 (64.5%) | 54 (35.5%) |
| 2-Person Household | 83 (86.5%) | 13 (13.5%) |
| 3-Person Household | 16 (100.0%) | 0 (0.0%) |
| 4+ Person Household | 51 (85.0%) | 9 (15.0%) |
| Total Housing Units | 248 (76.5%) | 76 (23.5%) |
Occupancy by Educational Attainment in Walden
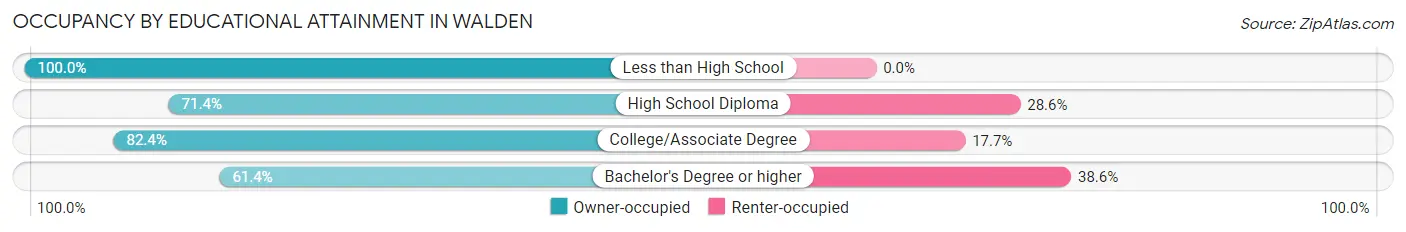
| Household Size | Owner-occupied | Renter-occupied |
| Less than High School | 63 (100.0%) | 0 (0.0%) |
| High School Diploma | 75 (71.4%) | 30 (28.6%) |
| College/Associate Degree | 56 (82.4%) | 12 (17.6%) |
| Bachelor's Degree or higher | 54 (61.4%) | 34 (38.6%) |
Occupancy by Age of Householder in Walden
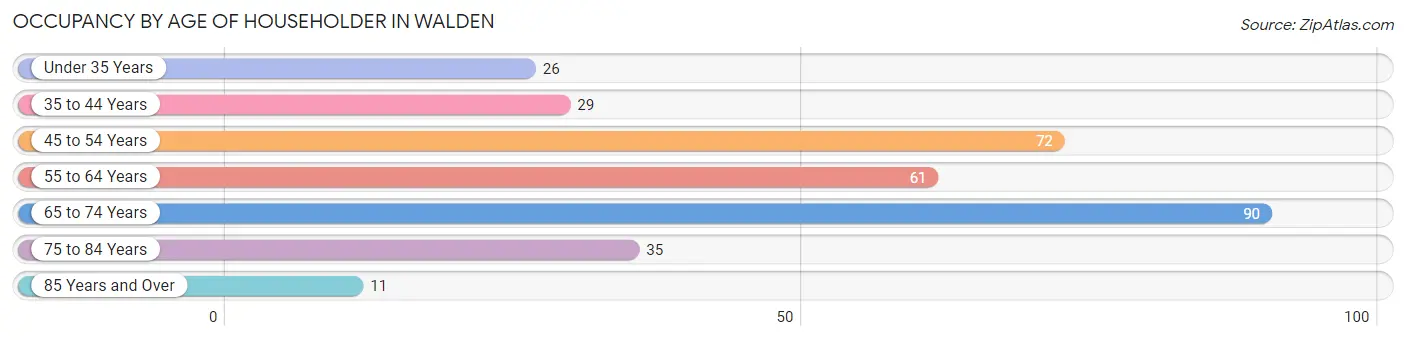
| Age Bracket | # Households | % Households |
| Under 35 Years | 26 | 8.0% |
| 35 to 44 Years | 29 | 8.9% |
| 45 to 54 Years | 72 | 22.2% |
| 55 to 64 Years | 61 | 18.8% |
| 65 to 74 Years | 90 | 27.8% |
| 75 to 84 Years | 35 | 10.8% |
| 85 Years and Over | 11 | 3.4% |
| Total | 324 | 100.0% |
Housing Finances in Walden
Median Income by Occupancy in Walden
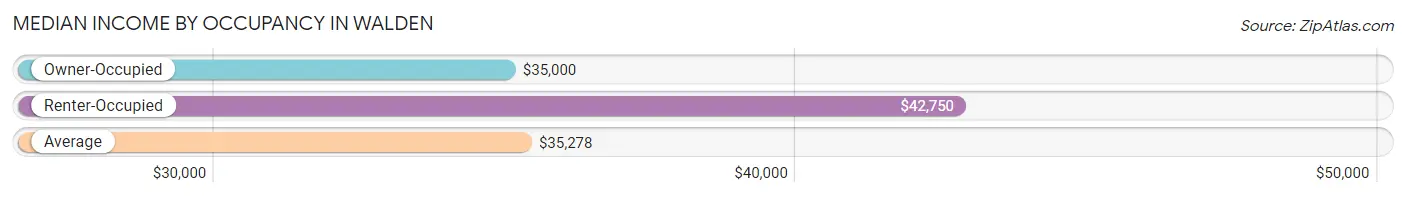
| Occupancy Type | # Households | Median Income |
| Owner-Occupied | 248 (76.5%) | $35,000 |
| Renter-Occupied | 76 (23.5%) | $42,750 |
| Average | 324 (100.0%) | $35,278 |
Occupancy by Householder Income Bracket in Walden
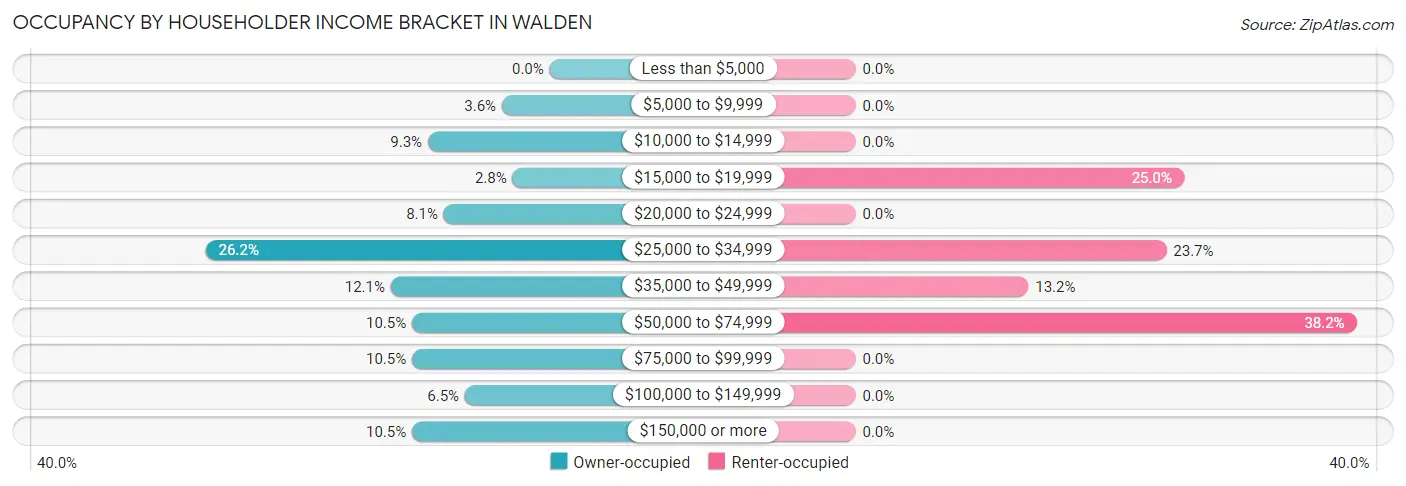
| Income Bracket | Owner-occupied | Renter-occupied |
| Less than $5,000 | 0 (0.0%) | 0 (0.0%) |
| $5,000 to $9,999 | 9 (3.6%) | 0 (0.0%) |
| $10,000 to $14,999 | 23 (9.3%) | 0 (0.0%) |
| $15,000 to $19,999 | 7 (2.8%) | 19 (25.0%) |
| $20,000 to $24,999 | 20 (8.1%) | 0 (0.0%) |
| $25,000 to $34,999 | 65 (26.2%) | 18 (23.7%) |
| $35,000 to $49,999 | 30 (12.1%) | 10 (13.2%) |
| $50,000 to $74,999 | 26 (10.5%) | 29 (38.2%) |
| $75,000 to $99,999 | 26 (10.5%) | 0 (0.0%) |
| $100,000 to $149,999 | 16 (6.5%) | 0 (0.0%) |
| $150,000 or more | 26 (10.5%) | 0 (0.0%) |
| Total | 248 (100.0%) | 76 (100.0%) |
Monthly Housing Cost Tiers in Walden
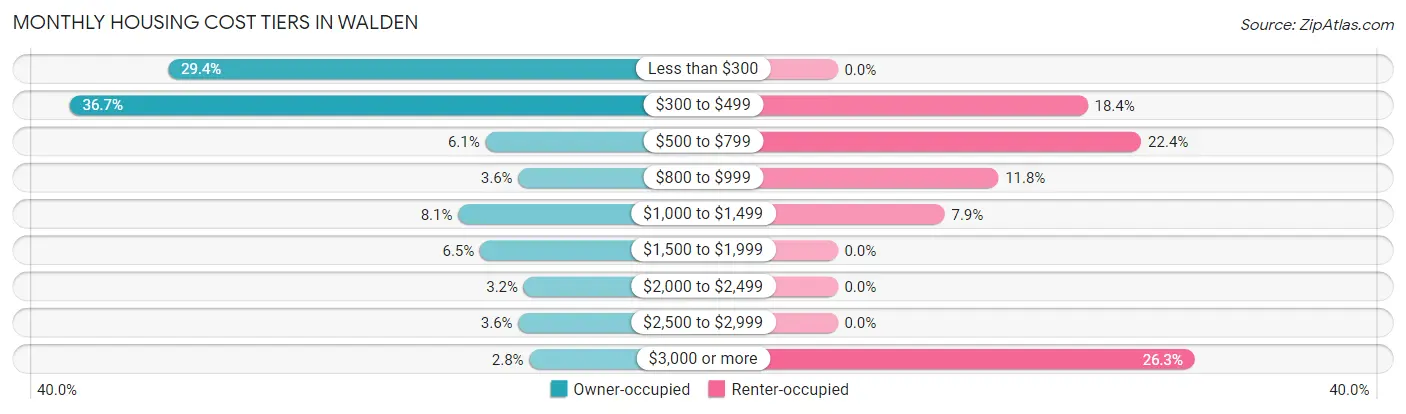
| Monthly Cost | Owner-occupied | Renter-occupied |
| Less than $300 | 73 (29.4%) | 0 (0.0%) |
| $300 to $499 | 91 (36.7%) | 14 (18.4%) |
| $500 to $799 | 15 (6.0%) | 17 (22.4%) |
| $800 to $999 | 9 (3.6%) | 9 (11.8%) |
| $1,000 to $1,499 | 20 (8.1%) | 6 (7.9%) |
| $1,500 to $1,999 | 16 (6.5%) | 0 (0.0%) |
| $2,000 to $2,499 | 8 (3.2%) | 0 (0.0%) |
| $2,500 to $2,999 | 9 (3.6%) | 0 (0.0%) |
| $3,000 or more | 7 (2.8%) | 20 (26.3%) |
| Total | 248 (100.0%) | 76 (100.0%) |
Physical Housing Characteristics in Walden
Housing Structures in Walden
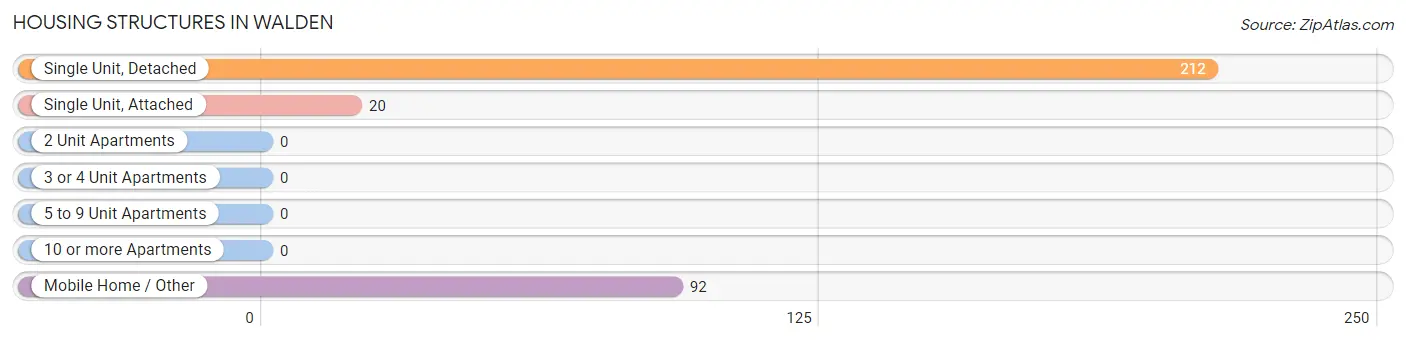
| Structure Type | # Housing Units | % Housing Units |
| Single Unit, Detached | 212 | 65.4% |
| Single Unit, Attached | 20 | 6.2% |
| 2 Unit Apartments | 0 | 0.0% |
| 3 or 4 Unit Apartments | 0 | 0.0% |
| 5 to 9 Unit Apartments | 0 | 0.0% |
| 10 or more Apartments | 0 | 0.0% |
| Mobile Home / Other | 92 | 28.4% |
| Total | 324 | 100.0% |
Housing Structures by Occupancy in Walden
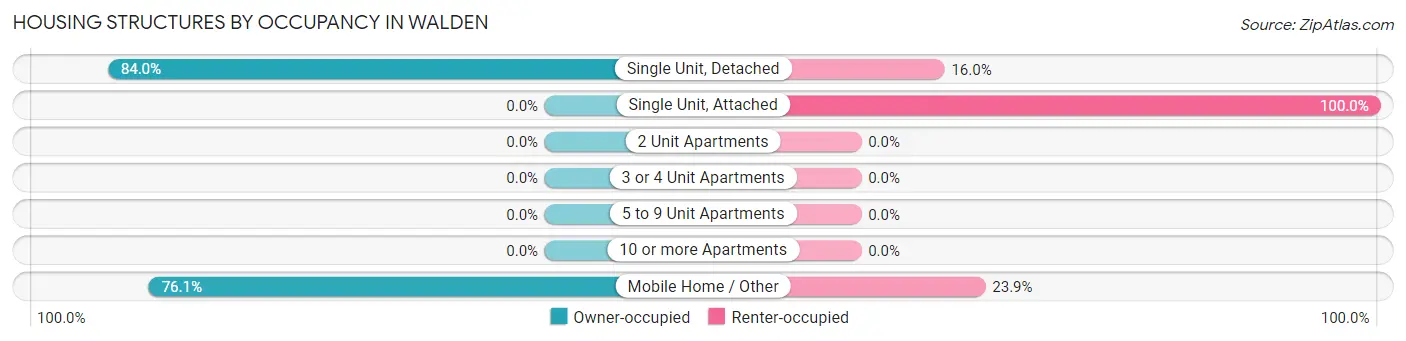
| Structure Type | Owner-occupied | Renter-occupied |
| Single Unit, Detached | 178 (84.0%) | 34 (16.0%) |
| Single Unit, Attached | 0 (0.0%) | 20 (100.0%) |
| 2 Unit Apartments | 0 (0.0%) | 0 (0.0%) |
| 3 or 4 Unit Apartments | 0 (0.0%) | 0 (0.0%) |
| 5 to 9 Unit Apartments | 0 (0.0%) | 0 (0.0%) |
| 10 or more Apartments | 0 (0.0%) | 0 (0.0%) |
| Mobile Home / Other | 70 (76.1%) | 22 (23.9%) |
| Total | 248 (76.5%) | 76 (23.5%) |
Housing Structures by Number of Rooms in Walden
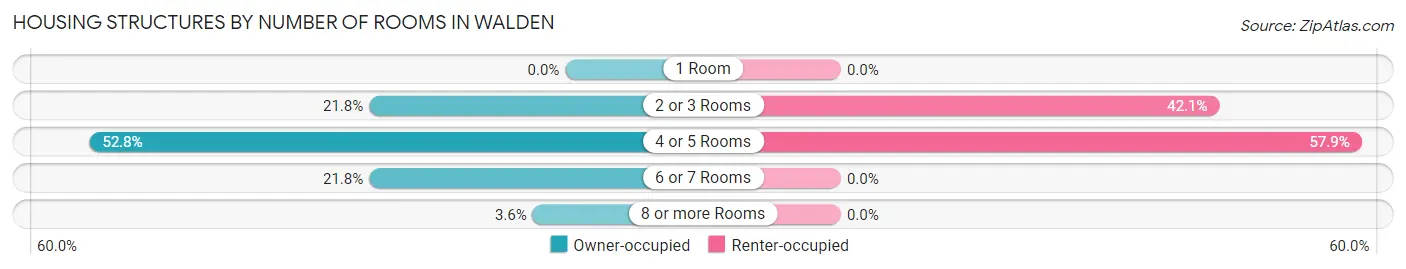
| Number of Rooms | Owner-occupied | Renter-occupied |
| 1 Room | 0 (0.0%) | 0 (0.0%) |
| 2 or 3 Rooms | 54 (21.8%) | 32 (42.1%) |
| 4 or 5 Rooms | 131 (52.8%) | 44 (57.9%) |
| 6 or 7 Rooms | 54 (21.8%) | 0 (0.0%) |
| 8 or more Rooms | 9 (3.6%) | 0 (0.0%) |
| Total | 248 (100.0%) | 76 (100.0%) |
Housing Structure by Heating Type in Walden
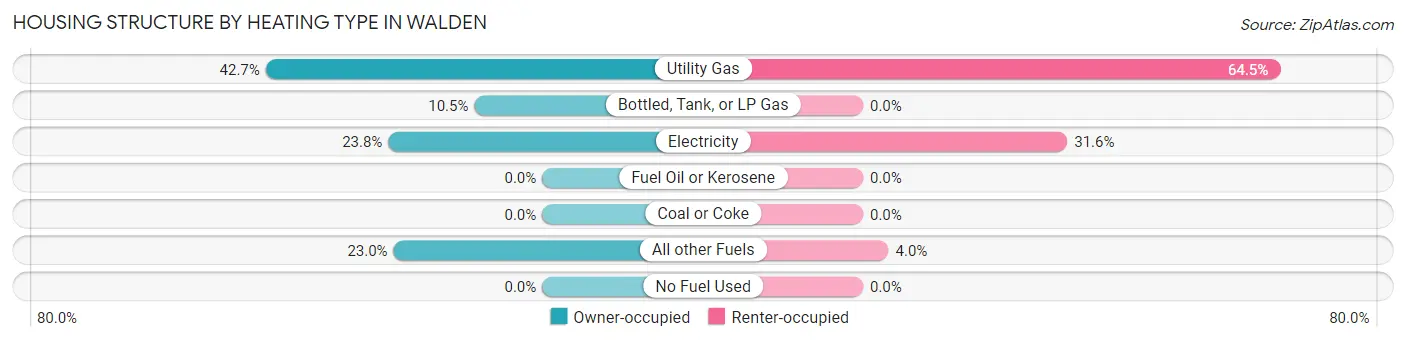
| Heating Type | Owner-occupied | Renter-occupied |
| Utility Gas | 106 (42.7%) | 49 (64.5%) |
| Bottled, Tank, or LP Gas | 26 (10.5%) | 0 (0.0%) |
| Electricity | 59 (23.8%) | 24 (31.6%) |
| Fuel Oil or Kerosene | 0 (0.0%) | 0 (0.0%) |
| Coal or Coke | 0 (0.0%) | 0 (0.0%) |
| All other Fuels | 57 (23.0%) | 3 (4.0%) |
| No Fuel Used | 0 (0.0%) | 0 (0.0%) |
| Total | 248 (100.0%) | 76 (100.0%) |
Household Vehicle Usage in Walden
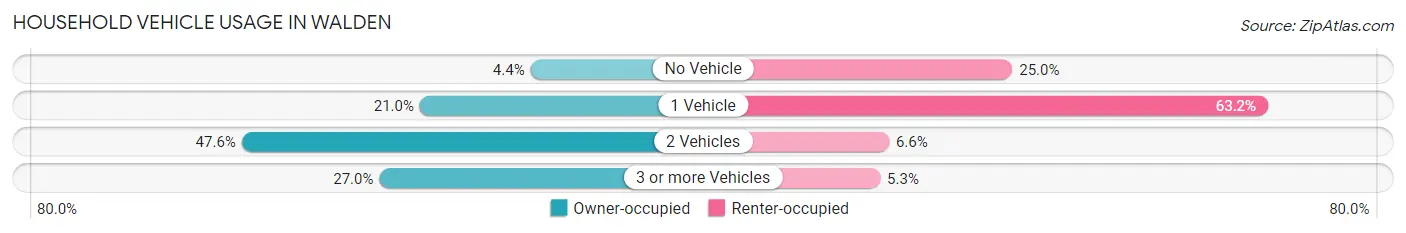
| Vehicles per Household | Owner-occupied | Renter-occupied |
| No Vehicle | 11 (4.4%) | 19 (25.0%) |
| 1 Vehicle | 52 (21.0%) | 48 (63.2%) |
| 2 Vehicles | 118 (47.6%) | 5 (6.6%) |
| 3 or more Vehicles | 67 (27.0%) | 4 (5.3%) |
| Total | 248 (100.0%) | 76 (100.0%) |
Real Estate & Mortgages in Walden
Real Estate and Mortgage Overview in Walden
| Characteristic | Without Mortgage | With Mortgage |
| Housing Units | 179 | 69 |
| Median Property Value | $159,800 | $242,600 |
| Median Household Income | $30,655 | $20 |
| Monthly Housing Costs | $386 | $7 |
| Real Estate Taxes | $277 | $9 |
Property Value by Mortgage Status in Walden
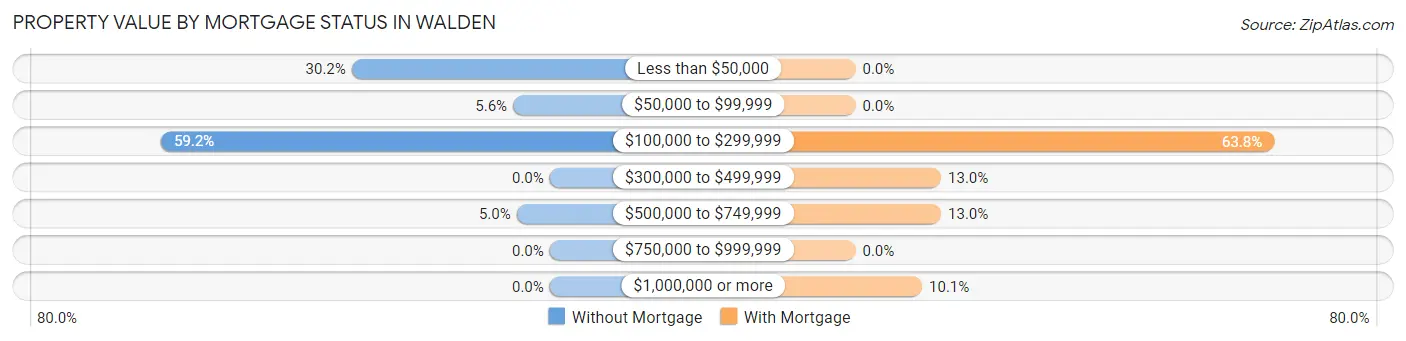
| Property Value | Without Mortgage | With Mortgage |
| Less than $50,000 | 54 (30.2%) | 0 (0.0%) |
| $50,000 to $99,999 | 10 (5.6%) | 0 (0.0%) |
| $100,000 to $299,999 | 106 (59.2%) | 44 (63.8%) |
| $300,000 to $499,999 | 0 (0.0%) | 9 (13.0%) |
| $500,000 to $749,999 | 9 (5.0%) | 9 (13.0%) |
| $750,000 to $999,999 | 0 (0.0%) | 0 (0.0%) |
| $1,000,000 or more | 0 (0.0%) | 7 (10.1%) |
| Total | 179 (100.0%) | 69 (100.0%) |
Household Income by Mortgage Status in Walden
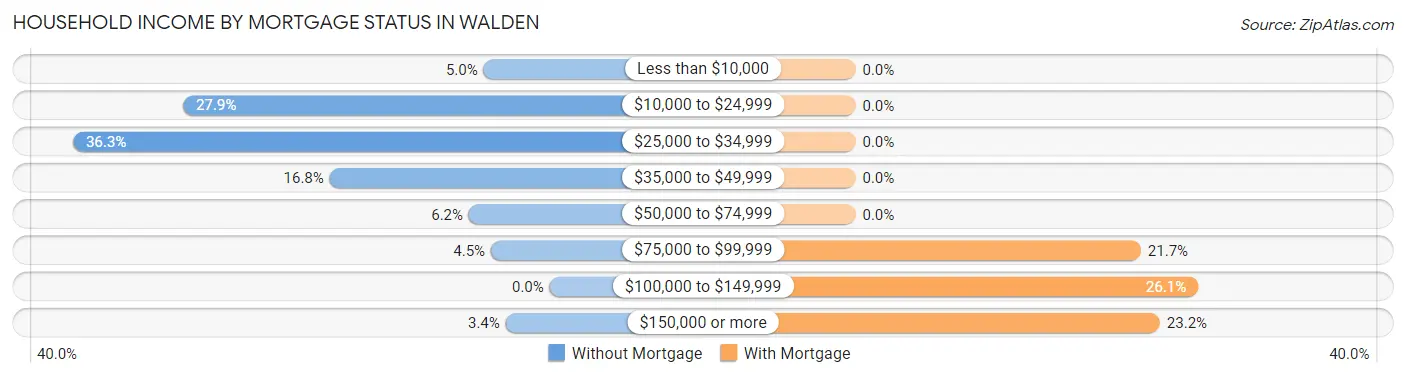
| Household Income | Without Mortgage | With Mortgage |
| Less than $10,000 | 9 (5.0%) | 0 (0.0%) |
| $10,000 to $24,999 | 50 (27.9%) | 0 (0.0%) |
| $25,000 to $34,999 | 65 (36.3%) | 0 (0.0%) |
| $35,000 to $49,999 | 30 (16.8%) | 0 (0.0%) |
| $50,000 to $74,999 | 11 (6.1%) | 0 (0.0%) |
| $75,000 to $99,999 | 8 (4.5%) | 15 (21.7%) |
| $100,000 to $149,999 | 0 (0.0%) | 18 (26.1%) |
| $150,000 or more | 6 (3.4%) | 16 (23.2%) |
| Total | 179 (100.0%) | 69 (100.0%) |
Property Value to Household Income Ratio in Walden
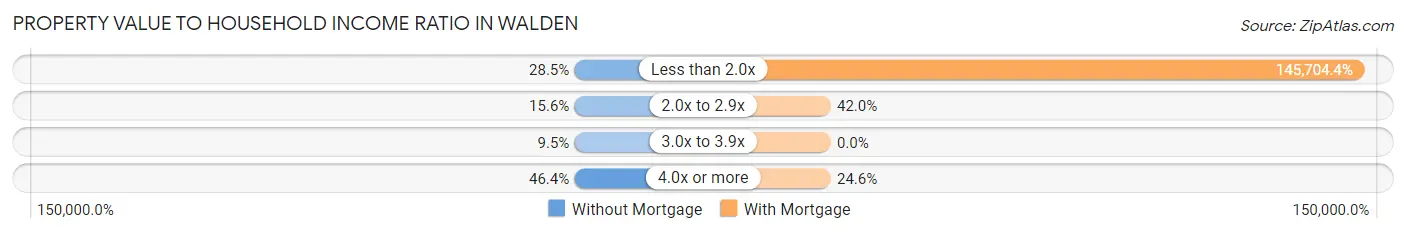
| Value-to-Income Ratio | Without Mortgage | With Mortgage |
| Less than 2.0x | 51 (28.5%) | 100,536 (145,704.3%) |
| 2.0x to 2.9x | 28 (15.6%) | 29 (42.0%) |
| 3.0x to 3.9x | 17 (9.5%) | 0 (0.0%) |
| 4.0x or more | 83 (46.4%) | 17 (24.6%) |
| Total | 179 (100.0%) | 69 (100.0%) |
Real Estate Taxes by Mortgage Status in Walden
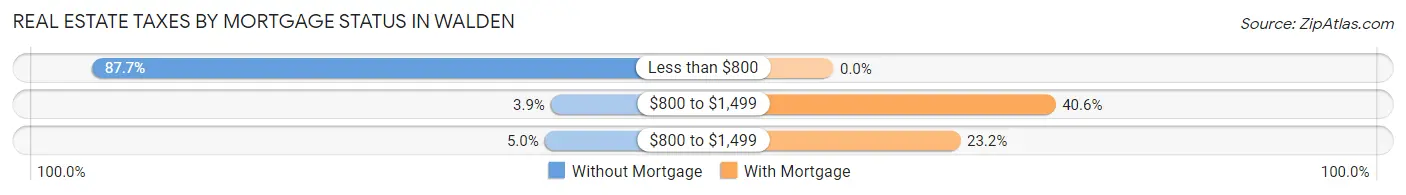
| Property Taxes | Without Mortgage | With Mortgage |
| Less than $800 | 157 (87.7%) | 0 (0.0%) |
| $800 to $1,499 | 7 (3.9%) | 28 (40.6%) |
| $800 to $1,499 | 9 (5.0%) | 16 (23.2%) |
| Total | 179 (100.0%) | 69 (100.0%) |
Health & Disability in Walden
Health Insurance Coverage by Age in Walden
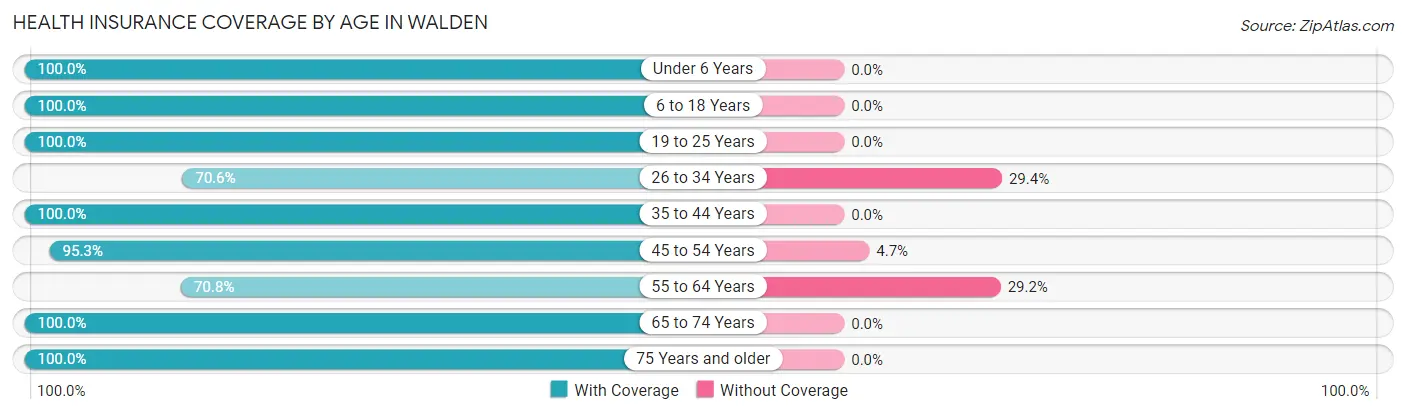
| Age Bracket | With Coverage | Without Coverage |
| Under 6 Years | 23 (100.0%) | 0 (0.0%) |
| 6 to 18 Years | 113 (100.0%) | 0 (0.0%) |
| 19 to 25 Years | 70 (100.0%) | 0 (0.0%) |
| 26 to 34 Years | 36 (70.6%) | 15 (29.4%) |
| 35 to 44 Years | 39 (100.0%) | 0 (0.0%) |
| 45 to 54 Years | 102 (95.3%) | 5 (4.7%) |
| 55 to 64 Years | 68 (70.8%) | 28 (29.2%) |
| 65 to 74 Years | 126 (100.0%) | 0 (0.0%) |
| 75 Years and older | 73 (100.0%) | 0 (0.0%) |
| Total | 650 (93.1%) | 48 (6.9%) |
Health Insurance Coverage by Citizenship Status in Walden
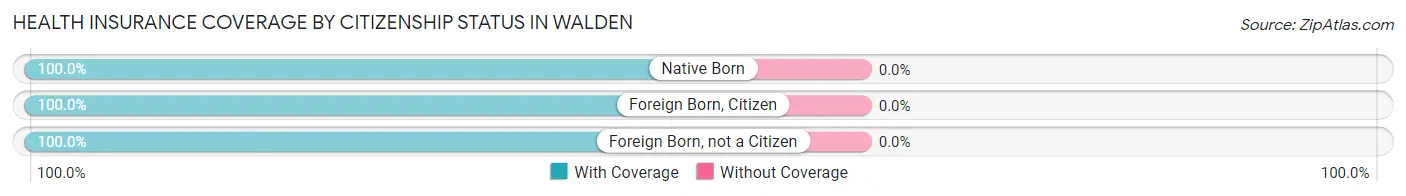
| Citizenship Status | With Coverage | Without Coverage |
| Native Born | 23 (100.0%) | 0 (0.0%) |
| Foreign Born, Citizen | 113 (100.0%) | 0 (0.0%) |
| Foreign Born, not a Citizen | 70 (100.0%) | 0 (0.0%) |
Health Insurance Coverage by Household Income in Walden
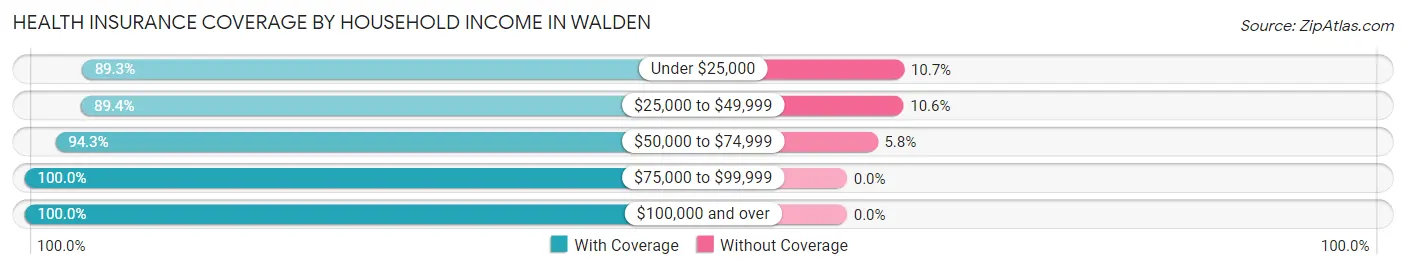
| Household Income | With Coverage | Without Coverage |
| Under $25,000 | 75 (89.3%) | 9 (10.7%) |
| $25,000 to $49,999 | 287 (89.4%) | 34 (10.6%) |
| $50,000 to $74,999 | 82 (94.3%) | 5 (5.8%) |
| $75,000 to $99,999 | 45 (100.0%) | 0 (0.0%) |
| $100,000 and over | 154 (100.0%) | 0 (0.0%) |
Public vs Private Health Insurance Coverage by Age in Walden
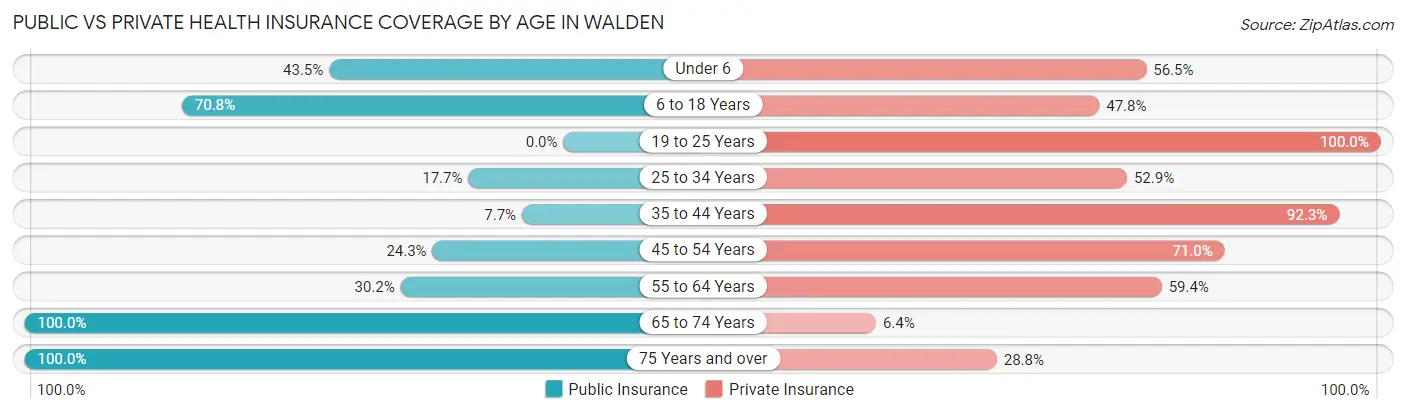
| Age Bracket | Public Insurance | Private Insurance |
| Under 6 | 10 (43.5%) | 13 (56.5%) |
| 6 to 18 Years | 80 (70.8%) | 54 (47.8%) |
| 19 to 25 Years | 0 (0.0%) | 70 (100.0%) |
| 25 to 34 Years | 9 (17.6%) | 27 (52.9%) |
| 35 to 44 Years | 3 (7.7%) | 36 (92.3%) |
| 45 to 54 Years | 26 (24.3%) | 76 (71.0%) |
| 55 to 64 Years | 29 (30.2%) | 57 (59.4%) |
| 65 to 74 Years | 126 (100.0%) | 8 (6.4%) |
| 75 Years and over | 73 (100.0%) | 21 (28.8%) |
| Total | 356 (51.0%) | 362 (51.9%) |
Disability Status by Sex by Age in Walden
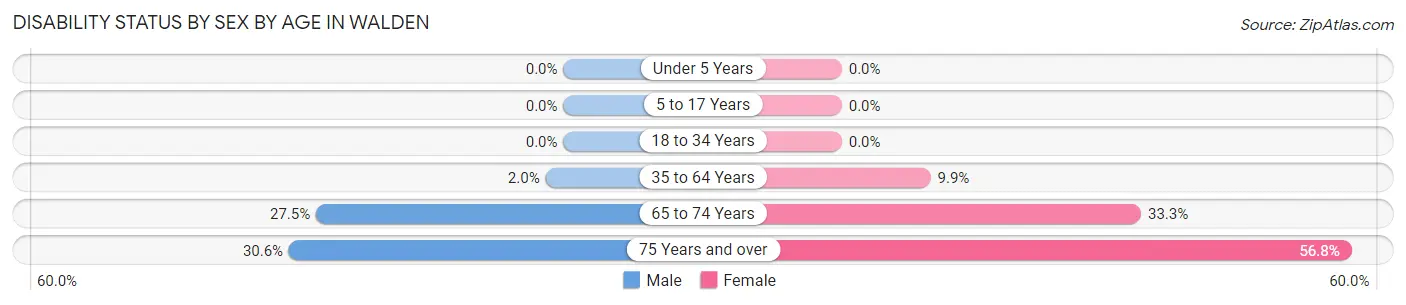
| Age Bracket | Male | Female |
| Under 5 Years | 0 (0.0%) | 0 (0.0%) |
| 5 to 17 Years | 0 (0.0%) | 0 (0.0%) |
| 18 to 34 Years | 0 (0.0%) | 0 (0.0%) |
| 35 to 64 Years | 3 (2.0%) | 9 (9.9%) |
| 65 to 74 Years | 19 (27.5%) | 19 (33.3%) |
| 75 Years and over | 11 (30.6%) | 21 (56.8%) |
Disability Class by Sex by Age in Walden
Disability Class: Hearing Difficulty
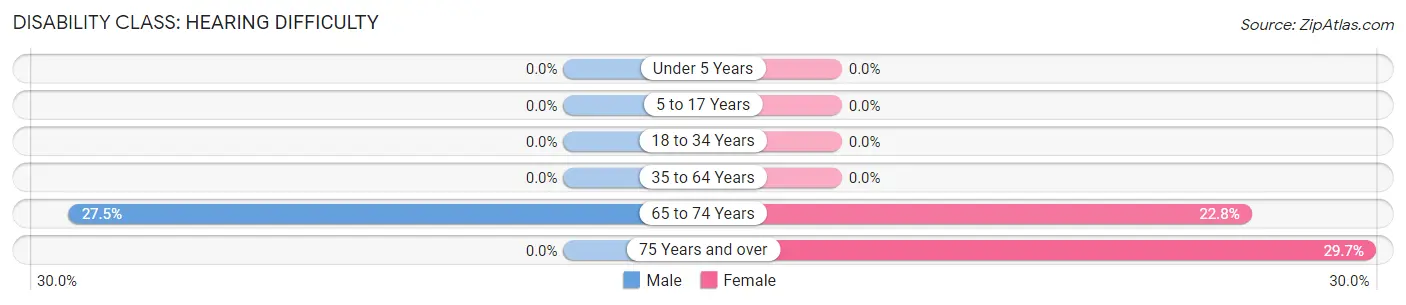
| Age Bracket | Male | Female |
| Under 5 Years | 0 (0.0%) | 0 (0.0%) |
| 5 to 17 Years | 0 (0.0%) | 0 (0.0%) |
| 18 to 34 Years | 0 (0.0%) | 0 (0.0%) |
| 35 to 64 Years | 0 (0.0%) | 0 (0.0%) |
| 65 to 74 Years | 19 (27.5%) | 13 (22.8%) |
| 75 Years and over | 0 (0.0%) | 11 (29.7%) |
Disability Class: Vision Difficulty
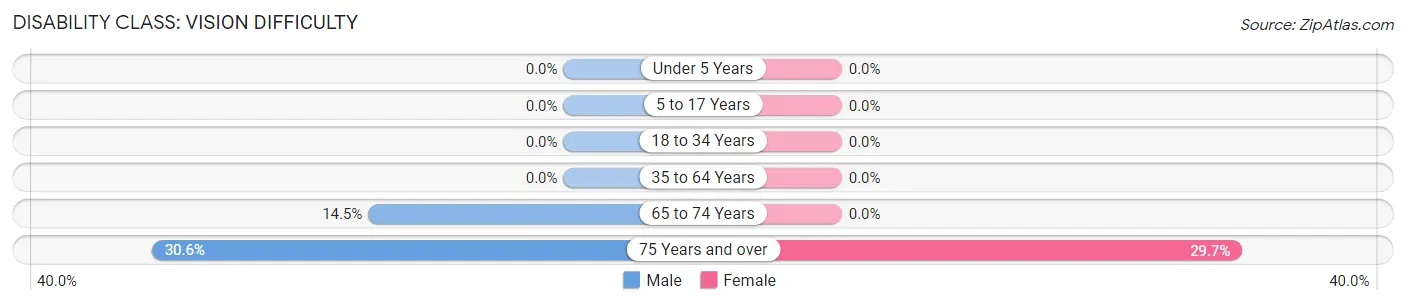
| Age Bracket | Male | Female |
| Under 5 Years | 0 (0.0%) | 0 (0.0%) |
| 5 to 17 Years | 0 (0.0%) | 0 (0.0%) |
| 18 to 34 Years | 0 (0.0%) | 0 (0.0%) |
| 35 to 64 Years | 0 (0.0%) | 0 (0.0%) |
| 65 to 74 Years | 10 (14.5%) | 0 (0.0%) |
| 75 Years and over | 11 (30.6%) | 11 (29.7%) |
Disability Class: Cognitive Difficulty
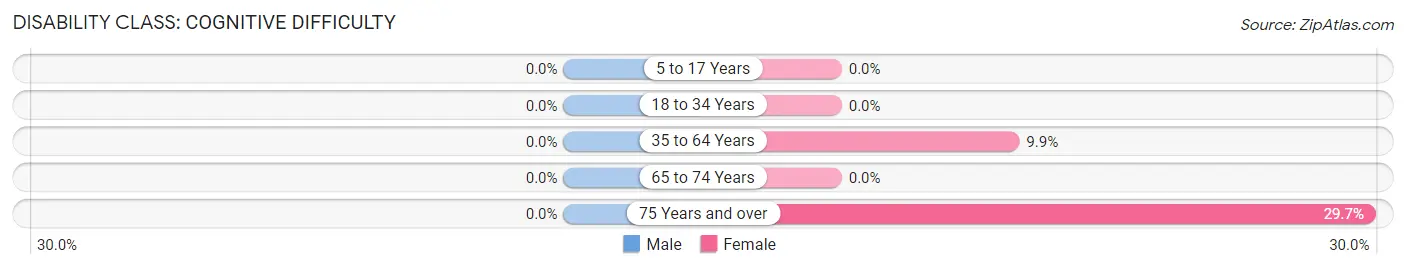
| Age Bracket | Male | Female |
| 5 to 17 Years | 0 (0.0%) | 0 (0.0%) |
| 18 to 34 Years | 0 (0.0%) | 0 (0.0%) |
| 35 to 64 Years | 0 (0.0%) | 9 (9.9%) |
| 65 to 74 Years | 0 (0.0%) | 0 (0.0%) |
| 75 Years and over | 0 (0.0%) | 11 (29.7%) |
Disability Class: Ambulatory Difficulty
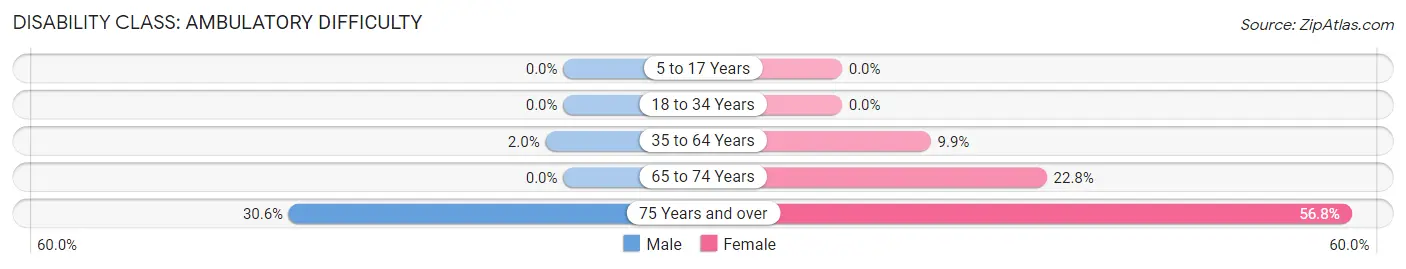
| Age Bracket | Male | Female |
| 5 to 17 Years | 0 (0.0%) | 0 (0.0%) |
| 18 to 34 Years | 0 (0.0%) | 0 (0.0%) |
| 35 to 64 Years | 3 (2.0%) | 9 (9.9%) |
| 65 to 74 Years | 0 (0.0%) | 13 (22.8%) |
| 75 Years and over | 11 (30.6%) | 21 (56.8%) |
Disability Class: Self-Care Difficulty
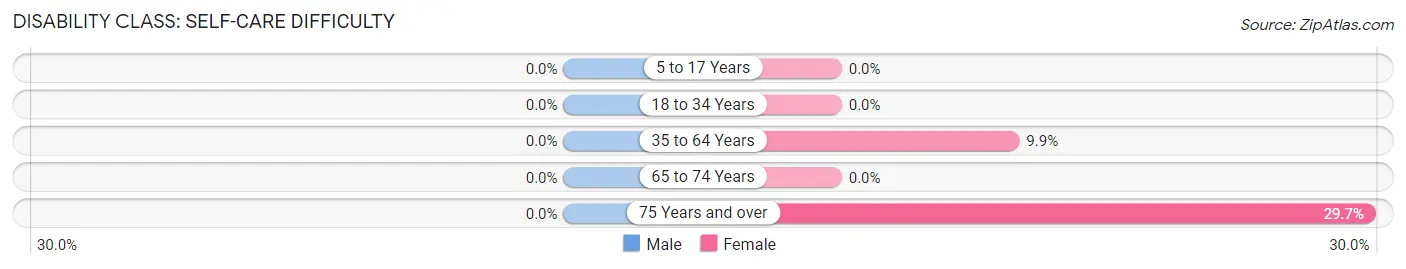
| Age Bracket | Male | Female |
| 5 to 17 Years | 0 (0.0%) | 0 (0.0%) |
| 18 to 34 Years | 0 (0.0%) | 0 (0.0%) |
| 35 to 64 Years | 0 (0.0%) | 9 (9.9%) |
| 65 to 74 Years | 0 (0.0%) | 0 (0.0%) |
| 75 Years and over | 0 (0.0%) | 11 (29.7%) |
Technology Access in Walden
Computing Device Access in Walden
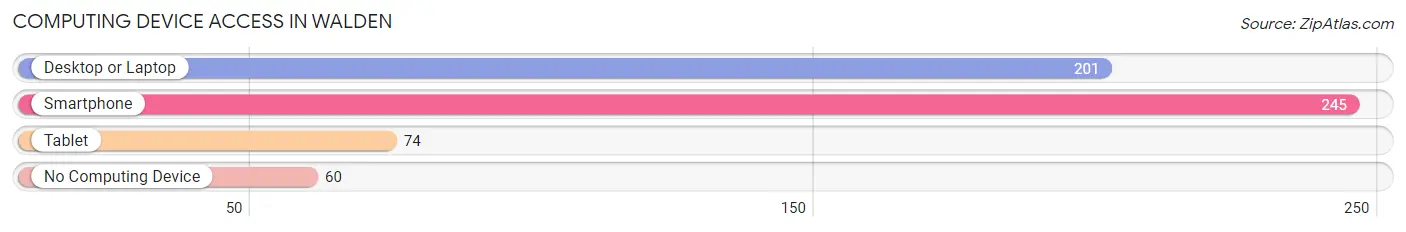
| Device Type | # Households | % Households |
| Desktop or Laptop | 201 | 62.0% |
| Smartphone | 245 | 75.6% |
| Tablet | 74 | 22.8% |
| No Computing Device | 60 | 18.5% |
| Total | 324 | 100.0% |
Internet Access in Walden
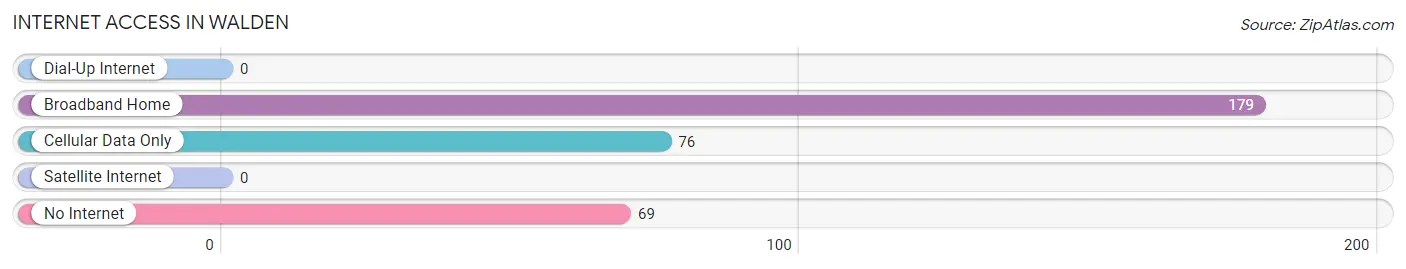
| Internet Type | # Households | % Households |
| Dial-Up Internet | 0 | 0.0% |
| Broadband Home | 179 | 55.2% |
| Cellular Data Only | 76 | 23.5% |
| Satellite Internet | 0 | 0.0% |
| No Internet | 69 | 21.3% |
| Total | 324 | 100.0% |
Walden Summary
Walden, Colorado is a small town located in the northern part of the state, in Jackson County. It is situated at an elevation of 8,000 feet, making it one of the highest towns in the United States. The town is surrounded by the Medicine Bow National Forest and the Routt National Forest, and is home to a population of just over 600 people.
History
The town of Walden was founded in 1875 by a group of settlers from the Midwest. The settlers were looking for a place to homestead and found the area to be ideal for farming and ranching. The town was named after the nearby Walden Creek, which was named after the famous American philosopher Henry David Thoreau's book, Walden.
The town grew slowly over the years, and by the early 1900s, it had become a popular destination for tourists and hunters. The town was also home to a number of businesses, including a hotel, a general store, and a post office.
In the 1950s, the town began to experience a decline in population as people moved away to larger cities. However, in the 1970s, the town experienced a resurgence in popularity as people began to move back to the area. Today, Walden is a popular destination for outdoor enthusiasts, with a variety of activities such as fishing, hunting, camping, and hiking.
Geography
Walden is located in the northern part of Colorado, in Jackson County. It is situated at an elevation of 8,000 feet, making it one of the highest towns in the United States. The town is surrounded by the Medicine Bow National Forest and the Routt National Forest.
The town is located in a valley surrounded by mountains, and is home to a variety of wildlife, including elk, deer, and bighorn sheep. The area is also home to a variety of birds, including bald eagles, hawks, and owls.
Economy
The economy of Walden is largely based on tourism and outdoor recreation. The town is home to a number of businesses, including restaurants, hotels, and stores. The town is also home to a number of outdoor recreation businesses, such as fishing guides, hunting guides, and outfitters.
The town is also home to a number of small businesses, such as a general store, a post office, and a gas station. The town is also home to a number of art galleries, which feature the work of local artists.
Demographics
As of the 2010 census, the population of Walden was 602. The town is predominantly white, with a small Hispanic population. The median household income in the town is $37,500, and the median age is 44.
Conclusion
Walden, Colorado is a small town located in the northern part of the state, in Jackson County. It is situated at an elevation of 8,000 feet, making it one of the highest towns in the United States. The town is surrounded by the Medicine Bow National Forest and the Routt National Forest, and is home to a population of just over 600 people. The town was founded in 1875 by a group of settlers from the Midwest, and has since become a popular destination for outdoor enthusiasts. The economy of Walden is largely based on tourism and outdoor recreation, and the town is home to a number of businesses, including restaurants, hotels, and stores. The town is predominantly white, with a small Hispanic population, and the median household income is $37,500.
Common Questions
What is Per Capita Income in Walden?
Per Capita income in Walden is $29,651.
What is the Median Family Income in Walden?
Median Family Income in Walden is $35,556.
What is the Median Household income in Walden?
Median Household Income in Walden is $35,278.
What is Income or Wage Gap in Walden?
Income or Wage Gap in Walden is 70.4%.
Women in Walden earn 29.6 cents for every dollar earned by a man.
What is Inequality or Gini Index in Walden?
Inequality or Gini Index in Walden is 0.51.
What is the Total Population of Walden?
Total Population of Walden is 704.
What is the Total Male Population of Walden?
Total Male Population of Walden is 362.
What is the Total Female Population of Walden?
Total Female Population of Walden is 342.
What is the Ratio of Males per 100 Females in Walden?
There are 105.85 Males per 100 Females in Walden.
What is the Ratio of Females per 100 Males in Walden?
There are 94.48 Females per 100 Males in Walden.
What is the Median Population Age in Walden?
Median Population Age in Walden is 51.1 Years.
What is the Average Family Size in Walden
Average Family Size in Walden is 3.2 People.
What is the Average Household Size in Walden
Average Household Size in Walden is 2.1 People.
How Large is the Labor Force in Walden?
There are 338 People in the Labor Forcein in Walden.
What is the Percentage of People in the Labor Force in Walden?
54.6% of People are in the Labor Force in Walden.