Telluride, CO Map & Demographics
Telluride Map
Telluride Overview
$55,531
PER CAPITA INCOME
$155,500
AVG FAMILY INCOME
$81,429
AVG HOUSEHOLD INCOME
3.3%
WAGE / INCOME GAP [ % ]
96.7¢/ $1
WAGE / INCOME GAP [ $ ]
0.43
INEQUALITY / GINI INDEX
2,622
TOTAL POPULATION
1,406
MALE POPULATION
1,216
FEMALE POPULATION
115.62
MALES / 100 FEMALES
86.49
FEMALES / 100 MALES
40.1
MEDIAN AGE
2.7
AVG FAMILY SIZE
2.1
AVG HOUSEHOLD SIZE
1,772
LABOR FORCE [ PEOPLE ]
78.9%
PERCENT IN LABOR FORCE
2.8%
UNEMPLOYMENT RATE
Telluride Zip Codes
Telluride Area Codes
Income in Telluride
Income Overview in Telluride
Per Capita Income in Telluride is $55,531, while median incomes of families and households are $155,500 and $81,429 respectively.
| Characteristic | Number | Measure |
| Per Capita Income | 2,622 | $55,531 |
| Median Family Income | 580 | $155,500 |
| Mean Family Income | 580 | $148,257 |
| Median Household Income | 1,250 | $81,429 |
| Mean Household Income | 1,250 | $115,161 |
| Income Deficit | 580 | $0 |
| Wage / Income Gap (%) | 2,622 | 3.34% |
| Wage / Income Gap ($) | 2,622 | 96.66¢ per $1 |
| Gini / Inequality Index | 2,622 | 0.43 |
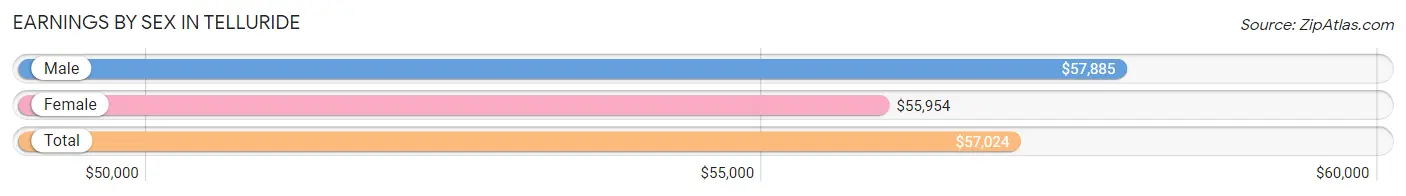
Earnings by Sex in Telluride
Average Earnings in Telluride are $57,024, $57,885 for men and $55,954 for women, a difference of 3.3%.
| Sex | Number | Average Earnings |
| Male | 1,040 (57.1%) | $57,885 |
| Female | 783 (42.9%) | $55,954 |
| Total | 1,823 (100.0%) | $57,024 |
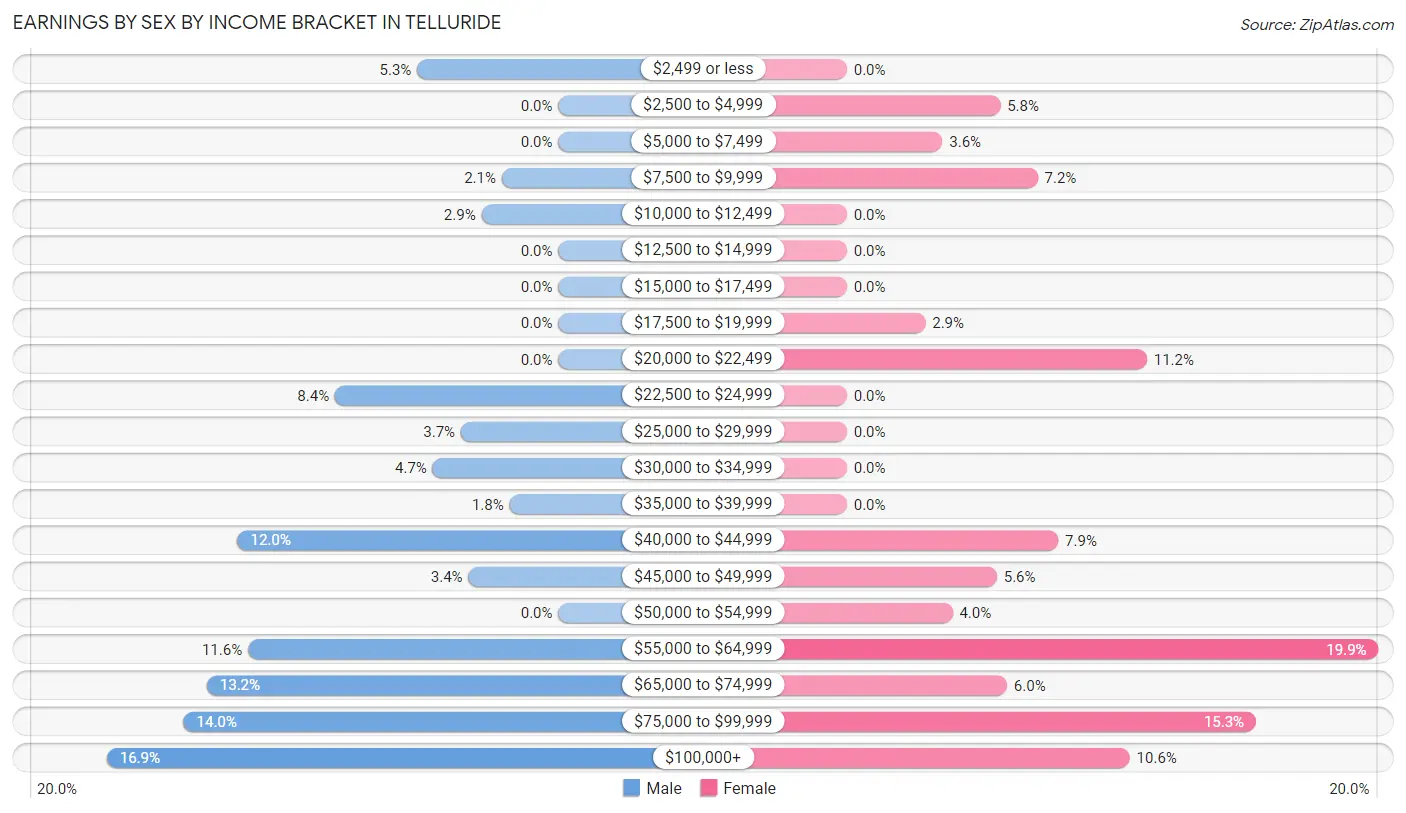
Earnings by Sex by Income Bracket in Telluride
The most common earnings brackets in Telluride are $100,000+ for men (176 | 16.9%) and $55,000 to $64,999 for women (156 | 19.9%).
| Income | Male | Female |
| $2,499 or less | 55 (5.3%) | 0 (0.0%) |
| $2,500 to $4,999 | 0 (0.0%) | 45 (5.8%) |
| $5,000 to $7,499 | 0 (0.0%) | 28 (3.6%) |
| $7,500 to $9,999 | 22 (2.1%) | 56 (7.1%) |
| $10,000 to $12,499 | 30 (2.9%) | 0 (0.0%) |
| $12,500 to $14,999 | 0 (0.0%) | 0 (0.0%) |
| $15,000 to $17,499 | 0 (0.0%) | 0 (0.0%) |
| $17,500 to $19,999 | 0 (0.0%) | 23 (2.9%) |
| $20,000 to $22,499 | 0 (0.0%) | 88 (11.2%) |
| $22,500 to $24,999 | 87 (8.4%) | 0 (0.0%) |
| $25,000 to $29,999 | 38 (3.6%) | 0 (0.0%) |
| $30,000 to $34,999 | 49 (4.7%) | 0 (0.0%) |
| $35,000 to $39,999 | 19 (1.8%) | 0 (0.0%) |
| $40,000 to $44,999 | 125 (12.0%) | 62 (7.9%) |
| $45,000 to $49,999 | 35 (3.4%) | 44 (5.6%) |
| $50,000 to $54,999 | 0 (0.0%) | 31 (4.0%) |
| $55,000 to $64,999 | 121 (11.6%) | 156 (19.9%) |
| $65,000 to $74,999 | 137 (13.2%) | 47 (6.0%) |
| $75,000 to $99,999 | 146 (14.0%) | 120 (15.3%) |
| $100,000+ | 176 (16.9%) | 83 (10.6%) |
| Total | 1,040 (100.0%) | 783 (100.0%) |
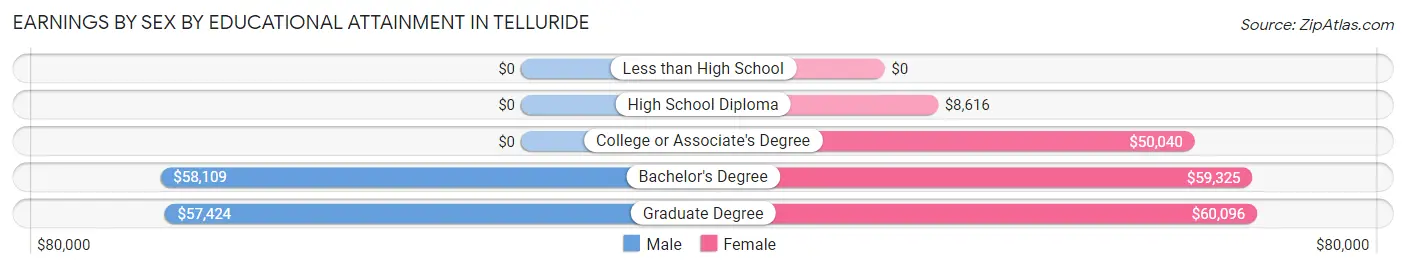
Earnings by Sex by Educational Attainment in Telluride
Average earnings in Telluride are $59,455 for men and $57,586 for women, a difference of 3.1%. Men with an educational attainment of bachelor's degree enjoy the highest average annual earnings of $58,109, while those with graduate degree education earn the least with $57,424. Women with an educational attainment of graduate degree earn the most with the average annual earnings of $60,096, while those with high school diploma education have the smallest earnings of $8,616.
| Educational Attainment | Male Income | Female Income |
| Less than High School | - | - |
| High School Diploma | - | - |
| College or Associate's Degree | - | - |
| Bachelor's Degree | $58,109 | $59,325 |
| Graduate Degree | $57,424 | $60,096 |
| Total | $59,455 | $57,586 |
Family Income in Telluride
Family Income Brackets in Telluride
According to the Telluride family income data, there are 149 families falling into the $150,000 to $199,999 income range, which is the most common income bracket and makes up 25.7% of all families.
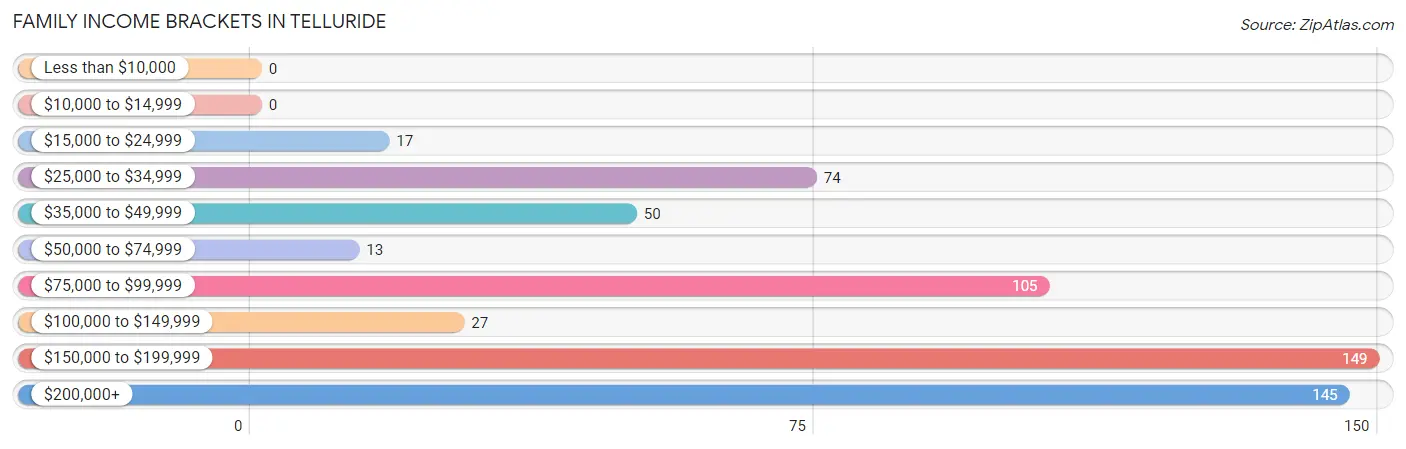
| Income Bracket | # Families | % Families |
| Less than $10,000 | 0 | 0.0% |
| $10,000 to $14,999 | 0 | 0.0% |
| $15,000 to $24,999 | 17 | 2.9% |
| $25,000 to $34,999 | 74 | 12.8% |
| $35,000 to $49,999 | 50 | 8.6% |
| $50,000 to $74,999 | 13 | 2.2% |
| $75,000 to $99,999 | 105 | 18.1% |
| $100,000 to $149,999 | 27 | 4.7% |
| $150,000 to $199,999 | 149 | 25.7% |
| $200,000+ | 145 | 25.0% |
Family Income by Famaliy Size in Telluride
2-person families (288 | 49.7%) account for the highest median family income in Telluride with $173,051 per family, while 2-person families (288 | 49.7%) have the highest median income of $86,526 per family member.
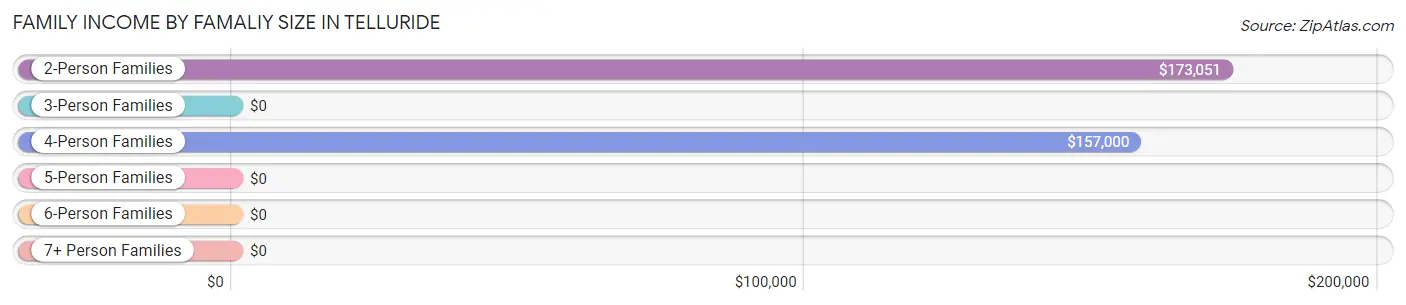
| Income Bracket | # Families | Median Income |
| 2-Person Families | 288 (49.7%) | $173,051 |
| 3-Person Families | 132 (22.8%) | $0 |
| 4-Person Families | 96 (16.6%) | $157,000 |
| 5-Person Families | 47 (8.1%) | $0 |
| 6-Person Families | 17 (2.9%) | $0 |
| 7+ Person Families | 0 (0.0%) | $0 |
| Total | 580 (100.0%) | $155,500 |
Family Income by Number of Earners in Telluride
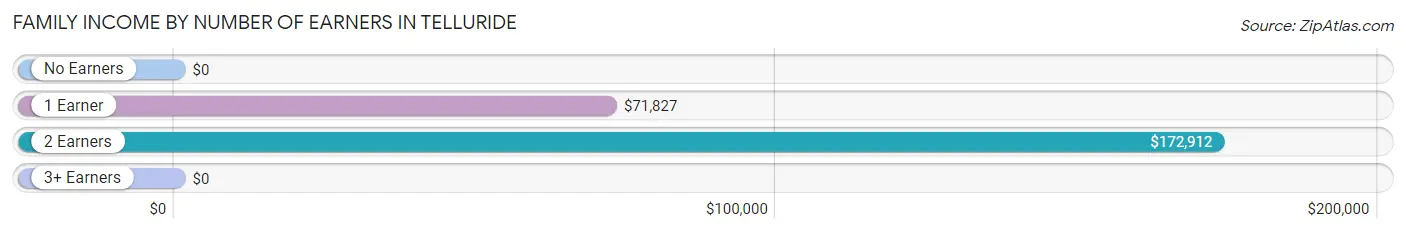
| Number of Earners | # Families | Median Income |
| No Earners | 56 (9.7%) | $0 |
| 1 Earner | 189 (32.6%) | $71,827 |
| 2 Earners | 321 (55.3%) | $172,912 |
| 3+ Earners | 14 (2.4%) | $0 |
| Total | 580 (100.0%) | $155,500 |
Household Income in Telluride
Household Income Brackets in Telluride
With 250 households falling in the category, the $200,000+ income range is the most frequent in Telluride, accounting for 20.0% of all households.
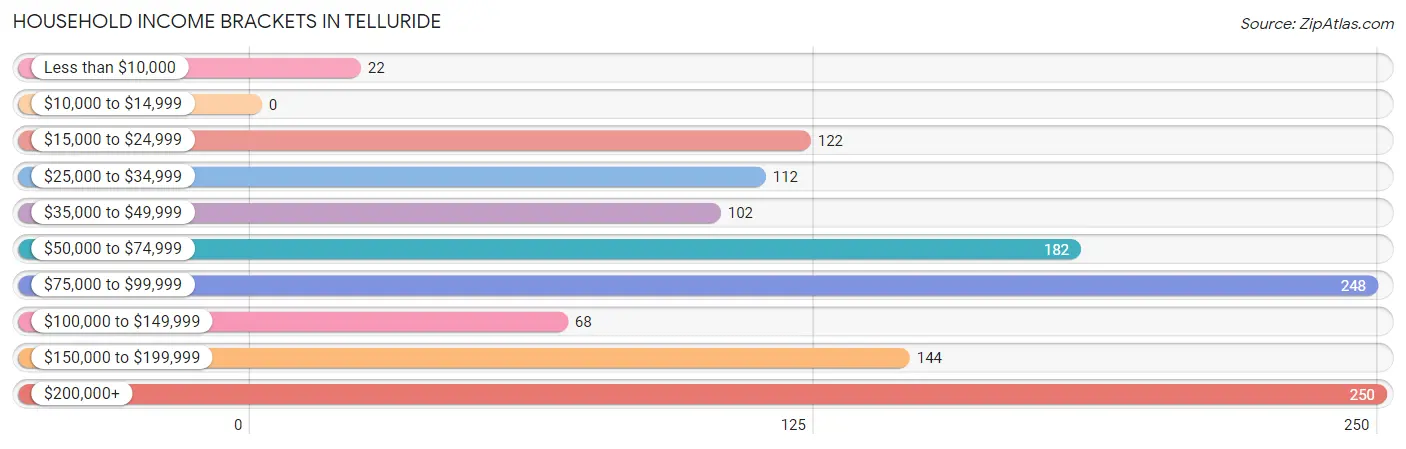
| Income Bracket | # Households | % Households |
| Less than $10,000 | 22 | 1.8% |
| $10,000 to $14,999 | 0 | 0.0% |
| $15,000 to $24,999 | 122 | 9.8% |
| $25,000 to $34,999 | 112 | 9.0% |
| $35,000 to $49,999 | 102 | 8.2% |
| $50,000 to $74,999 | 182 | 14.6% |
| $75,000 to $99,999 | 248 | 19.8% |
| $100,000 to $149,999 | 68 | 5.4% |
| $150,000 to $199,999 | 144 | 11.5% |
| $200,000+ | 250 | 20.0% |
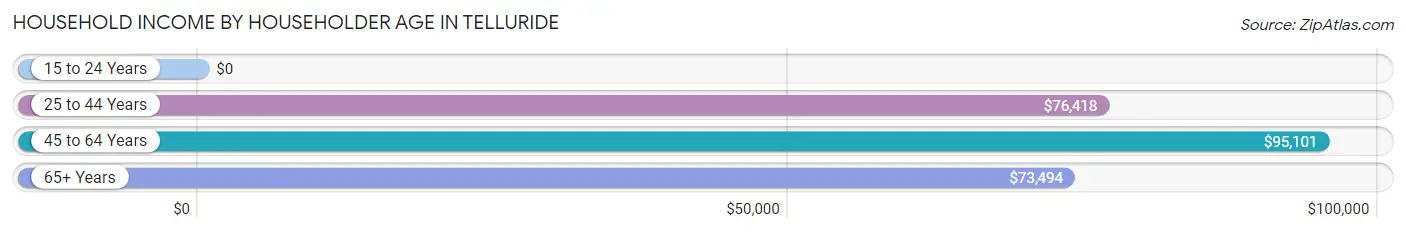
Household Income by Householder Age in Telluride
The median household income in Telluride is $81,429, with the highest median household income of $95,101 found in the 45 to 64 years age bracket for the primary householder. A total of 505 households (40.4%) fall into this category. Meanwhile, the 15 to 24 years age bracket for the primary householder has the lowest median household income of $0, with 19 households (1.5%) in this group.
| Income Bracket | # Households | Median Income |
| 15 to 24 Years | 19 (1.5%) | $0 |
| 25 to 44 Years | 543 (43.4%) | $76,418 |
| 45 to 64 Years | 505 (40.4%) | $95,101 |
| 65+ Years | 183 (14.6%) | $73,494 |
| Total | 1,250 (100.0%) | $81,429 |
Poverty in Telluride
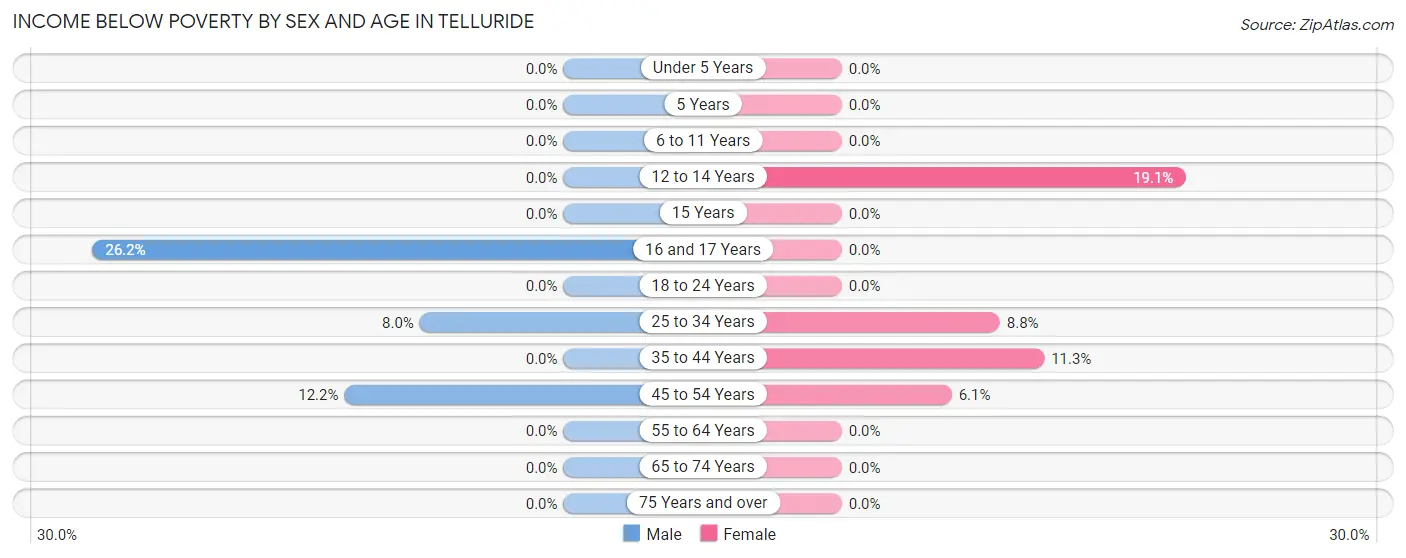
Income Below Poverty by Sex and Age in Telluride
With 5.2% poverty level for males and 6.3% for females among the residents of Telluride, 16 and 17 year old males and 12 to 14 year old females are the most vulnerable to poverty, with 16 males (26.2%) and 13 females (19.1%) in their respective age groups living below the poverty level.
| Age Bracket | Male | Female |
| Under 5 Years | 0 (0.0%) | 0 (0.0%) |
| 5 Years | 0 (0.0%) | 0 (0.0%) |
| 6 to 11 Years | 0 (0.0%) | 0 (0.0%) |
| 12 to 14 Years | 0 (0.0%) | 13 (19.1%) |
| 15 Years | 0 (0.0%) | 0 (0.0%) |
| 16 and 17 Years | 16 (26.2%) | 0 (0.0%) |
| 18 to 24 Years | 0 (0.0%) | 0 (0.0%) |
| 25 to 34 Years | 22 (8.0%) | 22 (8.8%) |
| 35 to 44 Years | 0 (0.0%) | 23 (11.3%) |
| 45 to 54 Years | 35 (12.2%) | 17 (6.1%) |
| 55 to 64 Years | 0 (0.0%) | 0 (0.0%) |
| 65 to 74 Years | 0 (0.0%) | 0 (0.0%) |
| 75 Years and over | 0 (0.0%) | 0 (0.0%) |
| Total | 73 (5.2%) | 75 (6.3%) |
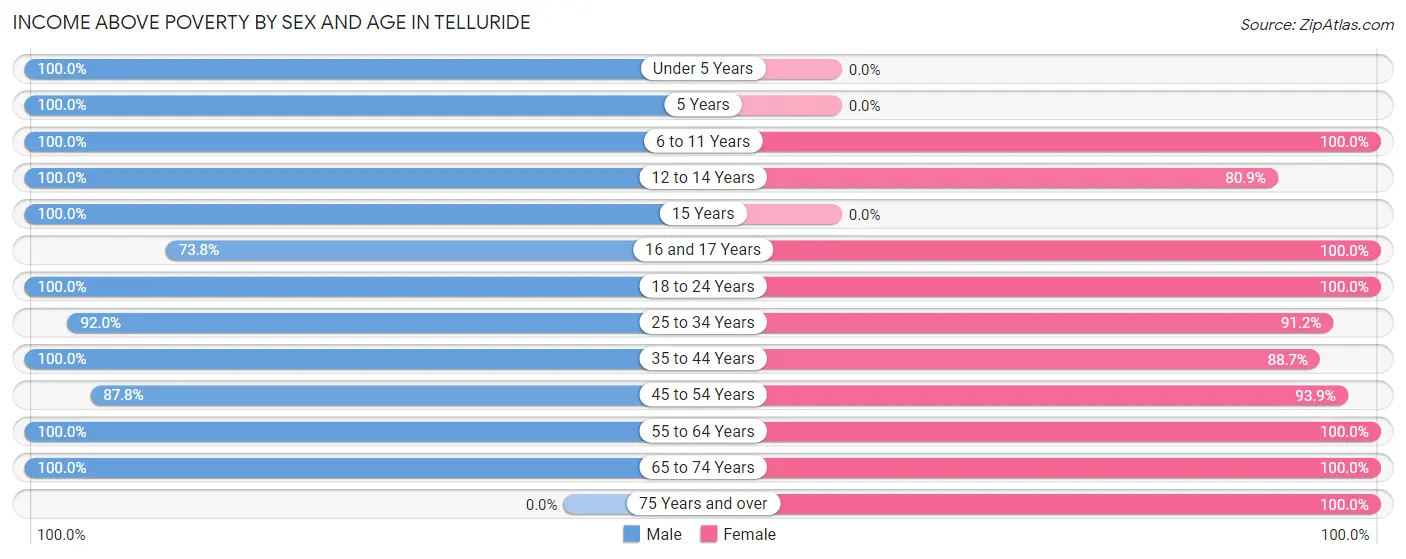
Income Above Poverty by Sex and Age in Telluride
According to the poverty statistics in Telluride, males aged under 5 years and females aged 6 to 11 years are the age groups that are most secure financially, with 100.0% of males and 100.0% of females in these age groups living above the poverty line.
| Age Bracket | Male | Female |
| Under 5 Years | 41 (100.0%) | 0 (0.0%) |
| 5 Years | 24 (100.0%) | 0 (0.0%) |
| 6 to 11 Years | 116 (100.0%) | 61 (100.0%) |
| 12 to 14 Years | 32 (100.0%) | 55 (80.9%) |
| 15 Years | 14 (100.0%) | 0 (0.0%) |
| 16 and 17 Years | 45 (73.8%) | 24 (100.0%) |
| 18 to 24 Years | 81 (100.0%) | 53 (100.0%) |
| 25 to 34 Years | 253 (92.0%) | 228 (91.2%) |
| 35 to 44 Years | 217 (100.0%) | 181 (88.7%) |
| 45 to 54 Years | 252 (87.8%) | 261 (93.9%) |
| 55 to 64 Years | 190 (100.0%) | 95 (100.0%) |
| 65 to 74 Years | 68 (100.0%) | 102 (100.0%) |
| 75 Years and over | 0 (0.0%) | 61 (100.0%) |
| Total | 1,333 (94.8%) | 1,121 (93.7%) |
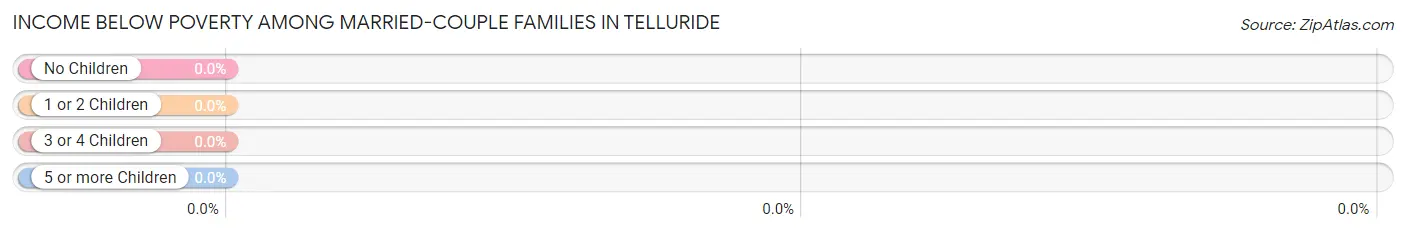
Income Below Poverty Among Married-Couple Families in Telluride
| Children | Above Poverty | Below Poverty |
| No Children | 167 (100.0%) | 0 (0.0%) |
| 1 or 2 Children | 166 (100.0%) | 0 (0.0%) |
| 3 or 4 Children | 50 (100.0%) | 0 (0.0%) |
| 5 or more Children | 0 (0.0%) | 0 (0.0%) |
| Total | 383 (100.0%) | 0 (0.0%) |
Income Below Poverty Among Single-Parent Households in Telluride
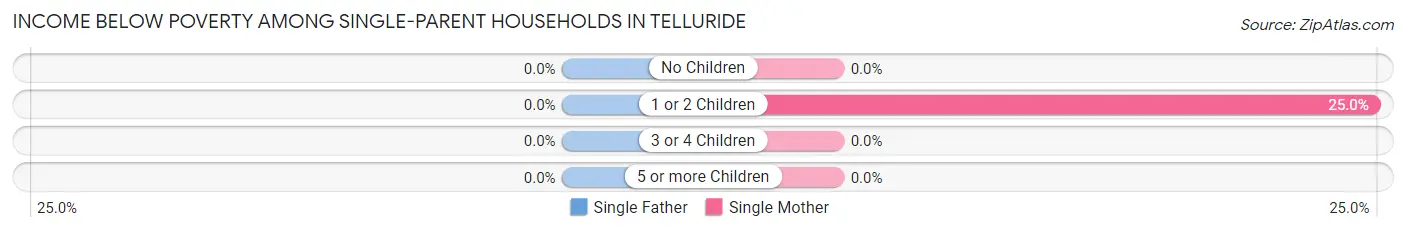
| Children | Single Father | Single Mother |
| No Children | 0 (0.0%) | 0 (0.0%) |
| 1 or 2 Children | 0 (0.0%) | 17 (25.0%) |
| 3 or 4 Children | 0 (0.0%) | 0 (0.0%) |
| 5 or more Children | 0 (0.0%) | 0 (0.0%) |
| Total | 0 (0.0%) | 17 (12.5%) |
Income Below Poverty Among Married-Couple vs Single-Parent Households in Telluride
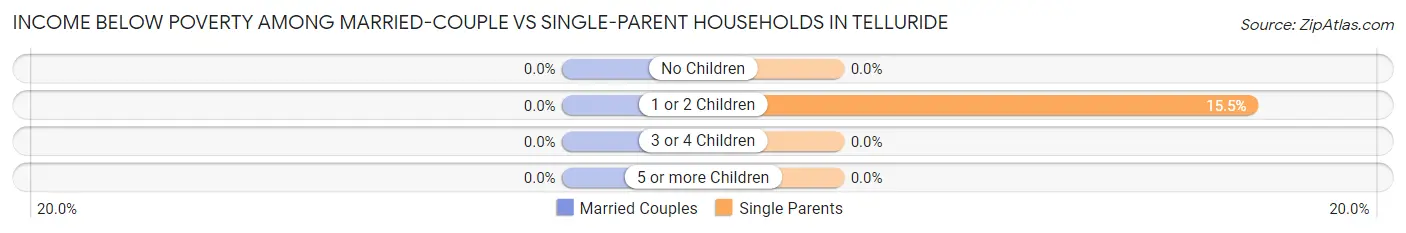
| Children | Married-Couple Families | Single-Parent Households |
| No Children | 0 (0.0%) | 0 (0.0%) |
| 1 or 2 Children | 0 (0.0%) | 17 (15.4%) |
| 3 or 4 Children | 0 (0.0%) | 0 (0.0%) |
| 5 or more Children | 0 (0.0%) | 0 (0.0%) |
| Total | 0 (0.0%) | 17 (8.6%) |
Race in Telluride
The most populous races in Telluride are White / Caucasian (2,571 | 98.1%), Hispanic or Latino (256 | 9.8%), and Two or more Races (28 | 1.1%).
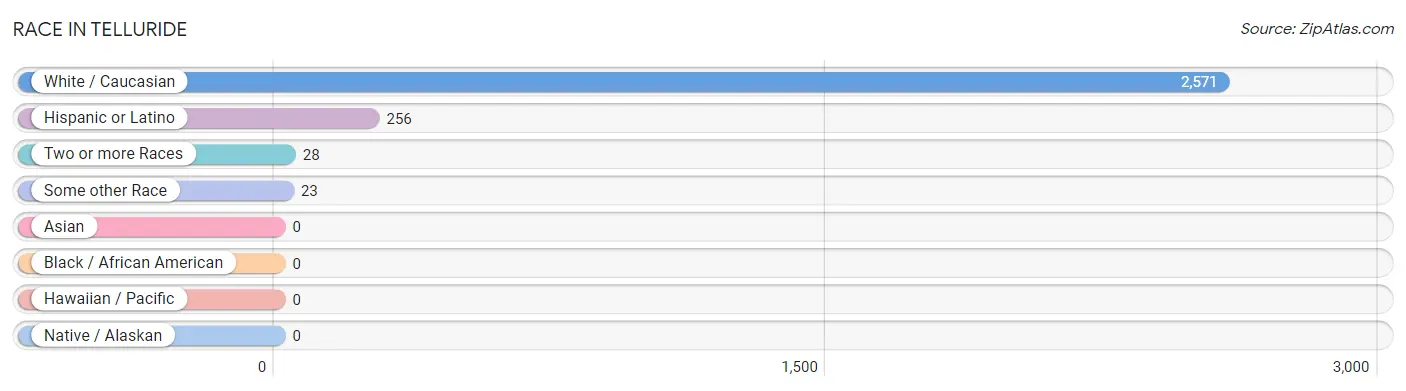
| Race | # Population | % Population |
| Asian | 0 | 0.0% |
| Black / African American | 0 | 0.0% |
| Hawaiian / Pacific | 0 | 0.0% |
| Hispanic or Latino | 256 | 9.8% |
| Native / Alaskan | 0 | 0.0% |
| White / Caucasian | 2,571 | 98.1% |
| Two or more Races | 28 | 1.1% |
| Some other Race | 23 | 0.9% |
| Total | 2,622 | 100.0% |
Ancestry in Telluride
The most populous ancestries reported in Telluride are Irish (466 | 17.8%), German (461 | 17.6%), English (324 | 12.4%), Mexican (233 | 8.9%), and Polish (162 | 6.2%), together accounting for 62.8% of all Telluride residents.
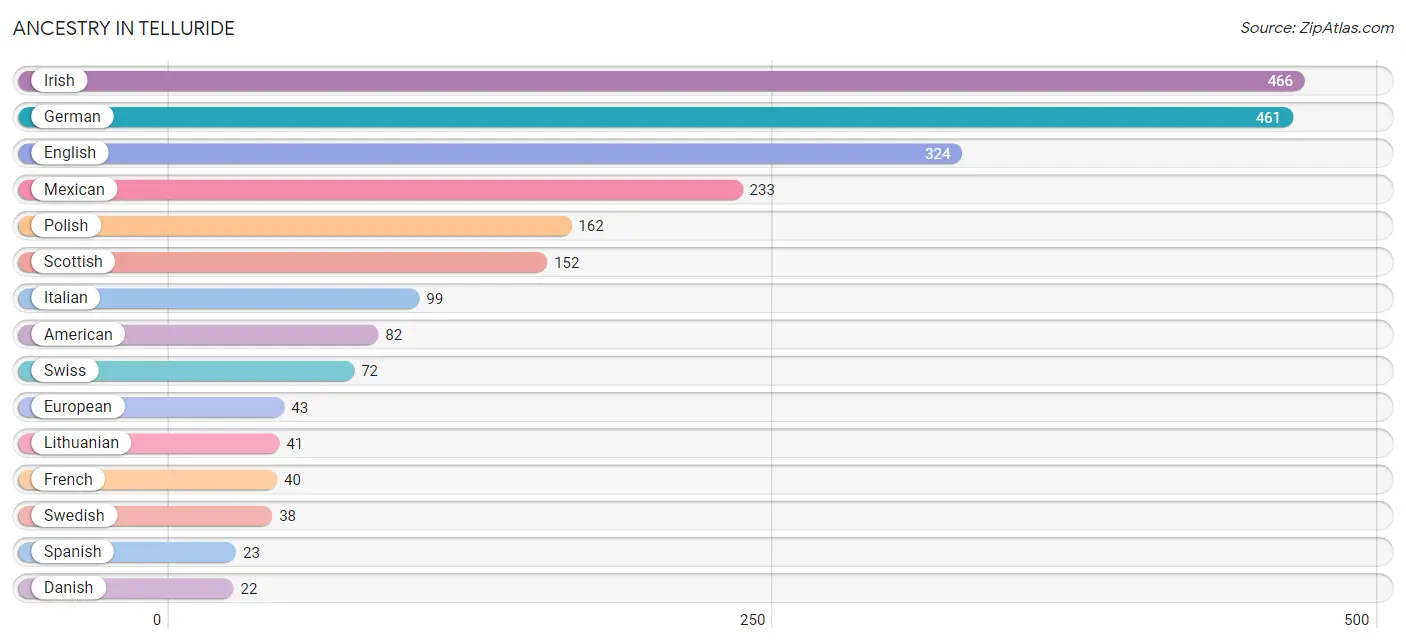
| Ancestry | # Population | % Population |
| American | 82 | 3.1% |
| Czech | 21 | 0.8% |
| Danish | 22 | 0.8% |
| Eastern European | 12 | 0.5% |
| English | 324 | 12.4% |
| European | 43 | 1.6% |
| French | 40 | 1.5% |
| German | 461 | 17.6% |
| Greek | 20 | 0.8% |
| Irish | 466 | 17.8% |
| Italian | 99 | 3.8% |
| Lithuanian | 41 | 1.6% |
| Mexican | 233 | 8.9% |
| Norwegian | 14 | 0.5% |
| Polish | 162 | 6.2% |
| Scotch-Irish | 12 | 0.5% |
| Scottish | 152 | 5.8% |
| Spanish | 23 | 0.9% |
| Swedish | 38 | 1.5% |
| Swiss | 72 | 2.8% | View All 20 Rows |
Immigrants in Telluride
The most numerous immigrant groups reported in Telluride came from Central America (102 | 3.9%), Latin America (102 | 3.9%), Mexico (102 | 3.9%), Europe (65 | 2.5%), and England (42 | 1.6%), together accounting for 15.7% of all Telluride residents.
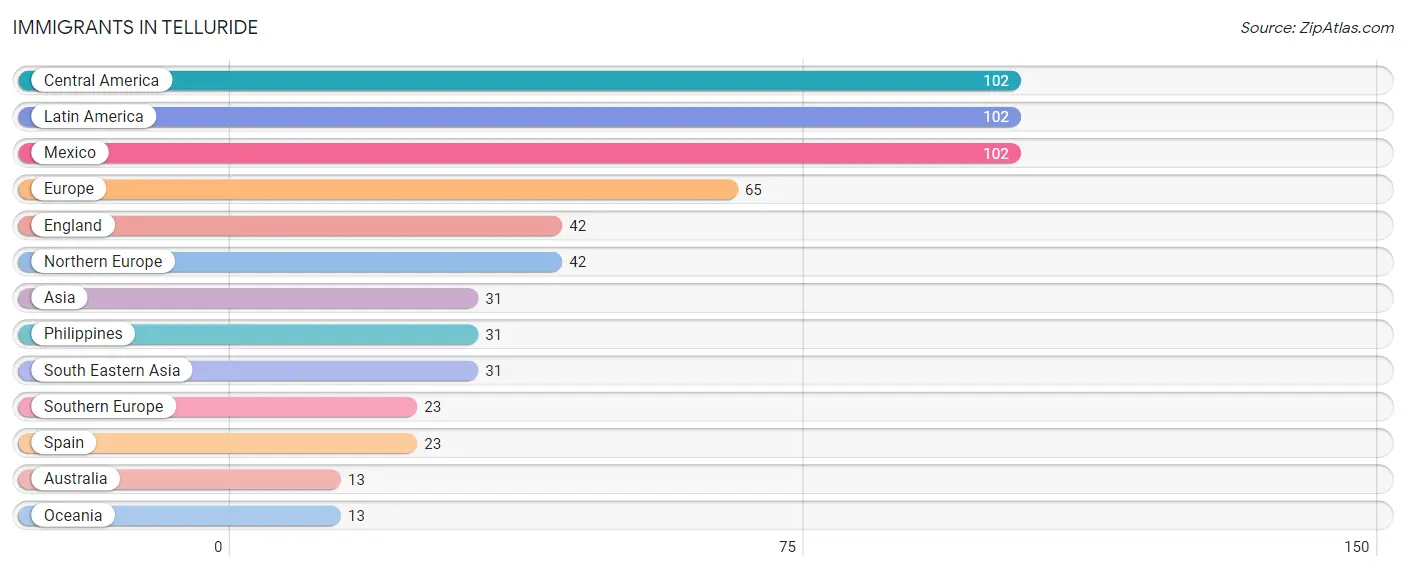
| Immigration Origin | # Population | % Population |
| Asia | 31 | 1.2% |
| Australia | 13 | 0.5% |
| Central America | 102 | 3.9% |
| England | 42 | 1.6% |
| Europe | 65 | 2.5% |
| Latin America | 102 | 3.9% |
| Mexico | 102 | 3.9% |
| Northern Europe | 42 | 1.6% |
| Oceania | 13 | 0.5% |
| Philippines | 31 | 1.2% |
| South Eastern Asia | 31 | 1.2% |
| Southern Europe | 23 | 0.9% |
| Spain | 23 | 0.9% | View All 13 Rows |
Sex and Age in Telluride
Sex and Age in Telluride
The most populous age groups in Telluride are 30 to 34 Years (203 | 14.4%) for men and 50 to 54 Years (155 | 12.8%) for women.
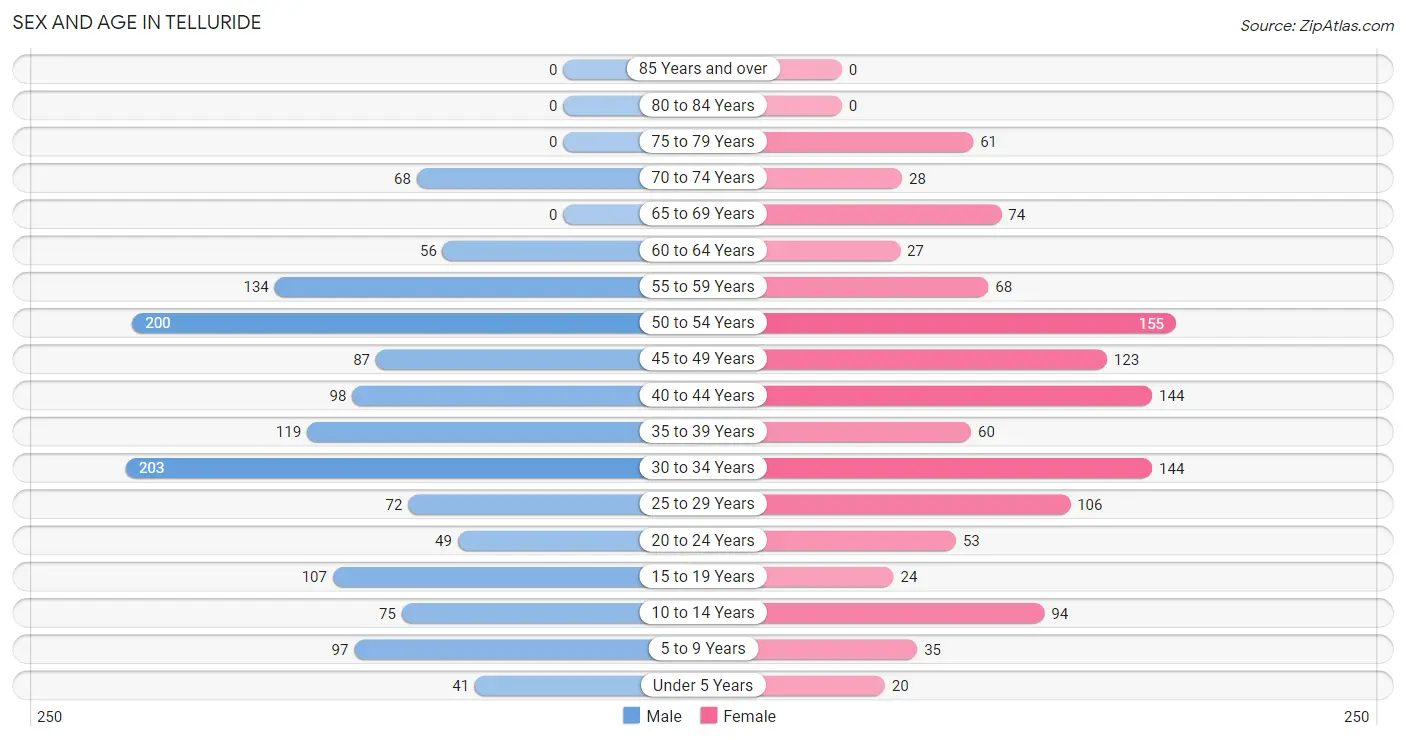
| Age Bracket | Male | Female |
| Under 5 Years | 41 (2.9%) | 20 (1.6%) |
| 5 to 9 Years | 97 (6.9%) | 35 (2.9%) |
| 10 to 14 Years | 75 (5.3%) | 94 (7.7%) |
| 15 to 19 Years | 107 (7.6%) | 24 (2.0%) |
| 20 to 24 Years | 49 (3.5%) | 53 (4.4%) |
| 25 to 29 Years | 72 (5.1%) | 106 (8.7%) |
| 30 to 34 Years | 203 (14.4%) | 144 (11.8%) |
| 35 to 39 Years | 119 (8.5%) | 60 (4.9%) |
| 40 to 44 Years | 98 (7.0%) | 144 (11.8%) |
| 45 to 49 Years | 87 (6.2%) | 123 (10.1%) |
| 50 to 54 Years | 200 (14.2%) | 155 (12.8%) |
| 55 to 59 Years | 134 (9.5%) | 68 (5.6%) |
| 60 to 64 Years | 56 (4.0%) | 27 (2.2%) |
| 65 to 69 Years | 0 (0.0%) | 74 (6.1%) |
| 70 to 74 Years | 68 (4.8%) | 28 (2.3%) |
| 75 to 79 Years | 0 (0.0%) | 61 (5.0%) |
| 80 to 84 Years | 0 (0.0%) | 0 (0.0%) |
| 85 Years and over | 0 (0.0%) | 0 (0.0%) |
| Total | 1,406 (100.0%) | 1,216 (100.0%) |
Families and Households in Telluride
Median Family Size in Telluride
The median family size in Telluride is 2.74 persons per family, with married-couple families (383 | 66.0%) accounting for the largest median family size of 3.07 persons per family. On the other hand, single female/mother families (136 | 23.4%) represent the smallest median family size with 1.96 persons per family.
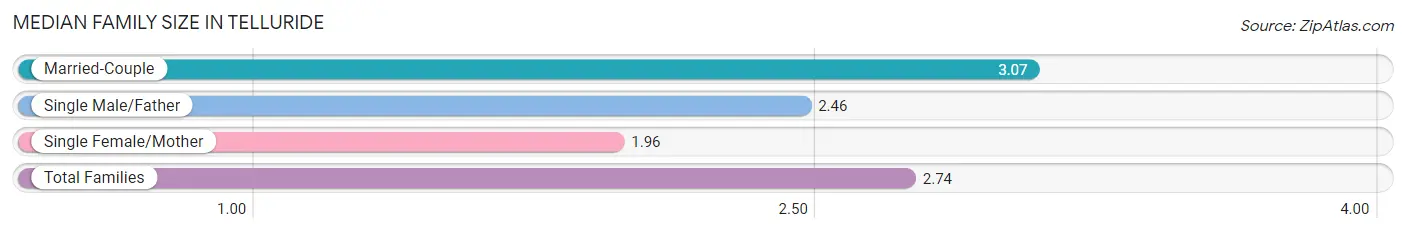
| Family Type | # Families | Family Size |
| Married-Couple | 383 (66.0%) | 3.07 |
| Single Male/Father | 61 (10.5%) | 2.46 |
| Single Female/Mother | 136 (23.4%) | 1.96 |
| Total Families | 580 (100.0%) | 2.74 |
Median Household Size in Telluride
The median household size in Telluride is 2.10 persons per household, with married-couple households (383 | 30.6%) accounting for the largest median household size of 3.12 persons per household. non-family households (670 | 53.6%) represent the smallest median household size with 1.39 persons per household.
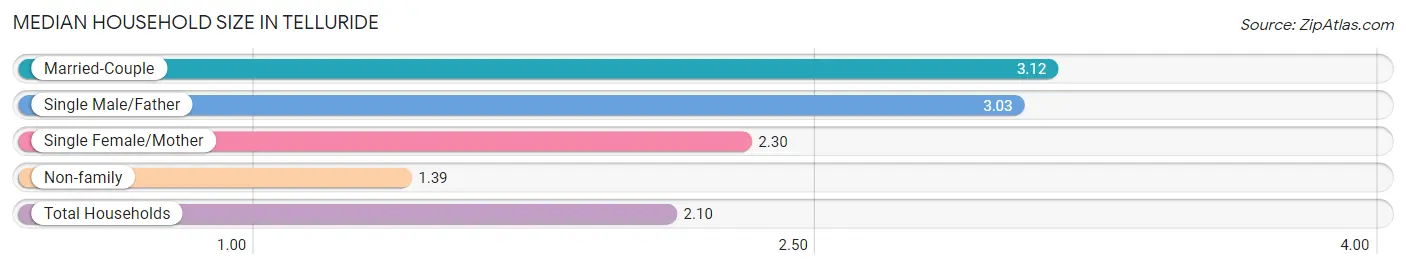
| Household Type | # Households | Household Size |
| Married-Couple | 383 (30.6%) | 3.12 |
| Single Male/Father | 61 (4.9%) | 3.03 |
| Single Female/Mother | 136 (10.9%) | 2.30 |
| Non-family | 670 (53.6%) | 1.39 |
| Total Households | 1,250 (100.0%) | 2.10 |
Household Size by Marriage Status in Telluride
Out of a total of 1,250 households in Telluride, 580 (46.4%) are family households, while 670 (53.6%) are nonfamily households. The most numerous type of family households are 2-person households, comprising 201, and the most common type of nonfamily households are 1-person households, comprising 500.
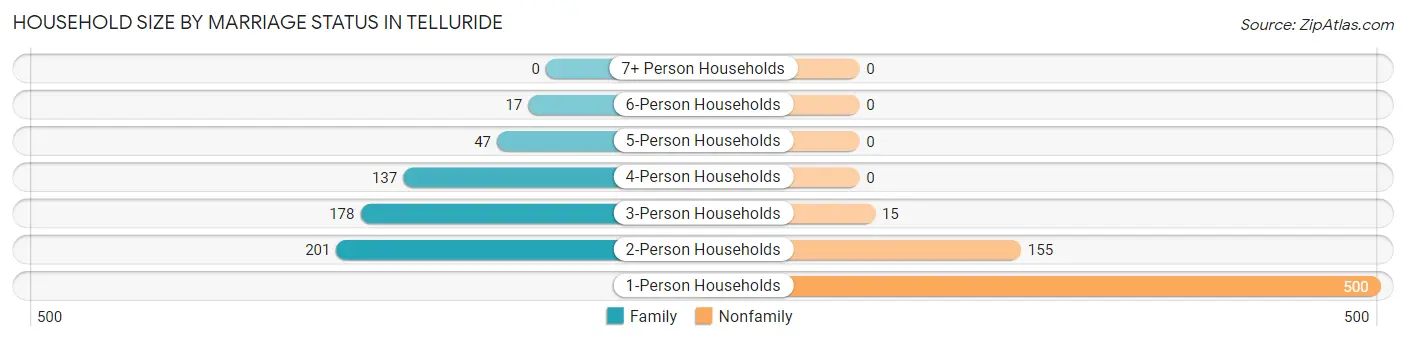
| Household Size | Family Households | Nonfamily Households |
| 1-Person Households | - | 500 (40.0%) |
| 2-Person Households | 201 (16.1%) | 155 (12.4%) |
| 3-Person Households | 178 (14.2%) | 15 (1.2%) |
| 4-Person Households | 137 (11.0%) | 0 (0.0%) |
| 5-Person Households | 47 (3.8%) | 0 (0.0%) |
| 6-Person Households | 17 (1.4%) | 0 (0.0%) |
| 7+ Person Households | 0 (0.0%) | 0 (0.0%) |
| Total | 580 (46.4%) | 670 (53.6%) |
Female Fertility in Telluride
Fertility by Age in Telluride
| Age Bracket | Women with Births | Births / 1,000 Women |
| 15 to 19 years | 0 (0.0%) | 0.0 |
| 20 to 34 years | 0 (0.0%) | 0.0 |
| 35 to 50 years | 0 (0.0%) | 0.0 |
| Total | 0 (0.0%) | 0.0 |
Fertility by Age by Marriage Status in Telluride
| Age Bracket | Married | Unmarried |
| 15 to 19 years | 0 (0.0%) | 0 (0.0%) |
| 20 to 34 years | 0 (0.0%) | 0 (0.0%) |
| 35 to 50 years | 0 (0.0%) | 0 (0.0%) |
| Total | 0 (0.0%) | 0 (0.0%) |
Fertility by Education in Telluride
| Educational Attainment | Women with Births | Births / 1,000 Women |
| Less than High School | 0 (0.0%) | 0.0 |
| High School Diploma | 0 (0.0%) | 0.0 |
| College or Associate's Degree | 0 (0.0%) | 0.0 |
| Bachelor's Degree | 0 (0.0%) | 0.0 |
| Graduate Degree | 0 (0.0%) | 0.0 |
| Total | 0 (0.0%) | 0.0 |
Fertility by Education by Marriage Status in Telluride
| Educational Attainment | Married | Unmarried |
| Less than High School | 0 (0.0%) | 0 (0.0%) |
| High School Diploma | 0 (0.0%) | 0 (0.0%) |
| College or Associate's Degree | 0 (0.0%) | 0 (0.0%) |
| Bachelor's Degree | 0 (0.0%) | 0 (0.0%) |
| Graduate Degree | 0 (0.0%) | 0 (0.0%) |
| Total | 0 (0.0%) | 0 (0.0%) |
Employment Characteristics in Telluride
Employment by Class of Employer in Telluride
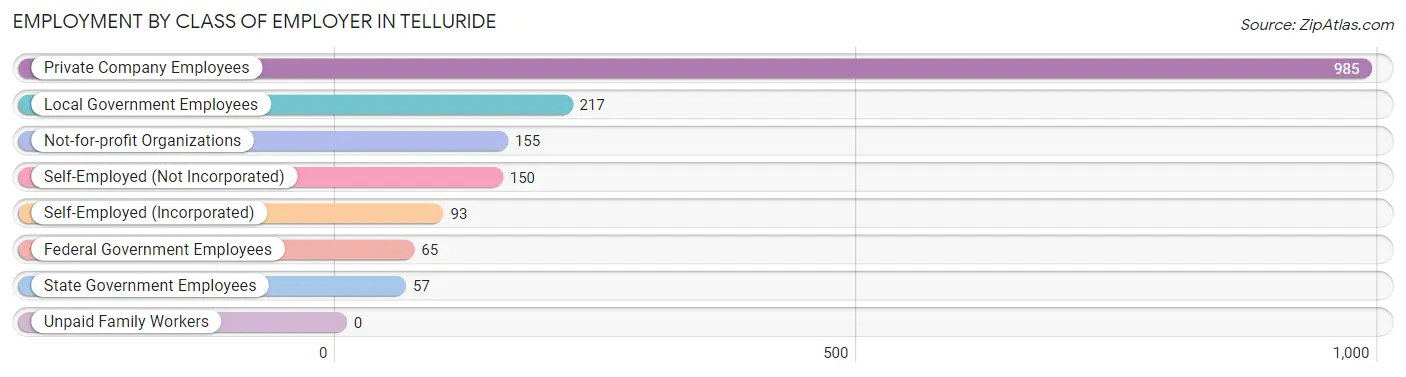
Among the 1,722 employed individuals in Telluride, private company employees (985 | 57.2%), local government employees (217 | 12.6%), and not-for-profit organizations (155 | 9.0%) make up the most common classes of employment.
| Employer Class | # Employees | % Employees |
| Private Company Employees | 985 | 57.2% |
| Self-Employed (Incorporated) | 93 | 5.4% |
| Self-Employed (Not Incorporated) | 150 | 8.7% |
| Not-for-profit Organizations | 155 | 9.0% |
| Local Government Employees | 217 | 12.6% |
| State Government Employees | 57 | 3.3% |
| Federal Government Employees | 65 | 3.8% |
| Unpaid Family Workers | 0 | 0.0% |
| Total | 1,722 | 100.0% |
Employment Status by Age in Telluride
According to the labor force statistics for Telluride, out of the total population over 16 years of age (2,246), 78.9% or 1,772 individuals are in the labor force, with 2.8% or 50 of them unemployed. The age group with the highest labor force participation rate is 20 to 24 years, with 100.0% or 102 individuals in the labor force. Within the labor force, the 25 to 29 years age range has the highest percentage of unemployed individuals, with 28.1% or 50 of them being unemployed.
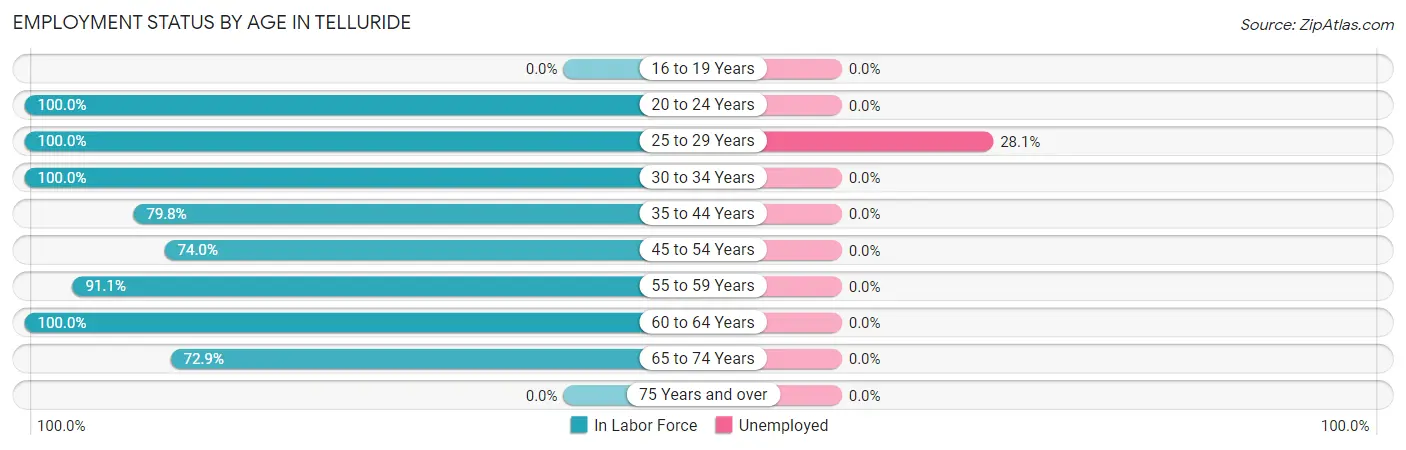
| Age Bracket | In Labor Force | Unemployed |
| 16 to 19 Years | 0 (0.0%) | 0 (0.0%) |
| 20 to 24 Years | 102 (100.0%) | 0 (0.0%) |
| 25 to 29 Years | 178 (100.0%) | 50 (28.1%) |
| 30 to 34 Years | 347 (100.0%) | 0 (0.0%) |
| 35 to 44 Years | 336 (79.8%) | 0 (0.0%) |
| 45 to 54 Years | 418 (74.0%) | 0 (0.0%) |
| 55 to 59 Years | 184 (91.1%) | 0 (0.0%) |
| 60 to 64 Years | 83 (100.0%) | 0 (0.0%) |
| 65 to 74 Years | 124 (72.9%) | 0 (0.0%) |
| 75 Years and over | 0 (0.0%) | 0 (0.0%) |
| Total | 1,772 (78.9%) | 50 (2.8%) |
Employment Status by Educational Attainment in Telluride
According to labor force statistics for Telluride, 86.1% of individuals (1,546) out of the total population between 25 and 64 years of age (1,796) are in the labor force, with 3.2% or 49 of them being unemployed. The group with the highest labor force participation rate are those with the educational attainment of high school diploma, with 87.8% or 130 individuals in the labor force. Within the labor force, individuals with college / associate degree education have the highest percentage of unemployment, with 11.8% or 22 of them being unemployed.
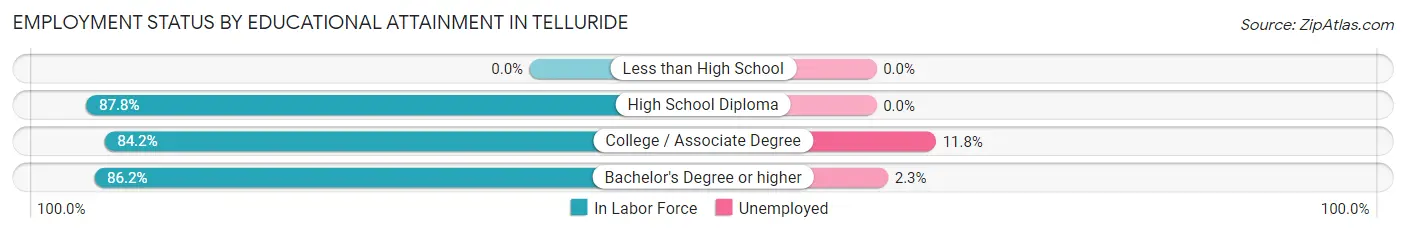
| Educational Attainment | In Labor Force | Unemployed |
| Less than High School | 0 (0.0%) | 0 (0.0%) |
| High School Diploma | 130 (87.8%) | 0 (0.0%) |
| College / Associate Degree | 186 (84.2%) | 26 (11.8%) |
| Bachelor's Degree or higher | 1,230 (86.2%) | 33 (2.3%) |
| Total | 1,546 (86.1%) | 57 (3.2%) |
Employment Occupations by Sex in Telluride
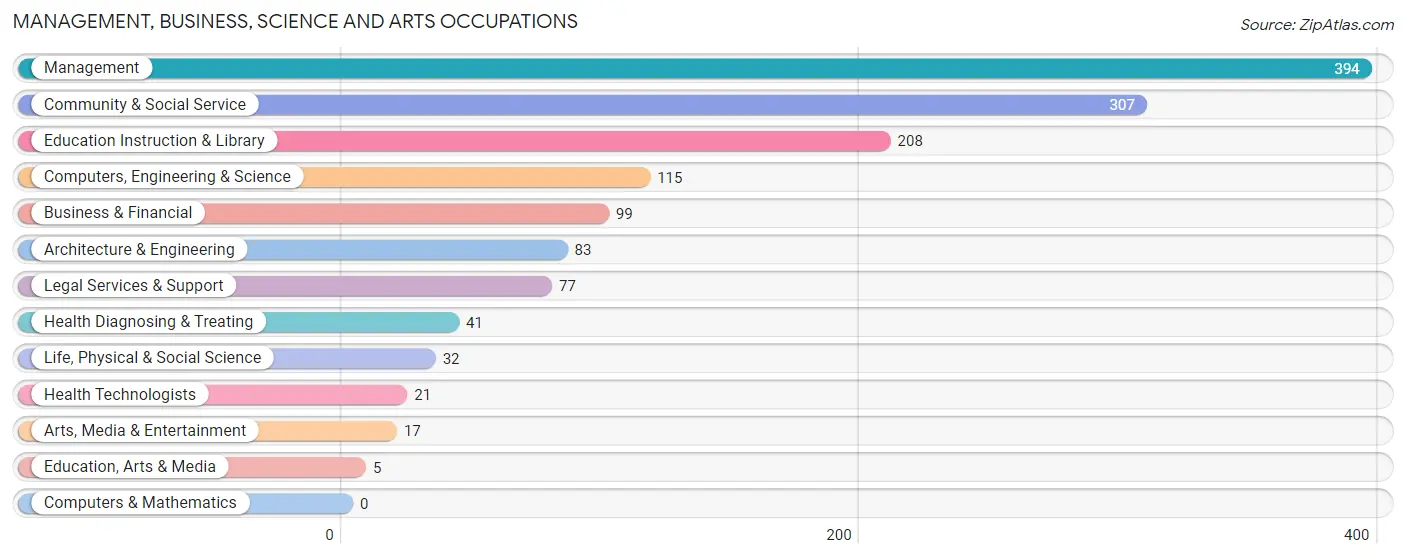
Management, Business, Science and Arts Occupations
The most common Management, Business, Science and Arts occupations in Telluride are Management (394 | 22.9%), Community & Social Service (307 | 17.8%), Education Instruction & Library (208 | 12.1%), Computers, Engineering & Science (115 | 6.7%), and Business & Financial (99 | 5.8%).
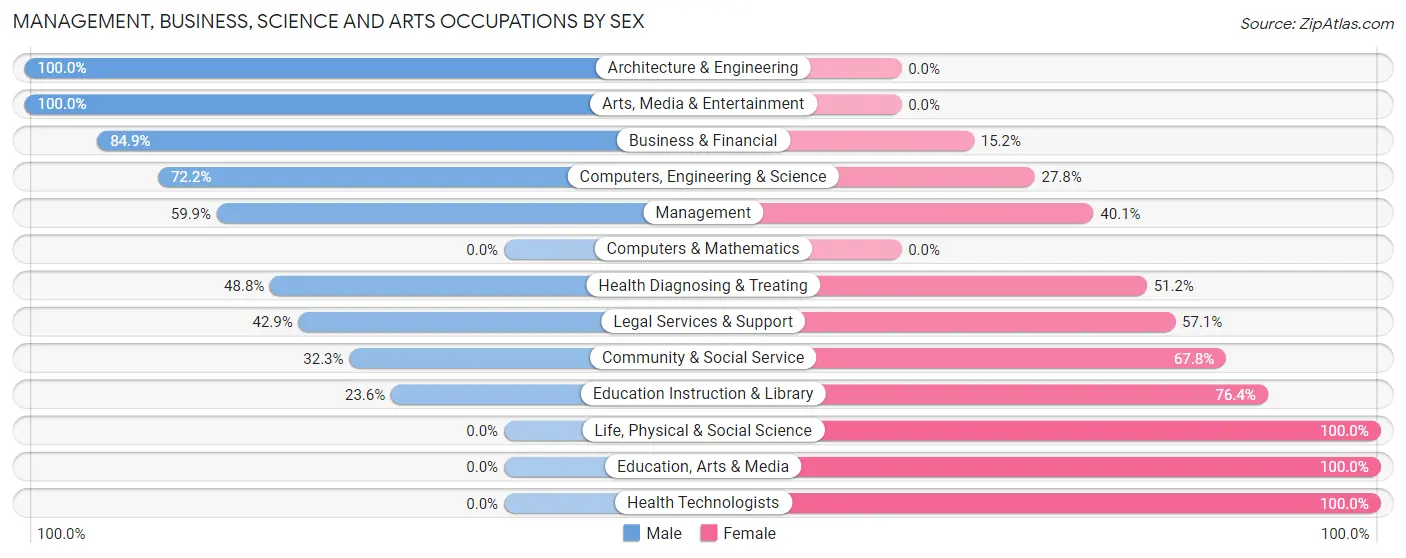
Management, Business, Science and Arts Occupations by Sex
Within the Management, Business, Science and Arts occupations in Telluride, the most male-oriented occupations are Architecture & Engineering (100.0%), Arts, Media & Entertainment (100.0%), and Business & Financial (84.9%), while the most female-oriented occupations are Life, Physical & Social Science (100.0%), Education, Arts & Media (100.0%), and Health Technologists (100.0%).
| Occupation | Male | Female |
| Management | 236 (59.9%) | 158 (40.1%) |
| Business & Financial | 84 (84.9%) | 15 (15.1%) |
| Computers, Engineering & Science | 83 (72.2%) | 32 (27.8%) |
| Computers & Mathematics | 0 (0.0%) | 0 (0.0%) |
| Architecture & Engineering | 83 (100.0%) | 0 (0.0%) |
| Life, Physical & Social Science | 0 (0.0%) | 32 (100.0%) |
| Community & Social Service | 99 (32.3%) | 208 (67.7%) |
| Education, Arts & Media | 0 (0.0%) | 5 (100.0%) |
| Legal Services & Support | 33 (42.9%) | 44 (57.1%) |
| Education Instruction & Library | 49 (23.6%) | 159 (76.4%) |
| Arts, Media & Entertainment | 17 (100.0%) | 0 (0.0%) |
| Health Diagnosing & Treating | 20 (48.8%) | 21 (51.2%) |
| Health Technologists | 0 (0.0%) | 21 (100.0%) |
| Total (Category) | 522 (54.6%) | 434 (45.4%) |
| Total (Overall) | 985 (57.2%) | 737 (42.8%) |
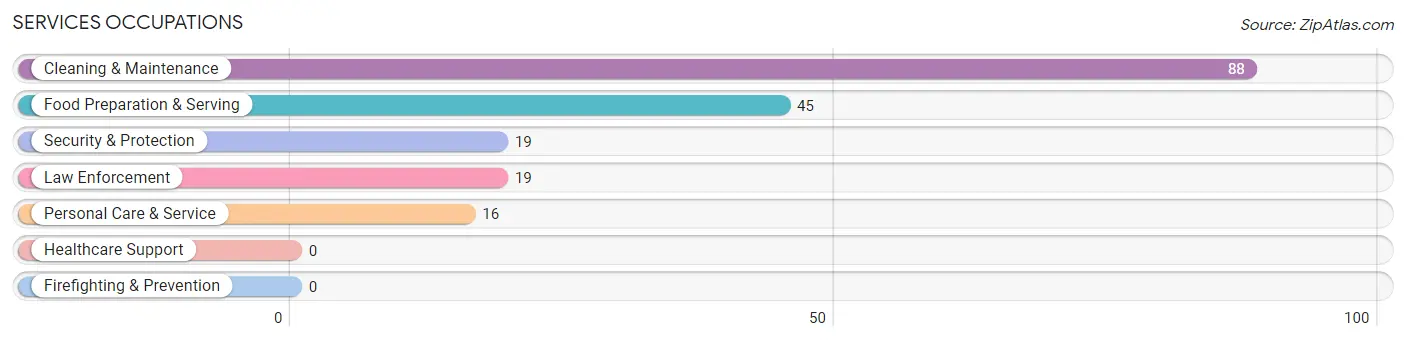
Services Occupations
The most common Services occupations in Telluride are Cleaning & Maintenance (88 | 5.1%), Food Preparation & Serving (45 | 2.6%), Security & Protection (19 | 1.1%), Law Enforcement (19 | 1.1%), and Personal Care & Service (16 | 0.9%).
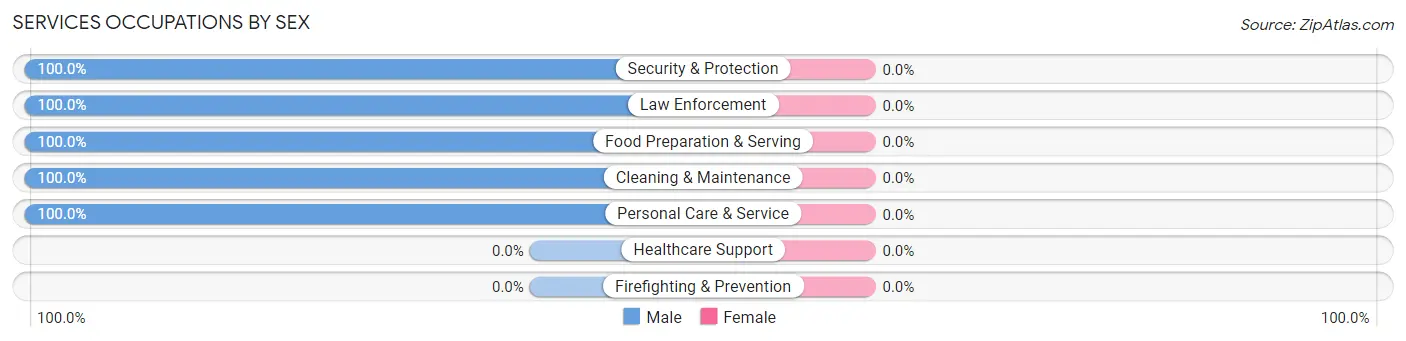
Services Occupations by Sex
| Occupation | Male | Female |
| Healthcare Support | 0 (0.0%) | 0 (0.0%) |
| Security & Protection | 19 (100.0%) | 0 (0.0%) |
| Firefighting & Prevention | 0 (0.0%) | 0 (0.0%) |
| Law Enforcement | 19 (100.0%) | 0 (0.0%) |
| Food Preparation & Serving | 45 (100.0%) | 0 (0.0%) |
| Cleaning & Maintenance | 88 (100.0%) | 0 (0.0%) |
| Personal Care & Service | 16 (100.0%) | 0 (0.0%) |
| Total (Category) | 168 (100.0%) | 0 (0.0%) |
| Total (Overall) | 985 (57.2%) | 737 (42.8%) |
Sales and Office Occupations
The most common Sales and Office occupations in Telluride are Sales & Related (427 | 24.8%), and Office & Administration (19 | 1.1%).

Sales and Office Occupations by Sex

| Occupation | Male | Female |
| Sales & Related | 181 (42.4%) | 246 (57.6%) |
| Office & Administration | 19 (100.0%) | 0 (0.0%) |
| Total (Category) | 200 (44.8%) | 246 (55.2%) |
| Total (Overall) | 985 (57.2%) | 737 (42.8%) |
Natural Resources, Construction and Maintenance Occupations
The most common Natural Resources, Construction and Maintenance occupations in Telluride are , and Construction & Extraction (58 | 3.4%).
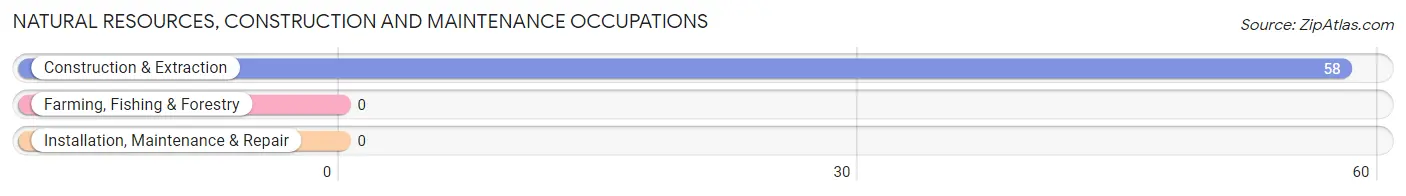
Natural Resources, Construction and Maintenance Occupations by Sex
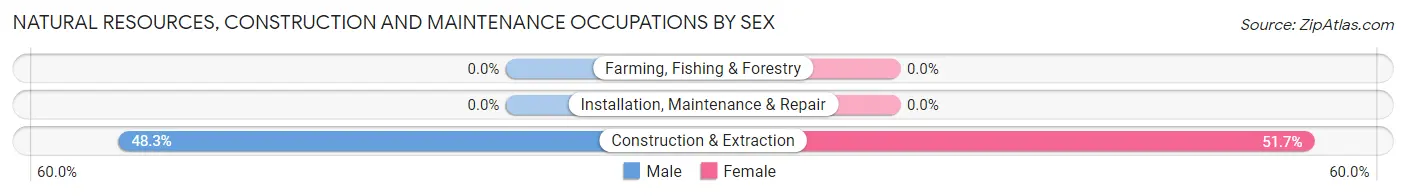
| Occupation | Male | Female |
| Farming, Fishing & Forestry | 0 (0.0%) | 0 (0.0%) |
| Construction & Extraction | 28 (48.3%) | 30 (51.7%) |
| Installation, Maintenance & Repair | 0 (0.0%) | 0 (0.0%) |
| Total (Category) | 28 (48.3%) | 30 (51.7%) |
| Total (Overall) | 985 (57.2%) | 737 (42.8%) |
Production, Transportation and Moving Occupations
The most common Production, Transportation and Moving occupations in Telluride are Material Moving (47 | 2.7%), Transportation (27 | 1.6%), and Production (20 | 1.2%).
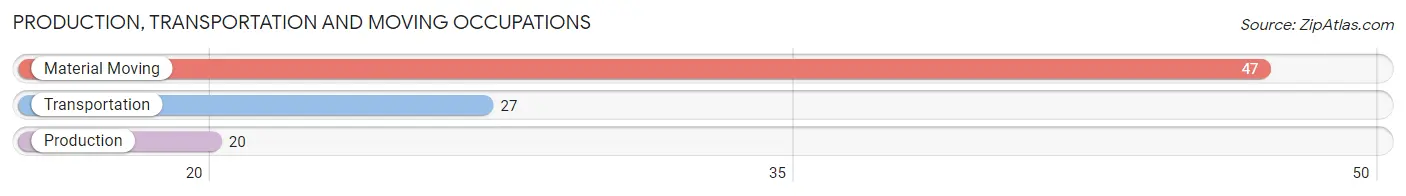
Production, Transportation and Moving Occupations by Sex
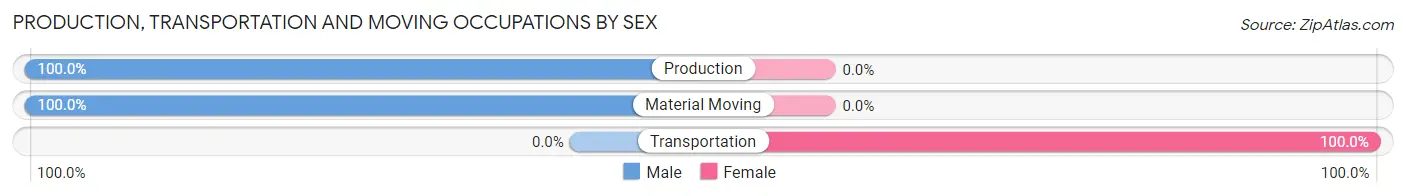
| Occupation | Male | Female |
| Production | 20 (100.0%) | 0 (0.0%) |
| Transportation | 0 (0.0%) | 27 (100.0%) |
| Material Moving | 47 (100.0%) | 0 (0.0%) |
| Total (Category) | 67 (71.3%) | 27 (28.7%) |
| Total (Overall) | 985 (57.2%) | 737 (42.8%) |
Employment Industries by Sex in Telluride
Employment Industries in Telluride
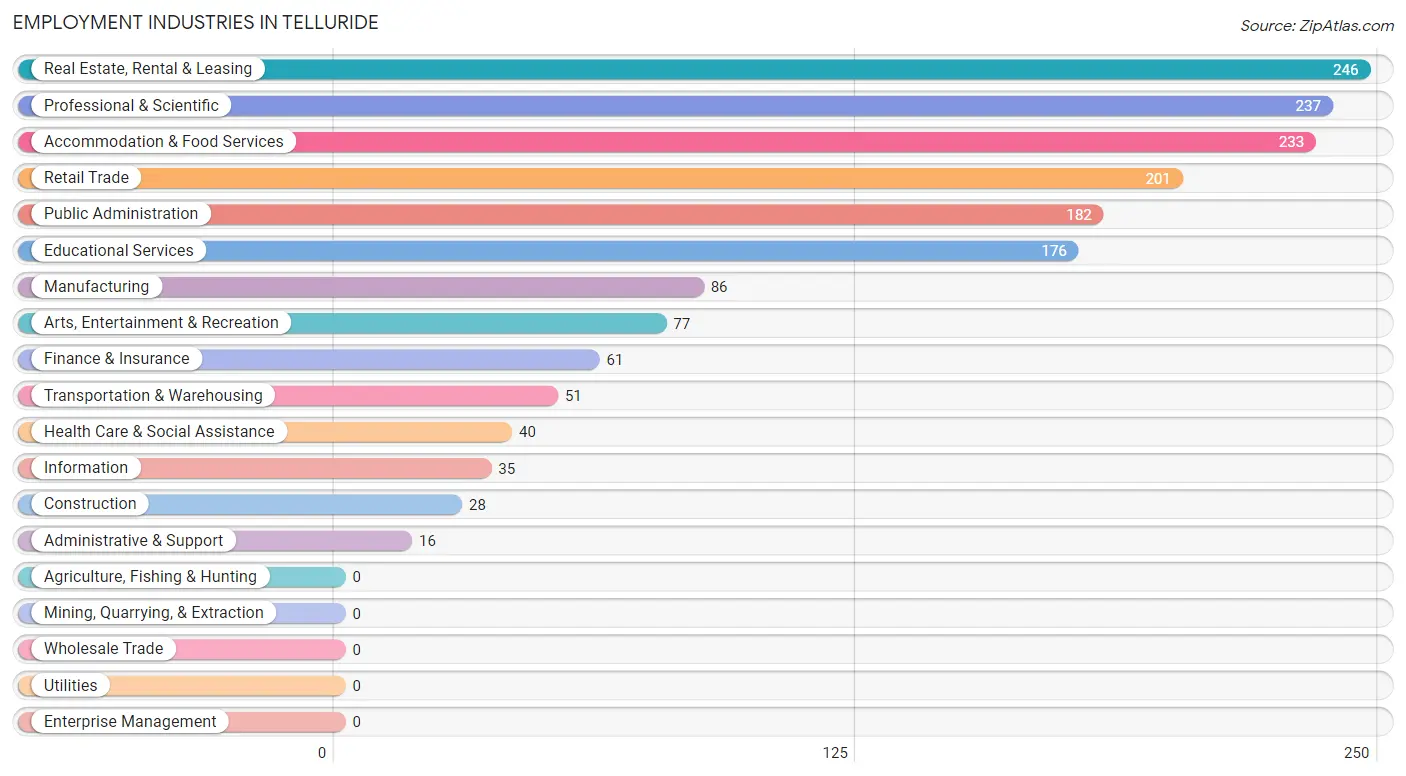
The major employment industries in Telluride include Real Estate, Rental & Leasing (246 | 14.3%), Professional & Scientific (237 | 13.8%), Accommodation & Food Services (233 | 13.5%), Retail Trade (201 | 11.7%), and Public Administration (182 | 10.6%).
Employment Industries by Sex in Telluride
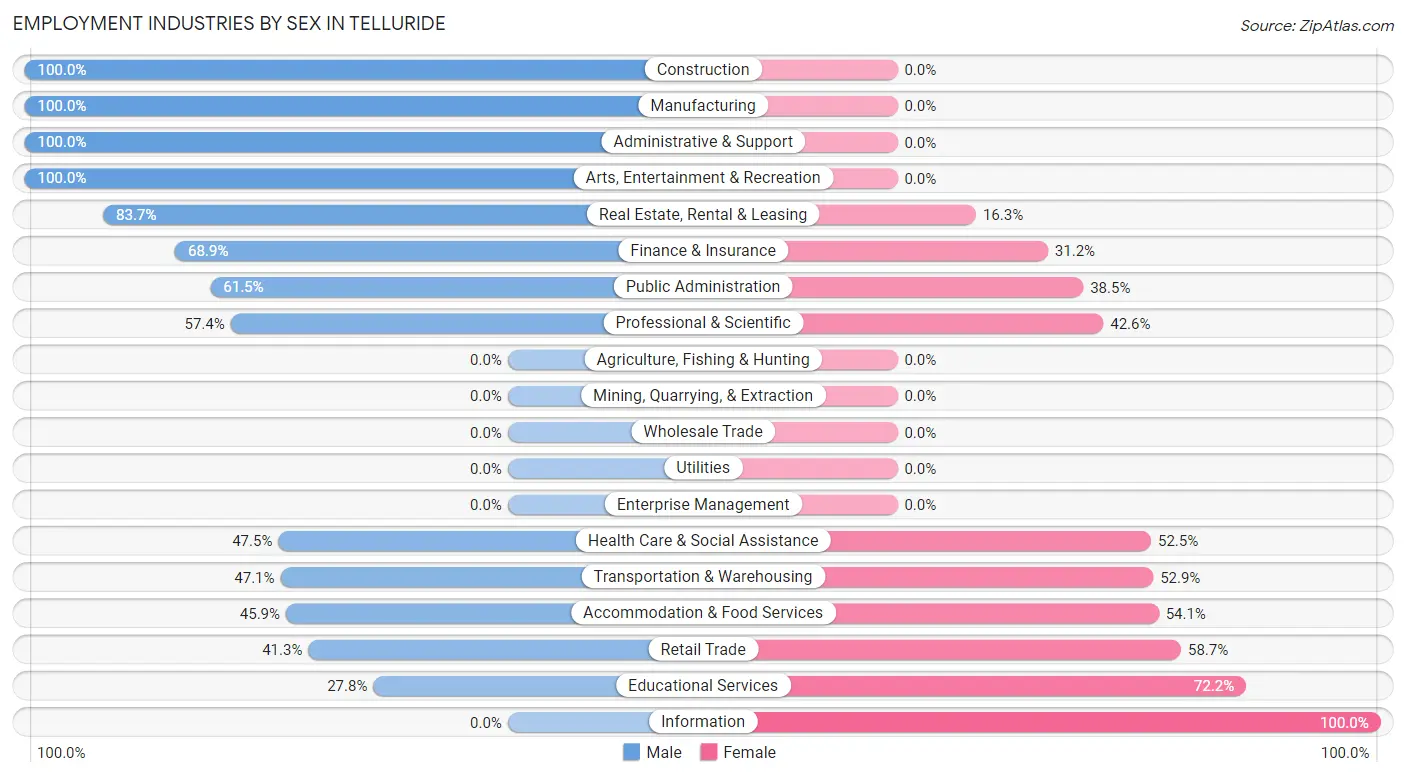
The Telluride industries that see more men than women are Construction (100.0%), Manufacturing (100.0%), and Administrative & Support (100.0%), whereas the industries that tend to have a higher number of women are Information (100.0%), Educational Services (72.2%), and Retail Trade (58.7%).
| Industry | Male | Female |
| Agriculture, Fishing & Hunting | 0 (0.0%) | 0 (0.0%) |
| Mining, Quarrying, & Extraction | 0 (0.0%) | 0 (0.0%) |
| Construction | 28 (100.0%) | 0 (0.0%) |
| Manufacturing | 86 (100.0%) | 0 (0.0%) |
| Wholesale Trade | 0 (0.0%) | 0 (0.0%) |
| Retail Trade | 83 (41.3%) | 118 (58.7%) |
| Transportation & Warehousing | 24 (47.1%) | 27 (52.9%) |
| Utilities | 0 (0.0%) | 0 (0.0%) |
| Information | 0 (0.0%) | 35 (100.0%) |
| Finance & Insurance | 42 (68.9%) | 19 (31.1%) |
| Real Estate, Rental & Leasing | 206 (83.7%) | 40 (16.3%) |
| Professional & Scientific | 136 (57.4%) | 101 (42.6%) |
| Enterprise Management | 0 (0.0%) | 0 (0.0%) |
| Administrative & Support | 16 (100.0%) | 0 (0.0%) |
| Educational Services | 49 (27.8%) | 127 (72.2%) |
| Health Care & Social Assistance | 19 (47.5%) | 21 (52.5%) |
| Arts, Entertainment & Recreation | 77 (100.0%) | 0 (0.0%) |
| Accommodation & Food Services | 107 (45.9%) | 126 (54.1%) |
| Public Administration | 112 (61.5%) | 70 (38.5%) |
| Total | 985 (57.2%) | 737 (42.8%) |
Education in Telluride
School Enrollment in Telluride
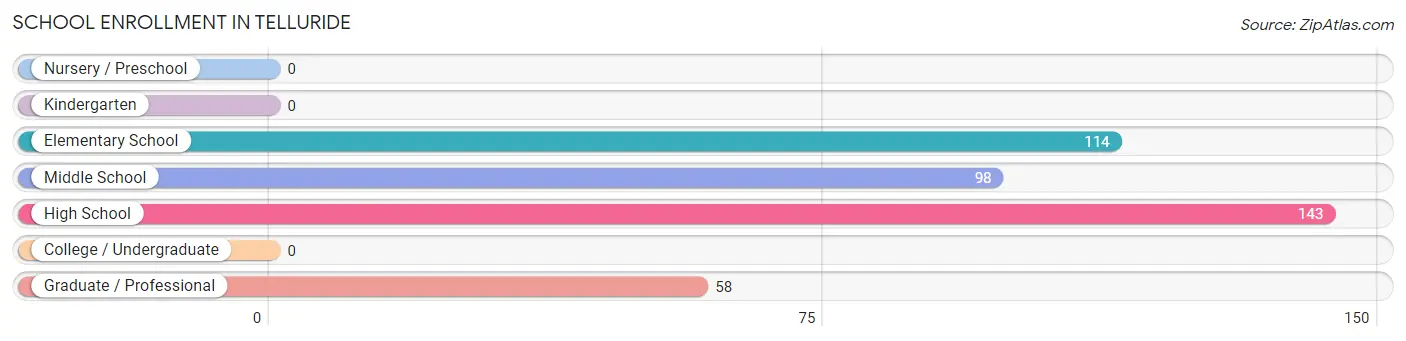
The most common levels of schooling among the 413 students in Telluride are high school (143 | 34.6%), elementary school (114 | 27.6%), and middle school (98 | 23.7%).
| School Level | # Students | % Students |
| Nursery / Preschool | 0 | 0.0% |
| Kindergarten | 0 | 0.0% |
| Elementary School | 114 | 27.6% |
| Middle School | 98 | 23.7% |
| High School | 143 | 34.6% |
| College / Undergraduate | 0 | 0.0% |
| Graduate / Professional | 58 | 14.0% |
| Total | 413 | 100.0% |
School Enrollment by Age by Funding Source in Telluride
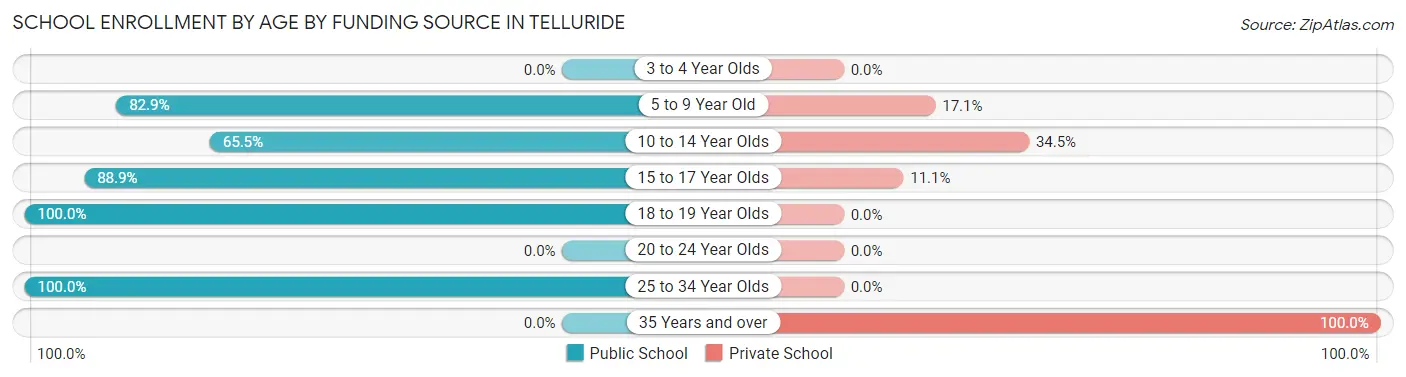
Out of a total of 413 students who are enrolled in schools in Telluride, 112 (27.1%) attend a private institution, while the remaining 301 (72.9%) are enrolled in public schools. The age group of 35 years and over has the highest likelihood of being enrolled in private schools, with 38 (100.0% in the age bracket) enrolled. Conversely, the age group of 18 to 19 year olds has the lowest likelihood of being enrolled in a private school, with 32 (100.0% in the age bracket) attending a public institution.
| Age Bracket | Public School | Private School |
| 3 to 4 Year Olds | 0 (0.0%) | 0 (0.0%) |
| 5 to 9 Year Old | 68 (82.9%) | 14 (17.1%) |
| 10 to 14 Year Olds | 93 (65.5%) | 49 (34.5%) |
| 15 to 17 Year Olds | 88 (88.9%) | 11 (11.1%) |
| 18 to 19 Year Olds | 32 (100.0%) | 0 (0.0%) |
| 20 to 24 Year Olds | 0 (0.0%) | 0 (0.0%) |
| 25 to 34 Year Olds | 20 (100.0%) | 0 (0.0%) |
| 35 Years and over | 0 (0.0%) | 38 (100.0%) |
| Total | 301 (72.9%) | 112 (27.1%) |
Educational Attainment by Field of Study in Telluride
Business (382 | 22.5%), education (264 | 15.5%), social sciences (177 | 10.4%), psychology (174 | 10.2%), and bio, nature & agricultural (141 | 8.3%) are the most common fields of study among 1,698 individuals in Telluride who have obtained a bachelor's degree or higher.
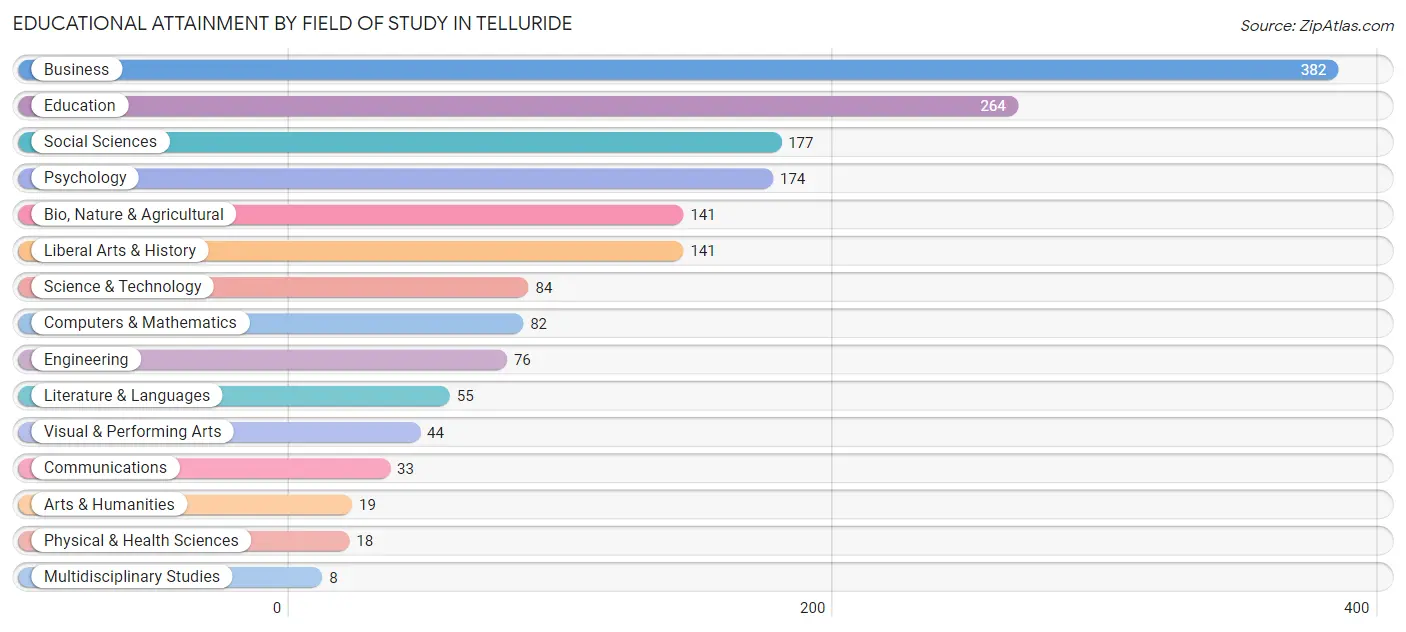
| Field of Study | # Graduates | % Graduates |
| Computers & Mathematics | 82 | 4.8% |
| Bio, Nature & Agricultural | 141 | 8.3% |
| Physical & Health Sciences | 18 | 1.1% |
| Psychology | 174 | 10.2% |
| Social Sciences | 177 | 10.4% |
| Engineering | 76 | 4.5% |
| Multidisciplinary Studies | 8 | 0.5% |
| Science & Technology | 84 | 5.0% |
| Business | 382 | 22.5% |
| Education | 264 | 15.5% |
| Literature & Languages | 55 | 3.2% |
| Liberal Arts & History | 141 | 8.3% |
| Visual & Performing Arts | 44 | 2.6% |
| Communications | 33 | 1.9% |
| Arts & Humanities | 19 | 1.1% |
| Total | 1,698 | 100.0% |
Transportation & Commute in Telluride
Vehicle Availability by Sex in Telluride
The most prevalent vehicle ownership categories in Telluride are males with 1 vehicle (471, accounting for 47.8%) and females with 1 vehicle (422, making up 63.9%).
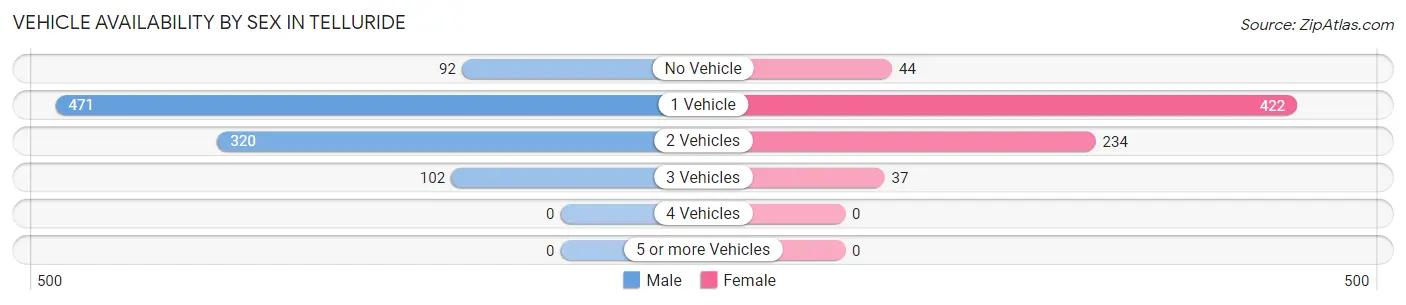
| Vehicles Available | Male | Female |
| No Vehicle | 92 (9.3%) | 44 (6.0%) |
| 1 Vehicle | 471 (47.8%) | 422 (57.3%) |
| 2 Vehicles | 320 (32.5%) | 234 (31.8%) |
| 3 Vehicles | 102 (10.4%) | 37 (5.0%) |
| 4 Vehicles | 0 (0.0%) | 0 (0.0%) |
| 5 or more Vehicles | 0 (0.0%) | 0 (0.0%) |
| Total | 985 (100.0%) | 737 (100.0%) |
Commute Time in Telluride
The most frequently occuring commute durations in Telluride are 5 to 9 minutes (477 commuters, 35.0%), 10 to 14 minutes (376 commuters, 27.6%), and 15 to 19 minutes (228 commuters, 16.7%).
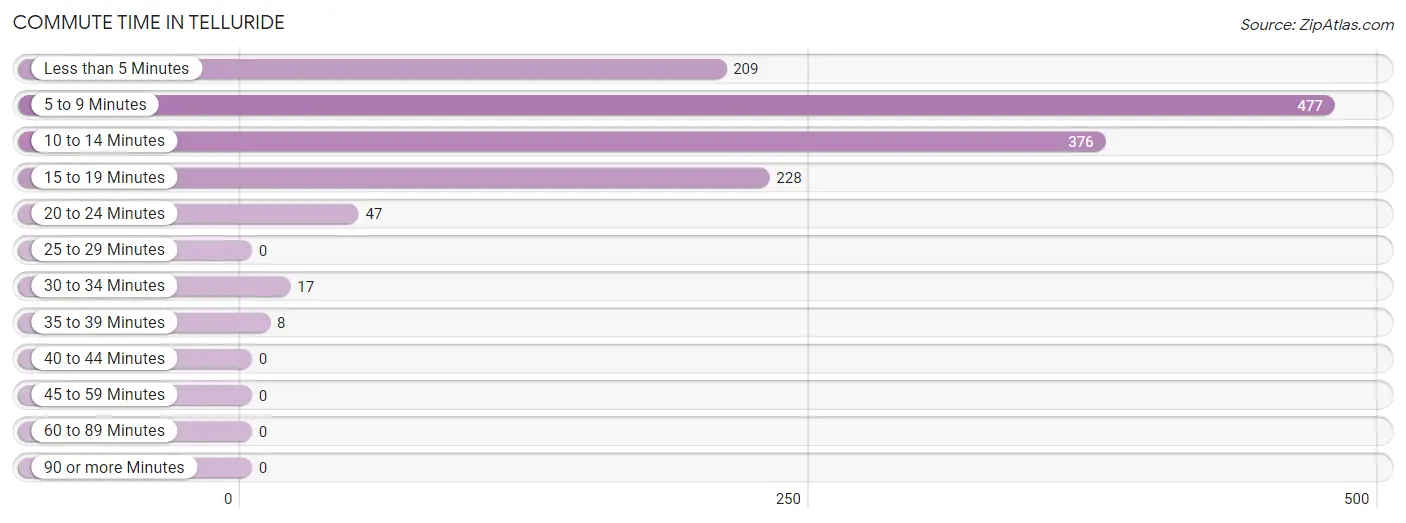
| Commute Time | # Commuters | % Commuters |
| Less than 5 Minutes | 209 | 15.3% |
| 5 to 9 Minutes | 477 | 35.0% |
| 10 to 14 Minutes | 376 | 27.6% |
| 15 to 19 Minutes | 228 | 16.7% |
| 20 to 24 Minutes | 47 | 3.5% |
| 25 to 29 Minutes | 0 | 0.0% |
| 30 to 34 Minutes | 17 | 1.3% |
| 35 to 39 Minutes | 8 | 0.6% |
| 40 to 44 Minutes | 0 | 0.0% |
| 45 to 59 Minutes | 0 | 0.0% |
| 60 to 89 Minutes | 0 | 0.0% |
| 90 or more Minutes | 0 | 0.0% |
Commute Time by Sex in Telluride
The most common commute times in Telluride are 10 to 14 minutes (229 commuters, 32.8%) for males and 5 to 9 minutes (290 commuters, 43.7%) for females.
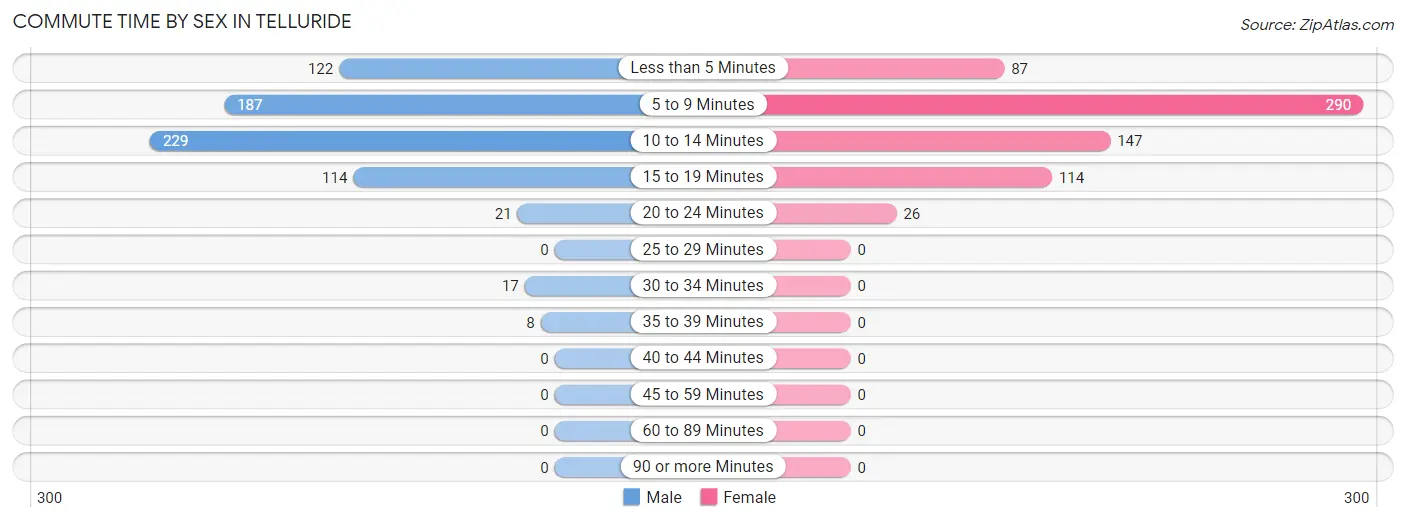
| Commute Time | Male | Female |
| Less than 5 Minutes | 122 (17.5%) | 87 (13.1%) |
| 5 to 9 Minutes | 187 (26.8%) | 290 (43.7%) |
| 10 to 14 Minutes | 229 (32.8%) | 147 (22.1%) |
| 15 to 19 Minutes | 114 (16.3%) | 114 (17.2%) |
| 20 to 24 Minutes | 21 (3.0%) | 26 (3.9%) |
| 25 to 29 Minutes | 0 (0.0%) | 0 (0.0%) |
| 30 to 34 Minutes | 17 (2.4%) | 0 (0.0%) |
| 35 to 39 Minutes | 8 (1.1%) | 0 (0.0%) |
| 40 to 44 Minutes | 0 (0.0%) | 0 (0.0%) |
| 45 to 59 Minutes | 0 (0.0%) | 0 (0.0%) |
| 60 to 89 Minutes | 0 (0.0%) | 0 (0.0%) |
| 90 or more Minutes | 0 (0.0%) | 0 (0.0%) |
Time of Departure to Work by Sex in Telluride
The most frequent times of departure to work in Telluride are 7:30 AM to 7:59 AM (172, 24.6%) for males and 7:30 AM to 7:59 AM (209, 31.5%) for females.
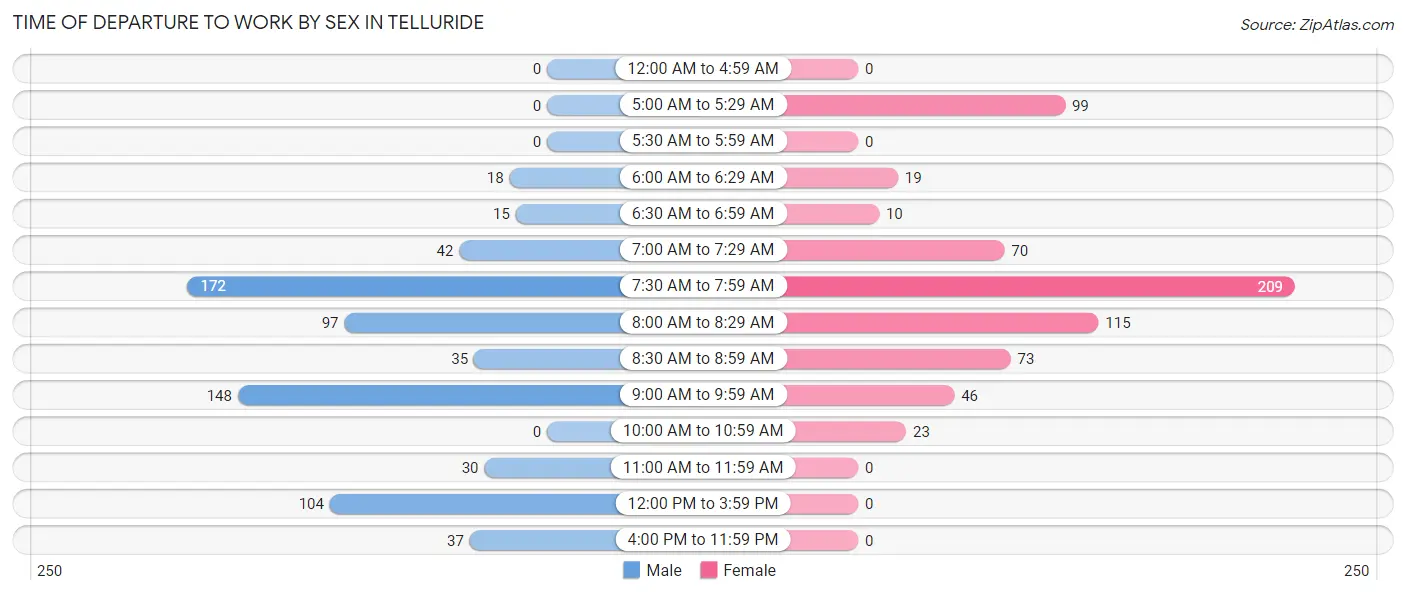
| Time of Departure | Male | Female |
| 12:00 AM to 4:59 AM | 0 (0.0%) | 0 (0.0%) |
| 5:00 AM to 5:29 AM | 0 (0.0%) | 99 (14.9%) |
| 5:30 AM to 5:59 AM | 0 (0.0%) | 0 (0.0%) |
| 6:00 AM to 6:29 AM | 18 (2.6%) | 19 (2.9%) |
| 6:30 AM to 6:59 AM | 15 (2.1%) | 10 (1.5%) |
| 7:00 AM to 7:29 AM | 42 (6.0%) | 70 (10.5%) |
| 7:30 AM to 7:59 AM | 172 (24.6%) | 209 (31.5%) |
| 8:00 AM to 8:29 AM | 97 (13.9%) | 115 (17.3%) |
| 8:30 AM to 8:59 AM | 35 (5.0%) | 73 (11.0%) |
| 9:00 AM to 9:59 AM | 148 (21.2%) | 46 (6.9%) |
| 10:00 AM to 10:59 AM | 0 (0.0%) | 23 (3.5%) |
| 11:00 AM to 11:59 AM | 30 (4.3%) | 0 (0.0%) |
| 12:00 PM to 3:59 PM | 104 (14.9%) | 0 (0.0%) |
| 4:00 PM to 11:59 PM | 37 (5.3%) | 0 (0.0%) |
| Total | 698 (100.0%) | 664 (100.0%) |
Housing Occupancy in Telluride
Occupancy by Ownership in Telluride
Of the total 1,250 dwellings in Telluride, owner-occupied units account for 732 (58.6%), while renter-occupied units make up 518 (41.4%).
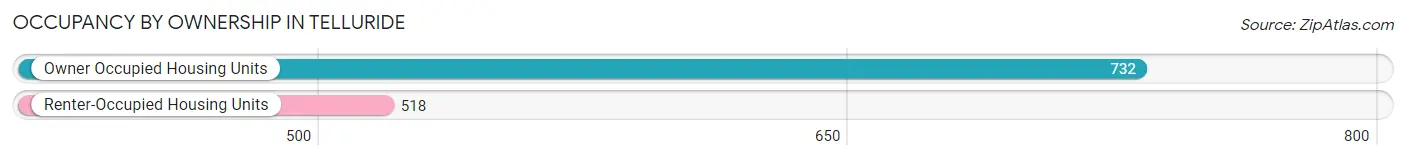
| Occupancy | # Housing Units | % Housing Units |
| Owner Occupied Housing Units | 732 | 58.6% |
| Renter-Occupied Housing Units | 518 | 41.4% |
| Total Occupied Housing Units | 1,250 | 100.0% |
Occupancy by Household Size in Telluride
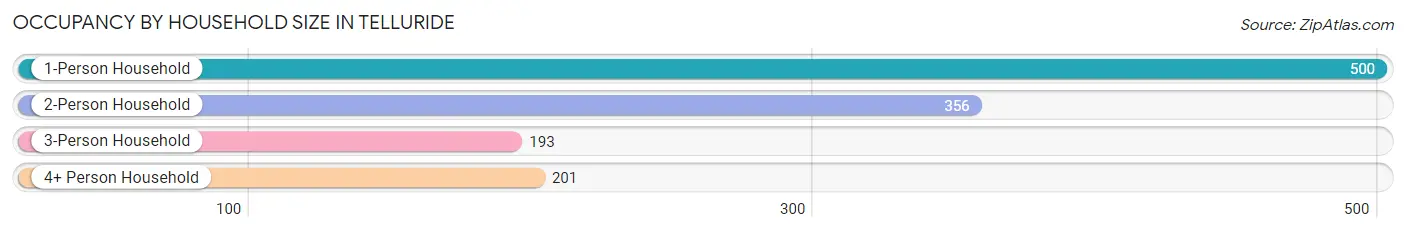
| Household Size | # Housing Units | % Housing Units |
| 1-Person Household | 500 | 40.0% |
| 2-Person Household | 356 | 28.5% |
| 3-Person Household | 193 | 15.4% |
| 4+ Person Household | 201 | 16.1% |
| Total Housing Units | 1,250 | 100.0% |
Occupancy by Ownership by Household Size in Telluride
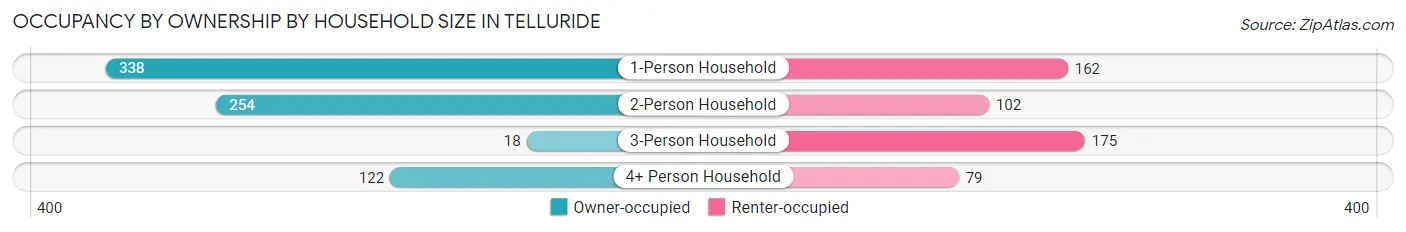
| Household Size | Owner-occupied | Renter-occupied |
| 1-Person Household | 338 (67.6%) | 162 (32.4%) |
| 2-Person Household | 254 (71.4%) | 102 (28.6%) |
| 3-Person Household | 18 (9.3%) | 175 (90.7%) |
| 4+ Person Household | 122 (60.7%) | 79 (39.3%) |
| Total Housing Units | 732 (58.6%) | 518 (41.4%) |
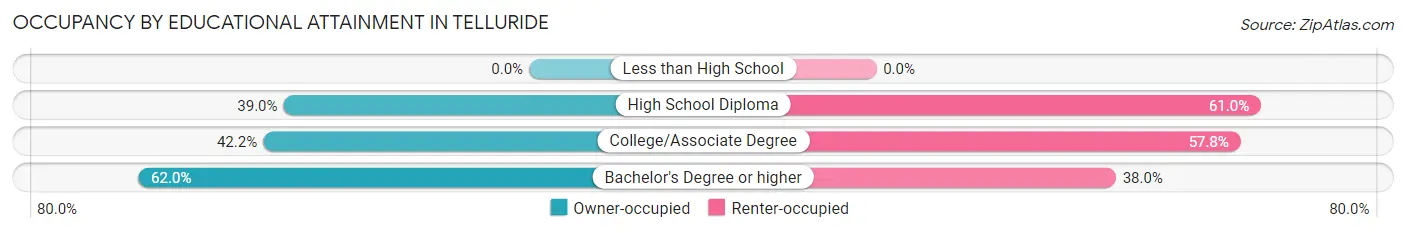
Occupancy by Educational Attainment in Telluride
| Household Size | Owner-occupied | Renter-occupied |
| Less than High School | 0 (0.0%) | 0 (0.0%) |
| High School Diploma | 30 (39.0%) | 47 (61.0%) |
| College/Associate Degree | 54 (42.2%) | 74 (57.8%) |
| Bachelor's Degree or higher | 648 (62.0%) | 397 (38.0%) |
Occupancy by Age of Householder in Telluride
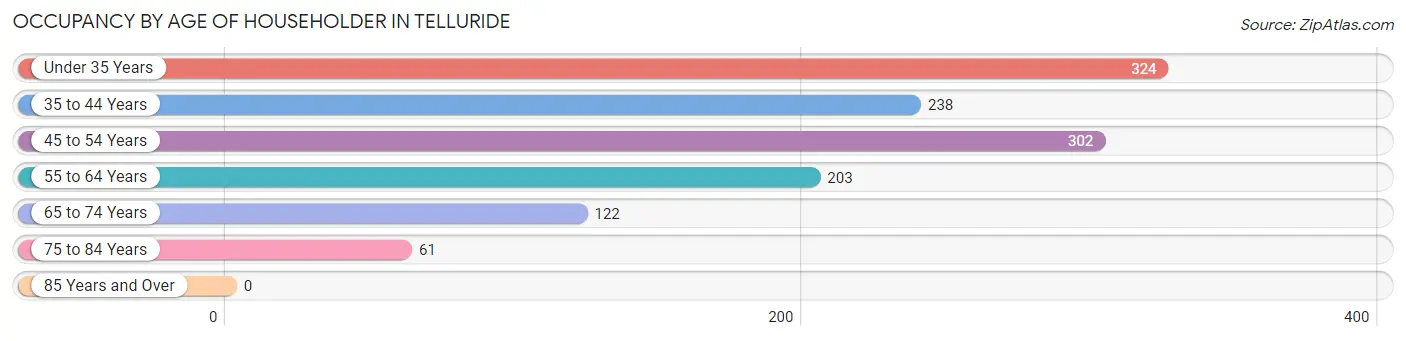
| Age Bracket | # Households | % Households |
| Under 35 Years | 324 | 25.9% |
| 35 to 44 Years | 238 | 19.0% |
| 45 to 54 Years | 302 | 24.2% |
| 55 to 64 Years | 203 | 16.2% |
| 65 to 74 Years | 122 | 9.8% |
| 75 to 84 Years | 61 | 4.9% |
| 85 Years and Over | 0 | 0.0% |
| Total | 1,250 | 100.0% |
Housing Finances in Telluride
Median Income by Occupancy in Telluride
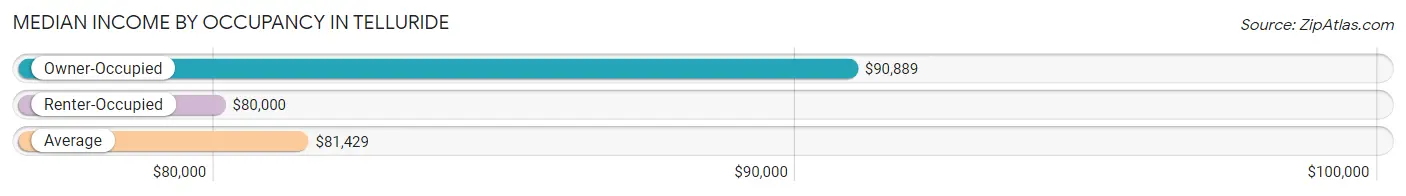
| Occupancy Type | # Households | Median Income |
| Owner-Occupied | 732 (58.6%) | $90,889 |
| Renter-Occupied | 518 (41.4%) | $80,000 |
| Average | 1,250 (100.0%) | $81,429 |
Occupancy by Householder Income Bracket in Telluride
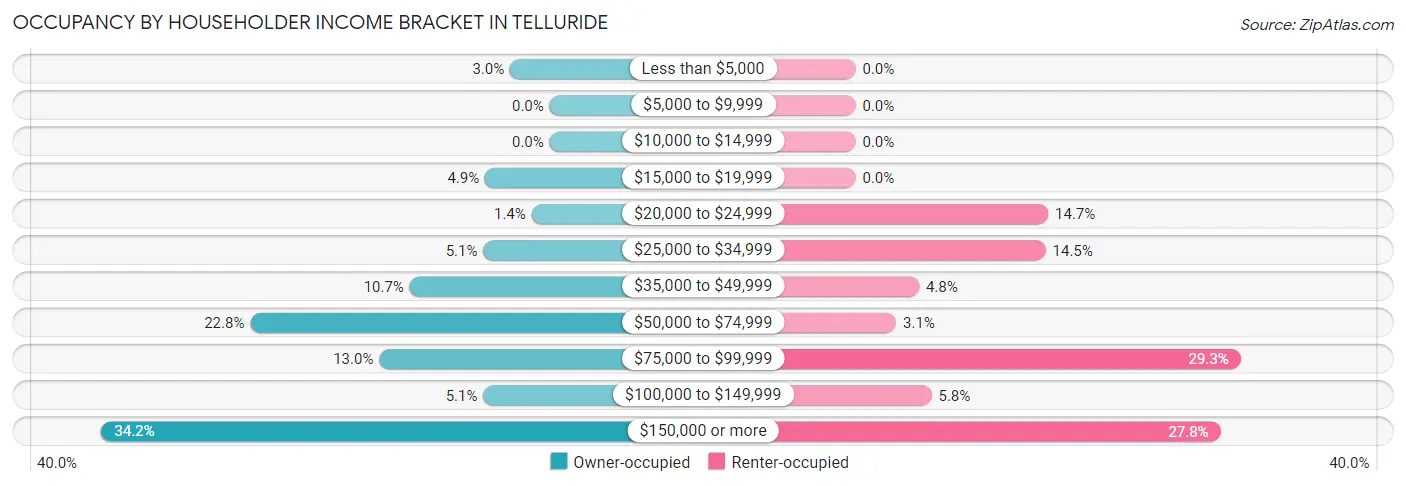
| Income Bracket | Owner-occupied | Renter-occupied |
| Less than $5,000 | 22 (3.0%) | 0 (0.0%) |
| $5,000 to $9,999 | 0 (0.0%) | 0 (0.0%) |
| $10,000 to $14,999 | 0 (0.0%) | 0 (0.0%) |
| $15,000 to $19,999 | 36 (4.9%) | 0 (0.0%) |
| $20,000 to $24,999 | 10 (1.4%) | 76 (14.7%) |
| $25,000 to $34,999 | 37 (5.1%) | 75 (14.5%) |
| $35,000 to $49,999 | 78 (10.7%) | 25 (4.8%) |
| $50,000 to $74,999 | 167 (22.8%) | 16 (3.1%) |
| $75,000 to $99,999 | 95 (13.0%) | 152 (29.3%) |
| $100,000 to $149,999 | 37 (5.1%) | 30 (5.8%) |
| $150,000 or more | 250 (34.2%) | 144 (27.8%) |
| Total | 732 (100.0%) | 518 (100.0%) |
Monthly Housing Cost Tiers in Telluride
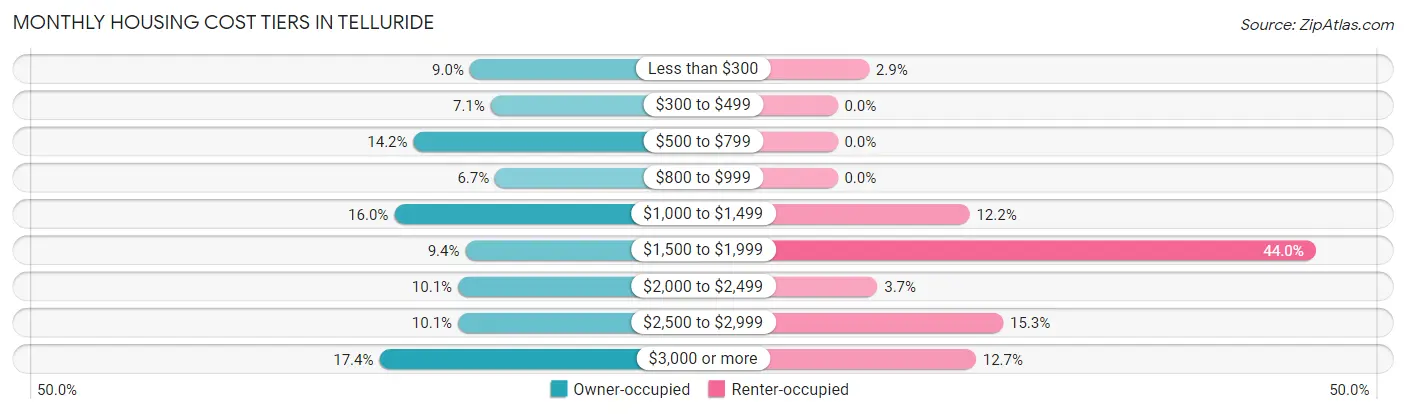
| Monthly Cost | Owner-occupied | Renter-occupied |
| Less than $300 | 66 (9.0%) | 15 (2.9%) |
| $300 to $499 | 52 (7.1%) | 0 (0.0%) |
| $500 to $799 | 104 (14.2%) | 0 (0.0%) |
| $800 to $999 | 49 (6.7%) | 0 (0.0%) |
| $1,000 to $1,499 | 117 (16.0%) | 63 (12.2%) |
| $1,500 to $1,999 | 69 (9.4%) | 228 (44.0%) |
| $2,000 to $2,499 | 74 (10.1%) | 19 (3.7%) |
| $2,500 to $2,999 | 74 (10.1%) | 79 (15.2%) |
| $3,000 or more | 127 (17.3%) | 66 (12.7%) |
| Total | 732 (100.0%) | 518 (100.0%) |
Physical Housing Characteristics in Telluride
Housing Structures in Telluride
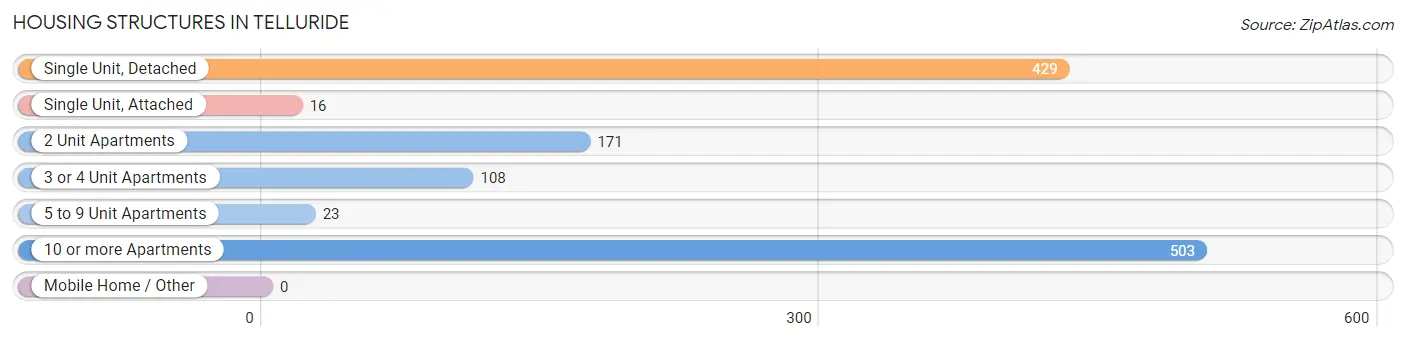
| Structure Type | # Housing Units | % Housing Units |
| Single Unit, Detached | 429 | 34.3% |
| Single Unit, Attached | 16 | 1.3% |
| 2 Unit Apartments | 171 | 13.7% |
| 3 or 4 Unit Apartments | 108 | 8.6% |
| 5 to 9 Unit Apartments | 23 | 1.8% |
| 10 or more Apartments | 503 | 40.2% |
| Mobile Home / Other | 0 | 0.0% |
| Total | 1,250 | 100.0% |
Housing Structures by Occupancy in Telluride
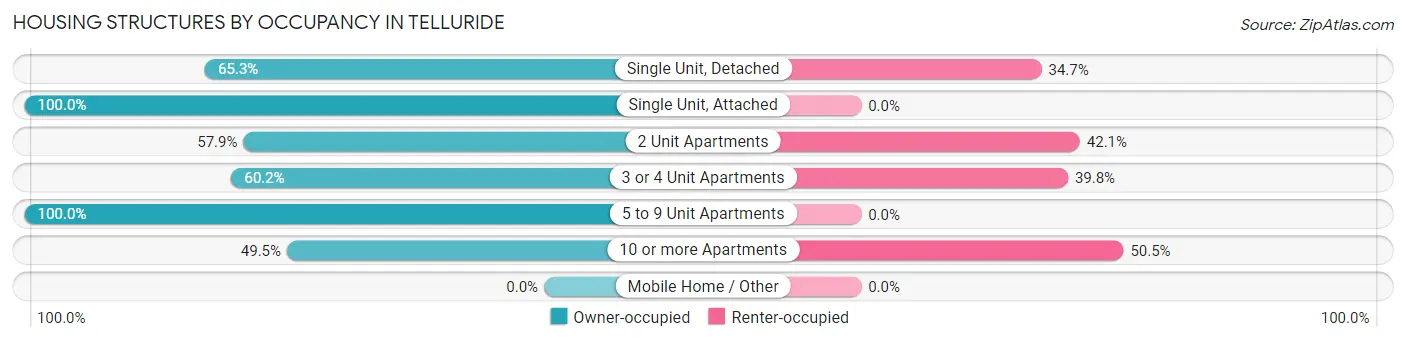
| Structure Type | Owner-occupied | Renter-occupied |
| Single Unit, Detached | 280 (65.3%) | 149 (34.7%) |
| Single Unit, Attached | 16 (100.0%) | 0 (0.0%) |
| 2 Unit Apartments | 99 (57.9%) | 72 (42.1%) |
| 3 or 4 Unit Apartments | 65 (60.2%) | 43 (39.8%) |
| 5 to 9 Unit Apartments | 23 (100.0%) | 0 (0.0%) |
| 10 or more Apartments | 249 (49.5%) | 254 (50.5%) |
| Mobile Home / Other | 0 (0.0%) | 0 (0.0%) |
| Total | 732 (58.6%) | 518 (41.4%) |
Housing Structures by Number of Rooms in Telluride
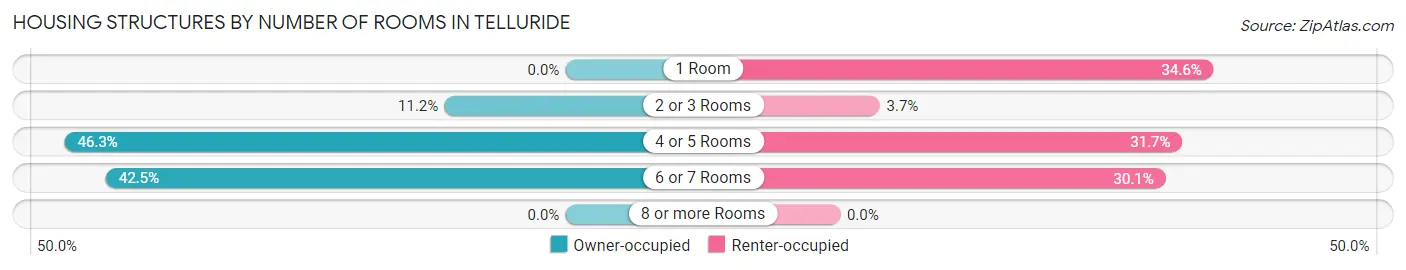
| Number of Rooms | Owner-occupied | Renter-occupied |
| 1 Room | 0 (0.0%) | 179 (34.6%) |
| 2 or 3 Rooms | 82 (11.2%) | 19 (3.7%) |
| 4 or 5 Rooms | 339 (46.3%) | 164 (31.7%) |
| 6 or 7 Rooms | 311 (42.5%) | 156 (30.1%) |
| 8 or more Rooms | 0 (0.0%) | 0 (0.0%) |
| Total | 732 (100.0%) | 518 (100.0%) |
Housing Structure by Heating Type in Telluride
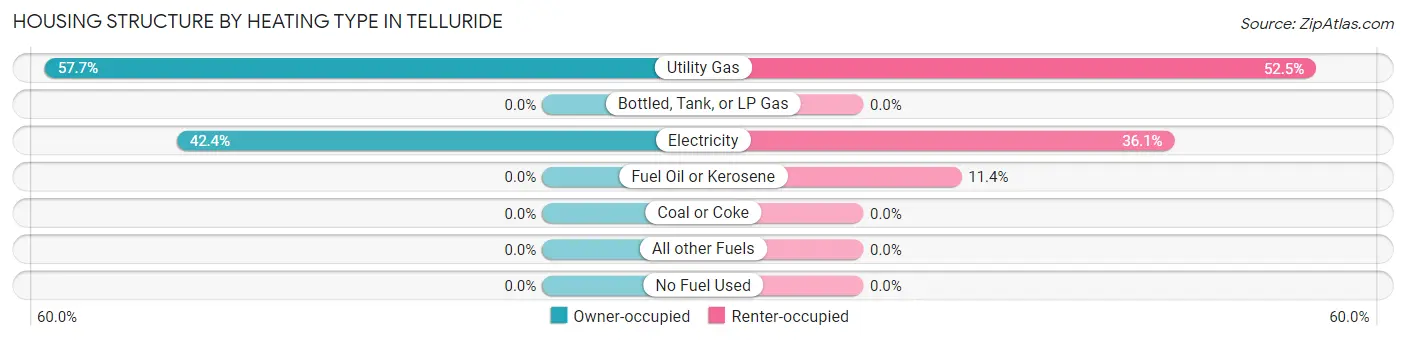
| Heating Type | Owner-occupied | Renter-occupied |
| Utility Gas | 422 (57.7%) | 272 (52.5%) |
| Bottled, Tank, or LP Gas | 0 (0.0%) | 0 (0.0%) |
| Electricity | 310 (42.3%) | 187 (36.1%) |
| Fuel Oil or Kerosene | 0 (0.0%) | 59 (11.4%) |
| Coal or Coke | 0 (0.0%) | 0 (0.0%) |
| All other Fuels | 0 (0.0%) | 0 (0.0%) |
| No Fuel Used | 0 (0.0%) | 0 (0.0%) |
| Total | 732 (100.0%) | 518 (100.0%) |
Household Vehicle Usage in Telluride
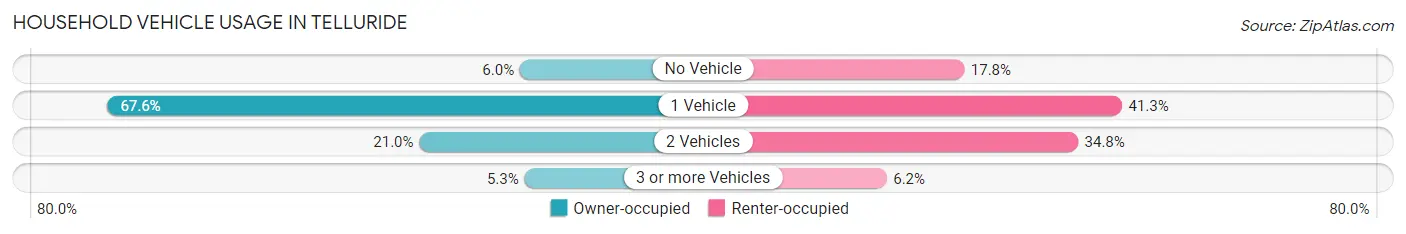
| Vehicles per Household | Owner-occupied | Renter-occupied |
| No Vehicle | 44 (6.0%) | 92 (17.8%) |
| 1 Vehicle | 495 (67.6%) | 214 (41.3%) |
| 2 Vehicles | 154 (21.0%) | 180 (34.7%) |
| 3 or more Vehicles | 39 (5.3%) | 32 (6.2%) |
| Total | 732 (100.0%) | 518 (100.0%) |
Real Estate & Mortgages in Telluride
Real Estate and Mortgage Overview in Telluride
| Characteristic | Without Mortgage | With Mortgage |
| Housing Units | 356 | 376 |
| Median Property Value | $806,500 | $326,500 |
| Median Household Income | $62,171 | $155 |
| Monthly Housing Costs | $653 | $127 |
| Real Estate Taxes | $3,696 | $0 |
Property Value by Mortgage Status in Telluride
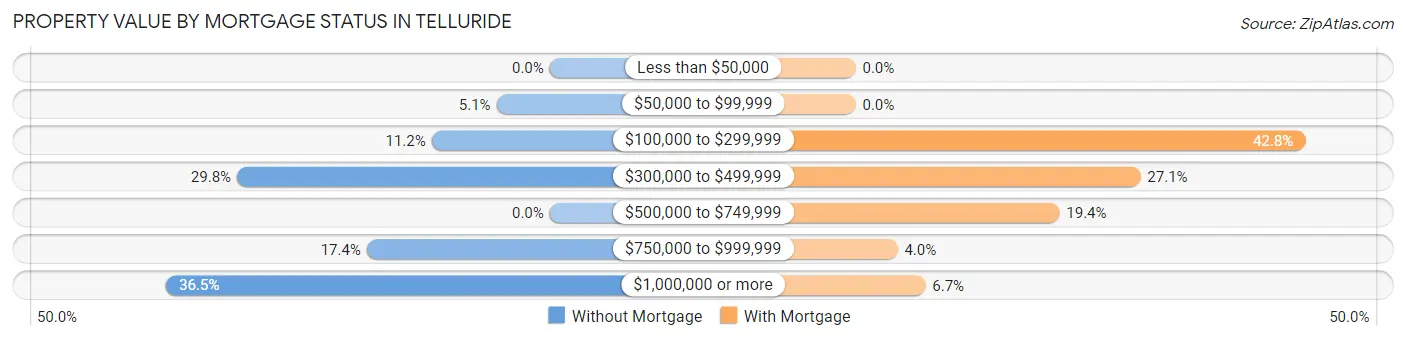
| Property Value | Without Mortgage | With Mortgage |
| Less than $50,000 | 0 (0.0%) | 0 (0.0%) |
| $50,000 to $99,999 | 18 (5.1%) | 0 (0.0%) |
| $100,000 to $299,999 | 40 (11.2%) | 161 (42.8%) |
| $300,000 to $499,999 | 106 (29.8%) | 102 (27.1%) |
| $500,000 to $749,999 | 0 (0.0%) | 73 (19.4%) |
| $750,000 to $999,999 | 62 (17.4%) | 15 (4.0%) |
| $1,000,000 or more | 130 (36.5%) | 25 (6.7%) |
| Total | 356 (100.0%) | 376 (100.0%) |
Household Income by Mortgage Status in Telluride
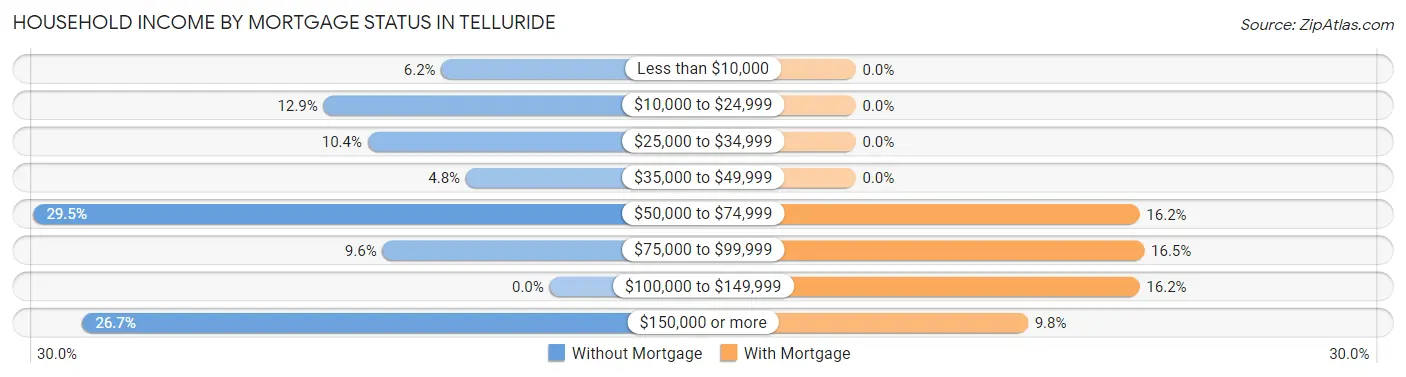
| Household Income | Without Mortgage | With Mortgage |
| Less than $10,000 | 22 (6.2%) | 0 (0.0%) |
| $10,000 to $24,999 | 46 (12.9%) | 0 (0.0%) |
| $25,000 to $34,999 | 37 (10.4%) | 0 (0.0%) |
| $35,000 to $49,999 | 17 (4.8%) | 0 (0.0%) |
| $50,000 to $74,999 | 105 (29.5%) | 61 (16.2%) |
| $75,000 to $99,999 | 34 (9.6%) | 62 (16.5%) |
| $100,000 to $149,999 | 0 (0.0%) | 61 (16.2%) |
| $150,000 or more | 95 (26.7%) | 37 (9.8%) |
| Total | 356 (100.0%) | 376 (100.0%) |
Property Value to Household Income Ratio in Telluride
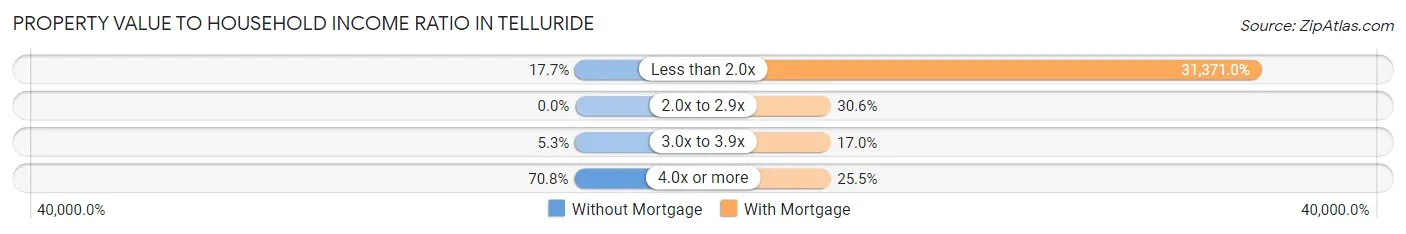
| Value-to-Income Ratio | Without Mortgage | With Mortgage |
| Less than 2.0x | 63 (17.7%) | 117,955 (31,371.0%) |
| 2.0x to 2.9x | 0 (0.0%) | 115 (30.6%) |
| 3.0x to 3.9x | 19 (5.3%) | 64 (17.0%) |
| 4.0x or more | 252 (70.8%) | 96 (25.5%) |
| Total | 356 (100.0%) | 376 (100.0%) |
Real Estate Taxes by Mortgage Status in Telluride
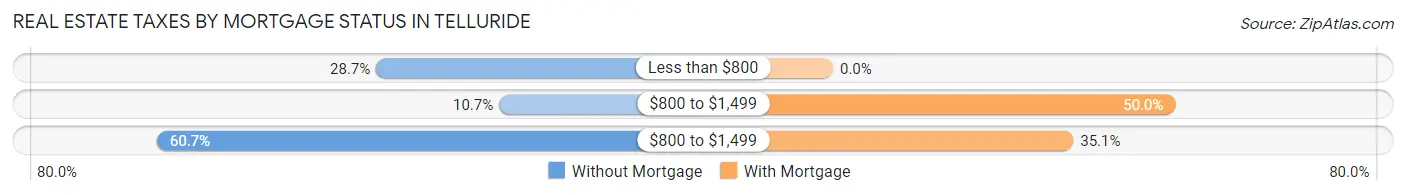
| Property Taxes | Without Mortgage | With Mortgage |
| Less than $800 | 102 (28.6%) | 0 (0.0%) |
| $800 to $1,499 | 38 (10.7%) | 188 (50.0%) |
| $800 to $1,499 | 216 (60.7%) | 132 (35.1%) |
| Total | 356 (100.0%) | 376 (100.0%) |
Health & Disability in Telluride
Health Insurance Coverage by Age in Telluride
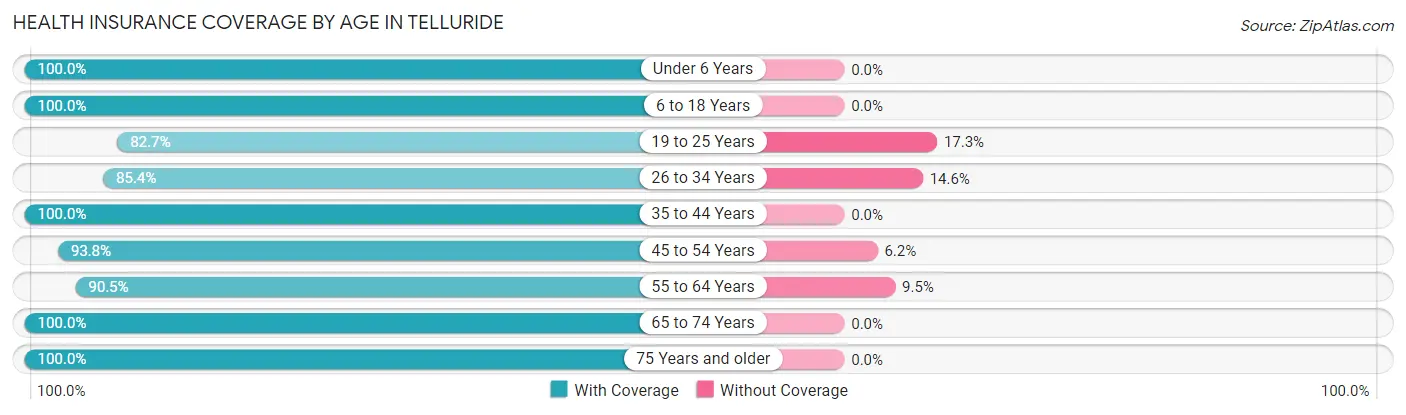
| Age Bracket | With Coverage | Without Coverage |
| Under 6 Years | 85 (100.0%) | 0 (0.0%) |
| 6 to 18 Years | 408 (100.0%) | 0 (0.0%) |
| 19 to 25 Years | 134 (82.7%) | 28 (17.3%) |
| 26 to 34 Years | 397 (85.4%) | 68 (14.6%) |
| 35 to 44 Years | 421 (100.0%) | 0 (0.0%) |
| 45 to 54 Years | 530 (93.8%) | 35 (6.2%) |
| 55 to 64 Years | 258 (90.5%) | 27 (9.5%) |
| 65 to 74 Years | 170 (100.0%) | 0 (0.0%) |
| 75 Years and older | 61 (100.0%) | 0 (0.0%) |
| Total | 2,464 (94.0%) | 158 (6.0%) |
Health Insurance Coverage by Citizenship Status in Telluride
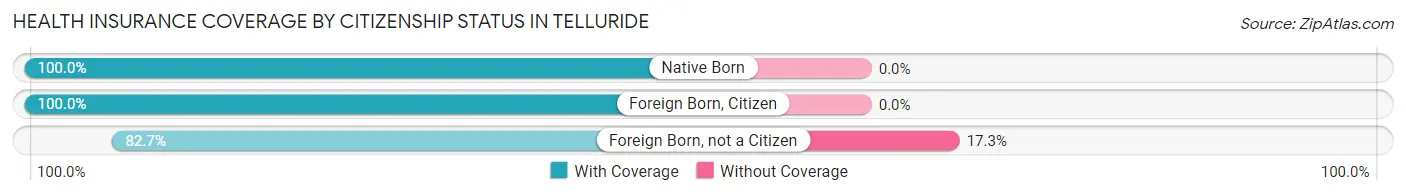
| Citizenship Status | With Coverage | Without Coverage |
| Native Born | 85 (100.0%) | 0 (0.0%) |
| Foreign Born, Citizen | 408 (100.0%) | 0 (0.0%) |
| Foreign Born, not a Citizen | 134 (82.7%) | 28 (17.3%) |
Health Insurance Coverage by Household Income in Telluride
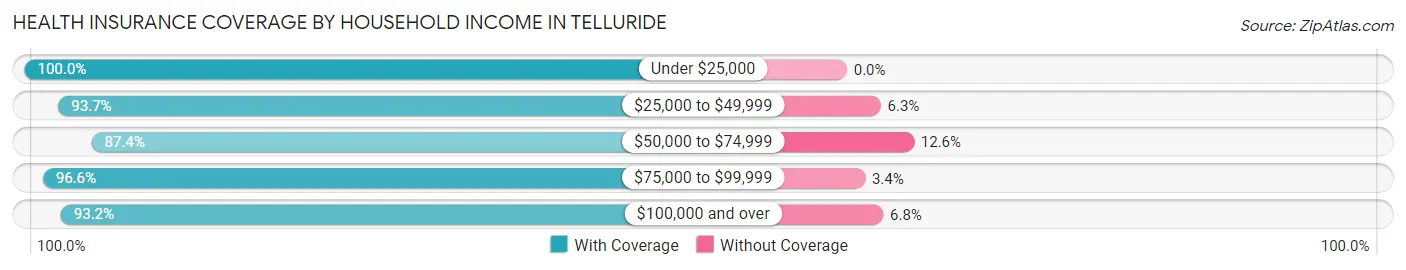
| Household Income | With Coverage | Without Coverage |
| Under $25,000 | 173 (100.0%) | 0 (0.0%) |
| $25,000 to $49,999 | 502 (93.7%) | 34 (6.3%) |
| $50,000 to $74,999 | 195 (87.4%) | 28 (12.6%) |
| $75,000 to $99,999 | 539 (96.6%) | 19 (3.4%) |
| $100,000 and over | 1,055 (93.2%) | 77 (6.8%) |
Public vs Private Health Insurance Coverage by Age in Telluride
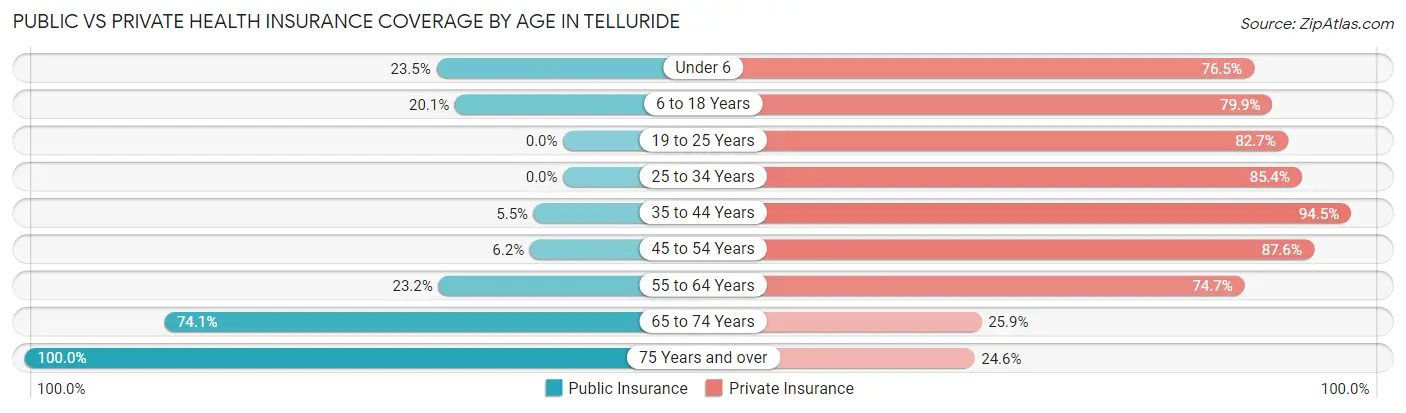
| Age Bracket | Public Insurance | Private Insurance |
| Under 6 | 20 (23.5%) | 65 (76.5%) |
| 6 to 18 Years | 82 (20.1%) | 326 (79.9%) |
| 19 to 25 Years | 0 (0.0%) | 134 (82.7%) |
| 25 to 34 Years | 0 (0.0%) | 397 (85.4%) |
| 35 to 44 Years | 23 (5.5%) | 398 (94.5%) |
| 45 to 54 Years | 35 (6.2%) | 495 (87.6%) |
| 55 to 64 Years | 66 (23.2%) | 213 (74.7%) |
| 65 to 74 Years | 126 (74.1%) | 44 (25.9%) |
| 75 Years and over | 61 (100.0%) | 15 (24.6%) |
| Total | 413 (15.8%) | 2,087 (79.6%) |
Disability Status by Sex by Age in Telluride
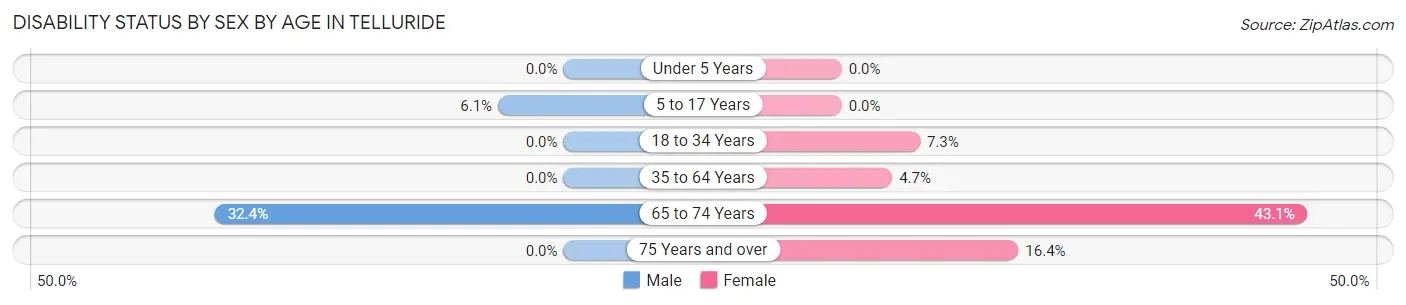
| Age Bracket | Male | Female |
| Under 5 Years | 0 (0.0%) | 0 (0.0%) |
| 5 to 17 Years | 15 (6.1%) | 0 (0.0%) |
| 18 to 34 Years | 0 (0.0%) | 22 (7.3%) |
| 35 to 64 Years | 0 (0.0%) | 27 (4.7%) |
| 65 to 74 Years | 22 (32.4%) | 44 (43.1%) |
| 75 Years and over | 0 (0.0%) | 10 (16.4%) |
Disability Class by Sex by Age in Telluride
Disability Class: Hearing Difficulty
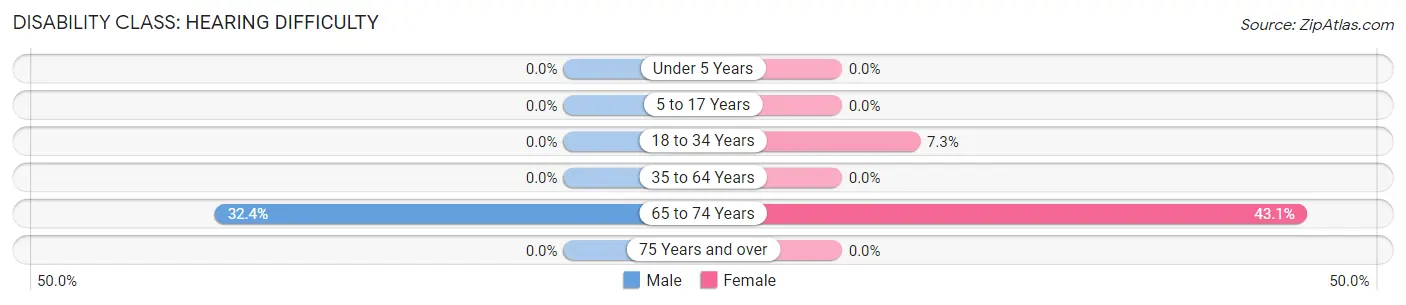
| Age Bracket | Male | Female |
| Under 5 Years | 0 (0.0%) | 0 (0.0%) |
| 5 to 17 Years | 0 (0.0%) | 0 (0.0%) |
| 18 to 34 Years | 0 (0.0%) | 22 (7.3%) |
| 35 to 64 Years | 0 (0.0%) | 0 (0.0%) |
| 65 to 74 Years | 22 (32.4%) | 44 (43.1%) |
| 75 Years and over | 0 (0.0%) | 0 (0.0%) |
Disability Class: Vision Difficulty
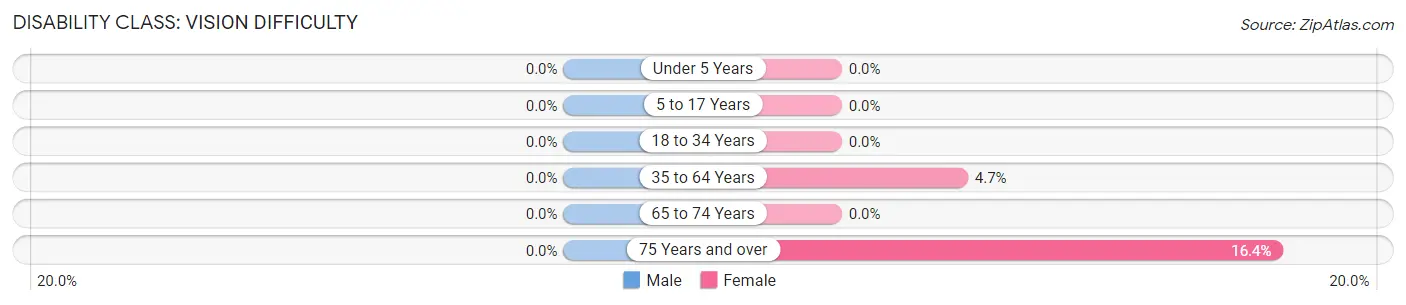
| Age Bracket | Male | Female |
| Under 5 Years | 0 (0.0%) | 0 (0.0%) |
| 5 to 17 Years | 0 (0.0%) | 0 (0.0%) |
| 18 to 34 Years | 0 (0.0%) | 0 (0.0%) |
| 35 to 64 Years | 0 (0.0%) | 27 (4.7%) |
| 65 to 74 Years | 0 (0.0%) | 0 (0.0%) |
| 75 Years and over | 0 (0.0%) | 10 (16.4%) |
Disability Class: Cognitive Difficulty
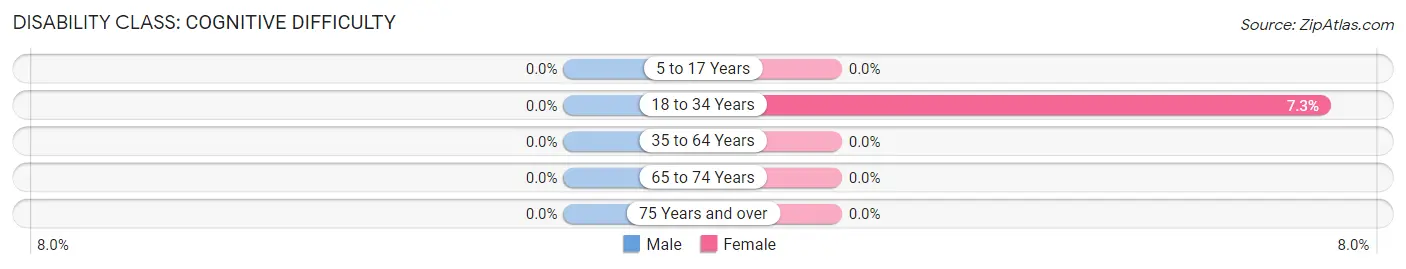
| Age Bracket | Male | Female |
| 5 to 17 Years | 0 (0.0%) | 0 (0.0%) |
| 18 to 34 Years | 0 (0.0%) | 22 (7.3%) |
| 35 to 64 Years | 0 (0.0%) | 0 (0.0%) |
| 65 to 74 Years | 0 (0.0%) | 0 (0.0%) |
| 75 Years and over | 0 (0.0%) | 0 (0.0%) |
Disability Class: Ambulatory Difficulty
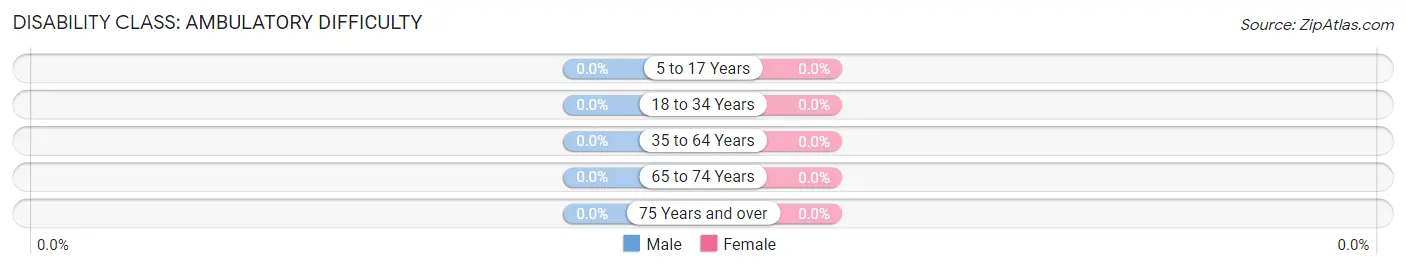
| Age Bracket | Male | Female |
| 5 to 17 Years | 0 (0.0%) | 0 (0.0%) |
| 18 to 34 Years | 0 (0.0%) | 0 (0.0%) |
| 35 to 64 Years | 0 (0.0%) | 0 (0.0%) |
| 65 to 74 Years | 0 (0.0%) | 0 (0.0%) |
| 75 Years and over | 0 (0.0%) | 0 (0.0%) |
Disability Class: Self-Care Difficulty
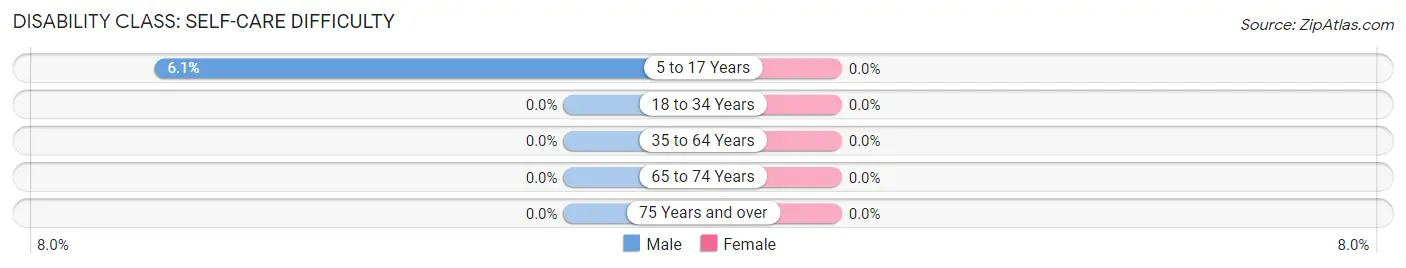
| Age Bracket | Male | Female |
| 5 to 17 Years | 15 (6.1%) | 0 (0.0%) |
| 18 to 34 Years | 0 (0.0%) | 0 (0.0%) |
| 35 to 64 Years | 0 (0.0%) | 0 (0.0%) |
| 65 to 74 Years | 0 (0.0%) | 0 (0.0%) |
| 75 Years and over | 0 (0.0%) | 0 (0.0%) |
Technology Access in Telluride
Computing Device Access in Telluride
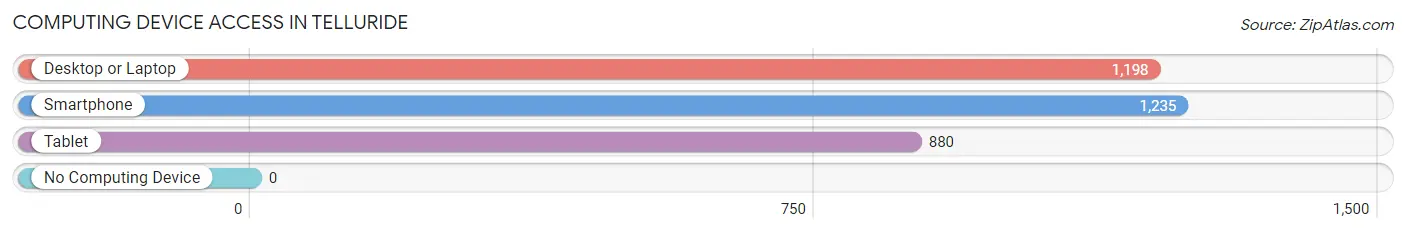
| Device Type | # Households | % Households |
| Desktop or Laptop | 1,198 | 95.8% |
| Smartphone | 1,235 | 98.8% |
| Tablet | 880 | 70.4% |
| No Computing Device | 0 | 0.0% |
| Total | 1,250 | 100.0% |
Internet Access in Telluride
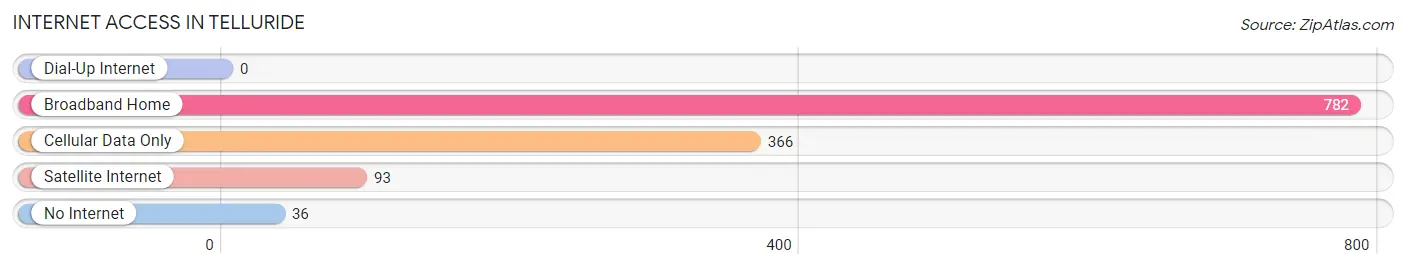
| Internet Type | # Households | % Households |
| Dial-Up Internet | 0 | 0.0% |
| Broadband Home | 782 | 62.6% |
| Cellular Data Only | 366 | 29.3% |
| Satellite Internet | 93 | 7.4% |
| No Internet | 36 | 2.9% |
| Total | 1,250 | 100.0% |
Telluride Summary
Telluride, Colorado is a small mountain town located in the San Juan Mountains of southwestern Colorado. It is situated in the Uncompahgre Valley, surrounded by steep mountains and canyons. The town is known for its stunning natural beauty, outdoor recreation opportunities, and vibrant culture.
History
The area that is now Telluride was first inhabited by the Ute Indians, who used the area for hunting and gathering. The first Europeans to explore the area were Spanish explorers in the late 1700s. In 1858, prospectors discovered gold in the area, and the town of Telluride was founded in 1878. The town was named after the telluride ore that was found in the area.
The town quickly grew as miners flocked to the area in search of gold and silver. By the late 1800s, Telluride had become a bustling mining town with a population of over 5,000. The town was home to several large mines, including the Smuggler-Union Mine, which was the largest gold mine in Colorado.
The mining industry in Telluride declined in the early 1900s, and the town’s population decreased. In the 1970s, the town was revitalized as a ski resort and tourist destination. Today, Telluride is a popular destination for outdoor recreation and tourism.
Geography
Telluride is located in the San Juan Mountains of southwestern Colorado. The town is situated in the Uncompahgre Valley, surrounded by steep mountains and canyons. The town is located at an elevation of 8,750 feet, making it one of the highest towns in the United States.
The town is located near several ski resorts, including Telluride Ski Resort, which is the largest ski resort in the area. The town is also located near several national parks and forests, including the San Juan National Forest and the Black Canyon of the Gunnison National Park.
Economy
The economy of Telluride is largely based on tourism and outdoor recreation. The town is home to several ski resorts, including Telluride Ski Resort, which is the largest ski resort in the area. The town is also home to several national parks and forests, which attract visitors from around the world.
The town is also home to several businesses, including restaurants, bars, shops, and galleries. The town is also home to several festivals and events, including the Telluride Film Festival and the Telluride Bluegrass Festival.
Demographics
As of the 2010 census, the population of Telluride was 2,325. The town has a median age of 39.7 years, and the median household income is $68,958. The town is predominantly white, with 87.3% of the population identifying as white. The town is also home to a small Hispanic population, with 8.3% of the population identifying as Hispanic or Latino.
Conclusion
Telluride, Colorado is a small mountain town located in the San Juan Mountains of southwestern Colorado. It is known for its stunning natural beauty, outdoor recreation opportunities, and vibrant culture. The town’s economy is largely based on tourism and outdoor recreation, and the town is home to several ski resorts, national parks, and businesses. The town has a population of 2,325, and the median age is 39.7 years. The town is predominantly white, with 87.3% of the population identifying as white.
Common Questions
What is Per Capita Income in Telluride?
Per Capita income in Telluride is $55,531.
What is the Median Family Income in Telluride?
Median Family Income in Telluride is $155,500.
What is the Median Household income in Telluride?
Median Household Income in Telluride is $81,429.
What is Income or Wage Gap in Telluride?
Income or Wage Gap in Telluride is 3.3%.
Women in Telluride earn 96.7 cents for every dollar earned by a man.
What is Inequality or Gini Index in Telluride?
Inequality or Gini Index in Telluride is 0.43.
What is the Total Population of Telluride?
Total Population of Telluride is 2,622.
What is the Total Male Population of Telluride?
Total Male Population of Telluride is 1,406.
What is the Total Female Population of Telluride?
Total Female Population of Telluride is 1,216.
What is the Ratio of Males per 100 Females in Telluride?
There are 115.62 Males per 100 Females in Telluride.
What is the Ratio of Females per 100 Males in Telluride?
There are 86.49 Females per 100 Males in Telluride.
What is the Median Population Age in Telluride?
Median Population Age in Telluride is 40.1 Years.
What is the Average Family Size in Telluride
Average Family Size in Telluride is 2.7 People.
What is the Average Household Size in Telluride
Average Household Size in Telluride is 2.1 People.
How Large is the Labor Force in Telluride?
There are 1,772 People in the Labor Forcein in Telluride.
What is the Percentage of People in the Labor Force in Telluride?
78.9% of People are in the Labor Force in Telluride.
What is the Unemployment Rate in Telluride?
Unemployment Rate in Telluride is 2.8%.