Sugarloaf, CO Map & Demographics
Sugarloaf Map
Sugarloaf Overview
$60,964
PER CAPITA INCOME
0.36
INEQUALITY / GINI INDEX
501
TOTAL POPULATION
267
MALE POPULATION
234
FEMALE POPULATION
114.10
MALES / 100 FEMALES
87.64
FEMALES / 100 MALES
52.4
MEDIAN AGE
3.0
AVG FAMILY SIZE
3.1
AVG HOUSEHOLD SIZE
280
LABOR FORCE [ PEOPLE ]
73.5%
PERCENT IN LABOR FORCE
Income in Sugarloaf
Income Overview in Sugarloaf
| Characteristic | Number | Measure |
| Per Capita Income | 501 | $60,964 |
| Median Family Income | 160 | $0 |
| Mean Family Income | 160 | $204,391 |
| Median Household Income | 160 | $0 |
| Mean Household Income | 160 | $211,008 |
| Income Deficit | 160 | $0 |
| Wage / Income Gap (%) | 501 | 0.00% |
| Wage / Income Gap ($) | 501 | 100.00¢ per $1 |
| Gini / Inequality Index | 501 | 0.36 |
Earnings by Sex in Sugarloaf
| Sex | Number | Average Earnings |
| Male | 186 (59.8%) | $0 |
| Female | 125 (40.2%) | $0 |
| Total | 311 (100.0%) | $0 |
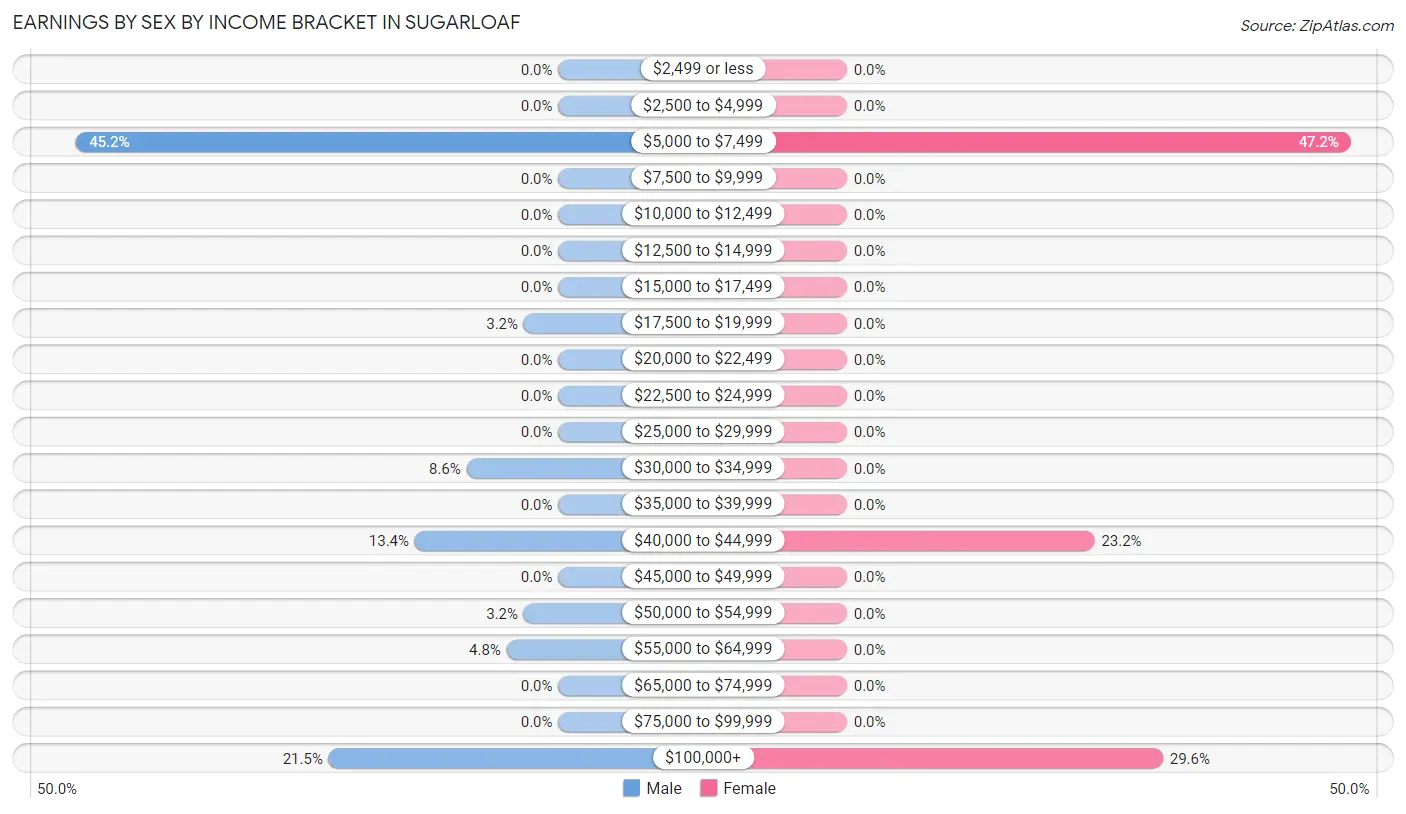
Earnings by Sex by Income Bracket in Sugarloaf
The most common earnings brackets in Sugarloaf are $5,000 to $7,499 for men (84 | 45.2%) and $5,000 to $7,499 for women (59 | 47.2%).
| Income | Male | Female |
| $2,499 or less | 0 (0.0%) | 0 (0.0%) |
| $2,500 to $4,999 | 0 (0.0%) | 0 (0.0%) |
| $5,000 to $7,499 | 84 (45.2%) | 59 (47.2%) |
| $7,500 to $9,999 | 0 (0.0%) | 0 (0.0%) |
| $10,000 to $12,499 | 0 (0.0%) | 0 (0.0%) |
| $12,500 to $14,999 | 0 (0.0%) | 0 (0.0%) |
| $15,000 to $17,499 | 0 (0.0%) | 0 (0.0%) |
| $17,500 to $19,999 | 6 (3.2%) | 0 (0.0%) |
| $20,000 to $22,499 | 0 (0.0%) | 0 (0.0%) |
| $22,500 to $24,999 | 0 (0.0%) | 0 (0.0%) |
| $25,000 to $29,999 | 0 (0.0%) | 0 (0.0%) |
| $30,000 to $34,999 | 16 (8.6%) | 0 (0.0%) |
| $35,000 to $39,999 | 0 (0.0%) | 0 (0.0%) |
| $40,000 to $44,999 | 25 (13.4%) | 29 (23.2%) |
| $45,000 to $49,999 | 0 (0.0%) | 0 (0.0%) |
| $50,000 to $54,999 | 6 (3.2%) | 0 (0.0%) |
| $55,000 to $64,999 | 9 (4.8%) | 0 (0.0%) |
| $65,000 to $74,999 | 0 (0.0%) | 0 (0.0%) |
| $75,000 to $99,999 | 0 (0.0%) | 0 (0.0%) |
| $100,000+ | 40 (21.5%) | 37 (29.6%) |
| Total | 186 (100.0%) | 125 (100.0%) |
Earnings by Sex by Educational Attainment in Sugarloaf
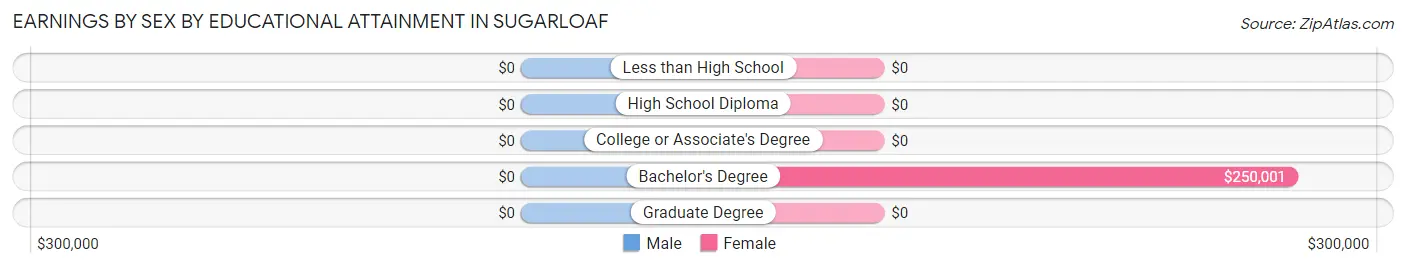
| Educational Attainment | Male Income | Female Income |
| Less than High School | - | - |
| High School Diploma | - | - |
| College or Associate's Degree | - | - |
| Bachelor's Degree | - | - |
| Graduate Degree | - | - |
| Total | - | - |
Family Income in Sugarloaf
Family Income Brackets in Sugarloaf
According to the Sugarloaf family income data, there are 72 families falling into the $75,000 to $99,999 income range, which is the most common income bracket and makes up 45.0% of all families.
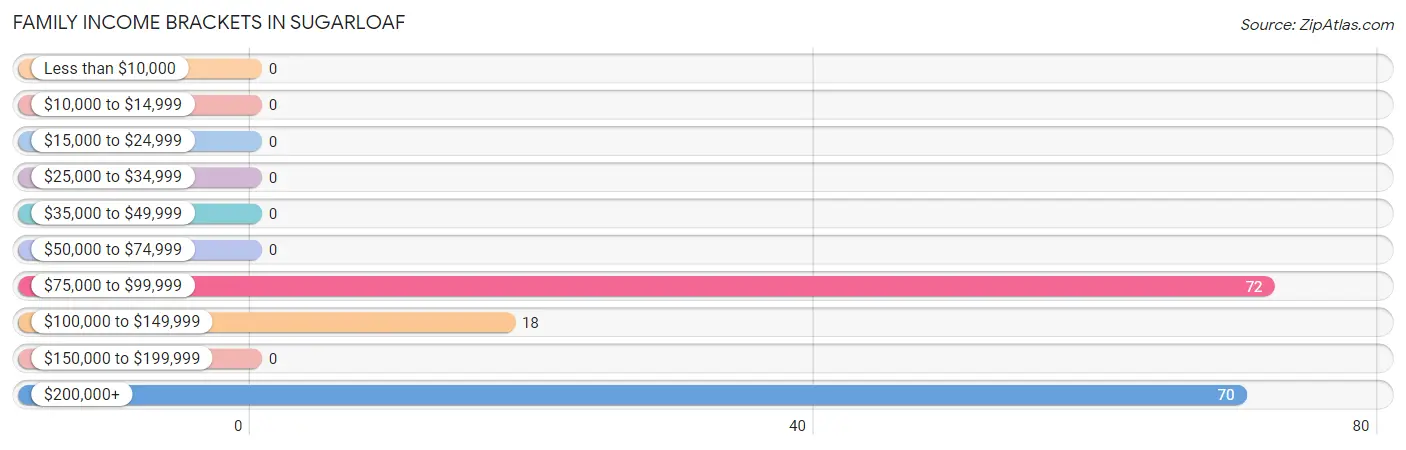
| Income Bracket | # Families | % Families |
| Less than $10,000 | 0 | 0.0% |
| $10,000 to $14,999 | 0 | 0.0% |
| $15,000 to $24,999 | 0 | 0.0% |
| $25,000 to $34,999 | 0 | 0.0% |
| $35,000 to $49,999 | 0 | 0.0% |
| $50,000 to $74,999 | 0 | 0.0% |
| $75,000 to $99,999 | 72 | 45.0% |
| $100,000 to $149,999 | 18 | 11.3% |
| $150,000 to $199,999 | 0 | 0.0% |
| $200,000+ | 70 | 43.8% |
Family Income by Famaliy Size in Sugarloaf
2-person families (101 | 63.1%) account for the highest median family income in Sugarloaf with $250,001 per family, while 2-person families (101 | 63.1%) have the highest median income of $125,000 per family member.
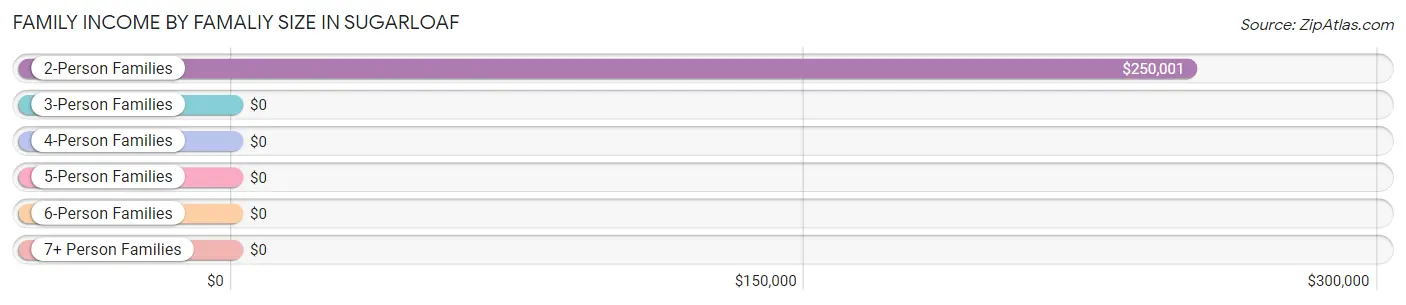
| Income Bracket | # Families | Median Income |
| 2-Person Families | 101 (63.1%) | $250,001 |
| 3-Person Families | 0 (0.0%) | $0 |
| 4-Person Families | 0 (0.0%) | $0 |
| 5-Person Families | 59 (36.9%) | $0 |
| 6-Person Families | 0 (0.0%) | $0 |
| 7+ Person Families | 0 (0.0%) | $0 |
| Total | 160 (100.0%) | $0 |
Family Income by Number of Earners in Sugarloaf
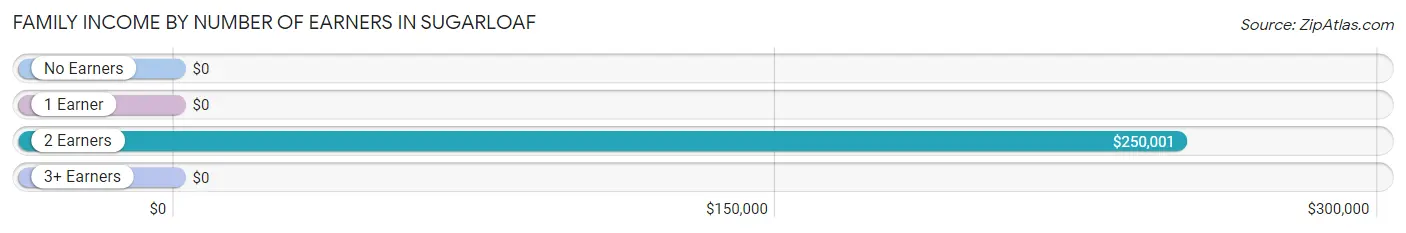
| Number of Earners | # Families | Median Income |
| No Earners | 23 (14.4%) | $0 |
| 1 Earner | 18 (11.3%) | $0 |
| 2 Earners | 60 (37.5%) | $250,001 |
| 3+ Earners | 59 (36.9%) | $0 |
| Total | 160 (100.0%) | $0 |
Household Income in Sugarloaf
Household Income Brackets in Sugarloaf
With 72 households falling in the category, the $75,000 to $99,999 income range is the most frequent in Sugarloaf, accounting for 45.0% of all households.
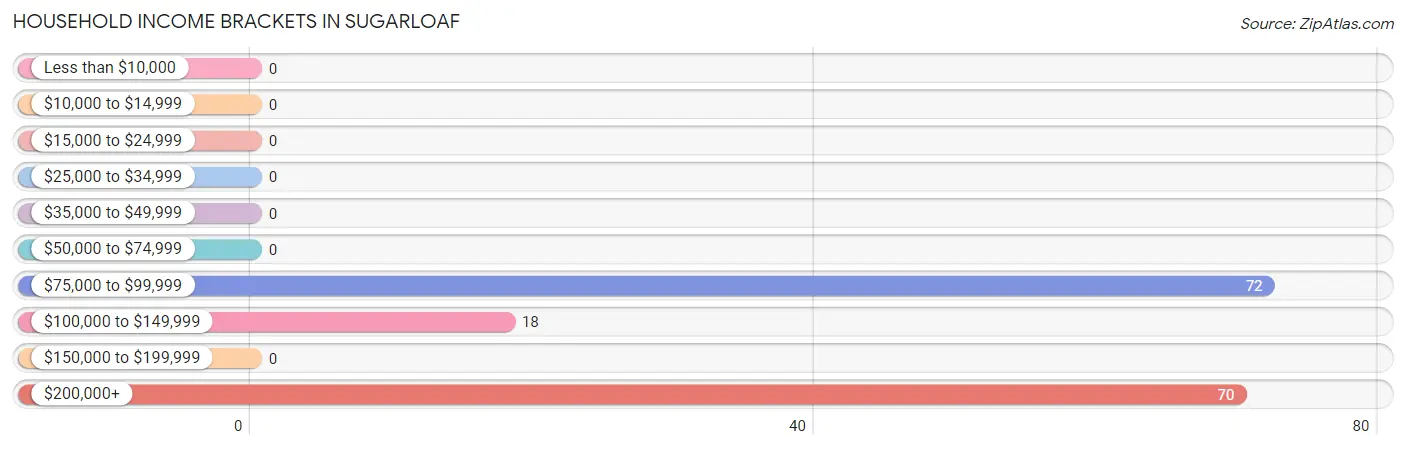
| Income Bracket | # Households | % Households |
| Less than $10,000 | 0 | 0.0% |
| $10,000 to $14,999 | 0 | 0.0% |
| $15,000 to $24,999 | 0 | 0.0% |
| $25,000 to $34,999 | 0 | 0.0% |
| $35,000 to $49,999 | 0 | 0.0% |
| $50,000 to $74,999 | 0 | 0.0% |
| $75,000 to $99,999 | 72 | 45.0% |
| $100,000 to $149,999 | 18 | 11.3% |
| $150,000 to $199,999 | 0 | 0.0% |
| $200,000+ | 70 | 43.8% |
Household Income by Householder Age in Sugarloaf
The median household income in Sugarloaf is $0, with the highest median household income of $105,781 found in the 65+ years age bracket for the primary householder. A total of 31 households (19.4%) fall into this category.
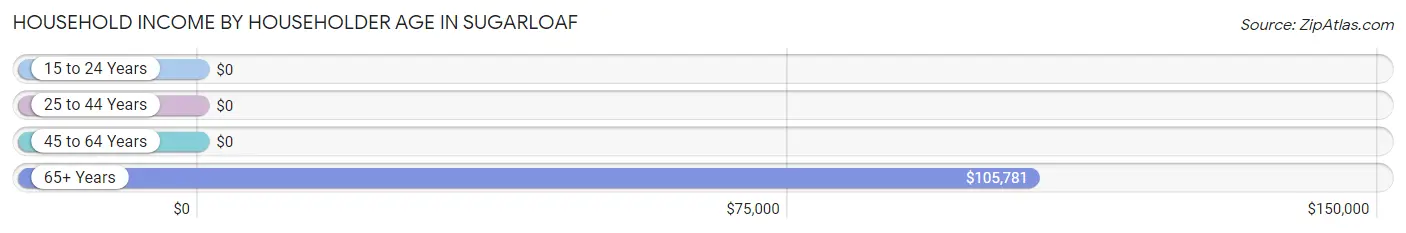
| Income Bracket | # Households | Median Income |
| 15 to 24 Years | 0 (0.0%) | $0 |
| 25 to 44 Years | 0 (0.0%) | $0 |
| 45 to 64 Years | 129 (80.6%) | $0 |
| 65+ Years | 31 (19.4%) | $105,781 |
| Total | 160 (100.0%) | $0 |
Poverty in Sugarloaf
Income Below Poverty by Sex and Age in Sugarloaf
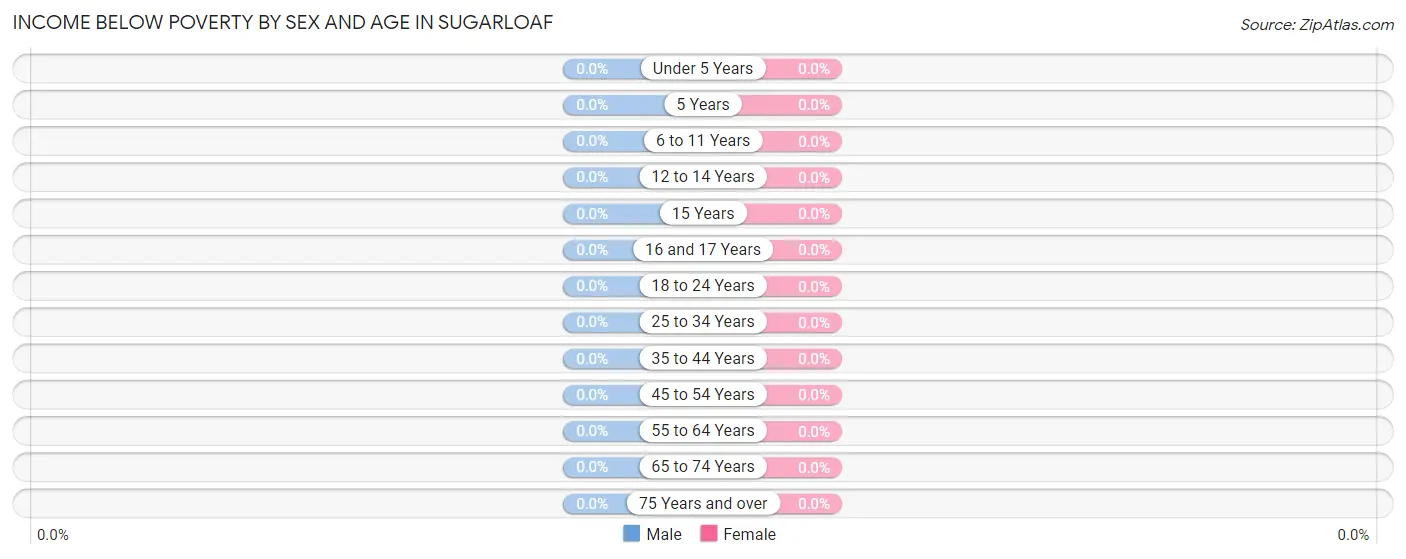
| Age Bracket | Male | Female |
| Under 5 Years | 0 (0.0%) | 0 (0.0%) |
| 5 Years | 0 (0.0%) | 0 (0.0%) |
| 6 to 11 Years | 0 (0.0%) | 0 (0.0%) |
| 12 to 14 Years | 0 (0.0%) | 0 (0.0%) |
| 15 Years | 0 (0.0%) | 0 (0.0%) |
| 16 and 17 Years | 0 (0.0%) | 0 (0.0%) |
| 18 to 24 Years | 0 (0.0%) | 0 (0.0%) |
| 25 to 34 Years | 0 (0.0%) | 0 (0.0%) |
| 35 to 44 Years | 0 (0.0%) | 0 (0.0%) |
| 45 to 54 Years | 0 (0.0%) | 0 (0.0%) |
| 55 to 64 Years | 0 (0.0%) | 0 (0.0%) |
| 65 to 74 Years | 0 (0.0%) | 0 (0.0%) |
| 75 Years and over | 0 (0.0%) | 0 (0.0%) |
| Total | 0 (0.0%) | 0 (0.0%) |
Income Above Poverty by Sex and Age in Sugarloaf
According to the poverty statistics in Sugarloaf, males aged 15 years and females aged 15 years are the age groups that are most secure financially, with 100.0% of males and 100.0% of females in these age groups living above the poverty line.
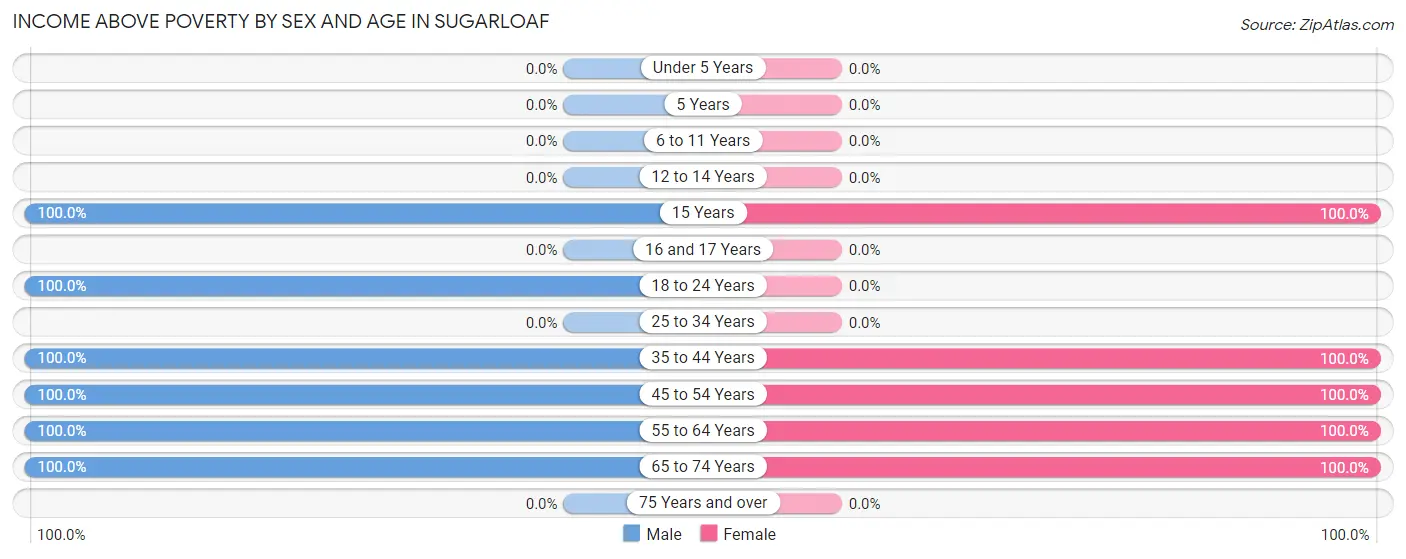
| Age Bracket | Male | Female |
| Under 5 Years | 0 (0.0%) | 0 (0.0%) |
| 5 Years | 0 (0.0%) | 0 (0.0%) |
| 6 to 11 Years | 0 (0.0%) | 0 (0.0%) |
| 12 to 14 Years | 0 (0.0%) | 0 (0.0%) |
| 15 Years | 58 (100.0%) | 62 (100.0%) |
| 16 and 17 Years | 0 (0.0%) | 0 (0.0%) |
| 18 to 24 Years | 84 (100.0%) | 0 (0.0%) |
| 25 to 34 Years | 0 (0.0%) | 0 (0.0%) |
| 35 to 44 Years | 6 (100.0%) | 7 (100.0%) |
| 45 to 54 Years | 22 (100.0%) | 89 (100.0%) |
| 55 to 64 Years | 74 (100.0%) | 43 (100.0%) |
| 65 to 74 Years | 23 (100.0%) | 33 (100.0%) |
| 75 Years and over | 0 (0.0%) | 0 (0.0%) |
| Total | 267 (100.0%) | 234 (100.0%) |
Income Below Poverty Among Married-Couple Families in Sugarloaf
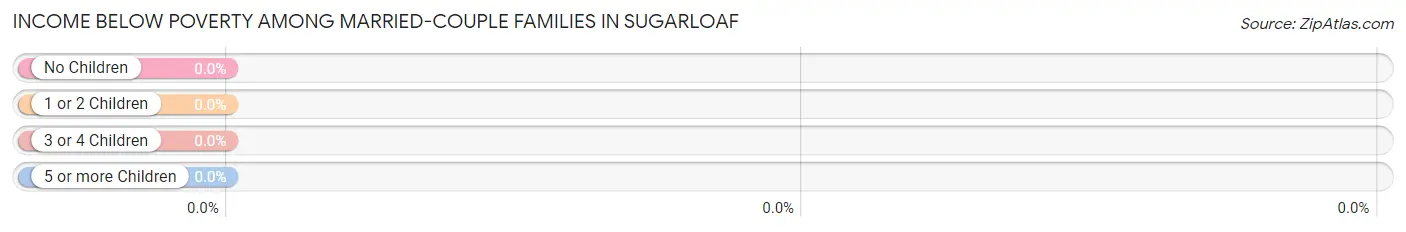
| Children | Above Poverty | Below Poverty |
| No Children | 101 (100.0%) | 0 (0.0%) |
| 1 or 2 Children | 59 (100.0%) | 0 (0.0%) |
| 3 or 4 Children | 0 (0.0%) | 0 (0.0%) |
| 5 or more Children | 0 (0.0%) | 0 (0.0%) |
| Total | 160 (100.0%) | 0 (0.0%) |
Income Below Poverty Among Single-Parent Households in Sugarloaf
| Children | Single Father | Single Mother |
| No Children | 0 (0.0%) | 0 (0.0%) |
| 1 or 2 Children | 0 (0.0%) | 0 (0.0%) |
| 3 or 4 Children | 0 (0.0%) | 0 (0.0%) |
| 5 or more Children | 0 (0.0%) | 0 (0.0%) |
| Total | 0 (0.0%) | 0 (0.0%) |
Income Below Poverty Among Married-Couple vs Single-Parent Households in Sugarloaf
| Children | Married-Couple Families | Single-Parent Households |
| No Children | 0 (0.0%) | 0 (0.0%) |
| 1 or 2 Children | 0 (0.0%) | 0 (0.0%) |
| 3 or 4 Children | 0 (0.0%) | 0 (0.0%) |
| 5 or more Children | 0 (0.0%) | 0 (0.0%) |
| Total | 0 (0.0%) | 0 (0.0%) |
Race in Sugarloaf
The most populous races in Sugarloaf are White / Caucasian (468 | 93.4%), Two or more Races (23 | 4.6%), and Native / Alaskan (10 | 2.0%).
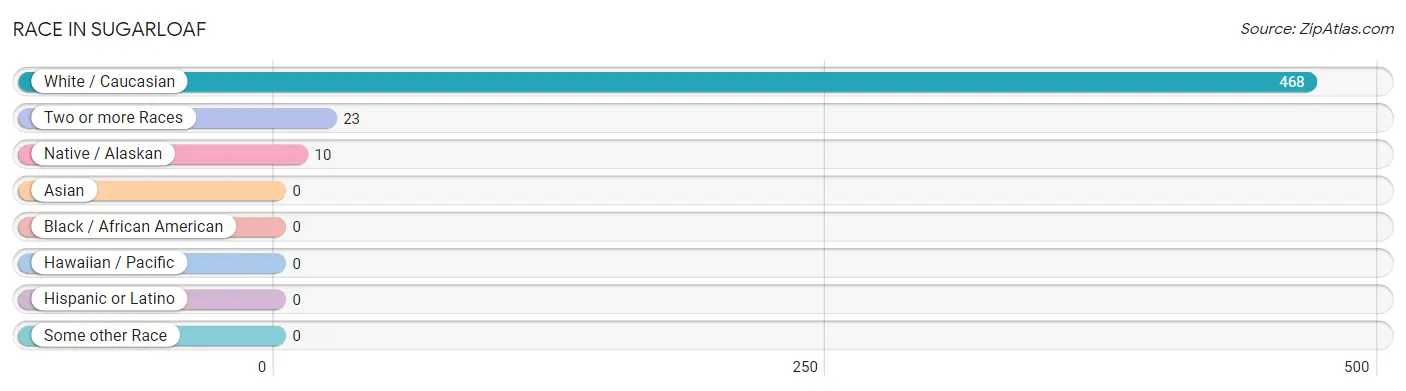
| Race | # Population | % Population |
| Asian | 0 | 0.0% |
| Black / African American | 0 | 0.0% |
| Hawaiian / Pacific | 0 | 0.0% |
| Hispanic or Latino | 0 | 0.0% |
| Native / Alaskan | 10 | 2.0% |
| White / Caucasian | 468 | 93.4% |
| Two or more Races | 23 | 4.6% |
| Some other Race | 0 | 0.0% |
| Total | 501 | 100.0% |
Ancestry in Sugarloaf
The most populous ancestries reported in Sugarloaf are English (296 | 59.1%), French (279 | 55.7%), German (59 | 11.8%), Scandinavian (27 | 5.4%), and Cherokee (26 | 5.2%), together accounting for 137.1% of all Sugarloaf residents.
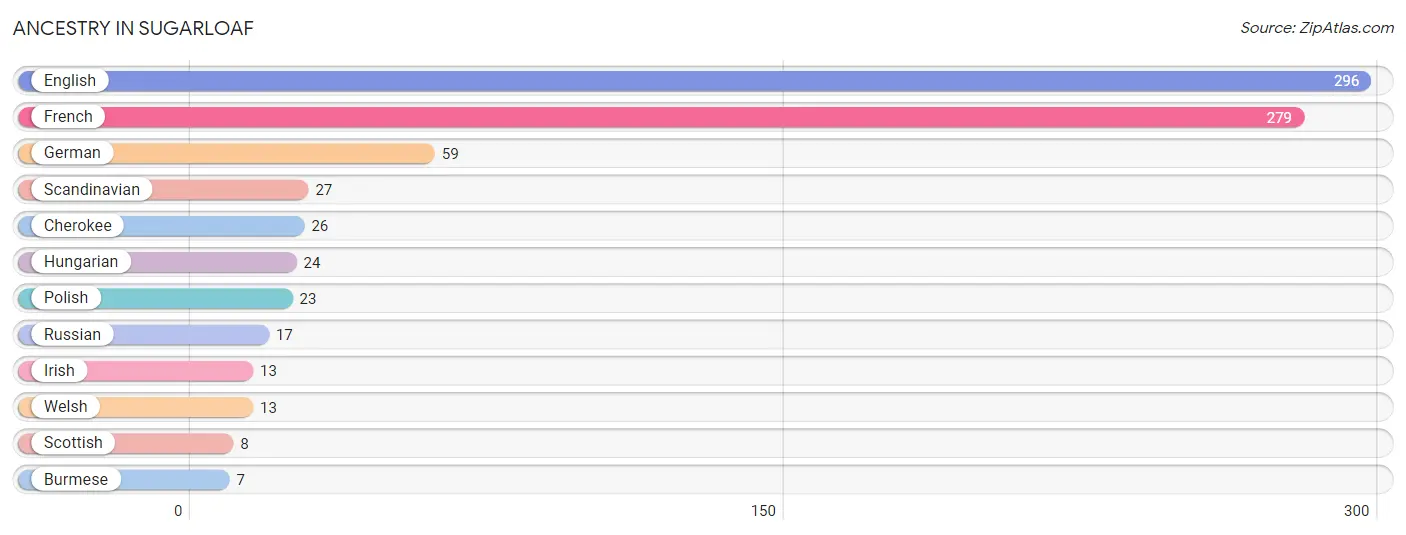
| Ancestry | # Population | % Population |
| Burmese | 7 | 1.4% |
| Cherokee | 26 | 5.2% |
| English | 296 | 59.1% |
| French | 279 | 55.7% |
| German | 59 | 11.8% |
| Hungarian | 24 | 4.8% |
| Irish | 13 | 2.6% |
| Polish | 23 | 4.6% |
| Russian | 17 | 3.4% |
| Scandinavian | 27 | 5.4% |
| Scottish | 8 | 1.6% |
| Welsh | 13 | 2.6% | View All 12 Rows |
Immigrants in Sugarloaf

| Immigration Origin | # Population | % Population | View All 0 Rows |
Sex and Age in Sugarloaf
Sex and Age in Sugarloaf
The most populous age groups in Sugarloaf are 15 to 19 Years (142 | 53.2%) for men and 50 to 54 Years (83 | 35.5%) for women.
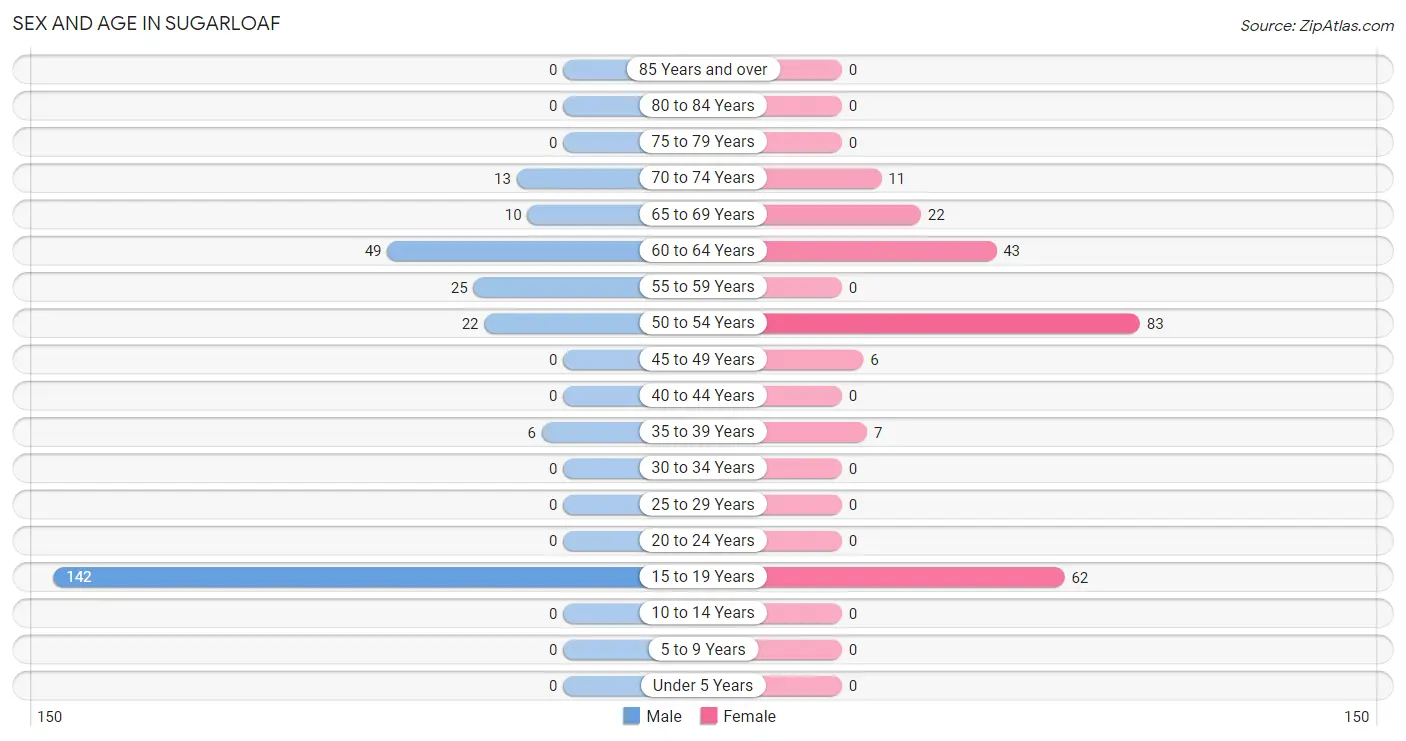
| Age Bracket | Male | Female |
| Under 5 Years | 0 (0.0%) | 0 (0.0%) |
| 5 to 9 Years | 0 (0.0%) | 0 (0.0%) |
| 10 to 14 Years | 0 (0.0%) | 0 (0.0%) |
| 15 to 19 Years | 142 (53.2%) | 62 (26.5%) |
| 20 to 24 Years | 0 (0.0%) | 0 (0.0%) |
| 25 to 29 Years | 0 (0.0%) | 0 (0.0%) |
| 30 to 34 Years | 0 (0.0%) | 0 (0.0%) |
| 35 to 39 Years | 6 (2.2%) | 7 (3.0%) |
| 40 to 44 Years | 0 (0.0%) | 0 (0.0%) |
| 45 to 49 Years | 0 (0.0%) | 6 (2.6%) |
| 50 to 54 Years | 22 (8.2%) | 83 (35.5%) |
| 55 to 59 Years | 25 (9.4%) | 0 (0.0%) |
| 60 to 64 Years | 49 (18.3%) | 43 (18.4%) |
| 65 to 69 Years | 10 (3.7%) | 22 (9.4%) |
| 70 to 74 Years | 13 (4.9%) | 11 (4.7%) |
| 75 to 79 Years | 0 (0.0%) | 0 (0.0%) |
| 80 to 84 Years | 0 (0.0%) | 0 (0.0%) |
| 85 Years and over | 0 (0.0%) | 0 (0.0%) |
| Total | 267 (100.0%) | 234 (100.0%) |
Families and Households in Sugarloaf
Median Family Size in Sugarloaf
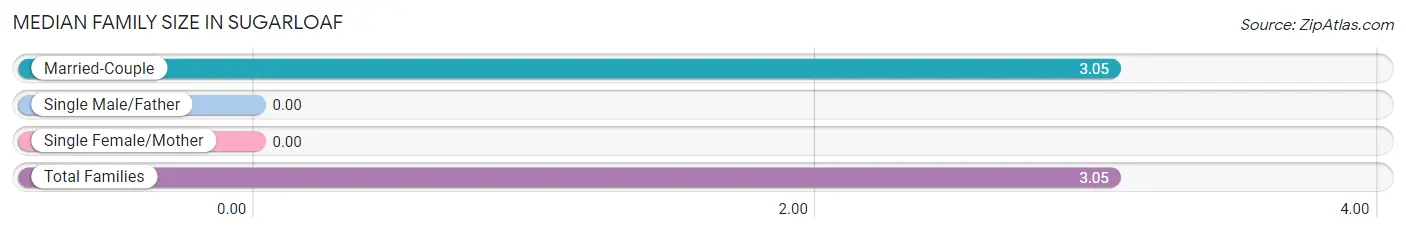
| Family Type | # Families | Family Size |
| Married-Couple | 160 (100.0%) | 3.05 |
| Single Male/Father | 0 (0.0%) | - |
| Single Female/Mother | 0 (0.0%) | - |
| Total Families | 160 (100.0%) | 3.05 |
Median Household Size in Sugarloaf
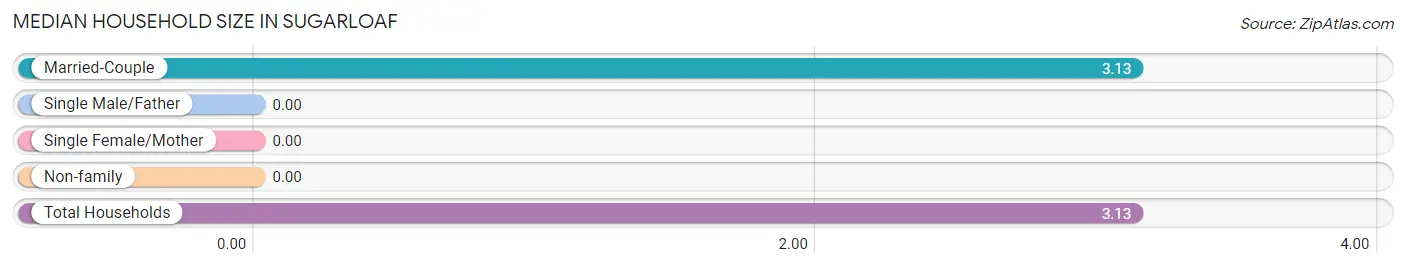
| Household Type | # Households | Household Size |
| Married-Couple | 160 (100.0%) | 3.13 |
| Single Male/Father | 0 (0.0%) | - |
| Single Female/Mother | 0 (0.0%) | - |
| Non-family | 0 (0.0%) | - |
| Total Households | 160 (100.0%) | 3.13 |
Household Size by Marriage Status in Sugarloaf
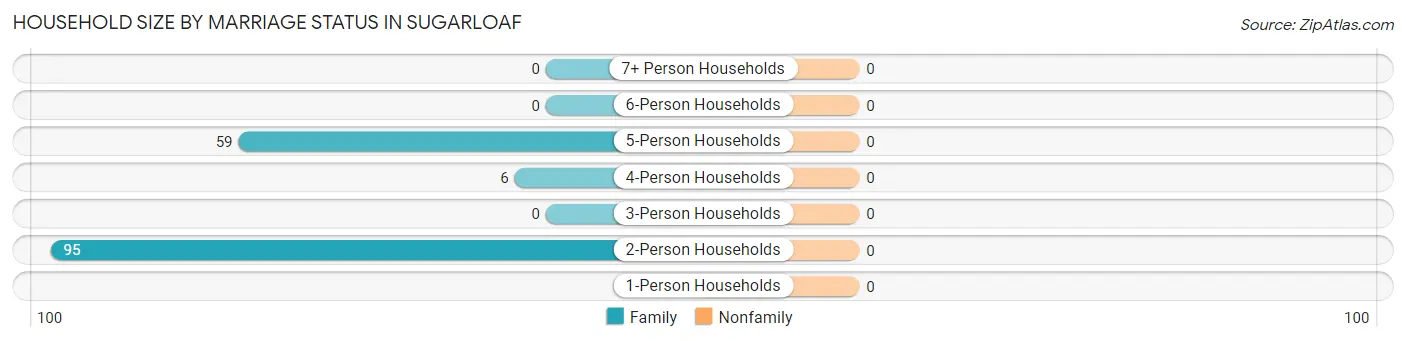
| Household Size | Family Households | Nonfamily Households |
| 1-Person Households | - | 0 (0.0%) |
| 2-Person Households | 95 (59.4%) | 0 (0.0%) |
| 3-Person Households | 0 (0.0%) | 0 (0.0%) |
| 4-Person Households | 6 (3.7%) | 0 (0.0%) |
| 5-Person Households | 59 (36.9%) | 0 (0.0%) |
| 6-Person Households | 0 (0.0%) | 0 (0.0%) |
| 7+ Person Households | 0 (0.0%) | 0 (0.0%) |
| Total | 160 (100.0%) | 0 (0.0%) |
Female Fertility in Sugarloaf
Fertility by Age in Sugarloaf
| Age Bracket | Women with Births | Births / 1,000 Women |
| 15 to 19 years | 0 (0.0%) | 0.0 |
| 20 to 34 years | 0 (0.0%) | 0.0 |
| 35 to 50 years | 0 (0.0%) | 0.0 |
| Total | 0 (0.0%) | 0.0 |
Fertility by Age by Marriage Status in Sugarloaf
| Age Bracket | Married | Unmarried |
| 15 to 19 years | 0 (0.0%) | 0 (0.0%) |
| 20 to 34 years | 0 (0.0%) | 0 (0.0%) |
| 35 to 50 years | 0 (0.0%) | 0 (0.0%) |
| Total | 0 (0.0%) | 0 (0.0%) |
Fertility by Education in Sugarloaf
| Educational Attainment | Women with Births | Births / 1,000 Women |
| Less than High School | 0 (0.0%) | 0.0 |
| High School Diploma | 0 (0.0%) | 0.0 |
| College or Associate's Degree | 0 (0.0%) | 0.0 |
| Bachelor's Degree | 0 (0.0%) | 0.0 |
| Graduate Degree | 0 (0.0%) | 0.0 |
| Total | 0 (0.0%) | 0.0 |
Fertility by Education by Marriage Status in Sugarloaf
| Educational Attainment | Married | Unmarried |
| Less than High School | 0 (0.0%) | 0 (0.0%) |
| High School Diploma | 0 (0.0%) | 0 (0.0%) |
| College or Associate's Degree | 0 (0.0%) | 0 (0.0%) |
| Bachelor's Degree | 0 (0.0%) | 0 (0.0%) |
| Graduate Degree | 0 (0.0%) | 0 (0.0%) |
| Total | 0 (0.0%) | 0 (0.0%) |
Employment Characteristics in Sugarloaf
Employment by Class of Employer in Sugarloaf
Among the 280 employed individuals in Sugarloaf, private company employees (157 | 56.1%), self-employed (not incorporated) (59 | 21.1%), and self-employed (incorporated) (32 | 11.4%) make up the most common classes of employment.
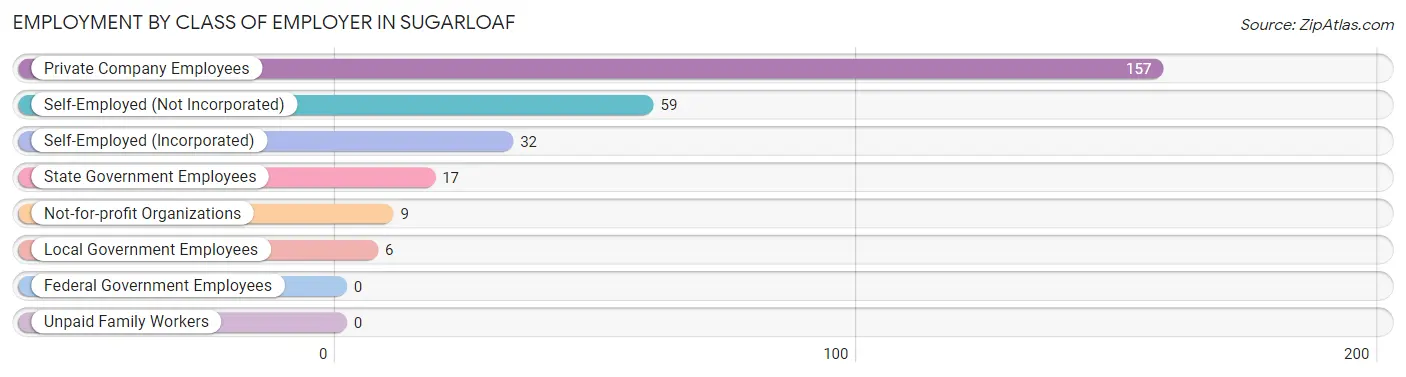
| Employer Class | # Employees | % Employees |
| Private Company Employees | 157 | 56.1% |
| Self-Employed (Incorporated) | 32 | 11.4% |
| Self-Employed (Not Incorporated) | 59 | 21.1% |
| Not-for-profit Organizations | 9 | 3.2% |
| Local Government Employees | 6 | 2.1% |
| State Government Employees | 17 | 6.1% |
| Federal Government Employees | 0 | 0.0% |
| Unpaid Family Workers | 0 | 0.0% |
| Total | 280 | 100.0% |
Employment Status by Age in Sugarloaf
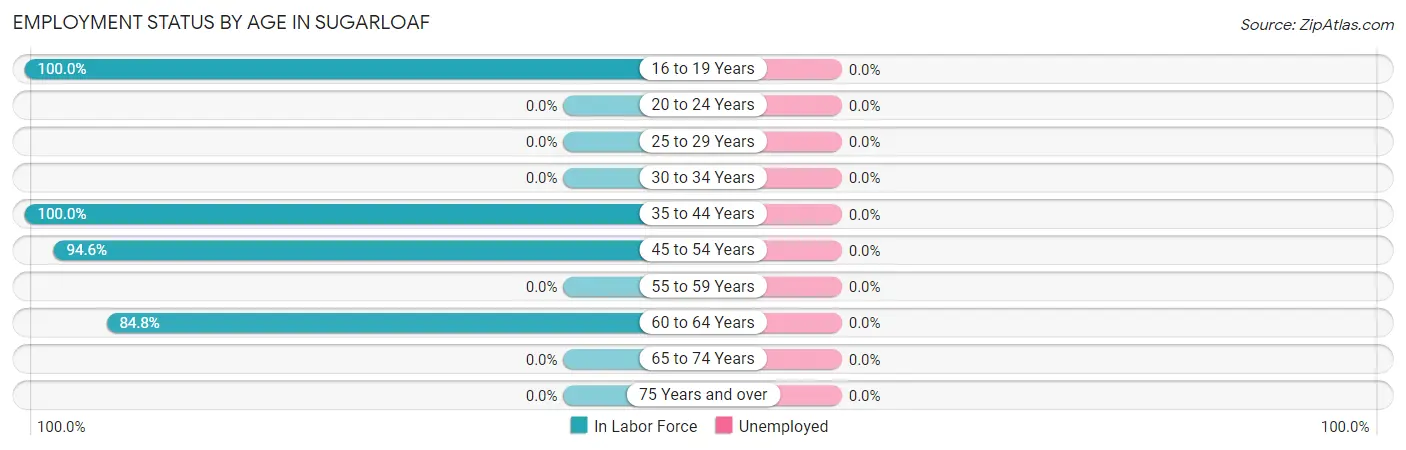
| Age Bracket | In Labor Force | Unemployed |
| 16 to 19 Years | 84 (100.0%) | 0 (0.0%) |
| 20 to 24 Years | 0 (0.0%) | 0 (0.0%) |
| 25 to 29 Years | 0 (0.0%) | 0 (0.0%) |
| 30 to 34 Years | 0 (0.0%) | 0 (0.0%) |
| 35 to 44 Years | 13 (100.0%) | 0 (0.0%) |
| 45 to 54 Years | 105 (94.6%) | 0 (0.0%) |
| 55 to 59 Years | 0 (0.0%) | 0 (0.0%) |
| 60 to 64 Years | 78 (84.8%) | 0 (0.0%) |
| 65 to 74 Years | 0 (0.0%) | 0 (0.0%) |
| 75 Years and over | 0 (0.0%) | 0 (0.0%) |
| Total | 280 (73.5%) | 0 (0.0%) |
Employment Status by Educational Attainment in Sugarloaf
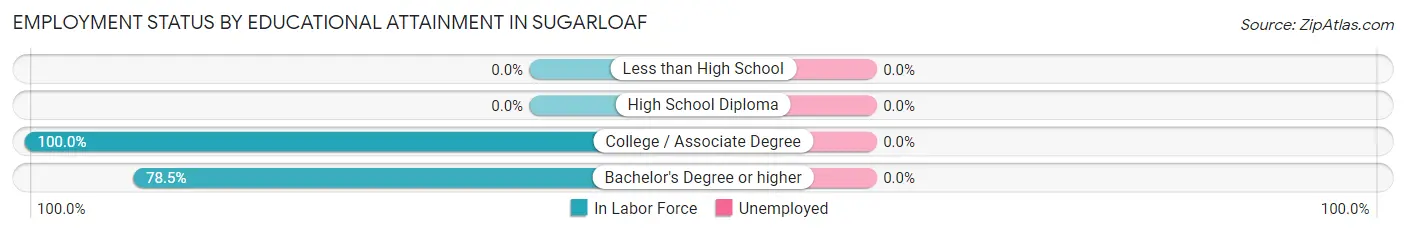
| Educational Attainment | In Labor Force | Unemployed |
| Less than High School | 0 (0.0%) | 0 (0.0%) |
| High School Diploma | 0 (0.0%) | 0 (0.0%) |
| College / Associate Degree | 32 (100.0%) | 0 (0.0%) |
| Bachelor's Degree or higher | 164 (78.5%) | 0 (0.0%) |
| Total | 196 (81.3%) | 0 (0.0%) |
Employment Occupations by Sex in Sugarloaf
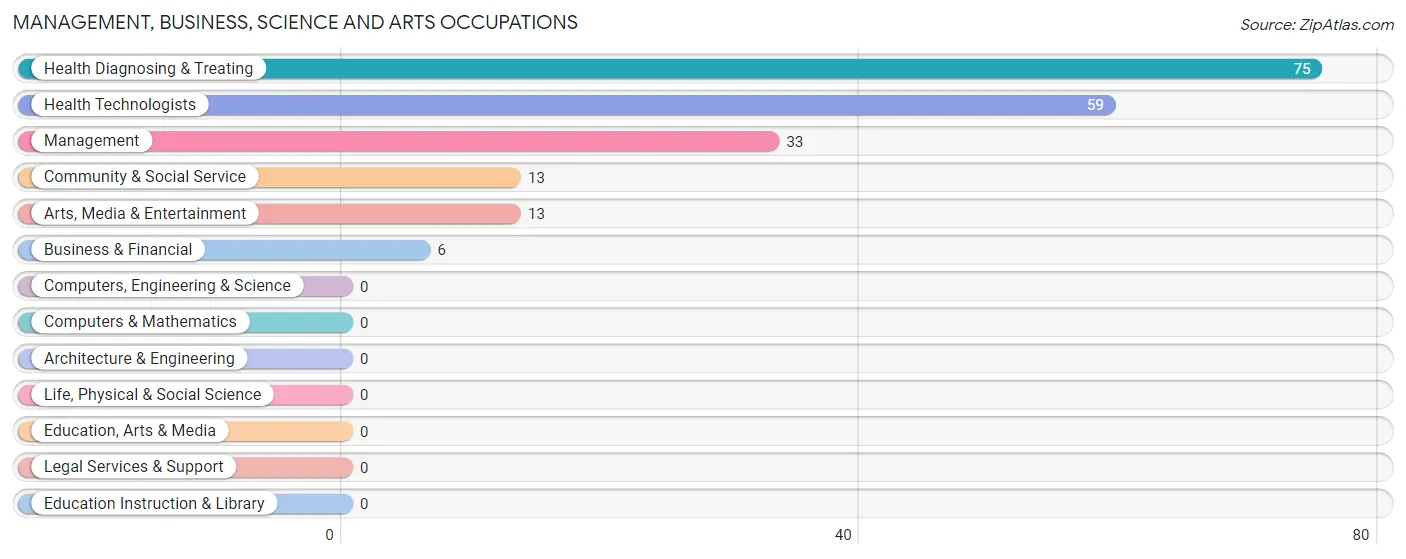
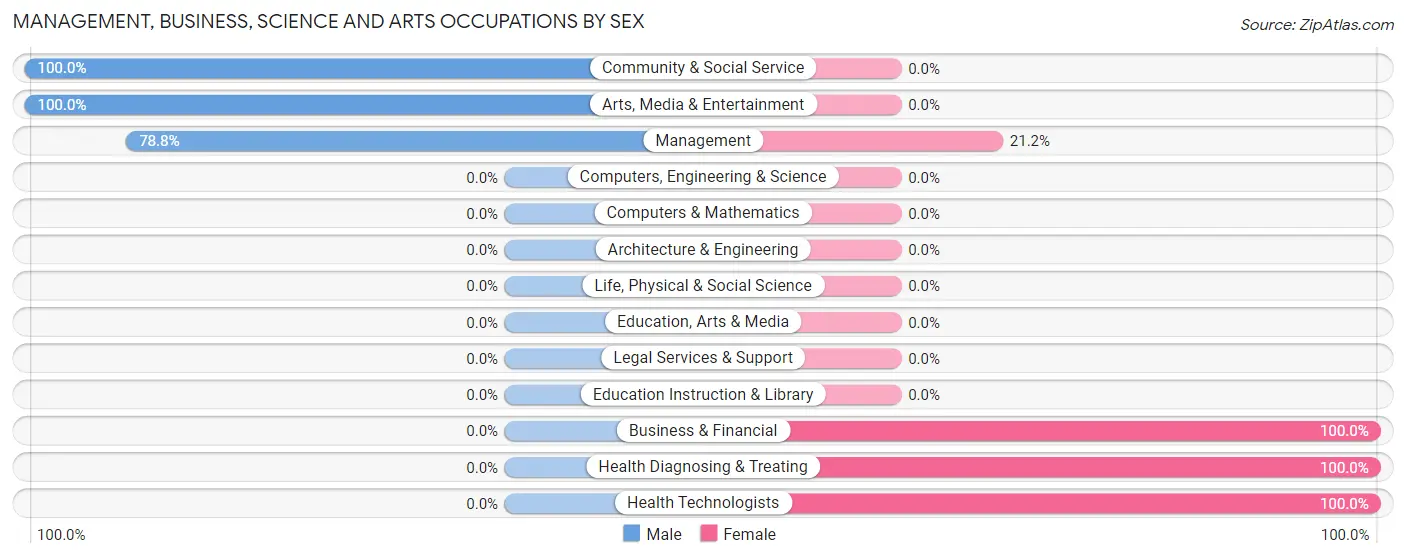
Management, Business, Science and Arts Occupations
The most common Management, Business, Science and Arts occupations in Sugarloaf are Health Diagnosing & Treating (75 | 26.8%), Health Technologists (59 | 21.1%), Management (33 | 11.8%), Community & Social Service (13 | 4.6%), and Arts, Media & Entertainment (13 | 4.6%).
Management, Business, Science and Arts Occupations by Sex
Within the Management, Business, Science and Arts occupations in Sugarloaf, the most male-oriented occupations are Community & Social Service (100.0%), Arts, Media & Entertainment (100.0%), and Management (78.8%), while the most female-oriented occupations are Business & Financial (100.0%), Health Diagnosing & Treating (100.0%), and Health Technologists (100.0%).
| Occupation | Male | Female |
| Management | 26 (78.8%) | 7 (21.2%) |
| Business & Financial | 0 (0.0%) | 6 (100.0%) |
| Computers, Engineering & Science | 0 (0.0%) | 0 (0.0%) |
| Computers & Mathematics | 0 (0.0%) | 0 (0.0%) |
| Architecture & Engineering | 0 (0.0%) | 0 (0.0%) |
| Life, Physical & Social Science | 0 (0.0%) | 0 (0.0%) |
| Community & Social Service | 13 (100.0%) | 0 (0.0%) |
| Education, Arts & Media | 0 (0.0%) | 0 (0.0%) |
| Legal Services & Support | 0 (0.0%) | 0 (0.0%) |
| Education Instruction & Library | 0 (0.0%) | 0 (0.0%) |
| Arts, Media & Entertainment | 13 (100.0%) | 0 (0.0%) |
| Health Diagnosing & Treating | 0 (0.0%) | 75 (100.0%) |
| Health Technologists | 0 (0.0%) | 59 (100.0%) |
| Total (Category) | 39 (30.7%) | 88 (69.3%) |
| Total (Overall) | 155 (55.4%) | 125 (44.6%) |
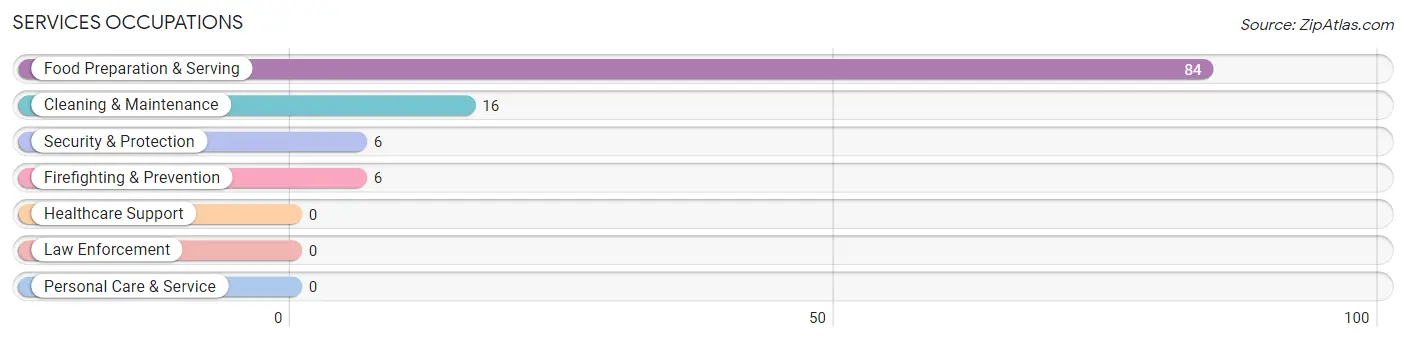
Services Occupations
The most common Services occupations in Sugarloaf are Food Preparation & Serving (84 | 30.0%), Cleaning & Maintenance (16 | 5.7%), Security & Protection (6 | 2.1%), and Firefighting & Prevention (6 | 2.1%).
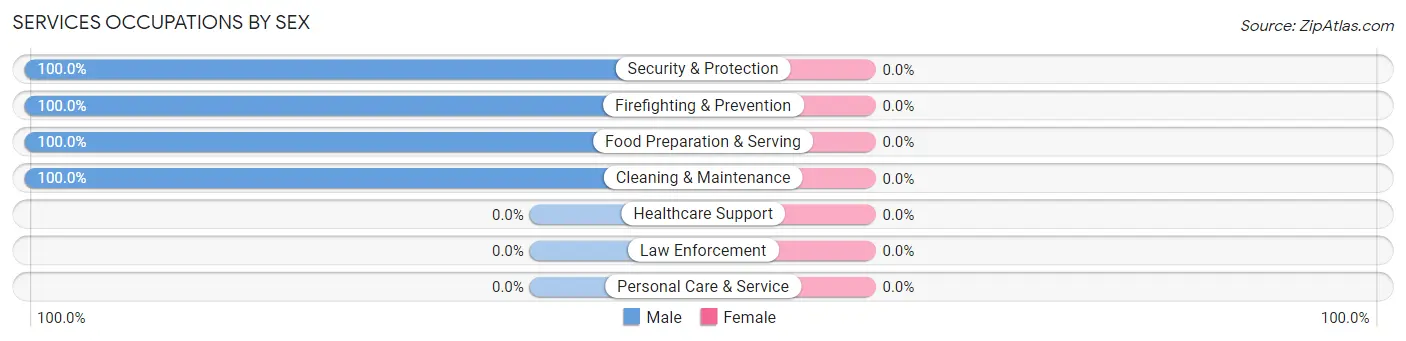
Services Occupations by Sex
| Occupation | Male | Female |
| Healthcare Support | 0 (0.0%) | 0 (0.0%) |
| Security & Protection | 6 (100.0%) | 0 (0.0%) |
| Firefighting & Prevention | 6 (100.0%) | 0 (0.0%) |
| Law Enforcement | 0 (0.0%) | 0 (0.0%) |
| Food Preparation & Serving | 84 (100.0%) | 0 (0.0%) |
| Cleaning & Maintenance | 16 (100.0%) | 0 (0.0%) |
| Personal Care & Service | 0 (0.0%) | 0 (0.0%) |
| Total (Category) | 106 (100.0%) | 0 (0.0%) |
| Total (Overall) | 155 (55.4%) | 125 (44.6%) |
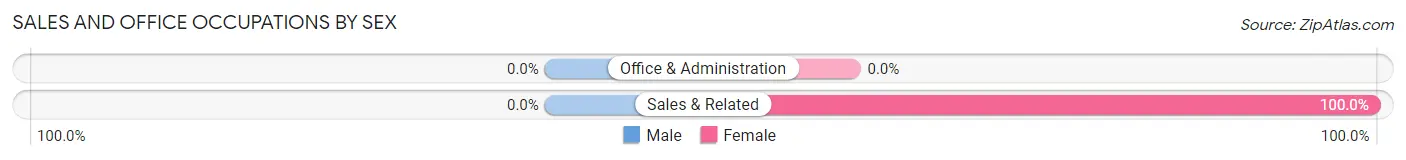
Sales and Office Occupations
The most common Sales and Office occupations in Sugarloaf are , and Sales & Related (24 | 8.6%).
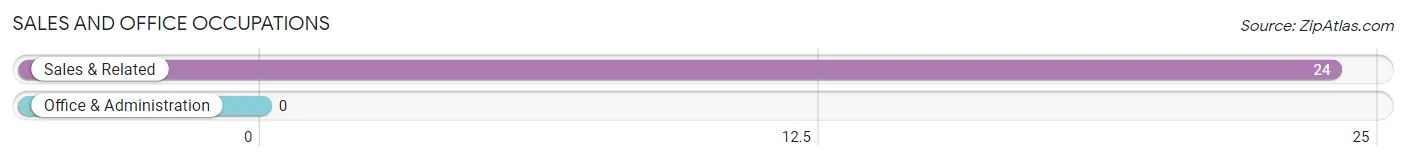
Sales and Office Occupations by Sex
| Occupation | Male | Female |
| Sales & Related | 0 (0.0%) | 24 (100.0%) |
| Office & Administration | 0 (0.0%) | 0 (0.0%) |
| Total (Category) | 0 (0.0%) | 24 (100.0%) |
| Total (Overall) | 155 (55.4%) | 125 (44.6%) |
Natural Resources, Construction and Maintenance Occupations
Natural Resources, Construction and Maintenance Occupations by Sex
| Occupation | Male | Female |
| Farming, Fishing & Forestry | 0 (0.0%) | 0 (0.0%) |
| Construction & Extraction | 0 (0.0%) | 0 (0.0%) |
| Installation, Maintenance & Repair | 0 (0.0%) | 0 (0.0%) |
| Total (Category) | 0 (0.0%) | 0 (0.0%) |
| Total (Overall) | 155 (55.4%) | 125 (44.6%) |
Production, Transportation and Moving Occupations
The most common Production, Transportation and Moving occupations in Sugarloaf are , and Transportation (23 | 8.2%).
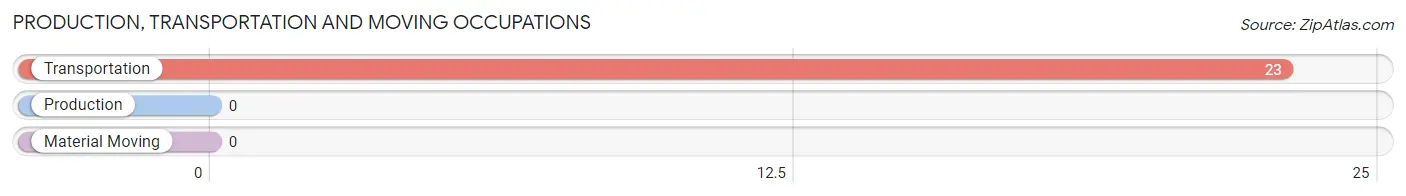
Production, Transportation and Moving Occupations by Sex
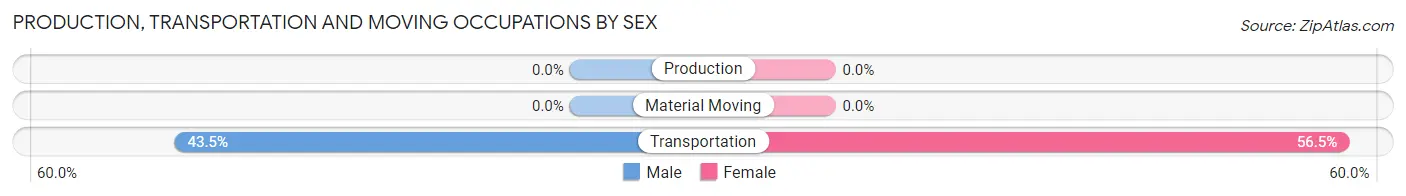
| Occupation | Male | Female |
| Production | 0 (0.0%) | 0 (0.0%) |
| Transportation | 10 (43.5%) | 13 (56.5%) |
| Material Moving | 0 (0.0%) | 0 (0.0%) |
| Total (Category) | 10 (43.5%) | 13 (56.5%) |
| Total (Overall) | 155 (55.4%) | 125 (44.6%) |
Employment Industries by Sex in Sugarloaf
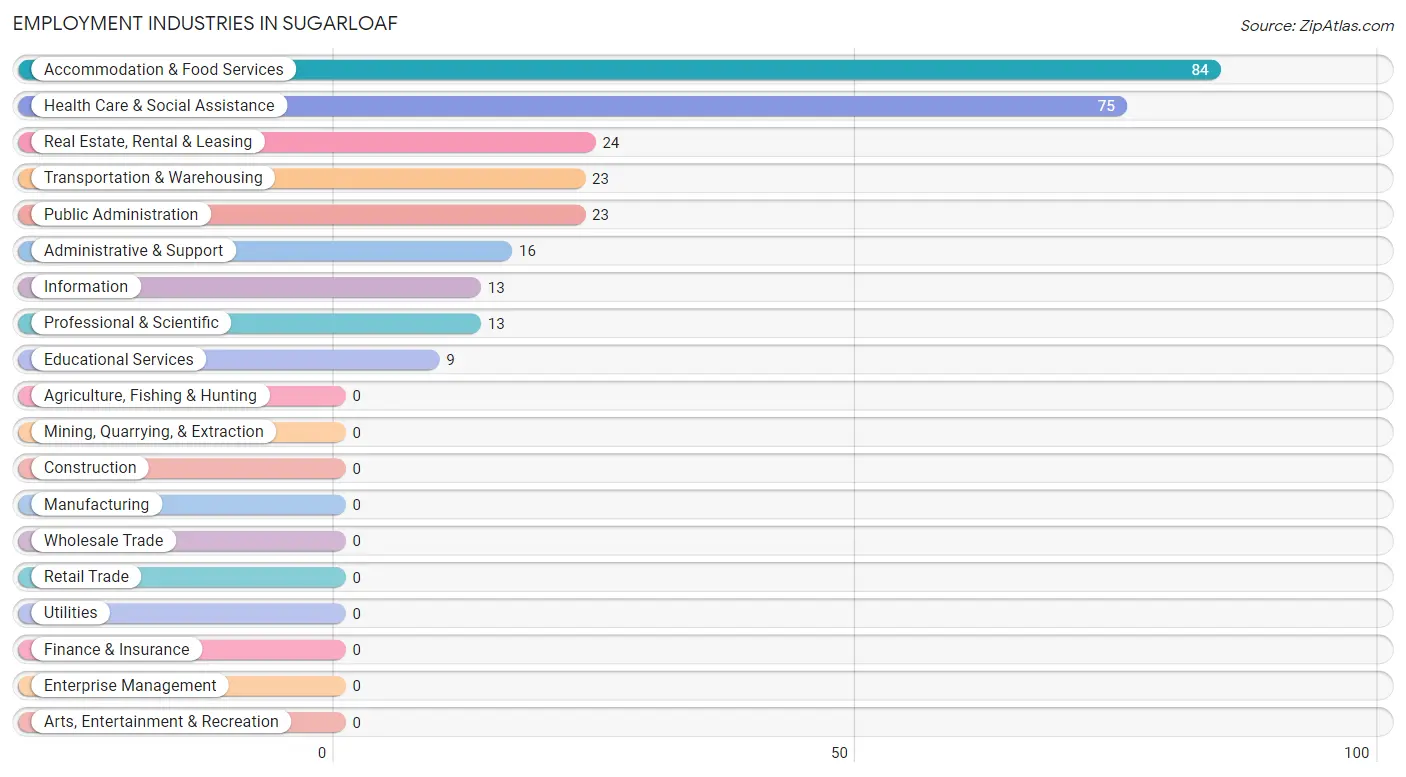
Employment Industries in Sugarloaf
The major employment industries in Sugarloaf include Accommodation & Food Services (84 | 30.0%), Health Care & Social Assistance (75 | 26.8%), Real Estate, Rental & Leasing (24 | 8.6%), Transportation & Warehousing (23 | 8.2%), and Public Administration (23 | 8.2%).
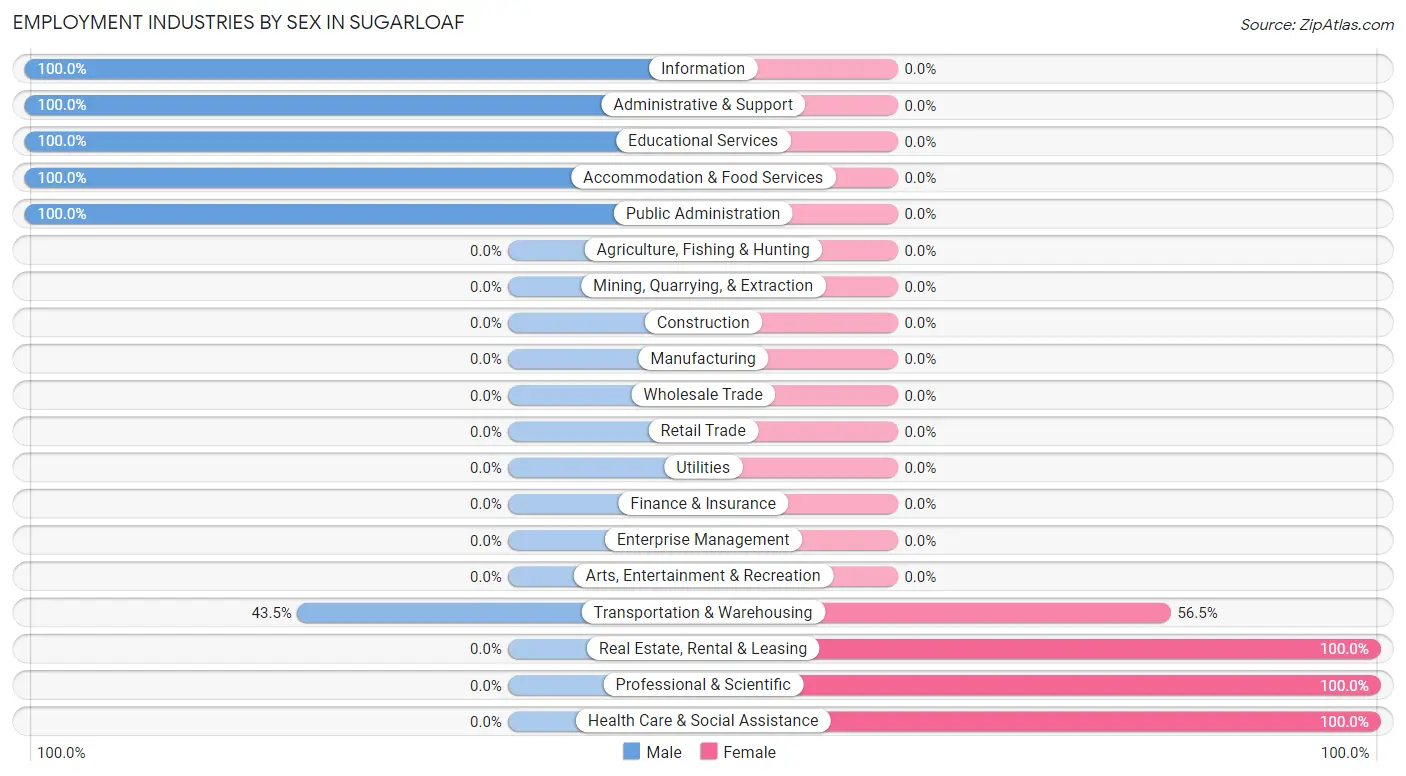
Employment Industries by Sex in Sugarloaf
The Sugarloaf industries that see more men than women are Information (100.0%), Administrative & Support (100.0%), and Educational Services (100.0%), whereas the industries that tend to have a higher number of women are Real Estate, Rental & Leasing (100.0%), Professional & Scientific (100.0%), and Health Care & Social Assistance (100.0%).
| Industry | Male | Female |
| Agriculture, Fishing & Hunting | 0 (0.0%) | 0 (0.0%) |
| Mining, Quarrying, & Extraction | 0 (0.0%) | 0 (0.0%) |
| Construction | 0 (0.0%) | 0 (0.0%) |
| Manufacturing | 0 (0.0%) | 0 (0.0%) |
| Wholesale Trade | 0 (0.0%) | 0 (0.0%) |
| Retail Trade | 0 (0.0%) | 0 (0.0%) |
| Transportation & Warehousing | 10 (43.5%) | 13 (56.5%) |
| Utilities | 0 (0.0%) | 0 (0.0%) |
| Information | 13 (100.0%) | 0 (0.0%) |
| Finance & Insurance | 0 (0.0%) | 0 (0.0%) |
| Real Estate, Rental & Leasing | 0 (0.0%) | 24 (100.0%) |
| Professional & Scientific | 0 (0.0%) | 13 (100.0%) |
| Enterprise Management | 0 (0.0%) | 0 (0.0%) |
| Administrative & Support | 16 (100.0%) | 0 (0.0%) |
| Educational Services | 9 (100.0%) | 0 (0.0%) |
| Health Care & Social Assistance | 0 (0.0%) | 75 (100.0%) |
| Arts, Entertainment & Recreation | 0 (0.0%) | 0 (0.0%) |
| Accommodation & Food Services | 84 (100.0%) | 0 (0.0%) |
| Public Administration | 23 (100.0%) | 0 (0.0%) |
| Total | 155 (55.4%) | 125 (44.6%) |
Education in Sugarloaf
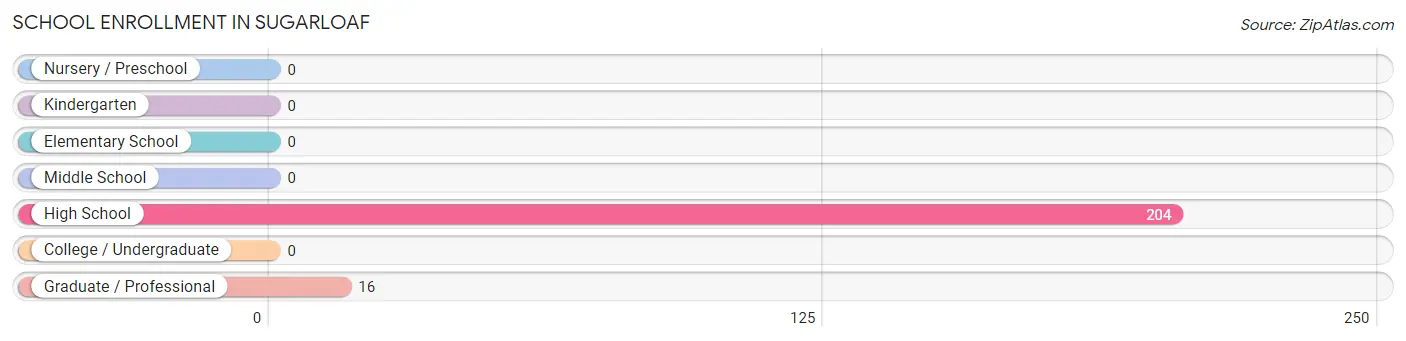
School Enrollment in Sugarloaf
The most common levels of schooling among the 220 students in Sugarloaf are high school (204 | 92.7%), and graduate / professional (16 | 7.3%).
| School Level | # Students | % Students |
| Nursery / Preschool | 0 | 0.0% |
| Kindergarten | 0 | 0.0% |
| Elementary School | 0 | 0.0% |
| Middle School | 0 | 0.0% |
| High School | 204 | 92.7% |
| College / Undergraduate | 0 | 0.0% |
| Graduate / Professional | 16 | 7.3% |
| Total | 220 | 100.0% |
School Enrollment by Age by Funding Source in Sugarloaf
Out of a total of 220 students who are enrolled in schools in Sugarloaf, 7 (3.2%) attend a private institution, while the remaining 213 (96.8%) are enrolled in public schools. The age group of 35 years and over has the highest likelihood of being enrolled in private schools, with 7 (43.8% in the age bracket) enrolled. Conversely, the age group of 15 to 17 year olds has the lowest likelihood of being enrolled in a private school, with 120 (100.0% in the age bracket) attending a public institution.
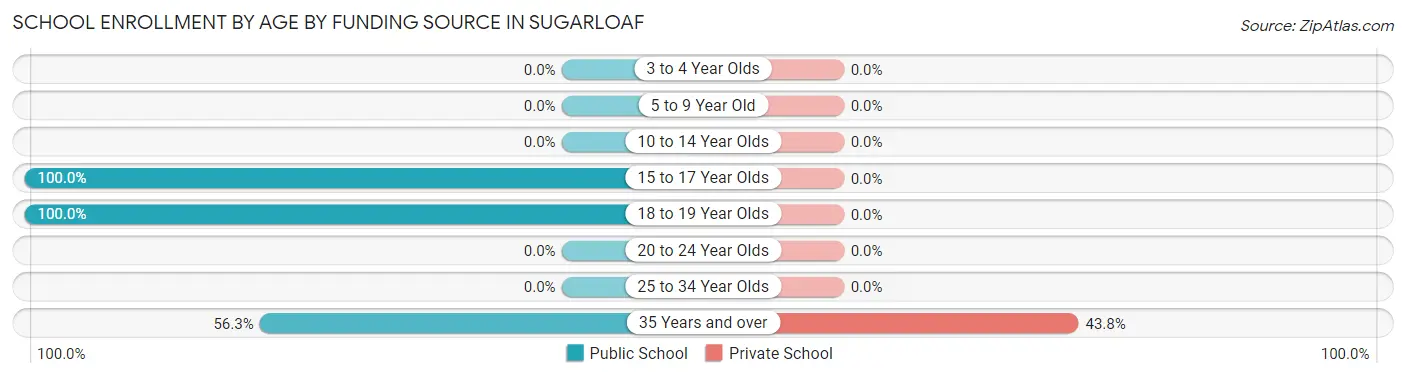
| Age Bracket | Public School | Private School |
| 3 to 4 Year Olds | 0 (0.0%) | 0 (0.0%) |
| 5 to 9 Year Old | 0 (0.0%) | 0 (0.0%) |
| 10 to 14 Year Olds | 0 (0.0%) | 0 (0.0%) |
| 15 to 17 Year Olds | 120 (100.0%) | 0 (0.0%) |
| 18 to 19 Year Olds | 84 (100.0%) | 0 (0.0%) |
| 20 to 24 Year Olds | 0 (0.0%) | 0 (0.0%) |
| 25 to 34 Year Olds | 0 (0.0%) | 0 (0.0%) |
| 35 Years and over | 9 (56.2%) | 7 (43.8%) |
| Total | 213 (96.8%) | 7 (3.2%) |
Educational Attainment by Field of Study in Sugarloaf
Psychology (74 | 26.4%), business (65 | 23.2%), education (25 | 8.9%), arts & humanities (25 | 8.9%), and literature & languages (22 | 7.9%) are the most common fields of study among 280 individuals in Sugarloaf who have obtained a bachelor's degree or higher.
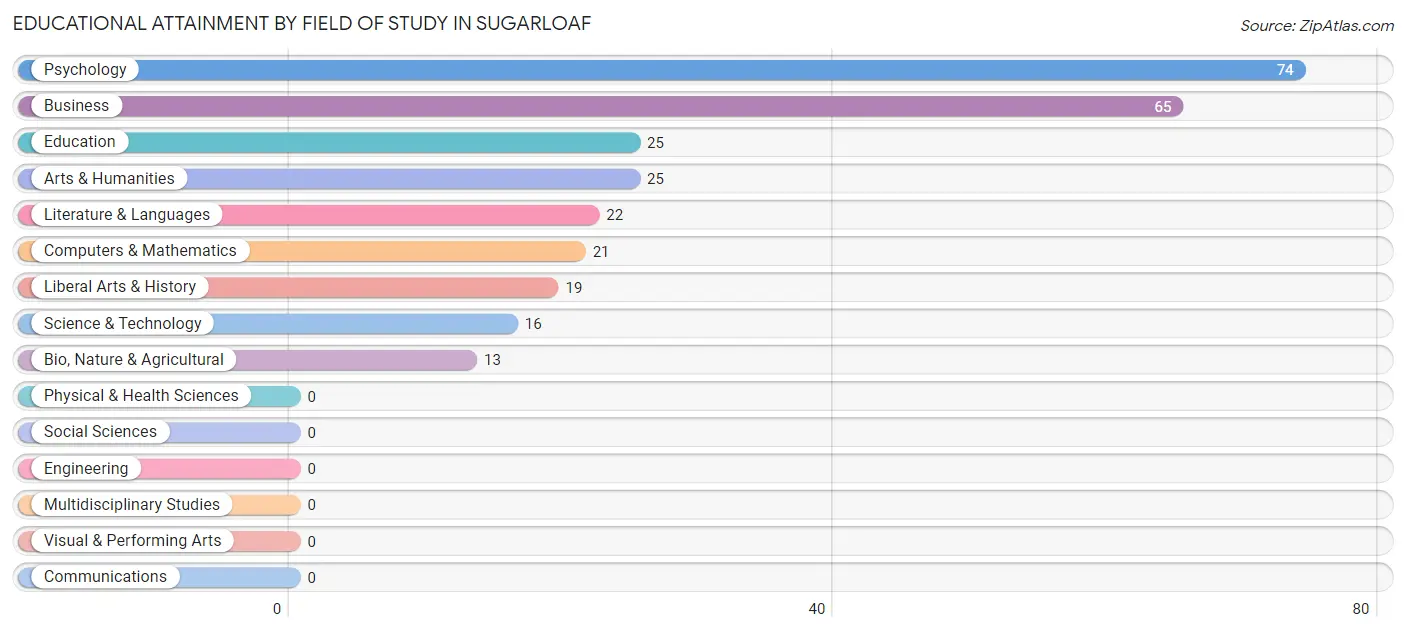
| Field of Study | # Graduates | % Graduates |
| Computers & Mathematics | 21 | 7.5% |
| Bio, Nature & Agricultural | 13 | 4.6% |
| Physical & Health Sciences | 0 | 0.0% |
| Psychology | 74 | 26.4% |
| Social Sciences | 0 | 0.0% |
| Engineering | 0 | 0.0% |
| Multidisciplinary Studies | 0 | 0.0% |
| Science & Technology | 16 | 5.7% |
| Business | 65 | 23.2% |
| Education | 25 | 8.9% |
| Literature & Languages | 22 | 7.9% |
| Liberal Arts & History | 19 | 6.8% |
| Visual & Performing Arts | 0 | 0.0% |
| Communications | 0 | 0.0% |
| Arts & Humanities | 25 | 8.9% |
| Total | 280 | 100.0% |
Transportation & Commute in Sugarloaf
Vehicle Availability by Sex in Sugarloaf
The most prevalent vehicle ownership categories in Sugarloaf are males with 5 or more vehicles (106, accounting for 68.4%) and females with 5 or more vehicles (72, making up 84.8%).
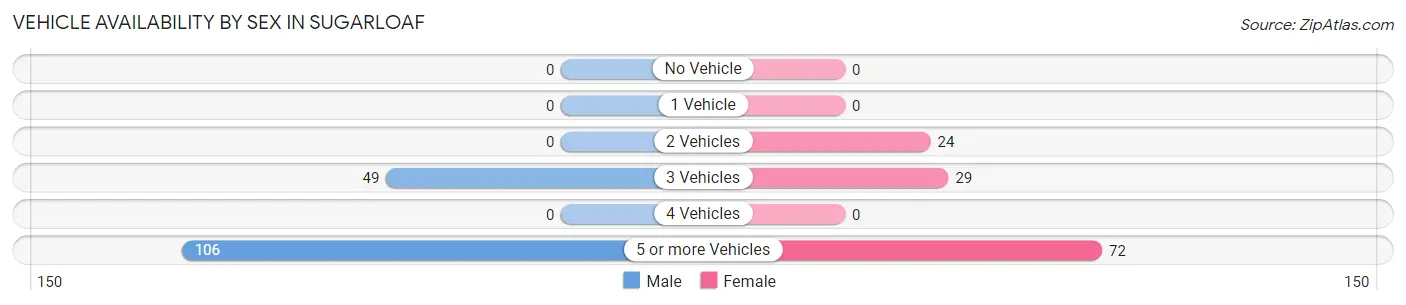
| Vehicles Available | Male | Female |
| No Vehicle | 0 (0.0%) | 0 (0.0%) |
| 1 Vehicle | 0 (0.0%) | 0 (0.0%) |
| 2 Vehicles | 0 (0.0%) | 24 (19.2%) |
| 3 Vehicles | 49 (31.6%) | 29 (23.2%) |
| 4 Vehicles | 0 (0.0%) | 0 (0.0%) |
| 5 or more Vehicles | 106 (68.4%) | 72 (57.6%) |
| Total | 155 (100.0%) | 125 (100.0%) |
Commute Time in Sugarloaf
The most frequently occuring commute durations in Sugarloaf are 25 to 29 minutes (108 commuters, 40.5%), 45 to 59 minutes (78 commuters, 29.2%), and 30 to 34 minutes (32 commuters, 12.0%).
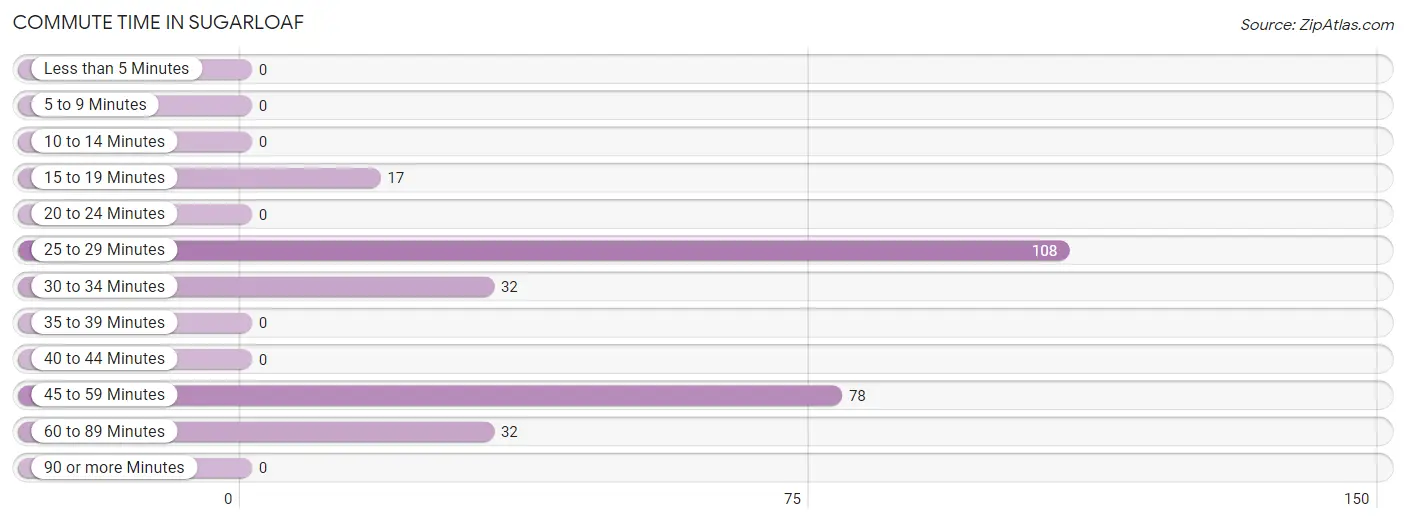
| Commute Time | # Commuters | % Commuters |
| Less than 5 Minutes | 0 | 0.0% |
| 5 to 9 Minutes | 0 | 0.0% |
| 10 to 14 Minutes | 0 | 0.0% |
| 15 to 19 Minutes | 17 | 6.4% |
| 20 to 24 Minutes | 0 | 0.0% |
| 25 to 29 Minutes | 108 | 40.5% |
| 30 to 34 Minutes | 32 | 12.0% |
| 35 to 39 Minutes | 0 | 0.0% |
| 40 to 44 Minutes | 0 | 0.0% |
| 45 to 59 Minutes | 78 | 29.2% |
| 60 to 89 Minutes | 32 | 12.0% |
| 90 or more Minutes | 0 | 0.0% |
Commute Time by Sex in Sugarloaf
The most common commute times in Sugarloaf are 25 to 29 minutes (84 commuters, 54.2%) for males and 45 to 59 minutes (59 commuters, 52.7%) for females.
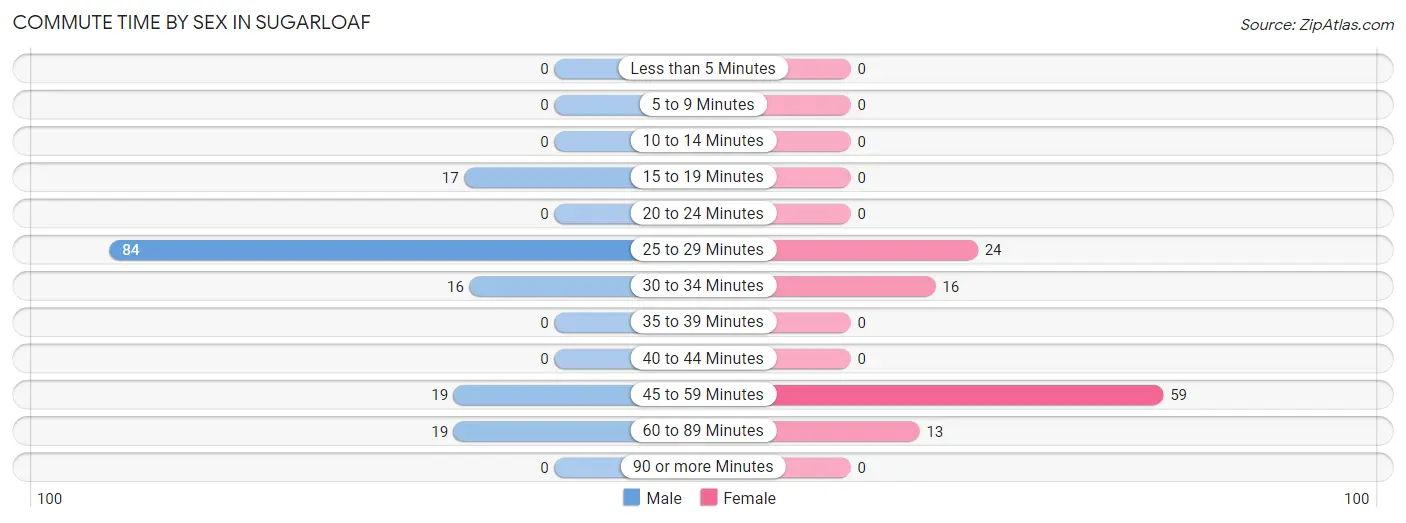
| Commute Time | Male | Female |
| Less than 5 Minutes | 0 (0.0%) | 0 (0.0%) |
| 5 to 9 Minutes | 0 (0.0%) | 0 (0.0%) |
| 10 to 14 Minutes | 0 (0.0%) | 0 (0.0%) |
| 15 to 19 Minutes | 17 (11.0%) | 0 (0.0%) |
| 20 to 24 Minutes | 0 (0.0%) | 0 (0.0%) |
| 25 to 29 Minutes | 84 (54.2%) | 24 (21.4%) |
| 30 to 34 Minutes | 16 (10.3%) | 16 (14.3%) |
| 35 to 39 Minutes | 0 (0.0%) | 0 (0.0%) |
| 40 to 44 Minutes | 0 (0.0%) | 0 (0.0%) |
| 45 to 59 Minutes | 19 (12.3%) | 59 (52.7%) |
| 60 to 89 Minutes | 19 (12.3%) | 13 (11.6%) |
| 90 or more Minutes | 0 (0.0%) | 0 (0.0%) |
Time of Departure to Work by Sex in Sugarloaf
The most frequent times of departure to work in Sugarloaf are 12:00 PM to 3:59 PM (84, 54.2%) for males and 12:00 PM to 3:59 PM (59, 52.7%) for females.
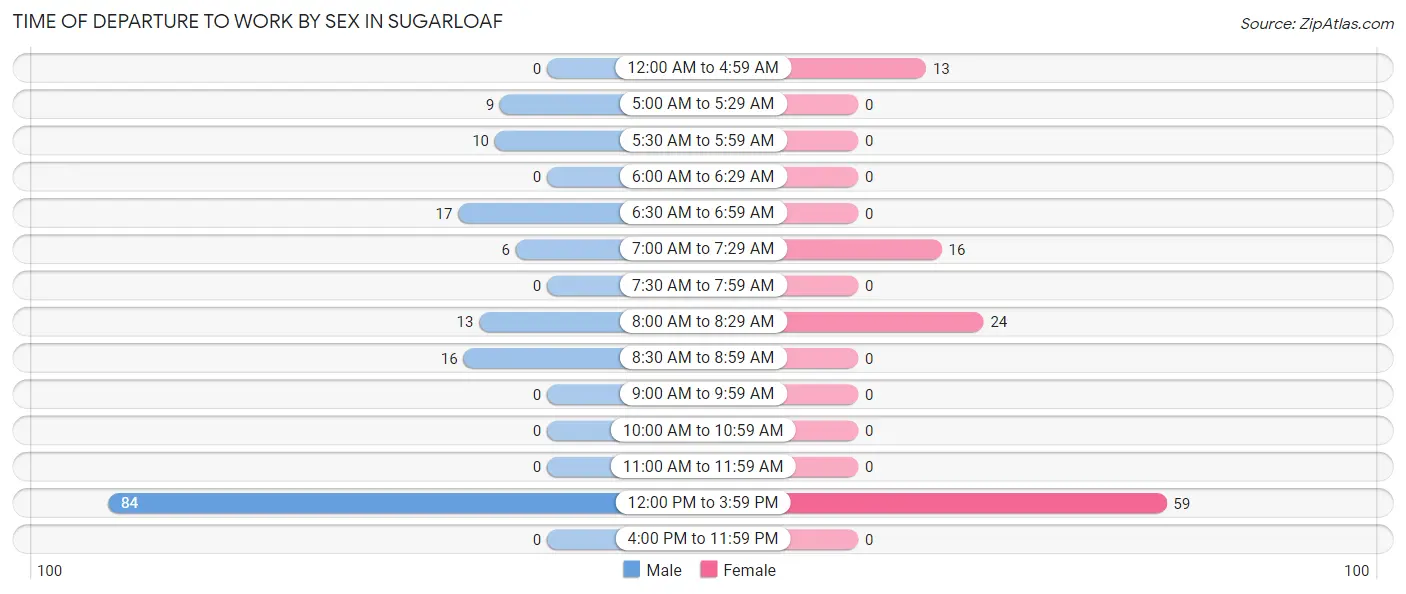
| Time of Departure | Male | Female |
| 12:00 AM to 4:59 AM | 0 (0.0%) | 13 (11.6%) |
| 5:00 AM to 5:29 AM | 9 (5.8%) | 0 (0.0%) |
| 5:30 AM to 5:59 AM | 10 (6.5%) | 0 (0.0%) |
| 6:00 AM to 6:29 AM | 0 (0.0%) | 0 (0.0%) |
| 6:30 AM to 6:59 AM | 17 (11.0%) | 0 (0.0%) |
| 7:00 AM to 7:29 AM | 6 (3.9%) | 16 (14.3%) |
| 7:30 AM to 7:59 AM | 0 (0.0%) | 0 (0.0%) |
| 8:00 AM to 8:29 AM | 13 (8.4%) | 24 (21.4%) |
| 8:30 AM to 8:59 AM | 16 (10.3%) | 0 (0.0%) |
| 9:00 AM to 9:59 AM | 0 (0.0%) | 0 (0.0%) |
| 10:00 AM to 10:59 AM | 0 (0.0%) | 0 (0.0%) |
| 11:00 AM to 11:59 AM | 0 (0.0%) | 0 (0.0%) |
| 12:00 PM to 3:59 PM | 84 (54.2%) | 59 (52.7%) |
| 4:00 PM to 11:59 PM | 0 (0.0%) | 0 (0.0%) |
| Total | 155 (100.0%) | 112 (100.0%) |
Housing Occupancy in Sugarloaf
Occupancy by Ownership in Sugarloaf
Of the total 160 dwellings in Sugarloaf, owner-occupied units account for 150 (93.8%), while renter-occupied units make up 10 (6.2%).
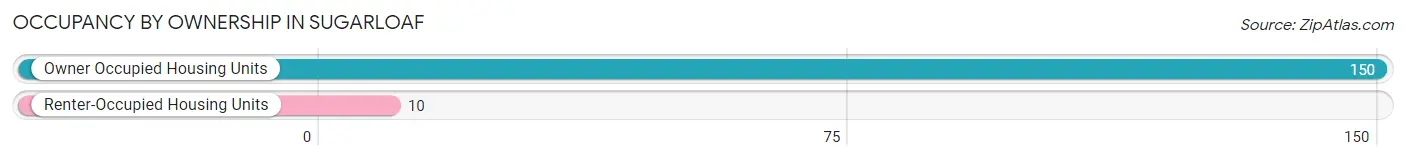
| Occupancy | # Housing Units | % Housing Units |
| Owner Occupied Housing Units | 150 | 93.8% |
| Renter-Occupied Housing Units | 10 | 6.2% |
| Total Occupied Housing Units | 160 | 100.0% |
Occupancy by Household Size in Sugarloaf
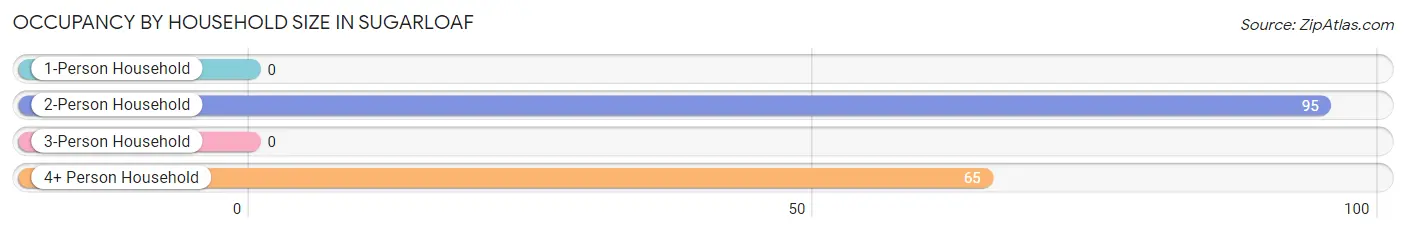
| Household Size | # Housing Units | % Housing Units |
| 1-Person Household | 0 | 0.0% |
| 2-Person Household | 95 | 59.4% |
| 3-Person Household | 0 | 0.0% |
| 4+ Person Household | 65 | 40.6% |
| Total Housing Units | 160 | 100.0% |
Occupancy by Ownership by Household Size in Sugarloaf
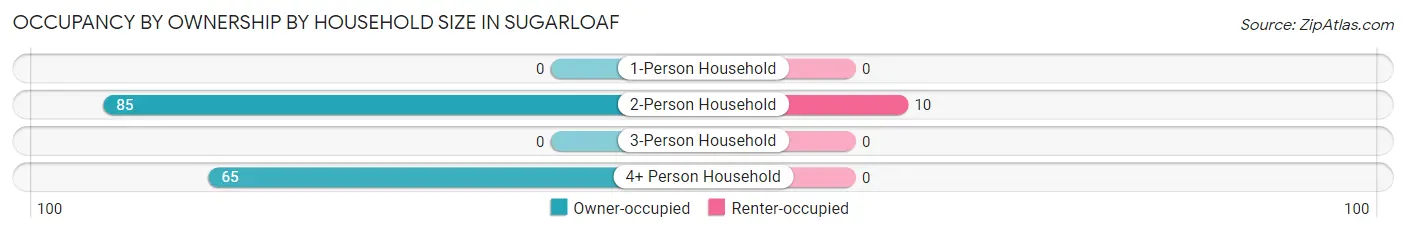
| Household Size | Owner-occupied | Renter-occupied |
| 1-Person Household | 0 (0.0%) | 0 (0.0%) |
| 2-Person Household | 85 (89.5%) | 10 (10.5%) |
| 3-Person Household | 0 (0.0%) | 0 (0.0%) |
| 4+ Person Household | 65 (100.0%) | 0 (0.0%) |
| Total Housing Units | 150 (93.8%) | 10 (6.2%) |
Occupancy by Educational Attainment in Sugarloaf
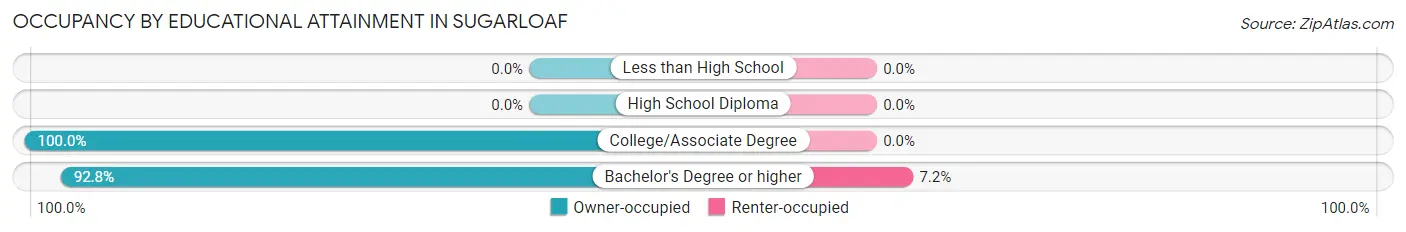
| Household Size | Owner-occupied | Renter-occupied |
| Less than High School | 0 (0.0%) | 0 (0.0%) |
| High School Diploma | 0 (0.0%) | 0 (0.0%) |
| College/Associate Degree | 21 (100.0%) | 0 (0.0%) |
| Bachelor's Degree or higher | 129 (92.8%) | 10 (7.2%) |
Occupancy by Age of Householder in Sugarloaf
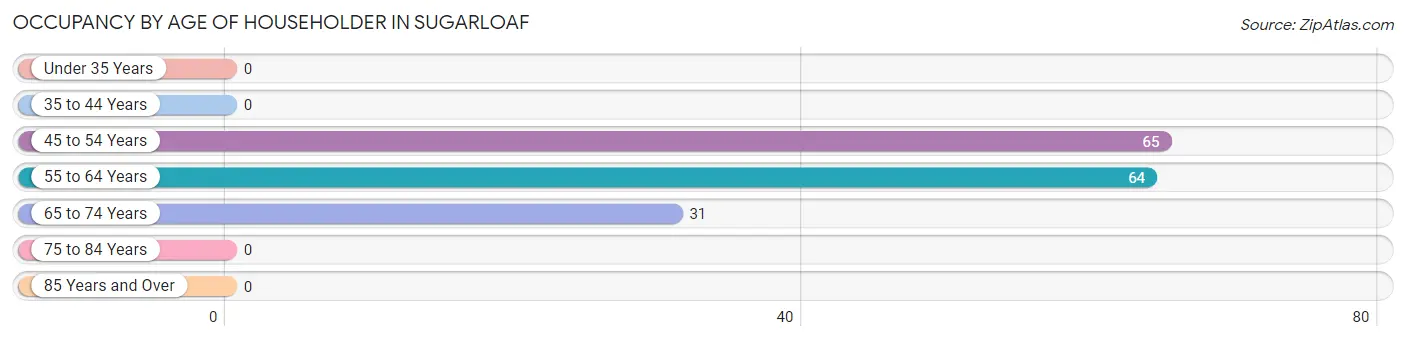
| Age Bracket | # Households | % Households |
| Under 35 Years | 0 | 0.0% |
| 35 to 44 Years | 0 | 0.0% |
| 45 to 54 Years | 65 | 40.6% |
| 55 to 64 Years | 64 | 40.0% |
| 65 to 74 Years | 31 | 19.4% |
| 75 to 84 Years | 0 | 0.0% |
| 85 Years and Over | 0 | 0.0% |
| Total | 160 | 100.0% |
Housing Finances in Sugarloaf
Median Income by Occupancy in Sugarloaf
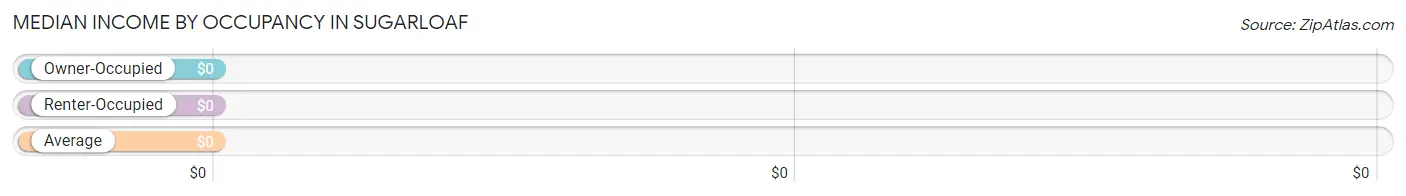
| Occupancy Type | # Households | Median Income |
| Owner-Occupied | 150 (93.8%) | $0 |
| Renter-Occupied | 10 (6.2%) | $0 |
| Average | 160 (100.0%) | $0 |
Occupancy by Householder Income Bracket in Sugarloaf
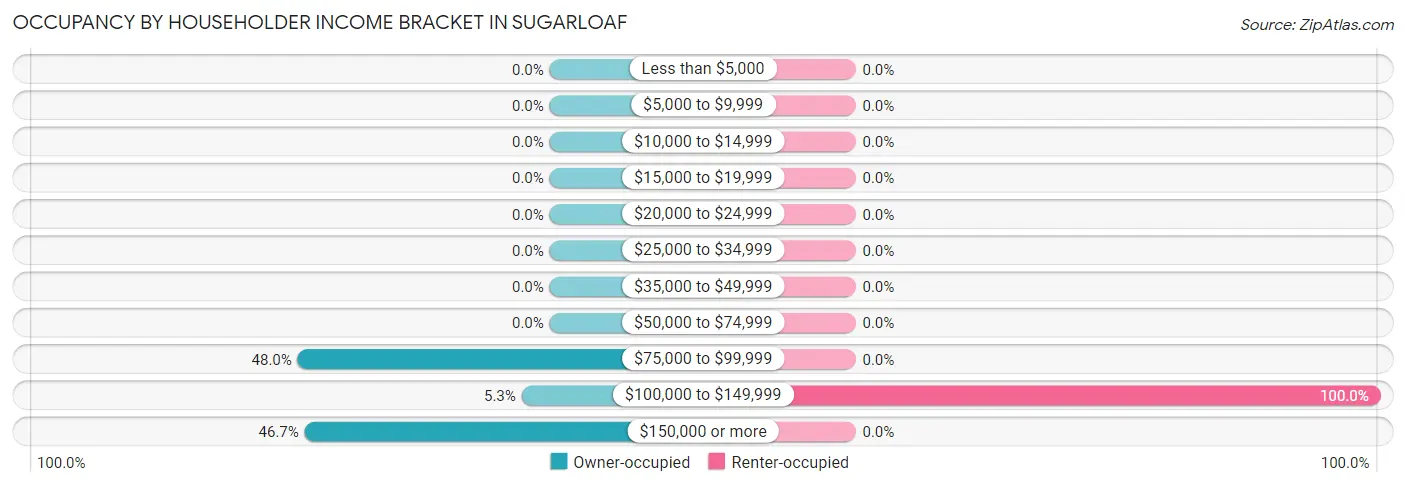
| Income Bracket | Owner-occupied | Renter-occupied |
| Less than $5,000 | 0 (0.0%) | 0 (0.0%) |
| $5,000 to $9,999 | 0 (0.0%) | 0 (0.0%) |
| $10,000 to $14,999 | 0 (0.0%) | 0 (0.0%) |
| $15,000 to $19,999 | 0 (0.0%) | 0 (0.0%) |
| $20,000 to $24,999 | 0 (0.0%) | 0 (0.0%) |
| $25,000 to $34,999 | 0 (0.0%) | 0 (0.0%) |
| $35,000 to $49,999 | 0 (0.0%) | 0 (0.0%) |
| $50,000 to $74,999 | 0 (0.0%) | 0 (0.0%) |
| $75,000 to $99,999 | 72 (48.0%) | 0 (0.0%) |
| $100,000 to $149,999 | 8 (5.3%) | 10 (100.0%) |
| $150,000 or more | 70 (46.7%) | 0 (0.0%) |
| Total | 150 (100.0%) | 10 (100.0%) |
Monthly Housing Cost Tiers in Sugarloaf
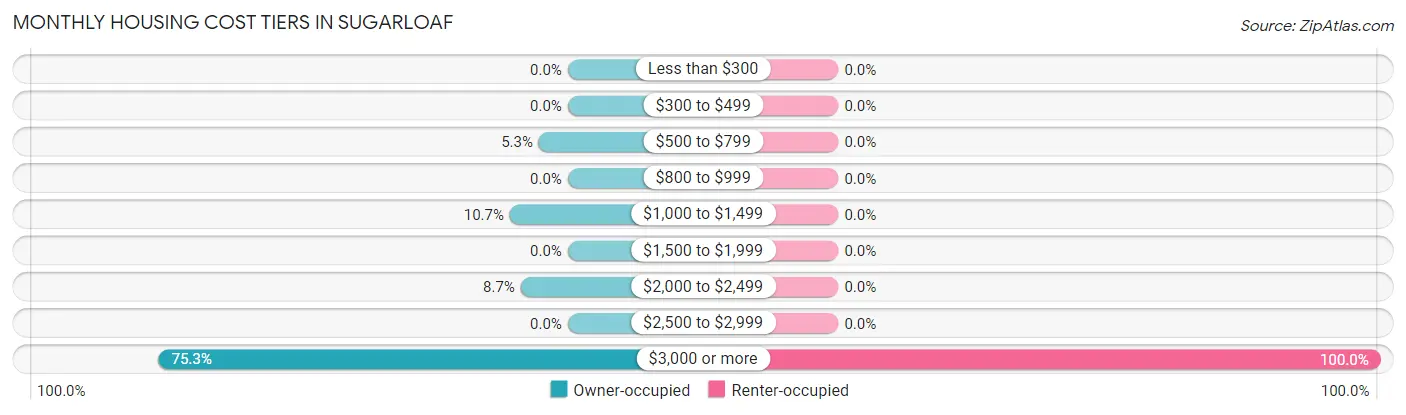
| Monthly Cost | Owner-occupied | Renter-occupied |
| Less than $300 | 0 (0.0%) | 0 (0.0%) |
| $300 to $499 | 0 (0.0%) | 0 (0.0%) |
| $500 to $799 | 8 (5.3%) | 0 (0.0%) |
| $800 to $999 | 0 (0.0%) | 0 (0.0%) |
| $1,000 to $1,499 | 16 (10.7%) | 0 (0.0%) |
| $1,500 to $1,999 | 0 (0.0%) | 0 (0.0%) |
| $2,000 to $2,499 | 13 (8.7%) | 0 (0.0%) |
| $2,500 to $2,999 | 0 (0.0%) | 0 (0.0%) |
| $3,000 or more | 113 (75.3%) | 10 (100.0%) |
| Total | 150 (100.0%) | 10 (100.0%) |
Physical Housing Characteristics in Sugarloaf
Housing Structures in Sugarloaf
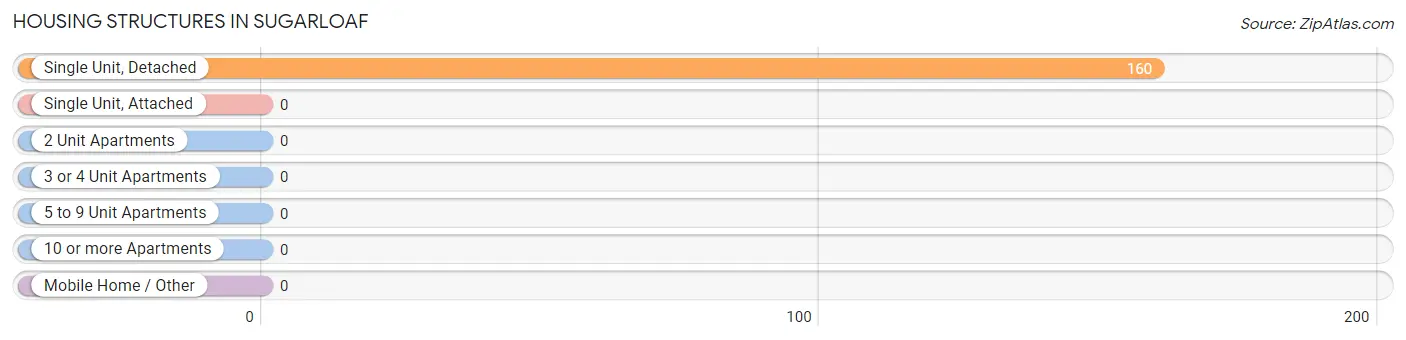
| Structure Type | # Housing Units | % Housing Units |
| Single Unit, Detached | 160 | 100.0% |
| Single Unit, Attached | 0 | 0.0% |
| 2 Unit Apartments | 0 | 0.0% |
| 3 or 4 Unit Apartments | 0 | 0.0% |
| 5 to 9 Unit Apartments | 0 | 0.0% |
| 10 or more Apartments | 0 | 0.0% |
| Mobile Home / Other | 0 | 0.0% |
| Total | 160 | 100.0% |
Housing Structures by Occupancy in Sugarloaf
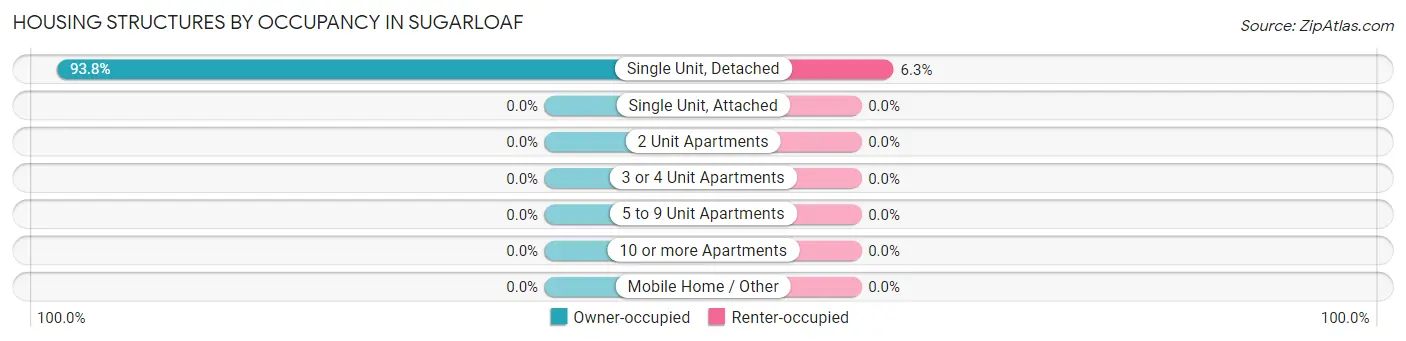
| Structure Type | Owner-occupied | Renter-occupied |
| Single Unit, Detached | 150 (93.8%) | 10 (6.2%) |
| Single Unit, Attached | 0 (0.0%) | 0 (0.0%) |
| 2 Unit Apartments | 0 (0.0%) | 0 (0.0%) |
| 3 or 4 Unit Apartments | 0 (0.0%) | 0 (0.0%) |
| 5 to 9 Unit Apartments | 0 (0.0%) | 0 (0.0%) |
| 10 or more Apartments | 0 (0.0%) | 0 (0.0%) |
| Mobile Home / Other | 0 (0.0%) | 0 (0.0%) |
| Total | 150 (93.8%) | 10 (6.2%) |
Housing Structures by Number of Rooms in Sugarloaf
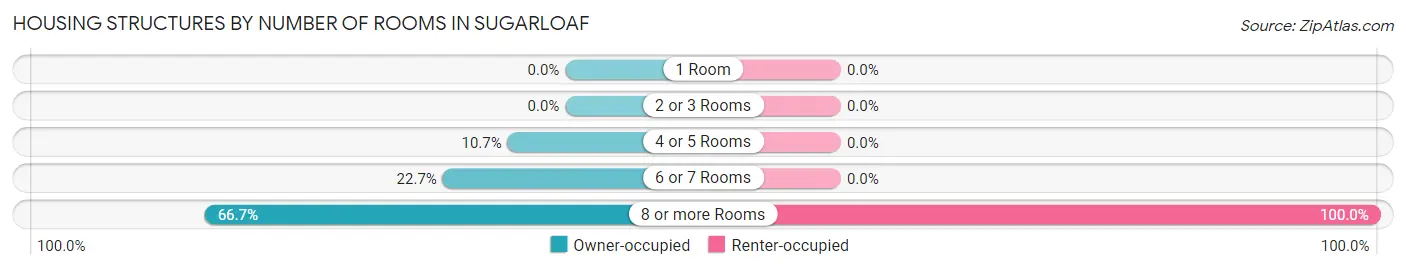
| Number of Rooms | Owner-occupied | Renter-occupied |
| 1 Room | 0 (0.0%) | 0 (0.0%) |
| 2 or 3 Rooms | 0 (0.0%) | 0 (0.0%) |
| 4 or 5 Rooms | 16 (10.7%) | 0 (0.0%) |
| 6 or 7 Rooms | 34 (22.7%) | 0 (0.0%) |
| 8 or more Rooms | 100 (66.7%) | 10 (100.0%) |
| Total | 150 (100.0%) | 10 (100.0%) |
Housing Structure by Heating Type in Sugarloaf
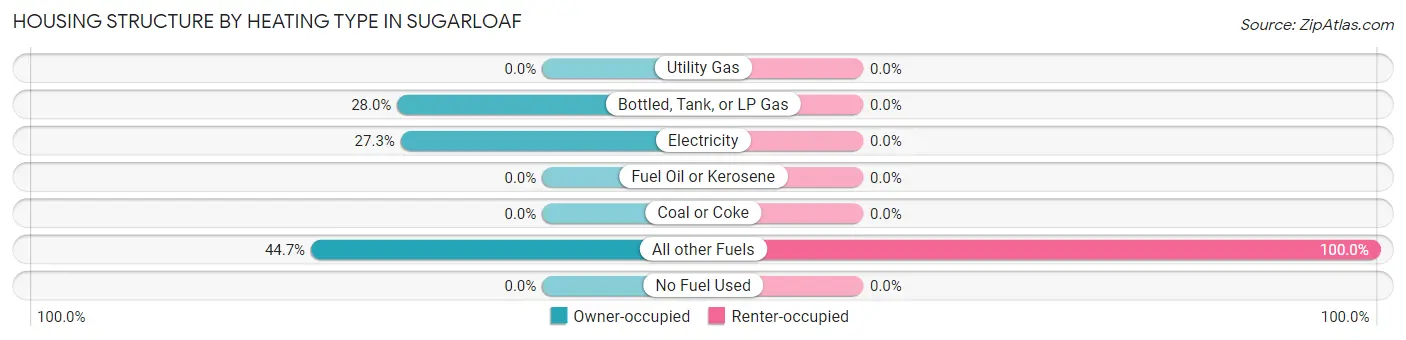
| Heating Type | Owner-occupied | Renter-occupied |
| Utility Gas | 0 (0.0%) | 0 (0.0%) |
| Bottled, Tank, or LP Gas | 42 (28.0%) | 0 (0.0%) |
| Electricity | 41 (27.3%) | 0 (0.0%) |
| Fuel Oil or Kerosene | 0 (0.0%) | 0 (0.0%) |
| Coal or Coke | 0 (0.0%) | 0 (0.0%) |
| All other Fuels | 67 (44.7%) | 10 (100.0%) |
| No Fuel Used | 0 (0.0%) | 0 (0.0%) |
| Total | 150 (100.0%) | 10 (100.0%) |
Household Vehicle Usage in Sugarloaf
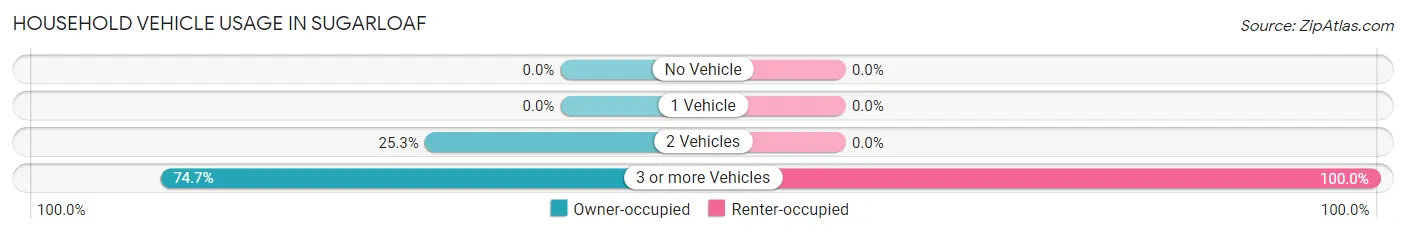
| Vehicles per Household | Owner-occupied | Renter-occupied |
| No Vehicle | 0 (0.0%) | 0 (0.0%) |
| 1 Vehicle | 0 (0.0%) | 0 (0.0%) |
| 2 Vehicles | 38 (25.3%) | 0 (0.0%) |
| 3 or more Vehicles | 112 (74.7%) | 10 (100.0%) |
| Total | 150 (100.0%) | 10 (100.0%) |
Real Estate & Mortgages in Sugarloaf
Real Estate and Mortgage Overview in Sugarloaf
| Characteristic | Without Mortgage | With Mortgage |
| Housing Units | 8 | 142 |
| Median Property Value | - | - |
| Median Household Income | - | - |
| Monthly Housing Costs | - | - |
| Real Estate Taxes | - | - |
Property Value by Mortgage Status in Sugarloaf
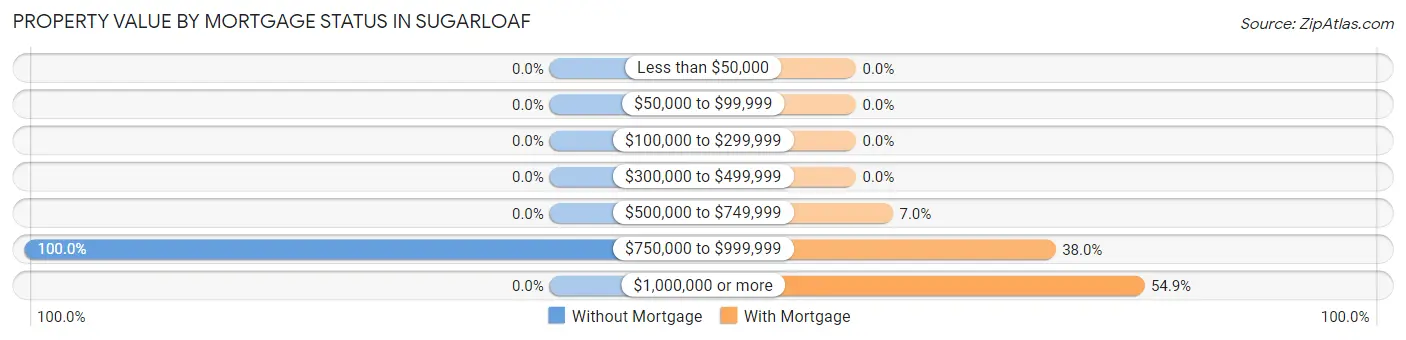
| Property Value | Without Mortgage | With Mortgage |
| Less than $50,000 | 0 (0.0%) | 0 (0.0%) |
| $50,000 to $99,999 | 0 (0.0%) | 0 (0.0%) |
| $100,000 to $299,999 | 0 (0.0%) | 0 (0.0%) |
| $300,000 to $499,999 | 0 (0.0%) | 0 (0.0%) |
| $500,000 to $749,999 | 0 (0.0%) | 10 (7.0%) |
| $750,000 to $999,999 | 8 (100.0%) | 54 (38.0%) |
| $1,000,000 or more | 0 (0.0%) | 78 (54.9%) |
| Total | 8 (100.0%) | 142 (100.0%) |
Household Income by Mortgage Status in Sugarloaf
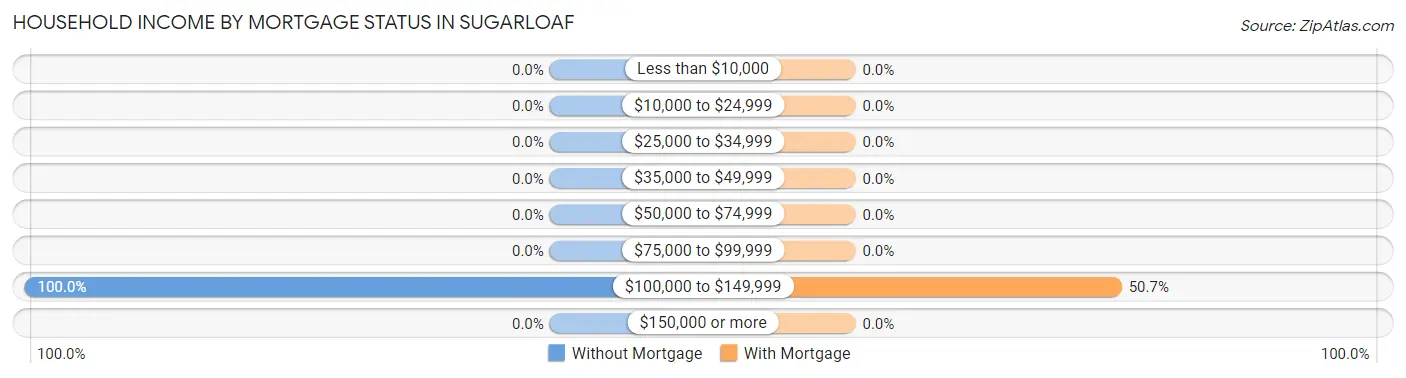
| Household Income | Without Mortgage | With Mortgage |
| Less than $10,000 | 0 (0.0%) | 0 (0.0%) |
| $10,000 to $24,999 | 0 (0.0%) | 0 (0.0%) |
| $25,000 to $34,999 | 0 (0.0%) | 0 (0.0%) |
| $35,000 to $49,999 | 0 (0.0%) | 0 (0.0%) |
| $50,000 to $74,999 | 0 (0.0%) | 0 (0.0%) |
| $75,000 to $99,999 | 0 (0.0%) | 0 (0.0%) |
| $100,000 to $149,999 | 8 (100.0%) | 72 (50.7%) |
| $150,000 or more | 0 (0.0%) | 0 (0.0%) |
| Total | 8 (100.0%) | 142 (100.0%) |
Property Value to Household Income Ratio in Sugarloaf
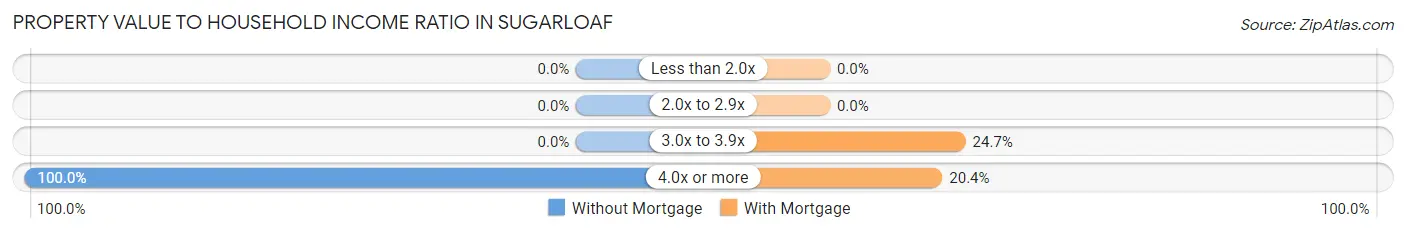
| Value-to-Income Ratio | Without Mortgage | With Mortgage |
| Less than 2.0x | 0 (0.0%) | 0 (0.0%) |
| 2.0x to 2.9x | 0 (0.0%) | 0 (0.0%) |
| 3.0x to 3.9x | 0 (0.0%) | 35 (24.6%) |
| 4.0x or more | 8 (100.0%) | 29 (20.4%) |
| Total | 8 (100.0%) | 142 (100.0%) |
Real Estate Taxes by Mortgage Status in Sugarloaf
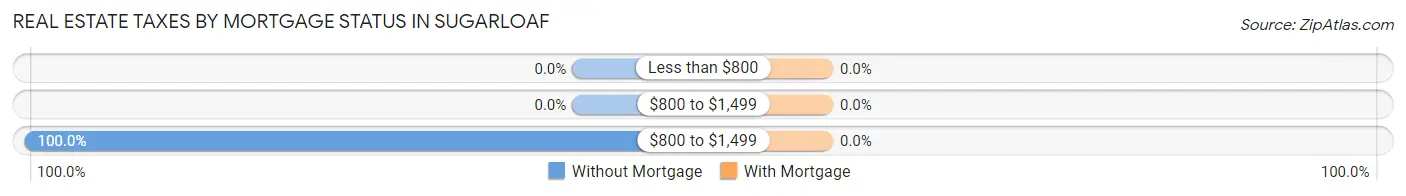
| Property Taxes | Without Mortgage | With Mortgage |
| Less than $800 | 0 (0.0%) | 0 (0.0%) |
| $800 to $1,499 | 0 (0.0%) | 0 (0.0%) |
| $800 to $1,499 | 8 (100.0%) | 0 (0.0%) |
| Total | 8 (100.0%) | 142 (100.0%) |
Health & Disability in Sugarloaf
Health Insurance Coverage by Age in Sugarloaf
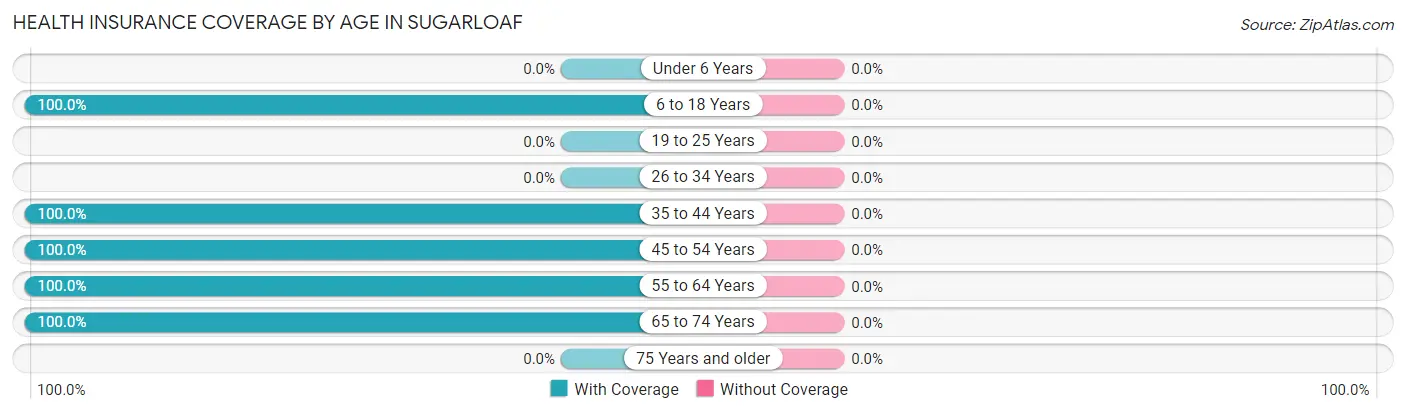
| Age Bracket | With Coverage | Without Coverage |
| Under 6 Years | 0 (0.0%) | 0 (0.0%) |
| 6 to 18 Years | 204 (100.0%) | 0 (0.0%) |
| 19 to 25 Years | 0 (0.0%) | 0 (0.0%) |
| 26 to 34 Years | 0 (0.0%) | 0 (0.0%) |
| 35 to 44 Years | 13 (100.0%) | 0 (0.0%) |
| 45 to 54 Years | 111 (100.0%) | 0 (0.0%) |
| 55 to 64 Years | 117 (100.0%) | 0 (0.0%) |
| 65 to 74 Years | 56 (100.0%) | 0 (0.0%) |
| 75 Years and older | 0 (0.0%) | 0 (0.0%) |
| Total | 501 (100.0%) | 0 (0.0%) |
Health Insurance Coverage by Citizenship Status in Sugarloaf
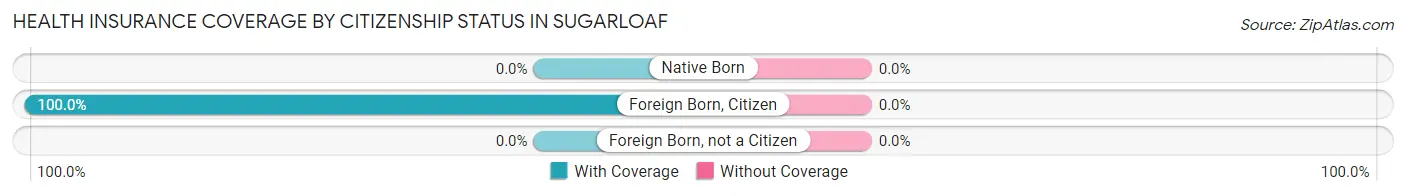
| Citizenship Status | With Coverage | Without Coverage |
| Native Born | 0 (0.0%) | 0 (0.0%) |
| Foreign Born, Citizen | 204 (100.0%) | 0 (0.0%) |
| Foreign Born, not a Citizen | 0 (0.0%) | 0 (0.0%) |
Health Insurance Coverage by Household Income in Sugarloaf
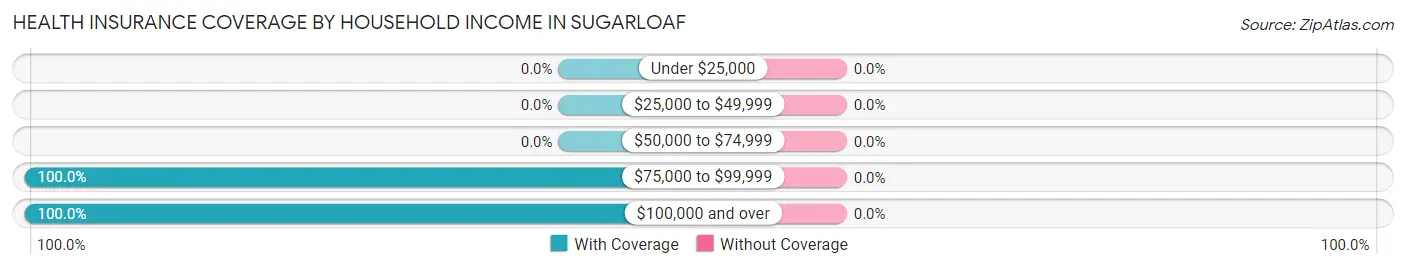
| Household Income | With Coverage | Without Coverage |
| Under $25,000 | 0 (0.0%) | 0 (0.0%) |
| $25,000 to $49,999 | 0 (0.0%) | 0 (0.0%) |
| $50,000 to $74,999 | 0 (0.0%) | 0 (0.0%) |
| $75,000 to $99,999 | 303 (100.0%) | 0 (0.0%) |
| $100,000 and over | 198 (100.0%) | 0 (0.0%) |
Public vs Private Health Insurance Coverage by Age in Sugarloaf
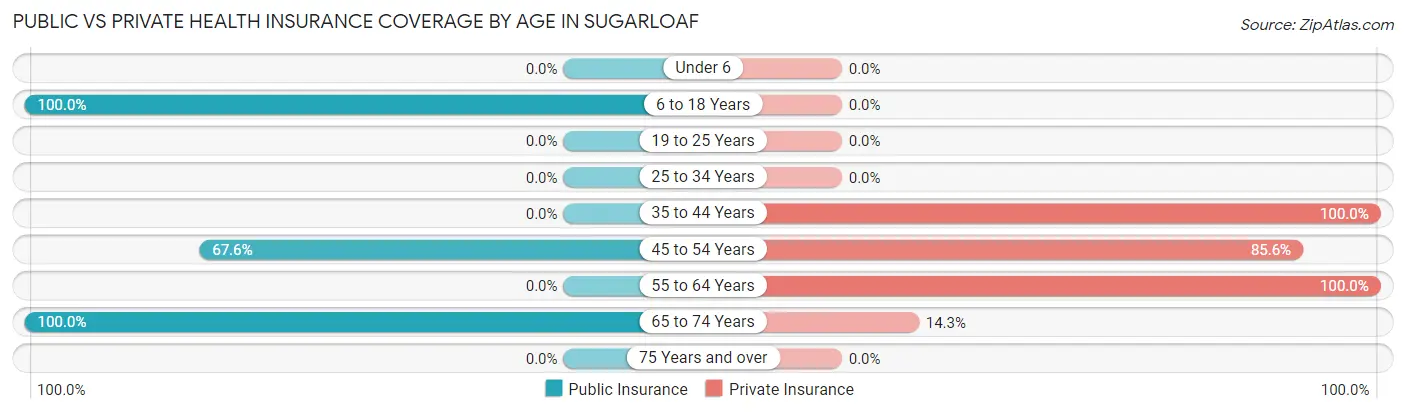
| Age Bracket | Public Insurance | Private Insurance |
| Under 6 | 0 (0.0%) | 0 (0.0%) |
| 6 to 18 Years | 204 (100.0%) | 0 (0.0%) |
| 19 to 25 Years | 0 (0.0%) | 0 (0.0%) |
| 25 to 34 Years | 0 (0.0%) | 0 (0.0%) |
| 35 to 44 Years | 0 (0.0%) | 13 (100.0%) |
| 45 to 54 Years | 75 (67.6%) | 95 (85.6%) |
| 55 to 64 Years | 0 (0.0%) | 117 (100.0%) |
| 65 to 74 Years | 56 (100.0%) | 8 (14.3%) |
| 75 Years and over | 0 (0.0%) | 0 (0.0%) |
| Total | 335 (66.9%) | 233 (46.5%) |
Disability Status by Sex by Age in Sugarloaf
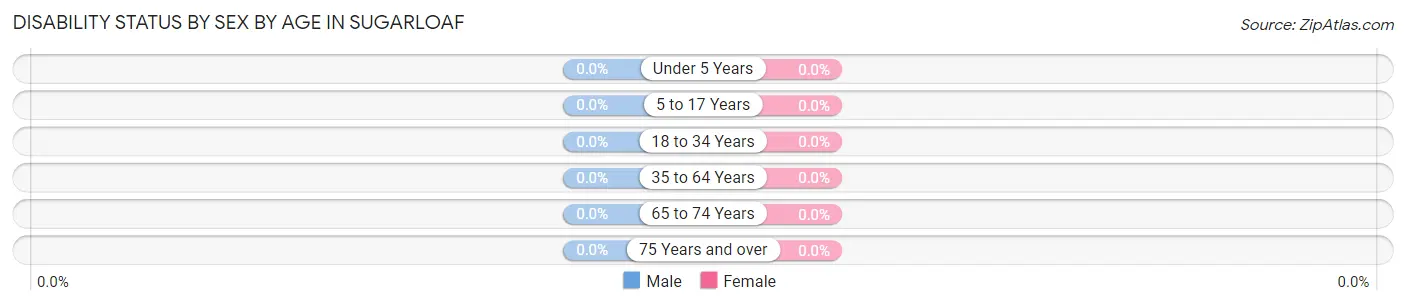
| Age Bracket | Male | Female |
| Under 5 Years | 0 (0.0%) | 0 (0.0%) |
| 5 to 17 Years | 0 (0.0%) | 0 (0.0%) |
| 18 to 34 Years | 0 (0.0%) | 0 (0.0%) |
| 35 to 64 Years | 0 (0.0%) | 0 (0.0%) |
| 65 to 74 Years | 0 (0.0%) | 0 (0.0%) |
| 75 Years and over | 0 (0.0%) | 0 (0.0%) |
Disability Class by Sex by Age in Sugarloaf
Disability Class: Hearing Difficulty
| Age Bracket | Male | Female |
| Under 5 Years | 0 (0.0%) | 0 (0.0%) |
| 5 to 17 Years | 0 (0.0%) | 0 (0.0%) |
| 18 to 34 Years | 0 (0.0%) | 0 (0.0%) |
| 35 to 64 Years | 0 (0.0%) | 0 (0.0%) |
| 65 to 74 Years | 0 (0.0%) | 0 (0.0%) |
| 75 Years and over | 0 (0.0%) | 0 (0.0%) |
Disability Class: Vision Difficulty
| Age Bracket | Male | Female |
| Under 5 Years | 0 (0.0%) | 0 (0.0%) |
| 5 to 17 Years | 0 (0.0%) | 0 (0.0%) |
| 18 to 34 Years | 0 (0.0%) | 0 (0.0%) |
| 35 to 64 Years | 0 (0.0%) | 0 (0.0%) |
| 65 to 74 Years | 0 (0.0%) | 0 (0.0%) |
| 75 Years and over | 0 (0.0%) | 0 (0.0%) |
Disability Class: Cognitive Difficulty
| Age Bracket | Male | Female |
| 5 to 17 Years | 0 (0.0%) | 0 (0.0%) |
| 18 to 34 Years | 0 (0.0%) | 0 (0.0%) |
| 35 to 64 Years | 0 (0.0%) | 0 (0.0%) |
| 65 to 74 Years | 0 (0.0%) | 0 (0.0%) |
| 75 Years and over | 0 (0.0%) | 0 (0.0%) |
Disability Class: Ambulatory Difficulty
| Age Bracket | Male | Female |
| 5 to 17 Years | 0 (0.0%) | 0 (0.0%) |
| 18 to 34 Years | 0 (0.0%) | 0 (0.0%) |
| 35 to 64 Years | 0 (0.0%) | 0 (0.0%) |
| 65 to 74 Years | 0 (0.0%) | 0 (0.0%) |
| 75 Years and over | 0 (0.0%) | 0 (0.0%) |
Disability Class: Self-Care Difficulty
| Age Bracket | Male | Female |
| 5 to 17 Years | 0 (0.0%) | 0 (0.0%) |
| 18 to 34 Years | 0 (0.0%) | 0 (0.0%) |
| 35 to 64 Years | 0 (0.0%) | 0 (0.0%) |
| 65 to 74 Years | 0 (0.0%) | 0 (0.0%) |
| 75 Years and over | 0 (0.0%) | 0 (0.0%) |
Technology Access in Sugarloaf
Computing Device Access in Sugarloaf
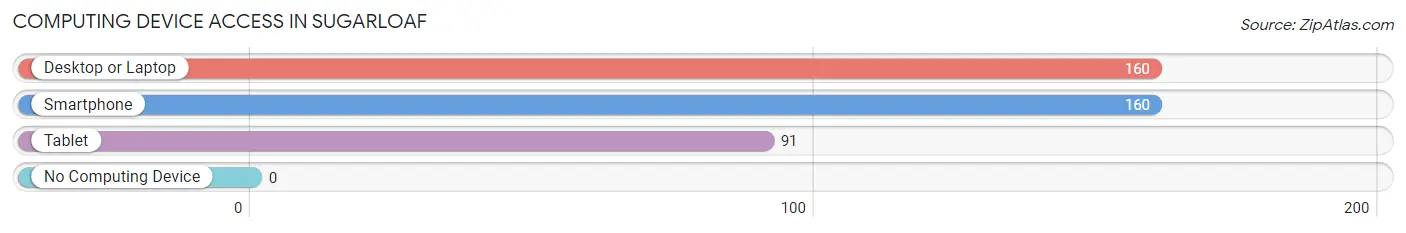
| Device Type | # Households | % Households |
| Desktop or Laptop | 160 | 100.0% |
| Smartphone | 160 | 100.0% |
| Tablet | 91 | 56.9% |
| No Computing Device | 0 | 0.0% |
| Total | 160 | 100.0% |
Internet Access in Sugarloaf
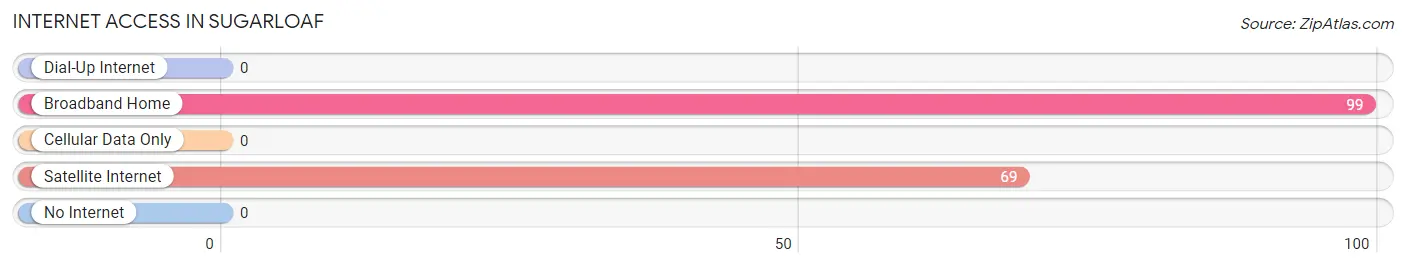
| Internet Type | # Households | % Households |
| Dial-Up Internet | 0 | 0.0% |
| Broadband Home | 99 | 61.9% |
| Cellular Data Only | 0 | 0.0% |
| Satellite Internet | 69 | 43.1% |
| No Internet | 0 | 0.0% |
| Total | 160 | 100.0% |
Sugarloaf Summary
Sugarloaf is a small unincorporated community located in the White River National Forest in the Rocky Mountains of Colorado. It is situated in the northern part of the state, approximately 10 miles south of the town of Breckenridge. The area is known for its stunning mountain views, outdoor recreation opportunities, and its close proximity to the ski resorts of Breckenridge and Copper Mountain.
History
The area that is now known as Sugarloaf was first settled in the late 1800s by miners and prospectors looking to strike it rich in the gold and silver mines of the area. The town was officially established in 1883 and was named after the nearby mountain peak of the same name. The town quickly grew to become a bustling mining community, with a population of over 500 people.
In the early 1900s, the mining industry began to decline and the town’s population began to dwindle. In the 1950s, the area was rediscovered by skiers and outdoor enthusiasts, and the town began to experience a resurgence. In the 1960s, the town was officially incorporated and the first ski resort in the area, Copper Mountain, was opened.
Geography
Sugarloaf is located in the northern part of Colorado, approximately 10 miles south of the town of Breckenridge. The town is situated in the White River National Forest, at an elevation of 9,000 feet. The area is surrounded by stunning mountain peaks, including the nearby peak of Sugarloaf Mountain. The area is known for its abundant outdoor recreation opportunities, including skiing, snowboarding, hiking, camping, and fishing.
Economy
The economy of Sugarloaf is largely driven by tourism. The area is home to two major ski resorts, Copper Mountain and Breckenridge, which attract thousands of visitors each year. The town also has a number of restaurants, bars, and shops that cater to the tourist population. Additionally, the town is home to a number of small businesses, including a local brewery, a general store, and a post office.
Demographics
As of the 2010 census, the population of Sugarloaf was 545. The town is predominantly white, with approximately 95% of the population identifying as such. The median household income in the town is $50,000, and the median age is 40. The town is home to a number of families, with approximately 40% of households having children under the age of 18.
Common Questions
What is Per Capita Income in Sugarloaf?
Per Capita income in Sugarloaf is $60,964.
What is Inequality or Gini Index in Sugarloaf?
Inequality or Gini Index in Sugarloaf is 0.36.
What is the Total Population of Sugarloaf?
Total Population of Sugarloaf is 501.
What is the Total Male Population of Sugarloaf?
Total Male Population of Sugarloaf is 267.
What is the Total Female Population of Sugarloaf?
Total Female Population of Sugarloaf is 234.
What is the Ratio of Males per 100 Females in Sugarloaf?
There are 114.10 Males per 100 Females in Sugarloaf.
What is the Ratio of Females per 100 Males in Sugarloaf?
There are 87.64 Females per 100 Males in Sugarloaf.
What is the Median Population Age in Sugarloaf?
Median Population Age in Sugarloaf is 52.4 Years.
What is the Average Family Size in Sugarloaf
Average Family Size in Sugarloaf is 3.0 People.
What is the Average Household Size in Sugarloaf
Average Household Size in Sugarloaf is 3.1 People.
How Large is the Labor Force in Sugarloaf?
There are 280 People in the Labor Forcein in Sugarloaf.
What is the Percentage of People in the Labor Force in Sugarloaf?
73.5% of People are in the Labor Force in Sugarloaf.