Silverton, CO Map & Demographics
Silverton Map
Silverton Overview
$36,876
PER CAPITA INCOME
$71,875
AVG FAMILY INCOME
$64,000
AVG HOUSEHOLD INCOME
35.3%
WAGE / INCOME GAP [ % ]
64.7¢/ $1
WAGE / INCOME GAP [ $ ]
0.41
INEQUALITY / GINI INDEX
613
TOTAL POPULATION
333
MALE POPULATION
280
FEMALE POPULATION
118.93
MALES / 100 FEMALES
84.08
FEMALES / 100 MALES
45.4
MEDIAN AGE
2.4
AVG FAMILY SIZE
2.0
AVG HOUSEHOLD SIZE
382
LABOR FORCE [ PEOPLE ]
70.3%
PERCENT IN LABOR FORCE
7.9%
UNEMPLOYMENT RATE
Silverton Zip Codes
Silverton Area Codes
Income in Silverton
Income Overview in Silverton
Per Capita Income in Silverton is $36,876, while median incomes of families and households are $71,875 and $64,000 respectively.
| Characteristic | Number | Measure |
| Per Capita Income | 613 | $36,876 |
| Median Family Income | 179 | $71,875 |
| Mean Family Income | 179 | $78,996 |
| Median Household Income | 302 | $64,000 |
| Mean Household Income | 302 | $71,132 |
| Income Deficit | 179 | $0 |
| Wage / Income Gap (%) | 613 | 35.34% |
| Wage / Income Gap ($) | 613 | 64.66¢ per $1 |
| Gini / Inequality Index | 613 | 0.41 |
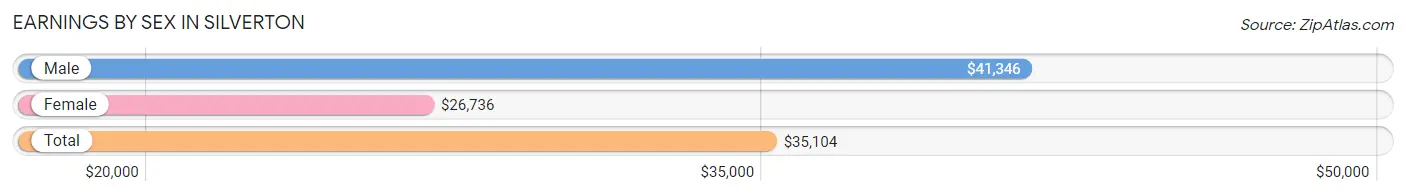
Earnings by Sex in Silverton
Average Earnings in Silverton are $35,104, $41,346 for men and $26,736 for women, a difference of 35.3%.
| Sex | Number | Average Earnings |
| Male | 256 (64.5%) | $41,346 |
| Female | 141 (35.5%) | $26,736 |
| Total | 397 (100.0%) | $35,104 |
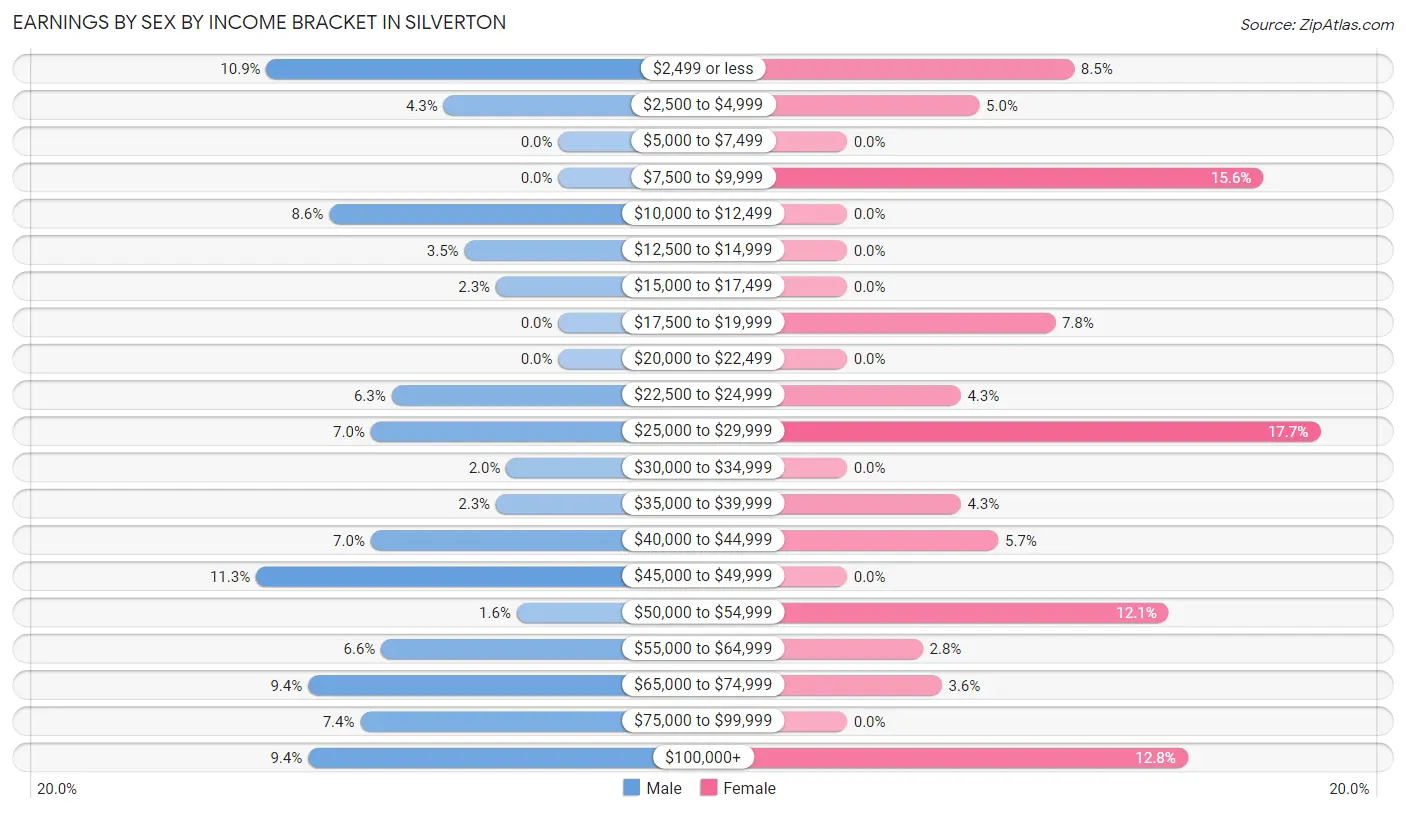
Earnings by Sex by Income Bracket in Silverton
The most common earnings brackets in Silverton are $45,000 to $49,999 for men (29 | 11.3%) and $25,000 to $29,999 for women (25 | 17.7%).
| Income | Male | Female |
| $2,499 or less | 28 (10.9%) | 12 (8.5%) |
| $2,500 to $4,999 | 11 (4.3%) | 7 (5.0%) |
| $5,000 to $7,499 | 0 (0.0%) | 0 (0.0%) |
| $7,500 to $9,999 | 0 (0.0%) | 22 (15.6%) |
| $10,000 to $12,499 | 22 (8.6%) | 0 (0.0%) |
| $12,500 to $14,999 | 9 (3.5%) | 0 (0.0%) |
| $15,000 to $17,499 | 6 (2.3%) | 0 (0.0%) |
| $17,500 to $19,999 | 0 (0.0%) | 11 (7.8%) |
| $20,000 to $22,499 | 0 (0.0%) | 0 (0.0%) |
| $22,500 to $24,999 | 16 (6.2%) | 6 (4.3%) |
| $25,000 to $29,999 | 18 (7.0%) | 25 (17.7%) |
| $30,000 to $34,999 | 5 (1.9%) | 0 (0.0%) |
| $35,000 to $39,999 | 6 (2.3%) | 6 (4.3%) |
| $40,000 to $44,999 | 18 (7.0%) | 8 (5.7%) |
| $45,000 to $49,999 | 29 (11.3%) | 0 (0.0%) |
| $50,000 to $54,999 | 4 (1.6%) | 17 (12.1%) |
| $55,000 to $64,999 | 17 (6.6%) | 4 (2.8%) |
| $65,000 to $74,999 | 24 (9.4%) | 5 (3.5%) |
| $75,000 to $99,999 | 19 (7.4%) | 0 (0.0%) |
| $100,000+ | 24 (9.4%) | 18 (12.8%) |
| Total | 256 (100.0%) | 141 (100.0%) |
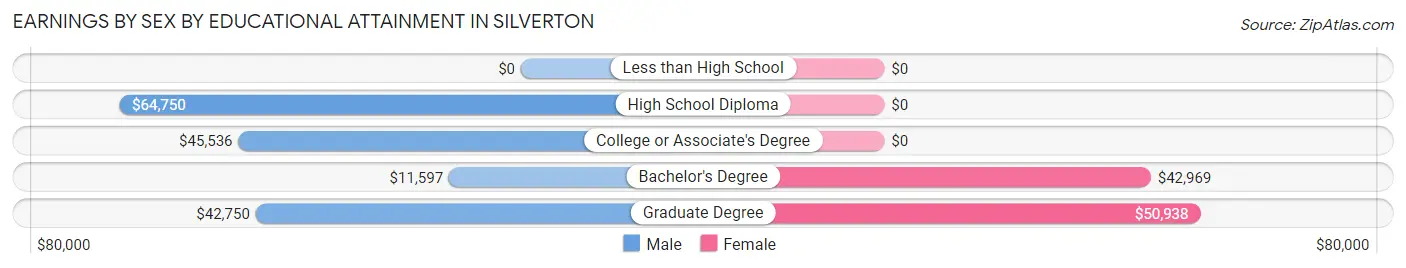
Earnings by Sex by Educational Attainment in Silverton
Average earnings in Silverton are $44,000 for men and $29,107 for women, a difference of 33.9%. Men with an educational attainment of high school diploma enjoy the highest average annual earnings of $64,750, while those with bachelor's degree education earn the least with $11,597. Women with an educational attainment of graduate degree earn the most with the average annual earnings of $50,938, while those with bachelor's degree education have the smallest earnings of $42,969.
| Educational Attainment | Male Income | Female Income |
| Less than High School | - | - |
| High School Diploma | $64,750 | $0 |
| College or Associate's Degree | $45,536 | $0 |
| Bachelor's Degree | $11,597 | $42,969 |
| Graduate Degree | $42,750 | $50,938 |
| Total | $44,000 | $29,107 |
Family Income in Silverton
Family Income Brackets in Silverton
According to the Silverton family income data, there are 42 families falling into the $75,000 to $99,999 income range, which is the most common income bracket and makes up 23.5% of all families.
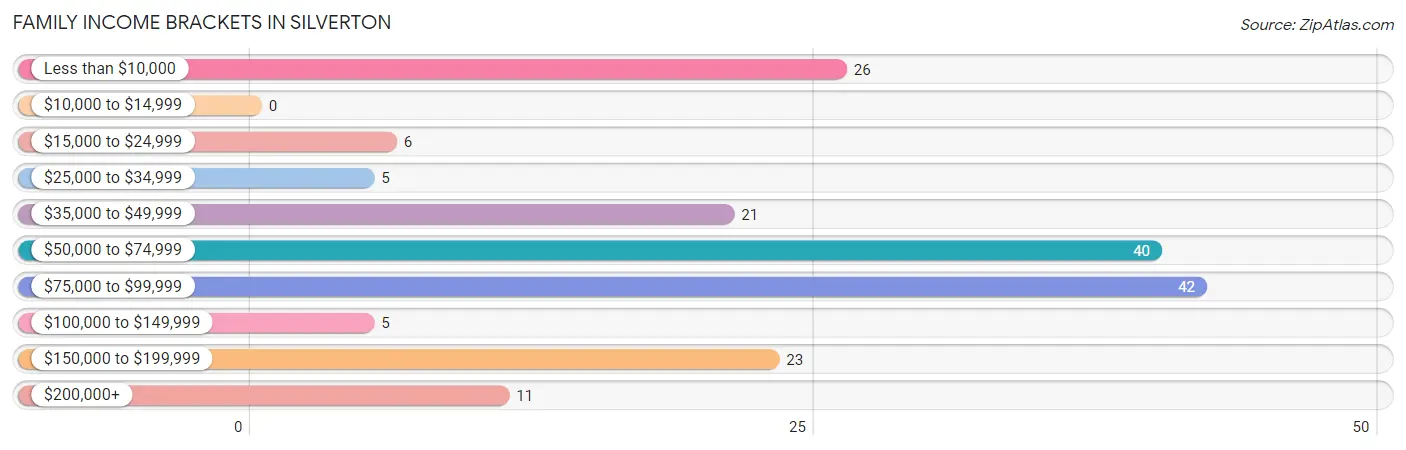
| Income Bracket | # Families | % Families |
| Less than $10,000 | 26 | 14.5% |
| $10,000 to $14,999 | 0 | 0.0% |
| $15,000 to $24,999 | 6 | 3.4% |
| $25,000 to $34,999 | 5 | 2.8% |
| $35,000 to $49,999 | 21 | 11.7% |
| $50,000 to $74,999 | 40 | 22.3% |
| $75,000 to $99,999 | 42 | 23.5% |
| $100,000 to $149,999 | 5 | 2.8% |
| $150,000 to $199,999 | 23 | 12.8% |
| $200,000+ | 11 | 6.1% |
Family Income by Famaliy Size in Silverton
2-person families (135 | 75.4%) account for the highest median family income in Silverton with $72,292 per family, while 2-person families (135 | 75.4%) have the highest median income of $36,146 per family member.
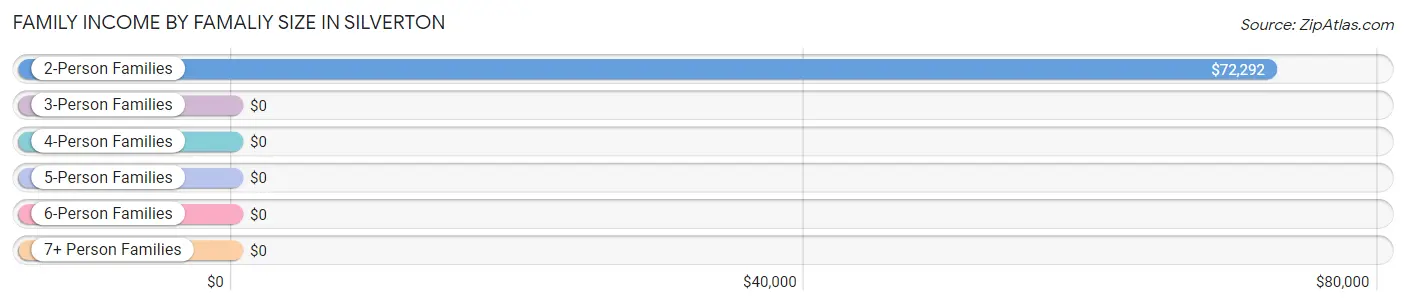
| Income Bracket | # Families | Median Income |
| 2-Person Families | 135 (75.4%) | $72,292 |
| 3-Person Families | 14 (7.8%) | $0 |
| 4-Person Families | 30 (16.8%) | $0 |
| 5-Person Families | 0 (0.0%) | $0 |
| 6-Person Families | 0 (0.0%) | $0 |
| 7+ Person Families | 0 (0.0%) | $0 |
| Total | 179 (100.0%) | $71,875 |
Family Income by Number of Earners in Silverton
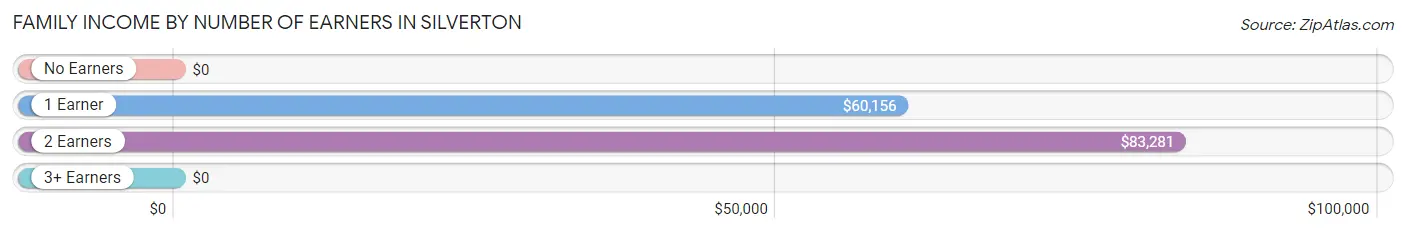
| Number of Earners | # Families | Median Income |
| No Earners | 31 (17.3%) | $0 |
| 1 Earner | 47 (26.3%) | $60,156 |
| 2 Earners | 101 (56.4%) | $83,281 |
| 3+ Earners | 0 (0.0%) | $0 |
| Total | 179 (100.0%) | $71,875 |
Household Income in Silverton
Household Income Brackets in Silverton
With 65 households falling in the category, the $50,000 to $74,999 income range is the most frequent in Silverton, accounting for 21.5% of all households. In contrast, only 11 households (3.6%) fall into the $200,000+ income bracket, making it the least populous group.
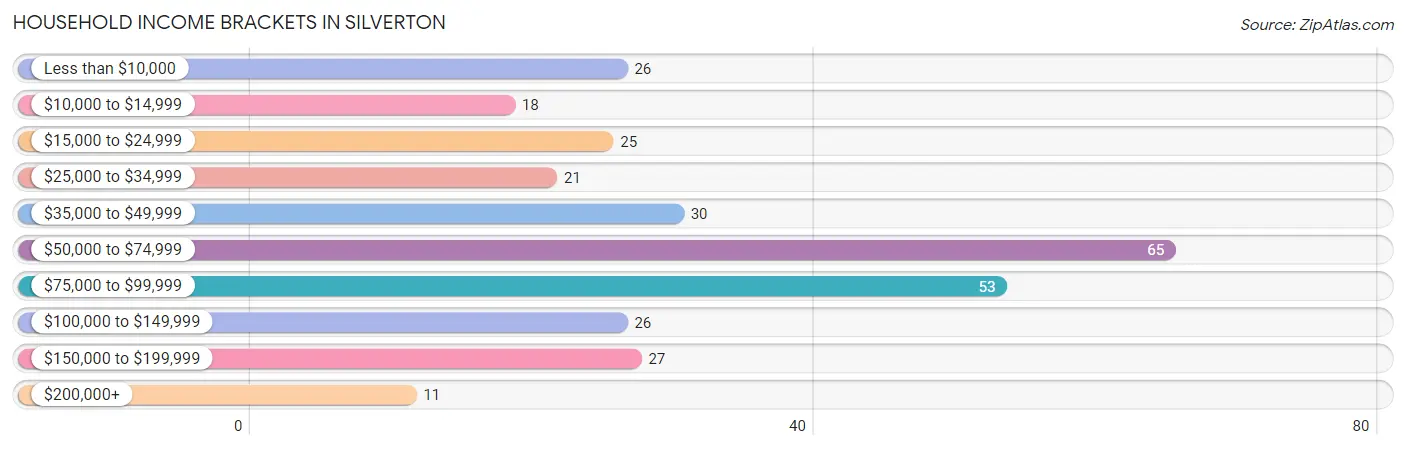
| Income Bracket | # Households | % Households |
| Less than $10,000 | 26 | 8.6% |
| $10,000 to $14,999 | 18 | 6.0% |
| $15,000 to $24,999 | 25 | 8.3% |
| $25,000 to $34,999 | 21 | 7.0% |
| $35,000 to $49,999 | 30 | 9.9% |
| $50,000 to $74,999 | 65 | 21.5% |
| $75,000 to $99,999 | 53 | 17.5% |
| $100,000 to $149,999 | 26 | 8.6% |
| $150,000 to $199,999 | 27 | 8.9% |
| $200,000+ | 11 | 3.6% |
Household Income by Householder Age in Silverton
The median household income in Silverton is $64,000, with the highest median household income of $71,848 found in the 45 to 64 years age bracket for the primary householder. A total of 82 households (27.2%) fall into this category. Meanwhile, the 15 to 24 years age bracket for the primary householder has the lowest median household income of $0, with 20 households (6.6%) in this group.
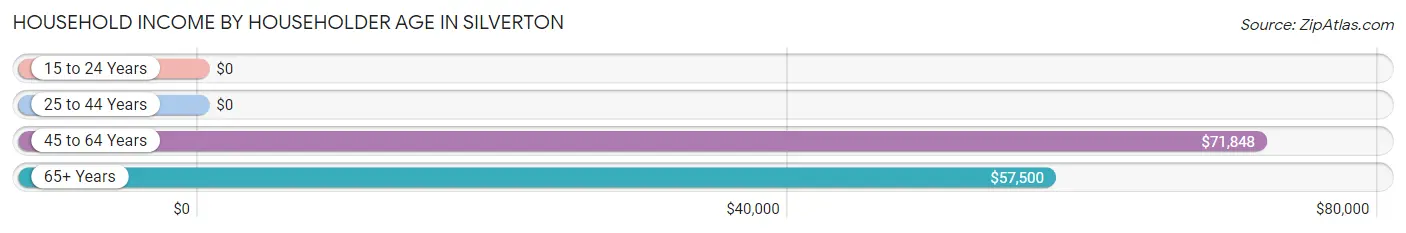
| Income Bracket | # Households | Median Income |
| 15 to 24 Years | 20 (6.6%) | $0 |
| 25 to 44 Years | 102 (33.8%) | $0 |
| 45 to 64 Years | 82 (27.2%) | $71,848 |
| 65+ Years | 98 (32.5%) | $57,500 |
| Total | 302 (100.0%) | $64,000 |
Poverty in Silverton
Income Below Poverty by Sex and Age in Silverton
With 17.7% poverty level for males and 21.1% for females among the residents of Silverton, 15 year old males and 12 to 14 year old females are the most vulnerable to poverty, with 12 males (100.0%) and 18 females (100.0%) in their respective age groups living below the poverty level.
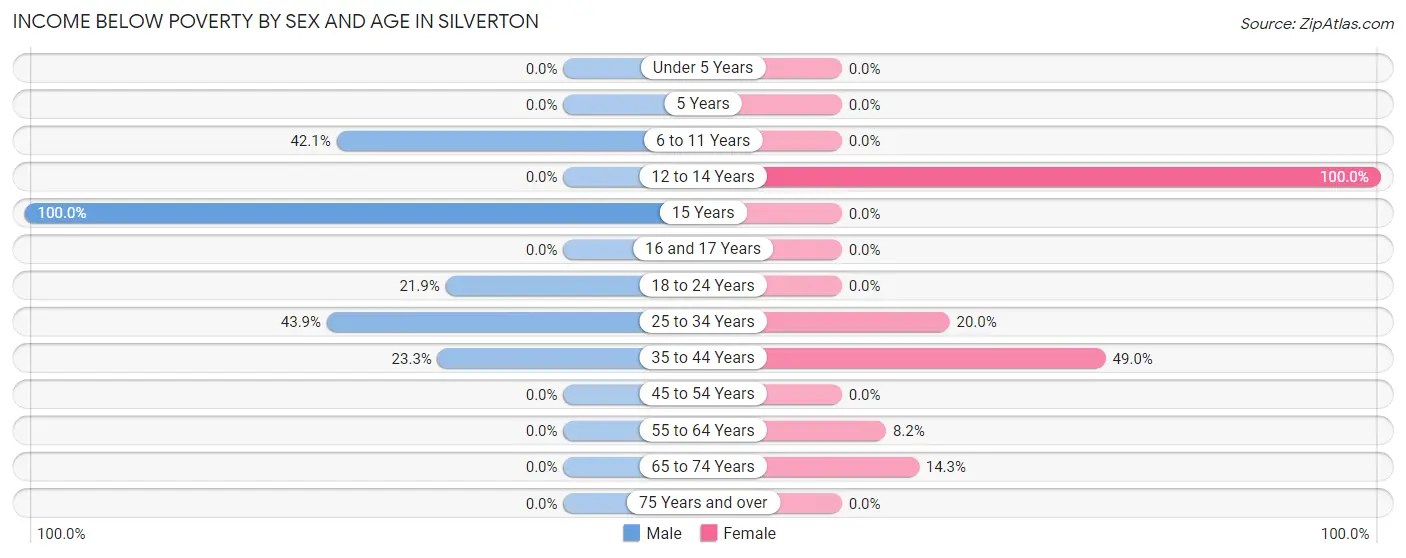
| Age Bracket | Male | Female |
| Under 5 Years | 0 (0.0%) | 0 (0.0%) |
| 5 Years | 0 (0.0%) | 0 (0.0%) |
| 6 to 11 Years | 8 (42.1%) | 0 (0.0%) |
| 12 to 14 Years | 0 (0.0%) | 18 (100.0%) |
| 15 Years | 12 (100.0%) | 0 (0.0%) |
| 16 and 17 Years | 0 (0.0%) | 0 (0.0%) |
| 18 to 24 Years | 7 (21.9%) | 0 (0.0%) |
| 25 to 34 Years | 18 (43.9%) | 6 (20.0%) |
| 35 to 44 Years | 14 (23.3%) | 24 (49.0%) |
| 45 to 54 Years | 0 (0.0%) | 0 (0.0%) |
| 55 to 64 Years | 0 (0.0%) | 5 (8.2%) |
| 65 to 74 Years | 0 (0.0%) | 6 (14.3%) |
| 75 Years and over | 0 (0.0%) | 0 (0.0%) |
| Total | 59 (17.7%) | 59 (21.1%) |
Income Above Poverty by Sex and Age in Silverton
According to the poverty statistics in Silverton, males aged under 5 years and females aged 6 to 11 years are the age groups that are most secure financially, with 100.0% of males and 100.0% of females in these age groups living above the poverty line.
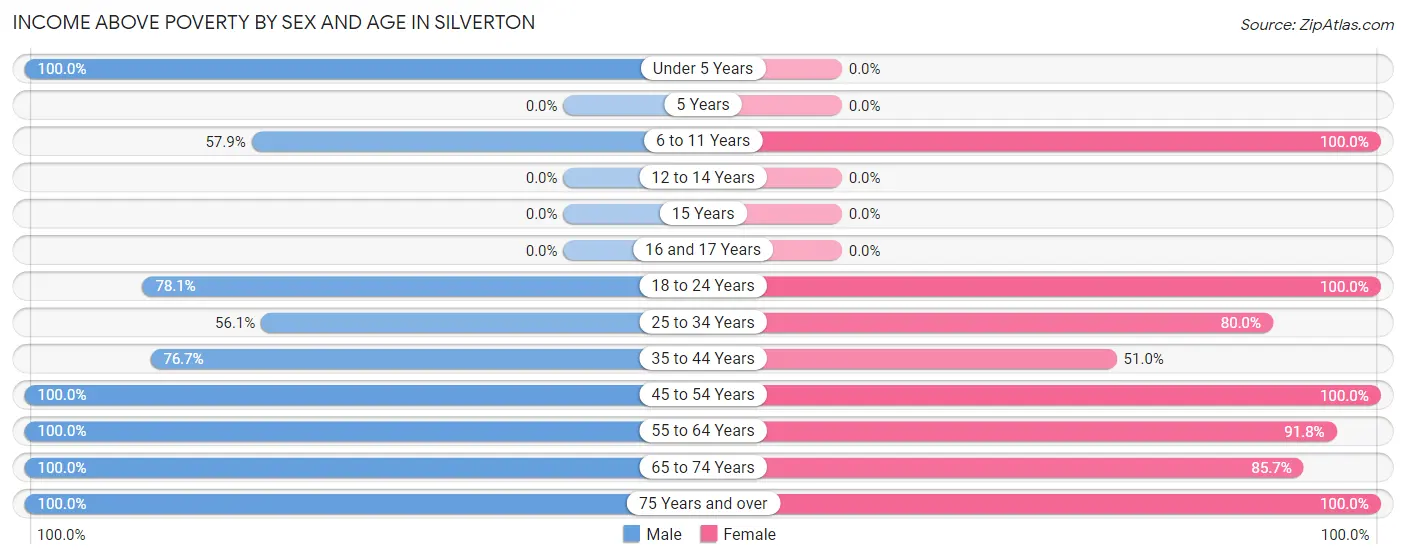
| Age Bracket | Male | Female |
| Under 5 Years | 11 (100.0%) | 0 (0.0%) |
| 5 Years | 0 (0.0%) | 0 (0.0%) |
| 6 to 11 Years | 11 (57.9%) | 10 (100.0%) |
| 12 to 14 Years | 0 (0.0%) | 0 (0.0%) |
| 15 Years | 0 (0.0%) | 0 (0.0%) |
| 16 and 17 Years | 0 (0.0%) | 0 (0.0%) |
| 18 to 24 Years | 25 (78.1%) | 20 (100.0%) |
| 25 to 34 Years | 23 (56.1%) | 24 (80.0%) |
| 35 to 44 Years | 46 (76.7%) | 25 (51.0%) |
| 45 to 54 Years | 28 (100.0%) | 23 (100.0%) |
| 55 to 64 Years | 54 (100.0%) | 56 (91.8%) |
| 65 to 74 Years | 61 (100.0%) | 36 (85.7%) |
| 75 Years and over | 15 (100.0%) | 27 (100.0%) |
| Total | 274 (82.3%) | 221 (78.9%) |
Income Below Poverty Among Married-Couple Families in Silverton
The poverty statistics for married-couple families in Silverton show that 8.6% or 14 of the total 162 families live below the poverty line. Families with 1 or 2 children have the highest poverty rate of 46.7%, comprising of 14 families. On the other hand, families with no children have the lowest poverty rate of 0.0%, which includes 0 families.
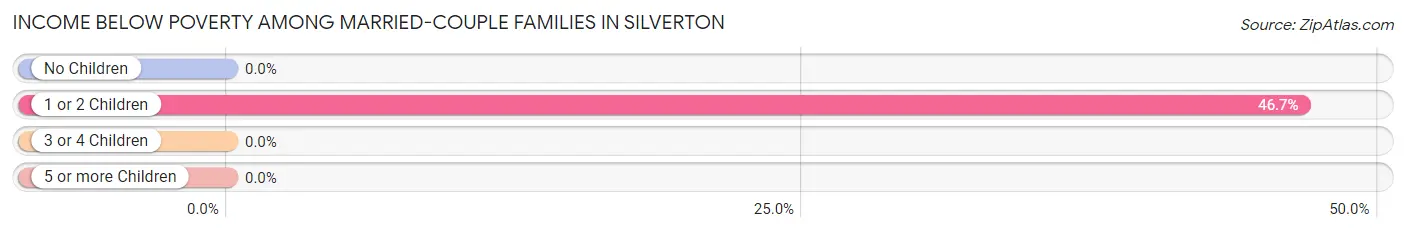
| Children | Above Poverty | Below Poverty |
| No Children | 132 (100.0%) | 0 (0.0%) |
| 1 or 2 Children | 16 (53.3%) | 14 (46.7%) |
| 3 or 4 Children | 0 (0.0%) | 0 (0.0%) |
| 5 or more Children | 0 (0.0%) | 0 (0.0%) |
| Total | 148 (91.4%) | 14 (8.6%) |
Income Below Poverty Among Single-Parent Households in Silverton
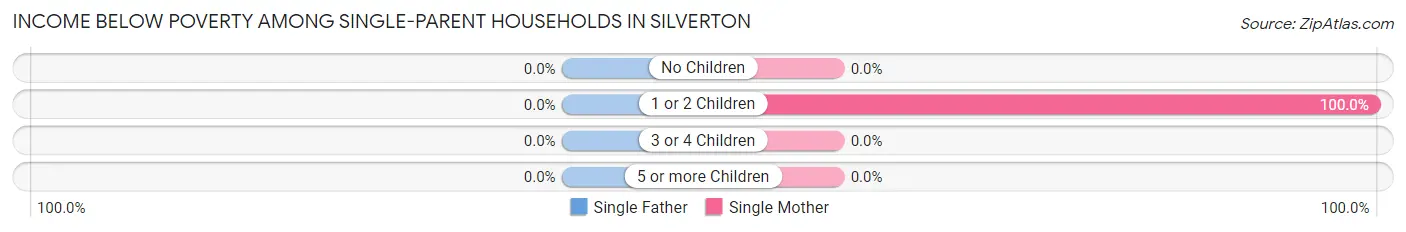
| Children | Single Father | Single Mother |
| No Children | 0 (0.0%) | 0 (0.0%) |
| 1 or 2 Children | 0 (0.0%) | 12 (100.0%) |
| 3 or 4 Children | 0 (0.0%) | 0 (0.0%) |
| 5 or more Children | 0 (0.0%) | 0 (0.0%) |
| Total | 0 (0.0%) | 12 (70.6%) |
Income Below Poverty Among Married-Couple vs Single-Parent Households in Silverton
The poverty data for Silverton shows that 14 of the married-couple family households (8.6%) and 12 of the single-parent households (70.6%) are living below the poverty level. Within the married-couple family households, those with 1 or 2 children have the highest poverty rate, with 14 households (46.7%) falling below the poverty line. Among the single-parent households, those with 1 or 2 children have the highest poverty rate, with 12 household (100.0%) living below poverty.
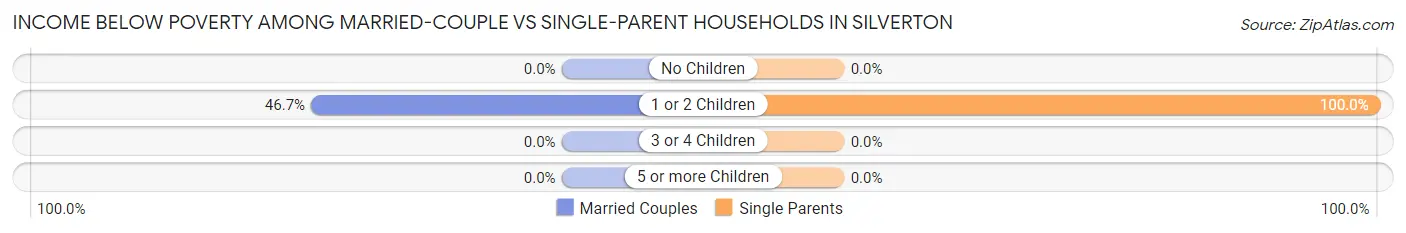
| Children | Married-Couple Families | Single-Parent Households |
| No Children | 0 (0.0%) | 0 (0.0%) |
| 1 or 2 Children | 14 (46.7%) | 12 (100.0%) |
| 3 or 4 Children | 0 (0.0%) | 0 (0.0%) |
| 5 or more Children | 0 (0.0%) | 0 (0.0%) |
| Total | 14 (8.6%) | 12 (70.6%) |
Race in Silverton
The most populous races in Silverton are White / Caucasian (553 | 90.2%), Hispanic or Latino (126 | 20.5%), and Two or more Races (60 | 9.8%).
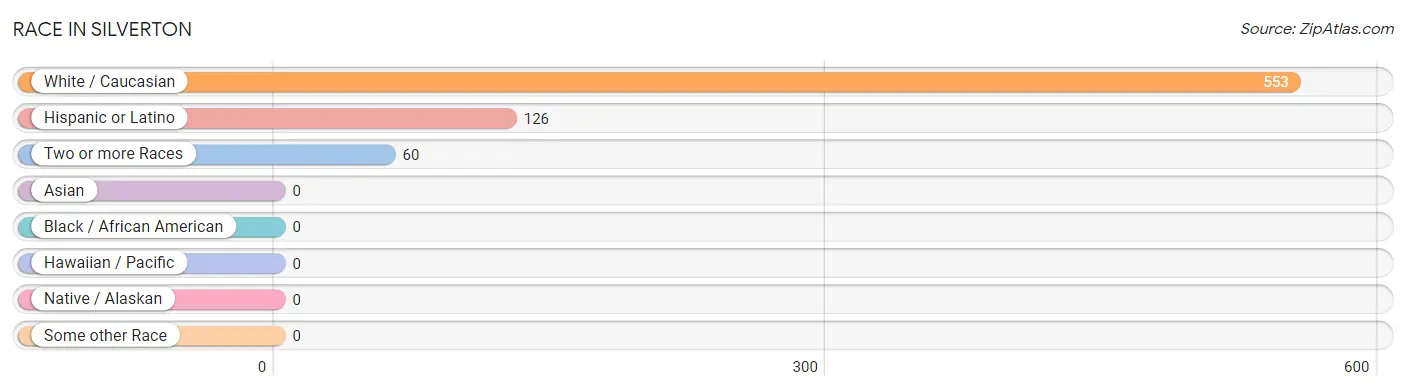
| Race | # Population | % Population |
| Asian | 0 | 0.0% |
| Black / African American | 0 | 0.0% |
| Hawaiian / Pacific | 0 | 0.0% |
| Hispanic or Latino | 126 | 20.5% |
| Native / Alaskan | 0 | 0.0% |
| White / Caucasian | 553 | 90.2% |
| Two or more Races | 60 | 9.8% |
| Some other Race | 0 | 0.0% |
| Total | 613 | 100.0% |
Ancestry in Silverton
The most populous ancestries reported in Silverton are Mexican (99 | 16.2%), German (55 | 9.0%), Irish (52 | 8.5%), Scottish (41 | 6.7%), and English (34 | 5.6%), together accounting for 45.8% of all Silverton residents.
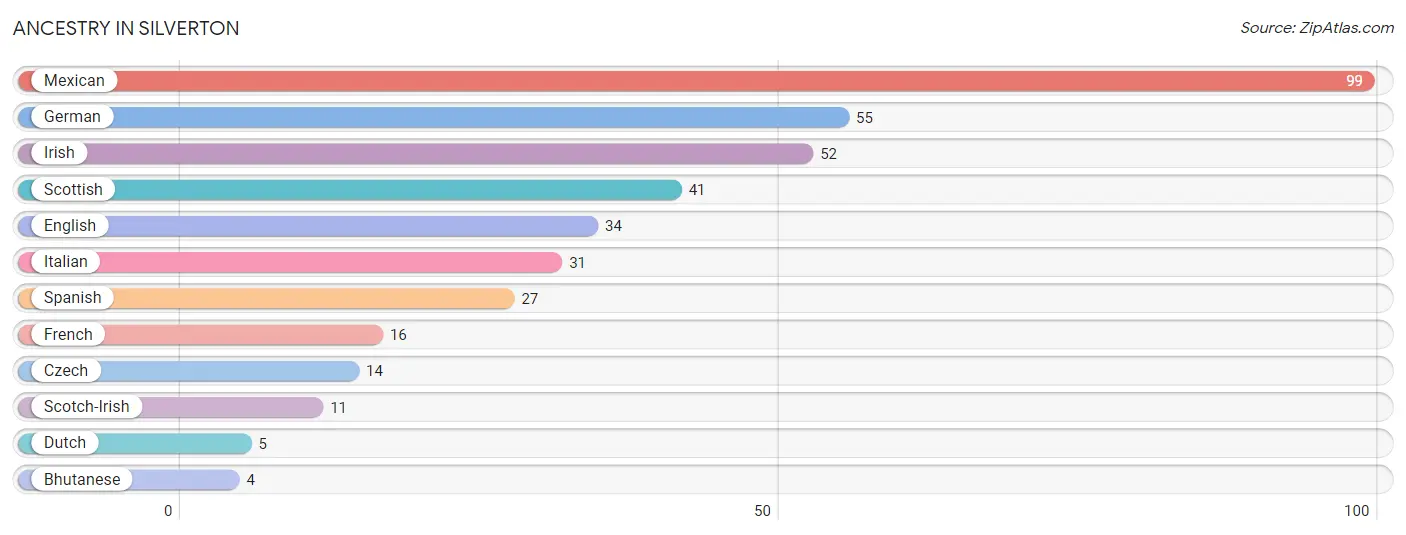
| Ancestry | # Population | % Population |
| Bhutanese | 4 | 0.6% |
| Czech | 14 | 2.3% |
| Dutch | 5 | 0.8% |
| English | 34 | 5.6% |
| French | 16 | 2.6% |
| German | 55 | 9.0% |
| Irish | 52 | 8.5% |
| Italian | 31 | 5.1% |
| Mexican | 99 | 16.2% |
| Scotch-Irish | 11 | 1.8% |
| Scottish | 41 | 6.7% |
| Spanish | 27 | 4.4% | View All 12 Rows |
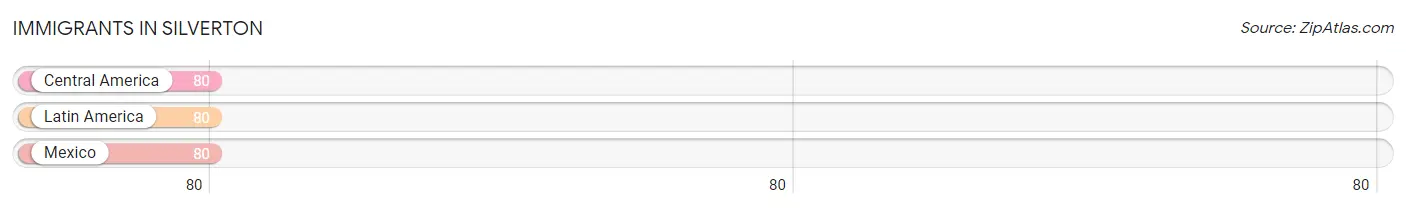
Immigrants in Silverton
The most numerous immigrant groups reported in Silverton came from Central America (80 | 13.1%), Latin America (80 | 13.1%), and Mexico (80 | 13.1%), together accounting for 39.2% of all Silverton residents.
| Immigration Origin | # Population | % Population |
| Central America | 80 | 13.1% |
| Latin America | 80 | 13.1% |
| Mexico | 80 | 13.1% | View All 3 Rows |
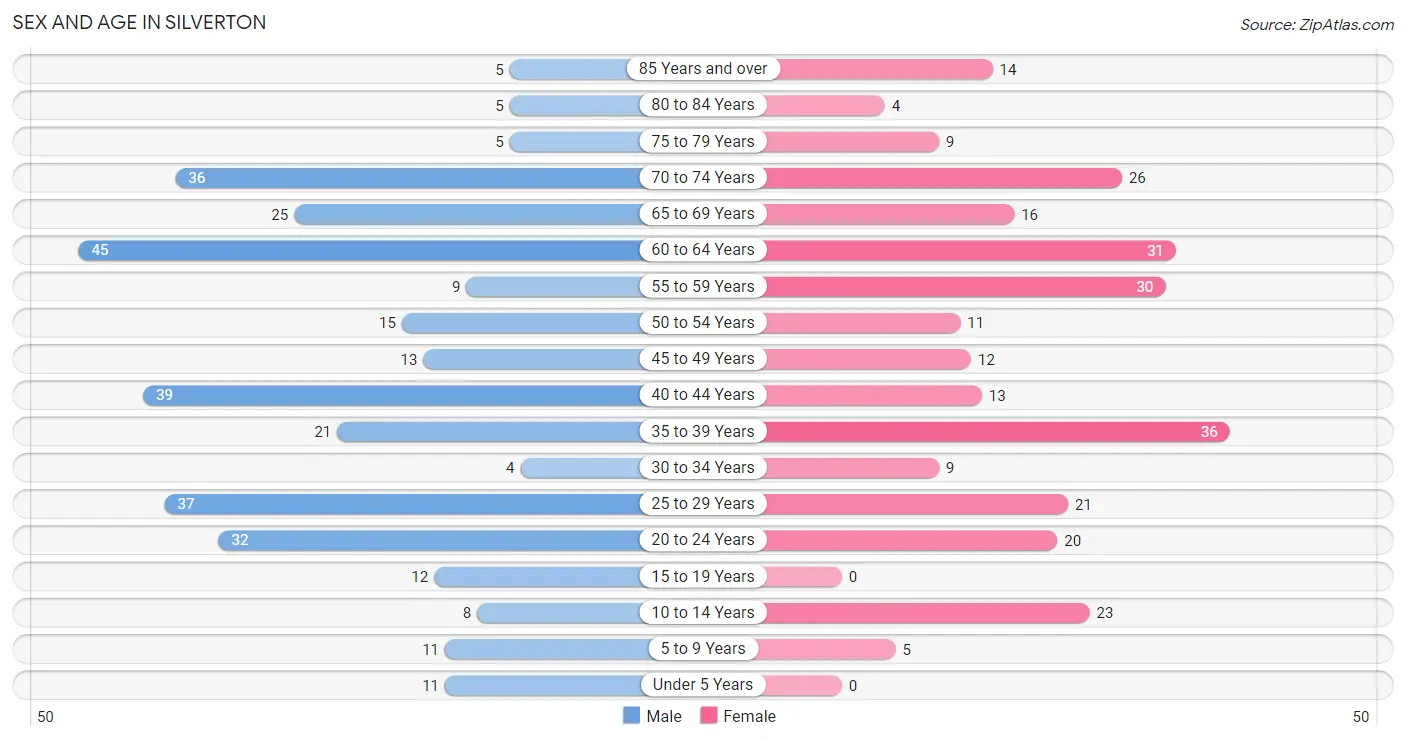
Sex and Age in Silverton
Sex and Age in Silverton
The most populous age groups in Silverton are 60 to 64 Years (45 | 13.5%) for men and 35 to 39 Years (36 | 12.9%) for women.
| Age Bracket | Male | Female |
| Under 5 Years | 11 (3.3%) | 0 (0.0%) |
| 5 to 9 Years | 11 (3.3%) | 5 (1.8%) |
| 10 to 14 Years | 8 (2.4%) | 23 (8.2%) |
| 15 to 19 Years | 12 (3.6%) | 0 (0.0%) |
| 20 to 24 Years | 32 (9.6%) | 20 (7.1%) |
| 25 to 29 Years | 37 (11.1%) | 21 (7.5%) |
| 30 to 34 Years | 4 (1.2%) | 9 (3.2%) |
| 35 to 39 Years | 21 (6.3%) | 36 (12.9%) |
| 40 to 44 Years | 39 (11.7%) | 13 (4.6%) |
| 45 to 49 Years | 13 (3.9%) | 12 (4.3%) |
| 50 to 54 Years | 15 (4.5%) | 11 (3.9%) |
| 55 to 59 Years | 9 (2.7%) | 30 (10.7%) |
| 60 to 64 Years | 45 (13.5%) | 31 (11.1%) |
| 65 to 69 Years | 25 (7.5%) | 16 (5.7%) |
| 70 to 74 Years | 36 (10.8%) | 26 (9.3%) |
| 75 to 79 Years | 5 (1.5%) | 9 (3.2%) |
| 80 to 84 Years | 5 (1.5%) | 4 (1.4%) |
| 85 Years and over | 5 (1.5%) | 14 (5.0%) |
| Total | 333 (100.0%) | 280 (100.0%) |
Families and Households in Silverton
Median Family Size in Silverton
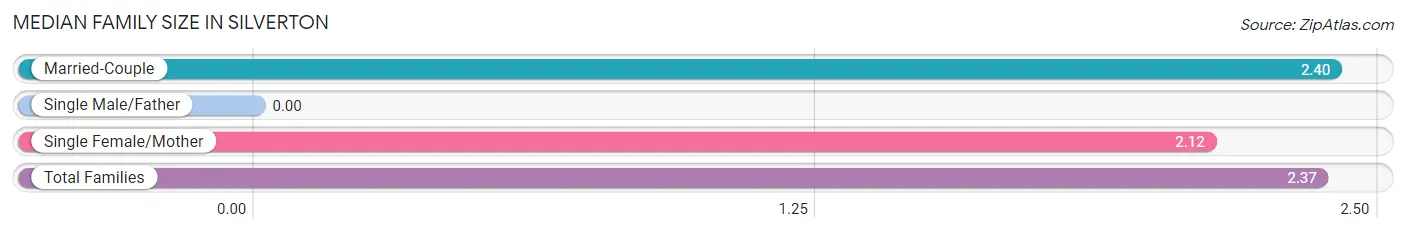
| Family Type | # Families | Family Size |
| Married-Couple | 162 (90.5%) | 2.40 |
| Single Male/Father | 0 (0.0%) | - |
| Single Female/Mother | 17 (9.5%) | 2.12 |
| Total Families | 179 (100.0%) | 2.37 |
Median Household Size in Silverton
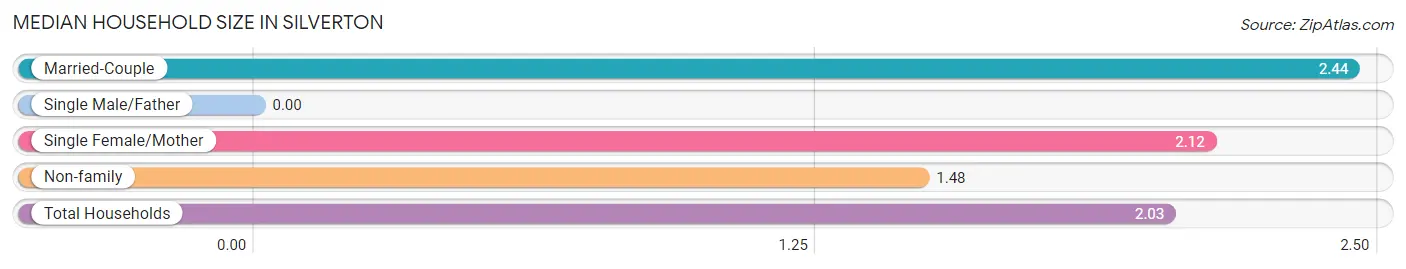
| Household Type | # Households | Household Size |
| Married-Couple | 162 (53.6%) | 2.44 |
| Single Male/Father | 0 (0.0%) | - |
| Single Female/Mother | 17 (5.6%) | 2.12 |
| Non-family | 123 (40.7%) | 1.48 |
| Total Households | 302 (100.0%) | 2.03 |
Household Size by Marriage Status in Silverton
Out of a total of 302 households in Silverton, 179 (59.3%) are family households, while 123 (40.7%) are nonfamily households. The most numerous type of family households are 2-person households, comprising 135, and the most common type of nonfamily households are 1-person households, comprising 83.
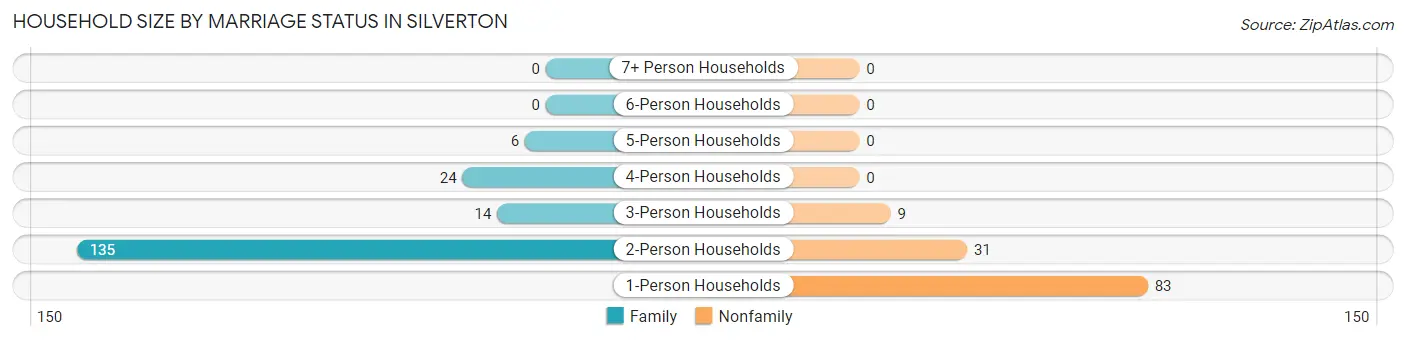
| Household Size | Family Households | Nonfamily Households |
| 1-Person Households | - | 83 (27.5%) |
| 2-Person Households | 135 (44.7%) | 31 (10.3%) |
| 3-Person Households | 14 (4.6%) | 9 (3.0%) |
| 4-Person Households | 24 (8.0%) | 0 (0.0%) |
| 5-Person Households | 6 (2.0%) | 0 (0.0%) |
| 6-Person Households | 0 (0.0%) | 0 (0.0%) |
| 7+ Person Households | 0 (0.0%) | 0 (0.0%) |
| Total | 179 (59.3%) | 123 (40.7%) |
Female Fertility in Silverton
Fertility by Age in Silverton
Average fertility rate in Silverton is 27.0 births per 1,000 women. Women in the age bracket of 20 to 34 years have the highest fertility rate with 60.0 births per 1,000 women. Women in the age bracket of 20 to 34 years acount for 100.0% of all women with births.
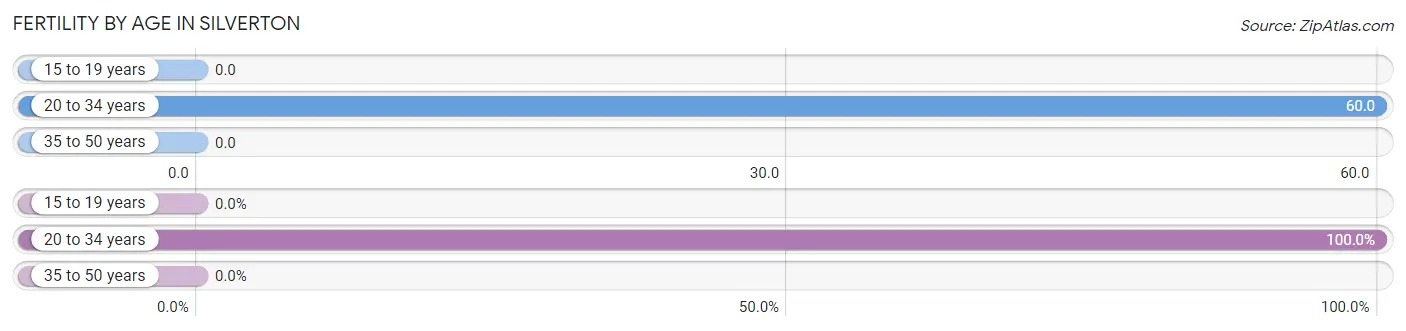
| Age Bracket | Women with Births | Births / 1,000 Women |
| 15 to 19 years | 0 (0.0%) | 0.0 |
| 20 to 34 years | 3 (100.0%) | 60.0 |
| 35 to 50 years | 0 (0.0%) | 0.0 |
| Total | 3 (100.0%) | 27.0 |
Fertility by Age by Marriage Status in Silverton
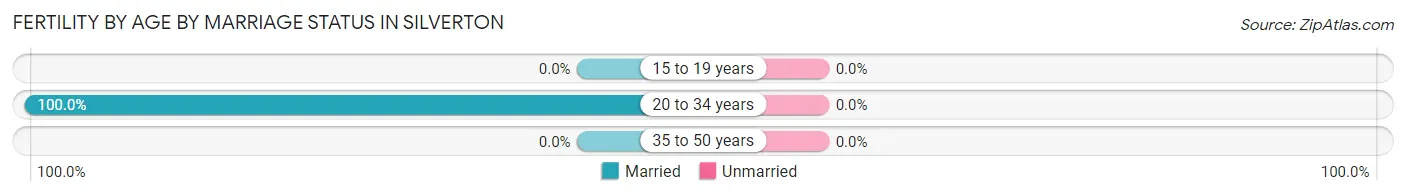
| Age Bracket | Married | Unmarried |
| 15 to 19 years | 0 (0.0%) | 0 (0.0%) |
| 20 to 34 years | 3 (100.0%) | 0 (0.0%) |
| 35 to 50 years | 0 (0.0%) | 0 (0.0%) |
| Total | 3 (100.0%) | 0 (0.0%) |
Fertility by Education in Silverton
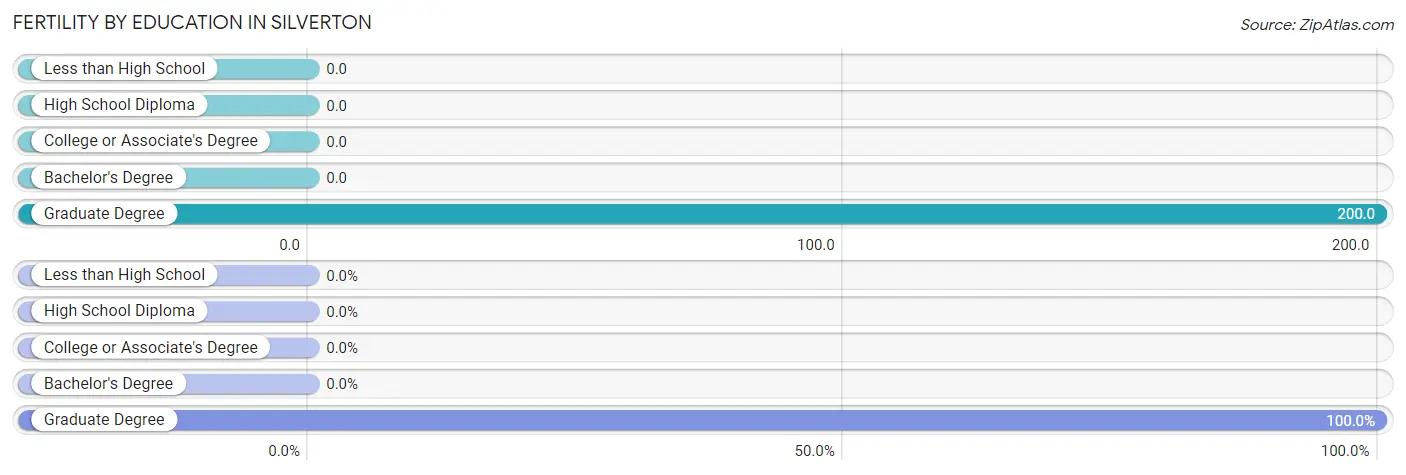
| Educational Attainment | Women with Births | Births / 1,000 Women |
| Less than High School | 0 (0.0%) | 0.0 |
| High School Diploma | 0 (0.0%) | 0.0 |
| College or Associate's Degree | 0 (0.0%) | 0.0 |
| Bachelor's Degree | 0 (0.0%) | 0.0 |
| Graduate Degree | 3 (100.0%) | 200.0 |
| Total | 3 (100.0%) | 27.0 |
Fertility by Education by Marriage Status in Silverton
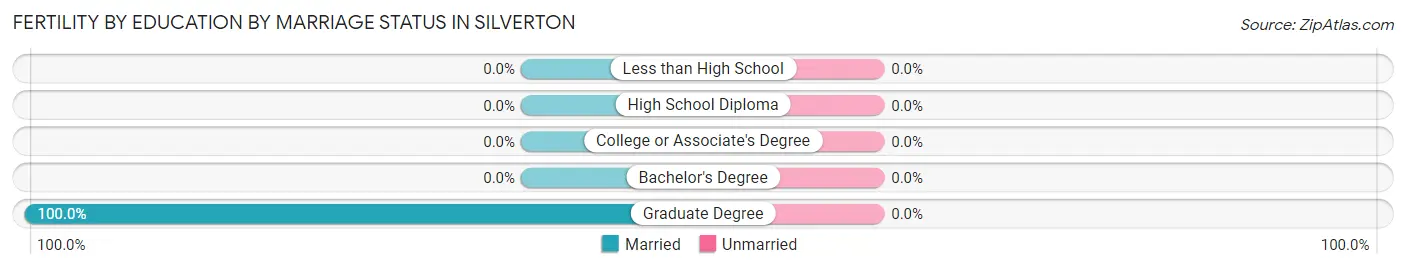
| Educational Attainment | Married | Unmarried |
| Less than High School | 0 (0.0%) | 0 (0.0%) |
| High School Diploma | 0 (0.0%) | 0 (0.0%) |
| College or Associate's Degree | 0 (0.0%) | 0 (0.0%) |
| Bachelor's Degree | 0 (0.0%) | 0 (0.0%) |
| Graduate Degree | 3 (100.0%) | 0 (0.0%) |
| Total | 3 (100.0%) | 0 (0.0%) |
Employment Characteristics in Silverton
Employment by Class of Employer in Silverton
Among the 343 employed individuals in Silverton, private company employees (161 | 46.9%), self-employed (not incorporated) (78 | 22.7%), and local government employees (65 | 19.0%) make up the most common classes of employment.
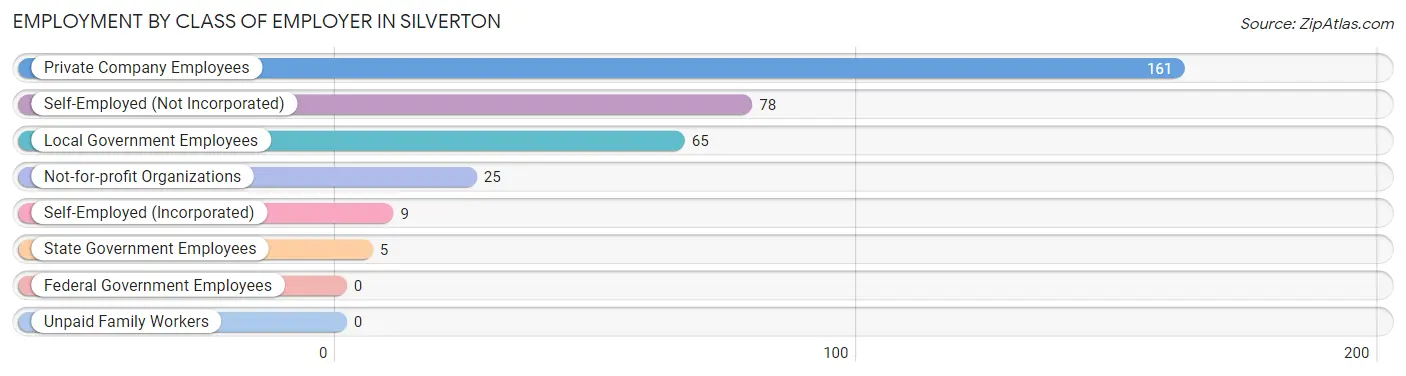
| Employer Class | # Employees | % Employees |
| Private Company Employees | 161 | 46.9% |
| Self-Employed (Incorporated) | 9 | 2.6% |
| Self-Employed (Not Incorporated) | 78 | 22.7% |
| Not-for-profit Organizations | 25 | 7.3% |
| Local Government Employees | 65 | 19.0% |
| State Government Employees | 5 | 1.5% |
| Federal Government Employees | 0 | 0.0% |
| Unpaid Family Workers | 0 | 0.0% |
| Total | 343 | 100.0% |
Employment Status by Age in Silverton
According to the labor force statistics for Silverton, out of the total population over 16 years of age (543), 70.3% or 382 individuals are in the labor force, with 7.9% or 30 of them unemployed. The age group with the highest labor force participation rate is 20 to 24 years, with 100.0% or 52 individuals in the labor force. Within the labor force, the 35 to 44 years age range has the highest percentage of unemployed individuals, with 21.1% or 23 of them being unemployed.
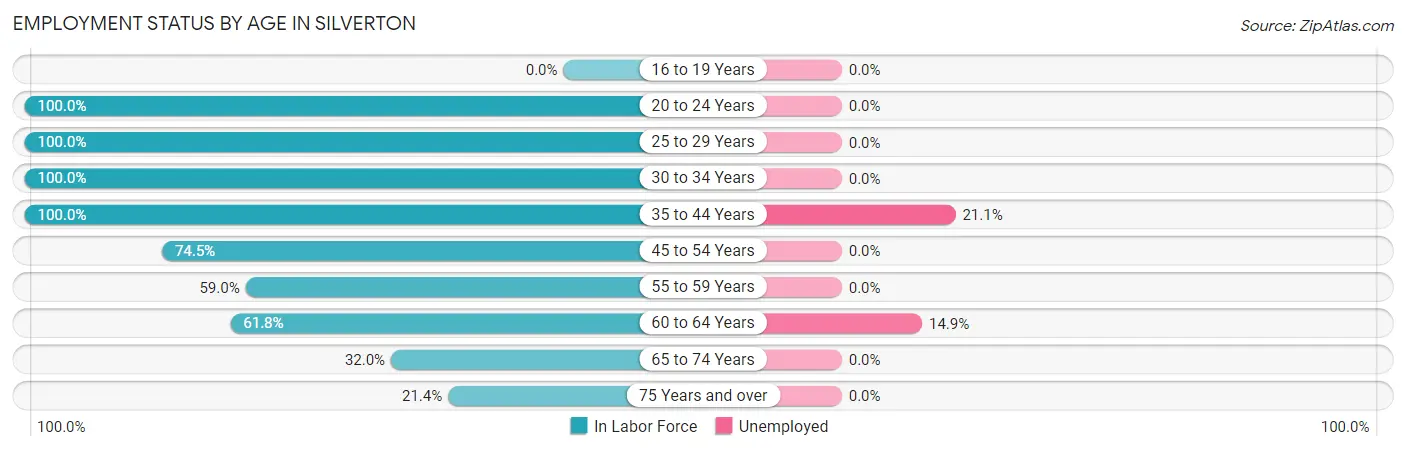
| Age Bracket | In Labor Force | Unemployed |
| 16 to 19 Years | 0 (0.0%) | 0 (0.0%) |
| 20 to 24 Years | 52 (100.0%) | 0 (0.0%) |
| 25 to 29 Years | 58 (100.0%) | 0 (0.0%) |
| 30 to 34 Years | 13 (100.0%) | 0 (0.0%) |
| 35 to 44 Years | 109 (100.0%) | 23 (21.1%) |
| 45 to 54 Years | 38 (74.5%) | 0 (0.0%) |
| 55 to 59 Years | 23 (59.0%) | 0 (0.0%) |
| 60 to 64 Years | 47 (61.8%) | 7 (14.9%) |
| 65 to 74 Years | 33 (32.0%) | 0 (0.0%) |
| 75 Years and over | 9 (21.4%) | 0 (0.0%) |
| Total | 382 (70.3%) | 30 (7.9%) |
Employment Status by Educational Attainment in Silverton
According to labor force statistics for Silverton, 83.2% of individuals (288) out of the total population between 25 and 64 years of age (346) are in the labor force, with 10.4% or 30 of them being unemployed. The group with the highest labor force participation rate are those with the educational attainment of less than high school, with 100.0% or 24 individuals in the labor force. Within the labor force, individuals with college / associate degree education have the highest percentage of unemployment, with 18.7% or 14 of them being unemployed.
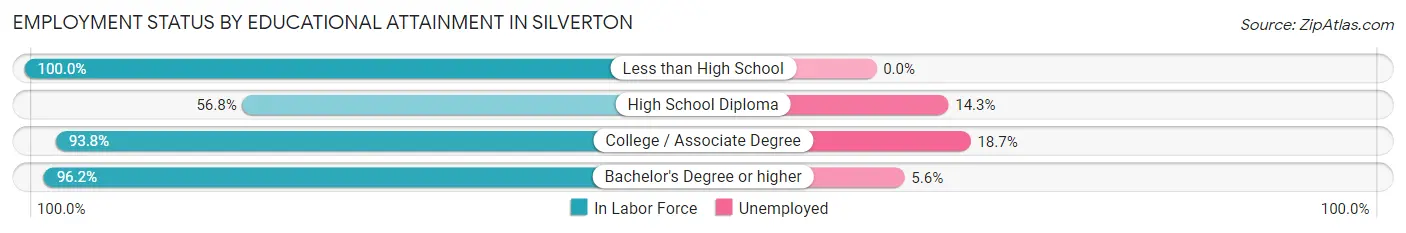
| Educational Attainment | In Labor Force | Unemployed |
| Less than High School | 24 (100.0%) | 0 (0.0%) |
| High School Diploma | 63 (56.8%) | 16 (14.3%) |
| College / Associate Degree | 75 (93.8%) | 15 (18.7%) |
| Bachelor's Degree or higher | 126 (96.2%) | 7 (5.6%) |
| Total | 288 (83.2%) | 36 (10.4%) |
Employment Occupations by Sex in Silverton
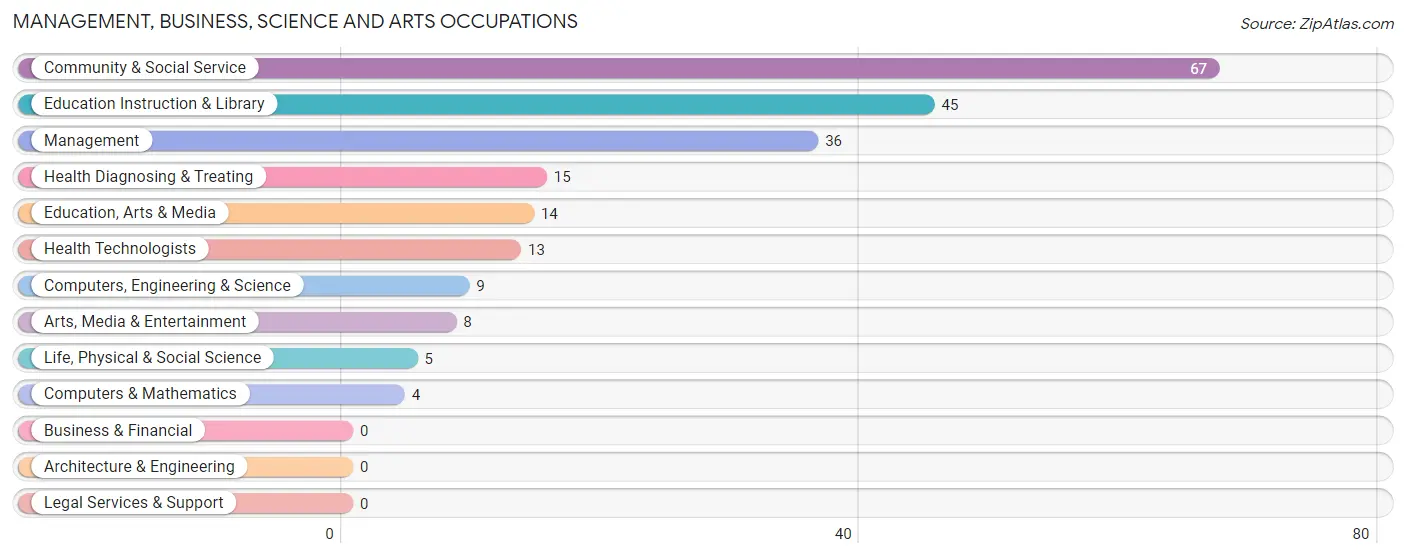
Management, Business, Science and Arts Occupations
The most common Management, Business, Science and Arts occupations in Silverton are Community & Social Service (67 | 19.0%), Education Instruction & Library (45 | 12.8%), Management (36 | 10.2%), Health Diagnosing & Treating (15 | 4.3%), and Education, Arts & Media (14 | 4.0%).
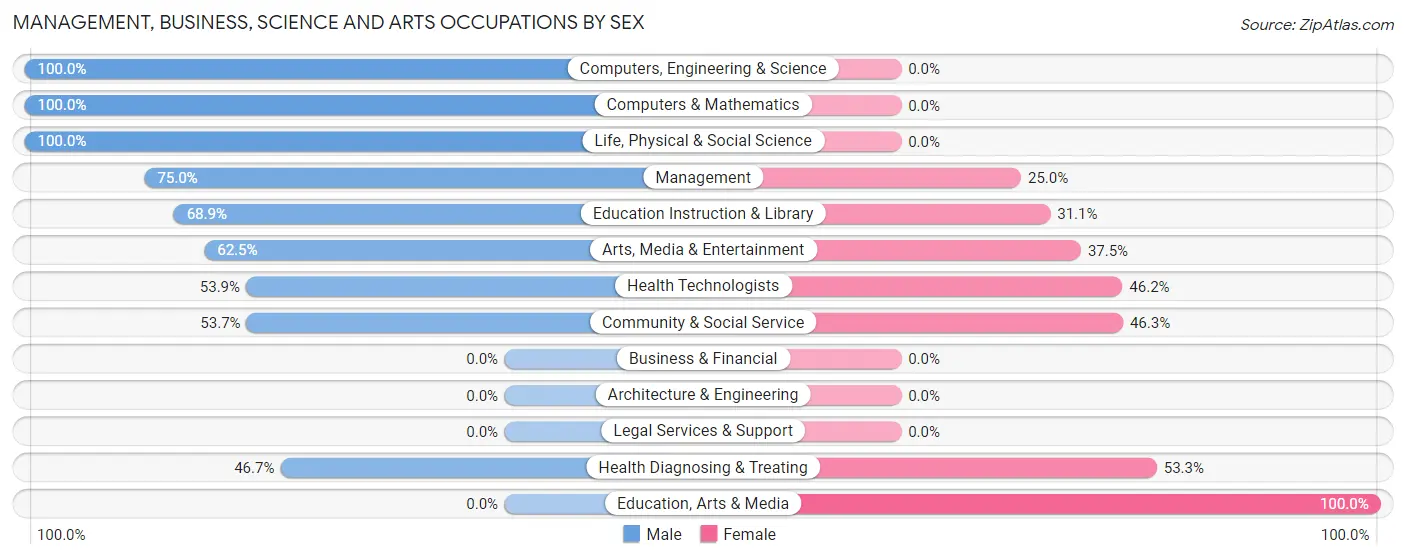
Management, Business, Science and Arts Occupations by Sex
Within the Management, Business, Science and Arts occupations in Silverton, the most male-oriented occupations are Computers, Engineering & Science (100.0%), Computers & Mathematics (100.0%), and Life, Physical & Social Science (100.0%), while the most female-oriented occupations are Education, Arts & Media (100.0%), Health Diagnosing & Treating (53.3%), and Community & Social Service (46.3%).
| Occupation | Male | Female |
| Management | 27 (75.0%) | 9 (25.0%) |
| Business & Financial | 0 (0.0%) | 0 (0.0%) |
| Computers, Engineering & Science | 9 (100.0%) | 0 (0.0%) |
| Computers & Mathematics | 4 (100.0%) | 0 (0.0%) |
| Architecture & Engineering | 0 (0.0%) | 0 (0.0%) |
| Life, Physical & Social Science | 5 (100.0%) | 0 (0.0%) |
| Community & Social Service | 36 (53.7%) | 31 (46.3%) |
| Education, Arts & Media | 0 (0.0%) | 14 (100.0%) |
| Legal Services & Support | 0 (0.0%) | 0 (0.0%) |
| Education Instruction & Library | 31 (68.9%) | 14 (31.1%) |
| Arts, Media & Entertainment | 5 (62.5%) | 3 (37.5%) |
| Health Diagnosing & Treating | 7 (46.7%) | 8 (53.3%) |
| Health Technologists | 7 (53.8%) | 6 (46.2%) |
| Total (Category) | 79 (62.2%) | 48 (37.8%) |
| Total (Overall) | 218 (61.9%) | 134 (38.1%) |
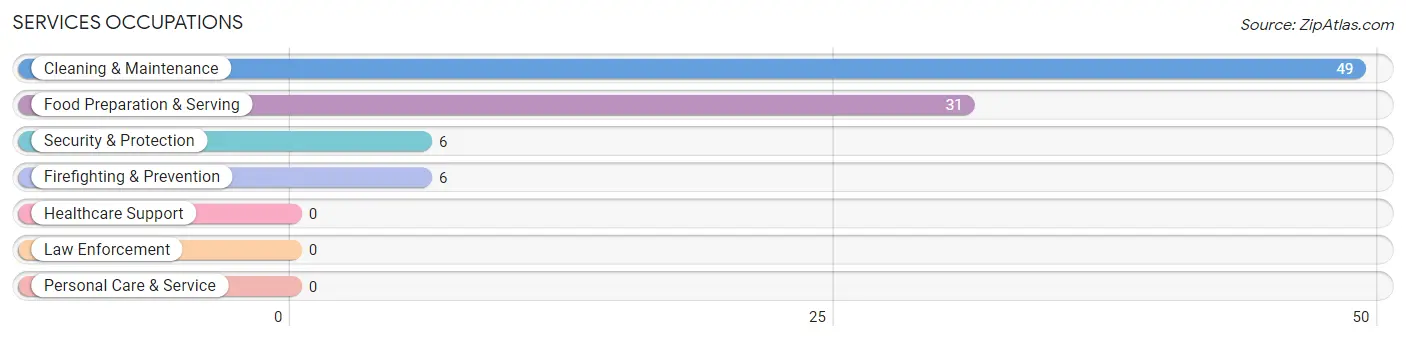
Services Occupations
The most common Services occupations in Silverton are Cleaning & Maintenance (49 | 13.9%), Food Preparation & Serving (31 | 8.8%), Security & Protection (6 | 1.7%), and Firefighting & Prevention (6 | 1.7%).
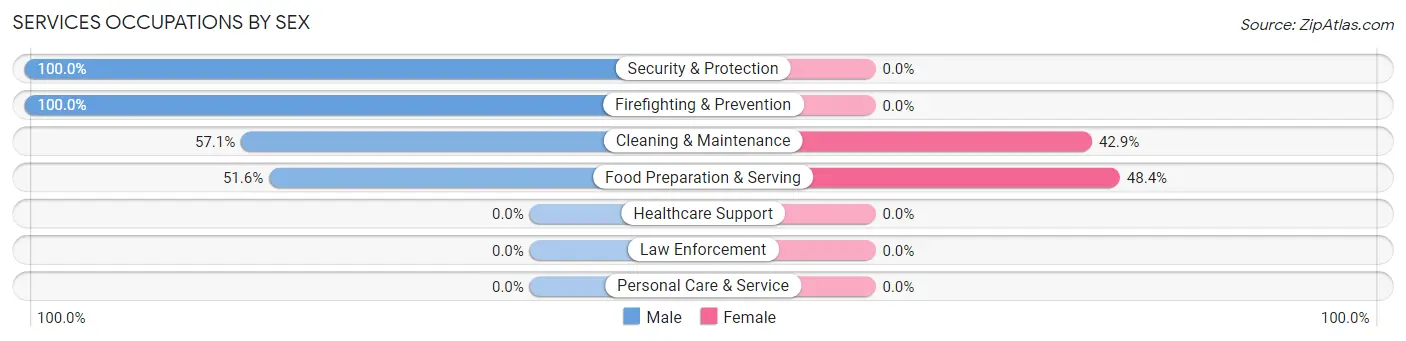
Services Occupations by Sex
Within the Services occupations in Silverton, the most male-oriented occupations are Security & Protection (100.0%), Firefighting & Prevention (100.0%), and Cleaning & Maintenance (57.1%), while the most female-oriented occupations are Food Preparation & Serving (48.4%), and Cleaning & Maintenance (42.9%).
| Occupation | Male | Female |
| Healthcare Support | 0 (0.0%) | 0 (0.0%) |
| Security & Protection | 6 (100.0%) | 0 (0.0%) |
| Firefighting & Prevention | 6 (100.0%) | 0 (0.0%) |
| Law Enforcement | 0 (0.0%) | 0 (0.0%) |
| Food Preparation & Serving | 16 (51.6%) | 15 (48.4%) |
| Cleaning & Maintenance | 28 (57.1%) | 21 (42.9%) |
| Personal Care & Service | 0 (0.0%) | 0 (0.0%) |
| Total (Category) | 50 (58.1%) | 36 (41.9%) |
| Total (Overall) | 218 (61.9%) | 134 (38.1%) |
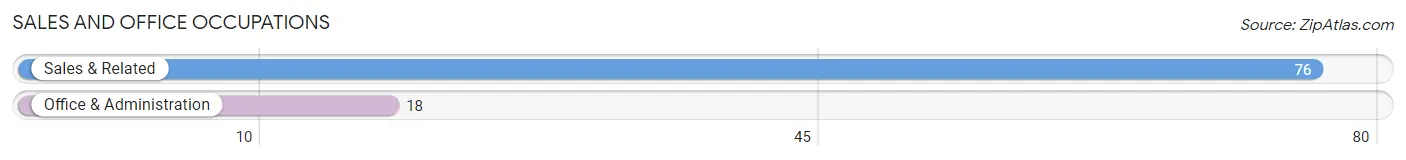
Sales and Office Occupations
The most common Sales and Office occupations in Silverton are Sales & Related (76 | 21.6%), and Office & Administration (18 | 5.1%).
Sales and Office Occupations by Sex
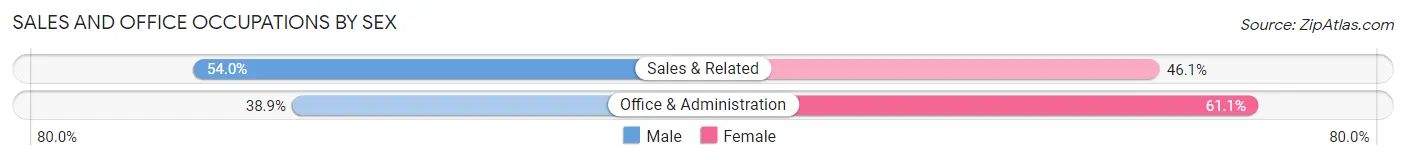
| Occupation | Male | Female |
| Sales & Related | 41 (53.9%) | 35 (46.1%) |
| Office & Administration | 7 (38.9%) | 11 (61.1%) |
| Total (Category) | 48 (51.1%) | 46 (48.9%) |
| Total (Overall) | 218 (61.9%) | 134 (38.1%) |
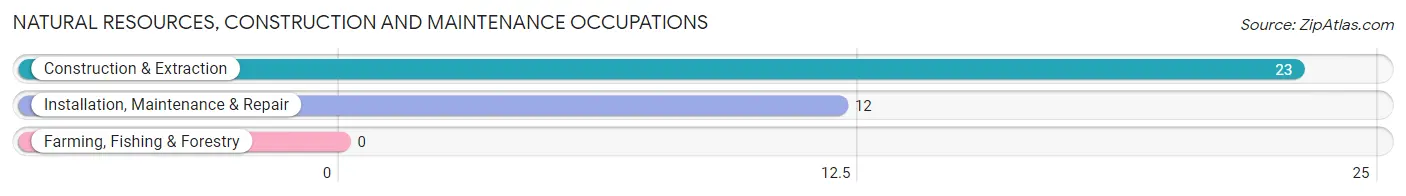
Natural Resources, Construction and Maintenance Occupations
The most common Natural Resources, Construction and Maintenance occupations in Silverton are Construction & Extraction (23 | 6.5%), and Installation, Maintenance & Repair (12 | 3.4%).
Natural Resources, Construction and Maintenance Occupations by Sex
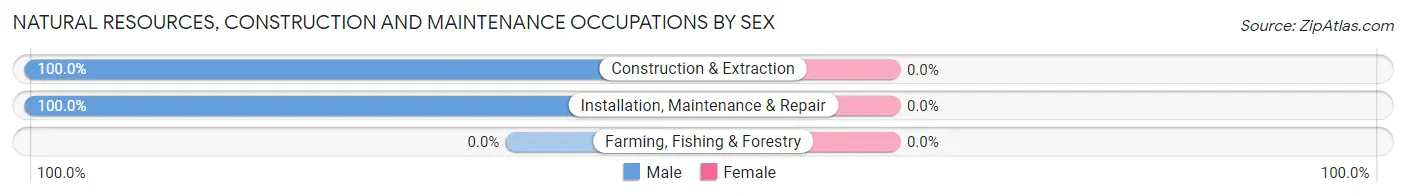
| Occupation | Male | Female |
| Farming, Fishing & Forestry | 0 (0.0%) | 0 (0.0%) |
| Construction & Extraction | 23 (100.0%) | 0 (0.0%) |
| Installation, Maintenance & Repair | 12 (100.0%) | 0 (0.0%) |
| Total (Category) | 35 (100.0%) | 0 (0.0%) |
| Total (Overall) | 218 (61.9%) | 134 (38.1%) |
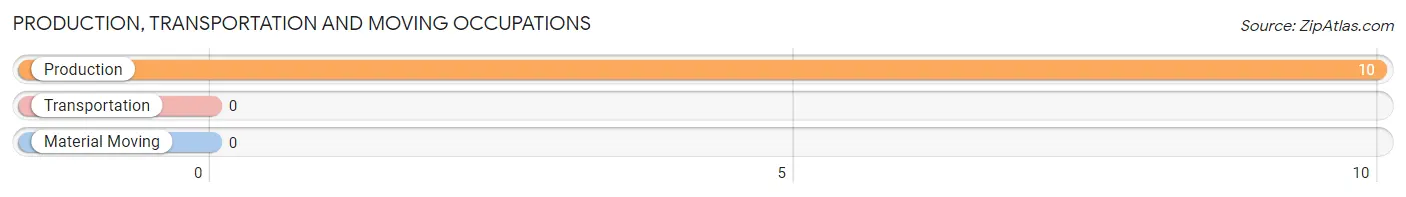
Production, Transportation and Moving Occupations
The most common Production, Transportation and Moving occupations in Silverton are , and Production (10 | 2.8%).
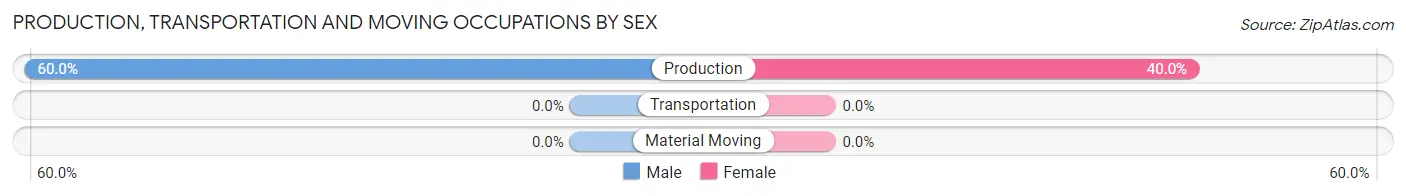
Production, Transportation and Moving Occupations by Sex
| Occupation | Male | Female |
| Production | 6 (60.0%) | 4 (40.0%) |
| Transportation | 0 (0.0%) | 0 (0.0%) |
| Material Moving | 0 (0.0%) | 0 (0.0%) |
| Total (Category) | 6 (60.0%) | 4 (40.0%) |
| Total (Overall) | 218 (61.9%) | 134 (38.1%) |
Employment Industries by Sex in Silverton
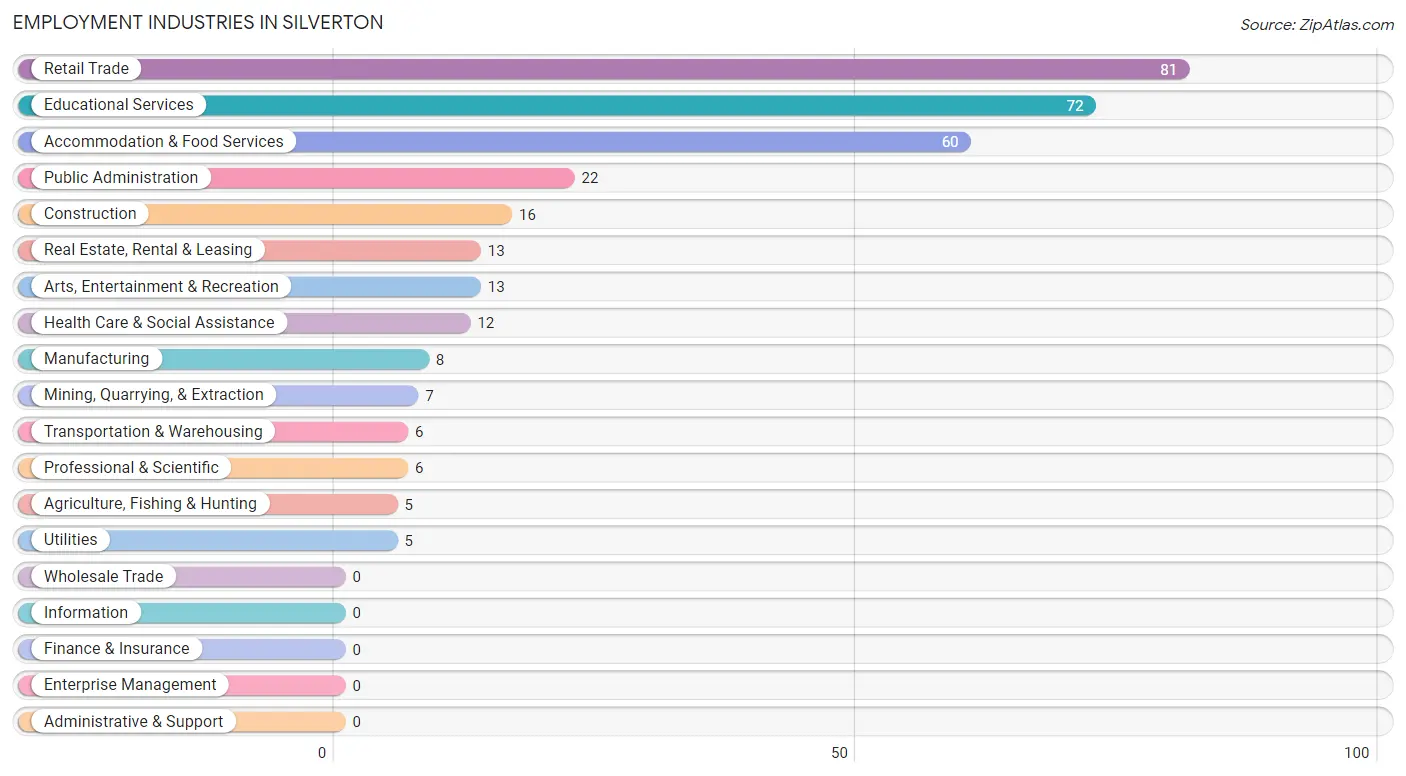
Employment Industries in Silverton
The major employment industries in Silverton include Retail Trade (81 | 23.0%), Educational Services (72 | 20.4%), Accommodation & Food Services (60 | 17.1%), Public Administration (22 | 6.2%), and Construction (16 | 4.5%).
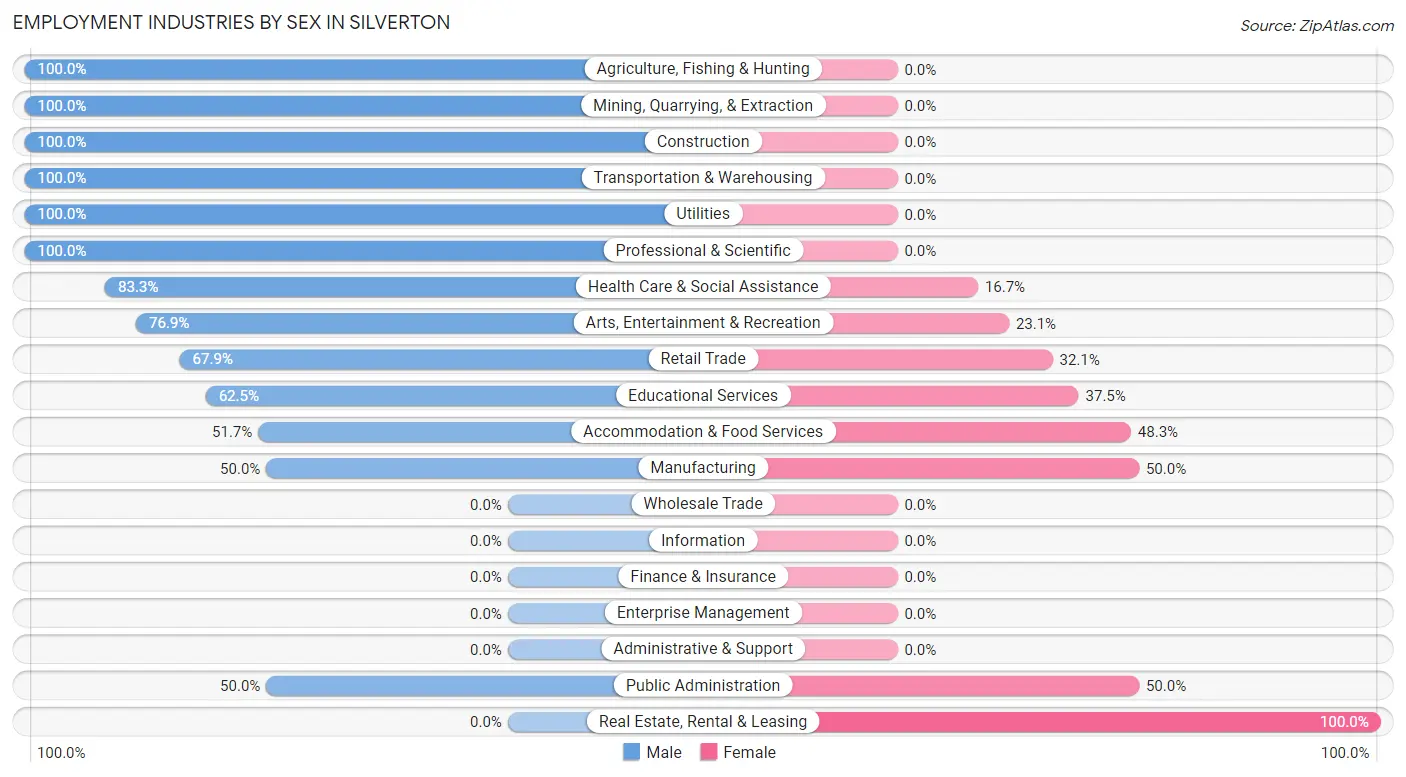
Employment Industries by Sex in Silverton
The Silverton industries that see more men than women are Agriculture, Fishing & Hunting (100.0%), Mining, Quarrying, & Extraction (100.0%), and Construction (100.0%), whereas the industries that tend to have a higher number of women are Real Estate, Rental & Leasing (100.0%), Manufacturing (50.0%), and Public Administration (50.0%).
| Industry | Male | Female |
| Agriculture, Fishing & Hunting | 5 (100.0%) | 0 (0.0%) |
| Mining, Quarrying, & Extraction | 7 (100.0%) | 0 (0.0%) |
| Construction | 16 (100.0%) | 0 (0.0%) |
| Manufacturing | 4 (50.0%) | 4 (50.0%) |
| Wholesale Trade | 0 (0.0%) | 0 (0.0%) |
| Retail Trade | 55 (67.9%) | 26 (32.1%) |
| Transportation & Warehousing | 6 (100.0%) | 0 (0.0%) |
| Utilities | 5 (100.0%) | 0 (0.0%) |
| Information | 0 (0.0%) | 0 (0.0%) |
| Finance & Insurance | 0 (0.0%) | 0 (0.0%) |
| Real Estate, Rental & Leasing | 0 (0.0%) | 13 (100.0%) |
| Professional & Scientific | 6 (100.0%) | 0 (0.0%) |
| Enterprise Management | 0 (0.0%) | 0 (0.0%) |
| Administrative & Support | 0 (0.0%) | 0 (0.0%) |
| Educational Services | 45 (62.5%) | 27 (37.5%) |
| Health Care & Social Assistance | 10 (83.3%) | 2 (16.7%) |
| Arts, Entertainment & Recreation | 10 (76.9%) | 3 (23.1%) |
| Accommodation & Food Services | 31 (51.7%) | 29 (48.3%) |
| Public Administration | 11 (50.0%) | 11 (50.0%) |
| Total | 218 (61.9%) | 134 (38.1%) |
Education in Silverton
School Enrollment in Silverton
The most common levels of schooling among the 70 students in Silverton are middle school (31 | 44.3%), elementary school (16 | 22.9%), and high school (12 | 17.1%).
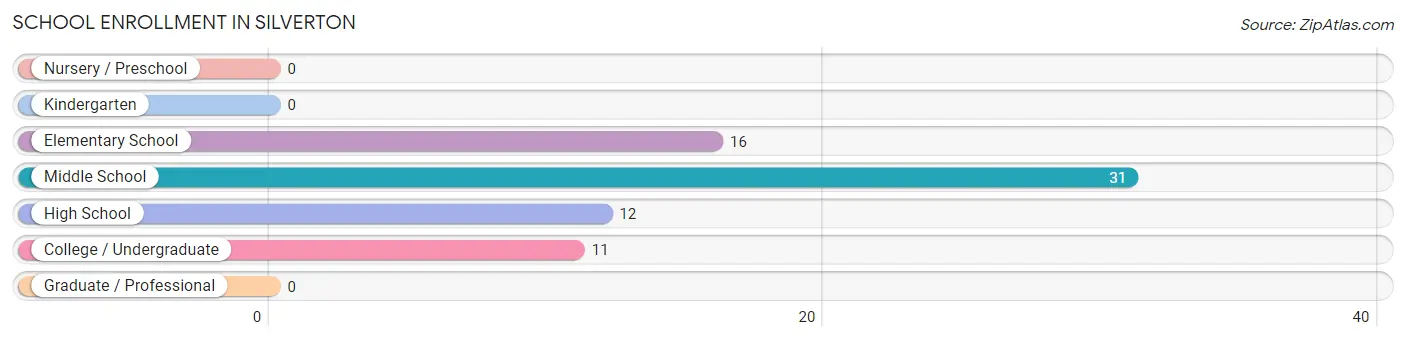
| School Level | # Students | % Students |
| Nursery / Preschool | 0 | 0.0% |
| Kindergarten | 0 | 0.0% |
| Elementary School | 16 | 22.9% |
| Middle School | 31 | 44.3% |
| High School | 12 | 17.1% |
| College / Undergraduate | 11 | 15.7% |
| Graduate / Professional | 0 | 0.0% |
| Total | 70 | 100.0% |
School Enrollment by Age by Funding Source in Silverton
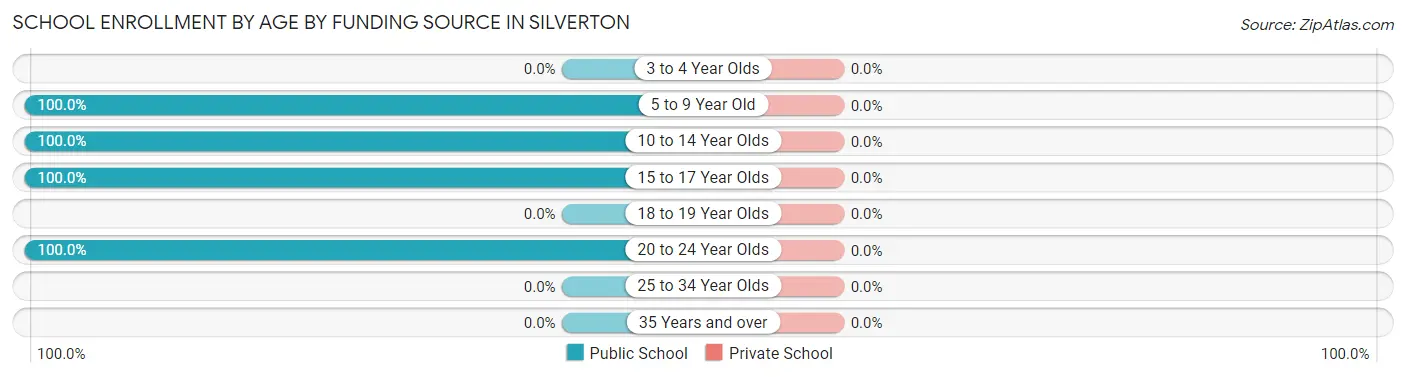
| Age Bracket | Public School | Private School |
| 3 to 4 Year Olds | 0 (0.0%) | 0 (0.0%) |
| 5 to 9 Year Old | 16 (100.0%) | 0 (0.0%) |
| 10 to 14 Year Olds | 31 (100.0%) | 0 (0.0%) |
| 15 to 17 Year Olds | 12 (100.0%) | 0 (0.0%) |
| 18 to 19 Year Olds | 0 (0.0%) | 0 (0.0%) |
| 20 to 24 Year Olds | 11 (100.0%) | 0 (0.0%) |
| 25 to 34 Year Olds | 0 (0.0%) | 0 (0.0%) |
| 35 Years and over | 0 (0.0%) | 0 (0.0%) |
| Total | 70 (100.0%) | 0 (0.0%) |
Educational Attainment by Field of Study in Silverton
Bio, nature & agricultural (38 | 20.4%), business (30 | 16.1%), education (27 | 14.5%), engineering (22 | 11.8%), and arts & humanities (20 | 10.7%) are the most common fields of study among 186 individuals in Silverton who have obtained a bachelor's degree or higher.
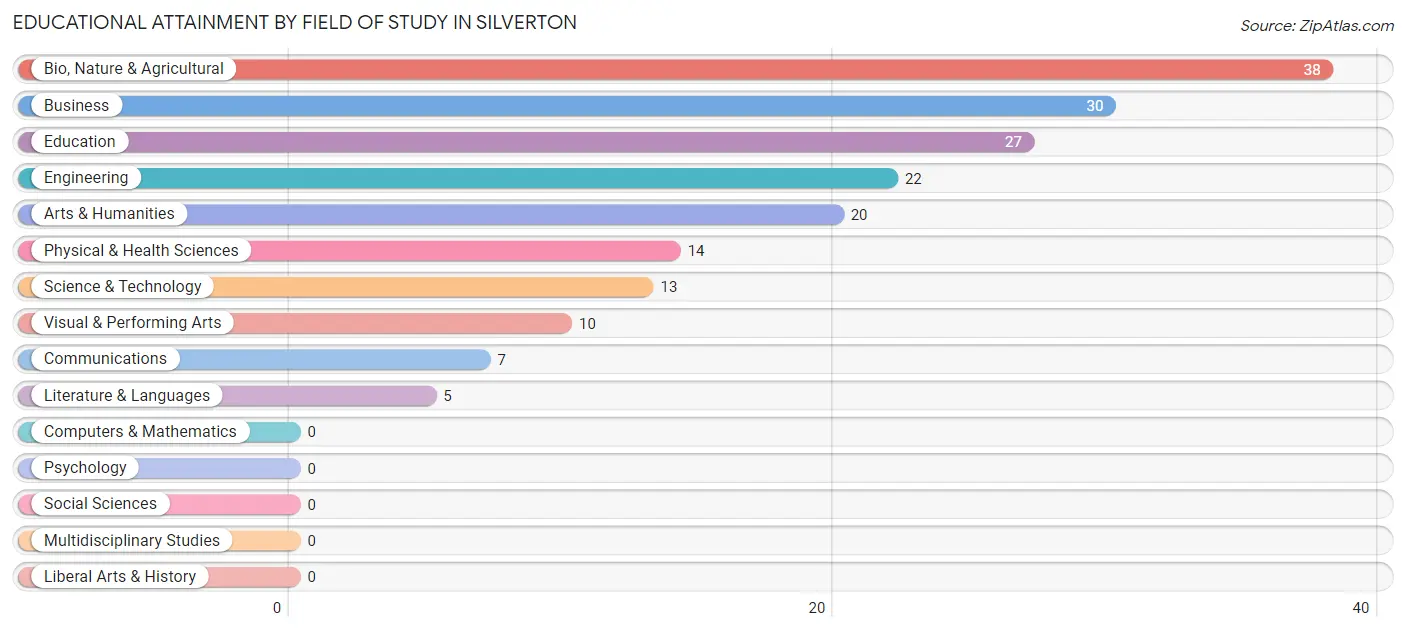
| Field of Study | # Graduates | % Graduates |
| Computers & Mathematics | 0 | 0.0% |
| Bio, Nature & Agricultural | 38 | 20.4% |
| Physical & Health Sciences | 14 | 7.5% |
| Psychology | 0 | 0.0% |
| Social Sciences | 0 | 0.0% |
| Engineering | 22 | 11.8% |
| Multidisciplinary Studies | 0 | 0.0% |
| Science & Technology | 13 | 7.0% |
| Business | 30 | 16.1% |
| Education | 27 | 14.5% |
| Literature & Languages | 5 | 2.7% |
| Liberal Arts & History | 0 | 0.0% |
| Visual & Performing Arts | 10 | 5.4% |
| Communications | 7 | 3.8% |
| Arts & Humanities | 20 | 10.7% |
| Total | 186 | 100.0% |
Transportation & Commute in Silverton
Vehicle Availability by Sex in Silverton
The most prevalent vehicle ownership categories in Silverton are males with 2 vehicles (132, accounting for 62.3%) and females with 2 vehicles (76, making up 100.8%).
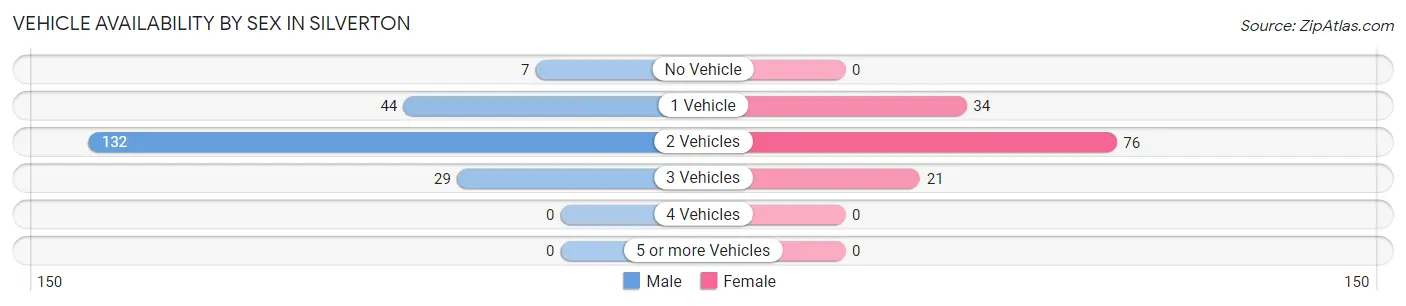
| Vehicles Available | Male | Female |
| No Vehicle | 7 (3.3%) | 0 (0.0%) |
| 1 Vehicle | 44 (20.7%) | 34 (26.0%) |
| 2 Vehicles | 132 (62.3%) | 76 (58.0%) |
| 3 Vehicles | 29 (13.7%) | 21 (16.0%) |
| 4 Vehicles | 0 (0.0%) | 0 (0.0%) |
| 5 or more Vehicles | 0 (0.0%) | 0 (0.0%) |
| Total | 212 (100.0%) | 131 (100.0%) |
Commute Time in Silverton
The most frequently occuring commute durations in Silverton are 5 to 9 minutes (161 commuters, 54.2%), 10 to 14 minutes (45 commuters, 15.1%), and less than 5 minutes (26 commuters, 8.7%).
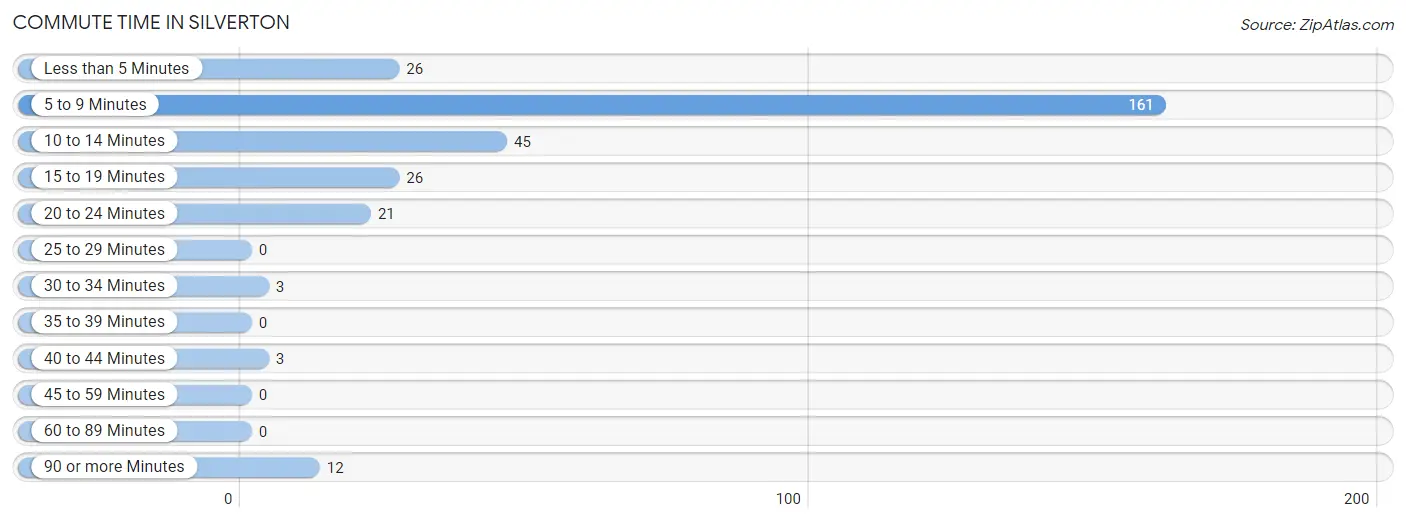
| Commute Time | # Commuters | % Commuters |
| Less than 5 Minutes | 26 | 8.7% |
| 5 to 9 Minutes | 161 | 54.2% |
| 10 to 14 Minutes | 45 | 15.1% |
| 15 to 19 Minutes | 26 | 8.7% |
| 20 to 24 Minutes | 21 | 7.1% |
| 25 to 29 Minutes | 0 | 0.0% |
| 30 to 34 Minutes | 3 | 1.0% |
| 35 to 39 Minutes | 0 | 0.0% |
| 40 to 44 Minutes | 3 | 1.0% |
| 45 to 59 Minutes | 0 | 0.0% |
| 60 to 89 Minutes | 0 | 0.0% |
| 90 or more Minutes | 12 | 4.0% |
Commute Time by Sex in Silverton
The most common commute times in Silverton are 5 to 9 minutes (112 commuters, 58.0%) for males and 5 to 9 minutes (49 commuters, 47.1%) for females.
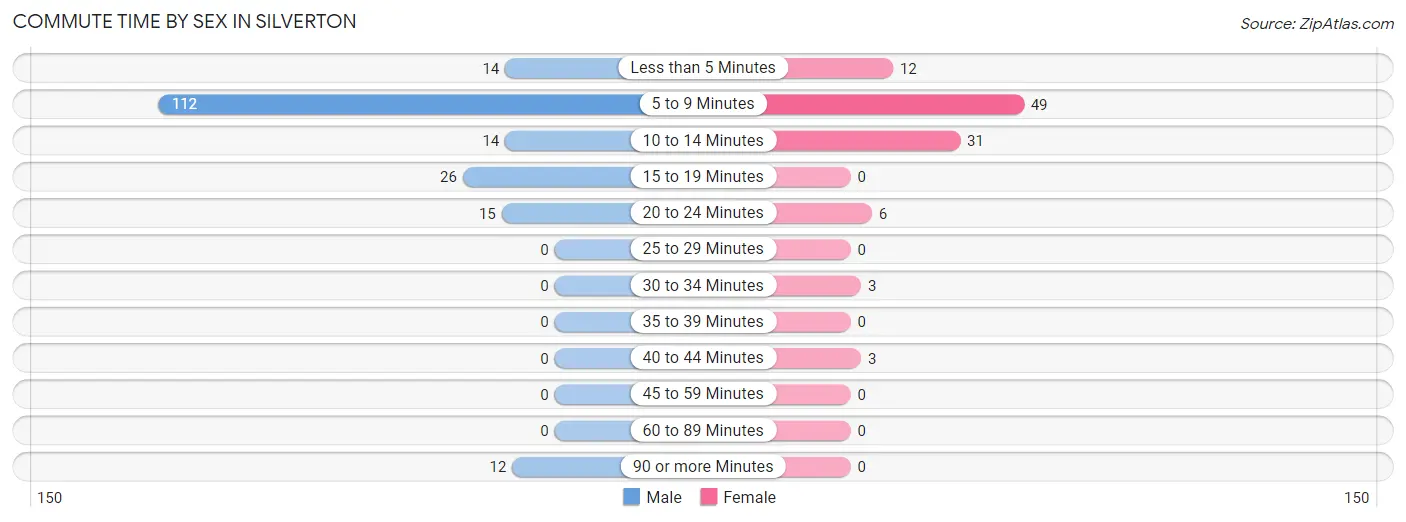
| Commute Time | Male | Female |
| Less than 5 Minutes | 14 (7.2%) | 12 (11.5%) |
| 5 to 9 Minutes | 112 (58.0%) | 49 (47.1%) |
| 10 to 14 Minutes | 14 (7.2%) | 31 (29.8%) |
| 15 to 19 Minutes | 26 (13.5%) | 0 (0.0%) |
| 20 to 24 Minutes | 15 (7.8%) | 6 (5.8%) |
| 25 to 29 Minutes | 0 (0.0%) | 0 (0.0%) |
| 30 to 34 Minutes | 0 (0.0%) | 3 (2.9%) |
| 35 to 39 Minutes | 0 (0.0%) | 0 (0.0%) |
| 40 to 44 Minutes | 0 (0.0%) | 3 (2.9%) |
| 45 to 59 Minutes | 0 (0.0%) | 0 (0.0%) |
| 60 to 89 Minutes | 0 (0.0%) | 0 (0.0%) |
| 90 or more Minutes | 12 (6.2%) | 0 (0.0%) |
Time of Departure to Work by Sex in Silverton
The most frequent times of departure to work in Silverton are 7:00 AM to 7:29 AM (61, 31.6%) for males and 8:00 AM to 8:29 AM (56, 53.8%) for females.
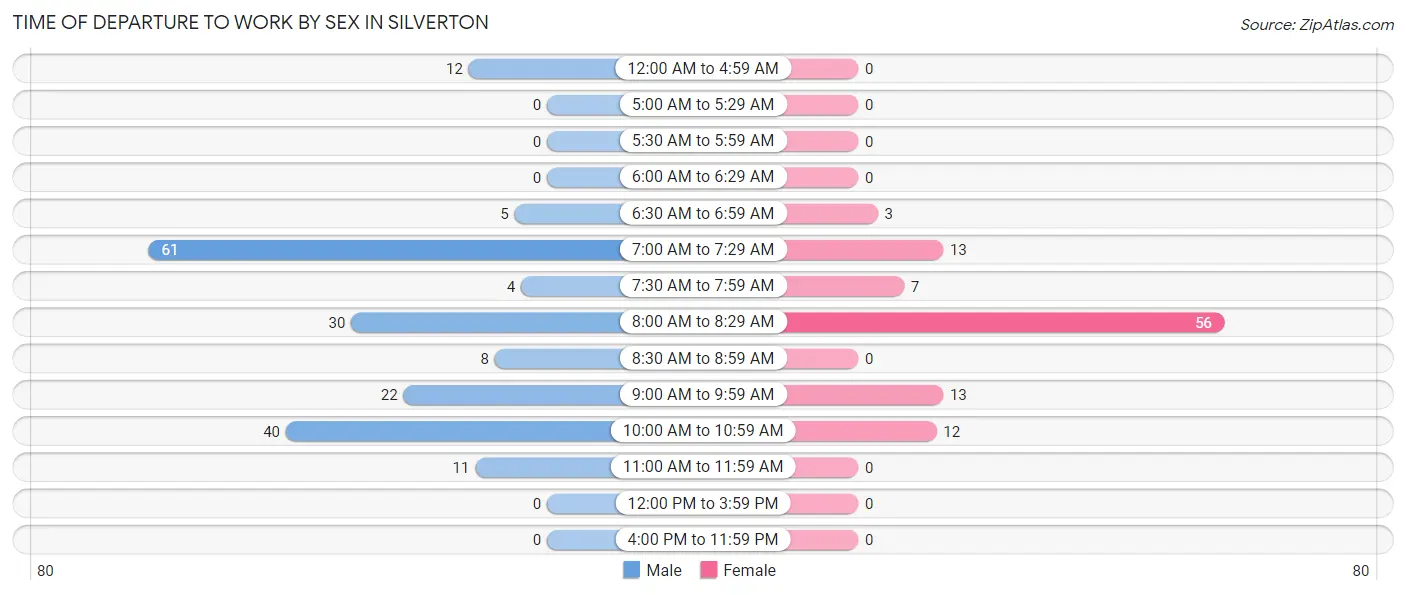
| Time of Departure | Male | Female |
| 12:00 AM to 4:59 AM | 12 (6.2%) | 0 (0.0%) |
| 5:00 AM to 5:29 AM | 0 (0.0%) | 0 (0.0%) |
| 5:30 AM to 5:59 AM | 0 (0.0%) | 0 (0.0%) |
| 6:00 AM to 6:29 AM | 0 (0.0%) | 0 (0.0%) |
| 6:30 AM to 6:59 AM | 5 (2.6%) | 3 (2.9%) |
| 7:00 AM to 7:29 AM | 61 (31.6%) | 13 (12.5%) |
| 7:30 AM to 7:59 AM | 4 (2.1%) | 7 (6.7%) |
| 8:00 AM to 8:29 AM | 30 (15.5%) | 56 (53.8%) |
| 8:30 AM to 8:59 AM | 8 (4.2%) | 0 (0.0%) |
| 9:00 AM to 9:59 AM | 22 (11.4%) | 13 (12.5%) |
| 10:00 AM to 10:59 AM | 40 (20.7%) | 12 (11.5%) |
| 11:00 AM to 11:59 AM | 11 (5.7%) | 0 (0.0%) |
| 12:00 PM to 3:59 PM | 0 (0.0%) | 0 (0.0%) |
| 4:00 PM to 11:59 PM | 0 (0.0%) | 0 (0.0%) |
| Total | 193 (100.0%) | 104 (100.0%) |
Housing Occupancy in Silverton
Occupancy by Ownership in Silverton
Of the total 302 dwellings in Silverton, owner-occupied units account for 150 (49.7%), while renter-occupied units make up 152 (50.3%).
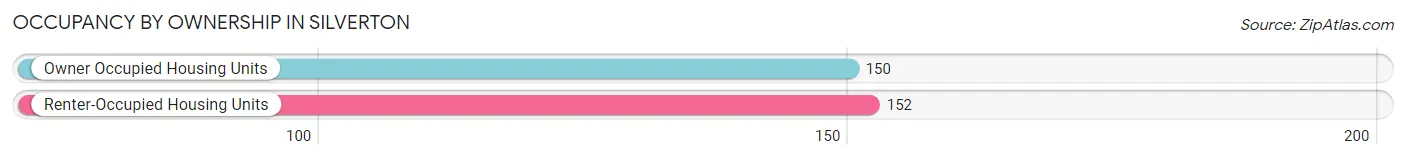
| Occupancy | # Housing Units | % Housing Units |
| Owner Occupied Housing Units | 150 | 49.7% |
| Renter-Occupied Housing Units | 152 | 50.3% |
| Total Occupied Housing Units | 302 | 100.0% |
Occupancy by Household Size in Silverton
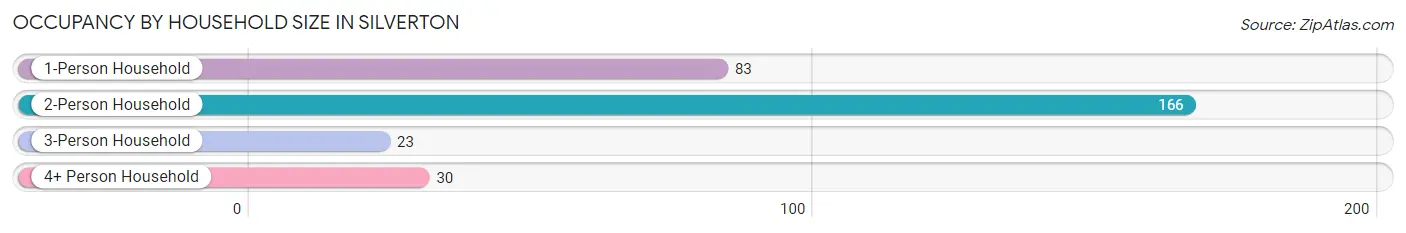
| Household Size | # Housing Units | % Housing Units |
| 1-Person Household | 83 | 27.5% |
| 2-Person Household | 166 | 55.0% |
| 3-Person Household | 23 | 7.6% |
| 4+ Person Household | 30 | 9.9% |
| Total Housing Units | 302 | 100.0% |
Occupancy by Ownership by Household Size in Silverton
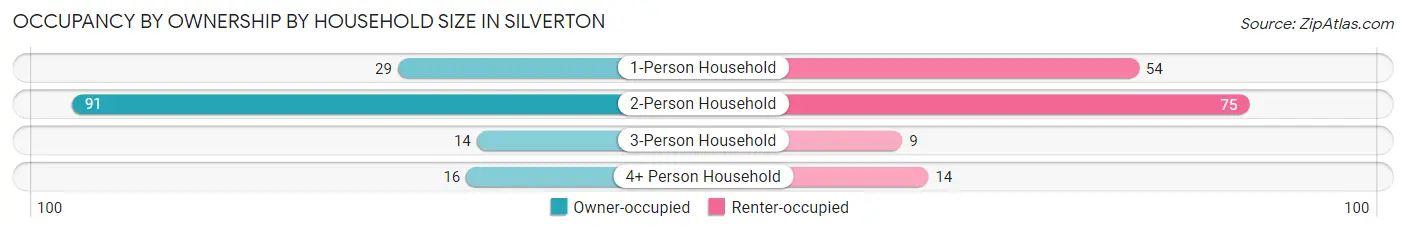
| Household Size | Owner-occupied | Renter-occupied |
| 1-Person Household | 29 (34.9%) | 54 (65.1%) |
| 2-Person Household | 91 (54.8%) | 75 (45.2%) |
| 3-Person Household | 14 (60.9%) | 9 (39.1%) |
| 4+ Person Household | 16 (53.3%) | 14 (46.7%) |
| Total Housing Units | 150 (49.7%) | 152 (50.3%) |
Occupancy by Educational Attainment in Silverton
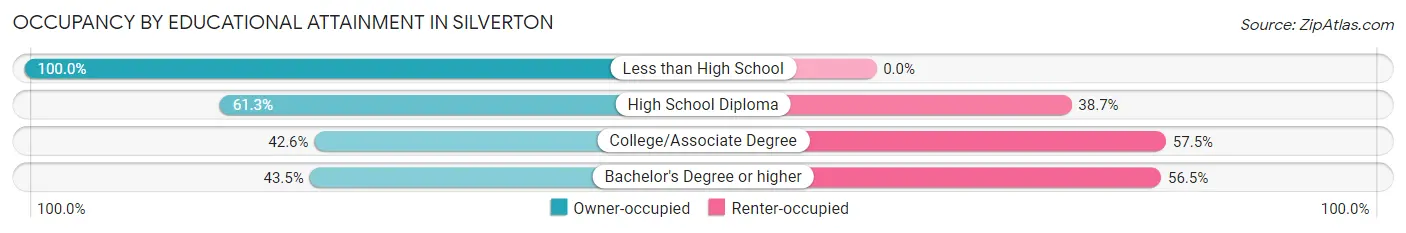
| Household Size | Owner-occupied | Renter-occupied |
| Less than High School | 15 (100.0%) | 0 (0.0%) |
| High School Diploma | 38 (61.3%) | 24 (38.7%) |
| College/Associate Degree | 40 (42.5%) | 54 (57.5%) |
| Bachelor's Degree or higher | 57 (43.5%) | 74 (56.5%) |
Occupancy by Age of Householder in Silverton
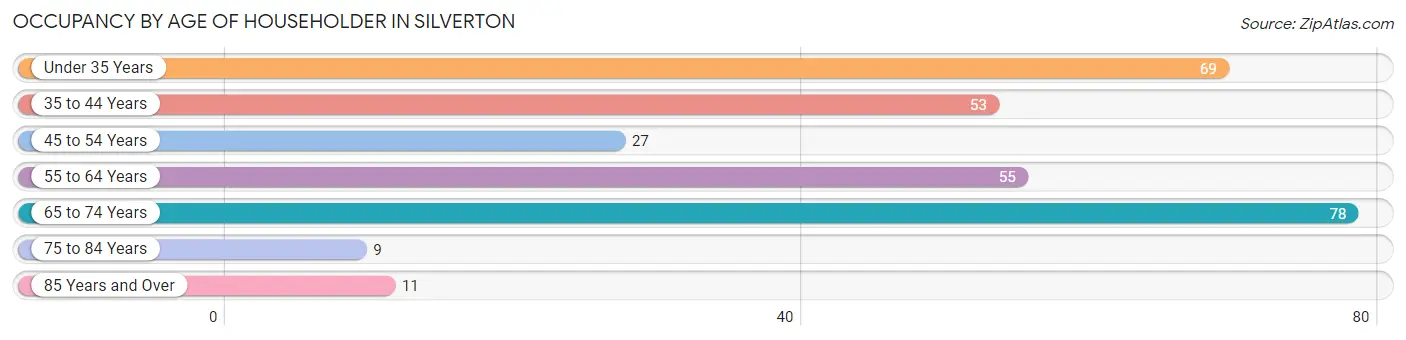
| Age Bracket | # Households | % Households |
| Under 35 Years | 69 | 22.9% |
| 35 to 44 Years | 53 | 17.5% |
| 45 to 54 Years | 27 | 8.9% |
| 55 to 64 Years | 55 | 18.2% |
| 65 to 74 Years | 78 | 25.8% |
| 75 to 84 Years | 9 | 3.0% |
| 85 Years and Over | 11 | 3.6% |
| Total | 302 | 100.0% |
Housing Finances in Silverton
Median Income by Occupancy in Silverton
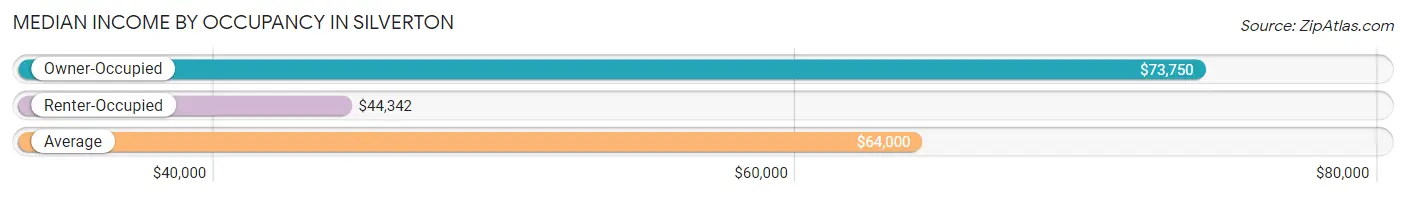
| Occupancy Type | # Households | Median Income |
| Owner-Occupied | 150 (49.7%) | $73,750 |
| Renter-Occupied | 152 (50.3%) | $44,342 |
| Average | 302 (100.0%) | $64,000 |
Occupancy by Householder Income Bracket in Silverton
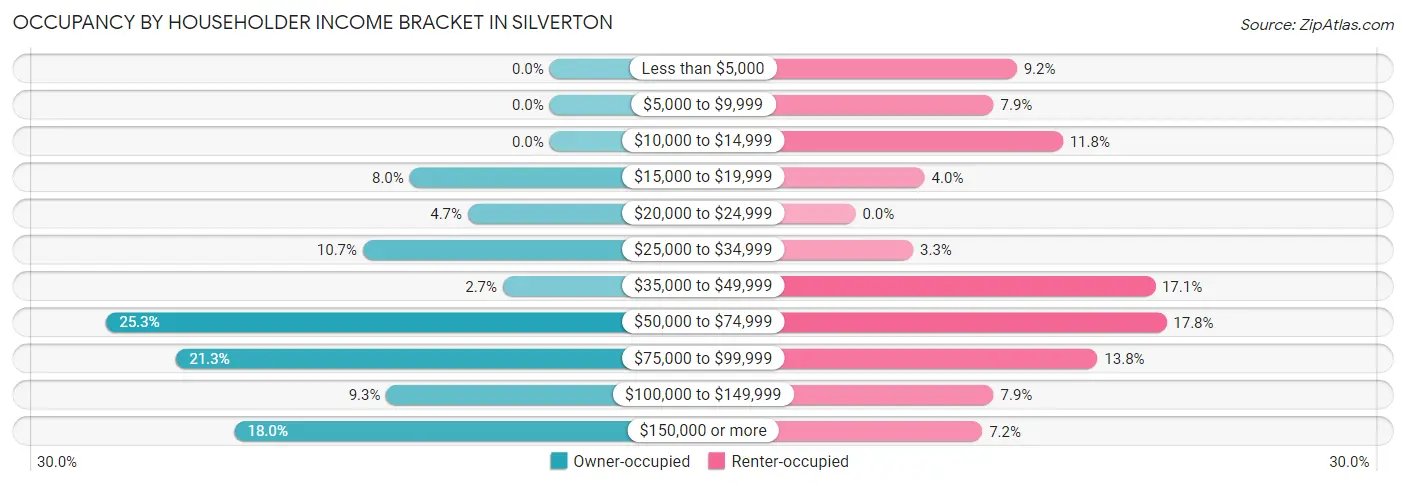
| Income Bracket | Owner-occupied | Renter-occupied |
| Less than $5,000 | 0 (0.0%) | 14 (9.2%) |
| $5,000 to $9,999 | 0 (0.0%) | 12 (7.9%) |
| $10,000 to $14,999 | 0 (0.0%) | 18 (11.8%) |
| $15,000 to $19,999 | 12 (8.0%) | 6 (4.0%) |
| $20,000 to $24,999 | 7 (4.7%) | 0 (0.0%) |
| $25,000 to $34,999 | 16 (10.7%) | 5 (3.3%) |
| $35,000 to $49,999 | 4 (2.7%) | 26 (17.1%) |
| $50,000 to $74,999 | 38 (25.3%) | 27 (17.8%) |
| $75,000 to $99,999 | 32 (21.3%) | 21 (13.8%) |
| $100,000 to $149,999 | 14 (9.3%) | 12 (7.9%) |
| $150,000 or more | 27 (18.0%) | 11 (7.2%) |
| Total | 150 (100.0%) | 152 (100.0%) |
Monthly Housing Cost Tiers in Silverton
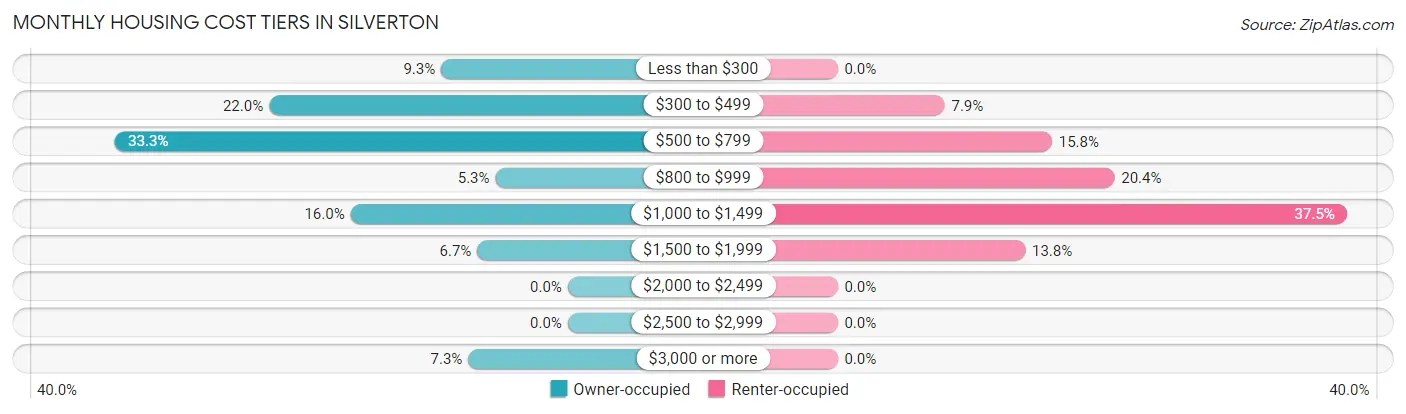
| Monthly Cost | Owner-occupied | Renter-occupied |
| Less than $300 | 14 (9.3%) | 0 (0.0%) |
| $300 to $499 | 33 (22.0%) | 12 (7.9%) |
| $500 to $799 | 50 (33.3%) | 24 (15.8%) |
| $800 to $999 | 8 (5.3%) | 31 (20.4%) |
| $1,000 to $1,499 | 24 (16.0%) | 57 (37.5%) |
| $1,500 to $1,999 | 10 (6.7%) | 21 (13.8%) |
| $2,000 to $2,499 | 0 (0.0%) | 0 (0.0%) |
| $2,500 to $2,999 | 0 (0.0%) | 0 (0.0%) |
| $3,000 or more | 11 (7.3%) | 0 (0.0%) |
| Total | 150 (100.0%) | 152 (100.0%) |
Physical Housing Characteristics in Silverton
Housing Structures in Silverton
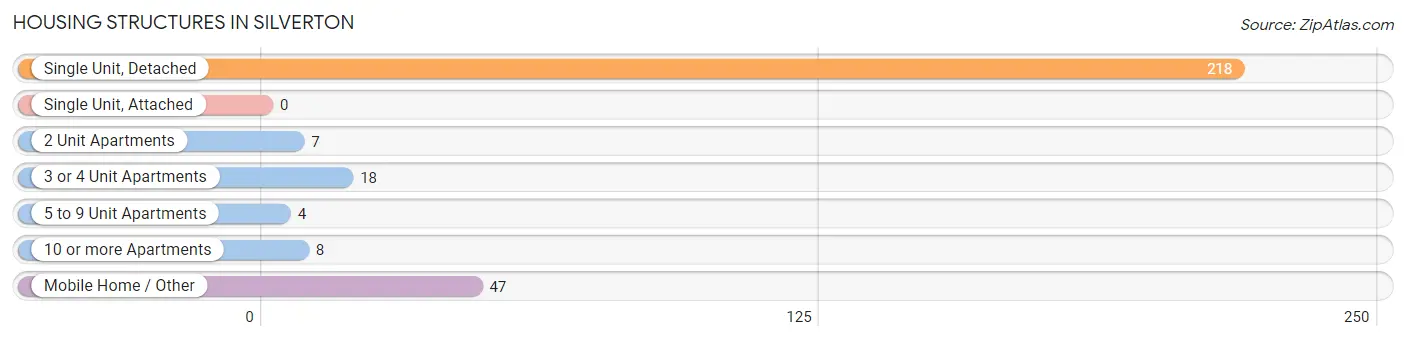
| Structure Type | # Housing Units | % Housing Units |
| Single Unit, Detached | 218 | 72.2% |
| Single Unit, Attached | 0 | 0.0% |
| 2 Unit Apartments | 7 | 2.3% |
| 3 or 4 Unit Apartments | 18 | 6.0% |
| 5 to 9 Unit Apartments | 4 | 1.3% |
| 10 or more Apartments | 8 | 2.6% |
| Mobile Home / Other | 47 | 15.6% |
| Total | 302 | 100.0% |
Housing Structures by Occupancy in Silverton
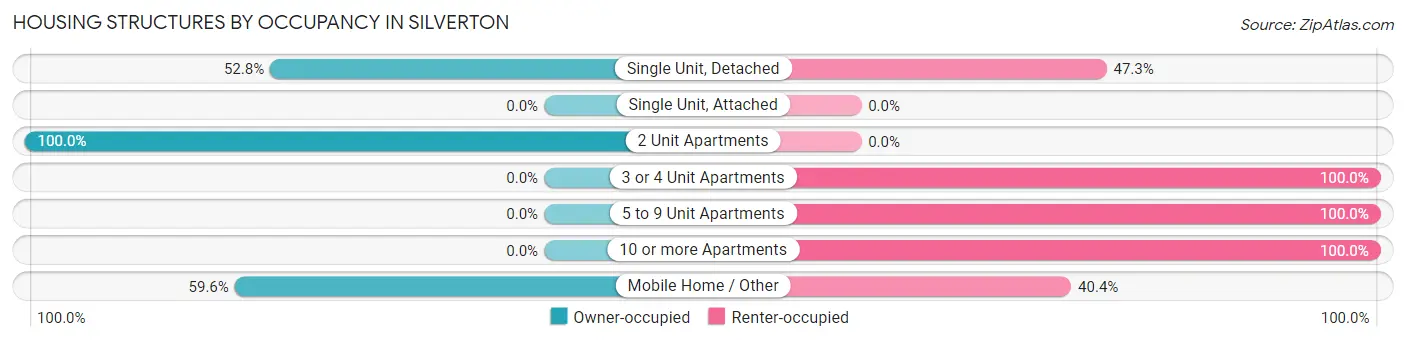
| Structure Type | Owner-occupied | Renter-occupied |
| Single Unit, Detached | 115 (52.7%) | 103 (47.2%) |
| Single Unit, Attached | 0 (0.0%) | 0 (0.0%) |
| 2 Unit Apartments | 7 (100.0%) | 0 (0.0%) |
| 3 or 4 Unit Apartments | 0 (0.0%) | 18 (100.0%) |
| 5 to 9 Unit Apartments | 0 (0.0%) | 4 (100.0%) |
| 10 or more Apartments | 0 (0.0%) | 8 (100.0%) |
| Mobile Home / Other | 28 (59.6%) | 19 (40.4%) |
| Total | 150 (49.7%) | 152 (50.3%) |
Housing Structures by Number of Rooms in Silverton
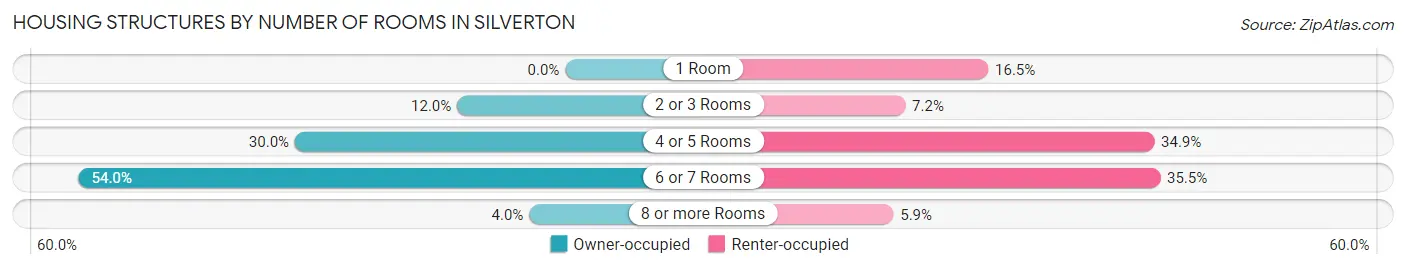
| Number of Rooms | Owner-occupied | Renter-occupied |
| 1 Room | 0 (0.0%) | 25 (16.5%) |
| 2 or 3 Rooms | 18 (12.0%) | 11 (7.2%) |
| 4 or 5 Rooms | 45 (30.0%) | 53 (34.9%) |
| 6 or 7 Rooms | 81 (54.0%) | 54 (35.5%) |
| 8 or more Rooms | 6 (4.0%) | 9 (5.9%) |
| Total | 150 (100.0%) | 152 (100.0%) |
Housing Structure by Heating Type in Silverton
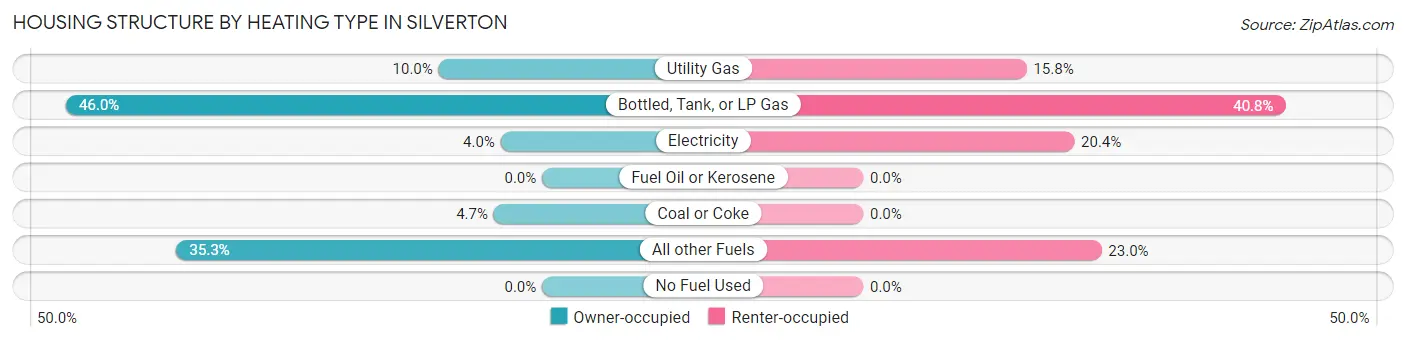
| Heating Type | Owner-occupied | Renter-occupied |
| Utility Gas | 15 (10.0%) | 24 (15.8%) |
| Bottled, Tank, or LP Gas | 69 (46.0%) | 62 (40.8%) |
| Electricity | 6 (4.0%) | 31 (20.4%) |
| Fuel Oil or Kerosene | 0 (0.0%) | 0 (0.0%) |
| Coal or Coke | 7 (4.7%) | 0 (0.0%) |
| All other Fuels | 53 (35.3%) | 35 (23.0%) |
| No Fuel Used | 0 (0.0%) | 0 (0.0%) |
| Total | 150 (100.0%) | 152 (100.0%) |
Household Vehicle Usage in Silverton
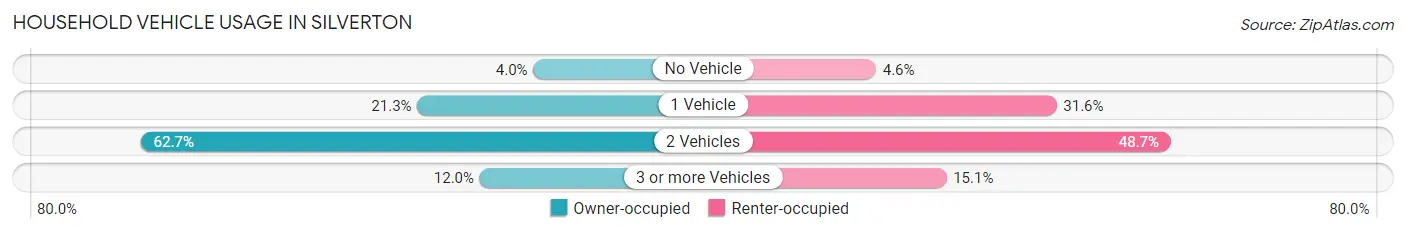
| Vehicles per Household | Owner-occupied | Renter-occupied |
| No Vehicle | 6 (4.0%) | 7 (4.6%) |
| 1 Vehicle | 32 (21.3%) | 48 (31.6%) |
| 2 Vehicles | 94 (62.7%) | 74 (48.7%) |
| 3 or more Vehicles | 18 (12.0%) | 23 (15.1%) |
| Total | 150 (100.0%) | 152 (100.0%) |
Real Estate & Mortgages in Silverton
Real Estate and Mortgage Overview in Silverton
| Characteristic | Without Mortgage | With Mortgage |
| Housing Units | 106 | 44 |
| Median Property Value | $381,300 | $0 |
| Median Household Income | $68,750 | $5 |
| Monthly Housing Costs | $524 | $11 |
| Real Estate Taxes | $579 | $0 |
Property Value by Mortgage Status in Silverton
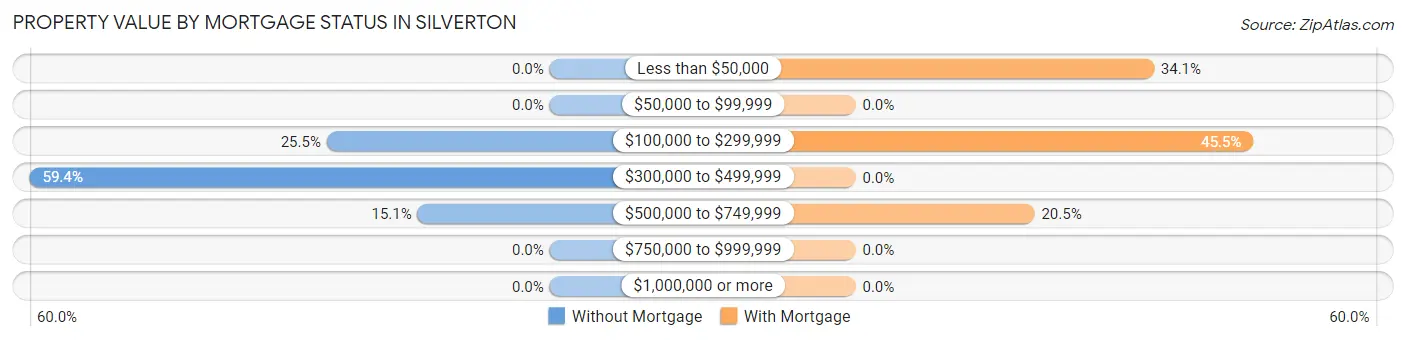
| Property Value | Without Mortgage | With Mortgage |
| Less than $50,000 | 0 (0.0%) | 15 (34.1%) |
| $50,000 to $99,999 | 0 (0.0%) | 0 (0.0%) |
| $100,000 to $299,999 | 27 (25.5%) | 20 (45.5%) |
| $300,000 to $499,999 | 63 (59.4%) | 0 (0.0%) |
| $500,000 to $749,999 | 16 (15.1%) | 9 (20.4%) |
| $750,000 to $999,999 | 0 (0.0%) | 0 (0.0%) |
| $1,000,000 or more | 0 (0.0%) | 0 (0.0%) |
| Total | 106 (100.0%) | 44 (100.0%) |
Household Income by Mortgage Status in Silverton
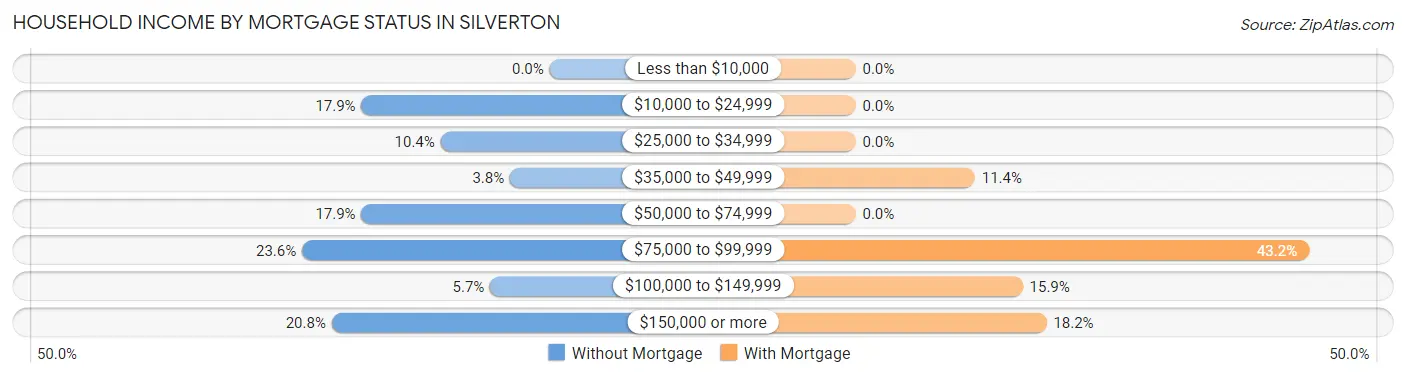
| Household Income | Without Mortgage | With Mortgage |
| Less than $10,000 | 0 (0.0%) | 0 (0.0%) |
| $10,000 to $24,999 | 19 (17.9%) | 0 (0.0%) |
| $25,000 to $34,999 | 11 (10.4%) | 0 (0.0%) |
| $35,000 to $49,999 | 4 (3.8%) | 5 (11.4%) |
| $50,000 to $74,999 | 19 (17.9%) | 0 (0.0%) |
| $75,000 to $99,999 | 25 (23.6%) | 19 (43.2%) |
| $100,000 to $149,999 | 6 (5.7%) | 7 (15.9%) |
| $150,000 or more | 22 (20.7%) | 8 (18.2%) |
| Total | 106 (100.0%) | 44 (100.0%) |
Property Value to Household Income Ratio in Silverton
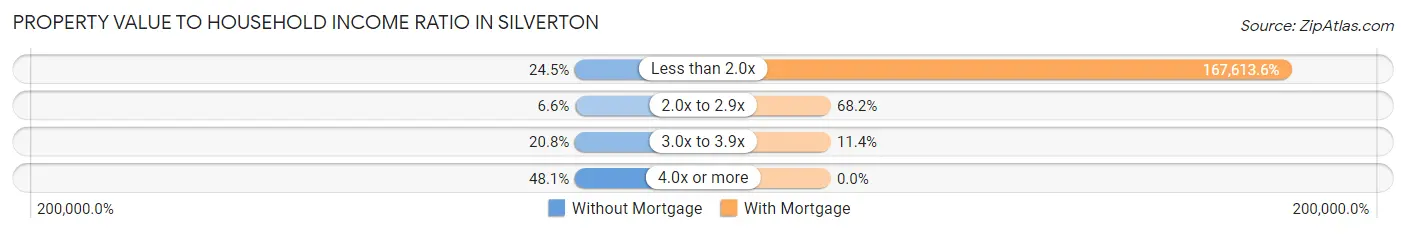
| Value-to-Income Ratio | Without Mortgage | With Mortgage |
| Less than 2.0x | 26 (24.5%) | 73,750 (167,613.6%) |
| 2.0x to 2.9x | 7 (6.6%) | 30 (68.2%) |
| 3.0x to 3.9x | 22 (20.7%) | 5 (11.4%) |
| 4.0x or more | 51 (48.1%) | 0 (0.0%) |
| Total | 106 (100.0%) | 44 (100.0%) |
Real Estate Taxes by Mortgage Status in Silverton
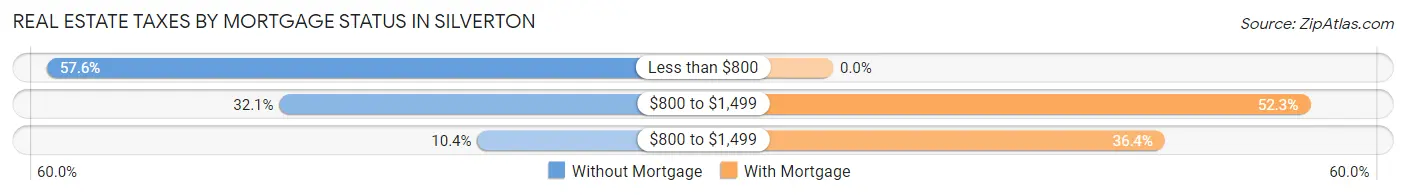
| Property Taxes | Without Mortgage | With Mortgage |
| Less than $800 | 61 (57.6%) | 0 (0.0%) |
| $800 to $1,499 | 34 (32.1%) | 23 (52.3%) |
| $800 to $1,499 | 11 (10.4%) | 16 (36.4%) |
| Total | 106 (100.0%) | 44 (100.0%) |
Health & Disability in Silverton
Health Insurance Coverage by Age in Silverton
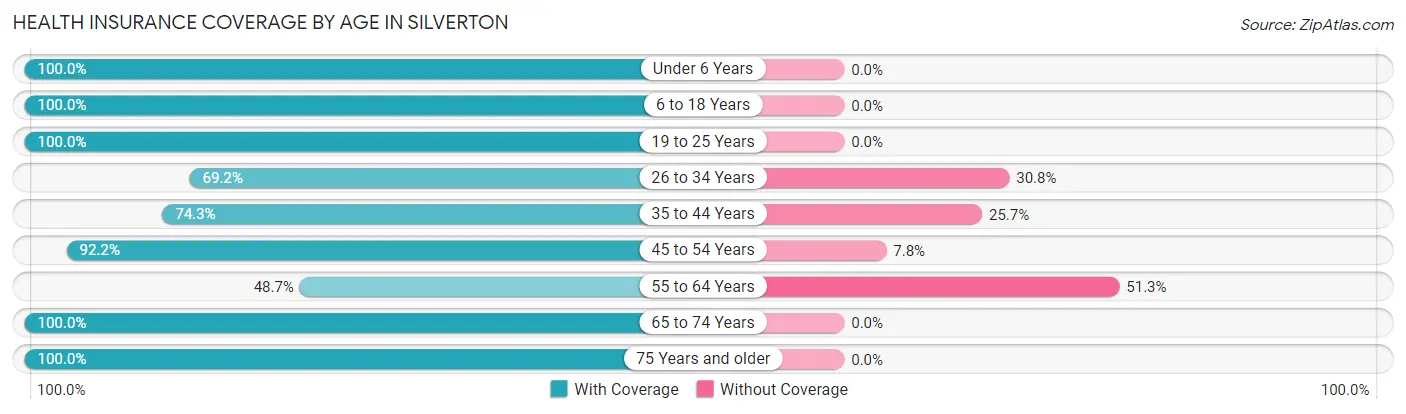
| Age Bracket | With Coverage | Without Coverage |
| Under 6 Years | 11 (100.0%) | 0 (0.0%) |
| 6 to 18 Years | 59 (100.0%) | 0 (0.0%) |
| 19 to 25 Years | 58 (100.0%) | 0 (0.0%) |
| 26 to 34 Years | 45 (69.2%) | 20 (30.8%) |
| 35 to 44 Years | 81 (74.3%) | 28 (25.7%) |
| 45 to 54 Years | 47 (92.2%) | 4 (7.8%) |
| 55 to 64 Years | 56 (48.7%) | 59 (51.3%) |
| 65 to 74 Years | 103 (100.0%) | 0 (0.0%) |
| 75 Years and older | 42 (100.0%) | 0 (0.0%) |
| Total | 502 (81.9%) | 111 (18.1%) |
Health Insurance Coverage by Citizenship Status in Silverton
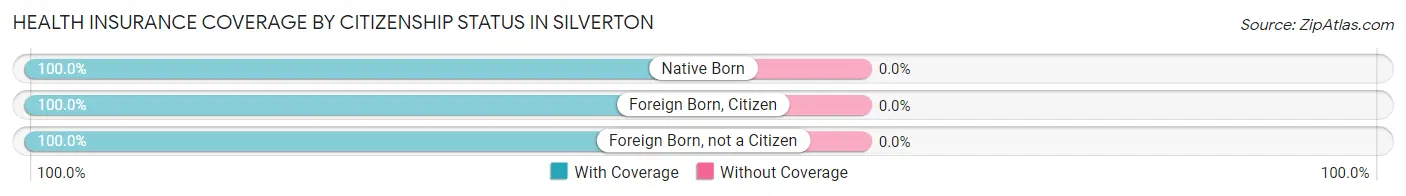
| Citizenship Status | With Coverage | Without Coverage |
| Native Born | 11 (100.0%) | 0 (0.0%) |
| Foreign Born, Citizen | 59 (100.0%) | 0 (0.0%) |
| Foreign Born, not a Citizen | 58 (100.0%) | 0 (0.0%) |
Health Insurance Coverage by Household Income in Silverton
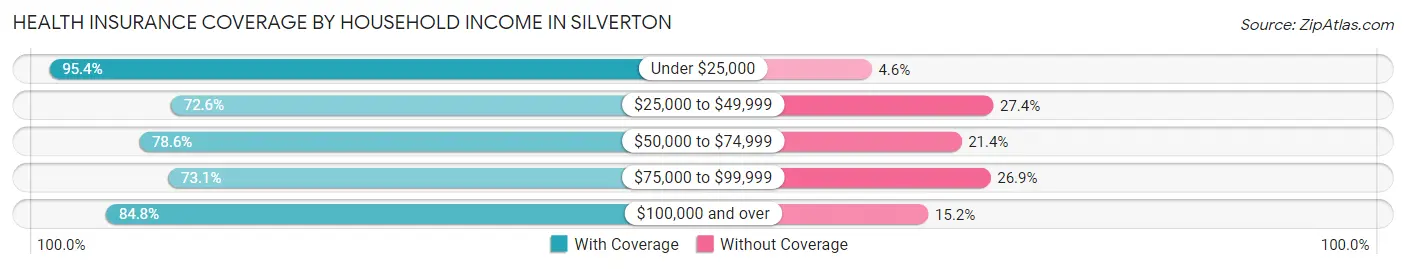
| Household Income | With Coverage | Without Coverage |
| Under $25,000 | 124 (95.4%) | 6 (4.6%) |
| $25,000 to $49,999 | 53 (72.6%) | 20 (27.4%) |
| $50,000 to $74,999 | 110 (78.6%) | 30 (21.4%) |
| $75,000 to $99,999 | 87 (73.1%) | 32 (26.9%) |
| $100,000 and over | 128 (84.8%) | 23 (15.2%) |
Public vs Private Health Insurance Coverage by Age in Silverton
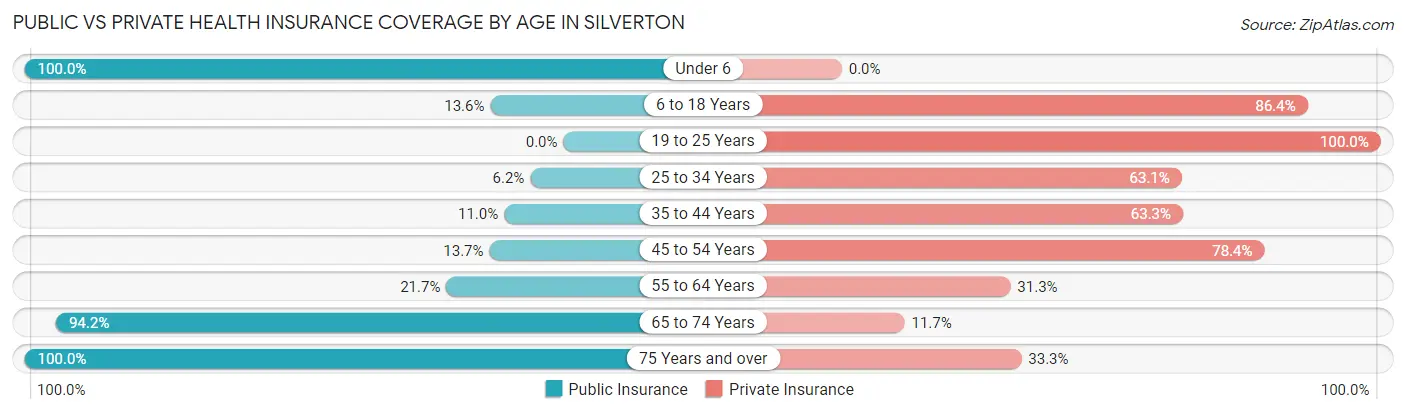
| Age Bracket | Public Insurance | Private Insurance |
| Under 6 | 11 (100.0%) | 0 (0.0%) |
| 6 to 18 Years | 8 (13.6%) | 51 (86.4%) |
| 19 to 25 Years | 0 (0.0%) | 58 (100.0%) |
| 25 to 34 Years | 4 (6.1%) | 41 (63.1%) |
| 35 to 44 Years | 12 (11.0%) | 69 (63.3%) |
| 45 to 54 Years | 7 (13.7%) | 40 (78.4%) |
| 55 to 64 Years | 25 (21.7%) | 36 (31.3%) |
| 65 to 74 Years | 97 (94.2%) | 12 (11.7%) |
| 75 Years and over | 42 (100.0%) | 14 (33.3%) |
| Total | 206 (33.6%) | 321 (52.4%) |
Disability Status by Sex by Age in Silverton
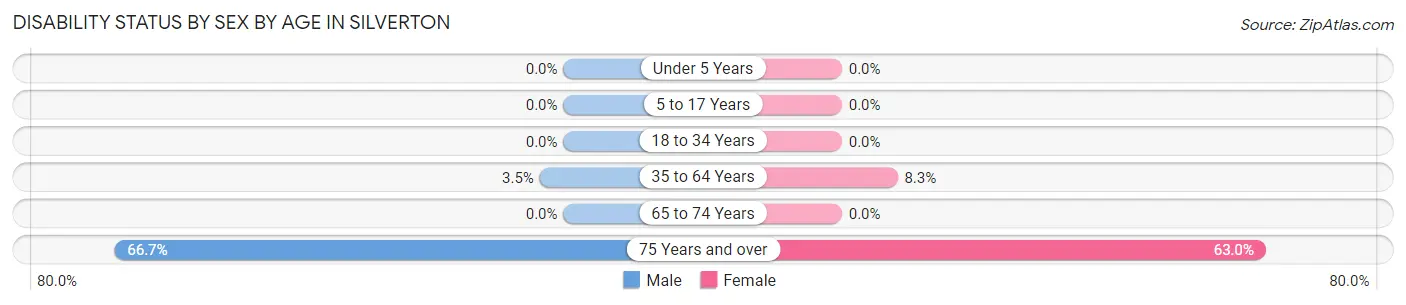
| Age Bracket | Male | Female |
| Under 5 Years | 0 (0.0%) | 0 (0.0%) |
| 5 to 17 Years | 0 (0.0%) | 0 (0.0%) |
| 18 to 34 Years | 0 (0.0%) | 0 (0.0%) |
| 35 to 64 Years | 5 (3.5%) | 11 (8.3%) |
| 65 to 74 Years | 0 (0.0%) | 0 (0.0%) |
| 75 Years and over | 10 (66.7%) | 17 (63.0%) |
Disability Class by Sex by Age in Silverton
Disability Class: Hearing Difficulty
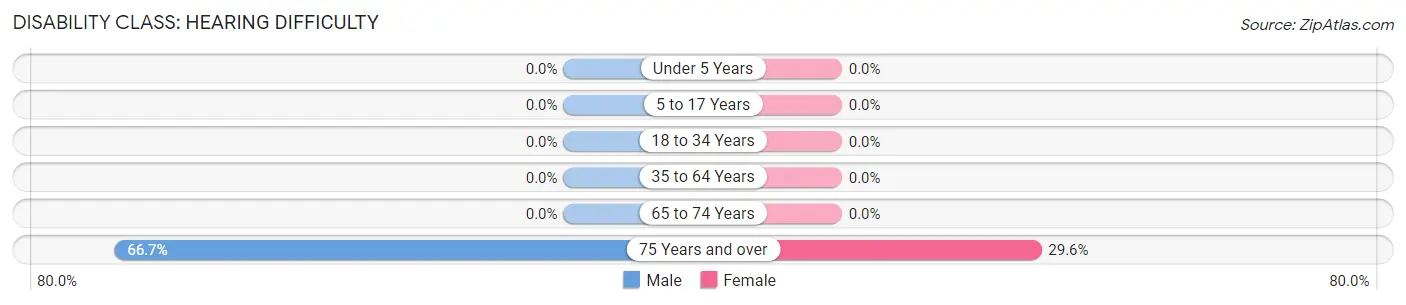
| Age Bracket | Male | Female |
| Under 5 Years | 0 (0.0%) | 0 (0.0%) |
| 5 to 17 Years | 0 (0.0%) | 0 (0.0%) |
| 18 to 34 Years | 0 (0.0%) | 0 (0.0%) |
| 35 to 64 Years | 0 (0.0%) | 0 (0.0%) |
| 65 to 74 Years | 0 (0.0%) | 0 (0.0%) |
| 75 Years and over | 10 (66.7%) | 8 (29.6%) |
Disability Class: Vision Difficulty
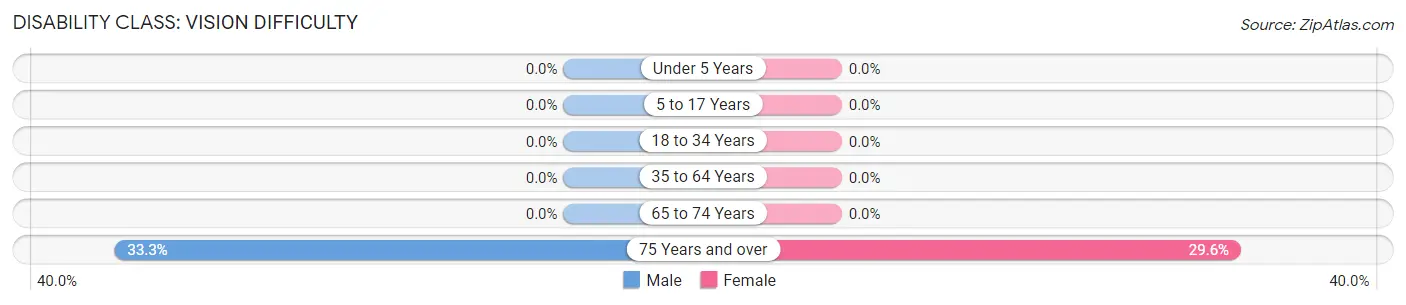
| Age Bracket | Male | Female |
| Under 5 Years | 0 (0.0%) | 0 (0.0%) |
| 5 to 17 Years | 0 (0.0%) | 0 (0.0%) |
| 18 to 34 Years | 0 (0.0%) | 0 (0.0%) |
| 35 to 64 Years | 0 (0.0%) | 0 (0.0%) |
| 65 to 74 Years | 0 (0.0%) | 0 (0.0%) |
| 75 Years and over | 5 (33.3%) | 8 (29.6%) |
Disability Class: Cognitive Difficulty
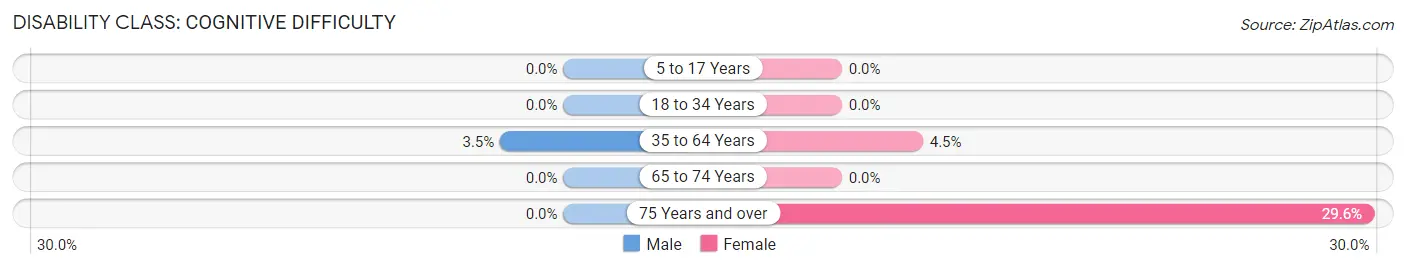
| Age Bracket | Male | Female |
| 5 to 17 Years | 0 (0.0%) | 0 (0.0%) |
| 18 to 34 Years | 0 (0.0%) | 0 (0.0%) |
| 35 to 64 Years | 5 (3.5%) | 6 (4.5%) |
| 65 to 74 Years | 0 (0.0%) | 0 (0.0%) |
| 75 Years and over | 0 (0.0%) | 8 (29.6%) |
Disability Class: Ambulatory Difficulty
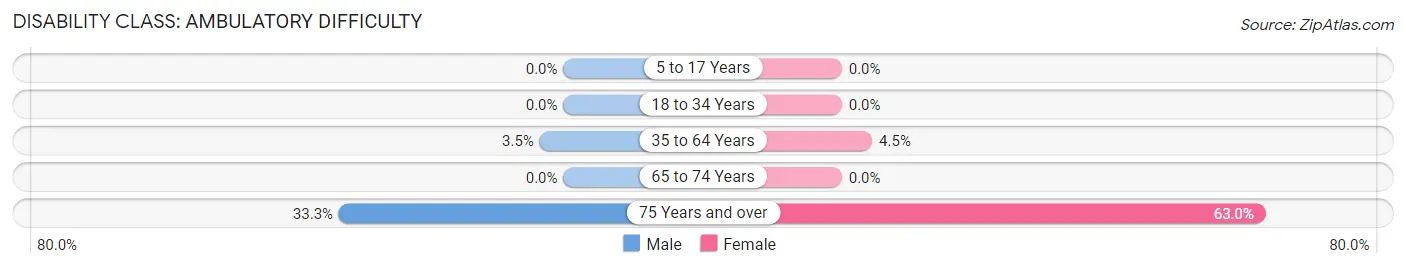
| Age Bracket | Male | Female |
| 5 to 17 Years | 0 (0.0%) | 0 (0.0%) |
| 18 to 34 Years | 0 (0.0%) | 0 (0.0%) |
| 35 to 64 Years | 5 (3.5%) | 6 (4.5%) |
| 65 to 74 Years | 0 (0.0%) | 0 (0.0%) |
| 75 Years and over | 5 (33.3%) | 17 (63.0%) |
Disability Class: Self-Care Difficulty
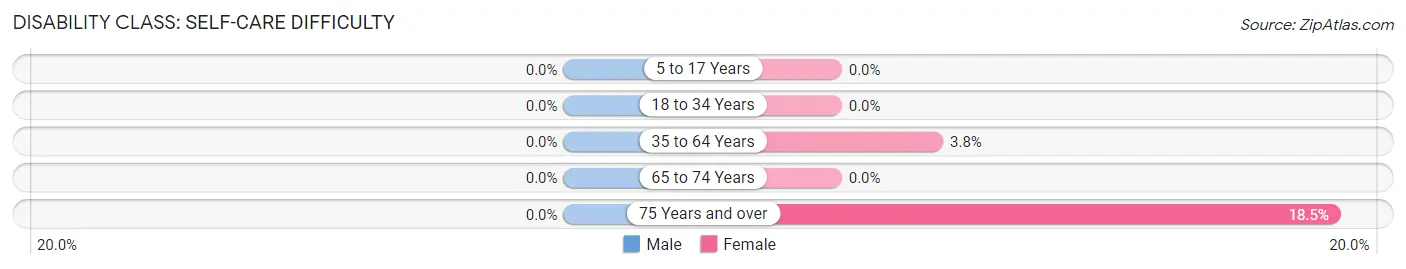
| Age Bracket | Male | Female |
| 5 to 17 Years | 0 (0.0%) | 0 (0.0%) |
| 18 to 34 Years | 0 (0.0%) | 0 (0.0%) |
| 35 to 64 Years | 0 (0.0%) | 5 (3.8%) |
| 65 to 74 Years | 0 (0.0%) | 0 (0.0%) |
| 75 Years and over | 0 (0.0%) | 5 (18.5%) |
Technology Access in Silverton
Computing Device Access in Silverton
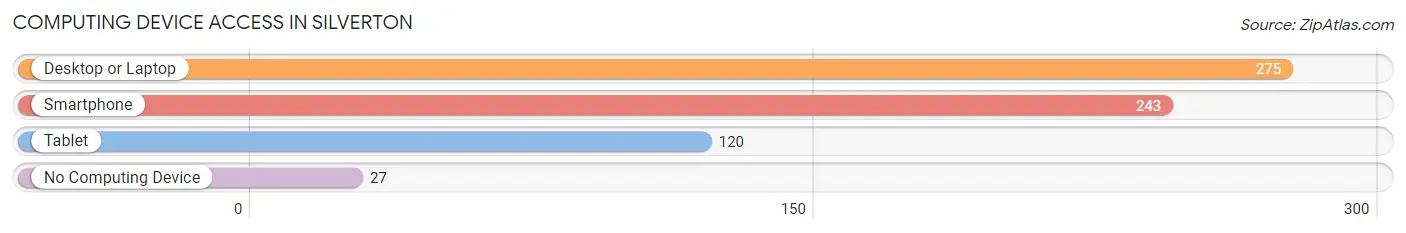
| Device Type | # Households | % Households |
| Desktop or Laptop | 275 | 91.1% |
| Smartphone | 243 | 80.5% |
| Tablet | 120 | 39.7% |
| No Computing Device | 27 | 8.9% |
| Total | 302 | 100.0% |
Internet Access in Silverton
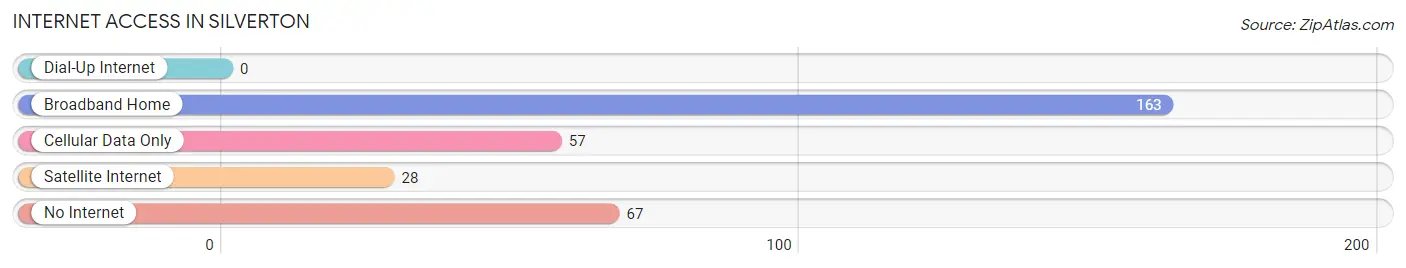
| Internet Type | # Households | % Households |
| Dial-Up Internet | 0 | 0.0% |
| Broadband Home | 163 | 54.0% |
| Cellular Data Only | 57 | 18.9% |
| Satellite Internet | 28 | 9.3% |
| No Internet | 67 | 22.2% |
| Total | 302 | 100.0% |
Silverton Summary
Silverton, Colorado is a small town located in the San Juan Mountains of southwestern Colorado. It is situated at an elevation of 9,318 feet and is the county seat of San Juan County. The town is located in the Animas River Valley, and is surrounded by the San Juan National Forest. Silverton has a population of about 500 people, and is a popular tourist destination due to its proximity to the San Juan Mountains and its historic downtown.
History
Silverton was founded in 1874 by prospectors who were searching for gold and silver in the San Juan Mountains. The town was named after the silver ore that was discovered in the area. The town quickly grew and by 1876, it had a population of over 1,000 people. The town was incorporated in 1883 and was the county seat of San Juan County.
In the late 1800s, Silverton was a bustling mining town. The town was home to several mines, including the Sunnyside Mine, which was the largest silver producer in the United States at the time. The town also had several smelters and mills, which processed the ore from the mines.
In the early 1900s, the mining industry in Silverton began to decline. The town’s population decreased and many of the mines closed. In the 1950s, the town was almost abandoned.
In the late 1960s, the town was rediscovered by tourists and outdoor enthusiasts. The town was designated as a National Historic Landmark in 1966, and the Silverton Historic District was established in 1971. The town has since become a popular tourist destination, and is home to several festivals and events throughout the year.
Geography
Silverton is located in the San Juan Mountains of southwestern Colorado. The town is situated at an elevation of 9,318 feet and is surrounded by the San Juan National Forest. The town is located in the Animas River Valley, and is surrounded by several mountain peaks, including Red Mountain, Kendall Mountain, and Engineer Mountain.
The town is located about 25 miles north of Durango, Colorado, and about 50 miles south of Ouray, Colorado. The town is accessible by car via US Highway 550, which is known as the Million Dollar Highway.
Economy
Silverton’s economy is largely based on tourism. The town is a popular destination for outdoor enthusiasts, and is home to several festivals and events throughout the year. The town is also home to several restaurants, shops, and lodging options.
The town is also home to several mining operations, including the Sunnyside Mine, which is still in operation. The mine produces gold, silver, and other minerals.
Demographics
As of the 2010 census, Silverton had a population of 547 people. The town is predominantly white, with about 95% of the population identifying as white. The town also has a small Hispanic population, with about 4% of the population identifying as Hispanic or Latino. The median household income in Silverton is $41,250, and the median home value is $219,000.
Common Questions
What is Per Capita Income in Silverton?
Per Capita income in Silverton is $36,876.
What is the Median Family Income in Silverton?
Median Family Income in Silverton is $71,875.
What is the Median Household income in Silverton?
Median Household Income in Silverton is $64,000.
What is Income or Wage Gap in Silverton?
Income or Wage Gap in Silverton is 35.3%.
Women in Silverton earn 64.7 cents for every dollar earned by a man.
What is Inequality or Gini Index in Silverton?
Inequality or Gini Index in Silverton is 0.41.
What is the Total Population of Silverton?
Total Population of Silverton is 613.
What is the Total Male Population of Silverton?
Total Male Population of Silverton is 333.
What is the Total Female Population of Silverton?
Total Female Population of Silverton is 280.
What is the Ratio of Males per 100 Females in Silverton?
There are 118.93 Males per 100 Females in Silverton.
What is the Ratio of Females per 100 Males in Silverton?
There are 84.08 Females per 100 Males in Silverton.
What is the Median Population Age in Silverton?
Median Population Age in Silverton is 45.4 Years.
What is the Average Family Size in Silverton
Average Family Size in Silverton is 2.4 People.
What is the Average Household Size in Silverton
Average Household Size in Silverton is 2.0 People.
How Large is the Labor Force in Silverton?
There are 382 People in the Labor Forcein in Silverton.
What is the Percentage of People in the Labor Force in Silverton?
70.3% of People are in the Labor Force in Silverton.
What is the Unemployment Rate in Silverton?
Unemployment Rate in Silverton is 7.9%.