Silt, CO Map & Demographics
Silt Map
Silt Overview
$31,181
PER CAPITA INCOME
$93,684
AVG FAMILY INCOME
$72,450
AVG HOUSEHOLD INCOME
45.0%
WAGE / INCOME GAP [ % ]
55.0¢/ $1
WAGE / INCOME GAP [ $ ]
0.36
INEQUALITY / GINI INDEX
3,529
TOTAL POPULATION
1,722
MALE POPULATION
1,807
FEMALE POPULATION
95.30
MALES / 100 FEMALES
104.94
FEMALES / 100 MALES
31.0
MEDIAN AGE
3.4
AVG FAMILY SIZE
3.1
AVG HOUSEHOLD SIZE
1,971
LABOR FORCE [ PEOPLE ]
77.8%
PERCENT IN LABOR FORCE
1.7%
UNEMPLOYMENT RATE
Silt Zip Codes
Silt Area Codes
Income in Silt
Income Overview in Silt
Per Capita Income in Silt is $31,181, while median incomes of families and households are $93,684 and $72,450 respectively.
| Characteristic | Number | Measure |
| Per Capita Income | 3,529 | $31,181 |
| Median Family Income | 912 | $93,684 |
| Mean Family Income | 912 | $99,727 |
| Median Household Income | 1,155 | $72,450 |
| Mean Household Income | 1,155 | $92,406 |
| Income Deficit | 912 | $0 |
| Wage / Income Gap (%) | 3,529 | 44.98% |
| Wage / Income Gap ($) | 3,529 | 55.02¢ per $1 |
| Gini / Inequality Index | 3,529 | 0.36 |
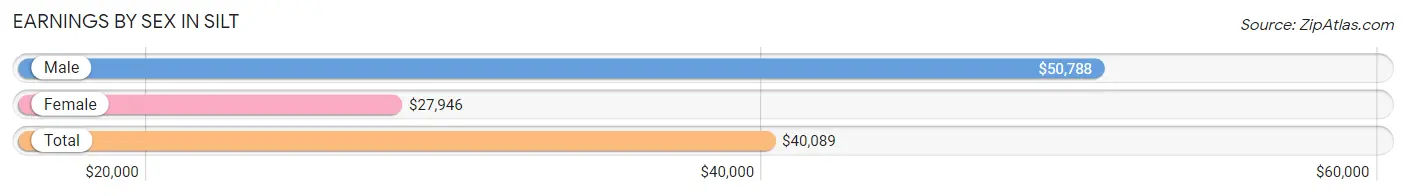
Earnings by Sex in Silt
Average Earnings in Silt are $40,089, $50,788 for men and $27,946 for women, a difference of 45.0%.
| Sex | Number | Average Earnings |
| Male | 1,097 (52.3%) | $50,788 |
| Female | 999 (47.7%) | $27,946 |
| Total | 2,096 (100.0%) | $40,089 |
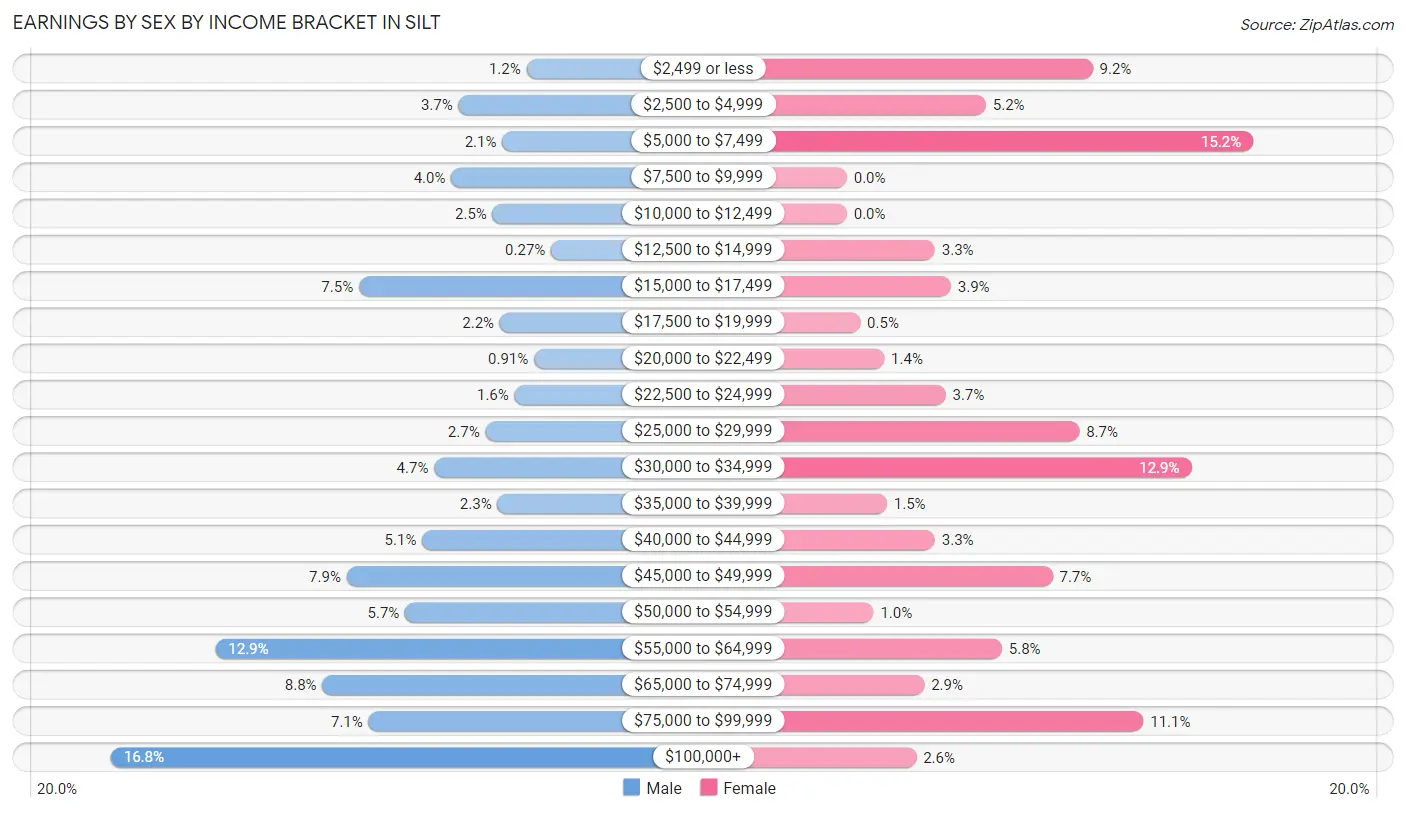
Earnings by Sex by Income Bracket in Silt
The most common earnings brackets in Silt are $100,000+ for men (184 | 16.8%) and $5,000 to $7,499 for women (152 | 15.2%).
| Income | Male | Female |
| $2,499 or less | 13 (1.2%) | 92 (9.2%) |
| $2,500 to $4,999 | 41 (3.7%) | 52 (5.2%) |
| $5,000 to $7,499 | 23 (2.1%) | 152 (15.2%) |
| $7,500 to $9,999 | 44 (4.0%) | 0 (0.0%) |
| $10,000 to $12,499 | 27 (2.5%) | 0 (0.0%) |
| $12,500 to $14,999 | 3 (0.3%) | 33 (3.3%) |
| $15,000 to $17,499 | 82 (7.5%) | 39 (3.9%) |
| $17,500 to $19,999 | 24 (2.2%) | 5 (0.5%) |
| $20,000 to $22,499 | 10 (0.9%) | 14 (1.4%) |
| $22,500 to $24,999 | 18 (1.6%) | 37 (3.7%) |
| $25,000 to $29,999 | 30 (2.7%) | 87 (8.7%) |
| $30,000 to $34,999 | 51 (4.6%) | 129 (12.9%) |
| $35,000 to $39,999 | 25 (2.3%) | 15 (1.5%) |
| $40,000 to $44,999 | 56 (5.1%) | 33 (3.3%) |
| $45,000 to $49,999 | 87 (7.9%) | 77 (7.7%) |
| $50,000 to $54,999 | 63 (5.7%) | 10 (1.0%) |
| $55,000 to $64,999 | 141 (12.9%) | 58 (5.8%) |
| $65,000 to $74,999 | 97 (8.8%) | 29 (2.9%) |
| $75,000 to $99,999 | 78 (7.1%) | 111 (11.1%) |
| $100,000+ | 184 (16.8%) | 26 (2.6%) |
| Total | 1,097 (100.0%) | 999 (100.0%) |
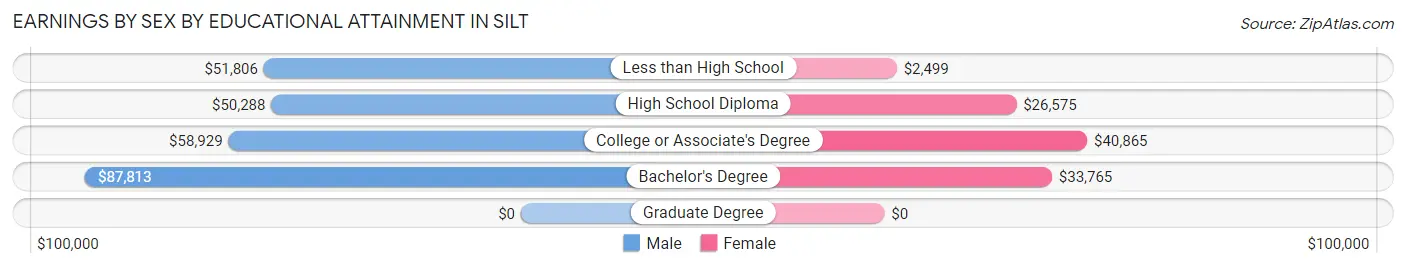
Earnings by Sex by Educational Attainment in Silt
Average earnings in Silt are $55,465 for men and $31,250 for women, a difference of 43.7%. Men with an educational attainment of bachelor's degree enjoy the highest average annual earnings of $87,813, while those with high school diploma education earn the least with $50,288. Women with an educational attainment of college or associate's degree earn the most with the average annual earnings of $40,865, while those with less than high school education have the smallest earnings of $2,499.
| Educational Attainment | Male Income | Female Income |
| Less than High School | $51,806 | $2,499 |
| High School Diploma | $50,288 | $26,575 |
| College or Associate's Degree | $58,929 | $40,865 |
| Bachelor's Degree | $87,813 | $33,765 |
| Graduate Degree | - | - |
| Total | $55,465 | $31,250 |
Family Income in Silt
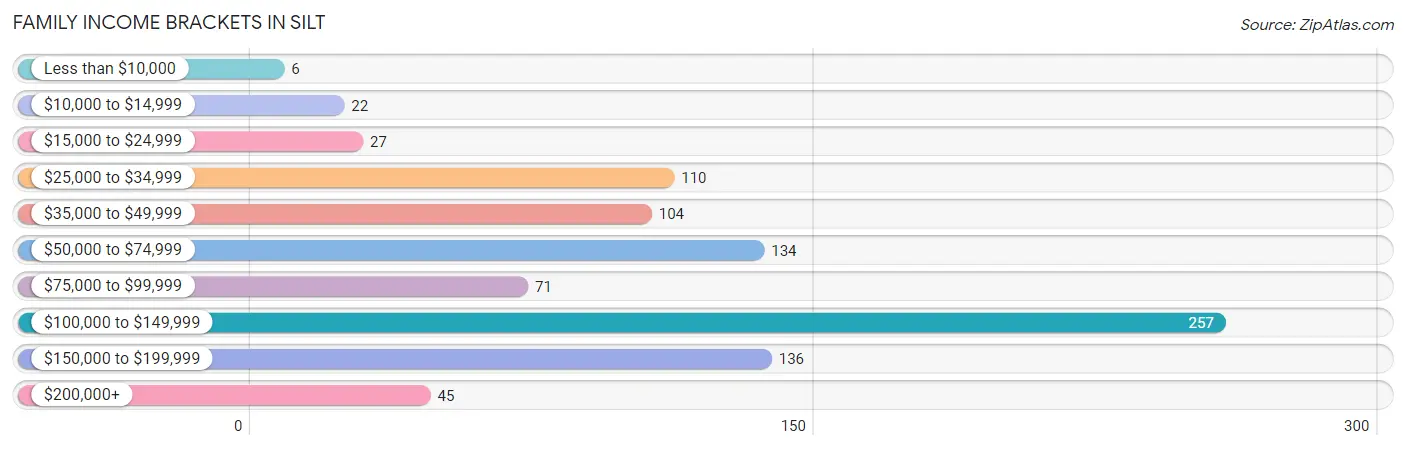
Family Income Brackets in Silt
According to the Silt family income data, there are 257 families falling into the $100,000 to $149,999 income range, which is the most common income bracket and makes up 28.2% of all families. Conversely, the less than $10,000 income bracket is the least frequent group with only 6 families (0.7%) belonging to this category.
| Income Bracket | # Families | % Families |
| Less than $10,000 | 6 | 0.7% |
| $10,000 to $14,999 | 22 | 2.4% |
| $15,000 to $24,999 | 27 | 3.0% |
| $25,000 to $34,999 | 110 | 12.1% |
| $35,000 to $49,999 | 104 | 11.4% |
| $50,000 to $74,999 | 134 | 14.7% |
| $75,000 to $99,999 | 71 | 7.8% |
| $100,000 to $149,999 | 257 | 28.2% |
| $150,000 to $199,999 | 136 | 14.9% |
| $200,000+ | 45 | 4.9% |
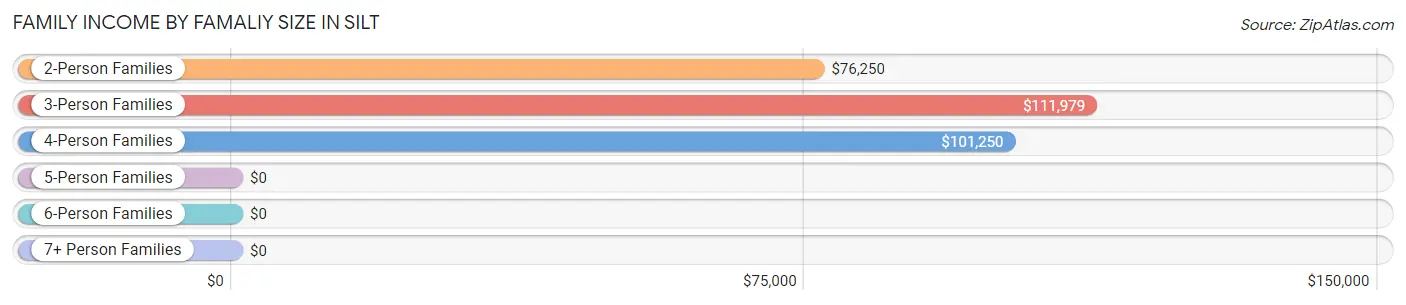
Family Income by Famaliy Size in Silt
3-person families (301 | 33.0%) account for the highest median family income in Silt with $111,979 per family, while 2-person families (291 | 31.9%) have the highest median income of $38,125 per family member.
| Income Bracket | # Families | Median Income |
| 2-Person Families | 291 (31.9%) | $76,250 |
| 3-Person Families | 301 (33.0%) | $111,979 |
| 4-Person Families | 200 (21.9%) | $101,250 |
| 5-Person Families | 96 (10.5%) | $0 |
| 6-Person Families | 7 (0.8%) | $0 |
| 7+ Person Families | 17 (1.9%) | $0 |
| Total | 912 (100.0%) | $93,684 |
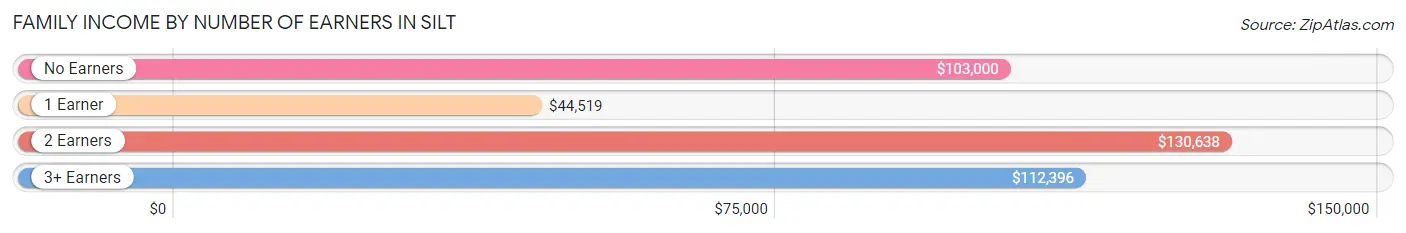
Family Income by Number of Earners in Silt
The median family income in Silt is $93,684, with families comprising 2 earners (543) having the highest median family income of $130,638, while families with 1 earner (260) have the lowest median family income of $44,519, accounting for 59.5% and 28.5% of families, respectively.
| Number of Earners | # Families | Median Income |
| No Earners | 18 (2.0%) | $103,000 |
| 1 Earner | 260 (28.5%) | $44,519 |
| 2 Earners | 543 (59.5%) | $130,638 |
| 3+ Earners | 91 (10.0%) | $112,396 |
| Total | 912 (100.0%) | $93,684 |
Household Income in Silt
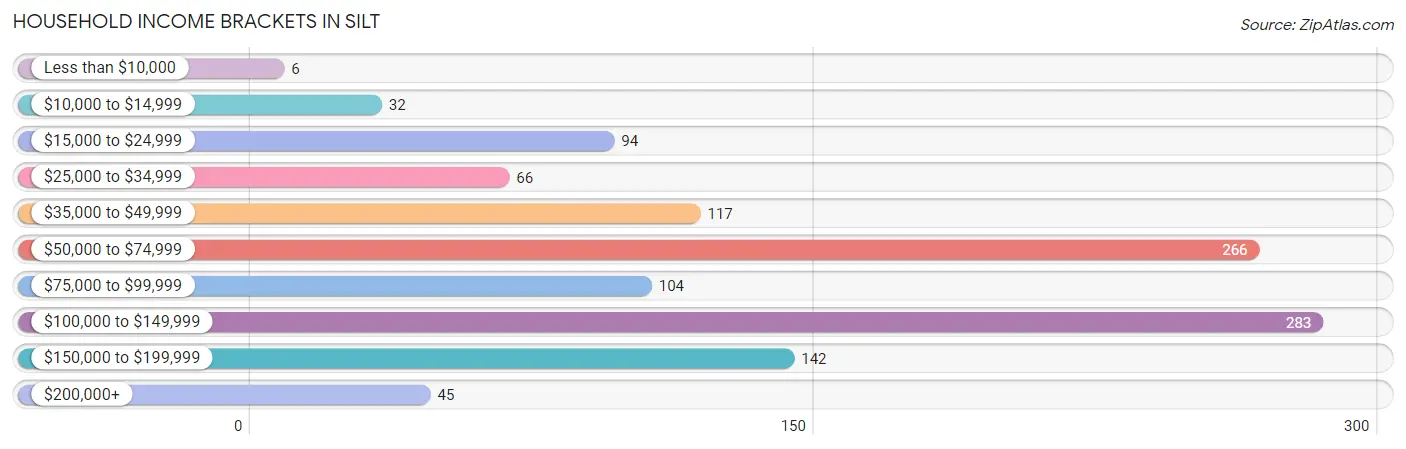
Household Income Brackets in Silt
With 283 households falling in the category, the $100,000 to $149,999 income range is the most frequent in Silt, accounting for 24.5% of all households. In contrast, only 6 households (0.5%) fall into the less than $10,000 income bracket, making it the least populous group.
| Income Bracket | # Households | % Households |
| Less than $10,000 | 6 | 0.5% |
| $10,000 to $14,999 | 32 | 2.8% |
| $15,000 to $24,999 | 94 | 8.1% |
| $25,000 to $34,999 | 66 | 5.7% |
| $35,000 to $49,999 | 117 | 10.1% |
| $50,000 to $74,999 | 266 | 23.0% |
| $75,000 to $99,999 | 104 | 9.0% |
| $100,000 to $149,999 | 283 | 24.5% |
| $150,000 to $199,999 | 142 | 12.3% |
| $200,000+ | 45 | 3.9% |
Household Income by Householder Age in Silt
The median household income in Silt is $72,450, with the highest median household income of $93,882 found in the 45 to 64 years age bracket for the primary householder. A total of 415 households (35.9%) fall into this category. Meanwhile, the 15 to 24 years age bracket for the primary householder has the lowest median household income of $0, with 38 households (3.3%) in this group.
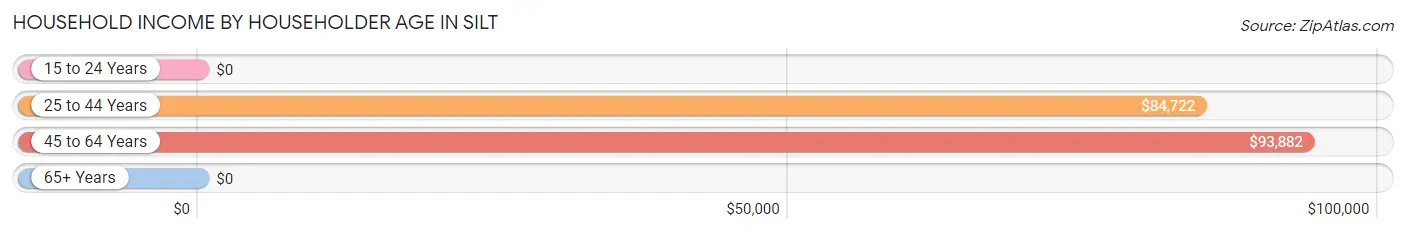
| Income Bracket | # Households | Median Income |
| 15 to 24 Years | 38 (3.3%) | $0 |
| 25 to 44 Years | 540 (46.8%) | $84,722 |
| 45 to 64 Years | 415 (35.9%) | $93,882 |
| 65+ Years | 162 (14.0%) | $0 |
| Total | 1,155 (100.0%) | $72,450 |
Poverty in Silt
Income Below Poverty by Sex and Age in Silt
With 7.4% poverty level for males and 8.3% for females among the residents of Silt, 5 year old males and 75 year old and over females are the most vulnerable to poverty, with 5 males (22.7%) and 5 females (50.0%) in their respective age groups living below the poverty level.
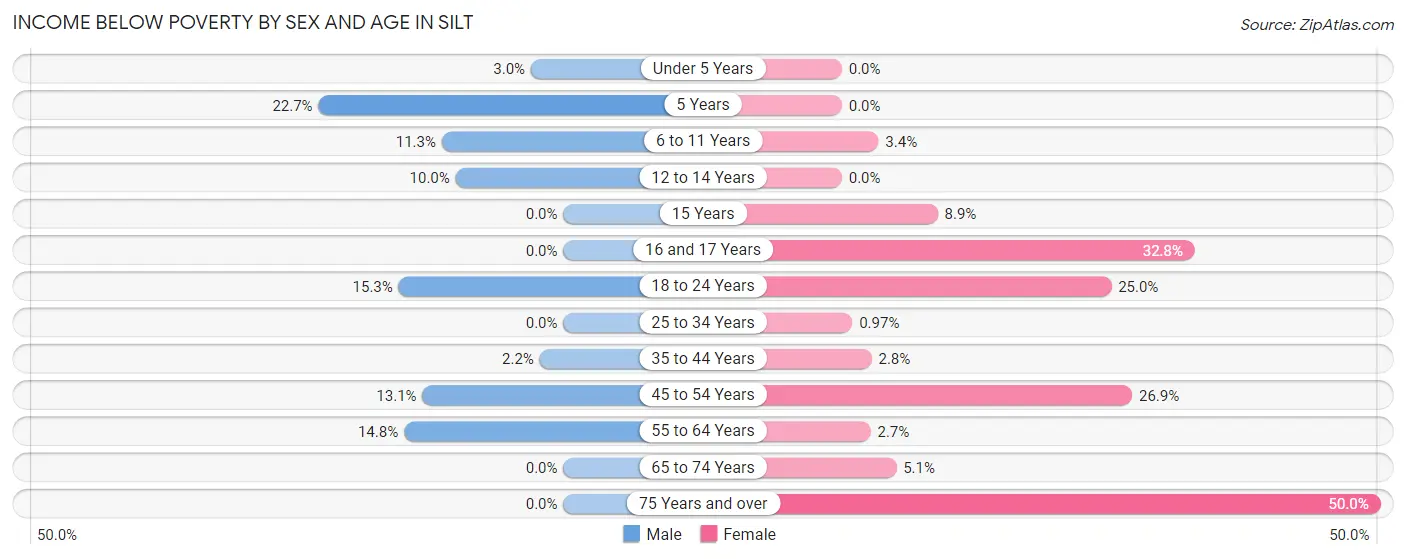
| Age Bracket | Male | Female |
| Under 5 Years | 4 (3.0%) | 0 (0.0%) |
| 5 Years | 5 (22.7%) | 0 (0.0%) |
| 6 to 11 Years | 22 (11.3%) | 8 (3.4%) |
| 12 to 14 Years | 11 (10.0%) | 0 (0.0%) |
| 15 Years | 0 (0.0%) | 4 (8.9%) |
| 16 and 17 Years | 0 (0.0%) | 19 (32.8%) |
| 18 to 24 Years | 24 (15.3%) | 35 (25.0%) |
| 25 to 34 Years | 0 (0.0%) | 3 (1.0%) |
| 35 to 44 Years | 7 (2.2%) | 8 (2.8%) |
| 45 to 54 Years | 34 (13.1%) | 59 (26.9%) |
| 55 to 64 Years | 21 (14.8%) | 4 (2.7%) |
| 65 to 74 Years | 0 (0.0%) | 5 (5.1%) |
| 75 Years and over | 0 (0.0%) | 5 (50.0%) |
| Total | 128 (7.4%) | 150 (8.3%) |
Income Above Poverty by Sex and Age in Silt
According to the poverty statistics in Silt, males aged 15 years and females aged under 5 years are the age groups that are most secure financially, with 100.0% of males and 100.0% of females in these age groups living above the poverty line.
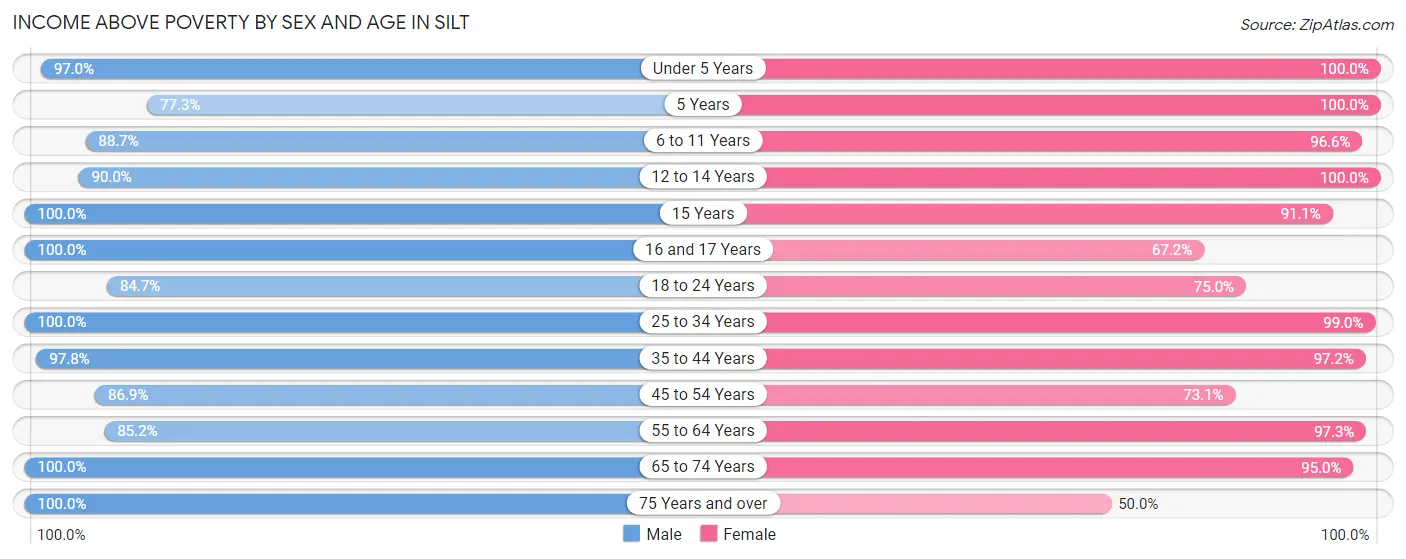
| Age Bracket | Male | Female |
| Under 5 Years | 129 (97.0%) | 150 (100.0%) |
| 5 Years | 17 (77.3%) | 31 (100.0%) |
| 6 to 11 Years | 173 (88.7%) | 227 (96.6%) |
| 12 to 14 Years | 99 (90.0%) | 70 (100.0%) |
| 15 Years | 4 (100.0%) | 41 (91.1%) |
| 16 and 17 Years | 50 (100.0%) | 39 (67.2%) |
| 18 to 24 Years | 133 (84.7%) | 105 (75.0%) |
| 25 to 34 Years | 186 (100.0%) | 307 (99.0%) |
| 35 to 44 Years | 311 (97.8%) | 282 (97.2%) |
| 45 to 54 Years | 226 (86.9%) | 160 (73.1%) |
| 55 to 64 Years | 121 (85.2%) | 146 (97.3%) |
| 65 to 74 Years | 101 (100.0%) | 94 (95.0%) |
| 75 Years and over | 44 (100.0%) | 5 (50.0%) |
| Total | 1,594 (92.6%) | 1,657 (91.7%) |
Income Below Poverty Among Married-Couple Families in Silt
The poverty statistics for married-couple families in Silt show that 5.6% or 40 of the total 721 families live below the poverty line. Families with 3 or 4 children have the highest poverty rate of 8.1%, comprising of 7 families. On the other hand, families with 5 or more children have the lowest poverty rate of 0.0%, which includes 0 families.
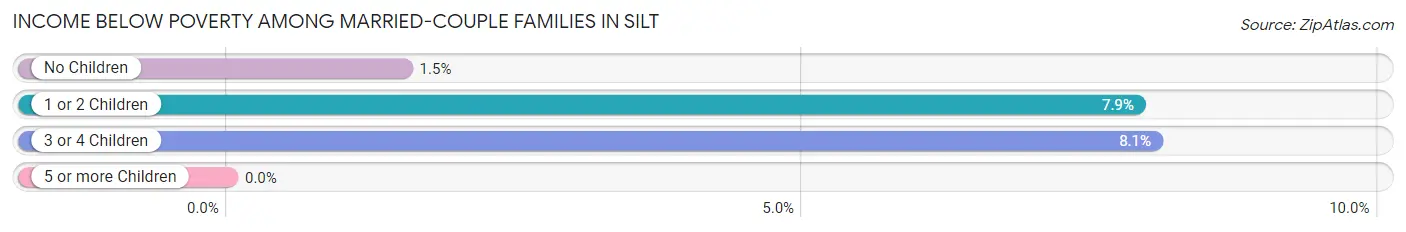
| Children | Above Poverty | Below Poverty |
| No Children | 259 (98.5%) | 4 (1.5%) |
| 1 or 2 Children | 338 (92.1%) | 29 (7.9%) |
| 3 or 4 Children | 80 (91.9%) | 7 (8.1%) |
| 5 or more Children | 4 (100.0%) | 0 (0.0%) |
| Total | 681 (94.5%) | 40 (5.6%) |
Income Below Poverty Among Single-Parent Households in Silt
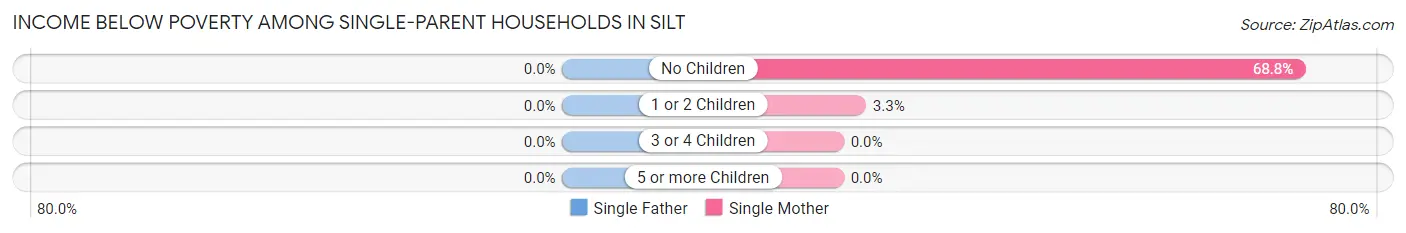
| Children | Single Father | Single Mother |
| No Children | 0 (0.0%) | 22 (68.8%) |
| 1 or 2 Children | 0 (0.0%) | 4 (3.3%) |
| 3 or 4 Children | 0 (0.0%) | 0 (0.0%) |
| 5 or more Children | 0 (0.0%) | 0 (0.0%) |
| Total | 0 (0.0%) | 26 (17.0%) |
Income Below Poverty Among Married-Couple vs Single-Parent Households in Silt
The poverty data for Silt shows that 40 of the married-couple family households (5.6%) and 26 of the single-parent households (13.6%) are living below the poverty level. Within the married-couple family households, those with 3 or 4 children have the highest poverty rate, with 7 households (8.1%) falling below the poverty line. Among the single-parent households, those with no children have the highest poverty rate, with 22 household (40.0%) living below poverty.
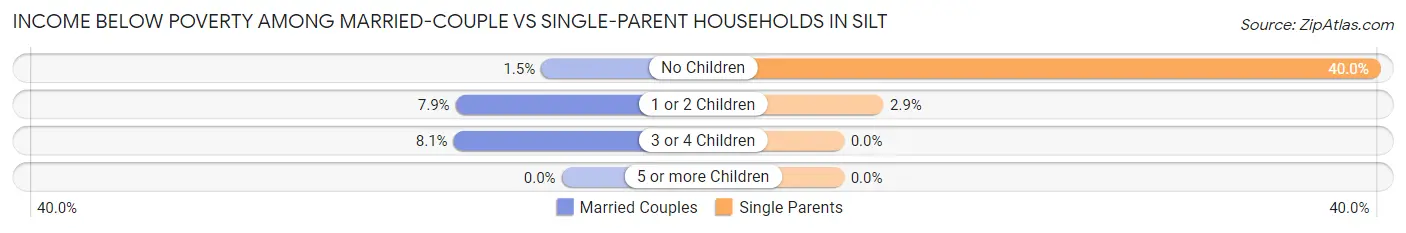
| Children | Married-Couple Families | Single-Parent Households |
| No Children | 4 (1.5%) | 22 (40.0%) |
| 1 or 2 Children | 29 (7.9%) | 4 (2.9%) |
| 3 or 4 Children | 7 (8.1%) | 0 (0.0%) |
| 5 or more Children | 0 (0.0%) | 0 (0.0%) |
| Total | 40 (5.6%) | 26 (13.6%) |
Race in Silt
The most populous races in Silt are White / Caucasian (2,572 | 72.9%), Hispanic or Latino (1,405 | 39.8%), and Two or more Races (602 | 17.1%).
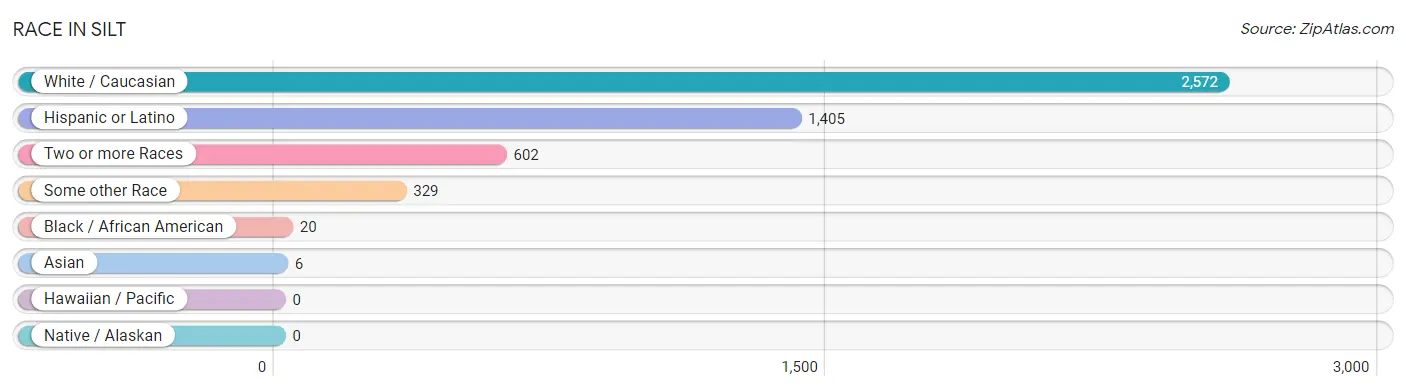
| Race | # Population | % Population |
| Asian | 6 | 0.2% |
| Black / African American | 20 | 0.6% |
| Hawaiian / Pacific | 0 | 0.0% |
| Hispanic or Latino | 1,405 | 39.8% |
| Native / Alaskan | 0 | 0.0% |
| White / Caucasian | 2,572 | 72.9% |
| Two or more Races | 602 | 17.1% |
| Some other Race | 329 | 9.3% |
| Total | 3,529 | 100.0% |
Ancestry in Silt
The most populous ancestries reported in Silt are Mexican (1,000 | 28.3%), German (438 | 12.4%), Polish (228 | 6.5%), English (202 | 5.7%), and American (129 | 3.7%), together accounting for 56.6% of all Silt residents.
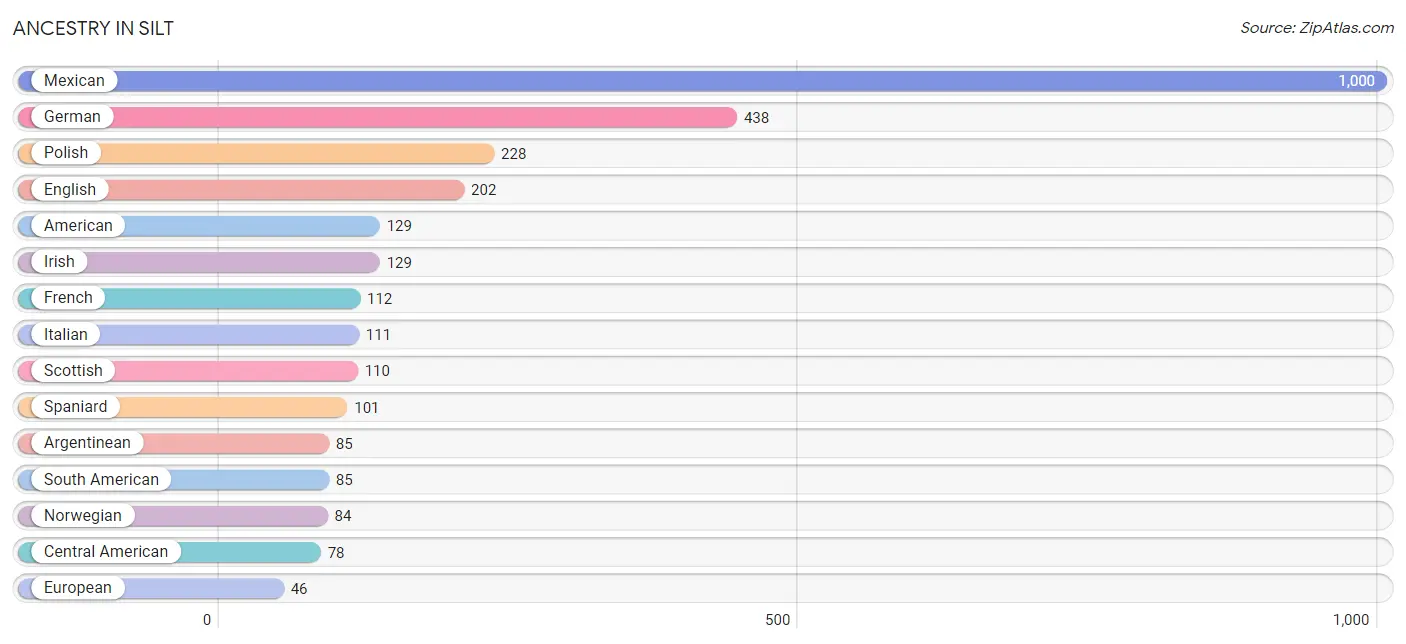
| Ancestry | # Population | % Population |
| American | 129 | 3.7% |
| Argentinean | 85 | 2.4% |
| Brazilian | 9 | 0.3% |
| British | 17 | 0.5% |
| Burmese | 6 | 0.2% |
| Central American | 78 | 2.2% |
| Danish | 18 | 0.5% |
| Dutch | 15 | 0.4% |
| Eastern European | 24 | 0.7% |
| English | 202 | 5.7% |
| European | 46 | 1.3% |
| Finnish | 3 | 0.1% |
| French | 112 | 3.2% |
| French Canadian | 4 | 0.1% |
| German | 438 | 12.4% |
| Greek | 16 | 0.4% |
| Guatemalan | 22 | 0.6% |
| Honduran | 14 | 0.4% |
| Irish | 129 | 3.7% |
| Iroquois | 9 | 0.3% |
| Italian | 111 | 3.2% |
| Mexican | 1,000 | 28.3% |
| Mexican American Indian | 8 | 0.2% |
| Northern European | 35 | 1.0% |
| Norwegian | 84 | 2.4% |
| Polish | 228 | 6.5% |
| Portuguese | 14 | 0.4% |
| Russian | 17 | 0.5% |
| Salvadoran | 42 | 1.2% |
| Scandinavian | 8 | 0.2% |
| Scotch-Irish | 39 | 1.1% |
| Scottish | 110 | 3.1% |
| South American | 85 | 2.4% |
| Spaniard | 101 | 2.9% |
| Swedish | 4 | 0.1% |
| Swiss | 8 | 0.2% |
| Welsh | 15 | 0.4% | View All 37 Rows |
Immigrants in Silt
The most numerous immigrant groups reported in Silt came from Latin America (674 | 19.1%), Central America (580 | 16.4%), Mexico (523 | 14.8%), South America (94 | 2.7%), and Argentina (85 | 2.4%), together accounting for 55.4% of all Silt residents.
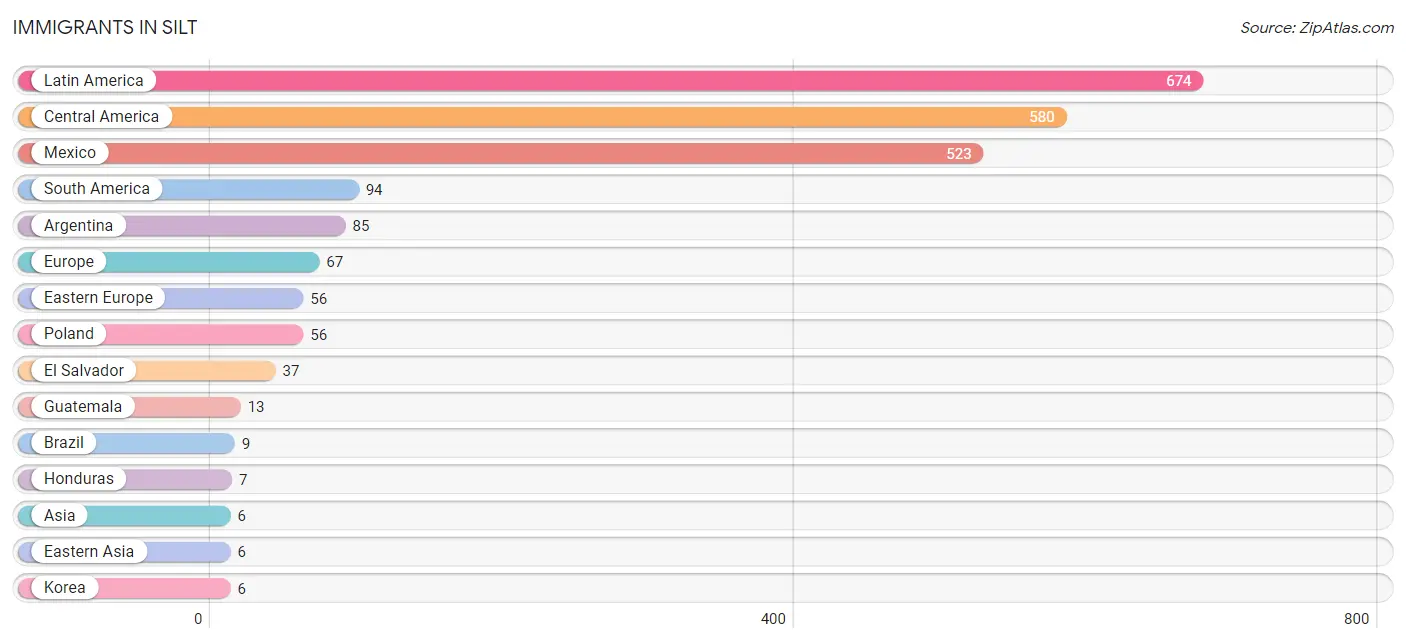
| Immigration Origin | # Population | % Population |
| Argentina | 85 | 2.4% |
| Asia | 6 | 0.2% |
| Brazil | 9 | 0.3% |
| Canada | 4 | 0.1% |
| Central America | 580 | 16.4% |
| Eastern Asia | 6 | 0.2% |
| Eastern Europe | 56 | 1.6% |
| El Salvador | 37 | 1.1% |
| England | 5 | 0.1% |
| Europe | 67 | 1.9% |
| Guatemala | 13 | 0.4% |
| Honduras | 7 | 0.2% |
| Korea | 6 | 0.2% |
| Latin America | 674 | 19.1% |
| Mexico | 523 | 14.8% |
| Northern Europe | 5 | 0.1% |
| Poland | 56 | 1.6% |
| Portugal | 6 | 0.2% |
| South America | 94 | 2.7% |
| Southern Europe | 6 | 0.2% | View All 20 Rows |
Sex and Age in Silt
Sex and Age in Silt
The most populous age groups in Silt are 10 to 14 Years (225 | 13.1%) for men and 5 to 9 Years (183 | 10.1%) for women.
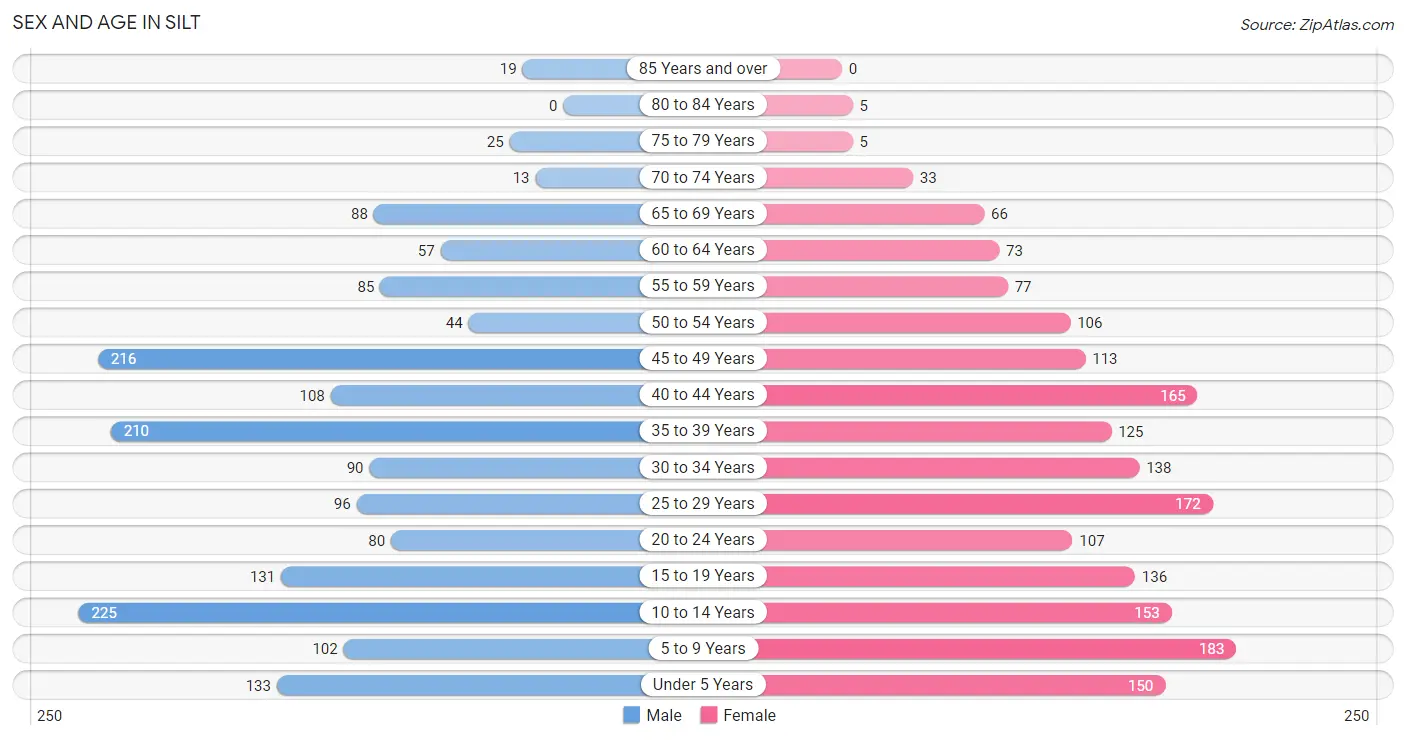
| Age Bracket | Male | Female |
| Under 5 Years | 133 (7.7%) | 150 (8.3%) |
| 5 to 9 Years | 102 (5.9%) | 183 (10.1%) |
| 10 to 14 Years | 225 (13.1%) | 153 (8.5%) |
| 15 to 19 Years | 131 (7.6%) | 136 (7.5%) |
| 20 to 24 Years | 80 (4.6%) | 107 (5.9%) |
| 25 to 29 Years | 96 (5.6%) | 172 (9.5%) |
| 30 to 34 Years | 90 (5.2%) | 138 (7.6%) |
| 35 to 39 Years | 210 (12.2%) | 125 (6.9%) |
| 40 to 44 Years | 108 (6.3%) | 165 (9.1%) |
| 45 to 49 Years | 216 (12.5%) | 113 (6.2%) |
| 50 to 54 Years | 44 (2.6%) | 106 (5.9%) |
| 55 to 59 Years | 85 (4.9%) | 77 (4.3%) |
| 60 to 64 Years | 57 (3.3%) | 73 (4.0%) |
| 65 to 69 Years | 88 (5.1%) | 66 (3.6%) |
| 70 to 74 Years | 13 (0.7%) | 33 (1.8%) |
| 75 to 79 Years | 25 (1.5%) | 5 (0.3%) |
| 80 to 84 Years | 0 (0.0%) | 5 (0.3%) |
| 85 Years and over | 19 (1.1%) | 0 (0.0%) |
| Total | 1,722 (100.0%) | 1,807 (100.0%) |
Families and Households in Silt
Median Family Size in Silt
The median family size in Silt is 3.39 persons per family, with married-couple families (721 | 79.1%) accounting for the largest median family size of 3.67 persons per family. On the other hand, single male/father families (38 | 4.2%) represent the smallest median family size with 2.34 persons per family.
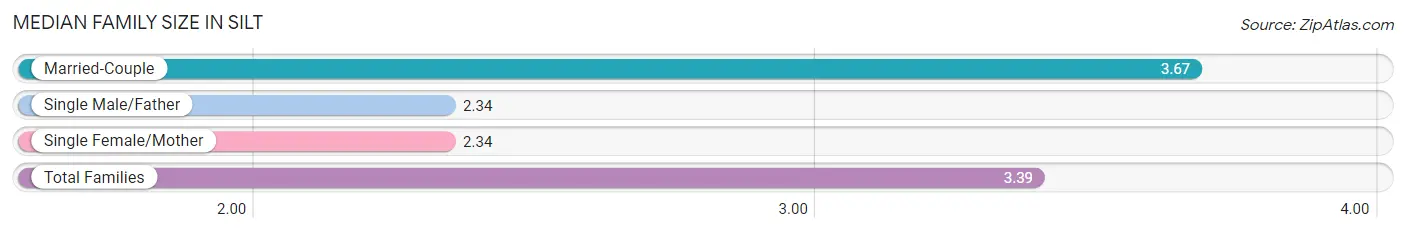
| Family Type | # Families | Family Size |
| Married-Couple | 721 (79.1%) | 3.67 |
| Single Male/Father | 38 (4.2%) | 2.34 |
| Single Female/Mother | 153 (16.8%) | 2.34 |
| Total Families | 912 (100.0%) | 3.39 |
Median Household Size in Silt
The median household size in Silt is 3.06 persons per household, with married-couple households (721 | 62.4%) accounting for the largest median household size of 3.67 persons per household. non-family households (243 | 21.0%) represent the smallest median household size with 1.48 persons per household.
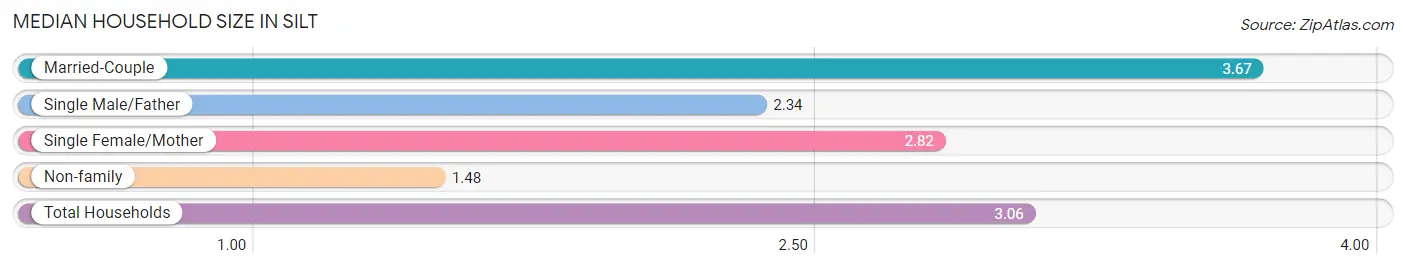
| Household Type | # Households | Household Size |
| Married-Couple | 721 (62.4%) | 3.67 |
| Single Male/Father | 38 (3.3%) | 2.34 |
| Single Female/Mother | 153 (13.3%) | 2.82 |
| Non-family | 243 (21.0%) | 1.48 |
| Total Households | 1,155 (100.0%) | 3.06 |
Household Size by Marriage Status in Silt
Out of a total of 1,155 households in Silt, 912 (79.0%) are family households, while 243 (21.0%) are nonfamily households. The most numerous type of family households are 4-person households, comprising 285, and the most common type of nonfamily households are 1-person households, comprising 178.
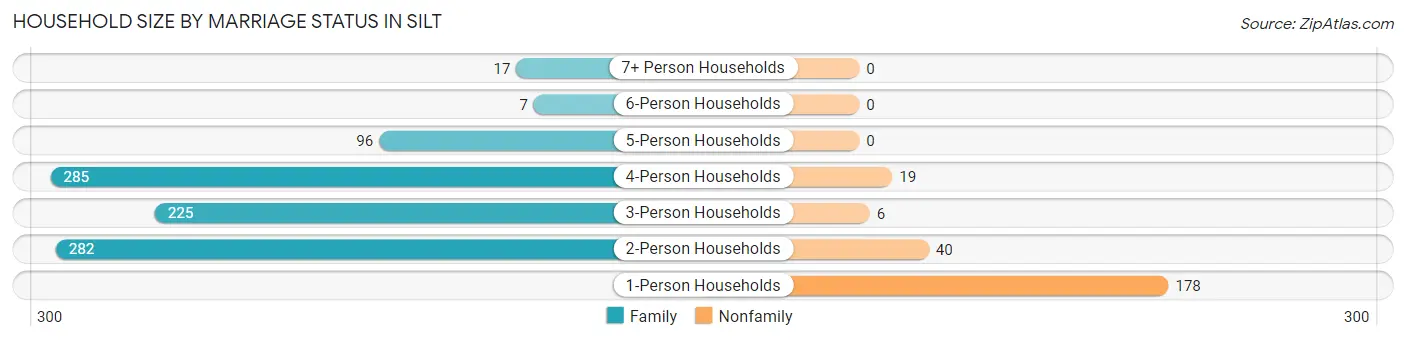
| Household Size | Family Households | Nonfamily Households |
| 1-Person Households | - | 178 (15.4%) |
| 2-Person Households | 282 (24.4%) | 40 (3.5%) |
| 3-Person Households | 225 (19.5%) | 6 (0.5%) |
| 4-Person Households | 285 (24.7%) | 19 (1.7%) |
| 5-Person Households | 96 (8.3%) | 0 (0.0%) |
| 6-Person Households | 7 (0.6%) | 0 (0.0%) |
| 7+ Person Households | 17 (1.5%) | 0 (0.0%) |
| Total | 912 (79.0%) | 243 (21.0%) |
Female Fertility in Silt
Fertility by Age in Silt
Average fertility rate in Silt is 50.0 births per 1,000 women. Women in the age bracket of 20 to 34 years have the highest fertility rate with 115.0 births per 1,000 women. Women in the age bracket of 20 to 34 years acount for 100.0% of all women with births.
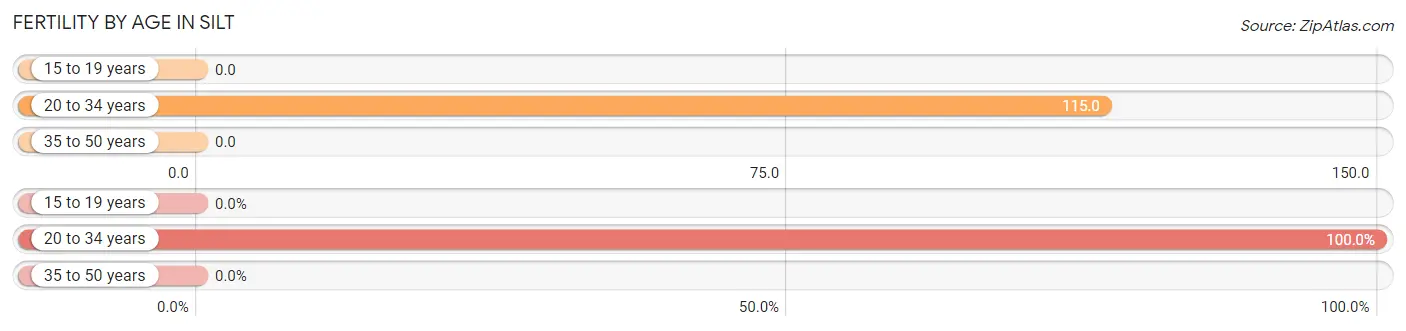
| Age Bracket | Women with Births | Births / 1,000 Women |
| 15 to 19 years | 0 (0.0%) | 0.0 |
| 20 to 34 years | 48 (100.0%) | 115.0 |
| 35 to 50 years | 0 (0.0%) | 0.0 |
| Total | 48 (100.0%) | 50.0 |
Fertility by Age by Marriage Status in Silt
72.9% of women with births (48) in Silt are married. The highest percentage of unmarried women with births falls into 20 to 34 years age bracket with 27.1% of them unmarried at the time of birth, while the lowest percentage of unmarried women with births belong to 20 to 34 years age bracket with 27.1% of them unmarried.
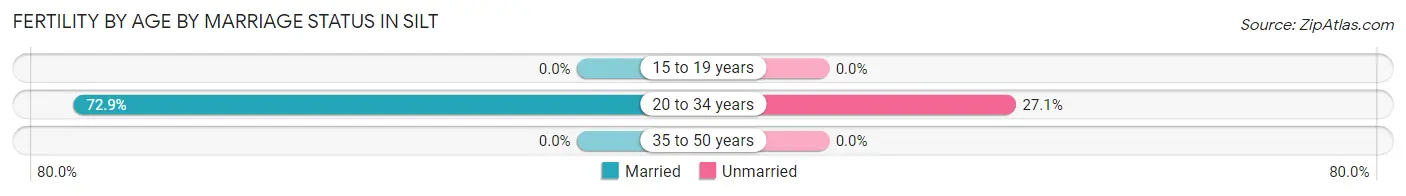
| Age Bracket | Married | Unmarried |
| 15 to 19 years | 0 (0.0%) | 0 (0.0%) |
| 20 to 34 years | 35 (72.9%) | 13 (27.1%) |
| 35 to 50 years | 0 (0.0%) | 0 (0.0%) |
| Total | 35 (72.9%) | 13 (27.1%) |
Fertility by Education in Silt
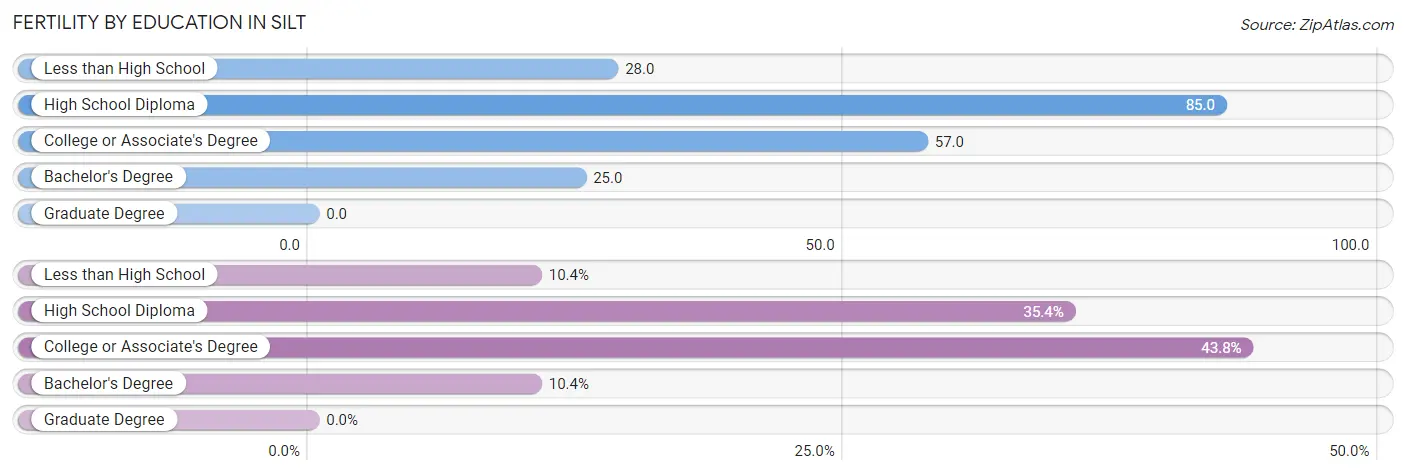
| Educational Attainment | Women with Births | Births / 1,000 Women |
| Less than High School | 5 (10.4%) | 28.0 |
| High School Diploma | 17 (35.4%) | 85.0 |
| College or Associate's Degree | 21 (43.8%) | 57.0 |
| Bachelor's Degree | 5 (10.4%) | 25.0 |
| Graduate Degree | 0 (0.0%) | 0.0 |
| Total | 48 (100.0%) | 50.0 |
Fertility by Education by Marriage Status in Silt
27.1% of women with births in Silt are unmarried. Women with the educational attainment of less than high school are most likely to be married with 100.0% of them married at childbirth, while women with the educational attainment of high school diploma are least likely to be married with 76.5% of them unmarried at childbirth.
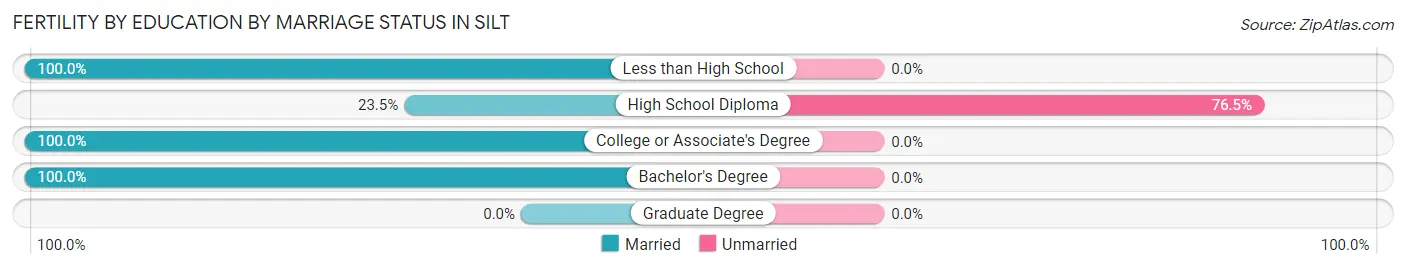
| Educational Attainment | Married | Unmarried |
| Less than High School | 5 (100.0%) | 0 (0.0%) |
| High School Diploma | 4 (23.5%) | 13 (76.5%) |
| College or Associate's Degree | 21 (100.0%) | 0 (0.0%) |
| Bachelor's Degree | 5 (100.0%) | 0 (0.0%) |
| Graduate Degree | 0 (0.0%) | 0 (0.0%) |
| Total | 35 (72.9%) | 13 (27.1%) |
Employment Characteristics in Silt
Employment by Class of Employer in Silt
Among the 1,908 employed individuals in Silt, private company employees (1,251 | 65.6%), local government employees (243 | 12.7%), and self-employed (incorporated) (158 | 8.3%) make up the most common classes of employment.
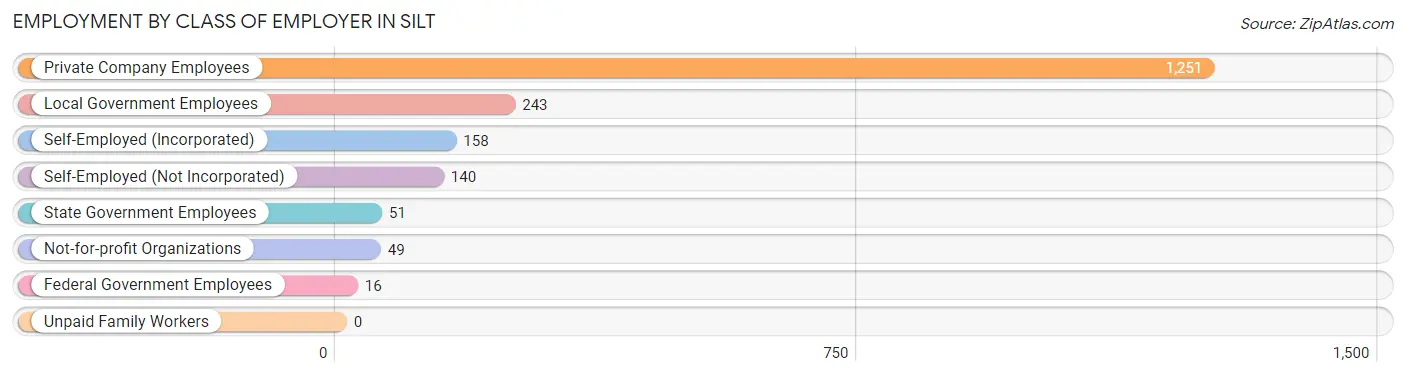
| Employer Class | # Employees | % Employees |
| Private Company Employees | 1,251 | 65.6% |
| Self-Employed (Incorporated) | 158 | 8.3% |
| Self-Employed (Not Incorporated) | 140 | 7.3% |
| Not-for-profit Organizations | 49 | 2.6% |
| Local Government Employees | 243 | 12.7% |
| State Government Employees | 51 | 2.7% |
| Federal Government Employees | 16 | 0.8% |
| Unpaid Family Workers | 0 | 0.0% |
| Total | 1,908 | 100.0% |
Employment Status by Age in Silt
According to the labor force statistics for Silt, out of the total population over 16 years of age (2,534), 77.8% or 1,971 individuals are in the labor force, with 1.7% or 34 of them unemployed. The age group with the highest labor force participation rate is 20 to 24 years, with 97.3% or 182 individuals in the labor force. Within the labor force, the 45 to 54 years age range has the highest percentage of unemployed individuals, with 5.0% or 22 of them being unemployed.
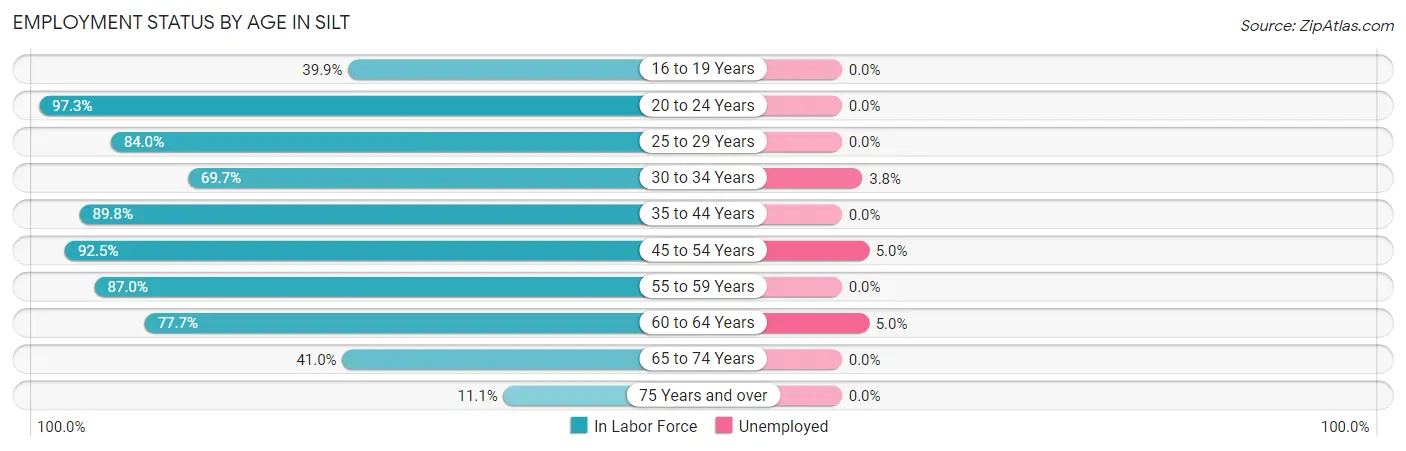
| Age Bracket | In Labor Force | Unemployed |
| 16 to 19 Years | 87 (39.9%) | 0 (0.0%) |
| 20 to 24 Years | 182 (97.3%) | 0 (0.0%) |
| 25 to 29 Years | 225 (84.0%) | 0 (0.0%) |
| 30 to 34 Years | 159 (69.7%) | 6 (3.8%) |
| 35 to 44 Years | 546 (89.8%) | 0 (0.0%) |
| 45 to 54 Years | 443 (92.5%) | 22 (5.0%) |
| 55 to 59 Years | 141 (87.0%) | 0 (0.0%) |
| 60 to 64 Years | 101 (77.7%) | 5 (5.0%) |
| 65 to 74 Years | 82 (41.0%) | 0 (0.0%) |
| 75 Years and over | 6 (11.1%) | 0 (0.0%) |
| Total | 1,971 (77.8%) | 34 (1.7%) |
Employment Status by Educational Attainment in Silt
According to labor force statistics for Silt, 86.1% of individuals (1,614) out of the total population between 25 and 64 years of age (1,875) are in the labor force, with 2.0% or 32 of them being unemployed. The group with the highest labor force participation rate are those with the educational attainment of bachelor's degree or higher, with 97.0% or 322 individuals in the labor force. Within the labor force, individuals with less than high school education have the highest percentage of unemployment, with 9.6% or 22 of them being unemployed.
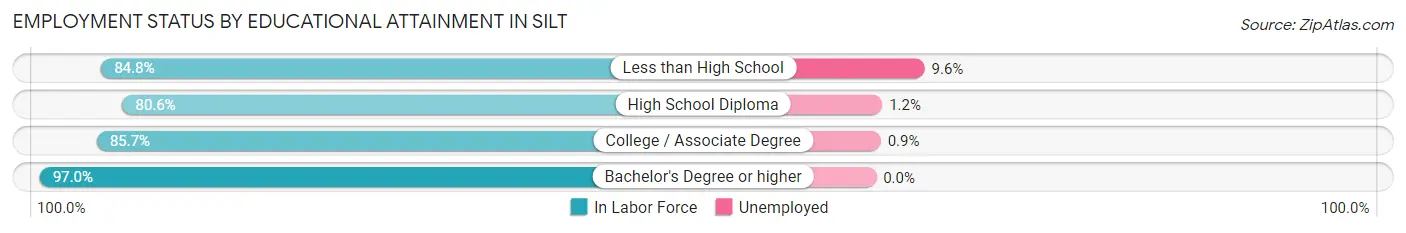
| Educational Attainment | In Labor Force | Unemployed |
| Less than High School | 229 (84.8%) | 26 (9.6%) |
| High School Diploma | 419 (80.6%) | 6 (1.2%) |
| College / Associate Degree | 645 (85.7%) | 7 (0.9%) |
| Bachelor's Degree or higher | 322 (97.0%) | 0 (0.0%) |
| Total | 1,614 (86.1%) | 38 (2.0%) |
Employment Occupations by Sex in Silt
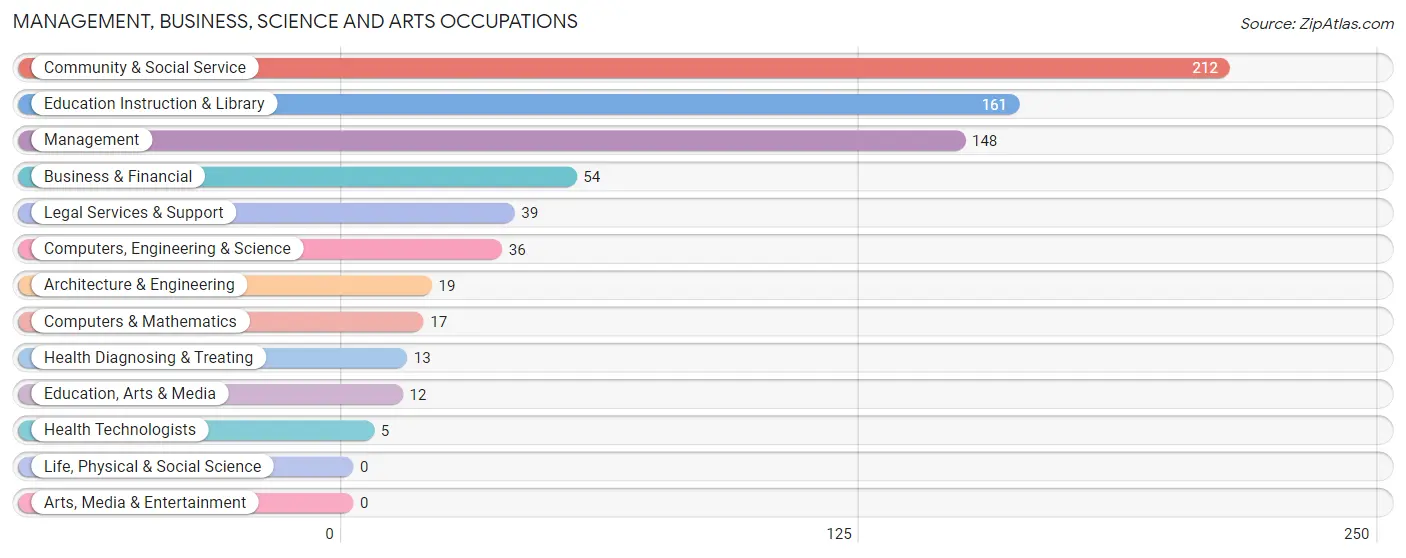
Management, Business, Science and Arts Occupations
The most common Management, Business, Science and Arts occupations in Silt are Community & Social Service (212 | 10.9%), Education Instruction & Library (161 | 8.3%), Management (148 | 7.6%), Business & Financial (54 | 2.8%), and Legal Services & Support (39 | 2.0%).
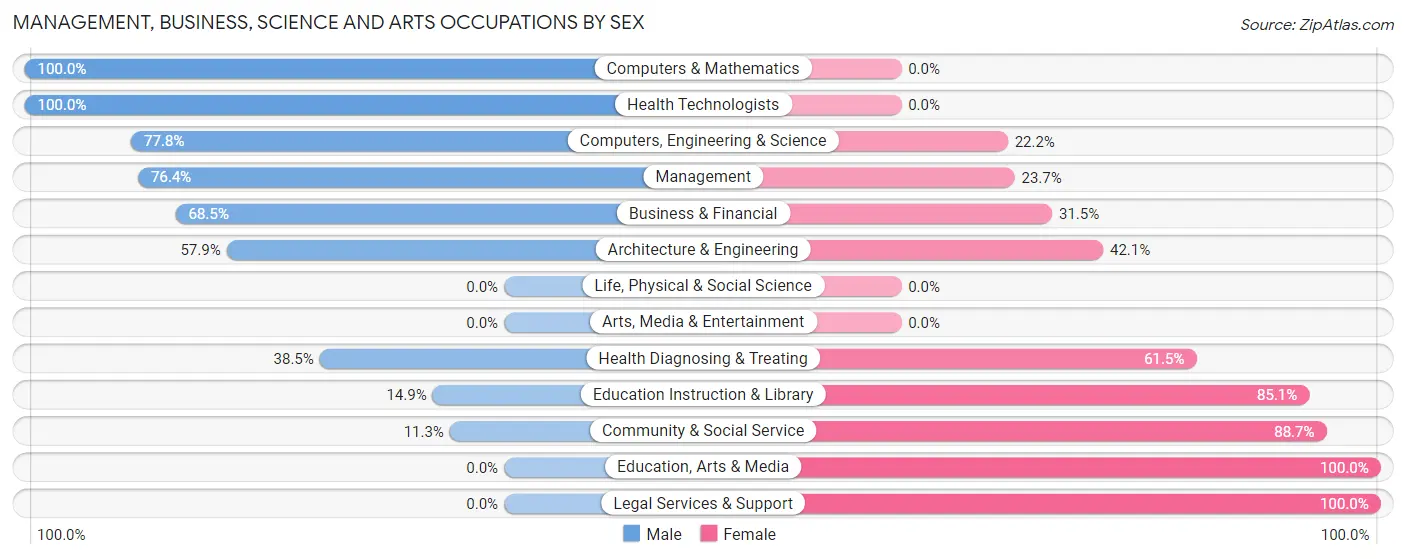
Management, Business, Science and Arts Occupations by Sex
Within the Management, Business, Science and Arts occupations in Silt, the most male-oriented occupations are Computers & Mathematics (100.0%), Health Technologists (100.0%), and Computers, Engineering & Science (77.8%), while the most female-oriented occupations are Education, Arts & Media (100.0%), Legal Services & Support (100.0%), and Community & Social Service (88.7%).
| Occupation | Male | Female |
| Management | 113 (76.3%) | 35 (23.6%) |
| Business & Financial | 37 (68.5%) | 17 (31.5%) |
| Computers, Engineering & Science | 28 (77.8%) | 8 (22.2%) |
| Computers & Mathematics | 17 (100.0%) | 0 (0.0%) |
| Architecture & Engineering | 11 (57.9%) | 8 (42.1%) |
| Life, Physical & Social Science | 0 (0.0%) | 0 (0.0%) |
| Community & Social Service | 24 (11.3%) | 188 (88.7%) |
| Education, Arts & Media | 0 (0.0%) | 12 (100.0%) |
| Legal Services & Support | 0 (0.0%) | 39 (100.0%) |
| Education Instruction & Library | 24 (14.9%) | 137 (85.1%) |
| Arts, Media & Entertainment | 0 (0.0%) | 0 (0.0%) |
| Health Diagnosing & Treating | 5 (38.5%) | 8 (61.5%) |
| Health Technologists | 5 (100.0%) | 0 (0.0%) |
| Total (Category) | 207 (44.7%) | 256 (55.3%) |
| Total (Overall) | 1,069 (55.1%) | 870 (44.9%) |
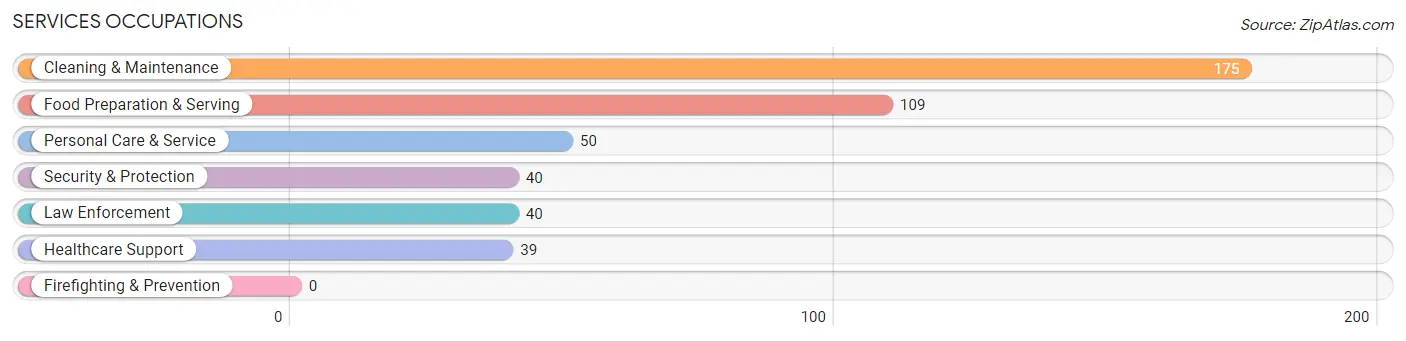
Services Occupations
The most common Services occupations in Silt are Cleaning & Maintenance (175 | 9.0%), Food Preparation & Serving (109 | 5.6%), Personal Care & Service (50 | 2.6%), Security & Protection (40 | 2.1%), and Law Enforcement (40 | 2.1%).
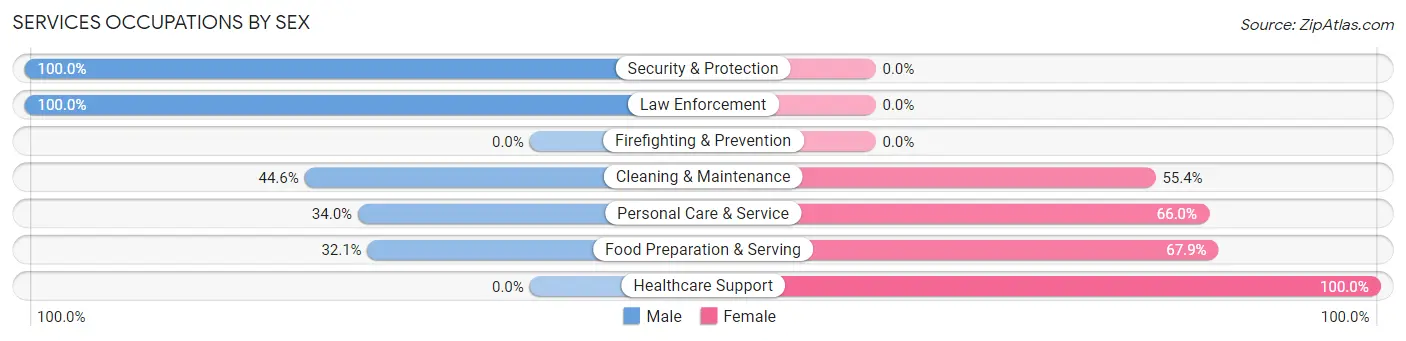
Services Occupations by Sex
Within the Services occupations in Silt, the most male-oriented occupations are Security & Protection (100.0%), Law Enforcement (100.0%), and Cleaning & Maintenance (44.6%), while the most female-oriented occupations are Healthcare Support (100.0%), Food Preparation & Serving (67.9%), and Personal Care & Service (66.0%).
| Occupation | Male | Female |
| Healthcare Support | 0 (0.0%) | 39 (100.0%) |
| Security & Protection | 40 (100.0%) | 0 (0.0%) |
| Firefighting & Prevention | 0 (0.0%) | 0 (0.0%) |
| Law Enforcement | 40 (100.0%) | 0 (0.0%) |
| Food Preparation & Serving | 35 (32.1%) | 74 (67.9%) |
| Cleaning & Maintenance | 78 (44.6%) | 97 (55.4%) |
| Personal Care & Service | 17 (34.0%) | 33 (66.0%) |
| Total (Category) | 170 (41.2%) | 243 (58.8%) |
| Total (Overall) | 1,069 (55.1%) | 870 (44.9%) |
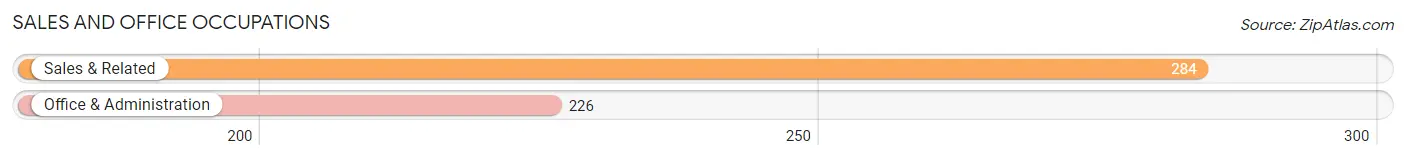
Sales and Office Occupations
The most common Sales and Office occupations in Silt are Sales & Related (284 | 14.6%), and Office & Administration (226 | 11.7%).
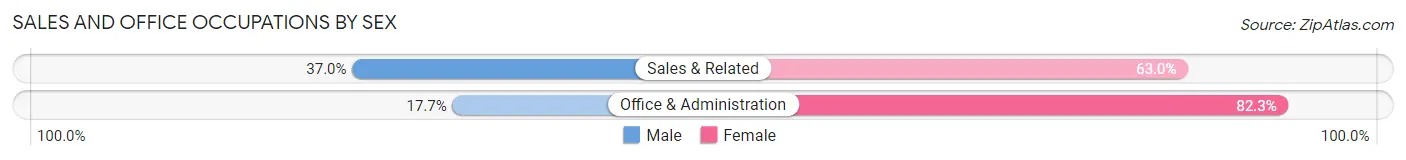
Sales and Office Occupations by Sex
| Occupation | Male | Female |
| Sales & Related | 105 (37.0%) | 179 (63.0%) |
| Office & Administration | 40 (17.7%) | 186 (82.3%) |
| Total (Category) | 145 (28.4%) | 365 (71.6%) |
| Total (Overall) | 1,069 (55.1%) | 870 (44.9%) |
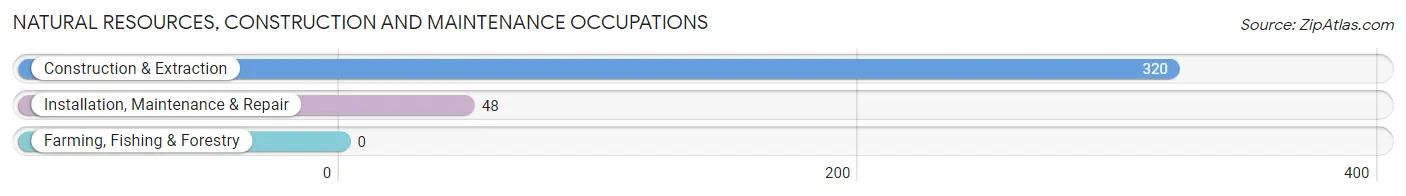
Natural Resources, Construction and Maintenance Occupations
The most common Natural Resources, Construction and Maintenance occupations in Silt are Construction & Extraction (320 | 16.5%), and Installation, Maintenance & Repair (48 | 2.5%).
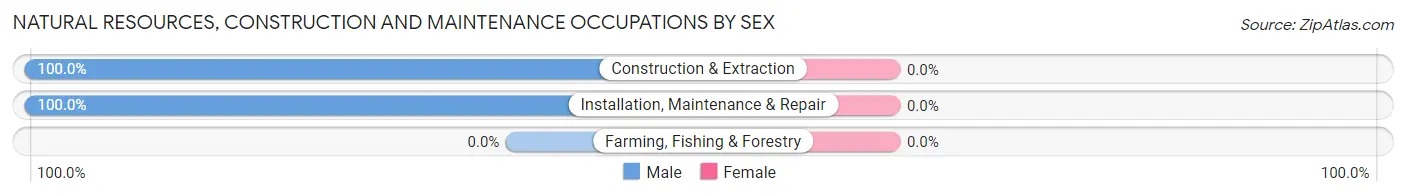
Natural Resources, Construction and Maintenance Occupations by Sex
| Occupation | Male | Female |
| Farming, Fishing & Forestry | 0 (0.0%) | 0 (0.0%) |
| Construction & Extraction | 320 (100.0%) | 0 (0.0%) |
| Installation, Maintenance & Repair | 48 (100.0%) | 0 (0.0%) |
| Total (Category) | 368 (100.0%) | 0 (0.0%) |
| Total (Overall) | 1,069 (55.1%) | 870 (44.9%) |
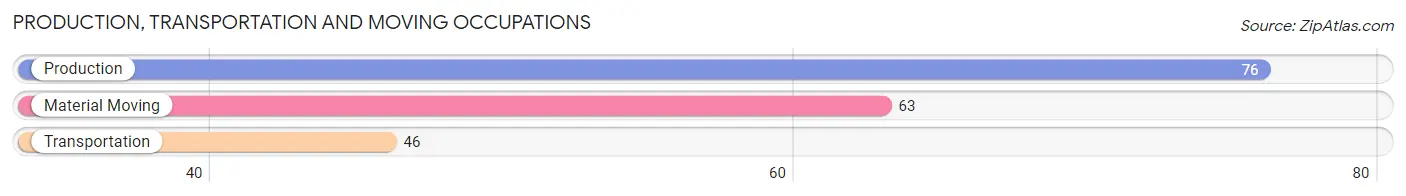
Production, Transportation and Moving Occupations
The most common Production, Transportation and Moving occupations in Silt are Production (76 | 3.9%), Material Moving (63 | 3.3%), and Transportation (46 | 2.4%).
Production, Transportation and Moving Occupations by Sex
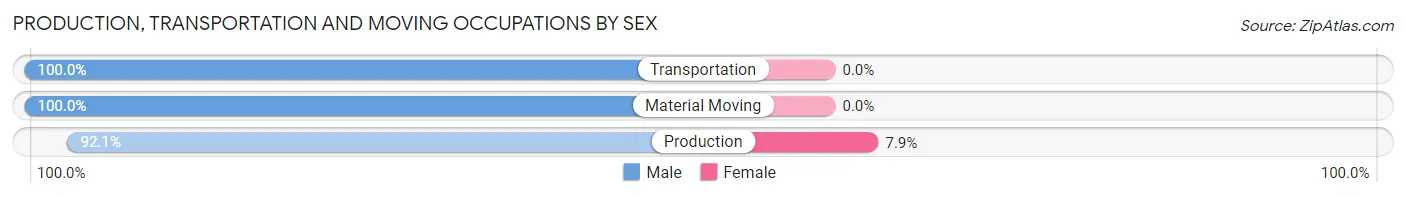
| Occupation | Male | Female |
| Production | 70 (92.1%) | 6 (7.9%) |
| Transportation | 46 (100.0%) | 0 (0.0%) |
| Material Moving | 63 (100.0%) | 0 (0.0%) |
| Total (Category) | 179 (96.8%) | 6 (3.2%) |
| Total (Overall) | 1,069 (55.1%) | 870 (44.9%) |
Employment Industries by Sex in Silt
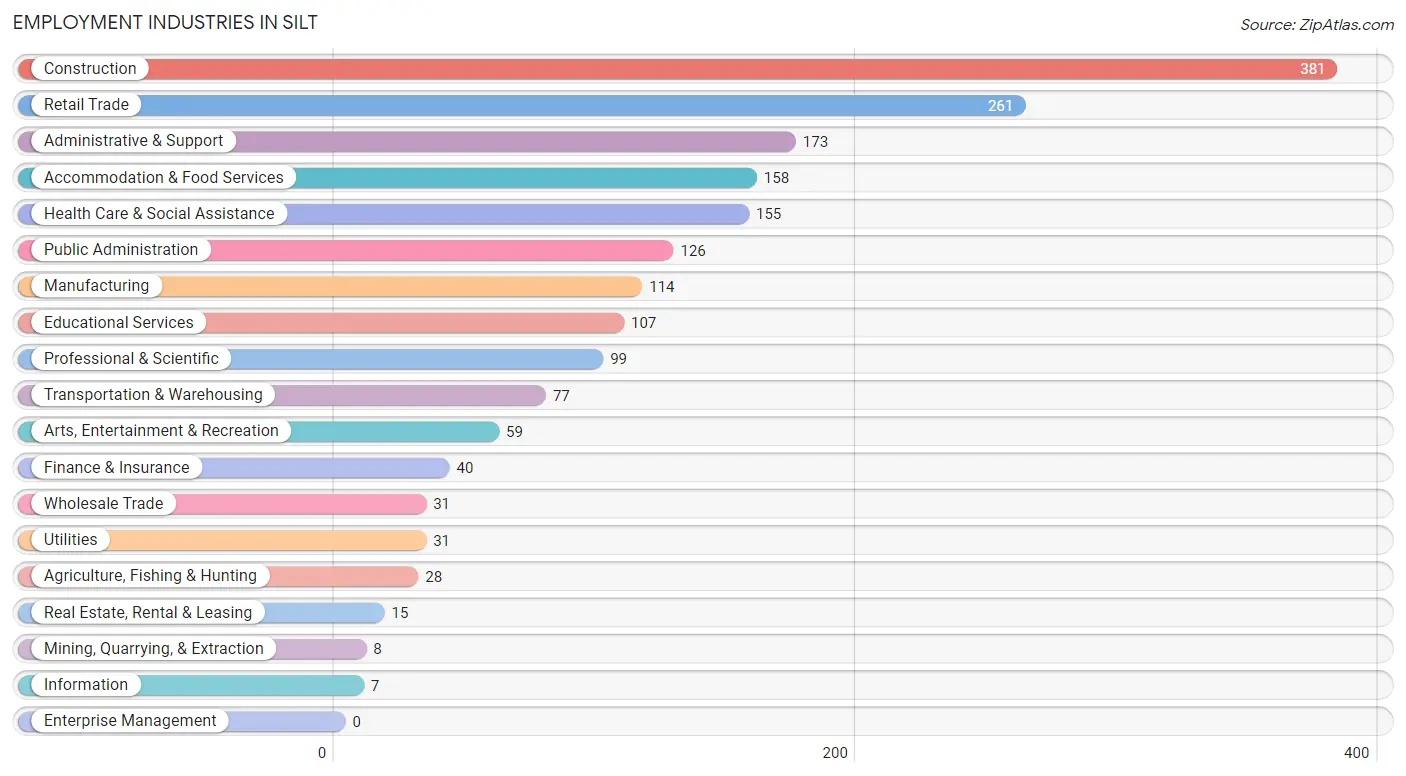
Employment Industries in Silt
The major employment industries in Silt include Construction (381 | 19.7%), Retail Trade (261 | 13.5%), Administrative & Support (173 | 8.9%), Accommodation & Food Services (158 | 8.2%), and Health Care & Social Assistance (155 | 8.0%).
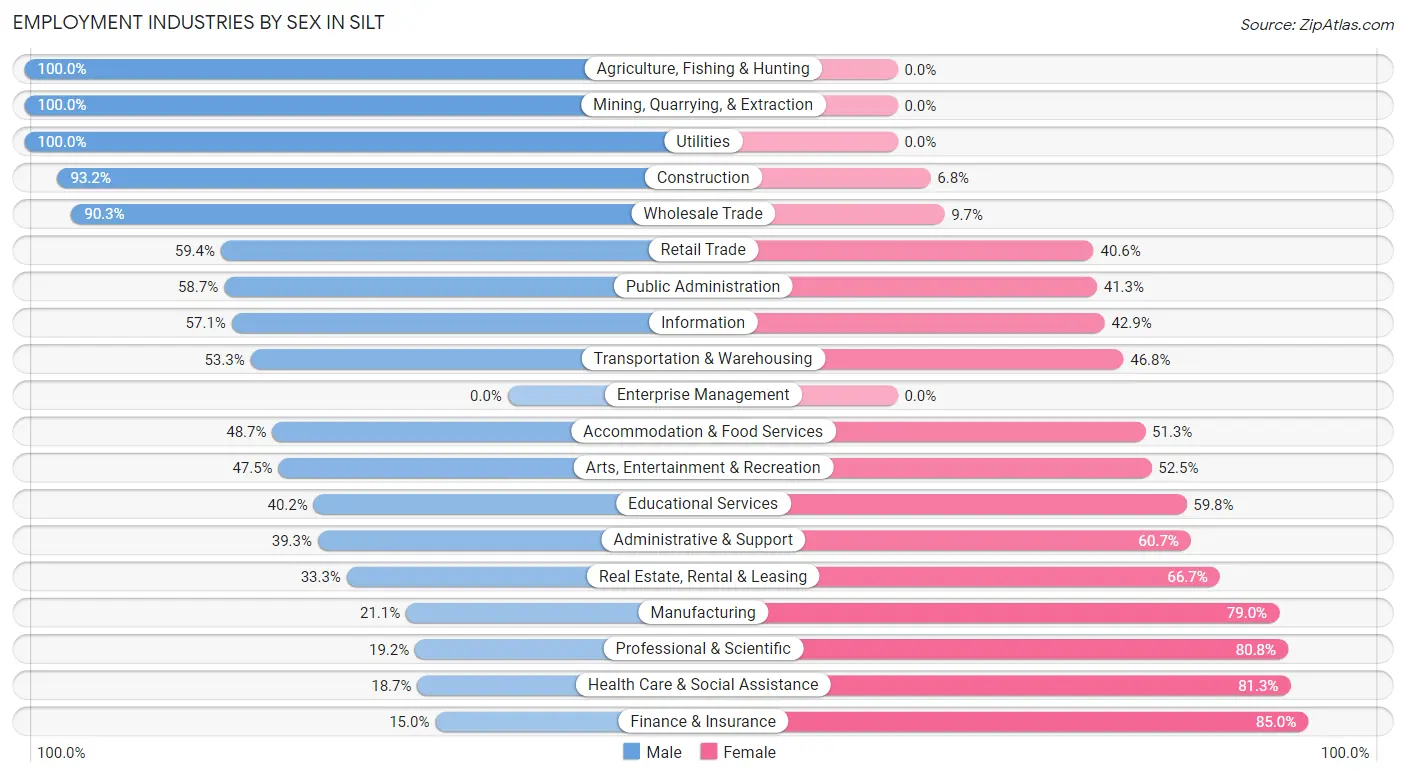
Employment Industries by Sex in Silt
The Silt industries that see more men than women are Agriculture, Fishing & Hunting (100.0%), Mining, Quarrying, & Extraction (100.0%), and Utilities (100.0%), whereas the industries that tend to have a higher number of women are Finance & Insurance (85.0%), Health Care & Social Assistance (81.3%), and Professional & Scientific (80.8%).
| Industry | Male | Female |
| Agriculture, Fishing & Hunting | 28 (100.0%) | 0 (0.0%) |
| Mining, Quarrying, & Extraction | 8 (100.0%) | 0 (0.0%) |
| Construction | 355 (93.2%) | 26 (6.8%) |
| Manufacturing | 24 (21.0%) | 90 (78.9%) |
| Wholesale Trade | 28 (90.3%) | 3 (9.7%) |
| Retail Trade | 155 (59.4%) | 106 (40.6%) |
| Transportation & Warehousing | 41 (53.2%) | 36 (46.8%) |
| Utilities | 31 (100.0%) | 0 (0.0%) |
| Information | 4 (57.1%) | 3 (42.9%) |
| Finance & Insurance | 6 (15.0%) | 34 (85.0%) |
| Real Estate, Rental & Leasing | 5 (33.3%) | 10 (66.7%) |
| Professional & Scientific | 19 (19.2%) | 80 (80.8%) |
| Enterprise Management | 0 (0.0%) | 0 (0.0%) |
| Administrative & Support | 68 (39.3%) | 105 (60.7%) |
| Educational Services | 43 (40.2%) | 64 (59.8%) |
| Health Care & Social Assistance | 29 (18.7%) | 126 (81.3%) |
| Arts, Entertainment & Recreation | 28 (47.5%) | 31 (52.5%) |
| Accommodation & Food Services | 77 (48.7%) | 81 (51.3%) |
| Public Administration | 74 (58.7%) | 52 (41.3%) |
| Total | 1,069 (55.1%) | 870 (44.9%) |
Education in Silt
School Enrollment in Silt
The most common levels of schooling among the 1,167 students in Silt are elementary school (312 | 26.7%), middle school (264 | 22.6%), and high school (208 | 17.8%).
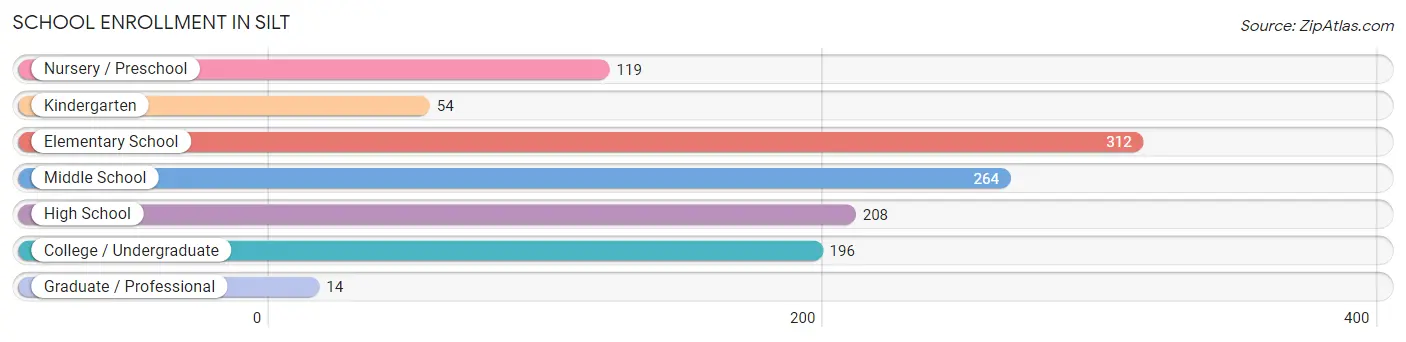
| School Level | # Students | % Students |
| Nursery / Preschool | 119 | 10.2% |
| Kindergarten | 54 | 4.6% |
| Elementary School | 312 | 26.7% |
| Middle School | 264 | 22.6% |
| High School | 208 | 17.8% |
| College / Undergraduate | 196 | 16.8% |
| Graduate / Professional | 14 | 1.2% |
| Total | 1,167 | 100.0% |
School Enrollment by Age by Funding Source in Silt
Out of a total of 1,167 students who are enrolled in schools in Silt, 111 (9.5%) attend a private institution, while the remaining 1,056 (90.5%) are enrolled in public schools. The age group of 10 to 14 year olds has the highest likelihood of being enrolled in private schools, with 74 (19.6% in the age bracket) enrolled. Conversely, the age group of 5 to 9 year old has the lowest likelihood of being enrolled in a private school, with 276 (100.0% in the age bracket) attending a public institution.
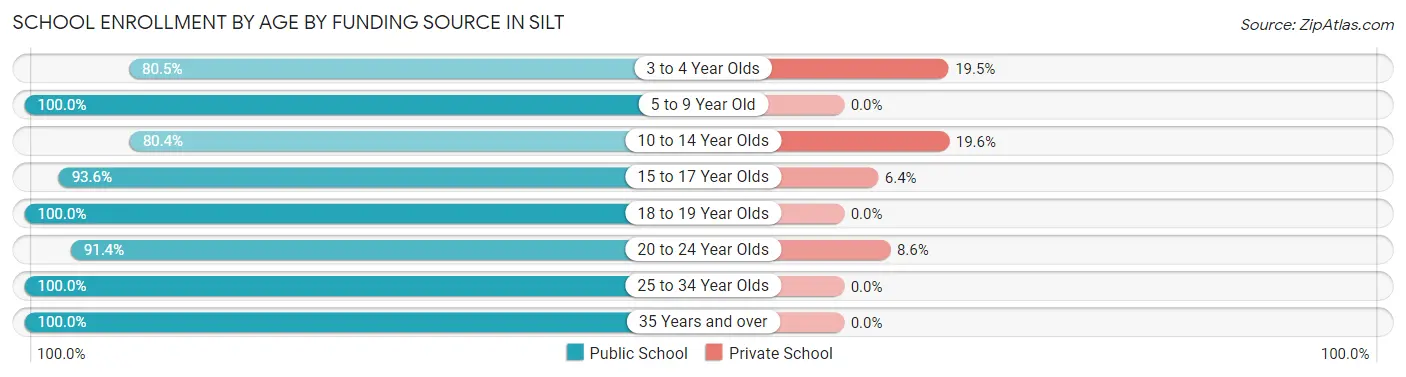
| Age Bracket | Public School | Private School |
| 3 to 4 Year Olds | 91 (80.5%) | 22 (19.5%) |
| 5 to 9 Year Old | 276 (100.0%) | 0 (0.0%) |
| 10 to 14 Year Olds | 304 (80.4%) | 74 (19.6%) |
| 15 to 17 Year Olds | 147 (93.6%) | 10 (6.4%) |
| 18 to 19 Year Olds | 88 (100.0%) | 0 (0.0%) |
| 20 to 24 Year Olds | 53 (91.4%) | 5 (8.6%) |
| 25 to 34 Year Olds | 61 (100.0%) | 0 (0.0%) |
| 35 Years and over | 36 (100.0%) | 0 (0.0%) |
| Total | 1,056 (90.5%) | 111 (9.5%) |
Educational Attainment by Field of Study in Silt
Science & technology (89 | 20.5%), business (63 | 14.5%), arts & humanities (56 | 12.9%), education (43 | 9.9%), and bio, nature & agricultural (41 | 9.5%) are the most common fields of study among 433 individuals in Silt who have obtained a bachelor's degree or higher.
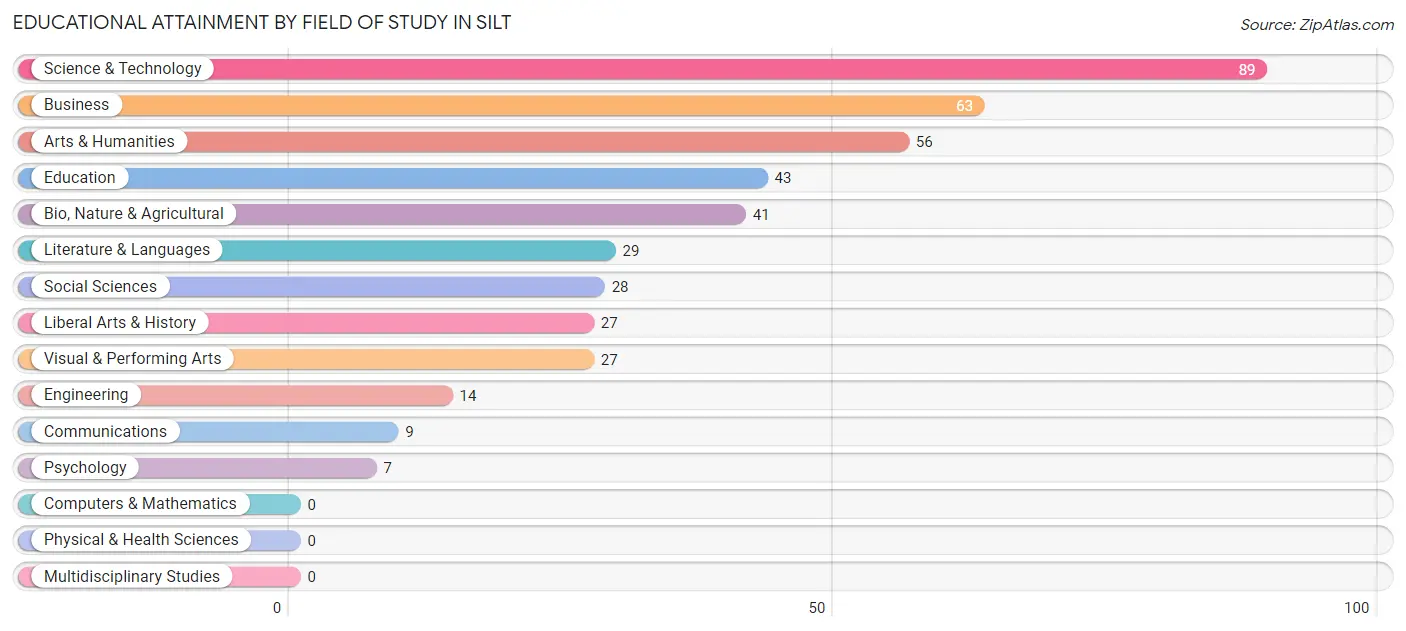
| Field of Study | # Graduates | % Graduates |
| Computers & Mathematics | 0 | 0.0% |
| Bio, Nature & Agricultural | 41 | 9.5% |
| Physical & Health Sciences | 0 | 0.0% |
| Psychology | 7 | 1.6% |
| Social Sciences | 28 | 6.5% |
| Engineering | 14 | 3.2% |
| Multidisciplinary Studies | 0 | 0.0% |
| Science & Technology | 89 | 20.5% |
| Business | 63 | 14.5% |
| Education | 43 | 9.9% |
| Literature & Languages | 29 | 6.7% |
| Liberal Arts & History | 27 | 6.2% |
| Visual & Performing Arts | 27 | 6.2% |
| Communications | 9 | 2.1% |
| Arts & Humanities | 56 | 12.9% |
| Total | 433 | 100.0% |
Transportation & Commute in Silt
Vehicle Availability by Sex in Silt
The most prevalent vehicle ownership categories in Silt are males with 2 vehicles (382, accounting for 36.0%) and females with 2 vehicles (212, making up 45.1%).
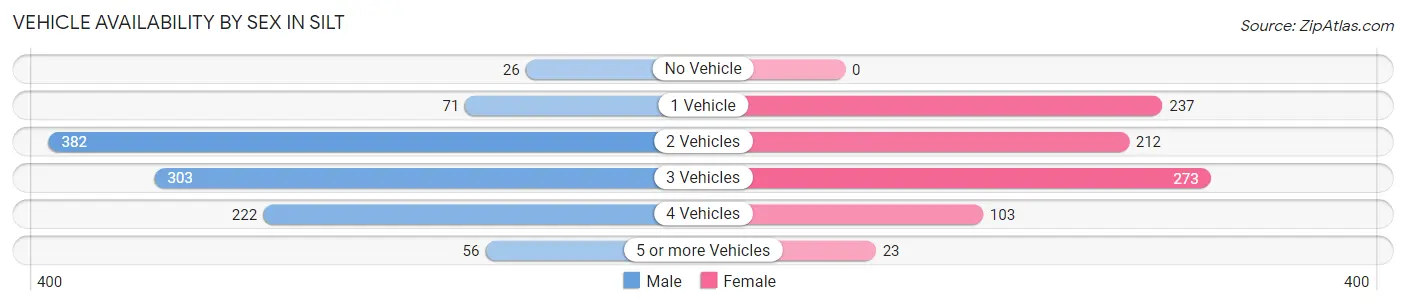
| Vehicles Available | Male | Female |
| No Vehicle | 26 (2.5%) | 0 (0.0%) |
| 1 Vehicle | 71 (6.7%) | 237 (28.0%) |
| 2 Vehicles | 382 (36.0%) | 212 (25.0%) |
| 3 Vehicles | 303 (28.6%) | 273 (32.2%) |
| 4 Vehicles | 222 (20.9%) | 103 (12.1%) |
| 5 or more Vehicles | 56 (5.3%) | 23 (2.7%) |
| Total | 1,060 (100.0%) | 848 (100.0%) |
Commute Time in Silt
The most frequently occuring commute durations in Silt are 15 to 19 minutes (444 commuters, 25.0%), 30 to 34 minutes (349 commuters, 19.7%), and 60 to 89 minutes (281 commuters, 15.8%).
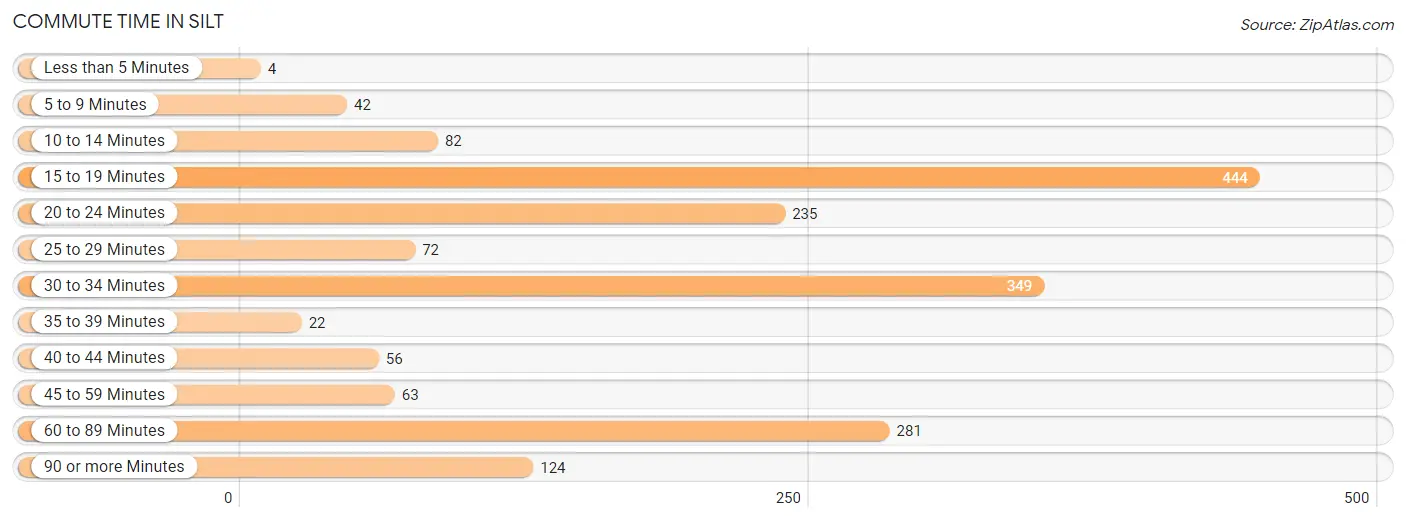
| Commute Time | # Commuters | % Commuters |
| Less than 5 Minutes | 4 | 0.2% |
| 5 to 9 Minutes | 42 | 2.4% |
| 10 to 14 Minutes | 82 | 4.6% |
| 15 to 19 Minutes | 444 | 25.0% |
| 20 to 24 Minutes | 235 | 13.3% |
| 25 to 29 Minutes | 72 | 4.1% |
| 30 to 34 Minutes | 349 | 19.7% |
| 35 to 39 Minutes | 22 | 1.2% |
| 40 to 44 Minutes | 56 | 3.2% |
| 45 to 59 Minutes | 63 | 3.5% |
| 60 to 89 Minutes | 281 | 15.8% |
| 90 or more Minutes | 124 | 7.0% |
Commute Time by Sex in Silt
The most common commute times in Silt are 30 to 34 minutes (204 commuters, 20.3%) for males and 15 to 19 minutes (276 commuters, 36.0%) for females.
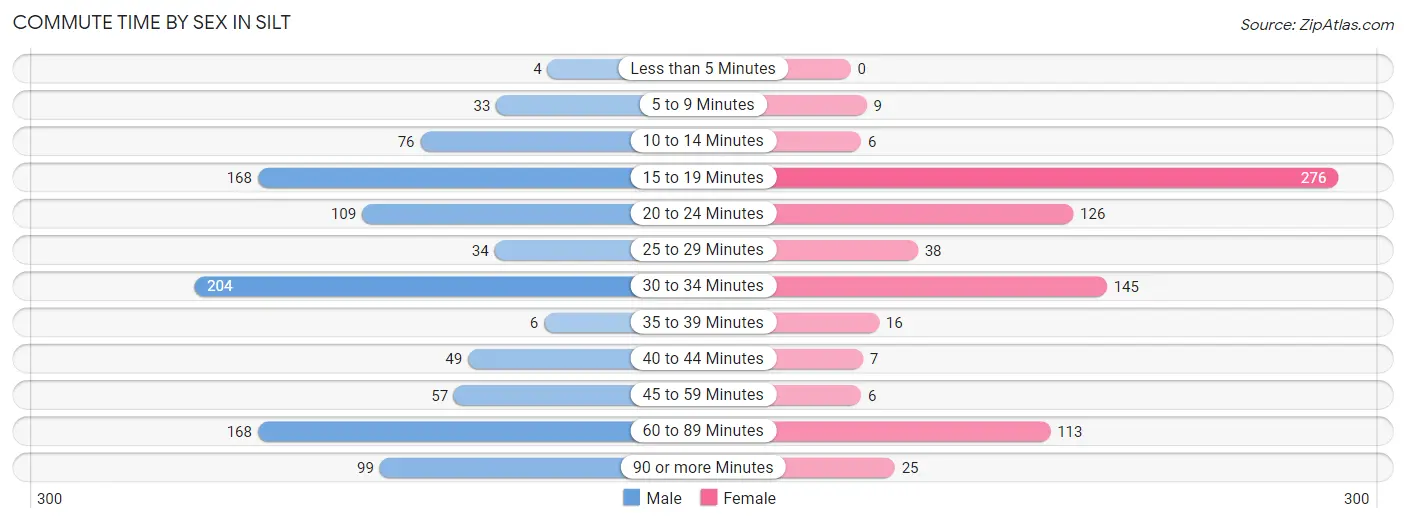
| Commute Time | Male | Female |
| Less than 5 Minutes | 4 (0.4%) | 0 (0.0%) |
| 5 to 9 Minutes | 33 (3.3%) | 9 (1.2%) |
| 10 to 14 Minutes | 76 (7.5%) | 6 (0.8%) |
| 15 to 19 Minutes | 168 (16.7%) | 276 (36.0%) |
| 20 to 24 Minutes | 109 (10.8%) | 126 (16.4%) |
| 25 to 29 Minutes | 34 (3.4%) | 38 (5.0%) |
| 30 to 34 Minutes | 204 (20.3%) | 145 (18.9%) |
| 35 to 39 Minutes | 6 (0.6%) | 16 (2.1%) |
| 40 to 44 Minutes | 49 (4.9%) | 7 (0.9%) |
| 45 to 59 Minutes | 57 (5.7%) | 6 (0.8%) |
| 60 to 89 Minutes | 168 (16.7%) | 113 (14.7%) |
| 90 or more Minutes | 99 (9.8%) | 25 (3.3%) |
Time of Departure to Work by Sex in Silt
The most frequent times of departure to work in Silt are 7:30 AM to 7:59 AM (171, 17.0%) for males and 11:00 AM to 11:59 AM (158, 20.6%) for females.
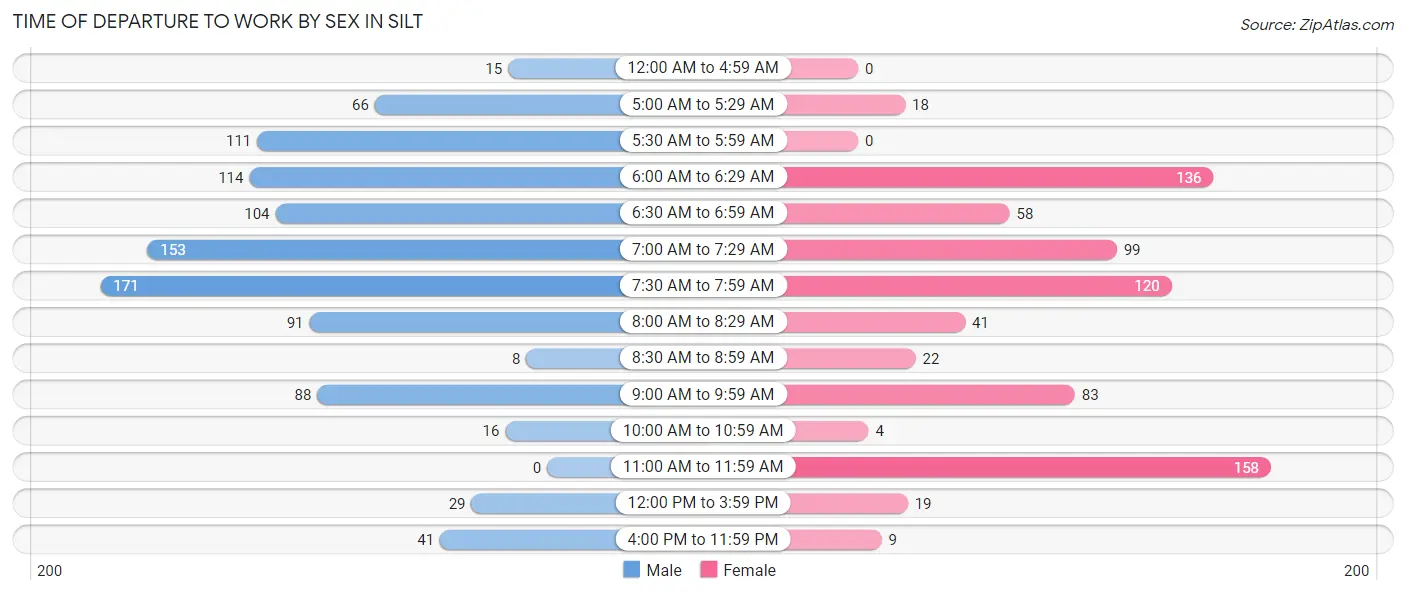
| Time of Departure | Male | Female |
| 12:00 AM to 4:59 AM | 15 (1.5%) | 0 (0.0%) |
| 5:00 AM to 5:29 AM | 66 (6.6%) | 18 (2.4%) |
| 5:30 AM to 5:59 AM | 111 (11.0%) | 0 (0.0%) |
| 6:00 AM to 6:29 AM | 114 (11.3%) | 136 (17.7%) |
| 6:30 AM to 6:59 AM | 104 (10.3%) | 58 (7.6%) |
| 7:00 AM to 7:29 AM | 153 (15.2%) | 99 (12.9%) |
| 7:30 AM to 7:59 AM | 171 (17.0%) | 120 (15.7%) |
| 8:00 AM to 8:29 AM | 91 (9.0%) | 41 (5.3%) |
| 8:30 AM to 8:59 AM | 8 (0.8%) | 22 (2.9%) |
| 9:00 AM to 9:59 AM | 88 (8.7%) | 83 (10.8%) |
| 10:00 AM to 10:59 AM | 16 (1.6%) | 4 (0.5%) |
| 11:00 AM to 11:59 AM | 0 (0.0%) | 158 (20.6%) |
| 12:00 PM to 3:59 PM | 29 (2.9%) | 19 (2.5%) |
| 4:00 PM to 11:59 PM | 41 (4.1%) | 9 (1.2%) |
| Total | 1,007 (100.0%) | 767 (100.0%) |
Housing Occupancy in Silt
Occupancy by Ownership in Silt
Of the total 1,155 dwellings in Silt, owner-occupied units account for 843 (73.0%), while renter-occupied units make up 312 (27.0%).
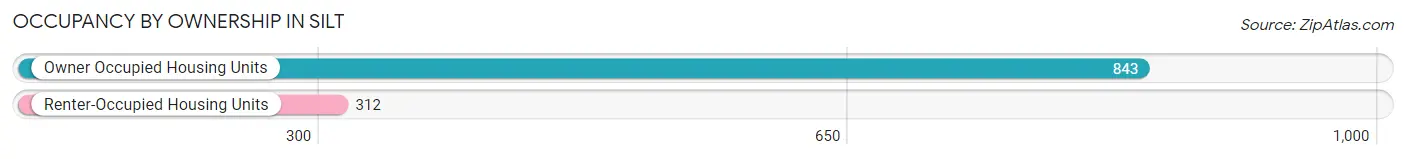
| Occupancy | # Housing Units | % Housing Units |
| Owner Occupied Housing Units | 843 | 73.0% |
| Renter-Occupied Housing Units | 312 | 27.0% |
| Total Occupied Housing Units | 1,155 | 100.0% |
Occupancy by Household Size in Silt
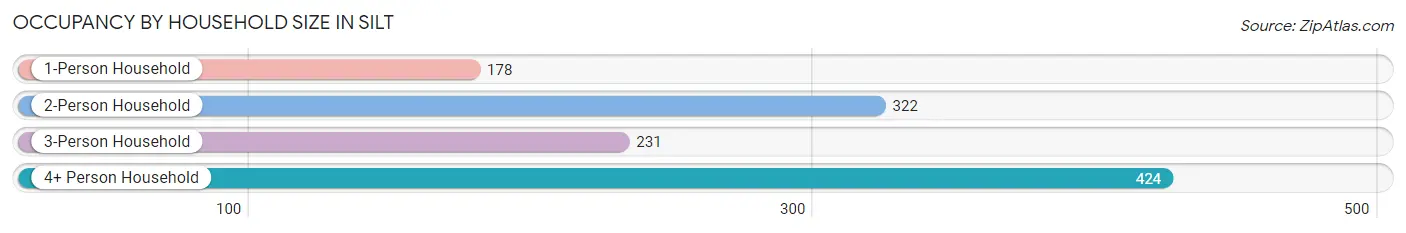
| Household Size | # Housing Units | % Housing Units |
| 1-Person Household | 178 | 15.4% |
| 2-Person Household | 322 | 27.9% |
| 3-Person Household | 231 | 20.0% |
| 4+ Person Household | 424 | 36.7% |
| Total Housing Units | 1,155 | 100.0% |
Occupancy by Ownership by Household Size in Silt
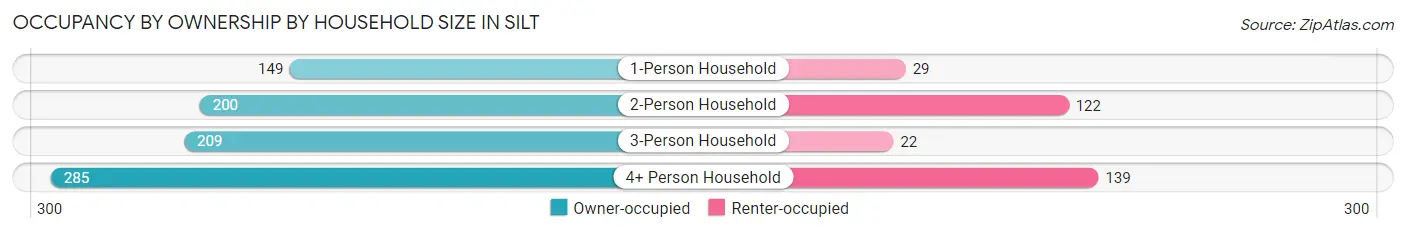
| Household Size | Owner-occupied | Renter-occupied |
| 1-Person Household | 149 (83.7%) | 29 (16.3%) |
| 2-Person Household | 200 (62.1%) | 122 (37.9%) |
| 3-Person Household | 209 (90.5%) | 22 (9.5%) |
| 4+ Person Household | 285 (67.2%) | 139 (32.8%) |
| Total Housing Units | 843 (73.0%) | 312 (27.0%) |
Occupancy by Educational Attainment in Silt
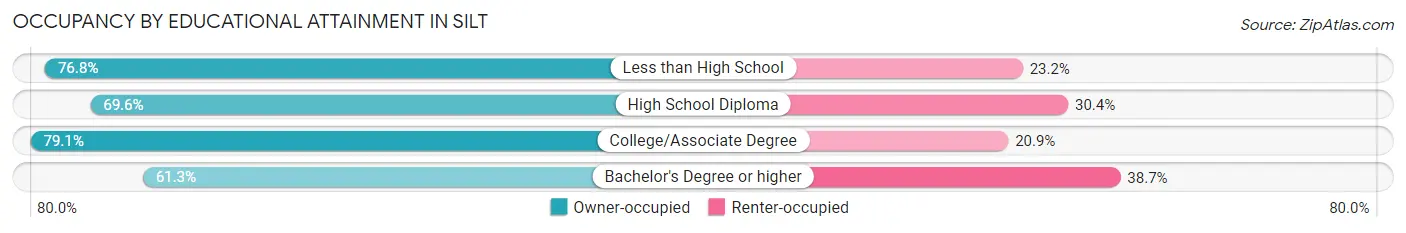
| Household Size | Owner-occupied | Renter-occupied |
| Less than High School | 109 (76.8%) | 33 (23.2%) |
| High School Diploma | 160 (69.6%) | 70 (30.4%) |
| College/Associate Degree | 419 (79.1%) | 111 (20.9%) |
| Bachelor's Degree or higher | 155 (61.3%) | 98 (38.7%) |
Occupancy by Age of Householder in Silt
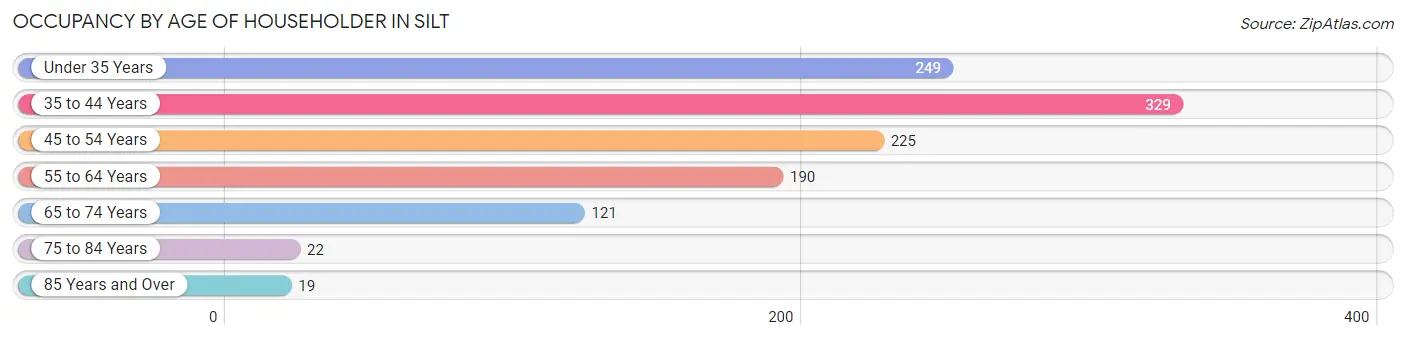
| Age Bracket | # Households | % Households |
| Under 35 Years | 249 | 21.6% |
| 35 to 44 Years | 329 | 28.5% |
| 45 to 54 Years | 225 | 19.5% |
| 55 to 64 Years | 190 | 16.5% |
| 65 to 74 Years | 121 | 10.5% |
| 75 to 84 Years | 22 | 1.9% |
| 85 Years and Over | 19 | 1.7% |
| Total | 1,155 | 100.0% |
Housing Finances in Silt
Median Income by Occupancy in Silt
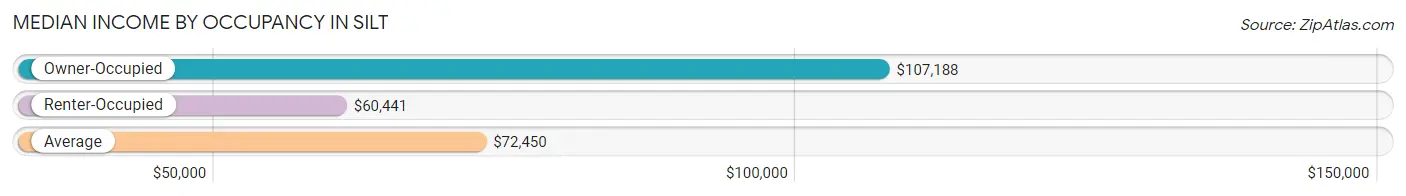
| Occupancy Type | # Households | Median Income |
| Owner-Occupied | 843 (73.0%) | $107,188 |
| Renter-Occupied | 312 (27.0%) | $60,441 |
| Average | 1,155 (100.0%) | $72,450 |
Occupancy by Householder Income Bracket in Silt
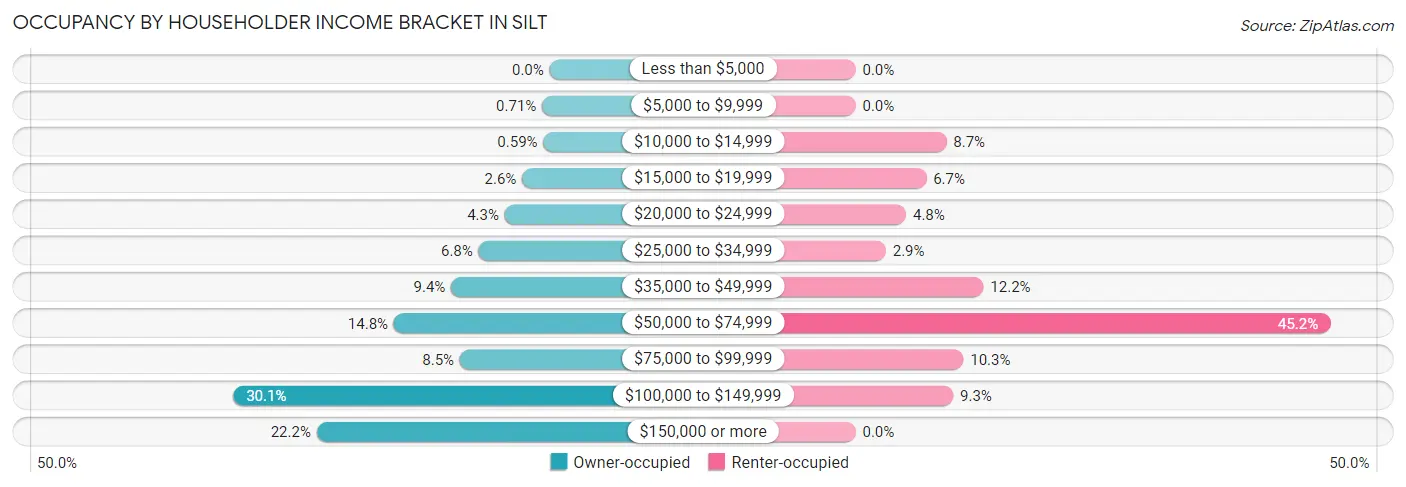
| Income Bracket | Owner-occupied | Renter-occupied |
| Less than $5,000 | 0 (0.0%) | 0 (0.0%) |
| $5,000 to $9,999 | 6 (0.7%) | 0 (0.0%) |
| $10,000 to $14,999 | 5 (0.6%) | 27 (8.6%) |
| $15,000 to $19,999 | 22 (2.6%) | 21 (6.7%) |
| $20,000 to $24,999 | 36 (4.3%) | 15 (4.8%) |
| $25,000 to $34,999 | 57 (6.8%) | 9 (2.9%) |
| $35,000 to $49,999 | 79 (9.4%) | 38 (12.2%) |
| $50,000 to $74,999 | 125 (14.8%) | 141 (45.2%) |
| $75,000 to $99,999 | 72 (8.5%) | 32 (10.3%) |
| $100,000 to $149,999 | 254 (30.1%) | 29 (9.3%) |
| $150,000 or more | 187 (22.2%) | 0 (0.0%) |
| Total | 843 (100.0%) | 312 (100.0%) |
Monthly Housing Cost Tiers in Silt
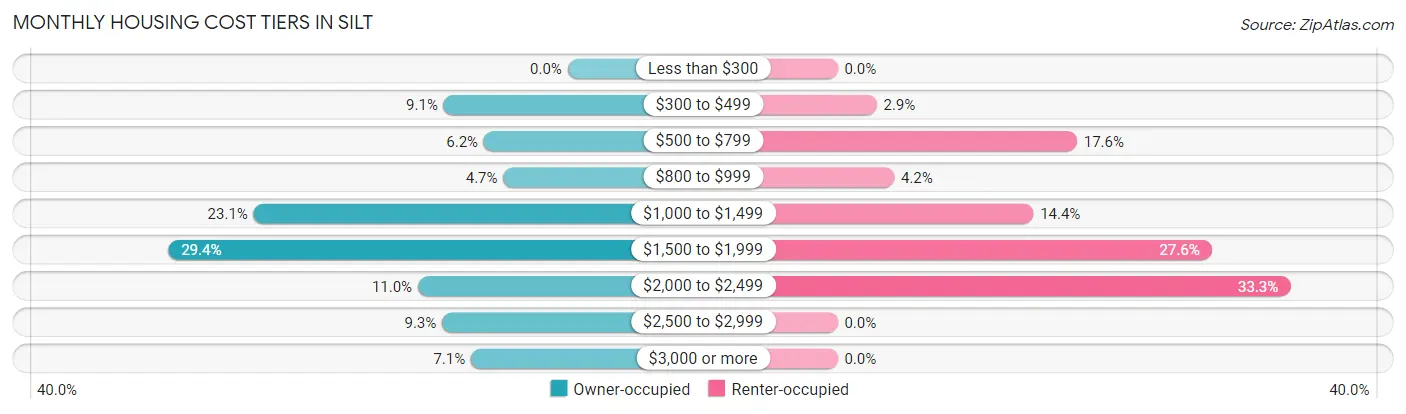
| Monthly Cost | Owner-occupied | Renter-occupied |
| Less than $300 | 0 (0.0%) | 0 (0.0%) |
| $300 to $499 | 77 (9.1%) | 9 (2.9%) |
| $500 to $799 | 52 (6.2%) | 55 (17.6%) |
| $800 to $999 | 40 (4.7%) | 13 (4.2%) |
| $1,000 to $1,499 | 195 (23.1%) | 45 (14.4%) |
| $1,500 to $1,999 | 248 (29.4%) | 86 (27.6%) |
| $2,000 to $2,499 | 93 (11.0%) | 104 (33.3%) |
| $2,500 to $2,999 | 78 (9.2%) | 0 (0.0%) |
| $3,000 or more | 60 (7.1%) | 0 (0.0%) |
| Total | 843 (100.0%) | 312 (100.0%) |
Physical Housing Characteristics in Silt
Housing Structures in Silt
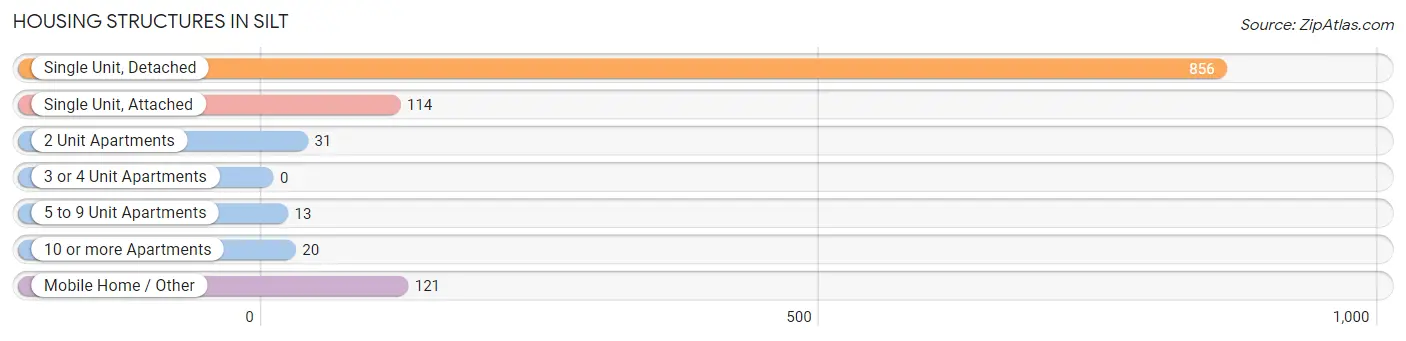
| Structure Type | # Housing Units | % Housing Units |
| Single Unit, Detached | 856 | 74.1% |
| Single Unit, Attached | 114 | 9.9% |
| 2 Unit Apartments | 31 | 2.7% |
| 3 or 4 Unit Apartments | 0 | 0.0% |
| 5 to 9 Unit Apartments | 13 | 1.1% |
| 10 or more Apartments | 20 | 1.7% |
| Mobile Home / Other | 121 | 10.5% |
| Total | 1,155 | 100.0% |
Housing Structures by Occupancy in Silt
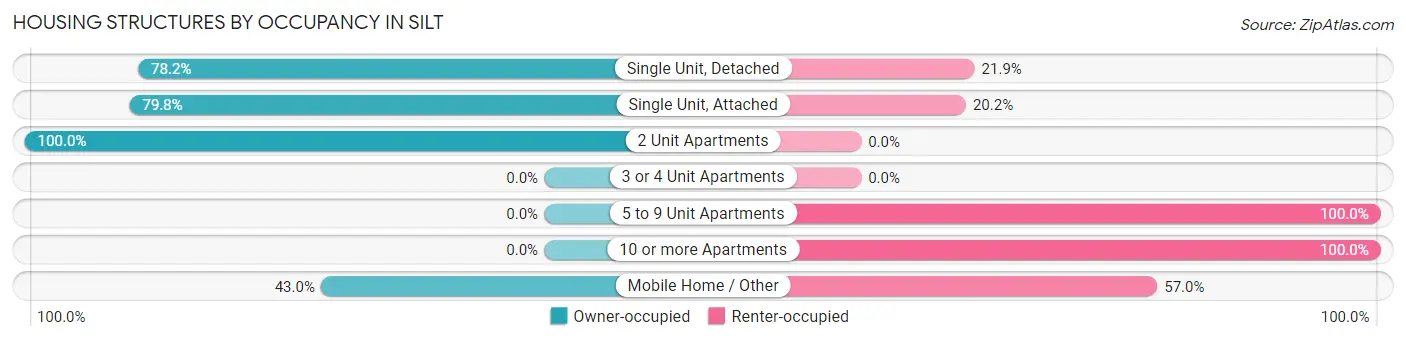
| Structure Type | Owner-occupied | Renter-occupied |
| Single Unit, Detached | 669 (78.1%) | 187 (21.8%) |
| Single Unit, Attached | 91 (79.8%) | 23 (20.2%) |
| 2 Unit Apartments | 31 (100.0%) | 0 (0.0%) |
| 3 or 4 Unit Apartments | 0 (0.0%) | 0 (0.0%) |
| 5 to 9 Unit Apartments | 0 (0.0%) | 13 (100.0%) |
| 10 or more Apartments | 0 (0.0%) | 20 (100.0%) |
| Mobile Home / Other | 52 (43.0%) | 69 (57.0%) |
| Total | 843 (73.0%) | 312 (27.0%) |
Housing Structures by Number of Rooms in Silt
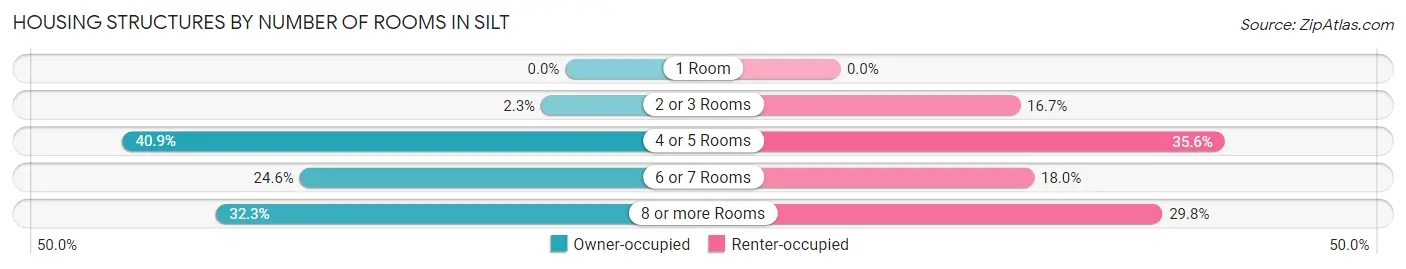
| Number of Rooms | Owner-occupied | Renter-occupied |
| 1 Room | 0 (0.0%) | 0 (0.0%) |
| 2 or 3 Rooms | 19 (2.2%) | 52 (16.7%) |
| 4 or 5 Rooms | 345 (40.9%) | 111 (35.6%) |
| 6 or 7 Rooms | 207 (24.6%) | 56 (17.9%) |
| 8 or more Rooms | 272 (32.3%) | 93 (29.8%) |
| Total | 843 (100.0%) | 312 (100.0%) |
Housing Structure by Heating Type in Silt
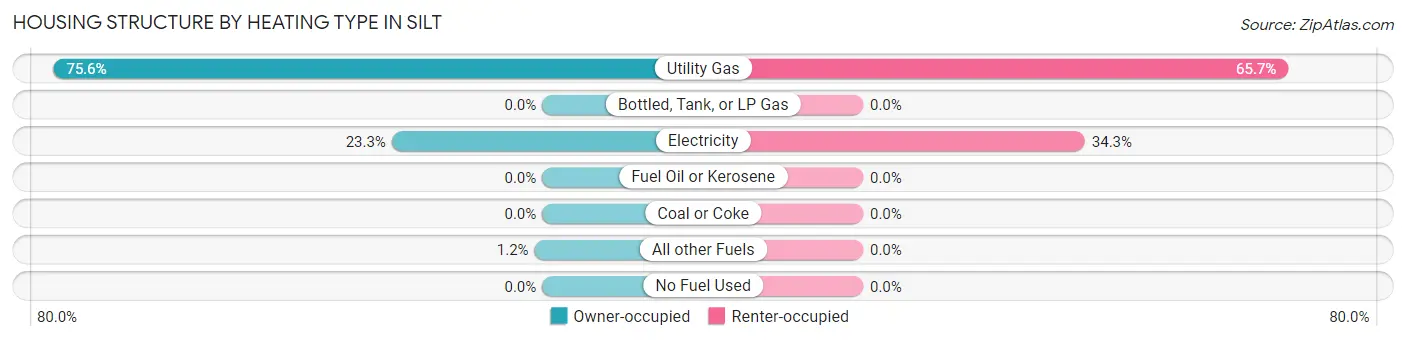
| Heating Type | Owner-occupied | Renter-occupied |
| Utility Gas | 637 (75.6%) | 205 (65.7%) |
| Bottled, Tank, or LP Gas | 0 (0.0%) | 0 (0.0%) |
| Electricity | 196 (23.3%) | 107 (34.3%) |
| Fuel Oil or Kerosene | 0 (0.0%) | 0 (0.0%) |
| Coal or Coke | 0 (0.0%) | 0 (0.0%) |
| All other Fuels | 10 (1.2%) | 0 (0.0%) |
| No Fuel Used | 0 (0.0%) | 0 (0.0%) |
| Total | 843 (100.0%) | 312 (100.0%) |
Household Vehicle Usage in Silt
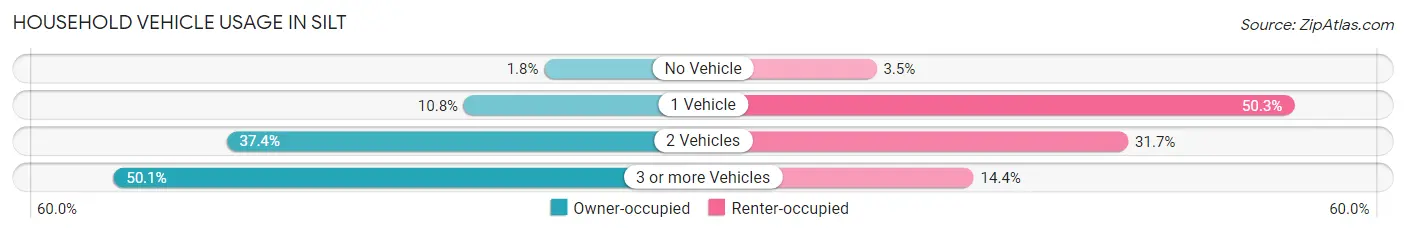
| Vehicles per Household | Owner-occupied | Renter-occupied |
| No Vehicle | 15 (1.8%) | 11 (3.5%) |
| 1 Vehicle | 91 (10.8%) | 157 (50.3%) |
| 2 Vehicles | 315 (37.4%) | 99 (31.7%) |
| 3 or more Vehicles | 422 (50.1%) | 45 (14.4%) |
| Total | 843 (100.0%) | 312 (100.0%) |
Real Estate & Mortgages in Silt
Real Estate and Mortgage Overview in Silt
| Characteristic | Without Mortgage | With Mortgage |
| Housing Units | 137 | 706 |
| Median Property Value | $379,300 | $371,000 |
| Median Household Income | $84,063 | $164 |
| Monthly Housing Costs | $450 | $60 |
| Real Estate Taxes | $1,325 | $31 |
Property Value by Mortgage Status in Silt
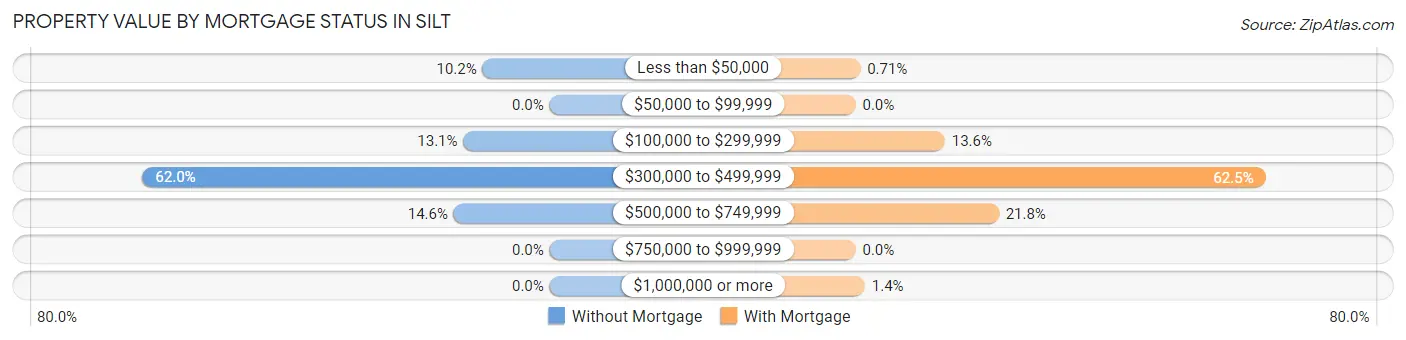
| Property Value | Without Mortgage | With Mortgage |
| Less than $50,000 | 14 (10.2%) | 5 (0.7%) |
| $50,000 to $99,999 | 0 (0.0%) | 0 (0.0%) |
| $100,000 to $299,999 | 18 (13.1%) | 96 (13.6%) |
| $300,000 to $499,999 | 85 (62.0%) | 441 (62.5%) |
| $500,000 to $749,999 | 20 (14.6%) | 154 (21.8%) |
| $750,000 to $999,999 | 0 (0.0%) | 0 (0.0%) |
| $1,000,000 or more | 0 (0.0%) | 10 (1.4%) |
| Total | 137 (100.0%) | 706 (100.0%) |
Household Income by Mortgage Status in Silt
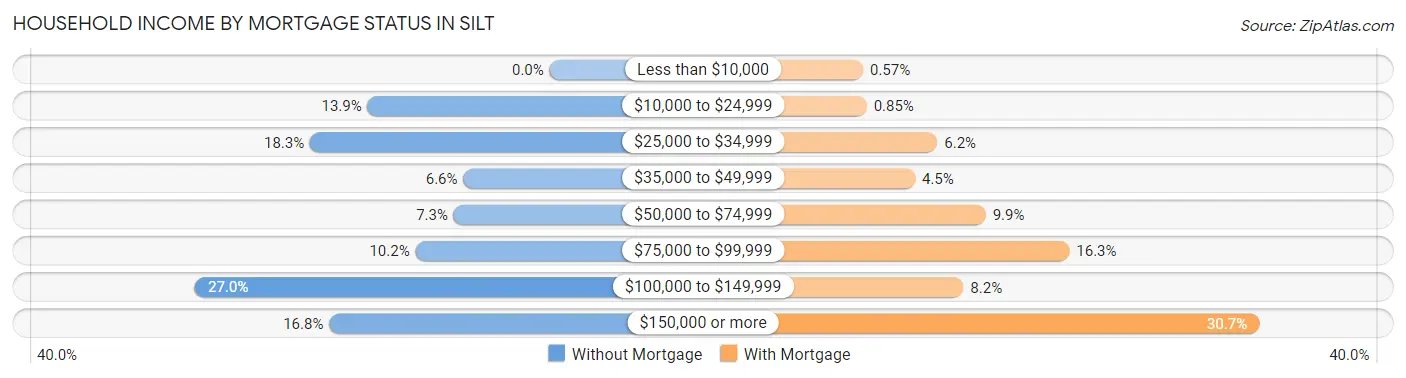
| Household Income | Without Mortgage | With Mortgage |
| Less than $10,000 | 0 (0.0%) | 4 (0.6%) |
| $10,000 to $24,999 | 19 (13.9%) | 6 (0.9%) |
| $25,000 to $34,999 | 25 (18.2%) | 44 (6.2%) |
| $35,000 to $49,999 | 9 (6.6%) | 32 (4.5%) |
| $50,000 to $74,999 | 10 (7.3%) | 70 (9.9%) |
| $75,000 to $99,999 | 14 (10.2%) | 115 (16.3%) |
| $100,000 to $149,999 | 37 (27.0%) | 58 (8.2%) |
| $150,000 or more | 23 (16.8%) | 217 (30.7%) |
| Total | 137 (100.0%) | 706 (100.0%) |
Property Value to Household Income Ratio in Silt
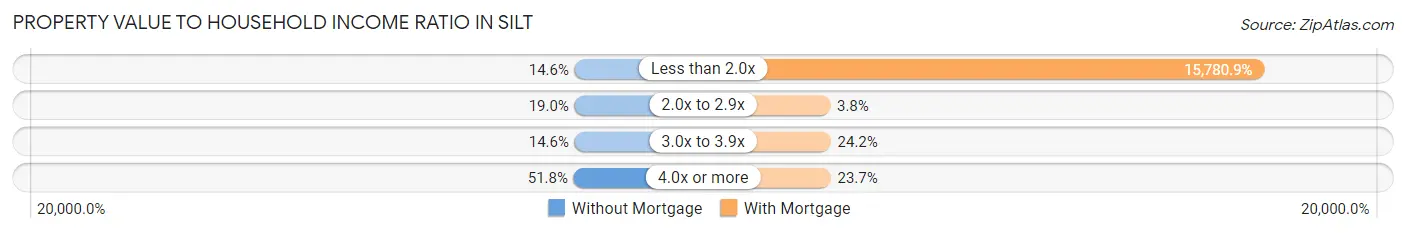
| Value-to-Income Ratio | Without Mortgage | With Mortgage |
| Less than 2.0x | 20 (14.6%) | 111,413 (15,780.9%) |
| 2.0x to 2.9x | 26 (19.0%) | 27 (3.8%) |
| 3.0x to 3.9x | 20 (14.6%) | 171 (24.2%) |
| 4.0x or more | 71 (51.8%) | 167 (23.6%) |
| Total | 137 (100.0%) | 706 (100.0%) |
Real Estate Taxes by Mortgage Status in Silt
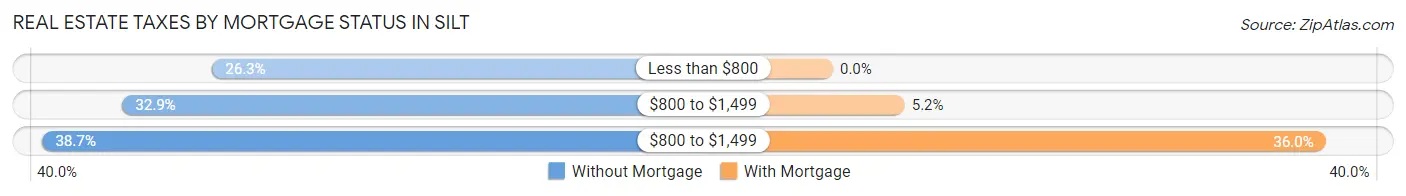
| Property Taxes | Without Mortgage | With Mortgage |
| Less than $800 | 36 (26.3%) | 0 (0.0%) |
| $800 to $1,499 | 45 (32.9%) | 37 (5.2%) |
| $800 to $1,499 | 53 (38.7%) | 254 (36.0%) |
| Total | 137 (100.0%) | 706 (100.0%) |
Health & Disability in Silt
Health Insurance Coverage by Age in Silt
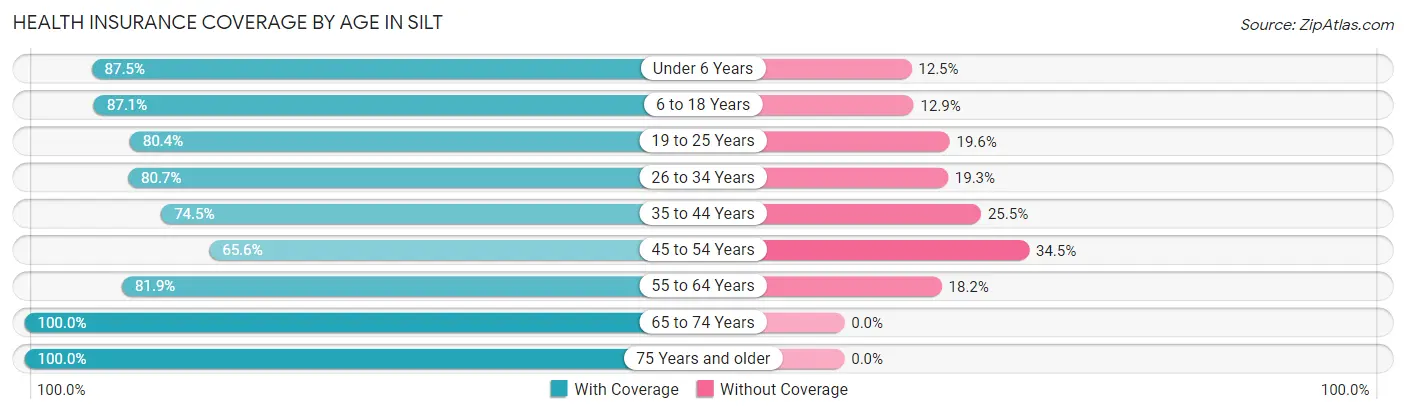
| Age Bracket | With Coverage | Without Coverage |
| Under 6 Years | 294 (87.5%) | 42 (12.5%) |
| 6 to 18 Years | 701 (87.1%) | 104 (12.9%) |
| 19 to 25 Years | 303 (80.4%) | 74 (19.6%) |
| 26 to 34 Years | 305 (80.7%) | 73 (19.3%) |
| 35 to 44 Years | 453 (74.5%) | 155 (25.5%) |
| 45 to 54 Years | 314 (65.5%) | 165 (34.4%) |
| 55 to 64 Years | 239 (81.9%) | 53 (18.1%) |
| 65 to 74 Years | 200 (100.0%) | 0 (0.0%) |
| 75 Years and older | 54 (100.0%) | 0 (0.0%) |
| Total | 2,863 (81.1%) | 666 (18.9%) |
Health Insurance Coverage by Citizenship Status in Silt
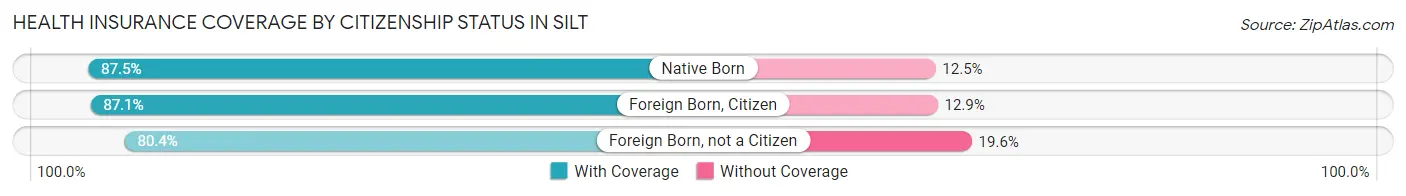
| Citizenship Status | With Coverage | Without Coverage |
| Native Born | 294 (87.5%) | 42 (12.5%) |
| Foreign Born, Citizen | 701 (87.1%) | 104 (12.9%) |
| Foreign Born, not a Citizen | 303 (80.4%) | 74 (19.6%) |
Health Insurance Coverage by Household Income in Silt
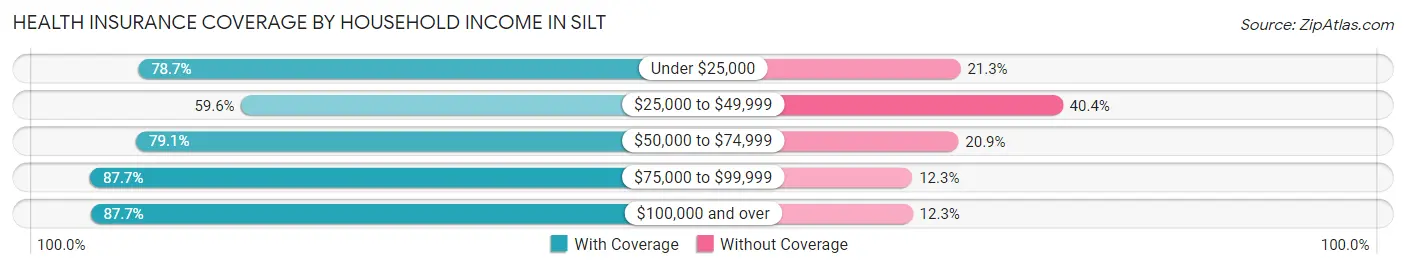
| Household Income | With Coverage | Without Coverage |
| Under $25,000 | 196 (78.7%) | 53 (21.3%) |
| $25,000 to $49,999 | 296 (59.6%) | 201 (40.4%) |
| $50,000 to $74,999 | 636 (79.1%) | 168 (20.9%) |
| $75,000 to $99,999 | 279 (87.7%) | 39 (12.3%) |
| $100,000 and over | 1,456 (87.7%) | 205 (12.3%) |
Public vs Private Health Insurance Coverage by Age in Silt
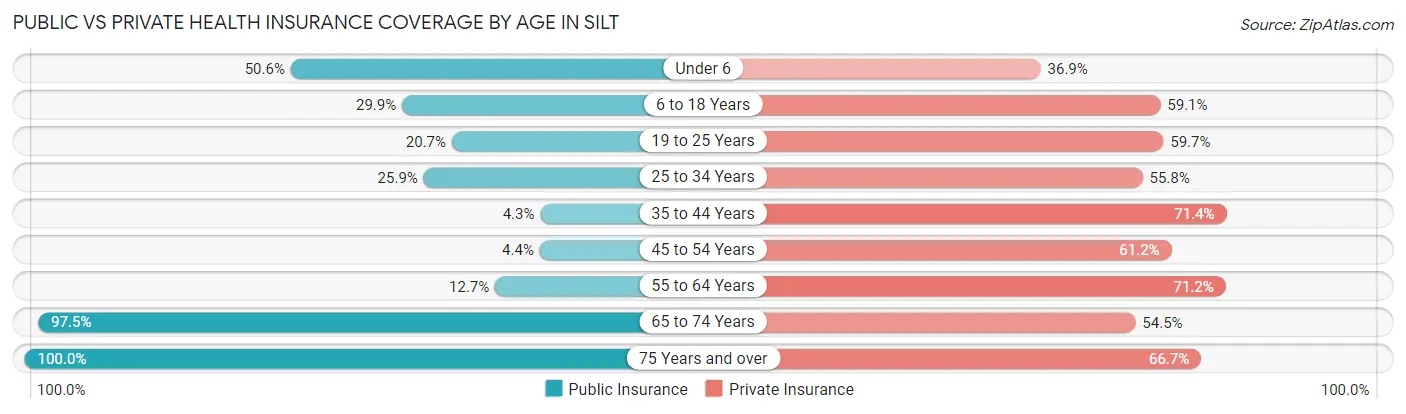
| Age Bracket | Public Insurance | Private Insurance |
| Under 6 | 170 (50.6%) | 124 (36.9%) |
| 6 to 18 Years | 241 (29.9%) | 476 (59.1%) |
| 19 to 25 Years | 78 (20.7%) | 225 (59.7%) |
| 25 to 34 Years | 98 (25.9%) | 211 (55.8%) |
| 35 to 44 Years | 26 (4.3%) | 434 (71.4%) |
| 45 to 54 Years | 21 (4.4%) | 293 (61.2%) |
| 55 to 64 Years | 37 (12.7%) | 208 (71.2%) |
| 65 to 74 Years | 195 (97.5%) | 109 (54.5%) |
| 75 Years and over | 54 (100.0%) | 36 (66.7%) |
| Total | 920 (26.1%) | 2,116 (60.0%) |
Disability Status by Sex by Age in Silt
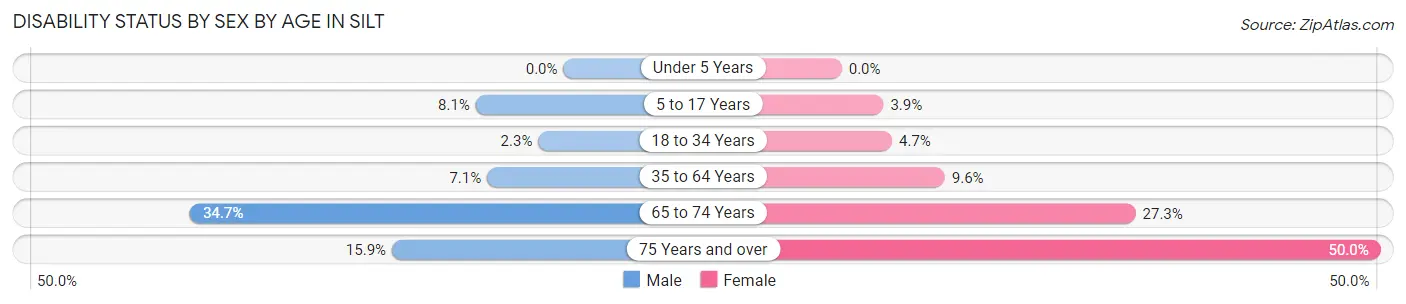
| Age Bracket | Male | Female |
| Under 5 Years | 0 (0.0%) | 0 (0.0%) |
| 5 to 17 Years | 31 (8.1%) | 17 (3.9%) |
| 18 to 34 Years | 8 (2.3%) | 21 (4.7%) |
| 35 to 64 Years | 51 (7.1%) | 63 (9.6%) |
| 65 to 74 Years | 35 (34.6%) | 27 (27.3%) |
| 75 Years and over | 7 (15.9%) | 5 (50.0%) |
Disability Class by Sex by Age in Silt
Disability Class: Hearing Difficulty
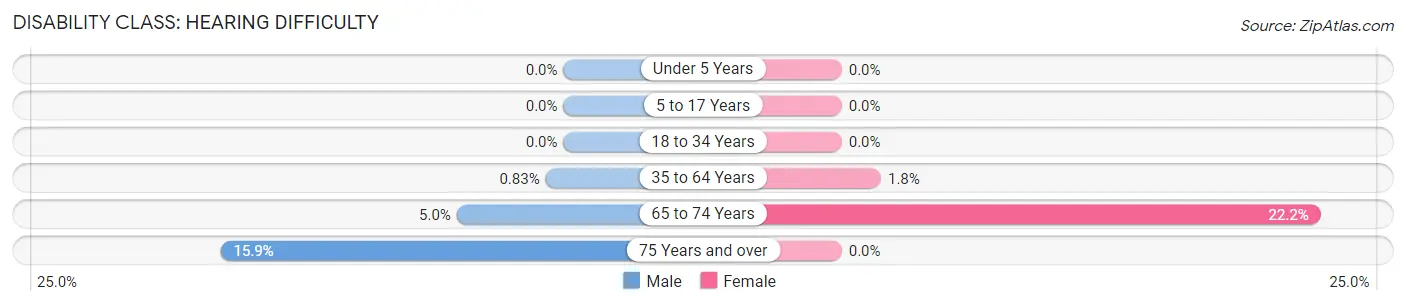
| Age Bracket | Male | Female |
| Under 5 Years | 0 (0.0%) | 0 (0.0%) |
| 5 to 17 Years | 0 (0.0%) | 0 (0.0%) |
| 18 to 34 Years | 0 (0.0%) | 0 (0.0%) |
| 35 to 64 Years | 6 (0.8%) | 12 (1.8%) |
| 65 to 74 Years | 5 (5.0%) | 22 (22.2%) |
| 75 Years and over | 7 (15.9%) | 0 (0.0%) |
Disability Class: Vision Difficulty
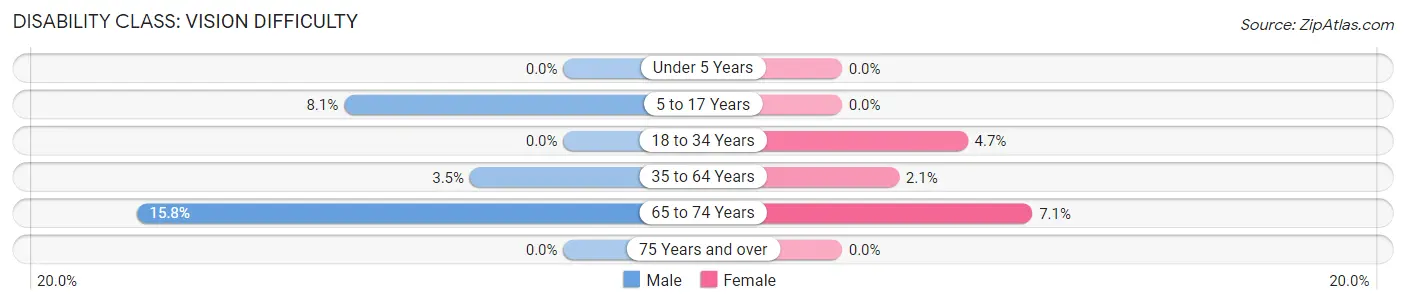
| Age Bracket | Male | Female |
| Under 5 Years | 0 (0.0%) | 0 (0.0%) |
| 5 to 17 Years | 31 (8.1%) | 0 (0.0%) |
| 18 to 34 Years | 0 (0.0%) | 21 (4.7%) |
| 35 to 64 Years | 25 (3.5%) | 14 (2.1%) |
| 65 to 74 Years | 16 (15.8%) | 7 (7.1%) |
| 75 Years and over | 0 (0.0%) | 0 (0.0%) |
Disability Class: Cognitive Difficulty
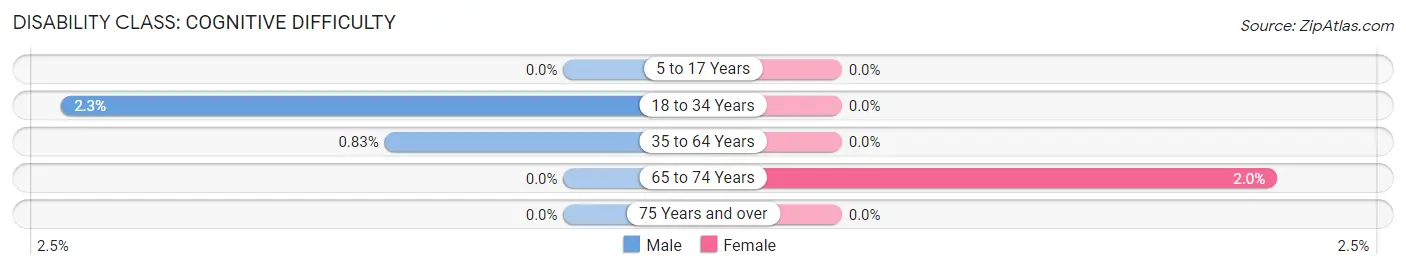
| Age Bracket | Male | Female |
| 5 to 17 Years | 0 (0.0%) | 0 (0.0%) |
| 18 to 34 Years | 8 (2.3%) | 0 (0.0%) |
| 35 to 64 Years | 6 (0.8%) | 0 (0.0%) |
| 65 to 74 Years | 0 (0.0%) | 2 (2.0%) |
| 75 Years and over | 0 (0.0%) | 0 (0.0%) |
Disability Class: Ambulatory Difficulty
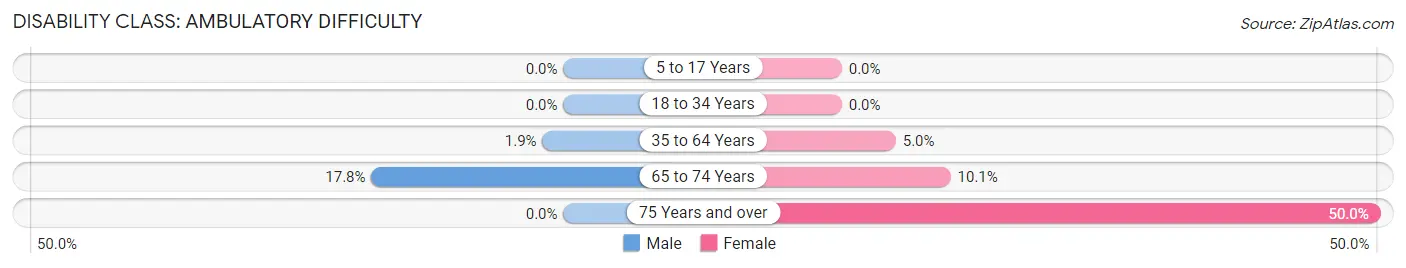
| Age Bracket | Male | Female |
| 5 to 17 Years | 0 (0.0%) | 0 (0.0%) |
| 18 to 34 Years | 0 (0.0%) | 0 (0.0%) |
| 35 to 64 Years | 14 (1.9%) | 33 (5.0%) |
| 65 to 74 Years | 18 (17.8%) | 10 (10.1%) |
| 75 Years and over | 0 (0.0%) | 5 (50.0%) |
Disability Class: Self-Care Difficulty
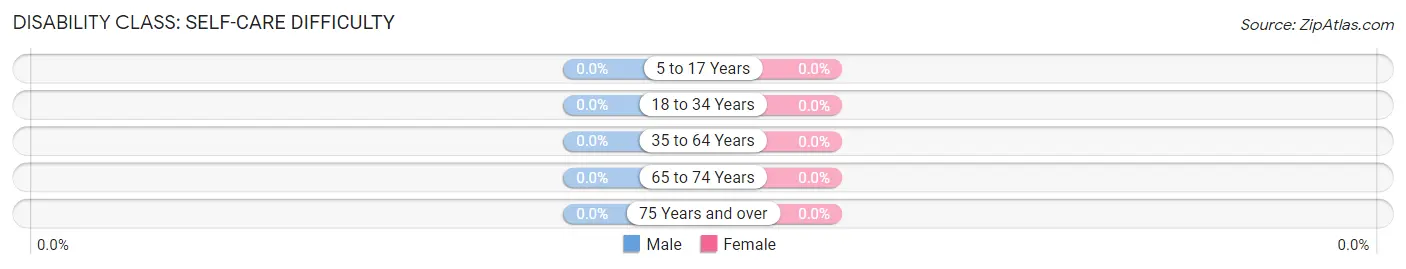
| Age Bracket | Male | Female |
| 5 to 17 Years | 0 (0.0%) | 0 (0.0%) |
| 18 to 34 Years | 0 (0.0%) | 0 (0.0%) |
| 35 to 64 Years | 0 (0.0%) | 0 (0.0%) |
| 65 to 74 Years | 0 (0.0%) | 0 (0.0%) |
| 75 Years and over | 0 (0.0%) | 0 (0.0%) |
Technology Access in Silt
Computing Device Access in Silt
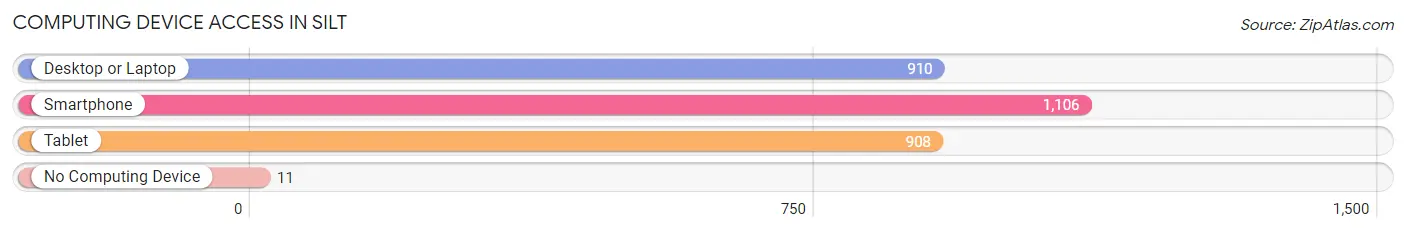
| Device Type | # Households | % Households |
| Desktop or Laptop | 910 | 78.8% |
| Smartphone | 1,106 | 95.8% |
| Tablet | 908 | 78.6% |
| No Computing Device | 11 | 0.9% |
| Total | 1,155 | 100.0% |
Internet Access in Silt
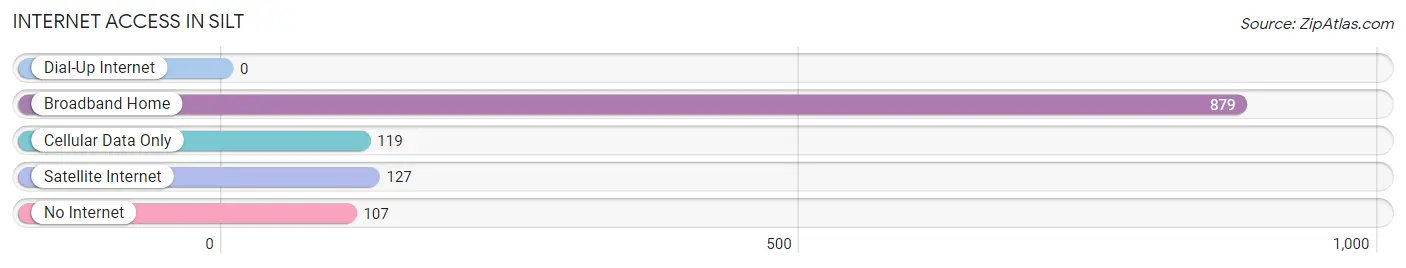
| Internet Type | # Households | % Households |
| Dial-Up Internet | 0 | 0.0% |
| Broadband Home | 879 | 76.1% |
| Cellular Data Only | 119 | 10.3% |
| Satellite Internet | 127 | 11.0% |
| No Internet | 107 | 9.3% |
| Total | 1,155 | 100.0% |
Silt Summary
Silt is a small town located in Garfield County, Colorado, United States. It is situated along the Colorado River, approximately 10 miles west of Glenwood Springs and 30 miles east of Rifle. The town was founded in 1904 and incorporated in 1906. As of the 2010 census, the population of Silt was 2,165.
History
The area that is now Silt was originally inhabited by the Ute Indians. The first settlers arrived in the area in the late 1800s, and the town was officially founded in 1904. The town was named after the silt deposits that were found in the area.
In 1906, the town was incorporated and the first post office was established. The town grew quickly, and by 1910, the population had grown to over 500. The town was home to several businesses, including a hotel, a general store, a blacksmith shop, and a saloon.
In the 1920s, the town experienced a period of growth and prosperity. The town was home to several businesses, including a bank, a movie theater, a newspaper, and a school. The town also had a train station, which allowed for easy access to the rest of the state.
In the 1950s, the town experienced a period of decline. The railroad station closed, and many businesses moved away. The population of the town decreased, and by the 1970s, the population had dropped to just over 500.
Geography
Silt is located in western Garfield County, Colorado, at an elevation of 5,845 feet. The town is situated along the Colorado River, approximately 10 miles west of Glenwood Springs and 30 miles east of Rifle. The town is surrounded by mountains, including the Flat Tops, the Grand Hogback, and the Book Cliffs.
The climate in Silt is semi-arid, with hot summers and cold winters. The average annual temperature is 48°F, and the average annual precipitation is 12.5 inches.
Economy
The economy of Silt is largely based on agriculture and tourism. The town is home to several farms, which produce hay, wheat, and other crops. The town is also home to several tourist attractions, including the Silt Historical Museum and the Silt Nature Center.
The town is also home to several businesses, including restaurants, retail stores, and service providers. The town is also home to several manufacturing companies, including a concrete plant and a metal fabrication plant.
Demographics
As of the 2010 census, the population of Silt was 2,165. The racial makeup of the town was 91.3% White, 0.7% African American, 0.7% Native American, 0.3% Asian, 0.1% Pacific Islander, 4.3% from other races, and 2.6% from two or more races. Hispanic or Latino of any race were 11.2% of the population.
The median household income in Silt was $45,938, and the median family income was $50,938. The per capita income in Silt was $20,938. About 11.2% of families and 14.2% of the population were below the poverty line, including 18.2% of those under age 18 and 8.2% of those age 65 or over.
Common Questions
What is Per Capita Income in Silt?
Per Capita income in Silt is $31,181.
What is the Median Family Income in Silt?
Median Family Income in Silt is $93,684.
What is the Median Household income in Silt?
Median Household Income in Silt is $72,450.
What is Income or Wage Gap in Silt?
Income or Wage Gap in Silt is 45.0%.
Women in Silt earn 55.0 cents for every dollar earned by a man.
What is Inequality or Gini Index in Silt?
Inequality or Gini Index in Silt is 0.36.
What is the Total Population of Silt?
Total Population of Silt is 3,529.
What is the Total Male Population of Silt?
Total Male Population of Silt is 1,722.
What is the Total Female Population of Silt?
Total Female Population of Silt is 1,807.
What is the Ratio of Males per 100 Females in Silt?
There are 95.30 Males per 100 Females in Silt.
What is the Ratio of Females per 100 Males in Silt?
There are 104.94 Females per 100 Males in Silt.
What is the Median Population Age in Silt?
Median Population Age in Silt is 31.0 Years.
What is the Average Family Size in Silt
Average Family Size in Silt is 3.4 People.
What is the Average Household Size in Silt
Average Household Size in Silt is 3.1 People.
How Large is the Labor Force in Silt?
There are 1,971 People in the Labor Forcein in Silt.
What is the Percentage of People in the Labor Force in Silt?
77.8% of People are in the Labor Force in Silt.
What is the Unemployment Rate in Silt?
Unemployment Rate in Silt is 1.7%.