Rollinsville, CO Map & Demographics
Rollinsville Map
Rollinsville Overview
$57,820
PER CAPITA INCOME
$195,893
AVG FAMILY INCOME
0.40
INEQUALITY / GINI INDEX
189
TOTAL POPULATION
71
MALE POPULATION
118
FEMALE POPULATION
60.17
MALES / 100 FEMALES
166.20
FEMALES / 100 MALES
48.2
MEDIAN AGE
2.6
AVG FAMILY SIZE
1.6
AVG HOUSEHOLD SIZE
160
LABOR FORCE [ PEOPLE ]
84.7%
PERCENT IN LABOR FORCE
Rollinsville Zip Codes
Rollinsville Area Codes
Income in Rollinsville
Income Overview in Rollinsville
| Characteristic | Number | Measure |
| Per Capita Income | 189 | $57,820 |
| Median Family Income | 43 | $195,893 |
| Mean Family Income | 43 | $163,556 |
| Median Household Income | 121 | $0 |
| Mean Household Income | 121 | $96,901 |
| Income Deficit | 43 | $0 |
| Wage / Income Gap (%) | 189 | 0.00% |
| Wage / Income Gap ($) | 189 | 100.00¢ per $1 |
| Gini / Inequality Index | 189 | 0.40 |
Earnings by Sex in Rollinsville
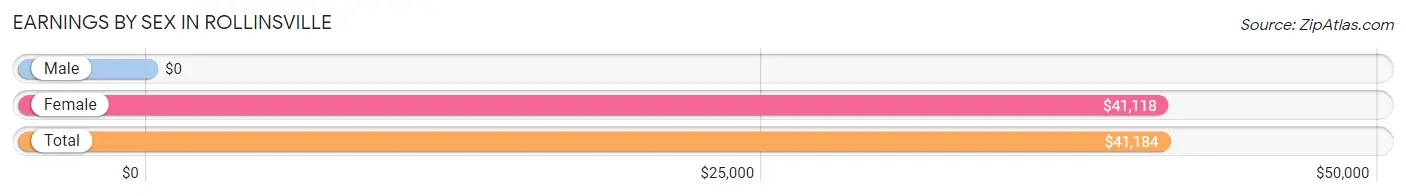
| Sex | Number | Average Earnings |
| Male | 56 (35.0%) | $0 |
| Female | 104 (65.0%) | $41,118 |
| Total | 160 (100.0%) | $41,184 |
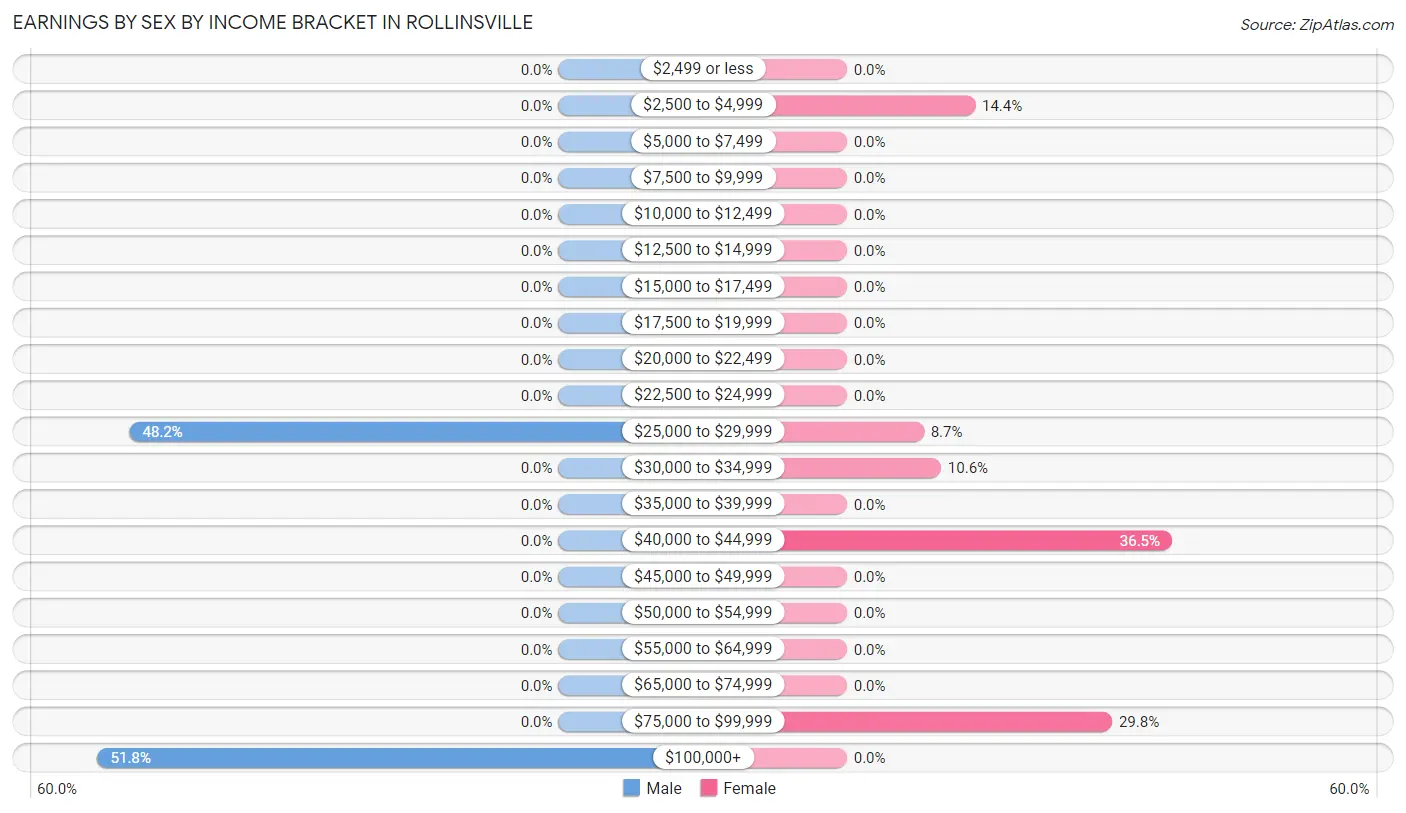
Earnings by Sex by Income Bracket in Rollinsville
The most common earnings brackets in Rollinsville are $100,000+ for men (29 | 51.8%) and $40,000 to $44,999 for women (38 | 36.5%).
| Income | Male | Female |
| $2,499 or less | 0 (0.0%) | 0 (0.0%) |
| $2,500 to $4,999 | 0 (0.0%) | 15 (14.4%) |
| $5,000 to $7,499 | 0 (0.0%) | 0 (0.0%) |
| $7,500 to $9,999 | 0 (0.0%) | 0 (0.0%) |
| $10,000 to $12,499 | 0 (0.0%) | 0 (0.0%) |
| $12,500 to $14,999 | 0 (0.0%) | 0 (0.0%) |
| $15,000 to $17,499 | 0 (0.0%) | 0 (0.0%) |
| $17,500 to $19,999 | 0 (0.0%) | 0 (0.0%) |
| $20,000 to $22,499 | 0 (0.0%) | 0 (0.0%) |
| $22,500 to $24,999 | 0 (0.0%) | 0 (0.0%) |
| $25,000 to $29,999 | 27 (48.2%) | 9 (8.6%) |
| $30,000 to $34,999 | 0 (0.0%) | 11 (10.6%) |
| $35,000 to $39,999 | 0 (0.0%) | 0 (0.0%) |
| $40,000 to $44,999 | 0 (0.0%) | 38 (36.5%) |
| $45,000 to $49,999 | 0 (0.0%) | 0 (0.0%) |
| $50,000 to $54,999 | 0 (0.0%) | 0 (0.0%) |
| $55,000 to $64,999 | 0 (0.0%) | 0 (0.0%) |
| $65,000 to $74,999 | 0 (0.0%) | 0 (0.0%) |
| $75,000 to $99,999 | 0 (0.0%) | 31 (29.8%) |
| $100,000+ | 29 (51.8%) | 0 (0.0%) |
| Total | 56 (100.0%) | 104 (100.0%) |
Earnings by Sex by Educational Attainment in Rollinsville
| Educational Attainment | Male Income | Female Income |
| Less than High School | - | - |
| High School Diploma | - | - |
| College or Associate's Degree | - | - |
| Bachelor's Degree | - | - |
| Graduate Degree | - | - |
| Total | - | - |
Family Income in Rollinsville
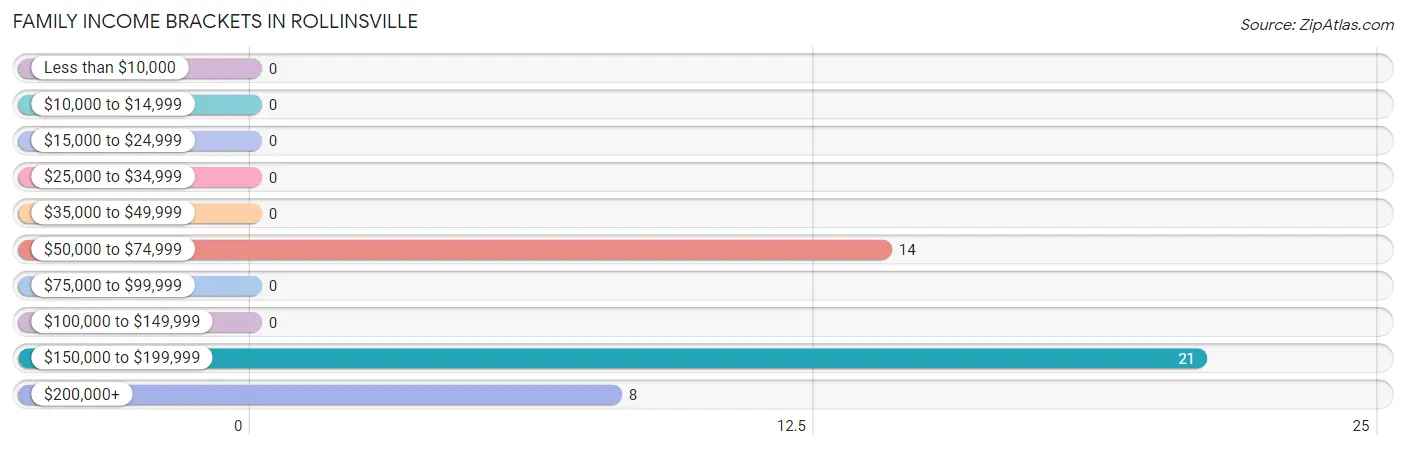
Family Income Brackets in Rollinsville
According to the Rollinsville family income data, there are 21 families falling into the $150,000 to $199,999 income range, which is the most common income bracket and makes up 48.8% of all families.
| Income Bracket | # Families | % Families |
| Less than $10,000 | 0 | 0.0% |
| $10,000 to $14,999 | 0 | 0.0% |
| $15,000 to $24,999 | 0 | 0.0% |
| $25,000 to $34,999 | 0 | 0.0% |
| $35,000 to $49,999 | 0 | 0.0% |
| $50,000 to $74,999 | 14 | 32.6% |
| $75,000 to $99,999 | 0 | 0.0% |
| $100,000 to $149,999 | 0 | 0.0% |
| $150,000 to $199,999 | 21 | 48.8% |
| $200,000+ | 8 | 18.6% |
Family Income by Famaliy Size in Rollinsville
| Income Bracket | # Families | Median Income |
| 2-Person Families | 21 (48.8%) | $0 |
| 3-Person Families | 14 (32.6%) | $0 |
| 4-Person Families | 8 (18.6%) | $0 |
| 5-Person Families | 0 (0.0%) | $0 |
| 6-Person Families | 0 (0.0%) | $0 |
| 7+ Person Families | 0 (0.0%) | $0 |
| Total | 43 (100.0%) | $195,893 |
Family Income by Number of Earners in Rollinsville
| Number of Earners | # Families | Median Income |
| No Earners | 0 (0.0%) | $0 |
| 1 Earner | 14 (32.6%) | $0 |
| 2 Earners | 21 (48.8%) | $0 |
| 3+ Earners | 8 (18.6%) | $0 |
| Total | 43 (100.0%) | $195,893 |
Household Income in Rollinsville
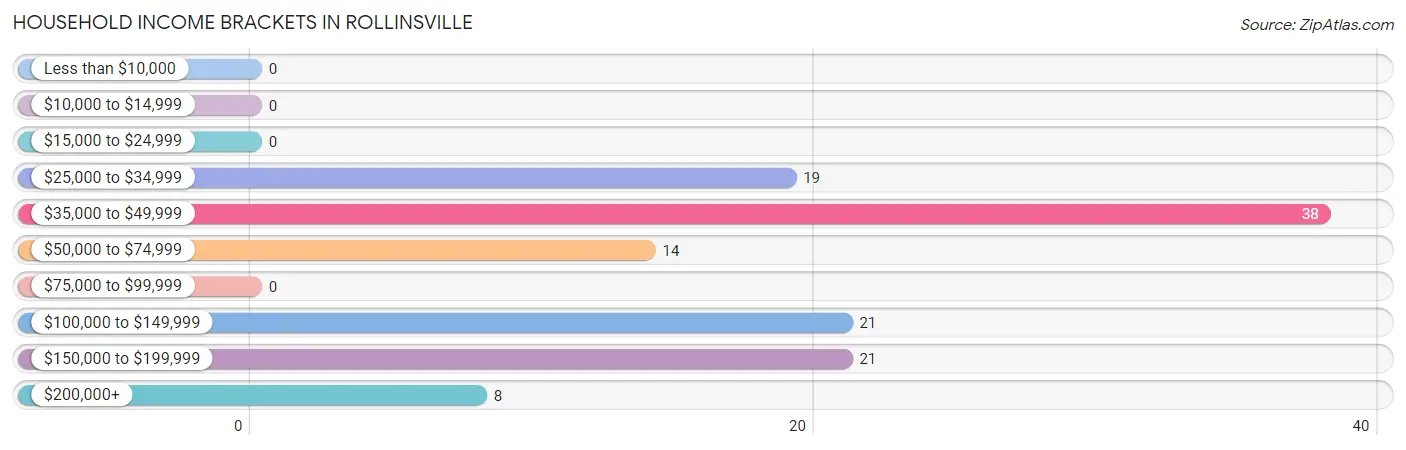
Household Income Brackets in Rollinsville
With 38 households falling in the category, the $35,000 to $49,999 income range is the most frequent in Rollinsville, accounting for 31.4% of all households.
| Income Bracket | # Households | % Households |
| Less than $10,000 | 0 | 0.0% |
| $10,000 to $14,999 | 0 | 0.0% |
| $15,000 to $24,999 | 0 | 0.0% |
| $25,000 to $34,999 | 19 | 15.7% |
| $35,000 to $49,999 | 38 | 31.4% |
| $50,000 to $74,999 | 14 | 11.6% |
| $75,000 to $99,999 | 0 | 0.0% |
| $100,000 to $149,999 | 21 | 17.4% |
| $150,000 to $199,999 | 21 | 17.4% |
| $200,000+ | 8 | 6.6% |
Household Income by Householder Age in Rollinsville
| Income Bracket | # Households | Median Income |
| 15 to 24 Years | 0 (0.0%) | $0 |
| 25 to 44 Years | 38 (31.4%) | $0 |
| 45 to 64 Years | 48 (39.7%) | $0 |
| 65+ Years | 35 (28.9%) | $0 |
| Total | 121 (100.0%) | $0 |
Poverty in Rollinsville
Income Below Poverty by Sex and Age in Rollinsville
| Age Bracket | Male | Female |
| Under 5 Years | 0 (0.0%) | 0 (0.0%) |
| 5 Years | 0 (0.0%) | 0 (0.0%) |
| 6 to 11 Years | 0 (0.0%) | 0 (0.0%) |
| 12 to 14 Years | 0 (0.0%) | 0 (0.0%) |
| 15 Years | 0 (0.0%) | 0 (0.0%) |
| 16 and 17 Years | 0 (0.0%) | 0 (0.0%) |
| 18 to 24 Years | 0 (0.0%) | 0 (0.0%) |
| 25 to 34 Years | 0 (0.0%) | 0 (0.0%) |
| 35 to 44 Years | 0 (0.0%) | 0 (0.0%) |
| 45 to 54 Years | 0 (0.0%) | 0 (0.0%) |
| 55 to 64 Years | 0 (0.0%) | 0 (0.0%) |
| 65 to 74 Years | 0 (0.0%) | 0 (0.0%) |
| 75 Years and over | 0 (0.0%) | 0 (0.0%) |
| Total | 0 (0.0%) | 0 (0.0%) |
Income Above Poverty by Sex and Age in Rollinsville
According to the poverty statistics in Rollinsville, males aged 25 to 34 years and females aged 18 to 24 years are the age groups that are most secure financially, with 100.0% of males and 100.0% of females in these age groups living above the poverty line.
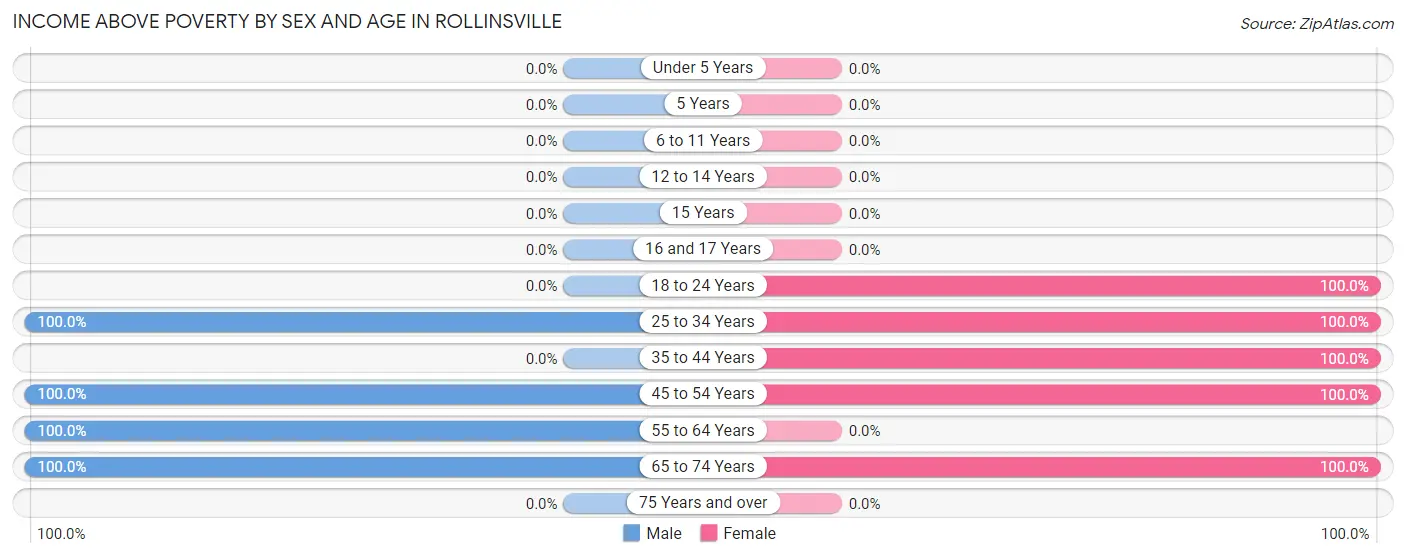
| Age Bracket | Male | Female |
| Under 5 Years | 0 (0.0%) | 0 (0.0%) |
| 5 Years | 0 (0.0%) | 0 (0.0%) |
| 6 to 11 Years | 0 (0.0%) | 0 (0.0%) |
| 12 to 14 Years | 0 (0.0%) | 0 (0.0%) |
| 15 Years | 0 (0.0%) | 0 (0.0%) |
| 16 and 17 Years | 0 (0.0%) | 0 (0.0%) |
| 18 to 24 Years | 0 (0.0%) | 11 (100.0%) |
| 25 to 34 Years | 8 (100.0%) | 38 (100.0%) |
| 35 to 44 Years | 0 (0.0%) | 25 (100.0%) |
| 45 to 54 Years | 29 (100.0%) | 9 (100.0%) |
| 55 to 64 Years | 19 (100.0%) | 0 (0.0%) |
| 65 to 74 Years | 15 (100.0%) | 35 (100.0%) |
| 75 Years and over | 0 (0.0%) | 0 (0.0%) |
| Total | 71 (100.0%) | 118 (100.0%) |
Income Below Poverty Among Married-Couple Families in Rollinsville
| Children | Above Poverty | Below Poverty |
| No Children | 43 (100.0%) | 0 (0.0%) |
| 1 or 2 Children | 0 (0.0%) | 0 (0.0%) |
| 3 or 4 Children | 0 (0.0%) | 0 (0.0%) |
| 5 or more Children | 0 (0.0%) | 0 (0.0%) |
| Total | 43 (100.0%) | 0 (0.0%) |
Income Below Poverty Among Single-Parent Households in Rollinsville
| Children | Single Father | Single Mother |
| No Children | 0 (0.0%) | 0 (0.0%) |
| 1 or 2 Children | 0 (0.0%) | 0 (0.0%) |
| 3 or 4 Children | 0 (0.0%) | 0 (0.0%) |
| 5 or more Children | 0 (0.0%) | 0 (0.0%) |
| Total | 0 (0.0%) | 0 (0.0%) |
Income Below Poverty Among Married-Couple vs Single-Parent Households in Rollinsville
| Children | Married-Couple Families | Single-Parent Households |
| No Children | 0 (0.0%) | 0 (0.0%) |
| 1 or 2 Children | 0 (0.0%) | 0 (0.0%) |
| 3 or 4 Children | 0 (0.0%) | 0 (0.0%) |
| 5 or more Children | 0 (0.0%) | 0 (0.0%) |
| Total | 0 (0.0%) | 0 (0.0%) |
Race in Rollinsville
The most populous races in Rollinsville are , and White / Caucasian (189 | 100.0%).
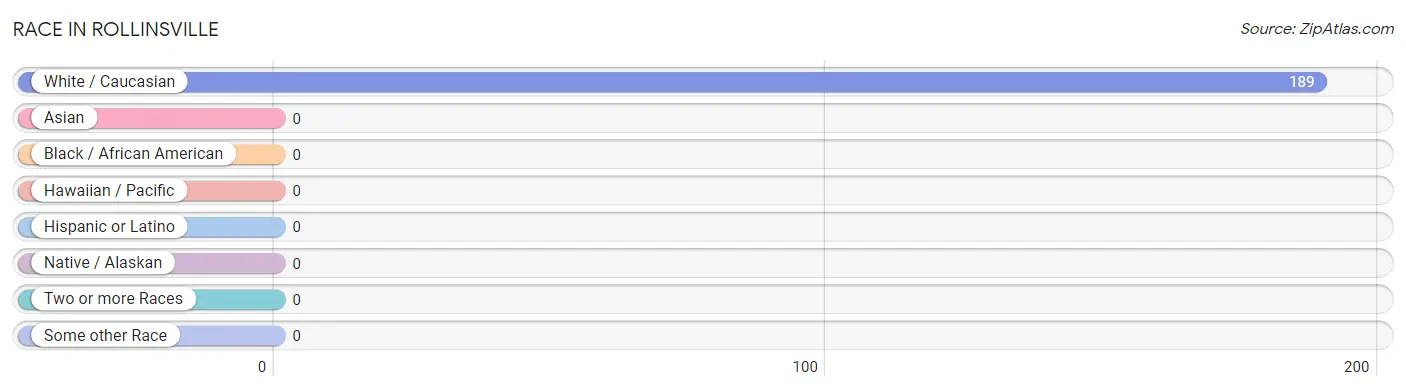
| Race | # Population | % Population |
| Asian | 0 | 0.0% |
| Black / African American | 0 | 0.0% |
| Hawaiian / Pacific | 0 | 0.0% |
| Hispanic or Latino | 0 | 0.0% |
| Native / Alaskan | 0 | 0.0% |
| White / Caucasian | 189 | 100.0% |
| Two or more Races | 0 | 0.0% |
| Some other Race | 0 | 0.0% |
| Total | 189 | 100.0% |
Ancestry in Rollinsville
The most populous ancestries reported in Rollinsville are English (92 | 48.7%), German (86 | 45.5%), Irish (59 | 31.2%), Scottish (29 | 15.3%), and Russian (27 | 14.3%), together accounting for 155.0% of all Rollinsville residents.
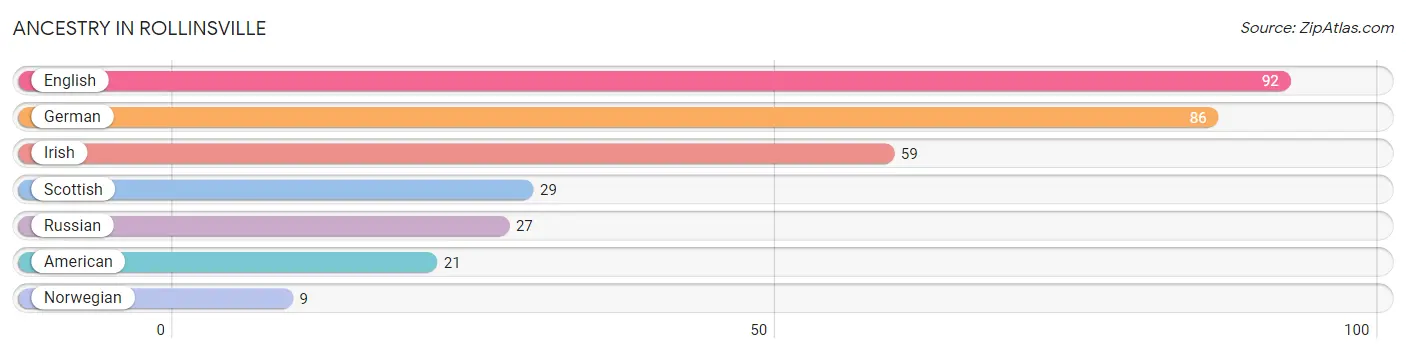
| Ancestry | # Population | % Population |
| American | 21 | 11.1% |
| English | 92 | 48.7% |
| German | 86 | 45.5% |
| Irish | 59 | 31.2% |
| Norwegian | 9 | 4.8% |
| Russian | 27 | 14.3% |
| Scottish | 29 | 15.3% | View All 7 Rows |
Immigrants in Rollinsville

| Immigration Origin | # Population | % Population | View All 0 Rows |
Sex and Age in Rollinsville
Sex and Age in Rollinsville
The most populous age groups in Rollinsville are 45 to 49 Years (21 | 29.6%) for men and 30 to 34 Years (38 | 32.2%) for women.
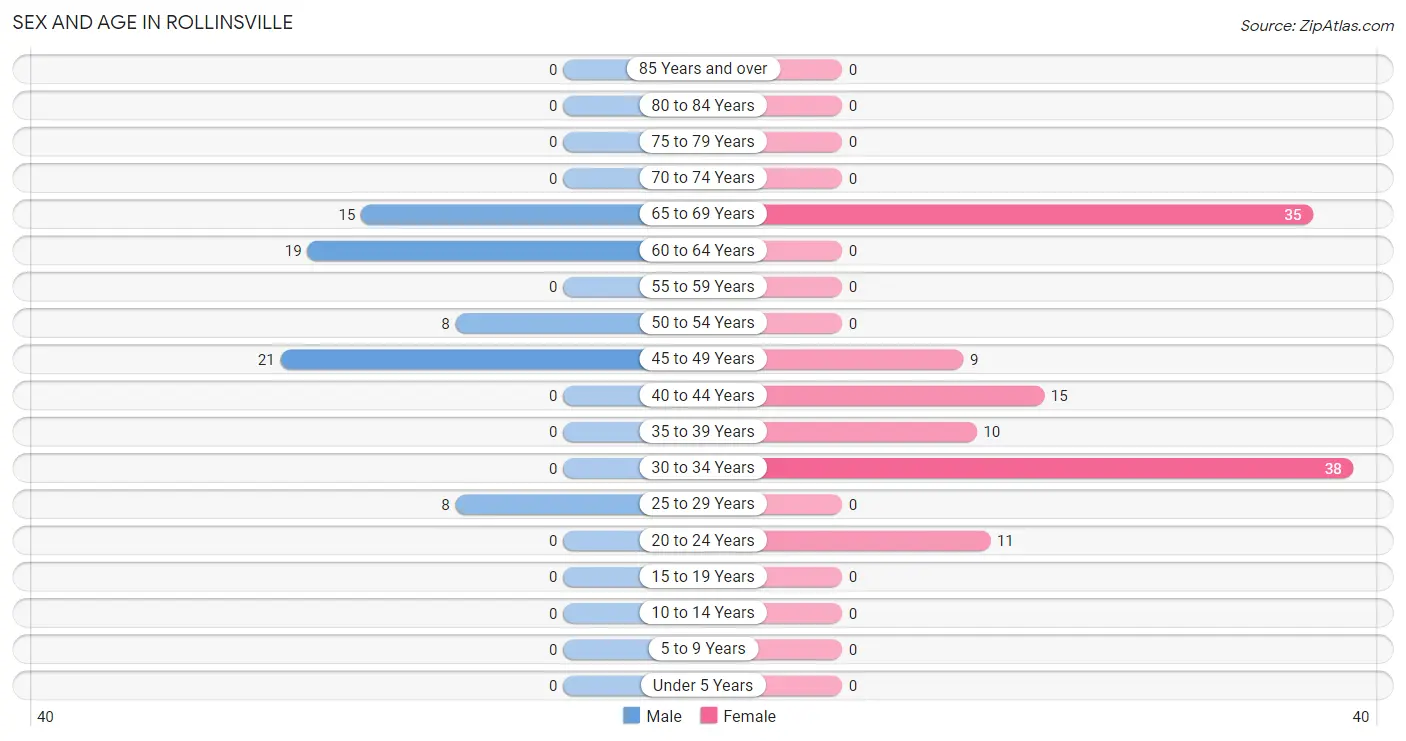
| Age Bracket | Male | Female |
| Under 5 Years | 0 (0.0%) | 0 (0.0%) |
| 5 to 9 Years | 0 (0.0%) | 0 (0.0%) |
| 10 to 14 Years | 0 (0.0%) | 0 (0.0%) |
| 15 to 19 Years | 0 (0.0%) | 0 (0.0%) |
| 20 to 24 Years | 0 (0.0%) | 11 (9.3%) |
| 25 to 29 Years | 8 (11.3%) | 0 (0.0%) |
| 30 to 34 Years | 0 (0.0%) | 38 (32.2%) |
| 35 to 39 Years | 0 (0.0%) | 10 (8.5%) |
| 40 to 44 Years | 0 (0.0%) | 15 (12.7%) |
| 45 to 49 Years | 21 (29.6%) | 9 (7.6%) |
| 50 to 54 Years | 8 (11.3%) | 0 (0.0%) |
| 55 to 59 Years | 0 (0.0%) | 0 (0.0%) |
| 60 to 64 Years | 19 (26.8%) | 0 (0.0%) |
| 65 to 69 Years | 15 (21.1%) | 35 (29.7%) |
| 70 to 74 Years | 0 (0.0%) | 0 (0.0%) |
| 75 to 79 Years | 0 (0.0%) | 0 (0.0%) |
| 80 to 84 Years | 0 (0.0%) | 0 (0.0%) |
| 85 Years and over | 0 (0.0%) | 0 (0.0%) |
| Total | 71 (100.0%) | 118 (100.0%) |
Families and Households in Rollinsville
Median Family Size in Rollinsville
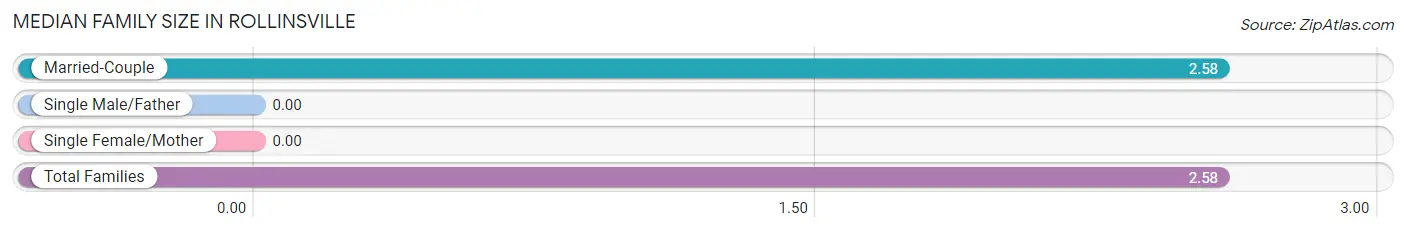
| Family Type | # Families | Family Size |
| Married-Couple | 43 (100.0%) | 2.58 |
| Single Male/Father | 0 (0.0%) | - |
| Single Female/Mother | 0 (0.0%) | - |
| Total Families | 43 (100.0%) | 2.58 |
Median Household Size in Rollinsville
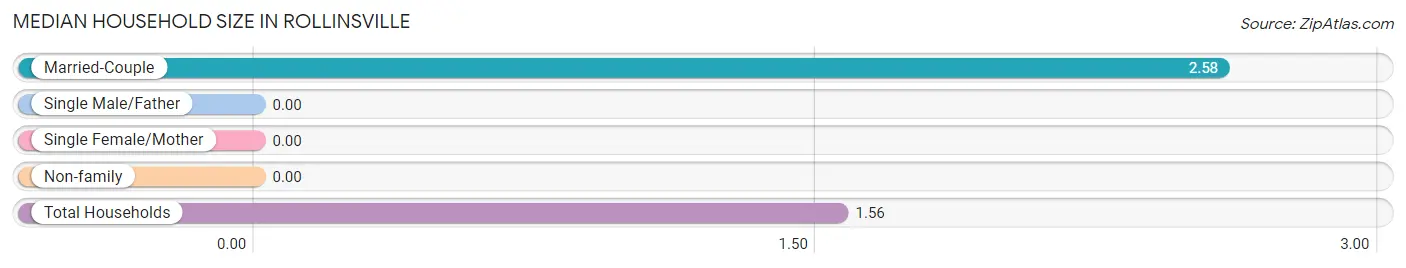
| Household Type | # Households | Household Size |
| Married-Couple | 43 (35.5%) | 2.58 |
| Single Male/Father | 0 (0.0%) | - |
| Single Female/Mother | 0 (0.0%) | - |
| Non-family | 78 (64.5%) | - |
| Total Households | 121 (100.0%) | 1.56 |
Household Size by Marriage Status in Rollinsville
Out of a total of 121 households in Rollinsville, 43 (35.5%) are family households, while 78 (64.5%) are nonfamily households. The most numerous type of family households are 2-person households, comprising 21, and the most common type of nonfamily households are 1-person households, comprising 78.
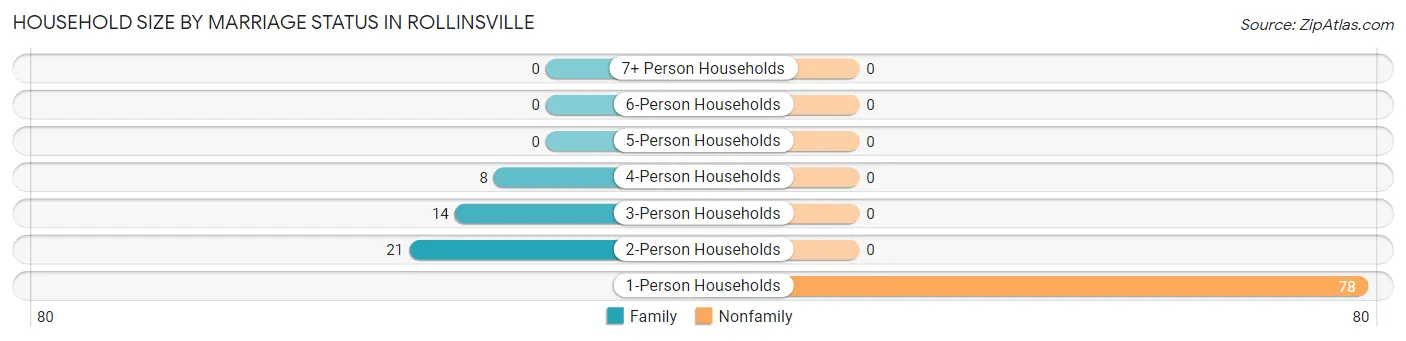
| Household Size | Family Households | Nonfamily Households |
| 1-Person Households | - | 78 (64.5%) |
| 2-Person Households | 21 (17.4%) | 0 (0.0%) |
| 3-Person Households | 14 (11.6%) | 0 (0.0%) |
| 4-Person Households | 8 (6.6%) | 0 (0.0%) |
| 5-Person Households | 0 (0.0%) | 0 (0.0%) |
| 6-Person Households | 0 (0.0%) | 0 (0.0%) |
| 7+ Person Households | 0 (0.0%) | 0 (0.0%) |
| Total | 43 (35.5%) | 78 (64.5%) |
Female Fertility in Rollinsville
Fertility by Age in Rollinsville
| Age Bracket | Women with Births | Births / 1,000 Women |
| 15 to 19 years | 0 (0.0%) | 0.0 |
| 20 to 34 years | 0 (0.0%) | 0.0 |
| 35 to 50 years | 0 (0.0%) | 0.0 |
| Total | 0 (0.0%) | 0.0 |
Fertility by Age by Marriage Status in Rollinsville
| Age Bracket | Married | Unmarried |
| 15 to 19 years | 0 (0.0%) | 0 (0.0%) |
| 20 to 34 years | 0 (0.0%) | 0 (0.0%) |
| 35 to 50 years | 0 (0.0%) | 0 (0.0%) |
| Total | 0 (0.0%) | 0 (0.0%) |
Fertility by Education in Rollinsville
| Educational Attainment | Women with Births | Births / 1,000 Women |
| Less than High School | 0 (0.0%) | 0.0 |
| High School Diploma | 0 (0.0%) | 0.0 |
| College or Associate's Degree | 0 (0.0%) | 0.0 |
| Bachelor's Degree | 0 (0.0%) | 0.0 |
| Graduate Degree | 0 (0.0%) | 0.0 |
| Total | 0 (0.0%) | 0.0 |
Fertility by Education by Marriage Status in Rollinsville
| Educational Attainment | Married | Unmarried |
| Less than High School | 0 (0.0%) | 0 (0.0%) |
| High School Diploma | 0 (0.0%) | 0 (0.0%) |
| College or Associate's Degree | 0 (0.0%) | 0 (0.0%) |
| Bachelor's Degree | 0 (0.0%) | 0 (0.0%) |
| Graduate Degree | 0 (0.0%) | 0 (0.0%) |
| Total | 0 (0.0%) | 0 (0.0%) |
Employment Characteristics in Rollinsville
Employment by Class of Employer in Rollinsville
Among the 160 employed individuals in Rollinsville, private company employees (78 | 48.7%), self-employed (incorporated) (53 | 33.1%), and self-employed (not incorporated) (19 | 11.9%) make up the most common classes of employment.
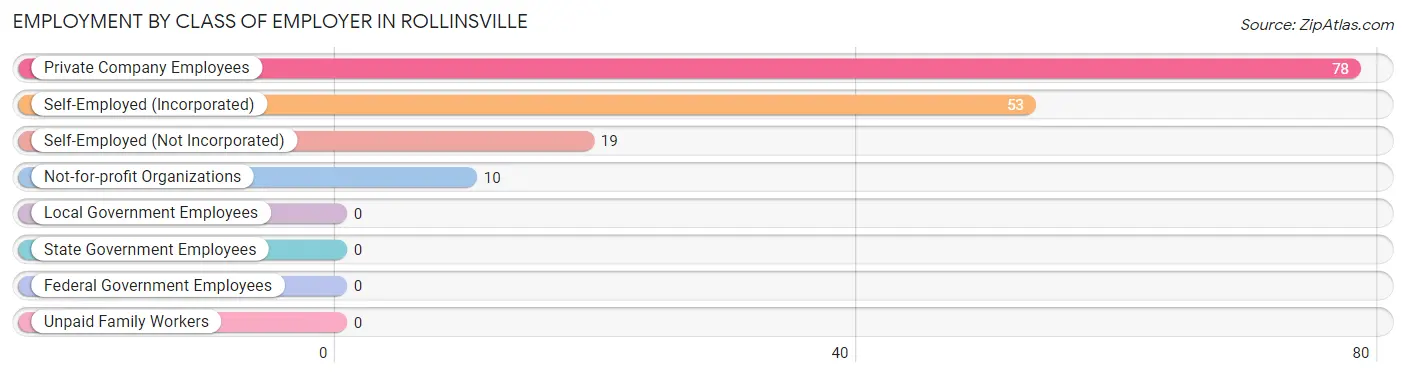
| Employer Class | # Employees | % Employees |
| Private Company Employees | 78 | 48.7% |
| Self-Employed (Incorporated) | 53 | 33.1% |
| Self-Employed (Not Incorporated) | 19 | 11.9% |
| Not-for-profit Organizations | 10 | 6.2% |
| Local Government Employees | 0 | 0.0% |
| State Government Employees | 0 | 0.0% |
| Federal Government Employees | 0 | 0.0% |
| Unpaid Family Workers | 0 | 0.0% |
| Total | 160 | 100.0% |
Employment Status by Age in Rollinsville
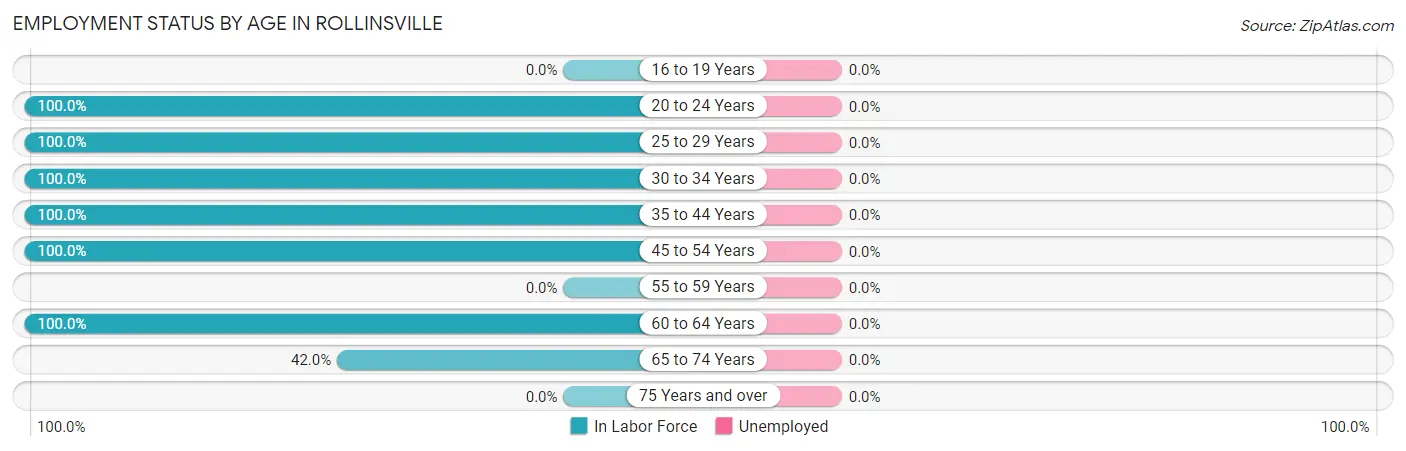
| Age Bracket | In Labor Force | Unemployed |
| 16 to 19 Years | 0 (0.0%) | 0 (0.0%) |
| 20 to 24 Years | 11 (100.0%) | 0 (0.0%) |
| 25 to 29 Years | 8 (100.0%) | 0 (0.0%) |
| 30 to 34 Years | 38 (100.0%) | 0 (0.0%) |
| 35 to 44 Years | 25 (100.0%) | 0 (0.0%) |
| 45 to 54 Years | 38 (100.0%) | 0 (0.0%) |
| 55 to 59 Years | 0 (0.0%) | 0 (0.0%) |
| 60 to 64 Years | 19 (100.0%) | 0 (0.0%) |
| 65 to 74 Years | 21 (42.0%) | 0 (0.0%) |
| 75 Years and over | 0 (0.0%) | 0 (0.0%) |
| Total | 160 (84.7%) | 0 (0.0%) |
Employment Status by Educational Attainment in Rollinsville
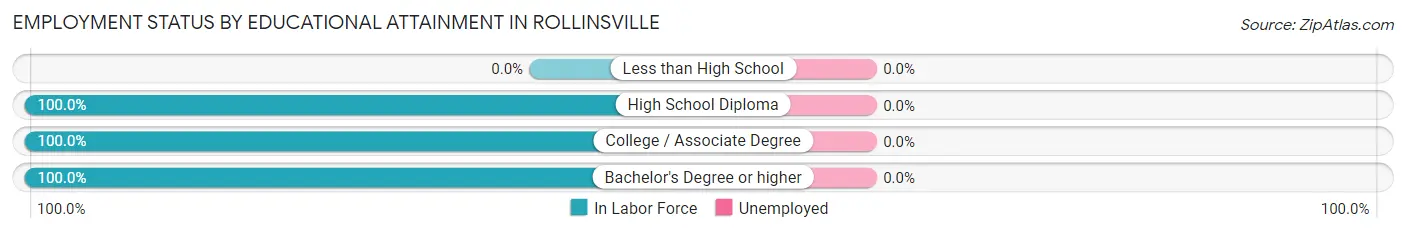
| Educational Attainment | In Labor Force | Unemployed |
| Less than High School | 0 (0.0%) | 0 (0.0%) |
| High School Diploma | 21 (100.0%) | 0 (0.0%) |
| College / Associate Degree | 36 (100.0%) | 0 (0.0%) |
| Bachelor's Degree or higher | 71 (100.0%) | 0 (0.0%) |
| Total | 128 (100.0%) | 0 (0.0%) |
Employment Occupations by Sex in Rollinsville
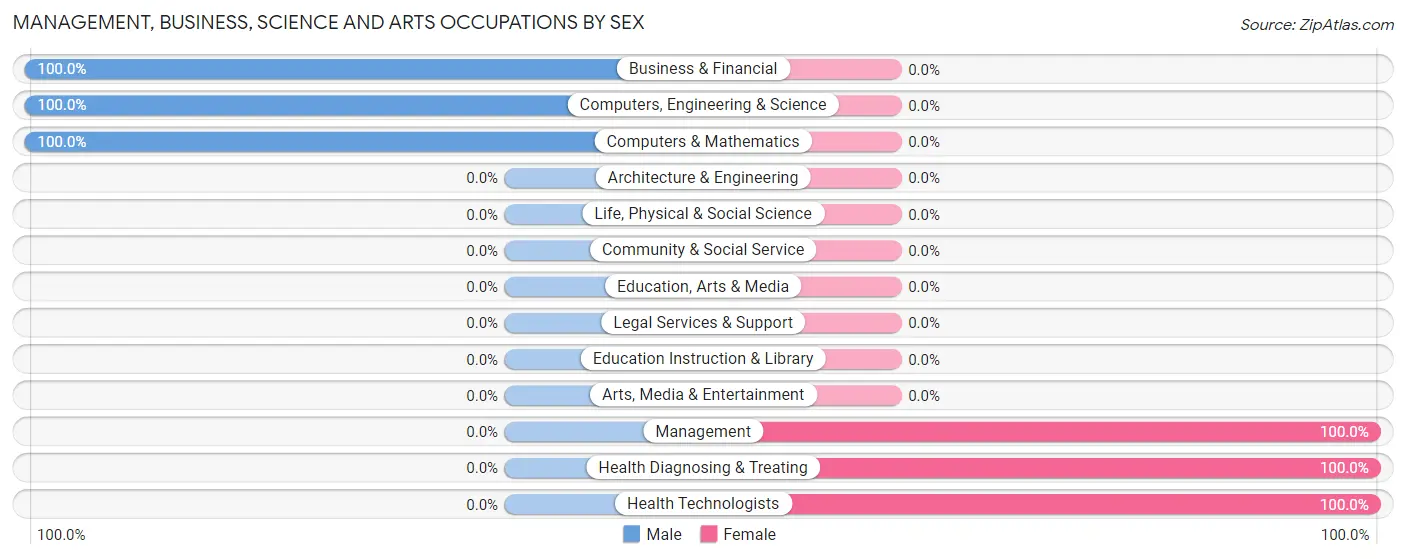
Management, Business, Science and Arts Occupations
The most common Management, Business, Science and Arts occupations in Rollinsville are Health Diagnosing & Treating (38 | 23.7%), Health Technologists (38 | 23.7%), Management (31 | 19.4%), Business & Financial (21 | 13.1%), and Computers, Engineering & Science (8 | 5.0%).
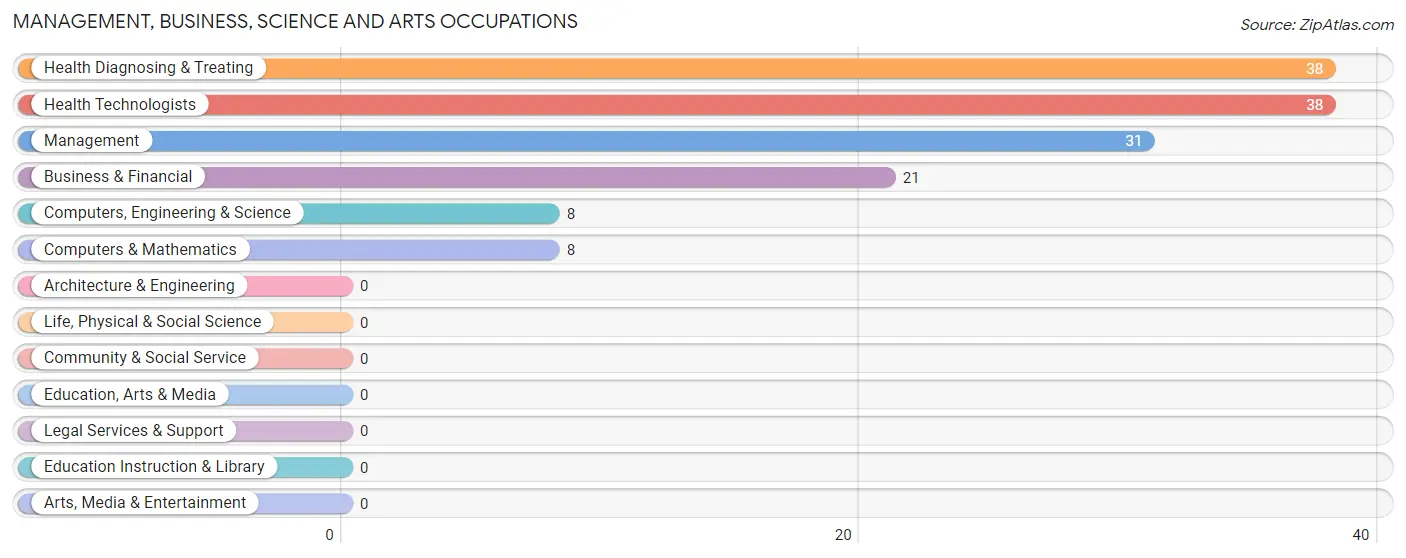
Management, Business, Science and Arts Occupations by Sex
Within the Management, Business, Science and Arts occupations in Rollinsville, the most male-oriented occupations are Business & Financial (100.0%), Computers, Engineering & Science (100.0%), and Computers & Mathematics (100.0%), while the most female-oriented occupations are Management (100.0%), Health Diagnosing & Treating (100.0%), and Health Technologists (100.0%).
| Occupation | Male | Female |
| Management | 0 (0.0%) | 31 (100.0%) |
| Business & Financial | 21 (100.0%) | 0 (0.0%) |
| Computers, Engineering & Science | 8 (100.0%) | 0 (0.0%) |
| Computers & Mathematics | 8 (100.0%) | 0 (0.0%) |
| Architecture & Engineering | 0 (0.0%) | 0 (0.0%) |
| Life, Physical & Social Science | 0 (0.0%) | 0 (0.0%) |
| Community & Social Service | 0 (0.0%) | 0 (0.0%) |
| Education, Arts & Media | 0 (0.0%) | 0 (0.0%) |
| Legal Services & Support | 0 (0.0%) | 0 (0.0%) |
| Education Instruction & Library | 0 (0.0%) | 0 (0.0%) |
| Arts, Media & Entertainment | 0 (0.0%) | 0 (0.0%) |
| Health Diagnosing & Treating | 0 (0.0%) | 38 (100.0%) |
| Health Technologists | 0 (0.0%) | 38 (100.0%) |
| Total (Category) | 29 (29.6%) | 69 (70.4%) |
| Total (Overall) | 56 (35.0%) | 104 (65.0%) |
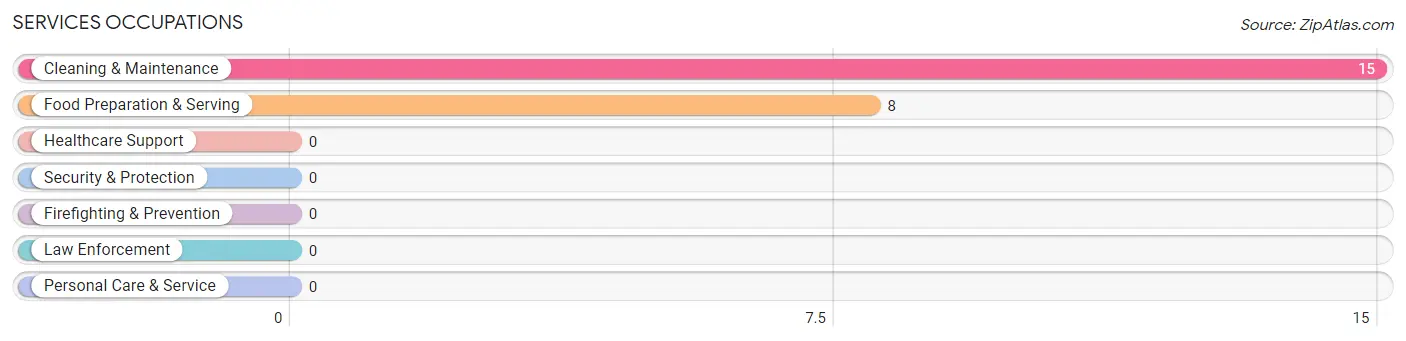
Services Occupations
The most common Services occupations in Rollinsville are Cleaning & Maintenance (15 | 9.4%), and Food Preparation & Serving (8 | 5.0%).
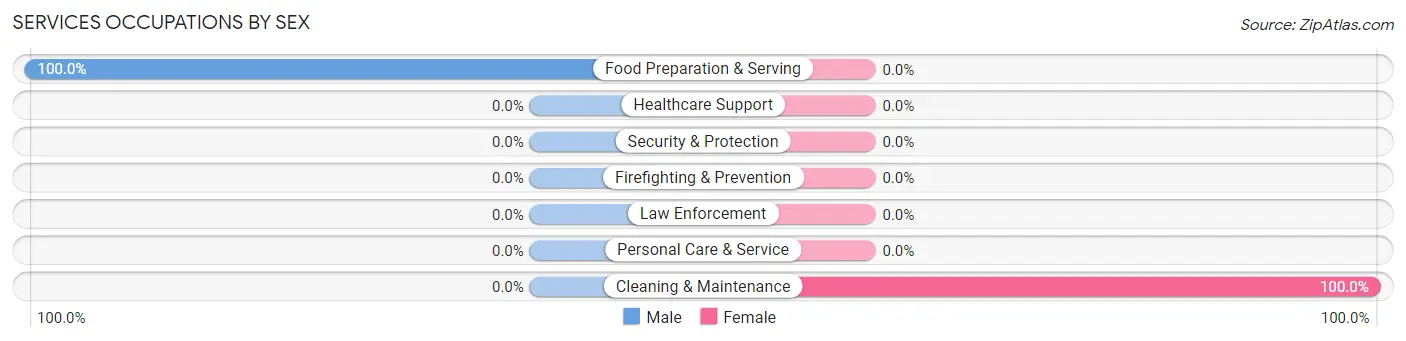
Services Occupations by Sex
| Occupation | Male | Female |
| Healthcare Support | 0 (0.0%) | 0 (0.0%) |
| Security & Protection | 0 (0.0%) | 0 (0.0%) |
| Firefighting & Prevention | 0 (0.0%) | 0 (0.0%) |
| Law Enforcement | 0 (0.0%) | 0 (0.0%) |
| Food Preparation & Serving | 8 (100.0%) | 0 (0.0%) |
| Cleaning & Maintenance | 0 (0.0%) | 15 (100.0%) |
| Personal Care & Service | 0 (0.0%) | 0 (0.0%) |
| Total (Category) | 8 (34.8%) | 15 (65.2%) |
| Total (Overall) | 56 (35.0%) | 104 (65.0%) |
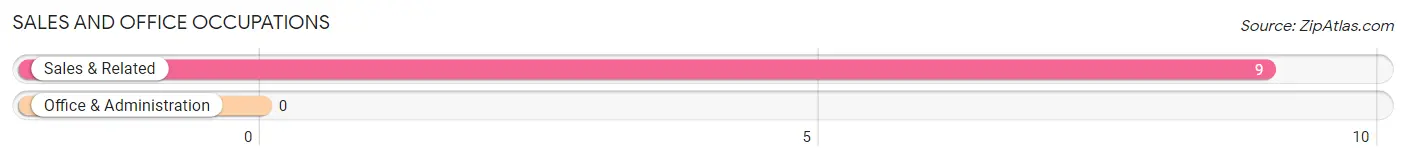
Sales and Office Occupations
The most common Sales and Office occupations in Rollinsville are , and Sales & Related (9 | 5.6%).
Sales and Office Occupations by Sex
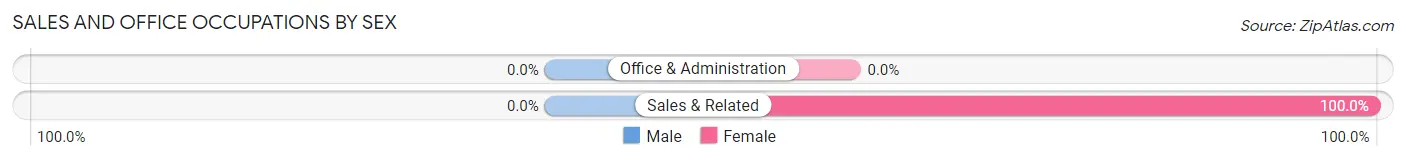
| Occupation | Male | Female |
| Sales & Related | 0 (0.0%) | 9 (100.0%) |
| Office & Administration | 0 (0.0%) | 0 (0.0%) |
| Total (Category) | 0 (0.0%) | 9 (100.0%) |
| Total (Overall) | 56 (35.0%) | 104 (65.0%) |
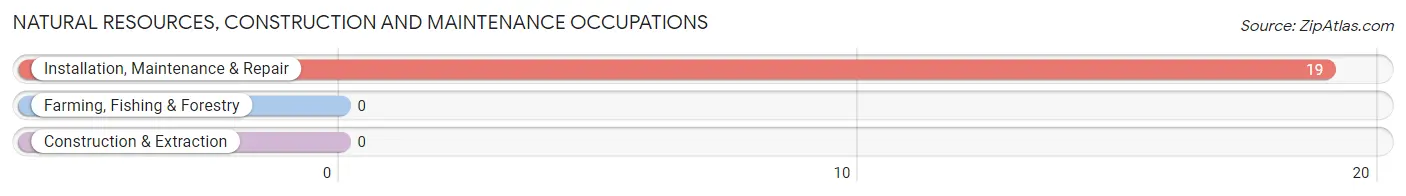
Natural Resources, Construction and Maintenance Occupations
The most common Natural Resources, Construction and Maintenance occupations in Rollinsville are , and Installation, Maintenance & Repair (19 | 11.9%).
Natural Resources, Construction and Maintenance Occupations by Sex
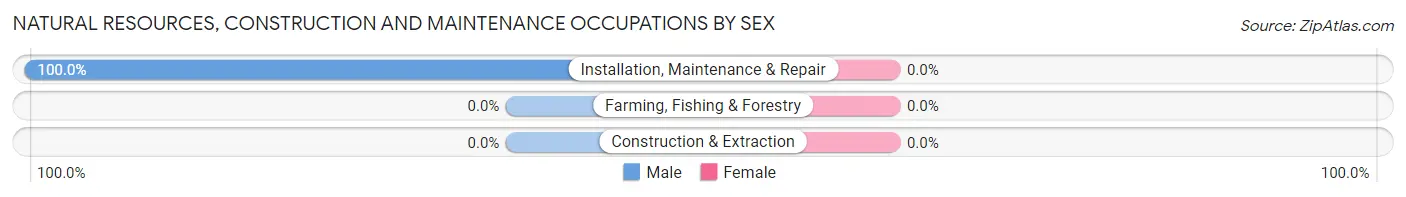
| Occupation | Male | Female |
| Farming, Fishing & Forestry | 0 (0.0%) | 0 (0.0%) |
| Construction & Extraction | 0 (0.0%) | 0 (0.0%) |
| Installation, Maintenance & Repair | 19 (100.0%) | 0 (0.0%) |
| Total (Category) | 19 (100.0%) | 0 (0.0%) |
| Total (Overall) | 56 (35.0%) | 104 (65.0%) |
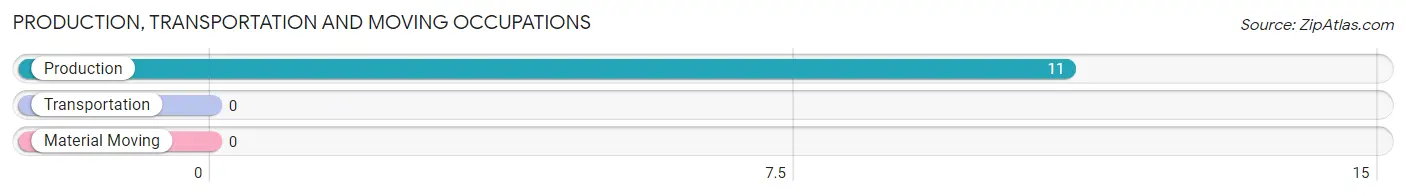
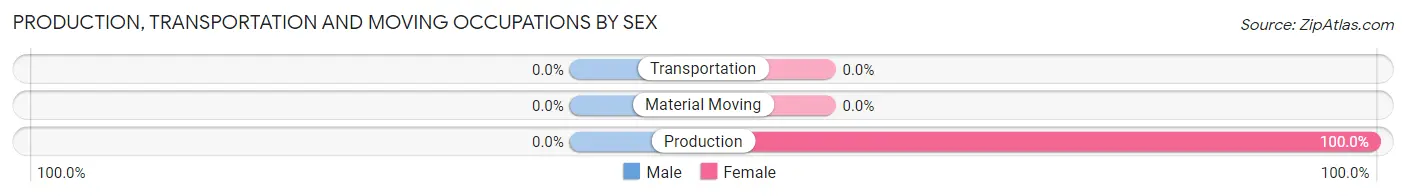
Production, Transportation and Moving Occupations
The most common Production, Transportation and Moving occupations in Rollinsville are , and Production (11 | 6.9%).
Production, Transportation and Moving Occupations by Sex
| Occupation | Male | Female |
| Production | 0 (0.0%) | 11 (100.0%) |
| Transportation | 0 (0.0%) | 0 (0.0%) |
| Material Moving | 0 (0.0%) | 0 (0.0%) |
| Total (Category) | 0 (0.0%) | 11 (100.0%) |
| Total (Overall) | 56 (35.0%) | 104 (65.0%) |
Employment Industries by Sex in Rollinsville
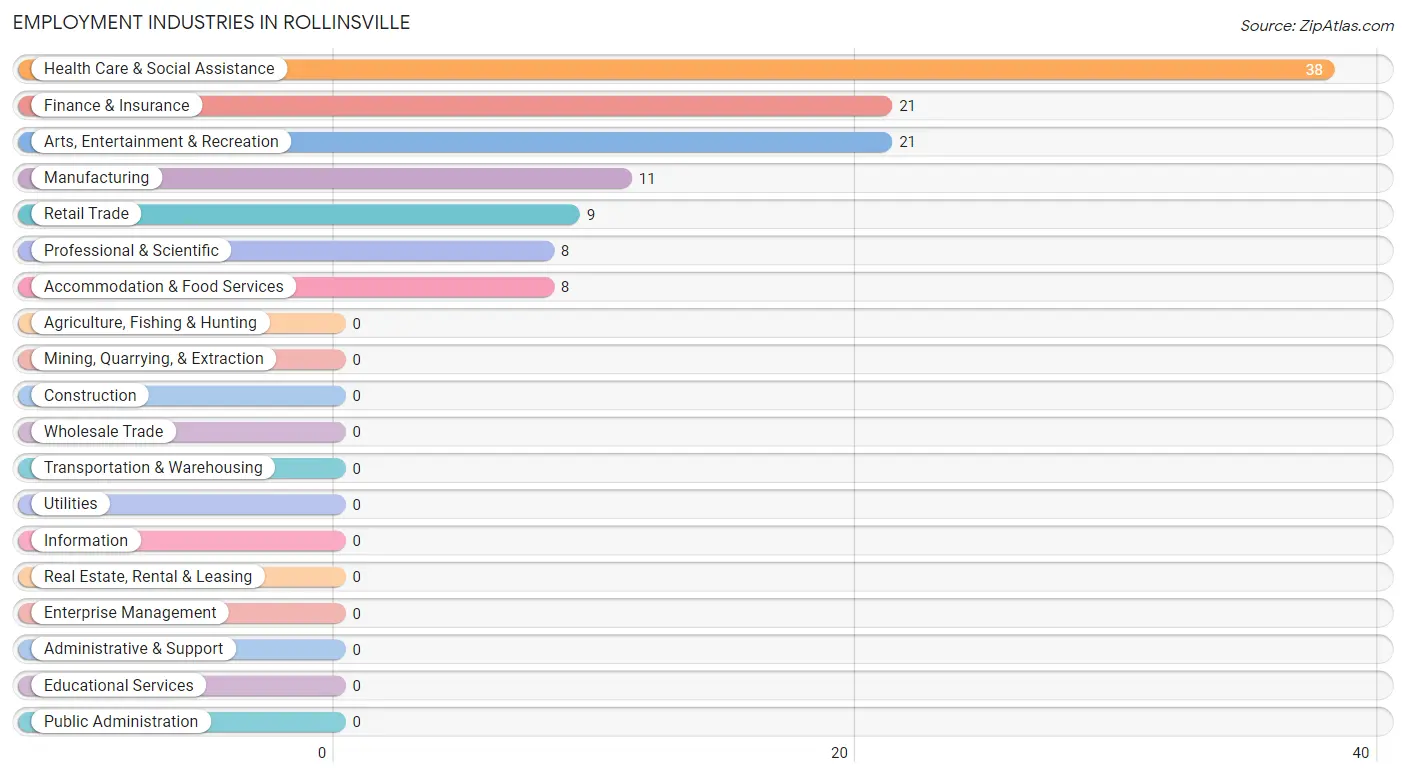
Employment Industries in Rollinsville
The major employment industries in Rollinsville include Health Care & Social Assistance (38 | 23.7%), Finance & Insurance (21 | 13.1%), Arts, Entertainment & Recreation (21 | 13.1%), Manufacturing (11 | 6.9%), and Retail Trade (9 | 5.6%).
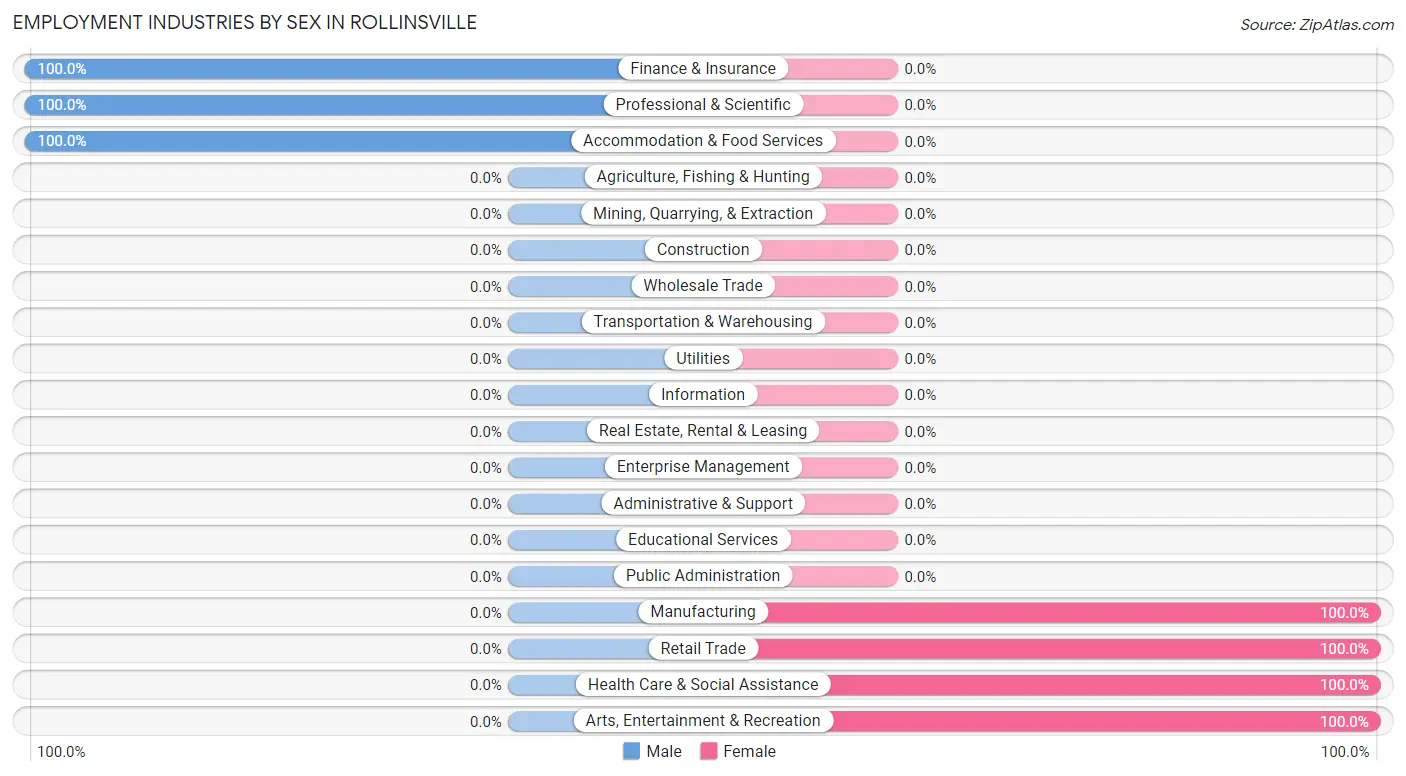
Employment Industries by Sex in Rollinsville
The Rollinsville industries that see more men than women are Finance & Insurance (100.0%), Professional & Scientific (100.0%), and Accommodation & Food Services (100.0%), whereas the industries that tend to have a higher number of women are Manufacturing (100.0%), Retail Trade (100.0%), and Health Care & Social Assistance (100.0%).
| Industry | Male | Female |
| Agriculture, Fishing & Hunting | 0 (0.0%) | 0 (0.0%) |
| Mining, Quarrying, & Extraction | 0 (0.0%) | 0 (0.0%) |
| Construction | 0 (0.0%) | 0 (0.0%) |
| Manufacturing | 0 (0.0%) | 11 (100.0%) |
| Wholesale Trade | 0 (0.0%) | 0 (0.0%) |
| Retail Trade | 0 (0.0%) | 9 (100.0%) |
| Transportation & Warehousing | 0 (0.0%) | 0 (0.0%) |
| Utilities | 0 (0.0%) | 0 (0.0%) |
| Information | 0 (0.0%) | 0 (0.0%) |
| Finance & Insurance | 21 (100.0%) | 0 (0.0%) |
| Real Estate, Rental & Leasing | 0 (0.0%) | 0 (0.0%) |
| Professional & Scientific | 8 (100.0%) | 0 (0.0%) |
| Enterprise Management | 0 (0.0%) | 0 (0.0%) |
| Administrative & Support | 0 (0.0%) | 0 (0.0%) |
| Educational Services | 0 (0.0%) | 0 (0.0%) |
| Health Care & Social Assistance | 0 (0.0%) | 38 (100.0%) |
| Arts, Entertainment & Recreation | 0 (0.0%) | 21 (100.0%) |
| Accommodation & Food Services | 8 (100.0%) | 0 (0.0%) |
| Public Administration | 0 (0.0%) | 0 (0.0%) |
| Total | 56 (35.0%) | 104 (65.0%) |
Education in Rollinsville
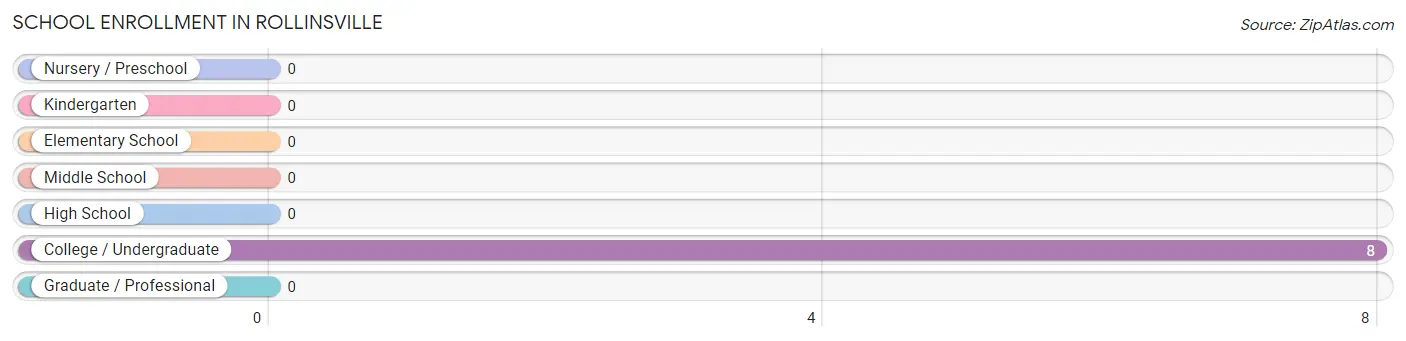
School Enrollment in Rollinsville
| School Level | # Students | % Students |
| Nursery / Preschool | 0 | 0.0% |
| Kindergarten | 0 | 0.0% |
| Elementary School | 0 | 0.0% |
| Middle School | 0 | 0.0% |
| High School | 0 | 0.0% |
| College / Undergraduate | 8 | 100.0% |
| Graduate / Professional | 0 | 0.0% |
| Total | 8 | 100.0% |
School Enrollment by Age by Funding Source in Rollinsville
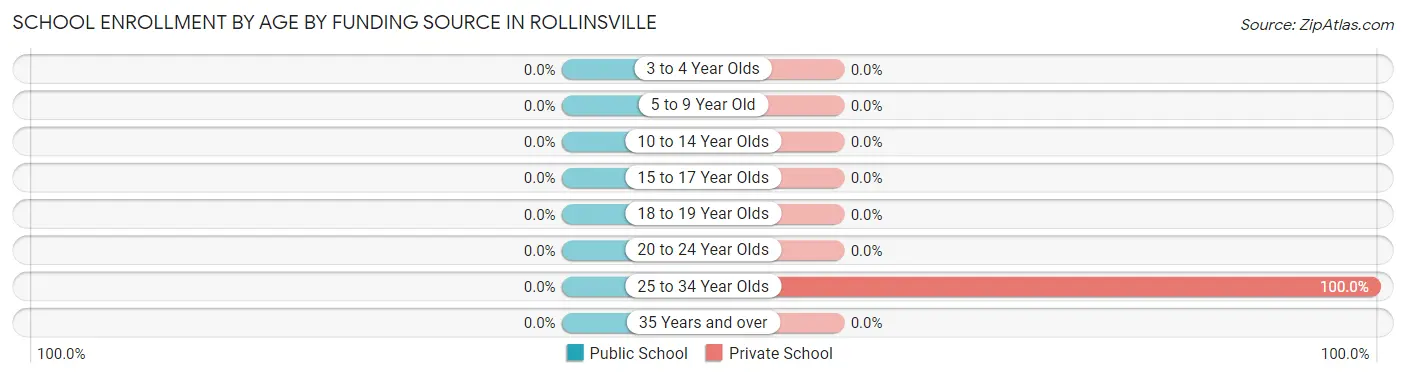
| Age Bracket | Public School | Private School |
| 3 to 4 Year Olds | 0 (0.0%) | 0 (0.0%) |
| 5 to 9 Year Old | 0 (0.0%) | 0 (0.0%) |
| 10 to 14 Year Olds | 0 (0.0%) | 0 (0.0%) |
| 15 to 17 Year Olds | 0 (0.0%) | 0 (0.0%) |
| 18 to 19 Year Olds | 0 (0.0%) | 0 (0.0%) |
| 20 to 24 Year Olds | 0 (0.0%) | 0 (0.0%) |
| 25 to 34 Year Olds | 0 (0.0%) | 8 (100.0%) |
| 35 Years and over | 0 (0.0%) | 0 (0.0%) |
| Total | 0 (0.0%) | 8 (100.0%) |
Educational Attainment by Field of Study in Rollinsville
Visual & performing arts (38 | 28.1%), education (24 | 17.8%), business (21 | 15.6%), physical & health sciences (15 | 11.1%), and engineering (15 | 11.1%) are the most common fields of study among 135 individuals in Rollinsville who have obtained a bachelor's degree or higher.
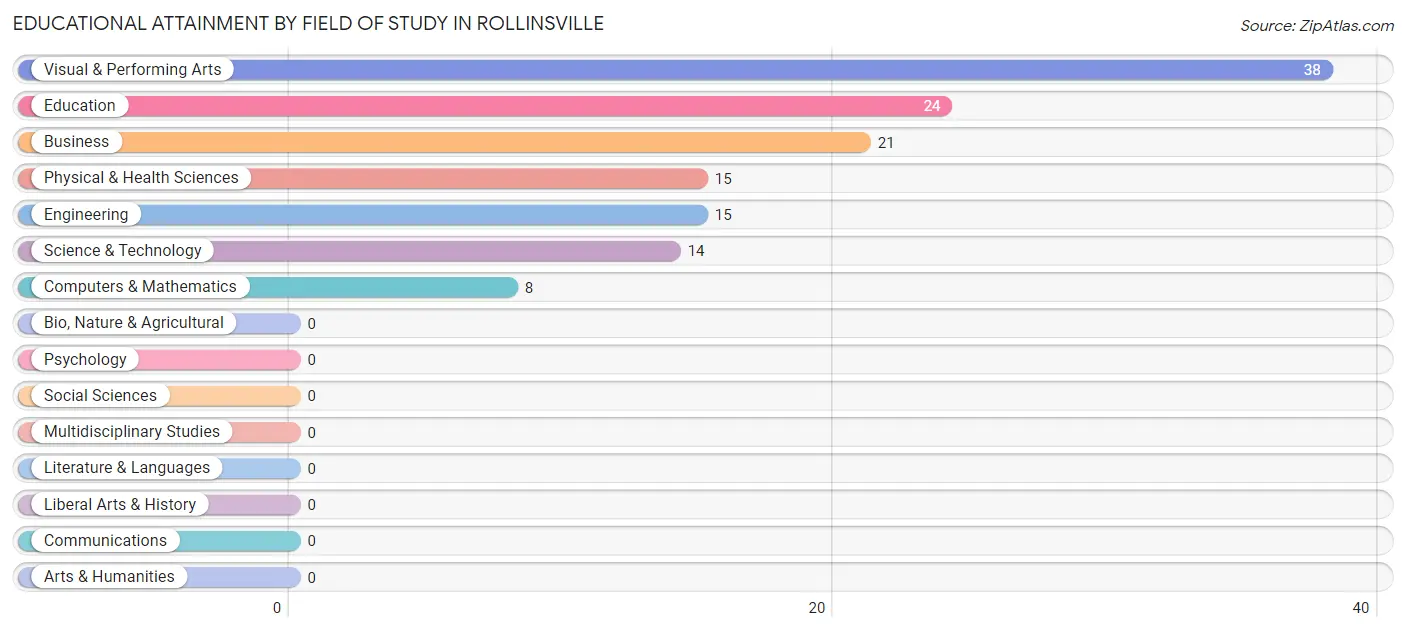
| Field of Study | # Graduates | % Graduates |
| Computers & Mathematics | 8 | 5.9% |
| Bio, Nature & Agricultural | 0 | 0.0% |
| Physical & Health Sciences | 15 | 11.1% |
| Psychology | 0 | 0.0% |
| Social Sciences | 0 | 0.0% |
| Engineering | 15 | 11.1% |
| Multidisciplinary Studies | 0 | 0.0% |
| Science & Technology | 14 | 10.4% |
| Business | 21 | 15.6% |
| Education | 24 | 17.8% |
| Literature & Languages | 0 | 0.0% |
| Liberal Arts & History | 0 | 0.0% |
| Visual & Performing Arts | 38 | 28.1% |
| Communications | 0 | 0.0% |
| Arts & Humanities | 0 | 0.0% |
| Total | 135 | 100.0% |
Transportation & Commute in Rollinsville
Vehicle Availability by Sex in Rollinsville
The most prevalent vehicle ownership categories in Rollinsville are males with 2 vehicles (21, accounting for 37.5%) and females with 2 vehicles (10, making up 20.2%).
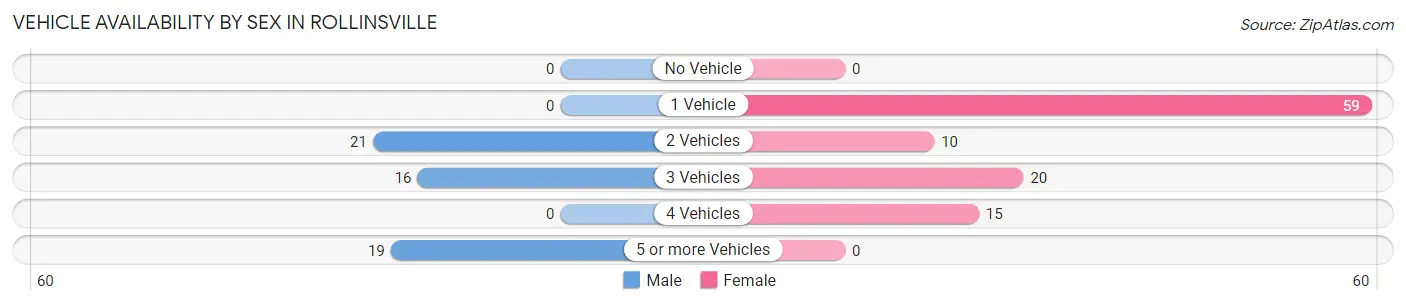
| Vehicles Available | Male | Female |
| No Vehicle | 0 (0.0%) | 0 (0.0%) |
| 1 Vehicle | 0 (0.0%) | 59 (56.7%) |
| 2 Vehicles | 21 (37.5%) | 10 (9.6%) |
| 3 Vehicles | 16 (28.6%) | 20 (19.2%) |
| 4 Vehicles | 0 (0.0%) | 15 (14.4%) |
| 5 or more Vehicles | 19 (33.9%) | 0 (0.0%) |
| Total | 56 (100.0%) | 104 (100.0%) |
Commute Time in Rollinsville
The most frequently occuring commute durations in Rollinsville are 60 to 89 minutes (63 commuters, 39.4%), 5 to 9 minutes (27 commuters, 16.9%), and 20 to 24 minutes (21 commuters, 13.1%).
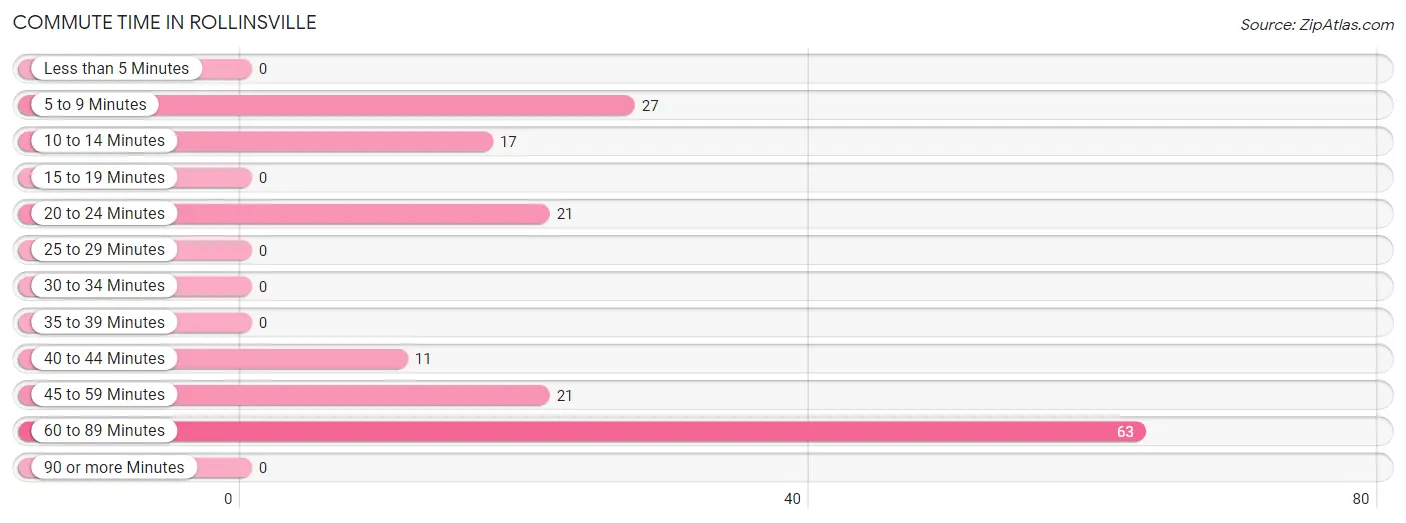
| Commute Time | # Commuters | % Commuters |
| Less than 5 Minutes | 0 | 0.0% |
| 5 to 9 Minutes | 27 | 16.9% |
| 10 to 14 Minutes | 17 | 10.6% |
| 15 to 19 Minutes | 0 | 0.0% |
| 20 to 24 Minutes | 21 | 13.1% |
| 25 to 29 Minutes | 0 | 0.0% |
| 30 to 34 Minutes | 0 | 0.0% |
| 35 to 39 Minutes | 0 | 0.0% |
| 40 to 44 Minutes | 11 | 6.9% |
| 45 to 59 Minutes | 21 | 13.1% |
| 60 to 89 Minutes | 63 | 39.4% |
| 90 or more Minutes | 0 | 0.0% |
Commute Time by Sex in Rollinsville
The most common commute times in Rollinsville are 5 to 9 minutes (27 commuters, 48.2%) for males and 60 to 89 minutes (63 commuters, 60.6%) for females.
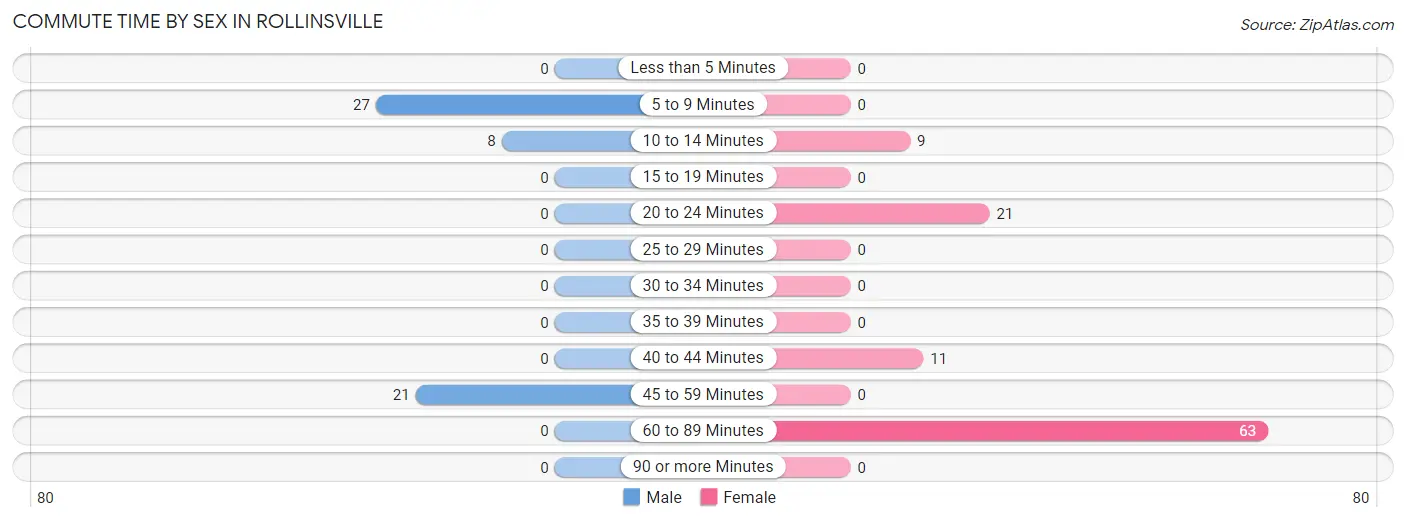
| Commute Time | Male | Female |
| Less than 5 Minutes | 0 (0.0%) | 0 (0.0%) |
| 5 to 9 Minutes | 27 (48.2%) | 0 (0.0%) |
| 10 to 14 Minutes | 8 (14.3%) | 9 (8.6%) |
| 15 to 19 Minutes | 0 (0.0%) | 0 (0.0%) |
| 20 to 24 Minutes | 0 (0.0%) | 21 (20.2%) |
| 25 to 29 Minutes | 0 (0.0%) | 0 (0.0%) |
| 30 to 34 Minutes | 0 (0.0%) | 0 (0.0%) |
| 35 to 39 Minutes | 0 (0.0%) | 0 (0.0%) |
| 40 to 44 Minutes | 0 (0.0%) | 11 (10.6%) |
| 45 to 59 Minutes | 21 (37.5%) | 0 (0.0%) |
| 60 to 89 Minutes | 0 (0.0%) | 63 (60.6%) |
| 90 or more Minutes | 0 (0.0%) | 0 (0.0%) |
Time of Departure to Work by Sex in Rollinsville
The most frequent times of departure to work in Rollinsville are 8:00 AM to 8:29 AM (21, 37.5%) for males and 7:00 AM to 7:29 AM (47, 45.2%) for females.
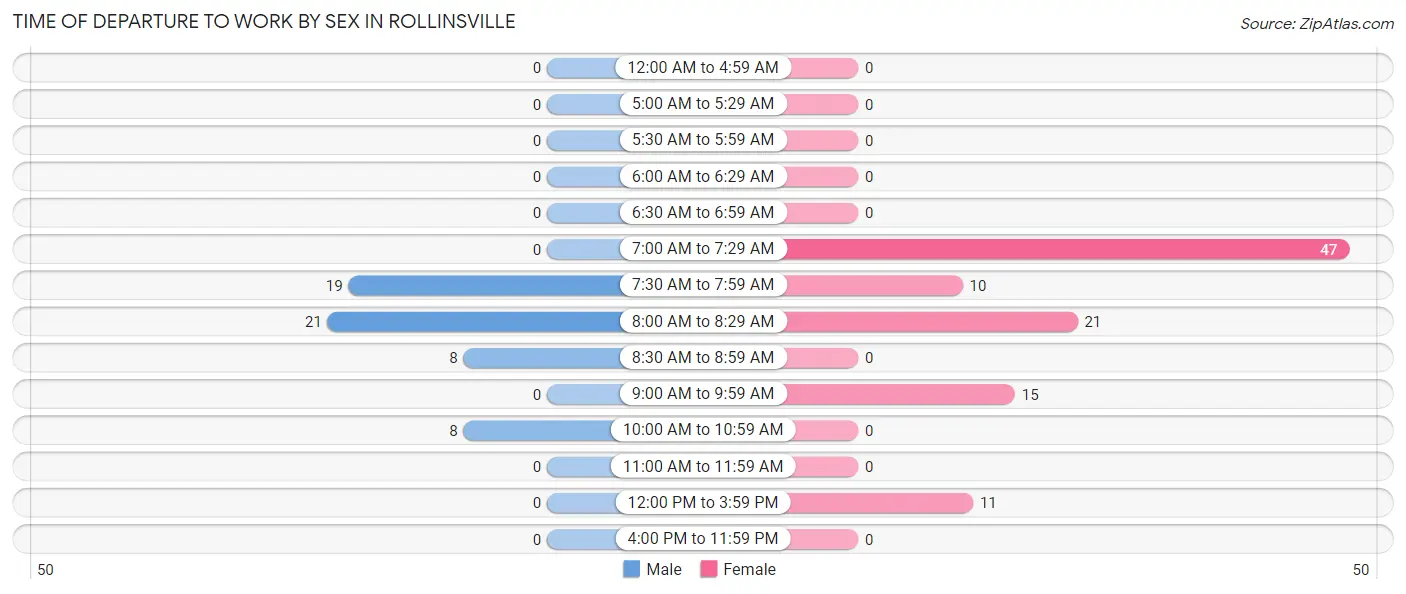
| Time of Departure | Male | Female |
| 12:00 AM to 4:59 AM | 0 (0.0%) | 0 (0.0%) |
| 5:00 AM to 5:29 AM | 0 (0.0%) | 0 (0.0%) |
| 5:30 AM to 5:59 AM | 0 (0.0%) | 0 (0.0%) |
| 6:00 AM to 6:29 AM | 0 (0.0%) | 0 (0.0%) |
| 6:30 AM to 6:59 AM | 0 (0.0%) | 0 (0.0%) |
| 7:00 AM to 7:29 AM | 0 (0.0%) | 47 (45.2%) |
| 7:30 AM to 7:59 AM | 19 (33.9%) | 10 (9.6%) |
| 8:00 AM to 8:29 AM | 21 (37.5%) | 21 (20.2%) |
| 8:30 AM to 8:59 AM | 8 (14.3%) | 0 (0.0%) |
| 9:00 AM to 9:59 AM | 0 (0.0%) | 15 (14.4%) |
| 10:00 AM to 10:59 AM | 8 (14.3%) | 0 (0.0%) |
| 11:00 AM to 11:59 AM | 0 (0.0%) | 0 (0.0%) |
| 12:00 PM to 3:59 PM | 0 (0.0%) | 11 (10.6%) |
| 4:00 PM to 11:59 PM | 0 (0.0%) | 0 (0.0%) |
| Total | 56 (100.0%) | 104 (100.0%) |
Housing Occupancy in Rollinsville
Occupancy by Ownership in Rollinsville
Of the total 121 dwellings in Rollinsville, owner-occupied units account for 121 (100.0%), while renter-occupied units make up 0 (0.0%).
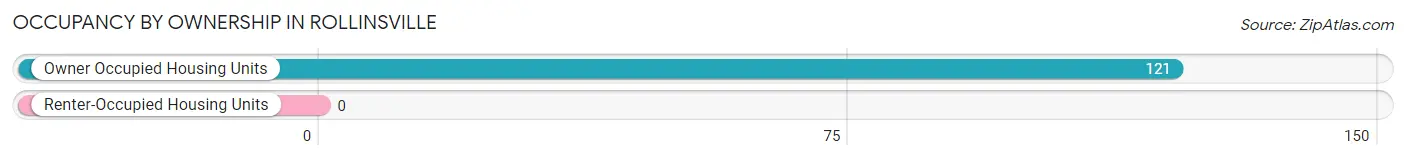
| Occupancy | # Housing Units | % Housing Units |
| Owner Occupied Housing Units | 121 | 100.0% |
| Renter-Occupied Housing Units | 0 | 0.0% |
| Total Occupied Housing Units | 121 | 100.0% |
Occupancy by Household Size in Rollinsville
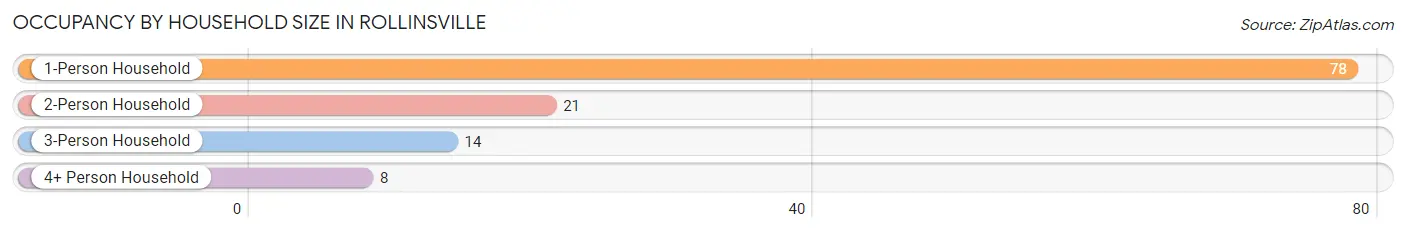
| Household Size | # Housing Units | % Housing Units |
| 1-Person Household | 78 | 64.5% |
| 2-Person Household | 21 | 17.4% |
| 3-Person Household | 14 | 11.6% |
| 4+ Person Household | 8 | 6.6% |
| Total Housing Units | 121 | 100.0% |
Occupancy by Ownership by Household Size in Rollinsville
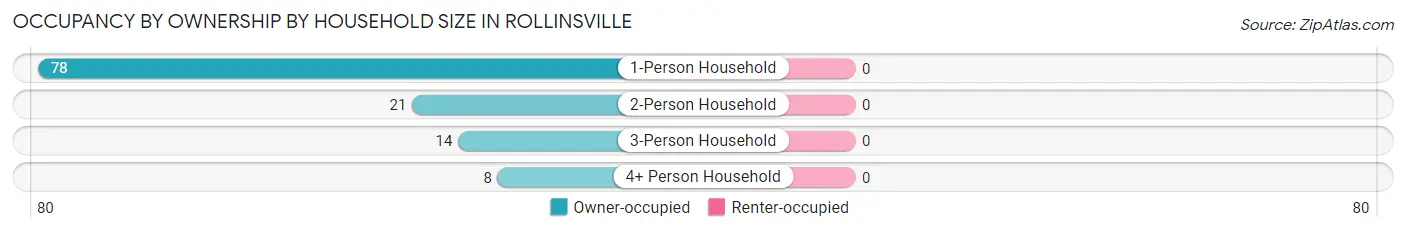
| Household Size | Owner-occupied | Renter-occupied |
| 1-Person Household | 78 (100.0%) | 0 (0.0%) |
| 2-Person Household | 21 (100.0%) | 0 (0.0%) |
| 3-Person Household | 14 (100.0%) | 0 (0.0%) |
| 4+ Person Household | 8 (100.0%) | 0 (0.0%) |
| Total Housing Units | 121 (100.0%) | 0 (0.0%) |
Occupancy by Educational Attainment in Rollinsville
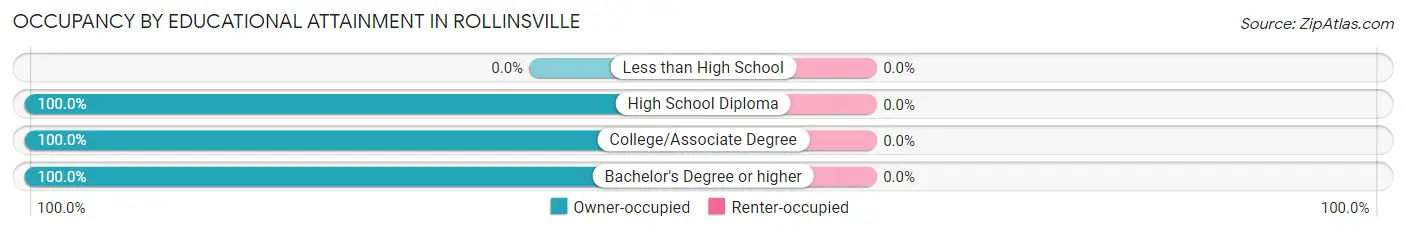
| Household Size | Owner-occupied | Renter-occupied |
| Less than High School | 0 (0.0%) | 0 (0.0%) |
| High School Diploma | 21 (100.0%) | 0 (0.0%) |
| College/Associate Degree | 19 (100.0%) | 0 (0.0%) |
| Bachelor's Degree or higher | 81 (100.0%) | 0 (0.0%) |
Occupancy by Age of Householder in Rollinsville
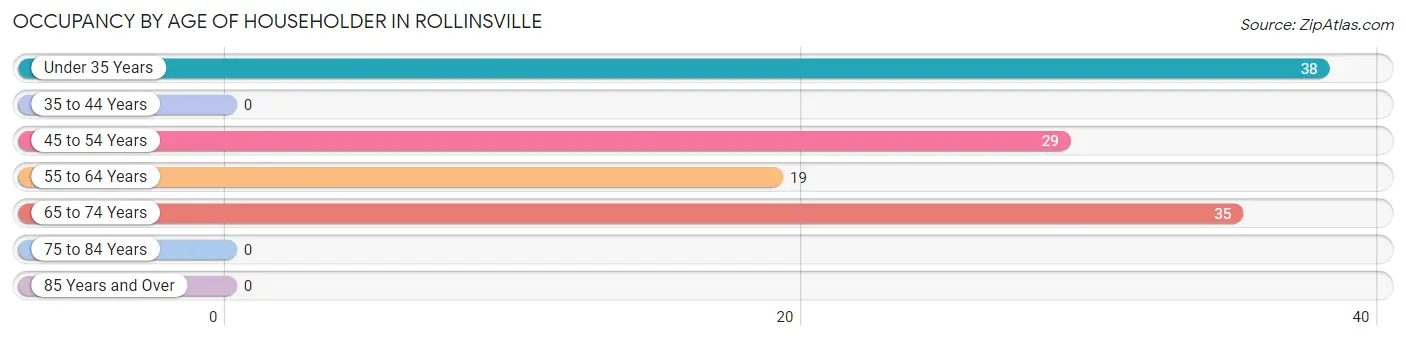
| Age Bracket | # Households | % Households |
| Under 35 Years | 38 | 31.4% |
| 35 to 44 Years | 0 | 0.0% |
| 45 to 54 Years | 29 | 24.0% |
| 55 to 64 Years | 19 | 15.7% |
| 65 to 74 Years | 35 | 28.9% |
| 75 to 84 Years | 0 | 0.0% |
| 85 Years and Over | 0 | 0.0% |
| Total | 121 | 100.0% |
Housing Finances in Rollinsville
Median Income by Occupancy in Rollinsville
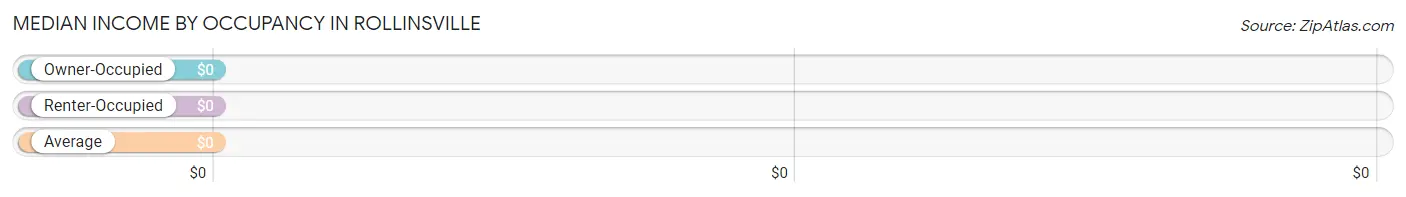
| Occupancy Type | # Households | Median Income |
| Owner-Occupied | 121 (100.0%) | $0 |
| Renter-Occupied | 0 (0.0%) | $0 |
| Average | 121 (100.0%) | $0 |
Occupancy by Householder Income Bracket in Rollinsville
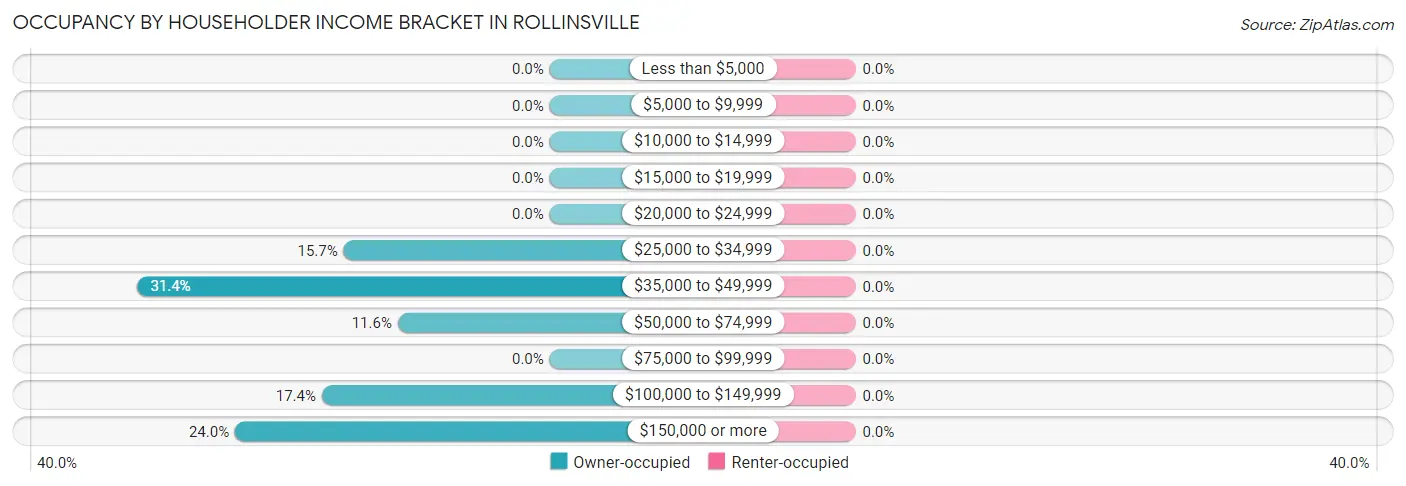
| Income Bracket | Owner-occupied | Renter-occupied |
| Less than $5,000 | 0 (0.0%) | 0 (0.0%) |
| $5,000 to $9,999 | 0 (0.0%) | 0 (0.0%) |
| $10,000 to $14,999 | 0 (0.0%) | 0 (0.0%) |
| $15,000 to $19,999 | 0 (0.0%) | 0 (0.0%) |
| $20,000 to $24,999 | 0 (0.0%) | 0 (0.0%) |
| $25,000 to $34,999 | 19 (15.7%) | 0 (0.0%) |
| $35,000 to $49,999 | 38 (31.4%) | 0 (0.0%) |
| $50,000 to $74,999 | 14 (11.6%) | 0 (0.0%) |
| $75,000 to $99,999 | 0 (0.0%) | 0 (0.0%) |
| $100,000 to $149,999 | 21 (17.4%) | 0 (0.0%) |
| $150,000 or more | 29 (24.0%) | 0 (0.0%) |
| Total | 121 (100.0%) | 0 (0.0%) |
Monthly Housing Cost Tiers in Rollinsville
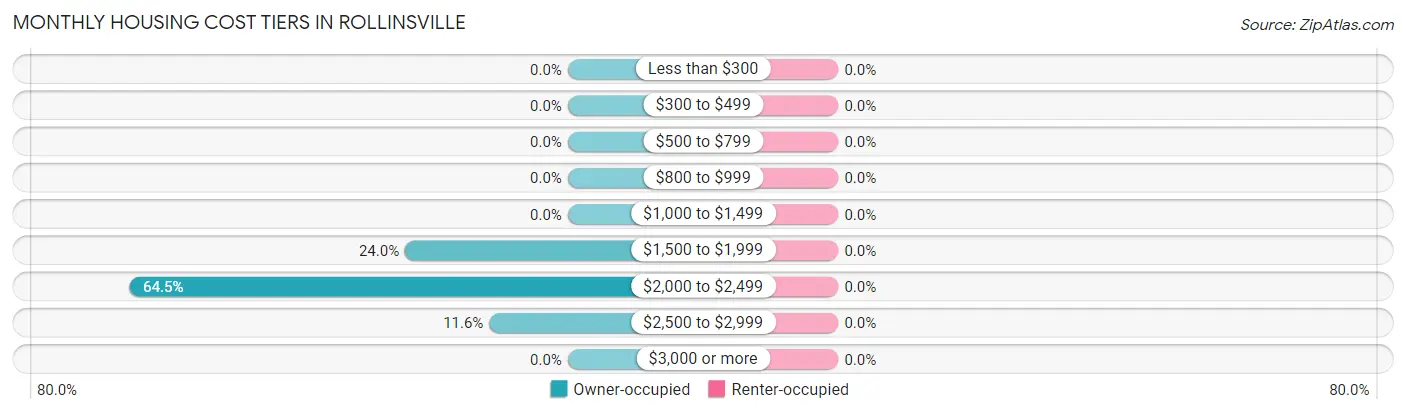
| Monthly Cost | Owner-occupied | Renter-occupied |
| Less than $300 | 0 (0.0%) | 0 (0.0%) |
| $300 to $499 | 0 (0.0%) | 0 (0.0%) |
| $500 to $799 | 0 (0.0%) | 0 (0.0%) |
| $800 to $999 | 0 (0.0%) | 0 (0.0%) |
| $1,000 to $1,499 | 0 (0.0%) | 0 (0.0%) |
| $1,500 to $1,999 | 29 (24.0%) | 0 (0.0%) |
| $2,000 to $2,499 | 78 (64.5%) | 0 (0.0%) |
| $2,500 to $2,999 | 14 (11.6%) | 0 (0.0%) |
| $3,000 or more | 0 (0.0%) | 0 (0.0%) |
| Total | 121 (100.0%) | 0 (0.0%) |
Physical Housing Characteristics in Rollinsville
Housing Structures in Rollinsville
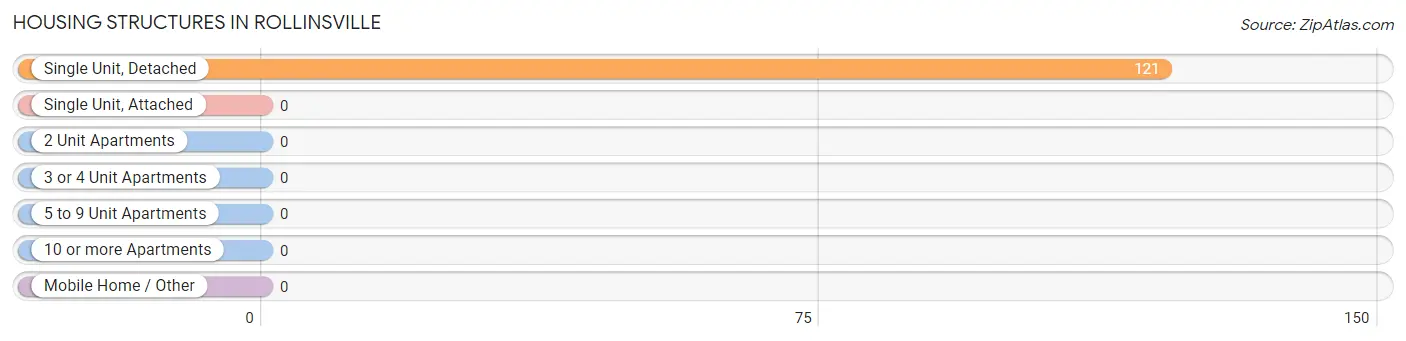
| Structure Type | # Housing Units | % Housing Units |
| Single Unit, Detached | 121 | 100.0% |
| Single Unit, Attached | 0 | 0.0% |
| 2 Unit Apartments | 0 | 0.0% |
| 3 or 4 Unit Apartments | 0 | 0.0% |
| 5 to 9 Unit Apartments | 0 | 0.0% |
| 10 or more Apartments | 0 | 0.0% |
| Mobile Home / Other | 0 | 0.0% |
| Total | 121 | 100.0% |
Housing Structures by Occupancy in Rollinsville
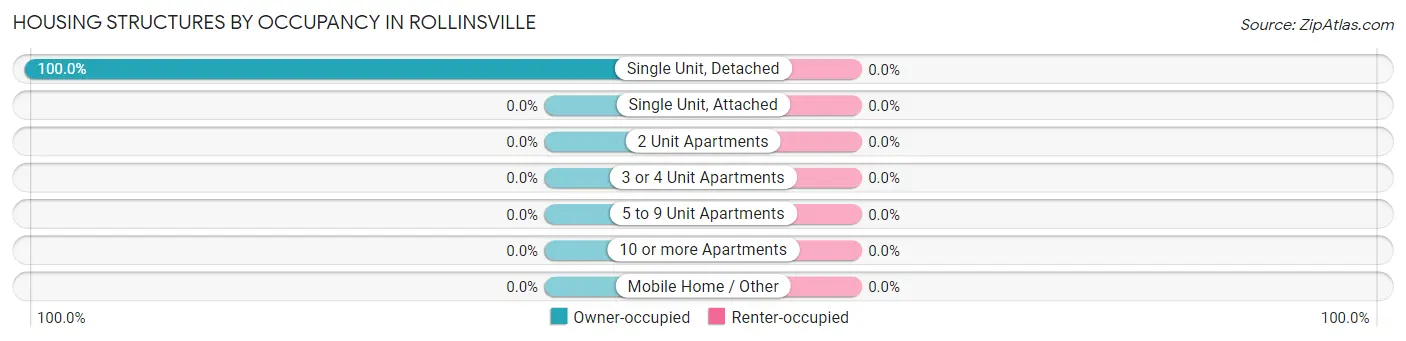
| Structure Type | Owner-occupied | Renter-occupied |
| Single Unit, Detached | 121 (100.0%) | 0 (0.0%) |
| Single Unit, Attached | 0 (0.0%) | 0 (0.0%) |
| 2 Unit Apartments | 0 (0.0%) | 0 (0.0%) |
| 3 or 4 Unit Apartments | 0 (0.0%) | 0 (0.0%) |
| 5 to 9 Unit Apartments | 0 (0.0%) | 0 (0.0%) |
| 10 or more Apartments | 0 (0.0%) | 0 (0.0%) |
| Mobile Home / Other | 0 (0.0%) | 0 (0.0%) |
| Total | 121 (100.0%) | 0 (0.0%) |
Housing Structures by Number of Rooms in Rollinsville
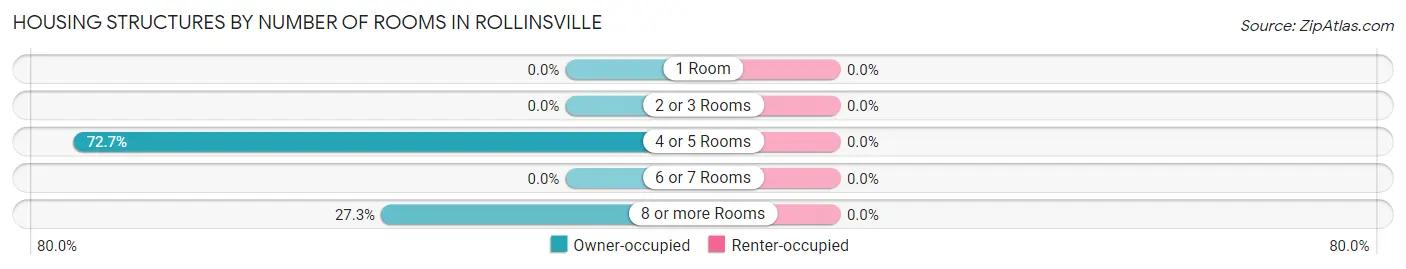
| Number of Rooms | Owner-occupied | Renter-occupied |
| 1 Room | 0 (0.0%) | 0 (0.0%) |
| 2 or 3 Rooms | 0 (0.0%) | 0 (0.0%) |
| 4 or 5 Rooms | 88 (72.7%) | 0 (0.0%) |
| 6 or 7 Rooms | 0 (0.0%) | 0 (0.0%) |
| 8 or more Rooms | 33 (27.3%) | 0 (0.0%) |
| Total | 121 (100.0%) | 0 (0.0%) |
Housing Structure by Heating Type in Rollinsville
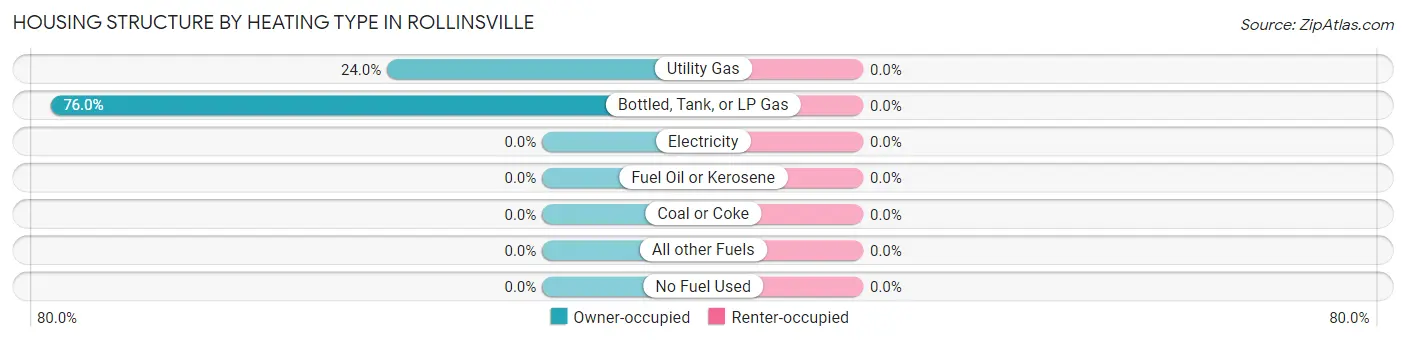
| Heating Type | Owner-occupied | Renter-occupied |
| Utility Gas | 29 (24.0%) | 0 (0.0%) |
| Bottled, Tank, or LP Gas | 92 (76.0%) | 0 (0.0%) |
| Electricity | 0 (0.0%) | 0 (0.0%) |
| Fuel Oil or Kerosene | 0 (0.0%) | 0 (0.0%) |
| Coal or Coke | 0 (0.0%) | 0 (0.0%) |
| All other Fuels | 0 (0.0%) | 0 (0.0%) |
| No Fuel Used | 0 (0.0%) | 0 (0.0%) |
| Total | 121 (100.0%) | 0 (0.0%) |
Household Vehicle Usage in Rollinsville
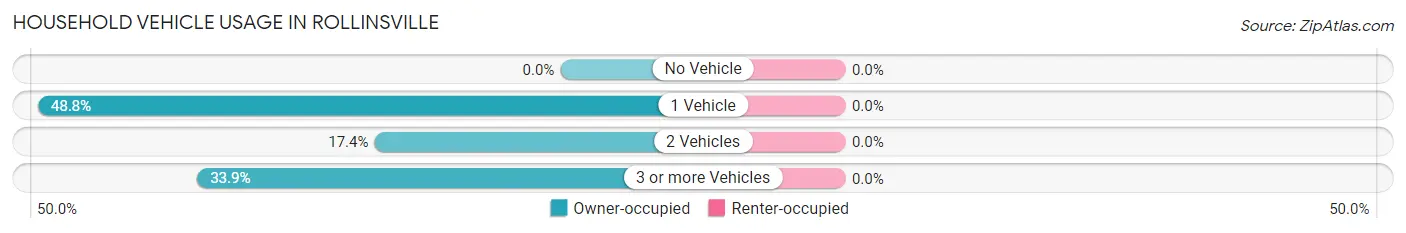
| Vehicles per Household | Owner-occupied | Renter-occupied |
| No Vehicle | 0 (0.0%) | 0 (0.0%) |
| 1 Vehicle | 59 (48.8%) | 0 (0.0%) |
| 2 Vehicles | 21 (17.4%) | 0 (0.0%) |
| 3 or more Vehicles | 41 (33.9%) | 0 (0.0%) |
| Total | 121 (100.0%) | 0 (0.0%) |
Real Estate & Mortgages in Rollinsville
Real Estate and Mortgage Overview in Rollinsville
| Characteristic | Without Mortgage | With Mortgage |
| Housing Units | 0 | 121 |
| Median Property Value | - | - |
| Median Household Income | - | - |
| Monthly Housing Costs | - | - |
| Real Estate Taxes | - | - |
Property Value by Mortgage Status in Rollinsville
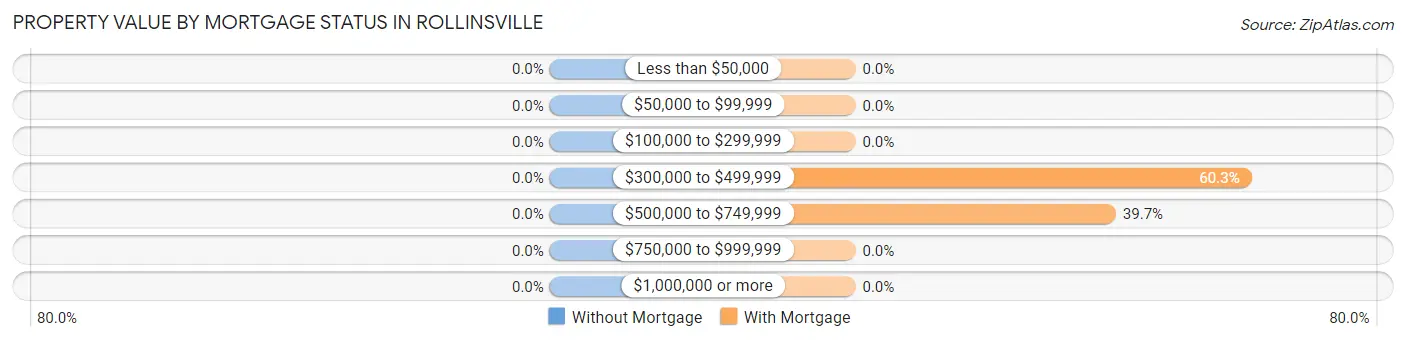
| Property Value | Without Mortgage | With Mortgage |
| Less than $50,000 | 0 (0.0%) | 0 (0.0%) |
| $50,000 to $99,999 | 0 (0.0%) | 0 (0.0%) |
| $100,000 to $299,999 | 0 (0.0%) | 0 (0.0%) |
| $300,000 to $499,999 | 0 (0.0%) | 73 (60.3%) |
| $500,000 to $749,999 | 0 (0.0%) | 48 (39.7%) |
| $750,000 to $999,999 | 0 (0.0%) | 0 (0.0%) |
| $1,000,000 or more | 0 (0.0%) | 0 (0.0%) |
| Total | 0 (0.0%) | 121 (100.0%) |
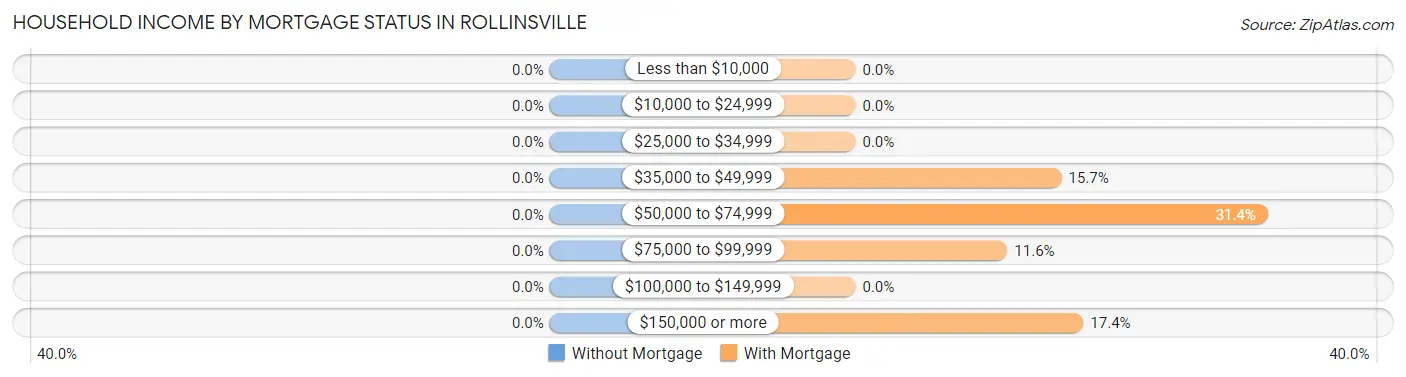
Household Income by Mortgage Status in Rollinsville
| Household Income | Without Mortgage | With Mortgage |
| Less than $10,000 | 0 (0.0%) | 0 (0.0%) |
| $10,000 to $24,999 | 0 (0.0%) | 0 (0.0%) |
| $25,000 to $34,999 | 0 (0.0%) | 0 (0.0%) |
| $35,000 to $49,999 | 0 (0.0%) | 19 (15.7%) |
| $50,000 to $74,999 | 0 (0.0%) | 38 (31.4%) |
| $75,000 to $99,999 | 0 (0.0%) | 14 (11.6%) |
| $100,000 to $149,999 | 0 (0.0%) | 0 (0.0%) |
| $150,000 or more | 0 (0.0%) | 21 (17.4%) |
| Total | 0 (0.0%) | 121 (100.0%) |
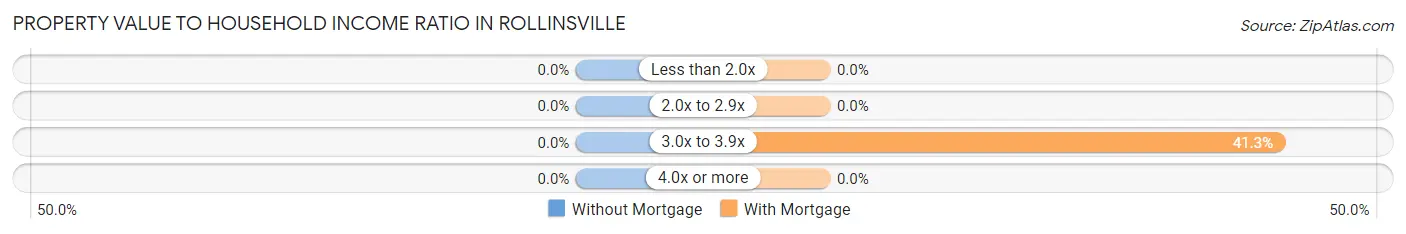
Property Value to Household Income Ratio in Rollinsville
| Value-to-Income Ratio | Without Mortgage | With Mortgage |
| Less than 2.0x | 0 (0.0%) | 0 (0.0%) |
| 2.0x to 2.9x | 0 (0.0%) | 0 (0.0%) |
| 3.0x to 3.9x | 0 (0.0%) | 50 (41.3%) |
| 4.0x or more | 0 (0.0%) | 0 (0.0%) |
| Total | 0 (0.0%) | 121 (100.0%) |
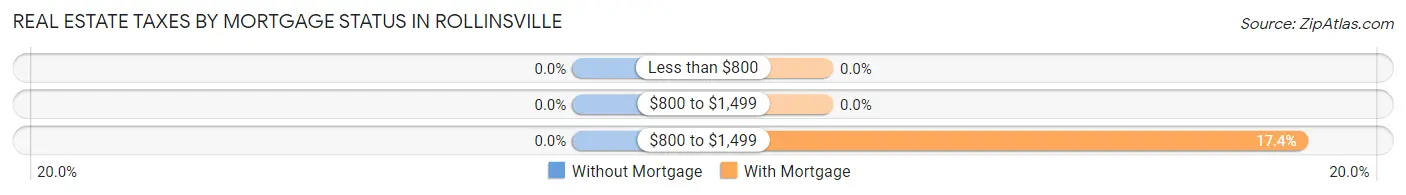
Real Estate Taxes by Mortgage Status in Rollinsville
| Property Taxes | Without Mortgage | With Mortgage |
| Less than $800 | 0 (0.0%) | 0 (0.0%) |
| $800 to $1,499 | 0 (0.0%) | 0 (0.0%) |
| $800 to $1,499 | 0 (0.0%) | 21 (17.4%) |
| Total | 0 (0.0%) | 121 (100.0%) |
Health & Disability in Rollinsville
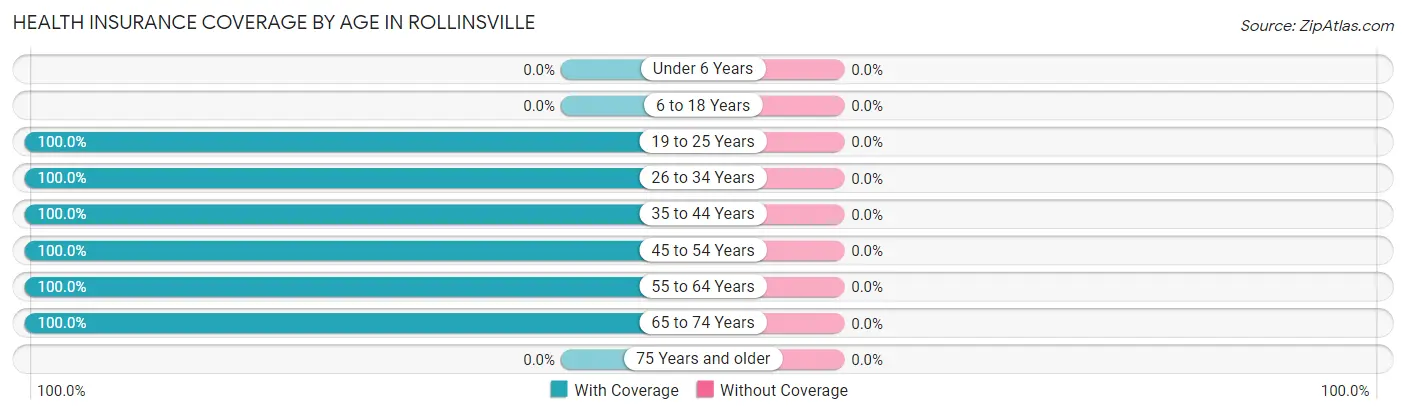
Health Insurance Coverage by Age in Rollinsville
| Age Bracket | With Coverage | Without Coverage |
| Under 6 Years | 0 (0.0%) | 0 (0.0%) |
| 6 to 18 Years | 0 (0.0%) | 0 (0.0%) |
| 19 to 25 Years | 19 (100.0%) | 0 (0.0%) |
| 26 to 34 Years | 38 (100.0%) | 0 (0.0%) |
| 35 to 44 Years | 25 (100.0%) | 0 (0.0%) |
| 45 to 54 Years | 38 (100.0%) | 0 (0.0%) |
| 55 to 64 Years | 19 (100.0%) | 0 (0.0%) |
| 65 to 74 Years | 50 (100.0%) | 0 (0.0%) |
| 75 Years and older | 0 (0.0%) | 0 (0.0%) |
| Total | 189 (100.0%) | 0 (0.0%) |
Health Insurance Coverage by Citizenship Status in Rollinsville
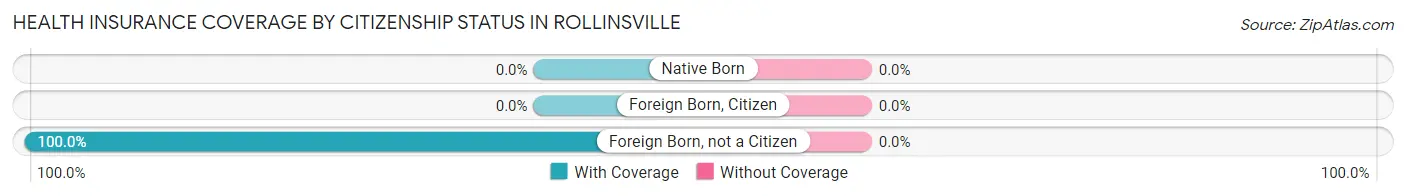
| Citizenship Status | With Coverage | Without Coverage |
| Native Born | 0 (0.0%) | 0 (0.0%) |
| Foreign Born, Citizen | 0 (0.0%) | 0 (0.0%) |
| Foreign Born, not a Citizen | 19 (100.0%) | 0 (0.0%) |
Health Insurance Coverage by Household Income in Rollinsville
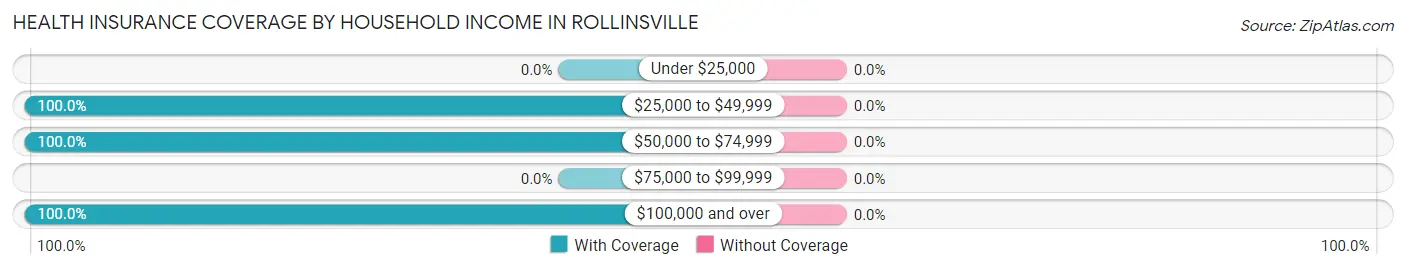
| Household Income | With Coverage | Without Coverage |
| Under $25,000 | 0 (0.0%) | 0 (0.0%) |
| $25,000 to $49,999 | 57 (100.0%) | 0 (0.0%) |
| $50,000 to $74,999 | 44 (100.0%) | 0 (0.0%) |
| $75,000 to $99,999 | 0 (0.0%) | 0 (0.0%) |
| $100,000 and over | 88 (100.0%) | 0 (0.0%) |
Public vs Private Health Insurance Coverage by Age in Rollinsville
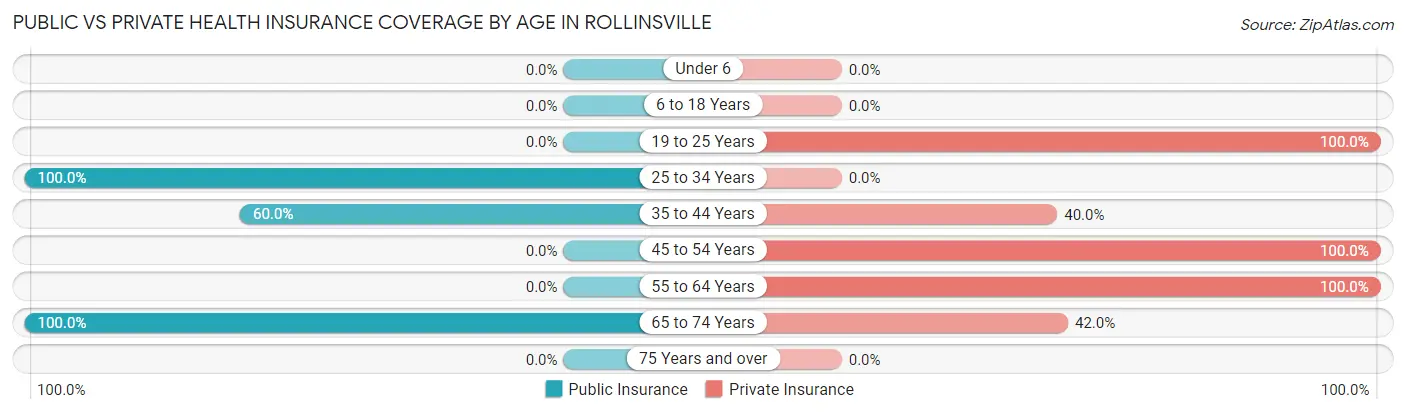
| Age Bracket | Public Insurance | Private Insurance |
| Under 6 | 0 (0.0%) | 0 (0.0%) |
| 6 to 18 Years | 0 (0.0%) | 0 (0.0%) |
| 19 to 25 Years | 0 (0.0%) | 19 (100.0%) |
| 25 to 34 Years | 38 (100.0%) | 0 (0.0%) |
| 35 to 44 Years | 15 (60.0%) | 10 (40.0%) |
| 45 to 54 Years | 0 (0.0%) | 38 (100.0%) |
| 55 to 64 Years | 0 (0.0%) | 19 (100.0%) |
| 65 to 74 Years | 50 (100.0%) | 21 (42.0%) |
| 75 Years and over | 0 (0.0%) | 0 (0.0%) |
| Total | 103 (54.5%) | 107 (56.6%) |
Disability Status by Sex by Age in Rollinsville
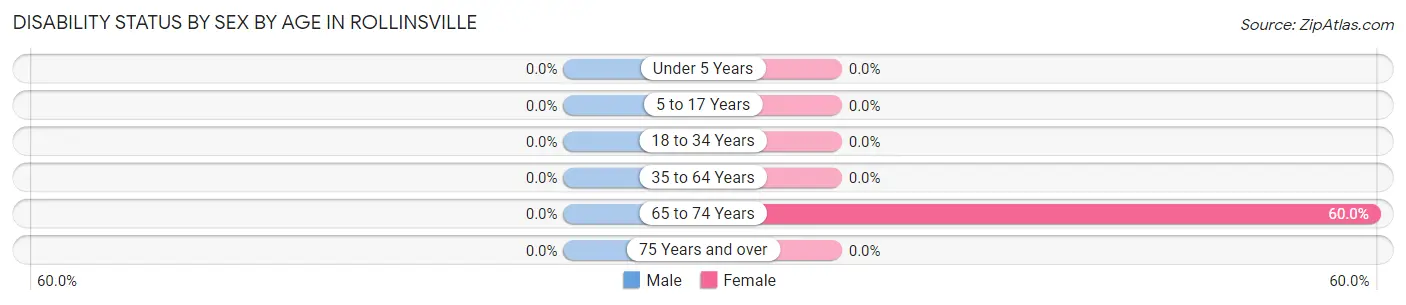
| Age Bracket | Male | Female |
| Under 5 Years | 0 (0.0%) | 0 (0.0%) |
| 5 to 17 Years | 0 (0.0%) | 0 (0.0%) |
| 18 to 34 Years | 0 (0.0%) | 0 (0.0%) |
| 35 to 64 Years | 0 (0.0%) | 0 (0.0%) |
| 65 to 74 Years | 0 (0.0%) | 21 (60.0%) |
| 75 Years and over | 0 (0.0%) | 0 (0.0%) |
Disability Class by Sex by Age in Rollinsville
Disability Class: Hearing Difficulty
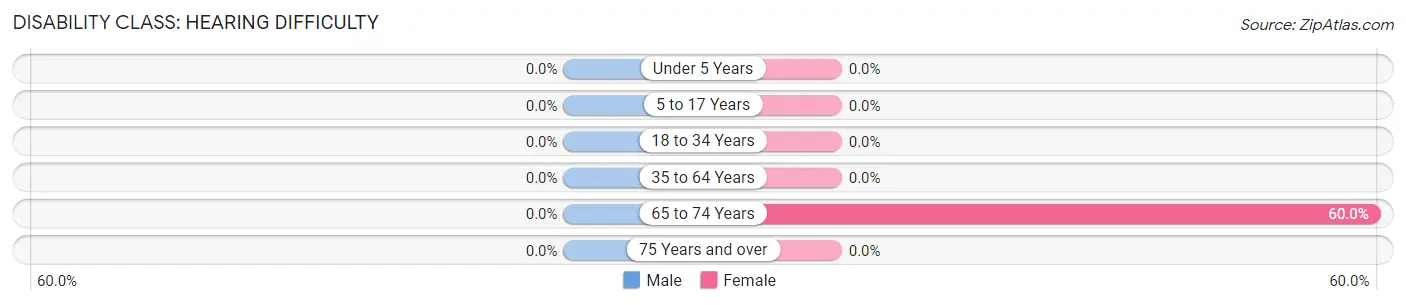
| Age Bracket | Male | Female |
| Under 5 Years | 0 (0.0%) | 0 (0.0%) |
| 5 to 17 Years | 0 (0.0%) | 0 (0.0%) |
| 18 to 34 Years | 0 (0.0%) | 0 (0.0%) |
| 35 to 64 Years | 0 (0.0%) | 0 (0.0%) |
| 65 to 74 Years | 0 (0.0%) | 21 (60.0%) |
| 75 Years and over | 0 (0.0%) | 0 (0.0%) |
Disability Class: Vision Difficulty
| Age Bracket | Male | Female |
| Under 5 Years | 0 (0.0%) | 0 (0.0%) |
| 5 to 17 Years | 0 (0.0%) | 0 (0.0%) |
| 18 to 34 Years | 0 (0.0%) | 0 (0.0%) |
| 35 to 64 Years | 0 (0.0%) | 0 (0.0%) |
| 65 to 74 Years | 0 (0.0%) | 0 (0.0%) |
| 75 Years and over | 0 (0.0%) | 0 (0.0%) |
Disability Class: Cognitive Difficulty
| Age Bracket | Male | Female |
| 5 to 17 Years | 0 (0.0%) | 0 (0.0%) |
| 18 to 34 Years | 0 (0.0%) | 0 (0.0%) |
| 35 to 64 Years | 0 (0.0%) | 0 (0.0%) |
| 65 to 74 Years | 0 (0.0%) | 0 (0.0%) |
| 75 Years and over | 0 (0.0%) | 0 (0.0%) |
Disability Class: Ambulatory Difficulty
| Age Bracket | Male | Female |
| 5 to 17 Years | 0 (0.0%) | 0 (0.0%) |
| 18 to 34 Years | 0 (0.0%) | 0 (0.0%) |
| 35 to 64 Years | 0 (0.0%) | 0 (0.0%) |
| 65 to 74 Years | 0 (0.0%) | 0 (0.0%) |
| 75 Years and over | 0 (0.0%) | 0 (0.0%) |
Disability Class: Self-Care Difficulty
| Age Bracket | Male | Female |
| 5 to 17 Years | 0 (0.0%) | 0 (0.0%) |
| 18 to 34 Years | 0 (0.0%) | 0 (0.0%) |
| 35 to 64 Years | 0 (0.0%) | 0 (0.0%) |
| 65 to 74 Years | 0 (0.0%) | 0 (0.0%) |
| 75 Years and over | 0 (0.0%) | 0 (0.0%) |
Technology Access in Rollinsville
Computing Device Access in Rollinsville
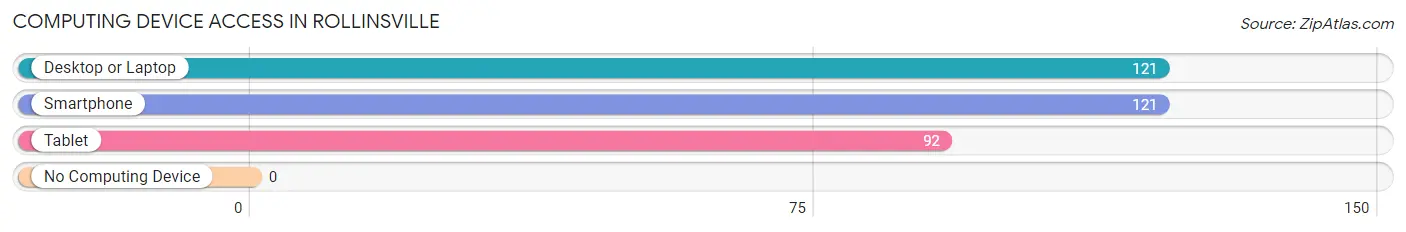
| Device Type | # Households | % Households |
| Desktop or Laptop | 121 | 100.0% |
| Smartphone | 121 | 100.0% |
| Tablet | 92 | 76.0% |
| No Computing Device | 0 | 0.0% |
| Total | 121 | 100.0% |
Internet Access in Rollinsville
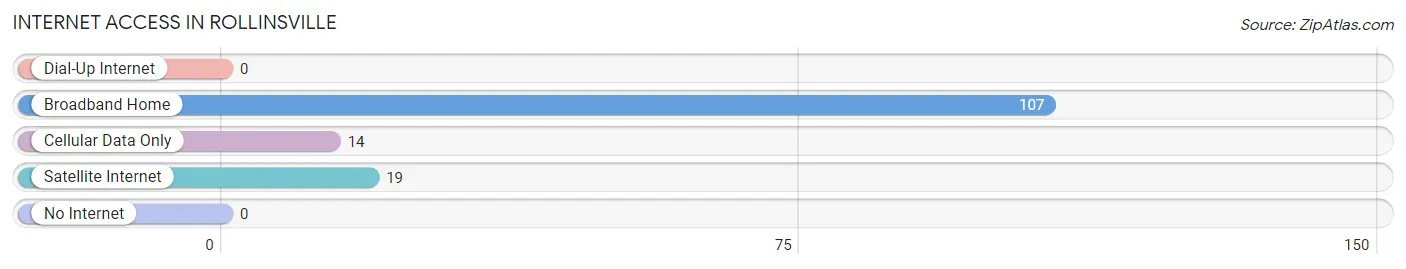
| Internet Type | # Households | % Households |
| Dial-Up Internet | 0 | 0.0% |
| Broadband Home | 107 | 88.4% |
| Cellular Data Only | 14 | 11.6% |
| Satellite Internet | 19 | 15.7% |
| No Internet | 0 | 0.0% |
| Total | 121 | 100.0% |
Rollinsville Summary
Rollinsville, Colorado is a small unincorporated community located in Gilpin County, Colorado. It is situated in the foothills of the Rocky Mountains, approximately 30 miles west of Denver. The town is located along the South Platte River and is surrounded by the Arapaho National Forest. Rollinsville is a popular destination for outdoor recreation, including camping, fishing, hiking, and mountain biking.
History
Rollinsville was founded in 1859 by prospectors looking for gold. The town was named after John Rollins, who was one of the first settlers in the area. The town quickly grew and by the late 1800s, it had become a bustling mining town. The town was home to several mines, including the Rollinsville Mine, which was one of the largest gold mines in the area. The town also had a post office, a school, and several stores.
In the early 1900s, the mining industry began to decline and the town’s population began to dwindle. By the 1950s, the town was nearly abandoned. In the 1970s, the town was rediscovered by outdoor enthusiasts and began to experience a resurgence. Today, Rollinsville is a popular destination for outdoor recreation and is home to several businesses, including restaurants, lodging, and a general store.
Geography
Rollinsville is located in the foothills of the Rocky Mountains, approximately 30 miles west of Denver. The town is situated along the South Platte River and is surrounded by the Arapaho National Forest. The town is located at an elevation of 8,000 feet and has a total area of 0.6 square miles. The climate in Rollinsville is mild and temperate, with warm summers and cold winters.
Economy
The economy of Rollinsville is largely based on tourism and outdoor recreation. The town is a popular destination for camping, fishing, hiking, and mountain biking. There are several businesses in town, including restaurants, lodging, and a general store. The town is also home to several small farms and ranches.
Demographics
As of the 2010 census, the population of Rollinsville was 545. The town is predominantly white, with 95.3% of the population identifying as white. The median household income in Rollinsville is $50,000, and the median age is 44. The town has a low unemployment rate of 3.2%.
Conclusion
Rollinsville, Colorado is a small unincorporated community located in Gilpin County, Colorado. It is situated in the foothills of the Rocky Mountains, approximately 30 miles west of Denver. The town is a popular destination for outdoor recreation, including camping, fishing, hiking, and mountain biking. The economy of Rollinsville is largely based on tourism and outdoor recreation, and the town is home to several businesses, including restaurants, lodging, and a general store. As of the 2010 census, the population of Rollinsville was 545. The town is predominantly white, with 95.3% of the population identifying as white.
Common Questions
What is Per Capita Income in Rollinsville?
Per Capita income in Rollinsville is $57,820.
What is the Median Family Income in Rollinsville?
Median Family Income in Rollinsville is $195,893.
What is Inequality or Gini Index in Rollinsville?
Inequality or Gini Index in Rollinsville is 0.40.
What is the Total Population of Rollinsville?
Total Population of Rollinsville is 189.
What is the Total Male Population of Rollinsville?
Total Male Population of Rollinsville is 71.
What is the Total Female Population of Rollinsville?
Total Female Population of Rollinsville is 118.
What is the Ratio of Males per 100 Females in Rollinsville?
There are 60.17 Males per 100 Females in Rollinsville.
What is the Ratio of Females per 100 Males in Rollinsville?
There are 166.20 Females per 100 Males in Rollinsville.
What is the Median Population Age in Rollinsville?
Median Population Age in Rollinsville is 48.2 Years.
What is the Average Family Size in Rollinsville
Average Family Size in Rollinsville is 2.6 People.
What is the Average Household Size in Rollinsville
Average Household Size in Rollinsville is 1.6 People.
How Large is the Labor Force in Rollinsville?
There are 160 People in the Labor Forcein in Rollinsville.
What is the Percentage of People in the Labor Force in Rollinsville?
84.7% of People are in the Labor Force in Rollinsville.