Rifle, CO Map & Demographics
Rifle Map
Rifle Overview
$30,798
PER CAPITA INCOME
$77,414
AVG FAMILY INCOME
$72,955
AVG HOUSEHOLD INCOME
33.2%
WAGE / INCOME GAP [ % ]
66.8¢/ $1
WAGE / INCOME GAP [ $ ]
0.35
INEQUALITY / GINI INDEX
10,420
TOTAL POPULATION
5,065
MALE POPULATION
5,355
FEMALE POPULATION
94.58
MALES / 100 FEMALES
105.73
FEMALES / 100 MALES
32.1
MEDIAN AGE
3.3
AVG FAMILY SIZE
2.8
AVG HOUSEHOLD SIZE
6,002
LABOR FORCE [ PEOPLE ]
77.9%
PERCENT IN LABOR FORCE
4.0%
UNEMPLOYMENT RATE
Rifle Zip Codes
Rifle Area Codes
Income in Rifle
Income Overview in Rifle
Per Capita Income in Rifle is $30,798, while median incomes of families and households are $77,414 and $72,955 respectively.
| Characteristic | Number | Measure |
| Per Capita Income | 10,420 | $30,798 |
| Median Family Income | 2,718 | $77,414 |
| Mean Family Income | 2,718 | $90,572 |
| Median Household Income | 3,615 | $72,955 |
| Mean Household Income | 3,615 | $83,044 |
| Income Deficit | 2,718 | $0 |
| Wage / Income Gap (%) | 10,420 | 33.17% |
| Wage / Income Gap ($) | 10,420 | 66.83¢ per $1 |
| Gini / Inequality Index | 10,420 | 0.35 |
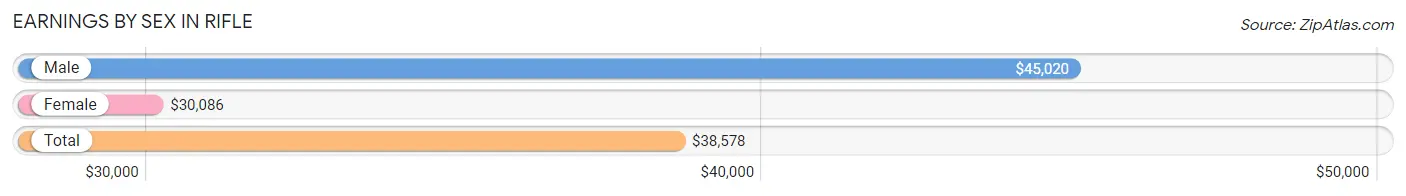
Earnings by Sex in Rifle
Average Earnings in Rifle are $38,578, $45,020 for men and $30,086 for women, a difference of 33.2%.
| Sex | Number | Average Earnings |
| Male | 3,451 (56.5%) | $45,020 |
| Female | 2,653 (43.5%) | $30,086 |
| Total | 6,104 (100.0%) | $38,578 |
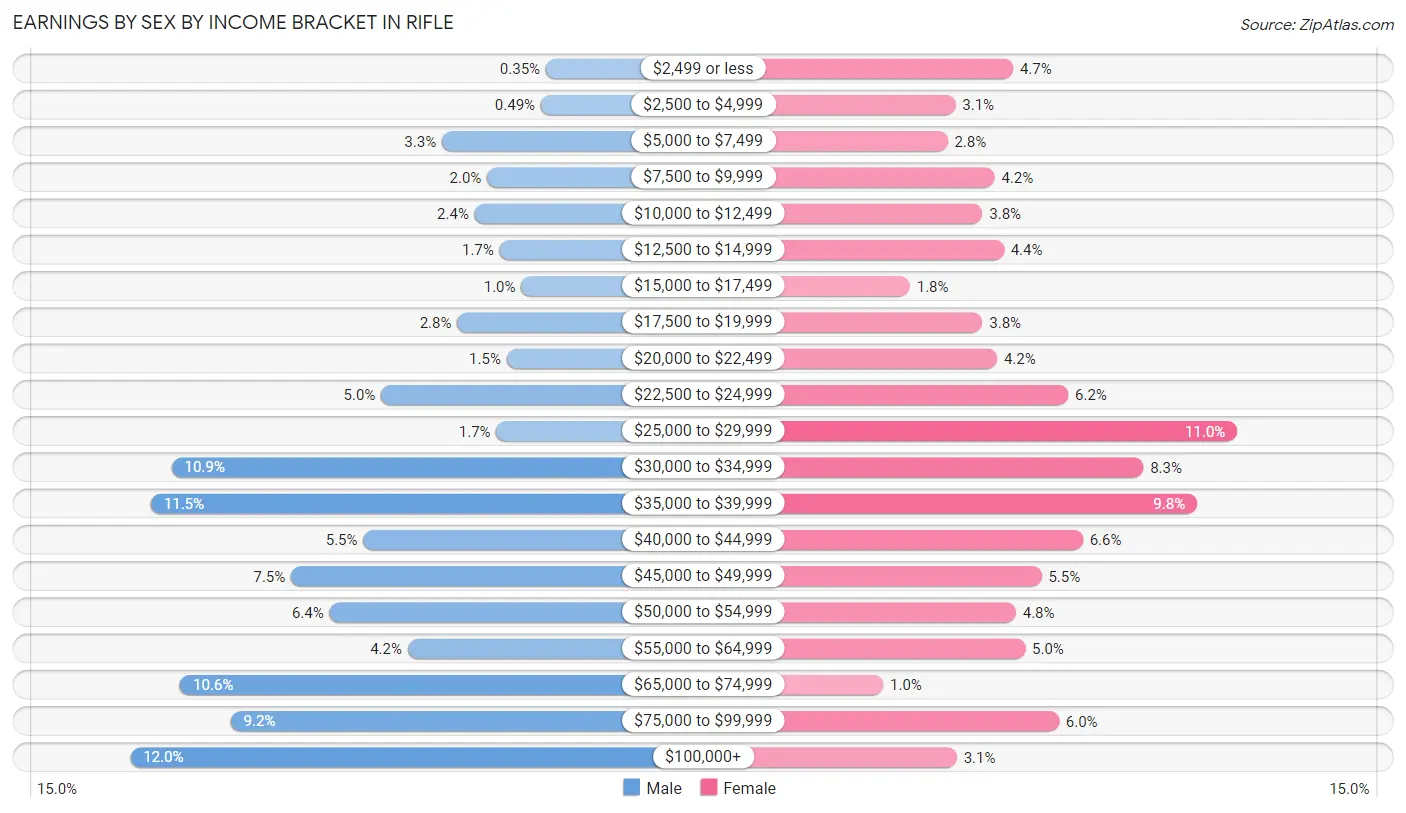
Earnings by Sex by Income Bracket in Rifle
The most common earnings brackets in Rifle are $100,000+ for men (415 | 12.0%) and $25,000 to $29,999 for women (291 | 11.0%).
| Income | Male | Female |
| $2,499 or less | 12 (0.4%) | 124 (4.7%) |
| $2,500 to $4,999 | 17 (0.5%) | 81 (3.0%) |
| $5,000 to $7,499 | 113 (3.3%) | 75 (2.8%) |
| $7,500 to $9,999 | 69 (2.0%) | 110 (4.2%) |
| $10,000 to $12,499 | 81 (2.4%) | 101 (3.8%) |
| $12,500 to $14,999 | 57 (1.7%) | 117 (4.4%) |
| $15,000 to $17,499 | 36 (1.0%) | 47 (1.8%) |
| $17,500 to $19,999 | 98 (2.8%) | 101 (3.8%) |
| $20,000 to $22,499 | 50 (1.5%) | 112 (4.2%) |
| $22,500 to $24,999 | 172 (5.0%) | 165 (6.2%) |
| $25,000 to $29,999 | 60 (1.7%) | 291 (11.0%) |
| $30,000 to $34,999 | 375 (10.9%) | 221 (8.3%) |
| $35,000 to $39,999 | 395 (11.5%) | 261 (9.8%) |
| $40,000 to $44,999 | 189 (5.5%) | 176 (6.6%) |
| $45,000 to $49,999 | 259 (7.5%) | 145 (5.5%) |
| $50,000 to $54,999 | 222 (6.4%) | 126 (4.8%) |
| $55,000 to $64,999 | 146 (4.2%) | 133 (5.0%) |
| $65,000 to $74,999 | 367 (10.6%) | 27 (1.0%) |
| $75,000 to $99,999 | 318 (9.2%) | 158 (6.0%) |
| $100,000+ | 415 (12.0%) | 82 (3.1%) |
| Total | 3,451 (100.0%) | 2,653 (100.0%) |
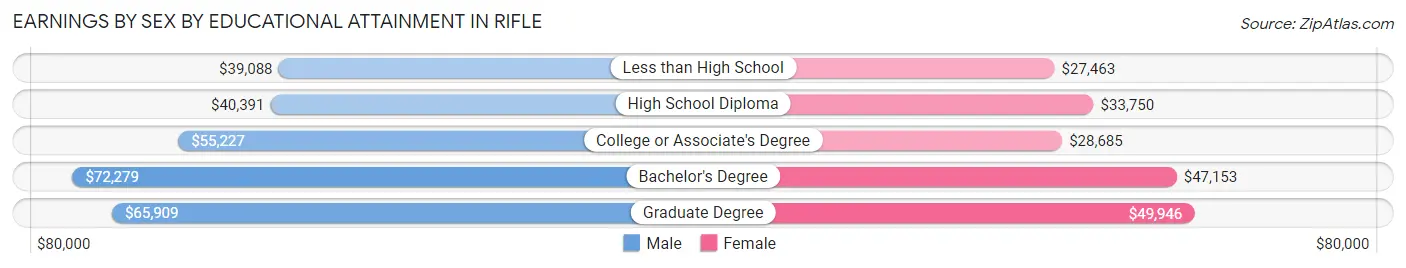
Earnings by Sex by Educational Attainment in Rifle
Average earnings in Rifle are $47,373 for men and $33,066 for women, a difference of 30.2%. Men with an educational attainment of bachelor's degree enjoy the highest average annual earnings of $72,279, while those with less than high school education earn the least with $39,088. Women with an educational attainment of graduate degree earn the most with the average annual earnings of $49,946, while those with less than high school education have the smallest earnings of $27,463.
| Educational Attainment | Male Income | Female Income |
| Less than High School | $39,088 | $27,463 |
| High School Diploma | $40,391 | $33,750 |
| College or Associate's Degree | $55,227 | $28,685 |
| Bachelor's Degree | $72,279 | $47,153 |
| Graduate Degree | $65,909 | $49,946 |
| Total | $47,373 | $33,066 |
Family Income in Rifle
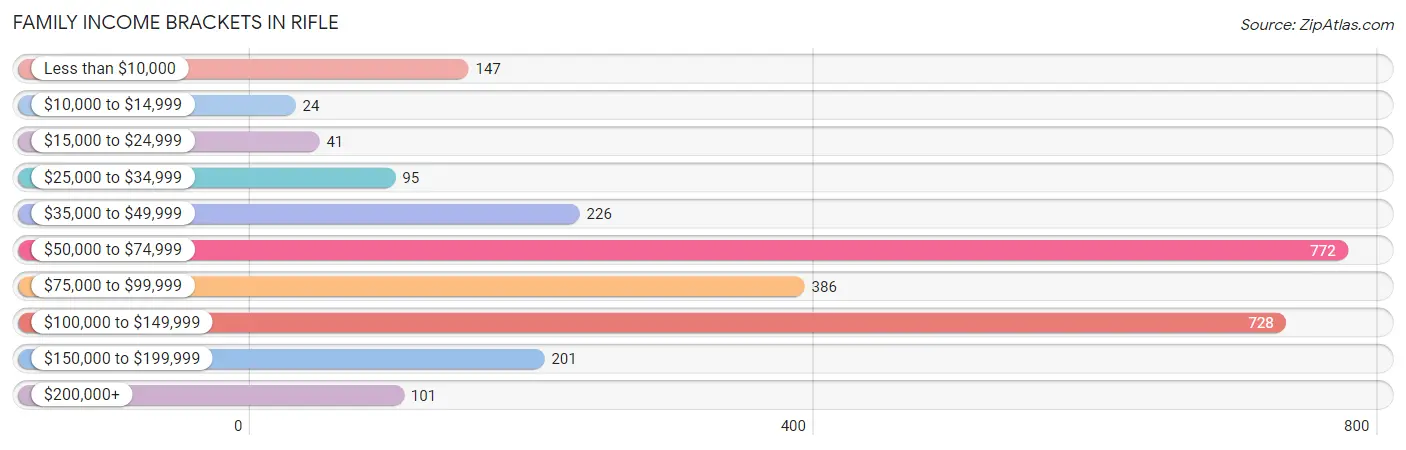
Family Income Brackets in Rifle
According to the Rifle family income data, there are 772 families falling into the $50,000 to $74,999 income range, which is the most common income bracket and makes up 28.4% of all families. Conversely, the $10,000 to $14,999 income bracket is the least frequent group with only 24 families (0.9%) belonging to this category.
| Income Bracket | # Families | % Families |
| Less than $10,000 | 147 | 5.4% |
| $10,000 to $14,999 | 24 | 0.9% |
| $15,000 to $24,999 | 41 | 1.5% |
| $25,000 to $34,999 | 95 | 3.5% |
| $35,000 to $49,999 | 226 | 8.3% |
| $50,000 to $74,999 | 772 | 28.4% |
| $75,000 to $99,999 | 386 | 14.2% |
| $100,000 to $149,999 | 728 | 26.8% |
| $150,000 to $199,999 | 201 | 7.4% |
| $200,000+ | 101 | 3.7% |
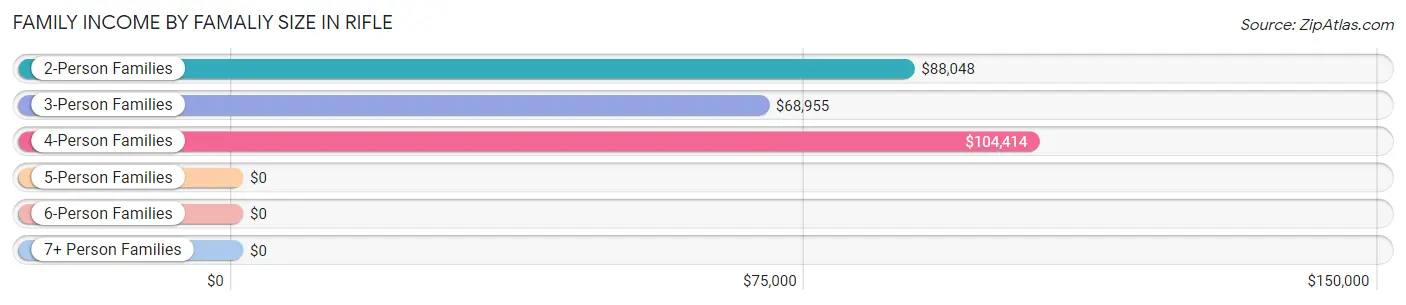
Family Income by Famaliy Size in Rifle
4-person families (470 | 17.3%) account for the highest median family income in Rifle with $104,414 per family, while 2-person families (1,159 | 42.6%) have the highest median income of $44,024 per family member.
| Income Bracket | # Families | Median Income |
| 2-Person Families | 1,159 (42.6%) | $88,048 |
| 3-Person Families | 870 (32.0%) | $68,955 |
| 4-Person Families | 470 (17.3%) | $104,414 |
| 5-Person Families | 75 (2.8%) | $0 |
| 6-Person Families | 105 (3.9%) | $0 |
| 7+ Person Families | 39 (1.4%) | $0 |
| Total | 2,718 (100.0%) | $77,414 |
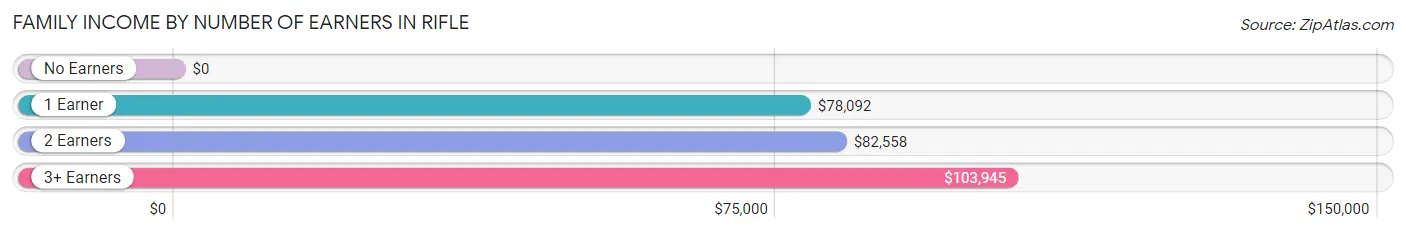
Family Income by Number of Earners in Rifle
| Number of Earners | # Families | Median Income |
| No Earners | 186 (6.8%) | $0 |
| 1 Earner | 538 (19.8%) | $78,092 |
| 2 Earners | 1,774 (65.3%) | $82,558 |
| 3+ Earners | 220 (8.1%) | $103,945 |
| Total | 2,718 (100.0%) | $77,414 |
Household Income in Rifle
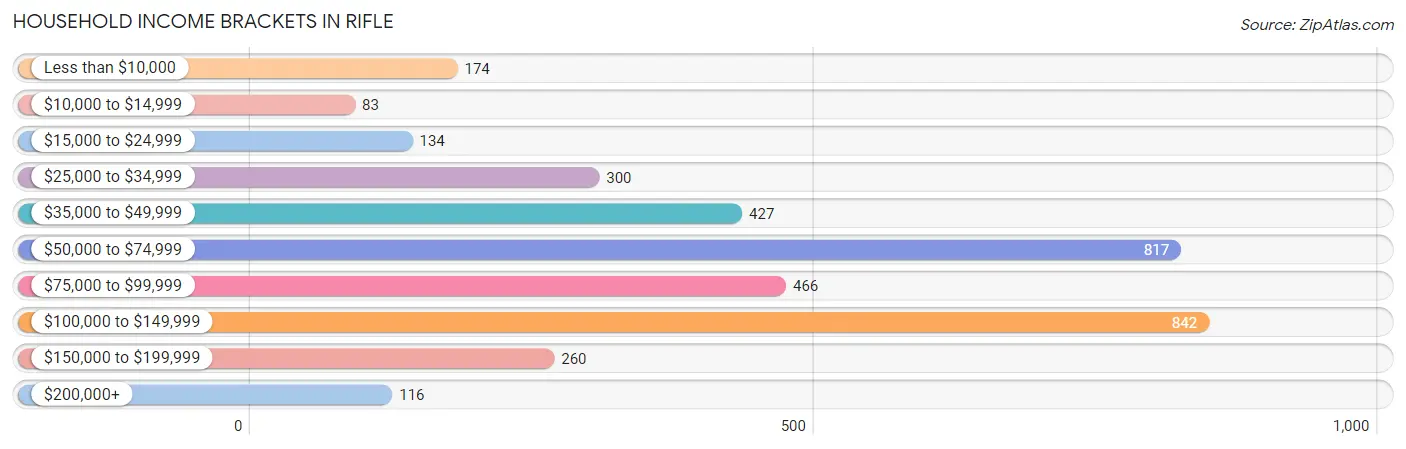
Household Income Brackets in Rifle
With 842 households falling in the category, the $100,000 to $149,999 income range is the most frequent in Rifle, accounting for 23.3% of all households. In contrast, only 83 households (2.3%) fall into the $10,000 to $14,999 income bracket, making it the least populous group.
| Income Bracket | # Households | % Households |
| Less than $10,000 | 174 | 4.8% |
| $10,000 to $14,999 | 83 | 2.3% |
| $15,000 to $24,999 | 134 | 3.7% |
| $25,000 to $34,999 | 300 | 8.3% |
| $35,000 to $49,999 | 427 | 11.8% |
| $50,000 to $74,999 | 817 | 22.6% |
| $75,000 to $99,999 | 466 | 12.9% |
| $100,000 to $149,999 | 842 | 23.3% |
| $150,000 to $199,999 | 260 | 7.2% |
| $200,000+ | 116 | 3.2% |
Household Income by Householder Age in Rifle
The median household income in Rifle is $72,955, with the highest median household income of $91,534 found in the 25 to 44 years age bracket for the primary householder. A total of 1,323 households (36.6%) fall into this category. Meanwhile, the 65+ years age bracket for the primary householder has the lowest median household income of $52,198, with 525 households (14.5%) in this group.
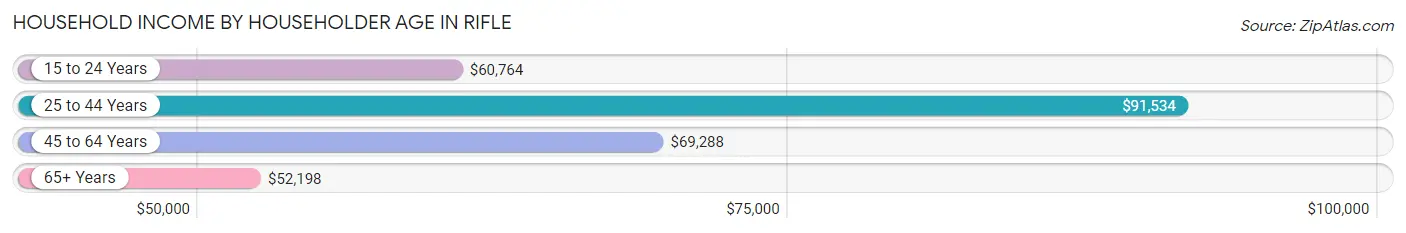
| Income Bracket | # Households | Median Income |
| 15 to 24 Years | 379 (10.5%) | $60,764 |
| 25 to 44 Years | 1,323 (36.6%) | $91,534 |
| 45 to 64 Years | 1,388 (38.4%) | $69,288 |
| 65+ Years | 525 (14.5%) | $52,198 |
| Total | 3,615 (100.0%) | $72,955 |
Poverty in Rifle
Income Below Poverty by Sex and Age in Rifle
With 2.8% poverty level for males and 7.7% for females among the residents of Rifle, 6 to 11 year old males and 45 to 54 year old females are the most vulnerable to poverty, with 78 males (15.7%) and 130 females (23.5%) in their respective age groups living below the poverty level.
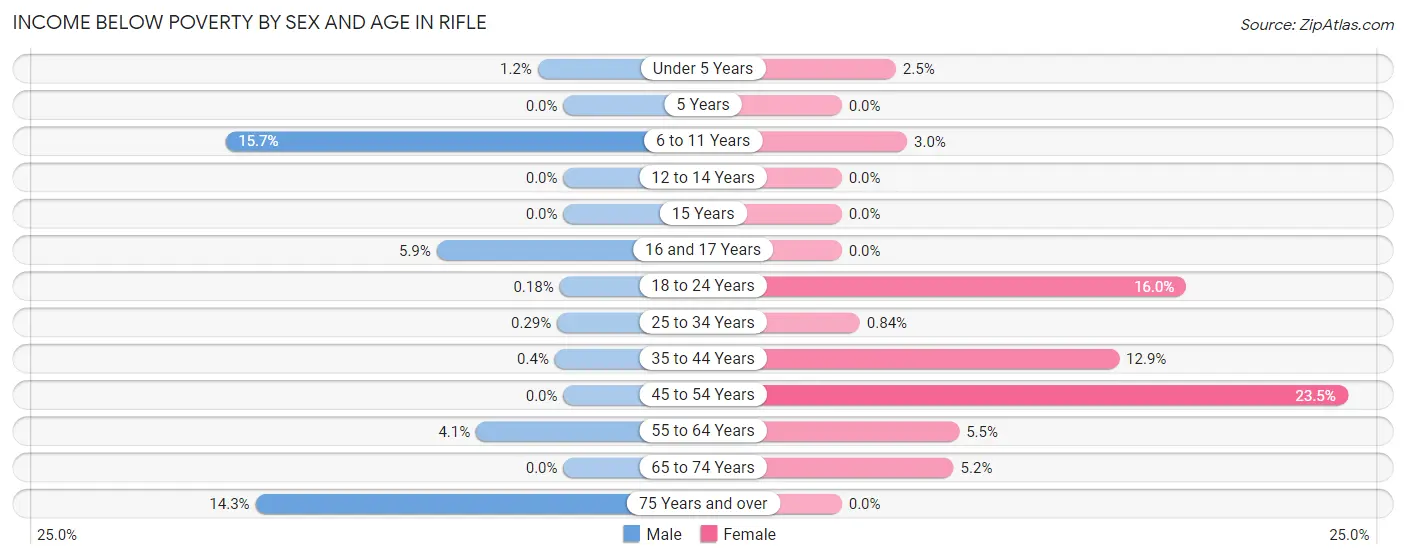
| Age Bracket | Male | Female |
| Under 5 Years | 6 (1.2%) | 9 (2.5%) |
| 5 Years | 0 (0.0%) | 0 (0.0%) |
| 6 to 11 Years | 78 (15.7%) | 17 (3.0%) |
| 12 to 14 Years | 0 (0.0%) | 0 (0.0%) |
| 15 Years | 0 (0.0%) | 0 (0.0%) |
| 16 and 17 Years | 10 (5.9%) | 0 (0.0%) |
| 18 to 24 Years | 1 (0.2%) | 121 (16.0%) |
| 25 to 34 Years | 2 (0.3%) | 6 (0.8%) |
| 35 to 44 Years | 3 (0.4%) | 78 (12.9%) |
| 45 to 54 Years | 0 (0.0%) | 130 (23.5%) |
| 55 to 64 Years | 22 (4.1%) | 31 (5.4%) |
| 65 to 74 Years | 0 (0.0%) | 14 (5.2%) |
| 75 Years and over | 17 (14.3%) | 0 (0.0%) |
| Total | 139 (2.8%) | 406 (7.7%) |
Income Above Poverty by Sex and Age in Rifle
According to the poverty statistics in Rifle, males aged 5 years and females aged 5 years are the age groups that are most secure financially, with 100.0% of males and 100.0% of females in these age groups living above the poverty line.
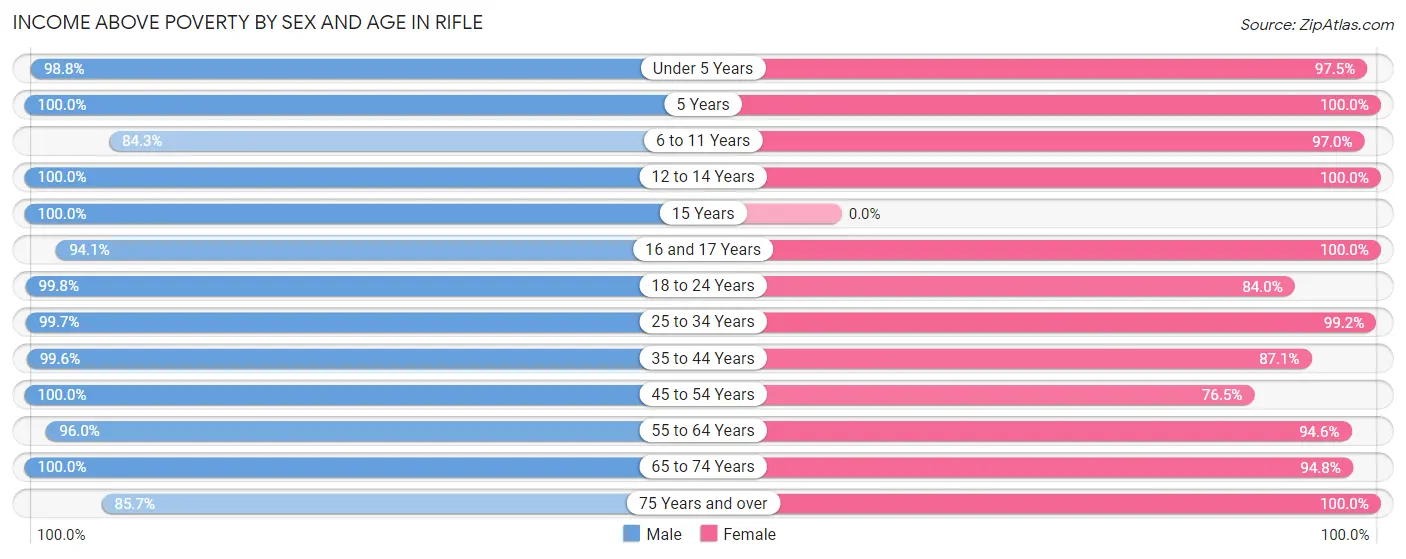
| Age Bracket | Male | Female |
| Under 5 Years | 498 (98.8%) | 349 (97.5%) |
| 5 Years | 24 (100.0%) | 321 (100.0%) |
| 6 to 11 Years | 419 (84.3%) | 544 (97.0%) |
| 12 to 14 Years | 190 (100.0%) | 251 (100.0%) |
| 15 Years | 9 (100.0%) | 0 (0.0%) |
| 16 and 17 Years | 160 (94.1%) | 135 (100.0%) |
| 18 to 24 Years | 540 (99.8%) | 636 (84.0%) |
| 25 to 34 Years | 678 (99.7%) | 709 (99.2%) |
| 35 to 44 Years | 738 (99.6%) | 528 (87.1%) |
| 45 to 54 Years | 689 (100.0%) | 424 (76.5%) |
| 55 to 64 Years | 521 (96.0%) | 538 (94.6%) |
| 65 to 74 Years | 300 (100.0%) | 256 (94.8%) |
| 75 Years and over | 102 (85.7%) | 194 (100.0%) |
| Total | 4,868 (97.2%) | 4,885 (92.3%) |
Income Below Poverty Among Married-Couple Families in Rifle
The poverty statistics for married-couple families in Rifle show that 1.2% or 25 of the total 2,164 families live below the poverty line. Families with no children have the highest poverty rate of 2.7%, comprising of 25 families. On the other hand, families with 1 or 2 children have the lowest poverty rate of 0.0%, which includes 0 families.
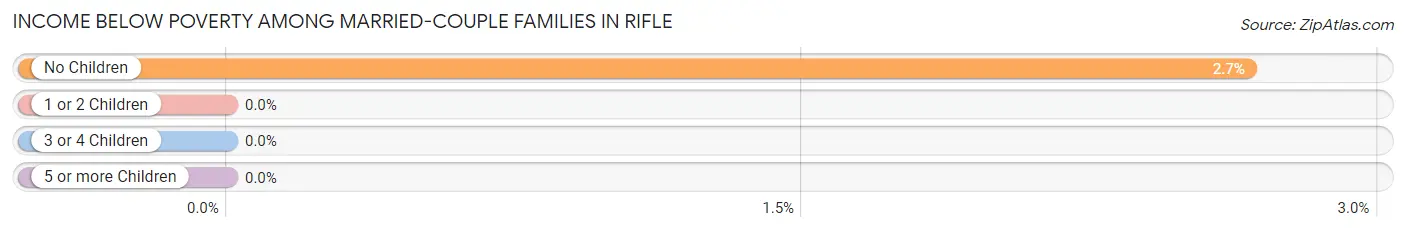
| Children | Above Poverty | Below Poverty |
| No Children | 914 (97.3%) | 25 (2.7%) |
| 1 or 2 Children | 1,078 (100.0%) | 0 (0.0%) |
| 3 or 4 Children | 147 (100.0%) | 0 (0.0%) |
| 5 or more Children | 0 (0.0%) | 0 (0.0%) |
| Total | 2,139 (98.8%) | 25 (1.2%) |
Income Below Poverty Among Single-Parent Households in Rifle
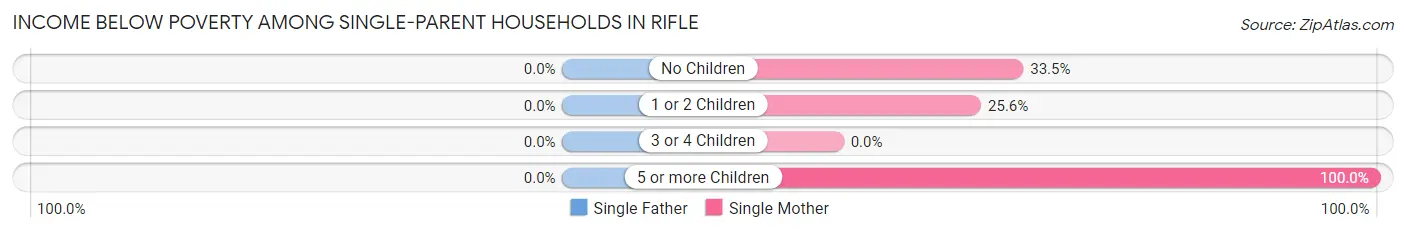
| Children | Single Father | Single Mother |
| No Children | 0 (0.0%) | 91 (33.5%) |
| 1 or 2 Children | 0 (0.0%) | 53 (25.6%) |
| 3 or 4 Children | 0 (0.0%) | 0 (0.0%) |
| 5 or more Children | 0 (0.0%) | 6 (100.0%) |
| Total | 0 (0.0%) | 150 (30.1%) |
Income Below Poverty Among Married-Couple vs Single-Parent Households in Rifle
The poverty data for Rifle shows that 25 of the married-couple family households (1.2%) and 150 of the single-parent households (27.1%) are living below the poverty level. Within the married-couple family households, those with no children have the highest poverty rate, with 25 households (2.7%) falling below the poverty line. Among the single-parent households, those with 5 or more children have the highest poverty rate, with 6 household (100.0%) living below poverty.
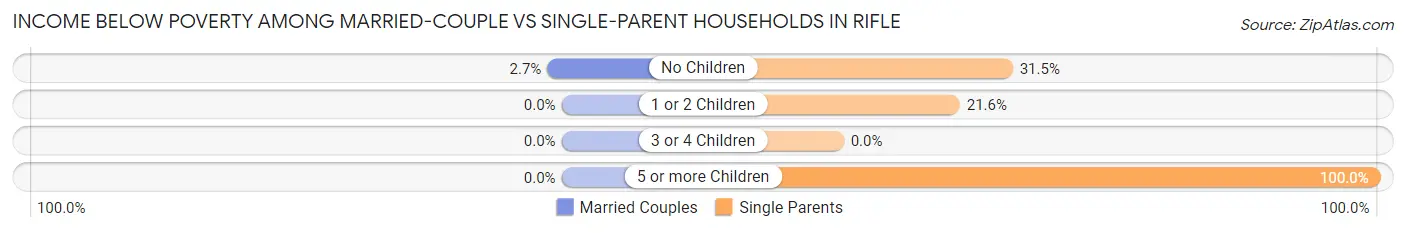
| Children | Married-Couple Families | Single-Parent Households |
| No Children | 25 (2.7%) | 91 (31.5%) |
| 1 or 2 Children | 0 (0.0%) | 53 (21.6%) |
| 3 or 4 Children | 0 (0.0%) | 0 (0.0%) |
| 5 or more Children | 0 (0.0%) | 6 (100.0%) |
| Total | 25 (1.2%) | 150 (27.1%) |
Race in Rifle
The most populous races in Rifle are White / Caucasian (8,044 | 77.2%), Hispanic or Latino (4,110 | 39.4%), and Two or more Races (1,573 | 15.1%).
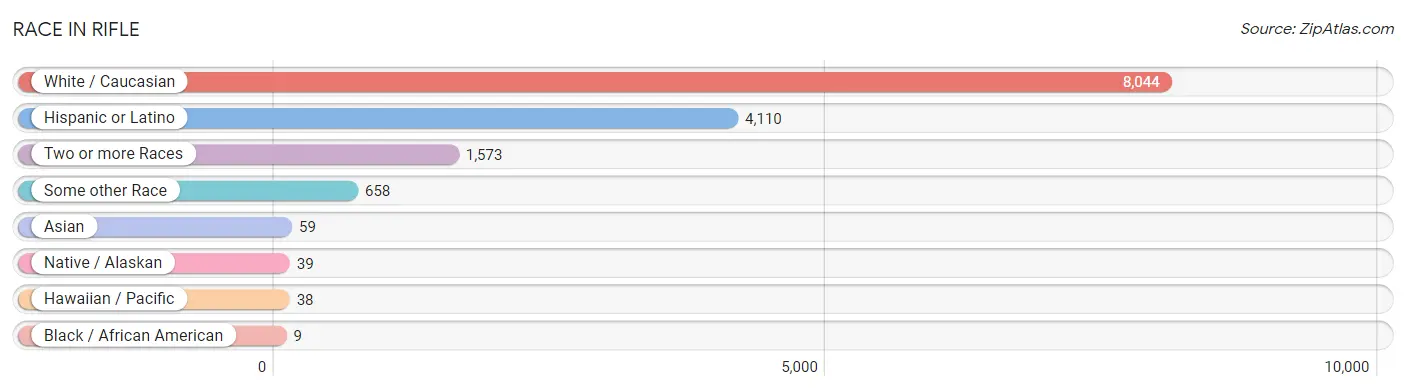
| Race | # Population | % Population |
| Asian | 59 | 0.6% |
| Black / African American | 9 | 0.1% |
| Hawaiian / Pacific | 38 | 0.4% |
| Hispanic or Latino | 4,110 | 39.4% |
| Native / Alaskan | 39 | 0.4% |
| White / Caucasian | 8,044 | 77.2% |
| Two or more Races | 1,573 | 15.1% |
| Some other Race | 658 | 6.3% |
| Total | 10,420 | 100.0% |
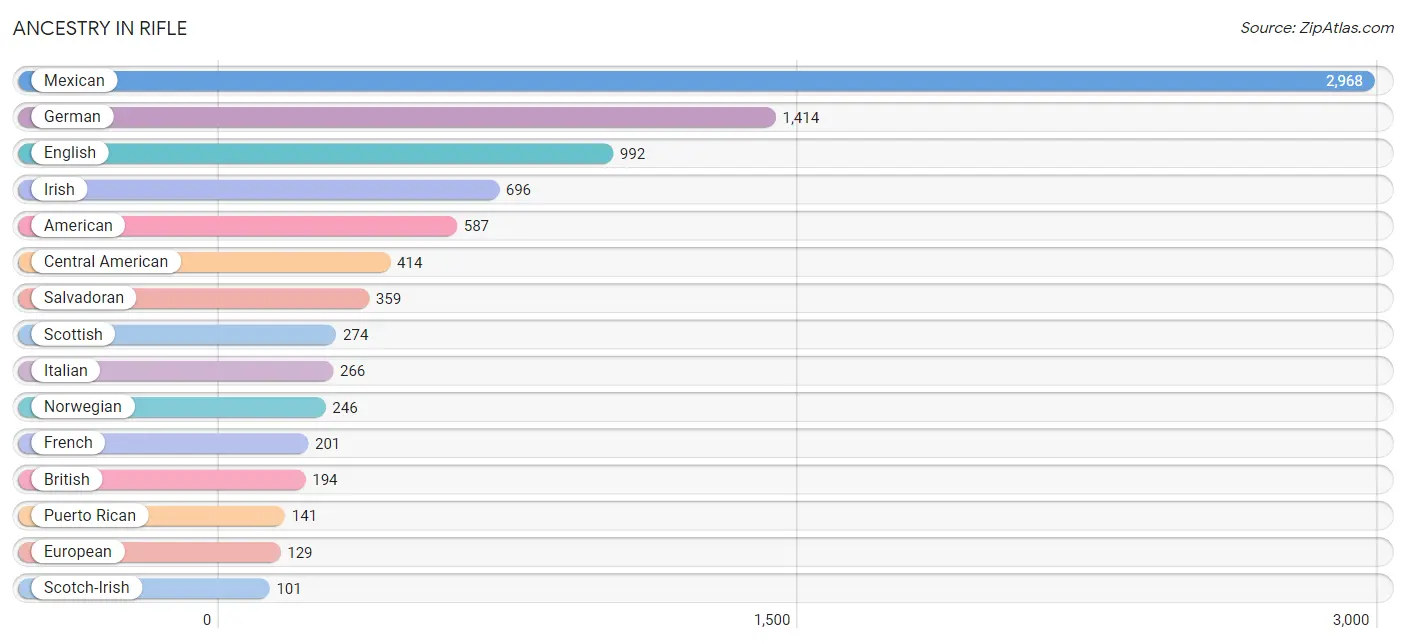
Ancestry in Rifle
The most populous ancestries reported in Rifle are Mexican (2,968 | 28.5%), German (1,414 | 13.6%), English (992 | 9.5%), Irish (696 | 6.7%), and American (587 | 5.6%), together accounting for 63.9% of all Rifle residents.
| Ancestry | # Population | % Population |
| Afghan | 30 | 0.3% |
| American | 587 | 5.6% |
| Apache | 22 | 0.2% |
| Arab | 45 | 0.4% |
| British | 194 | 1.9% |
| Central American | 414 | 4.0% |
| Central American Indian | 17 | 0.2% |
| Cherokee | 76 | 0.7% |
| Czech | 67 | 0.6% |
| Czechoslovakian | 23 | 0.2% |
| Ecuadorian | 42 | 0.4% |
| English | 992 | 9.5% |
| European | 129 | 1.2% |
| Finnish | 15 | 0.1% |
| French | 201 | 1.9% |
| French Canadian | 51 | 0.5% |
| German | 1,414 | 13.6% |
| Guatemalan | 55 | 0.5% |
| Hungarian | 21 | 0.2% |
| Icelander | 15 | 0.1% |
| Indian (Asian) | 99 | 0.9% |
| Irish | 696 | 6.7% |
| Italian | 266 | 2.5% |
| Korean | 29 | 0.3% |
| Lebanese | 22 | 0.2% |
| Lithuanian | 61 | 0.6% |
| Mexican | 2,968 | 28.5% |
| Mexican American Indian | 25 | 0.2% |
| Native Hawaiian | 38 | 0.4% |
| Norwegian | 246 | 2.4% |
| Polish | 60 | 0.6% |
| Potawatomi | 21 | 0.2% |
| Puerto Rican | 141 | 1.3% |
| Russian | 40 | 0.4% |
| Salvadoran | 359 | 3.5% |
| Scandinavian | 57 | 0.5% |
| Scotch-Irish | 101 | 1.0% |
| Scottish | 274 | 2.6% |
| South American | 83 | 0.8% |
| Spaniard | 33 | 0.3% |
| Spanish | 14 | 0.1% |
| Sri Lankan | 8 | 0.1% |
| Swedish | 83 | 0.8% |
| Swiss | 22 | 0.2% |
| Ukrainian | 11 | 0.1% |
| Uruguayan | 41 | 0.4% |
| Welsh | 20 | 0.2% |
| Yugoslavian | 52 | 0.5% | View All 48 Rows |
Immigrants in Rifle
The most numerous immigrant groups reported in Rifle came from Latin America (1,386 | 13.3%), Central America (1,372 | 13.2%), Mexico (959 | 9.2%), El Salvador (394 | 3.8%), and Asia (49 | 0.5%), together accounting for 39.9% of all Rifle residents.
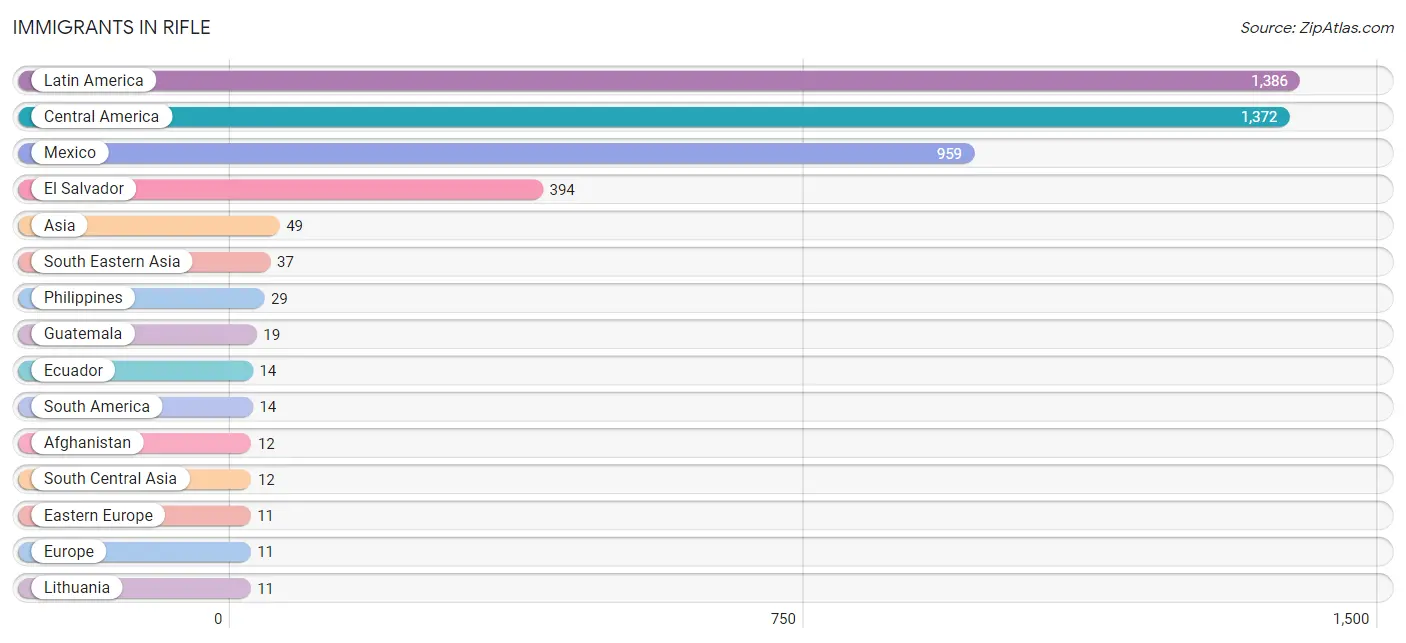
| Immigration Origin | # Population | % Population |
| Afghanistan | 12 | 0.1% |
| Asia | 49 | 0.5% |
| Central America | 1,372 | 13.2% |
| Eastern Europe | 11 | 0.1% |
| Ecuador | 14 | 0.1% |
| El Salvador | 394 | 3.8% |
| Europe | 11 | 0.1% |
| Guatemala | 19 | 0.2% |
| Latin America | 1,386 | 13.3% |
| Lithuania | 11 | 0.1% |
| Mexico | 959 | 9.2% |
| Philippines | 29 | 0.3% |
| South America | 14 | 0.1% |
| South Central Asia | 12 | 0.1% |
| South Eastern Asia | 37 | 0.4% |
| Vietnam | 8 | 0.1% | View All 16 Rows |
Sex and Age in Rifle
Sex and Age in Rifle
The most populous age groups in Rifle are 10 to 14 Years (533 | 10.5%) for men and 5 to 9 Years (624 | 11.7%) for women.
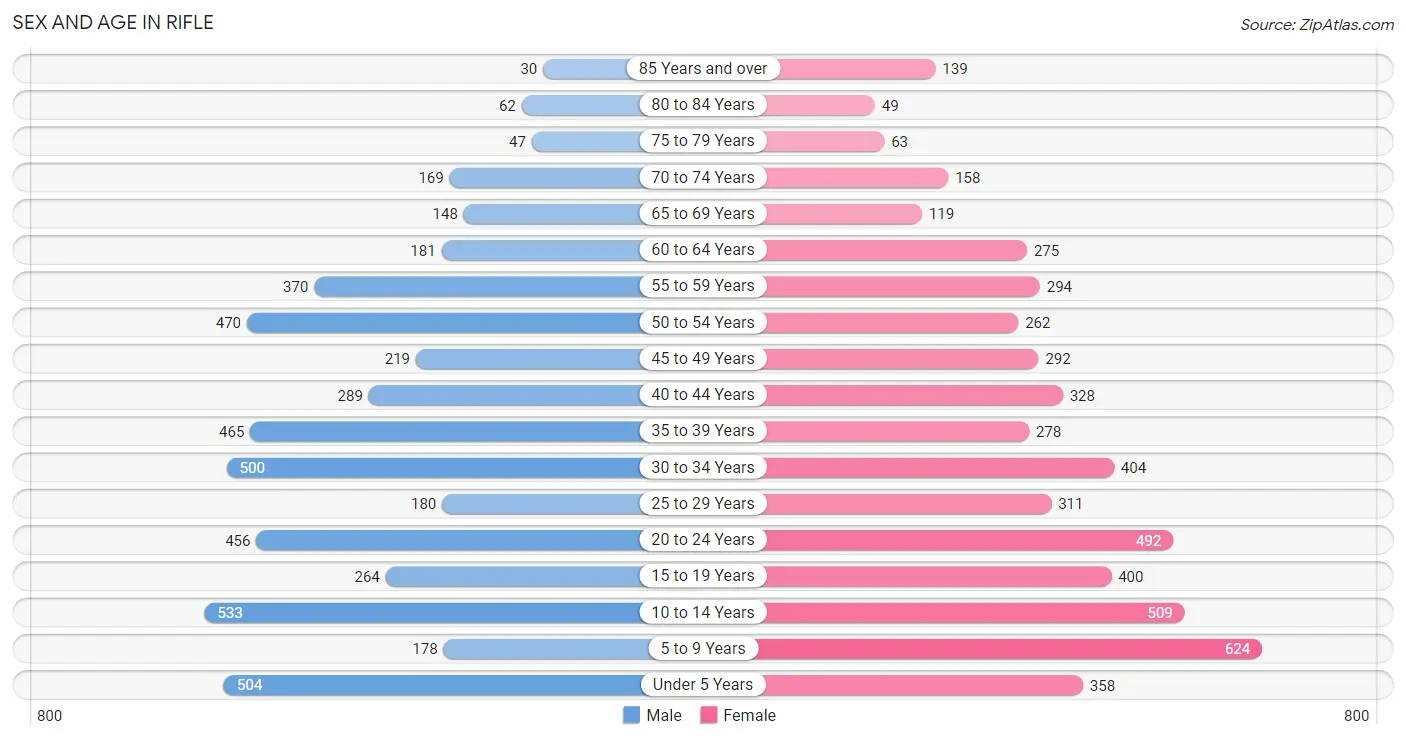
| Age Bracket | Male | Female |
| Under 5 Years | 504 (10.0%) | 358 (6.7%) |
| 5 to 9 Years | 178 (3.5%) | 624 (11.7%) |
| 10 to 14 Years | 533 (10.5%) | 509 (9.5%) |
| 15 to 19 Years | 264 (5.2%) | 400 (7.5%) |
| 20 to 24 Years | 456 (9.0%) | 492 (9.2%) |
| 25 to 29 Years | 180 (3.5%) | 311 (5.8%) |
| 30 to 34 Years | 500 (9.9%) | 404 (7.5%) |
| 35 to 39 Years | 465 (9.2%) | 278 (5.2%) |
| 40 to 44 Years | 289 (5.7%) | 328 (6.1%) |
| 45 to 49 Years | 219 (4.3%) | 292 (5.4%) |
| 50 to 54 Years | 470 (9.3%) | 262 (4.9%) |
| 55 to 59 Years | 370 (7.3%) | 294 (5.5%) |
| 60 to 64 Years | 181 (3.6%) | 275 (5.1%) |
| 65 to 69 Years | 148 (2.9%) | 119 (2.2%) |
| 70 to 74 Years | 169 (3.3%) | 158 (2.9%) |
| 75 to 79 Years | 47 (0.9%) | 63 (1.2%) |
| 80 to 84 Years | 62 (1.2%) | 49 (0.9%) |
| 85 Years and over | 30 (0.6%) | 139 (2.6%) |
| Total | 5,065 (100.0%) | 5,355 (100.0%) |
Families and Households in Rifle
Median Family Size in Rifle
The median family size in Rifle is 3.29 persons per family, with married-couple families (2,164 | 79.6%) accounting for the largest median family size of 3.33 persons per family. On the other hand, single male/father families (55 | 2.0%) represent the smallest median family size with 2.89 persons per family.
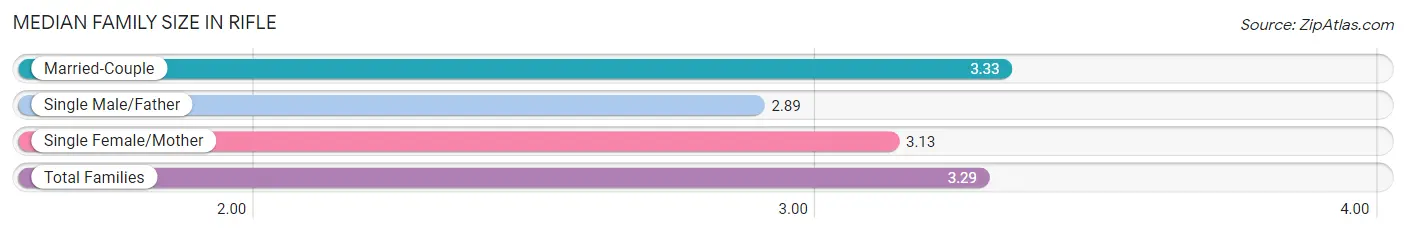
| Family Type | # Families | Family Size |
| Married-Couple | 2,164 (79.6%) | 3.33 |
| Single Male/Father | 55 (2.0%) | 2.89 |
| Single Female/Mother | 499 (18.4%) | 3.13 |
| Total Families | 2,718 (100.0%) | 3.29 |
Median Household Size in Rifle
The median household size in Rifle is 2.84 persons per household, with single male/father households (55 | 1.5%) accounting for the largest median household size of 3.6 persons per household. non-family households (897 | 24.8%) represent the smallest median household size with 1.29 persons per household.
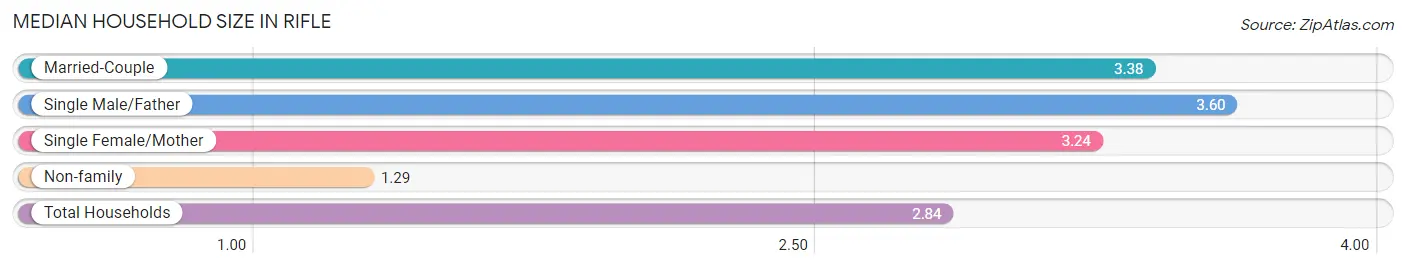
| Household Type | # Households | Household Size |
| Married-Couple | 2,164 (59.9%) | 3.38 |
| Single Male/Father | 55 (1.5%) | 3.60 |
| Single Female/Mother | 499 (13.8%) | 3.24 |
| Non-family | 897 (24.8%) | 1.29 |
| Total Households | 3,615 (100.0%) | 2.84 |
Household Size by Marriage Status in Rifle
Out of a total of 3,615 households in Rifle, 2,718 (75.2%) are family households, while 897 (24.8%) are nonfamily households. The most numerous type of family households are 2-person households, comprising 1,136, and the most common type of nonfamily households are 1-person households, comprising 783.
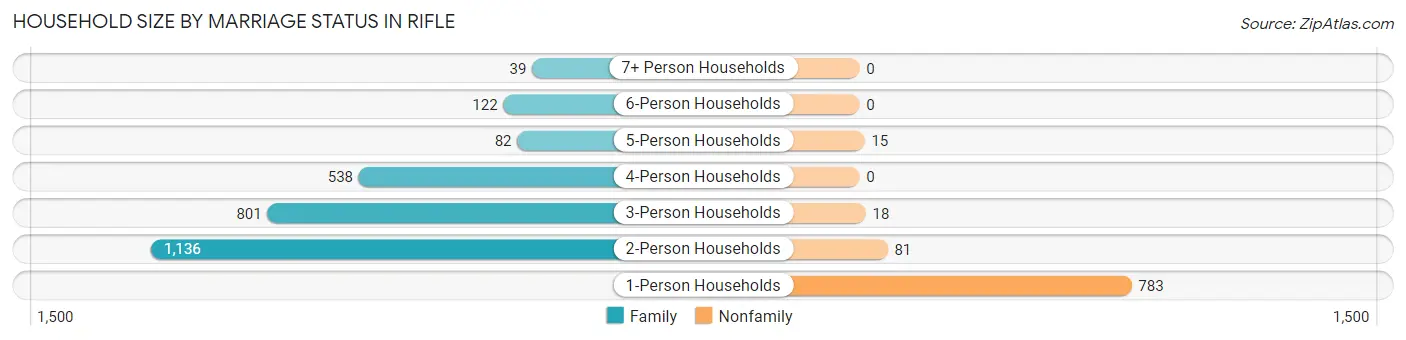
| Household Size | Family Households | Nonfamily Households |
| 1-Person Households | - | 783 (21.7%) |
| 2-Person Households | 1,136 (31.4%) | 81 (2.2%) |
| 3-Person Households | 801 (22.2%) | 18 (0.5%) |
| 4-Person Households | 538 (14.9%) | 0 (0.0%) |
| 5-Person Households | 82 (2.3%) | 15 (0.4%) |
| 6-Person Households | 122 (3.4%) | 0 (0.0%) |
| 7+ Person Households | 39 (1.1%) | 0 (0.0%) |
| Total | 2,718 (75.2%) | 897 (24.8%) |
Female Fertility in Rifle
Fertility by Age in Rifle
Average fertility rate in Rifle is 37.0 births per 1,000 women. Women in the age bracket of 20 to 34 years have the highest fertility rate with 79.0 births per 1,000 women. Women in the age bracket of 20 to 34 years acount for 100.0% of all women with births.
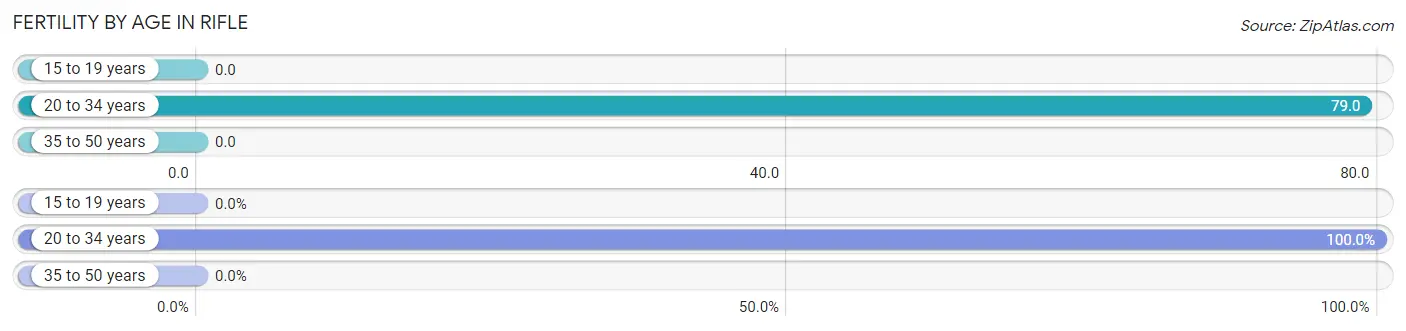
| Age Bracket | Women with Births | Births / 1,000 Women |
| 15 to 19 years | 0 (0.0%) | 0.0 |
| 20 to 34 years | 95 (100.0%) | 79.0 |
| 35 to 50 years | 0 (0.0%) | 0.0 |
| Total | 95 (100.0%) | 37.0 |
Fertility by Age by Marriage Status in Rifle
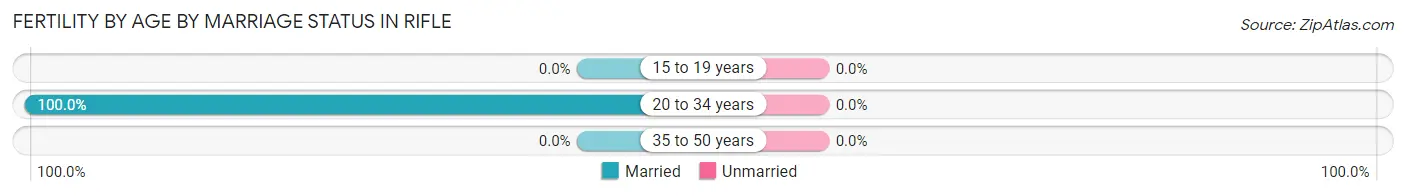
| Age Bracket | Married | Unmarried |
| 15 to 19 years | 0 (0.0%) | 0 (0.0%) |
| 20 to 34 years | 95 (100.0%) | 0 (0.0%) |
| 35 to 50 years | 0 (0.0%) | 0 (0.0%) |
| Total | 95 (100.0%) | 0 (0.0%) |
Fertility by Education in Rifle
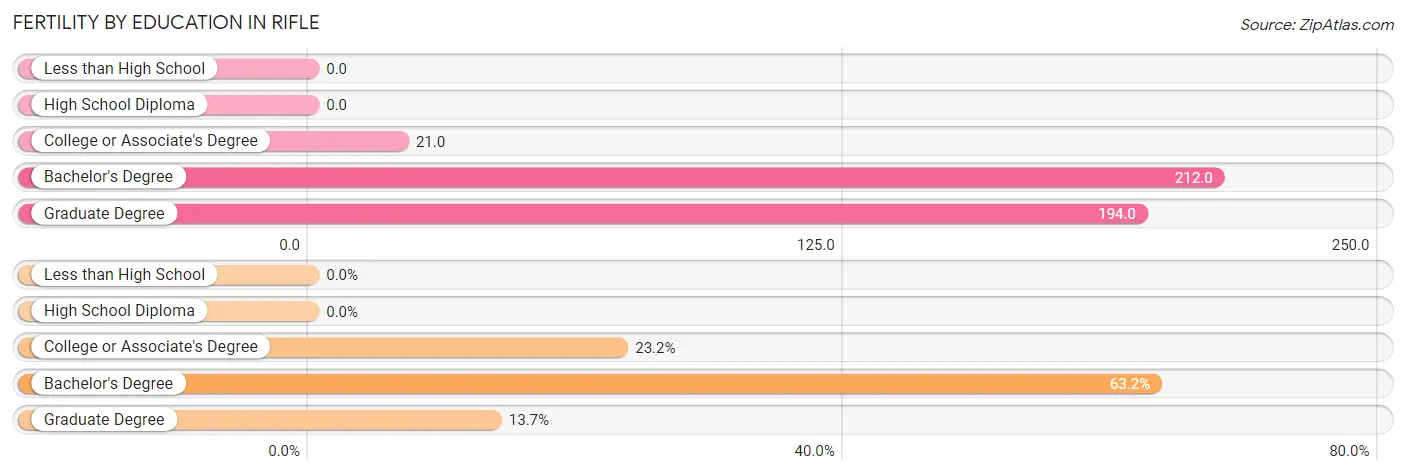
| Educational Attainment | Women with Births | Births / 1,000 Women |
| Less than High School | 0 (0.0%) | 0.0 |
| High School Diploma | 0 (0.0%) | 0.0 |
| College or Associate's Degree | 22 (23.2%) | 21.0 |
| Bachelor's Degree | 60 (63.2%) | 212.0 |
| Graduate Degree | 13 (13.7%) | 194.0 |
| Total | 95 (100.0%) | 37.0 |
Fertility by Education by Marriage Status in Rifle
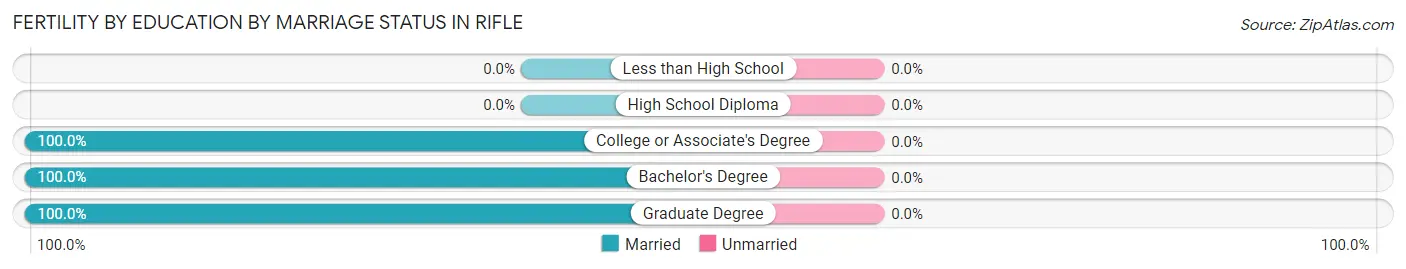
| Educational Attainment | Married | Unmarried |
| Less than High School | 0 (0.0%) | 0 (0.0%) |
| High School Diploma | 0 (0.0%) | 0 (0.0%) |
| College or Associate's Degree | 22 (100.0%) | 0 (0.0%) |
| Bachelor's Degree | 60 (100.0%) | 0 (0.0%) |
| Graduate Degree | 13 (100.0%) | 0 (0.0%) |
| Total | 95 (100.0%) | 0 (0.0%) |
Employment Characteristics in Rifle
Employment by Class of Employer in Rifle
Among the 5,623 employed individuals in Rifle, private company employees (3,777 | 67.2%), local government employees (604 | 10.7%), and not-for-profit organizations (395 | 7.0%) make up the most common classes of employment.
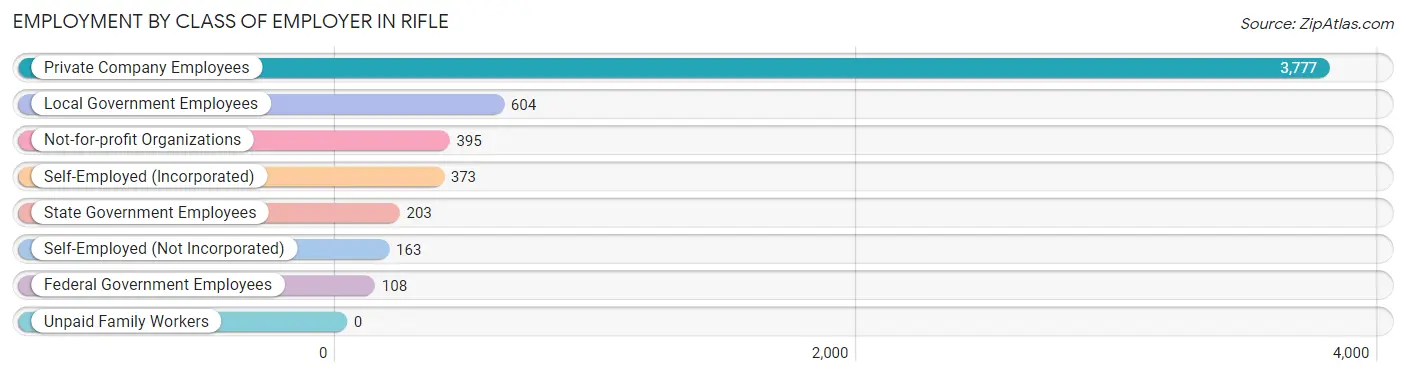
| Employer Class | # Employees | % Employees |
| Private Company Employees | 3,777 | 67.2% |
| Self-Employed (Incorporated) | 373 | 6.6% |
| Self-Employed (Not Incorporated) | 163 | 2.9% |
| Not-for-profit Organizations | 395 | 7.0% |
| Local Government Employees | 604 | 10.7% |
| State Government Employees | 203 | 3.6% |
| Federal Government Employees | 108 | 1.9% |
| Unpaid Family Workers | 0 | 0.0% |
| Total | 5,623 | 100.0% |
Employment Status by Age in Rifle
According to the labor force statistics for Rifle, out of the total population over 16 years of age (7,705), 77.9% or 6,002 individuals are in the labor force, with 4.0% or 240 of them unemployed. The age group with the highest labor force participation rate is 20 to 24 years, with 99.1% or 939 individuals in the labor force. Within the labor force, the 16 to 19 years age range has the highest percentage of unemployed individuals, with 35.3% or 65 of them being unemployed.
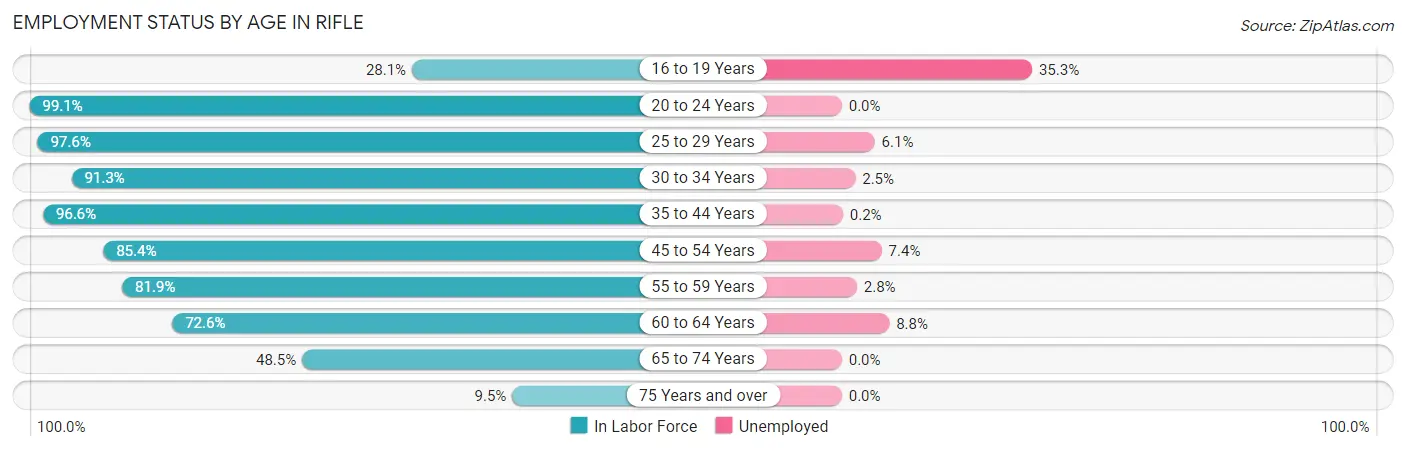
| Age Bracket | In Labor Force | Unemployed |
| 16 to 19 Years | 184 (28.1%) | 65 (35.3%) |
| 20 to 24 Years | 939 (99.1%) | 0 (0.0%) |
| 25 to 29 Years | 479 (97.6%) | 29 (6.1%) |
| 30 to 34 Years | 825 (91.3%) | 21 (2.5%) |
| 35 to 44 Years | 1,314 (96.6%) | 3 (0.2%) |
| 45 to 54 Years | 1,062 (85.4%) | 79 (7.4%) |
| 55 to 59 Years | 544 (81.9%) | 15 (2.8%) |
| 60 to 64 Years | 331 (72.6%) | 29 (8.8%) |
| 65 to 74 Years | 288 (48.5%) | 0 (0.0%) |
| 75 Years and over | 37 (9.5%) | 0 (0.0%) |
| Total | 6,002 (77.9%) | 240 (4.0%) |
Employment Status by Educational Attainment in Rifle
According to labor force statistics for Rifle, 89.0% of individuals (4,555) out of the total population between 25 and 64 years of age (5,118) are in the labor force, with 3.8% or 173 of them being unemployed. The group with the highest labor force participation rate are those with the educational attainment of bachelor's degree or higher, with 94.5% or 788 individuals in the labor force. Within the labor force, individuals with less than high school education have the highest percentage of unemployment, with 13.5% or 81 of them being unemployed.
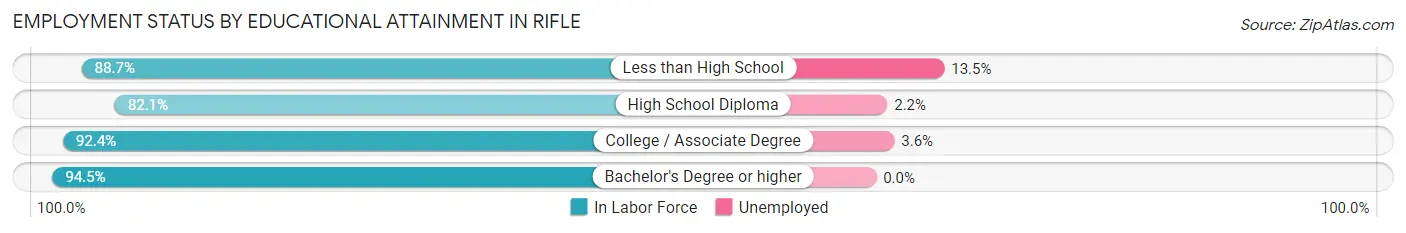
| Educational Attainment | In Labor Force | Unemployed |
| Less than High School | 598 (88.7%) | 91 (13.5%) |
| High School Diploma | 1,338 (82.1%) | 36 (2.2%) |
| College / Associate Degree | 1,830 (92.4%) | 71 (3.6%) |
| Bachelor's Degree or higher | 788 (94.5%) | 0 (0.0%) |
| Total | 4,555 (89.0%) | 194 (3.8%) |
Employment Occupations by Sex in Rifle
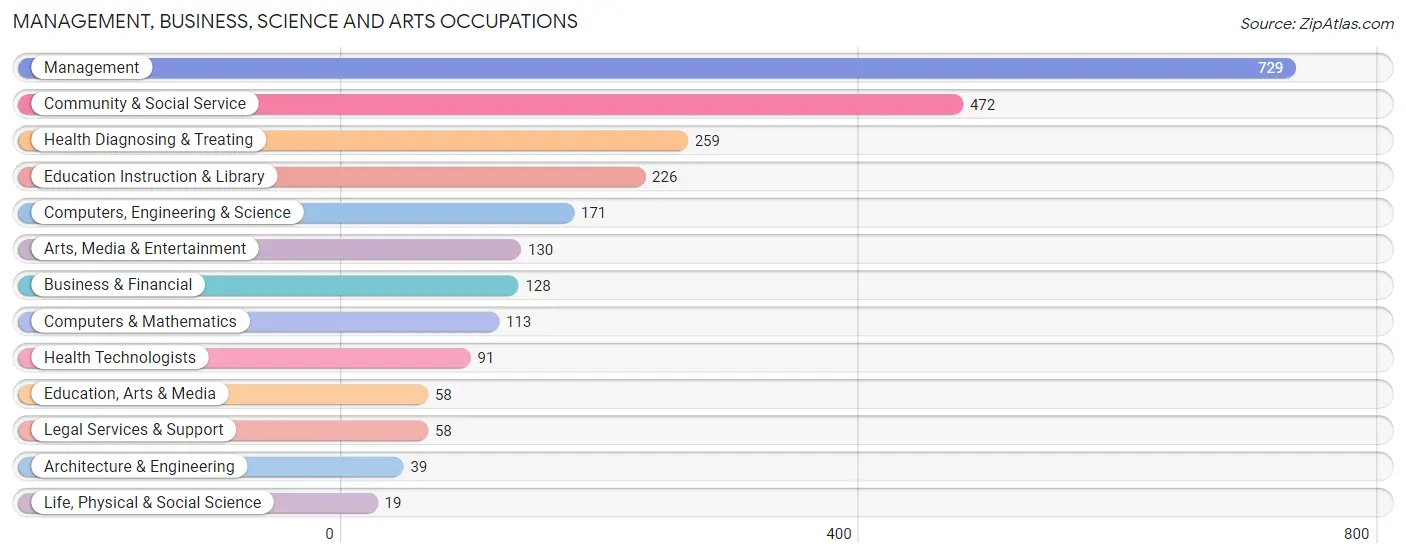
Management, Business, Science and Arts Occupations
The most common Management, Business, Science and Arts occupations in Rifle are Management (729 | 12.7%), Community & Social Service (472 | 8.2%), Health Diagnosing & Treating (259 | 4.5%), Education Instruction & Library (226 | 3.9%), and Computers, Engineering & Science (171 | 3.0%).
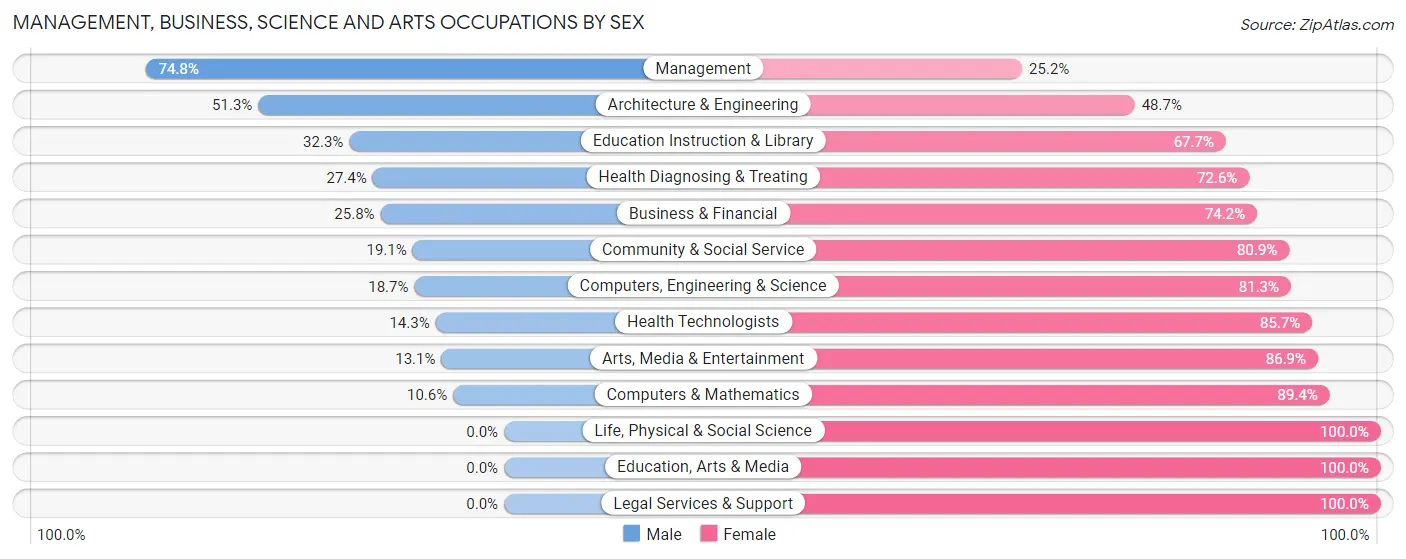
Management, Business, Science and Arts Occupations by Sex
Within the Management, Business, Science and Arts occupations in Rifle, the most male-oriented occupations are Management (74.8%), Architecture & Engineering (51.3%), and Education Instruction & Library (32.3%), while the most female-oriented occupations are Life, Physical & Social Science (100.0%), Education, Arts & Media (100.0%), and Legal Services & Support (100.0%).
| Occupation | Male | Female |
| Management | 545 (74.8%) | 184 (25.2%) |
| Business & Financial | 33 (25.8%) | 95 (74.2%) |
| Computers, Engineering & Science | 32 (18.7%) | 139 (81.3%) |
| Computers & Mathematics | 12 (10.6%) | 101 (89.4%) |
| Architecture & Engineering | 20 (51.3%) | 19 (48.7%) |
| Life, Physical & Social Science | 0 (0.0%) | 19 (100.0%) |
| Community & Social Service | 90 (19.1%) | 382 (80.9%) |
| Education, Arts & Media | 0 (0.0%) | 58 (100.0%) |
| Legal Services & Support | 0 (0.0%) | 58 (100.0%) |
| Education Instruction & Library | 73 (32.3%) | 153 (67.7%) |
| Arts, Media & Entertainment | 17 (13.1%) | 113 (86.9%) |
| Health Diagnosing & Treating | 71 (27.4%) | 188 (72.6%) |
| Health Technologists | 13 (14.3%) | 78 (85.7%) |
| Total (Category) | 771 (43.8%) | 988 (56.2%) |
| Total (Overall) | 3,276 (56.9%) | 2,487 (43.1%) |
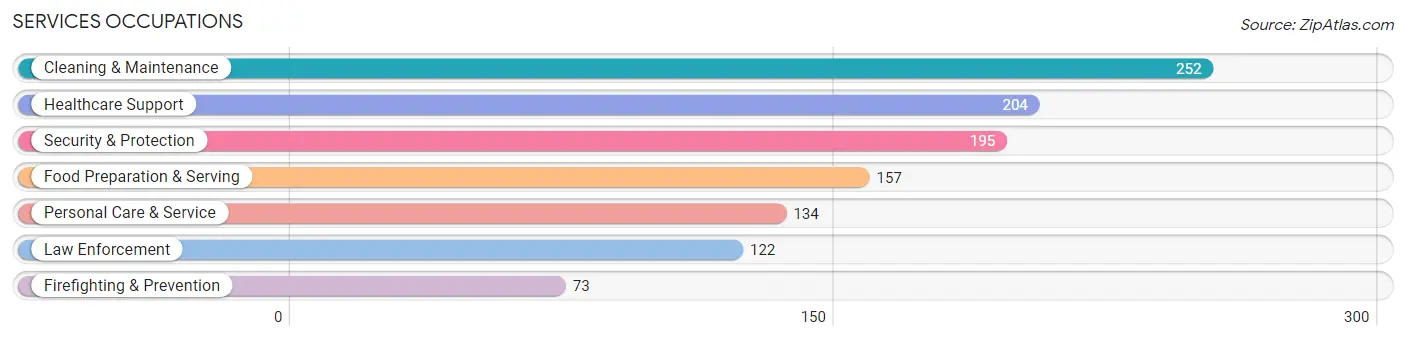
Services Occupations
The most common Services occupations in Rifle are Cleaning & Maintenance (252 | 4.4%), Healthcare Support (204 | 3.5%), Security & Protection (195 | 3.4%), Food Preparation & Serving (157 | 2.7%), and Personal Care & Service (134 | 2.3%).
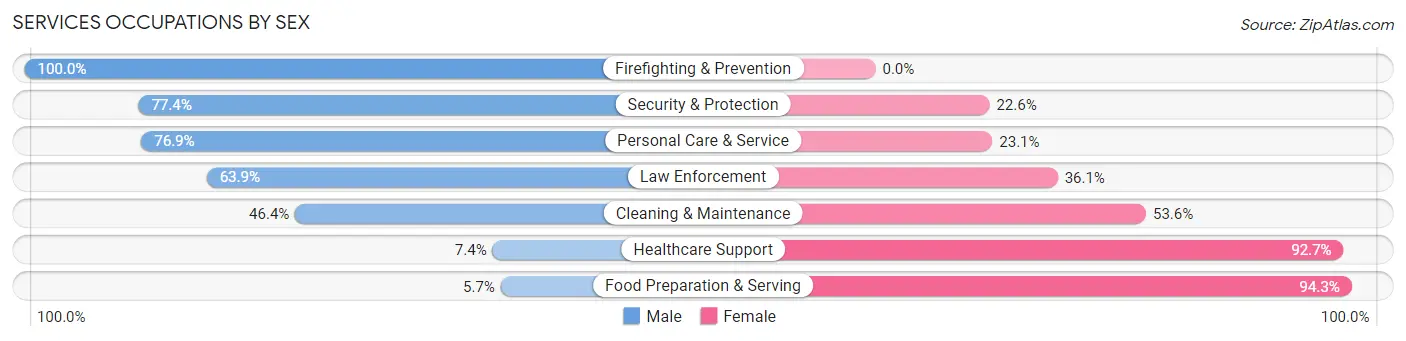
Services Occupations by Sex
Within the Services occupations in Rifle, the most male-oriented occupations are Firefighting & Prevention (100.0%), Security & Protection (77.4%), and Personal Care & Service (76.9%), while the most female-oriented occupations are Food Preparation & Serving (94.3%), Healthcare Support (92.6%), and Cleaning & Maintenance (53.6%).
| Occupation | Male | Female |
| Healthcare Support | 15 (7.3%) | 189 (92.6%) |
| Security & Protection | 151 (77.4%) | 44 (22.6%) |
| Firefighting & Prevention | 73 (100.0%) | 0 (0.0%) |
| Law Enforcement | 78 (63.9%) | 44 (36.1%) |
| Food Preparation & Serving | 9 (5.7%) | 148 (94.3%) |
| Cleaning & Maintenance | 117 (46.4%) | 135 (53.6%) |
| Personal Care & Service | 103 (76.9%) | 31 (23.1%) |
| Total (Category) | 395 (41.9%) | 547 (58.1%) |
| Total (Overall) | 3,276 (56.9%) | 2,487 (43.1%) |
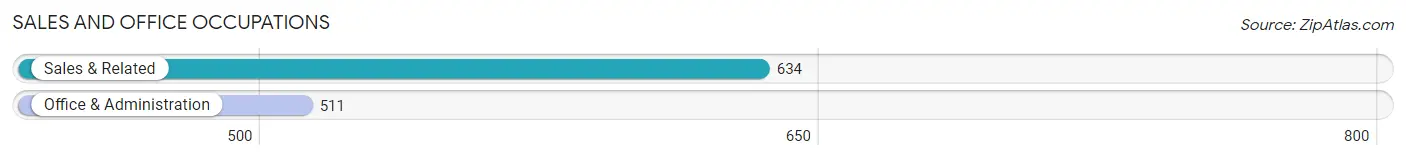
Sales and Office Occupations
The most common Sales and Office occupations in Rifle are Sales & Related (634 | 11.0%), and Office & Administration (511 | 8.9%).
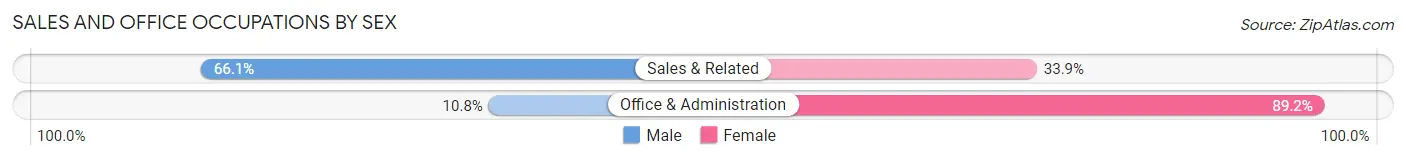
Sales and Office Occupations by Sex
| Occupation | Male | Female |
| Sales & Related | 419 (66.1%) | 215 (33.9%) |
| Office & Administration | 55 (10.8%) | 456 (89.2%) |
| Total (Category) | 474 (41.4%) | 671 (58.6%) |
| Total (Overall) | 3,276 (56.9%) | 2,487 (43.1%) |
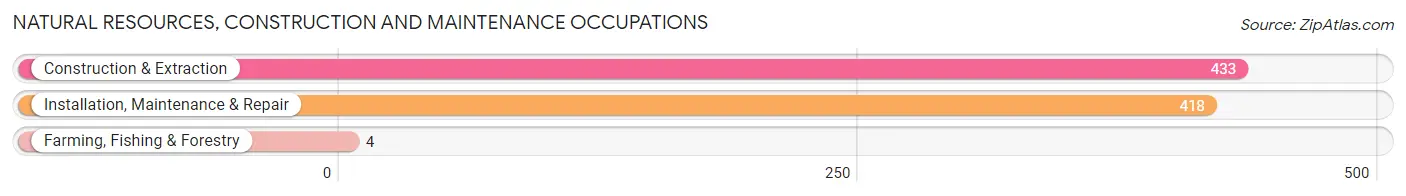
Natural Resources, Construction and Maintenance Occupations
The most common Natural Resources, Construction and Maintenance occupations in Rifle are Construction & Extraction (433 | 7.5%), Installation, Maintenance & Repair (418 | 7.2%), and Farming, Fishing & Forestry (4 | 0.1%).
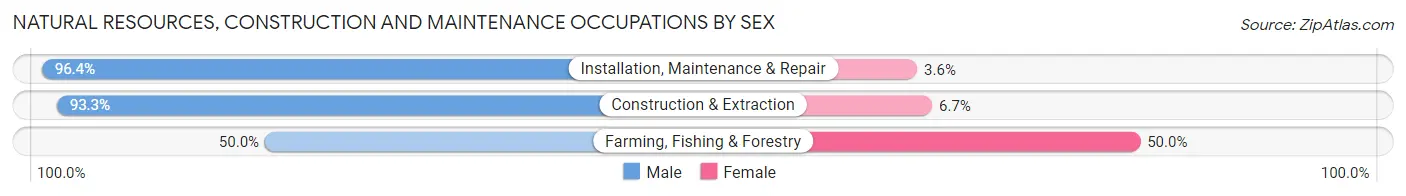
Natural Resources, Construction and Maintenance Occupations by Sex
| Occupation | Male | Female |
| Farming, Fishing & Forestry | 2 (50.0%) | 2 (50.0%) |
| Construction & Extraction | 404 (93.3%) | 29 (6.7%) |
| Installation, Maintenance & Repair | 403 (96.4%) | 15 (3.6%) |
| Total (Category) | 809 (94.6%) | 46 (5.4%) |
| Total (Overall) | 3,276 (56.9%) | 2,487 (43.1%) |
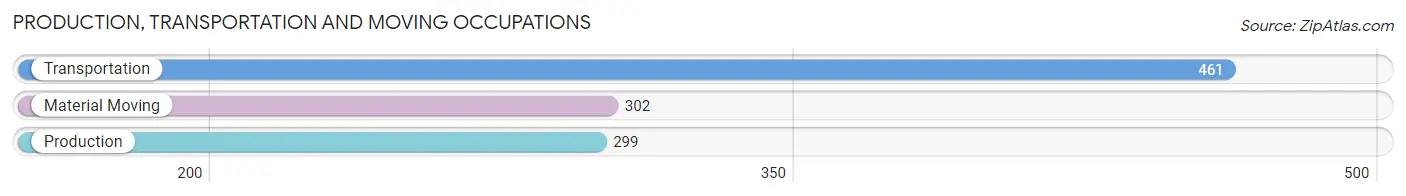
Production, Transportation and Moving Occupations
The most common Production, Transportation and Moving occupations in Rifle are Transportation (461 | 8.0%), Material Moving (302 | 5.2%), and Production (299 | 5.2%).
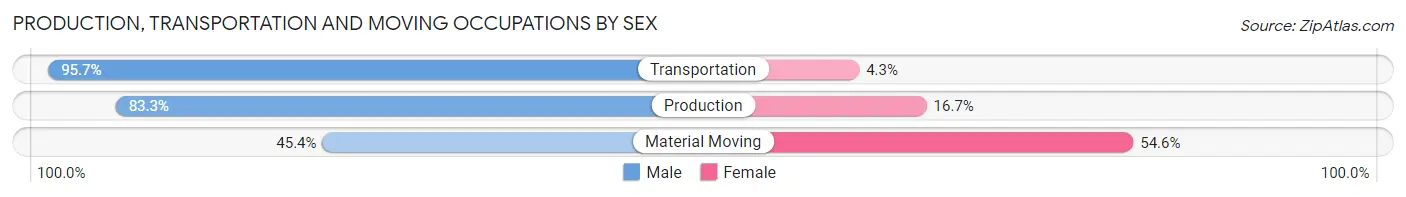
Production, Transportation and Moving Occupations by Sex
| Occupation | Male | Female |
| Production | 249 (83.3%) | 50 (16.7%) |
| Transportation | 441 (95.7%) | 20 (4.3%) |
| Material Moving | 137 (45.4%) | 165 (54.6%) |
| Total (Category) | 827 (77.9%) | 235 (22.1%) |
| Total (Overall) | 3,276 (56.9%) | 2,487 (43.1%) |
Employment Industries by Sex in Rifle
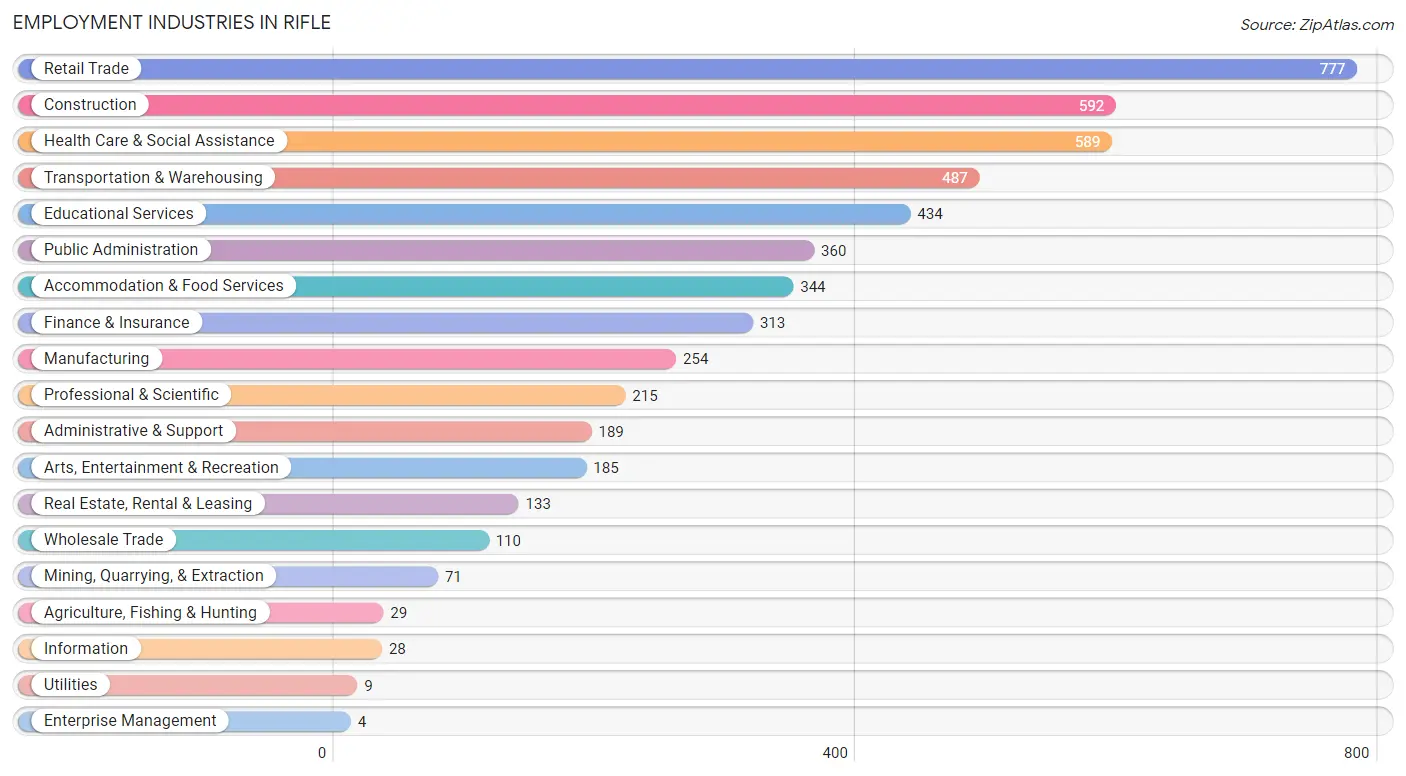
Employment Industries in Rifle
The major employment industries in Rifle include Retail Trade (777 | 13.5%), Construction (592 | 10.3%), Health Care & Social Assistance (589 | 10.2%), Transportation & Warehousing (487 | 8.5%), and Educational Services (434 | 7.5%).
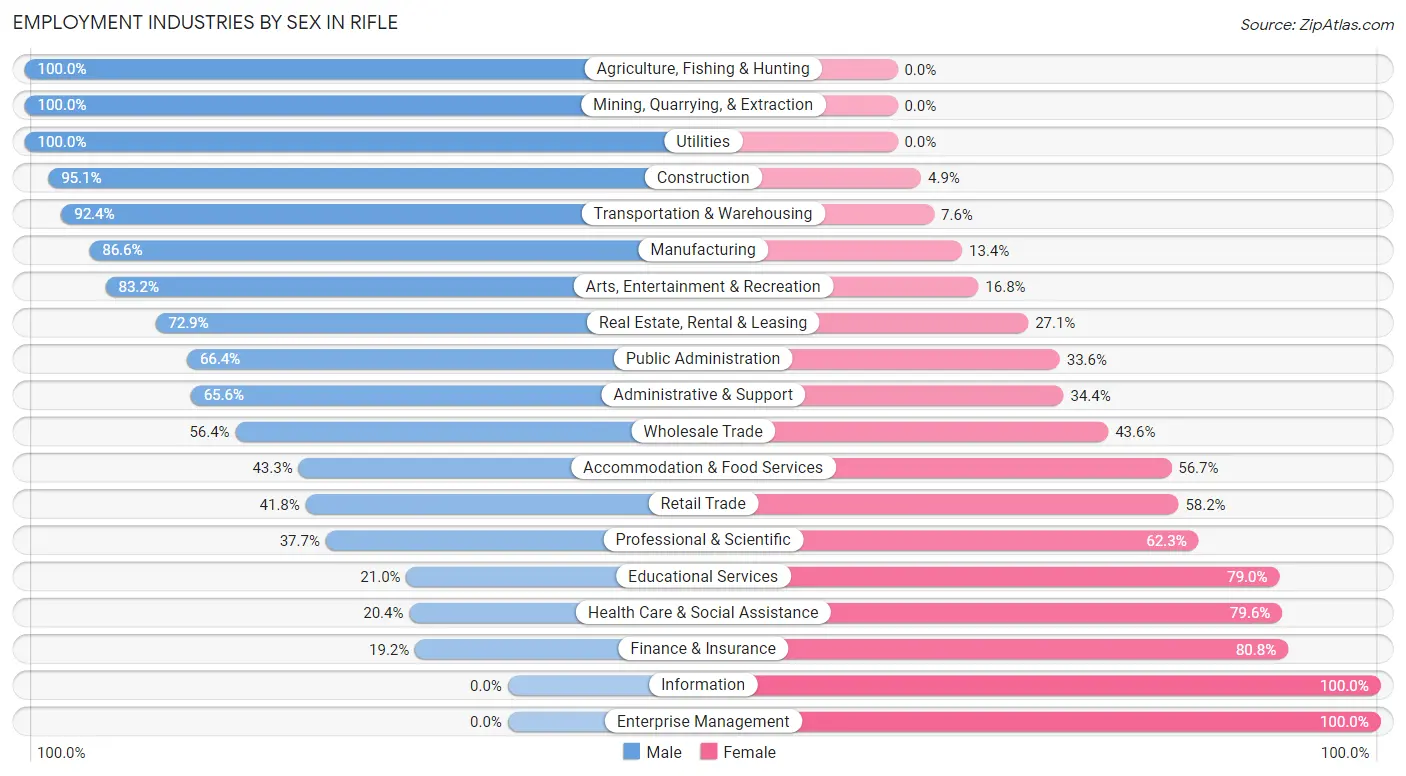
Employment Industries by Sex in Rifle
The Rifle industries that see more men than women are Agriculture, Fishing & Hunting (100.0%), Mining, Quarrying, & Extraction (100.0%), and Utilities (100.0%), whereas the industries that tend to have a higher number of women are Information (100.0%), Enterprise Management (100.0%), and Finance & Insurance (80.8%).
| Industry | Male | Female |
| Agriculture, Fishing & Hunting | 29 (100.0%) | 0 (0.0%) |
| Mining, Quarrying, & Extraction | 71 (100.0%) | 0 (0.0%) |
| Construction | 563 (95.1%) | 29 (4.9%) |
| Manufacturing | 220 (86.6%) | 34 (13.4%) |
| Wholesale Trade | 62 (56.4%) | 48 (43.6%) |
| Retail Trade | 325 (41.8%) | 452 (58.2%) |
| Transportation & Warehousing | 450 (92.4%) | 37 (7.6%) |
| Utilities | 9 (100.0%) | 0 (0.0%) |
| Information | 0 (0.0%) | 28 (100.0%) |
| Finance & Insurance | 60 (19.2%) | 253 (80.8%) |
| Real Estate, Rental & Leasing | 97 (72.9%) | 36 (27.1%) |
| Professional & Scientific | 81 (37.7%) | 134 (62.3%) |
| Enterprise Management | 0 (0.0%) | 4 (100.0%) |
| Administrative & Support | 124 (65.6%) | 65 (34.4%) |
| Educational Services | 91 (21.0%) | 343 (79.0%) |
| Health Care & Social Assistance | 120 (20.4%) | 469 (79.6%) |
| Arts, Entertainment & Recreation | 154 (83.2%) | 31 (16.8%) |
| Accommodation & Food Services | 149 (43.3%) | 195 (56.7%) |
| Public Administration | 239 (66.4%) | 121 (33.6%) |
| Total | 3,276 (56.9%) | 2,487 (43.1%) |
Education in Rifle
School Enrollment in Rifle
The most common levels of schooling among the 2,842 students in Rifle are middle school (830 | 29.2%), college / undergraduate (637 | 22.4%), and elementary school (561 | 19.7%).
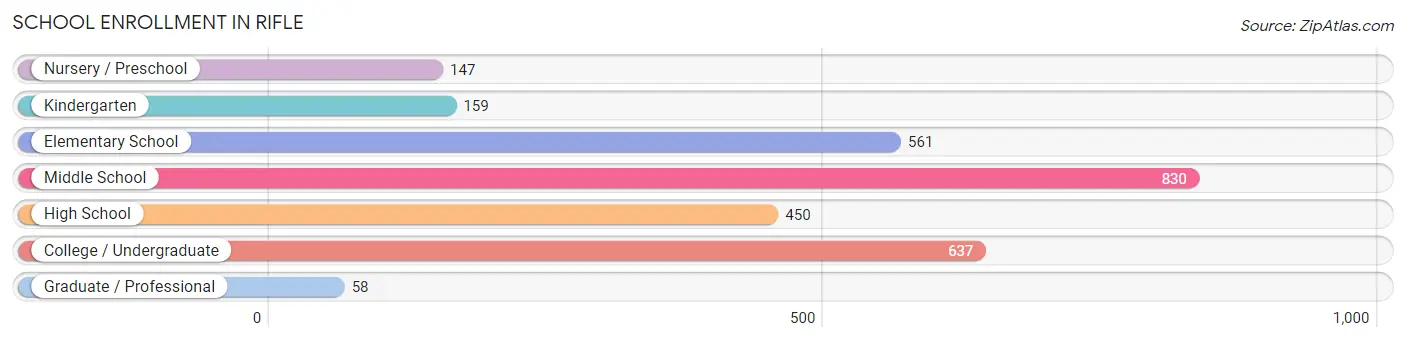
| School Level | # Students | % Students |
| Nursery / Preschool | 147 | 5.2% |
| Kindergarten | 159 | 5.6% |
| Elementary School | 561 | 19.7% |
| Middle School | 830 | 29.2% |
| High School | 450 | 15.8% |
| College / Undergraduate | 637 | 22.4% |
| Graduate / Professional | 58 | 2.0% |
| Total | 2,842 | 100.0% |
School Enrollment by Age by Funding Source in Rifle
Out of a total of 2,842 students who are enrolled in schools in Rifle, 520 (18.3%) attend a private institution, while the remaining 2,322 (81.7%) are enrolled in public schools. The age group of 20 to 24 year olds has the highest likelihood of being enrolled in private schools, with 180 (96.8% in the age bracket) enrolled. Conversely, the age group of 18 to 19 year olds has the lowest likelihood of being enrolled in a private school, with 232 (100.0% in the age bracket) attending a public institution.
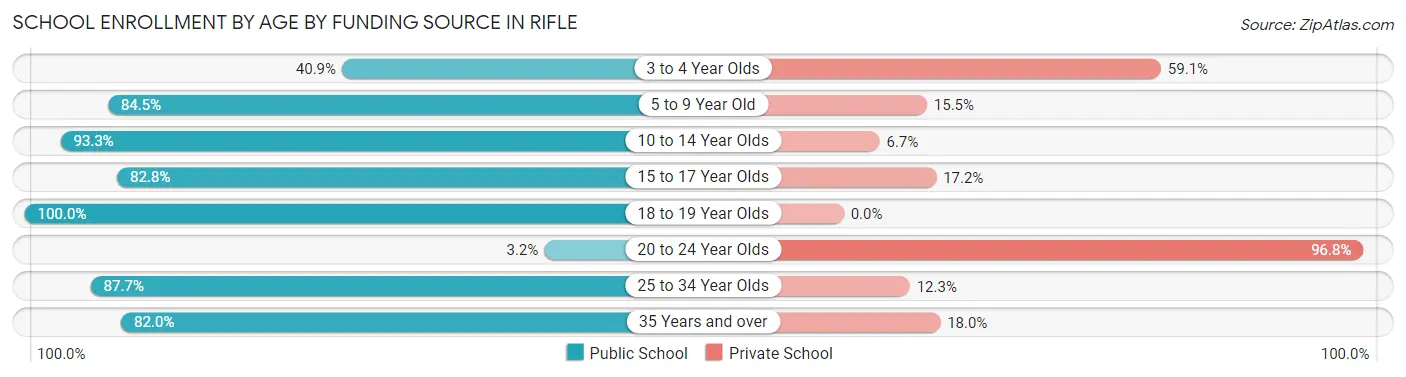
| Age Bracket | Public School | Private School |
| 3 to 4 Year Olds | 45 (40.9%) | 65 (59.1%) |
| 5 to 9 Year Old | 507 (84.5%) | 93 (15.5%) |
| 10 to 14 Year Olds | 936 (93.3%) | 67 (6.7%) |
| 15 to 17 Year Olds | 245 (82.8%) | 51 (17.2%) |
| 18 to 19 Year Olds | 232 (100.0%) | 0 (0.0%) |
| 20 to 24 Year Olds | 6 (3.2%) | 180 (96.8%) |
| 25 to 34 Year Olds | 164 (87.7%) | 23 (12.3%) |
| 35 Years and over | 187 (82.0%) | 41 (18.0%) |
| Total | 2,322 (81.7%) | 520 (18.3%) |
Educational Attainment by Field of Study in Rifle
Business (183 | 14.9%), literature & languages (174 | 14.2%), education (165 | 13.5%), social sciences (118 | 9.6%), and science & technology (100 | 8.2%) are the most common fields of study among 1,226 individuals in Rifle who have obtained a bachelor's degree or higher.
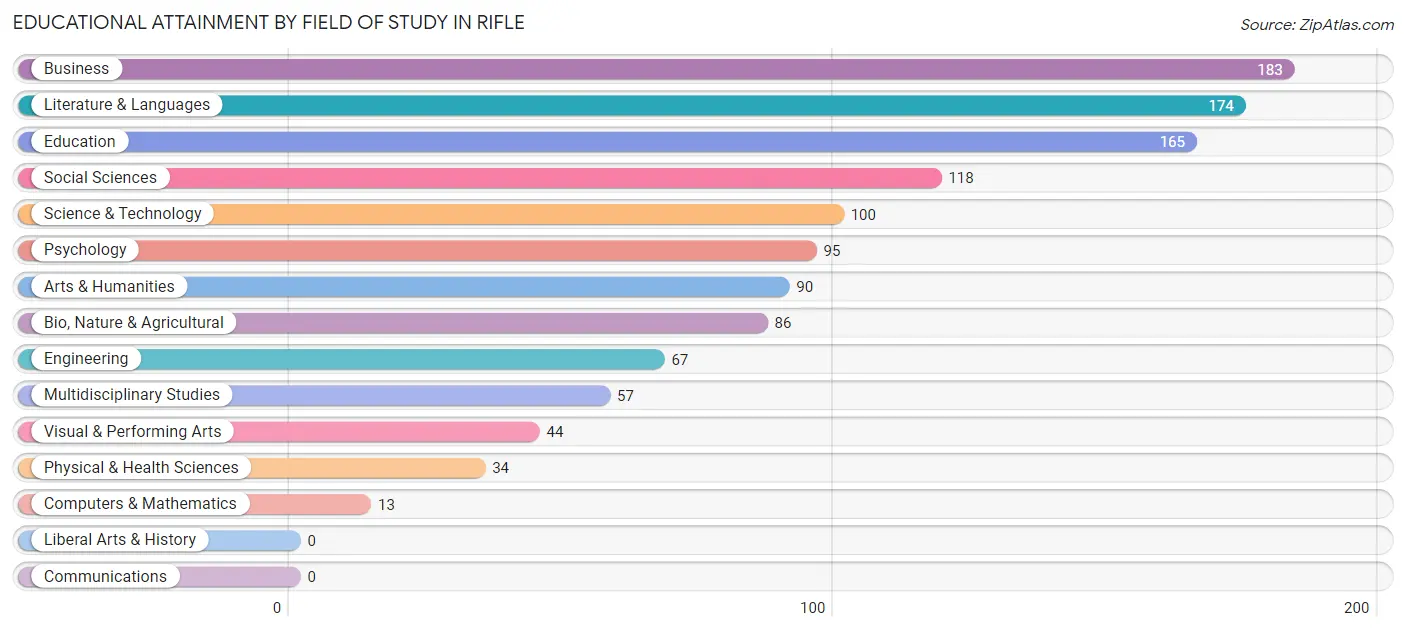
| Field of Study | # Graduates | % Graduates |
| Computers & Mathematics | 13 | 1.1% |
| Bio, Nature & Agricultural | 86 | 7.0% |
| Physical & Health Sciences | 34 | 2.8% |
| Psychology | 95 | 7.7% |
| Social Sciences | 118 | 9.6% |
| Engineering | 67 | 5.5% |
| Multidisciplinary Studies | 57 | 4.6% |
| Science & Technology | 100 | 8.2% |
| Business | 183 | 14.9% |
| Education | 165 | 13.5% |
| Literature & Languages | 174 | 14.2% |
| Liberal Arts & History | 0 | 0.0% |
| Visual & Performing Arts | 44 | 3.6% |
| Communications | 0 | 0.0% |
| Arts & Humanities | 90 | 7.3% |
| Total | 1,226 | 100.0% |
Transportation & Commute in Rifle
Vehicle Availability by Sex in Rifle
The most prevalent vehicle ownership categories in Rifle are males with 2 vehicles (1,398, accounting for 43.8%) and females with 2 vehicles (1,236, making up 57.6%).
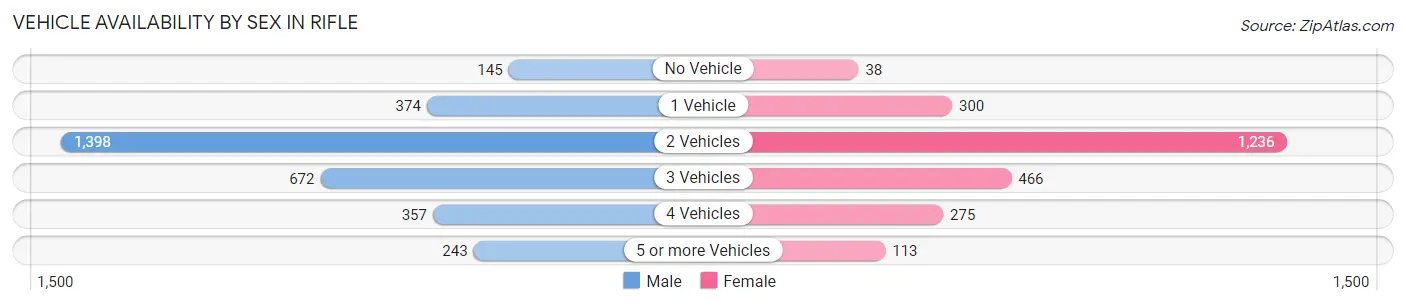
| Vehicles Available | Male | Female |
| No Vehicle | 145 (4.5%) | 38 (1.6%) |
| 1 Vehicle | 374 (11.7%) | 300 (12.4%) |
| 2 Vehicles | 1,398 (43.8%) | 1,236 (50.9%) |
| 3 Vehicles | 672 (21.1%) | 466 (19.2%) |
| 4 Vehicles | 357 (11.2%) | 275 (11.3%) |
| 5 or more Vehicles | 243 (7.6%) | 113 (4.6%) |
| Total | 3,189 (100.0%) | 2,428 (100.0%) |
Commute Time in Rifle
The most frequently occuring commute durations in Rifle are 45 to 59 minutes (836 commuters, 15.7%), 5 to 9 minutes (778 commuters, 14.6%), and 20 to 24 minutes (567 commuters, 10.6%).
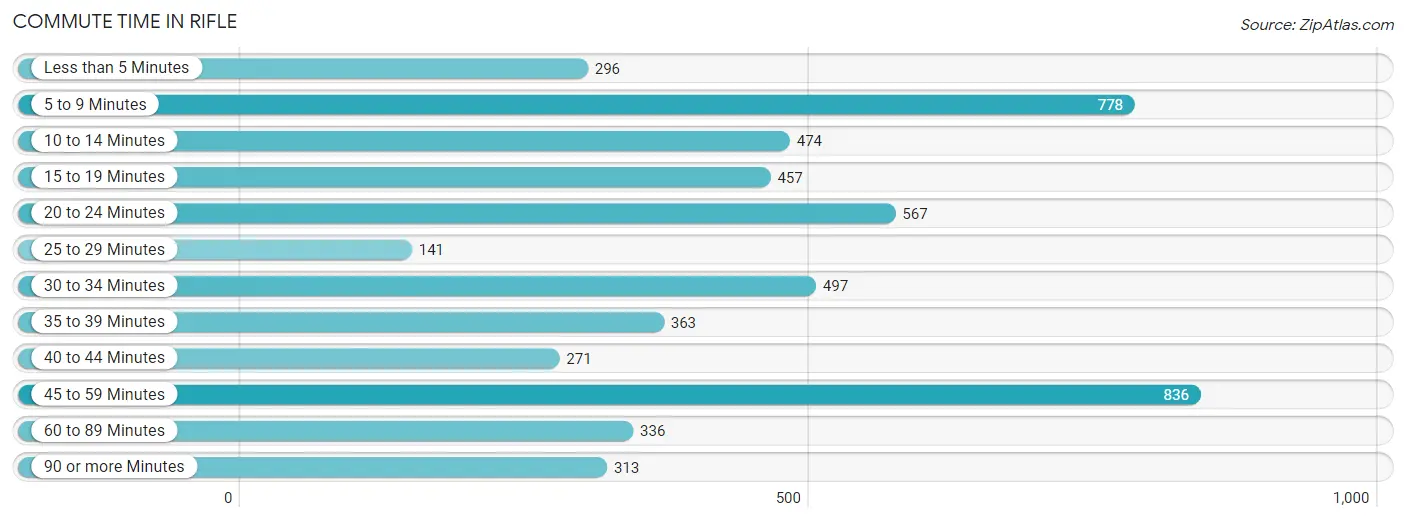
| Commute Time | # Commuters | % Commuters |
| Less than 5 Minutes | 296 | 5.6% |
| 5 to 9 Minutes | 778 | 14.6% |
| 10 to 14 Minutes | 474 | 8.9% |
| 15 to 19 Minutes | 457 | 8.6% |
| 20 to 24 Minutes | 567 | 10.6% |
| 25 to 29 Minutes | 141 | 2.6% |
| 30 to 34 Minutes | 497 | 9.3% |
| 35 to 39 Minutes | 363 | 6.8% |
| 40 to 44 Minutes | 271 | 5.1% |
| 45 to 59 Minutes | 836 | 15.7% |
| 60 to 89 Minutes | 336 | 6.3% |
| 90 or more Minutes | 313 | 5.9% |
Commute Time by Sex in Rifle
The most common commute times in Rifle are 45 to 59 minutes (482 commuters, 15.8%) for males and 5 to 9 minutes (626 commuters, 27.4%) for females.
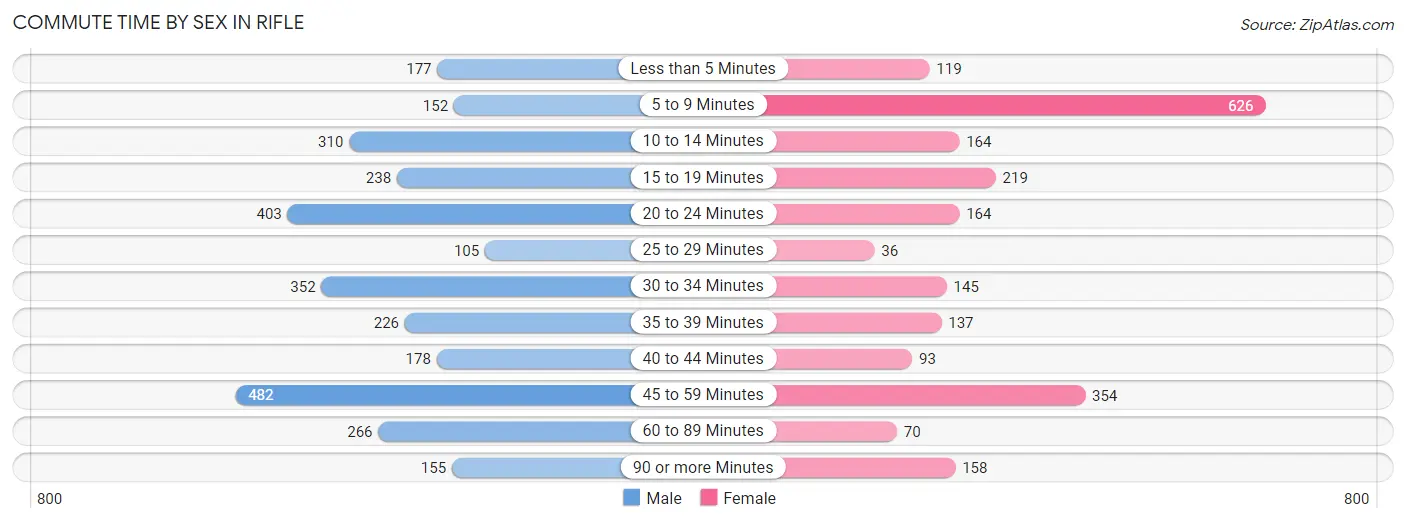
| Commute Time | Male | Female |
| Less than 5 Minutes | 177 (5.8%) | 119 (5.2%) |
| 5 to 9 Minutes | 152 (5.0%) | 626 (27.4%) |
| 10 to 14 Minutes | 310 (10.2%) | 164 (7.2%) |
| 15 to 19 Minutes | 238 (7.8%) | 219 (9.6%) |
| 20 to 24 Minutes | 403 (13.2%) | 164 (7.2%) |
| 25 to 29 Minutes | 105 (3.5%) | 36 (1.6%) |
| 30 to 34 Minutes | 352 (11.6%) | 145 (6.4%) |
| 35 to 39 Minutes | 226 (7.4%) | 137 (6.0%) |
| 40 to 44 Minutes | 178 (5.9%) | 93 (4.1%) |
| 45 to 59 Minutes | 482 (15.8%) | 354 (15.5%) |
| 60 to 89 Minutes | 266 (8.7%) | 70 (3.1%) |
| 90 or more Minutes | 155 (5.1%) | 158 (6.9%) |
Time of Departure to Work by Sex in Rifle
The most frequent times of departure to work in Rifle are 7:00 AM to 7:29 AM (579, 19.0%) for males and 7:00 AM to 7:29 AM (433, 19.0%) for females.
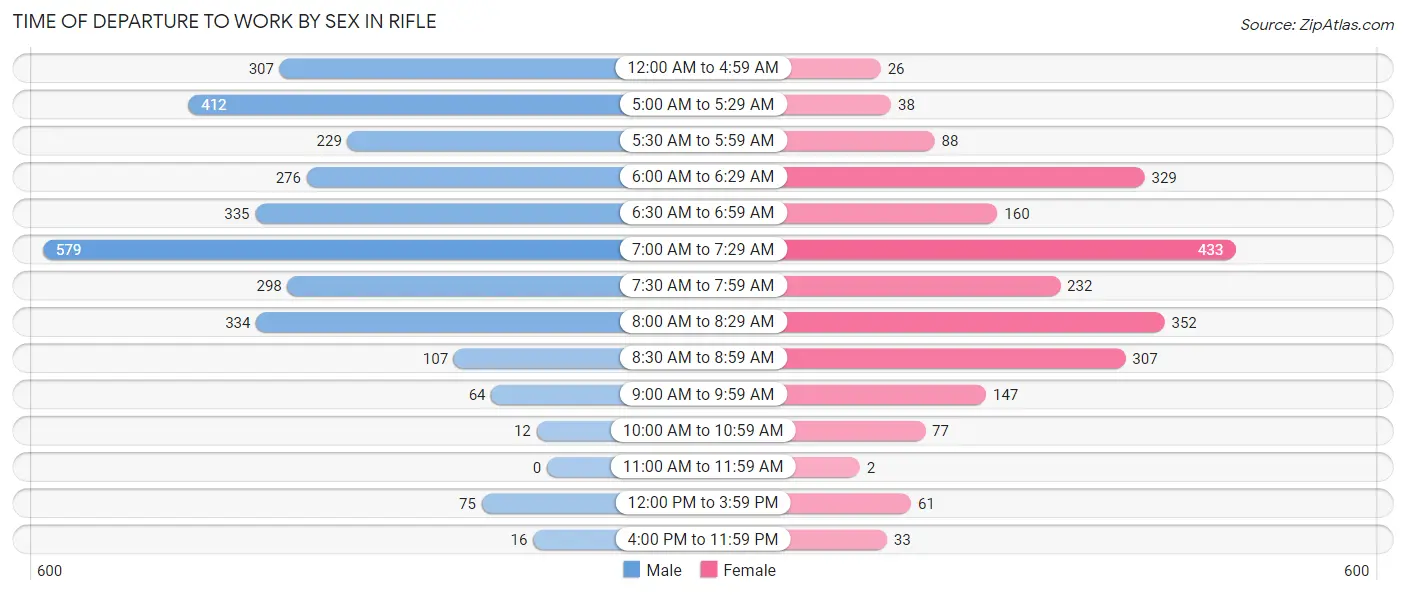
| Time of Departure | Male | Female |
| 12:00 AM to 4:59 AM | 307 (10.1%) | 26 (1.1%) |
| 5:00 AM to 5:29 AM | 412 (13.5%) | 38 (1.7%) |
| 5:30 AM to 5:59 AM | 229 (7.5%) | 88 (3.8%) |
| 6:00 AM to 6:29 AM | 276 (9.1%) | 329 (14.4%) |
| 6:30 AM to 6:59 AM | 335 (11.0%) | 160 (7.0%) |
| 7:00 AM to 7:29 AM | 579 (19.0%) | 433 (19.0%) |
| 7:30 AM to 7:59 AM | 298 (9.8%) | 232 (10.2%) |
| 8:00 AM to 8:29 AM | 334 (11.0%) | 352 (15.4%) |
| 8:30 AM to 8:59 AM | 107 (3.5%) | 307 (13.4%) |
| 9:00 AM to 9:59 AM | 64 (2.1%) | 147 (6.4%) |
| 10:00 AM to 10:59 AM | 12 (0.4%) | 77 (3.4%) |
| 11:00 AM to 11:59 AM | 0 (0.0%) | 2 (0.1%) |
| 12:00 PM to 3:59 PM | 75 (2.5%) | 61 (2.7%) |
| 4:00 PM to 11:59 PM | 16 (0.5%) | 33 (1.4%) |
| Total | 3,044 (100.0%) | 2,285 (100.0%) |
Housing Occupancy in Rifle
Occupancy by Ownership in Rifle
Of the total 3,615 dwellings in Rifle, owner-occupied units account for 2,532 (70.0%), while renter-occupied units make up 1,083 (30.0%).
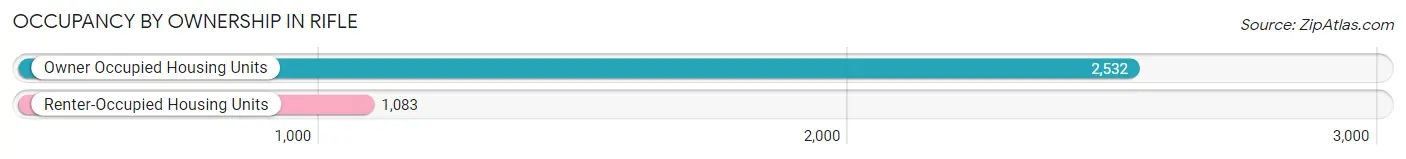
| Occupancy | # Housing Units | % Housing Units |
| Owner Occupied Housing Units | 2,532 | 70.0% |
| Renter-Occupied Housing Units | 1,083 | 30.0% |
| Total Occupied Housing Units | 3,615 | 100.0% |
Occupancy by Household Size in Rifle
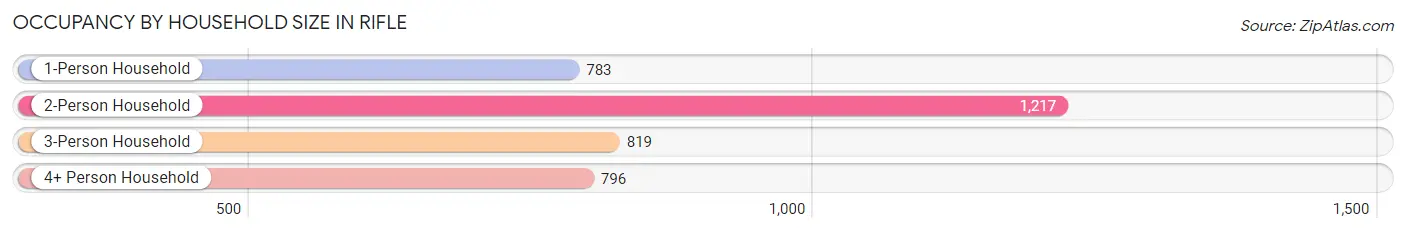
| Household Size | # Housing Units | % Housing Units |
| 1-Person Household | 783 | 21.7% |
| 2-Person Household | 1,217 | 33.7% |
| 3-Person Household | 819 | 22.7% |
| 4+ Person Household | 796 | 22.0% |
| Total Housing Units | 3,615 | 100.0% |
Occupancy by Ownership by Household Size in Rifle
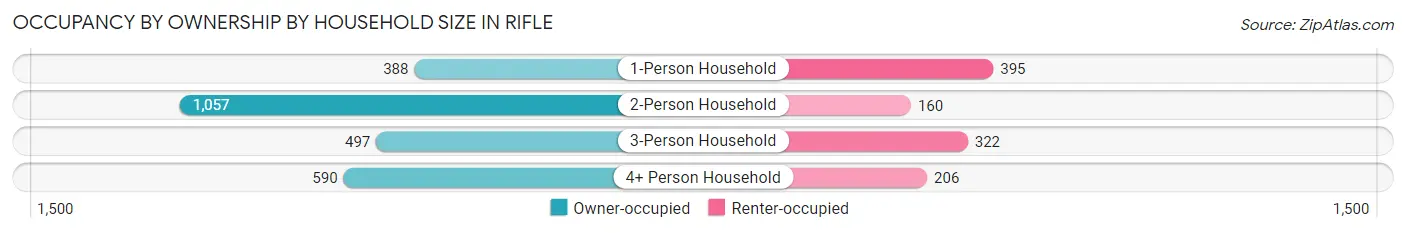
| Household Size | Owner-occupied | Renter-occupied |
| 1-Person Household | 388 (49.5%) | 395 (50.4%) |
| 2-Person Household | 1,057 (86.9%) | 160 (13.2%) |
| 3-Person Household | 497 (60.7%) | 322 (39.3%) |
| 4+ Person Household | 590 (74.1%) | 206 (25.9%) |
| Total Housing Units | 2,532 (70.0%) | 1,083 (30.0%) |
Occupancy by Educational Attainment in Rifle
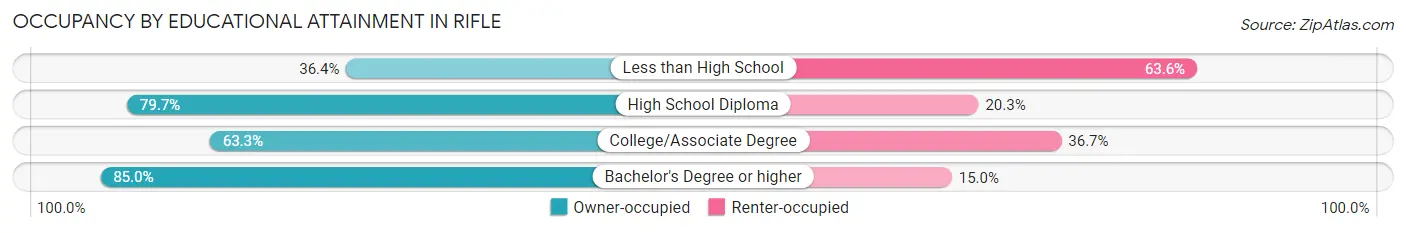
| Household Size | Owner-occupied | Renter-occupied |
| Less than High School | 142 (36.4%) | 248 (63.6%) |
| High School Diploma | 978 (79.7%) | 249 (20.3%) |
| College/Associate Degree | 834 (63.3%) | 484 (36.7%) |
| Bachelor's Degree or higher | 578 (85.0%) | 102 (15.0%) |
Occupancy by Age of Householder in Rifle
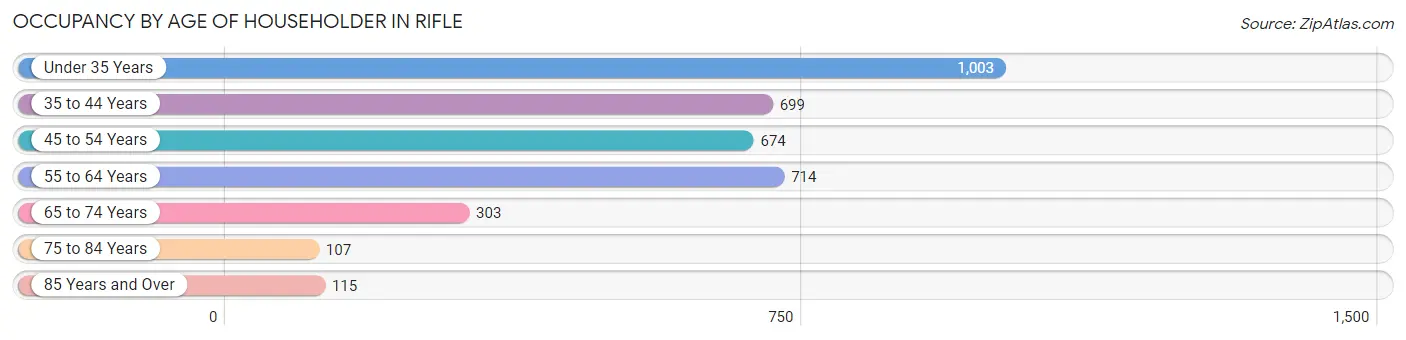
| Age Bracket | # Households | % Households |
| Under 35 Years | 1,003 | 27.8% |
| 35 to 44 Years | 699 | 19.3% |
| 45 to 54 Years | 674 | 18.6% |
| 55 to 64 Years | 714 | 19.8% |
| 65 to 74 Years | 303 | 8.4% |
| 75 to 84 Years | 107 | 3.0% |
| 85 Years and Over | 115 | 3.2% |
| Total | 3,615 | 100.0% |
Housing Finances in Rifle
Median Income by Occupancy in Rifle
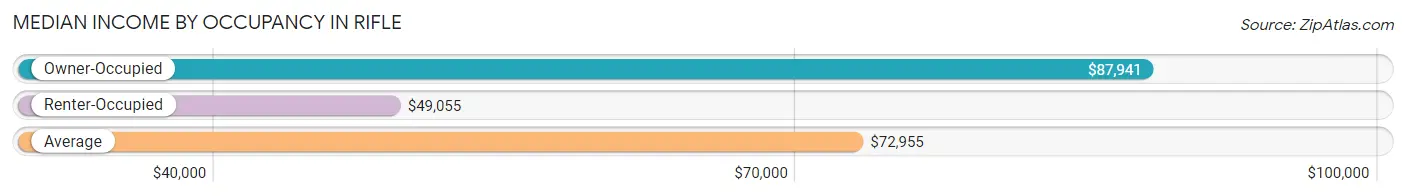
| Occupancy Type | # Households | Median Income |
| Owner-Occupied | 2,532 (70.0%) | $87,941 |
| Renter-Occupied | 1,083 (30.0%) | $49,055 |
| Average | 3,615 (100.0%) | $72,955 |
Occupancy by Householder Income Bracket in Rifle
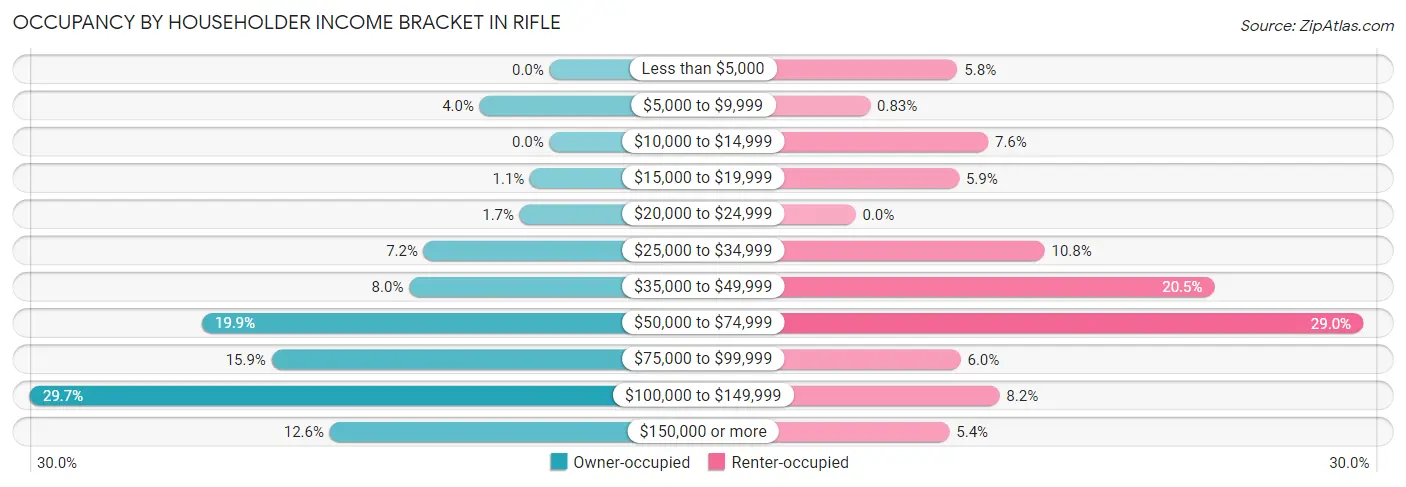
| Income Bracket | Owner-occupied | Renter-occupied |
| Less than $5,000 | 0 (0.0%) | 63 (5.8%) |
| $5,000 to $9,999 | 101 (4.0%) | 9 (0.8%) |
| $10,000 to $14,999 | 0 (0.0%) | 82 (7.6%) |
| $15,000 to $19,999 | 28 (1.1%) | 64 (5.9%) |
| $20,000 to $24,999 | 43 (1.7%) | 0 (0.0%) |
| $25,000 to $34,999 | 182 (7.2%) | 117 (10.8%) |
| $35,000 to $49,999 | 203 (8.0%) | 222 (20.5%) |
| $50,000 to $74,999 | 503 (19.9%) | 314 (29.0%) |
| $75,000 to $99,999 | 402 (15.9%) | 65 (6.0%) |
| $100,000 to $149,999 | 752 (29.7%) | 89 (8.2%) |
| $150,000 or more | 318 (12.6%) | 58 (5.4%) |
| Total | 2,532 (100.0%) | 1,083 (100.0%) |
Monthly Housing Cost Tiers in Rifle
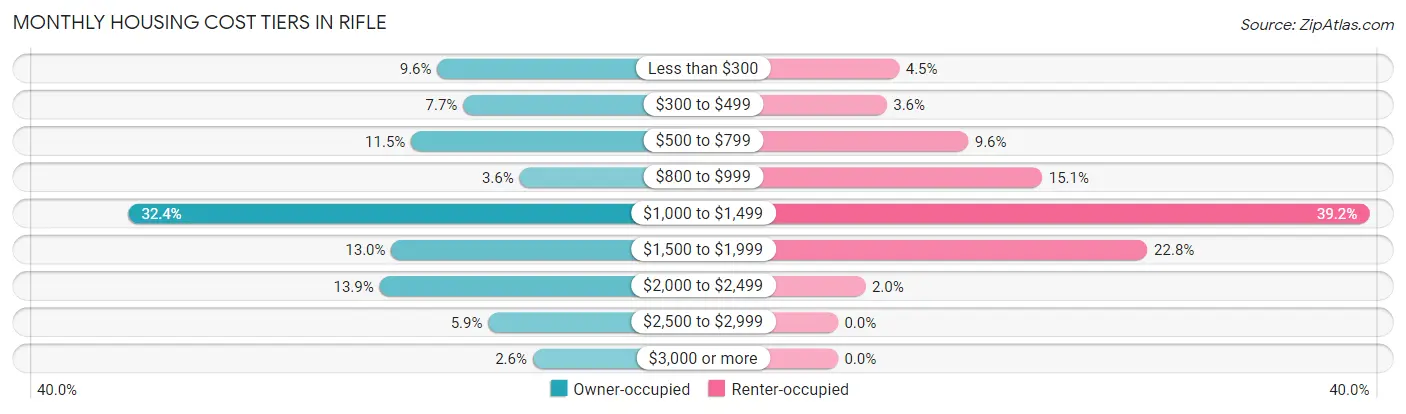
| Monthly Cost | Owner-occupied | Renter-occupied |
| Less than $300 | 243 (9.6%) | 49 (4.5%) |
| $300 to $499 | 195 (7.7%) | 39 (3.6%) |
| $500 to $799 | 292 (11.5%) | 104 (9.6%) |
| $800 to $999 | 90 (3.5%) | 163 (15.0%) |
| $1,000 to $1,499 | 819 (32.4%) | 424 (39.2%) |
| $1,500 to $1,999 | 329 (13.0%) | 247 (22.8%) |
| $2,000 to $2,499 | 351 (13.9%) | 22 (2.0%) |
| $2,500 to $2,999 | 148 (5.9%) | 0 (0.0%) |
| $3,000 or more | 65 (2.6%) | 0 (0.0%) |
| Total | 2,532 (100.0%) | 1,083 (100.0%) |
Physical Housing Characteristics in Rifle
Housing Structures in Rifle
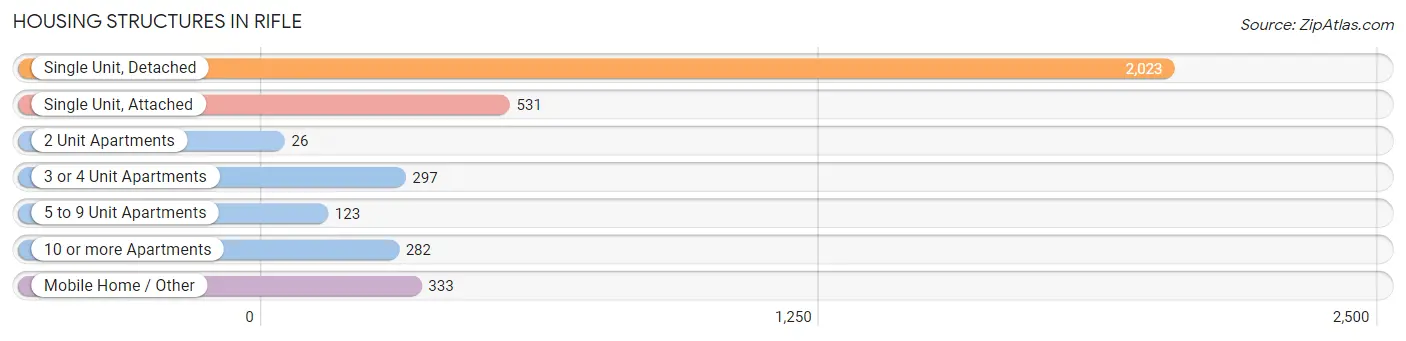
| Structure Type | # Housing Units | % Housing Units |
| Single Unit, Detached | 2,023 | 56.0% |
| Single Unit, Attached | 531 | 14.7% |
| 2 Unit Apartments | 26 | 0.7% |
| 3 or 4 Unit Apartments | 297 | 8.2% |
| 5 to 9 Unit Apartments | 123 | 3.4% |
| 10 or more Apartments | 282 | 7.8% |
| Mobile Home / Other | 333 | 9.2% |
| Total | 3,615 | 100.0% |
Housing Structures by Occupancy in Rifle
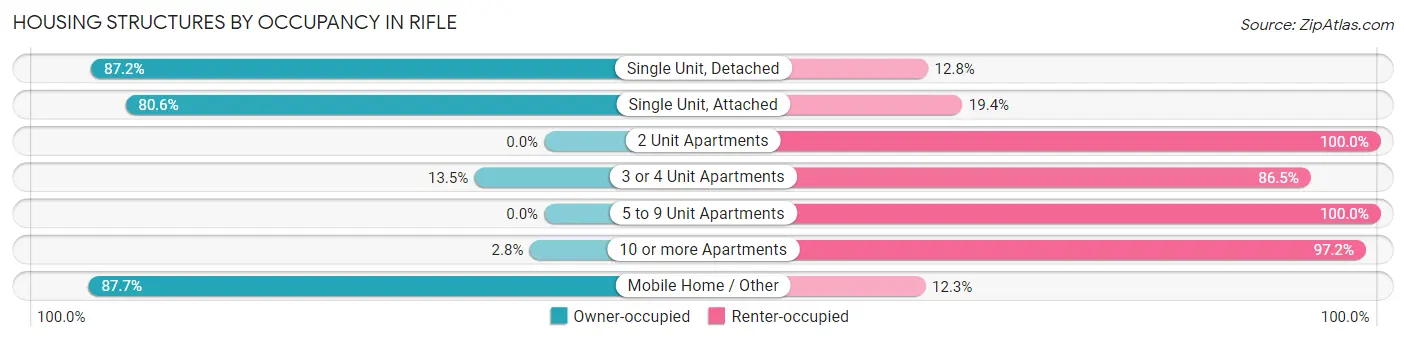
| Structure Type | Owner-occupied | Renter-occupied |
| Single Unit, Detached | 1,764 (87.2%) | 259 (12.8%) |
| Single Unit, Attached | 428 (80.6%) | 103 (19.4%) |
| 2 Unit Apartments | 0 (0.0%) | 26 (100.0%) |
| 3 or 4 Unit Apartments | 40 (13.5%) | 257 (86.5%) |
| 5 to 9 Unit Apartments | 0 (0.0%) | 123 (100.0%) |
| 10 or more Apartments | 8 (2.8%) | 274 (97.2%) |
| Mobile Home / Other | 292 (87.7%) | 41 (12.3%) |
| Total | 2,532 (70.0%) | 1,083 (30.0%) |
Housing Structures by Number of Rooms in Rifle
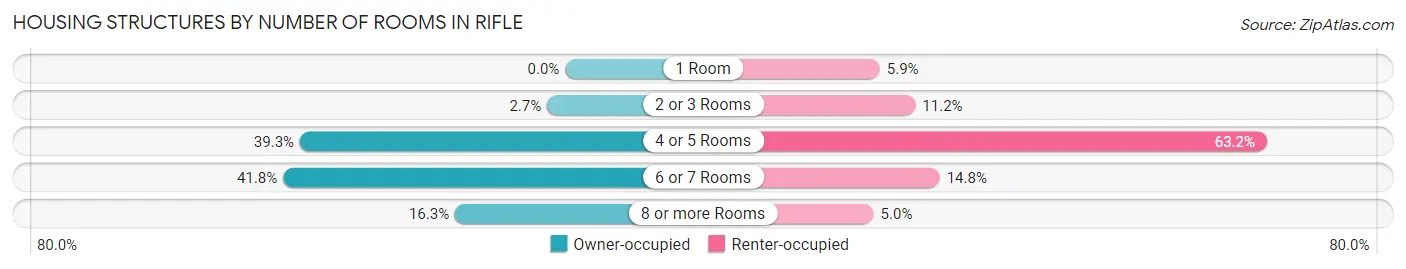
| Number of Rooms | Owner-occupied | Renter-occupied |
| 1 Room | 0 (0.0%) | 64 (5.9%) |
| 2 or 3 Rooms | 68 (2.7%) | 121 (11.2%) |
| 4 or 5 Rooms | 994 (39.3%) | 684 (63.2%) |
| 6 or 7 Rooms | 1,057 (41.7%) | 160 (14.8%) |
| 8 or more Rooms | 413 (16.3%) | 54 (5.0%) |
| Total | 2,532 (100.0%) | 1,083 (100.0%) |
Housing Structure by Heating Type in Rifle
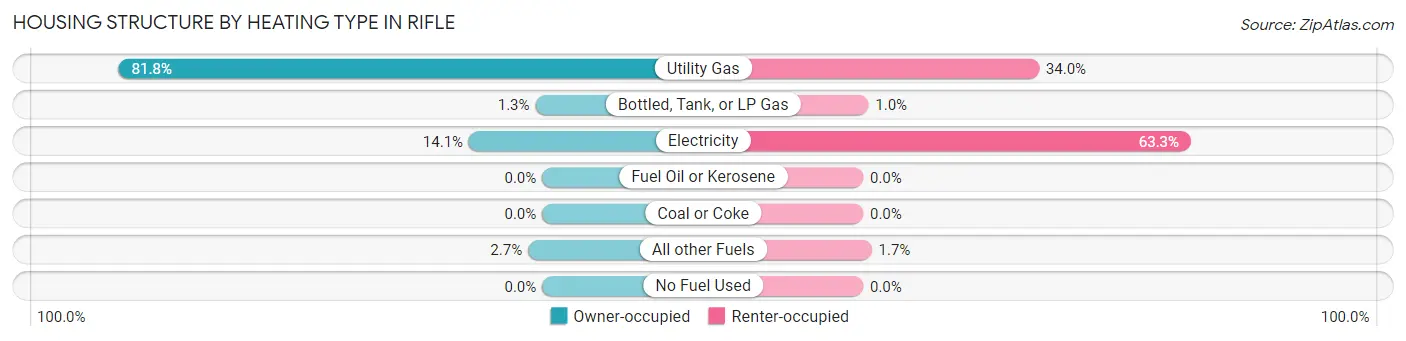
| Heating Type | Owner-occupied | Renter-occupied |
| Utility Gas | 2,072 (81.8%) | 368 (34.0%) |
| Bottled, Tank, or LP Gas | 33 (1.3%) | 11 (1.0%) |
| Electricity | 358 (14.1%) | 686 (63.3%) |
| Fuel Oil or Kerosene | 0 (0.0%) | 0 (0.0%) |
| Coal or Coke | 0 (0.0%) | 0 (0.0%) |
| All other Fuels | 69 (2.7%) | 18 (1.7%) |
| No Fuel Used | 0 (0.0%) | 0 (0.0%) |
| Total | 2,532 (100.0%) | 1,083 (100.0%) |
Household Vehicle Usage in Rifle
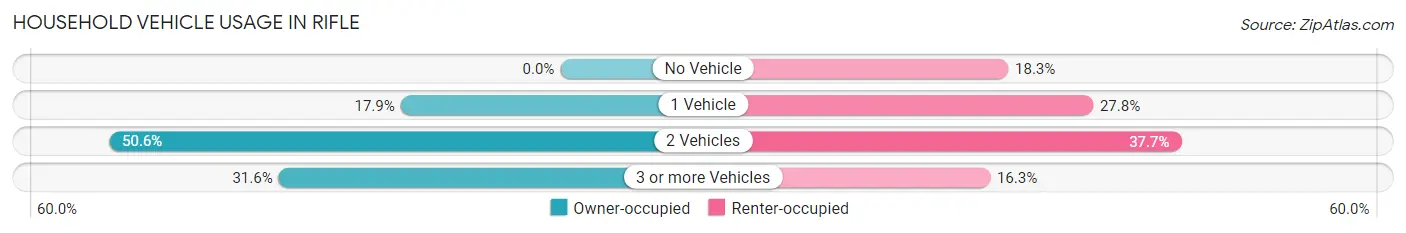
| Vehicles per Household | Owner-occupied | Renter-occupied |
| No Vehicle | 0 (0.0%) | 198 (18.3%) |
| 1 Vehicle | 453 (17.9%) | 301 (27.8%) |
| 2 Vehicles | 1,280 (50.5%) | 408 (37.7%) |
| 3 or more Vehicles | 799 (31.6%) | 176 (16.3%) |
| Total | 2,532 (100.0%) | 1,083 (100.0%) |
Real Estate & Mortgages in Rifle
Real Estate and Mortgage Overview in Rifle
| Characteristic | Without Mortgage | With Mortgage |
| Housing Units | 772 | 1,760 |
| Median Property Value | $259,000 | $333,900 |
| Median Household Income | $70,500 | $222 |
| Monthly Housing Costs | $471 | $65 |
| Real Estate Taxes | $1,028 | $35 |
Property Value by Mortgage Status in Rifle
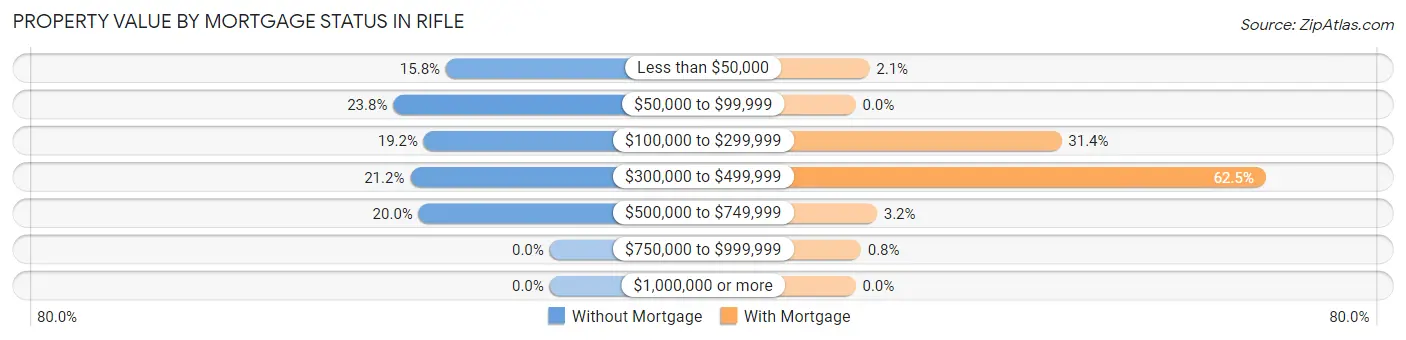
| Property Value | Without Mortgage | With Mortgage |
| Less than $50,000 | 122 (15.8%) | 37 (2.1%) |
| $50,000 to $99,999 | 184 (23.8%) | 0 (0.0%) |
| $100,000 to $299,999 | 148 (19.2%) | 552 (31.4%) |
| $300,000 to $499,999 | 164 (21.2%) | 1,100 (62.5%) |
| $500,000 to $749,999 | 154 (20.0%) | 57 (3.2%) |
| $750,000 to $999,999 | 0 (0.0%) | 14 (0.8%) |
| $1,000,000 or more | 0 (0.0%) | 0 (0.0%) |
| Total | 772 (100.0%) | 1,760 (100.0%) |
Household Income by Mortgage Status in Rifle
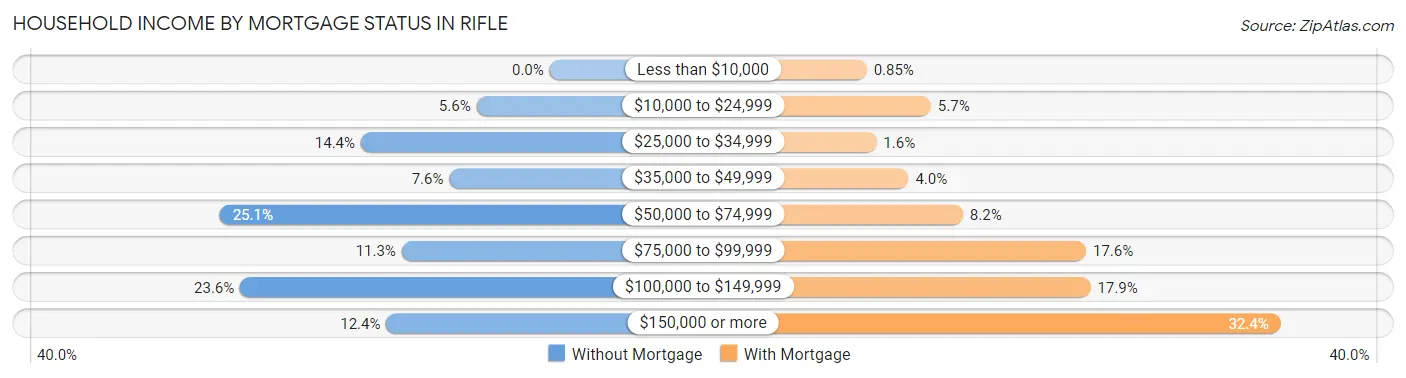
| Household Income | Without Mortgage | With Mortgage |
| Less than $10,000 | 0 (0.0%) | 15 (0.9%) |
| $10,000 to $24,999 | 43 (5.6%) | 101 (5.7%) |
| $25,000 to $34,999 | 111 (14.4%) | 28 (1.6%) |
| $35,000 to $49,999 | 59 (7.6%) | 71 (4.0%) |
| $50,000 to $74,999 | 194 (25.1%) | 144 (8.2%) |
| $75,000 to $99,999 | 87 (11.3%) | 309 (17.6%) |
| $100,000 to $149,999 | 182 (23.6%) | 315 (17.9%) |
| $150,000 or more | 96 (12.4%) | 570 (32.4%) |
| Total | 772 (100.0%) | 1,760 (100.0%) |
Property Value to Household Income Ratio in Rifle
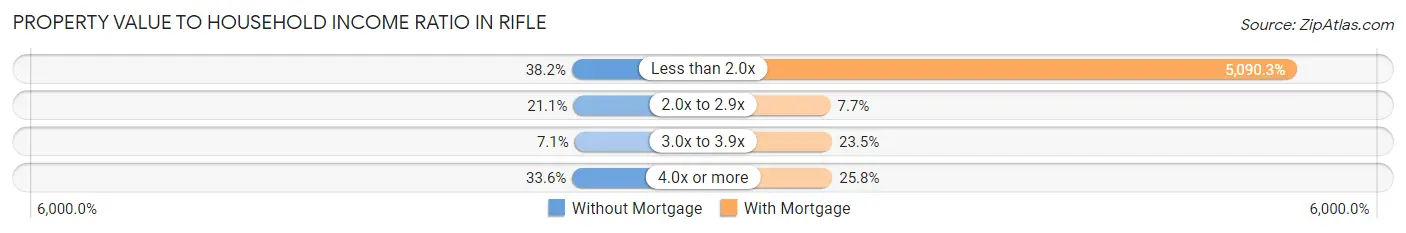
| Value-to-Income Ratio | Without Mortgage | With Mortgage |
| Less than 2.0x | 295 (38.2%) | 89,590 (5,090.3%) |
| 2.0x to 2.9x | 163 (21.1%) | 136 (7.7%) |
| 3.0x to 3.9x | 55 (7.1%) | 413 (23.5%) |
| 4.0x or more | 259 (33.6%) | 454 (25.8%) |
| Total | 772 (100.0%) | 1,760 (100.0%) |
Real Estate Taxes by Mortgage Status in Rifle
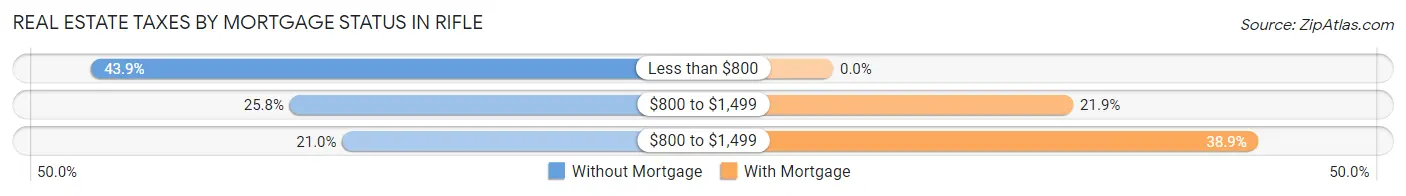
| Property Taxes | Without Mortgage | With Mortgage |
| Less than $800 | 339 (43.9%) | 0 (0.0%) |
| $800 to $1,499 | 199 (25.8%) | 386 (21.9%) |
| $800 to $1,499 | 162 (21.0%) | 684 (38.9%) |
| Total | 772 (100.0%) | 1,760 (100.0%) |
Health & Disability in Rifle
Health Insurance Coverage by Age in Rifle
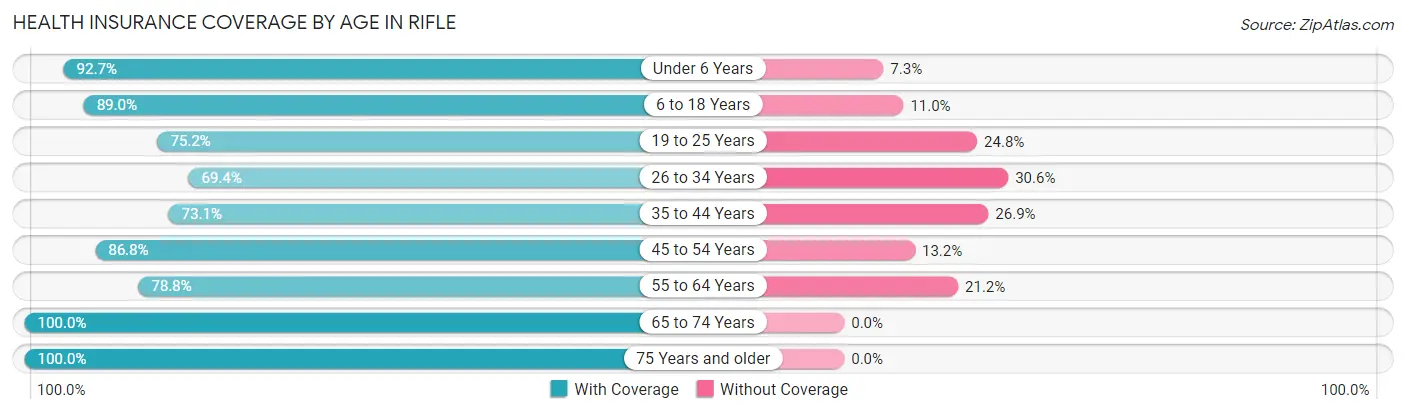
| Age Bracket | With Coverage | Without Coverage |
| Under 6 Years | 1,119 (92.7%) | 88 (7.3%) |
| 6 to 18 Years | 1,774 (89.0%) | 220 (11.0%) |
| 19 to 25 Years | 920 (75.2%) | 303 (24.8%) |
| 26 to 34 Years | 895 (69.4%) | 394 (30.6%) |
| 35 to 44 Years | 985 (73.1%) | 362 (26.9%) |
| 45 to 54 Years | 1,079 (86.8%) | 164 (13.2%) |
| 55 to 64 Years | 876 (78.8%) | 236 (21.2%) |
| 65 to 74 Years | 570 (100.0%) | 0 (0.0%) |
| 75 Years and older | 313 (100.0%) | 0 (0.0%) |
| Total | 8,531 (82.8%) | 1,767 (17.2%) |
Health Insurance Coverage by Citizenship Status in Rifle
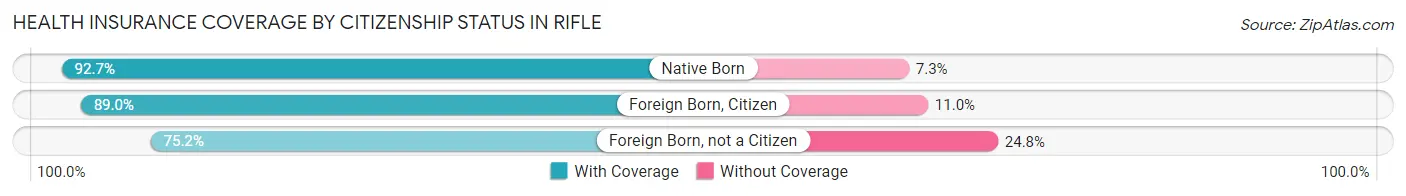
| Citizenship Status | With Coverage | Without Coverage |
| Native Born | 1,119 (92.7%) | 88 (7.3%) |
| Foreign Born, Citizen | 1,774 (89.0%) | 220 (11.0%) |
| Foreign Born, not a Citizen | 920 (75.2%) | 303 (24.8%) |
Health Insurance Coverage by Household Income in Rifle
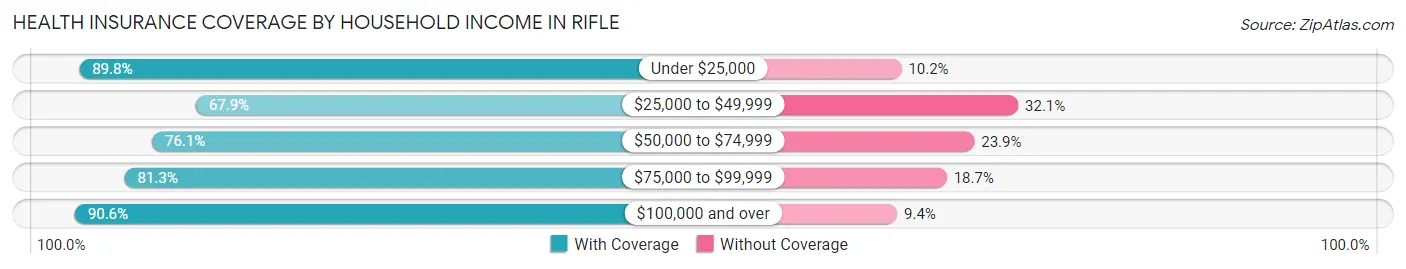
| Household Income | With Coverage | Without Coverage |
| Under $25,000 | 596 (89.8%) | 68 (10.2%) |
| $25,000 to $49,999 | 846 (67.9%) | 400 (32.1%) |
| $50,000 to $74,999 | 1,848 (76.1%) | 580 (23.9%) |
| $75,000 to $99,999 | 1,389 (81.3%) | 320 (18.7%) |
| $100,000 and over | 3,837 (90.6%) | 399 (9.4%) |
Public vs Private Health Insurance Coverage by Age in Rifle
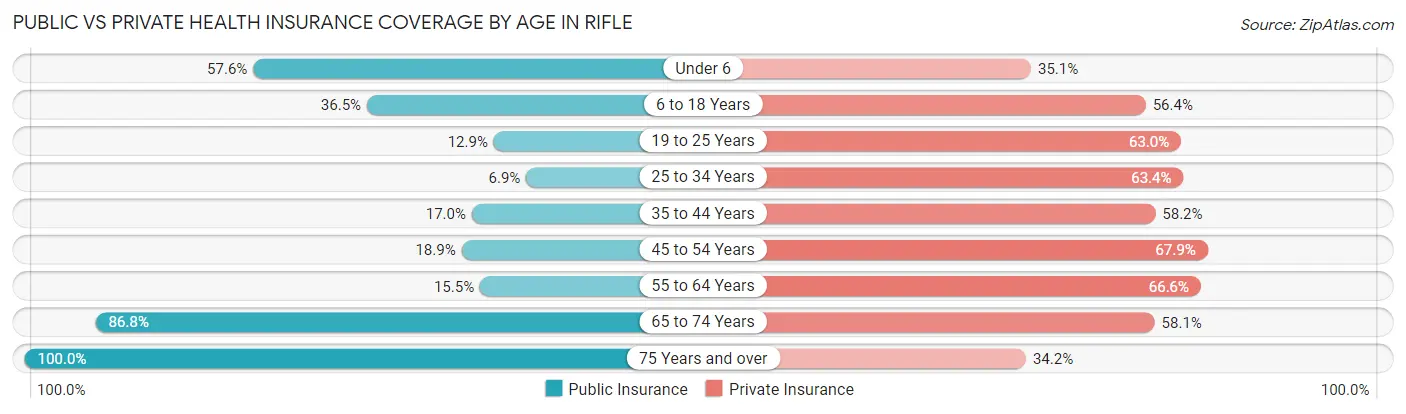
| Age Bracket | Public Insurance | Private Insurance |
| Under 6 | 695 (57.6%) | 424 (35.1%) |
| 6 to 18 Years | 727 (36.5%) | 1,125 (56.4%) |
| 19 to 25 Years | 158 (12.9%) | 770 (63.0%) |
| 25 to 34 Years | 89 (6.9%) | 817 (63.4%) |
| 35 to 44 Years | 229 (17.0%) | 784 (58.2%) |
| 45 to 54 Years | 235 (18.9%) | 844 (67.9%) |
| 55 to 64 Years | 172 (15.5%) | 741 (66.6%) |
| 65 to 74 Years | 495 (86.8%) | 331 (58.1%) |
| 75 Years and over | 313 (100.0%) | 107 (34.2%) |
| Total | 3,113 (30.2%) | 5,943 (57.7%) |
Disability Status by Sex by Age in Rifle
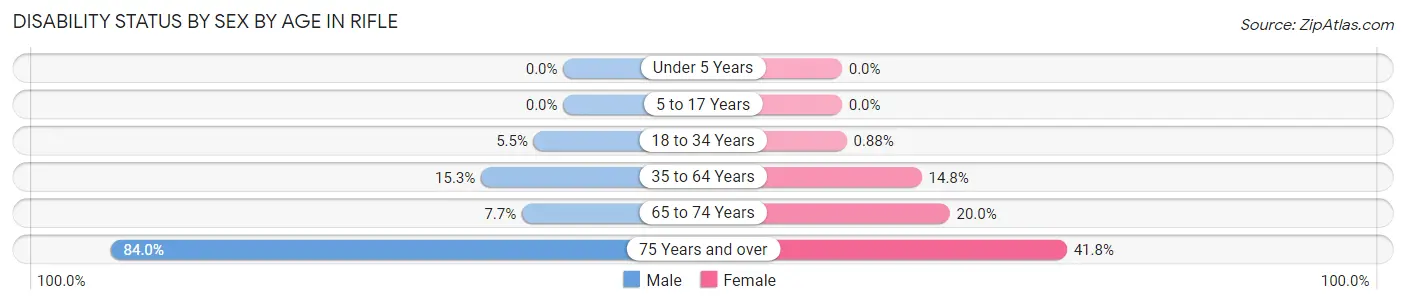
| Age Bracket | Male | Female |
| Under 5 Years | 0 (0.0%) | 0 (0.0%) |
| 5 to 17 Years | 0 (0.0%) | 0 (0.0%) |
| 18 to 34 Years | 67 (5.5%) | 13 (0.9%) |
| 35 to 64 Years | 301 (15.3%) | 256 (14.8%) |
| 65 to 74 Years | 23 (7.7%) | 54 (20.0%) |
| 75 Years and over | 100 (84.0%) | 81 (41.7%) |
Disability Class by Sex by Age in Rifle
Disability Class: Hearing Difficulty
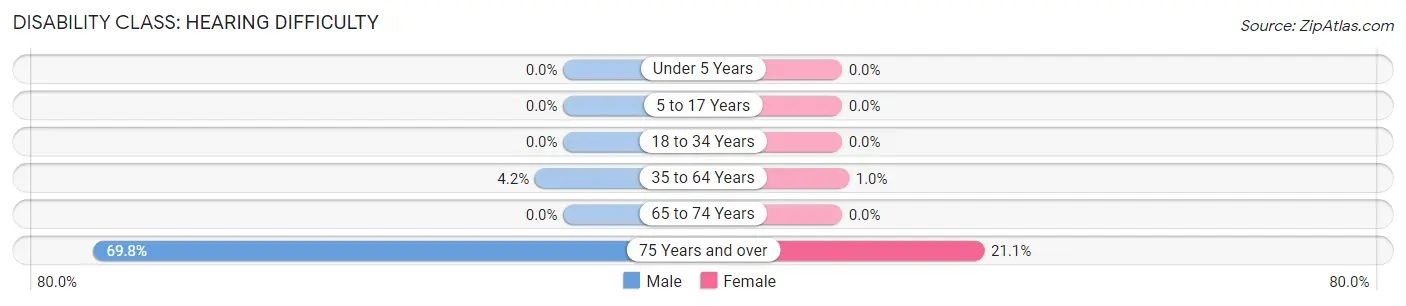
| Age Bracket | Male | Female |
| Under 5 Years | 0 (0.0%) | 0 (0.0%) |
| 5 to 17 Years | 0 (0.0%) | 0 (0.0%) |
| 18 to 34 Years | 0 (0.0%) | 0 (0.0%) |
| 35 to 64 Years | 83 (4.2%) | 18 (1.0%) |
| 65 to 74 Years | 0 (0.0%) | 0 (0.0%) |
| 75 Years and over | 83 (69.8%) | 41 (21.1%) |
Disability Class: Vision Difficulty
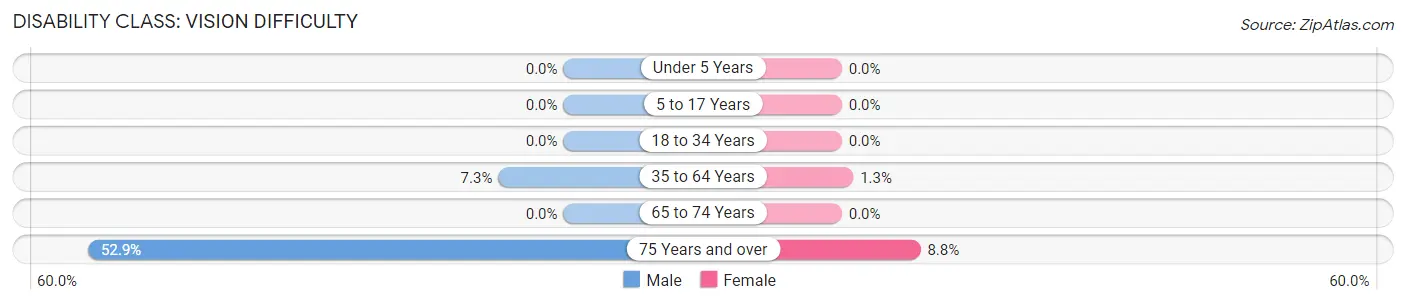
| Age Bracket | Male | Female |
| Under 5 Years | 0 (0.0%) | 0 (0.0%) |
| 5 to 17 Years | 0 (0.0%) | 0 (0.0%) |
| 18 to 34 Years | 0 (0.0%) | 0 (0.0%) |
| 35 to 64 Years | 143 (7.2%) | 22 (1.3%) |
| 65 to 74 Years | 0 (0.0%) | 0 (0.0%) |
| 75 Years and over | 63 (52.9%) | 17 (8.8%) |
Disability Class: Cognitive Difficulty
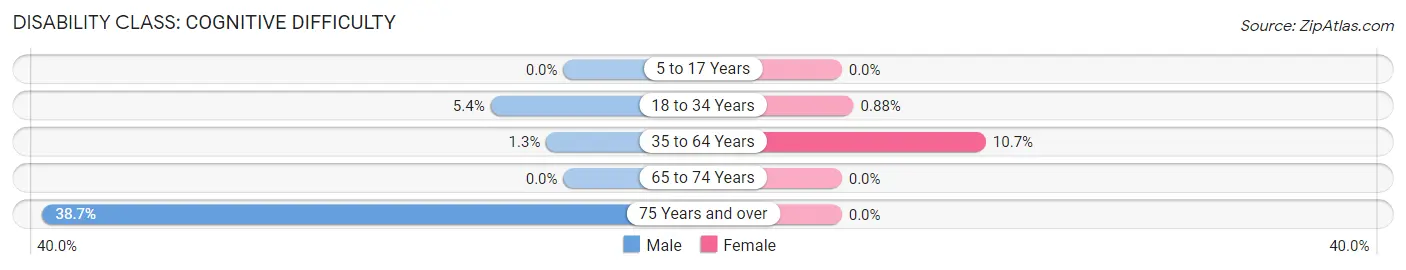
| Age Bracket | Male | Female |
| 5 to 17 Years | 0 (0.0%) | 0 (0.0%) |
| 18 to 34 Years | 66 (5.4%) | 13 (0.9%) |
| 35 to 64 Years | 25 (1.3%) | 185 (10.7%) |
| 65 to 74 Years | 0 (0.0%) | 0 (0.0%) |
| 75 Years and over | 46 (38.7%) | 0 (0.0%) |
Disability Class: Ambulatory Difficulty
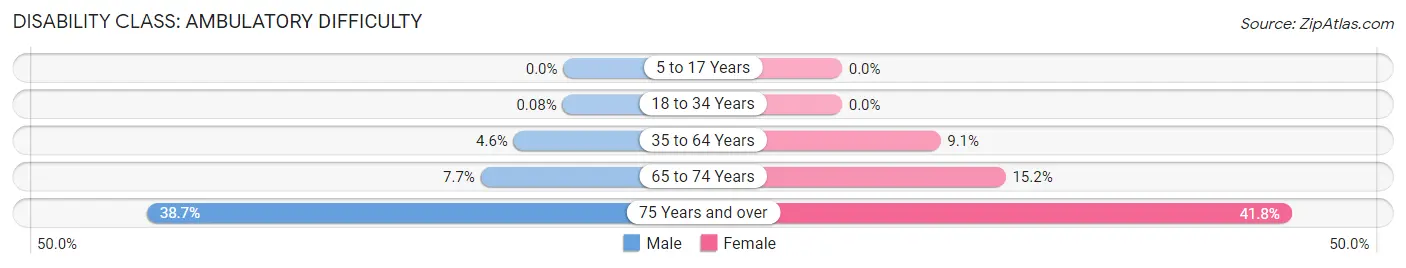
| Age Bracket | Male | Female |
| 5 to 17 Years | 0 (0.0%) | 0 (0.0%) |
| 18 to 34 Years | 1 (0.1%) | 0 (0.0%) |
| 35 to 64 Years | 91 (4.6%) | 158 (9.1%) |
| 65 to 74 Years | 23 (7.7%) | 41 (15.2%) |
| 75 Years and over | 46 (38.7%) | 81 (41.7%) |
Disability Class: Self-Care Difficulty
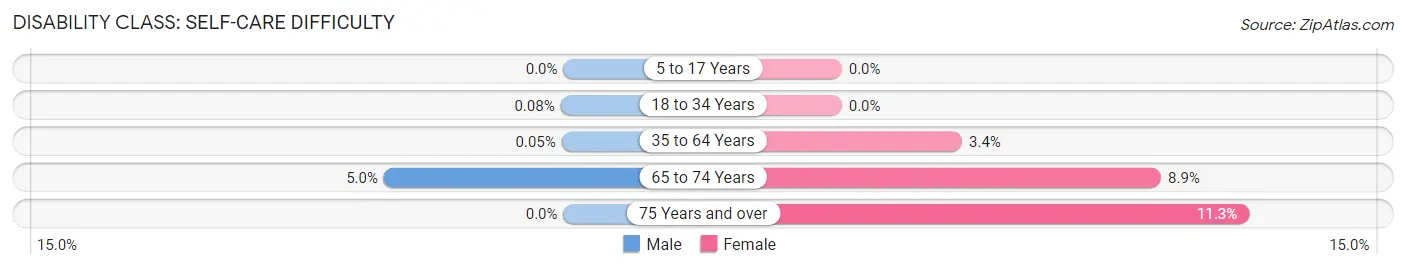
| Age Bracket | Male | Female |
| 5 to 17 Years | 0 (0.0%) | 0 (0.0%) |
| 18 to 34 Years | 1 (0.1%) | 0 (0.0%) |
| 35 to 64 Years | 1 (0.1%) | 58 (3.4%) |
| 65 to 74 Years | 15 (5.0%) | 24 (8.9%) |
| 75 Years and over | 0 (0.0%) | 22 (11.3%) |
Technology Access in Rifle
Computing Device Access in Rifle
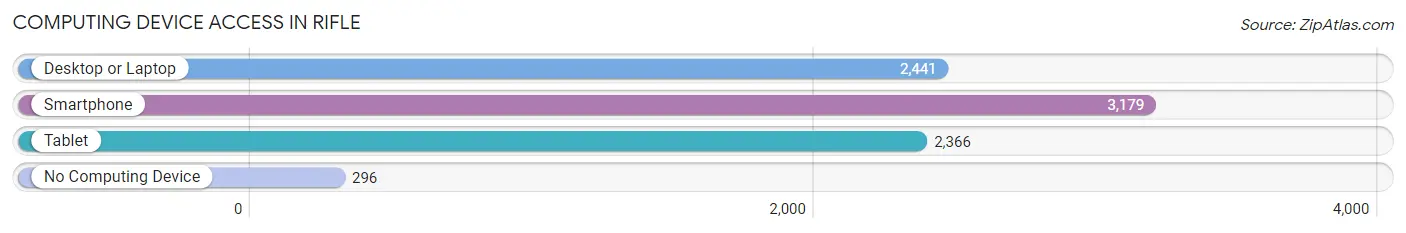
| Device Type | # Households | % Households |
| Desktop or Laptop | 2,441 | 67.5% |
| Smartphone | 3,179 | 87.9% |
| Tablet | 2,366 | 65.4% |
| No Computing Device | 296 | 8.2% |
| Total | 3,615 | 100.0% |
Internet Access in Rifle
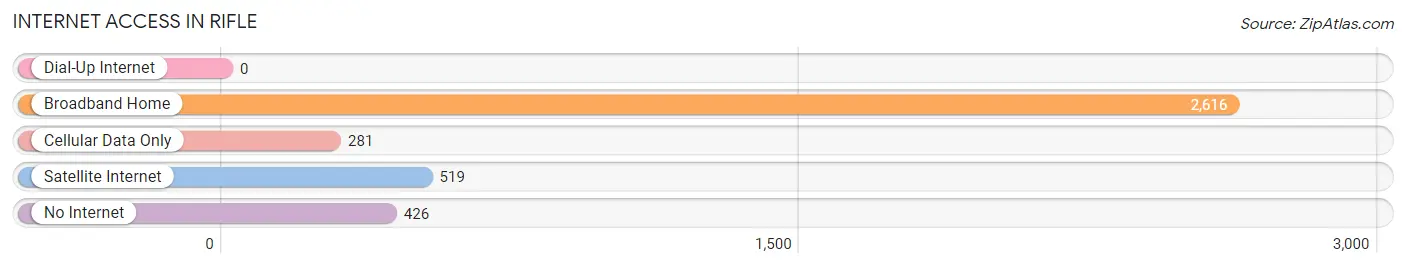
| Internet Type | # Households | % Households |
| Dial-Up Internet | 0 | 0.0% |
| Broadband Home | 2,616 | 72.4% |
| Cellular Data Only | 281 | 7.8% |
| Satellite Internet | 519 | 14.4% |
| No Internet | 426 | 11.8% |
| Total | 3,615 | 100.0% |
Rifle Summary
Rifle, Colorado is a small city located in Garfield County in the western part of the state. It is situated along the Colorado River, about 30 miles west of Glenwood Springs and about 100 miles east of Grand Junction. The city has a population of about 9,172 people, according to the 2010 census.
Rifle was founded in 1882 by a group of settlers who were looking for a place to settle and start a new life. The city was named after the nearby Rifle Creek, which was named after the rifle-shaped rocks found in the area. The city was incorporated in 1885 and has since grown to become a thriving community.
Geographically, Rifle is located in the Colorado River Valley, which is surrounded by the Rocky Mountains. The city is situated at an elevation of 5,890 feet above sea level. The climate in Rifle is semi-arid, with hot summers and cold winters. The average annual temperature is around 50 degrees Fahrenheit.
The economy of Rifle is largely based on agriculture, tourism, and energy production. Agriculture is the main industry in the area, with the majority of the land being used for farming and ranching. Tourism is also an important part of the local economy, with many visitors coming to the area to enjoy the natural beauty of the Rocky Mountains. Energy production is also a major part of the economy, with the nearby Rifle Gap Reservoir providing hydroelectric power to the area.
Demographically, the population of Rifle is mostly white, with a small percentage of African Americans, Hispanics, and Native Americans. The median household income in the city is around $50,000, and the median home value is around $200,000. The unemployment rate in the city is around 4.5%, which is lower than the national average.
Rifle is a great place to live, work, and play. The city has a small-town feel, with a friendly and welcoming atmosphere. The city is also home to a variety of outdoor activities, including hiking, camping, fishing, and skiing. The city also has a vibrant arts and culture scene, with a variety of galleries, museums, and theaters. Rifle is a great place to call home, and it is sure to provide a great quality of life for its residents.
Common Questions
What is Per Capita Income in Rifle?
Per Capita income in Rifle is $30,798.
What is the Median Family Income in Rifle?
Median Family Income in Rifle is $77,414.
What is the Median Household income in Rifle?
Median Household Income in Rifle is $72,955.
What is Income or Wage Gap in Rifle?
Income or Wage Gap in Rifle is 33.2%.
Women in Rifle earn 66.8 cents for every dollar earned by a man.
What is Inequality or Gini Index in Rifle?
Inequality or Gini Index in Rifle is 0.35.
What is the Total Population of Rifle?
Total Population of Rifle is 10,420.
What is the Total Male Population of Rifle?
Total Male Population of Rifle is 5,065.
What is the Total Female Population of Rifle?
Total Female Population of Rifle is 5,355.
What is the Ratio of Males per 100 Females in Rifle?
There are 94.58 Males per 100 Females in Rifle.
What is the Ratio of Females per 100 Males in Rifle?
There are 105.73 Females per 100 Males in Rifle.
What is the Median Population Age in Rifle?
Median Population Age in Rifle is 32.1 Years.
What is the Average Family Size in Rifle
Average Family Size in Rifle is 3.3 People.
What is the Average Household Size in Rifle
Average Household Size in Rifle is 2.8 People.
How Large is the Labor Force in Rifle?
There are 6,002 People in the Labor Forcein in Rifle.
What is the Percentage of People in the Labor Force in Rifle?
77.9% of People are in the Labor Force in Rifle.
What is the Unemployment Rate in Rifle?
Unemployment Rate in Rifle is 4.0%.