Ridgway, CO Map & Demographics
Ridgway Map
Ridgway Overview
$50,136
PER CAPITA INCOME
$124,286
AVG FAMILY INCOME
$82,903
AVG HOUSEHOLD INCOME
26.2%
WAGE / INCOME GAP [ % ]
73.8¢/ $1
WAGE / INCOME GAP [ $ ]
0.48
INEQUALITY / GINI INDEX
1,093
TOTAL POPULATION
553
MALE POPULATION
540
FEMALE POPULATION
102.41
MALES / 100 FEMALES
97.65
FEMALES / 100 MALES
48.0
MEDIAN AGE
3.0
AVG FAMILY SIZE
1.9
AVG HOUSEHOLD SIZE
631
LABOR FORCE [ PEOPLE ]
65.5%
PERCENT IN LABOR FORCE
10.1%
UNEMPLOYMENT RATE
Ridgway Zip Codes
Ridgway Area Codes
Income in Ridgway
Income Overview in Ridgway
Per Capita Income in Ridgway is $50,136, while median incomes of families and households are $124,286 and $82,903 respectively.
| Characteristic | Number | Measure |
| Per Capita Income | 1,093 | $50,136 |
| Median Family Income | 188 | $124,286 |
| Mean Family Income | 188 | $156,011 |
| Median Household Income | 575 | $82,903 |
| Mean Household Income | 575 | $96,147 |
| Income Deficit | 188 | $0 |
| Wage / Income Gap (%) | 1,093 | 26.18% |
| Wage / Income Gap ($) | 1,093 | 73.82¢ per $1 |
| Gini / Inequality Index | 1,093 | 0.48 |
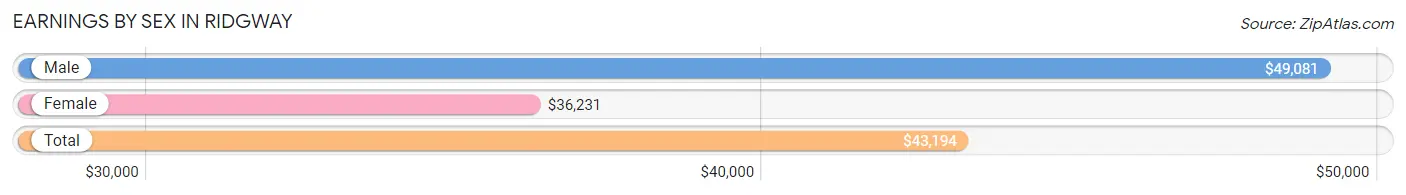
Earnings by Sex in Ridgway
Average Earnings in Ridgway are $43,194, $49,081 for men and $36,231 for women, a difference of 26.2%.
| Sex | Number | Average Earnings |
| Male | 417 (57.1%) | $49,081 |
| Female | 313 (42.9%) | $36,231 |
| Total | 730 (100.0%) | $43,194 |
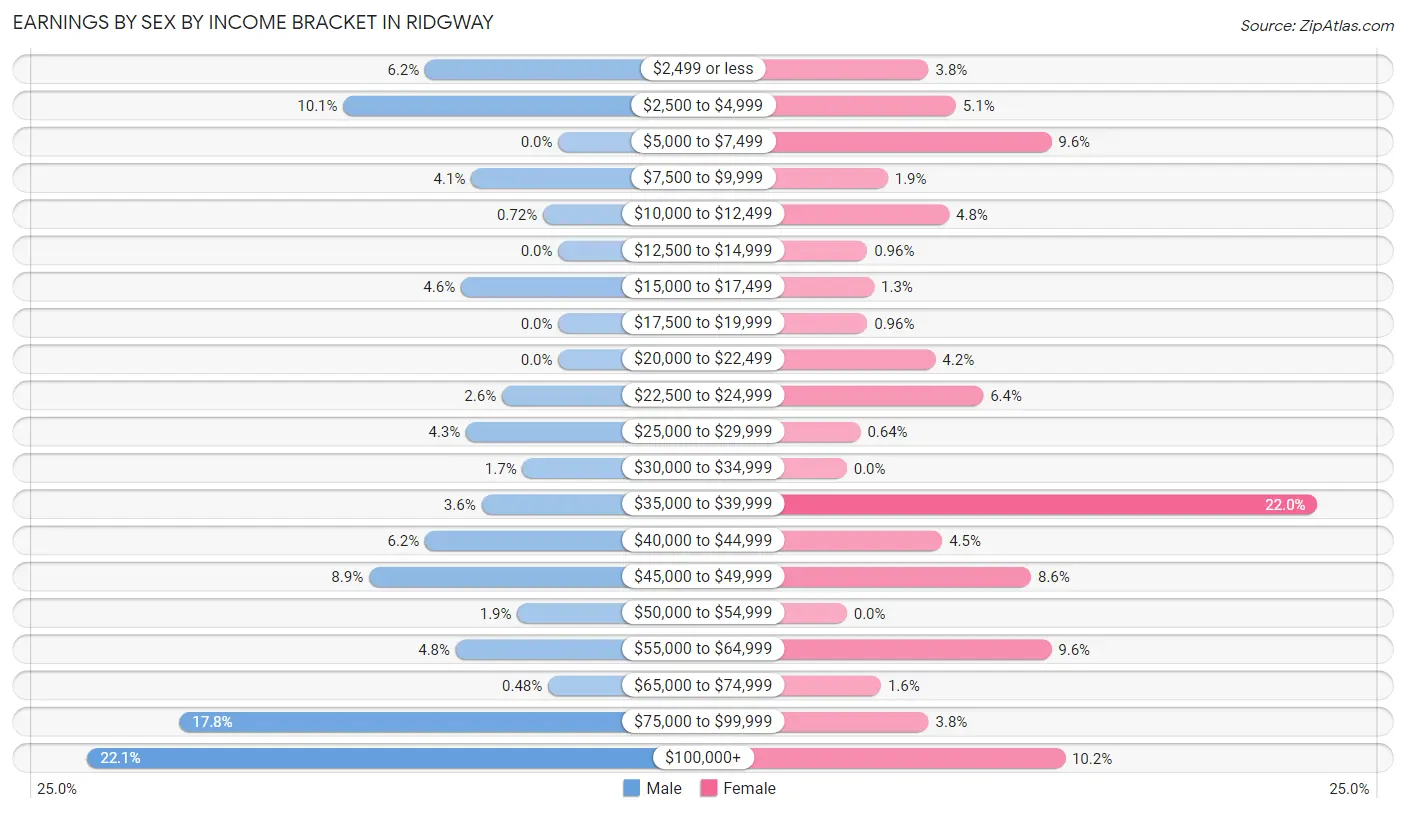
Earnings by Sex by Income Bracket in Ridgway
The most common earnings brackets in Ridgway are $100,000+ for men (92 | 22.1%) and $35,000 to $39,999 for women (69 | 22.0%).
| Income | Male | Female |
| $2,499 or less | 26 (6.2%) | 12 (3.8%) |
| $2,500 to $4,999 | 42 (10.1%) | 16 (5.1%) |
| $5,000 to $7,499 | 0 (0.0%) | 30 (9.6%) |
| $7,500 to $9,999 | 17 (4.1%) | 6 (1.9%) |
| $10,000 to $12,499 | 3 (0.7%) | 15 (4.8%) |
| $12,500 to $14,999 | 0 (0.0%) | 3 (1.0%) |
| $15,000 to $17,499 | 19 (4.6%) | 4 (1.3%) |
| $17,500 to $19,999 | 0 (0.0%) | 3 (1.0%) |
| $20,000 to $22,499 | 0 (0.0%) | 13 (4.2%) |
| $22,500 to $24,999 | 11 (2.6%) | 20 (6.4%) |
| $25,000 to $29,999 | 18 (4.3%) | 2 (0.6%) |
| $30,000 to $34,999 | 7 (1.7%) | 0 (0.0%) |
| $35,000 to $39,999 | 15 (3.6%) | 69 (22.0%) |
| $40,000 to $44,999 | 26 (6.2%) | 14 (4.5%) |
| $45,000 to $49,999 | 37 (8.9%) | 27 (8.6%) |
| $50,000 to $54,999 | 8 (1.9%) | 0 (0.0%) |
| $55,000 to $64,999 | 20 (4.8%) | 30 (9.6%) |
| $65,000 to $74,999 | 2 (0.5%) | 5 (1.6%) |
| $75,000 to $99,999 | 74 (17.7%) | 12 (3.8%) |
| $100,000+ | 92 (22.1%) | 32 (10.2%) |
| Total | 417 (100.0%) | 313 (100.0%) |
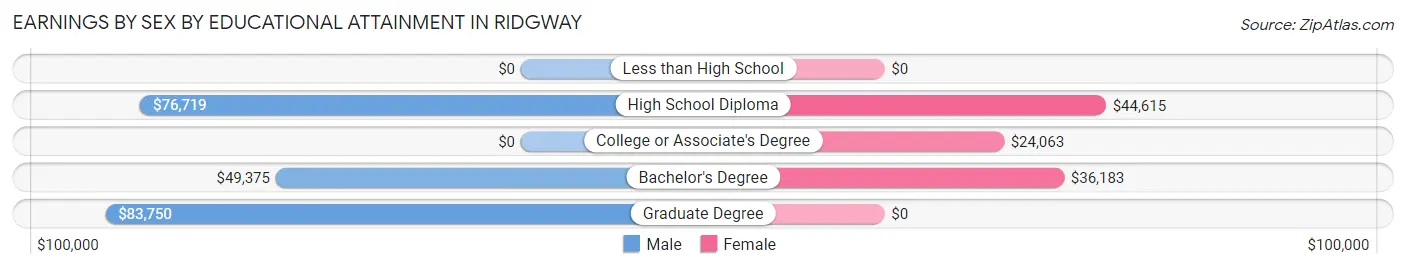
Earnings by Sex by Educational Attainment in Ridgway
Average earnings in Ridgway are $49,081 for men and $36,458 for women, a difference of 25.7%. Men with an educational attainment of graduate degree enjoy the highest average annual earnings of $83,750, while those with bachelor's degree education earn the least with $49,375. Women with an educational attainment of high school diploma earn the most with the average annual earnings of $44,615, while those with college or associate's degree education have the smallest earnings of $24,063.
| Educational Attainment | Male Income | Female Income |
| Less than High School | - | - |
| High School Diploma | $76,719 | $44,615 |
| College or Associate's Degree | - | - |
| Bachelor's Degree | $49,375 | $36,183 |
| Graduate Degree | $83,750 | $0 |
| Total | $49,081 | $36,458 |
Family Income in Ridgway
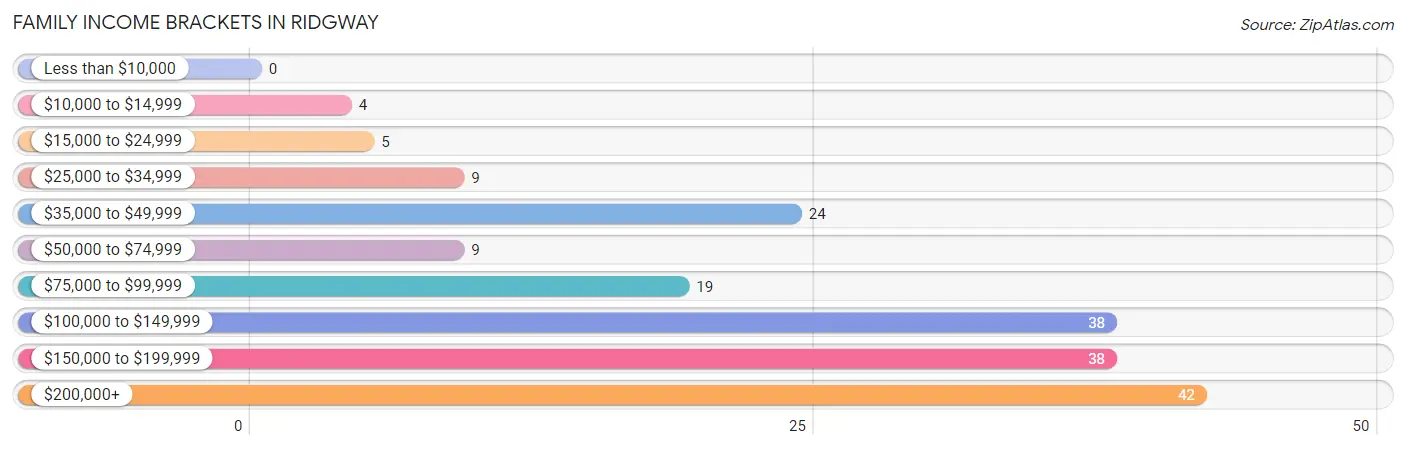
Family Income Brackets in Ridgway
According to the Ridgway family income data, there are 42 families falling into the $200,000+ income range, which is the most common income bracket and makes up 22.3% of all families.
| Income Bracket | # Families | % Families |
| Less than $10,000 | 0 | 0.0% |
| $10,000 to $14,999 | 4 | 2.1% |
| $15,000 to $24,999 | 5 | 2.7% |
| $25,000 to $34,999 | 9 | 4.8% |
| $35,000 to $49,999 | 24 | 12.8% |
| $50,000 to $74,999 | 9 | 4.8% |
| $75,000 to $99,999 | 19 | 10.1% |
| $100,000 to $149,999 | 38 | 20.2% |
| $150,000 to $199,999 | 38 | 20.2% |
| $200,000+ | 42 | 22.3% |
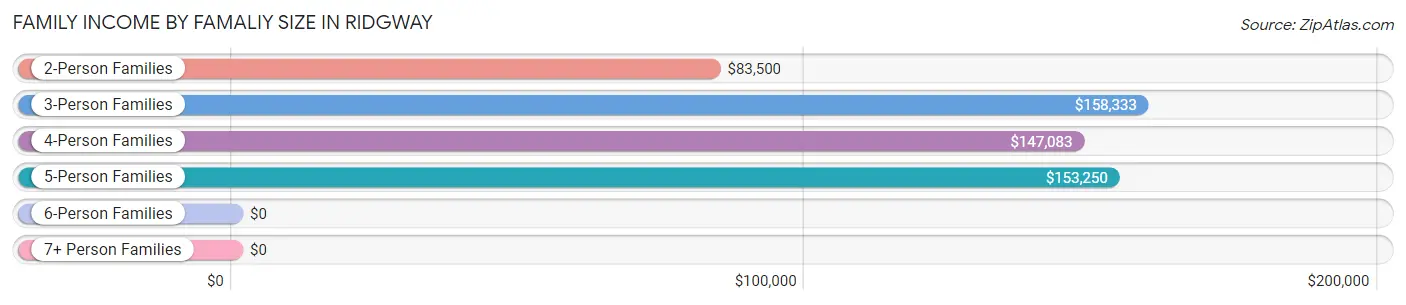
Family Income by Famaliy Size in Ridgway
3-person families (40 | 21.3%) account for the highest median family income in Ridgway with $158,333 per family, while 3-person families (40 | 21.3%) have the highest median income of $52,778 per family member.
| Income Bracket | # Families | Median Income |
| 2-Person Families | 94 (50.0%) | $83,500 |
| 3-Person Families | 40 (21.3%) | $158,333 |
| 4-Person Families | 31 (16.5%) | $147,083 |
| 5-Person Families | 20 (10.6%) | $153,250 |
| 6-Person Families | 3 (1.6%) | $0 |
| 7+ Person Families | 0 (0.0%) | $0 |
| Total | 188 (100.0%) | $124,286 |
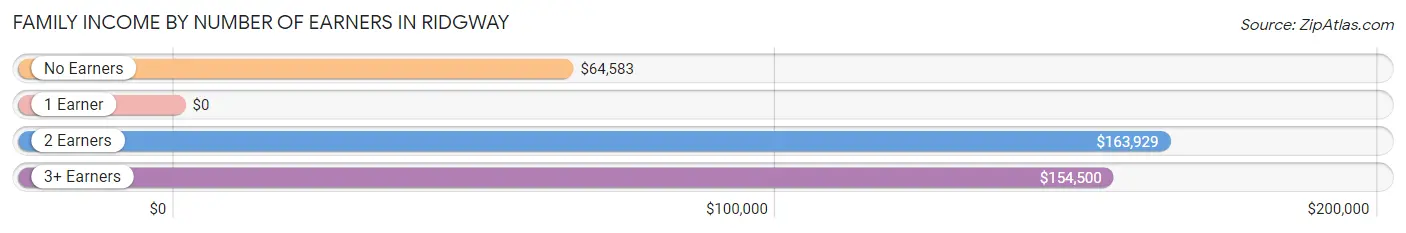
Family Income by Number of Earners in Ridgway
| Number of Earners | # Families | Median Income |
| No Earners | 37 (19.7%) | $64,583 |
| 1 Earner | 55 (29.3%) | $0 |
| 2 Earners | 80 (42.5%) | $163,929 |
| 3+ Earners | 16 (8.5%) | $154,500 |
| Total | 188 (100.0%) | $124,286 |
Household Income in Ridgway
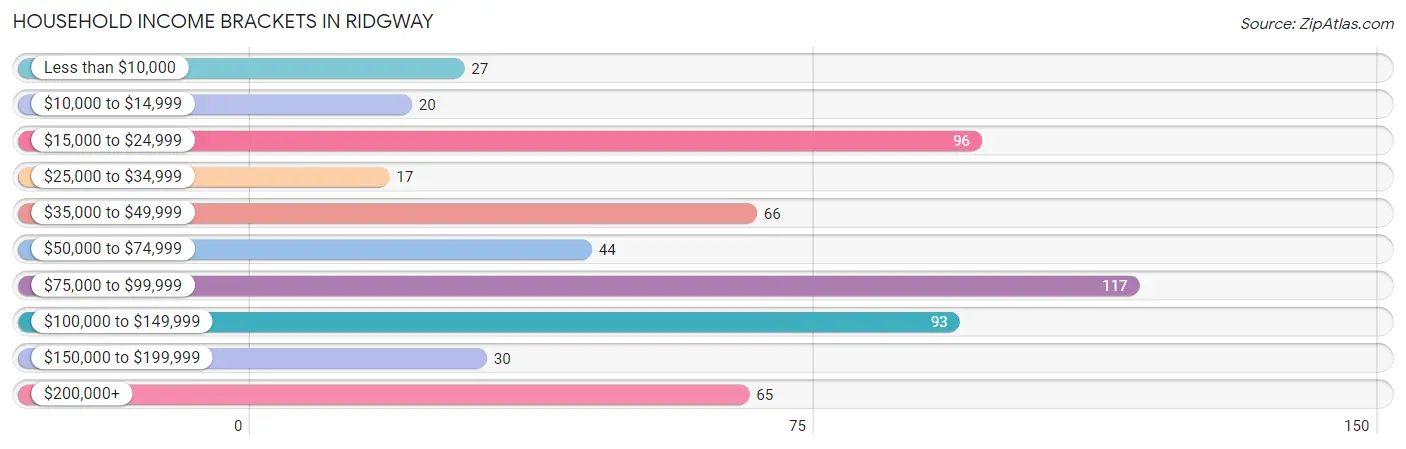
Household Income Brackets in Ridgway
With 117 households falling in the category, the $75,000 to $99,999 income range is the most frequent in Ridgway, accounting for 20.3% of all households. In contrast, only 17 households (3.0%) fall into the $25,000 to $34,999 income bracket, making it the least populous group.
| Income Bracket | # Households | % Households |
| Less than $10,000 | 27 | 4.7% |
| $10,000 to $14,999 | 20 | 3.5% |
| $15,000 to $24,999 | 96 | 16.7% |
| $25,000 to $34,999 | 17 | 3.0% |
| $35,000 to $49,999 | 66 | 11.5% |
| $50,000 to $74,999 | 44 | 7.7% |
| $75,000 to $99,999 | 117 | 20.3% |
| $100,000 to $149,999 | 93 | 16.2% |
| $150,000 to $199,999 | 30 | 5.2% |
| $200,000+ | 65 | 11.3% |
Household Income by Householder Age in Ridgway
The median household income in Ridgway is $82,903, with the highest median household income of $103,333 found in the 45 to 64 years age bracket for the primary householder. A total of 200 households (34.8%) fall into this category.
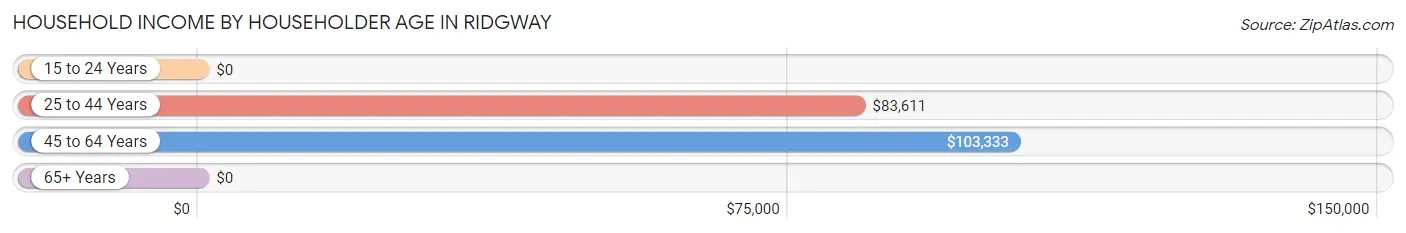
| Income Bracket | # Households | Median Income |
| 15 to 24 Years | 0 (0.0%) | $0 |
| 25 to 44 Years | 206 (35.8%) | $83,611 |
| 45 to 64 Years | 200 (34.8%) | $103,333 |
| 65+ Years | 169 (29.4%) | $0 |
| Total | 575 (100.0%) | $82,903 |
Poverty in Ridgway
Income Below Poverty by Sex and Age in Ridgway
With 6.9% poverty level for males and 17.8% for females among the residents of Ridgway, 55 to 64 year old males and 25 to 34 year old females are the most vulnerable to poverty, with 19 males (20.4%) and 39 females (29.8%) in their respective age groups living below the poverty level.
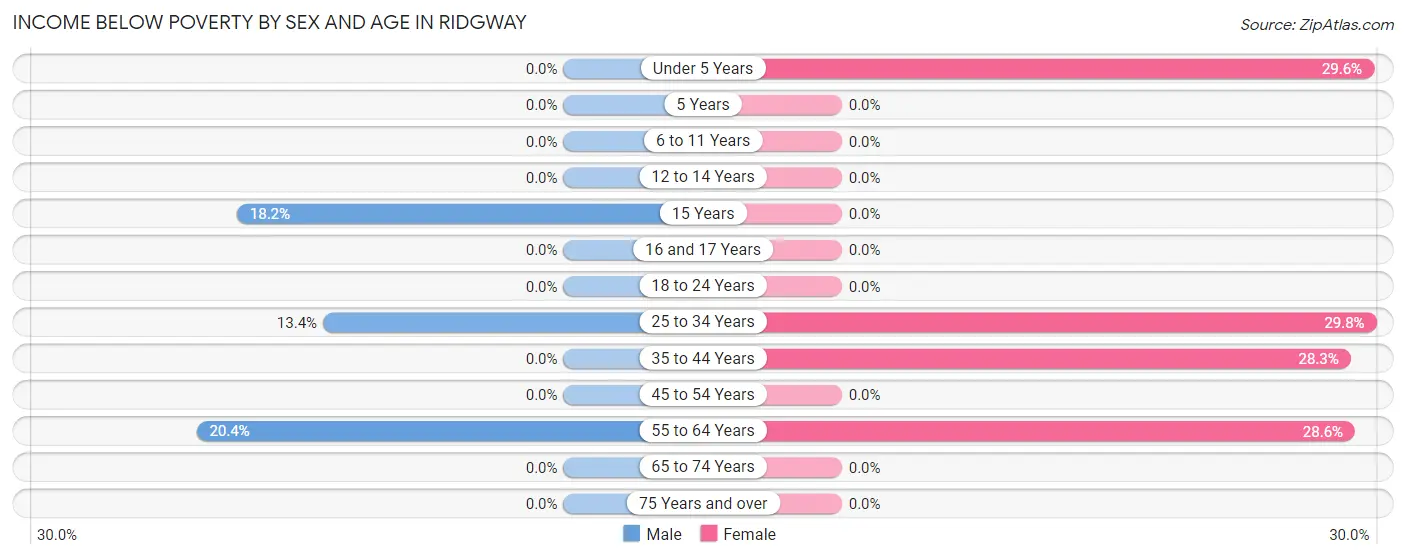
| Age Bracket | Male | Female |
| Under 5 Years | 0 (0.0%) | 8 (29.6%) |
| 5 Years | 0 (0.0%) | 0 (0.0%) |
| 6 to 11 Years | 0 (0.0%) | 0 (0.0%) |
| 12 to 14 Years | 0 (0.0%) | 0 (0.0%) |
| 15 Years | 2 (18.2%) | 0 (0.0%) |
| 16 and 17 Years | 0 (0.0%) | 0 (0.0%) |
| 18 to 24 Years | 0 (0.0%) | 0 (0.0%) |
| 25 to 34 Years | 17 (13.4%) | 39 (29.8%) |
| 35 to 44 Years | 0 (0.0%) | 17 (28.3%) |
| 45 to 54 Years | 0 (0.0%) | 0 (0.0%) |
| 55 to 64 Years | 19 (20.4%) | 32 (28.6%) |
| 65 to 74 Years | 0 (0.0%) | 0 (0.0%) |
| 75 Years and over | 0 (0.0%) | 0 (0.0%) |
| Total | 38 (6.9%) | 96 (17.8%) |
Income Above Poverty by Sex and Age in Ridgway
According to the poverty statistics in Ridgway, males aged under 5 years and females aged 5 years are the age groups that are most secure financially, with 100.0% of males and 100.0% of females in these age groups living above the poverty line.
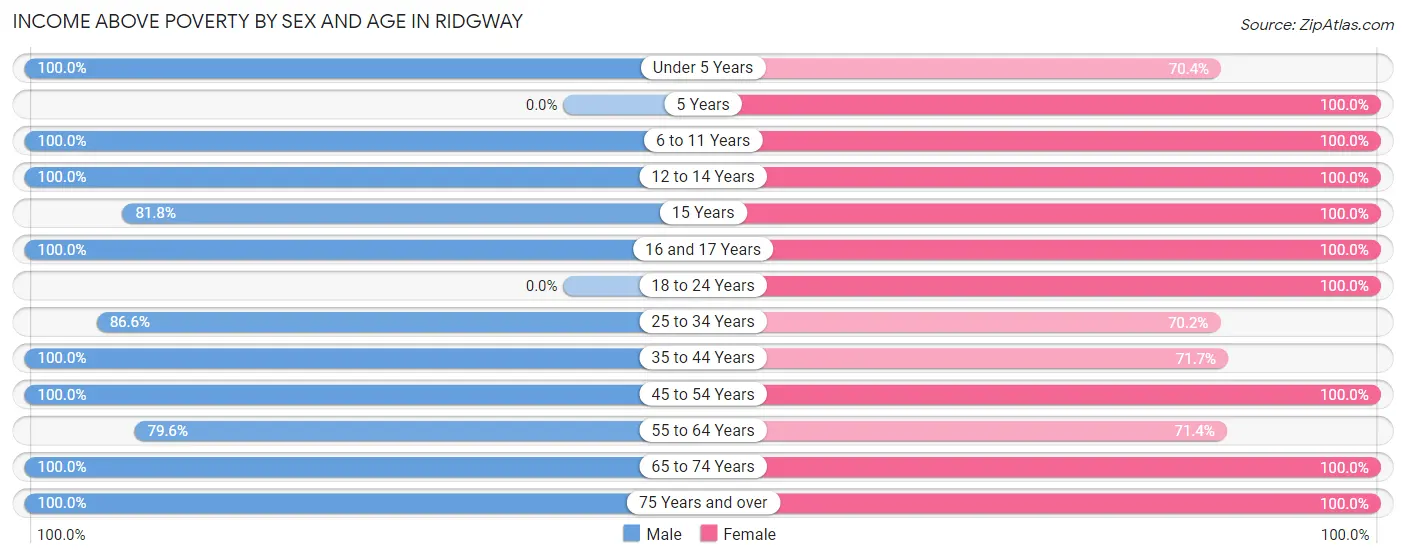
| Age Bracket | Male | Female |
| Under 5 Years | 14 (100.0%) | 19 (70.4%) |
| 5 Years | 0 (0.0%) | 7 (100.0%) |
| 6 to 11 Years | 5 (100.0%) | 39 (100.0%) |
| 12 to 14 Years | 9 (100.0%) | 8 (100.0%) |
| 15 Years | 9 (81.8%) | 5 (100.0%) |
| 16 and 17 Years | 13 (100.0%) | 2 (100.0%) |
| 18 to 24 Years | 0 (0.0%) | 10 (100.0%) |
| 25 to 34 Years | 110 (86.6%) | 92 (70.2%) |
| 35 to 44 Years | 37 (100.0%) | 43 (71.7%) |
| 45 to 54 Years | 86 (100.0%) | 52 (100.0%) |
| 55 to 64 Years | 74 (79.6%) | 80 (71.4%) |
| 65 to 74 Years | 124 (100.0%) | 60 (100.0%) |
| 75 Years and over | 29 (100.0%) | 27 (100.0%) |
| Total | 510 (93.1%) | 444 (82.2%) |
Income Below Poverty Among Married-Couple Families in Ridgway
The poverty statistics for married-couple families in Ridgway show that 1.2% or 2 of the total 163 families live below the poverty line. Families with no children have the highest poverty rate of 2.2%, comprising of 2 families. On the other hand, families with 1 or 2 children have the lowest poverty rate of 0.0%, which includes 0 families.
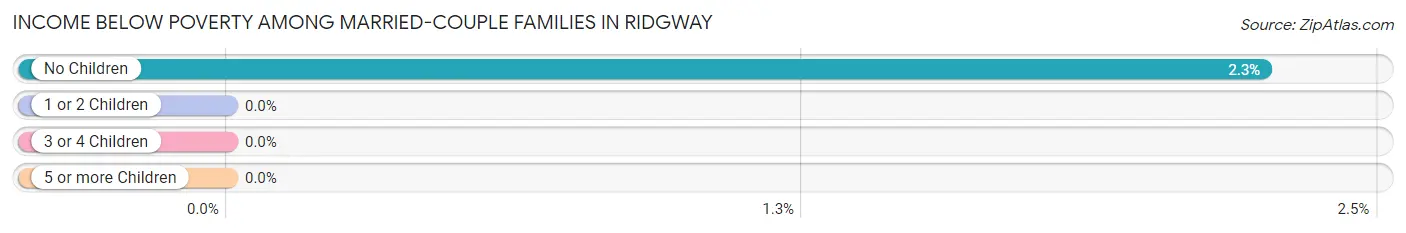
| Children | Above Poverty | Below Poverty |
| No Children | 87 (97.8%) | 2 (2.2%) |
| 1 or 2 Children | 64 (100.0%) | 0 (0.0%) |
| 3 or 4 Children | 10 (100.0%) | 0 (0.0%) |
| 5 or more Children | 0 (0.0%) | 0 (0.0%) |
| Total | 161 (98.8%) | 2 (1.2%) |
Income Below Poverty Among Single-Parent Households in Ridgway
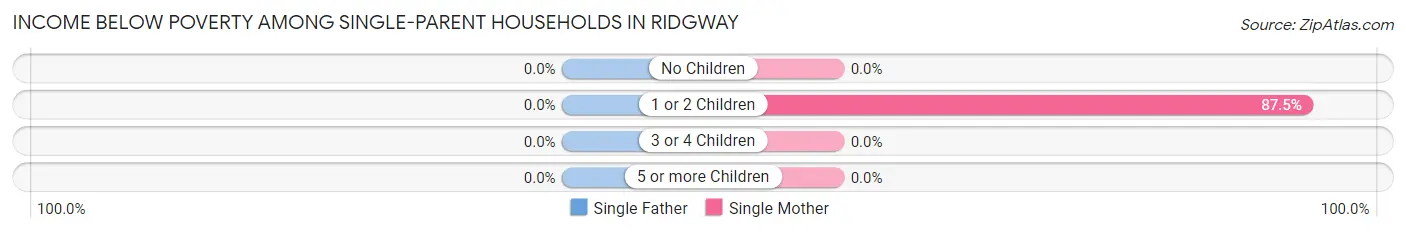
| Children | Single Father | Single Mother |
| No Children | 0 (0.0%) | 0 (0.0%) |
| 1 or 2 Children | 0 (0.0%) | 7 (87.5%) |
| 3 or 4 Children | 0 (0.0%) | 0 (0.0%) |
| 5 or more Children | 0 (0.0%) | 0 (0.0%) |
| Total | 0 (0.0%) | 7 (58.3%) |
Income Below Poverty Among Married-Couple vs Single-Parent Households in Ridgway
The poverty data for Ridgway shows that 2 of the married-couple family households (1.2%) and 7 of the single-parent households (28.0%) are living below the poverty level. Within the married-couple family households, those with no children have the highest poverty rate, with 2 households (2.2%) falling below the poverty line. Among the single-parent households, those with 1 or 2 children have the highest poverty rate, with 7 household (36.8%) living below poverty.
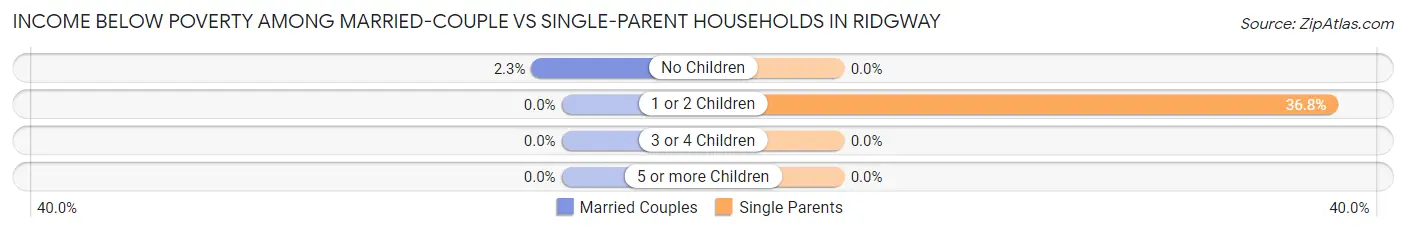
| Children | Married-Couple Families | Single-Parent Households |
| No Children | 2 (2.2%) | 0 (0.0%) |
| 1 or 2 Children | 0 (0.0%) | 7 (36.8%) |
| 3 or 4 Children | 0 (0.0%) | 0 (0.0%) |
| 5 or more Children | 0 (0.0%) | 0 (0.0%) |
| Total | 2 (1.2%) | 7 (28.0%) |
Race in Ridgway
The most populous races in Ridgway are White / Caucasian (1,003 | 91.8%), Two or more Races (47 | 4.3%), and Hispanic or Latino (42 | 3.8%).
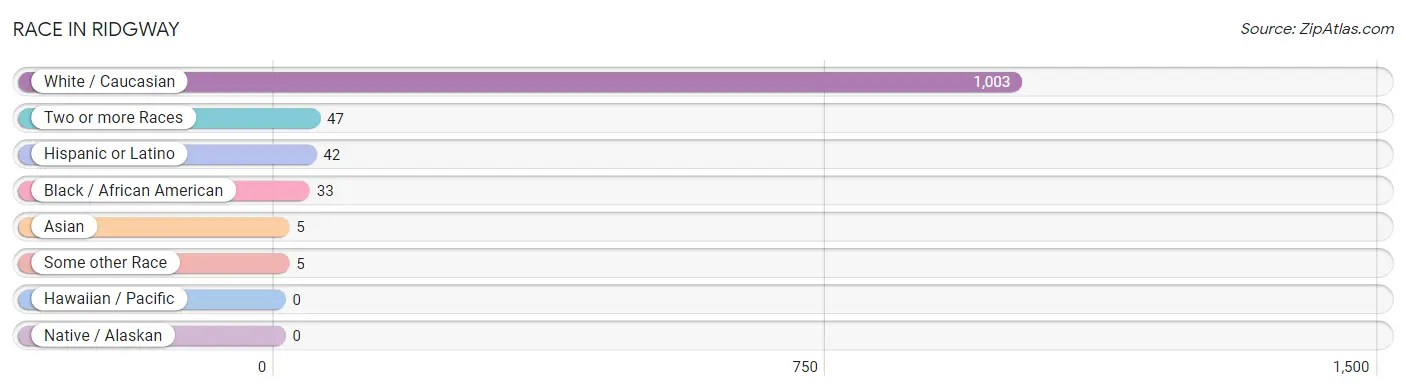
| Race | # Population | % Population |
| Asian | 5 | 0.5% |
| Black / African American | 33 | 3.0% |
| Hawaiian / Pacific | 0 | 0.0% |
| Hispanic or Latino | 42 | 3.8% |
| Native / Alaskan | 0 | 0.0% |
| White / Caucasian | 1,003 | 91.8% |
| Two or more Races | 47 | 4.3% |
| Some other Race | 5 | 0.5% |
| Total | 1,093 | 100.0% |
Ancestry in Ridgway
The most populous ancestries reported in Ridgway are English (290 | 26.5%), German (217 | 19.9%), Scottish (94 | 8.6%), Irish (80 | 7.3%), and European (47 | 4.3%), together accounting for 66.6% of all Ridgway residents.
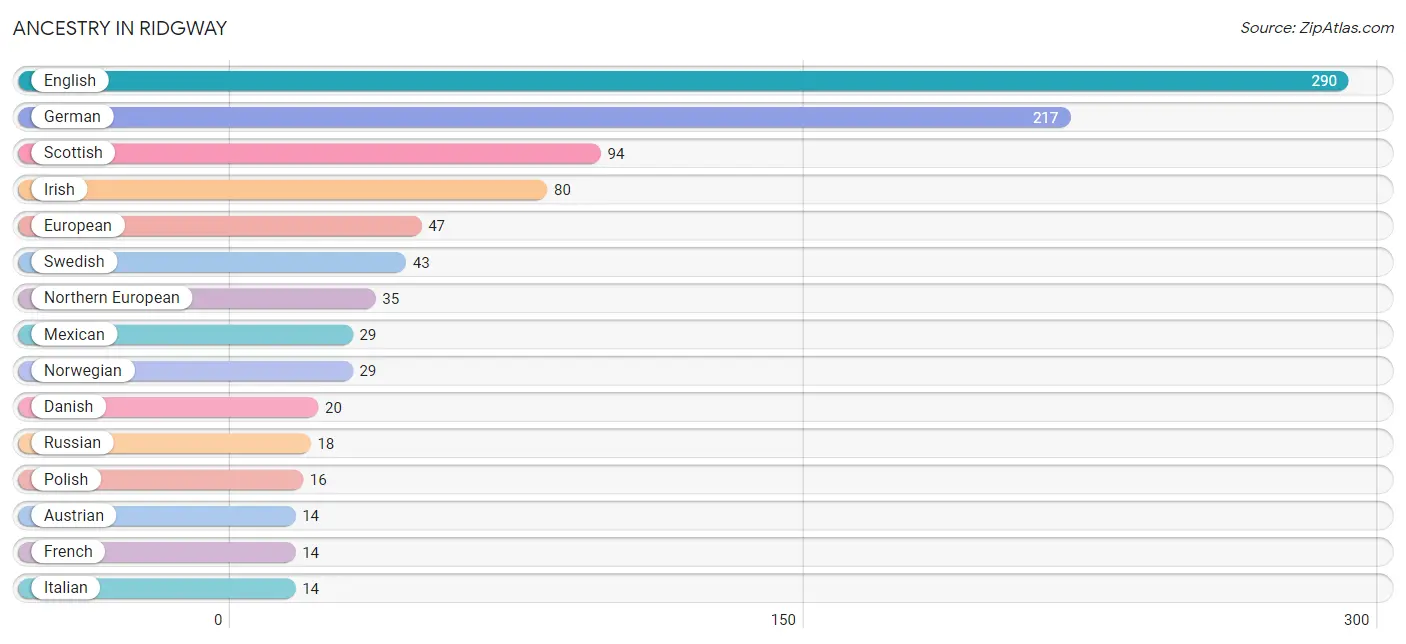
| Ancestry | # Population | % Population |
| American | 12 | 1.1% |
| Arab | 3 | 0.3% |
| Argentinean | 8 | 0.7% |
| Australian | 2 | 0.2% |
| Austrian | 14 | 1.3% |
| British | 2 | 0.2% |
| Burmese | 3 | 0.3% |
| Czech | 7 | 0.6% |
| Danish | 20 | 1.8% |
| Dutch | 13 | 1.2% |
| Eastern European | 3 | 0.3% |
| English | 290 | 26.5% |
| European | 47 | 4.3% |
| Finnish | 3 | 0.3% |
| French | 14 | 1.3% |
| German | 217 | 19.9% |
| Indian (Asian) | 2 | 0.2% |
| Irish | 80 | 7.3% |
| Italian | 14 | 1.3% |
| Lebanese | 3 | 0.3% |
| Lithuanian | 2 | 0.2% |
| Mexican | 29 | 2.6% |
| Northern European | 35 | 3.2% |
| Norwegian | 29 | 2.6% |
| Polish | 16 | 1.5% |
| Russian | 18 | 1.7% |
| Scandinavian | 7 | 0.6% |
| Scotch-Irish | 12 | 1.1% |
| Scottish | 94 | 8.6% |
| Slovene | 8 | 0.7% |
| South American | 8 | 0.7% |
| Spanish | 5 | 0.5% |
| Swedish | 43 | 3.9% |
| Ukrainian | 10 | 0.9% | View All 34 Rows |
Immigrants in Ridgway
The most numerous immigrant groups reported in Ridgway came from Europe (16 | 1.5%), Northern Europe (16 | 1.5%), Denmark (11 | 1.0%), Latin America (11 | 1.0%), and South America (11 | 1.0%), together accounting for 5.9% of all Ridgway residents.
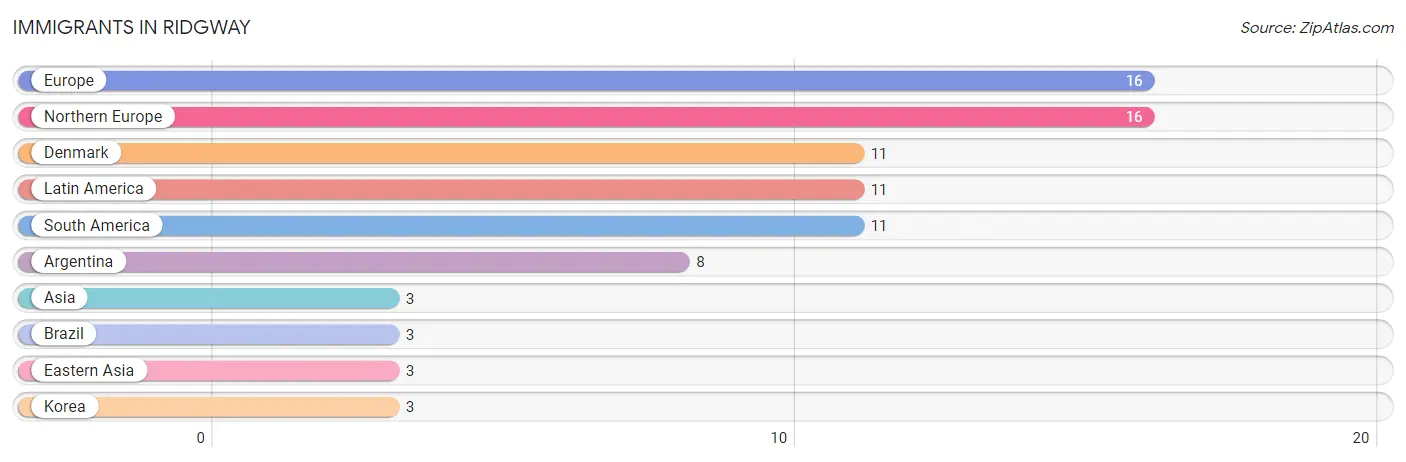
| Immigration Origin | # Population | % Population |
| Argentina | 8 | 0.7% |
| Asia | 3 | 0.3% |
| Brazil | 3 | 0.3% |
| Denmark | 11 | 1.0% |
| Eastern Asia | 3 | 0.3% |
| Europe | 16 | 1.5% |
| Korea | 3 | 0.3% |
| Latin America | 11 | 1.0% |
| Northern Europe | 16 | 1.5% |
| South America | 11 | 1.0% | View All 10 Rows |
Sex and Age in Ridgway
Sex and Age in Ridgway
The most populous age groups in Ridgway are 65 to 69 Years (88 | 15.9%) for men and 25 to 29 Years (107 | 19.8%) for women.
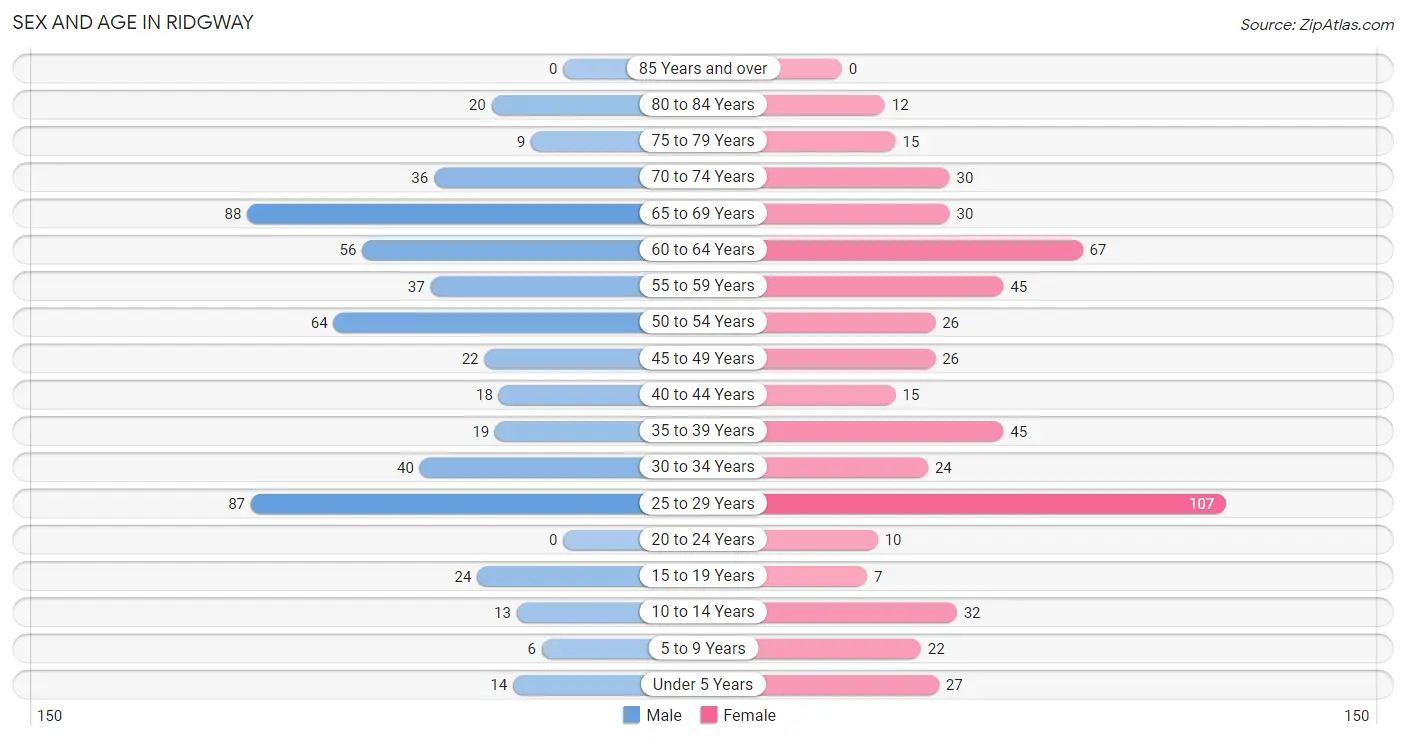
| Age Bracket | Male | Female |
| Under 5 Years | 14 (2.5%) | 27 (5.0%) |
| 5 to 9 Years | 6 (1.1%) | 22 (4.1%) |
| 10 to 14 Years | 13 (2.4%) | 32 (5.9%) |
| 15 to 19 Years | 24 (4.3%) | 7 (1.3%) |
| 20 to 24 Years | 0 (0.0%) | 10 (1.8%) |
| 25 to 29 Years | 87 (15.7%) | 107 (19.8%) |
| 30 to 34 Years | 40 (7.2%) | 24 (4.4%) |
| 35 to 39 Years | 19 (3.4%) | 45 (8.3%) |
| 40 to 44 Years | 18 (3.3%) | 15 (2.8%) |
| 45 to 49 Years | 22 (4.0%) | 26 (4.8%) |
| 50 to 54 Years | 64 (11.6%) | 26 (4.8%) |
| 55 to 59 Years | 37 (6.7%) | 45 (8.3%) |
| 60 to 64 Years | 56 (10.1%) | 67 (12.4%) |
| 65 to 69 Years | 88 (15.9%) | 30 (5.6%) |
| 70 to 74 Years | 36 (6.5%) | 30 (5.6%) |
| 75 to 79 Years | 9 (1.6%) | 15 (2.8%) |
| 80 to 84 Years | 20 (3.6%) | 12 (2.2%) |
| 85 Years and over | 0 (0.0%) | 0 (0.0%) |
| Total | 553 (100.0%) | 540 (100.0%) |
Families and Households in Ridgway
Median Family Size in Ridgway
The median family size in Ridgway is 2.99 persons per family, with married-couple families (163 | 86.7%) accounting for the largest median family size of 3.12 persons per family. On the other hand, single male/father families (13 | 6.9%) represent the smallest median family size with 1.85 persons per family.
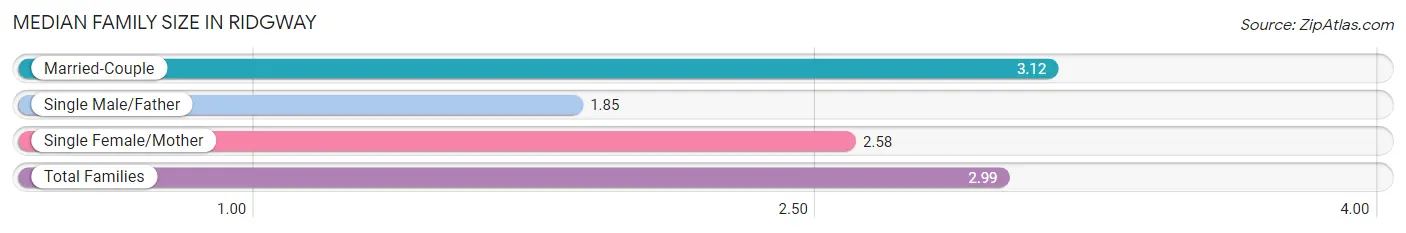
| Family Type | # Families | Family Size |
| Married-Couple | 163 (86.7%) | 3.12 |
| Single Male/Father | 13 (6.9%) | 1.85 |
| Single Female/Mother | 12 (6.4%) | 2.58 |
| Total Families | 188 (100.0%) | 2.99 |
Median Household Size in Ridgway
The median household size in Ridgway is 1.90 persons per household, with married-couple households (163 | 28.3%) accounting for the largest median household size of 3.17 persons per household. non-family households (387 | 67.3%) represent the smallest median household size with 1.33 persons per household.
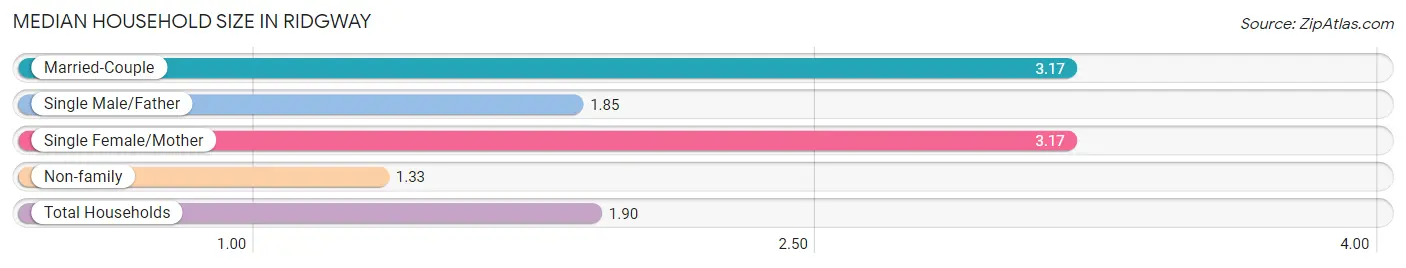
| Household Type | # Households | Household Size |
| Married-Couple | 163 (28.3%) | 3.17 |
| Single Male/Father | 13 (2.3%) | 1.85 |
| Single Female/Mother | 12 (2.1%) | 3.17 |
| Non-family | 387 (67.3%) | 1.33 |
| Total Households | 575 (100.0%) | 1.90 |
Household Size by Marriage Status in Ridgway
Out of a total of 575 households in Ridgway, 188 (32.7%) are family households, while 387 (67.3%) are nonfamily households. The most numerous type of family households are 2-person households, comprising 93, and the most common type of nonfamily households are 1-person households, comprising 239.
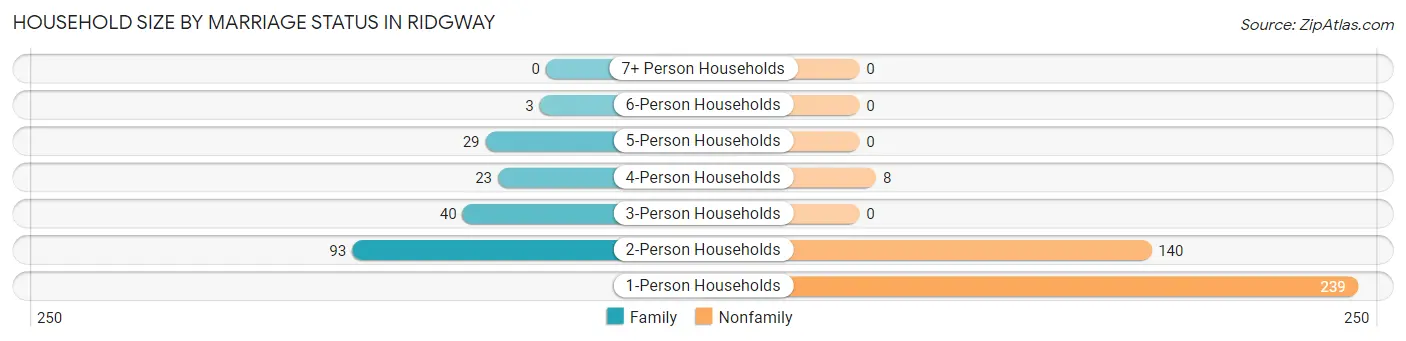
| Household Size | Family Households | Nonfamily Households |
| 1-Person Households | - | 239 (41.6%) |
| 2-Person Households | 93 (16.2%) | 140 (24.3%) |
| 3-Person Households | 40 (7.0%) | 0 (0.0%) |
| 4-Person Households | 23 (4.0%) | 8 (1.4%) |
| 5-Person Households | 29 (5.0%) | 0 (0.0%) |
| 6-Person Households | 3 (0.5%) | 0 (0.0%) |
| 7+ Person Households | 0 (0.0%) | 0 (0.0%) |
| Total | 188 (32.7%) | 387 (67.3%) |
Female Fertility in Ridgway
Fertility by Age in Ridgway
| Age Bracket | Women with Births | Births / 1,000 Women |
| 15 to 19 years | 0 (0.0%) | 0.0 |
| 20 to 34 years | 0 (0.0%) | 0.0 |
| 35 to 50 years | 0 (0.0%) | 0.0 |
| Total | 0 (0.0%) | 0.0 |
Fertility by Age by Marriage Status in Ridgway
| Age Bracket | Married | Unmarried |
| 15 to 19 years | 0 (0.0%) | 0 (0.0%) |
| 20 to 34 years | 0 (0.0%) | 0 (0.0%) |
| 35 to 50 years | 0 (0.0%) | 0 (0.0%) |
| Total | 0 (0.0%) | 0 (0.0%) |
Fertility by Education in Ridgway
| Educational Attainment | Women with Births | Births / 1,000 Women |
| Less than High School | 0 (0.0%) | 0.0 |
| High School Diploma | 0 (0.0%) | 0.0 |
| College or Associate's Degree | 0 (0.0%) | 0.0 |
| Bachelor's Degree | 0 (0.0%) | 0.0 |
| Graduate Degree | 0 (0.0%) | 0.0 |
| Total | 0 (0.0%) | 0.0 |
Fertility by Education by Marriage Status in Ridgway
| Educational Attainment | Married | Unmarried |
| Less than High School | 0 (0.0%) | 0 (0.0%) |
| High School Diploma | 0 (0.0%) | 0 (0.0%) |
| College or Associate's Degree | 0 (0.0%) | 0 (0.0%) |
| Bachelor's Degree | 0 (0.0%) | 0 (0.0%) |
| Graduate Degree | 0 (0.0%) | 0 (0.0%) |
| Total | 0 (0.0%) | 0 (0.0%) |
Employment Characteristics in Ridgway
Employment by Class of Employer in Ridgway
Among the 554 employed individuals in Ridgway, private company employees (337 | 60.8%), self-employed (incorporated) (88 | 15.9%), and self-employed (not incorporated) (41 | 7.4%) make up the most common classes of employment.
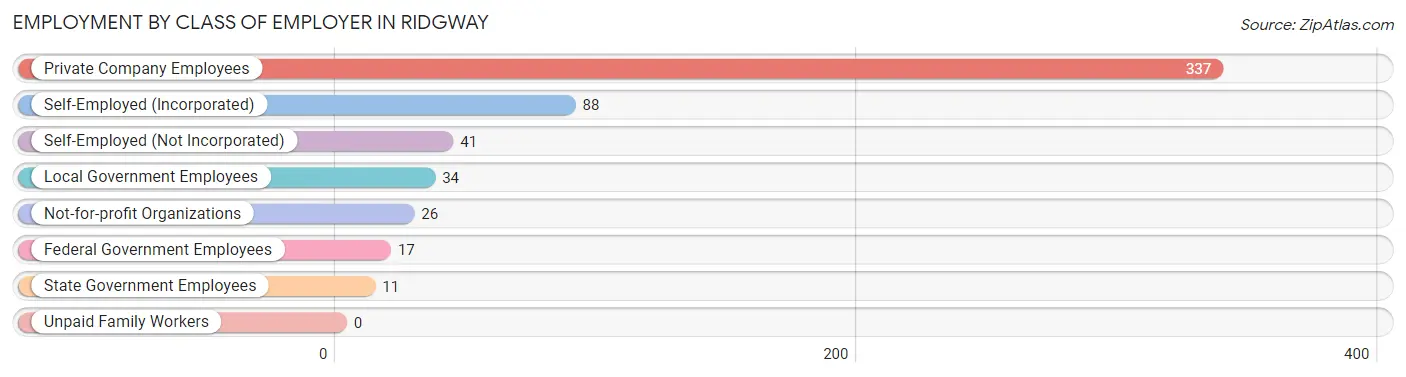
| Employer Class | # Employees | % Employees |
| Private Company Employees | 337 | 60.8% |
| Self-Employed (Incorporated) | 88 | 15.9% |
| Self-Employed (Not Incorporated) | 41 | 7.4% |
| Not-for-profit Organizations | 26 | 4.7% |
| Local Government Employees | 34 | 6.1% |
| State Government Employees | 11 | 2.0% |
| Federal Government Employees | 17 | 3.1% |
| Unpaid Family Workers | 0 | 0.0% |
| Total | 554 | 100.0% |
Employment Status by Age in Ridgway
According to the labor force statistics for Ridgway, out of the total population over 16 years of age (963), 65.5% or 631 individuals are in the labor force, with 10.1% or 64 of them unemployed. The age group with the highest labor force participation rate is 20 to 24 years, with 100.0% or 10 individuals in the labor force. Within the labor force, the 20 to 24 years age range has the highest percentage of unemployed individuals, with 100.0% or 10 of them being unemployed.
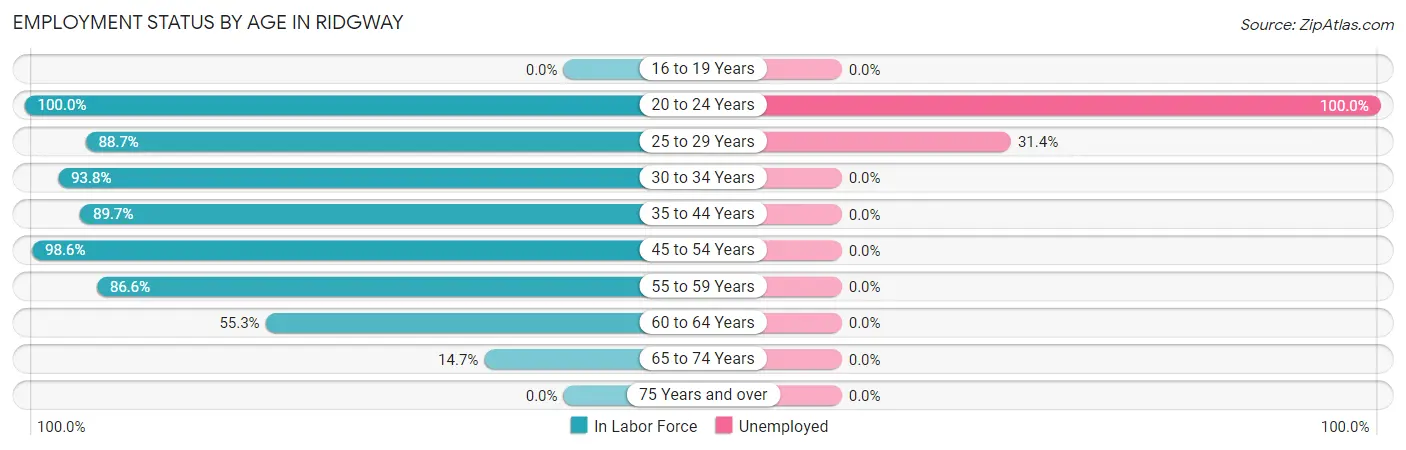
| Age Bracket | In Labor Force | Unemployed |
| 16 to 19 Years | 0 (0.0%) | 0 (0.0%) |
| 20 to 24 Years | 10 (100.0%) | 10 (100.0%) |
| 25 to 29 Years | 172 (88.7%) | 54 (31.4%) |
| 30 to 34 Years | 60 (93.8%) | 0 (0.0%) |
| 35 to 44 Years | 87 (89.7%) | 0 (0.0%) |
| 45 to 54 Years | 136 (98.6%) | 0 (0.0%) |
| 55 to 59 Years | 71 (86.6%) | 0 (0.0%) |
| 60 to 64 Years | 68 (55.3%) | 0 (0.0%) |
| 65 to 74 Years | 27 (14.7%) | 0 (0.0%) |
| 75 Years and over | 0 (0.0%) | 0 (0.0%) |
| Total | 631 (65.5%) | 64 (10.1%) |
Employment Status by Educational Attainment in Ridgway
According to labor force statistics for Ridgway, 85.1% of individuals (594) out of the total population between 25 and 64 years of age (698) are in the labor force, with 9.1% or 54 of them being unemployed. The group with the highest labor force participation rate are those with the educational attainment of college / associate degree, with 98.5% or 194 individuals in the labor force. Within the labor force, individuals with bachelor's degree or higher education have the highest percentage of unemployment, with 18.4% or 54 of them being unemployed.
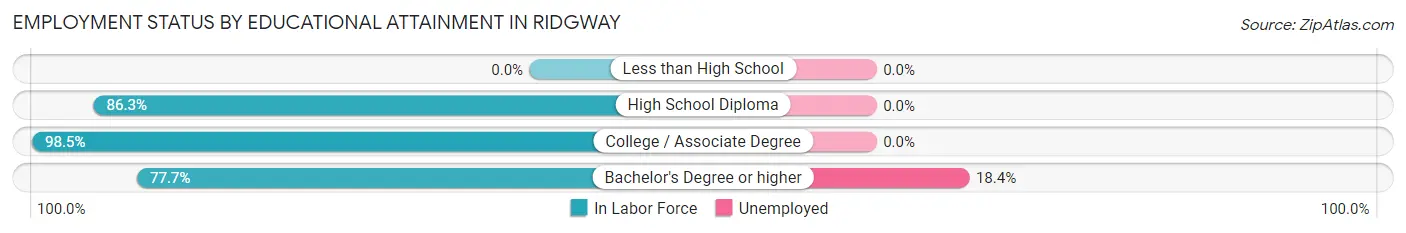
| Educational Attainment | In Labor Force | Unemployed |
| Less than High School | 0 (0.0%) | 0 (0.0%) |
| High School Diploma | 107 (86.3%) | 0 (0.0%) |
| College / Associate Degree | 194 (98.5%) | 0 (0.0%) |
| Bachelor's Degree or higher | 293 (77.7%) | 69 (18.4%) |
| Total | 594 (85.1%) | 64 (9.1%) |
Employment Occupations by Sex in Ridgway
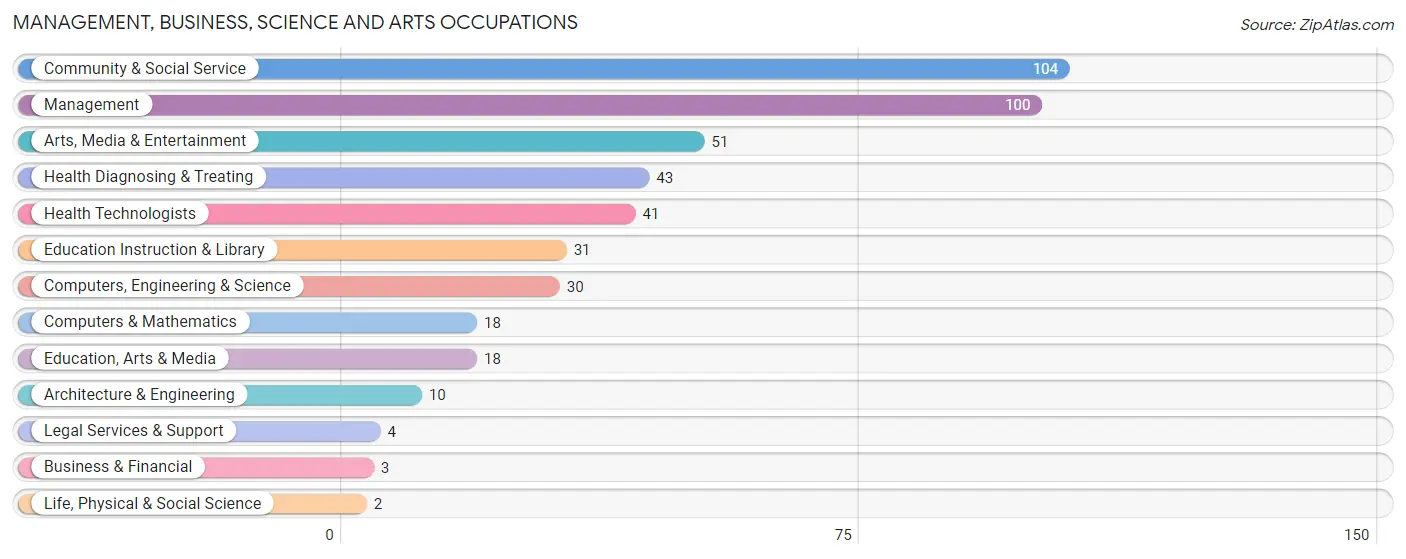
Management, Business, Science and Arts Occupations
The most common Management, Business, Science and Arts occupations in Ridgway are Community & Social Service (104 | 18.3%), Management (100 | 17.6%), Arts, Media & Entertainment (51 | 9.0%), Health Diagnosing & Treating (43 | 7.6%), and Health Technologists (41 | 7.2%).
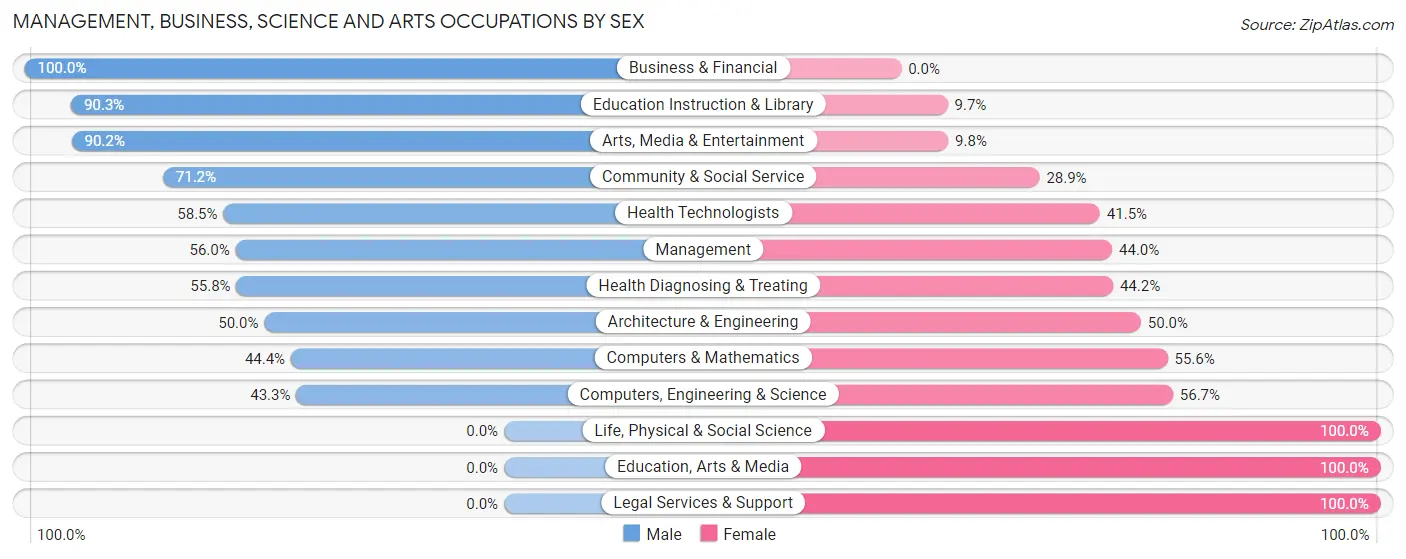
Management, Business, Science and Arts Occupations by Sex
Within the Management, Business, Science and Arts occupations in Ridgway, the most male-oriented occupations are Business & Financial (100.0%), Education Instruction & Library (90.3%), and Arts, Media & Entertainment (90.2%), while the most female-oriented occupations are Life, Physical & Social Science (100.0%), Education, Arts & Media (100.0%), and Legal Services & Support (100.0%).
| Occupation | Male | Female |
| Management | 56 (56.0%) | 44 (44.0%) |
| Business & Financial | 3 (100.0%) | 0 (0.0%) |
| Computers, Engineering & Science | 13 (43.3%) | 17 (56.7%) |
| Computers & Mathematics | 8 (44.4%) | 10 (55.6%) |
| Architecture & Engineering | 5 (50.0%) | 5 (50.0%) |
| Life, Physical & Social Science | 0 (0.0%) | 2 (100.0%) |
| Community & Social Service | 74 (71.2%) | 30 (28.8%) |
| Education, Arts & Media | 0 (0.0%) | 18 (100.0%) |
| Legal Services & Support | 0 (0.0%) | 4 (100.0%) |
| Education Instruction & Library | 28 (90.3%) | 3 (9.7%) |
| Arts, Media & Entertainment | 46 (90.2%) | 5 (9.8%) |
| Health Diagnosing & Treating | 24 (55.8%) | 19 (44.2%) |
| Health Technologists | 24 (58.5%) | 17 (41.5%) |
| Total (Category) | 170 (60.7%) | 110 (39.3%) |
| Total (Overall) | 349 (61.6%) | 218 (38.5%) |
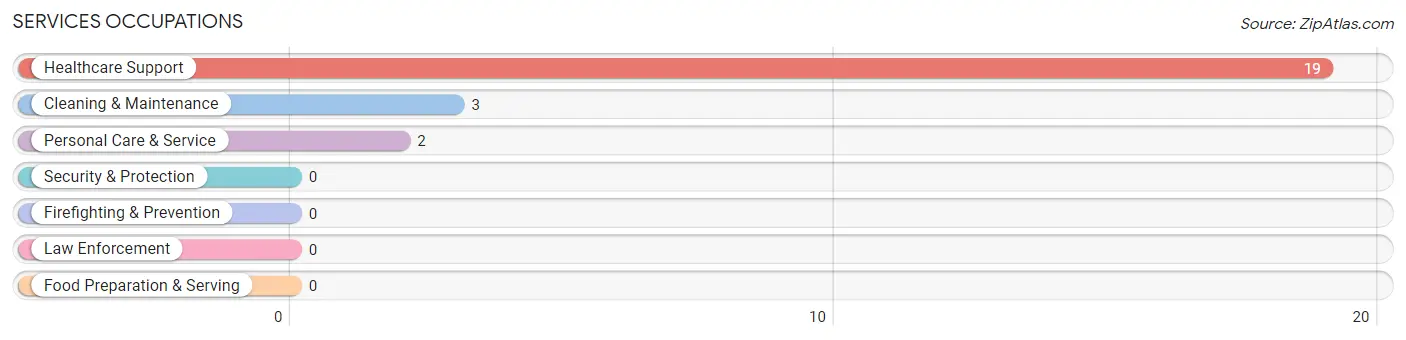
Services Occupations
The most common Services occupations in Ridgway are Healthcare Support (19 | 3.4%), Cleaning & Maintenance (3 | 0.5%), and Personal Care & Service (2 | 0.4%).
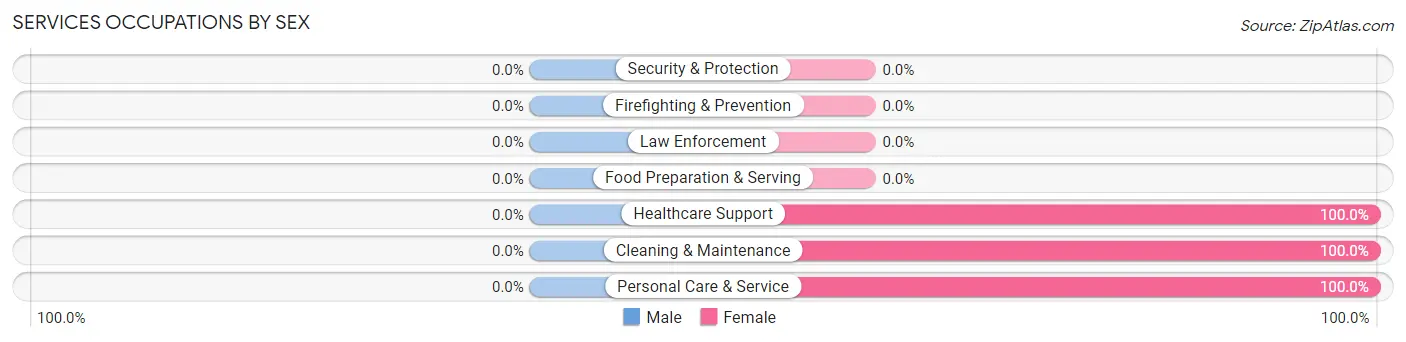
Services Occupations by Sex
| Occupation | Male | Female |
| Healthcare Support | 0 (0.0%) | 19 (100.0%) |
| Security & Protection | 0 (0.0%) | 0 (0.0%) |
| Firefighting & Prevention | 0 (0.0%) | 0 (0.0%) |
| Law Enforcement | 0 (0.0%) | 0 (0.0%) |
| Food Preparation & Serving | 0 (0.0%) | 0 (0.0%) |
| Cleaning & Maintenance | 0 (0.0%) | 3 (100.0%) |
| Personal Care & Service | 0 (0.0%) | 2 (100.0%) |
| Total (Category) | 0 (0.0%) | 24 (100.0%) |
| Total (Overall) | 349 (61.6%) | 218 (38.5%) |
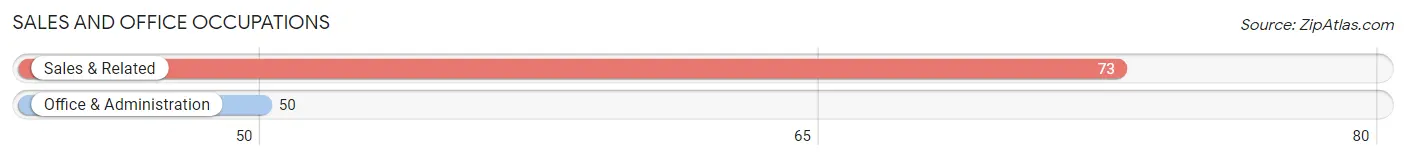
Sales and Office Occupations
The most common Sales and Office occupations in Ridgway are Sales & Related (73 | 12.9%), and Office & Administration (50 | 8.8%).
Sales and Office Occupations by Sex
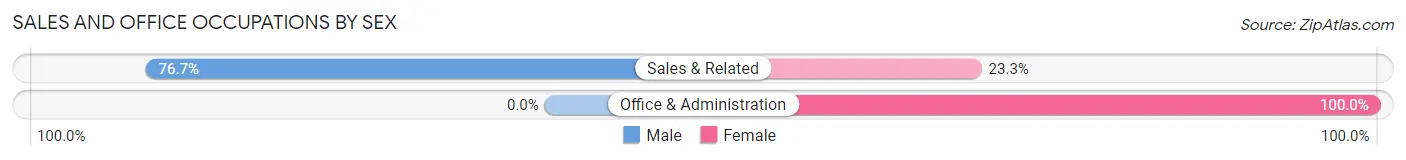
| Occupation | Male | Female |
| Sales & Related | 56 (76.7%) | 17 (23.3%) |
| Office & Administration | 0 (0.0%) | 50 (100.0%) |
| Total (Category) | 56 (45.5%) | 67 (54.5%) |
| Total (Overall) | 349 (61.6%) | 218 (38.5%) |
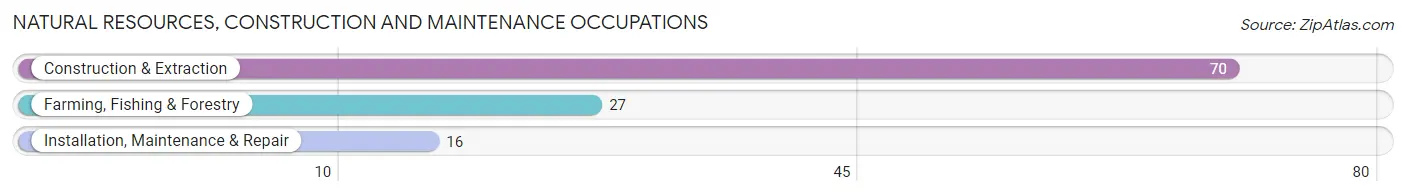
Natural Resources, Construction and Maintenance Occupations
The most common Natural Resources, Construction and Maintenance occupations in Ridgway are Construction & Extraction (70 | 12.3%), Farming, Fishing & Forestry (27 | 4.8%), and Installation, Maintenance & Repair (16 | 2.8%).
Natural Resources, Construction and Maintenance Occupations by Sex
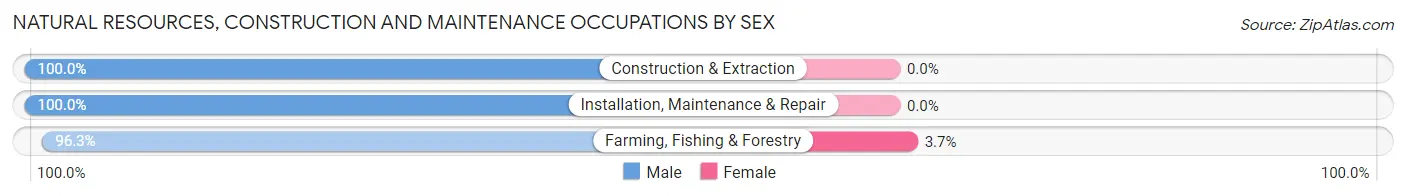
| Occupation | Male | Female |
| Farming, Fishing & Forestry | 26 (96.3%) | 1 (3.7%) |
| Construction & Extraction | 70 (100.0%) | 0 (0.0%) |
| Installation, Maintenance & Repair | 16 (100.0%) | 0 (0.0%) |
| Total (Category) | 112 (99.1%) | 1 (0.9%) |
| Total (Overall) | 349 (61.6%) | 218 (38.5%) |
Production, Transportation and Moving Occupations
The most common Production, Transportation and Moving occupations in Ridgway are Material Moving (16 | 2.8%), Transportation (8 | 1.4%), and Production (3 | 0.5%).
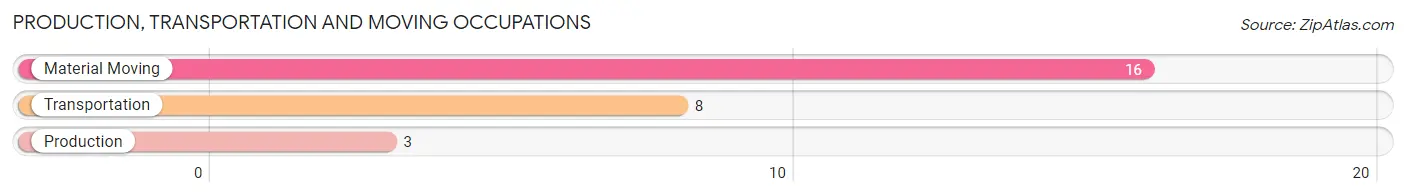
Production, Transportation and Moving Occupations by Sex
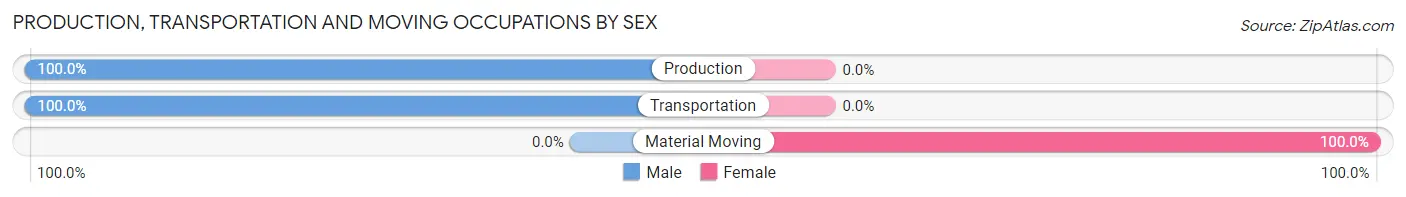
| Occupation | Male | Female |
| Production | 3 (100.0%) | 0 (0.0%) |
| Transportation | 8 (100.0%) | 0 (0.0%) |
| Material Moving | 0 (0.0%) | 16 (100.0%) |
| Total (Category) | 11 (40.7%) | 16 (59.3%) |
| Total (Overall) | 349 (61.6%) | 218 (38.5%) |
Employment Industries by Sex in Ridgway
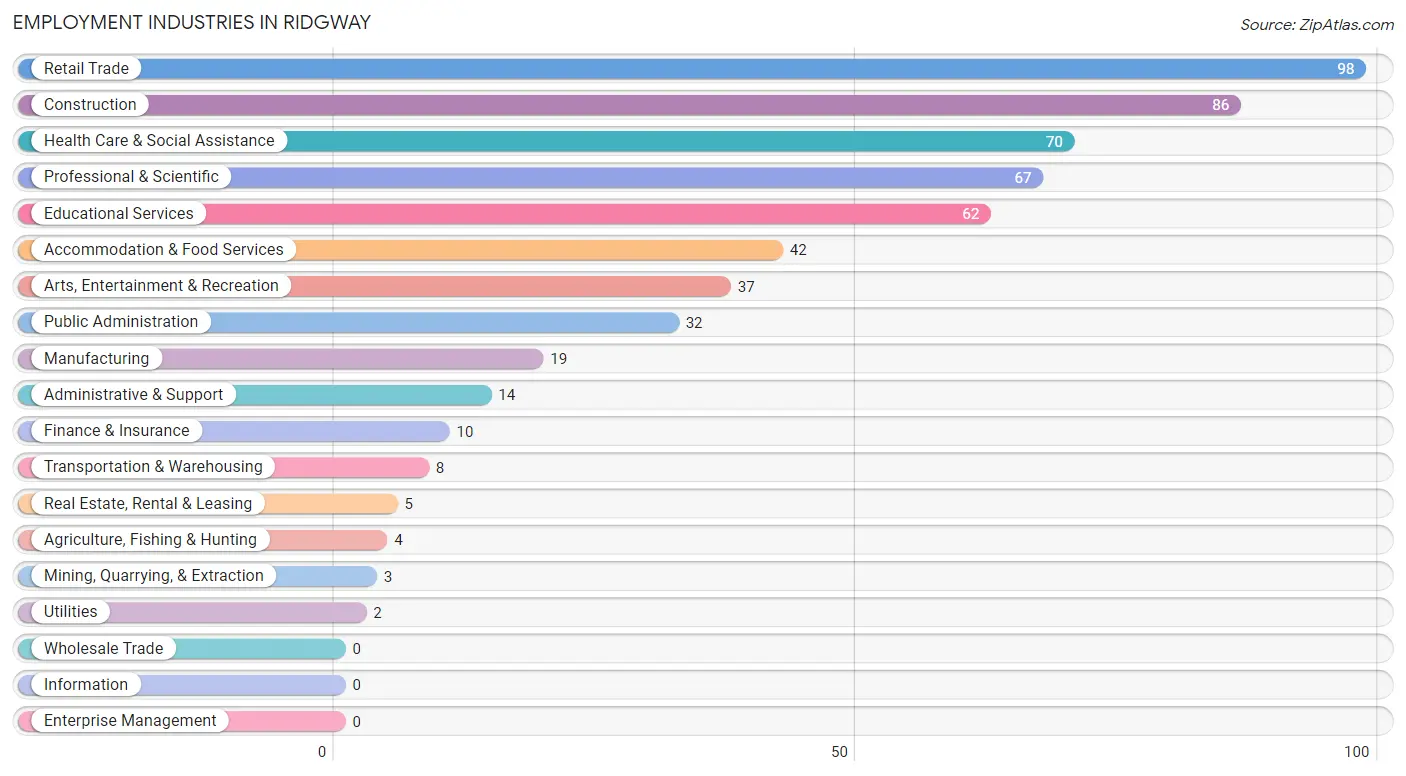
Employment Industries in Ridgway
The major employment industries in Ridgway include Retail Trade (98 | 17.3%), Construction (86 | 15.2%), Health Care & Social Assistance (70 | 12.3%), Professional & Scientific (67 | 11.8%), and Educational Services (62 | 10.9%).
Employment Industries by Sex in Ridgway
The Ridgway industries that see more men than women are Mining, Quarrying, & Extraction (100.0%), Transportation & Warehousing (100.0%), and Utilities (100.0%), whereas the industries that tend to have a higher number of women are Accommodation & Food Services (100.0%), Public Administration (100.0%), and Manufacturing (84.2%).
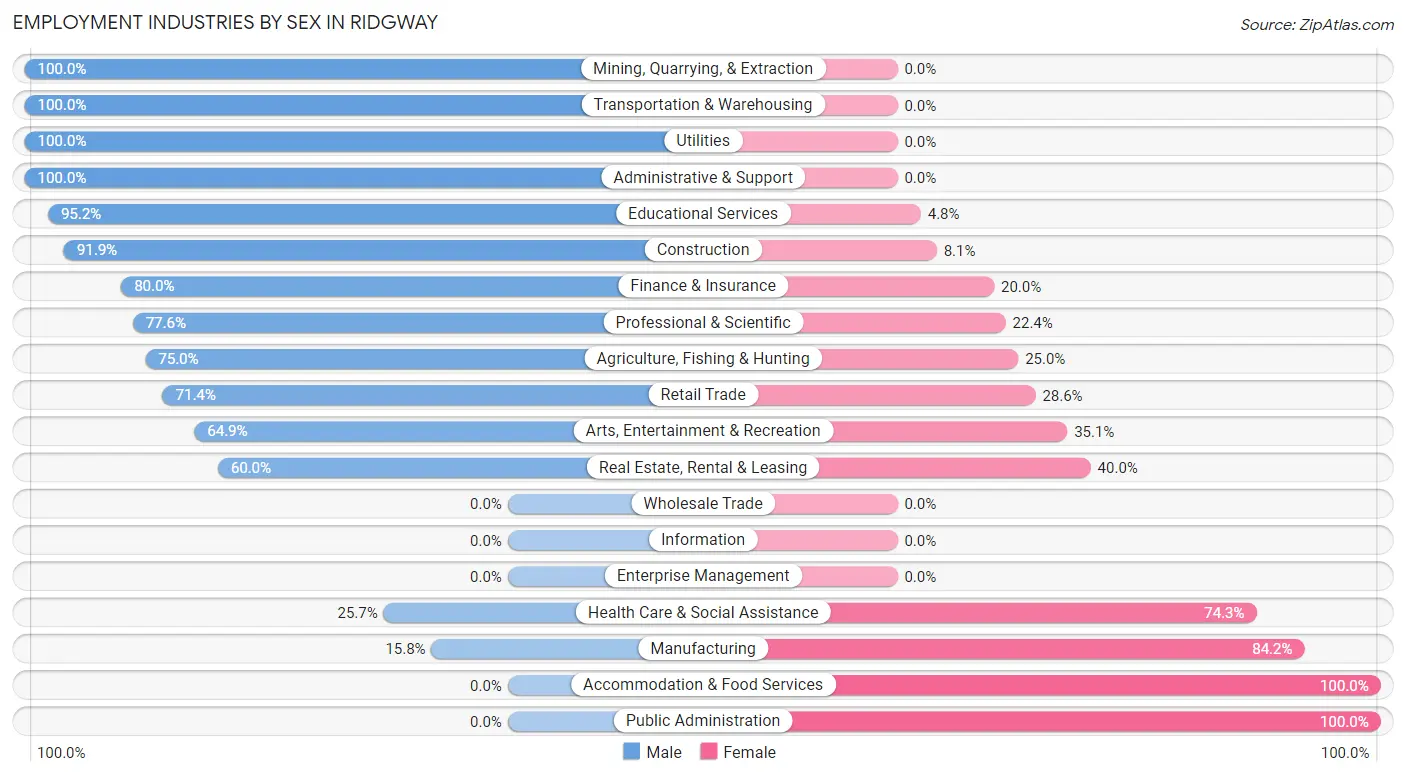
| Industry | Male | Female |
| Agriculture, Fishing & Hunting | 3 (75.0%) | 1 (25.0%) |
| Mining, Quarrying, & Extraction | 3 (100.0%) | 0 (0.0%) |
| Construction | 79 (91.9%) | 7 (8.1%) |
| Manufacturing | 3 (15.8%) | 16 (84.2%) |
| Wholesale Trade | 0 (0.0%) | 0 (0.0%) |
| Retail Trade | 70 (71.4%) | 28 (28.6%) |
| Transportation & Warehousing | 8 (100.0%) | 0 (0.0%) |
| Utilities | 2 (100.0%) | 0 (0.0%) |
| Information | 0 (0.0%) | 0 (0.0%) |
| Finance & Insurance | 8 (80.0%) | 2 (20.0%) |
| Real Estate, Rental & Leasing | 3 (60.0%) | 2 (40.0%) |
| Professional & Scientific | 52 (77.6%) | 15 (22.4%) |
| Enterprise Management | 0 (0.0%) | 0 (0.0%) |
| Administrative & Support | 14 (100.0%) | 0 (0.0%) |
| Educational Services | 59 (95.2%) | 3 (4.8%) |
| Health Care & Social Assistance | 18 (25.7%) | 52 (74.3%) |
| Arts, Entertainment & Recreation | 24 (64.9%) | 13 (35.1%) |
| Accommodation & Food Services | 0 (0.0%) | 42 (100.0%) |
| Public Administration | 0 (0.0%) | 32 (100.0%) |
| Total | 349 (61.6%) | 218 (38.5%) |
Education in Ridgway
School Enrollment in Ridgway
The most common levels of schooling among the 195 students in Ridgway are high school (40 | 20.5%), college / undergraduate (39 | 20.0%), and nursery / preschool (36 | 18.5%).
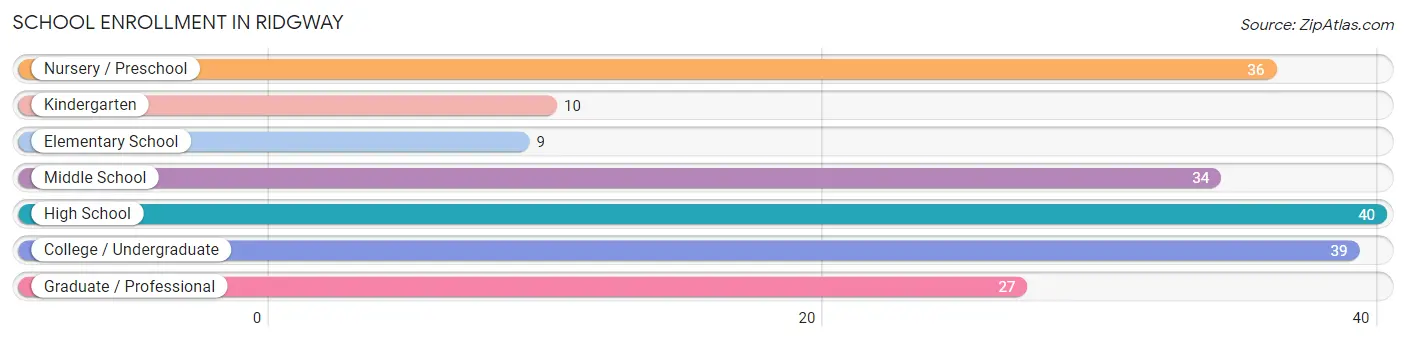
| School Level | # Students | % Students |
| Nursery / Preschool | 36 | 18.5% |
| Kindergarten | 10 | 5.1% |
| Elementary School | 9 | 4.6% |
| Middle School | 34 | 17.4% |
| High School | 40 | 20.5% |
| College / Undergraduate | 39 | 20.0% |
| Graduate / Professional | 27 | 13.9% |
| Total | 195 | 100.0% |
School Enrollment by Age by Funding Source in Ridgway
Out of a total of 195 students who are enrolled in schools in Ridgway, 32 (16.4%) attend a private institution, while the remaining 163 (83.6%) are enrolled in public schools. The age group of 35 years and over has the highest likelihood of being enrolled in private schools, with 3 (50.0% in the age bracket) enrolled. Conversely, the age group of 15 to 17 year olds has the lowest likelihood of being enrolled in a private school, with 31 (100.0% in the age bracket) attending a public institution.
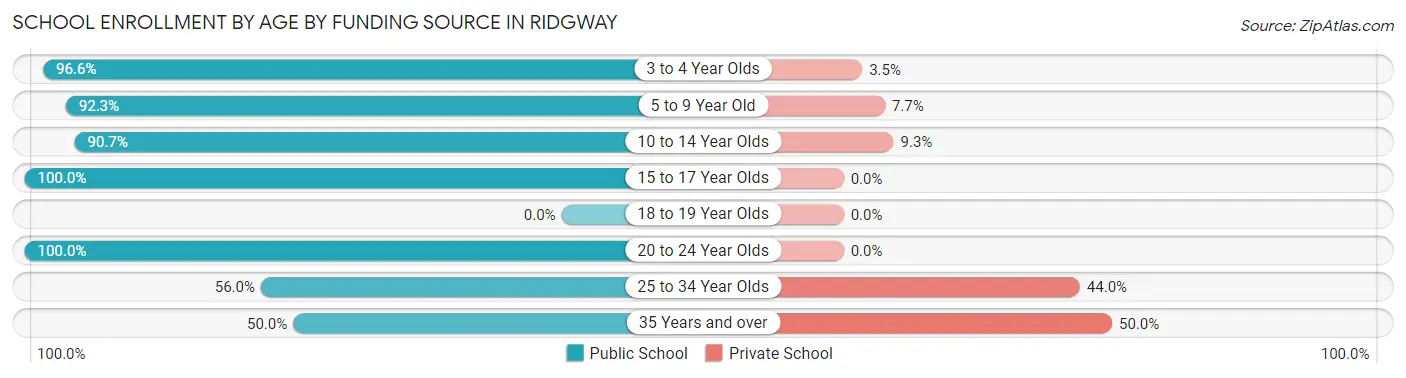
| Age Bracket | Public School | Private School |
| 3 to 4 Year Olds | 28 (96.6%) | 1 (3.5%) |
| 5 to 9 Year Old | 24 (92.3%) | 2 (7.7%) |
| 10 to 14 Year Olds | 39 (90.7%) | 4 (9.3%) |
| 15 to 17 Year Olds | 31 (100.0%) | 0 (0.0%) |
| 18 to 19 Year Olds | 0 (0.0%) | 0 (0.0%) |
| 20 to 24 Year Olds | 10 (100.0%) | 0 (0.0%) |
| 25 to 34 Year Olds | 28 (56.0%) | 22 (44.0%) |
| 35 Years and over | 3 (50.0%) | 3 (50.0%) |
| Total | 163 (83.6%) | 32 (16.4%) |
Educational Attainment by Field of Study in Ridgway
Science & technology (130 | 23.9%), arts & humanities (69 | 12.7%), business (58 | 10.7%), education (42 | 7.7%), and liberal arts & history (42 | 7.7%) are the most common fields of study among 543 individuals in Ridgway who have obtained a bachelor's degree or higher.
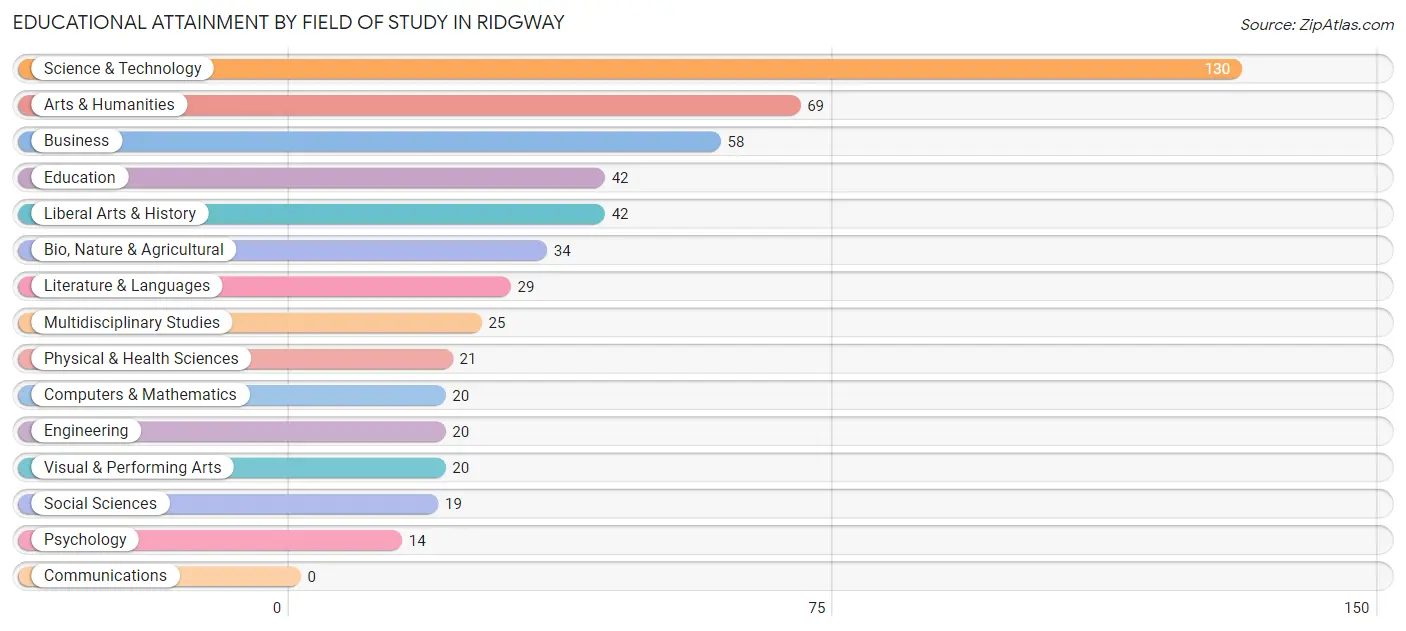
| Field of Study | # Graduates | % Graduates |
| Computers & Mathematics | 20 | 3.7% |
| Bio, Nature & Agricultural | 34 | 6.3% |
| Physical & Health Sciences | 21 | 3.9% |
| Psychology | 14 | 2.6% |
| Social Sciences | 19 | 3.5% |
| Engineering | 20 | 3.7% |
| Multidisciplinary Studies | 25 | 4.6% |
| Science & Technology | 130 | 23.9% |
| Business | 58 | 10.7% |
| Education | 42 | 7.7% |
| Literature & Languages | 29 | 5.3% |
| Liberal Arts & History | 42 | 7.7% |
| Visual & Performing Arts | 20 | 3.7% |
| Communications | 0 | 0.0% |
| Arts & Humanities | 69 | 12.7% |
| Total | 543 | 100.0% |
Transportation & Commute in Ridgway
Vehicle Availability by Sex in Ridgway
The most prevalent vehicle ownership categories in Ridgway are males with 2 vehicles (173, accounting for 51.2%) and females with 2 vehicles (92, making up 80.1%).
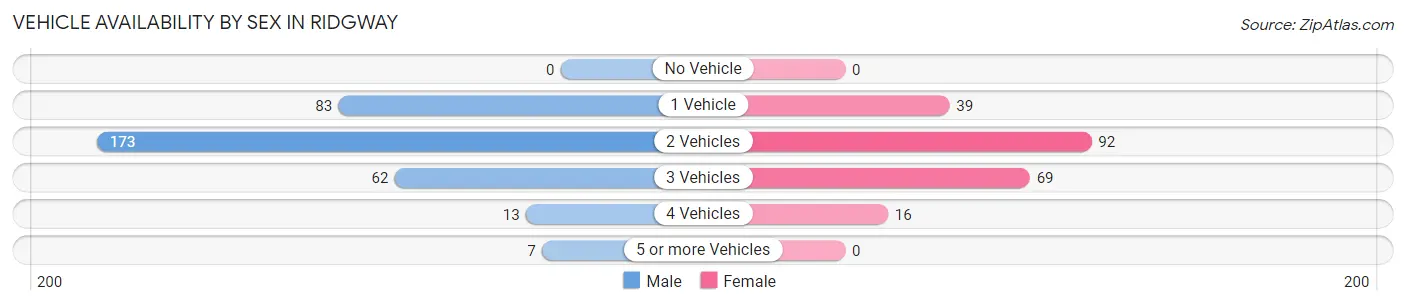
| Vehicles Available | Male | Female |
| No Vehicle | 0 (0.0%) | 0 (0.0%) |
| 1 Vehicle | 83 (24.6%) | 39 (18.1%) |
| 2 Vehicles | 173 (51.2%) | 92 (42.6%) |
| 3 Vehicles | 62 (18.3%) | 69 (31.9%) |
| 4 Vehicles | 13 (3.8%) | 16 (7.4%) |
| 5 or more Vehicles | 7 (2.1%) | 0 (0.0%) |
| Total | 338 (100.0%) | 216 (100.0%) |
Commute Time in Ridgway
The most frequently occuring commute durations in Ridgway are 5 to 9 minutes (104 commuters, 23.0%), 45 to 59 minutes (82 commuters, 18.1%), and 10 to 14 minutes (69 commuters, 15.2%).
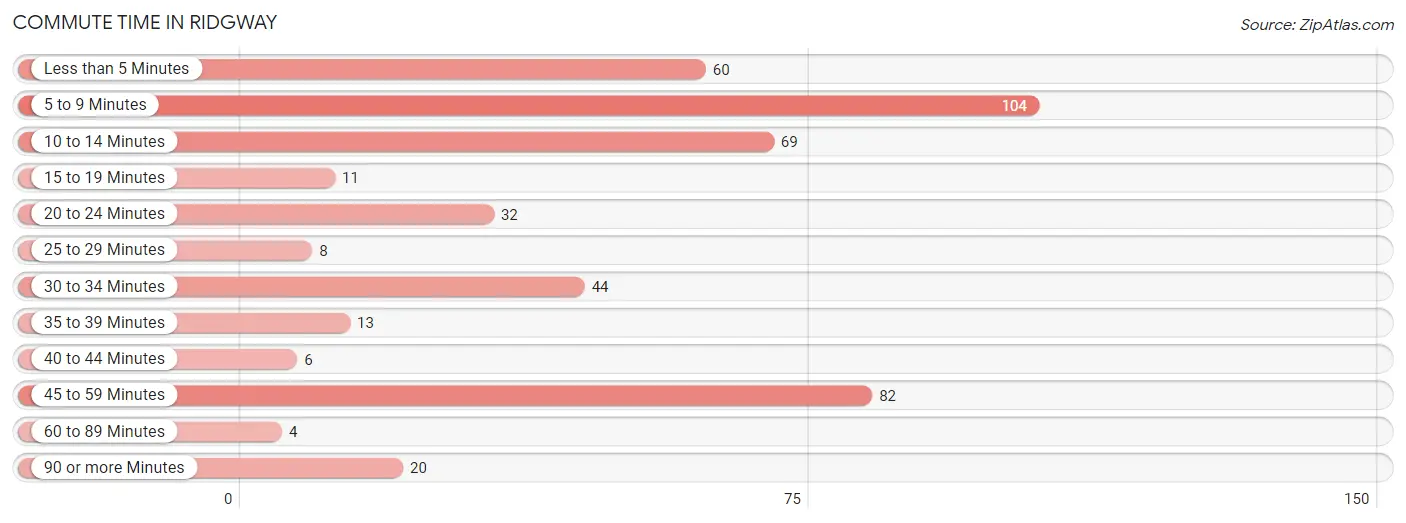
| Commute Time | # Commuters | % Commuters |
| Less than 5 Minutes | 60 | 13.3% |
| 5 to 9 Minutes | 104 | 23.0% |
| 10 to 14 Minutes | 69 | 15.2% |
| 15 to 19 Minutes | 11 | 2.4% |
| 20 to 24 Minutes | 32 | 7.1% |
| 25 to 29 Minutes | 8 | 1.8% |
| 30 to 34 Minutes | 44 | 9.7% |
| 35 to 39 Minutes | 13 | 2.9% |
| 40 to 44 Minutes | 6 | 1.3% |
| 45 to 59 Minutes | 82 | 18.1% |
| 60 to 89 Minutes | 4 | 0.9% |
| 90 or more Minutes | 20 | 4.4% |
Commute Time by Sex in Ridgway
The most common commute times in Ridgway are 5 to 9 minutes (64 commuters, 22.2%) for males and 10 to 14 minutes (41 commuters, 24.8%) for females.
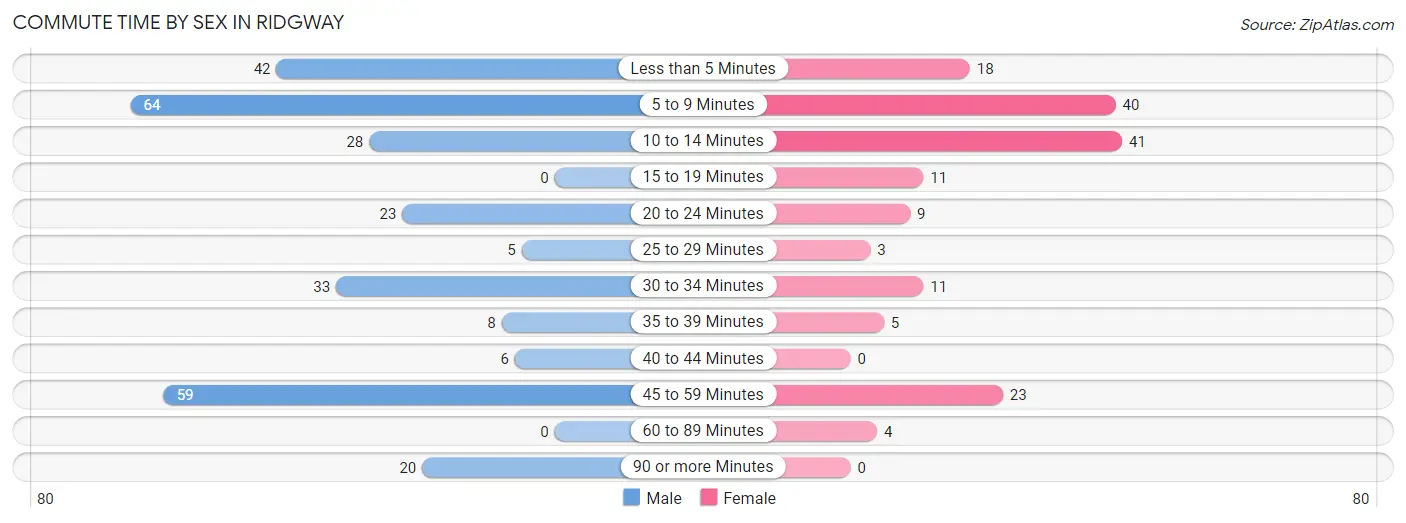
| Commute Time | Male | Female |
| Less than 5 Minutes | 42 (14.6%) | 18 (10.9%) |
| 5 to 9 Minutes | 64 (22.2%) | 40 (24.2%) |
| 10 to 14 Minutes | 28 (9.7%) | 41 (24.8%) |
| 15 to 19 Minutes | 0 (0.0%) | 11 (6.7%) |
| 20 to 24 Minutes | 23 (8.0%) | 9 (5.4%) |
| 25 to 29 Minutes | 5 (1.7%) | 3 (1.8%) |
| 30 to 34 Minutes | 33 (11.5%) | 11 (6.7%) |
| 35 to 39 Minutes | 8 (2.8%) | 5 (3.0%) |
| 40 to 44 Minutes | 6 (2.1%) | 0 (0.0%) |
| 45 to 59 Minutes | 59 (20.5%) | 23 (13.9%) |
| 60 to 89 Minutes | 0 (0.0%) | 4 (2.4%) |
| 90 or more Minutes | 20 (6.9%) | 0 (0.0%) |
Time of Departure to Work by Sex in Ridgway
The most frequent times of departure to work in Ridgway are 6:30 AM to 6:59 AM (75, 26.0%) for males and 7:30 AM to 7:59 AM (32, 19.4%) for females.
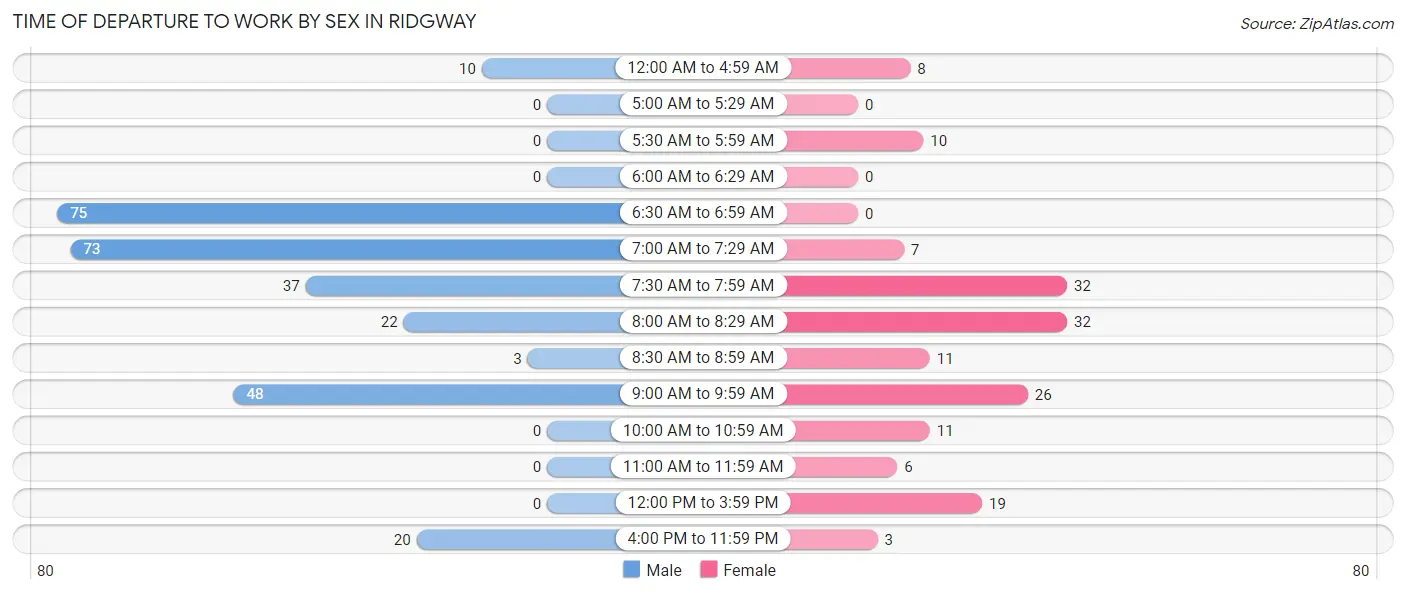
| Time of Departure | Male | Female |
| 12:00 AM to 4:59 AM | 10 (3.5%) | 8 (4.9%) |
| 5:00 AM to 5:29 AM | 0 (0.0%) | 0 (0.0%) |
| 5:30 AM to 5:59 AM | 0 (0.0%) | 10 (6.1%) |
| 6:00 AM to 6:29 AM | 0 (0.0%) | 0 (0.0%) |
| 6:30 AM to 6:59 AM | 75 (26.0%) | 0 (0.0%) |
| 7:00 AM to 7:29 AM | 73 (25.4%) | 7 (4.2%) |
| 7:30 AM to 7:59 AM | 37 (12.9%) | 32 (19.4%) |
| 8:00 AM to 8:29 AM | 22 (7.6%) | 32 (19.4%) |
| 8:30 AM to 8:59 AM | 3 (1.0%) | 11 (6.7%) |
| 9:00 AM to 9:59 AM | 48 (16.7%) | 26 (15.8%) |
| 10:00 AM to 10:59 AM | 0 (0.0%) | 11 (6.7%) |
| 11:00 AM to 11:59 AM | 0 (0.0%) | 6 (3.6%) |
| 12:00 PM to 3:59 PM | 0 (0.0%) | 19 (11.5%) |
| 4:00 PM to 11:59 PM | 20 (6.9%) | 3 (1.8%) |
| Total | 288 (100.0%) | 165 (100.0%) |
Housing Occupancy in Ridgway
Occupancy by Ownership in Ridgway
Of the total 575 dwellings in Ridgway, owner-occupied units account for 306 (53.2%), while renter-occupied units make up 269 (46.8%).
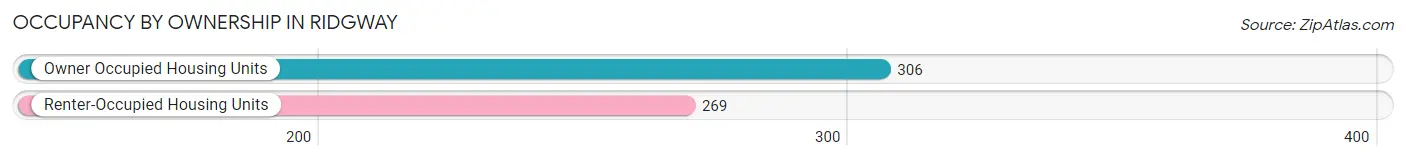
| Occupancy | # Housing Units | % Housing Units |
| Owner Occupied Housing Units | 306 | 53.2% |
| Renter-Occupied Housing Units | 269 | 46.8% |
| Total Occupied Housing Units | 575 | 100.0% |
Occupancy by Household Size in Ridgway
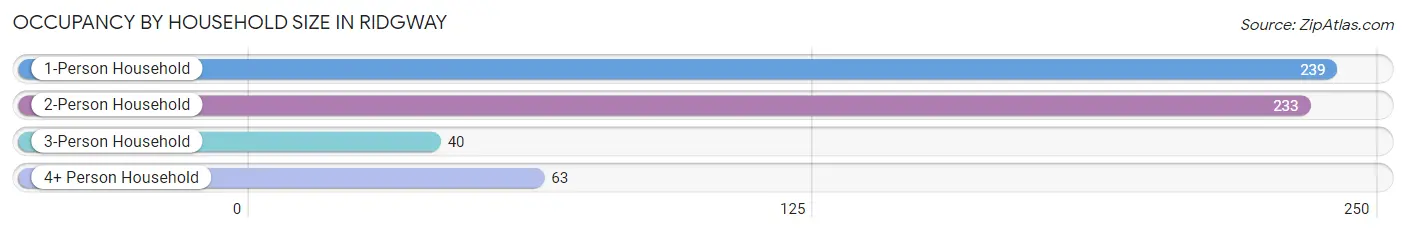
| Household Size | # Housing Units | % Housing Units |
| 1-Person Household | 239 | 41.6% |
| 2-Person Household | 233 | 40.5% |
| 3-Person Household | 40 | 7.0% |
| 4+ Person Household | 63 | 11.0% |
| Total Housing Units | 575 | 100.0% |
Occupancy by Ownership by Household Size in Ridgway
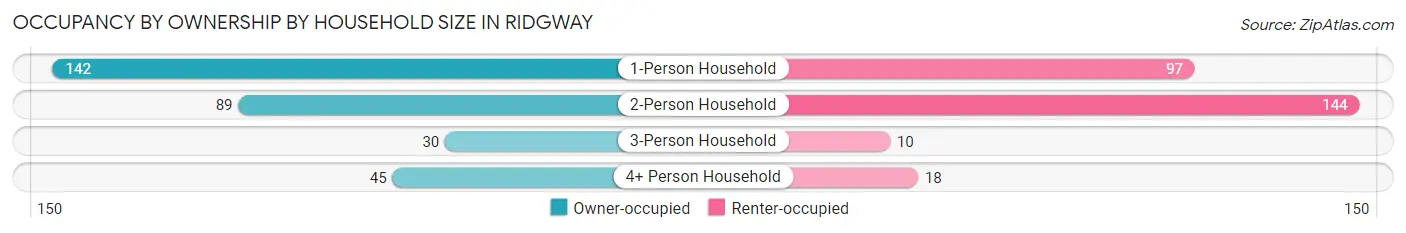
| Household Size | Owner-occupied | Renter-occupied |
| 1-Person Household | 142 (59.4%) | 97 (40.6%) |
| 2-Person Household | 89 (38.2%) | 144 (61.8%) |
| 3-Person Household | 30 (75.0%) | 10 (25.0%) |
| 4+ Person Household | 45 (71.4%) | 18 (28.6%) |
| Total Housing Units | 306 (53.2%) | 269 (46.8%) |
Occupancy by Educational Attainment in Ridgway
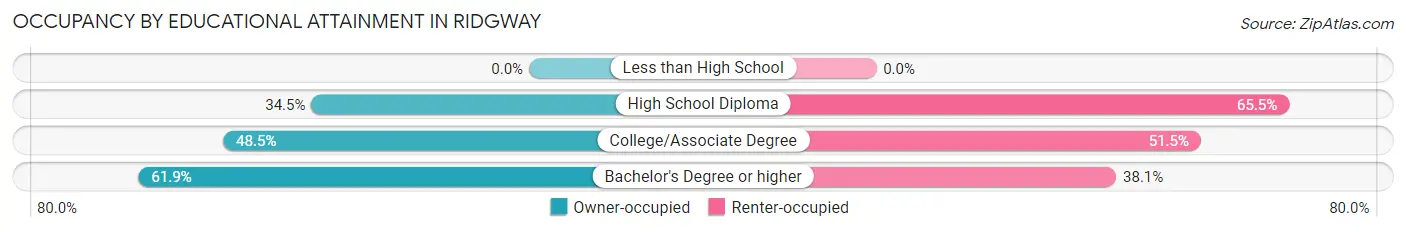
| Household Size | Owner-occupied | Renter-occupied |
| Less than High School | 0 (0.0%) | 0 (0.0%) |
| High School Diploma | 29 (34.5%) | 55 (65.5%) |
| College/Associate Degree | 98 (48.5%) | 104 (51.5%) |
| Bachelor's Degree or higher | 179 (61.9%) | 110 (38.1%) |
Occupancy by Age of Householder in Ridgway
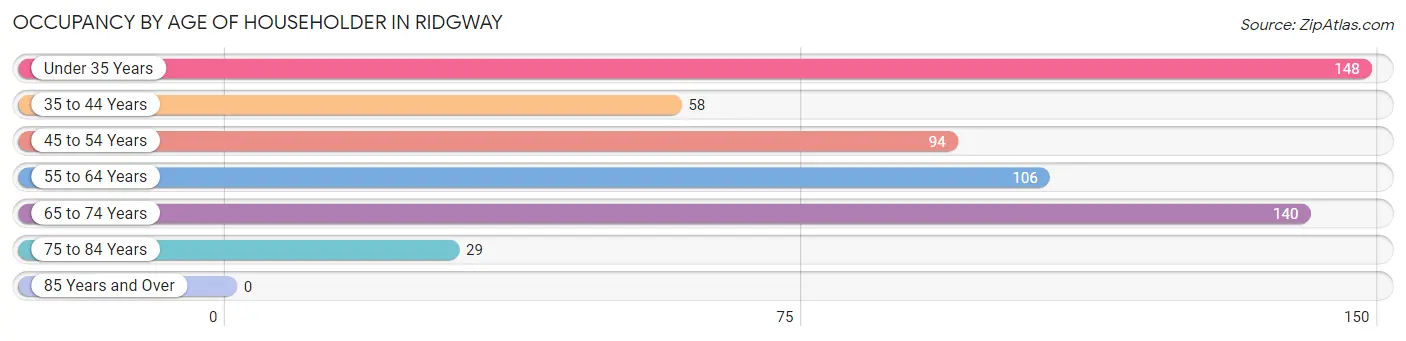
| Age Bracket | # Households | % Households |
| Under 35 Years | 148 | 25.7% |
| 35 to 44 Years | 58 | 10.1% |
| 45 to 54 Years | 94 | 16.4% |
| 55 to 64 Years | 106 | 18.4% |
| 65 to 74 Years | 140 | 24.3% |
| 75 to 84 Years | 29 | 5.0% |
| 85 Years and Over | 0 | 0.0% |
| Total | 575 | 100.0% |
Housing Finances in Ridgway
Median Income by Occupancy in Ridgway
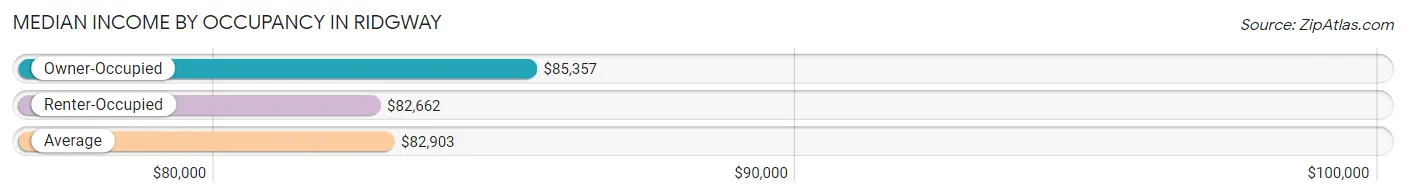
| Occupancy Type | # Households | Median Income |
| Owner-Occupied | 306 (53.2%) | $85,357 |
| Renter-Occupied | 269 (46.8%) | $82,662 |
| Average | 575 (100.0%) | $82,903 |
Occupancy by Householder Income Bracket in Ridgway
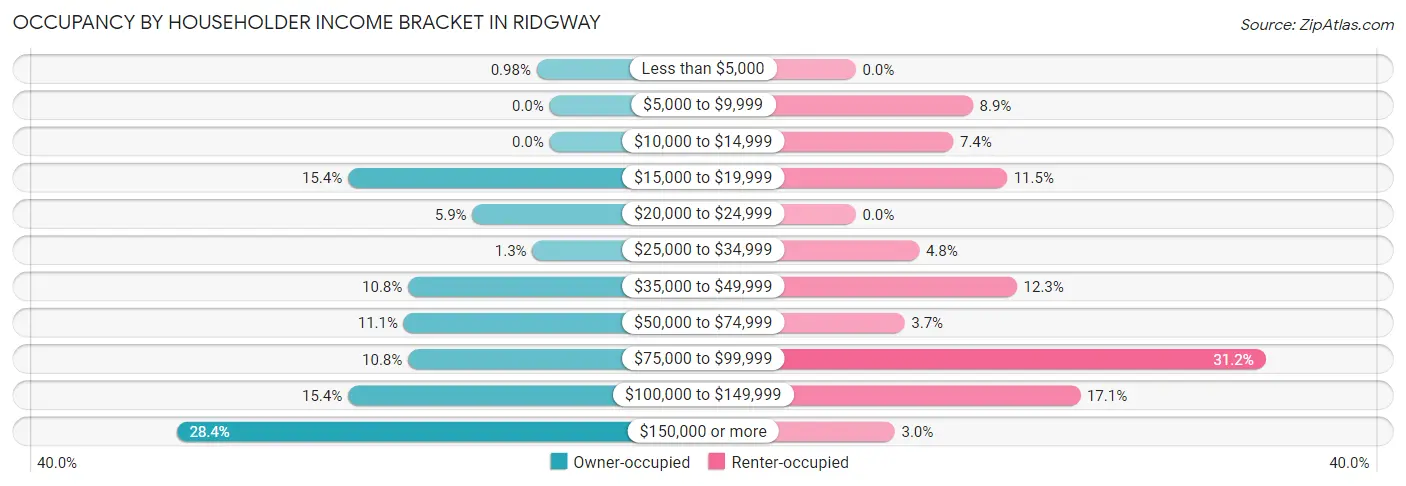
| Income Bracket | Owner-occupied | Renter-occupied |
| Less than $5,000 | 3 (1.0%) | 0 (0.0%) |
| $5,000 to $9,999 | 0 (0.0%) | 24 (8.9%) |
| $10,000 to $14,999 | 0 (0.0%) | 20 (7.4%) |
| $15,000 to $19,999 | 47 (15.4%) | 31 (11.5%) |
| $20,000 to $24,999 | 18 (5.9%) | 0 (0.0%) |
| $25,000 to $34,999 | 4 (1.3%) | 13 (4.8%) |
| $35,000 to $49,999 | 33 (10.8%) | 33 (12.3%) |
| $50,000 to $74,999 | 34 (11.1%) | 10 (3.7%) |
| $75,000 to $99,999 | 33 (10.8%) | 84 (31.2%) |
| $100,000 to $149,999 | 47 (15.4%) | 46 (17.1%) |
| $150,000 or more | 87 (28.4%) | 8 (3.0%) |
| Total | 306 (100.0%) | 269 (100.0%) |
Monthly Housing Cost Tiers in Ridgway
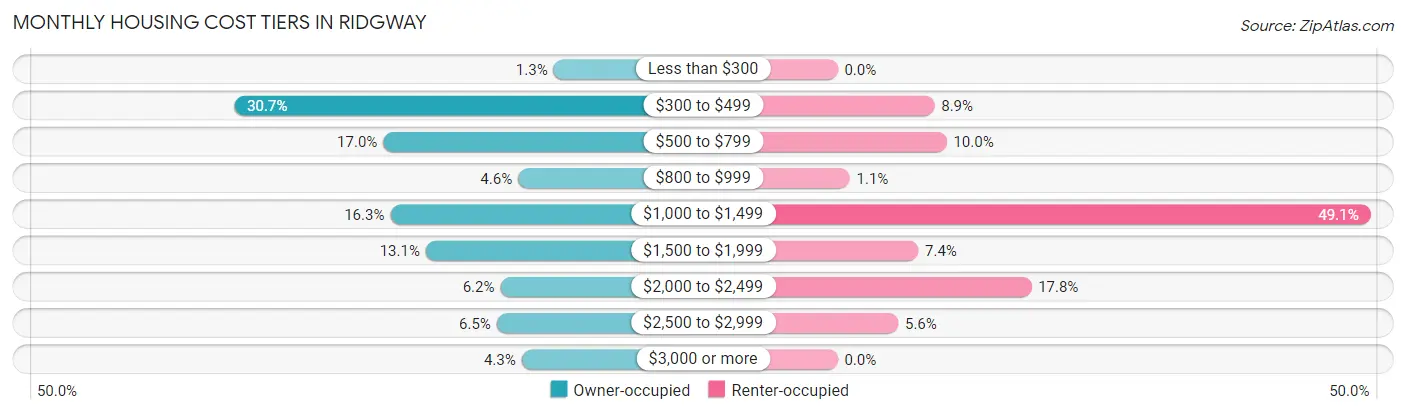
| Monthly Cost | Owner-occupied | Renter-occupied |
| Less than $300 | 4 (1.3%) | 0 (0.0%) |
| $300 to $499 | 94 (30.7%) | 24 (8.9%) |
| $500 to $799 | 52 (17.0%) | 27 (10.0%) |
| $800 to $999 | 14 (4.6%) | 3 (1.1%) |
| $1,000 to $1,499 | 50 (16.3%) | 132 (49.1%) |
| $1,500 to $1,999 | 40 (13.1%) | 20 (7.4%) |
| $2,000 to $2,499 | 19 (6.2%) | 48 (17.8%) |
| $2,500 to $2,999 | 20 (6.5%) | 15 (5.6%) |
| $3,000 or more | 13 (4.3%) | 0 (0.0%) |
| Total | 306 (100.0%) | 269 (100.0%) |
Physical Housing Characteristics in Ridgway
Housing Structures in Ridgway
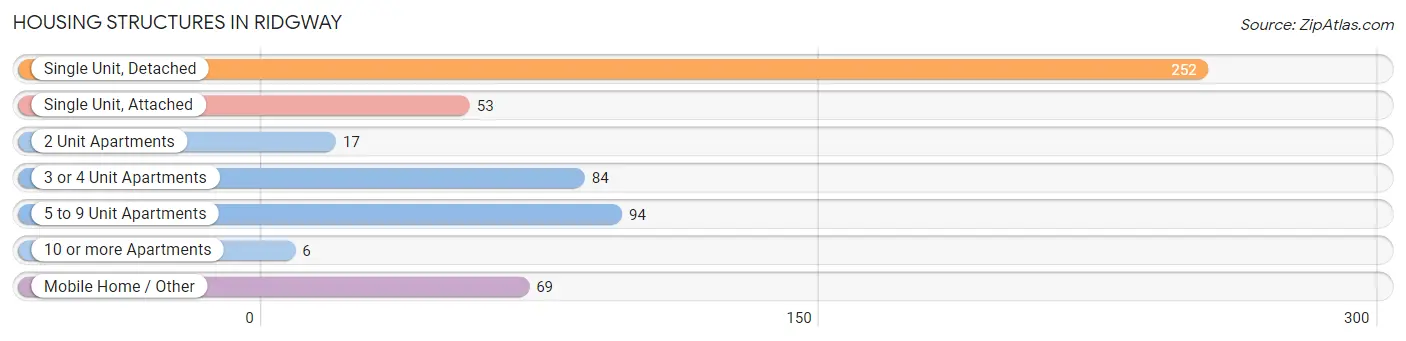
| Structure Type | # Housing Units | % Housing Units |
| Single Unit, Detached | 252 | 43.8% |
| Single Unit, Attached | 53 | 9.2% |
| 2 Unit Apartments | 17 | 3.0% |
| 3 or 4 Unit Apartments | 84 | 14.6% |
| 5 to 9 Unit Apartments | 94 | 16.4% |
| 10 or more Apartments | 6 | 1.0% |
| Mobile Home / Other | 69 | 12.0% |
| Total | 575 | 100.0% |
Housing Structures by Occupancy in Ridgway
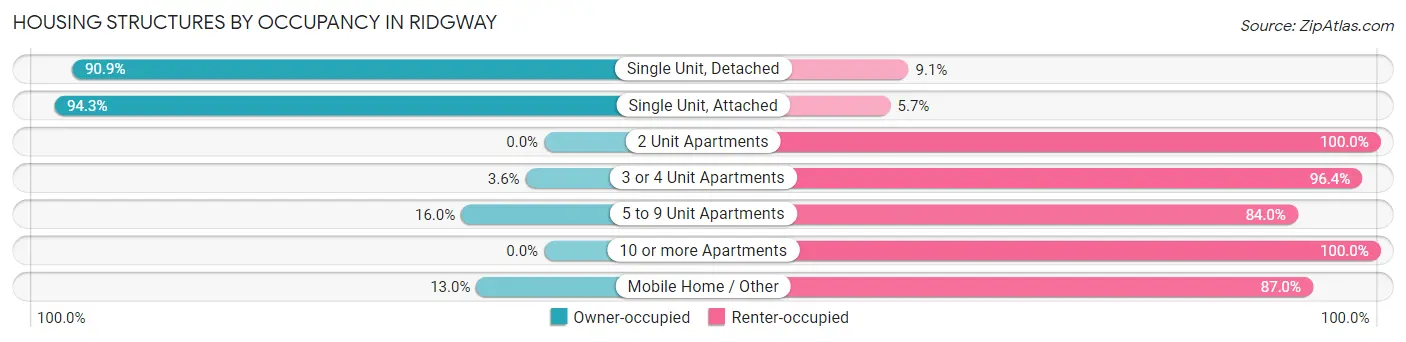
| Structure Type | Owner-occupied | Renter-occupied |
| Single Unit, Detached | 229 (90.9%) | 23 (9.1%) |
| Single Unit, Attached | 50 (94.3%) | 3 (5.7%) |
| 2 Unit Apartments | 0 (0.0%) | 17 (100.0%) |
| 3 or 4 Unit Apartments | 3 (3.6%) | 81 (96.4%) |
| 5 to 9 Unit Apartments | 15 (16.0%) | 79 (84.0%) |
| 10 or more Apartments | 0 (0.0%) | 6 (100.0%) |
| Mobile Home / Other | 9 (13.0%) | 60 (87.0%) |
| Total | 306 (53.2%) | 269 (46.8%) |
Housing Structures by Number of Rooms in Ridgway
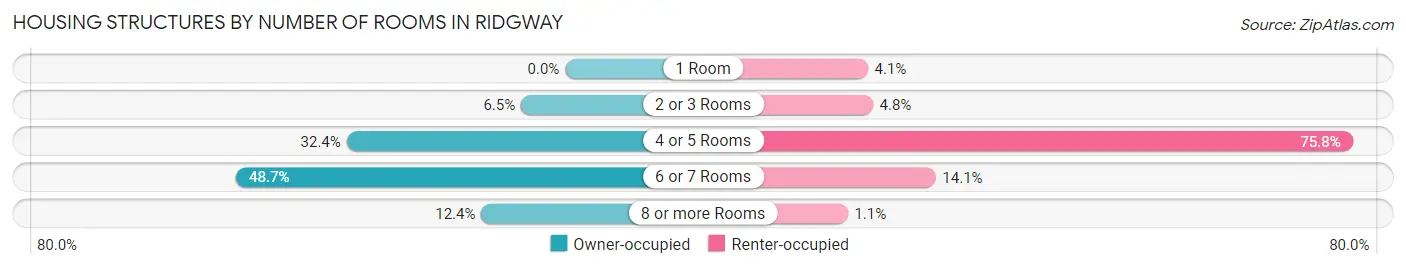
| Number of Rooms | Owner-occupied | Renter-occupied |
| 1 Room | 0 (0.0%) | 11 (4.1%) |
| 2 or 3 Rooms | 20 (6.5%) | 13 (4.8%) |
| 4 or 5 Rooms | 99 (32.4%) | 204 (75.8%) |
| 6 or 7 Rooms | 149 (48.7%) | 38 (14.1%) |
| 8 or more Rooms | 38 (12.4%) | 3 (1.1%) |
| Total | 306 (100.0%) | 269 (100.0%) |
Housing Structure by Heating Type in Ridgway
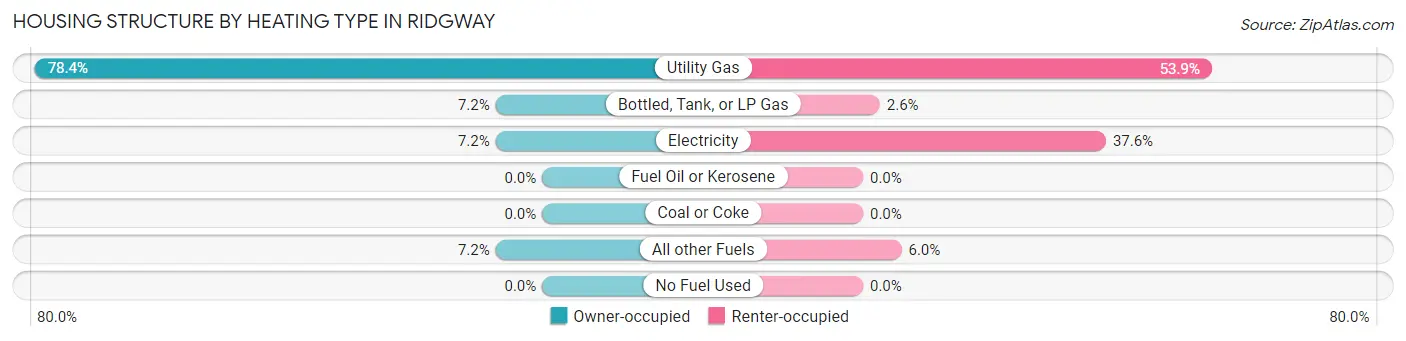
| Heating Type | Owner-occupied | Renter-occupied |
| Utility Gas | 240 (78.4%) | 145 (53.9%) |
| Bottled, Tank, or LP Gas | 22 (7.2%) | 7 (2.6%) |
| Electricity | 22 (7.2%) | 101 (37.6%) |
| Fuel Oil or Kerosene | 0 (0.0%) | 0 (0.0%) |
| Coal or Coke | 0 (0.0%) | 0 (0.0%) |
| All other Fuels | 22 (7.2%) | 16 (5.9%) |
| No Fuel Used | 0 (0.0%) | 0 (0.0%) |
| Total | 306 (100.0%) | 269 (100.0%) |
Household Vehicle Usage in Ridgway
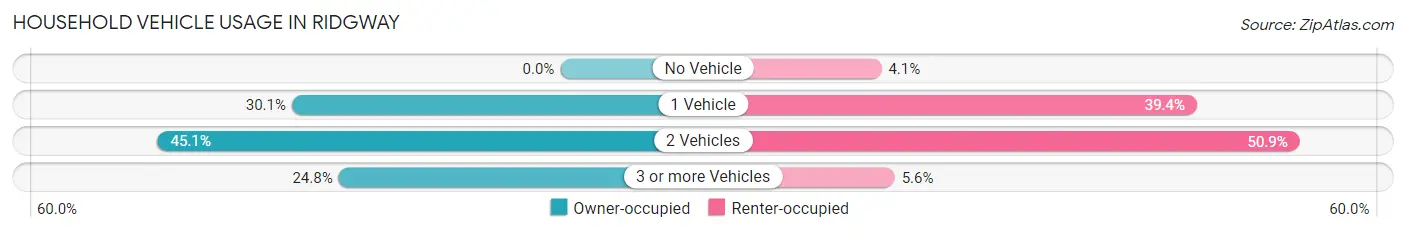
| Vehicles per Household | Owner-occupied | Renter-occupied |
| No Vehicle | 0 (0.0%) | 11 (4.1%) |
| 1 Vehicle | 92 (30.1%) | 106 (39.4%) |
| 2 Vehicles | 138 (45.1%) | 137 (50.9%) |
| 3 or more Vehicles | 76 (24.8%) | 15 (5.6%) |
| Total | 306 (100.0%) | 269 (100.0%) |
Real Estate & Mortgages in Ridgway
Real Estate and Mortgage Overview in Ridgway
| Characteristic | Without Mortgage | With Mortgage |
| Housing Units | 164 | 142 |
| Median Property Value | $547,300 | $626,800 |
| Median Household Income | $47,500 | $56 |
| Monthly Housing Costs | $445 | $13 |
| Real Estate Taxes | $1,559 | $0 |
Property Value by Mortgage Status in Ridgway
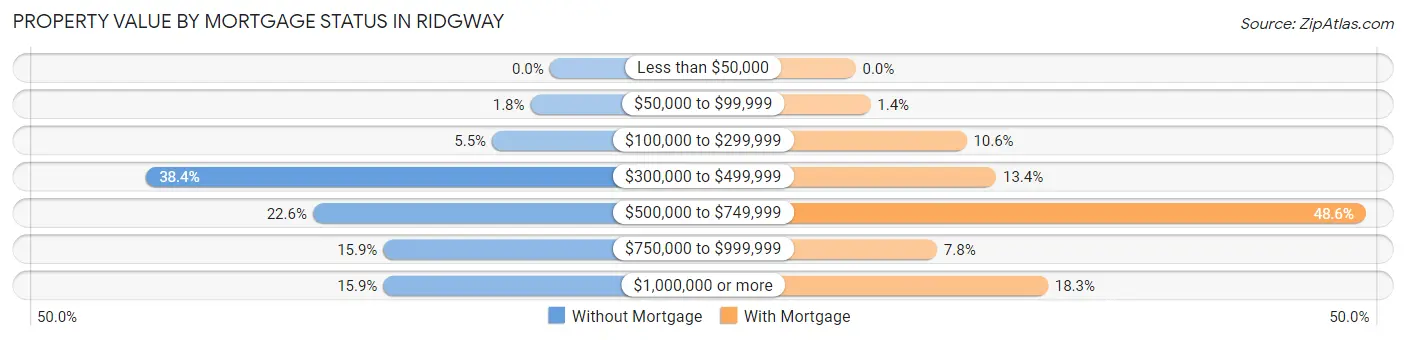
| Property Value | Without Mortgage | With Mortgage |
| Less than $50,000 | 0 (0.0%) | 0 (0.0%) |
| $50,000 to $99,999 | 3 (1.8%) | 2 (1.4%) |
| $100,000 to $299,999 | 9 (5.5%) | 15 (10.6%) |
| $300,000 to $499,999 | 63 (38.4%) | 19 (13.4%) |
| $500,000 to $749,999 | 37 (22.6%) | 69 (48.6%) |
| $750,000 to $999,999 | 26 (15.9%) | 11 (7.7%) |
| $1,000,000 or more | 26 (15.9%) | 26 (18.3%) |
| Total | 164 (100.0%) | 142 (100.0%) |
Household Income by Mortgage Status in Ridgway
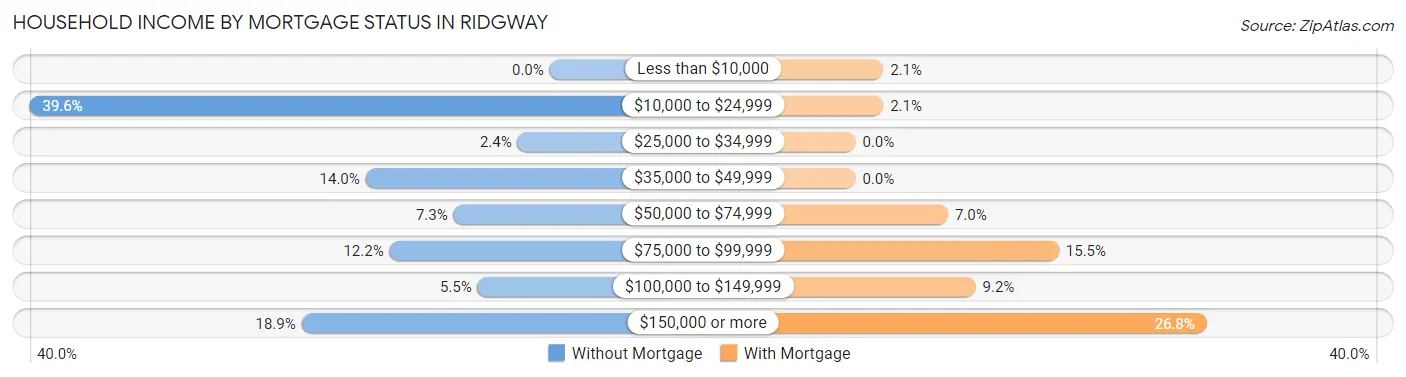
| Household Income | Without Mortgage | With Mortgage |
| Less than $10,000 | 0 (0.0%) | 3 (2.1%) |
| $10,000 to $24,999 | 65 (39.6%) | 3 (2.1%) |
| $25,000 to $34,999 | 4 (2.4%) | 0 (0.0%) |
| $35,000 to $49,999 | 23 (14.0%) | 0 (0.0%) |
| $50,000 to $74,999 | 12 (7.3%) | 10 (7.0%) |
| $75,000 to $99,999 | 20 (12.2%) | 22 (15.5%) |
| $100,000 to $149,999 | 9 (5.5%) | 13 (9.1%) |
| $150,000 or more | 31 (18.9%) | 38 (26.8%) |
| Total | 164 (100.0%) | 142 (100.0%) |
Property Value to Household Income Ratio in Ridgway
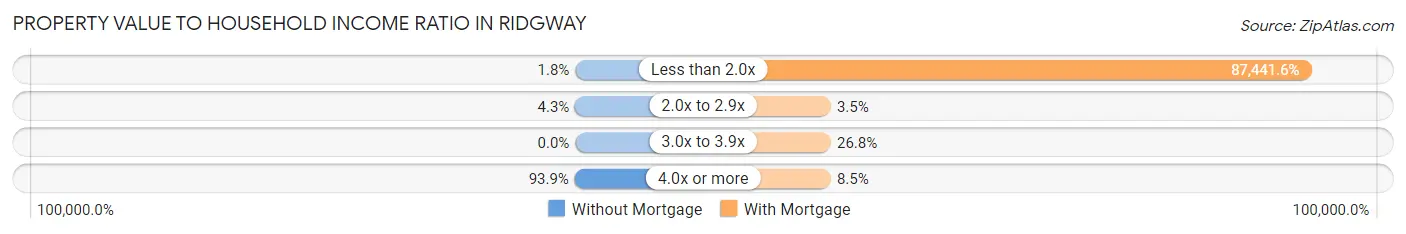
| Value-to-Income Ratio | Without Mortgage | With Mortgage |
| Less than 2.0x | 3 (1.8%) | 124,167 (87,441.5%) |
| 2.0x to 2.9x | 7 (4.3%) | 5 (3.5%) |
| 3.0x to 3.9x | 0 (0.0%) | 38 (26.8%) |
| 4.0x or more | 154 (93.9%) | 12 (8.5%) |
| Total | 164 (100.0%) | 142 (100.0%) |
Real Estate Taxes by Mortgage Status in Ridgway
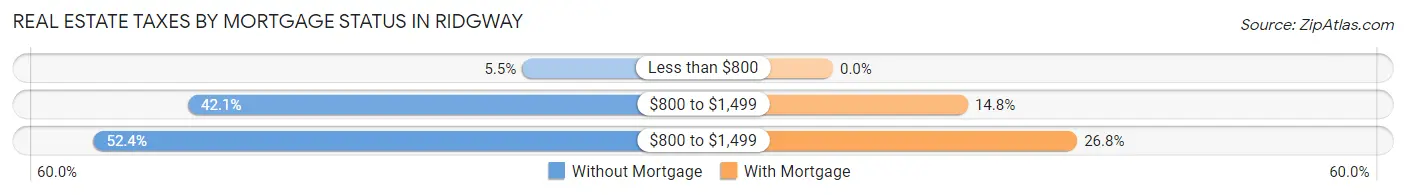
| Property Taxes | Without Mortgage | With Mortgage |
| Less than $800 | 9 (5.5%) | 0 (0.0%) |
| $800 to $1,499 | 69 (42.1%) | 21 (14.8%) |
| $800 to $1,499 | 86 (52.4%) | 38 (26.8%) |
| Total | 164 (100.0%) | 142 (100.0%) |
Health & Disability in Ridgway
Health Insurance Coverage by Age in Ridgway
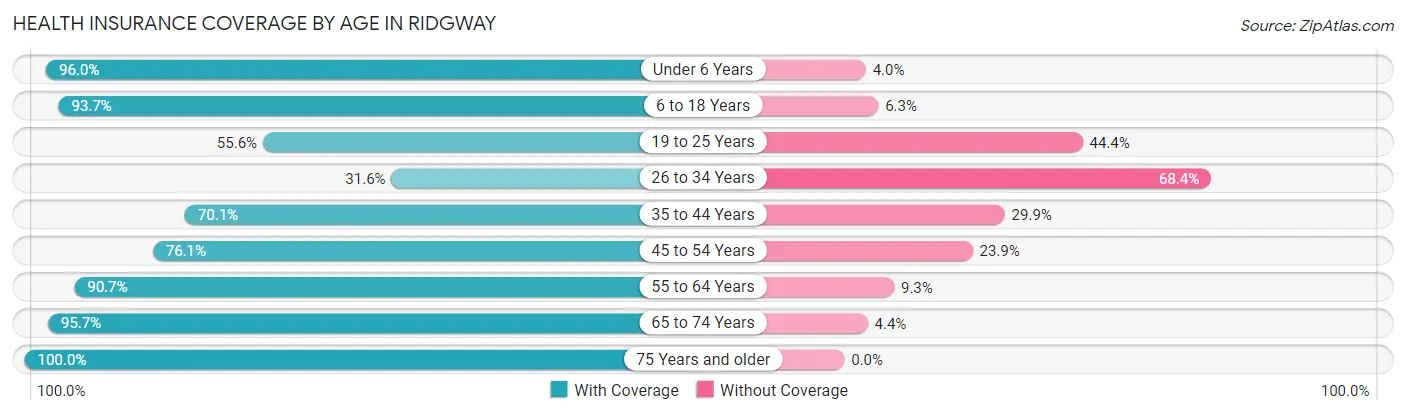
| Age Bracket | With Coverage | Without Coverage |
| Under 6 Years | 48 (96.0%) | 2 (4.0%) |
| 6 to 18 Years | 89 (93.7%) | 6 (6.3%) |
| 19 to 25 Years | 10 (55.6%) | 8 (44.4%) |
| 26 to 34 Years | 79 (31.6%) | 171 (68.4%) |
| 35 to 44 Years | 68 (70.1%) | 29 (29.9%) |
| 45 to 54 Years | 105 (76.1%) | 33 (23.9%) |
| 55 to 64 Years | 186 (90.7%) | 19 (9.3%) |
| 65 to 74 Years | 176 (95.7%) | 8 (4.3%) |
| 75 Years and older | 56 (100.0%) | 0 (0.0%) |
| Total | 817 (74.8%) | 276 (25.3%) |
Health Insurance Coverage by Citizenship Status in Ridgway
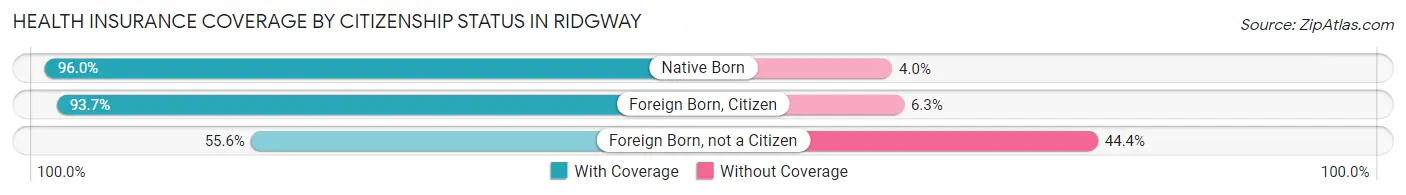
| Citizenship Status | With Coverage | Without Coverage |
| Native Born | 48 (96.0%) | 2 (4.0%) |
| Foreign Born, Citizen | 89 (93.7%) | 6 (6.3%) |
| Foreign Born, not a Citizen | 10 (55.6%) | 8 (44.4%) |
Health Insurance Coverage by Household Income in Ridgway
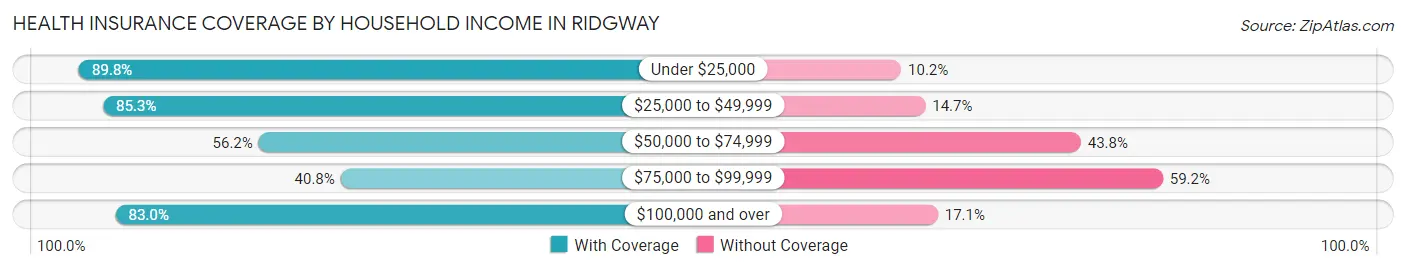
| Household Income | With Coverage | Without Coverage |
| Under $25,000 | 150 (89.8%) | 17 (10.2%) |
| $25,000 to $49,999 | 116 (85.3%) | 20 (14.7%) |
| $50,000 to $74,999 | 41 (56.2%) | 32 (43.8%) |
| $75,000 to $99,999 | 82 (40.8%) | 119 (59.2%) |
| $100,000 and over | 428 (83.0%) | 88 (17.1%) |
Public vs Private Health Insurance Coverage by Age in Ridgway
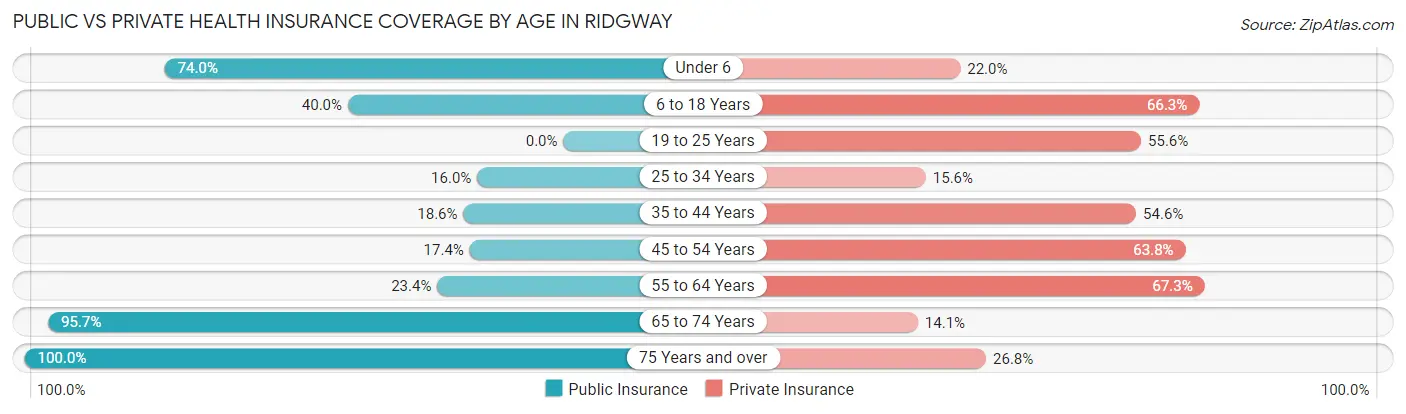
| Age Bracket | Public Insurance | Private Insurance |
| Under 6 | 37 (74.0%) | 11 (22.0%) |
| 6 to 18 Years | 38 (40.0%) | 63 (66.3%) |
| 19 to 25 Years | 0 (0.0%) | 10 (55.6%) |
| 25 to 34 Years | 40 (16.0%) | 39 (15.6%) |
| 35 to 44 Years | 18 (18.6%) | 53 (54.6%) |
| 45 to 54 Years | 24 (17.4%) | 88 (63.8%) |
| 55 to 64 Years | 48 (23.4%) | 138 (67.3%) |
| 65 to 74 Years | 176 (95.7%) | 26 (14.1%) |
| 75 Years and over | 56 (100.0%) | 15 (26.8%) |
| Total | 437 (40.0%) | 443 (40.5%) |
Disability Status by Sex by Age in Ridgway
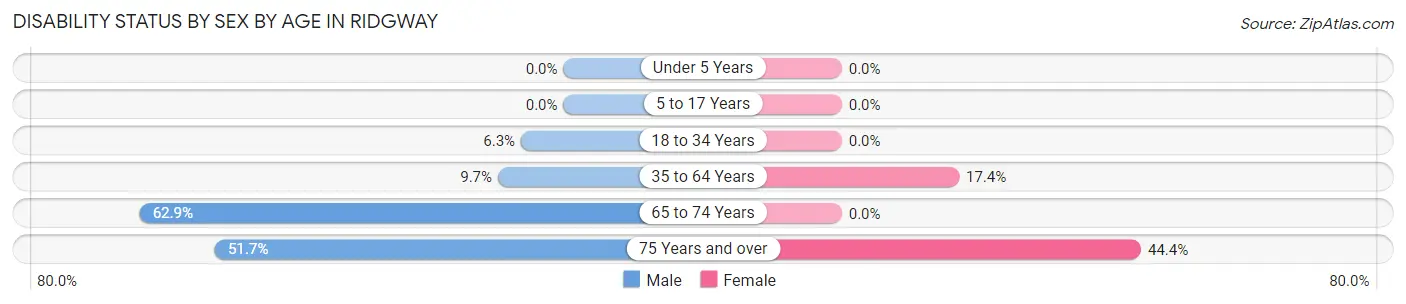
| Age Bracket | Male | Female |
| Under 5 Years | 0 (0.0%) | 0 (0.0%) |
| 5 to 17 Years | 0 (0.0%) | 0 (0.0%) |
| 18 to 34 Years | 8 (6.3%) | 0 (0.0%) |
| 35 to 64 Years | 21 (9.7%) | 39 (17.4%) |
| 65 to 74 Years | 78 (62.9%) | 0 (0.0%) |
| 75 Years and over | 15 (51.7%) | 12 (44.4%) |
Disability Class by Sex by Age in Ridgway
Disability Class: Hearing Difficulty
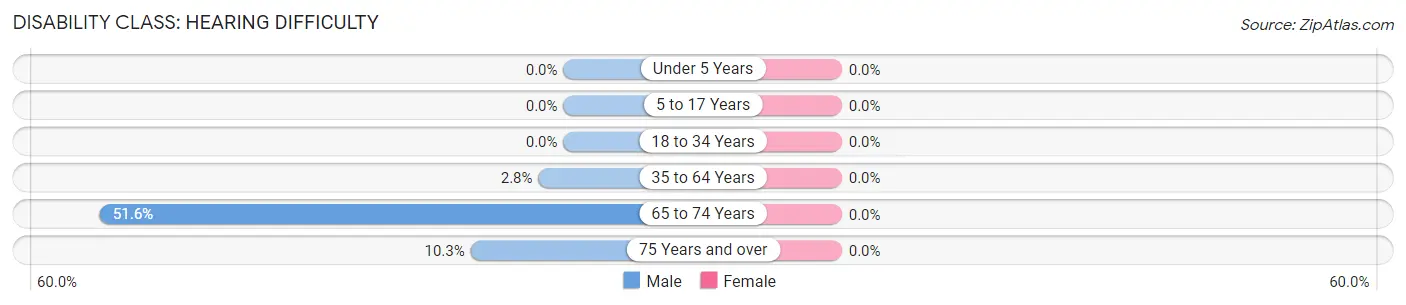
| Age Bracket | Male | Female |
| Under 5 Years | 0 (0.0%) | 0 (0.0%) |
| 5 to 17 Years | 0 (0.0%) | 0 (0.0%) |
| 18 to 34 Years | 0 (0.0%) | 0 (0.0%) |
| 35 to 64 Years | 6 (2.8%) | 0 (0.0%) |
| 65 to 74 Years | 64 (51.6%) | 0 (0.0%) |
| 75 Years and over | 3 (10.3%) | 0 (0.0%) |
Disability Class: Vision Difficulty
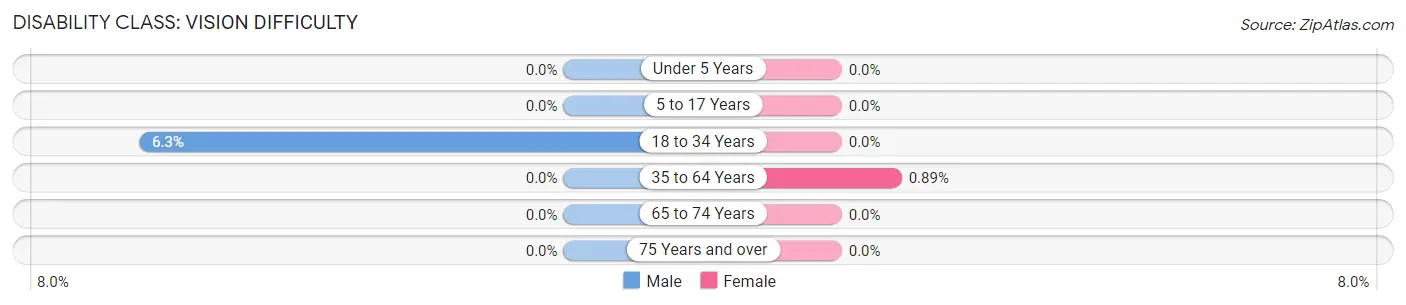
| Age Bracket | Male | Female |
| Under 5 Years | 0 (0.0%) | 0 (0.0%) |
| 5 to 17 Years | 0 (0.0%) | 0 (0.0%) |
| 18 to 34 Years | 8 (6.3%) | 0 (0.0%) |
| 35 to 64 Years | 0 (0.0%) | 2 (0.9%) |
| 65 to 74 Years | 0 (0.0%) | 0 (0.0%) |
| 75 Years and over | 0 (0.0%) | 0 (0.0%) |
Disability Class: Cognitive Difficulty
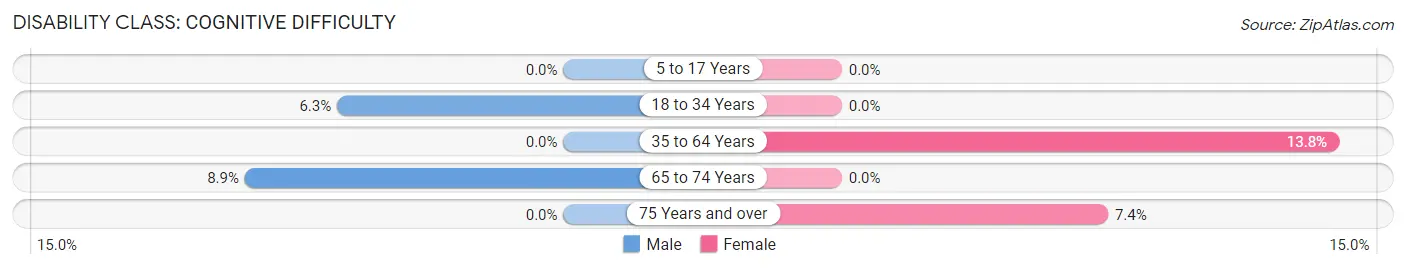
| Age Bracket | Male | Female |
| 5 to 17 Years | 0 (0.0%) | 0 (0.0%) |
| 18 to 34 Years | 8 (6.3%) | 0 (0.0%) |
| 35 to 64 Years | 0 (0.0%) | 31 (13.8%) |
| 65 to 74 Years | 11 (8.9%) | 0 (0.0%) |
| 75 Years and over | 0 (0.0%) | 2 (7.4%) |
Disability Class: Ambulatory Difficulty
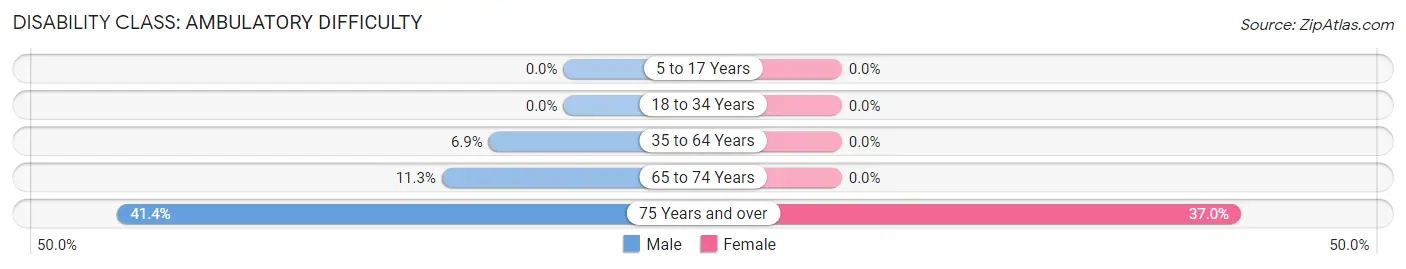
| Age Bracket | Male | Female |
| 5 to 17 Years | 0 (0.0%) | 0 (0.0%) |
| 18 to 34 Years | 0 (0.0%) | 0 (0.0%) |
| 35 to 64 Years | 15 (6.9%) | 0 (0.0%) |
| 65 to 74 Years | 14 (11.3%) | 0 (0.0%) |
| 75 Years and over | 12 (41.4%) | 10 (37.0%) |
Disability Class: Self-Care Difficulty
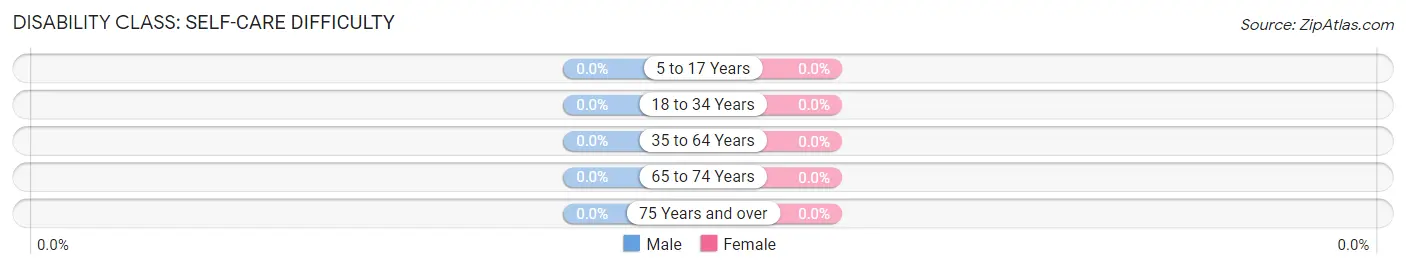
| Age Bracket | Male | Female |
| 5 to 17 Years | 0 (0.0%) | 0 (0.0%) |
| 18 to 34 Years | 0 (0.0%) | 0 (0.0%) |
| 35 to 64 Years | 0 (0.0%) | 0 (0.0%) |
| 65 to 74 Years | 0 (0.0%) | 0 (0.0%) |
| 75 Years and over | 0 (0.0%) | 0 (0.0%) |
Technology Access in Ridgway
Computing Device Access in Ridgway
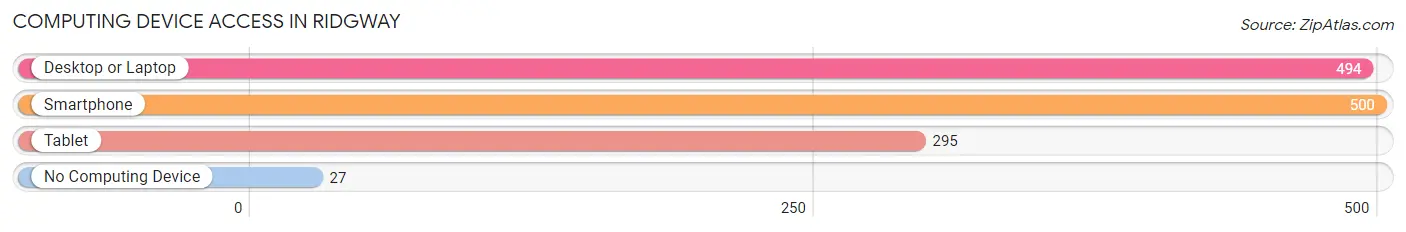
| Device Type | # Households | % Households |
| Desktop or Laptop | 494 | 85.9% |
| Smartphone | 500 | 87.0% |
| Tablet | 295 | 51.3% |
| No Computing Device | 27 | 4.7% |
| Total | 575 | 100.0% |
Internet Access in Ridgway
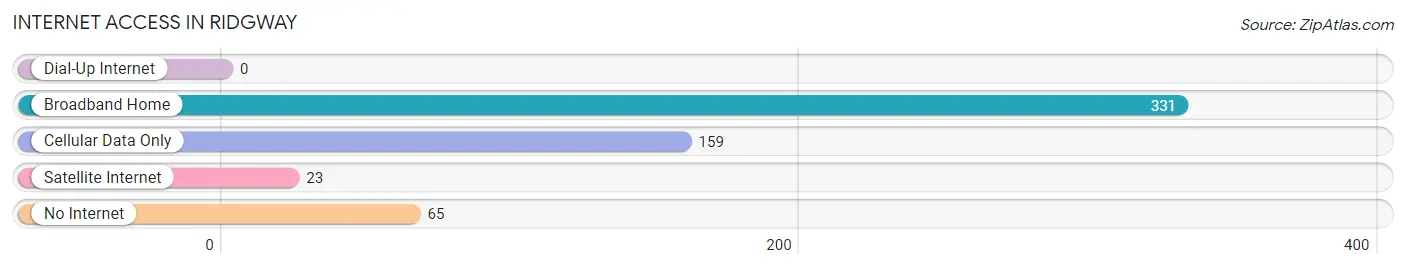
| Internet Type | # Households | % Households |
| Dial-Up Internet | 0 | 0.0% |
| Broadband Home | 331 | 57.6% |
| Cellular Data Only | 159 | 27.7% |
| Satellite Internet | 23 | 4.0% |
| No Internet | 65 | 11.3% |
| Total | 575 | 100.0% |
Ridgway Summary
Ridgway is a small town located in Ouray County, Colorado, United States. It is situated in the San Juan Mountains, at an elevation of 6,800 feet (2,073 m). The town was founded in 1883 and is named after the nearby Ridgway Reservoir. As of the 2010 census, the town had a population of 913.
History
Ridgway was founded in 1883 by John Ridgway, a prospector who discovered gold in the area. He named the town after himself and the nearby Ridgway Reservoir. The town quickly grew and by the early 1900s, it had become a bustling mining town with a population of over 1,000. The town was also home to a number of saloons, hotels, and other businesses.
In the late 1800s, the Denver and Rio Grande Western Railroad built a line through Ridgway, connecting it to the rest of the country. This allowed the town to become a major shipping hub for the region.
In the early 1900s, the town began to decline as the mining industry in the area began to decline. By the 1950s, the population had dropped to just over 500.
In the late 1970s, the town began to experience a resurgence as it became a popular tourist destination. The town was featured in the movie True Grit, which was filmed in the area. This helped to bring more visitors to the town and the population began to grow again.
Geography
Ridgway is located in the San Juan Mountains of southwestern Colorado. It is situated at an elevation of 6,800 feet (2,073 m). The town is located on the Uncompahgre Plateau, which is a large plateau that covers much of western Colorado.
The town is surrounded by mountains, including the San Juan Mountains to the east, the Uncompahgre Plateau to the west, and the San Miguel Mountains to the south. The town is located near the Ridgway Reservoir, which is a popular recreational area.
Economy
Ridgway’s economy is largely based on tourism. The town is a popular destination for outdoor recreation, such as camping, fishing, hiking, and mountain biking. The town is also home to a number of art galleries, restaurants, and other businesses.
The town is also home to a number of small businesses, such as construction companies, auto repair shops, and other service-based businesses.
Demographics
As of the 2010 census, the town had a population of 913. The racial makeup of the town was 91.3% White, 0.7% African American, 0.7% Native American, 0.7% Asian, 0.1% Pacific Islander, 4.2% from other races, and 2.1% from two or more races. Hispanic or Latino of any race were 8.2% of the population.
The median income for a household in the town was $37,500, and the median income for a family was $45,000. The per capita income for the town was $20,945. About 11.2% of families and 14.2% of the population were below the poverty line, including 18.2% of those under age 18 and 8.3% of those age 65 or over.
Common Questions
What is Per Capita Income in Ridgway?
Per Capita income in Ridgway is $50,136.
What is the Median Family Income in Ridgway?
Median Family Income in Ridgway is $124,286.
What is the Median Household income in Ridgway?
Median Household Income in Ridgway is $82,903.
What is Income or Wage Gap in Ridgway?
Income or Wage Gap in Ridgway is 26.2%.
Women in Ridgway earn 73.8 cents for every dollar earned by a man.
What is Inequality or Gini Index in Ridgway?
Inequality or Gini Index in Ridgway is 0.48.
What is the Total Population of Ridgway?
Total Population of Ridgway is 1,093.
What is the Total Male Population of Ridgway?
Total Male Population of Ridgway is 553.
What is the Total Female Population of Ridgway?
Total Female Population of Ridgway is 540.
What is the Ratio of Males per 100 Females in Ridgway?
There are 102.41 Males per 100 Females in Ridgway.
What is the Ratio of Females per 100 Males in Ridgway?
There are 97.65 Females per 100 Males in Ridgway.
What is the Median Population Age in Ridgway?
Median Population Age in Ridgway is 48.0 Years.
What is the Average Family Size in Ridgway
Average Family Size in Ridgway is 3.0 People.
What is the Average Household Size in Ridgway
Average Household Size in Ridgway is 1.9 People.
How Large is the Labor Force in Ridgway?
There are 631 People in the Labor Forcein in Ridgway.
What is the Percentage of People in the Labor Force in Ridgway?
65.5% of People are in the Labor Force in Ridgway.
What is the Unemployment Rate in Ridgway?
Unemployment Rate in Ridgway is 10.1%.