Redvale, CO Map & Demographics
Redvale Map
Redvale Overview
$32,194
PER CAPITA INCOME
$85,921
AVG FAMILY INCOME
$84,107
AVG HOUSEHOLD INCOME
0.38
INEQUALITY / GINI INDEX
349
TOTAL POPULATION
202
MALE POPULATION
147
FEMALE POPULATION
137.41
MALES / 100 FEMALES
72.77
FEMALES / 100 MALES
46.5
MEDIAN AGE
3.0
AVG FAMILY SIZE
3.1
AVG HOUSEHOLD SIZE
180
LABOR FORCE [ PEOPLE ]
64.3%
PERCENT IN LABOR FORCE
5.0%
UNEMPLOYMENT RATE
Redvale Zip Codes
Redvale Area Codes
Income in Redvale
Income Overview in Redvale
Per Capita Income in Redvale is $32,194, while median incomes of families and households are $85,921 and $84,107 respectively.
| Characteristic | Number | Measure |
| Per Capita Income | 349 | $32,194 |
| Median Family Income | 94 | $85,921 |
| Mean Family Income | 94 | $98,571 |
| Median Household Income | 113 | $84,107 |
| Mean Household Income | 113 | $91,275 |
| Income Deficit | 94 | $0 |
| Wage / Income Gap (%) | 349 | 0.00% |
| Wage / Income Gap ($) | 349 | 100.00¢ per $1 |
| Gini / Inequality Index | 349 | 0.38 |
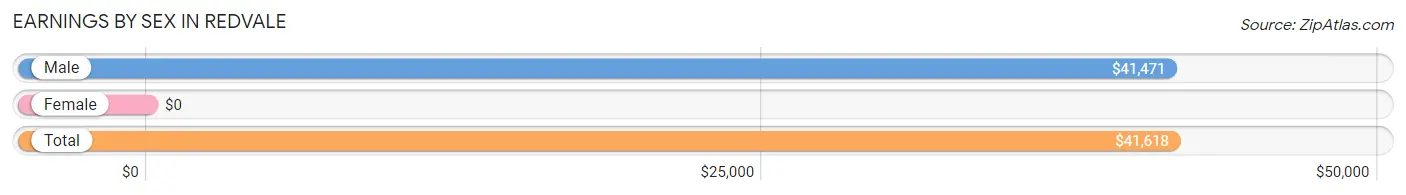
Earnings by Sex in Redvale
| Sex | Number | Average Earnings |
| Male | 142 (75.5%) | $41,471 |
| Female | 46 (24.5%) | $0 |
| Total | 188 (100.0%) | $41,618 |
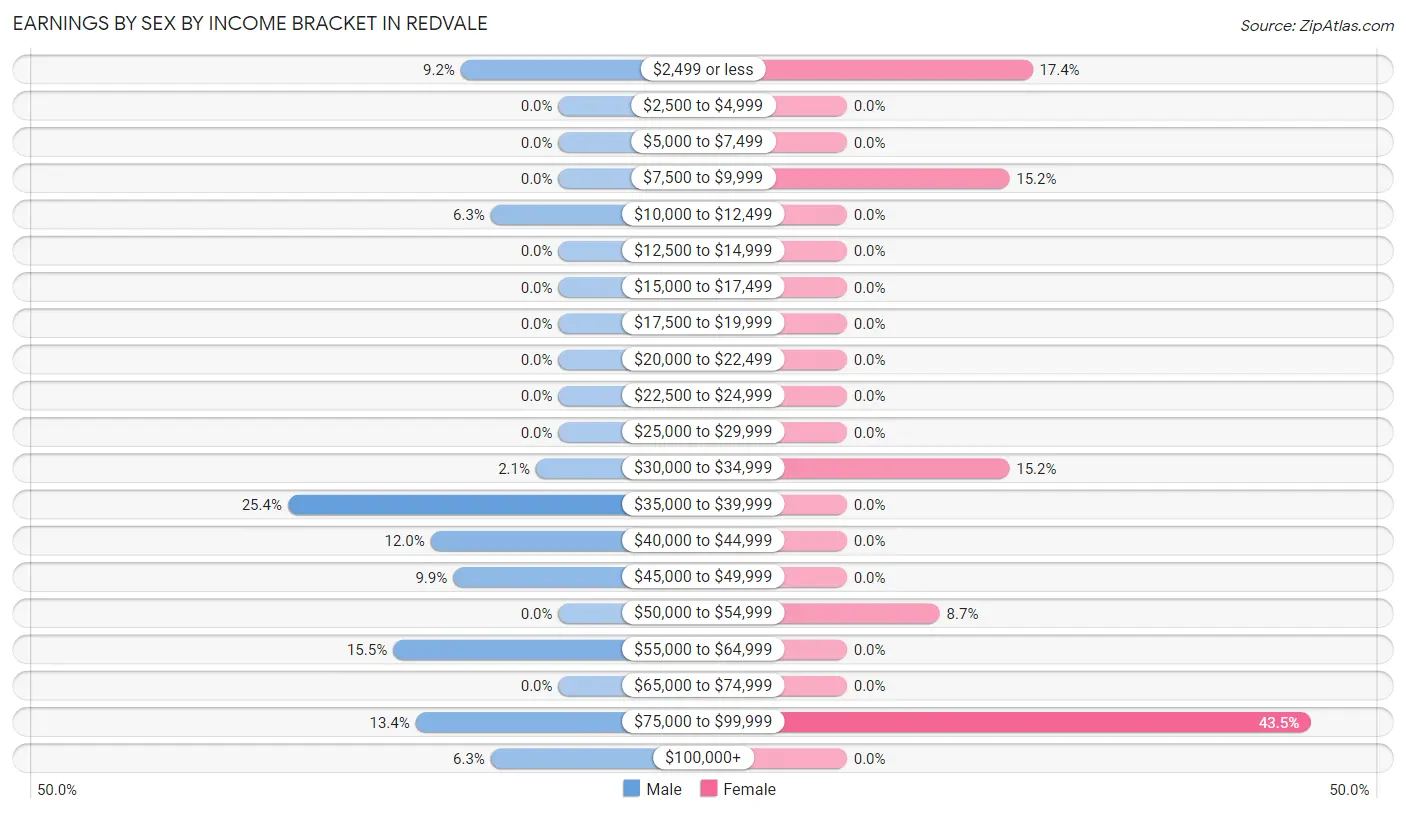
Earnings by Sex by Income Bracket in Redvale
The most common earnings brackets in Redvale are $35,000 to $39,999 for men (36 | 25.4%) and $75,000 to $99,999 for women (20 | 43.5%).
| Income | Male | Female |
| $2,499 or less | 13 (9.1%) | 8 (17.4%) |
| $2,500 to $4,999 | 0 (0.0%) | 0 (0.0%) |
| $5,000 to $7,499 | 0 (0.0%) | 0 (0.0%) |
| $7,500 to $9,999 | 0 (0.0%) | 7 (15.2%) |
| $10,000 to $12,499 | 9 (6.3%) | 0 (0.0%) |
| $12,500 to $14,999 | 0 (0.0%) | 0 (0.0%) |
| $15,000 to $17,499 | 0 (0.0%) | 0 (0.0%) |
| $17,500 to $19,999 | 0 (0.0%) | 0 (0.0%) |
| $20,000 to $22,499 | 0 (0.0%) | 0 (0.0%) |
| $22,500 to $24,999 | 0 (0.0%) | 0 (0.0%) |
| $25,000 to $29,999 | 0 (0.0%) | 0 (0.0%) |
| $30,000 to $34,999 | 3 (2.1%) | 7 (15.2%) |
| $35,000 to $39,999 | 36 (25.4%) | 0 (0.0%) |
| $40,000 to $44,999 | 17 (12.0%) | 0 (0.0%) |
| $45,000 to $49,999 | 14 (9.9%) | 0 (0.0%) |
| $50,000 to $54,999 | 0 (0.0%) | 4 (8.7%) |
| $55,000 to $64,999 | 22 (15.5%) | 0 (0.0%) |
| $65,000 to $74,999 | 0 (0.0%) | 0 (0.0%) |
| $75,000 to $99,999 | 19 (13.4%) | 20 (43.5%) |
| $100,000+ | 9 (6.3%) | 0 (0.0%) |
| Total | 142 (100.0%) | 46 (100.0%) |
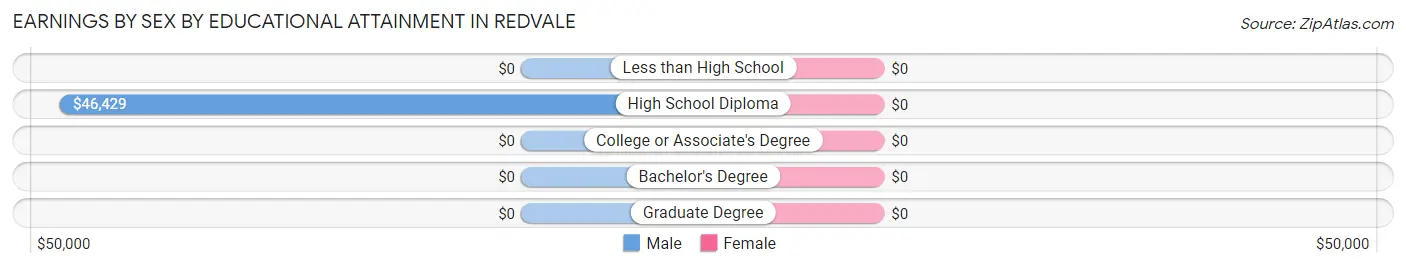
Earnings by Sex by Educational Attainment in Redvale
| Educational Attainment | Male Income | Female Income |
| Less than High School | - | - |
| High School Diploma | $46,429 | $0 |
| College or Associate's Degree | - | - |
| Bachelor's Degree | - | - |
| Graduate Degree | - | - |
| Total | $42,426 | $0 |
Family Income in Redvale
Family Income Brackets in Redvale
According to the Redvale family income data, there are 35 families falling into the $75,000 to $99,999 income range, which is the most common income bracket and makes up 37.2% of all families.
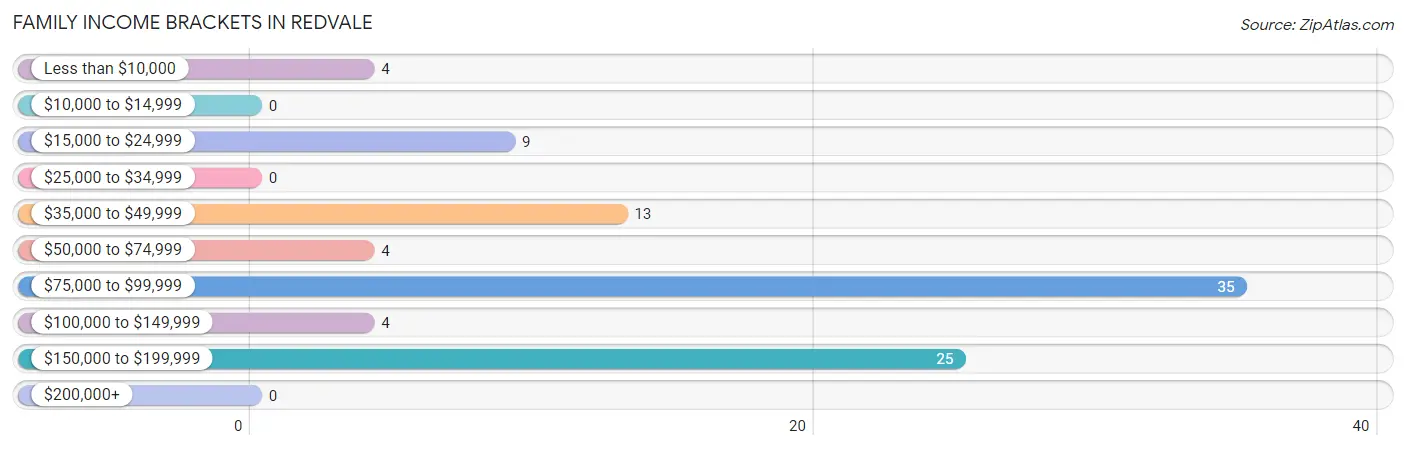
| Income Bracket | # Families | % Families |
| Less than $10,000 | 4 | 4.3% |
| $10,000 to $14,999 | 0 | 0.0% |
| $15,000 to $24,999 | 9 | 9.6% |
| $25,000 to $34,999 | 0 | 0.0% |
| $35,000 to $49,999 | 13 | 13.8% |
| $50,000 to $74,999 | 4 | 4.3% |
| $75,000 to $99,999 | 35 | 37.2% |
| $100,000 to $149,999 | 4 | 4.3% |
| $150,000 to $199,999 | 25 | 26.6% |
| $200,000+ | 0 | 0.0% |
Family Income by Famaliy Size in Redvale
5-person families (21 | 22.3%) account for the highest median family income in Redvale with $192,813 per family, while 2-person families (60 | 63.8%) have the highest median income of $42,894 per family member.
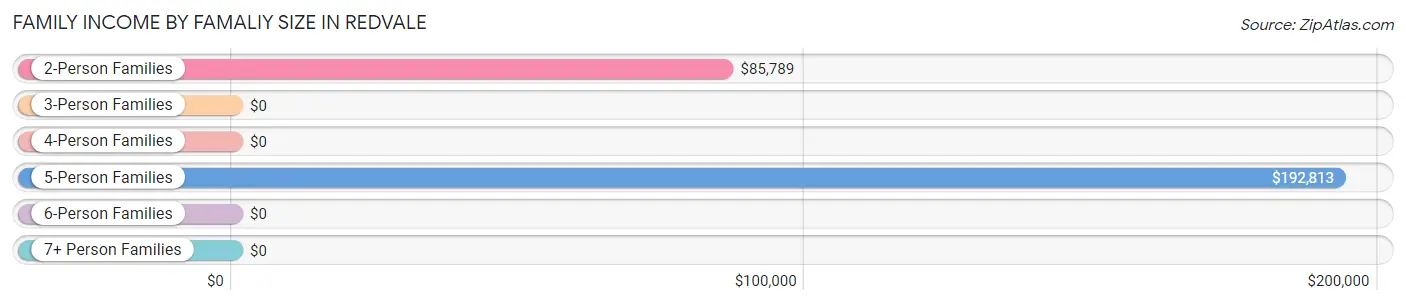
| Income Bracket | # Families | Median Income |
| 2-Person Families | 60 (63.8%) | $85,789 |
| 3-Person Families | 13 (13.8%) | $0 |
| 4-Person Families | 0 (0.0%) | $0 |
| 5-Person Families | 21 (22.3%) | $192,813 |
| 6-Person Families | 0 (0.0%) | $0 |
| 7+ Person Families | 0 (0.0%) | $0 |
| Total | 94 (100.0%) | $85,921 |
Family Income by Number of Earners in Redvale
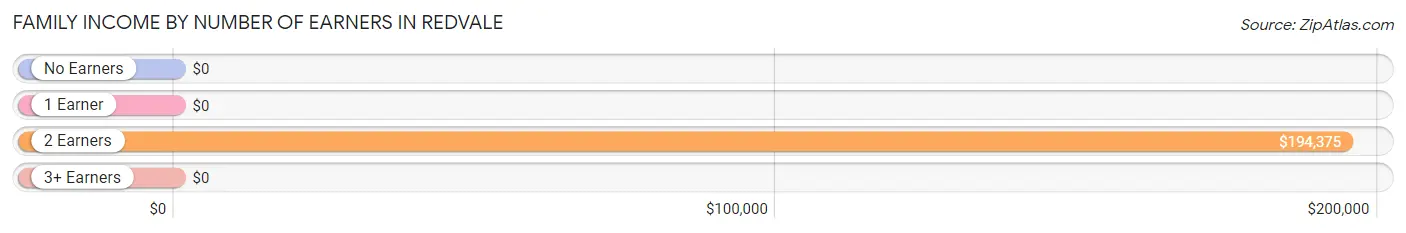
| Number of Earners | # Families | Median Income |
| No Earners | 20 (21.3%) | $0 |
| 1 Earner | 33 (35.1%) | $0 |
| 2 Earners | 32 (34.0%) | $194,375 |
| 3+ Earners | 9 (9.6%) | $0 |
| Total | 94 (100.0%) | $85,921 |
Household Income in Redvale
Household Income Brackets in Redvale
With 35 households falling in the category, the $75,000 to $99,999 income range is the most frequent in Redvale, accounting for 31.0% of all households.
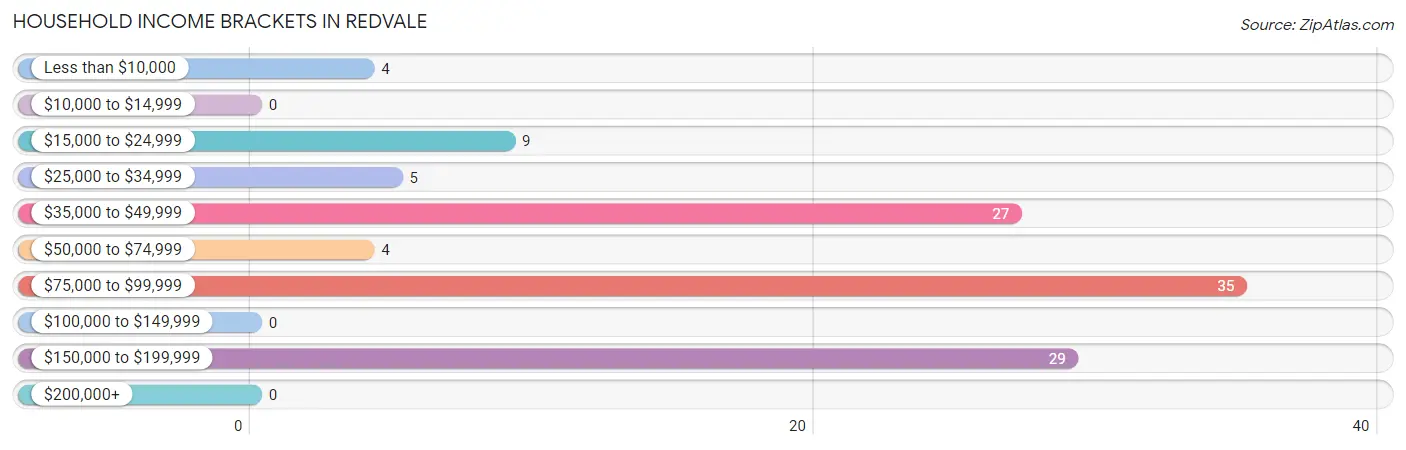
| Income Bracket | # Households | % Households |
| Less than $10,000 | 4 | 3.5% |
| $10,000 to $14,999 | 0 | 0.0% |
| $15,000 to $24,999 | 9 | 8.0% |
| $25,000 to $34,999 | 5 | 4.4% |
| $35,000 to $49,999 | 27 | 23.9% |
| $50,000 to $74,999 | 4 | 3.5% |
| $75,000 to $99,999 | 35 | 31.0% |
| $100,000 to $149,999 | 0 | 0.0% |
| $150,000 to $199,999 | 29 | 25.7% |
| $200,000+ | 0 | 0.0% |
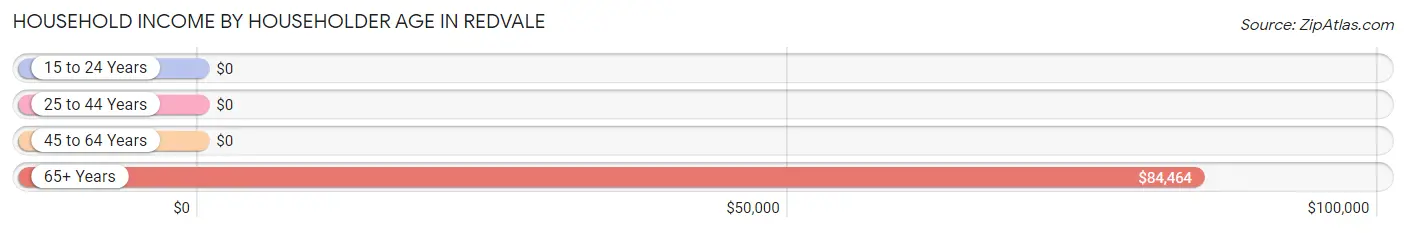
Household Income by Householder Age in Redvale
The median household income in Redvale is $84,107, with the highest median household income of $84,464 found in the 65+ years age bracket for the primary householder. A total of 47 households (41.6%) fall into this category. Meanwhile, the 15 to 24 years age bracket for the primary householder has the lowest median household income of $0, with 13 households (11.5%) in this group.
| Income Bracket | # Households | Median Income |
| 15 to 24 Years | 13 (11.5%) | $0 |
| 25 to 44 Years | 16 (14.2%) | $0 |
| 45 to 64 Years | 37 (32.7%) | $0 |
| 65+ Years | 47 (41.6%) | $84,464 |
| Total | 113 (100.0%) | $84,107 |
Poverty in Redvale
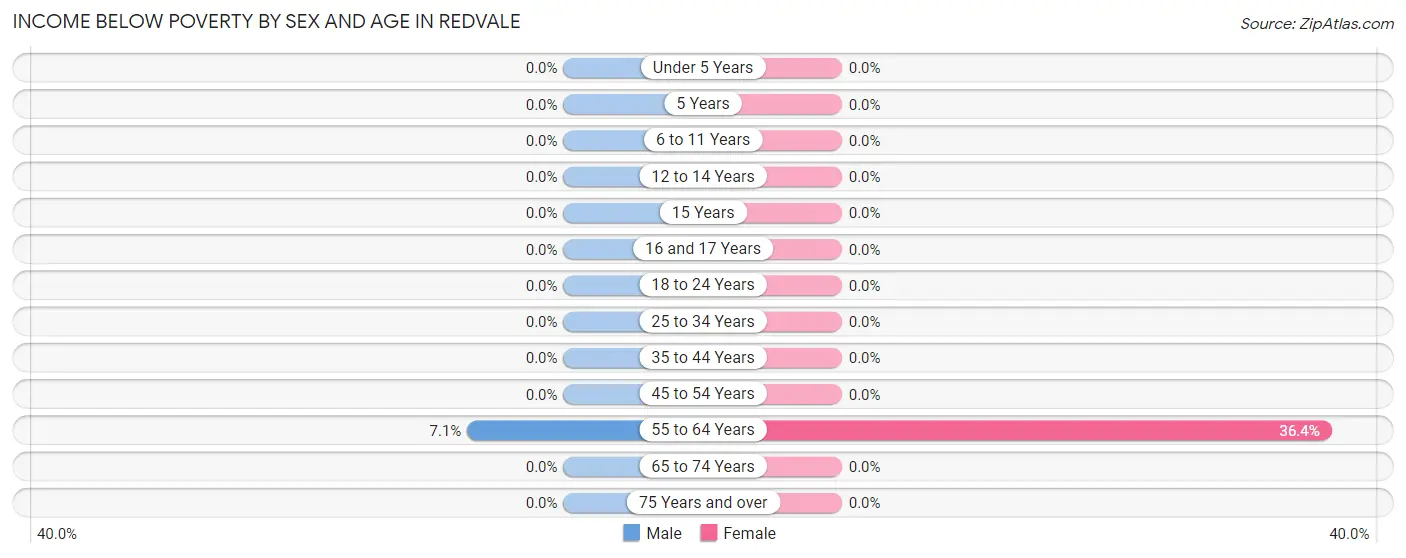
Income Below Poverty by Sex and Age in Redvale
With 2.0% poverty level for males and 3.2% for females among the residents of Redvale, 55 to 64 year old males and 55 to 64 year old females are the most vulnerable to poverty, with 4 males (7.1%) and 4 females (36.4%) in their respective age groups living below the poverty level.
| Age Bracket | Male | Female |
| Under 5 Years | 0 (0.0%) | 0 (0.0%) |
| 5 Years | 0 (0.0%) | 0 (0.0%) |
| 6 to 11 Years | 0 (0.0%) | 0 (0.0%) |
| 12 to 14 Years | 0 (0.0%) | 0 (0.0%) |
| 15 Years | 0 (0.0%) | 0 (0.0%) |
| 16 and 17 Years | 0 (0.0%) | 0 (0.0%) |
| 18 to 24 Years | 0 (0.0%) | 0 (0.0%) |
| 25 to 34 Years | 0 (0.0%) | 0 (0.0%) |
| 35 to 44 Years | 0 (0.0%) | 0 (0.0%) |
| 45 to 54 Years | 0 (0.0%) | 0 (0.0%) |
| 55 to 64 Years | 4 (7.1%) | 4 (36.4%) |
| 65 to 74 Years | 0 (0.0%) | 0 (0.0%) |
| 75 Years and over | 0 (0.0%) | 0 (0.0%) |
| Total | 4 (2.0%) | 4 (3.2%) |
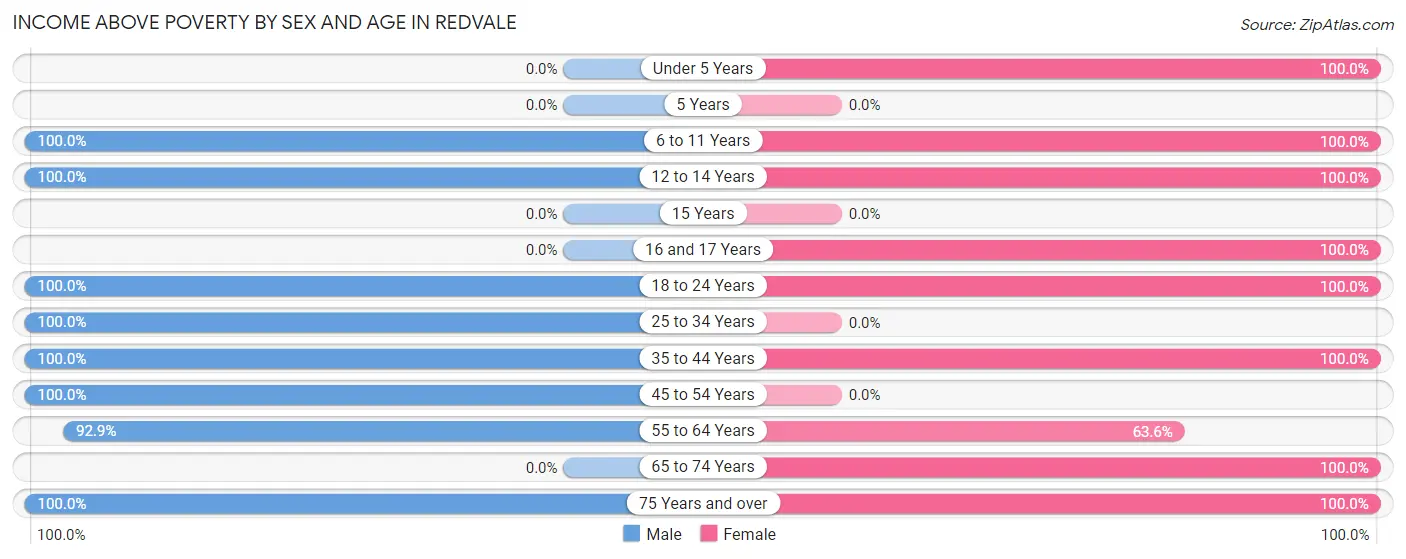
Income Above Poverty by Sex and Age in Redvale
According to the poverty statistics in Redvale, males aged 6 to 11 years and females aged under 5 years are the age groups that are most secure financially, with 100.0% of males and 100.0% of females in these age groups living above the poverty line.
| Age Bracket | Male | Female |
| Under 5 Years | 0 (0.0%) | 23 (100.0%) |
| 5 Years | 0 (0.0%) | 0 (0.0%) |
| 6 to 11 Years | 10 (100.0%) | 3 (100.0%) |
| 12 to 14 Years | 5 (100.0%) | 6 (100.0%) |
| 15 Years | 0 (0.0%) | 0 (0.0%) |
| 16 and 17 Years | 0 (0.0%) | 8 (100.0%) |
| 18 to 24 Years | 13 (100.0%) | 13 (100.0%) |
| 25 to 34 Years | 38 (100.0%) | 0 (0.0%) |
| 35 to 44 Years | 3 (100.0%) | 24 (100.0%) |
| 45 to 54 Years | 45 (100.0%) | 0 (0.0%) |
| 55 to 64 Years | 52 (92.9%) | 7 (63.6%) |
| 65 to 74 Years | 0 (0.0%) | 7 (100.0%) |
| 75 Years and over | 32 (100.0%) | 30 (100.0%) |
| Total | 198 (98.0%) | 121 (96.8%) |
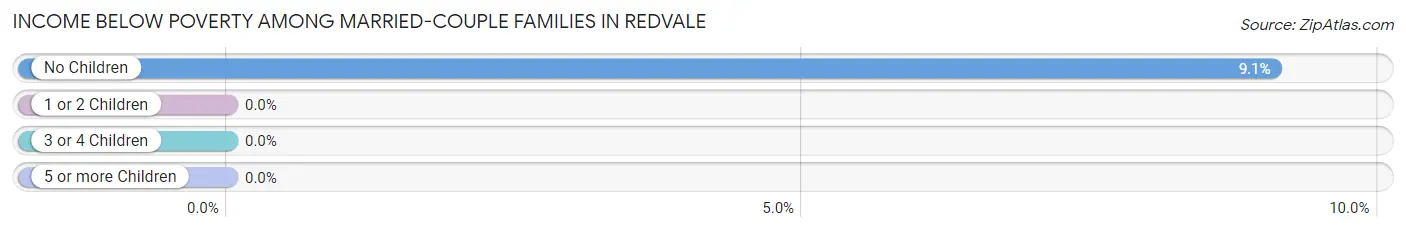
Income Below Poverty Among Married-Couple Families in Redvale
The poverty statistics for married-couple families in Redvale show that 5.6% or 4 of the total 72 families live below the poverty line. Families with no children have the highest poverty rate of 9.1%, comprising of 4 families. On the other hand, families with 1 or 2 children have the lowest poverty rate of 0.0%, which includes 0 families.
| Children | Above Poverty | Below Poverty |
| No Children | 40 (90.9%) | 4 (9.1%) |
| 1 or 2 Children | 13 (100.0%) | 0 (0.0%) |
| 3 or 4 Children | 15 (100.0%) | 0 (0.0%) |
| 5 or more Children | 0 (0.0%) | 0 (0.0%) |
| Total | 68 (94.4%) | 4 (5.6%) |
Income Below Poverty Among Single-Parent Households in Redvale
| Children | Single Father | Single Mother |
| No Children | 0 (0.0%) | 0 (0.0%) |
| 1 or 2 Children | 0 (0.0%) | 0 (0.0%) |
| 3 or 4 Children | 0 (0.0%) | 0 (0.0%) |
| 5 or more Children | 0 (0.0%) | 0 (0.0%) |
| Total | 0 (0.0%) | 0 (0.0%) |
Income Below Poverty Among Married-Couple vs Single-Parent Households in Redvale
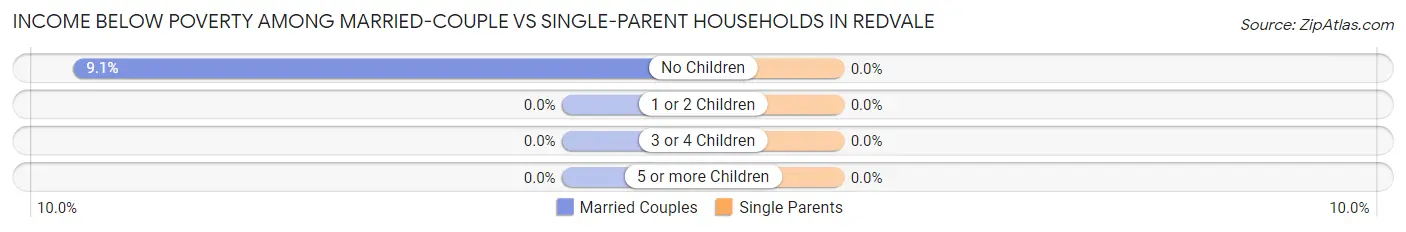
| Children | Married-Couple Families | Single-Parent Households |
| No Children | 4 (9.1%) | 0 (0.0%) |
| 1 or 2 Children | 0 (0.0%) | 0 (0.0%) |
| 3 or 4 Children | 0 (0.0%) | 0 (0.0%) |
| 5 or more Children | 0 (0.0%) | 0 (0.0%) |
| Total | 4 (5.6%) | 0 (0.0%) |
Race in Redvale
The most populous races in Redvale are White / Caucasian (284 | 81.4%), Two or more Races (57 | 16.3%), and Hispanic or Latino (44 | 12.6%).
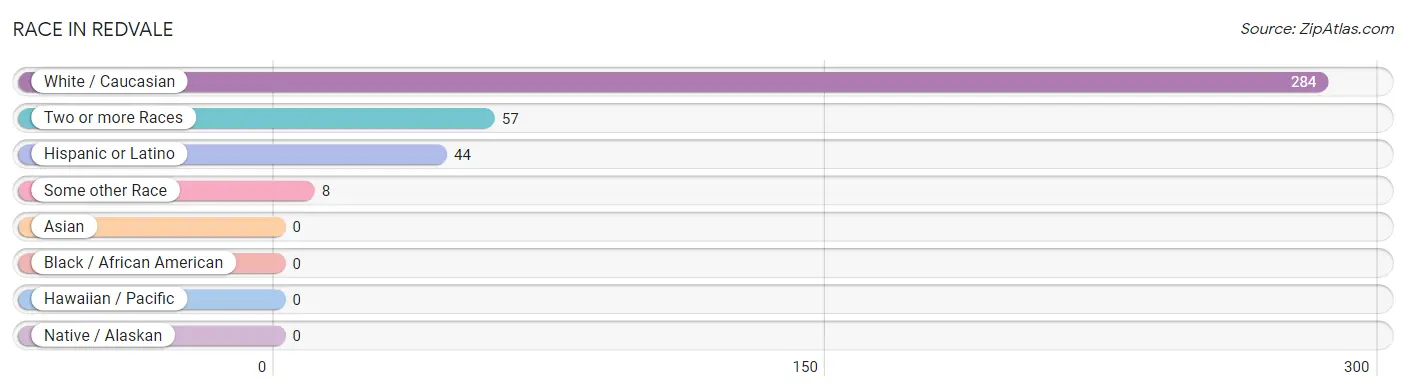
| Race | # Population | % Population |
| Asian | 0 | 0.0% |
| Black / African American | 0 | 0.0% |
| Hawaiian / Pacific | 0 | 0.0% |
| Hispanic or Latino | 44 | 12.6% |
| Native / Alaskan | 0 | 0.0% |
| White / Caucasian | 284 | 81.4% |
| Two or more Races | 57 | 16.3% |
| Some other Race | 8 | 2.3% |
| Total | 349 | 100.0% |
Ancestry in Redvale
The most populous ancestries reported in Redvale are English (58 | 16.6%), American (44 | 12.6%), Mexican (44 | 12.6%), German (38 | 10.9%), and Russian (32 | 9.2%), together accounting for 61.9% of all Redvale residents.
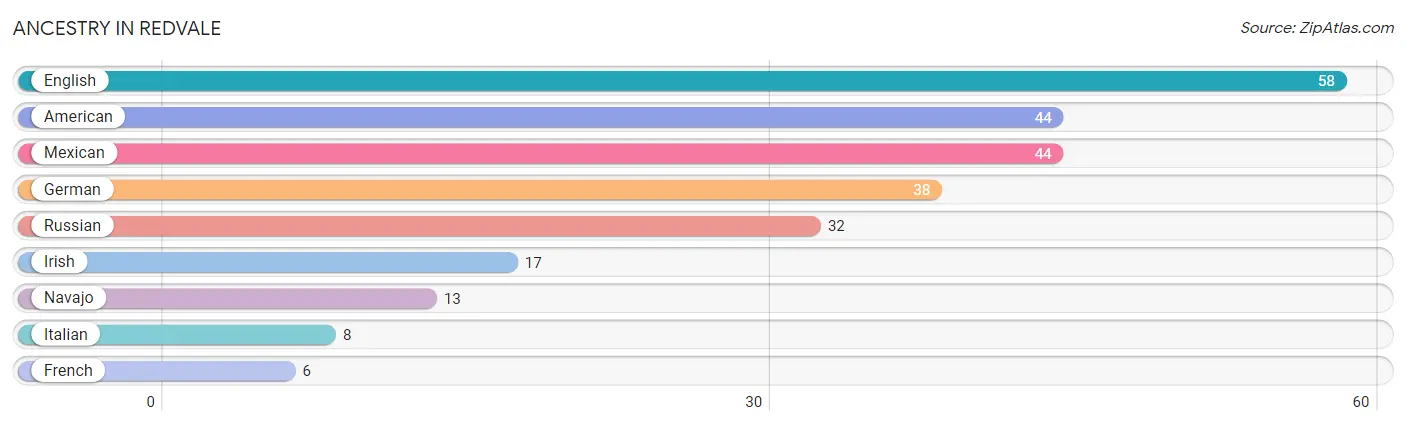
| Ancestry | # Population | % Population |
| American | 44 | 12.6% |
| English | 58 | 16.6% |
| French | 6 | 1.7% |
| German | 38 | 10.9% |
| Irish | 17 | 4.9% |
| Italian | 8 | 2.3% |
| Mexican | 44 | 12.6% |
| Navajo | 13 | 3.7% |
| Russian | 32 | 9.2% | View All 9 Rows |
Immigrants in Redvale

| Immigration Origin | # Population | % Population | View All 0 Rows |
Sex and Age in Redvale
Sex and Age in Redvale
The most populous age groups in Redvale are 60 to 64 Years (34 | 16.8%) for men and 10 to 14 Years (31 | 21.1%) for women.
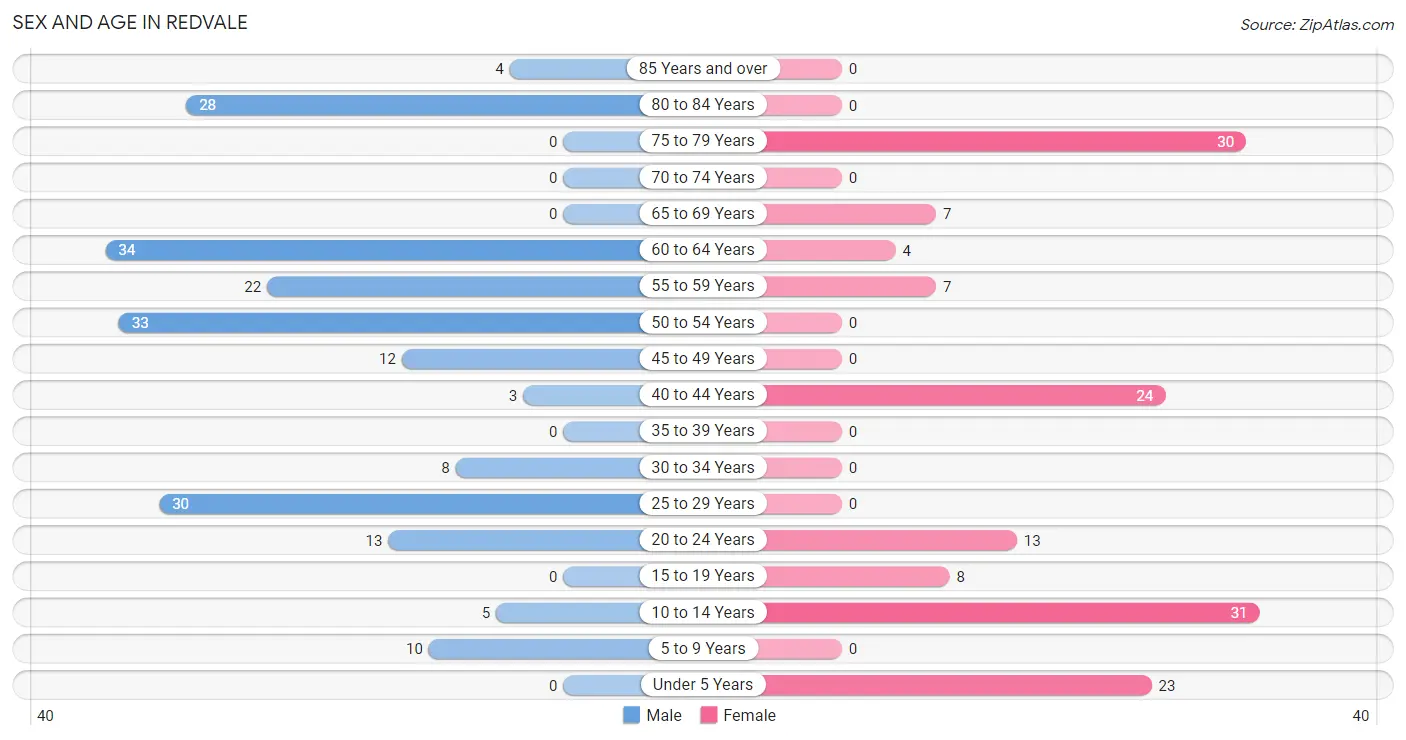
| Age Bracket | Male | Female |
| Under 5 Years | 0 (0.0%) | 23 (15.7%) |
| 5 to 9 Years | 10 (5.0%) | 0 (0.0%) |
| 10 to 14 Years | 5 (2.5%) | 31 (21.1%) |
| 15 to 19 Years | 0 (0.0%) | 8 (5.4%) |
| 20 to 24 Years | 13 (6.4%) | 13 (8.8%) |
| 25 to 29 Years | 30 (14.8%) | 0 (0.0%) |
| 30 to 34 Years | 8 (4.0%) | 0 (0.0%) |
| 35 to 39 Years | 0 (0.0%) | 0 (0.0%) |
| 40 to 44 Years | 3 (1.5%) | 24 (16.3%) |
| 45 to 49 Years | 12 (5.9%) | 0 (0.0%) |
| 50 to 54 Years | 33 (16.3%) | 0 (0.0%) |
| 55 to 59 Years | 22 (10.9%) | 7 (4.8%) |
| 60 to 64 Years | 34 (16.8%) | 4 (2.7%) |
| 65 to 69 Years | 0 (0.0%) | 7 (4.8%) |
| 70 to 74 Years | 0 (0.0%) | 0 (0.0%) |
| 75 to 79 Years | 0 (0.0%) | 30 (20.4%) |
| 80 to 84 Years | 28 (13.9%) | 0 (0.0%) |
| 85 Years and over | 4 (2.0%) | 0 (0.0%) |
| Total | 202 (100.0%) | 147 (100.0%) |
Families and Households in Redvale
Median Family Size in Redvale
The median family size in Redvale is 3.04 persons per family, with single female/mother families (6 | 6.4%) accounting for the largest median family size of 7.17 persons per family. On the other hand, single male/father families (16 | 17.0%) represent the smallest median family size with 2.50 persons per family.
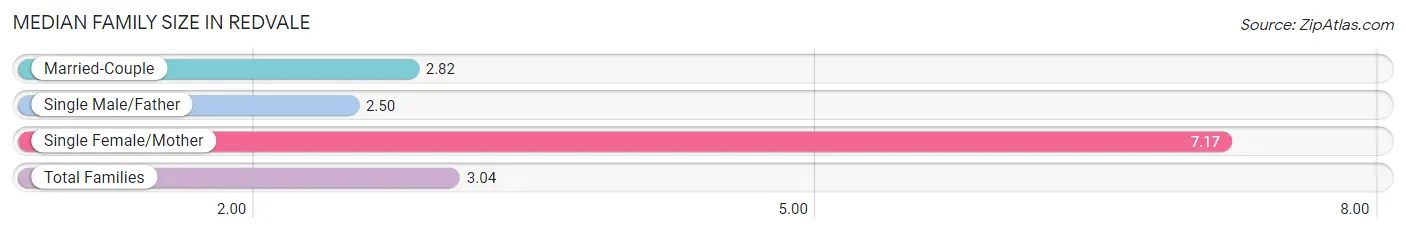
| Family Type | # Families | Family Size |
| Married-Couple | 72 (76.6%) | 2.82 |
| Single Male/Father | 16 (17.0%) | 2.50 |
| Single Female/Mother | 6 (6.4%) | 7.17 |
| Total Families | 94 (100.0%) | 3.04 |
Median Household Size in Redvale
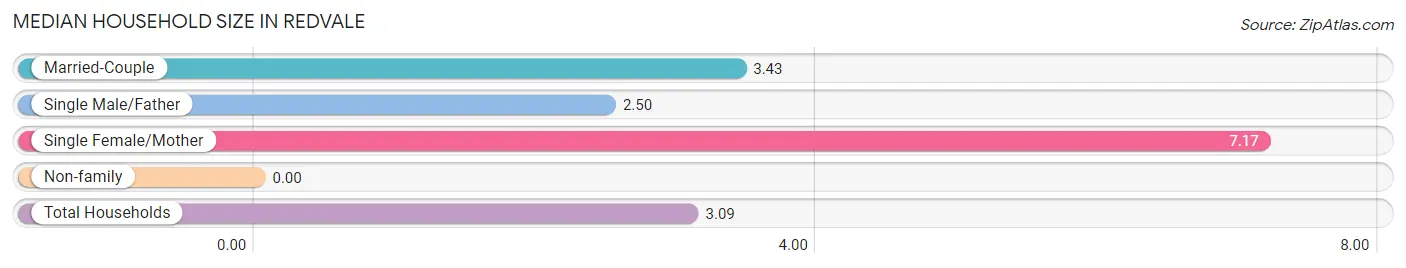
| Household Type | # Households | Household Size |
| Married-Couple | 72 (63.7%) | 3.43 |
| Single Male/Father | 16 (14.2%) | 2.50 |
| Single Female/Mother | 6 (5.3%) | 7.17 |
| Non-family | 19 (16.8%) | - |
| Total Households | 113 (100.0%) | 3.09 |
Household Size by Marriage Status in Redvale
Out of a total of 113 households in Redvale, 94 (83.2%) are family households, while 19 (16.8%) are nonfamily households. The most numerous type of family households are 2-person households, comprising 56, and the most common type of nonfamily households are 1-person households, comprising 19.
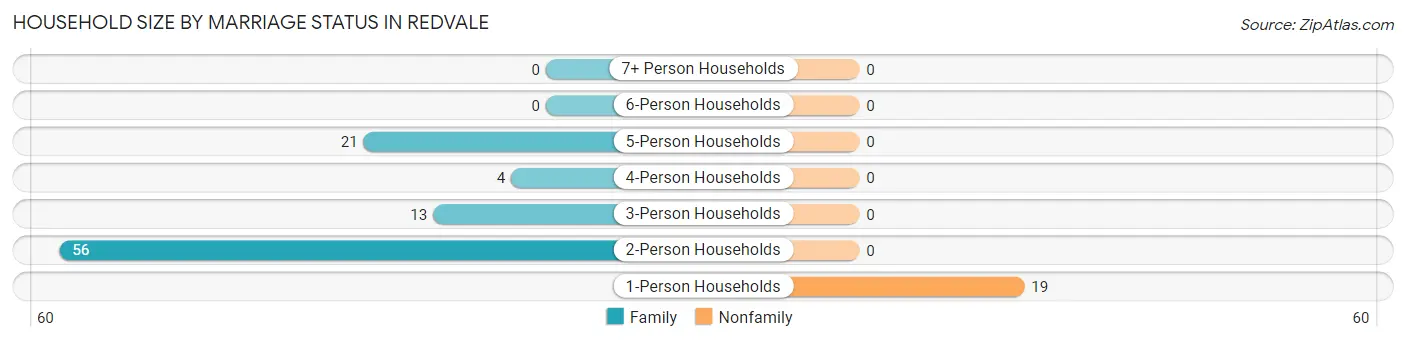
| Household Size | Family Households | Nonfamily Households |
| 1-Person Households | - | 19 (16.8%) |
| 2-Person Households | 56 (49.6%) | 0 (0.0%) |
| 3-Person Households | 13 (11.5%) | 0 (0.0%) |
| 4-Person Households | 4 (3.5%) | 0 (0.0%) |
| 5-Person Households | 21 (18.6%) | 0 (0.0%) |
| 6-Person Households | 0 (0.0%) | 0 (0.0%) |
| 7+ Person Households | 0 (0.0%) | 0 (0.0%) |
| Total | 94 (83.2%) | 19 (16.8%) |
Female Fertility in Redvale
Fertility by Age in Redvale
| Age Bracket | Women with Births | Births / 1,000 Women |
| 15 to 19 years | 0 (0.0%) | 0.0 |
| 20 to 34 years | 0 (0.0%) | 0.0 |
| 35 to 50 years | 0 (0.0%) | 0.0 |
| Total | 0 (0.0%) | 0.0 |
Fertility by Age by Marriage Status in Redvale
| Age Bracket | Married | Unmarried |
| 15 to 19 years | 0 (0.0%) | 0 (0.0%) |
| 20 to 34 years | 0 (0.0%) | 0 (0.0%) |
| 35 to 50 years | 0 (0.0%) | 0 (0.0%) |
| Total | 0 (0.0%) | 0 (0.0%) |
Fertility by Education in Redvale
| Educational Attainment | Women with Births | Births / 1,000 Women |
| Less than High School | 0 (0.0%) | 0.0 |
| High School Diploma | 0 (0.0%) | 0.0 |
| College or Associate's Degree | 0 (0.0%) | 0.0 |
| Bachelor's Degree | 0 (0.0%) | 0.0 |
| Graduate Degree | 0 (0.0%) | 0.0 |
| Total | 0 (0.0%) | 0.0 |
Fertility by Education by Marriage Status in Redvale
| Educational Attainment | Married | Unmarried |
| Less than High School | 0 (0.0%) | 0 (0.0%) |
| High School Diploma | 0 (0.0%) | 0 (0.0%) |
| College or Associate's Degree | 0 (0.0%) | 0 (0.0%) |
| Bachelor's Degree | 0 (0.0%) | 0 (0.0%) |
| Graduate Degree | 0 (0.0%) | 0 (0.0%) |
| Total | 0 (0.0%) | 0 (0.0%) |
Employment Characteristics in Redvale
Employment by Class of Employer in Redvale
Among the 171 employed individuals in Redvale, private company employees (113 | 66.1%), self-employed (not incorporated) (41 | 24.0%), and federal government employees (13 | 7.6%) make up the most common classes of employment.

| Employer Class | # Employees | % Employees |
| Private Company Employees | 113 | 66.1% |
| Self-Employed (Incorporated) | 0 | 0.0% |
| Self-Employed (Not Incorporated) | 41 | 24.0% |
| Not-for-profit Organizations | 0 | 0.0% |
| Local Government Employees | 4 | 2.3% |
| State Government Employees | 0 | 0.0% |
| Federal Government Employees | 13 | 7.6% |
| Unpaid Family Workers | 0 | 0.0% |
| Total | 171 | 100.0% |
Employment Status by Age in Redvale
According to the labor force statistics for Redvale, out of the total population over 16 years of age (280), 64.3% or 180 individuals are in the labor force, with 5.0% or 9 of them unemployed. The age group with the highest labor force participation rate is 30 to 34 years, with 100.0% or 8 individuals in the labor force. Within the labor force, the 60 to 64 years age range has the highest percentage of unemployed individuals, with 30.0% or 9 of them being unemployed.
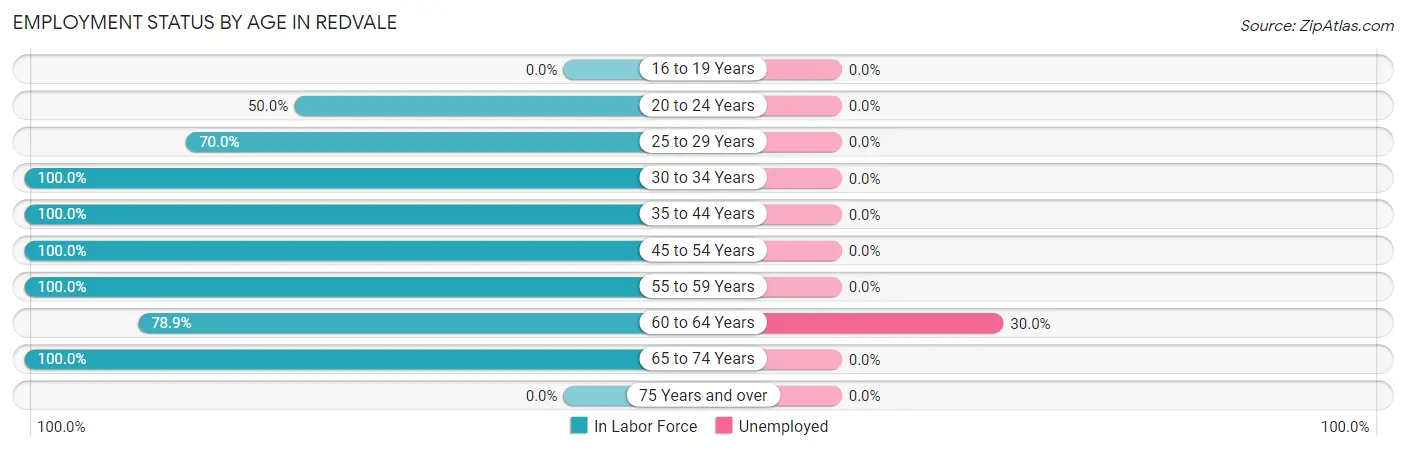
| Age Bracket | In Labor Force | Unemployed |
| 16 to 19 Years | 0 (0.0%) | 0 (0.0%) |
| 20 to 24 Years | 13 (50.0%) | 0 (0.0%) |
| 25 to 29 Years | 21 (70.0%) | 0 (0.0%) |
| 30 to 34 Years | 8 (100.0%) | 0 (0.0%) |
| 35 to 44 Years | 27 (100.0%) | 0 (0.0%) |
| 45 to 54 Years | 45 (100.0%) | 0 (0.0%) |
| 55 to 59 Years | 29 (100.0%) | 0 (0.0%) |
| 60 to 64 Years | 30 (78.9%) | 9 (30.0%) |
| 65 to 74 Years | 7 (100.0%) | 0 (0.0%) |
| 75 Years and over | 0 (0.0%) | 0 (0.0%) |
| Total | 180 (64.3%) | 9 (5.0%) |
Employment Status by Educational Attainment in Redvale
According to labor force statistics for Redvale, 90.4% of individuals (160) out of the total population between 25 and 64 years of age (177) are in the labor force, with 5.6% or 9 of them being unemployed. The group with the highest labor force participation rate are those with the educational attainment of less than high school, with 100.0% or 9 individuals in the labor force. Within the labor force, individuals with less than high school education have the highest percentage of unemployment, with 100.0% or 9 of them being unemployed.
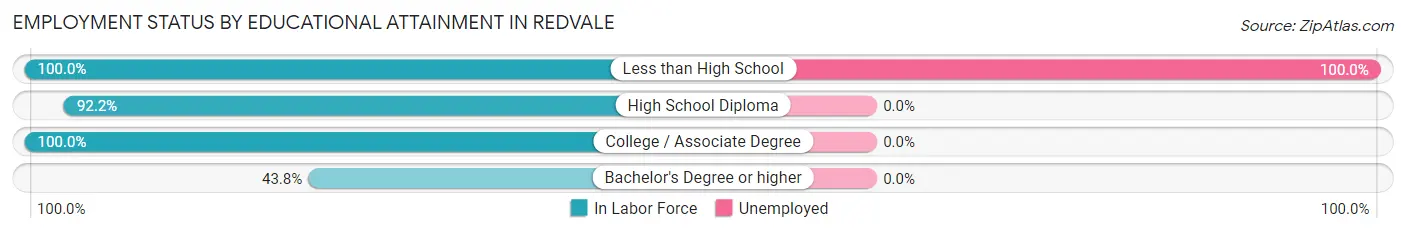
| Educational Attainment | In Labor Force | Unemployed |
| Less than High School | 9 (100.0%) | 9 (100.0%) |
| High School Diploma | 95 (92.2%) | 0 (0.0%) |
| College / Associate Degree | 49 (100.0%) | 0 (0.0%) |
| Bachelor's Degree or higher | 7 (43.8%) | 0 (0.0%) |
| Total | 160 (90.4%) | 10 (5.6%) |
Employment Occupations by Sex in Redvale
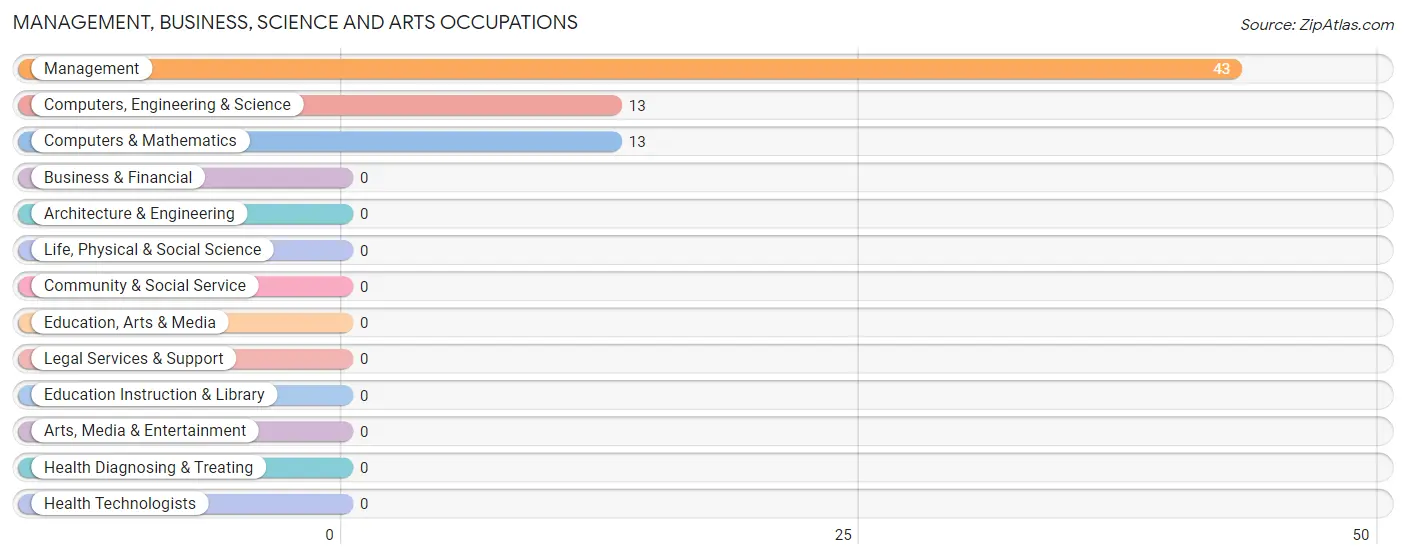
Management, Business, Science and Arts Occupations
The most common Management, Business, Science and Arts occupations in Redvale are Management (43 | 25.2%), Computers, Engineering & Science (13 | 7.6%), and Computers & Mathematics (13 | 7.6%).
Management, Business, Science and Arts Occupations by Sex
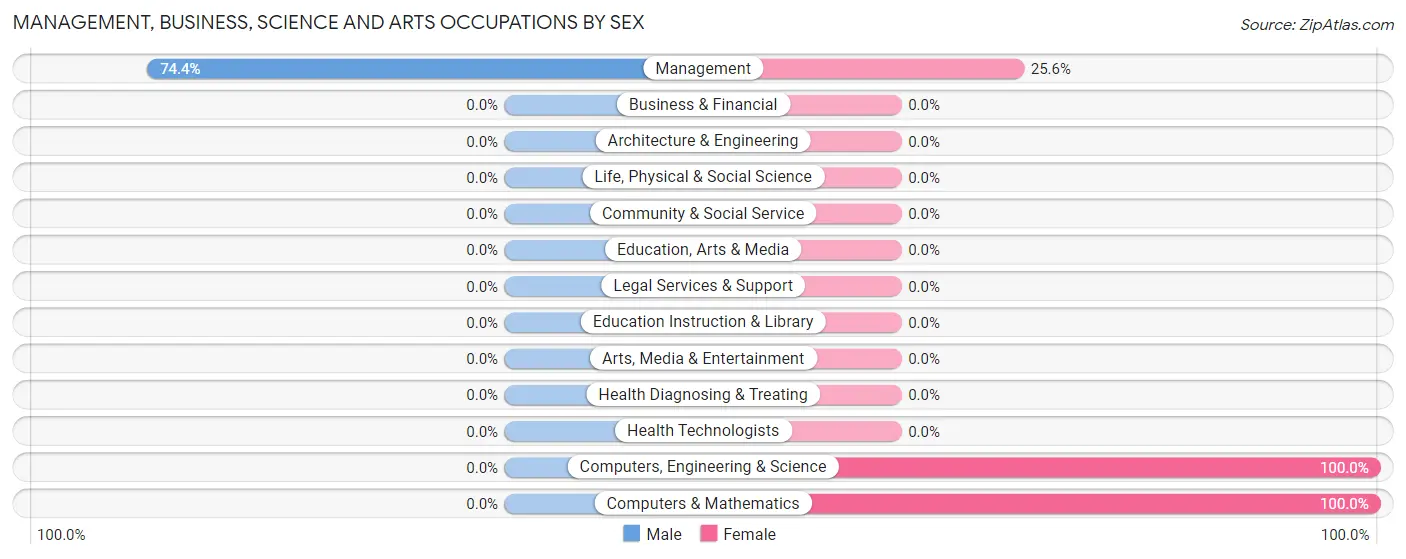
| Occupation | Male | Female |
| Management | 32 (74.4%) | 11 (25.6%) |
| Business & Financial | 0 (0.0%) | 0 (0.0%) |
| Computers, Engineering & Science | 0 (0.0%) | 13 (100.0%) |
| Computers & Mathematics | 0 (0.0%) | 13 (100.0%) |
| Architecture & Engineering | 0 (0.0%) | 0 (0.0%) |
| Life, Physical & Social Science | 0 (0.0%) | 0 (0.0%) |
| Community & Social Service | 0 (0.0%) | 0 (0.0%) |
| Education, Arts & Media | 0 (0.0%) | 0 (0.0%) |
| Legal Services & Support | 0 (0.0%) | 0 (0.0%) |
| Education Instruction & Library | 0 (0.0%) | 0 (0.0%) |
| Arts, Media & Entertainment | 0 (0.0%) | 0 (0.0%) |
| Health Diagnosing & Treating | 0 (0.0%) | 0 (0.0%) |
| Health Technologists | 0 (0.0%) | 0 (0.0%) |
| Total (Category) | 32 (57.1%) | 24 (42.9%) |
| Total (Overall) | 133 (77.8%) | 38 (22.2%) |
Services Occupations
The most common Services occupations in Redvale are , and Food Preparation & Serving (7 | 4.1%).
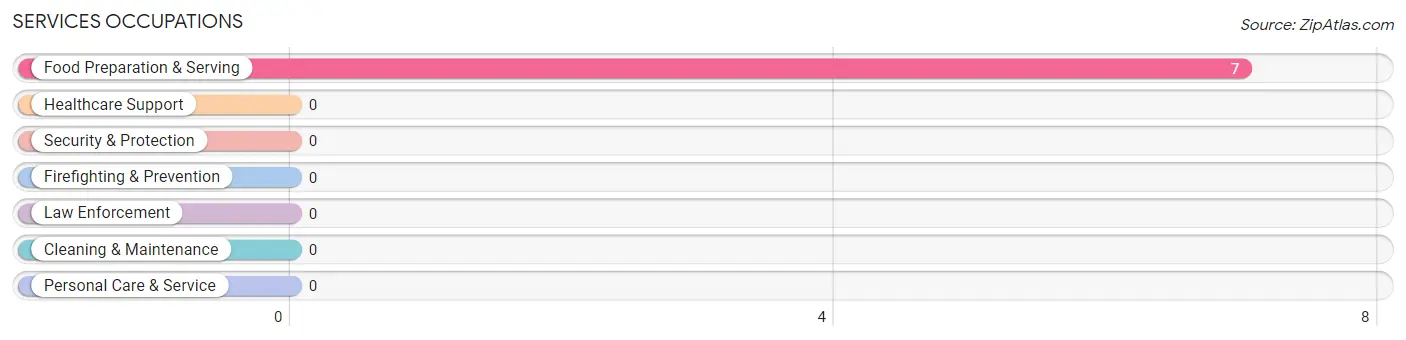
Services Occupations by Sex
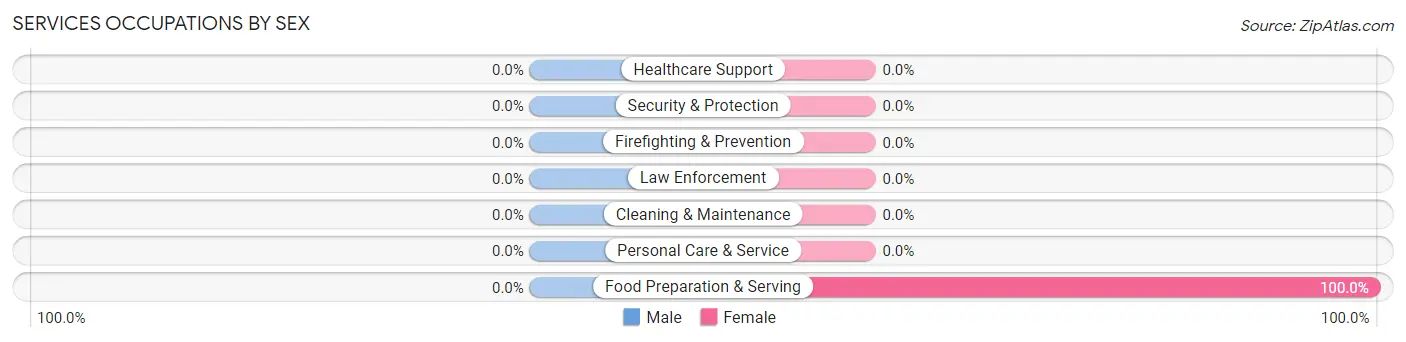
| Occupation | Male | Female |
| Healthcare Support | 0 (0.0%) | 0 (0.0%) |
| Security & Protection | 0 (0.0%) | 0 (0.0%) |
| Firefighting & Prevention | 0 (0.0%) | 0 (0.0%) |
| Law Enforcement | 0 (0.0%) | 0 (0.0%) |
| Food Preparation & Serving | 0 (0.0%) | 7 (100.0%) |
| Cleaning & Maintenance | 0 (0.0%) | 0 (0.0%) |
| Personal Care & Service | 0 (0.0%) | 0 (0.0%) |
| Total (Category) | 0 (0.0%) | 7 (100.0%) |
| Total (Overall) | 133 (77.8%) | 38 (22.2%) |
Sales and Office Occupations
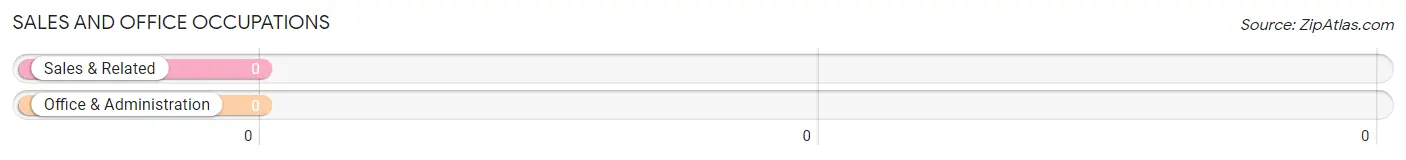
Sales and Office Occupations by Sex
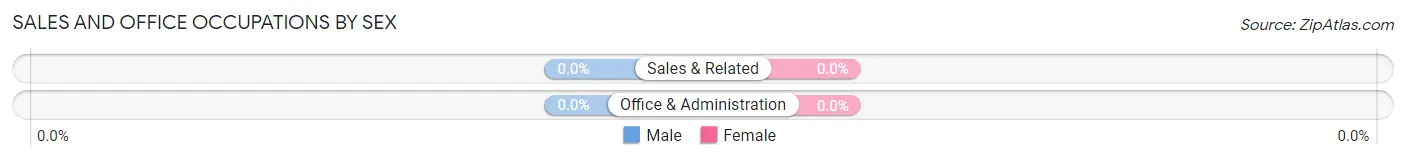
| Occupation | Male | Female |
| Sales & Related | 0 (0.0%) | 0 (0.0%) |
| Office & Administration | 0 (0.0%) | 0 (0.0%) |
| Total (Category) | 0 (0.0%) | 0 (0.0%) |
| Total (Overall) | 133 (77.8%) | 38 (22.2%) |
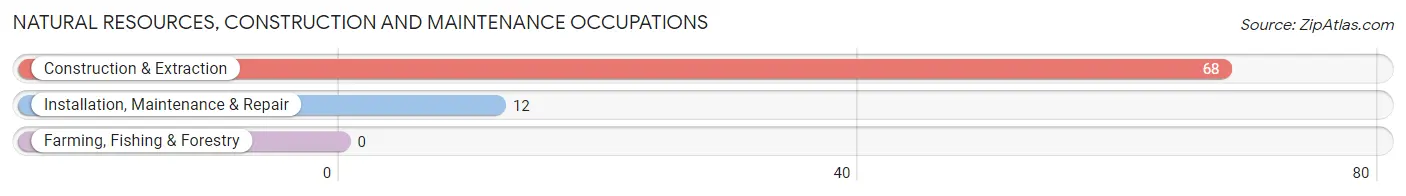
Natural Resources, Construction and Maintenance Occupations
The most common Natural Resources, Construction and Maintenance occupations in Redvale are Construction & Extraction (68 | 39.8%), and Installation, Maintenance & Repair (12 | 7.0%).
Natural Resources, Construction and Maintenance Occupations by Sex
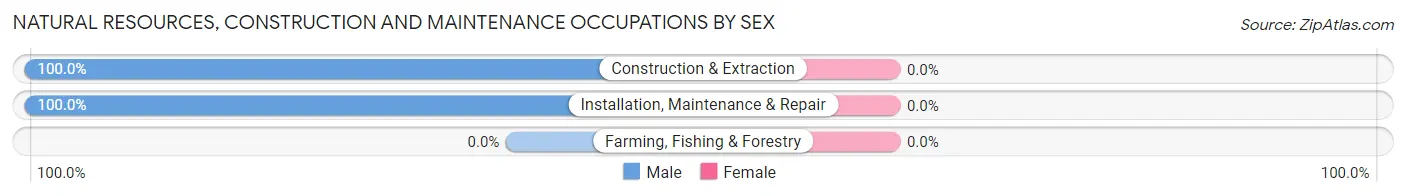
| Occupation | Male | Female |
| Farming, Fishing & Forestry | 0 (0.0%) | 0 (0.0%) |
| Construction & Extraction | 68 (100.0%) | 0 (0.0%) |
| Installation, Maintenance & Repair | 12 (100.0%) | 0 (0.0%) |
| Total (Category) | 80 (100.0%) | 0 (0.0%) |
| Total (Overall) | 133 (77.8%) | 38 (22.2%) |
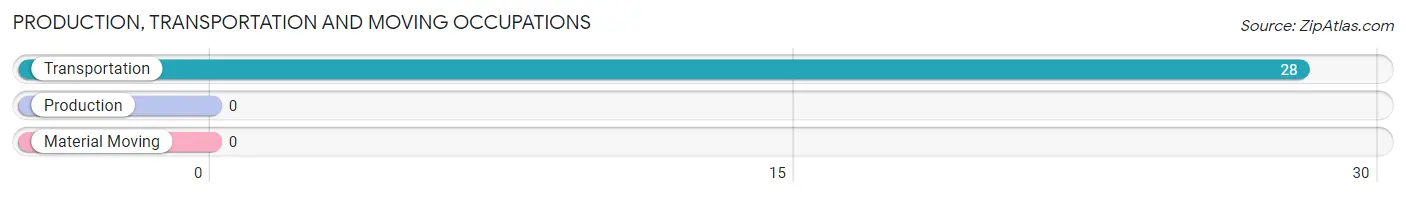
Production, Transportation and Moving Occupations
The most common Production, Transportation and Moving occupations in Redvale are , and Transportation (28 | 16.4%).
Production, Transportation and Moving Occupations by Sex
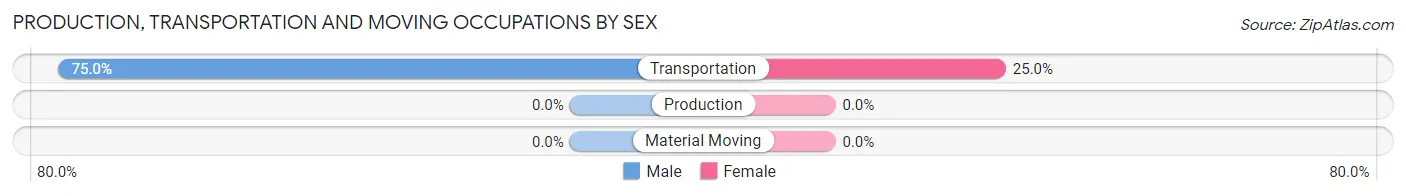
| Occupation | Male | Female |
| Production | 0 (0.0%) | 0 (0.0%) |
| Transportation | 21 (75.0%) | 7 (25.0%) |
| Material Moving | 0 (0.0%) | 0 (0.0%) |
| Total (Category) | 21 (75.0%) | 7 (25.0%) |
| Total (Overall) | 133 (77.8%) | 38 (22.2%) |
Employment Industries by Sex in Redvale
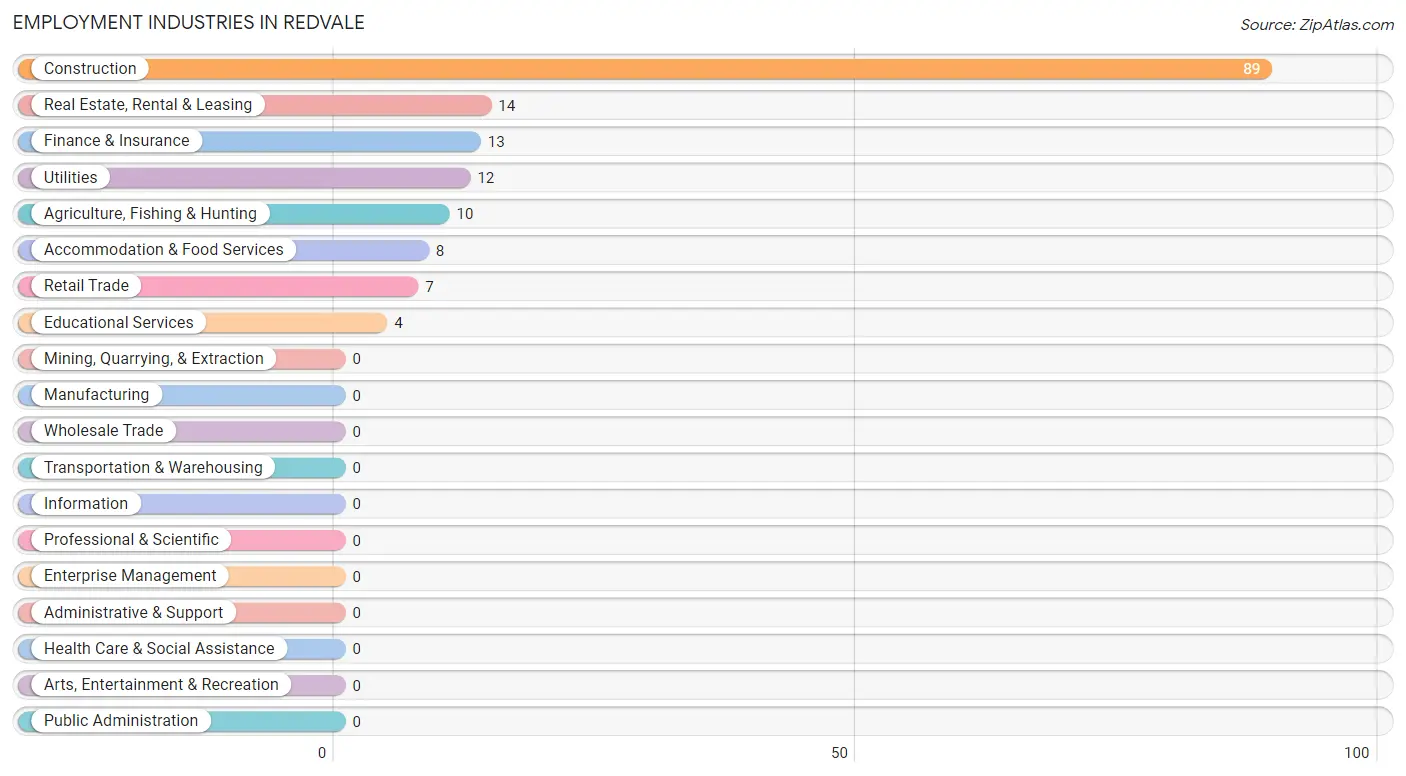
Employment Industries in Redvale
The major employment industries in Redvale include Construction (89 | 52.0%), Real Estate, Rental & Leasing (14 | 8.2%), Finance & Insurance (13 | 7.6%), Utilities (12 | 7.0%), and Agriculture, Fishing & Hunting (10 | 5.9%).
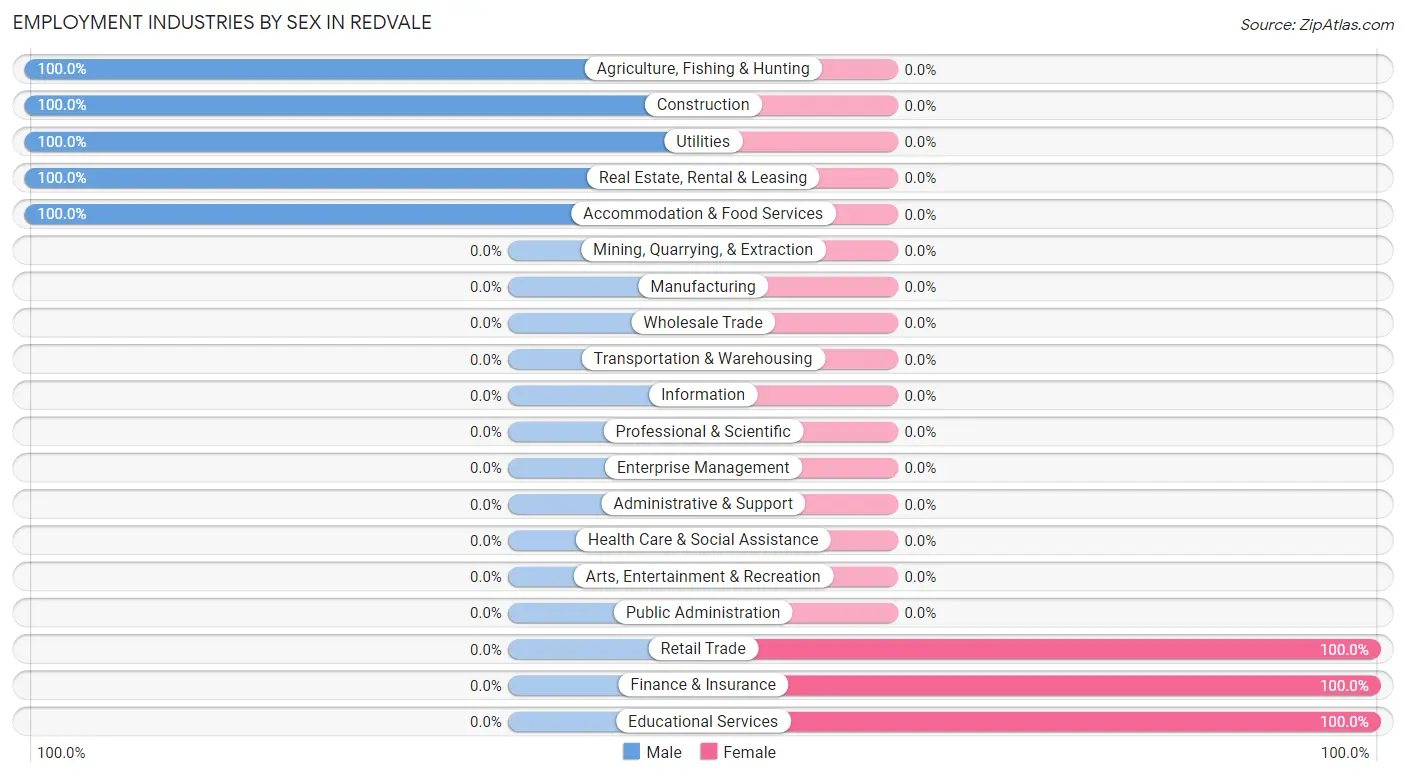
Employment Industries by Sex in Redvale
The Redvale industries that see more men than women are Agriculture, Fishing & Hunting (100.0%), Construction (100.0%), and Utilities (100.0%), whereas the industries that tend to have a higher number of women are Retail Trade (100.0%), Finance & Insurance (100.0%), and Educational Services (100.0%).
| Industry | Male | Female |
| Agriculture, Fishing & Hunting | 10 (100.0%) | 0 (0.0%) |
| Mining, Quarrying, & Extraction | 0 (0.0%) | 0 (0.0%) |
| Construction | 89 (100.0%) | 0 (0.0%) |
| Manufacturing | 0 (0.0%) | 0 (0.0%) |
| Wholesale Trade | 0 (0.0%) | 0 (0.0%) |
| Retail Trade | 0 (0.0%) | 7 (100.0%) |
| Transportation & Warehousing | 0 (0.0%) | 0 (0.0%) |
| Utilities | 12 (100.0%) | 0 (0.0%) |
| Information | 0 (0.0%) | 0 (0.0%) |
| Finance & Insurance | 0 (0.0%) | 13 (100.0%) |
| Real Estate, Rental & Leasing | 14 (100.0%) | 0 (0.0%) |
| Professional & Scientific | 0 (0.0%) | 0 (0.0%) |
| Enterprise Management | 0 (0.0%) | 0 (0.0%) |
| Administrative & Support | 0 (0.0%) | 0 (0.0%) |
| Educational Services | 0 (0.0%) | 4 (100.0%) |
| Health Care & Social Assistance | 0 (0.0%) | 0 (0.0%) |
| Arts, Entertainment & Recreation | 0 (0.0%) | 0 (0.0%) |
| Accommodation & Food Services | 8 (100.0%) | 0 (0.0%) |
| Public Administration | 0 (0.0%) | 0 (0.0%) |
| Total | 133 (77.8%) | 38 (22.2%) |
Education in Redvale
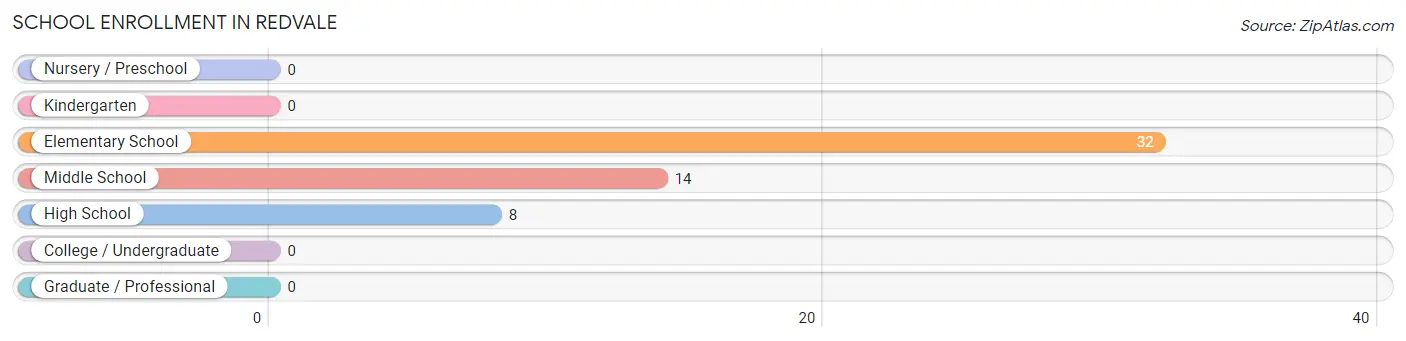
School Enrollment in Redvale
The most common levels of schooling among the 54 students in Redvale are elementary school (32 | 59.3%), middle school (14 | 25.9%), and high school (8 | 14.8%).
| School Level | # Students | % Students |
| Nursery / Preschool | 0 | 0.0% |
| Kindergarten | 0 | 0.0% |
| Elementary School | 32 | 59.3% |
| Middle School | 14 | 25.9% |
| High School | 8 | 14.8% |
| College / Undergraduate | 0 | 0.0% |
| Graduate / Professional | 0 | 0.0% |
| Total | 54 | 100.0% |
School Enrollment by Age by Funding Source in Redvale
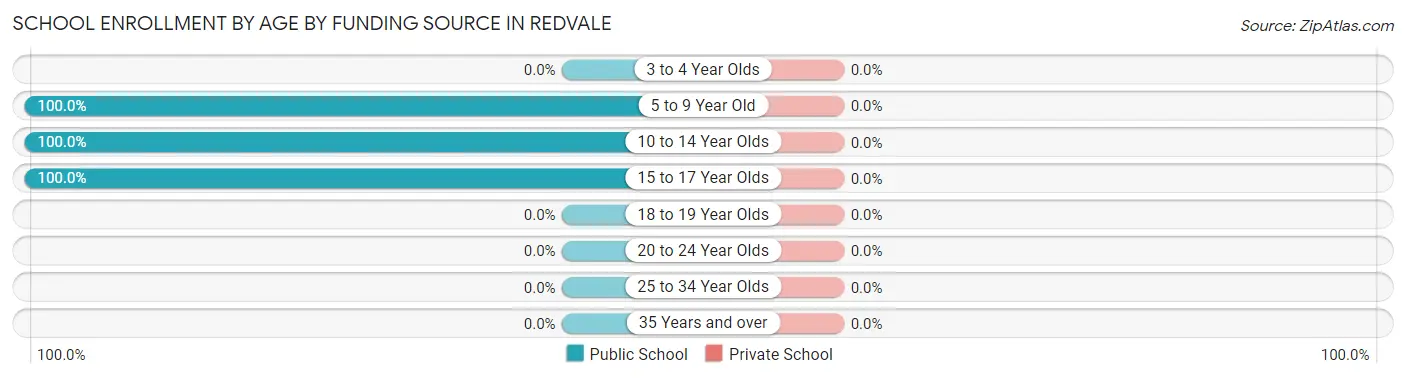
| Age Bracket | Public School | Private School |
| 3 to 4 Year Olds | 0 (0.0%) | 0 (0.0%) |
| 5 to 9 Year Old | 10 (100.0%) | 0 (0.0%) |
| 10 to 14 Year Olds | 36 (100.0%) | 0 (0.0%) |
| 15 to 17 Year Olds | 8 (100.0%) | 0 (0.0%) |
| 18 to 19 Year Olds | 0 (0.0%) | 0 (0.0%) |
| 20 to 24 Year Olds | 0 (0.0%) | 0 (0.0%) |
| 25 to 34 Year Olds | 0 (0.0%) | 0 (0.0%) |
| 35 Years and over | 0 (0.0%) | 0 (0.0%) |
| Total | 54 (100.0%) | 0 (0.0%) |
Educational Attainment by Field of Study in Redvale
Education (16 | 33.3%), physical & health sciences (12 | 25.0%), arts & humanities (9 | 18.8%), bio, nature & agricultural (7 | 14.6%), and science & technology (4 | 8.3%) are the most common fields of study among 48 individuals in Redvale who have obtained a bachelor's degree or higher.
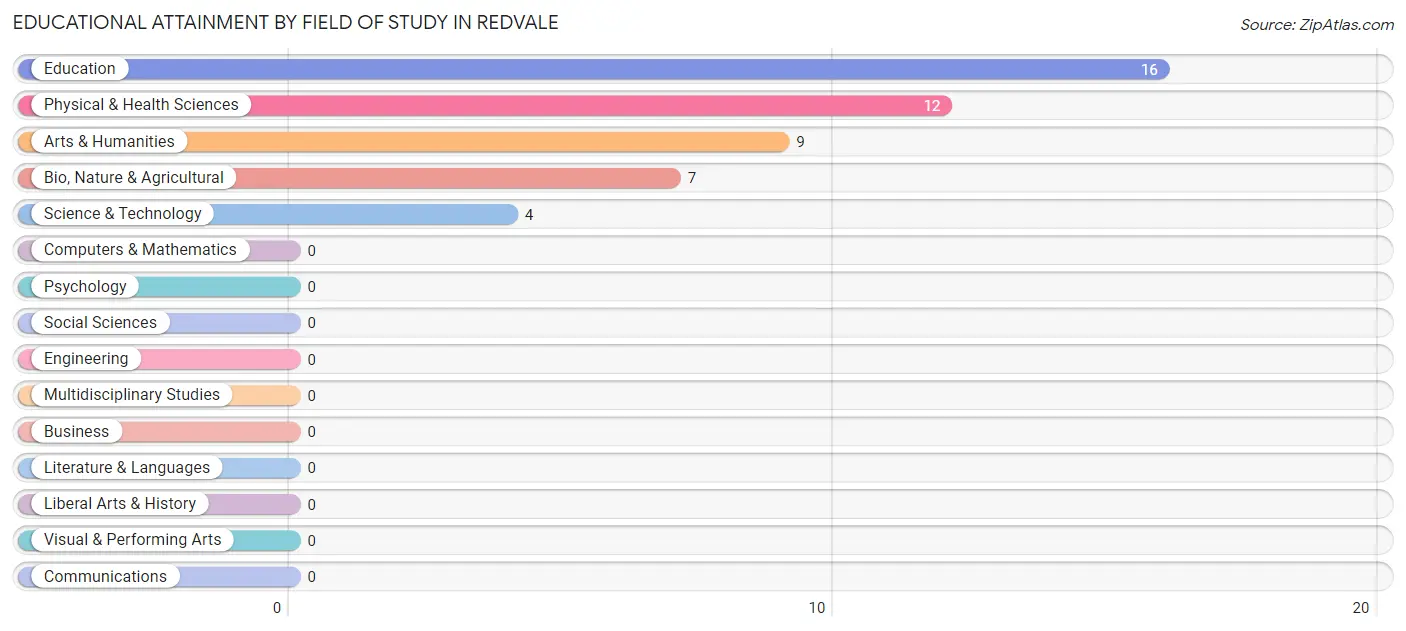
| Field of Study | # Graduates | % Graduates |
| Computers & Mathematics | 0 | 0.0% |
| Bio, Nature & Agricultural | 7 | 14.6% |
| Physical & Health Sciences | 12 | 25.0% |
| Psychology | 0 | 0.0% |
| Social Sciences | 0 | 0.0% |
| Engineering | 0 | 0.0% |
| Multidisciplinary Studies | 0 | 0.0% |
| Science & Technology | 4 | 8.3% |
| Business | 0 | 0.0% |
| Education | 16 | 33.3% |
| Literature & Languages | 0 | 0.0% |
| Liberal Arts & History | 0 | 0.0% |
| Visual & Performing Arts | 0 | 0.0% |
| Communications | 0 | 0.0% |
| Arts & Humanities | 9 | 18.8% |
| Total | 48 | 100.0% |
Transportation & Commute in Redvale
Vehicle Availability by Sex in Redvale
The most prevalent vehicle ownership categories in Redvale are males with 5 or more vehicles (62, accounting for 46.6%) and females with 5 or more vehicles (7, making up 163.2%).
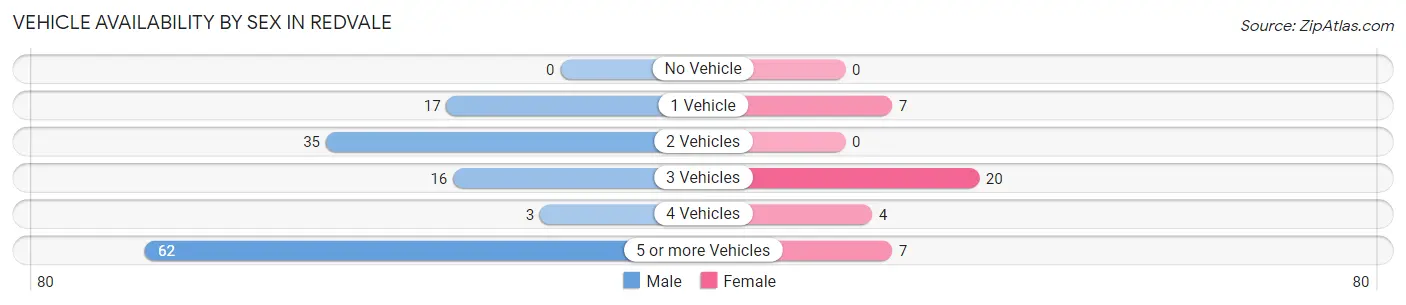
| Vehicles Available | Male | Female |
| No Vehicle | 0 (0.0%) | 0 (0.0%) |
| 1 Vehicle | 17 (12.8%) | 7 (18.4%) |
| 2 Vehicles | 35 (26.3%) | 0 (0.0%) |
| 3 Vehicles | 16 (12.0%) | 20 (52.6%) |
| 4 Vehicles | 3 (2.3%) | 4 (10.5%) |
| 5 or more Vehicles | 62 (46.6%) | 7 (18.4%) |
| Total | 133 (100.0%) | 38 (100.0%) |
Commute Time in Redvale
The most frequently occuring commute durations in Redvale are 15 to 19 minutes (50 commuters, 35.5%), 20 to 24 minutes (34 commuters, 24.1%), and 45 to 59 minutes (27 commuters, 19.2%).
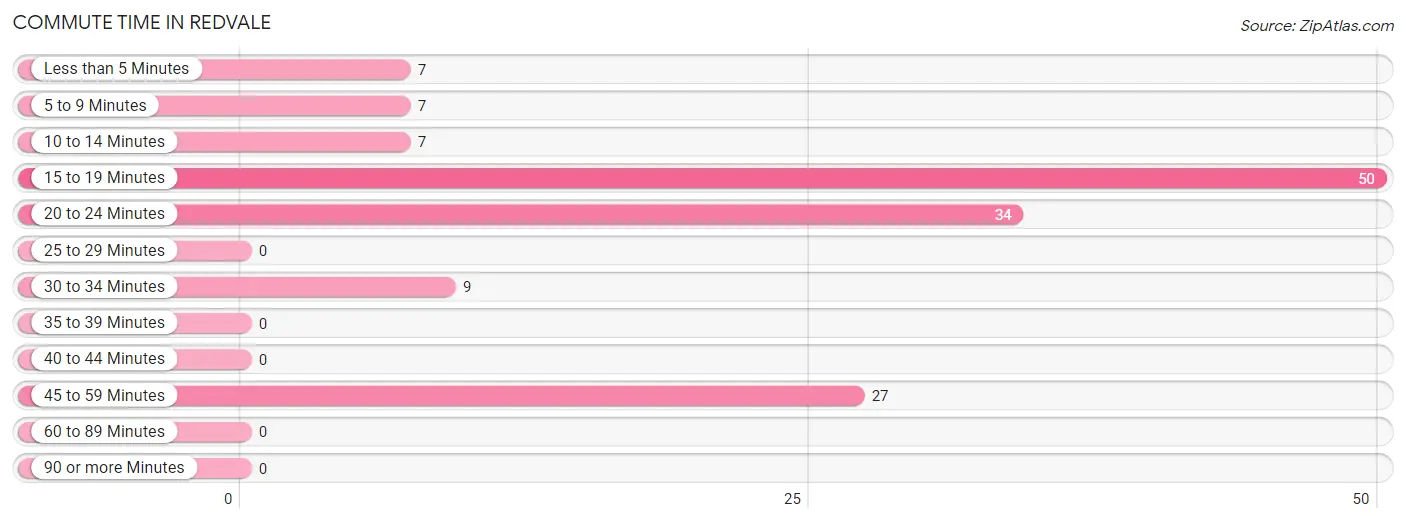
| Commute Time | # Commuters | % Commuters |
| Less than 5 Minutes | 7 | 5.0% |
| 5 to 9 Minutes | 7 | 5.0% |
| 10 to 14 Minutes | 7 | 5.0% |
| 15 to 19 Minutes | 50 | 35.5% |
| 20 to 24 Minutes | 34 | 24.1% |
| 25 to 29 Minutes | 0 | 0.0% |
| 30 to 34 Minutes | 9 | 6.4% |
| 35 to 39 Minutes | 0 | 0.0% |
| 40 to 44 Minutes | 0 | 0.0% |
| 45 to 59 Minutes | 27 | 19.2% |
| 60 to 89 Minutes | 0 | 0.0% |
| 90 or more Minutes | 0 | 0.0% |
Commute Time by Sex in Redvale
The most common commute times in Redvale are 15 to 19 minutes (46 commuters, 39.7%) for males and 20 to 24 minutes (14 commuters, 56.0%) for females.
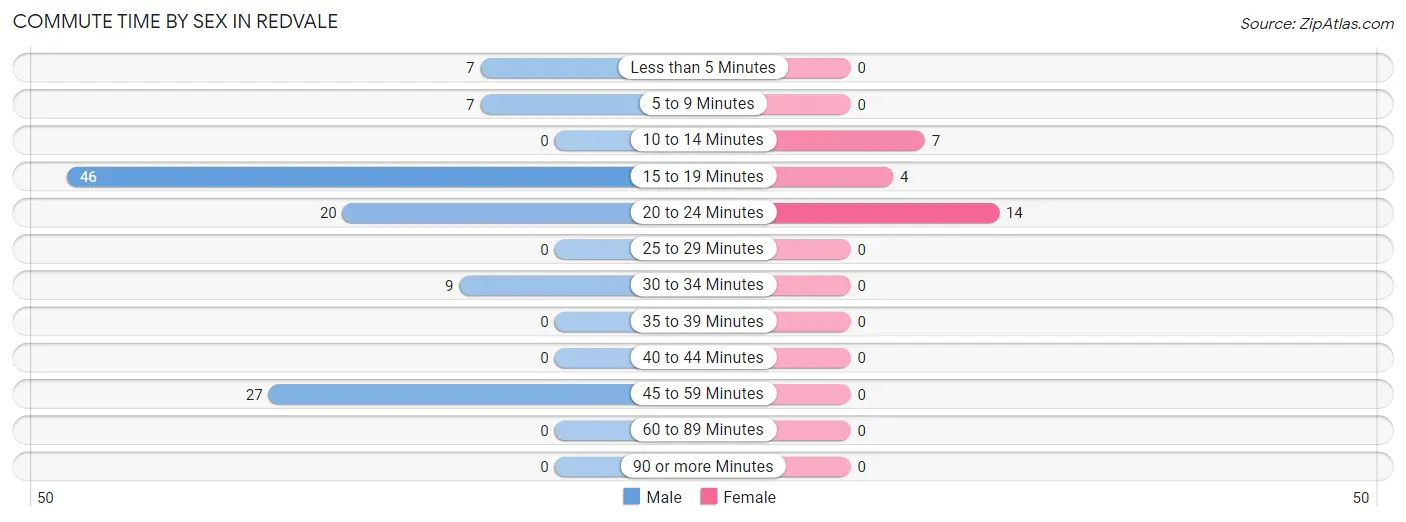
| Commute Time | Male | Female |
| Less than 5 Minutes | 7 (6.0%) | 0 (0.0%) |
| 5 to 9 Minutes | 7 (6.0%) | 0 (0.0%) |
| 10 to 14 Minutes | 0 (0.0%) | 7 (28.0%) |
| 15 to 19 Minutes | 46 (39.7%) | 4 (16.0%) |
| 20 to 24 Minutes | 20 (17.2%) | 14 (56.0%) |
| 25 to 29 Minutes | 0 (0.0%) | 0 (0.0%) |
| 30 to 34 Minutes | 9 (7.8%) | 0 (0.0%) |
| 35 to 39 Minutes | 0 (0.0%) | 0 (0.0%) |
| 40 to 44 Minutes | 0 (0.0%) | 0 (0.0%) |
| 45 to 59 Minutes | 27 (23.3%) | 0 (0.0%) |
| 60 to 89 Minutes | 0 (0.0%) | 0 (0.0%) |
| 90 or more Minutes | 0 (0.0%) | 0 (0.0%) |
Time of Departure to Work by Sex in Redvale
The most frequent times of departure to work in Redvale are 6:30 AM to 6:59 AM (41, 35.3%) for males and 7:00 AM to 7:29 AM (11, 44.0%) for females.
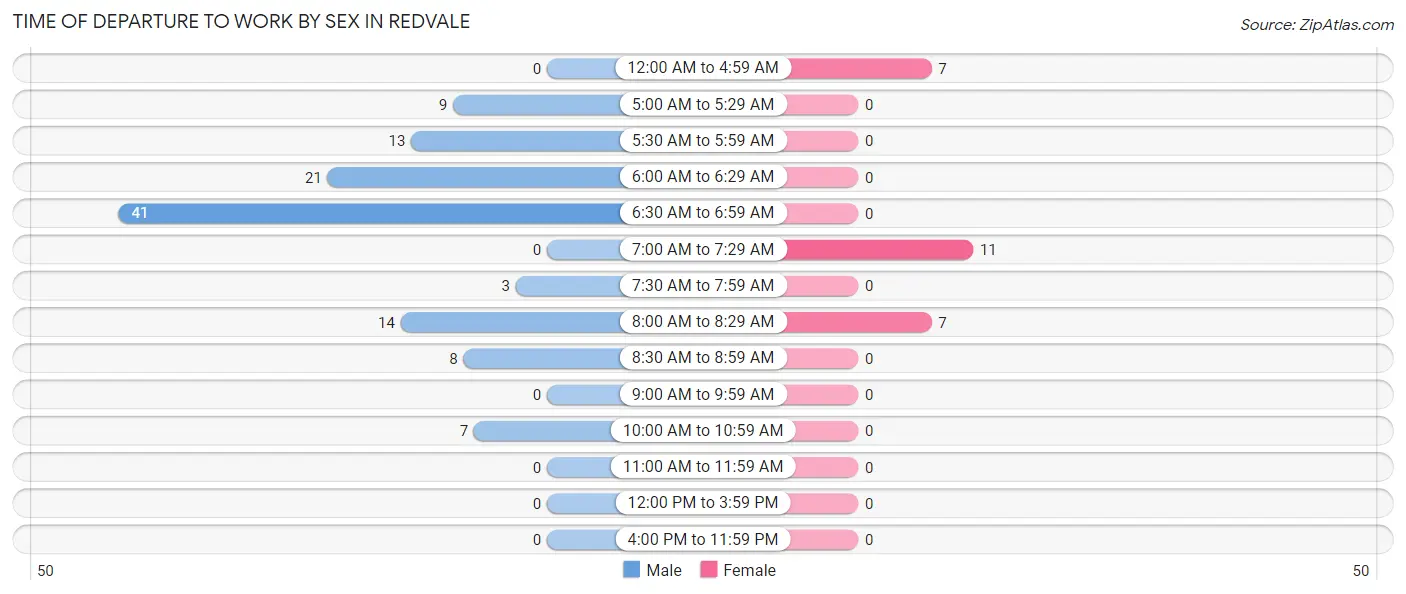
| Time of Departure | Male | Female |
| 12:00 AM to 4:59 AM | 0 (0.0%) | 7 (28.0%) |
| 5:00 AM to 5:29 AM | 9 (7.8%) | 0 (0.0%) |
| 5:30 AM to 5:59 AM | 13 (11.2%) | 0 (0.0%) |
| 6:00 AM to 6:29 AM | 21 (18.1%) | 0 (0.0%) |
| 6:30 AM to 6:59 AM | 41 (35.3%) | 0 (0.0%) |
| 7:00 AM to 7:29 AM | 0 (0.0%) | 11 (44.0%) |
| 7:30 AM to 7:59 AM | 3 (2.6%) | 0 (0.0%) |
| 8:00 AM to 8:29 AM | 14 (12.1%) | 7 (28.0%) |
| 8:30 AM to 8:59 AM | 8 (6.9%) | 0 (0.0%) |
| 9:00 AM to 9:59 AM | 0 (0.0%) | 0 (0.0%) |
| 10:00 AM to 10:59 AM | 7 (6.0%) | 0 (0.0%) |
| 11:00 AM to 11:59 AM | 0 (0.0%) | 0 (0.0%) |
| 12:00 PM to 3:59 PM | 0 (0.0%) | 0 (0.0%) |
| 4:00 PM to 11:59 PM | 0 (0.0%) | 0 (0.0%) |
| Total | 116 (100.0%) | 25 (100.0%) |
Housing Occupancy in Redvale
Occupancy by Ownership in Redvale
Of the total 113 dwellings in Redvale, owner-occupied units account for 100 (88.5%), while renter-occupied units make up 13 (11.5%).
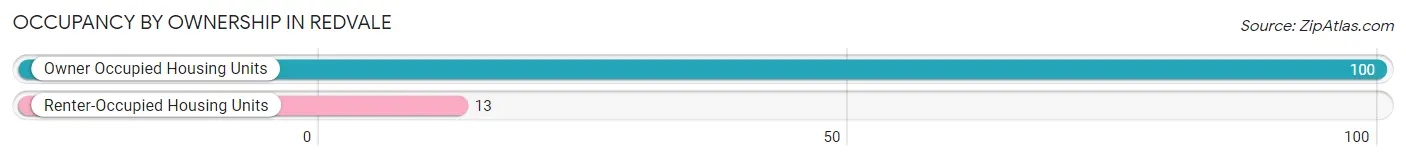
| Occupancy | # Housing Units | % Housing Units |
| Owner Occupied Housing Units | 100 | 88.5% |
| Renter-Occupied Housing Units | 13 | 11.5% |
| Total Occupied Housing Units | 113 | 100.0% |
Occupancy by Household Size in Redvale
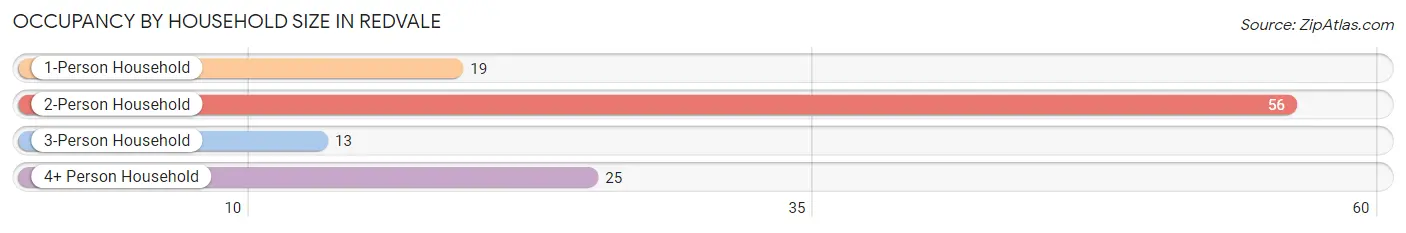
| Household Size | # Housing Units | % Housing Units |
| 1-Person Household | 19 | 16.8% |
| 2-Person Household | 56 | 49.6% |
| 3-Person Household | 13 | 11.5% |
| 4+ Person Household | 25 | 22.1% |
| Total Housing Units | 113 | 100.0% |
Occupancy by Ownership by Household Size in Redvale
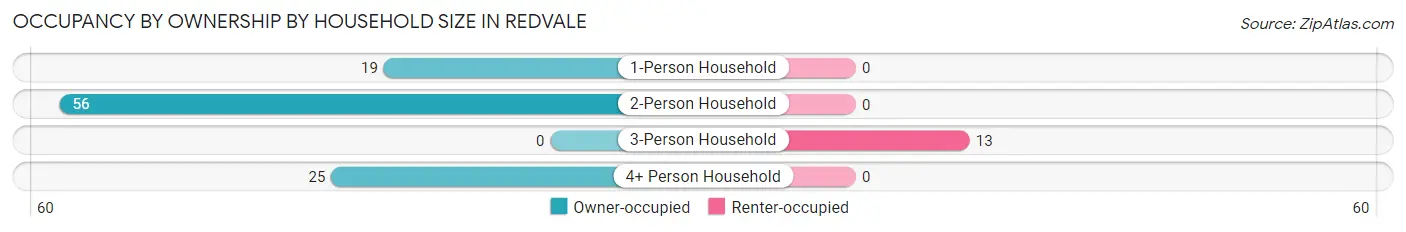
| Household Size | Owner-occupied | Renter-occupied |
| 1-Person Household | 19 (100.0%) | 0 (0.0%) |
| 2-Person Household | 56 (100.0%) | 0 (0.0%) |
| 3-Person Household | 0 (0.0%) | 13 (100.0%) |
| 4+ Person Household | 25 (100.0%) | 0 (0.0%) |
| Total Housing Units | 100 (88.5%) | 13 (11.5%) |
Occupancy by Educational Attainment in Redvale
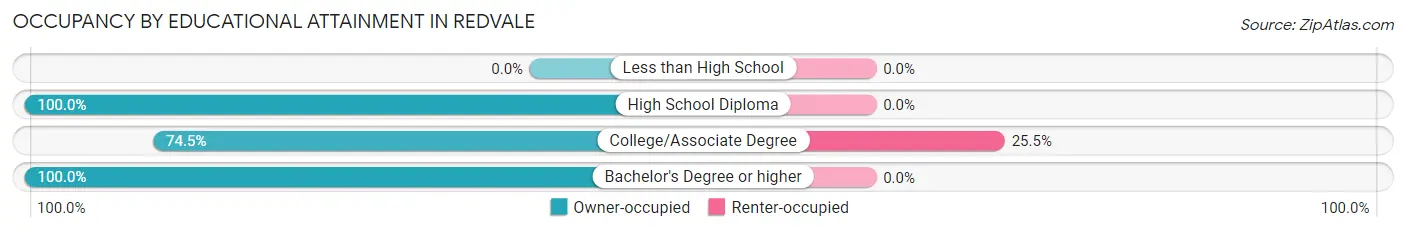
| Household Size | Owner-occupied | Renter-occupied |
| Less than High School | 0 (0.0%) | 0 (0.0%) |
| High School Diploma | 38 (100.0%) | 0 (0.0%) |
| College/Associate Degree | 38 (74.5%) | 13 (25.5%) |
| Bachelor's Degree or higher | 24 (100.0%) | 0 (0.0%) |
Occupancy by Age of Householder in Redvale
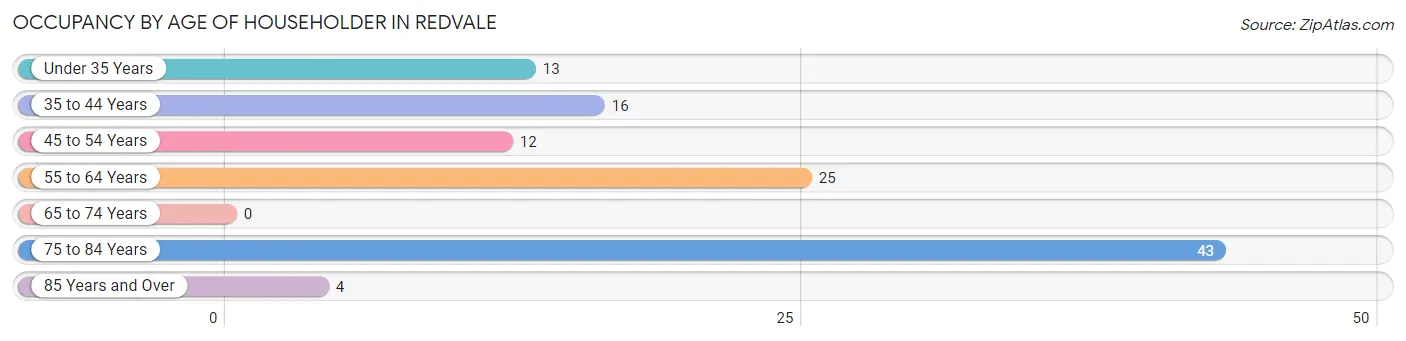
| Age Bracket | # Households | % Households |
| Under 35 Years | 13 | 11.5% |
| 35 to 44 Years | 16 | 14.2% |
| 45 to 54 Years | 12 | 10.6% |
| 55 to 64 Years | 25 | 22.1% |
| 65 to 74 Years | 0 | 0.0% |
| 75 to 84 Years | 43 | 38.1% |
| 85 Years and Over | 4 | 3.5% |
| Total | 113 | 100.0% |
Housing Finances in Redvale
Median Income by Occupancy in Redvale
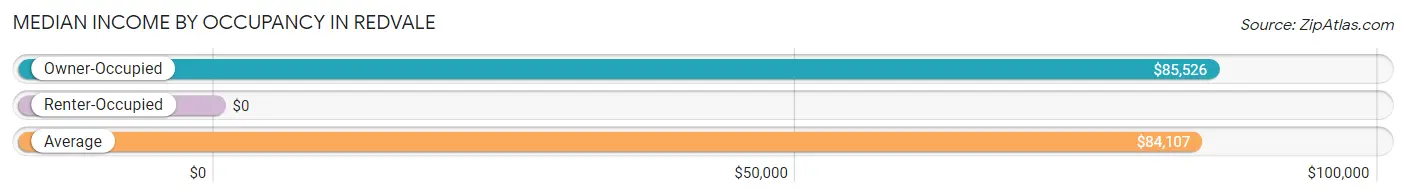
| Occupancy Type | # Households | Median Income |
| Owner-Occupied | 100 (88.5%) | $85,526 |
| Renter-Occupied | 13 (11.5%) | $0 |
| Average | 113 (100.0%) | $84,107 |
Occupancy by Householder Income Bracket in Redvale
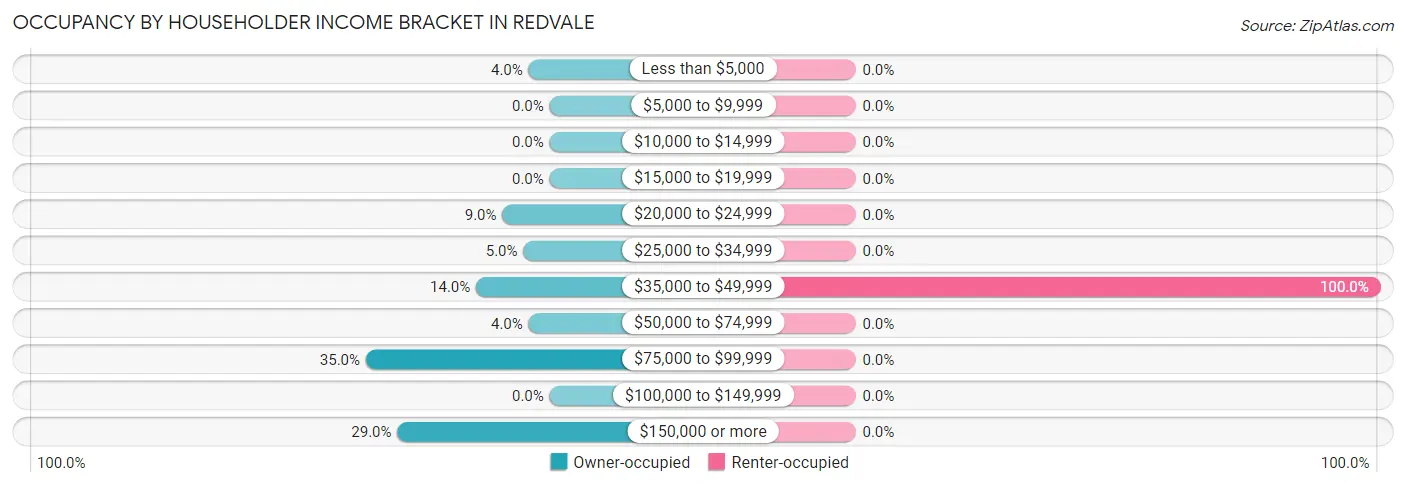
| Income Bracket | Owner-occupied | Renter-occupied |
| Less than $5,000 | 4 (4.0%) | 0 (0.0%) |
| $5,000 to $9,999 | 0 (0.0%) | 0 (0.0%) |
| $10,000 to $14,999 | 0 (0.0%) | 0 (0.0%) |
| $15,000 to $19,999 | 0 (0.0%) | 0 (0.0%) |
| $20,000 to $24,999 | 9 (9.0%) | 0 (0.0%) |
| $25,000 to $34,999 | 5 (5.0%) | 0 (0.0%) |
| $35,000 to $49,999 | 14 (14.0%) | 13 (100.0%) |
| $50,000 to $74,999 | 4 (4.0%) | 0 (0.0%) |
| $75,000 to $99,999 | 35 (35.0%) | 0 (0.0%) |
| $100,000 to $149,999 | 0 (0.0%) | 0 (0.0%) |
| $150,000 or more | 29 (29.0%) | 0 (0.0%) |
| Total | 100 (100.0%) | 13 (100.0%) |
Monthly Housing Cost Tiers in Redvale
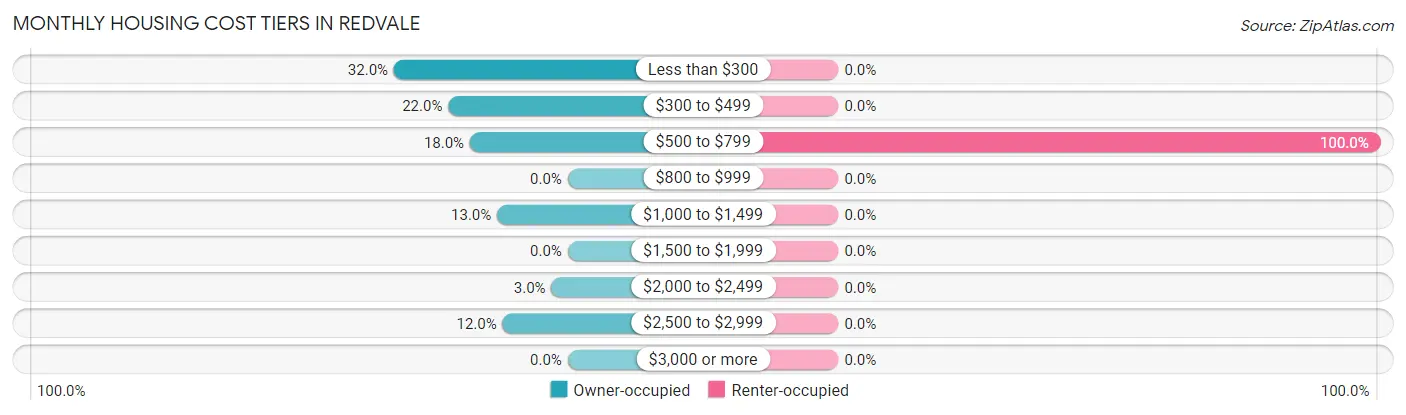
| Monthly Cost | Owner-occupied | Renter-occupied |
| Less than $300 | 32 (32.0%) | 0 (0.0%) |
| $300 to $499 | 22 (22.0%) | 0 (0.0%) |
| $500 to $799 | 18 (18.0%) | 13 (100.0%) |
| $800 to $999 | 0 (0.0%) | 0 (0.0%) |
| $1,000 to $1,499 | 13 (13.0%) | 0 (0.0%) |
| $1,500 to $1,999 | 0 (0.0%) | 0 (0.0%) |
| $2,000 to $2,499 | 3 (3.0%) | 0 (0.0%) |
| $2,500 to $2,999 | 12 (12.0%) | 0 (0.0%) |
| $3,000 or more | 0 (0.0%) | 0 (0.0%) |
| Total | 100 (100.0%) | 13 (100.0%) |
Physical Housing Characteristics in Redvale
Housing Structures in Redvale
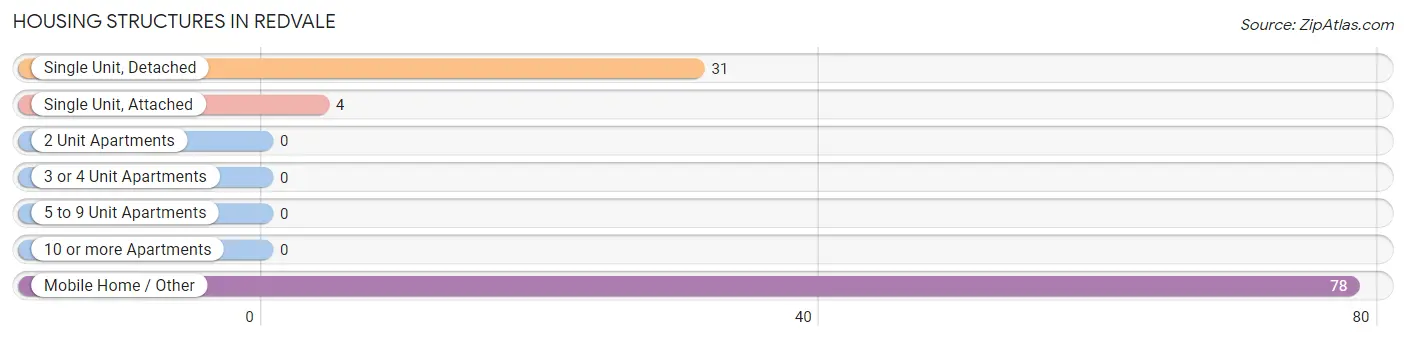
| Structure Type | # Housing Units | % Housing Units |
| Single Unit, Detached | 31 | 27.4% |
| Single Unit, Attached | 4 | 3.5% |
| 2 Unit Apartments | 0 | 0.0% |
| 3 or 4 Unit Apartments | 0 | 0.0% |
| 5 to 9 Unit Apartments | 0 | 0.0% |
| 10 or more Apartments | 0 | 0.0% |
| Mobile Home / Other | 78 | 69.0% |
| Total | 113 | 100.0% |
Housing Structures by Occupancy in Redvale
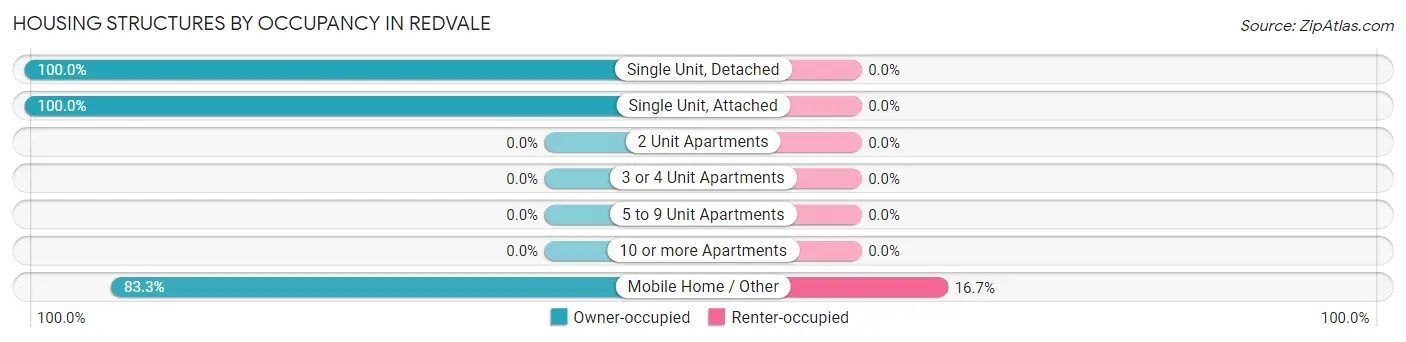
| Structure Type | Owner-occupied | Renter-occupied |
| Single Unit, Detached | 31 (100.0%) | 0 (0.0%) |
| Single Unit, Attached | 4 (100.0%) | 0 (0.0%) |
| 2 Unit Apartments | 0 (0.0%) | 0 (0.0%) |
| 3 or 4 Unit Apartments | 0 (0.0%) | 0 (0.0%) |
| 5 to 9 Unit Apartments | 0 (0.0%) | 0 (0.0%) |
| 10 or more Apartments | 0 (0.0%) | 0 (0.0%) |
| Mobile Home / Other | 65 (83.3%) | 13 (16.7%) |
| Total | 100 (88.5%) | 13 (11.5%) |
Housing Structures by Number of Rooms in Redvale
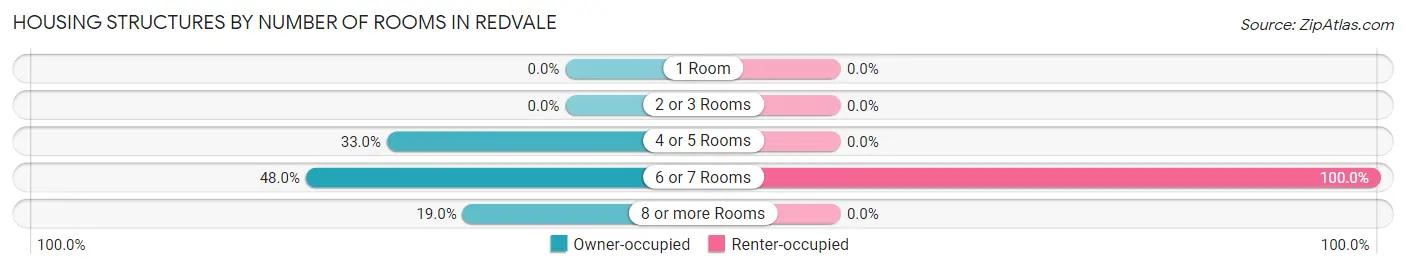
| Number of Rooms | Owner-occupied | Renter-occupied |
| 1 Room | 0 (0.0%) | 0 (0.0%) |
| 2 or 3 Rooms | 0 (0.0%) | 0 (0.0%) |
| 4 or 5 Rooms | 33 (33.0%) | 0 (0.0%) |
| 6 or 7 Rooms | 48 (48.0%) | 13 (100.0%) |
| 8 or more Rooms | 19 (19.0%) | 0 (0.0%) |
| Total | 100 (100.0%) | 13 (100.0%) |
Housing Structure by Heating Type in Redvale
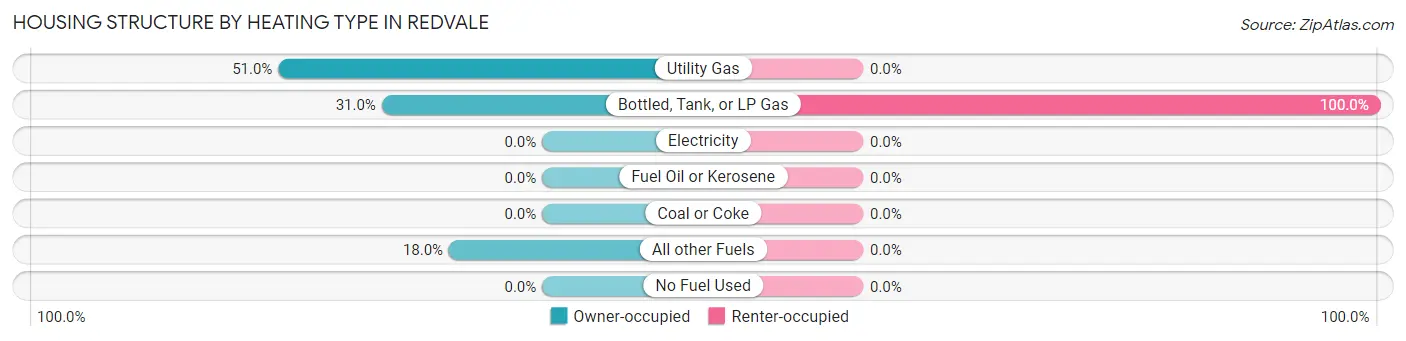
| Heating Type | Owner-occupied | Renter-occupied |
| Utility Gas | 51 (51.0%) | 0 (0.0%) |
| Bottled, Tank, or LP Gas | 31 (31.0%) | 13 (100.0%) |
| Electricity | 0 (0.0%) | 0 (0.0%) |
| Fuel Oil or Kerosene | 0 (0.0%) | 0 (0.0%) |
| Coal or Coke | 0 (0.0%) | 0 (0.0%) |
| All other Fuels | 18 (18.0%) | 0 (0.0%) |
| No Fuel Used | 0 (0.0%) | 0 (0.0%) |
| Total | 100 (100.0%) | 13 (100.0%) |
Household Vehicle Usage in Redvale
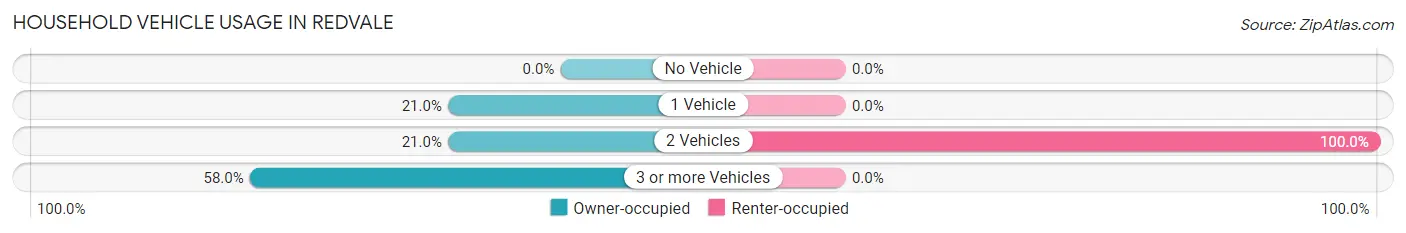
| Vehicles per Household | Owner-occupied | Renter-occupied |
| No Vehicle | 0 (0.0%) | 0 (0.0%) |
| 1 Vehicle | 21 (21.0%) | 0 (0.0%) |
| 2 Vehicles | 21 (21.0%) | 13 (100.0%) |
| 3 or more Vehicles | 58 (58.0%) | 0 (0.0%) |
| Total | 100 (100.0%) | 13 (100.0%) |
Real Estate & Mortgages in Redvale
Real Estate and Mortgage Overview in Redvale
| Characteristic | Without Mortgage | With Mortgage |
| Housing Units | 58 | 42 |
| Median Property Value | $114,800 | $276,900 |
| Median Household Income | $85,000 | $25 |
| Monthly Housing Costs | $291 | $0 |
| Real Estate Taxes | $495 | $0 |
Property Value by Mortgage Status in Redvale
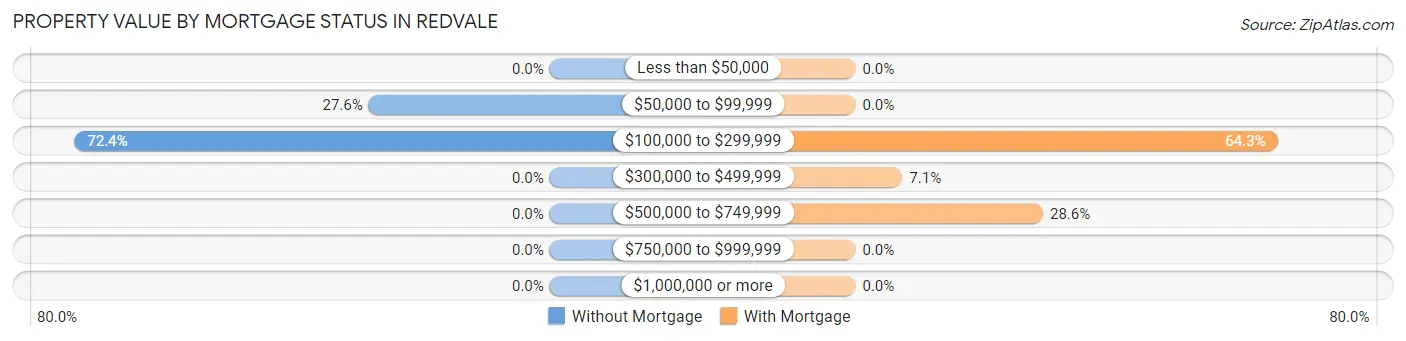
| Property Value | Without Mortgage | With Mortgage |
| Less than $50,000 | 0 (0.0%) | 0 (0.0%) |
| $50,000 to $99,999 | 16 (27.6%) | 0 (0.0%) |
| $100,000 to $299,999 | 42 (72.4%) | 27 (64.3%) |
| $300,000 to $499,999 | 0 (0.0%) | 3 (7.1%) |
| $500,000 to $749,999 | 0 (0.0%) | 12 (28.6%) |
| $750,000 to $999,999 | 0 (0.0%) | 0 (0.0%) |
| $1,000,000 or more | 0 (0.0%) | 0 (0.0%) |
| Total | 58 (100.0%) | 42 (100.0%) |
Household Income by Mortgage Status in Redvale
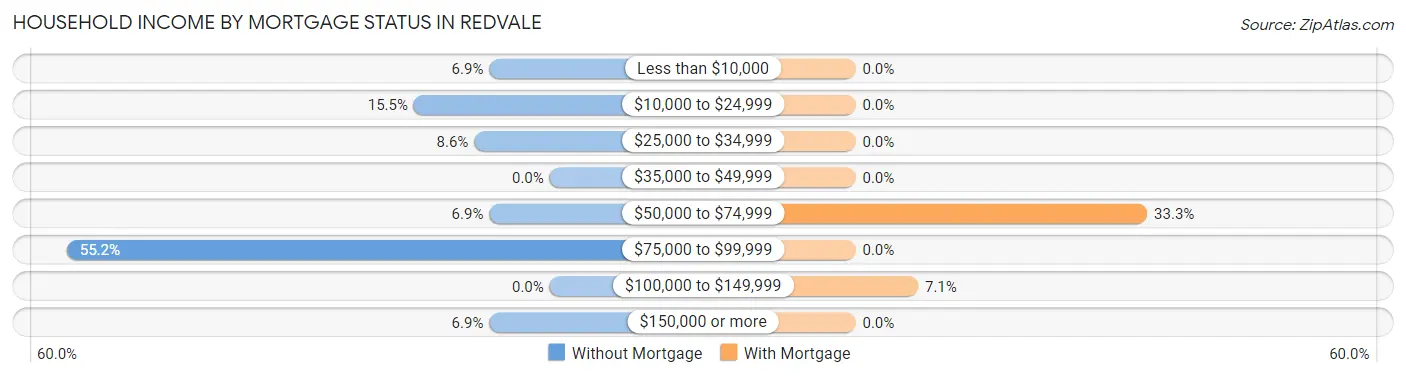
| Household Income | Without Mortgage | With Mortgage |
| Less than $10,000 | 4 (6.9%) | 0 (0.0%) |
| $10,000 to $24,999 | 9 (15.5%) | 0 (0.0%) |
| $25,000 to $34,999 | 5 (8.6%) | 0 (0.0%) |
| $35,000 to $49,999 | 0 (0.0%) | 0 (0.0%) |
| $50,000 to $74,999 | 4 (6.9%) | 14 (33.3%) |
| $75,000 to $99,999 | 32 (55.2%) | 0 (0.0%) |
| $100,000 to $149,999 | 0 (0.0%) | 3 (7.1%) |
| $150,000 or more | 4 (6.9%) | 0 (0.0%) |
| Total | 58 (100.0%) | 42 (100.0%) |
Property Value to Household Income Ratio in Redvale
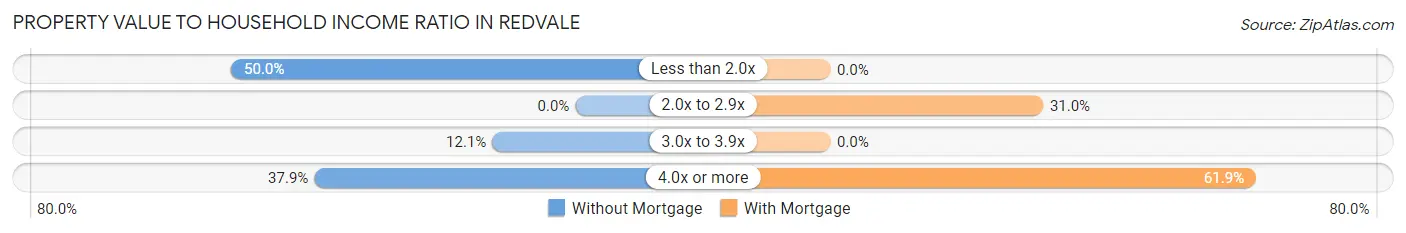
| Value-to-Income Ratio | Without Mortgage | With Mortgage |
| Less than 2.0x | 29 (50.0%) | 0 (0.0%) |
| 2.0x to 2.9x | 0 (0.0%) | 13 (30.9%) |
| 3.0x to 3.9x | 7 (12.1%) | 0 (0.0%) |
| 4.0x or more | 22 (37.9%) | 26 (61.9%) |
| Total | 58 (100.0%) | 42 (100.0%) |
Real Estate Taxes by Mortgage Status in Redvale
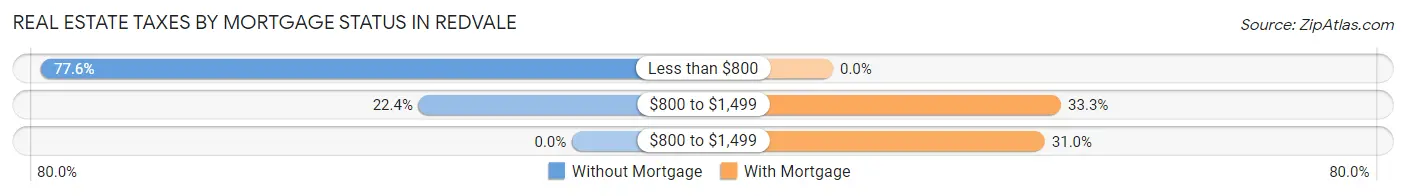
| Property Taxes | Without Mortgage | With Mortgage |
| Less than $800 | 45 (77.6%) | 0 (0.0%) |
| $800 to $1,499 | 13 (22.4%) | 14 (33.3%) |
| $800 to $1,499 | 0 (0.0%) | 13 (30.9%) |
| Total | 58 (100.0%) | 42 (100.0%) |
Health & Disability in Redvale
Health Insurance Coverage by Age in Redvale
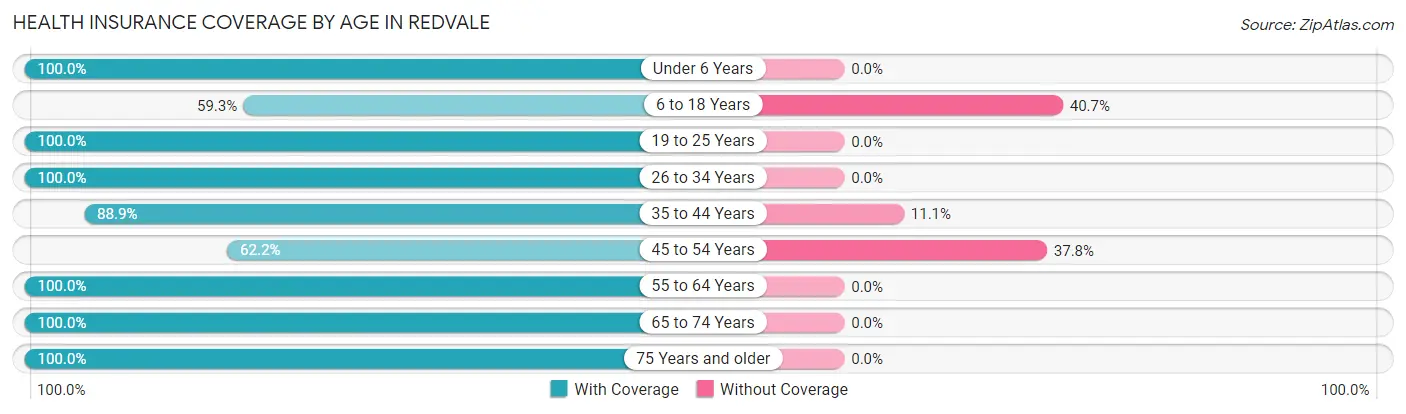
| Age Bracket | With Coverage | Without Coverage |
| Under 6 Years | 23 (100.0%) | 0 (0.0%) |
| 6 to 18 Years | 32 (59.3%) | 22 (40.7%) |
| 19 to 25 Years | 26 (100.0%) | 0 (0.0%) |
| 26 to 34 Years | 38 (100.0%) | 0 (0.0%) |
| 35 to 44 Years | 24 (88.9%) | 3 (11.1%) |
| 45 to 54 Years | 28 (62.2%) | 17 (37.8%) |
| 55 to 64 Years | 67 (100.0%) | 0 (0.0%) |
| 65 to 74 Years | 7 (100.0%) | 0 (0.0%) |
| 75 Years and older | 62 (100.0%) | 0 (0.0%) |
| Total | 307 (88.0%) | 42 (12.0%) |
Health Insurance Coverage by Citizenship Status in Redvale
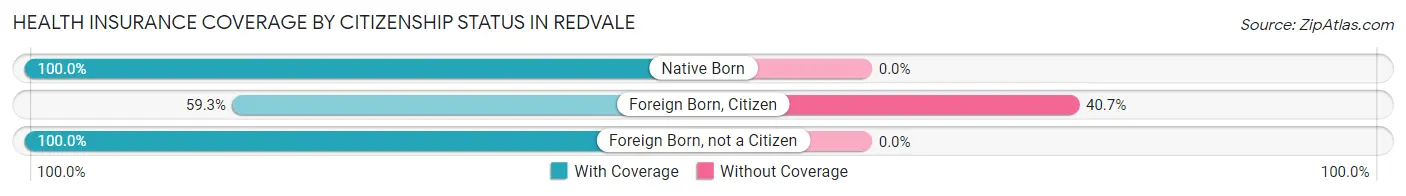
| Citizenship Status | With Coverage | Without Coverage |
| Native Born | 23 (100.0%) | 0 (0.0%) |
| Foreign Born, Citizen | 32 (59.3%) | 22 (40.7%) |
| Foreign Born, not a Citizen | 26 (100.0%) | 0 (0.0%) |
Health Insurance Coverage by Household Income in Redvale
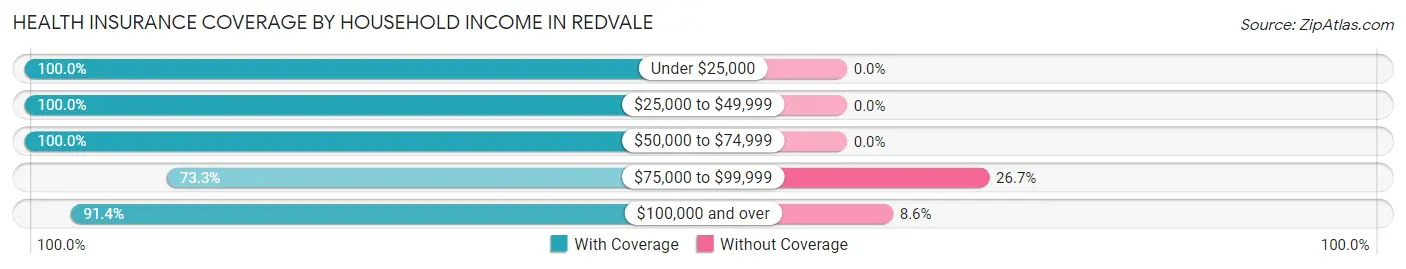
| Household Income | With Coverage | Without Coverage |
| Under $25,000 | 26 (100.0%) | 0 (0.0%) |
| $25,000 to $49,999 | 76 (100.0%) | 0 (0.0%) |
| $50,000 to $74,999 | 11 (100.0%) | 0 (0.0%) |
| $75,000 to $99,999 | 88 (73.3%) | 32 (26.7%) |
| $100,000 and over | 106 (91.4%) | 10 (8.6%) |
Public vs Private Health Insurance Coverage by Age in Redvale
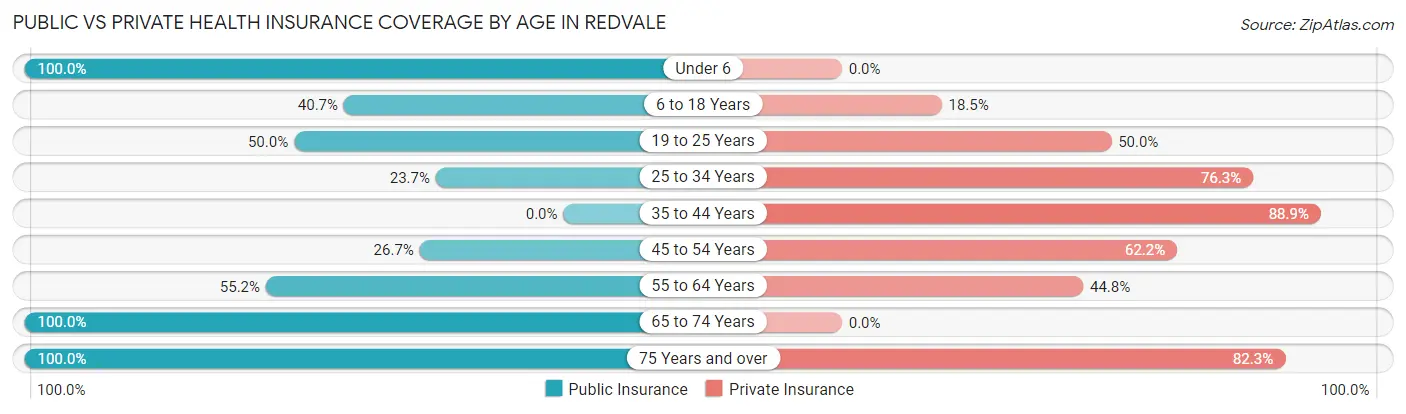
| Age Bracket | Public Insurance | Private Insurance |
| Under 6 | 23 (100.0%) | 0 (0.0%) |
| 6 to 18 Years | 22 (40.7%) | 10 (18.5%) |
| 19 to 25 Years | 13 (50.0%) | 13 (50.0%) |
| 25 to 34 Years | 9 (23.7%) | 29 (76.3%) |
| 35 to 44 Years | 0 (0.0%) | 24 (88.9%) |
| 45 to 54 Years | 12 (26.7%) | 28 (62.2%) |
| 55 to 64 Years | 37 (55.2%) | 30 (44.8%) |
| 65 to 74 Years | 7 (100.0%) | 0 (0.0%) |
| 75 Years and over | 62 (100.0%) | 51 (82.3%) |
| Total | 185 (53.0%) | 185 (53.0%) |
Disability Status by Sex by Age in Redvale
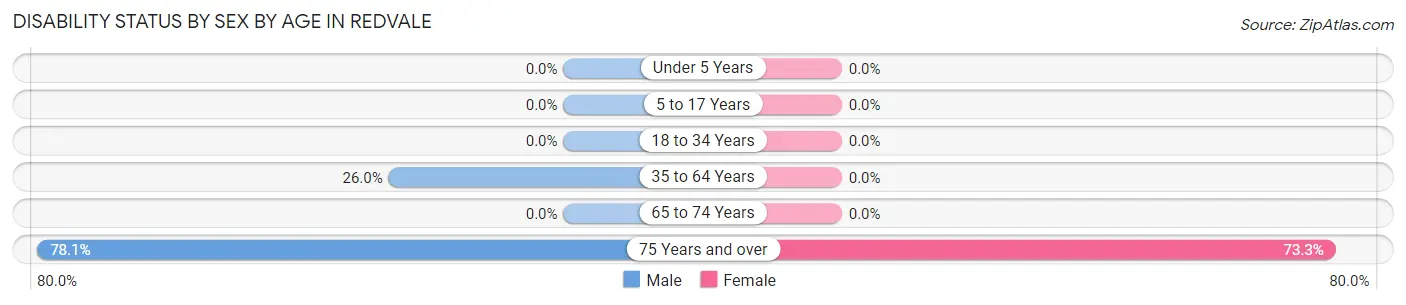
| Age Bracket | Male | Female |
| Under 5 Years | 0 (0.0%) | 0 (0.0%) |
| 5 to 17 Years | 0 (0.0%) | 0 (0.0%) |
| 18 to 34 Years | 0 (0.0%) | 0 (0.0%) |
| 35 to 64 Years | 27 (26.0%) | 0 (0.0%) |
| 65 to 74 Years | 0 (0.0%) | 0 (0.0%) |
| 75 Years and over | 25 (78.1%) | 22 (73.3%) |
Disability Class by Sex by Age in Redvale
Disability Class: Hearing Difficulty
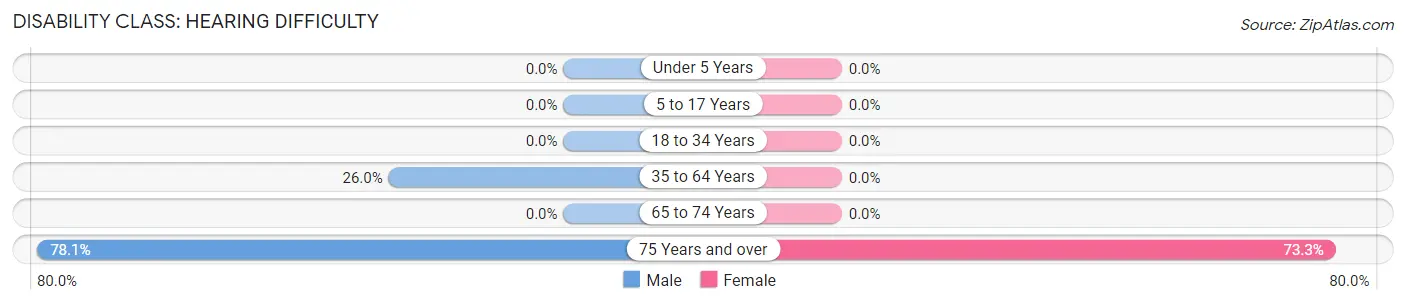
| Age Bracket | Male | Female |
| Under 5 Years | 0 (0.0%) | 0 (0.0%) |
| 5 to 17 Years | 0 (0.0%) | 0 (0.0%) |
| 18 to 34 Years | 0 (0.0%) | 0 (0.0%) |
| 35 to 64 Years | 27 (26.0%) | 0 (0.0%) |
| 65 to 74 Years | 0 (0.0%) | 0 (0.0%) |
| 75 Years and over | 25 (78.1%) | 22 (73.3%) |
Disability Class: Vision Difficulty
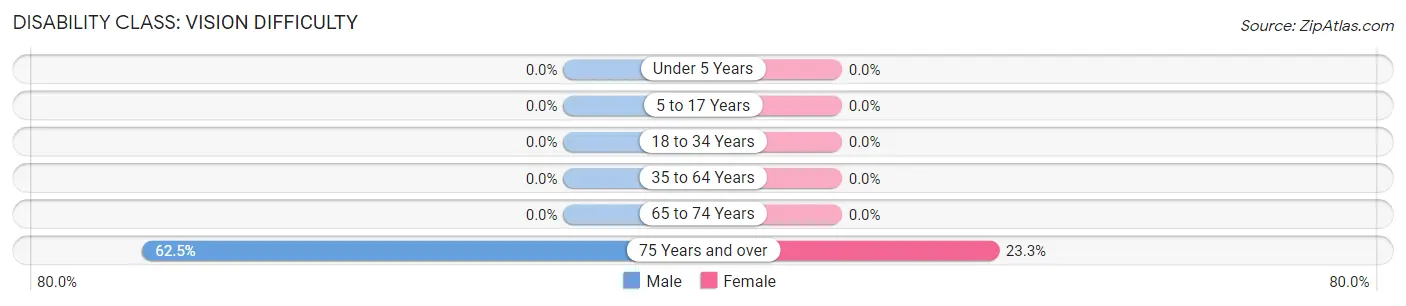
| Age Bracket | Male | Female |
| Under 5 Years | 0 (0.0%) | 0 (0.0%) |
| 5 to 17 Years | 0 (0.0%) | 0 (0.0%) |
| 18 to 34 Years | 0 (0.0%) | 0 (0.0%) |
| 35 to 64 Years | 0 (0.0%) | 0 (0.0%) |
| 65 to 74 Years | 0 (0.0%) | 0 (0.0%) |
| 75 Years and over | 20 (62.5%) | 7 (23.3%) |
Disability Class: Cognitive Difficulty

| Age Bracket | Male | Female |
| 5 to 17 Years | 0 (0.0%) | 0 (0.0%) |
| 18 to 34 Years | 0 (0.0%) | 0 (0.0%) |
| 35 to 64 Years | 0 (0.0%) | 0 (0.0%) |
| 65 to 74 Years | 0 (0.0%) | 0 (0.0%) |
| 75 Years and over | 16 (50.0%) | 0 (0.0%) |
Disability Class: Ambulatory Difficulty
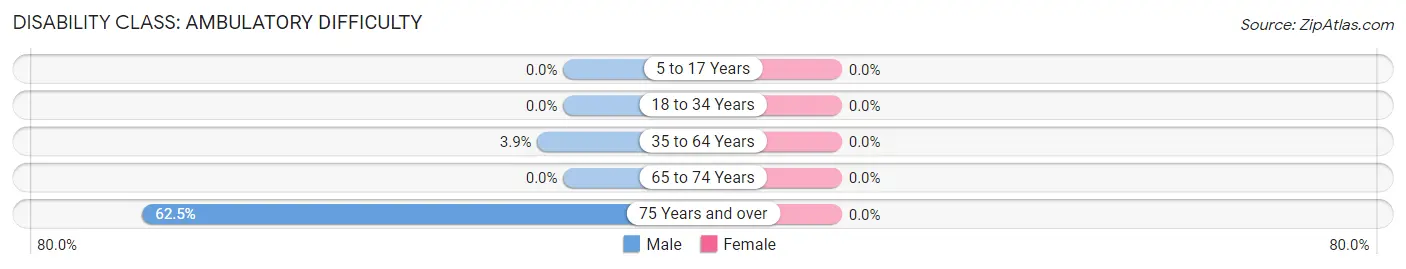
| Age Bracket | Male | Female |
| 5 to 17 Years | 0 (0.0%) | 0 (0.0%) |
| 18 to 34 Years | 0 (0.0%) | 0 (0.0%) |
| 35 to 64 Years | 4 (3.8%) | 0 (0.0%) |
| 65 to 74 Years | 0 (0.0%) | 0 (0.0%) |
| 75 Years and over | 20 (62.5%) | 0 (0.0%) |
Disability Class: Self-Care Difficulty
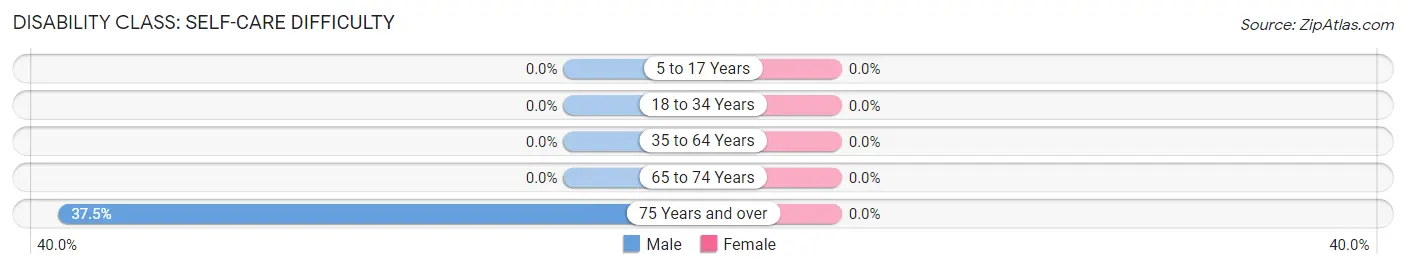
| Age Bracket | Male | Female |
| 5 to 17 Years | 0 (0.0%) | 0 (0.0%) |
| 18 to 34 Years | 0 (0.0%) | 0 (0.0%) |
| 35 to 64 Years | 0 (0.0%) | 0 (0.0%) |
| 65 to 74 Years | 0 (0.0%) | 0 (0.0%) |
| 75 Years and over | 12 (37.5%) | 0 (0.0%) |
Technology Access in Redvale
Computing Device Access in Redvale
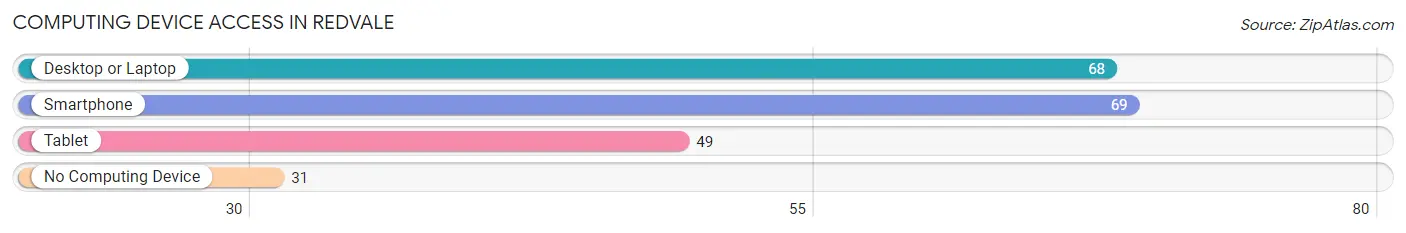
| Device Type | # Households | % Households |
| Desktop or Laptop | 68 | 60.2% |
| Smartphone | 69 | 61.1% |
| Tablet | 49 | 43.4% |
| No Computing Device | 31 | 27.4% |
| Total | 113 | 100.0% |
Internet Access in Redvale
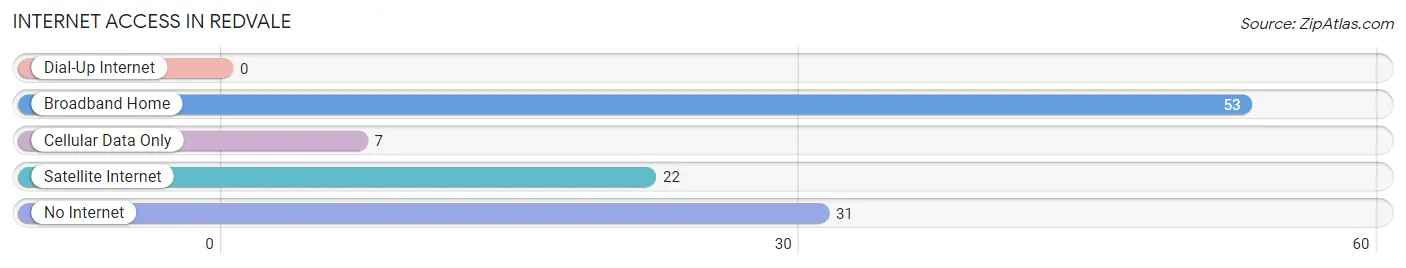
| Internet Type | # Households | % Households |
| Dial-Up Internet | 0 | 0.0% |
| Broadband Home | 53 | 46.9% |
| Cellular Data Only | 7 | 6.2% |
| Satellite Internet | 22 | 19.5% |
| No Internet | 31 | 27.4% |
| Total | 113 | 100.0% |
Redvale Summary
Valley Redvale is a small town located in the San Juan Mountains of southwestern Colorado. It is situated in the San Miguel County, and is surrounded by the towns of Telluride, Rico, and Norwood. The town has a population of approximately 1,000 people, and is known for its stunning mountain views and outdoor activities.
History
The town of Redvale was founded in 1881 by a group of miners who were searching for gold in the San Juan Mountains. The miners named the town after the red-colored ore they found in the area. The town quickly grew, and by the early 1900s, it had become a bustling mining town with a population of over 1,000 people.
The town was home to several mines, including the Redvale Mine, which was the largest and most successful. The mine produced gold, silver, and copper, and was the main source of income for the town. The mine closed in the 1950s, and the town’s population began to decline.
In the 1970s, the town was revitalized by the arrival of ski resorts in the area. The town became a popular destination for skiers and snowboarders, and the population began to grow again. Today, Redvale is a popular tourist destination, and is known for its stunning mountain views and outdoor activities.
Geography
Redvale is located in the San Juan Mountains of southwestern Colorado. The town is situated in the San Miguel County, and is surrounded by the towns of Telluride, Rico, and Norwood. The town is located at an elevation of 8,000 feet, and is surrounded by mountains and forests.
The town is located near several ski resorts, including Telluride Ski Resort, Purgatory Ski Resort, and Wolf Creek Ski Area. The town is also close to several national parks, including the Black Canyon of the Gunnison National Park and the Great Sand Dunes National Park.
Economy
The economy of Redvale is largely based on tourism. The town is a popular destination for skiers and snowboarders, and is home to several ski resorts. The town is also home to several restaurants, bars, and shops, which cater to tourists.
The town is also home to several small businesses, including a grocery store, a hardware store, and a gas station. The town is also home to several art galleries, which showcase the work of local artists.
Demographics
As of the 2010 census, the population of Redvale was 1,000 people. The town is predominantly white, with approximately 95% of the population being white. The town is also home to a small Hispanic population, with approximately 5% of the population being Hispanic.
The median household income in Redvale is $45,000, and the median home value is $250,000. The town has a low unemployment rate, and the majority of the population is employed in the tourism industry.
Conclusion
Redvale is a small town located in the San Juan Mountains of southwestern Colorado. The town has a population of approximately 1,000 people, and is known for its stunning mountain views and outdoor activities. The town’s economy is largely based on tourism, and the town is home to several ski resorts, restaurants, bars, and shops. The town is predominantly white, with a small Hispanic population. The median household income in Redvale is $45,000, and the median home value is $250,000.
Common Questions
What is Per Capita Income in Redvale?
Per Capita income in Redvale is $32,194.
What is the Median Family Income in Redvale?
Median Family Income in Redvale is $85,921.
What is the Median Household income in Redvale?
Median Household Income in Redvale is $84,107.
What is Inequality or Gini Index in Redvale?
Inequality or Gini Index in Redvale is 0.38.
What is the Total Population of Redvale?
Total Population of Redvale is 349.
What is the Total Male Population of Redvale?
Total Male Population of Redvale is 202.
What is the Total Female Population of Redvale?
Total Female Population of Redvale is 147.
What is the Ratio of Males per 100 Females in Redvale?
There are 137.41 Males per 100 Females in Redvale.
What is the Ratio of Females per 100 Males in Redvale?
There are 72.77 Females per 100 Males in Redvale.
What is the Median Population Age in Redvale?
Median Population Age in Redvale is 46.5 Years.
What is the Average Family Size in Redvale
Average Family Size in Redvale is 3.0 People.
What is the Average Household Size in Redvale
Average Household Size in Redvale is 3.1 People.
How Large is the Labor Force in Redvale?
There are 180 People in the Labor Forcein in Redvale.
What is the Percentage of People in the Labor Force in Redvale?
64.3% of People are in the Labor Force in Redvale.
What is the Unemployment Rate in Redvale?
Unemployment Rate in Redvale is 5.0%.