Paonia, CO Map & Demographics
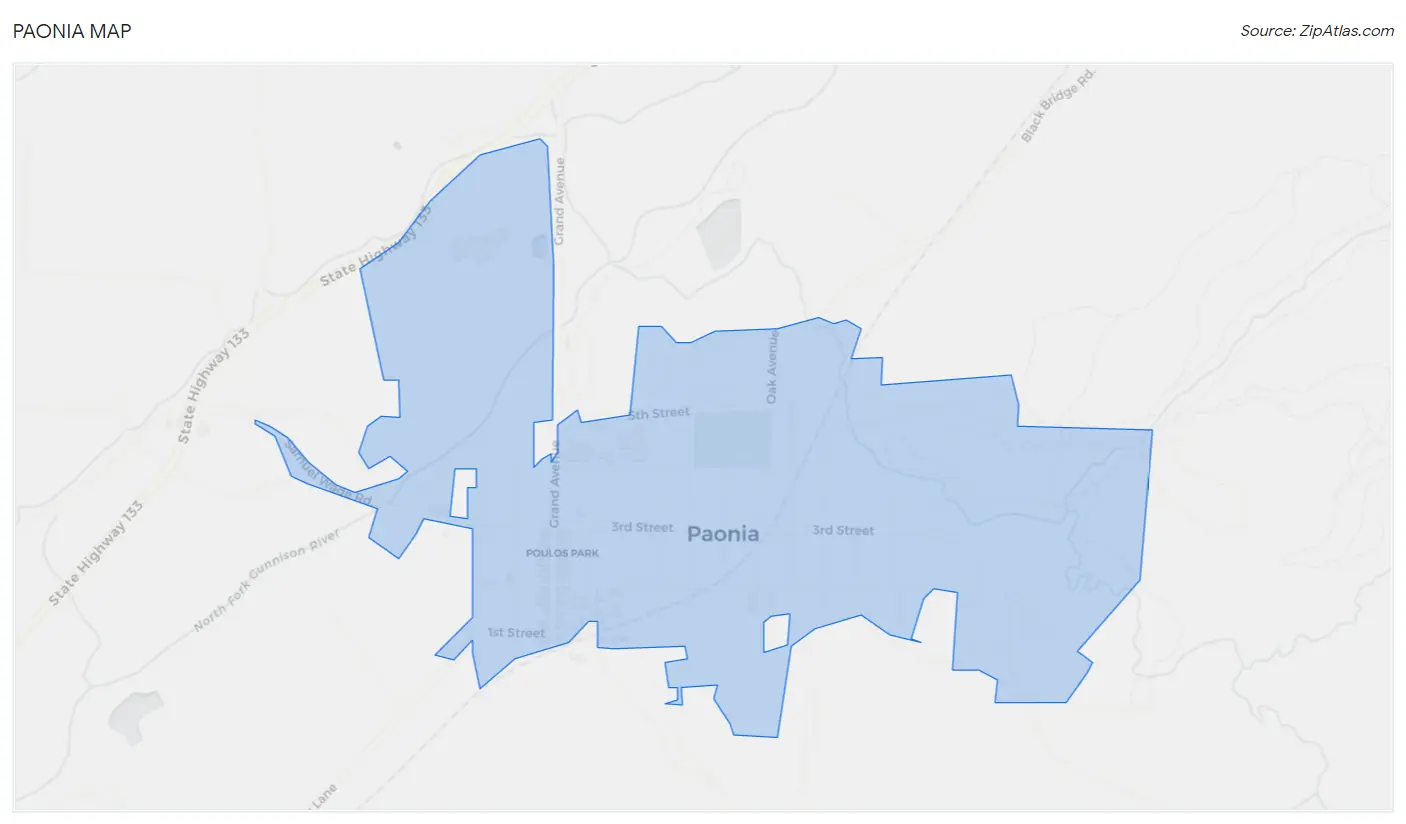
Paonia Map
Paonia Overview
$36,898
PER CAPITA INCOME
$71,667
AVG FAMILY INCOME
$54,643
AVG HOUSEHOLD INCOME
10.1%
WAGE / INCOME GAP [ % ]
89.9¢/ $1
WAGE / INCOME GAP [ $ ]
$7,142
FAMILY INCOME DEFICIT
0.43
INEQUALITY / GINI INDEX
1,571
TOTAL POPULATION
713
MALE POPULATION
858
FEMALE POPULATION
83.10
MALES / 100 FEMALES
120.34
FEMALES / 100 MALES
38.9
MEDIAN AGE
3.0
AVG FAMILY SIZE
2.0
AVG HOUSEHOLD SIZE
764
LABOR FORCE [ PEOPLE ]
57.8%
PERCENT IN LABOR FORCE
6.2%
UNEMPLOYMENT RATE
Paonia Zip Codes
Paonia Area Codes
Income in Paonia
Income Overview in Paonia
Per Capita Income in Paonia is $36,898, while median incomes of families and households are $71,667 and $54,643 respectively.
| Characteristic | Number | Measure |
| Per Capita Income | 1,571 | $36,898 |
| Median Family Income | 342 | $71,667 |
| Mean Family Income | 342 | $88,964 |
| Median Household Income | 744 | $54,643 |
| Mean Household Income | 744 | $69,517 |
| Income Deficit | 342 | $7,142 |
| Wage / Income Gap (%) | 1,571 | 10.06% |
| Wage / Income Gap ($) | 1,571 | 89.94¢ per $1 |
| Gini / Inequality Index | 1,571 | 0.43 |
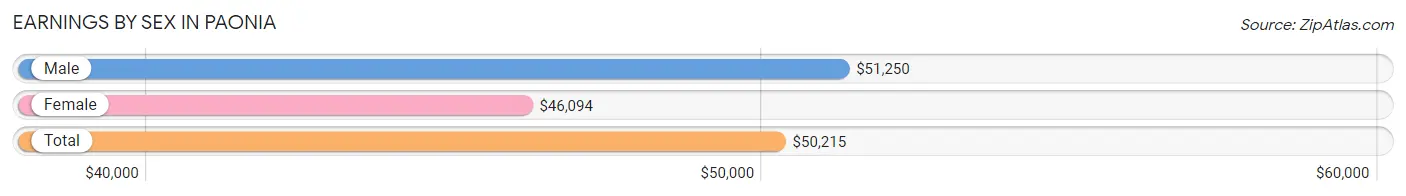
Earnings by Sex in Paonia
Average Earnings in Paonia are $50,215, $51,250 for men and $46,094 for women, a difference of 10.1%.
| Sex | Number | Average Earnings |
| Male | 312 (40.9%) | $51,250 |
| Female | 451 (59.1%) | $46,094 |
| Total | 763 (100.0%) | $50,215 |
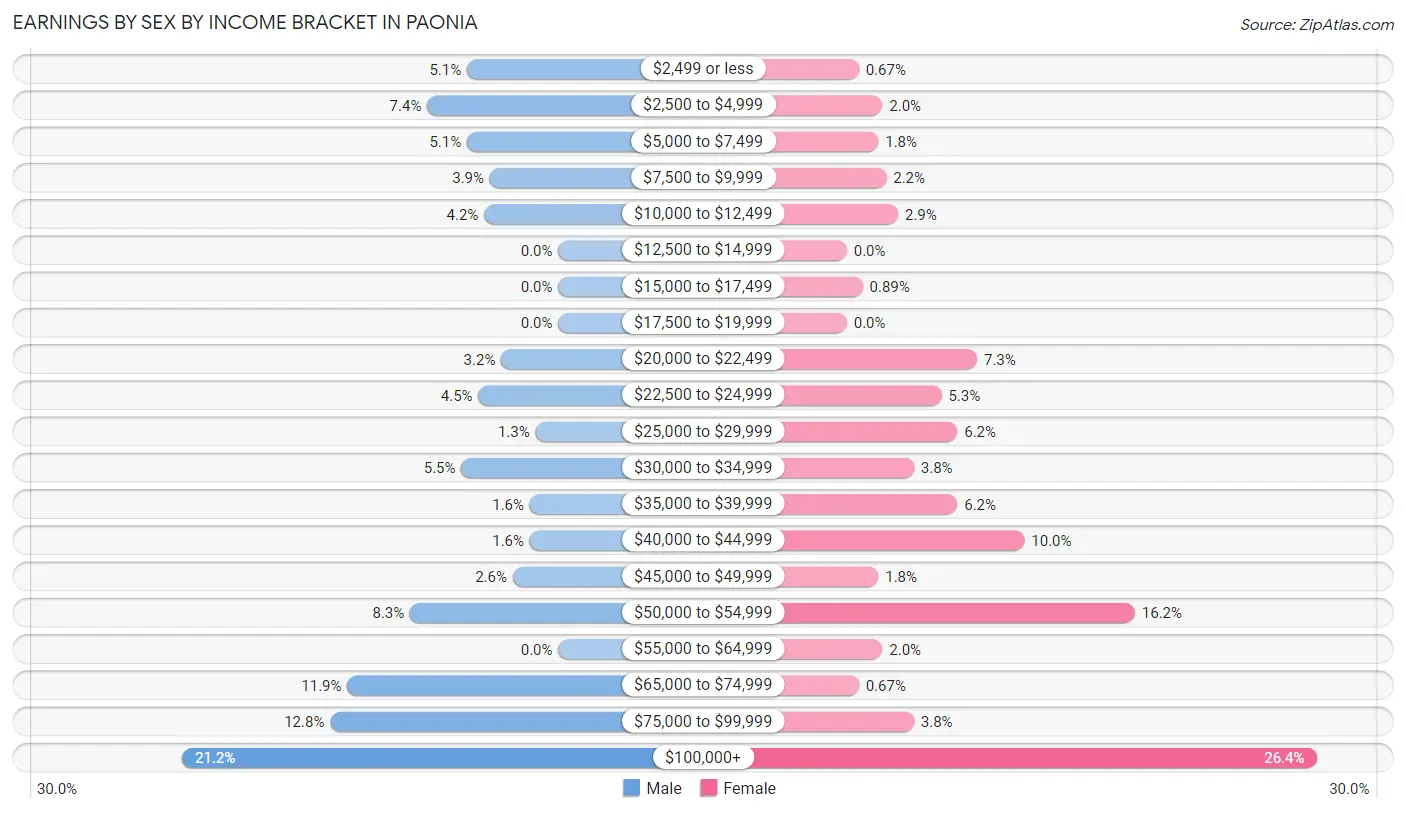
Earnings by Sex by Income Bracket in Paonia
The most common earnings brackets in Paonia are $100,000+ for men (66 | 21.1%) and $100,000+ for women (119 | 26.4%).
| Income | Male | Female |
| $2,499 or less | 16 (5.1%) | 3 (0.7%) |
| $2,500 to $4,999 | 23 (7.4%) | 9 (2.0%) |
| $5,000 to $7,499 | 16 (5.1%) | 8 (1.8%) |
| $7,500 to $9,999 | 12 (3.8%) | 10 (2.2%) |
| $10,000 to $12,499 | 13 (4.2%) | 13 (2.9%) |
| $12,500 to $14,999 | 0 (0.0%) | 0 (0.0%) |
| $15,000 to $17,499 | 0 (0.0%) | 4 (0.9%) |
| $17,500 to $19,999 | 0 (0.0%) | 0 (0.0%) |
| $20,000 to $22,499 | 10 (3.2%) | 33 (7.3%) |
| $22,500 to $24,999 | 14 (4.5%) | 24 (5.3%) |
| $25,000 to $29,999 | 4 (1.3%) | 28 (6.2%) |
| $30,000 to $34,999 | 17 (5.4%) | 17 (3.8%) |
| $35,000 to $39,999 | 5 (1.6%) | 28 (6.2%) |
| $40,000 to $44,999 | 5 (1.6%) | 45 (10.0%) |
| $45,000 to $49,999 | 8 (2.6%) | 8 (1.8%) |
| $50,000 to $54,999 | 26 (8.3%) | 73 (16.2%) |
| $55,000 to $64,999 | 0 (0.0%) | 9 (2.0%) |
| $65,000 to $74,999 | 37 (11.9%) | 3 (0.7%) |
| $75,000 to $99,999 | 40 (12.8%) | 17 (3.8%) |
| $100,000+ | 66 (21.1%) | 119 (26.4%) |
| Total | 312 (100.0%) | 451 (100.0%) |
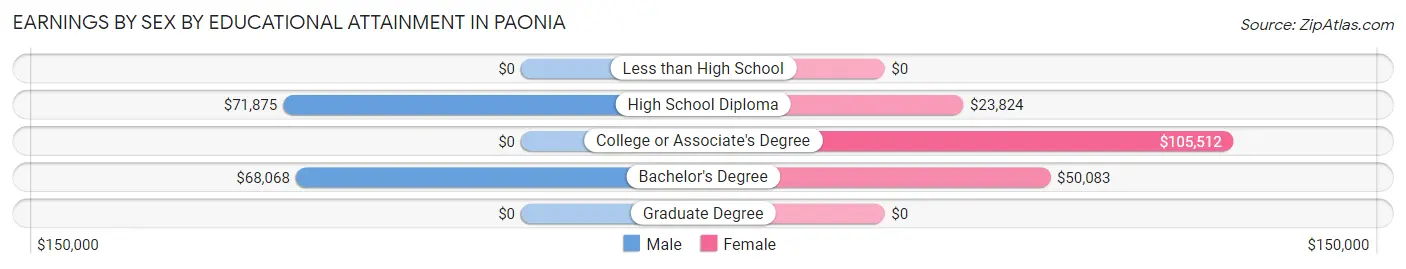
Earnings by Sex by Educational Attainment in Paonia
Average earnings in Paonia are $52,452 for men and $50,445 for women, a difference of 3.8%. Men with an educational attainment of high school diploma enjoy the highest average annual earnings of $71,875, while those with bachelor's degree education earn the least with $68,068. Women with an educational attainment of college or associate's degree earn the most with the average annual earnings of $105,512, while those with high school diploma education have the smallest earnings of $23,824.
| Educational Attainment | Male Income | Female Income |
| Less than High School | - | - |
| High School Diploma | $71,875 | $23,824 |
| College or Associate's Degree | - | - |
| Bachelor's Degree | $68,068 | $50,083 |
| Graduate Degree | - | - |
| Total | $52,452 | $50,445 |
Family Income in Paonia
Family Income Brackets in Paonia
According to the Paonia family income data, there are 90 families falling into the $100,000 to $149,999 income range, which is the most common income bracket and makes up 26.3% of all families. Conversely, the $10,000 to $14,999 income bracket is the least frequent group with only 3 families (0.9%) belonging to this category.
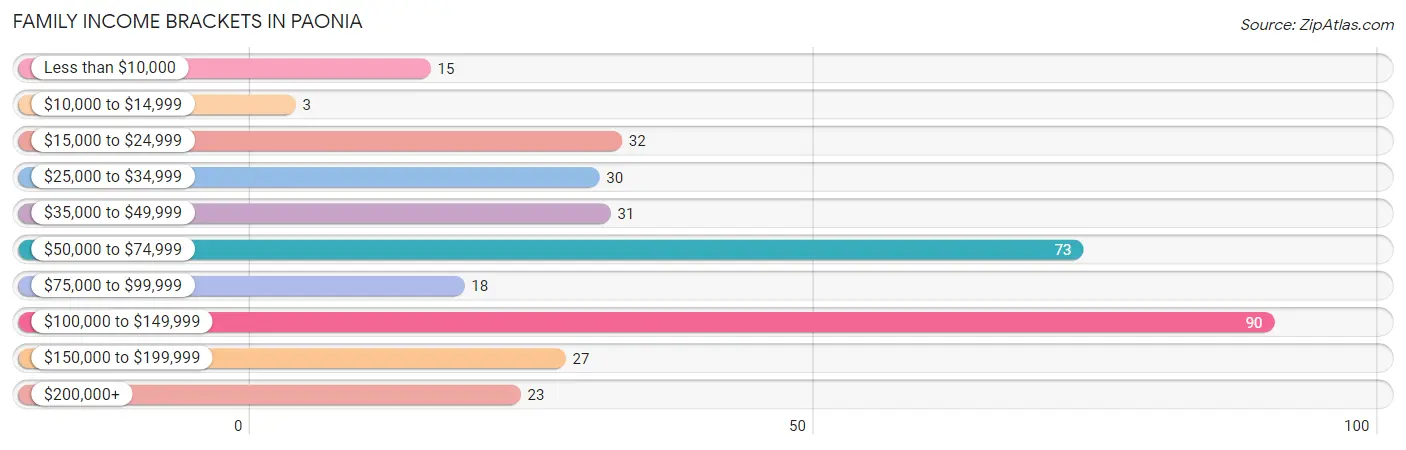
| Income Bracket | # Families | % Families |
| Less than $10,000 | 15 | 4.4% |
| $10,000 to $14,999 | 3 | 0.9% |
| $15,000 to $24,999 | 32 | 9.4% |
| $25,000 to $34,999 | 30 | 8.8% |
| $35,000 to $49,999 | 31 | 9.1% |
| $50,000 to $74,999 | 73 | 21.3% |
| $75,000 to $99,999 | 18 | 5.3% |
| $100,000 to $149,999 | 90 | 26.3% |
| $150,000 to $199,999 | 27 | 7.9% |
| $200,000+ | 23 | 6.7% |
Family Income by Famaliy Size in Paonia
4-person families (54 | 15.8%) account for the highest median family income in Paonia with $124,015 per family, while 3-person families (63 | 18.4%) have the highest median income of $37,770 per family member.
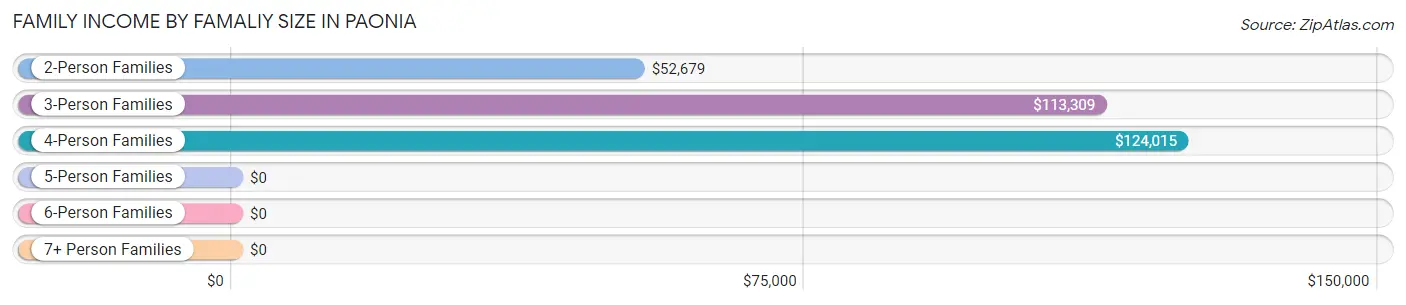
| Income Bracket | # Families | Median Income |
| 2-Person Families | 187 (54.7%) | $52,679 |
| 3-Person Families | 63 (18.4%) | $113,309 |
| 4-Person Families | 54 (15.8%) | $124,015 |
| 5-Person Families | 18 (5.3%) | $0 |
| 6-Person Families | 20 (5.9%) | $0 |
| 7+ Person Families | 0 (0.0%) | $0 |
| Total | 342 (100.0%) | $71,667 |
Family Income by Number of Earners in Paonia
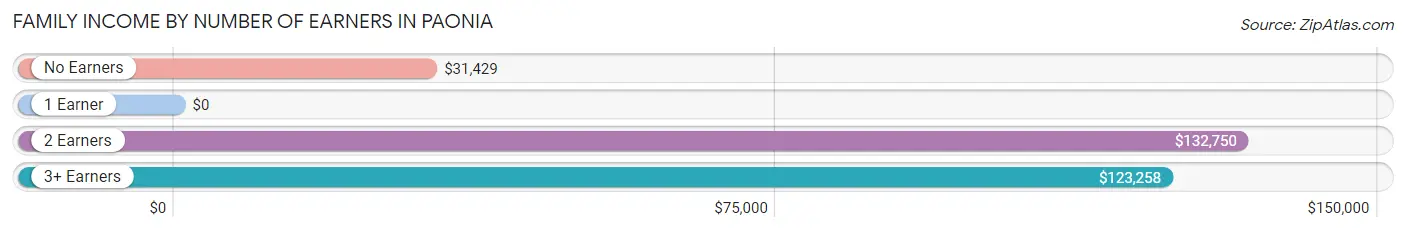
| Number of Earners | # Families | Median Income |
| No Earners | 106 (31.0%) | $31,429 |
| 1 Earner | 83 (24.3%) | $0 |
| 2 Earners | 107 (31.3%) | $132,750 |
| 3+ Earners | 46 (13.5%) | $123,258 |
| Total | 342 (100.0%) | $71,667 |
Household Income in Paonia
Household Income Brackets in Paonia
With 195 households falling in the category, the $100,000 to $149,999 income range is the most frequent in Paonia, accounting for 26.2% of all households. In contrast, only 23 households (3.1%) fall into the $200,000+ income bracket, making it the least populous group.
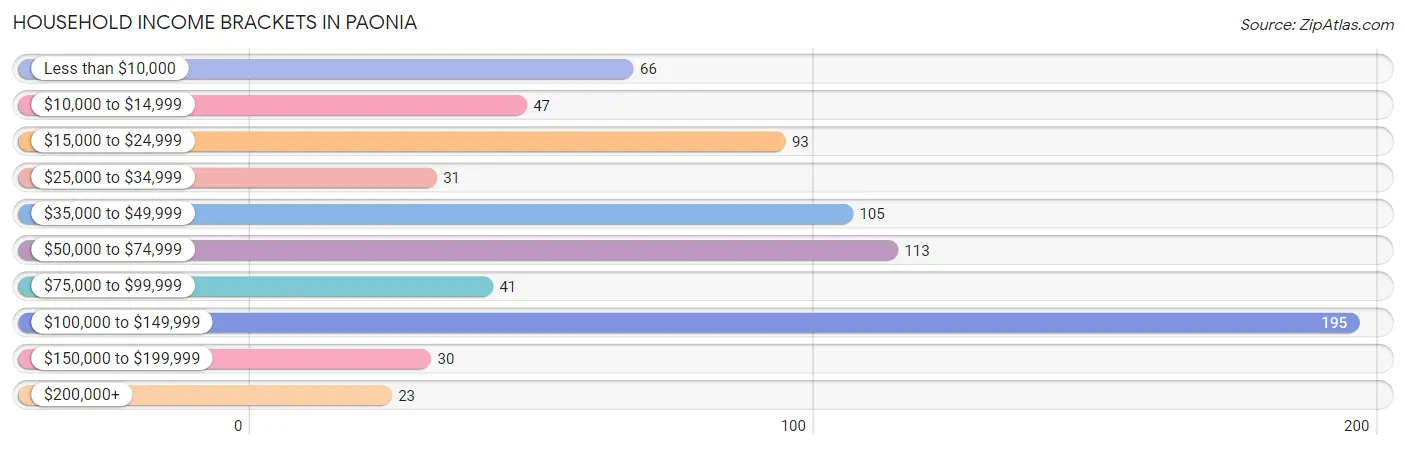
| Income Bracket | # Households | % Households |
| Less than $10,000 | 66 | 8.9% |
| $10,000 to $14,999 | 47 | 6.3% |
| $15,000 to $24,999 | 93 | 12.5% |
| $25,000 to $34,999 | 31 | 4.2% |
| $35,000 to $49,999 | 105 | 14.1% |
| $50,000 to $74,999 | 113 | 15.2% |
| $75,000 to $99,999 | 41 | 5.5% |
| $100,000 to $149,999 | 195 | 26.2% |
| $150,000 to $199,999 | 30 | 4.0% |
| $200,000+ | 23 | 3.1% |
Household Income by Householder Age in Paonia
The median household income in Paonia is $54,643, with the highest median household income of $92,000 found in the 25 to 44 years age bracket for the primary householder. A total of 268 households (36.0%) fall into this category. Meanwhile, the 15 to 24 years age bracket for the primary householder has the lowest median household income of $0, with 16 households (2.1%) in this group.
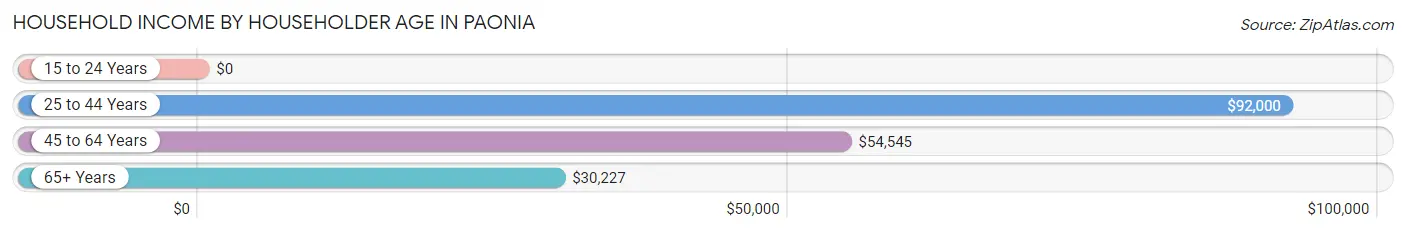
| Income Bracket | # Households | Median Income |
| 15 to 24 Years | 16 (2.1%) | $0 |
| 25 to 44 Years | 268 (36.0%) | $92,000 |
| 45 to 64 Years | 204 (27.4%) | $54,545 |
| 65+ Years | 256 (34.4%) | $30,227 |
| Total | 744 (100.0%) | $54,643 |
Poverty in Paonia
Income Below Poverty by Sex and Age in Paonia
With 12.9% poverty level for males and 17.5% for females among the residents of Paonia, 45 to 54 year old males and 16 and 17 year old females are the most vulnerable to poverty, with 7 males (35.0%) and 13 females (52.0%) in their respective age groups living below the poverty level.
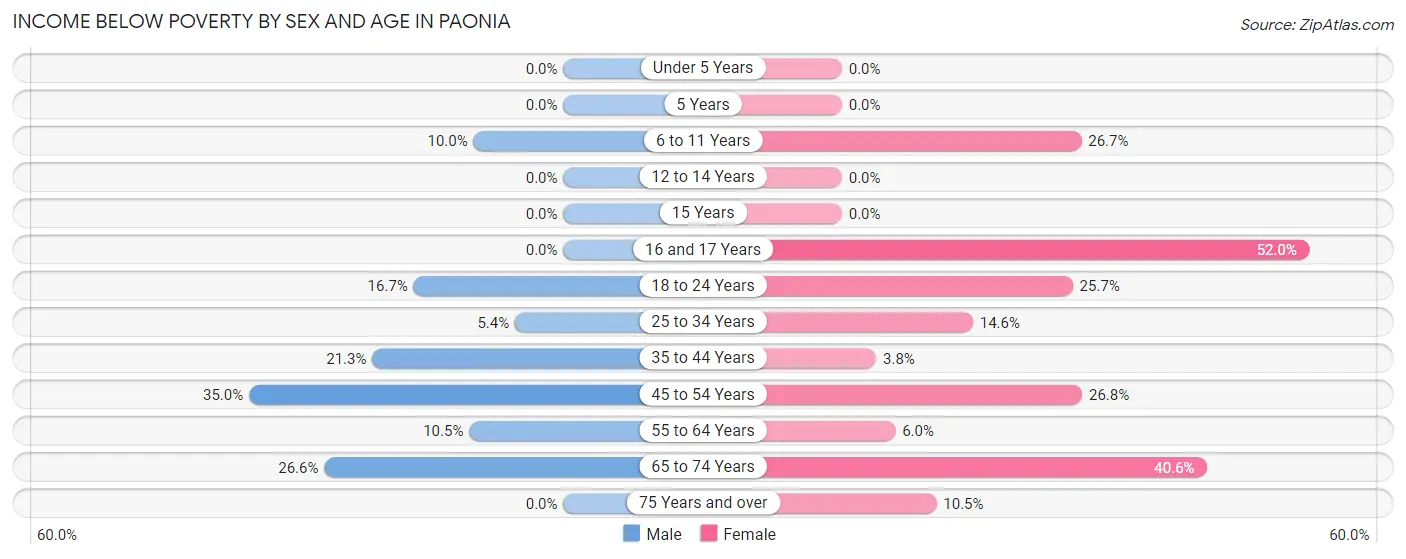
| Age Bracket | Male | Female |
| Under 5 Years | 0 (0.0%) | 0 (0.0%) |
| 5 Years | 0 (0.0%) | 0 (0.0%) |
| 6 to 11 Years | 5 (10.0%) | 4 (26.7%) |
| 12 to 14 Years | 0 (0.0%) | 0 (0.0%) |
| 15 Years | 0 (0.0%) | 0 (0.0%) |
| 16 and 17 Years | 0 (0.0%) | 13 (52.0%) |
| 18 to 24 Years | 4 (16.7%) | 9 (25.7%) |
| 25 to 34 Years | 5 (5.4%) | 27 (14.6%) |
| 35 to 44 Years | 20 (21.3%) | 5 (3.8%) |
| 45 to 54 Years | 7 (35.0%) | 19 (26.8%) |
| 55 to 64 Years | 13 (10.5%) | 5 (5.9%) |
| 65 to 74 Years | 37 (26.6%) | 54 (40.6%) |
| 75 Years and over | 0 (0.0%) | 8 (10.5%) |
| Total | 91 (12.9%) | 144 (17.5%) |
Income Above Poverty by Sex and Age in Paonia
According to the poverty statistics in Paonia, males aged under 5 years and females aged under 5 years are the age groups that are most secure financially, with 100.0% of males and 100.0% of females in these age groups living above the poverty line.
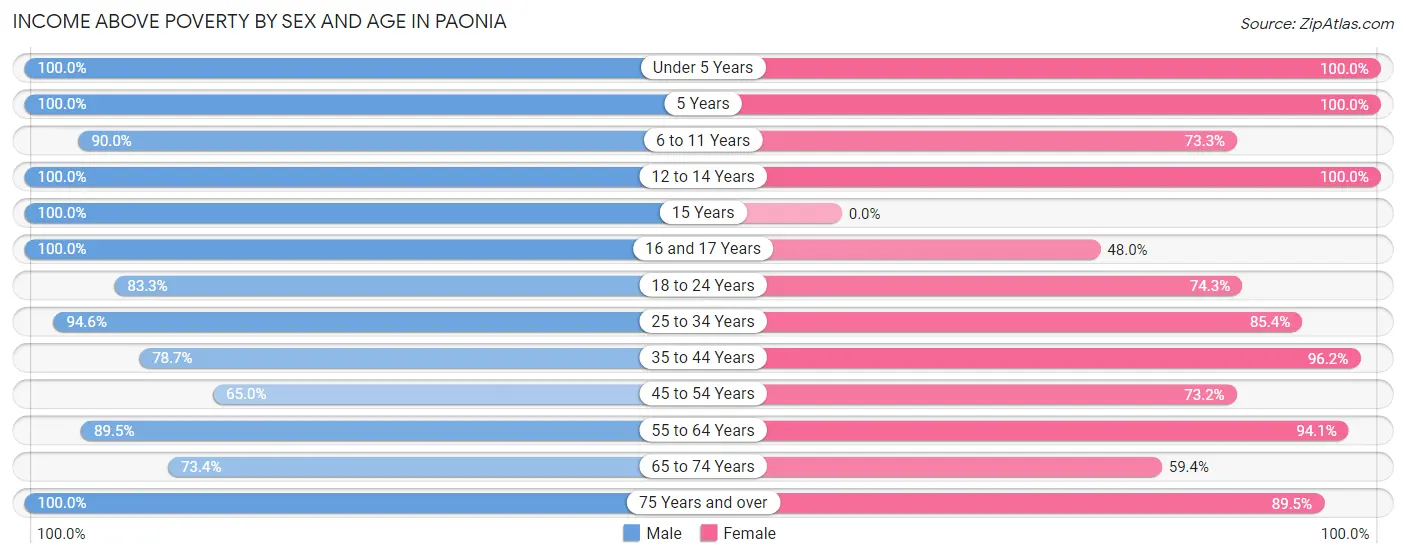
| Age Bracket | Male | Female |
| Under 5 Years | 46 (100.0%) | 50 (100.0%) |
| 5 Years | 10 (100.0%) | 6 (100.0%) |
| 6 to 11 Years | 45 (90.0%) | 11 (73.3%) |
| 12 to 14 Years | 60 (100.0%) | 10 (100.0%) |
| 15 Years | 3 (100.0%) | 0 (0.0%) |
| 16 and 17 Years | 16 (100.0%) | 12 (48.0%) |
| 18 to 24 Years | 20 (83.3%) | 26 (74.3%) |
| 25 to 34 Years | 88 (94.6%) | 158 (85.4%) |
| 35 to 44 Years | 74 (78.7%) | 126 (96.2%) |
| 45 to 54 Years | 13 (65.0%) | 52 (73.2%) |
| 55 to 64 Years | 111 (89.5%) | 79 (94.1%) |
| 65 to 74 Years | 102 (73.4%) | 79 (59.4%) |
| 75 Years and over | 26 (100.0%) | 68 (89.5%) |
| Total | 614 (87.1%) | 677 (82.5%) |
Income Below Poverty Among Married-Couple Families in Paonia
The poverty statistics for married-couple families in Paonia show that 8.3% or 21 of the total 254 families live below the poverty line. Families with 1 or 2 children have the highest poverty rate of 11.5%, comprising of 7 families. On the other hand, families with 3 or 4 children have the lowest poverty rate of 0.0%, which includes 0 families.
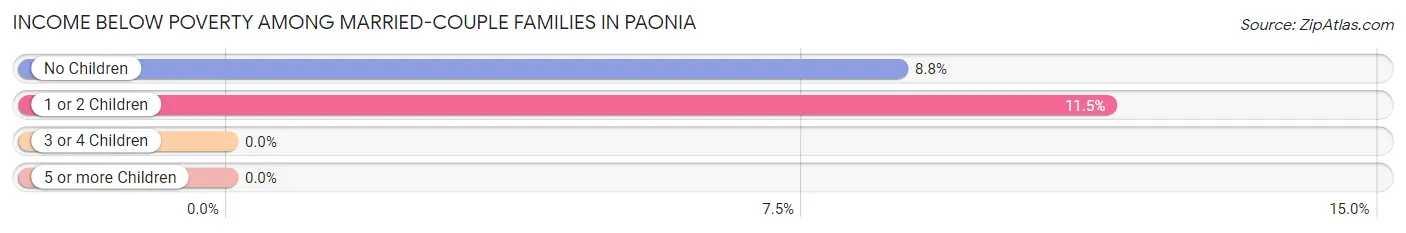
| Children | Above Poverty | Below Poverty |
| No Children | 146 (91.2%) | 14 (8.7%) |
| 1 or 2 Children | 54 (88.5%) | 7 (11.5%) |
| 3 or 4 Children | 33 (100.0%) | 0 (0.0%) |
| 5 or more Children | 0 (0.0%) | 0 (0.0%) |
| Total | 233 (91.7%) | 21 (8.3%) |
Income Below Poverty Among Single-Parent Households in Paonia
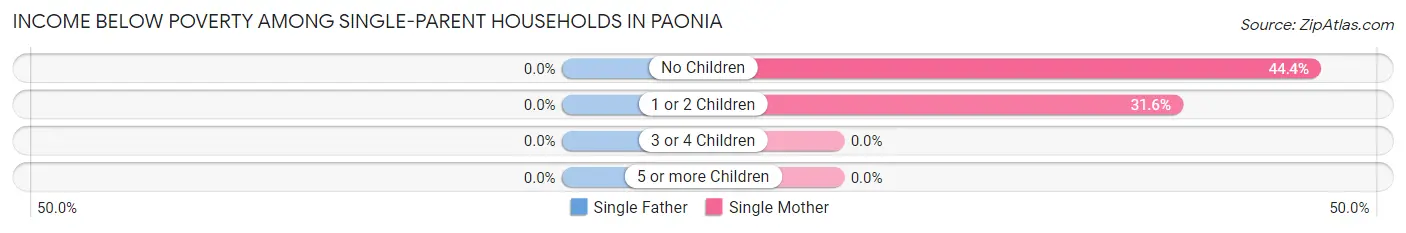
| Children | Single Father | Single Mother |
| No Children | 0 (0.0%) | 4 (44.4%) |
| 1 or 2 Children | 0 (0.0%) | 18 (31.6%) |
| 3 or 4 Children | 0 (0.0%) | 0 (0.0%) |
| 5 or more Children | 0 (0.0%) | 0 (0.0%) |
| Total | 0 (0.0%) | 22 (33.3%) |
Income Below Poverty Among Married-Couple vs Single-Parent Households in Paonia
The poverty data for Paonia shows that 21 of the married-couple family households (8.3%) and 22 of the single-parent households (25.0%) are living below the poverty level. Within the married-couple family households, those with 1 or 2 children have the highest poverty rate, with 7 households (11.5%) falling below the poverty line. Among the single-parent households, those with 1 or 2 children have the highest poverty rate, with 18 household (29.0%) living below poverty.
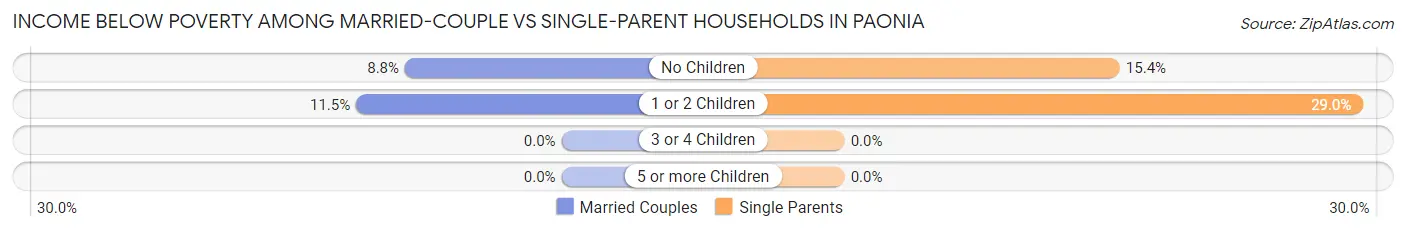
| Children | Married-Couple Families | Single-Parent Households |
| No Children | 14 (8.7%) | 4 (15.4%) |
| 1 or 2 Children | 7 (11.5%) | 18 (29.0%) |
| 3 or 4 Children | 0 (0.0%) | 0 (0.0%) |
| 5 or more Children | 0 (0.0%) | 0 (0.0%) |
| Total | 21 (8.3%) | 22 (25.0%) |
Race in Paonia
The most populous races in Paonia are White / Caucasian (1,360 | 86.6%), Hispanic or Latino (206 | 13.1%), and Two or more Races (133 | 8.5%).
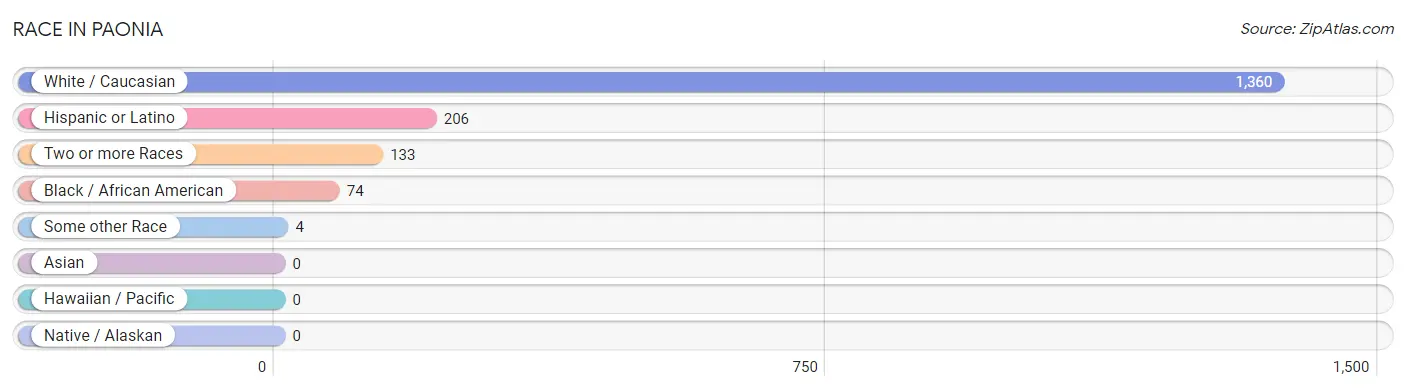
| Race | # Population | % Population |
| Asian | 0 | 0.0% |
| Black / African American | 74 | 4.7% |
| Hawaiian / Pacific | 0 | 0.0% |
| Hispanic or Latino | 206 | 13.1% |
| Native / Alaskan | 0 | 0.0% |
| White / Caucasian | 1,360 | 86.6% |
| Two or more Races | 133 | 8.5% |
| Some other Race | 4 | 0.3% |
| Total | 1,571 | 100.0% |
Ancestry in Paonia
The most populous ancestries reported in Paonia are English (366 | 23.3%), Irish (349 | 22.2%), German (205 | 13.1%), Mexican (168 | 10.7%), and American (117 | 7.4%), together accounting for 76.7% of all Paonia residents.
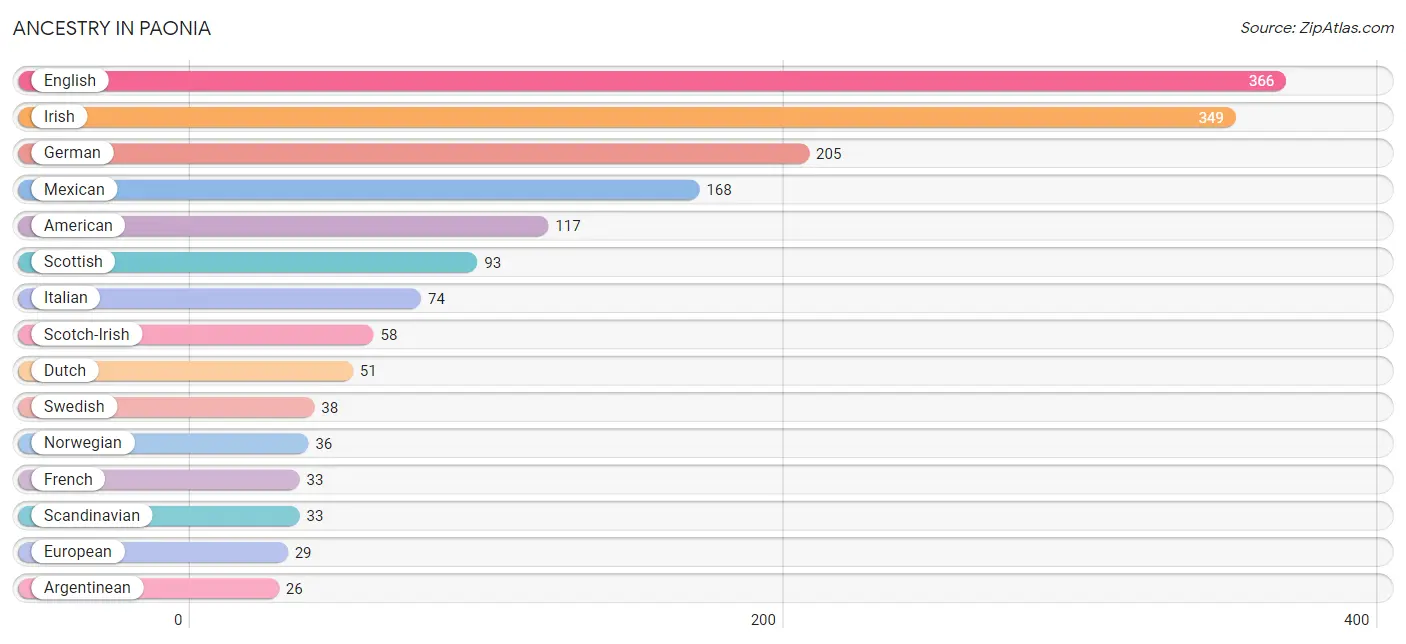
| Ancestry | # Population | % Population |
| American | 117 | 7.4% |
| Argentinean | 26 | 1.7% |
| Austrian | 6 | 0.4% |
| Belgian | 4 | 0.3% |
| British | 9 | 0.6% |
| Bulgarian | 4 | 0.3% |
| Cherokee | 3 | 0.2% |
| Croatian | 17 | 1.1% |
| Czech | 23 | 1.5% |
| Danish | 11 | 0.7% |
| Dutch | 51 | 3.3% |
| English | 366 | 23.3% |
| European | 29 | 1.8% |
| French | 33 | 2.1% |
| French Canadian | 13 | 0.8% |
| German | 205 | 13.1% |
| Hungarian | 3 | 0.2% |
| Irish | 349 | 22.2% |
| Italian | 74 | 4.7% |
| Mexican | 168 | 10.7% |
| Norwegian | 36 | 2.3% |
| Polish | 10 | 0.6% |
| Romanian | 3 | 0.2% |
| Russian | 6 | 0.4% |
| Scandinavian | 33 | 2.1% |
| Scotch-Irish | 58 | 3.7% |
| Scottish | 93 | 5.9% |
| Slovak | 4 | 0.3% |
| South American | 26 | 1.7% |
| Spanish American | 4 | 0.3% |
| Swedish | 38 | 2.4% |
| Welsh | 21 | 1.3% | View All 32 Rows |
Immigrants in Paonia
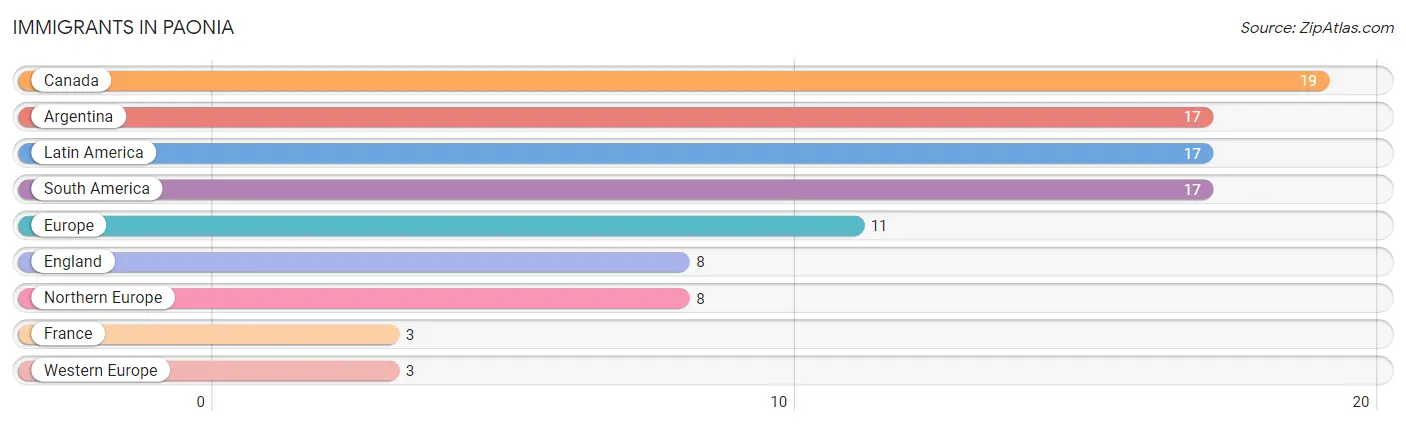
The most numerous immigrant groups reported in Paonia came from Canada (19 | 1.2%), Argentina (17 | 1.1%), Latin America (17 | 1.1%), South America (17 | 1.1%), and Europe (11 | 0.7%), together accounting for 5.1% of all Paonia residents.
| Immigration Origin | # Population | % Population |
| Argentina | 17 | 1.1% |
| Canada | 19 | 1.2% |
| England | 8 | 0.5% |
| Europe | 11 | 0.7% |
| France | 3 | 0.2% |
| Latin America | 17 | 1.1% |
| Northern Europe | 8 | 0.5% |
| South America | 17 | 1.1% |
| Western Europe | 3 | 0.2% | View All 9 Rows |
Sex and Age in Paonia
Sex and Age in Paonia
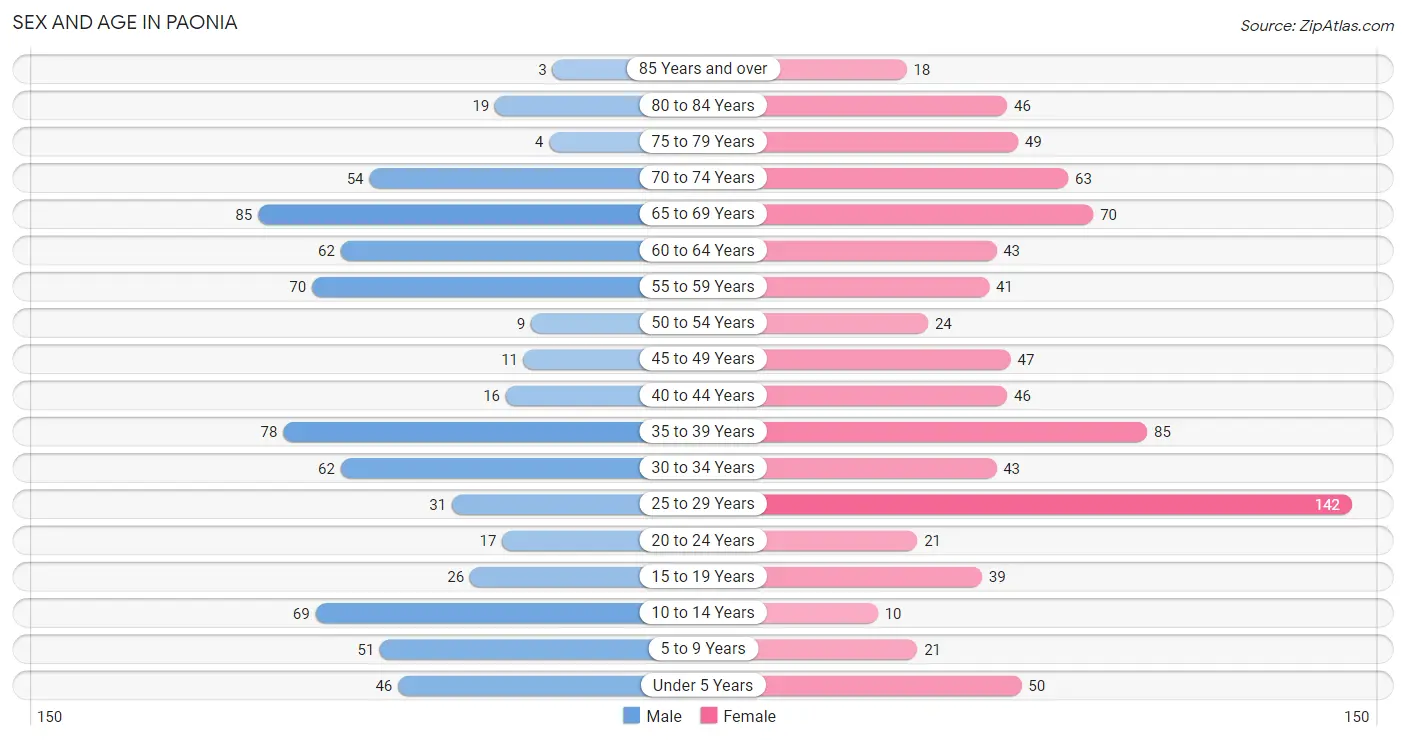
The most populous age groups in Paonia are 65 to 69 Years (85 | 11.9%) for men and 25 to 29 Years (142 | 16.6%) for women.
| Age Bracket | Male | Female |
| Under 5 Years | 46 (6.5%) | 50 (5.8%) |
| 5 to 9 Years | 51 (7.1%) | 21 (2.5%) |
| 10 to 14 Years | 69 (9.7%) | 10 (1.2%) |
| 15 to 19 Years | 26 (3.6%) | 39 (4.5%) |
| 20 to 24 Years | 17 (2.4%) | 21 (2.5%) |
| 25 to 29 Years | 31 (4.3%) | 142 (16.6%) |
| 30 to 34 Years | 62 (8.7%) | 43 (5.0%) |
| 35 to 39 Years | 78 (10.9%) | 85 (9.9%) |
| 40 to 44 Years | 16 (2.2%) | 46 (5.4%) |
| 45 to 49 Years | 11 (1.5%) | 47 (5.5%) |
| 50 to 54 Years | 9 (1.3%) | 24 (2.8%) |
| 55 to 59 Years | 70 (9.8%) | 41 (4.8%) |
| 60 to 64 Years | 62 (8.7%) | 43 (5.0%) |
| 65 to 69 Years | 85 (11.9%) | 70 (8.2%) |
| 70 to 74 Years | 54 (7.6%) | 63 (7.3%) |
| 75 to 79 Years | 4 (0.6%) | 49 (5.7%) |
| 80 to 84 Years | 19 (2.7%) | 46 (5.4%) |
| 85 Years and over | 3 (0.4%) | 18 (2.1%) |
| Total | 713 (100.0%) | 858 (100.0%) |
Families and Households in Paonia
Median Family Size in Paonia
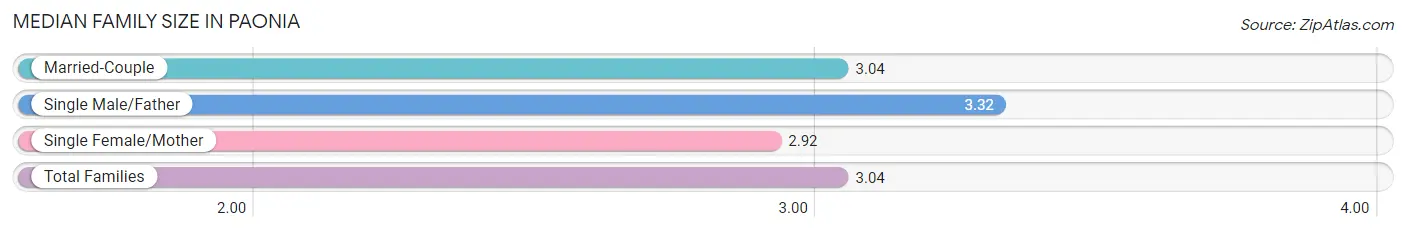
The median family size in Paonia is 3.04 persons per family, with single male/father families (22 | 6.4%) accounting for the largest median family size of 3.32 persons per family. On the other hand, single female/mother families (66 | 19.3%) represent the smallest median family size with 2.92 persons per family.
| Family Type | # Families | Family Size |
| Married-Couple | 254 (74.3%) | 3.04 |
| Single Male/Father | 22 (6.4%) | 3.32 |
| Single Female/Mother | 66 (19.3%) | 2.92 |
| Total Families | 342 (100.0%) | 3.04 |
Median Household Size in Paonia
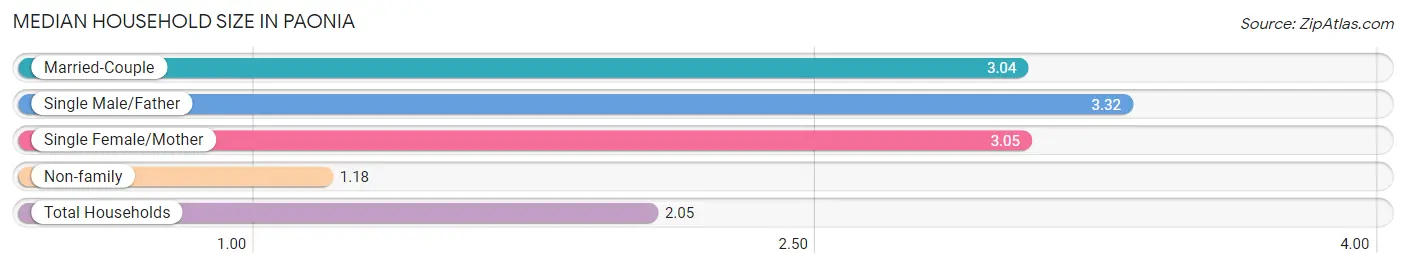
The median household size in Paonia is 2.05 persons per household, with single male/father households (22 | 3.0%) accounting for the largest median household size of 3.32 persons per household. non-family households (402 | 54.0%) represent the smallest median household size with 1.18 persons per household.
| Household Type | # Households | Household Size |
| Married-Couple | 254 (34.1%) | 3.04 |
| Single Male/Father | 22 (3.0%) | 3.32 |
| Single Female/Mother | 66 (8.9%) | 3.05 |
| Non-family | 402 (54.0%) | 1.18 |
| Total Households | 744 (100.0%) | 2.05 |
Household Size by Marriage Status in Paonia
Out of a total of 744 households in Paonia, 342 (46.0%) are family households, while 402 (54.0%) are nonfamily households. The most numerous type of family households are 2-person households, comprising 175, and the most common type of nonfamily households are 1-person households, comprising 351.
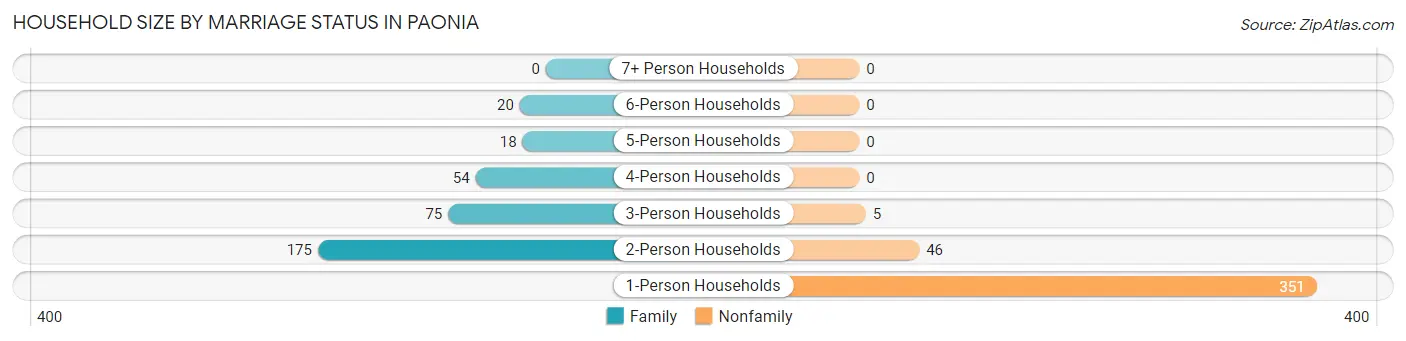
| Household Size | Family Households | Nonfamily Households |
| 1-Person Households | - | 351 (47.2%) |
| 2-Person Households | 175 (23.5%) | 46 (6.2%) |
| 3-Person Households | 75 (10.1%) | 5 (0.7%) |
| 4-Person Households | 54 (7.3%) | 0 (0.0%) |
| 5-Person Households | 18 (2.4%) | 0 (0.0%) |
| 6-Person Households | 20 (2.7%) | 0 (0.0%) |
| 7+ Person Households | 0 (0.0%) | 0 (0.0%) |
| Total | 342 (46.0%) | 402 (54.0%) |
Female Fertility in Paonia
Fertility by Age in Paonia
Average fertility rate in Paonia is 140.0 births per 1,000 women. Women in the age bracket of 35 to 50 years have the highest fertility rate with 324.0 births per 1,000 women. Women in the age bracket of 35 to 50 years acount for 100.0% of all women with births.
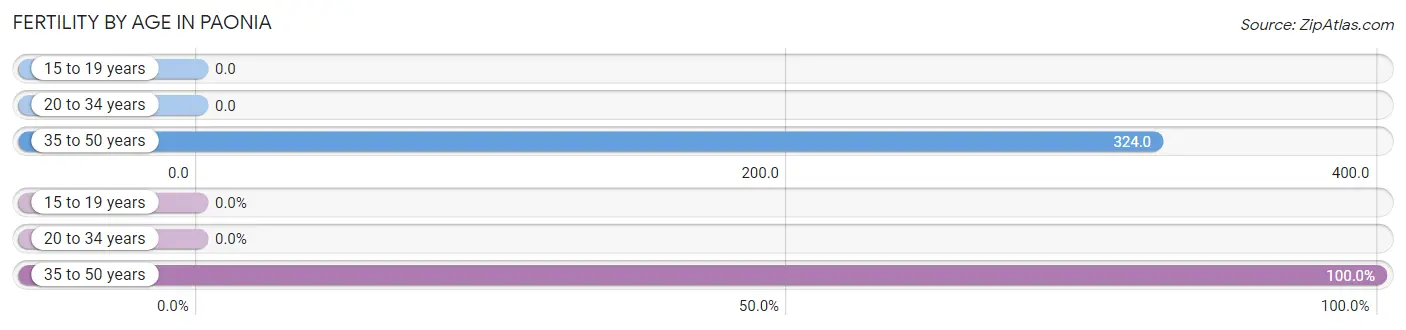
| Age Bracket | Women with Births | Births / 1,000 Women |
| 15 to 19 years | 0 (0.0%) | 0.0 |
| 20 to 34 years | 0 (0.0%) | 0.0 |
| 35 to 50 years | 60 (100.0%) | 324.0 |
| Total | 60 (100.0%) | 140.0 |
Fertility by Age by Marriage Status in Paonia
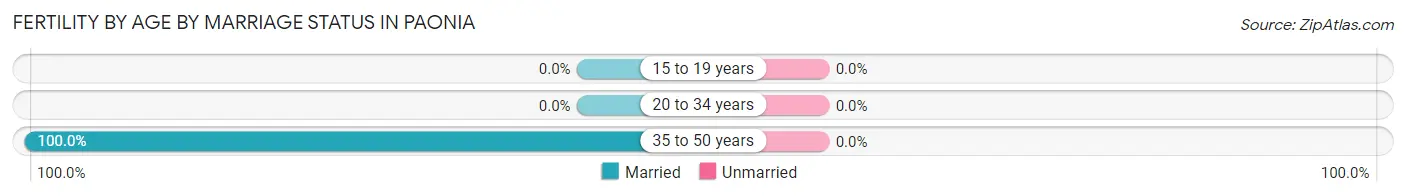
| Age Bracket | Married | Unmarried |
| 15 to 19 years | 0 (0.0%) | 0 (0.0%) |
| 20 to 34 years | 0 (0.0%) | 0 (0.0%) |
| 35 to 50 years | 60 (100.0%) | 0 (0.0%) |
| Total | 60 (100.0%) | 0 (0.0%) |
Fertility by Education in Paonia
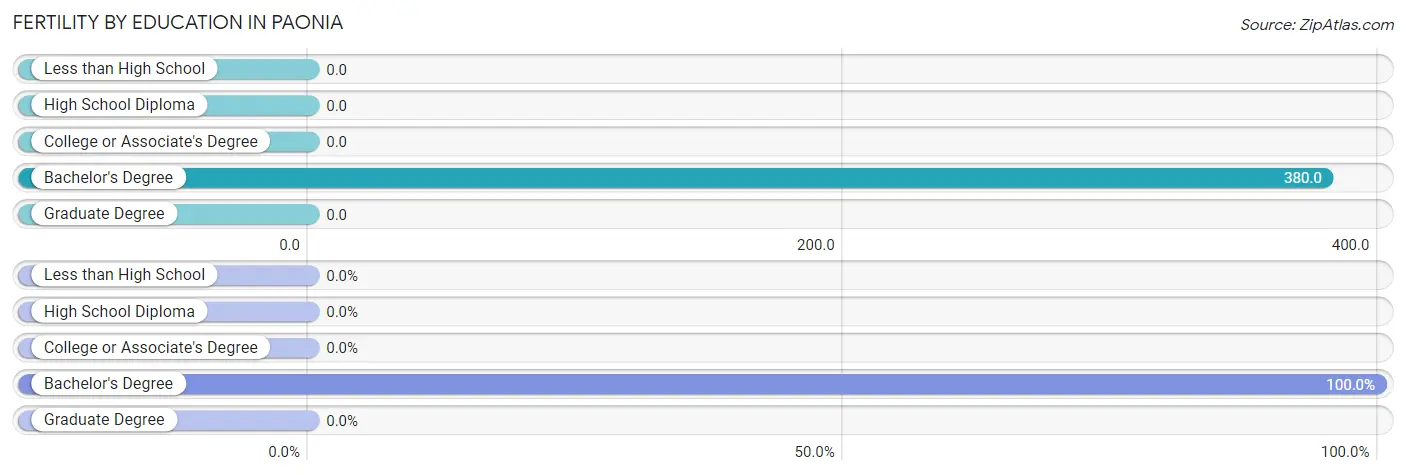
| Educational Attainment | Women with Births | Births / 1,000 Women |
| Less than High School | 0 (0.0%) | 0.0 |
| High School Diploma | 0 (0.0%) | 0.0 |
| College or Associate's Degree | 0 (0.0%) | 0.0 |
| Bachelor's Degree | 60 (100.0%) | 380.0 |
| Graduate Degree | 0 (0.0%) | 0.0 |
| Total | 60 (100.0%) | 140.0 |
Fertility by Education by Marriage Status in Paonia
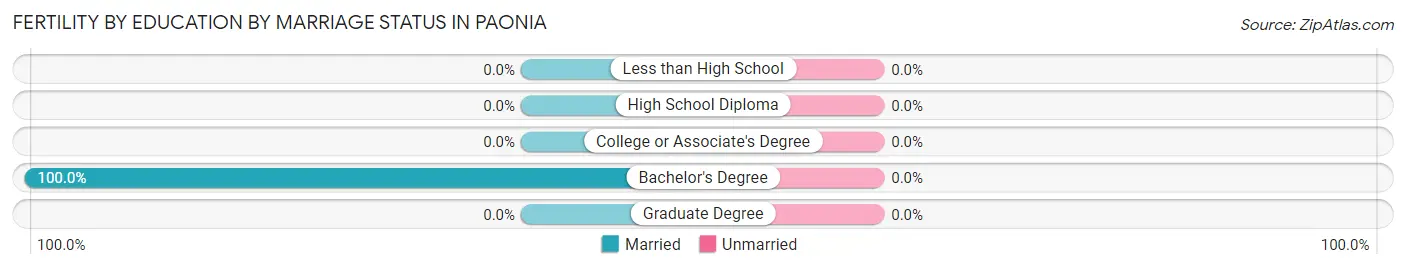
| Educational Attainment | Married | Unmarried |
| Less than High School | 0 (0.0%) | 0 (0.0%) |
| High School Diploma | 0 (0.0%) | 0 (0.0%) |
| College or Associate's Degree | 0 (0.0%) | 0 (0.0%) |
| Bachelor's Degree | 60 (100.0%) | 0 (0.0%) |
| Graduate Degree | 0 (0.0%) | 0 (0.0%) |
| Total | 60 (100.0%) | 0 (0.0%) |
Employment Characteristics in Paonia
Employment by Class of Employer in Paonia
Among the 717 employed individuals in Paonia, private company employees (361 | 50.3%), local government employees (121 | 16.9%), and not-for-profit organizations (84 | 11.7%) make up the most common classes of employment.
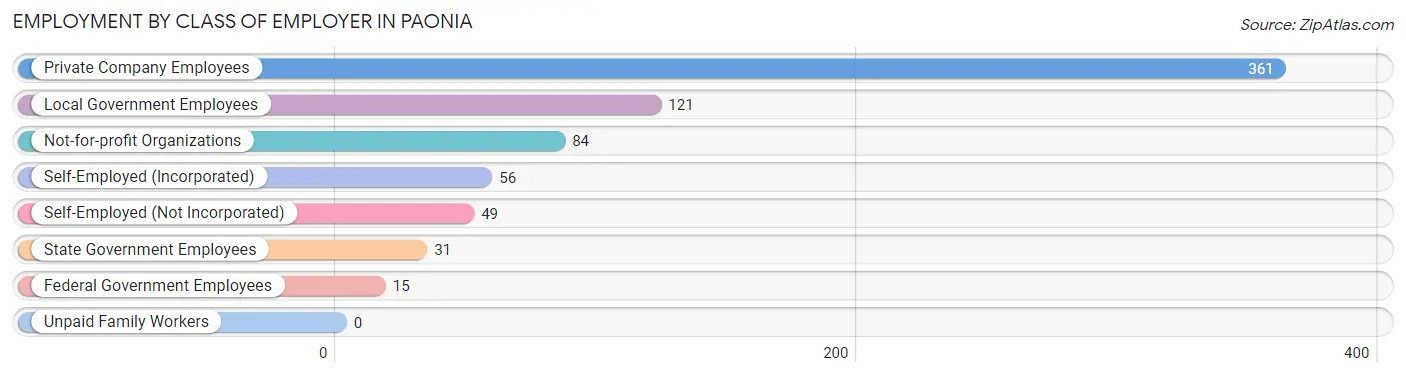
| Employer Class | # Employees | % Employees |
| Private Company Employees | 361 | 50.3% |
| Self-Employed (Incorporated) | 56 | 7.8% |
| Self-Employed (Not Incorporated) | 49 | 6.8% |
| Not-for-profit Organizations | 84 | 11.7% |
| Local Government Employees | 121 | 16.9% |
| State Government Employees | 31 | 4.3% |
| Federal Government Employees | 15 | 2.1% |
| Unpaid Family Workers | 0 | 0.0% |
| Total | 717 | 100.0% |
Employment Status by Age in Paonia
According to the labor force statistics for Paonia, out of the total population over 16 years of age (1,321), 57.8% or 764 individuals are in the labor force, with 6.2% or 47 of them unemployed. The age group with the highest labor force participation rate is 20 to 24 years, with 100.0% or 38 individuals in the labor force. Within the labor force, the 20 to 24 years age range has the highest percentage of unemployed individuals, with 21.1% or 8 of them being unemployed.
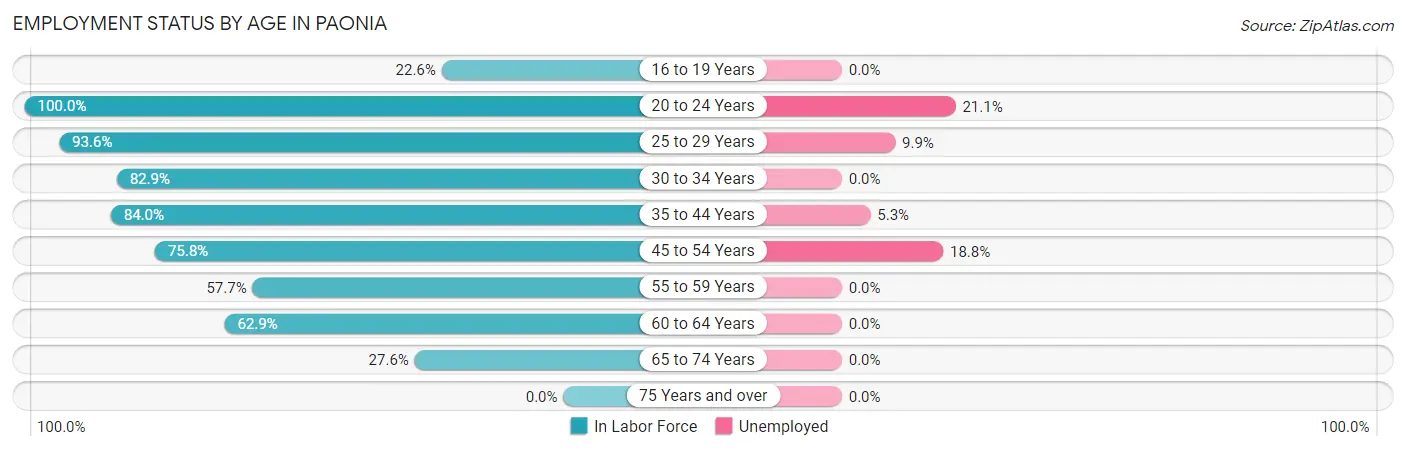
| Age Bracket | In Labor Force | Unemployed |
| 16 to 19 Years | 14 (22.6%) | 0 (0.0%) |
| 20 to 24 Years | 38 (100.0%) | 8 (21.1%) |
| 25 to 29 Years | 162 (93.6%) | 16 (9.9%) |
| 30 to 34 Years | 87 (82.9%) | 0 (0.0%) |
| 35 to 44 Years | 189 (84.0%) | 10 (5.3%) |
| 45 to 54 Years | 69 (75.8%) | 13 (18.8%) |
| 55 to 59 Years | 64 (57.7%) | 0 (0.0%) |
| 60 to 64 Years | 66 (62.9%) | 0 (0.0%) |
| 65 to 74 Years | 75 (27.6%) | 0 (0.0%) |
| 75 Years and over | 0 (0.0%) | 0 (0.0%) |
| Total | 764 (57.8%) | 47 (6.2%) |
Employment Status by Educational Attainment in Paonia
According to labor force statistics for Paonia, 78.6% of individuals (637) out of the total population between 25 and 64 years of age (810) are in the labor force, with 6.1% or 39 of them being unemployed. The group with the highest labor force participation rate are those with the educational attainment of bachelor's degree or higher, with 98.5% or 327 individuals in the labor force. Within the labor force, individuals with high school diploma education have the highest percentage of unemployment, with 23.2% or 13 of them being unemployed.
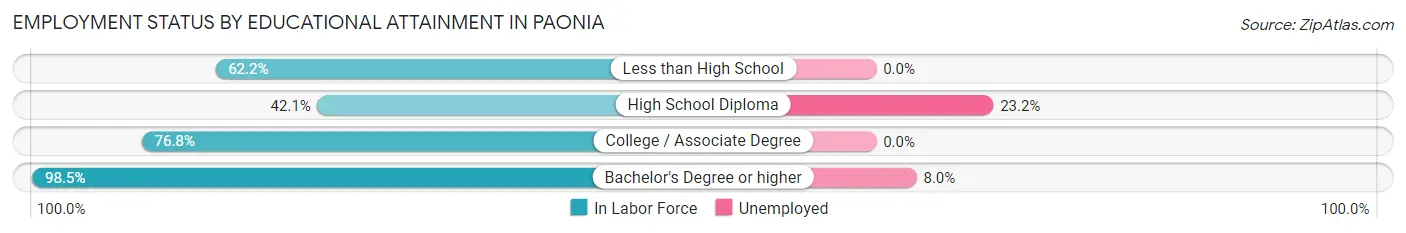
| Educational Attainment | In Labor Force | Unemployed |
| Less than High School | 46 (62.2%) | 0 (0.0%) |
| High School Diploma | 56 (42.1%) | 31 (23.2%) |
| College / Associate Degree | 208 (76.8%) | 0 (0.0%) |
| Bachelor's Degree or higher | 327 (98.5%) | 27 (8.0%) |
| Total | 637 (78.6%) | 49 (6.1%) |
Employment Occupations by Sex in Paonia
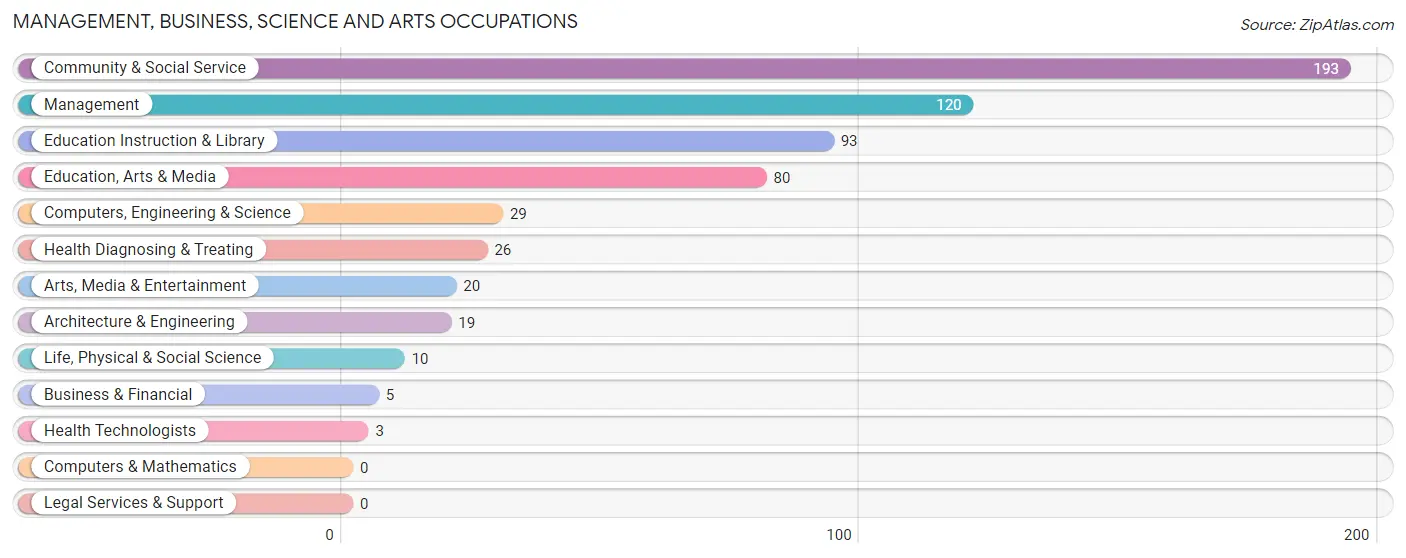
Management, Business, Science and Arts Occupations
The most common Management, Business, Science and Arts occupations in Paonia are Community & Social Service (193 | 26.9%), Management (120 | 16.7%), Education Instruction & Library (93 | 13.0%), Education, Arts & Media (80 | 11.2%), and Computers, Engineering & Science (29 | 4.0%).
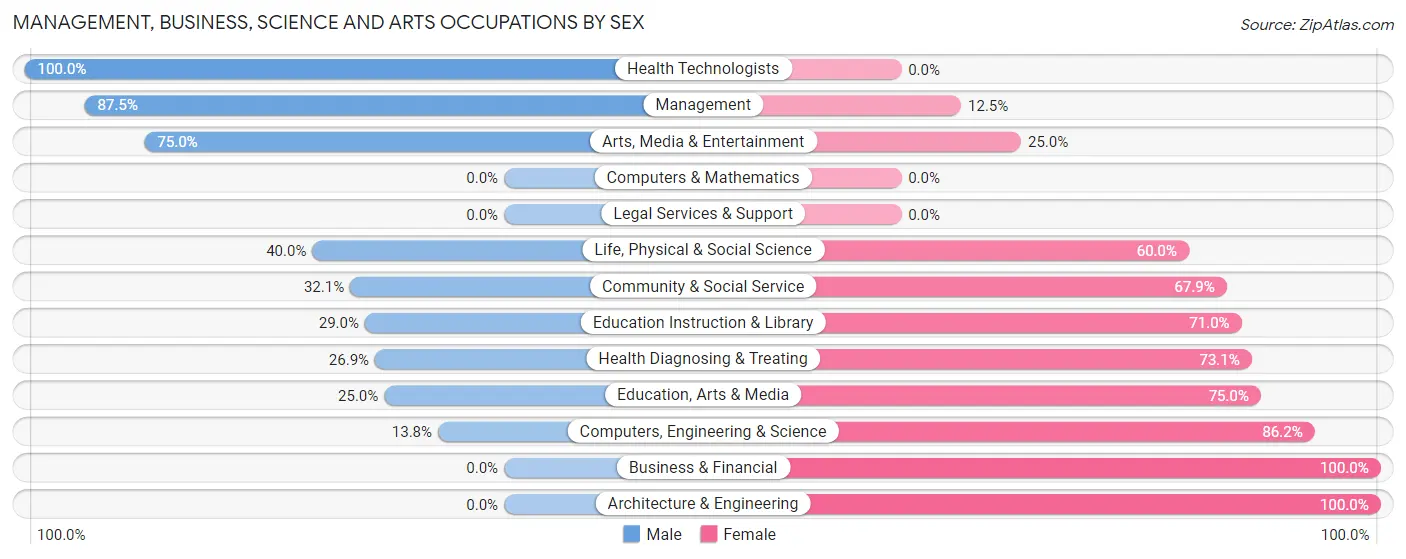
Management, Business, Science and Arts Occupations by Sex
Within the Management, Business, Science and Arts occupations in Paonia, the most male-oriented occupations are Health Technologists (100.0%), Management (87.5%), and Arts, Media & Entertainment (75.0%), while the most female-oriented occupations are Business & Financial (100.0%), Architecture & Engineering (100.0%), and Computers, Engineering & Science (86.2%).
| Occupation | Male | Female |
| Management | 105 (87.5%) | 15 (12.5%) |
| Business & Financial | 0 (0.0%) | 5 (100.0%) |
| Computers, Engineering & Science | 4 (13.8%) | 25 (86.2%) |
| Computers & Mathematics | 0 (0.0%) | 0 (0.0%) |
| Architecture & Engineering | 0 (0.0%) | 19 (100.0%) |
| Life, Physical & Social Science | 4 (40.0%) | 6 (60.0%) |
| Community & Social Service | 62 (32.1%) | 131 (67.9%) |
| Education, Arts & Media | 20 (25.0%) | 60 (75.0%) |
| Legal Services & Support | 0 (0.0%) | 0 (0.0%) |
| Education Instruction & Library | 27 (29.0%) | 66 (71.0%) |
| Arts, Media & Entertainment | 15 (75.0%) | 5 (25.0%) |
| Health Diagnosing & Treating | 7 (26.9%) | 19 (73.1%) |
| Health Technologists | 3 (100.0%) | 0 (0.0%) |
| Total (Category) | 178 (47.7%) | 195 (52.3%) |
| Total (Overall) | 282 (39.3%) | 435 (60.7%) |
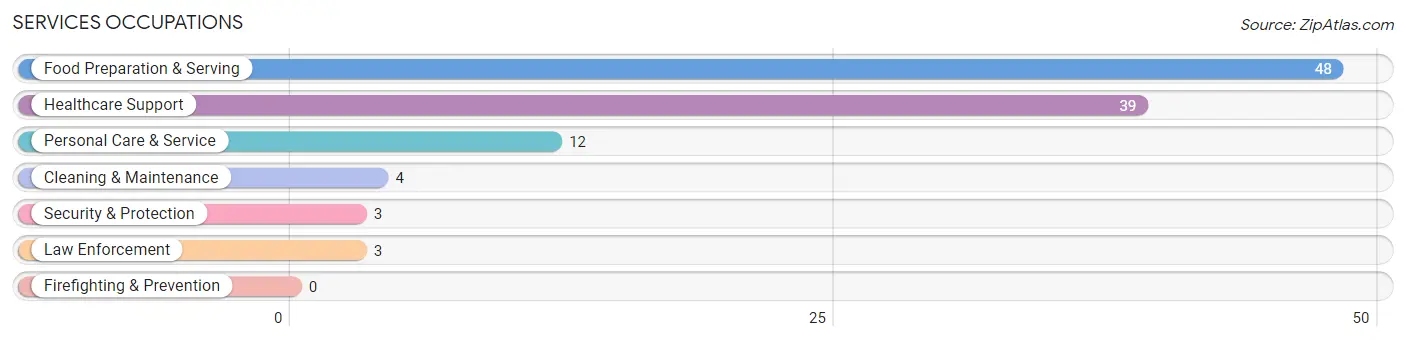
Services Occupations
The most common Services occupations in Paonia are Food Preparation & Serving (48 | 6.7%), Healthcare Support (39 | 5.4%), Personal Care & Service (12 | 1.7%), Cleaning & Maintenance (4 | 0.6%), and Security & Protection (3 | 0.4%).
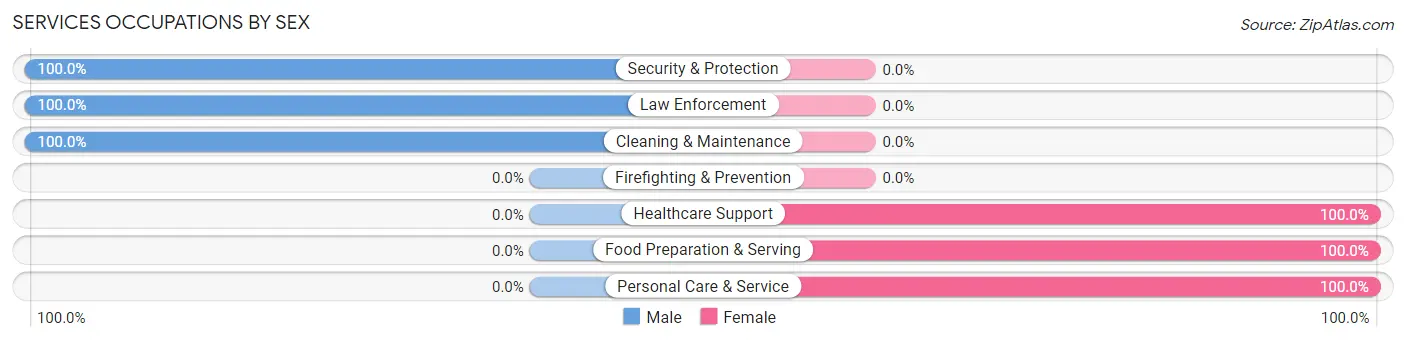
Services Occupations by Sex
Within the Services occupations in Paonia, the most male-oriented occupations are Security & Protection (100.0%), Law Enforcement (100.0%), and Cleaning & Maintenance (100.0%), while the most female-oriented occupations are Healthcare Support (100.0%), Food Preparation & Serving (100.0%), and Personal Care & Service (100.0%).
| Occupation | Male | Female |
| Healthcare Support | 0 (0.0%) | 39 (100.0%) |
| Security & Protection | 3 (100.0%) | 0 (0.0%) |
| Firefighting & Prevention | 0 (0.0%) | 0 (0.0%) |
| Law Enforcement | 3 (100.0%) | 0 (0.0%) |
| Food Preparation & Serving | 0 (0.0%) | 48 (100.0%) |
| Cleaning & Maintenance | 4 (100.0%) | 0 (0.0%) |
| Personal Care & Service | 0 (0.0%) | 12 (100.0%) |
| Total (Category) | 7 (6.6%) | 99 (93.4%) |
| Total (Overall) | 282 (39.3%) | 435 (60.7%) |
Sales and Office Occupations
The most common Sales and Office occupations in Paonia are Sales & Related (35 | 4.9%), and Office & Administration (18 | 2.5%).

Sales and Office Occupations by Sex
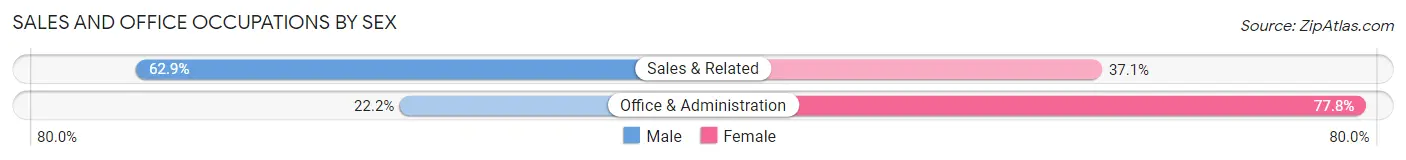
| Occupation | Male | Female |
| Sales & Related | 22 (62.9%) | 13 (37.1%) |
| Office & Administration | 4 (22.2%) | 14 (77.8%) |
| Total (Category) | 26 (49.1%) | 27 (50.9%) |
| Total (Overall) | 282 (39.3%) | 435 (60.7%) |
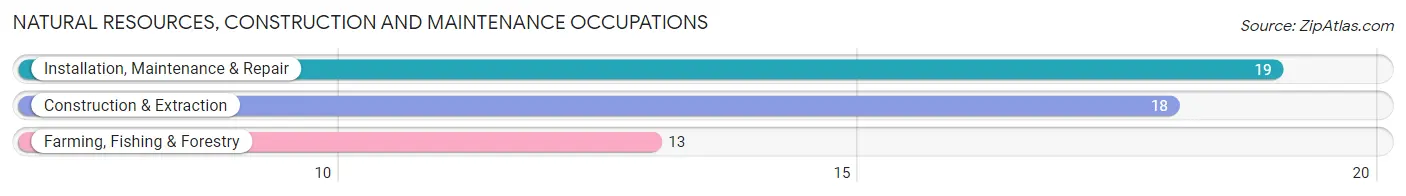
Natural Resources, Construction and Maintenance Occupations
The most common Natural Resources, Construction and Maintenance occupations in Paonia are Installation, Maintenance & Repair (19 | 2.6%), Construction & Extraction (18 | 2.5%), and Farming, Fishing & Forestry (13 | 1.8%).
Natural Resources, Construction and Maintenance Occupations by Sex
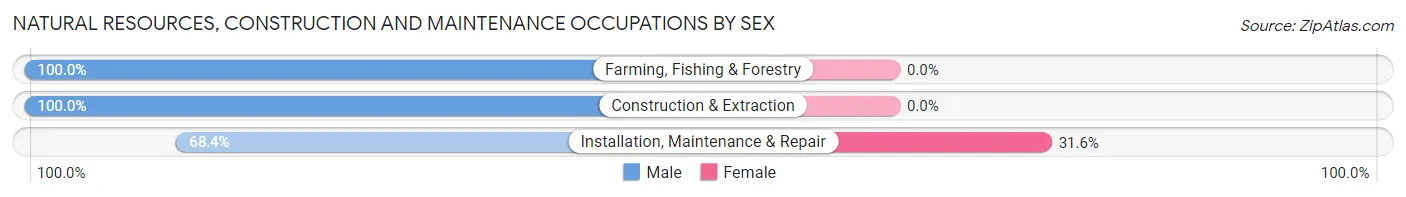
| Occupation | Male | Female |
| Farming, Fishing & Forestry | 13 (100.0%) | 0 (0.0%) |
| Construction & Extraction | 18 (100.0%) | 0 (0.0%) |
| Installation, Maintenance & Repair | 13 (68.4%) | 6 (31.6%) |
| Total (Category) | 44 (88.0%) | 6 (12.0%) |
| Total (Overall) | 282 (39.3%) | 435 (60.7%) |
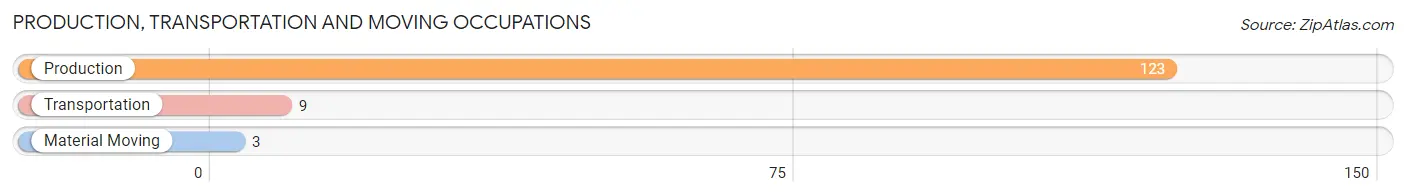
Production, Transportation and Moving Occupations
The most common Production, Transportation and Moving occupations in Paonia are Production (123 | 17.2%), Transportation (9 | 1.3%), and Material Moving (3 | 0.4%).
Production, Transportation and Moving Occupations by Sex
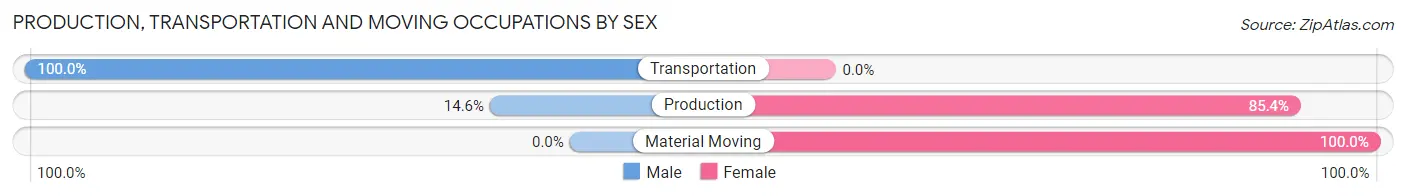
| Occupation | Male | Female |
| Production | 18 (14.6%) | 105 (85.4%) |
| Transportation | 9 (100.0%) | 0 (0.0%) |
| Material Moving | 0 (0.0%) | 3 (100.0%) |
| Total (Category) | 27 (20.0%) | 108 (80.0%) |
| Total (Overall) | 282 (39.3%) | 435 (60.7%) |
Employment Industries by Sex in Paonia
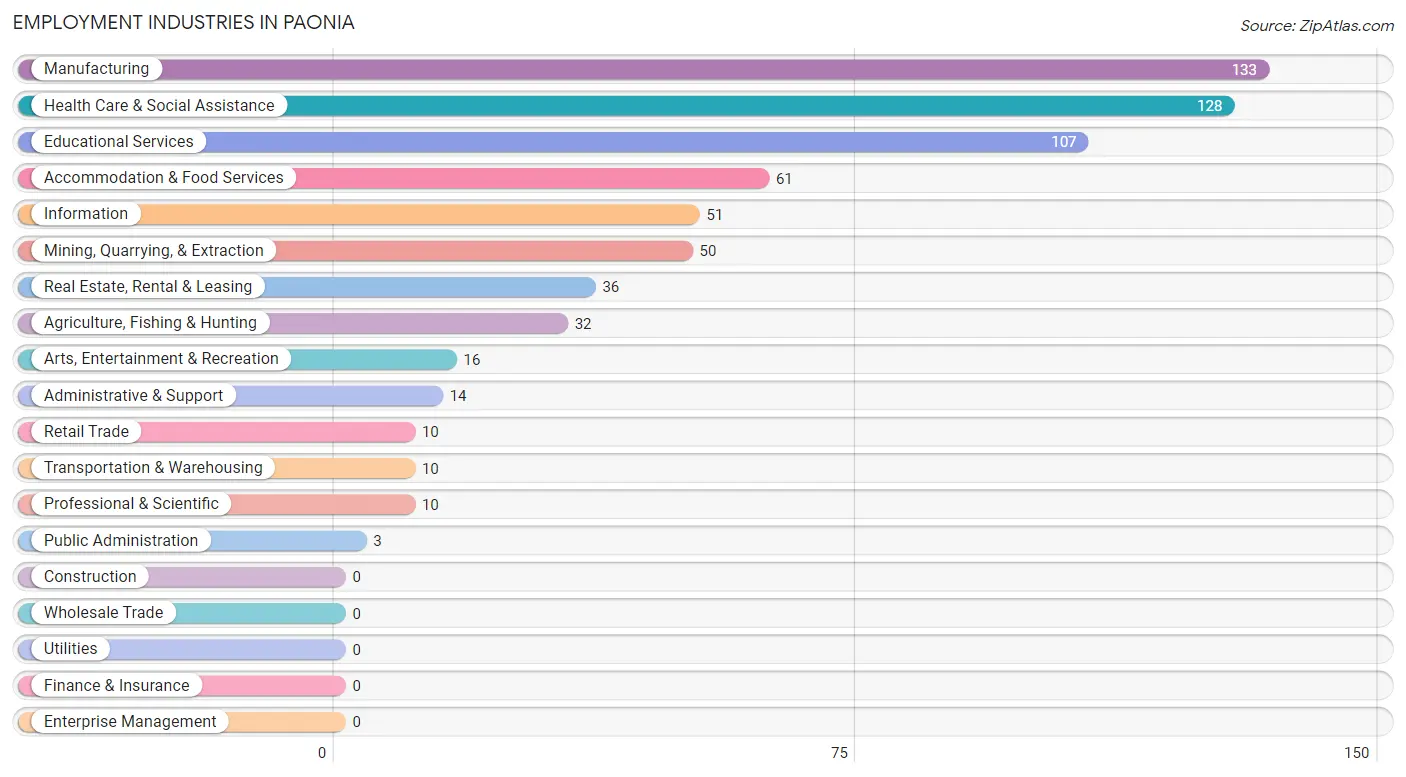
Employment Industries in Paonia
The major employment industries in Paonia include Manufacturing (133 | 18.5%), Health Care & Social Assistance (128 | 17.8%), Educational Services (107 | 14.9%), Accommodation & Food Services (61 | 8.5%), and Information (51 | 7.1%).
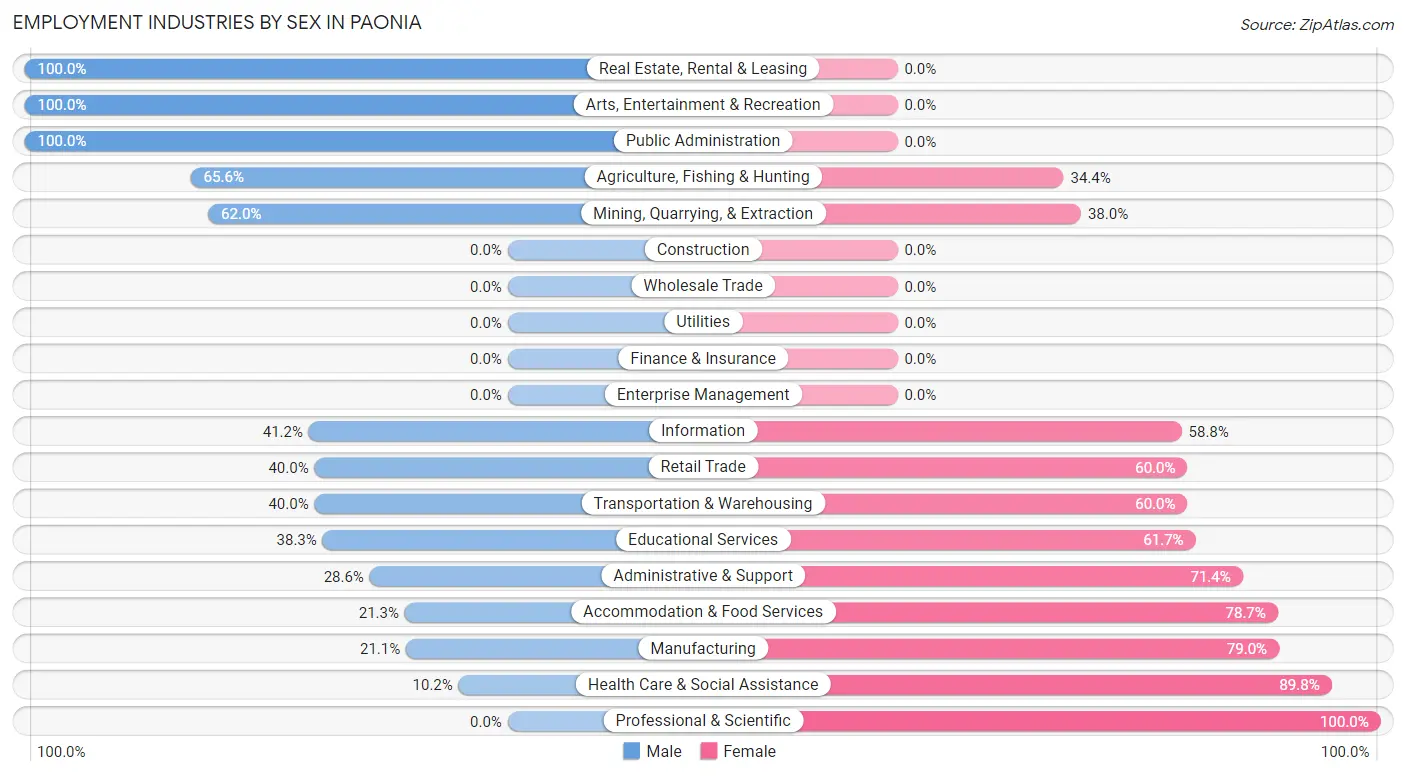
Employment Industries by Sex in Paonia
The Paonia industries that see more men than women are Real Estate, Rental & Leasing (100.0%), Arts, Entertainment & Recreation (100.0%), and Public Administration (100.0%), whereas the industries that tend to have a higher number of women are Professional & Scientific (100.0%), Health Care & Social Assistance (89.8%), and Manufacturing (78.9%).
| Industry | Male | Female |
| Agriculture, Fishing & Hunting | 21 (65.6%) | 11 (34.4%) |
| Mining, Quarrying, & Extraction | 31 (62.0%) | 19 (38.0%) |
| Construction | 0 (0.0%) | 0 (0.0%) |
| Manufacturing | 28 (21.0%) | 105 (78.9%) |
| Wholesale Trade | 0 (0.0%) | 0 (0.0%) |
| Retail Trade | 4 (40.0%) | 6 (60.0%) |
| Transportation & Warehousing | 4 (40.0%) | 6 (60.0%) |
| Utilities | 0 (0.0%) | 0 (0.0%) |
| Information | 21 (41.2%) | 30 (58.8%) |
| Finance & Insurance | 0 (0.0%) | 0 (0.0%) |
| Real Estate, Rental & Leasing | 36 (100.0%) | 0 (0.0%) |
| Professional & Scientific | 0 (0.0%) | 10 (100.0%) |
| Enterprise Management | 0 (0.0%) | 0 (0.0%) |
| Administrative & Support | 4 (28.6%) | 10 (71.4%) |
| Educational Services | 41 (38.3%) | 66 (61.7%) |
| Health Care & Social Assistance | 13 (10.2%) | 115 (89.8%) |
| Arts, Entertainment & Recreation | 16 (100.0%) | 0 (0.0%) |
| Accommodation & Food Services | 13 (21.3%) | 48 (78.7%) |
| Public Administration | 3 (100.0%) | 0 (0.0%) |
| Total | 282 (39.3%) | 435 (60.7%) |
Education in Paonia
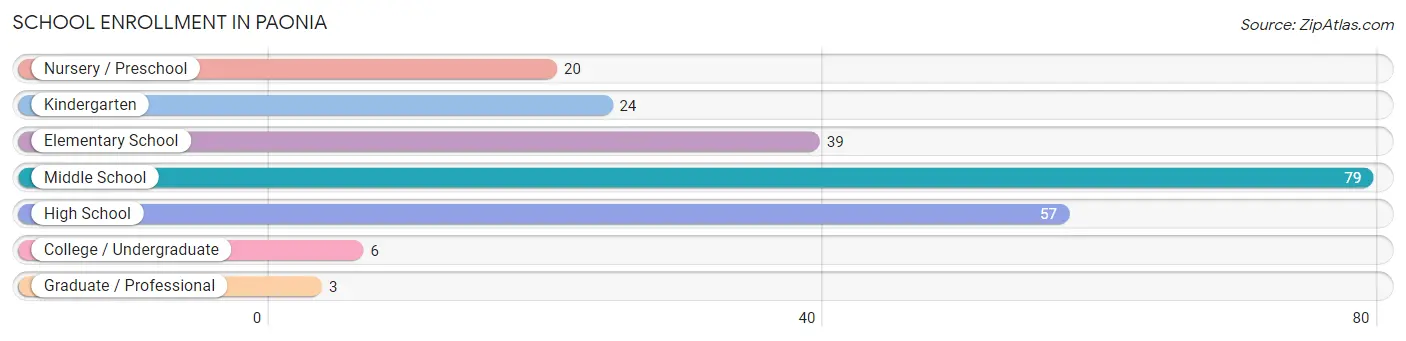
School Enrollment in Paonia
The most common levels of schooling among the 228 students in Paonia are middle school (79 | 34.6%), high school (57 | 25.0%), and elementary school (39 | 17.1%).
| School Level | # Students | % Students |
| Nursery / Preschool | 20 | 8.8% |
| Kindergarten | 24 | 10.5% |
| Elementary School | 39 | 17.1% |
| Middle School | 79 | 34.6% |
| High School | 57 | 25.0% |
| College / Undergraduate | 6 | 2.6% |
| Graduate / Professional | 3 | 1.3% |
| Total | 228 | 100.0% |
School Enrollment by Age by Funding Source in Paonia
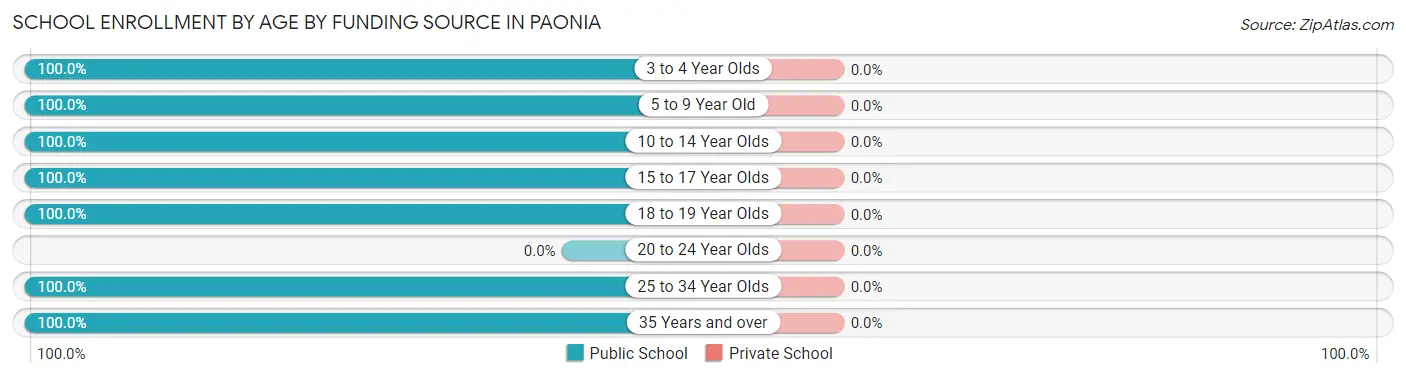
| Age Bracket | Public School | Private School |
| 3 to 4 Year Olds | 20 (100.0%) | 0 (0.0%) |
| 5 to 9 Year Old | 63 (100.0%) | 0 (0.0%) |
| 10 to 14 Year Olds | 79 (100.0%) | 0 (0.0%) |
| 15 to 17 Year Olds | 44 (100.0%) | 0 (0.0%) |
| 18 to 19 Year Olds | 13 (100.0%) | 0 (0.0%) |
| 20 to 24 Year Olds | 0 (0.0%) | 0 (0.0%) |
| 25 to 34 Year Olds | 6 (100.0%) | 0 (0.0%) |
| 35 Years and over | 3 (100.0%) | 0 (0.0%) |
| Total | 228 (100.0%) | 0 (0.0%) |
Educational Attainment by Field of Study in Paonia
Social sciences (117 | 22.3%), education (74 | 14.1%), business (42 | 8.0%), physical & health sciences (38 | 7.2%), and multidisciplinary studies (38 | 7.2%) are the most common fields of study among 524 individuals in Paonia who have obtained a bachelor's degree or higher.
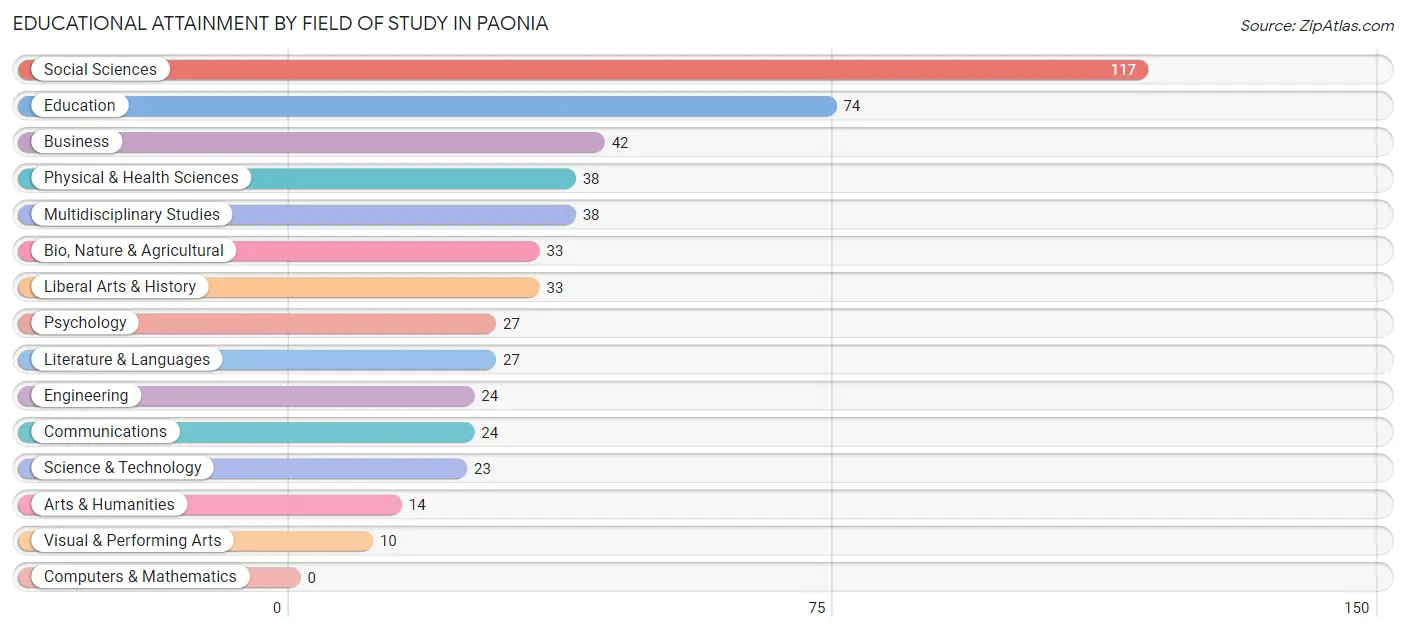
| Field of Study | # Graduates | % Graduates |
| Computers & Mathematics | 0 | 0.0% |
| Bio, Nature & Agricultural | 33 | 6.3% |
| Physical & Health Sciences | 38 | 7.2% |
| Psychology | 27 | 5.1% |
| Social Sciences | 117 | 22.3% |
| Engineering | 24 | 4.6% |
| Multidisciplinary Studies | 38 | 7.2% |
| Science & Technology | 23 | 4.4% |
| Business | 42 | 8.0% |
| Education | 74 | 14.1% |
| Literature & Languages | 27 | 5.1% |
| Liberal Arts & History | 33 | 6.3% |
| Visual & Performing Arts | 10 | 1.9% |
| Communications | 24 | 4.6% |
| Arts & Humanities | 14 | 2.7% |
| Total | 524 | 100.0% |
Transportation & Commute in Paonia
Vehicle Availability by Sex in Paonia
The most prevalent vehicle ownership categories in Paonia are males with 2 vehicles (120, accounting for 42.5%) and females with 2 vehicles (133, making up 27.6%).
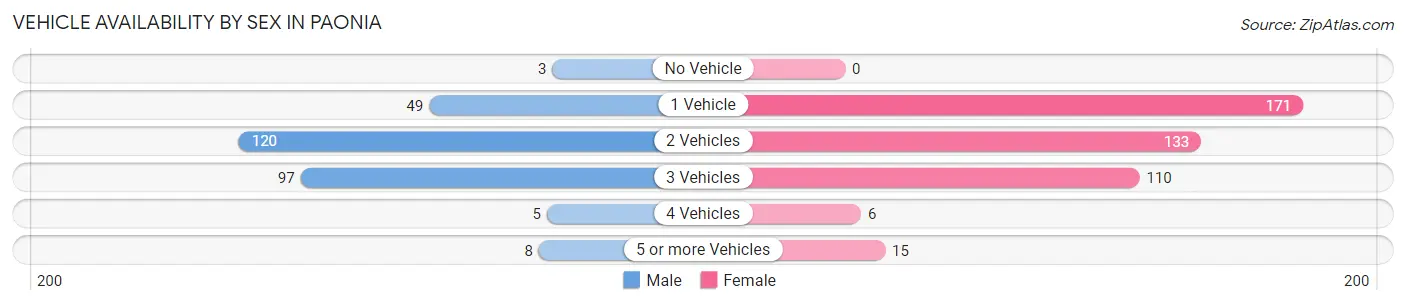
| Vehicles Available | Male | Female |
| No Vehicle | 3 (1.1%) | 0 (0.0%) |
| 1 Vehicle | 49 (17.4%) | 171 (39.3%) |
| 2 Vehicles | 120 (42.5%) | 133 (30.6%) |
| 3 Vehicles | 97 (34.4%) | 110 (25.3%) |
| 4 Vehicles | 5 (1.8%) | 6 (1.4%) |
| 5 or more Vehicles | 8 (2.8%) | 15 (3.5%) |
| Total | 282 (100.0%) | 435 (100.0%) |
Commute Time in Paonia
The most frequently occuring commute durations in Paonia are 5 to 9 minutes (221 commuters, 36.4%), 10 to 14 minutes (111 commuters, 18.3%), and 20 to 24 minutes (77 commuters, 12.7%).
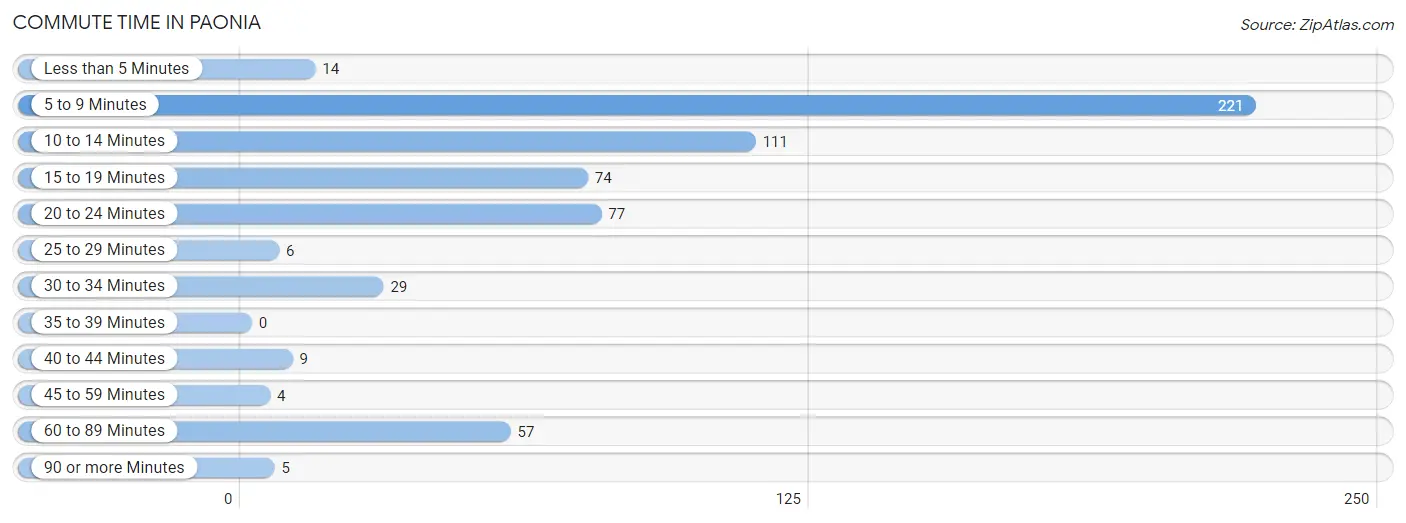
| Commute Time | # Commuters | % Commuters |
| Less than 5 Minutes | 14 | 2.3% |
| 5 to 9 Minutes | 221 | 36.4% |
| 10 to 14 Minutes | 111 | 18.3% |
| 15 to 19 Minutes | 74 | 12.2% |
| 20 to 24 Minutes | 77 | 12.7% |
| 25 to 29 Minutes | 6 | 1.0% |
| 30 to 34 Minutes | 29 | 4.8% |
| 35 to 39 Minutes | 0 | 0.0% |
| 40 to 44 Minutes | 9 | 1.5% |
| 45 to 59 Minutes | 4 | 0.7% |
| 60 to 89 Minutes | 57 | 9.4% |
| 90 or more Minutes | 5 | 0.8% |
Commute Time by Sex in Paonia
The most common commute times in Paonia are 5 to 9 minutes (64 commuters, 26.6%) for males and 5 to 9 minutes (157 commuters, 42.9%) for females.
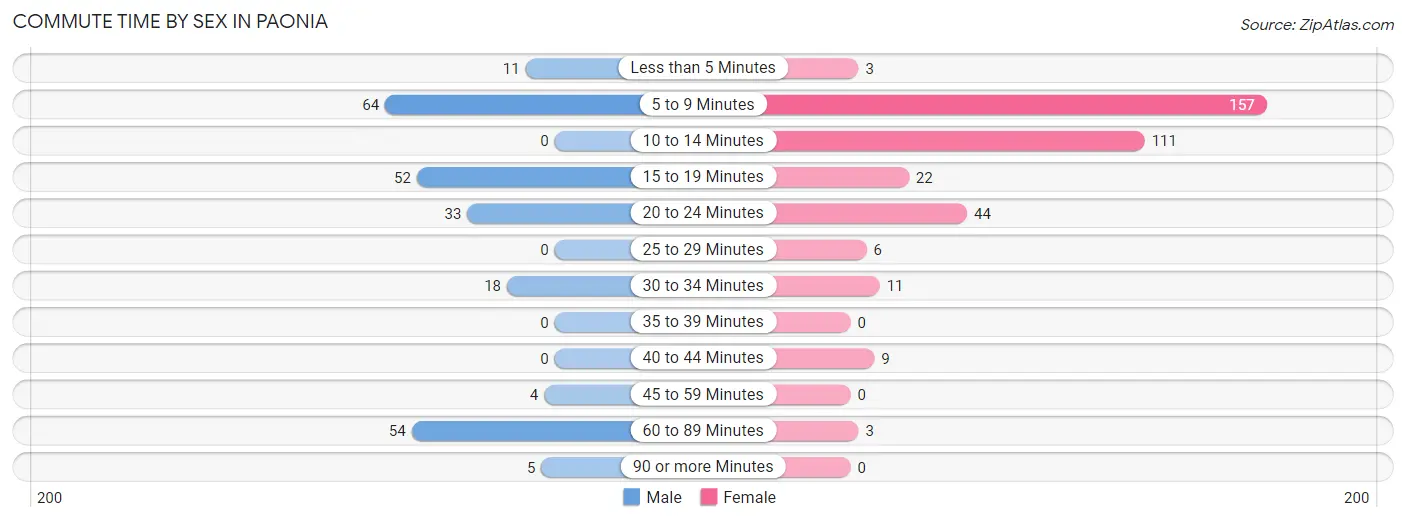
| Commute Time | Male | Female |
| Less than 5 Minutes | 11 (4.6%) | 3 (0.8%) |
| 5 to 9 Minutes | 64 (26.6%) | 157 (42.9%) |
| 10 to 14 Minutes | 0 (0.0%) | 111 (30.3%) |
| 15 to 19 Minutes | 52 (21.6%) | 22 (6.0%) |
| 20 to 24 Minutes | 33 (13.7%) | 44 (12.0%) |
| 25 to 29 Minutes | 0 (0.0%) | 6 (1.6%) |
| 30 to 34 Minutes | 18 (7.5%) | 11 (3.0%) |
| 35 to 39 Minutes | 0 (0.0%) | 0 (0.0%) |
| 40 to 44 Minutes | 0 (0.0%) | 9 (2.5%) |
| 45 to 59 Minutes | 4 (1.7%) | 0 (0.0%) |
| 60 to 89 Minutes | 54 (22.4%) | 3 (0.8%) |
| 90 or more Minutes | 5 (2.1%) | 0 (0.0%) |
Time of Departure to Work by Sex in Paonia
The most frequent times of departure to work in Paonia are 7:30 AM to 7:59 AM (38, 15.8%) for males and 7:30 AM to 7:59 AM (100, 27.3%) for females.
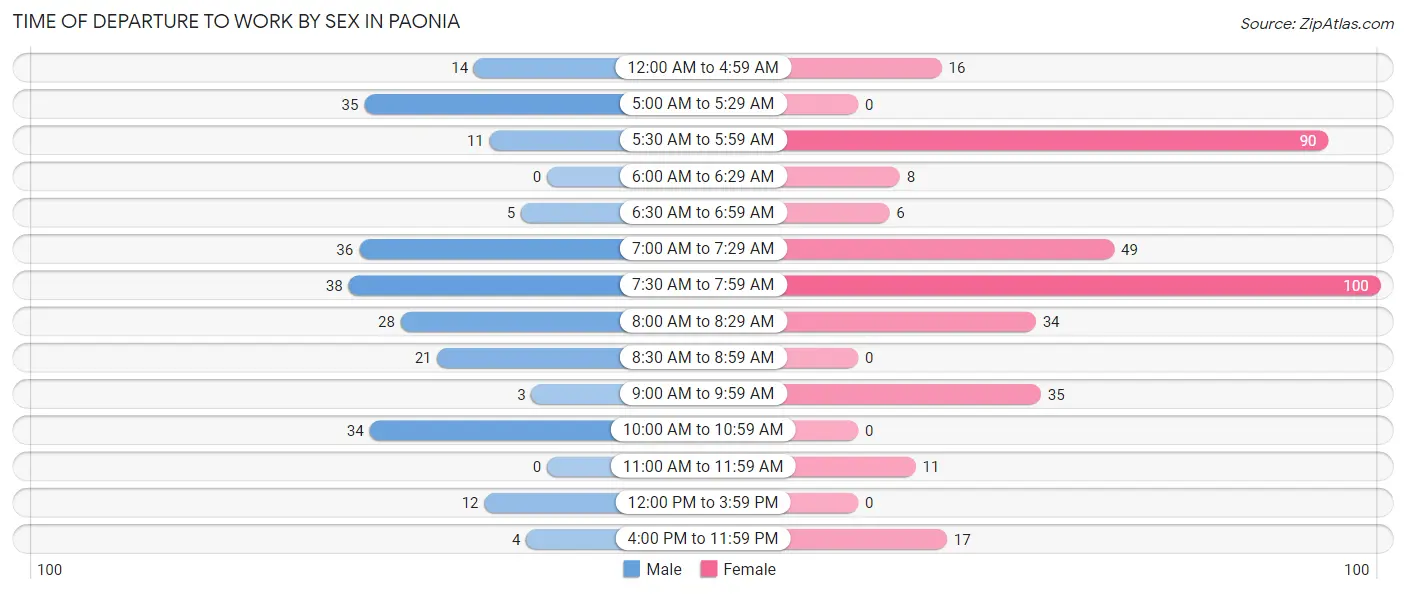
| Time of Departure | Male | Female |
| 12:00 AM to 4:59 AM | 14 (5.8%) | 16 (4.4%) |
| 5:00 AM to 5:29 AM | 35 (14.5%) | 0 (0.0%) |
| 5:30 AM to 5:59 AM | 11 (4.6%) | 90 (24.6%) |
| 6:00 AM to 6:29 AM | 0 (0.0%) | 8 (2.2%) |
| 6:30 AM to 6:59 AM | 5 (2.1%) | 6 (1.6%) |
| 7:00 AM to 7:29 AM | 36 (14.9%) | 49 (13.4%) |
| 7:30 AM to 7:59 AM | 38 (15.8%) | 100 (27.3%) |
| 8:00 AM to 8:29 AM | 28 (11.6%) | 34 (9.3%) |
| 8:30 AM to 8:59 AM | 21 (8.7%) | 0 (0.0%) |
| 9:00 AM to 9:59 AM | 3 (1.2%) | 35 (9.6%) |
| 10:00 AM to 10:59 AM | 34 (14.1%) | 0 (0.0%) |
| 11:00 AM to 11:59 AM | 0 (0.0%) | 11 (3.0%) |
| 12:00 PM to 3:59 PM | 12 (5.0%) | 0 (0.0%) |
| 4:00 PM to 11:59 PM | 4 (1.7%) | 17 (4.6%) |
| Total | 241 (100.0%) | 366 (100.0%) |
Housing Occupancy in Paonia
Occupancy by Ownership in Paonia
Of the total 744 dwellings in Paonia, owner-occupied units account for 449 (60.4%), while renter-occupied units make up 295 (39.7%).
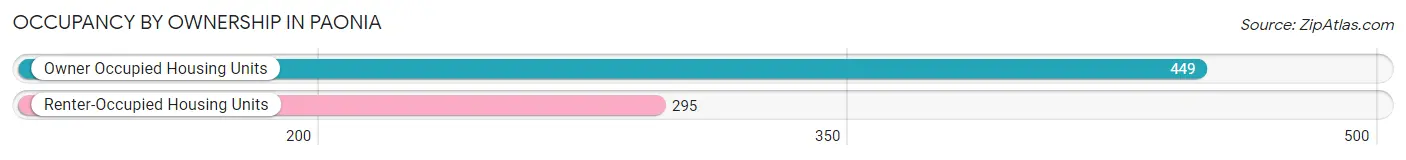
| Occupancy | # Housing Units | % Housing Units |
| Owner Occupied Housing Units | 449 | 60.4% |
| Renter-Occupied Housing Units | 295 | 39.7% |
| Total Occupied Housing Units | 744 | 100.0% |
Occupancy by Household Size in Paonia
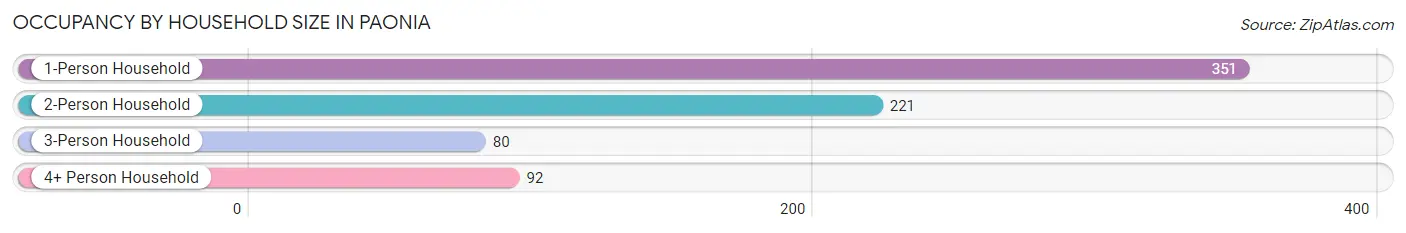
| Household Size | # Housing Units | % Housing Units |
| 1-Person Household | 351 | 47.2% |
| 2-Person Household | 221 | 29.7% |
| 3-Person Household | 80 | 10.7% |
| 4+ Person Household | 92 | 12.4% |
| Total Housing Units | 744 | 100.0% |
Occupancy by Ownership by Household Size in Paonia
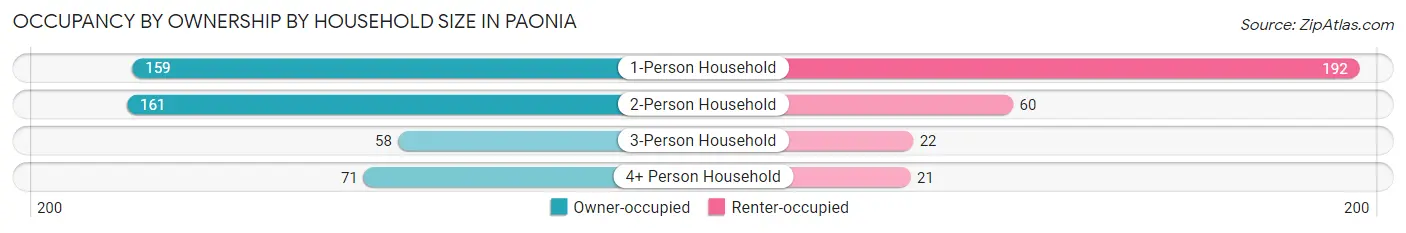
| Household Size | Owner-occupied | Renter-occupied |
| 1-Person Household | 159 (45.3%) | 192 (54.7%) |
| 2-Person Household | 161 (72.9%) | 60 (27.2%) |
| 3-Person Household | 58 (72.5%) | 22 (27.5%) |
| 4+ Person Household | 71 (77.2%) | 21 (22.8%) |
| Total Housing Units | 449 (60.4%) | 295 (39.7%) |
Occupancy by Educational Attainment in Paonia
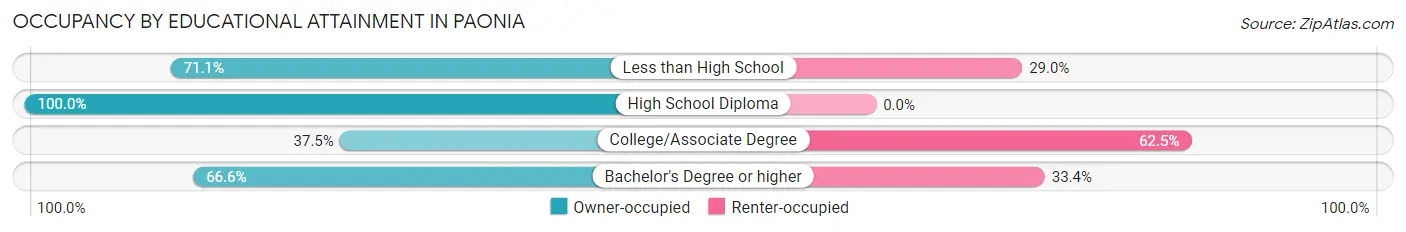
| Household Size | Owner-occupied | Renter-occupied |
| Less than High School | 27 (71.1%) | 11 (28.9%) |
| High School Diploma | 111 (100.0%) | 0 (0.0%) |
| College/Associate Degree | 110 (37.5%) | 183 (62.5%) |
| Bachelor's Degree or higher | 201 (66.6%) | 101 (33.4%) |
Occupancy by Age of Householder in Paonia
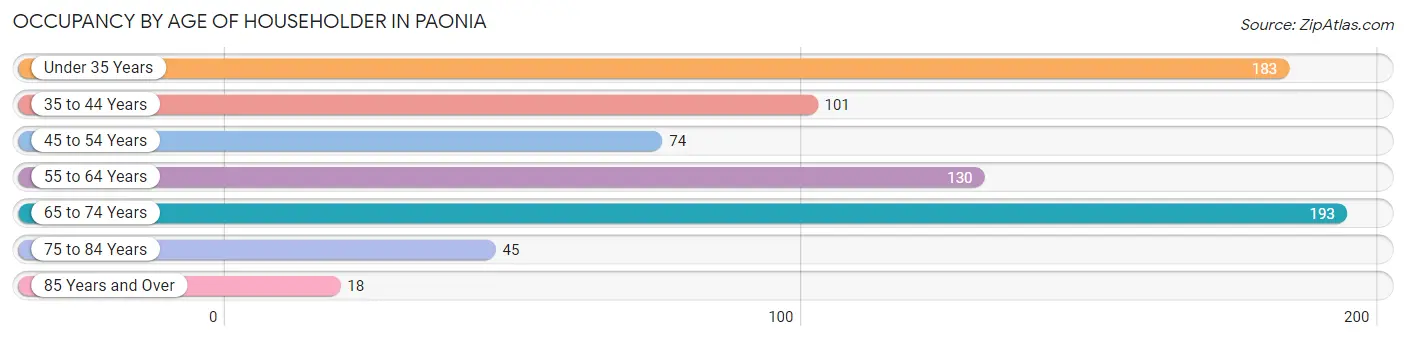
| Age Bracket | # Households | % Households |
| Under 35 Years | 183 | 24.6% |
| 35 to 44 Years | 101 | 13.6% |
| 45 to 54 Years | 74 | 10.0% |
| 55 to 64 Years | 130 | 17.5% |
| 65 to 74 Years | 193 | 25.9% |
| 75 to 84 Years | 45 | 6.0% |
| 85 Years and Over | 18 | 2.4% |
| Total | 744 | 100.0% |
Housing Finances in Paonia
Median Income by Occupancy in Paonia
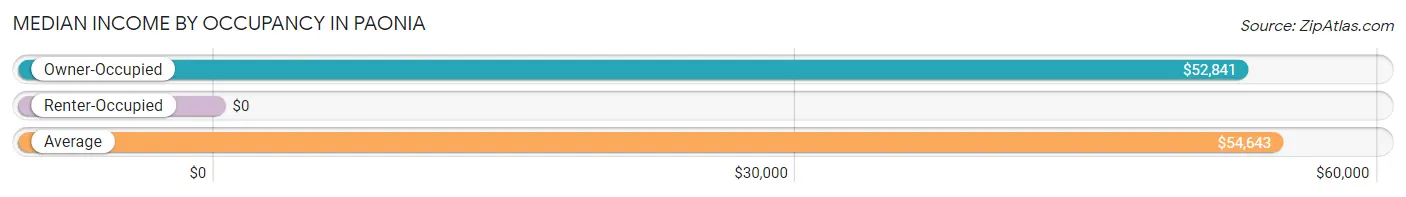
| Occupancy Type | # Households | Median Income |
| Owner-Occupied | 449 (60.4%) | $52,841 |
| Renter-Occupied | 295 (39.7%) | $0 |
| Average | 744 (100.0%) | $54,643 |
Occupancy by Householder Income Bracket in Paonia
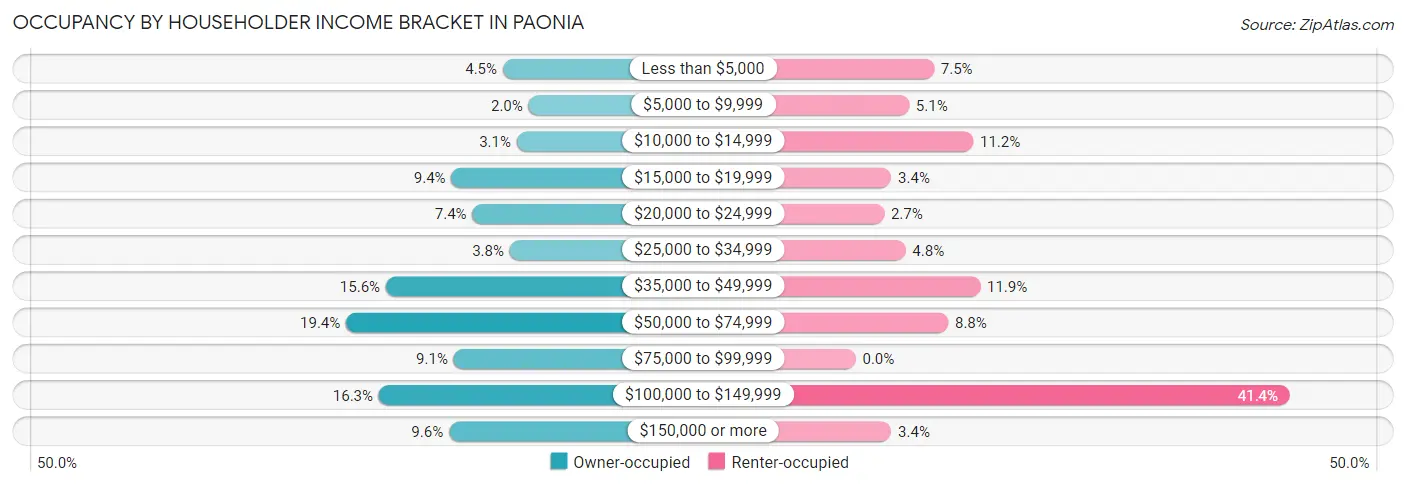
| Income Bracket | Owner-occupied | Renter-occupied |
| Less than $5,000 | 20 (4.4%) | 22 (7.5%) |
| $5,000 to $9,999 | 9 (2.0%) | 15 (5.1%) |
| $10,000 to $14,999 | 14 (3.1%) | 33 (11.2%) |
| $15,000 to $19,999 | 42 (9.3%) | 10 (3.4%) |
| $20,000 to $24,999 | 33 (7.3%) | 8 (2.7%) |
| $25,000 to $34,999 | 17 (3.8%) | 14 (4.8%) |
| $35,000 to $49,999 | 70 (15.6%) | 35 (11.9%) |
| $50,000 to $74,999 | 87 (19.4%) | 26 (8.8%) |
| $75,000 to $99,999 | 41 (9.1%) | 0 (0.0%) |
| $100,000 to $149,999 | 73 (16.3%) | 122 (41.4%) |
| $150,000 or more | 43 (9.6%) | 10 (3.4%) |
| Total | 449 (100.0%) | 295 (100.0%) |
Monthly Housing Cost Tiers in Paonia
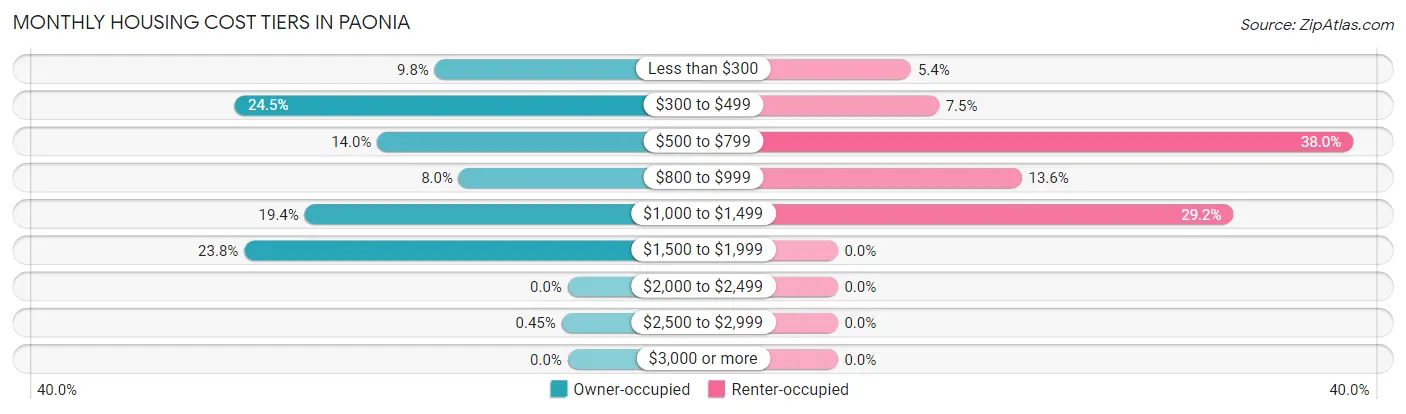
| Monthly Cost | Owner-occupied | Renter-occupied |
| Less than $300 | 44 (9.8%) | 16 (5.4%) |
| $300 to $499 | 110 (24.5%) | 22 (7.5%) |
| $500 to $799 | 63 (14.0%) | 112 (38.0%) |
| $800 to $999 | 36 (8.0%) | 40 (13.6%) |
| $1,000 to $1,499 | 87 (19.4%) | 86 (29.1%) |
| $1,500 to $1,999 | 107 (23.8%) | 0 (0.0%) |
| $2,000 to $2,499 | 0 (0.0%) | 0 (0.0%) |
| $2,500 to $2,999 | 2 (0.4%) | 0 (0.0%) |
| $3,000 or more | 0 (0.0%) | 0 (0.0%) |
| Total | 449 (100.0%) | 295 (100.0%) |
Physical Housing Characteristics in Paonia
Housing Structures in Paonia
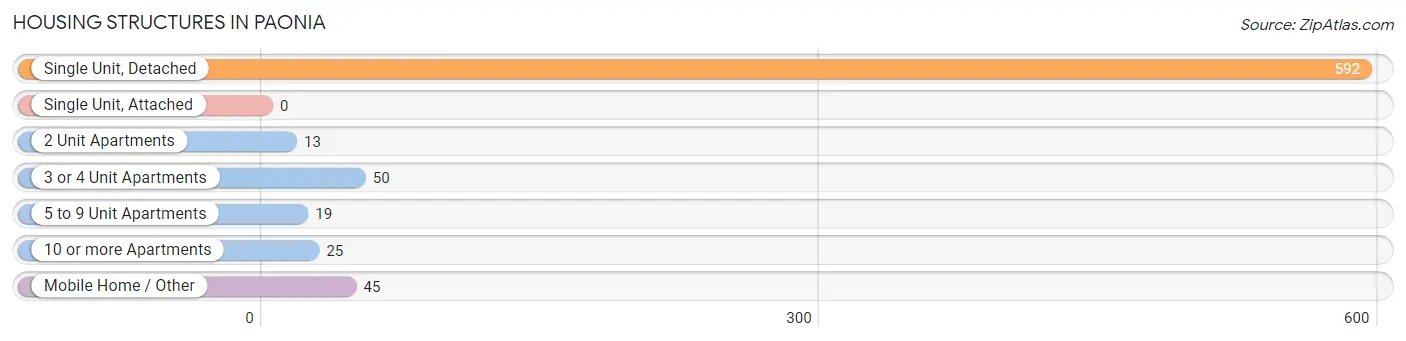
| Structure Type | # Housing Units | % Housing Units |
| Single Unit, Detached | 592 | 79.6% |
| Single Unit, Attached | 0 | 0.0% |
| 2 Unit Apartments | 13 | 1.8% |
| 3 or 4 Unit Apartments | 50 | 6.7% |
| 5 to 9 Unit Apartments | 19 | 2.5% |
| 10 or more Apartments | 25 | 3.4% |
| Mobile Home / Other | 45 | 6.0% |
| Total | 744 | 100.0% |
Housing Structures by Occupancy in Paonia
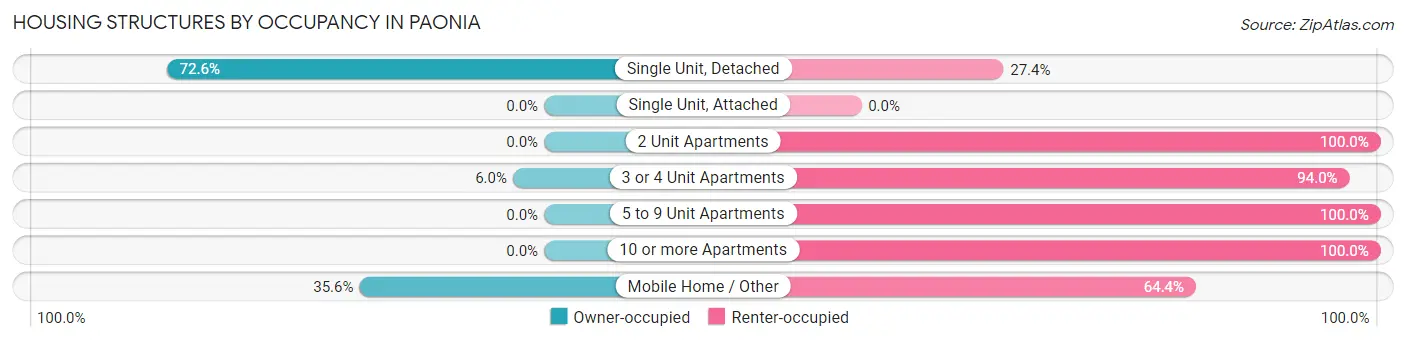
| Structure Type | Owner-occupied | Renter-occupied |
| Single Unit, Detached | 430 (72.6%) | 162 (27.4%) |
| Single Unit, Attached | 0 (0.0%) | 0 (0.0%) |
| 2 Unit Apartments | 0 (0.0%) | 13 (100.0%) |
| 3 or 4 Unit Apartments | 3 (6.0%) | 47 (94.0%) |
| 5 to 9 Unit Apartments | 0 (0.0%) | 19 (100.0%) |
| 10 or more Apartments | 0 (0.0%) | 25 (100.0%) |
| Mobile Home / Other | 16 (35.6%) | 29 (64.4%) |
| Total | 449 (60.4%) | 295 (39.7%) |
Housing Structures by Number of Rooms in Paonia
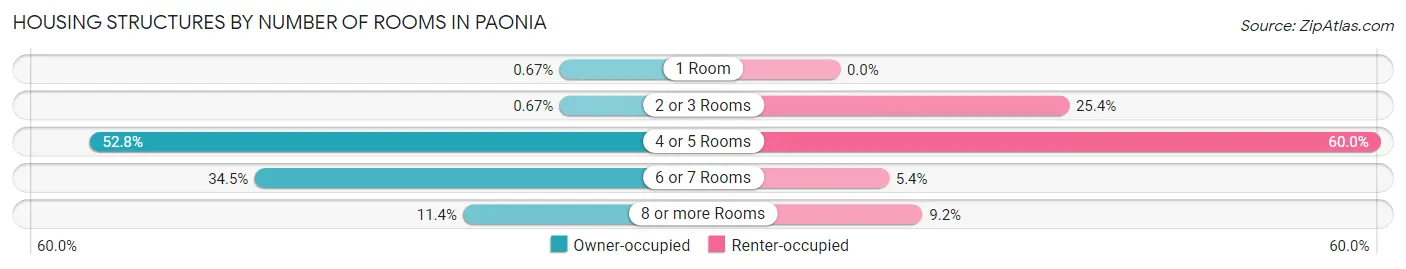
| Number of Rooms | Owner-occupied | Renter-occupied |
| 1 Room | 3 (0.7%) | 0 (0.0%) |
| 2 or 3 Rooms | 3 (0.7%) | 75 (25.4%) |
| 4 or 5 Rooms | 237 (52.8%) | 177 (60.0%) |
| 6 or 7 Rooms | 155 (34.5%) | 16 (5.4%) |
| 8 or more Rooms | 51 (11.4%) | 27 (9.1%) |
| Total | 449 (100.0%) | 295 (100.0%) |
Housing Structure by Heating Type in Paonia
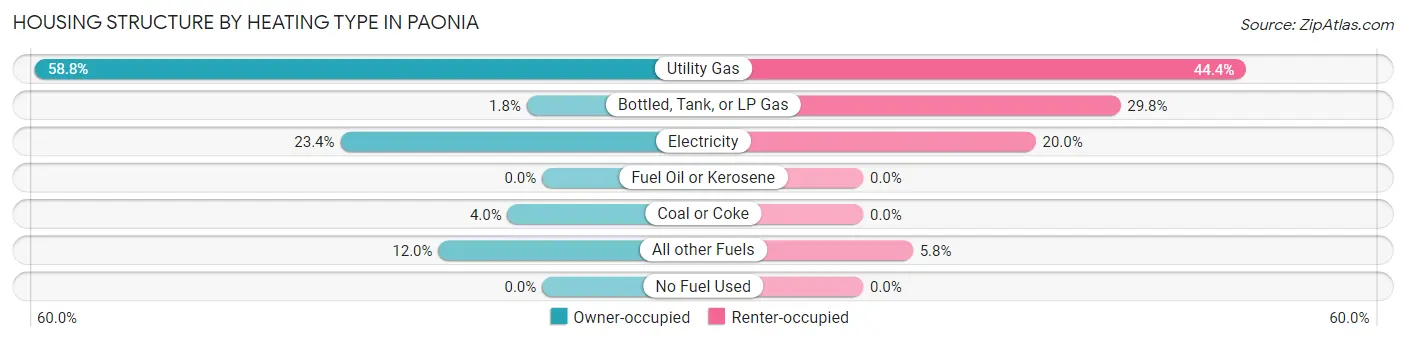
| Heating Type | Owner-occupied | Renter-occupied |
| Utility Gas | 264 (58.8%) | 131 (44.4%) |
| Bottled, Tank, or LP Gas | 8 (1.8%) | 88 (29.8%) |
| Electricity | 105 (23.4%) | 59 (20.0%) |
| Fuel Oil or Kerosene | 0 (0.0%) | 0 (0.0%) |
| Coal or Coke | 18 (4.0%) | 0 (0.0%) |
| All other Fuels | 54 (12.0%) | 17 (5.8%) |
| No Fuel Used | 0 (0.0%) | 0 (0.0%) |
| Total | 449 (100.0%) | 295 (100.0%) |
Household Vehicle Usage in Paonia
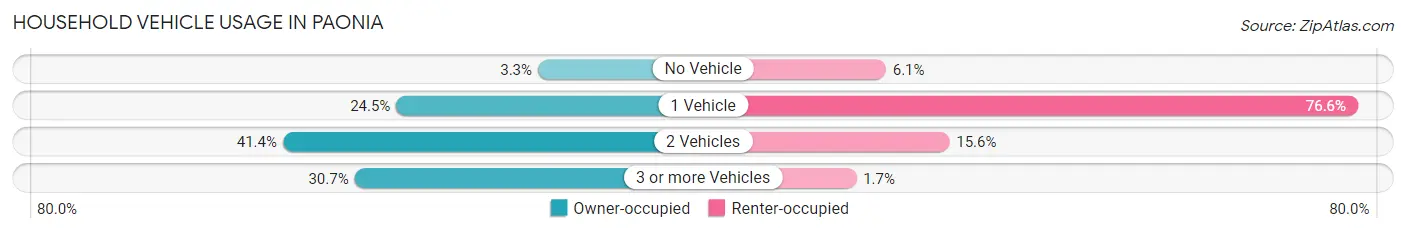
| Vehicles per Household | Owner-occupied | Renter-occupied |
| No Vehicle | 15 (3.3%) | 18 (6.1%) |
| 1 Vehicle | 110 (24.5%) | 226 (76.6%) |
| 2 Vehicles | 186 (41.4%) | 46 (15.6%) |
| 3 or more Vehicles | 138 (30.7%) | 5 (1.7%) |
| Total | 449 (100.0%) | 295 (100.0%) |
Real Estate & Mortgages in Paonia
Real Estate and Mortgage Overview in Paonia
| Characteristic | Without Mortgage | With Mortgage |
| Housing Units | 215 | 234 |
| Median Property Value | $253,500 | $316,700 |
| Median Household Income | $42,614 | $13 |
| Monthly Housing Costs | $421 | $0 |
| Real Estate Taxes | $708 | $0 |
Property Value by Mortgage Status in Paonia
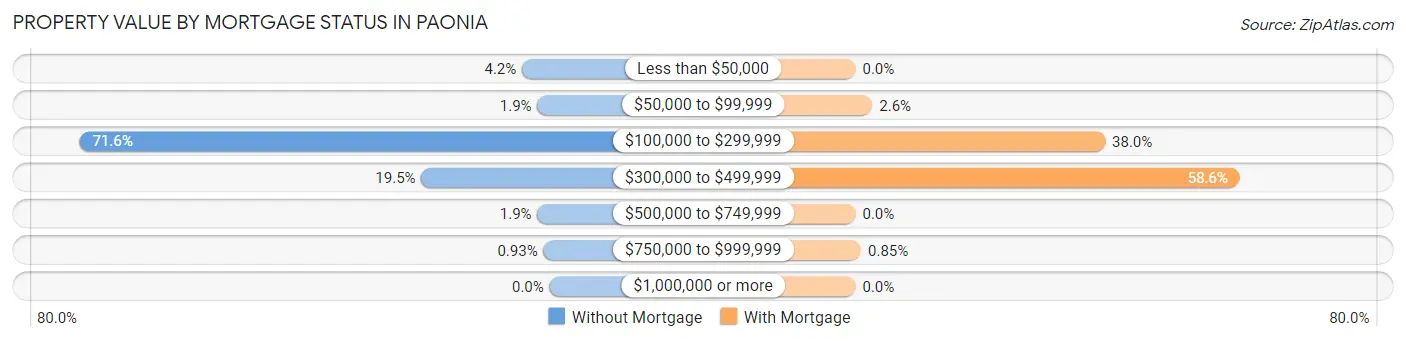
| Property Value | Without Mortgage | With Mortgage |
| Less than $50,000 | 9 (4.2%) | 0 (0.0%) |
| $50,000 to $99,999 | 4 (1.9%) | 6 (2.6%) |
| $100,000 to $299,999 | 154 (71.6%) | 89 (38.0%) |
| $300,000 to $499,999 | 42 (19.5%) | 137 (58.6%) |
| $500,000 to $749,999 | 4 (1.9%) | 0 (0.0%) |
| $750,000 to $999,999 | 2 (0.9%) | 2 (0.9%) |
| $1,000,000 or more | 0 (0.0%) | 0 (0.0%) |
| Total | 215 (100.0%) | 234 (100.0%) |
Household Income by Mortgage Status in Paonia
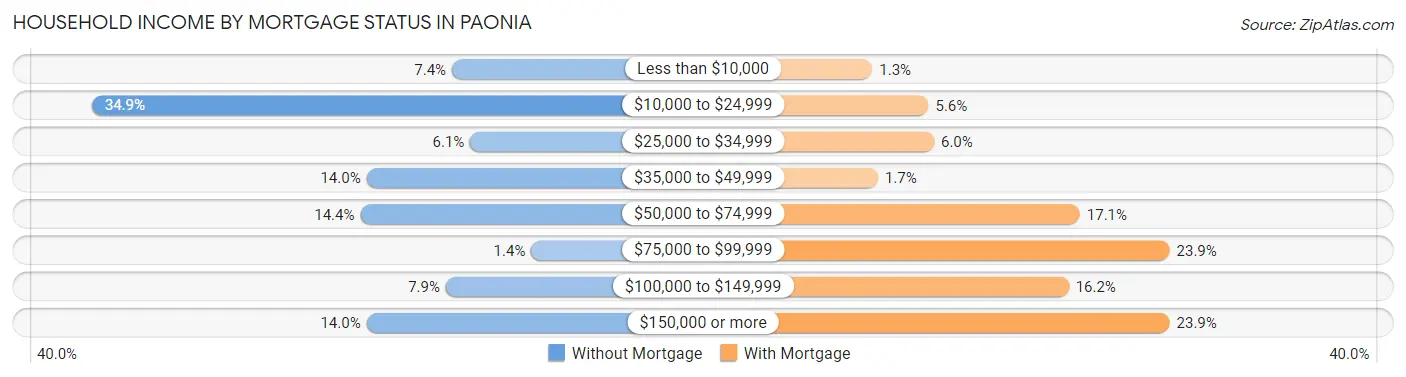
| Household Income | Without Mortgage | With Mortgage |
| Less than $10,000 | 16 (7.4%) | 3 (1.3%) |
| $10,000 to $24,999 | 75 (34.9%) | 13 (5.6%) |
| $25,000 to $34,999 | 13 (6.0%) | 14 (6.0%) |
| $35,000 to $49,999 | 30 (14.0%) | 4 (1.7%) |
| $50,000 to $74,999 | 31 (14.4%) | 40 (17.1%) |
| $75,000 to $99,999 | 3 (1.4%) | 56 (23.9%) |
| $100,000 to $149,999 | 17 (7.9%) | 38 (16.2%) |
| $150,000 or more | 30 (14.0%) | 56 (23.9%) |
| Total | 215 (100.0%) | 234 (100.0%) |
Property Value to Household Income Ratio in Paonia
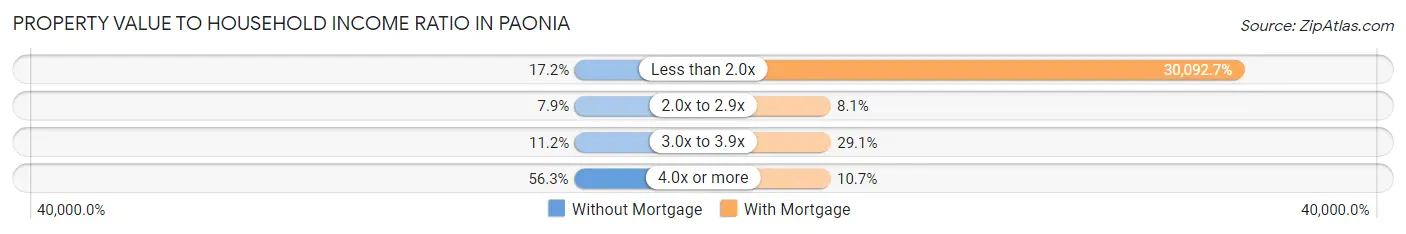
| Value-to-Income Ratio | Without Mortgage | With Mortgage |
| Less than 2.0x | 37 (17.2%) | 70,417 (30,092.7%) |
| 2.0x to 2.9x | 17 (7.9%) | 19 (8.1%) |
| 3.0x to 3.9x | 24 (11.2%) | 68 (29.1%) |
| 4.0x or more | 121 (56.3%) | 25 (10.7%) |
| Total | 215 (100.0%) | 234 (100.0%) |
Real Estate Taxes by Mortgage Status in Paonia
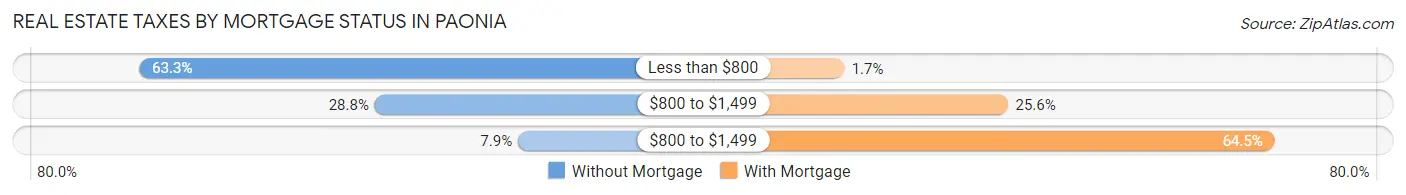
| Property Taxes | Without Mortgage | With Mortgage |
| Less than $800 | 136 (63.3%) | 4 (1.7%) |
| $800 to $1,499 | 62 (28.8%) | 60 (25.6%) |
| $800 to $1,499 | 17 (7.9%) | 151 (64.5%) |
| Total | 215 (100.0%) | 234 (100.0%) |
Health & Disability in Paonia
Health Insurance Coverage by Age in Paonia
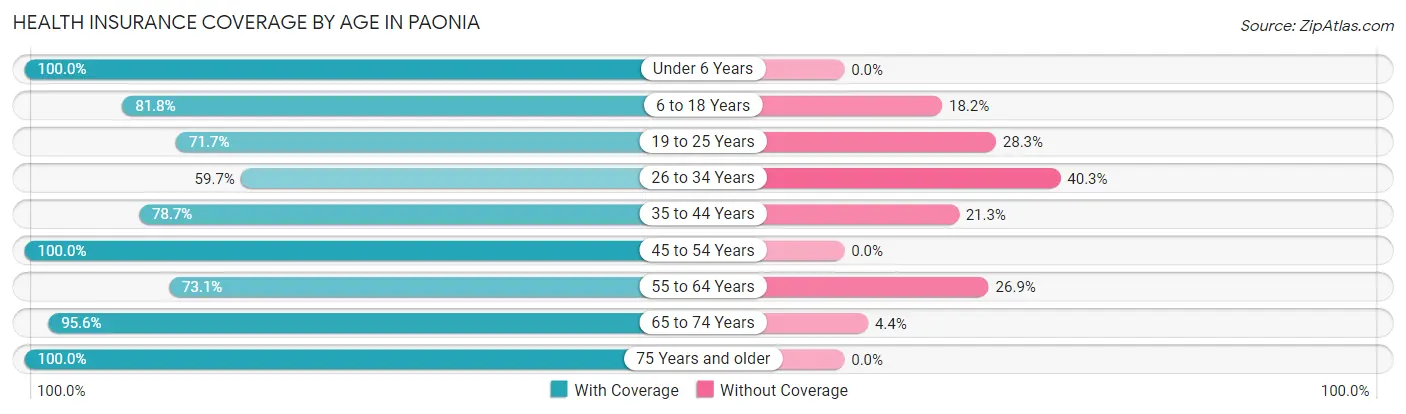
| Age Bracket | With Coverage | Without Coverage |
| Under 6 Years | 112 (100.0%) | 0 (0.0%) |
| 6 to 18 Years | 157 (81.8%) | 35 (18.2%) |
| 19 to 25 Years | 33 (71.7%) | 13 (28.3%) |
| 26 to 34 Years | 166 (59.7%) | 112 (40.3%) |
| 35 to 44 Years | 177 (78.7%) | 48 (21.3%) |
| 45 to 54 Years | 91 (100.0%) | 0 (0.0%) |
| 55 to 64 Years | 152 (73.1%) | 56 (26.9%) |
| 65 to 74 Years | 260 (95.6%) | 12 (4.4%) |
| 75 Years and older | 102 (100.0%) | 0 (0.0%) |
| Total | 1,250 (81.9%) | 276 (18.1%) |
Health Insurance Coverage by Citizenship Status in Paonia
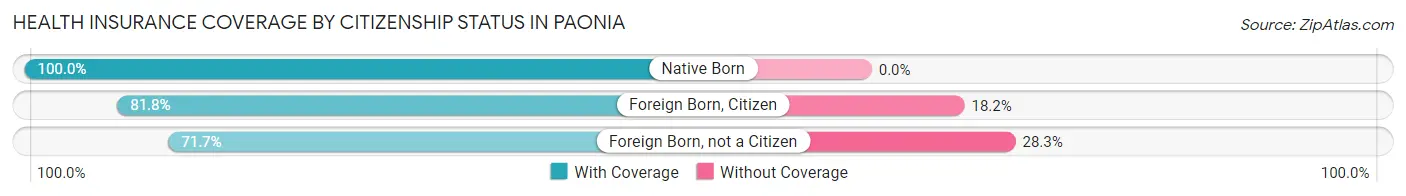
| Citizenship Status | With Coverage | Without Coverage |
| Native Born | 112 (100.0%) | 0 (0.0%) |
| Foreign Born, Citizen | 157 (81.8%) | 35 (18.2%) |
| Foreign Born, not a Citizen | 33 (71.7%) | 13 (28.3%) |
Health Insurance Coverage by Household Income in Paonia
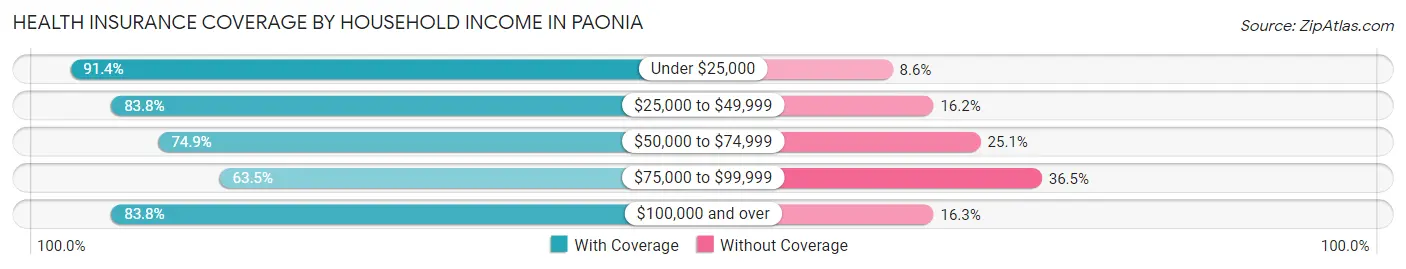
| Household Income | With Coverage | Without Coverage |
| Under $25,000 | 245 (91.4%) | 23 (8.6%) |
| $25,000 to $49,999 | 196 (83.8%) | 38 (16.2%) |
| $50,000 to $74,999 | 239 (74.9%) | 80 (25.1%) |
| $75,000 to $99,999 | 66 (63.5%) | 38 (36.5%) |
| $100,000 and over | 500 (83.8%) | 97 (16.3%) |
Public vs Private Health Insurance Coverage by Age in Paonia
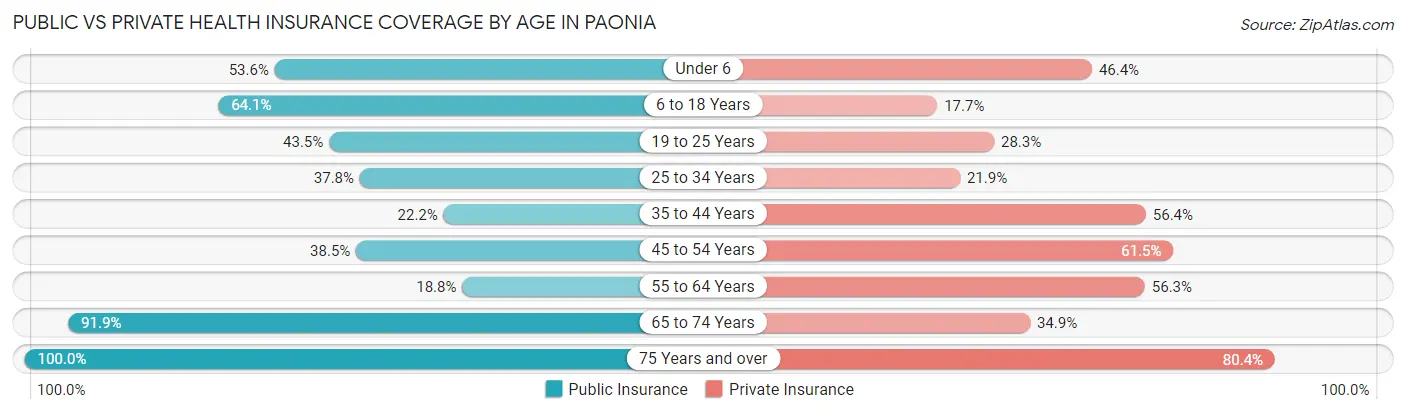
| Age Bracket | Public Insurance | Private Insurance |
| Under 6 | 60 (53.6%) | 52 (46.4%) |
| 6 to 18 Years | 123 (64.1%) | 34 (17.7%) |
| 19 to 25 Years | 20 (43.5%) | 13 (28.3%) |
| 25 to 34 Years | 105 (37.8%) | 61 (21.9%) |
| 35 to 44 Years | 50 (22.2%) | 127 (56.4%) |
| 45 to 54 Years | 35 (38.5%) | 56 (61.5%) |
| 55 to 64 Years | 39 (18.8%) | 117 (56.2%) |
| 65 to 74 Years | 250 (91.9%) | 95 (34.9%) |
| 75 Years and over | 102 (100.0%) | 82 (80.4%) |
| Total | 784 (51.4%) | 637 (41.7%) |
Disability Status by Sex by Age in Paonia
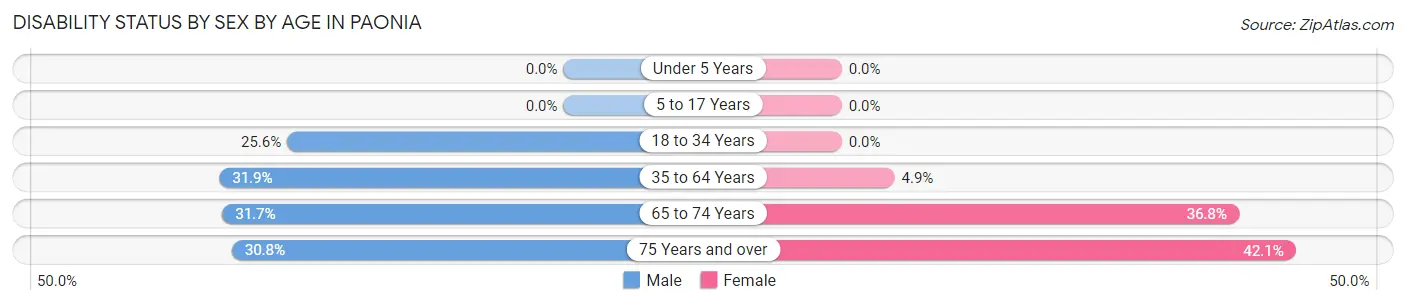
| Age Bracket | Male | Female |
| Under 5 Years | 0 (0.0%) | 0 (0.0%) |
| 5 to 17 Years | 0 (0.0%) | 0 (0.0%) |
| 18 to 34 Years | 30 (25.6%) | 0 (0.0%) |
| 35 to 64 Years | 76 (31.9%) | 14 (4.9%) |
| 65 to 74 Years | 44 (31.7%) | 49 (36.8%) |
| 75 Years and over | 8 (30.8%) | 32 (42.1%) |
Disability Class by Sex by Age in Paonia
Disability Class: Hearing Difficulty
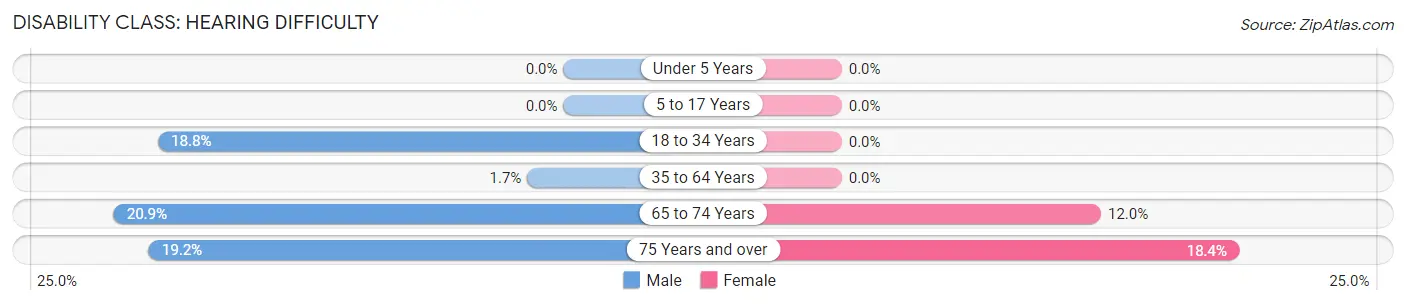
| Age Bracket | Male | Female |
| Under 5 Years | 0 (0.0%) | 0 (0.0%) |
| 5 to 17 Years | 0 (0.0%) | 0 (0.0%) |
| 18 to 34 Years | 22 (18.8%) | 0 (0.0%) |
| 35 to 64 Years | 4 (1.7%) | 0 (0.0%) |
| 65 to 74 Years | 29 (20.9%) | 16 (12.0%) |
| 75 Years and over | 5 (19.2%) | 14 (18.4%) |
Disability Class: Vision Difficulty
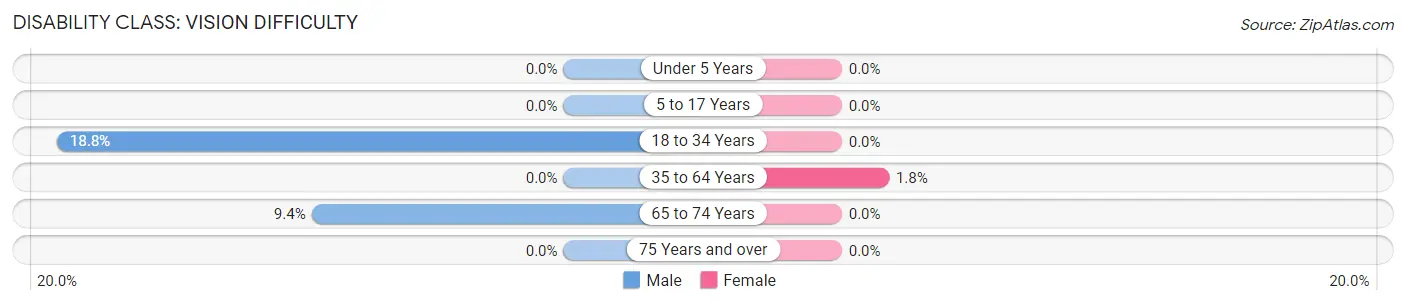
| Age Bracket | Male | Female |
| Under 5 Years | 0 (0.0%) | 0 (0.0%) |
| 5 to 17 Years | 0 (0.0%) | 0 (0.0%) |
| 18 to 34 Years | 22 (18.8%) | 0 (0.0%) |
| 35 to 64 Years | 0 (0.0%) | 5 (1.8%) |
| 65 to 74 Years | 13 (9.3%) | 0 (0.0%) |
| 75 Years and over | 0 (0.0%) | 0 (0.0%) |
Disability Class: Cognitive Difficulty
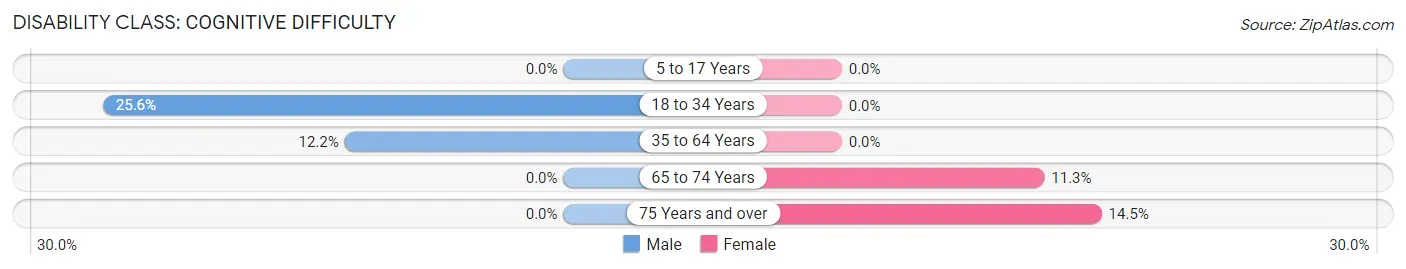
| Age Bracket | Male | Female |
| 5 to 17 Years | 0 (0.0%) | 0 (0.0%) |
| 18 to 34 Years | 30 (25.6%) | 0 (0.0%) |
| 35 to 64 Years | 29 (12.2%) | 0 (0.0%) |
| 65 to 74 Years | 0 (0.0%) | 15 (11.3%) |
| 75 Years and over | 0 (0.0%) | 11 (14.5%) |
Disability Class: Ambulatory Difficulty
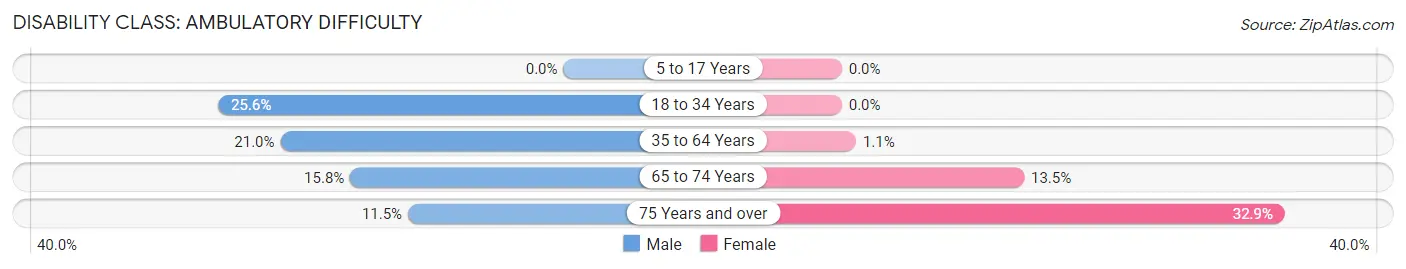
| Age Bracket | Male | Female |
| 5 to 17 Years | 0 (0.0%) | 0 (0.0%) |
| 18 to 34 Years | 30 (25.6%) | 0 (0.0%) |
| 35 to 64 Years | 50 (21.0%) | 3 (1.1%) |
| 65 to 74 Years | 22 (15.8%) | 18 (13.5%) |
| 75 Years and over | 3 (11.5%) | 25 (32.9%) |
Disability Class: Self-Care Difficulty
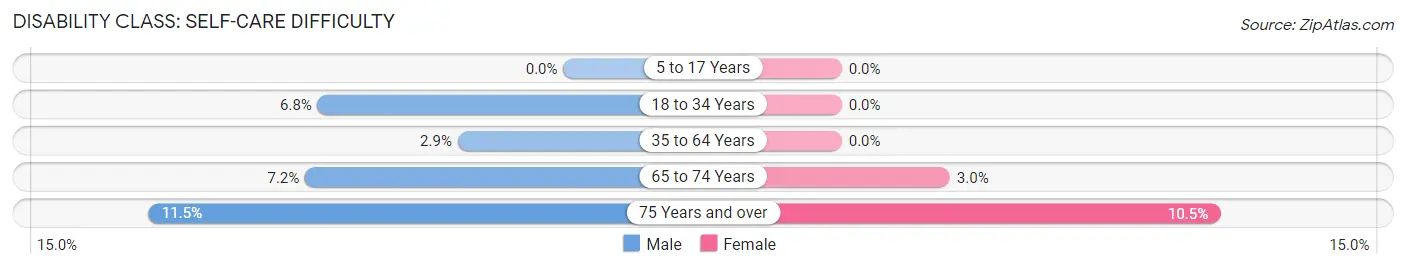
| Age Bracket | Male | Female |
| 5 to 17 Years | 0 (0.0%) | 0 (0.0%) |
| 18 to 34 Years | 8 (6.8%) | 0 (0.0%) |
| 35 to 64 Years | 7 (2.9%) | 0 (0.0%) |
| 65 to 74 Years | 10 (7.2%) | 4 (3.0%) |
| 75 Years and over | 3 (11.5%) | 8 (10.5%) |
Technology Access in Paonia
Computing Device Access in Paonia
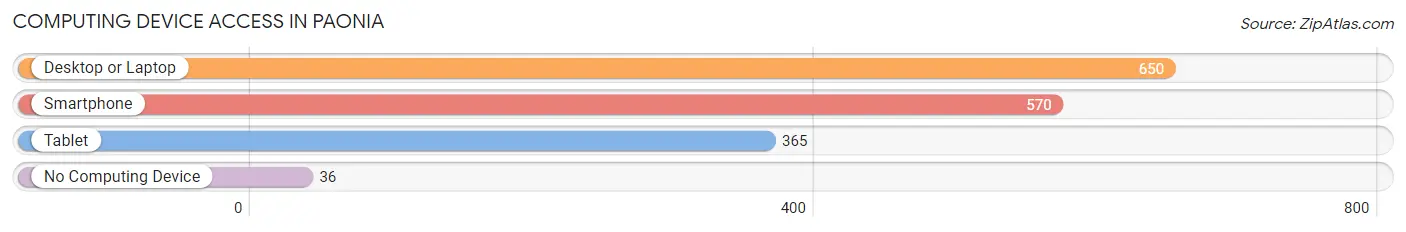
| Device Type | # Households | % Households |
| Desktop or Laptop | 650 | 87.4% |
| Smartphone | 570 | 76.6% |
| Tablet | 365 | 49.1% |
| No Computing Device | 36 | 4.8% |
| Total | 744 | 100.0% |
Internet Access in Paonia
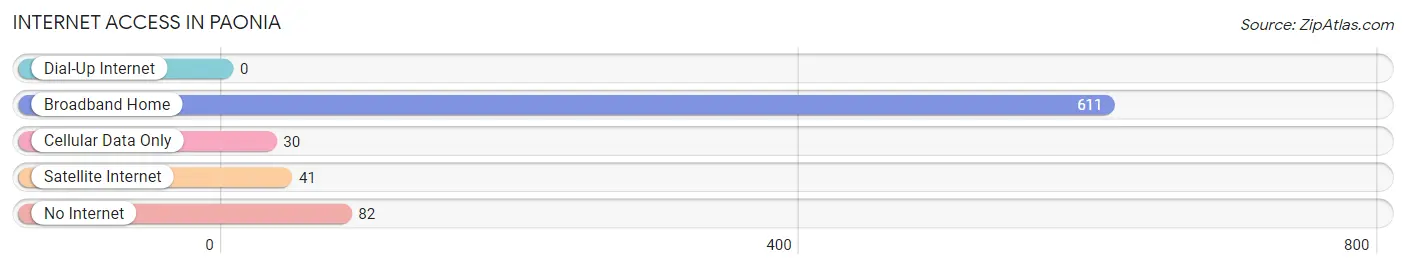
| Internet Type | # Households | % Households |
| Dial-Up Internet | 0 | 0.0% |
| Broadband Home | 611 | 82.1% |
| Cellular Data Only | 30 | 4.0% |
| Satellite Internet | 41 | 5.5% |
| No Internet | 82 | 11.0% |
| Total | 744 | 100.0% |
Paonia Summary
Paonia, Colorado is a small town located in the North Fork Valley of the Western Slope of the Rocky Mountains. It is situated in Delta County, approximately 25 miles south of the town of Hotchkiss and 25 miles north of the city of Montrose. The town is located at an elevation of 5,890 feet and has a population of 1,500 people.
History
The area that is now Paonia was first settled in the late 1800s by miners and ranchers. The town was officially founded in 1881 and was named after the Greek goddess of fruit, Paonia. The town was originally a mining town, with coal being the primary resource. The coal industry was the main source of employment for the town until the 1950s when the mines began to close.
In the 1960s, the town began to transition to an agricultural economy. The North Fork Valley is known for its fertile soil and mild climate, making it ideal for growing fruit and vegetables. Today, the town is home to several farms and orchards, as well as a thriving wine industry.
Geography
Paonia is located in the North Fork Valley of the Western Slope of the Rocky Mountains. The town is situated in Delta County, approximately 25 miles south of the town of Hotchkiss and 25 miles north of the city of Montrose. The town is located at an elevation of 5,890 feet and has a population of 1,500 people.
The town is surrounded by mountains and is situated in a valley. The North Fork of the Gunnison River runs through the town and is a popular spot for fishing and rafting. The town is also home to several parks and trails, including the Paonia State Park and the Paonia River Trail.
Economy
The economy of Paonia is largely based on agriculture and tourism. The town is home to several farms and orchards, as well as a thriving wine industry. The town is also a popular destination for outdoor recreation, with several parks and trails in the area.
The town is also home to several businesses, including restaurants, shops, and galleries. The town is also home to several art galleries and studios, as well as a local theater.
Demographics
As of the 2010 census, the population of Paonia was 1,500 people. The racial makeup of the town was 94.2% White, 0.7% African American, 0.7% Native American, 0.7% Asian, 0.7% from other races, and 2.7% from two or more races. Hispanic or Latino of any race were 3.3% of the population.
The median income for a household in the town was $37,500, and the median income for a family was $45,000. The per capita income for the town was $19,000. About 11.7% of families and 15.3% of the population were below the poverty line, including 22.2% of those under age 18 and 8.3% of those age 65 or over.
Common Questions
What is Per Capita Income in Paonia?
Per Capita income in Paonia is $36,898.
What is the Median Family Income in Paonia?
Median Family Income in Paonia is $71,667.
What is the Median Household income in Paonia?
Median Household Income in Paonia is $54,643.
What is Income or Wage Gap in Paonia?
Income or Wage Gap in Paonia is 10.1%.
Women in Paonia earn 89.9 cents for every dollar earned by a man.
What is Family Income Deficit in Paonia?
Family Income Deficit in Paonia is $7,142.
Families that are below poverty line in Paonia earn $7,142 less on average than the poverty threshold level.
What is Inequality or Gini Index in Paonia?
Inequality or Gini Index in Paonia is 0.43.
What is the Total Population of Paonia?
Total Population of Paonia is 1,571.
What is the Total Male Population of Paonia?
Total Male Population of Paonia is 713.
What is the Total Female Population of Paonia?
Total Female Population of Paonia is 858.
What is the Ratio of Males per 100 Females in Paonia?
There are 83.10 Males per 100 Females in Paonia.
What is the Ratio of Females per 100 Males in Paonia?
There are 120.34 Females per 100 Males in Paonia.
What is the Median Population Age in Paonia?
Median Population Age in Paonia is 38.9 Years.
What is the Average Family Size in Paonia
Average Family Size in Paonia is 3.0 People.
What is the Average Household Size in Paonia
Average Household Size in Paonia is 2.0 People.
How Large is the Labor Force in Paonia?
There are 764 People in the Labor Forcein in Paonia.
What is the Percentage of People in the Labor Force in Paonia?
57.8% of People are in the Labor Force in Paonia.
What is the Unemployment Rate in Paonia?
Unemployment Rate in Paonia is 6.2%.