Palisade, CO Map & Demographics
Palisade Map
Palisade Overview
$37,113
PER CAPITA INCOME
$90,764
AVG FAMILY INCOME
$56,359
AVG HOUSEHOLD INCOME
29.9%
WAGE / INCOME GAP [ % ]
70.1¢/ $1
WAGE / INCOME GAP [ $ ]
$6,347
FAMILY INCOME DEFICIT
0.46
INEQUALITY / GINI INDEX
2,571
TOTAL POPULATION
1,366
MALE POPULATION
1,205
FEMALE POPULATION
113.36
MALES / 100 FEMALES
88.21
FEMALES / 100 MALES
47.1
MEDIAN AGE
3.0
AVG FAMILY SIZE
2.1
AVG HOUSEHOLD SIZE
1,327
LABOR FORCE [ PEOPLE ]
62.0%
PERCENT IN LABOR FORCE
4.6%
UNEMPLOYMENT RATE
Palisade Zip Codes
Palisade Area Codes
Income in Palisade
Income Overview in Palisade
Per Capita Income in Palisade is $37,113, while median incomes of families and households are $90,764 and $56,359 respectively.
| Characteristic | Number | Measure |
| Per Capita Income | 2,571 | $37,113 |
| Median Family Income | 614 | $90,764 |
| Mean Family Income | 614 | $115,796 |
| Median Household Income | 1,171 | $56,359 |
| Mean Household Income | 1,171 | $81,678 |
| Income Deficit | 614 | $6,347 |
| Wage / Income Gap (%) | 2,571 | 29.88% |
| Wage / Income Gap ($) | 2,571 | 70.12¢ per $1 |
| Gini / Inequality Index | 2,571 | 0.46 |
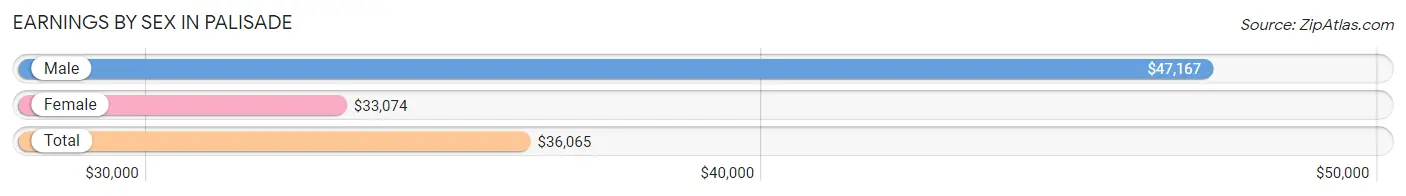
Earnings by Sex in Palisade
Average Earnings in Palisade are $36,065, $47,167 for men and $33,074 for women, a difference of 29.9%.
| Sex | Number | Average Earnings |
| Male | 712 (51.1%) | $47,167 |
| Female | 680 (48.8%) | $33,074 |
| Total | 1,392 (100.0%) | $36,065 |
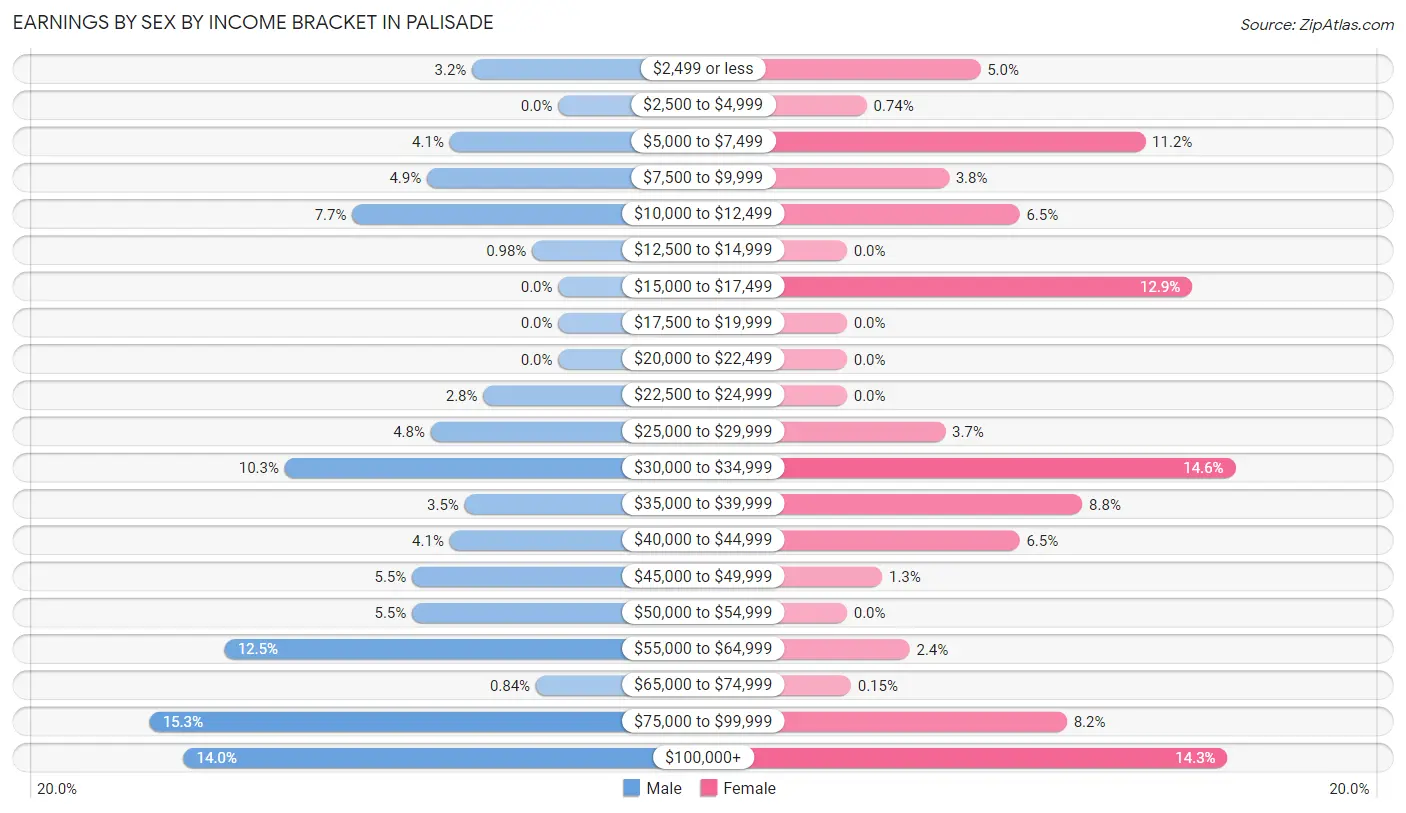
Earnings by Sex by Income Bracket in Palisade
The most common earnings brackets in Palisade are $75,000 to $99,999 for men (109 | 15.3%) and $30,000 to $34,999 for women (99 | 14.6%).
| Income | Male | Female |
| $2,499 or less | 23 (3.2%) | 34 (5.0%) |
| $2,500 to $4,999 | 0 (0.0%) | 5 (0.7%) |
| $5,000 to $7,499 | 29 (4.1%) | 76 (11.2%) |
| $7,500 to $9,999 | 35 (4.9%) | 26 (3.8%) |
| $10,000 to $12,499 | 55 (7.7%) | 44 (6.5%) |
| $12,500 to $14,999 | 7 (1.0%) | 0 (0.0%) |
| $15,000 to $17,499 | 0 (0.0%) | 88 (12.9%) |
| $17,500 to $19,999 | 0 (0.0%) | 0 (0.0%) |
| $20,000 to $22,499 | 0 (0.0%) | 0 (0.0%) |
| $22,500 to $24,999 | 20 (2.8%) | 0 (0.0%) |
| $25,000 to $29,999 | 34 (4.8%) | 25 (3.7%) |
| $30,000 to $34,999 | 73 (10.2%) | 99 (14.6%) |
| $35,000 to $39,999 | 25 (3.5%) | 60 (8.8%) |
| $40,000 to $44,999 | 29 (4.1%) | 44 (6.5%) |
| $45,000 to $49,999 | 39 (5.5%) | 9 (1.3%) |
| $50,000 to $54,999 | 39 (5.5%) | 0 (0.0%) |
| $55,000 to $64,999 | 89 (12.5%) | 16 (2.4%) |
| $65,000 to $74,999 | 6 (0.8%) | 1 (0.2%) |
| $75,000 to $99,999 | 109 (15.3%) | 56 (8.2%) |
| $100,000+ | 100 (14.0%) | 97 (14.3%) |
| Total | 712 (100.0%) | 680 (100.0%) |
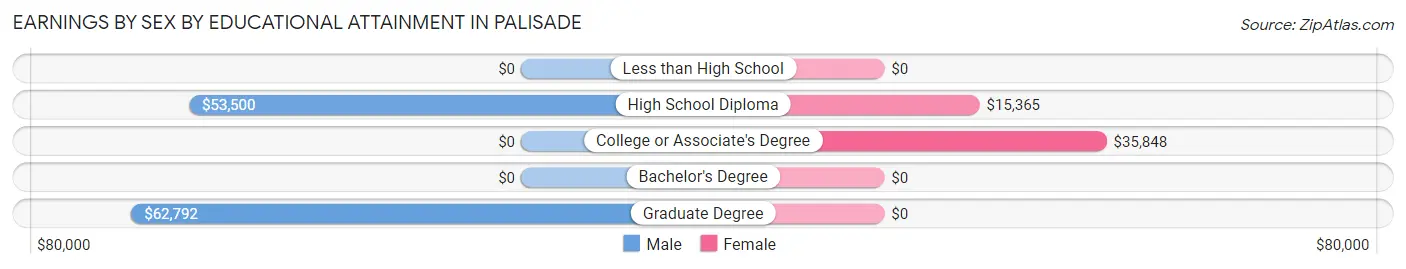
Earnings by Sex by Educational Attainment in Palisade
Average earnings in Palisade are $54,199 for men and $33,592 for women, a difference of 38.0%. Men with an educational attainment of graduate degree enjoy the highest average annual earnings of $62,792, while those with high school diploma education earn the least with $53,500. Women with an educational attainment of college or associate's degree earn the most with the average annual earnings of $35,848, while those with high school diploma education have the smallest earnings of $15,365.
| Educational Attainment | Male Income | Female Income |
| Less than High School | - | - |
| High School Diploma | $53,500 | $15,365 |
| College or Associate's Degree | - | - |
| Bachelor's Degree | - | - |
| Graduate Degree | $62,792 | $0 |
| Total | $54,199 | $33,592 |
Family Income in Palisade
Family Income Brackets in Palisade
According to the Palisade family income data, there are 175 families falling into the $75,000 to $99,999 income range, which is the most common income bracket and makes up 28.5% of all families.
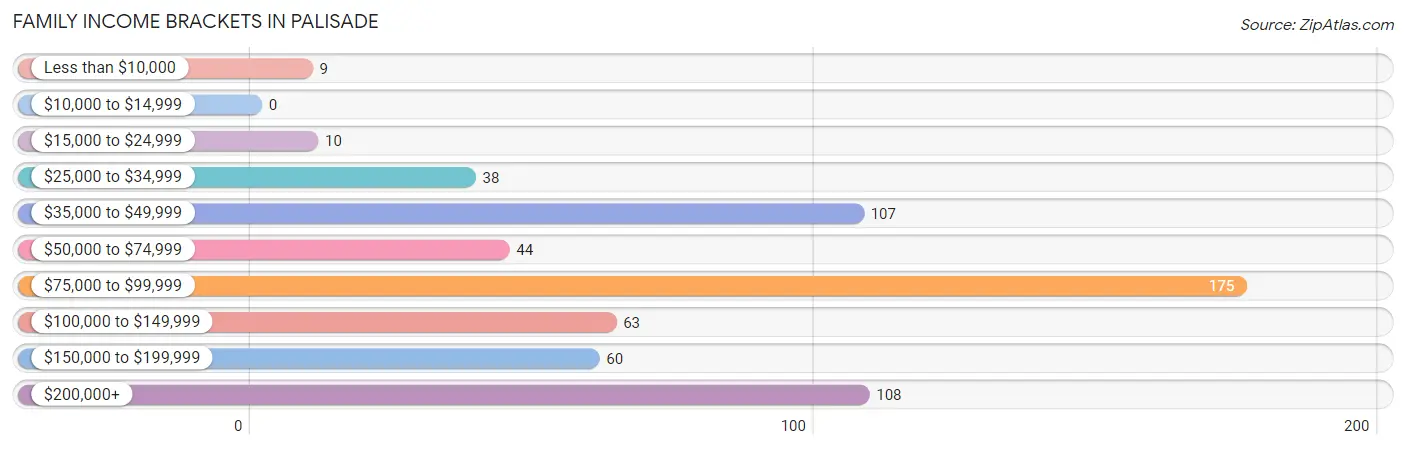
| Income Bracket | # Families | % Families |
| Less than $10,000 | 9 | 1.5% |
| $10,000 to $14,999 | 0 | 0.0% |
| $15,000 to $24,999 | 10 | 1.6% |
| $25,000 to $34,999 | 38 | 6.2% |
| $35,000 to $49,999 | 107 | 17.4% |
| $50,000 to $74,999 | 44 | 7.2% |
| $75,000 to $99,999 | 175 | 28.5% |
| $100,000 to $149,999 | 63 | 10.3% |
| $150,000 to $199,999 | 60 | 9.8% |
| $200,000+ | 108 | 17.6% |
Family Income by Famaliy Size in Palisade
4-person families (54 | 8.8%) account for the highest median family income in Palisade with $165,682 per family, while 4-person families (54 | 8.8%) have the highest median income of $41,420 per family member.
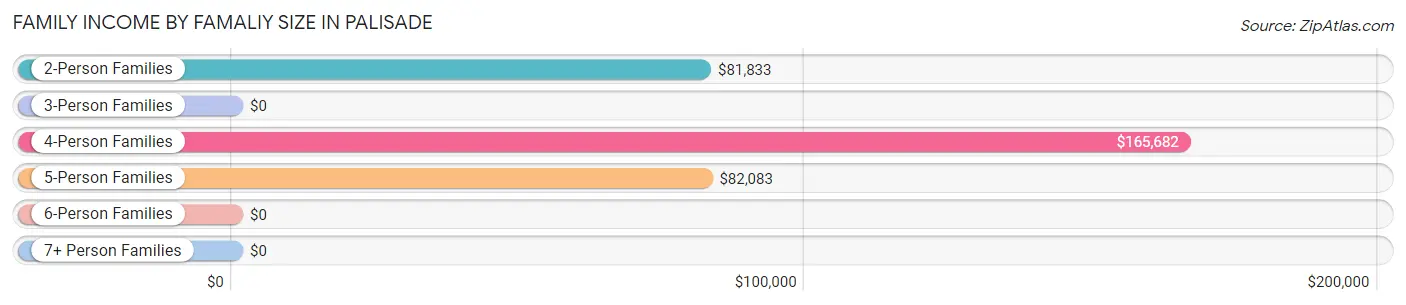
| Income Bracket | # Families | Median Income |
| 2-Person Families | 366 (59.6%) | $81,833 |
| 3-Person Families | 32 (5.2%) | $0 |
| 4-Person Families | 54 (8.8%) | $165,682 |
| 5-Person Families | 116 (18.9%) | $82,083 |
| 6-Person Families | 46 (7.5%) | $0 |
| 7+ Person Families | 0 (0.0%) | $0 |
| Total | 614 (100.0%) | $90,764 |
Family Income by Number of Earners in Palisade
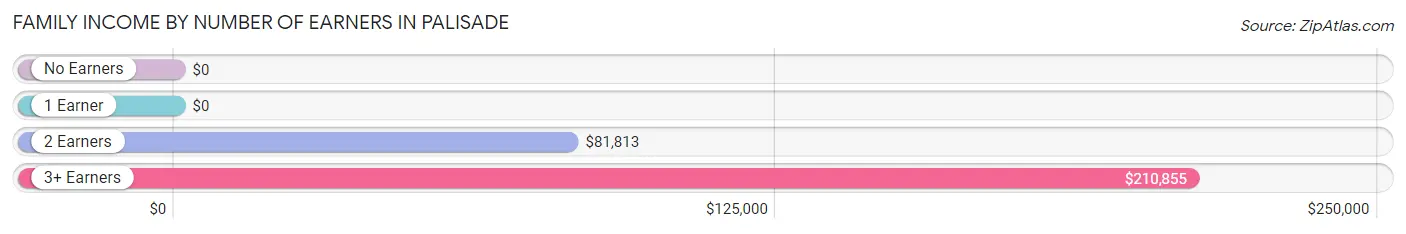
| Number of Earners | # Families | Median Income |
| No Earners | 31 (5.1%) | $0 |
| 1 Earner | 157 (25.6%) | $0 |
| 2 Earners | 325 (52.9%) | $81,813 |
| 3+ Earners | 101 (16.5%) | $210,855 |
| Total | 614 (100.0%) | $90,764 |
Household Income in Palisade
Household Income Brackets in Palisade
With 267 households falling in the category, the $75,000 to $99,999 income range is the most frequent in Palisade, accounting for 22.8% of all households. In contrast, only 36 households (3.1%) fall into the $10,000 to $14,999 income bracket, making it the least populous group.
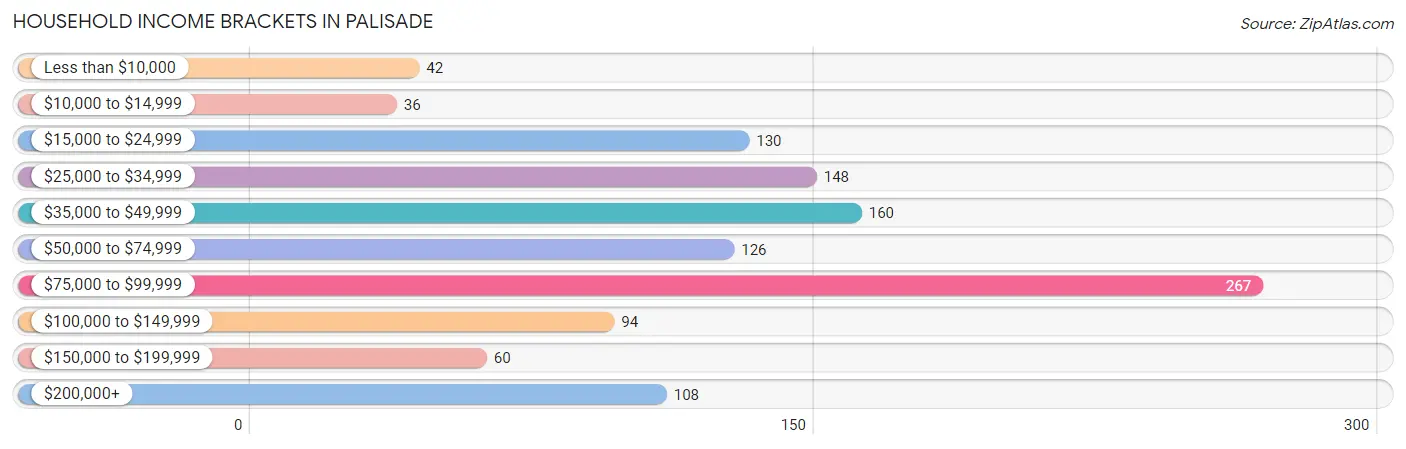
| Income Bracket | # Households | % Households |
| Less than $10,000 | 42 | 3.6% |
| $10,000 to $14,999 | 36 | 3.1% |
| $15,000 to $24,999 | 130 | 11.1% |
| $25,000 to $34,999 | 148 | 12.6% |
| $35,000 to $49,999 | 160 | 13.7% |
| $50,000 to $74,999 | 126 | 10.8% |
| $75,000 to $99,999 | 267 | 22.8% |
| $100,000 to $149,999 | 94 | 8.0% |
| $150,000 to $199,999 | 60 | 5.1% |
| $200,000+ | 108 | 9.2% |
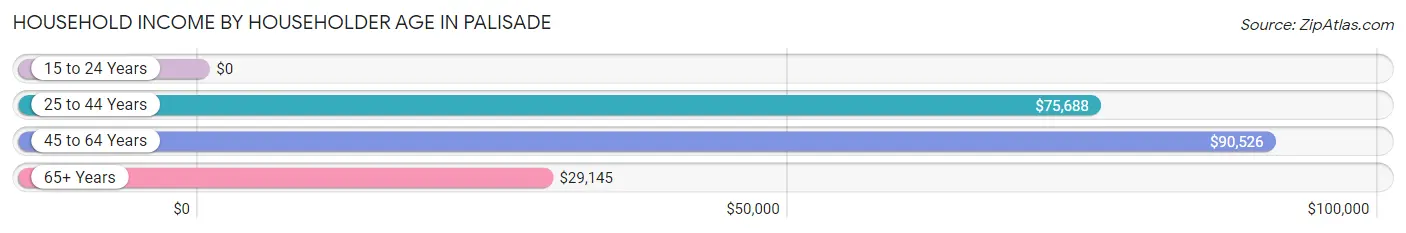
Household Income by Householder Age in Palisade
The median household income in Palisade is $56,359, with the highest median household income of $90,526 found in the 45 to 64 years age bracket for the primary householder. A total of 484 households (41.3%) fall into this category. Meanwhile, the 15 to 24 years age bracket for the primary householder has the lowest median household income of $0, with 3 households (0.3%) in this group.
| Income Bracket | # Households | Median Income |
| 15 to 24 Years | 3 (0.3%) | $0 |
| 25 to 44 Years | 324 (27.7%) | $75,688 |
| 45 to 64 Years | 484 (41.3%) | $90,526 |
| 65+ Years | 360 (30.7%) | $29,145 |
| Total | 1,171 (100.0%) | $56,359 |
Poverty in Palisade
Income Below Poverty by Sex and Age in Palisade
With 10.8% poverty level for males and 11.6% for females among the residents of Palisade, 65 to 74 year old males and 18 to 24 year old females are the most vulnerable to poverty, with 42 males (27.6%) and 13 females (38.2%) in their respective age groups living below the poverty level.
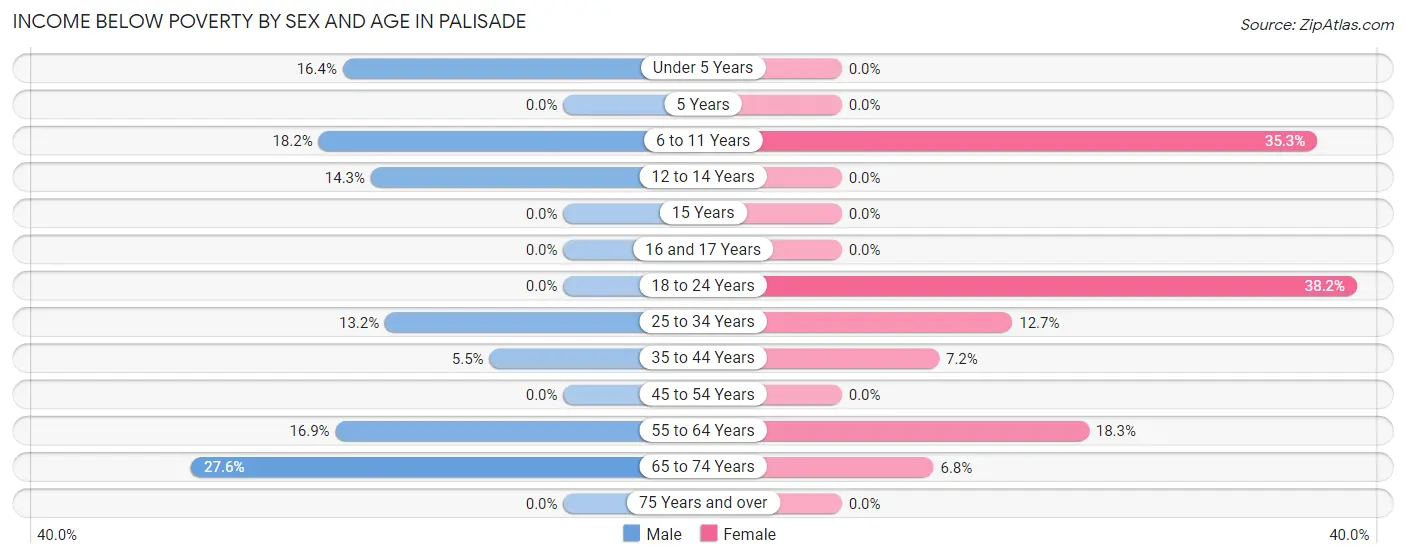
| Age Bracket | Male | Female |
| Under 5 Years | 19 (16.4%) | 0 (0.0%) |
| 5 Years | 0 (0.0%) | 0 (0.0%) |
| 6 to 11 Years | 10 (18.2%) | 30 (35.3%) |
| 12 to 14 Years | 8 (14.3%) | 0 (0.0%) |
| 15 Years | 0 (0.0%) | 0 (0.0%) |
| 16 and 17 Years | 0 (0.0%) | 0 (0.0%) |
| 18 to 24 Years | 0 (0.0%) | 13 (38.2%) |
| 25 to 34 Years | 18 (13.2%) | 10 (12.7%) |
| 35 to 44 Years | 14 (5.5%) | 13 (7.2%) |
| 45 to 54 Years | 0 (0.0%) | 0 (0.0%) |
| 55 to 64 Years | 33 (16.9%) | 53 (18.3%) |
| 65 to 74 Years | 42 (27.6%) | 16 (6.8%) |
| 75 Years and over | 0 (0.0%) | 0 (0.0%) |
| Total | 144 (10.8%) | 135 (11.6%) |
Income Above Poverty by Sex and Age in Palisade
According to the poverty statistics in Palisade, males aged 5 years and females aged under 5 years are the age groups that are most secure financially, with 100.0% of males and 100.0% of females in these age groups living above the poverty line.
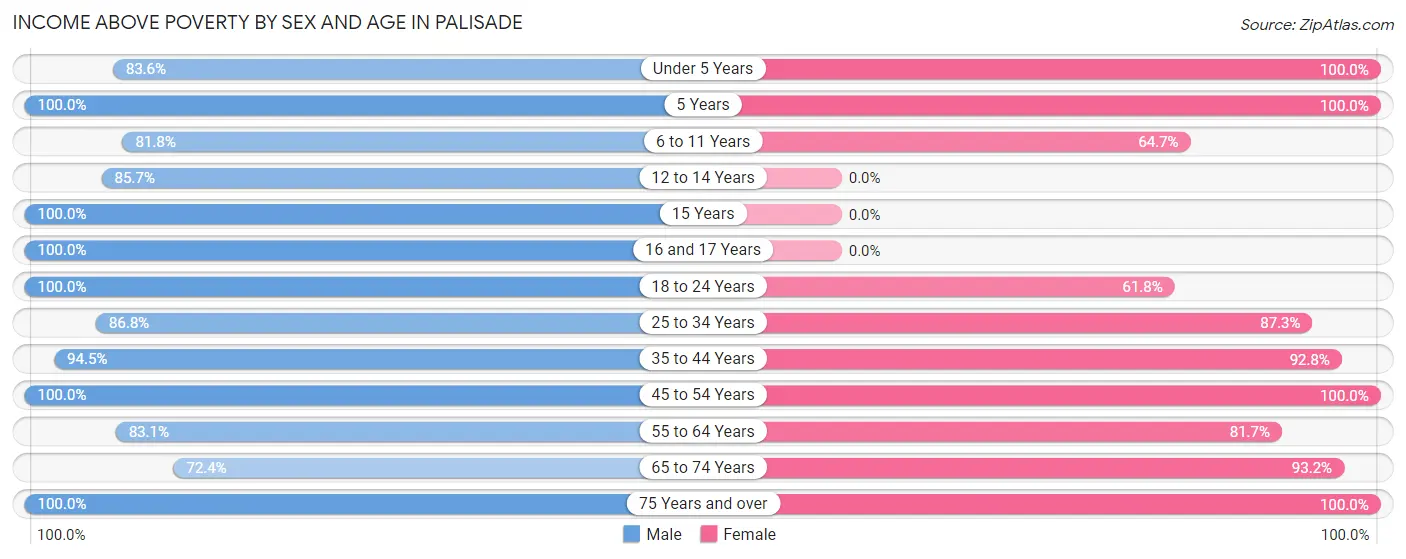
| Age Bracket | Male | Female |
| Under 5 Years | 97 (83.6%) | 22 (100.0%) |
| 5 Years | 49 (100.0%) | 8 (100.0%) |
| 6 to 11 Years | 45 (81.8%) | 55 (64.7%) |
| 12 to 14 Years | 48 (85.7%) | 0 (0.0%) |
| 15 Years | 40 (100.0%) | 0 (0.0%) |
| 16 and 17 Years | 44 (100.0%) | 0 (0.0%) |
| 18 to 24 Years | 61 (100.0%) | 21 (61.8%) |
| 25 to 34 Years | 118 (86.8%) | 69 (87.3%) |
| 35 to 44 Years | 241 (94.5%) | 167 (92.8%) |
| 45 to 54 Years | 116 (100.0%) | 165 (100.0%) |
| 55 to 64 Years | 162 (83.1%) | 236 (81.7%) |
| 65 to 74 Years | 110 (72.4%) | 219 (93.2%) |
| 75 Years and over | 54 (100.0%) | 69 (100.0%) |
| Total | 1,185 (89.2%) | 1,031 (88.4%) |
Income Below Poverty Among Married-Couple Families in Palisade
The poverty statistics for married-couple families in Palisade show that 6.1% or 30 of the total 495 families live below the poverty line. Families with 3 or 4 children have the highest poverty rate of 30.0%, comprising of 21 families. On the other hand, families with 1 or 2 children have the lowest poverty rate of 0.0%, which includes 0 families.
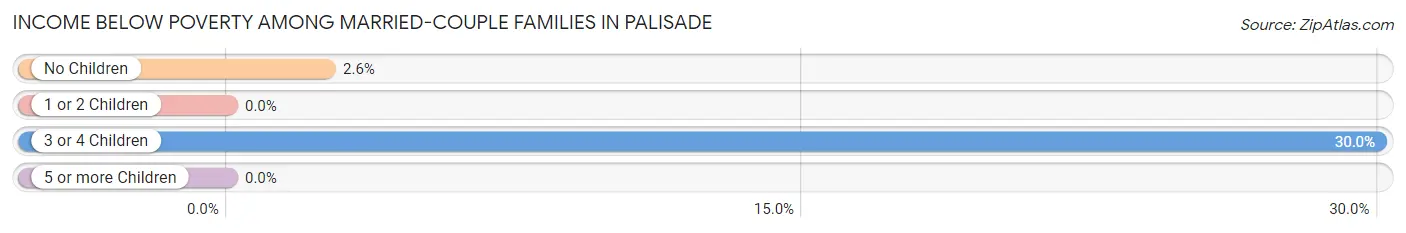
| Children | Above Poverty | Below Poverty |
| No Children | 342 (97.4%) | 9 (2.6%) |
| 1 or 2 Children | 74 (100.0%) | 0 (0.0%) |
| 3 or 4 Children | 49 (70.0%) | 21 (30.0%) |
| 5 or more Children | 0 (0.0%) | 0 (0.0%) |
| Total | 465 (93.9%) | 30 (6.1%) |
Income Below Poverty Among Single-Parent Households in Palisade
| Children | Single Father | Single Mother |
| No Children | 0 (0.0%) | 0 (0.0%) |
| 1 or 2 Children | 0 (0.0%) | 0 (0.0%) |
| 3 or 4 Children | 0 (0.0%) | 0 (0.0%) |
| 5 or more Children | 0 (0.0%) | 0 (0.0%) |
| Total | 0 (0.0%) | 0 (0.0%) |
Income Below Poverty Among Married-Couple vs Single-Parent Households in Palisade
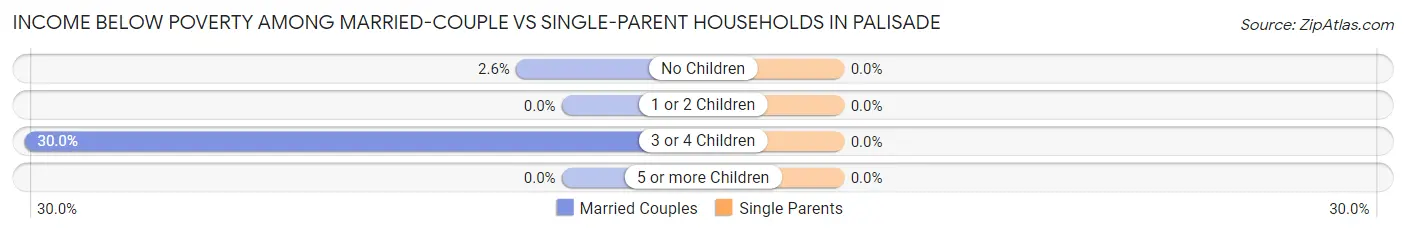
| Children | Married-Couple Families | Single-Parent Households |
| No Children | 9 (2.6%) | 0 (0.0%) |
| 1 or 2 Children | 0 (0.0%) | 0 (0.0%) |
| 3 or 4 Children | 21 (30.0%) | 0 (0.0%) |
| 5 or more Children | 0 (0.0%) | 0 (0.0%) |
| Total | 30 (6.1%) | 0 (0.0%) |
Race in Palisade
The most populous races in Palisade are White / Caucasian (2,203 | 85.7%), Two or more Races (350 | 13.6%), and Hispanic or Latino (333 | 13.0%).
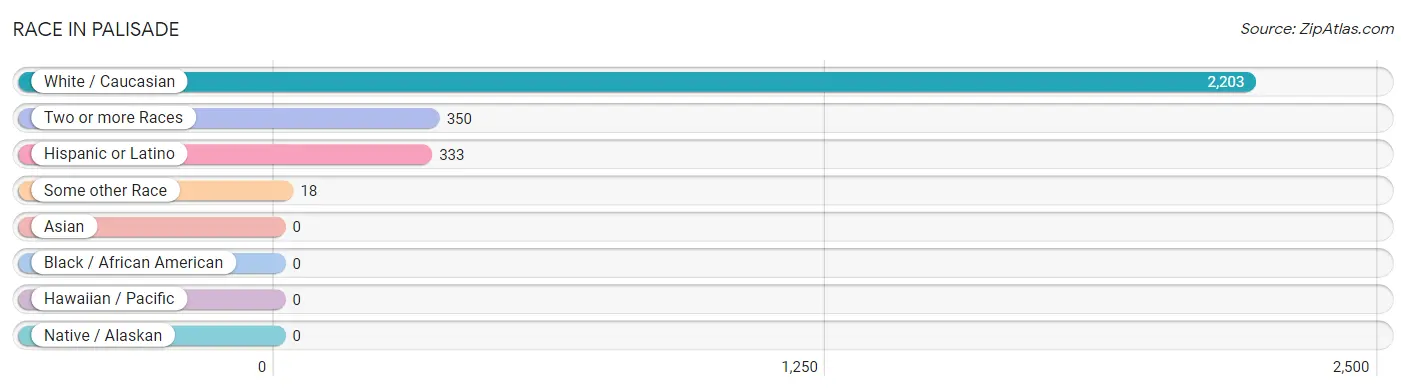
| Race | # Population | % Population |
| Asian | 0 | 0.0% |
| Black / African American | 0 | 0.0% |
| Hawaiian / Pacific | 0 | 0.0% |
| Hispanic or Latino | 333 | 13.0% |
| Native / Alaskan | 0 | 0.0% |
| White / Caucasian | 2,203 | 85.7% |
| Two or more Races | 350 | 13.6% |
| Some other Race | 18 | 0.7% |
| Total | 2,571 | 100.0% |
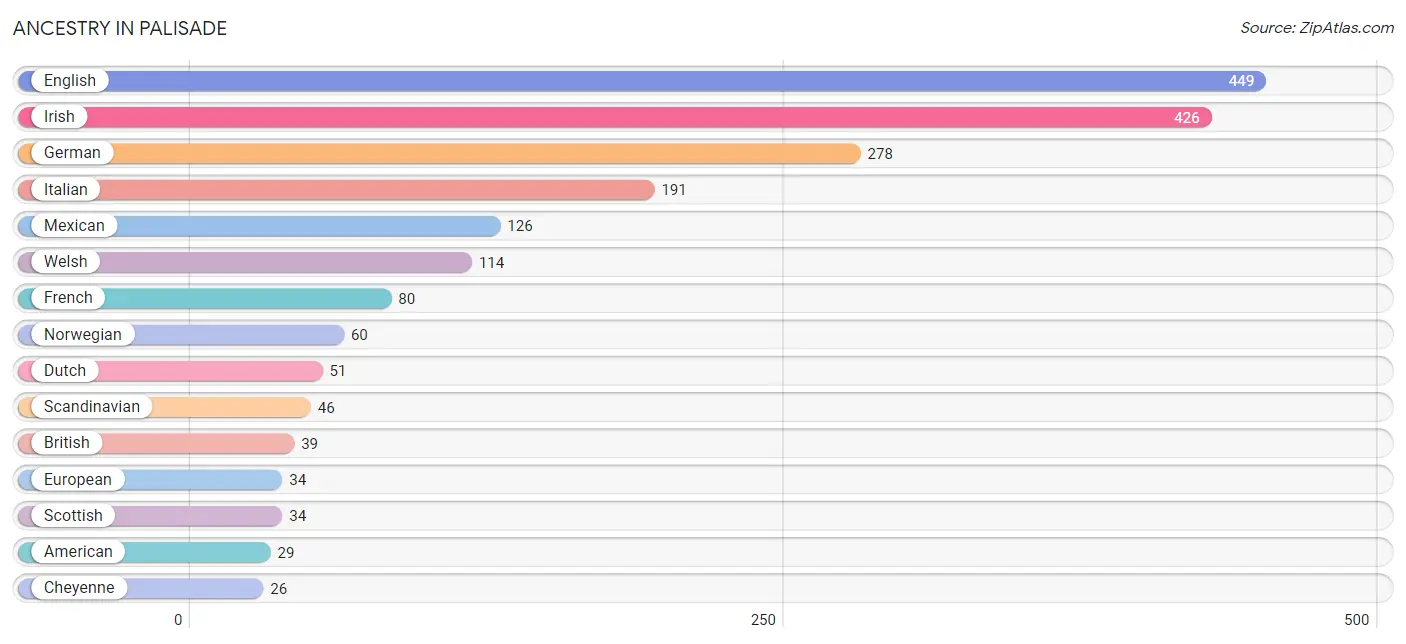
Ancestry in Palisade
The most populous ancestries reported in Palisade are English (449 | 17.5%), Irish (426 | 16.6%), German (278 | 10.8%), Italian (191 | 7.4%), and Mexican (126 | 4.9%), together accounting for 57.2% of all Palisade residents.
| Ancestry | # Population | % Population |
| American | 29 | 1.1% |
| British | 39 | 1.5% |
| Cherokee | 23 | 0.9% |
| Cheyenne | 26 | 1.0% |
| Croatian | 10 | 0.4% |
| Danish | 17 | 0.7% |
| Dutch | 51 | 2.0% |
| Eastern European | 12 | 0.5% |
| English | 449 | 17.5% |
| European | 34 | 1.3% |
| French | 80 | 3.1% |
| German | 278 | 10.8% |
| Greek | 22 | 0.9% |
| Irish | 426 | 16.6% |
| Italian | 191 | 7.4% |
| Mexican | 126 | 4.9% |
| Northern European | 20 | 0.8% |
| Norwegian | 60 | 2.3% |
| Polish | 9 | 0.4% |
| Potawatomi | 20 | 0.8% |
| Scandinavian | 46 | 1.8% |
| Scotch-Irish | 6 | 0.2% |
| Scottish | 34 | 1.3% |
| Sioux | 10 | 0.4% |
| Swedish | 14 | 0.5% |
| Swiss | 8 | 0.3% |
| Welsh | 114 | 4.4% | View All 27 Rows |
Immigrants in Palisade
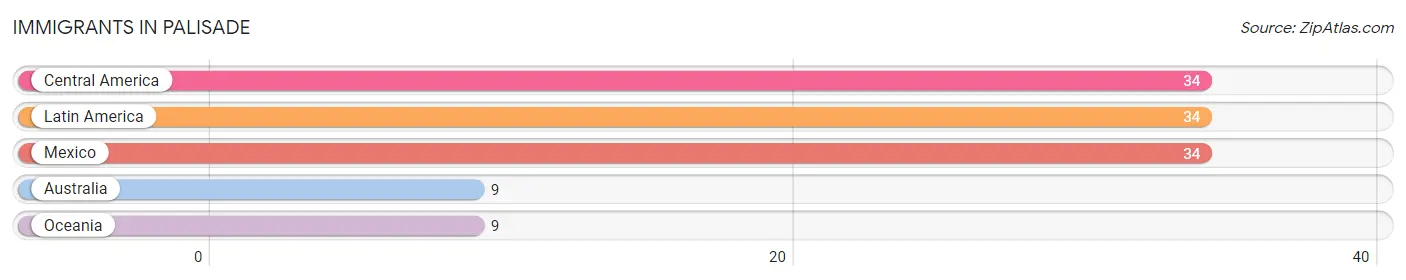
The most numerous immigrant groups reported in Palisade came from Central America (34 | 1.3%), Latin America (34 | 1.3%), Mexico (34 | 1.3%), Australia (9 | 0.4%), and Oceania (9 | 0.4%), together accounting for 4.7% of all Palisade residents.
| Immigration Origin | # Population | % Population |
| Australia | 9 | 0.4% |
| Central America | 34 | 1.3% |
| Latin America | 34 | 1.3% |
| Mexico | 34 | 1.3% |
| Oceania | 9 | 0.4% | View All 5 Rows |
Sex and Age in Palisade
Sex and Age in Palisade
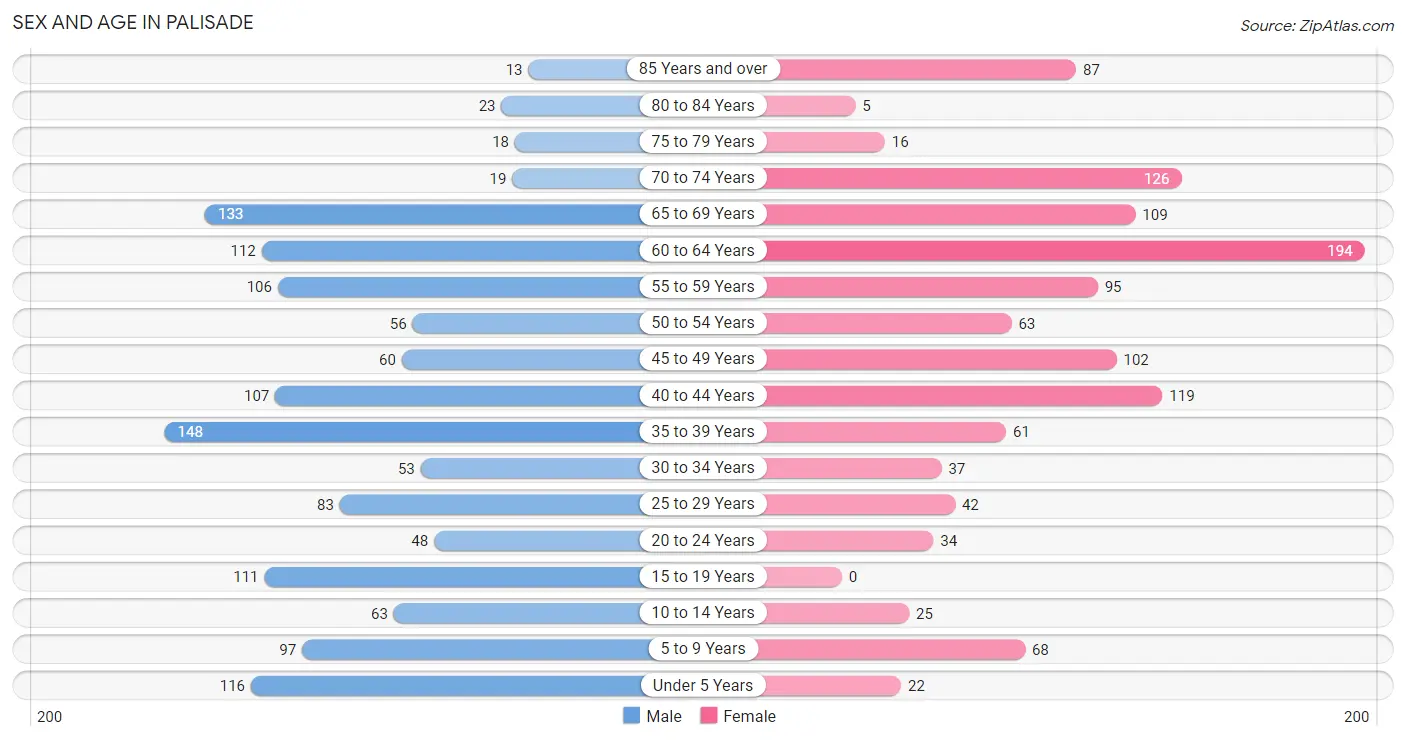
The most populous age groups in Palisade are 35 to 39 Years (148 | 10.8%) for men and 60 to 64 Years (194 | 16.1%) for women.
| Age Bracket | Male | Female |
| Under 5 Years | 116 (8.5%) | 22 (1.8%) |
| 5 to 9 Years | 97 (7.1%) | 68 (5.6%) |
| 10 to 14 Years | 63 (4.6%) | 25 (2.1%) |
| 15 to 19 Years | 111 (8.1%) | 0 (0.0%) |
| 20 to 24 Years | 48 (3.5%) | 34 (2.8%) |
| 25 to 29 Years | 83 (6.1%) | 42 (3.5%) |
| 30 to 34 Years | 53 (3.9%) | 37 (3.1%) |
| 35 to 39 Years | 148 (10.8%) | 61 (5.1%) |
| 40 to 44 Years | 107 (7.8%) | 119 (9.9%) |
| 45 to 49 Years | 60 (4.4%) | 102 (8.5%) |
| 50 to 54 Years | 56 (4.1%) | 63 (5.2%) |
| 55 to 59 Years | 106 (7.8%) | 95 (7.9%) |
| 60 to 64 Years | 112 (8.2%) | 194 (16.1%) |
| 65 to 69 Years | 133 (9.7%) | 109 (9.0%) |
| 70 to 74 Years | 19 (1.4%) | 126 (10.5%) |
| 75 to 79 Years | 18 (1.3%) | 16 (1.3%) |
| 80 to 84 Years | 23 (1.7%) | 5 (0.4%) |
| 85 Years and over | 13 (0.9%) | 87 (7.2%) |
| Total | 1,366 (100.0%) | 1,205 (100.0%) |
Families and Households in Palisade
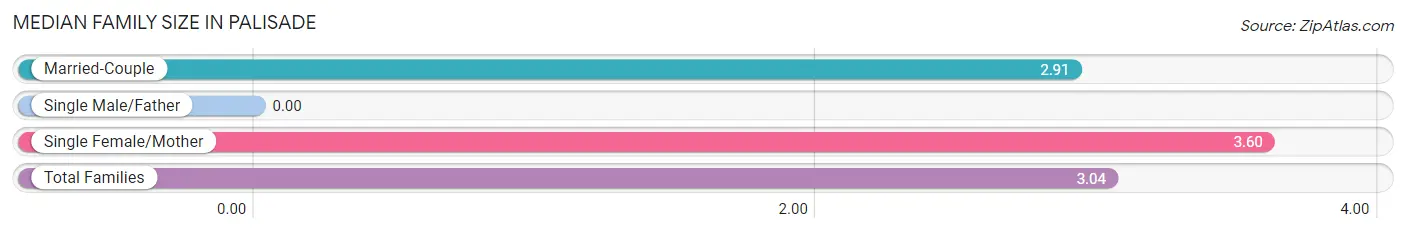
Median Family Size in Palisade
| Family Type | # Families | Family Size |
| Married-Couple | 495 (80.6%) | 2.91 |
| Single Male/Father | 0 (0.0%) | - |
| Single Female/Mother | 119 (19.4%) | 3.60 |
| Total Families | 614 (100.0%) | 3.04 |
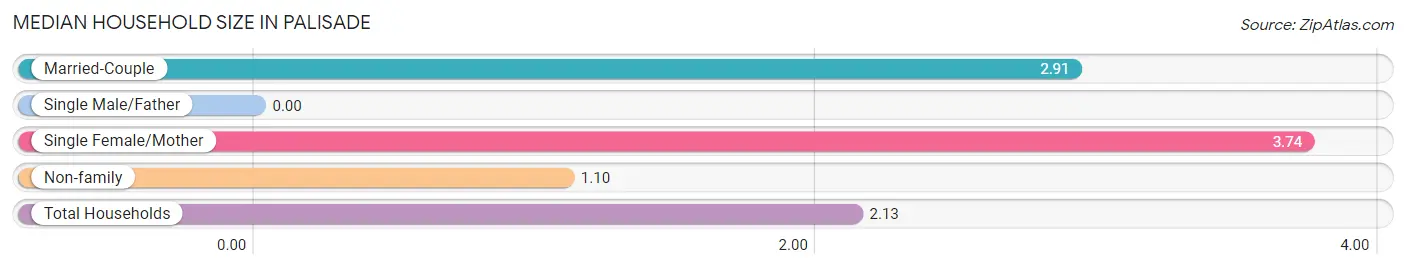
Median Household Size in Palisade
| Household Type | # Households | Household Size |
| Married-Couple | 495 (42.3%) | 2.91 |
| Single Male/Father | 0 (0.0%) | - |
| Single Female/Mother | 119 (10.2%) | 3.74 |
| Non-family | 557 (47.6%) | 1.10 |
| Total Households | 1,171 (100.0%) | 2.13 |
Household Size by Marriage Status in Palisade
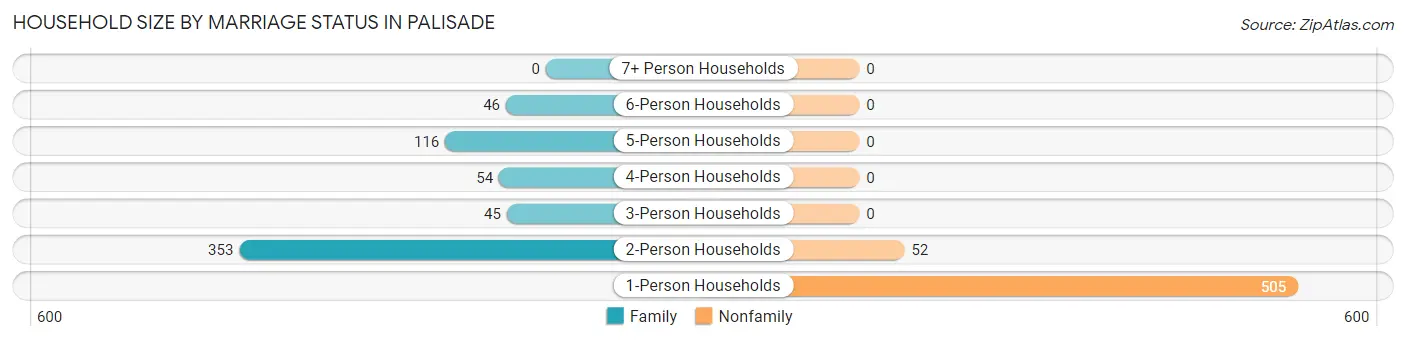
Out of a total of 1,171 households in Palisade, 614 (52.4%) are family households, while 557 (47.6%) are nonfamily households. The most numerous type of family households are 2-person households, comprising 353, and the most common type of nonfamily households are 1-person households, comprising 505.
| Household Size | Family Households | Nonfamily Households |
| 1-Person Households | - | 505 (43.1%) |
| 2-Person Households | 353 (30.1%) | 52 (4.4%) |
| 3-Person Households | 45 (3.8%) | 0 (0.0%) |
| 4-Person Households | 54 (4.6%) | 0 (0.0%) |
| 5-Person Households | 116 (9.9%) | 0 (0.0%) |
| 6-Person Households | 46 (3.9%) | 0 (0.0%) |
| 7+ Person Households | 0 (0.0%) | 0 (0.0%) |
| Total | 614 (52.4%) | 557 (47.6%) |
Female Fertility in Palisade
Fertility by Age in Palisade
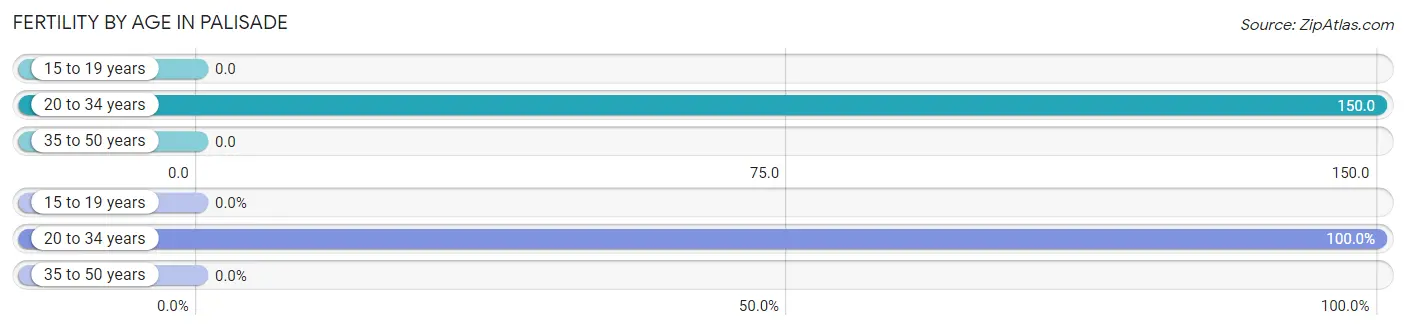
Average fertility rate in Palisade is 42.0 births per 1,000 women. Women in the age bracket of 20 to 34 years have the highest fertility rate with 150.0 births per 1,000 women. Women in the age bracket of 20 to 34 years acount for 100.0% of all women with births.
| Age Bracket | Women with Births | Births / 1,000 Women |
| 15 to 19 years | 0 (0.0%) | 0.0 |
| 20 to 34 years | 17 (100.0%) | 150.0 |
| 35 to 50 years | 0 (0.0%) | 0.0 |
| Total | 17 (100.0%) | 42.0 |
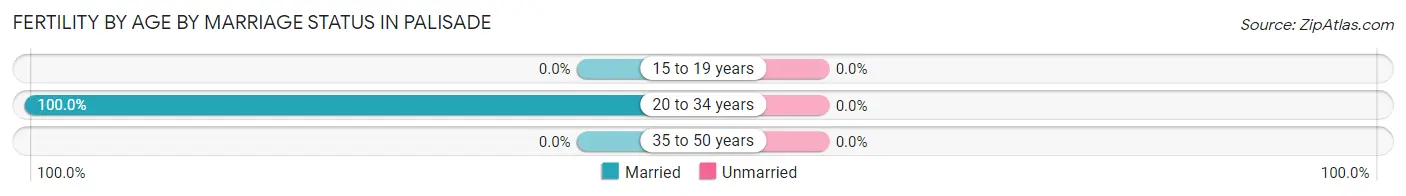
Fertility by Age by Marriage Status in Palisade
| Age Bracket | Married | Unmarried |
| 15 to 19 years | 0 (0.0%) | 0 (0.0%) |
| 20 to 34 years | 17 (100.0%) | 0 (0.0%) |
| 35 to 50 years | 0 (0.0%) | 0 (0.0%) |
| Total | 17 (100.0%) | 0 (0.0%) |
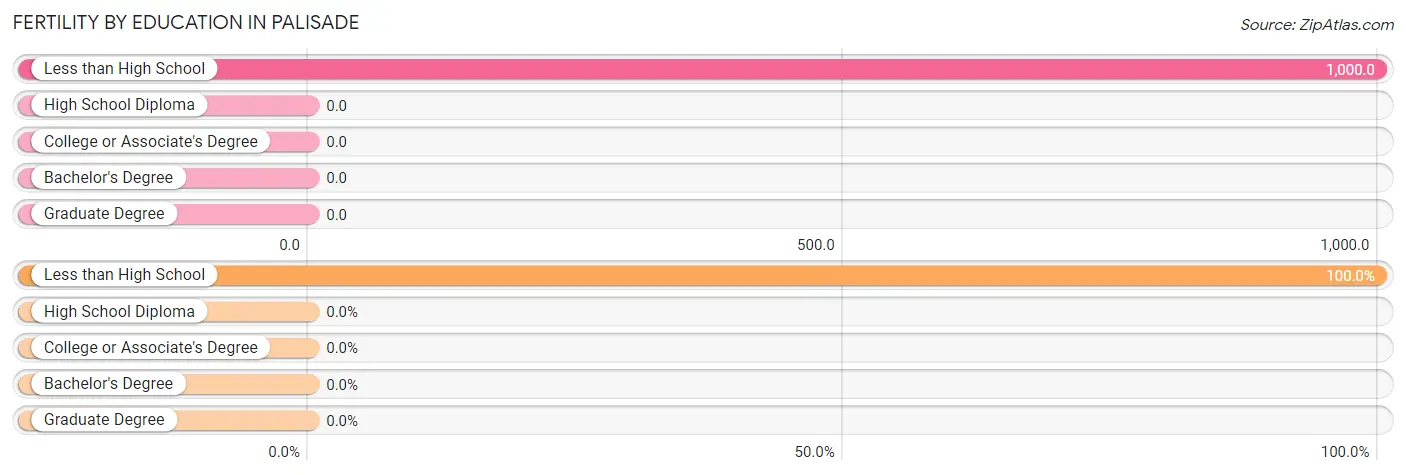
Fertility by Education in Palisade
| Educational Attainment | Women with Births | Births / 1,000 Women |
| Less than High School | 17 (100.0%) | 1,000.0 |
| High School Diploma | 0 (0.0%) | 0.0 |
| College or Associate's Degree | 0 (0.0%) | 0.0 |
| Bachelor's Degree | 0 (0.0%) | 0.0 |
| Graduate Degree | 0 (0.0%) | 0.0 |
| Total | 17 (100.0%) | 42.0 |
Fertility by Education by Marriage Status in Palisade
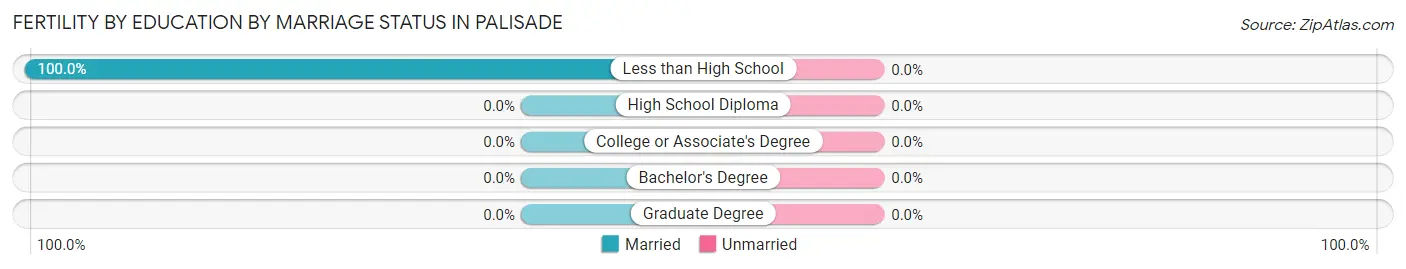
| Educational Attainment | Married | Unmarried |
| Less than High School | 17 (100.0%) | 0 (0.0%) |
| High School Diploma | 0 (0.0%) | 0 (0.0%) |
| College or Associate's Degree | 0 (0.0%) | 0 (0.0%) |
| Bachelor's Degree | 0 (0.0%) | 0 (0.0%) |
| Graduate Degree | 0 (0.0%) | 0 (0.0%) |
| Total | 17 (100.0%) | 0 (0.0%) |
Employment Characteristics in Palisade
Employment by Class of Employer in Palisade
Among the 1,249 employed individuals in Palisade, private company employees (629 | 50.4%), self-employed (incorporated) (224 | 17.9%), and self-employed (not incorporated) (157 | 12.6%) make up the most common classes of employment.
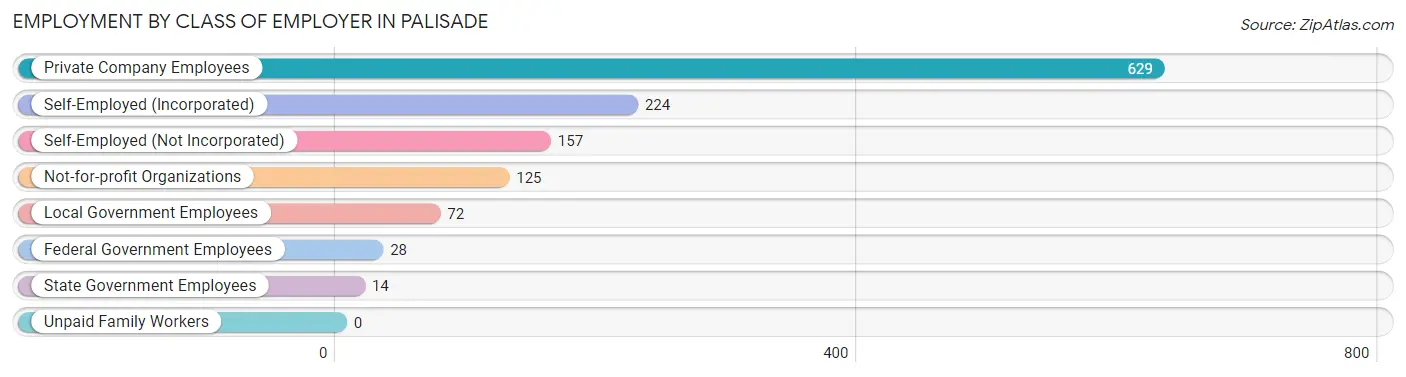
| Employer Class | # Employees | % Employees |
| Private Company Employees | 629 | 50.4% |
| Self-Employed (Incorporated) | 224 | 17.9% |
| Self-Employed (Not Incorporated) | 157 | 12.6% |
| Not-for-profit Organizations | 125 | 10.0% |
| Local Government Employees | 72 | 5.8% |
| State Government Employees | 14 | 1.1% |
| Federal Government Employees | 28 | 2.2% |
| Unpaid Family Workers | 0 | 0.0% |
| Total | 1,249 | 100.0% |
Employment Status by Age in Palisade
According to the labor force statistics for Palisade, out of the total population over 16 years of age (2,140), 62.0% or 1,327 individuals are in the labor force, with 4.6% or 61 of them unemployed. The age group with the highest labor force participation rate is 45 to 54 years, with 92.9% or 261 individuals in the labor force. Within the labor force, the 20 to 24 years age range has the highest percentage of unemployed individuals, with 19.1% or 13 of them being unemployed.
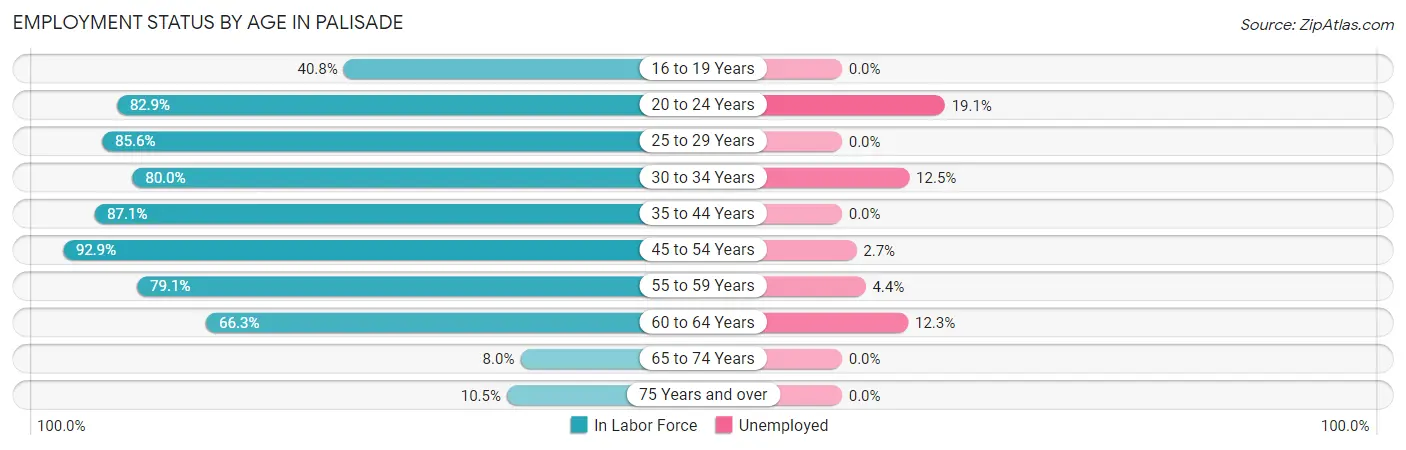
| Age Bracket | In Labor Force | Unemployed |
| 16 to 19 Years | 29 (40.8%) | 0 (0.0%) |
| 20 to 24 Years | 68 (82.9%) | 13 (19.1%) |
| 25 to 29 Years | 107 (85.6%) | 0 (0.0%) |
| 30 to 34 Years | 72 (80.0%) | 9 (12.5%) |
| 35 to 44 Years | 379 (87.1%) | 0 (0.0%) |
| 45 to 54 Years | 261 (92.9%) | 7 (2.7%) |
| 55 to 59 Years | 159 (79.1%) | 7 (4.4%) |
| 60 to 64 Years | 203 (66.3%) | 25 (12.3%) |
| 65 to 74 Years | 31 (8.0%) | 0 (0.0%) |
| 75 Years and over | 17 (10.5%) | 0 (0.0%) |
| Total | 1,327 (62.0%) | 61 (4.6%) |
Employment Status by Educational Attainment in Palisade
According to labor force statistics for Palisade, 82.1% of individuals (1,181) out of the total population between 25 and 64 years of age (1,438) are in the labor force, with 4.1% or 48 of them being unemployed. The group with the highest labor force participation rate are those with the educational attainment of bachelor's degree or higher, with 100.0% or 382 individuals in the labor force. Within the labor force, individuals with high school diploma education have the highest percentage of unemployment, with 14.6% or 41 of them being unemployed.
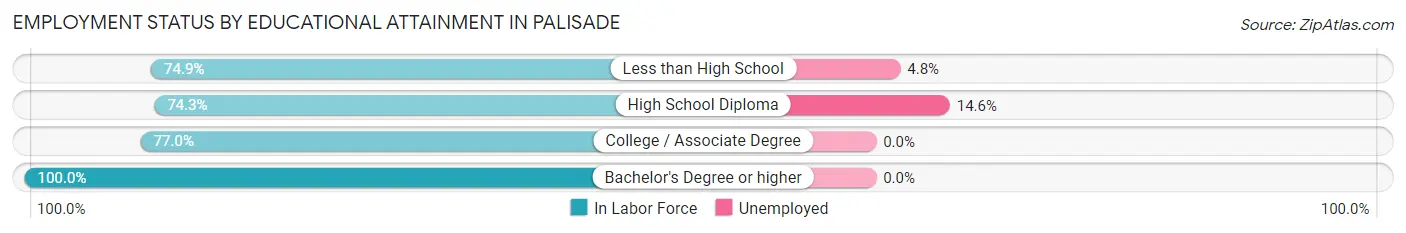
| Educational Attainment | In Labor Force | Unemployed |
| Less than High School | 146 (74.9%) | 9 (4.8%) |
| High School Diploma | 281 (74.3%) | 55 (14.6%) |
| College / Associate Degree | 372 (77.0%) | 0 (0.0%) |
| Bachelor's Degree or higher | 382 (100.0%) | 0 (0.0%) |
| Total | 1,181 (82.1%) | 59 (4.1%) |
Employment Occupations by Sex in Palisade
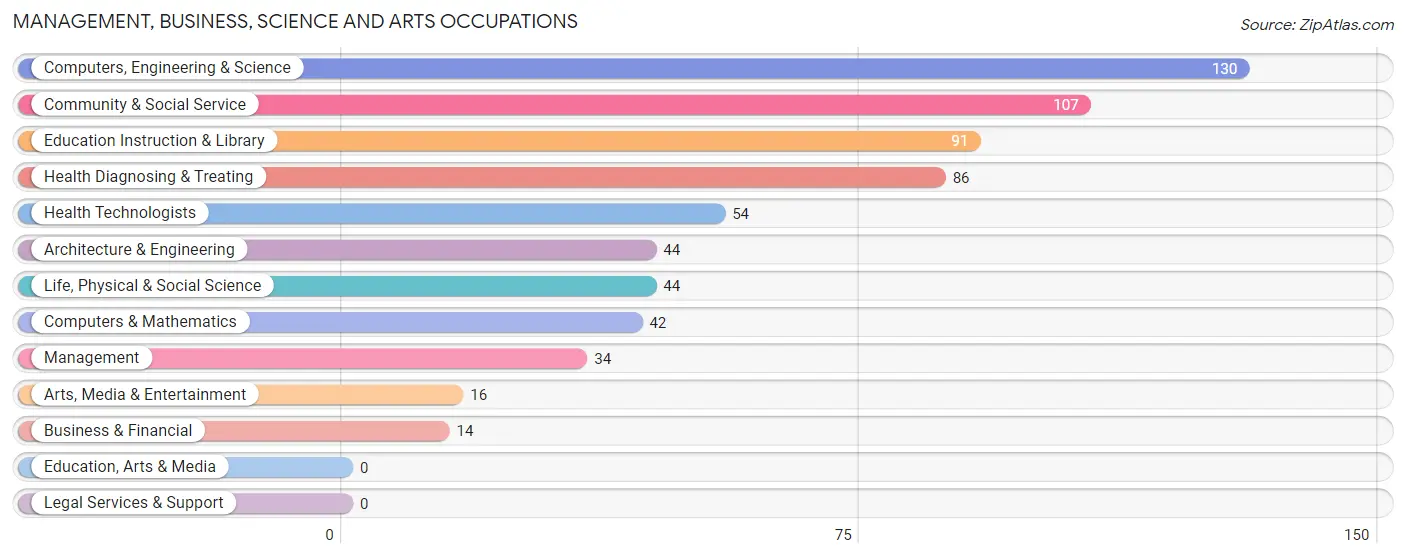
Management, Business, Science and Arts Occupations
The most common Management, Business, Science and Arts occupations in Palisade are Computers, Engineering & Science (130 | 10.3%), Community & Social Service (107 | 8.5%), Education Instruction & Library (91 | 7.2%), Health Diagnosing & Treating (86 | 6.8%), and Health Technologists (54 | 4.3%).
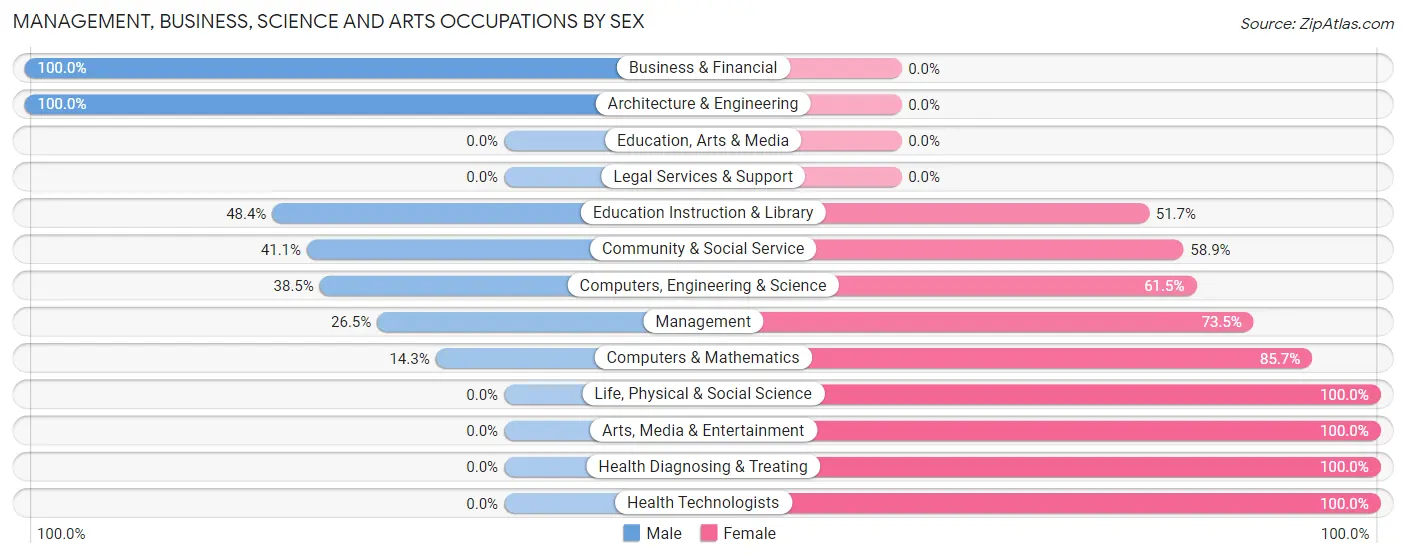
Management, Business, Science and Arts Occupations by Sex
Within the Management, Business, Science and Arts occupations in Palisade, the most male-oriented occupations are Business & Financial (100.0%), Architecture & Engineering (100.0%), and Education Instruction & Library (48.3%), while the most female-oriented occupations are Life, Physical & Social Science (100.0%), Arts, Media & Entertainment (100.0%), and Health Diagnosing & Treating (100.0%).
| Occupation | Male | Female |
| Management | 9 (26.5%) | 25 (73.5%) |
| Business & Financial | 14 (100.0%) | 0 (0.0%) |
| Computers, Engineering & Science | 50 (38.5%) | 80 (61.5%) |
| Computers & Mathematics | 6 (14.3%) | 36 (85.7%) |
| Architecture & Engineering | 44 (100.0%) | 0 (0.0%) |
| Life, Physical & Social Science | 0 (0.0%) | 44 (100.0%) |
| Community & Social Service | 44 (41.1%) | 63 (58.9%) |
| Education, Arts & Media | 0 (0.0%) | 0 (0.0%) |
| Legal Services & Support | 0 (0.0%) | 0 (0.0%) |
| Education Instruction & Library | 44 (48.3%) | 47 (51.6%) |
| Arts, Media & Entertainment | 0 (0.0%) | 16 (100.0%) |
| Health Diagnosing & Treating | 0 (0.0%) | 86 (100.0%) |
| Health Technologists | 0 (0.0%) | 54 (100.0%) |
| Total (Category) | 117 (31.5%) | 254 (68.5%) |
| Total (Overall) | 661 (52.2%) | 604 (47.7%) |
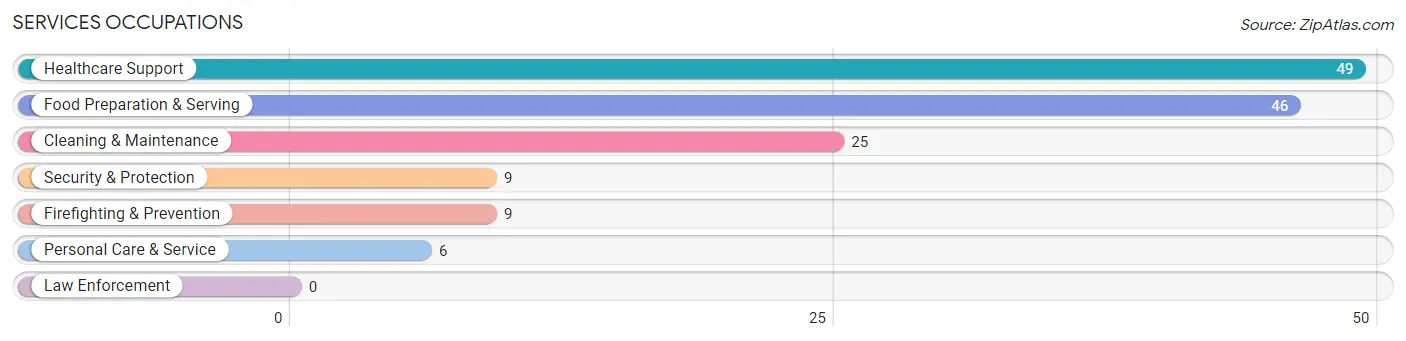
Services Occupations
The most common Services occupations in Palisade are Healthcare Support (49 | 3.9%), Food Preparation & Serving (46 | 3.6%), Cleaning & Maintenance (25 | 2.0%), Security & Protection (9 | 0.7%), and Firefighting & Prevention (9 | 0.7%).
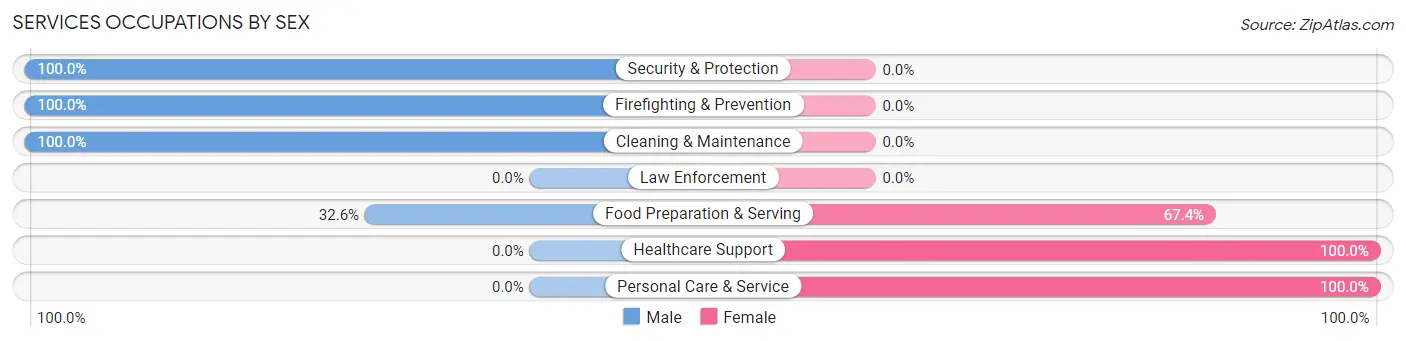
Services Occupations by Sex
Within the Services occupations in Palisade, the most male-oriented occupations are Security & Protection (100.0%), Firefighting & Prevention (100.0%), and Cleaning & Maintenance (100.0%), while the most female-oriented occupations are Healthcare Support (100.0%), Personal Care & Service (100.0%), and Food Preparation & Serving (67.4%).
| Occupation | Male | Female |
| Healthcare Support | 0 (0.0%) | 49 (100.0%) |
| Security & Protection | 9 (100.0%) | 0 (0.0%) |
| Firefighting & Prevention | 9 (100.0%) | 0 (0.0%) |
| Law Enforcement | 0 (0.0%) | 0 (0.0%) |
| Food Preparation & Serving | 15 (32.6%) | 31 (67.4%) |
| Cleaning & Maintenance | 25 (100.0%) | 0 (0.0%) |
| Personal Care & Service | 0 (0.0%) | 6 (100.0%) |
| Total (Category) | 49 (36.3%) | 86 (63.7%) |
| Total (Overall) | 661 (52.2%) | 604 (47.7%) |
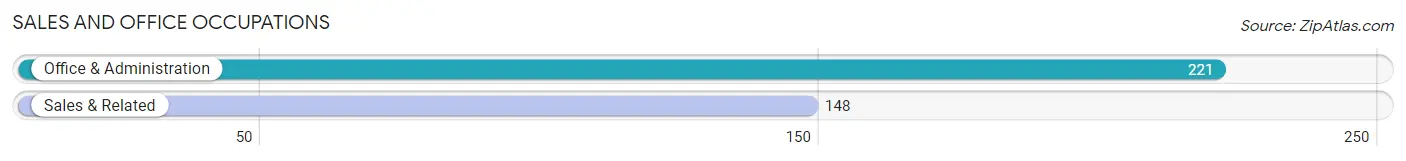
Sales and Office Occupations
The most common Sales and Office occupations in Palisade are Office & Administration (221 | 17.5%), and Sales & Related (148 | 11.7%).
Sales and Office Occupations by Sex
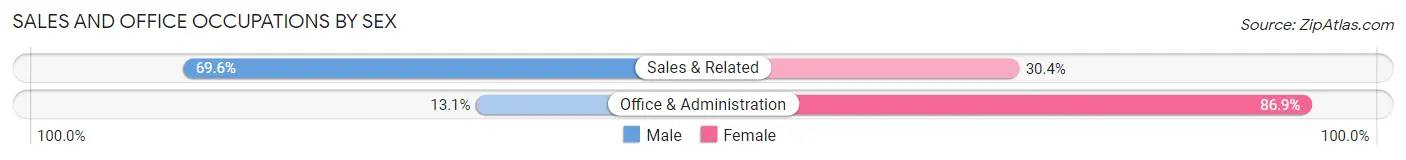
| Occupation | Male | Female |
| Sales & Related | 103 (69.6%) | 45 (30.4%) |
| Office & Administration | 29 (13.1%) | 192 (86.9%) |
| Total (Category) | 132 (35.8%) | 237 (64.2%) |
| Total (Overall) | 661 (52.2%) | 604 (47.7%) |
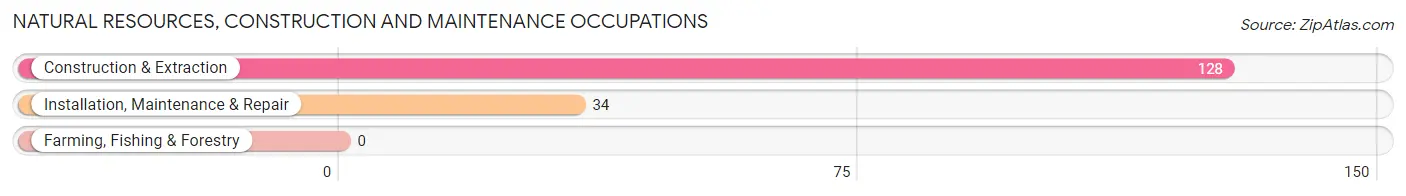
Natural Resources, Construction and Maintenance Occupations
The most common Natural Resources, Construction and Maintenance occupations in Palisade are Construction & Extraction (128 | 10.1%), and Installation, Maintenance & Repair (34 | 2.7%).
Natural Resources, Construction and Maintenance Occupations by Sex
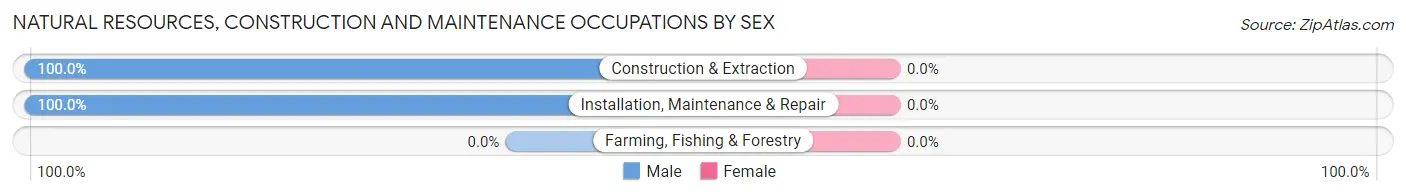
| Occupation | Male | Female |
| Farming, Fishing & Forestry | 0 (0.0%) | 0 (0.0%) |
| Construction & Extraction | 128 (100.0%) | 0 (0.0%) |
| Installation, Maintenance & Repair | 34 (100.0%) | 0 (0.0%) |
| Total (Category) | 162 (100.0%) | 0 (0.0%) |
| Total (Overall) | 661 (52.2%) | 604 (47.7%) |
Production, Transportation and Moving Occupations
The most common Production, Transportation and Moving occupations in Palisade are Material Moving (102 | 8.1%), Production (63 | 5.0%), and Transportation (63 | 5.0%).
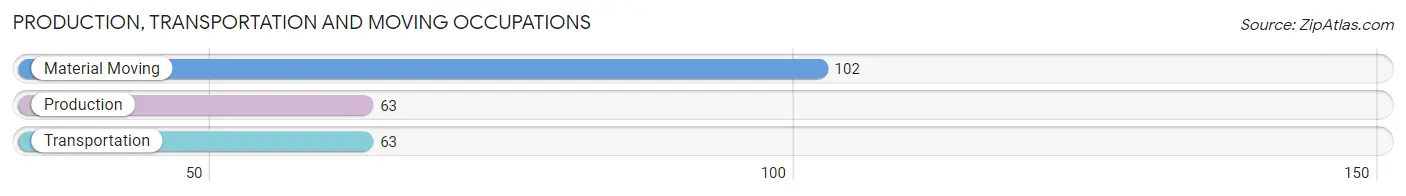
Production, Transportation and Moving Occupations by Sex
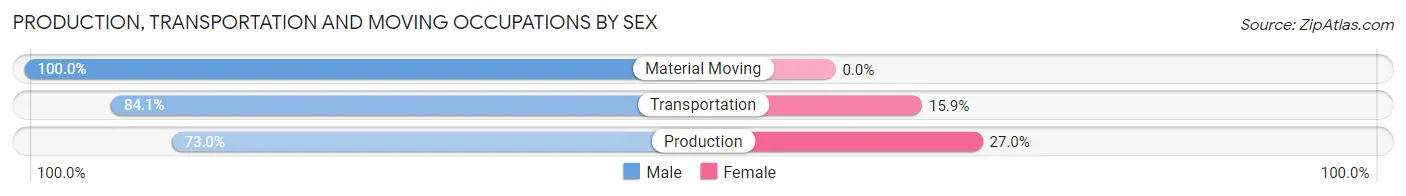
| Occupation | Male | Female |
| Production | 46 (73.0%) | 17 (27.0%) |
| Transportation | 53 (84.1%) | 10 (15.9%) |
| Material Moving | 102 (100.0%) | 0 (0.0%) |
| Total (Category) | 201 (88.2%) | 27 (11.8%) |
| Total (Overall) | 661 (52.2%) | 604 (47.7%) |
Employment Industries by Sex in Palisade
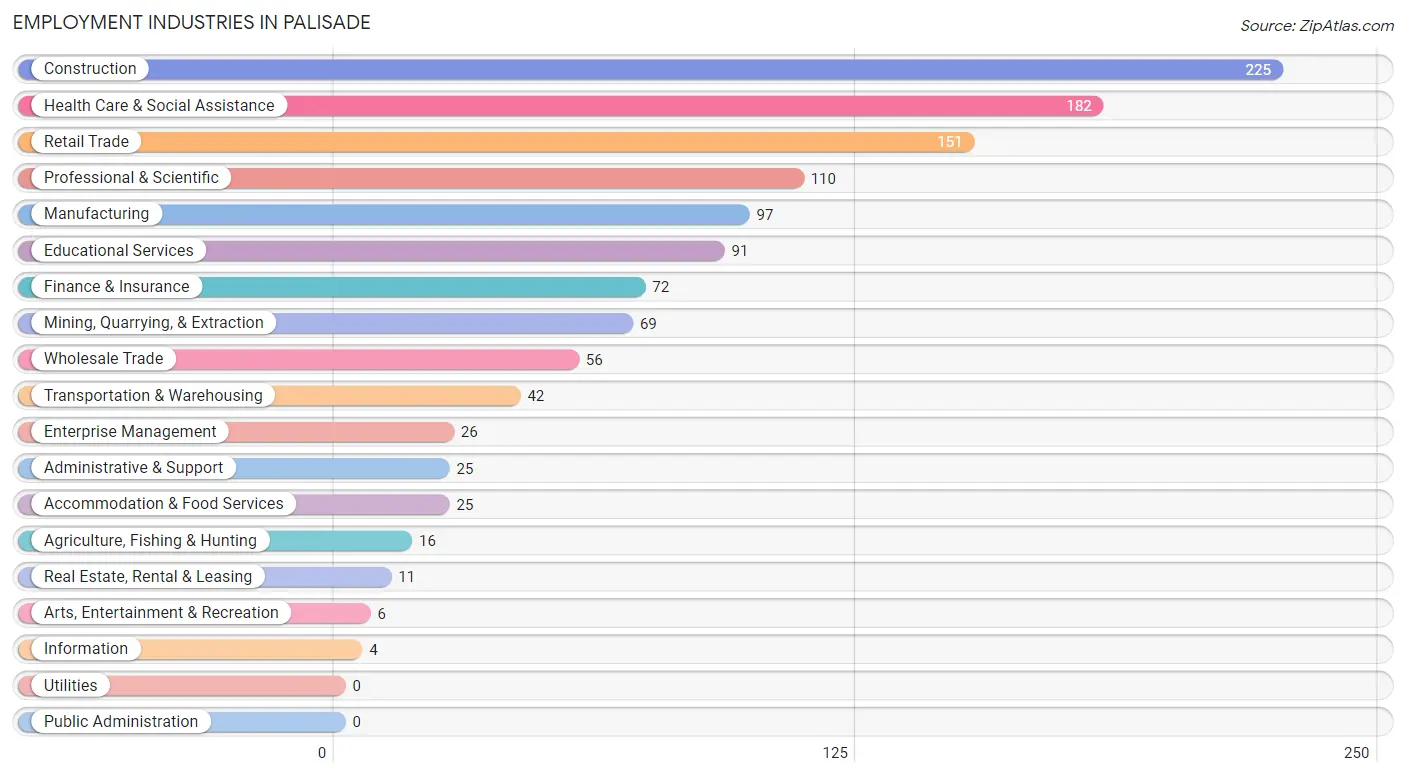
Employment Industries in Palisade
The major employment industries in Palisade include Construction (225 | 17.8%), Health Care & Social Assistance (182 | 14.4%), Retail Trade (151 | 11.9%), Professional & Scientific (110 | 8.7%), and Manufacturing (97 | 7.7%).
Employment Industries by Sex in Palisade
The Palisade industries that see more men than women are Mining, Quarrying, & Extraction (100.0%), Wholesale Trade (100.0%), and Real Estate, Rental & Leasing (100.0%), whereas the industries that tend to have a higher number of women are Agriculture, Fishing & Hunting (100.0%), Information (100.0%), and Enterprise Management (100.0%).
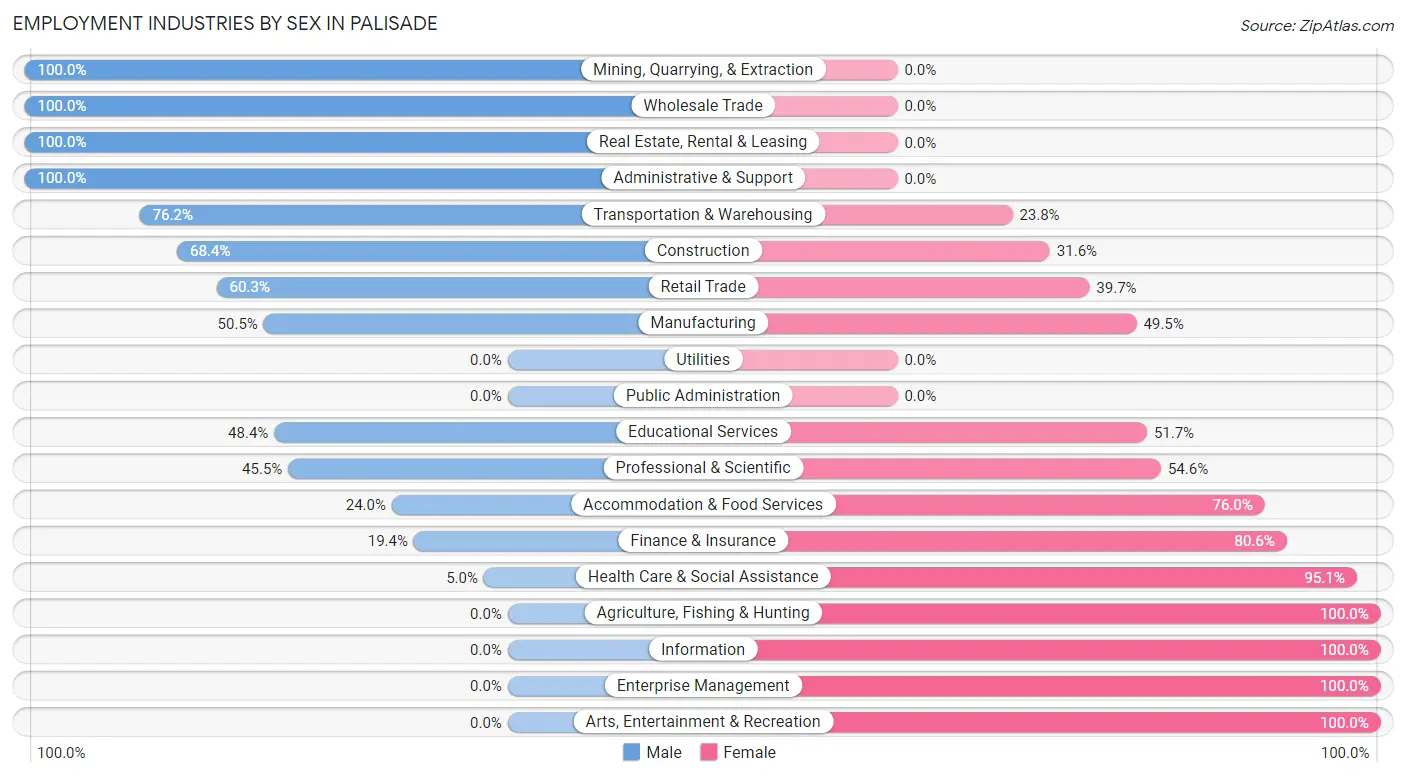
| Industry | Male | Female |
| Agriculture, Fishing & Hunting | 0 (0.0%) | 16 (100.0%) |
| Mining, Quarrying, & Extraction | 69 (100.0%) | 0 (0.0%) |
| Construction | 154 (68.4%) | 71 (31.6%) |
| Manufacturing | 49 (50.5%) | 48 (49.5%) |
| Wholesale Trade | 56 (100.0%) | 0 (0.0%) |
| Retail Trade | 91 (60.3%) | 60 (39.7%) |
| Transportation & Warehousing | 32 (76.2%) | 10 (23.8%) |
| Utilities | 0 (0.0%) | 0 (0.0%) |
| Information | 0 (0.0%) | 4 (100.0%) |
| Finance & Insurance | 14 (19.4%) | 58 (80.6%) |
| Real Estate, Rental & Leasing | 11 (100.0%) | 0 (0.0%) |
| Professional & Scientific | 50 (45.5%) | 60 (54.5%) |
| Enterprise Management | 0 (0.0%) | 26 (100.0%) |
| Administrative & Support | 25 (100.0%) | 0 (0.0%) |
| Educational Services | 44 (48.3%) | 47 (51.6%) |
| Health Care & Social Assistance | 9 (5.0%) | 173 (95.1%) |
| Arts, Entertainment & Recreation | 0 (0.0%) | 6 (100.0%) |
| Accommodation & Food Services | 6 (24.0%) | 19 (76.0%) |
| Public Administration | 0 (0.0%) | 0 (0.0%) |
| Total | 661 (52.2%) | 604 (47.7%) |
Education in Palisade
School Enrollment in Palisade
The most common levels of schooling among the 373 students in Palisade are high school (106 | 28.4%), elementary school (76 | 20.4%), and middle school (74 | 19.8%).
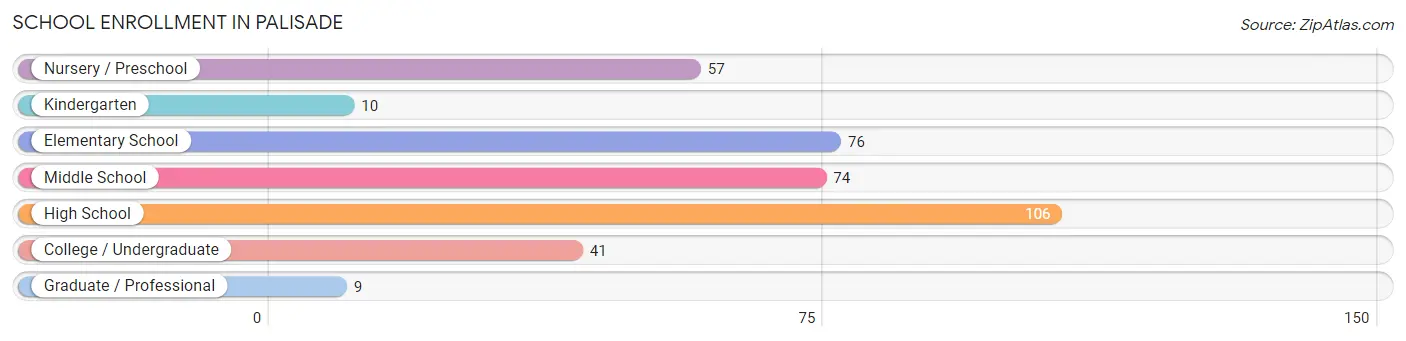
| School Level | # Students | % Students |
| Nursery / Preschool | 57 | 15.3% |
| Kindergarten | 10 | 2.7% |
| Elementary School | 76 | 20.4% |
| Middle School | 74 | 19.8% |
| High School | 106 | 28.4% |
| College / Undergraduate | 41 | 11.0% |
| Graduate / Professional | 9 | 2.4% |
| Total | 373 | 100.0% |
School Enrollment by Age by Funding Source in Palisade
Out of a total of 373 students who are enrolled in schools in Palisade, 43 (11.5%) attend a private institution, while the remaining 330 (88.5%) are enrolled in public schools. The age group of 5 to 9 year old has the highest likelihood of being enrolled in private schools, with 36 (26.5% in the age bracket) enrolled. Conversely, the age group of 15 to 17 year olds has the lowest likelihood of being enrolled in a private school, with 84 (100.0% in the age bracket) attending a public institution.
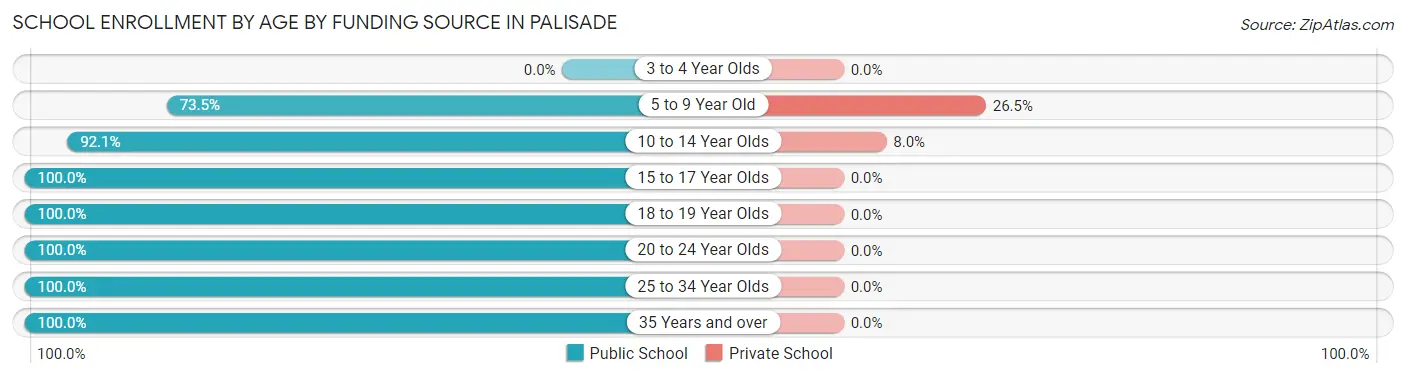
| Age Bracket | Public School | Private School |
| 3 to 4 Year Olds | 0 (0.0%) | 0 (0.0%) |
| 5 to 9 Year Old | 100 (73.5%) | 36 (26.5%) |
| 10 to 14 Year Olds | 81 (92.0%) | 7 (8.0%) |
| 15 to 17 Year Olds | 84 (100.0%) | 0 (0.0%) |
| 18 to 19 Year Olds | 15 (100.0%) | 0 (0.0%) |
| 20 to 24 Year Olds | 16 (100.0%) | 0 (0.0%) |
| 25 to 34 Year Olds | 8 (100.0%) | 0 (0.0%) |
| 35 Years and over | 26 (100.0%) | 0 (0.0%) |
| Total | 330 (88.5%) | 43 (11.5%) |
Educational Attainment by Field of Study in Palisade
Business (130 | 23.1%), arts & humanities (77 | 13.7%), bio, nature & agricultural (75 | 13.3%), science & technology (58 | 10.3%), and education (51 | 9.1%) are the most common fields of study among 563 individuals in Palisade who have obtained a bachelor's degree or higher.
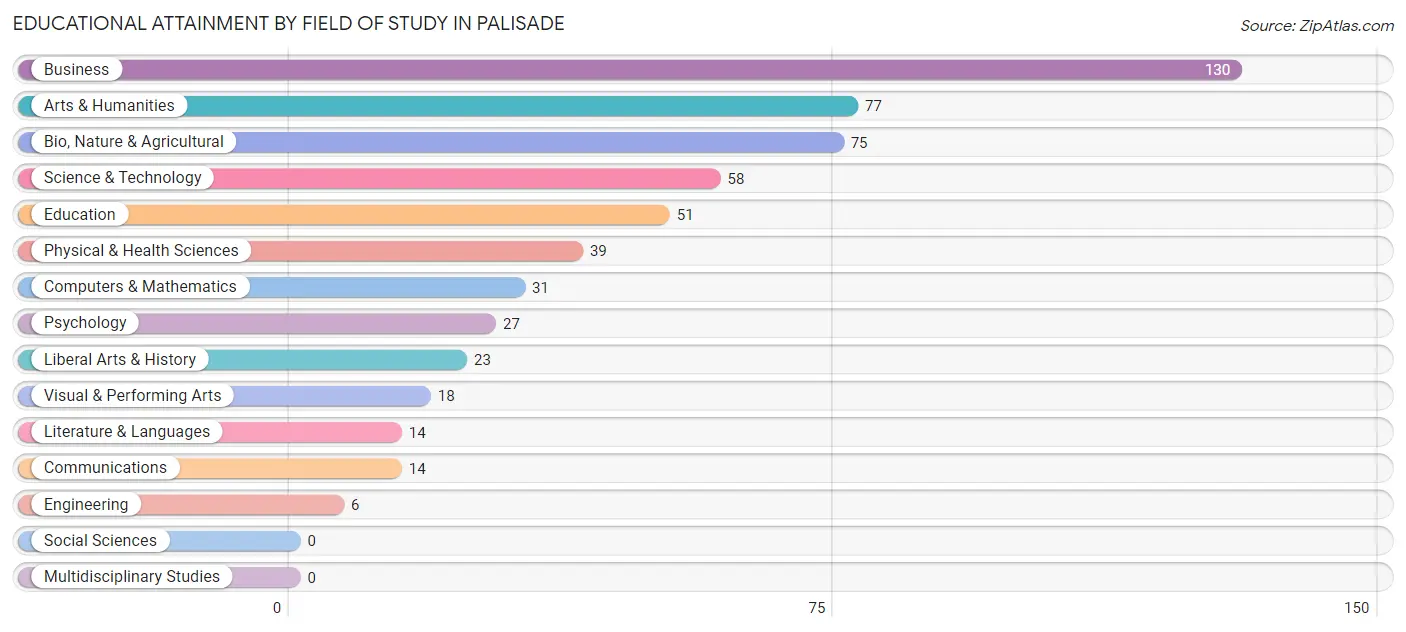
| Field of Study | # Graduates | % Graduates |
| Computers & Mathematics | 31 | 5.5% |
| Bio, Nature & Agricultural | 75 | 13.3% |
| Physical & Health Sciences | 39 | 6.9% |
| Psychology | 27 | 4.8% |
| Social Sciences | 0 | 0.0% |
| Engineering | 6 | 1.1% |
| Multidisciplinary Studies | 0 | 0.0% |
| Science & Technology | 58 | 10.3% |
| Business | 130 | 23.1% |
| Education | 51 | 9.1% |
| Literature & Languages | 14 | 2.5% |
| Liberal Arts & History | 23 | 4.1% |
| Visual & Performing Arts | 18 | 3.2% |
| Communications | 14 | 2.5% |
| Arts & Humanities | 77 | 13.7% |
| Total | 563 | 100.0% |
Transportation & Commute in Palisade
Vehicle Availability by Sex in Palisade
The most prevalent vehicle ownership categories in Palisade are males with 2 vehicles (304, accounting for 47.1%) and females with 2 vehicles (277, making up 50.3%).
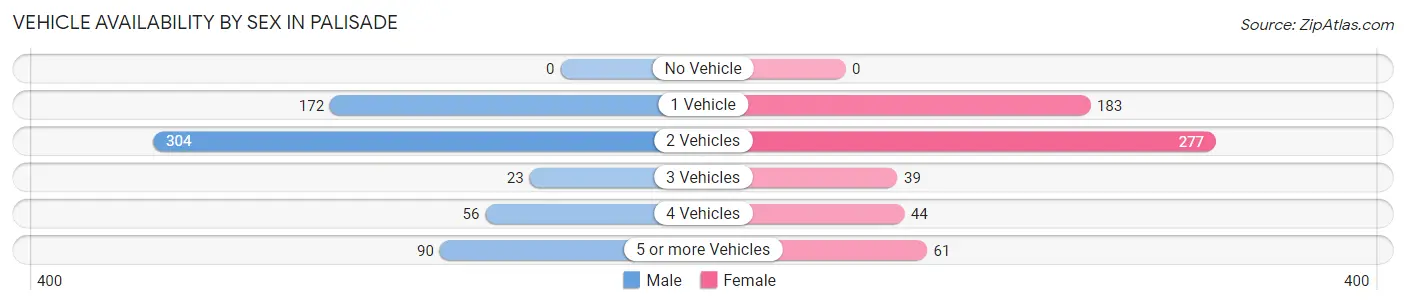
| Vehicles Available | Male | Female |
| No Vehicle | 0 (0.0%) | 0 (0.0%) |
| 1 Vehicle | 172 (26.7%) | 183 (30.3%) |
| 2 Vehicles | 304 (47.1%) | 277 (45.9%) |
| 3 Vehicles | 23 (3.6%) | 39 (6.5%) |
| 4 Vehicles | 56 (8.7%) | 44 (7.3%) |
| 5 or more Vehicles | 90 (14.0%) | 61 (10.1%) |
| Total | 645 (100.0%) | 604 (100.0%) |
Commute Time in Palisade
The most frequently occuring commute durations in Palisade are 20 to 24 minutes (247 commuters, 25.5%), 30 to 34 minutes (154 commuters, 15.9%), and 90 or more minutes (87 commuters, 9.0%).
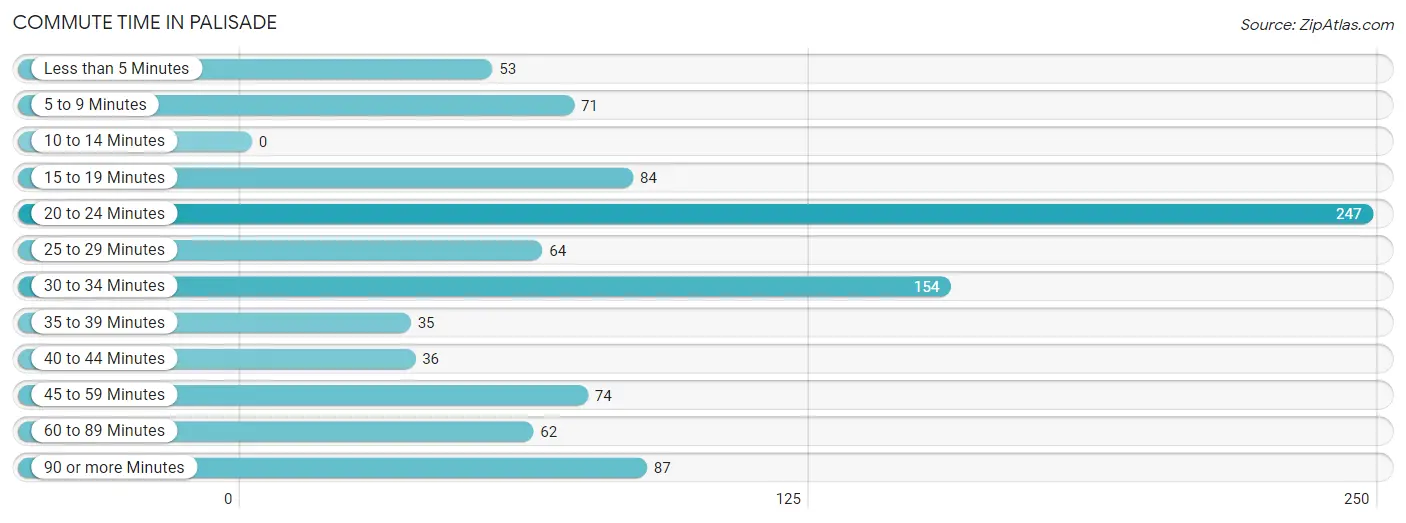
| Commute Time | # Commuters | % Commuters |
| Less than 5 Minutes | 53 | 5.5% |
| 5 to 9 Minutes | 71 | 7.3% |
| 10 to 14 Minutes | 0 | 0.0% |
| 15 to 19 Minutes | 84 | 8.7% |
| 20 to 24 Minutes | 247 | 25.5% |
| 25 to 29 Minutes | 64 | 6.6% |
| 30 to 34 Minutes | 154 | 15.9% |
| 35 to 39 Minutes | 35 | 3.6% |
| 40 to 44 Minutes | 36 | 3.7% |
| 45 to 59 Minutes | 74 | 7.6% |
| 60 to 89 Minutes | 62 | 6.4% |
| 90 or more Minutes | 87 | 9.0% |
Commute Time by Sex in Palisade
The most common commute times in Palisade are 20 to 24 minutes (132 commuters, 26.1%) for males and 20 to 24 minutes (115 commuters, 24.9%) for females.
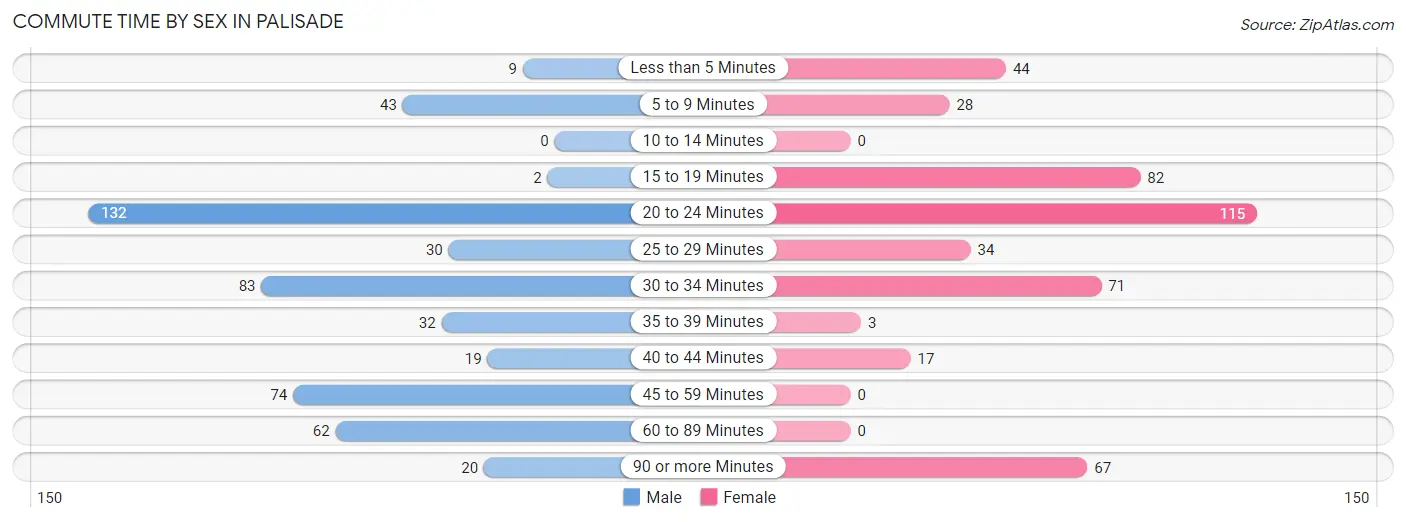
| Commute Time | Male | Female |
| Less than 5 Minutes | 9 (1.8%) | 44 (9.5%) |
| 5 to 9 Minutes | 43 (8.5%) | 28 (6.1%) |
| 10 to 14 Minutes | 0 (0.0%) | 0 (0.0%) |
| 15 to 19 Minutes | 2 (0.4%) | 82 (17.8%) |
| 20 to 24 Minutes | 132 (26.1%) | 115 (24.9%) |
| 25 to 29 Minutes | 30 (5.9%) | 34 (7.4%) |
| 30 to 34 Minutes | 83 (16.4%) | 71 (15.4%) |
| 35 to 39 Minutes | 32 (6.3%) | 3 (0.6%) |
| 40 to 44 Minutes | 19 (3.7%) | 17 (3.7%) |
| 45 to 59 Minutes | 74 (14.6%) | 0 (0.0%) |
| 60 to 89 Minutes | 62 (12.2%) | 0 (0.0%) |
| 90 or more Minutes | 20 (4.0%) | 67 (14.5%) |
Time of Departure to Work by Sex in Palisade
The most frequent times of departure to work in Palisade are 6:00 AM to 6:29 AM (144, 28.5%) for males and 7:00 AM to 7:29 AM (141, 30.6%) for females.
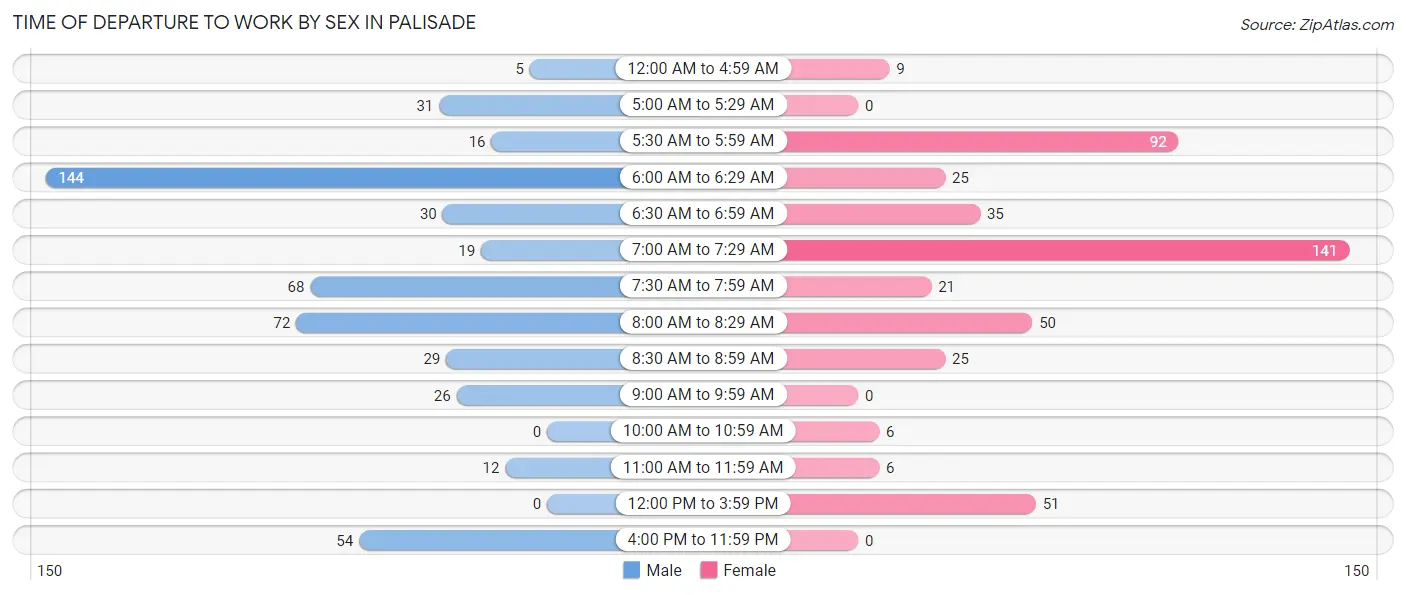
| Time of Departure | Male | Female |
| 12:00 AM to 4:59 AM | 5 (1.0%) | 9 (1.9%) |
| 5:00 AM to 5:29 AM | 31 (6.1%) | 0 (0.0%) |
| 5:30 AM to 5:59 AM | 16 (3.2%) | 92 (20.0%) |
| 6:00 AM to 6:29 AM | 144 (28.5%) | 25 (5.4%) |
| 6:30 AM to 6:59 AM | 30 (5.9%) | 35 (7.6%) |
| 7:00 AM to 7:29 AM | 19 (3.7%) | 141 (30.6%) |
| 7:30 AM to 7:59 AM | 68 (13.4%) | 21 (4.6%) |
| 8:00 AM to 8:29 AM | 72 (14.2%) | 50 (10.8%) |
| 8:30 AM to 8:59 AM | 29 (5.7%) | 25 (5.4%) |
| 9:00 AM to 9:59 AM | 26 (5.1%) | 0 (0.0%) |
| 10:00 AM to 10:59 AM | 0 (0.0%) | 6 (1.3%) |
| 11:00 AM to 11:59 AM | 12 (2.4%) | 6 (1.3%) |
| 12:00 PM to 3:59 PM | 0 (0.0%) | 51 (11.1%) |
| 4:00 PM to 11:59 PM | 54 (10.7%) | 0 (0.0%) |
| Total | 506 (100.0%) | 461 (100.0%) |
Housing Occupancy in Palisade
Occupancy by Ownership in Palisade
Of the total 1,171 dwellings in Palisade, owner-occupied units account for 864 (73.8%), while renter-occupied units make up 307 (26.2%).
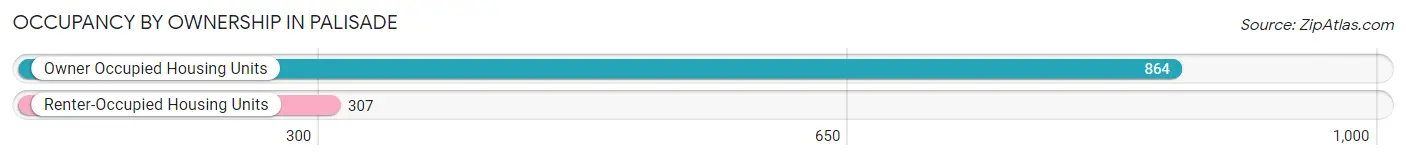
| Occupancy | # Housing Units | % Housing Units |
| Owner Occupied Housing Units | 864 | 73.8% |
| Renter-Occupied Housing Units | 307 | 26.2% |
| Total Occupied Housing Units | 1,171 | 100.0% |
Occupancy by Household Size in Palisade
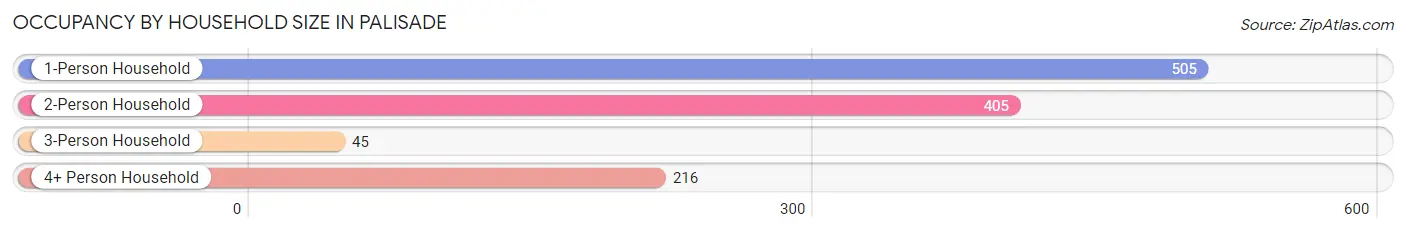
| Household Size | # Housing Units | % Housing Units |
| 1-Person Household | 505 | 43.1% |
| 2-Person Household | 405 | 34.6% |
| 3-Person Household | 45 | 3.8% |
| 4+ Person Household | 216 | 18.4% |
| Total Housing Units | 1,171 | 100.0% |
Occupancy by Ownership by Household Size in Palisade
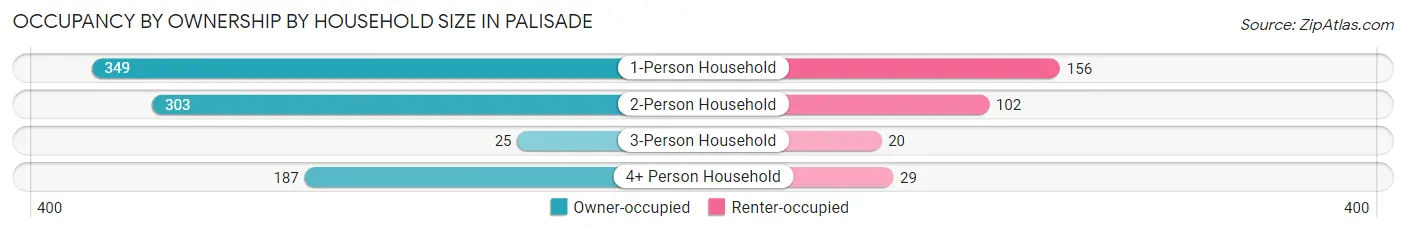
| Household Size | Owner-occupied | Renter-occupied |
| 1-Person Household | 349 (69.1%) | 156 (30.9%) |
| 2-Person Household | 303 (74.8%) | 102 (25.2%) |
| 3-Person Household | 25 (55.6%) | 20 (44.4%) |
| 4+ Person Household | 187 (86.6%) | 29 (13.4%) |
| Total Housing Units | 864 (73.8%) | 307 (26.2%) |
Occupancy by Educational Attainment in Palisade
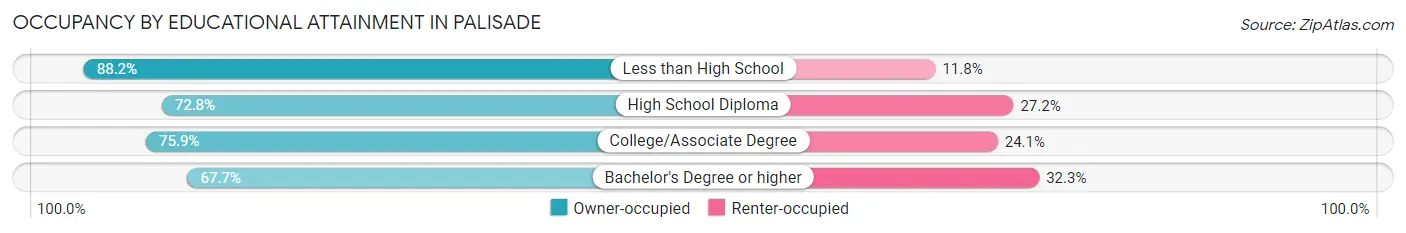
| Household Size | Owner-occupied | Renter-occupied |
| Less than High School | 75 (88.2%) | 10 (11.8%) |
| High School Diploma | 246 (72.8%) | 92 (27.2%) |
| College/Associate Degree | 340 (75.9%) | 108 (24.1%) |
| Bachelor's Degree or higher | 203 (67.7%) | 97 (32.3%) |
Occupancy by Age of Householder in Palisade
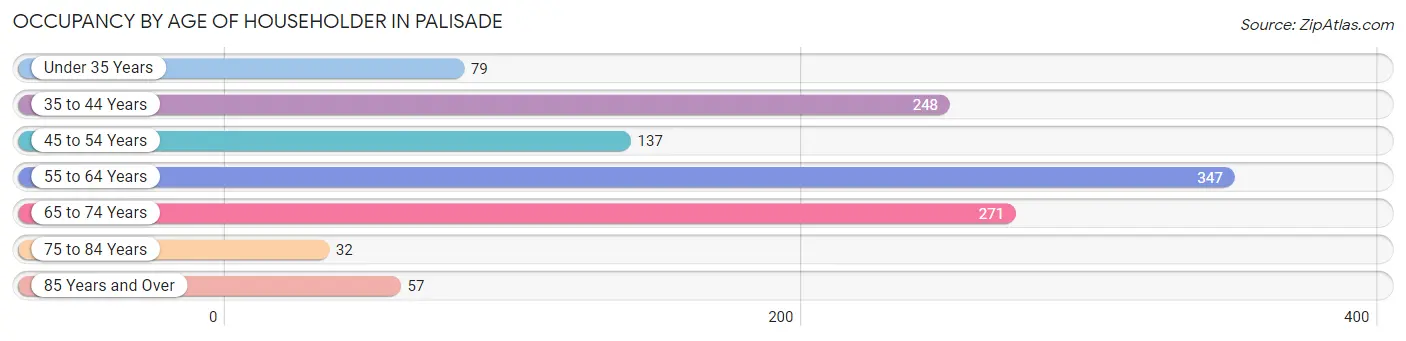
| Age Bracket | # Households | % Households |
| Under 35 Years | 79 | 6.8% |
| 35 to 44 Years | 248 | 21.2% |
| 45 to 54 Years | 137 | 11.7% |
| 55 to 64 Years | 347 | 29.6% |
| 65 to 74 Years | 271 | 23.1% |
| 75 to 84 Years | 32 | 2.7% |
| 85 Years and Over | 57 | 4.9% |
| Total | 1,171 | 100.0% |
Housing Finances in Palisade
Median Income by Occupancy in Palisade
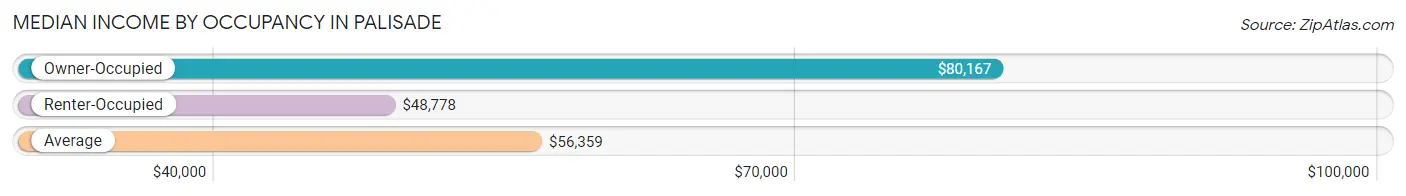
| Occupancy Type | # Households | Median Income |
| Owner-Occupied | 864 (73.8%) | $80,167 |
| Renter-Occupied | 307 (26.2%) | $48,778 |
| Average | 1,171 (100.0%) | $56,359 |
Occupancy by Householder Income Bracket in Palisade
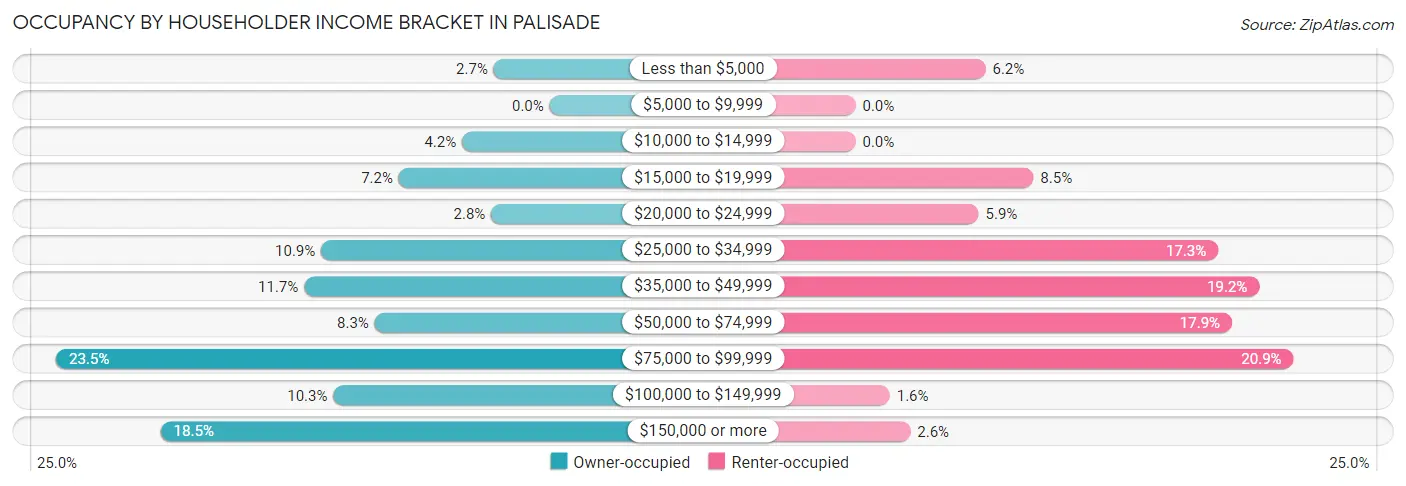
| Income Bracket | Owner-occupied | Renter-occupied |
| Less than $5,000 | 23 (2.7%) | 19 (6.2%) |
| $5,000 to $9,999 | 0 (0.0%) | 0 (0.0%) |
| $10,000 to $14,999 | 36 (4.2%) | 0 (0.0%) |
| $15,000 to $19,999 | 62 (7.2%) | 26 (8.5%) |
| $20,000 to $24,999 | 24 (2.8%) | 18 (5.9%) |
| $25,000 to $34,999 | 94 (10.9%) | 53 (17.3%) |
| $35,000 to $49,999 | 101 (11.7%) | 59 (19.2%) |
| $50,000 to $74,999 | 72 (8.3%) | 55 (17.9%) |
| $75,000 to $99,999 | 203 (23.5%) | 64 (20.8%) |
| $100,000 to $149,999 | 89 (10.3%) | 5 (1.6%) |
| $150,000 or more | 160 (18.5%) | 8 (2.6%) |
| Total | 864 (100.0%) | 307 (100.0%) |
Monthly Housing Cost Tiers in Palisade
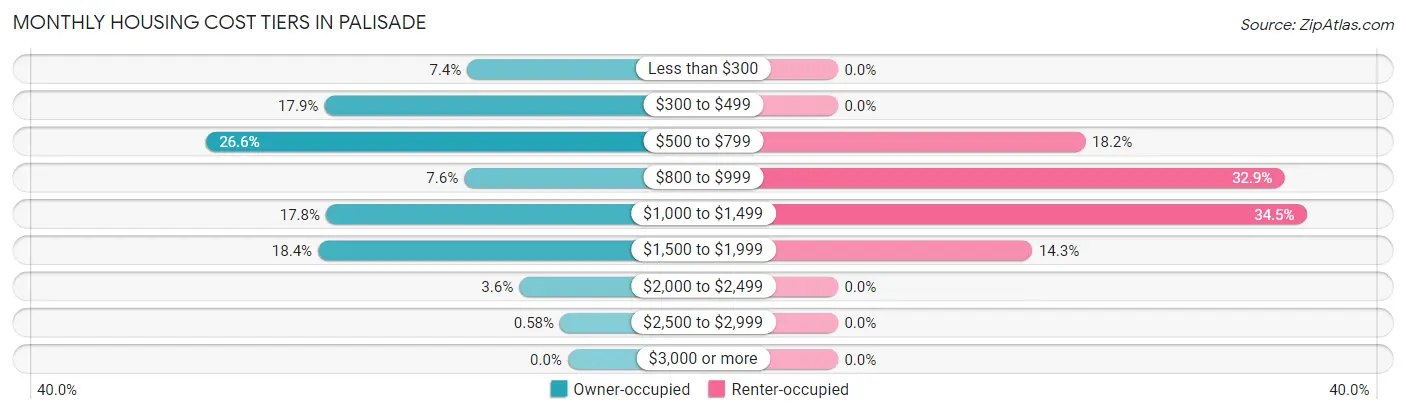
| Monthly Cost | Owner-occupied | Renter-occupied |
| Less than $300 | 64 (7.4%) | 0 (0.0%) |
| $300 to $499 | 155 (17.9%) | 0 (0.0%) |
| $500 to $799 | 230 (26.6%) | 56 (18.2%) |
| $800 to $999 | 66 (7.6%) | 101 (32.9%) |
| $1,000 to $1,499 | 154 (17.8%) | 106 (34.5%) |
| $1,500 to $1,999 | 159 (18.4%) | 44 (14.3%) |
| $2,000 to $2,499 | 31 (3.6%) | 0 (0.0%) |
| $2,500 to $2,999 | 5 (0.6%) | 0 (0.0%) |
| $3,000 or more | 0 (0.0%) | 0 (0.0%) |
| Total | 864 (100.0%) | 307 (100.0%) |
Physical Housing Characteristics in Palisade
Housing Structures in Palisade
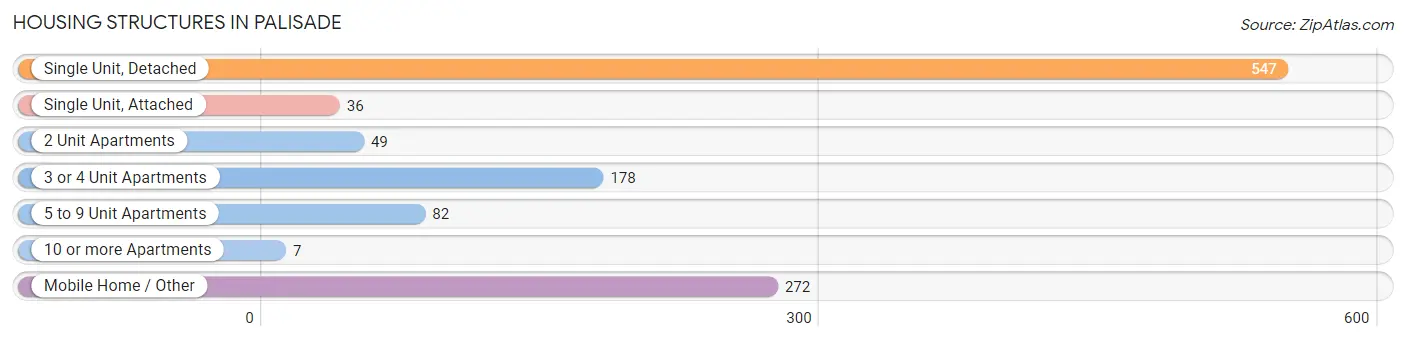
| Structure Type | # Housing Units | % Housing Units |
| Single Unit, Detached | 547 | 46.7% |
| Single Unit, Attached | 36 | 3.1% |
| 2 Unit Apartments | 49 | 4.2% |
| 3 or 4 Unit Apartments | 178 | 15.2% |
| 5 to 9 Unit Apartments | 82 | 7.0% |
| 10 or more Apartments | 7 | 0.6% |
| Mobile Home / Other | 272 | 23.2% |
| Total | 1,171 | 100.0% |
Housing Structures by Occupancy in Palisade
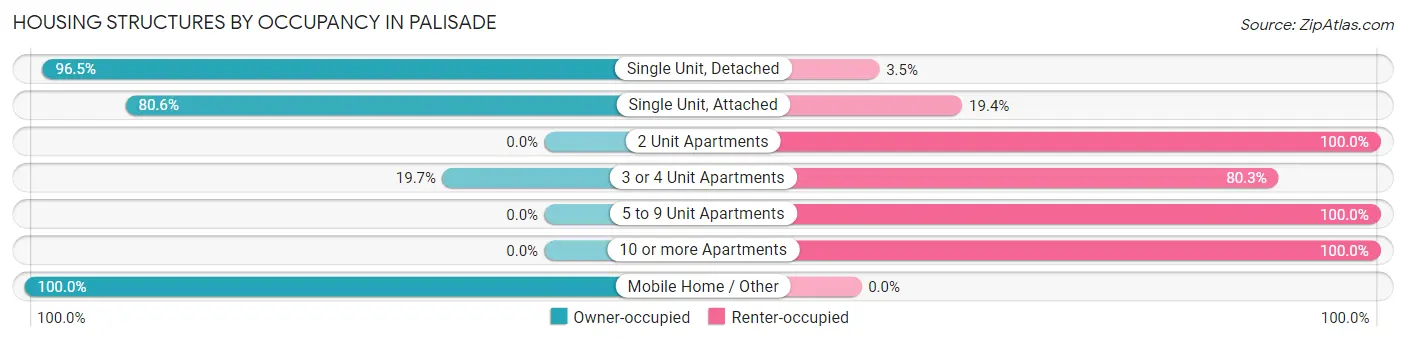
| Structure Type | Owner-occupied | Renter-occupied |
| Single Unit, Detached | 528 (96.5%) | 19 (3.5%) |
| Single Unit, Attached | 29 (80.6%) | 7 (19.4%) |
| 2 Unit Apartments | 0 (0.0%) | 49 (100.0%) |
| 3 or 4 Unit Apartments | 35 (19.7%) | 143 (80.3%) |
| 5 to 9 Unit Apartments | 0 (0.0%) | 82 (100.0%) |
| 10 or more Apartments | 0 (0.0%) | 7 (100.0%) |
| Mobile Home / Other | 272 (100.0%) | 0 (0.0%) |
| Total | 864 (73.8%) | 307 (26.2%) |
Housing Structures by Number of Rooms in Palisade
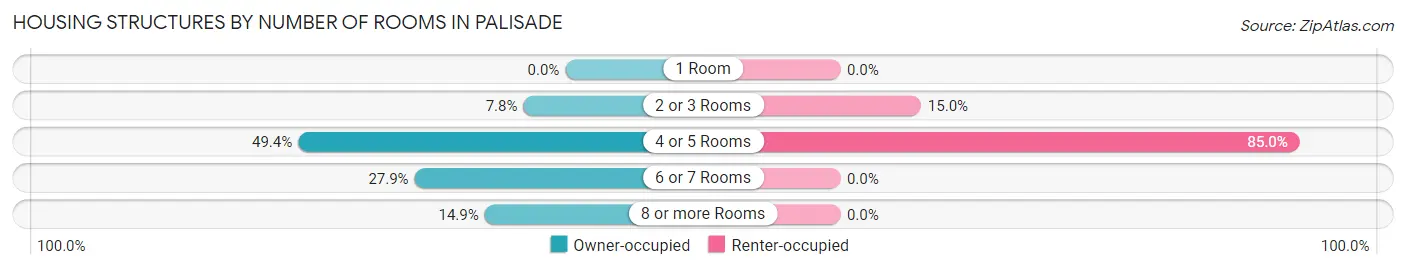
| Number of Rooms | Owner-occupied | Renter-occupied |
| 1 Room | 0 (0.0%) | 0 (0.0%) |
| 2 or 3 Rooms | 67 (7.7%) | 46 (15.0%) |
| 4 or 5 Rooms | 427 (49.4%) | 261 (85.0%) |
| 6 or 7 Rooms | 241 (27.9%) | 0 (0.0%) |
| 8 or more Rooms | 129 (14.9%) | 0 (0.0%) |
| Total | 864 (100.0%) | 307 (100.0%) |
Housing Structure by Heating Type in Palisade
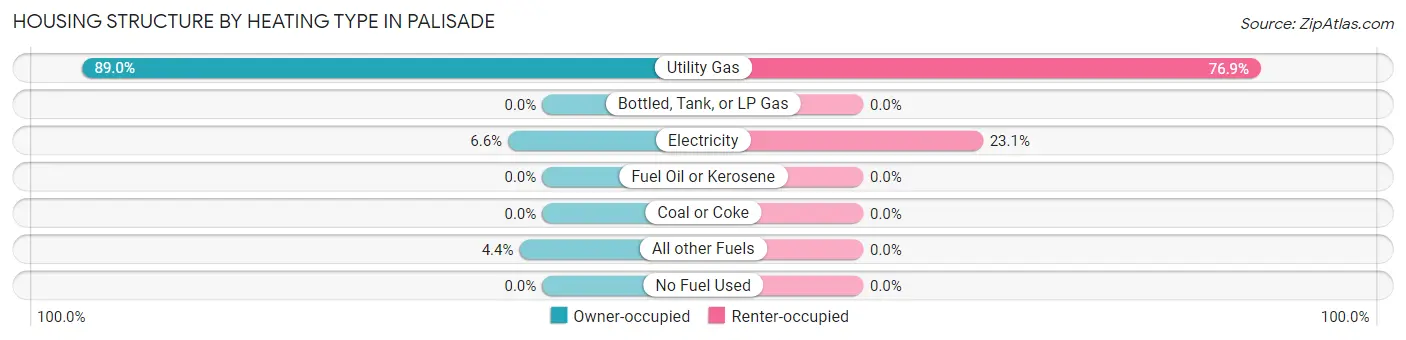
| Heating Type | Owner-occupied | Renter-occupied |
| Utility Gas | 769 (89.0%) | 236 (76.9%) |
| Bottled, Tank, or LP Gas | 0 (0.0%) | 0 (0.0%) |
| Electricity | 57 (6.6%) | 71 (23.1%) |
| Fuel Oil or Kerosene | 0 (0.0%) | 0 (0.0%) |
| Coal or Coke | 0 (0.0%) | 0 (0.0%) |
| All other Fuels | 38 (4.4%) | 0 (0.0%) |
| No Fuel Used | 0 (0.0%) | 0 (0.0%) |
| Total | 864 (100.0%) | 307 (100.0%) |
Household Vehicle Usage in Palisade
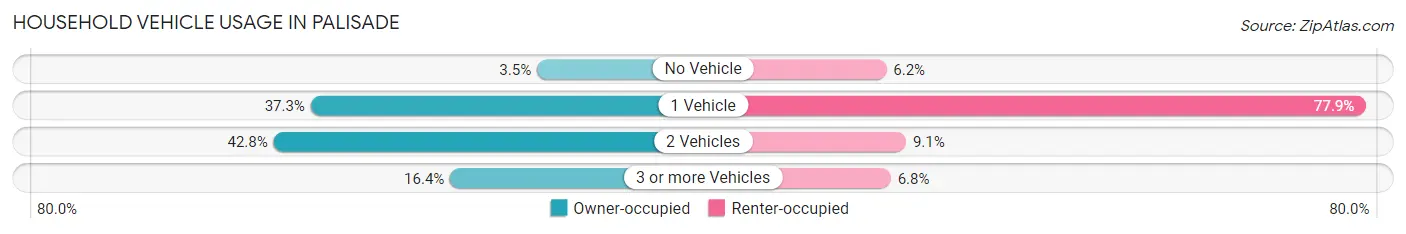
| Vehicles per Household | Owner-occupied | Renter-occupied |
| No Vehicle | 30 (3.5%) | 19 (6.2%) |
| 1 Vehicle | 322 (37.3%) | 239 (77.8%) |
| 2 Vehicles | 370 (42.8%) | 28 (9.1%) |
| 3 or more Vehicles | 142 (16.4%) | 21 (6.8%) |
| Total | 864 (100.0%) | 307 (100.0%) |
Real Estate & Mortgages in Palisade
Real Estate and Mortgage Overview in Palisade
| Characteristic | Without Mortgage | With Mortgage |
| Housing Units | 453 | 411 |
| Median Property Value | $179,900 | $284,300 |
| Median Household Income | $39,050 | $118 |
| Monthly Housing Costs | $530 | $0 |
| Real Estate Taxes | - | - |
Property Value by Mortgage Status in Palisade
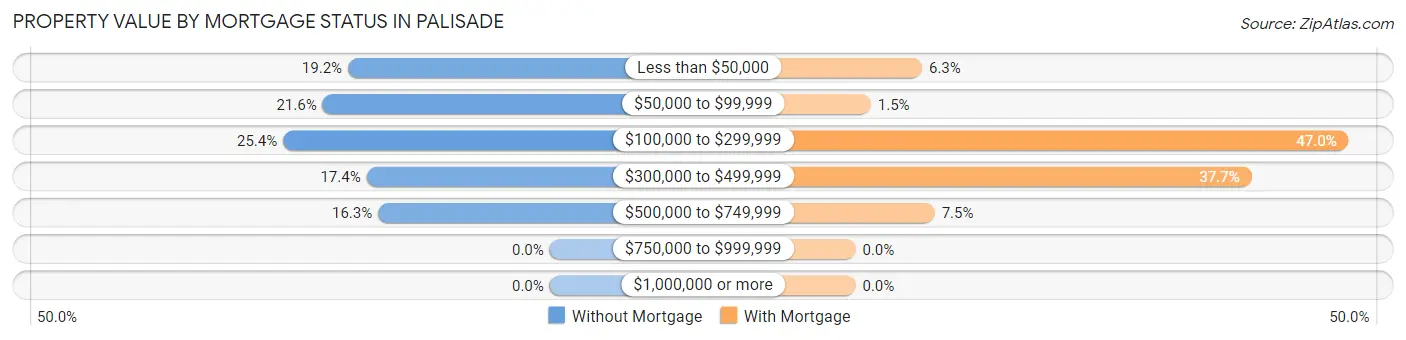
| Property Value | Without Mortgage | With Mortgage |
| Less than $50,000 | 87 (19.2%) | 26 (6.3%) |
| $50,000 to $99,999 | 98 (21.6%) | 6 (1.5%) |
| $100,000 to $299,999 | 115 (25.4%) | 193 (47.0%) |
| $300,000 to $499,999 | 79 (17.4%) | 155 (37.7%) |
| $500,000 to $749,999 | 74 (16.3%) | 31 (7.5%) |
| $750,000 to $999,999 | 0 (0.0%) | 0 (0.0%) |
| $1,000,000 or more | 0 (0.0%) | 0 (0.0%) |
| Total | 453 (100.0%) | 411 (100.0%) |
Household Income by Mortgage Status in Palisade
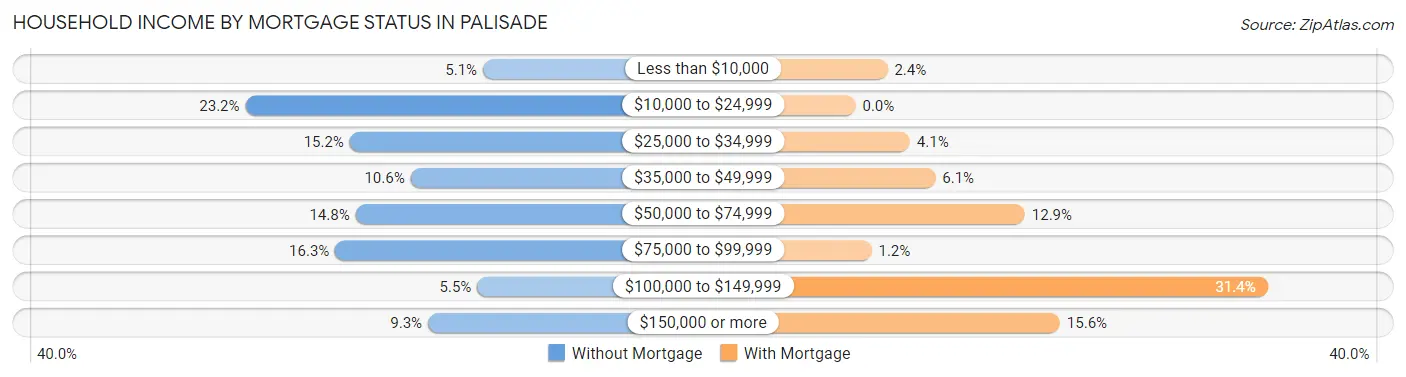
| Household Income | Without Mortgage | With Mortgage |
| Less than $10,000 | 23 (5.1%) | 10 (2.4%) |
| $10,000 to $24,999 | 105 (23.2%) | 0 (0.0%) |
| $25,000 to $34,999 | 69 (15.2%) | 17 (4.1%) |
| $35,000 to $49,999 | 48 (10.6%) | 25 (6.1%) |
| $50,000 to $74,999 | 67 (14.8%) | 53 (12.9%) |
| $75,000 to $99,999 | 74 (16.3%) | 5 (1.2%) |
| $100,000 to $149,999 | 25 (5.5%) | 129 (31.4%) |
| $150,000 or more | 42 (9.3%) | 64 (15.6%) |
| Total | 453 (100.0%) | 411 (100.0%) |
Property Value to Household Income Ratio in Palisade
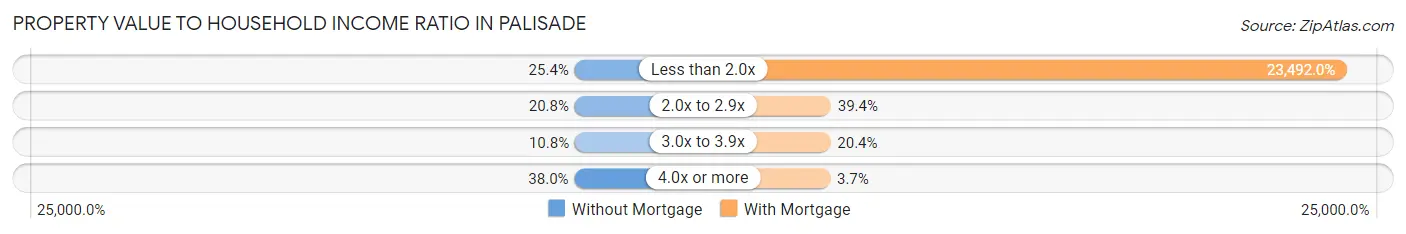
| Value-to-Income Ratio | Without Mortgage | With Mortgage |
| Less than 2.0x | 115 (25.4%) | 96,552 (23,492.0%) |
| 2.0x to 2.9x | 94 (20.7%) | 162 (39.4%) |
| 3.0x to 3.9x | 49 (10.8%) | 84 (20.4%) |
| 4.0x or more | 172 (38.0%) | 15 (3.6%) |
| Total | 453 (100.0%) | 411 (100.0%) |
Real Estate Taxes by Mortgage Status in Palisade
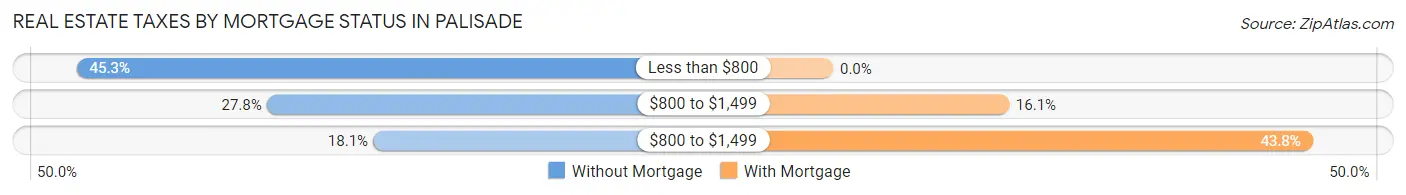
| Property Taxes | Without Mortgage | With Mortgage |
| Less than $800 | 205 (45.3%) | 0 (0.0%) |
| $800 to $1,499 | 126 (27.8%) | 66 (16.1%) |
| $800 to $1,499 | 82 (18.1%) | 180 (43.8%) |
| Total | 453 (100.0%) | 411 (100.0%) |
Health & Disability in Palisade
Health Insurance Coverage by Age in Palisade
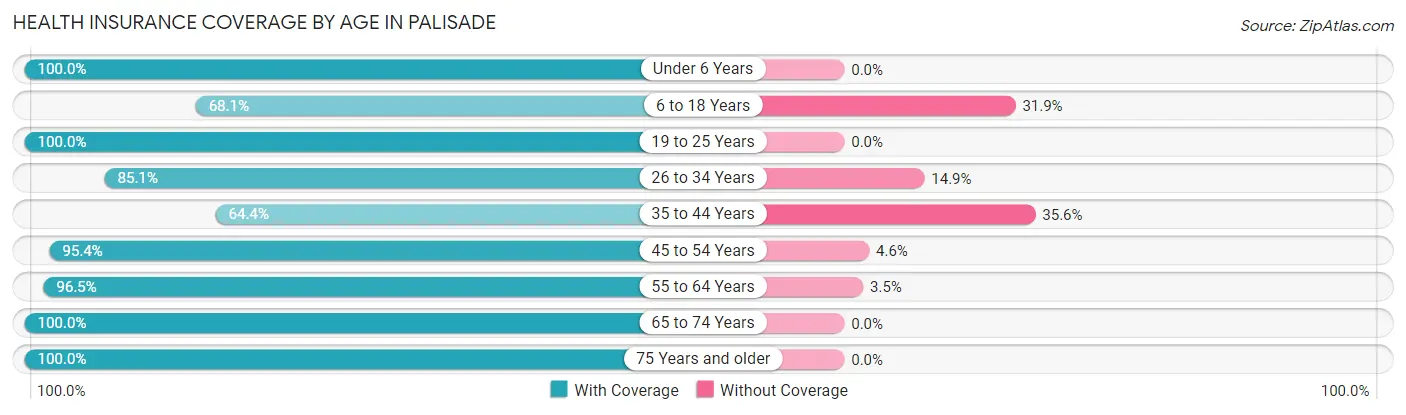
| Age Bracket | With Coverage | Without Coverage |
| Under 6 Years | 195 (100.0%) | 0 (0.0%) |
| 6 to 18 Years | 209 (68.1%) | 98 (31.9%) |
| 19 to 25 Years | 82 (100.0%) | 0 (0.0%) |
| 26 to 34 Years | 171 (85.1%) | 30 (14.9%) |
| 35 to 44 Years | 280 (64.4%) | 155 (35.6%) |
| 45 to 54 Years | 268 (95.4%) | 13 (4.6%) |
| 55 to 64 Years | 467 (96.5%) | 17 (3.5%) |
| 65 to 74 Years | 387 (100.0%) | 0 (0.0%) |
| 75 Years and older | 123 (100.0%) | 0 (0.0%) |
| Total | 2,182 (87.5%) | 313 (12.6%) |
Health Insurance Coverage by Citizenship Status in Palisade
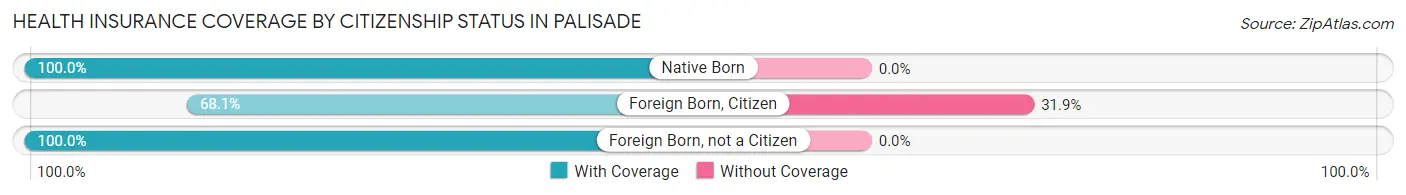
| Citizenship Status | With Coverage | Without Coverage |
| Native Born | 195 (100.0%) | 0 (0.0%) |
| Foreign Born, Citizen | 209 (68.1%) | 98 (31.9%) |
| Foreign Born, not a Citizen | 82 (100.0%) | 0 (0.0%) |
Health Insurance Coverage by Household Income in Palisade
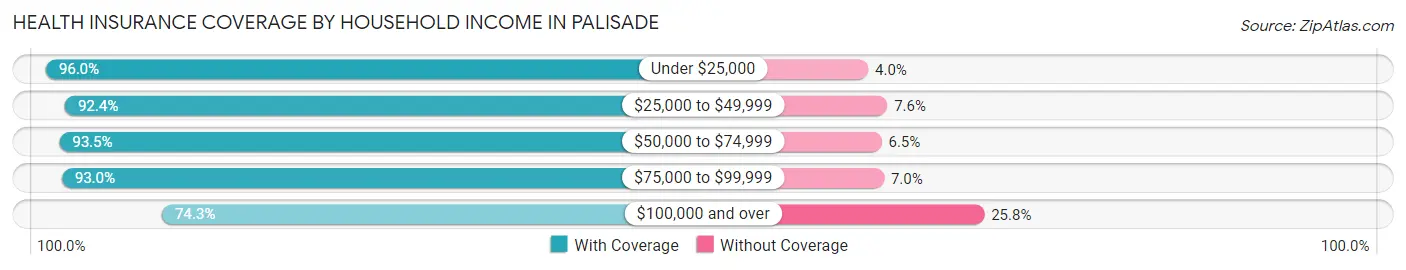
| Household Income | With Coverage | Without Coverage |
| Under $25,000 | 265 (96.0%) | 11 (4.0%) |
| $25,000 to $49,999 | 574 (92.4%) | 47 (7.6%) |
| $50,000 to $74,999 | 158 (93.5%) | 11 (6.5%) |
| $75,000 to $99,999 | 614 (93.0%) | 46 (7.0%) |
| $100,000 and over | 571 (74.3%) | 198 (25.8%) |
Public vs Private Health Insurance Coverage by Age in Palisade
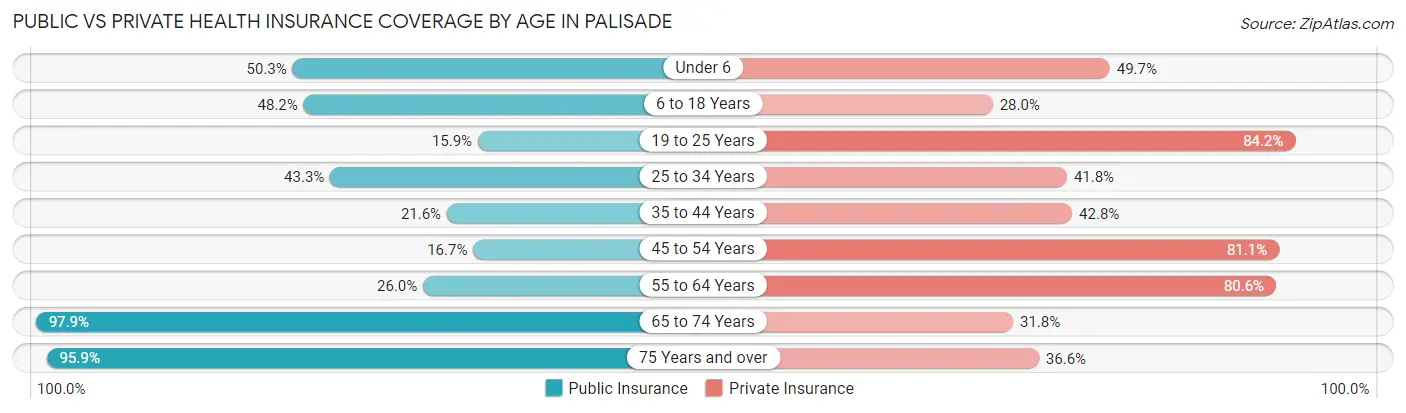
| Age Bracket | Public Insurance | Private Insurance |
| Under 6 | 98 (50.3%) | 97 (49.7%) |
| 6 to 18 Years | 148 (48.2%) | 86 (28.0%) |
| 19 to 25 Years | 13 (15.9%) | 69 (84.2%) |
| 25 to 34 Years | 87 (43.3%) | 84 (41.8%) |
| 35 to 44 Years | 94 (21.6%) | 186 (42.8%) |
| 45 to 54 Years | 47 (16.7%) | 228 (81.1%) |
| 55 to 64 Years | 126 (26.0%) | 390 (80.6%) |
| 65 to 74 Years | 379 (97.9%) | 123 (31.8%) |
| 75 Years and over | 118 (95.9%) | 45 (36.6%) |
| Total | 1,110 (44.5%) | 1,308 (52.4%) |
Disability Status by Sex by Age in Palisade
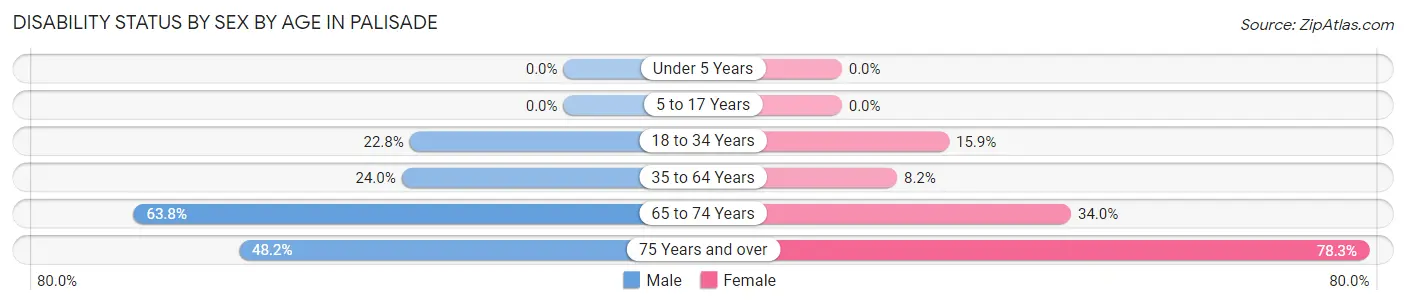
| Age Bracket | Male | Female |
| Under 5 Years | 0 (0.0%) | 0 (0.0%) |
| 5 to 17 Years | 0 (0.0%) | 0 (0.0%) |
| 18 to 34 Years | 45 (22.8%) | 18 (15.9%) |
| 35 to 64 Years | 136 (24.0%) | 52 (8.2%) |
| 65 to 74 Years | 97 (63.8%) | 80 (34.0%) |
| 75 Years and over | 26 (48.1%) | 54 (78.3%) |
Disability Class by Sex by Age in Palisade
Disability Class: Hearing Difficulty
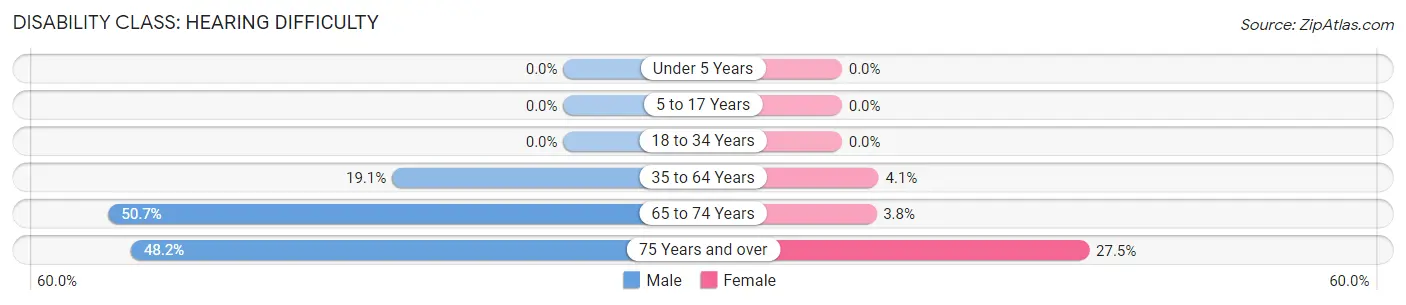
| Age Bracket | Male | Female |
| Under 5 Years | 0 (0.0%) | 0 (0.0%) |
| 5 to 17 Years | 0 (0.0%) | 0 (0.0%) |
| 18 to 34 Years | 0 (0.0%) | 0 (0.0%) |
| 35 to 64 Years | 108 (19.1%) | 26 (4.1%) |
| 65 to 74 Years | 77 (50.7%) | 9 (3.8%) |
| 75 Years and over | 26 (48.1%) | 19 (27.5%) |
Disability Class: Vision Difficulty
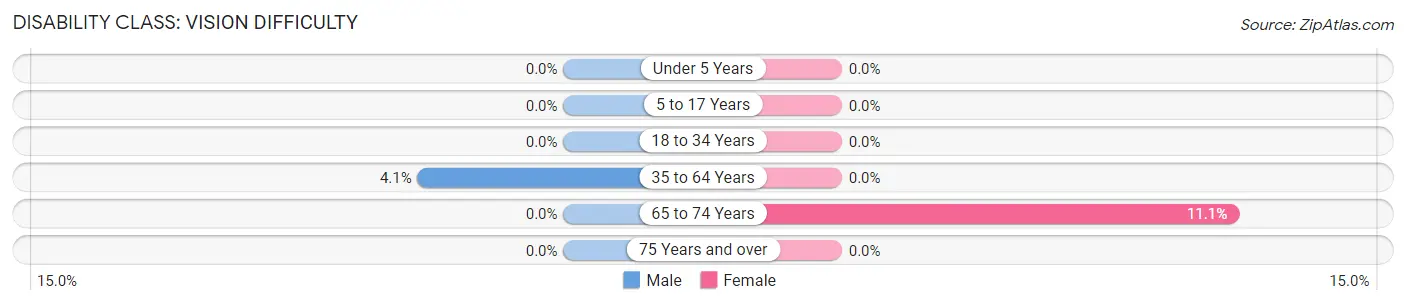
| Age Bracket | Male | Female |
| Under 5 Years | 0 (0.0%) | 0 (0.0%) |
| 5 to 17 Years | 0 (0.0%) | 0 (0.0%) |
| 18 to 34 Years | 0 (0.0%) | 0 (0.0%) |
| 35 to 64 Years | 23 (4.1%) | 0 (0.0%) |
| 65 to 74 Years | 0 (0.0%) | 26 (11.1%) |
| 75 Years and over | 0 (0.0%) | 0 (0.0%) |
Disability Class: Cognitive Difficulty
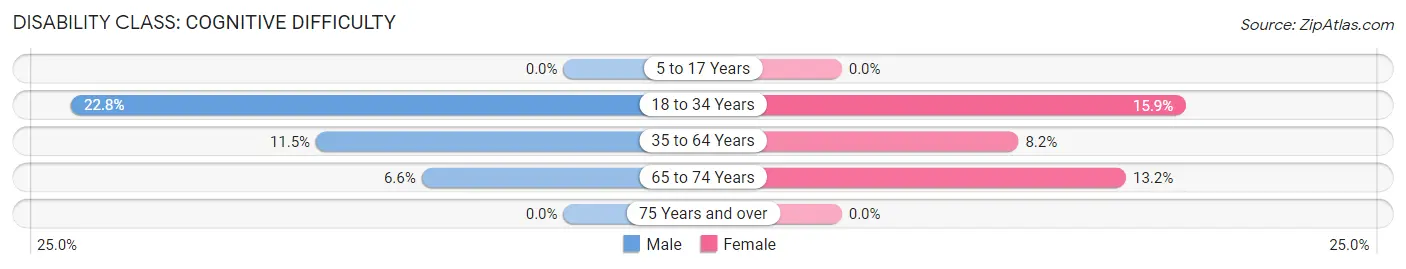
| Age Bracket | Male | Female |
| 5 to 17 Years | 0 (0.0%) | 0 (0.0%) |
| 18 to 34 Years | 45 (22.8%) | 18 (15.9%) |
| 35 to 64 Years | 65 (11.5%) | 52 (8.2%) |
| 65 to 74 Years | 10 (6.6%) | 31 (13.2%) |
| 75 Years and over | 0 (0.0%) | 0 (0.0%) |
Disability Class: Ambulatory Difficulty
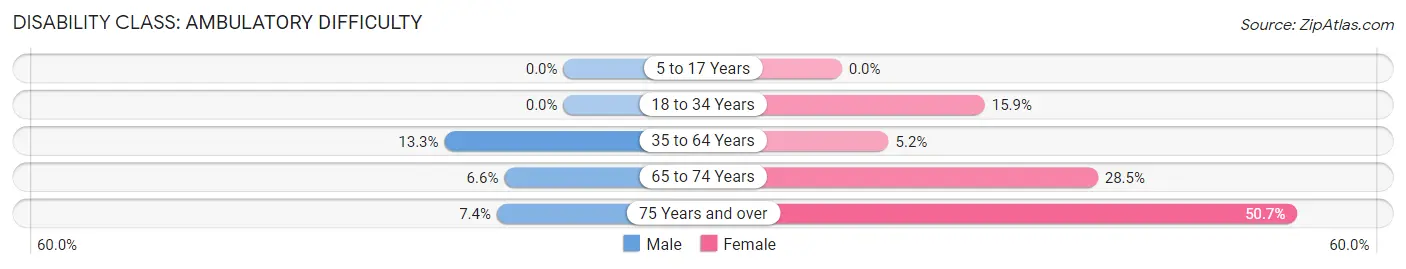
| Age Bracket | Male | Female |
| 5 to 17 Years | 0 (0.0%) | 0 (0.0%) |
| 18 to 34 Years | 0 (0.0%) | 18 (15.9%) |
| 35 to 64 Years | 75 (13.3%) | 33 (5.2%) |
| 65 to 74 Years | 10 (6.6%) | 67 (28.5%) |
| 75 Years and over | 4 (7.4%) | 35 (50.7%) |
Disability Class: Self-Care Difficulty
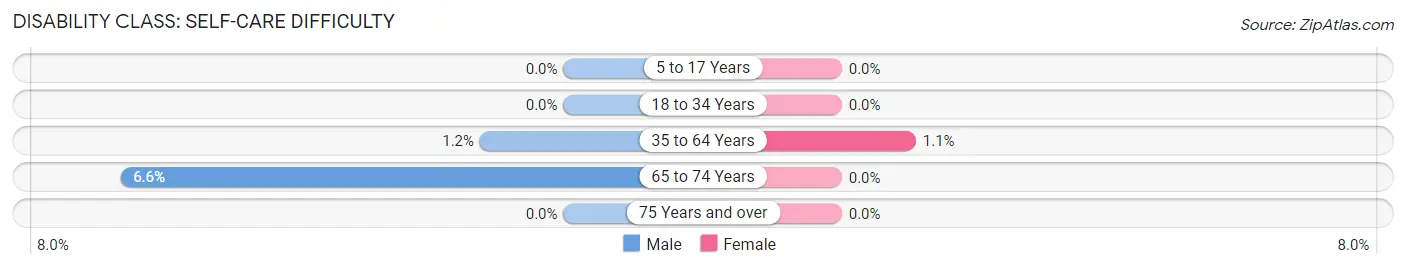
| Age Bracket | Male | Female |
| 5 to 17 Years | 0 (0.0%) | 0 (0.0%) |
| 18 to 34 Years | 0 (0.0%) | 0 (0.0%) |
| 35 to 64 Years | 7 (1.2%) | 7 (1.1%) |
| 65 to 74 Years | 10 (6.6%) | 0 (0.0%) |
| 75 Years and over | 0 (0.0%) | 0 (0.0%) |
Technology Access in Palisade
Computing Device Access in Palisade
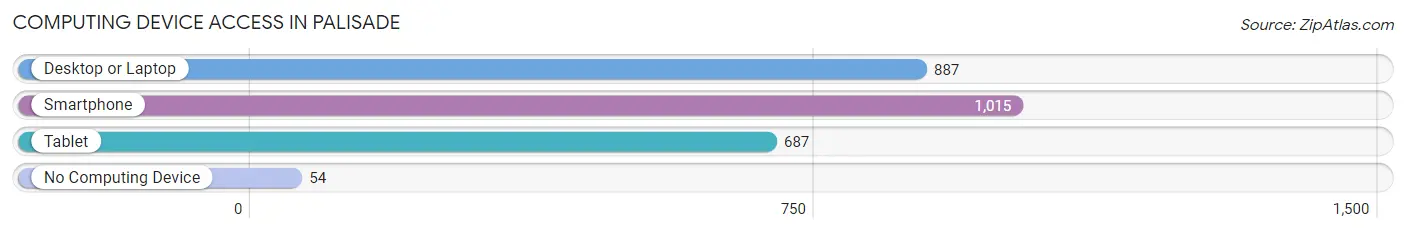
| Device Type | # Households | % Households |
| Desktop or Laptop | 887 | 75.7% |
| Smartphone | 1,015 | 86.7% |
| Tablet | 687 | 58.7% |
| No Computing Device | 54 | 4.6% |
| Total | 1,171 | 100.0% |
Internet Access in Palisade
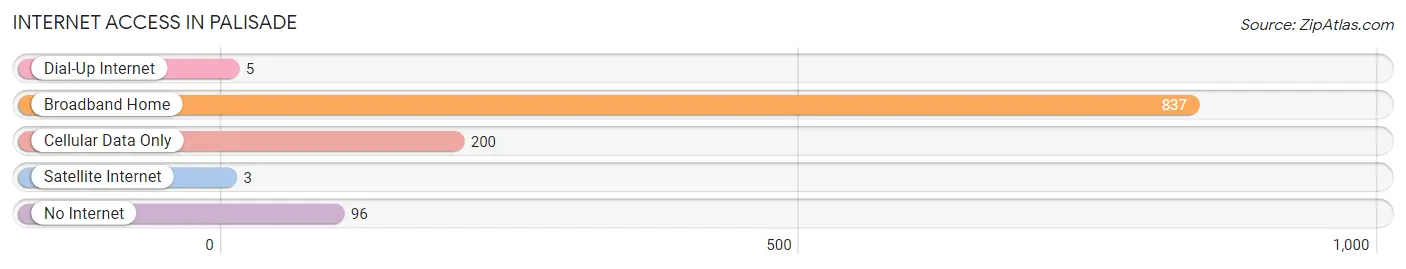
| Internet Type | # Households | % Households |
| Dial-Up Internet | 5 | 0.4% |
| Broadband Home | 837 | 71.5% |
| Cellular Data Only | 200 | 17.1% |
| Satellite Internet | 3 | 0.3% |
| No Internet | 96 | 8.2% |
| Total | 1,171 | 100.0% |
Palisade Summary
Palisade, Colorado is a small town located in Mesa County, in the western part of the state. It is situated along the Colorado River, just east of Grand Junction. The town was founded in 1882 by a group of settlers who were looking for a place to settle and farm. The town was named after the nearby Palisade Cliffs, which were formed by the Colorado River.
Palisade is located in a semi-arid climate, with hot summers and cold winters. The average annual temperature is around 60 degrees Fahrenheit. The town receives an average of 8.5 inches of precipitation per year, with most of it falling in the spring and summer months.
The town has a population of around 2,500 people, with a median age of 39. The population is mostly white, with a small percentage of African Americans, Hispanics, and Native Americans. The town has a low unemployment rate, and the median household income is around $50,000.
The economy of Palisade is largely based on agriculture. The town is home to several wineries, and is known for its peaches, apples, and other fruits. The town also has a thriving tourism industry, with many visitors coming to enjoy the scenery and outdoor activities.
The town is served by the Grand Junction Regional Airport, which is located just outside of town. The town is also served by several bus lines, and is connected to the rest of the state by Interstate 70.
Palisade is home to several parks and recreational areas, including the Palisade State Park, which offers camping, fishing, and hiking. The town also has several museums, including the Palisade Historical Museum, which showcases the history of the town and its people.
Palisade is a small town with a rich history and a vibrant economy. It is a great place to live, work, and play, and offers a variety of activities for visitors and residents alike.
Common Questions
What is Per Capita Income in Palisade?
Per Capita income in Palisade is $37,113.
What is the Median Family Income in Palisade?
Median Family Income in Palisade is $90,764.
What is the Median Household income in Palisade?
Median Household Income in Palisade is $56,359.
What is Income or Wage Gap in Palisade?
Income or Wage Gap in Palisade is 29.9%.
Women in Palisade earn 70.1 cents for every dollar earned by a man.
What is Family Income Deficit in Palisade?
Family Income Deficit in Palisade is $6,347.
Families that are below poverty line in Palisade earn $6,347 less on average than the poverty threshold level.
What is Inequality or Gini Index in Palisade?
Inequality or Gini Index in Palisade is 0.46.
What is the Total Population of Palisade?
Total Population of Palisade is 2,571.
What is the Total Male Population of Palisade?
Total Male Population of Palisade is 1,366.
What is the Total Female Population of Palisade?
Total Female Population of Palisade is 1,205.
What is the Ratio of Males per 100 Females in Palisade?
There are 113.36 Males per 100 Females in Palisade.
What is the Ratio of Females per 100 Males in Palisade?
There are 88.21 Females per 100 Males in Palisade.
What is the Median Population Age in Palisade?
Median Population Age in Palisade is 47.1 Years.
What is the Average Family Size in Palisade
Average Family Size in Palisade is 3.0 People.
What is the Average Household Size in Palisade
Average Household Size in Palisade is 2.1 People.
How Large is the Labor Force in Palisade?
There are 1,327 People in the Labor Forcein in Palisade.
What is the Percentage of People in the Labor Force in Palisade?
62.0% of People are in the Labor Force in Palisade.
What is the Unemployment Rate in Palisade?
Unemployment Rate in Palisade is 4.6%.