Ouray, CO Map & Demographics
Ouray Map
Ouray Overview
$40,699
PER CAPITA INCOME
$82,232
AVG FAMILY INCOME
$68,750
AVG HOUSEHOLD INCOME
33.0%
WAGE / INCOME GAP [ % ]
67.0¢/ $1
WAGE / INCOME GAP [ $ ]
0.42
INEQUALITY / GINI INDEX
1,007
TOTAL POPULATION
469
MALE POPULATION
538
FEMALE POPULATION
87.17
MALES / 100 FEMALES
114.71
FEMALES / 100 MALES
50.3
MEDIAN AGE
2.7
AVG FAMILY SIZE
2.2
AVG HOUSEHOLD SIZE
550
LABOR FORCE [ PEOPLE ]
59.7%
PERCENT IN LABOR FORCE
4.5%
UNEMPLOYMENT RATE
Ouray Zip Codes
Ouray Area Codes
Income in Ouray
Income Overview in Ouray
Per Capita Income in Ouray is $40,699, while median incomes of families and households are $82,232 and $68,750 respectively.
| Characteristic | Number | Measure |
| Per Capita Income | 1,007 | $40,699 |
| Median Family Income | 265 | $82,232 |
| Mean Family Income | 265 | $109,816 |
| Median Household Income | 462 | $68,750 |
| Mean Household Income | 462 | $87,820 |
| Income Deficit | 265 | $0 |
| Wage / Income Gap (%) | 1,007 | 32.96% |
| Wage / Income Gap ($) | 1,007 | 67.04¢ per $1 |
| Gini / Inequality Index | 1,007 | 0.42 |
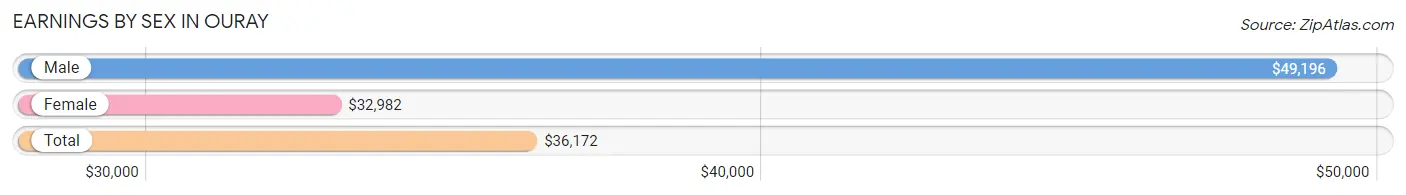
Earnings by Sex in Ouray
Average Earnings in Ouray are $36,172, $49,196 for men and $32,982 for women, a difference of 33.0%.
| Sex | Number | Average Earnings |
| Male | 279 (43.9%) | $49,196 |
| Female | 356 (56.1%) | $32,982 |
| Total | 635 (100.0%) | $36,172 |
Earnings by Sex by Income Bracket in Ouray
The most common earnings brackets in Ouray are $2,500 to $4,999 for men (52 | 18.6%) and $5,000 to $7,499 for women (68 | 19.1%).
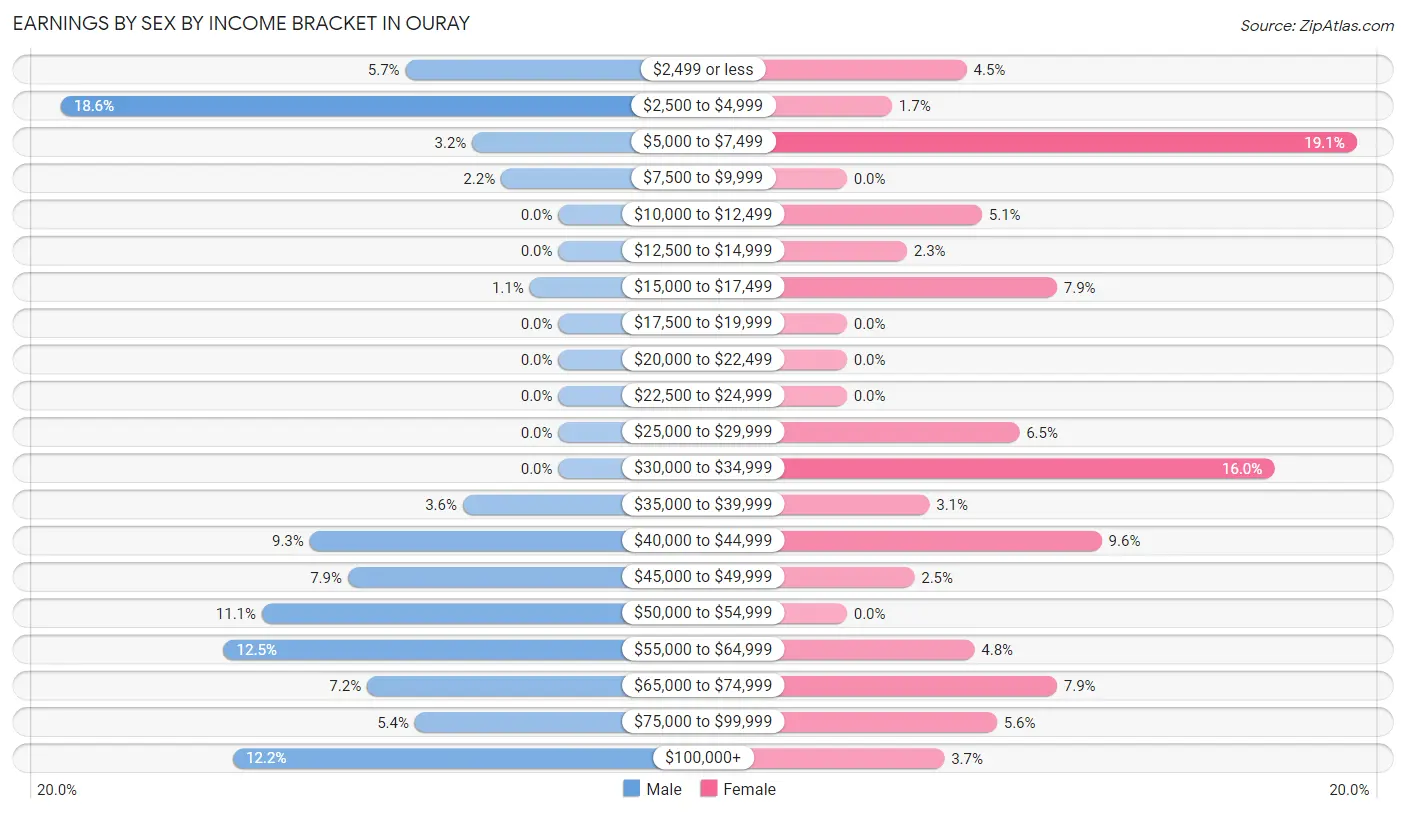
| Income | Male | Female |
| $2,499 or less | 16 (5.7%) | 16 (4.5%) |
| $2,500 to $4,999 | 52 (18.6%) | 6 (1.7%) |
| $5,000 to $7,499 | 9 (3.2%) | 68 (19.1%) |
| $7,500 to $9,999 | 6 (2.1%) | 0 (0.0%) |
| $10,000 to $12,499 | 0 (0.0%) | 18 (5.1%) |
| $12,500 to $14,999 | 0 (0.0%) | 8 (2.2%) |
| $15,000 to $17,499 | 3 (1.1%) | 28 (7.9%) |
| $17,500 to $19,999 | 0 (0.0%) | 0 (0.0%) |
| $20,000 to $22,499 | 0 (0.0%) | 0 (0.0%) |
| $22,500 to $24,999 | 0 (0.0%) | 0 (0.0%) |
| $25,000 to $29,999 | 0 (0.0%) | 23 (6.5%) |
| $30,000 to $34,999 | 0 (0.0%) | 57 (16.0%) |
| $35,000 to $39,999 | 10 (3.6%) | 11 (3.1%) |
| $40,000 to $44,999 | 26 (9.3%) | 34 (9.6%) |
| $45,000 to $49,999 | 22 (7.9%) | 9 (2.5%) |
| $50,000 to $54,999 | 31 (11.1%) | 0 (0.0%) |
| $55,000 to $64,999 | 35 (12.5%) | 17 (4.8%) |
| $65,000 to $74,999 | 20 (7.2%) | 28 (7.9%) |
| $75,000 to $99,999 | 15 (5.4%) | 20 (5.6%) |
| $100,000+ | 34 (12.2%) | 13 (3.6%) |
| Total | 279 (100.0%) | 356 (100.0%) |
Earnings by Sex by Educational Attainment in Ouray
Average earnings in Ouray are $51,089 for men and $33,816 for women, a difference of 33.8%. Men with an educational attainment of bachelor's degree enjoy the highest average annual earnings of $51,492, while those with bachelor's degree education earn the least with $51,492. Women with an educational attainment of bachelor's degree earn the most with the average annual earnings of $34,148, while those with high school diploma education have the smallest earnings of $29,167.
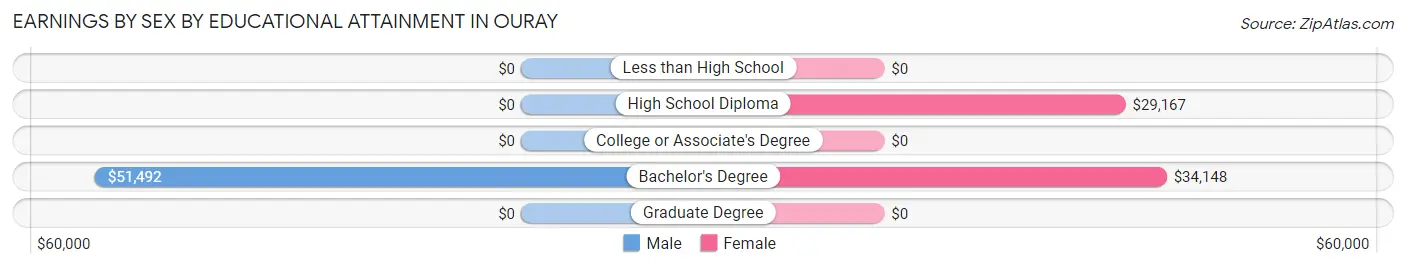
| Educational Attainment | Male Income | Female Income |
| Less than High School | - | - |
| High School Diploma | - | - |
| College or Associate's Degree | - | - |
| Bachelor's Degree | $51,492 | $34,148 |
| Graduate Degree | - | - |
| Total | $51,089 | $33,816 |
Family Income in Ouray
Family Income Brackets in Ouray
According to the Ouray family income data, there are 74 families falling into the $100,000 to $149,999 income range, which is the most common income bracket and makes up 27.9% of all families.
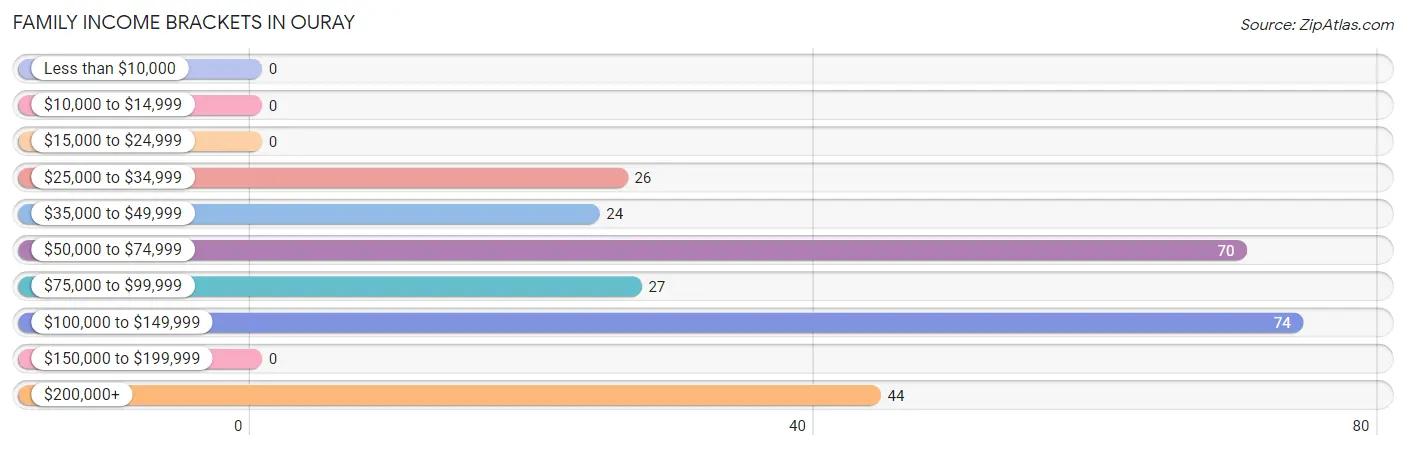
| Income Bracket | # Families | % Families |
| Less than $10,000 | 0 | 0.0% |
| $10,000 to $14,999 | 0 | 0.0% |
| $15,000 to $24,999 | 0 | 0.0% |
| $25,000 to $34,999 | 26 | 9.8% |
| $35,000 to $49,999 | 24 | 9.1% |
| $50,000 to $74,999 | 70 | 26.4% |
| $75,000 to $99,999 | 27 | 10.2% |
| $100,000 to $149,999 | 74 | 27.9% |
| $150,000 to $199,999 | 0 | 0.0% |
| $200,000+ | 44 | 16.6% |
Family Income by Famaliy Size in Ouray
2-person families (198 | 74.7%) account for the highest median family income in Ouray with $80,938 per family, while 2-person families (198 | 74.7%) have the highest median income of $40,469 per family member.
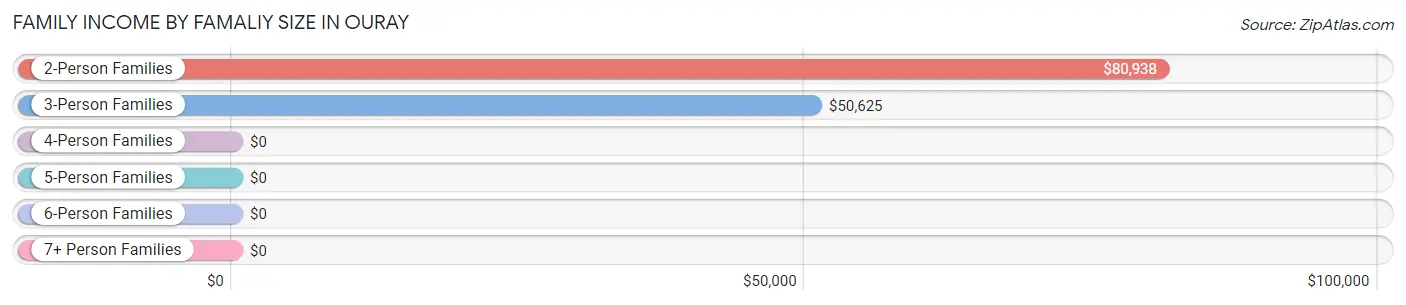
| Income Bracket | # Families | Median Income |
| 2-Person Families | 198 (74.7%) | $80,938 |
| 3-Person Families | 24 (9.1%) | $50,625 |
| 4-Person Families | 6 (2.3%) | $0 |
| 5-Person Families | 20 (7.5%) | $0 |
| 6-Person Families | 9 (3.4%) | $0 |
| 7+ Person Families | 8 (3.0%) | $0 |
| Total | 265 (100.0%) | $82,232 |
Family Income by Number of Earners in Ouray
The median family income in Ouray is $82,232, with families comprising no earners (63) having the highest median family income of $112,946, while families with 1 earner (78) have the lowest median family income of $66,053, accounting for 23.8% and 29.4% of families, respectively.
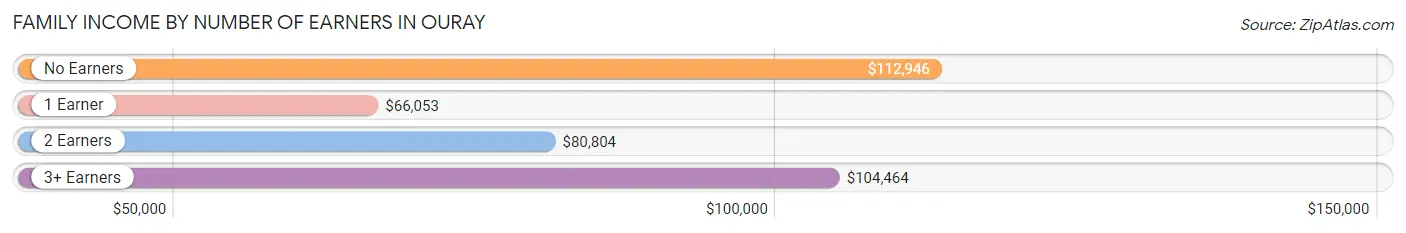
| Number of Earners | # Families | Median Income |
| No Earners | 63 (23.8%) | $112,946 |
| 1 Earner | 78 (29.4%) | $66,053 |
| 2 Earners | 87 (32.8%) | $80,804 |
| 3+ Earners | 37 (14.0%) | $104,464 |
| Total | 265 (100.0%) | $82,232 |
Household Income in Ouray
Household Income Brackets in Ouray
With 98 households falling in the category, the $50,000 to $74,999 income range is the most frequent in Ouray, accounting for 21.2% of all households.
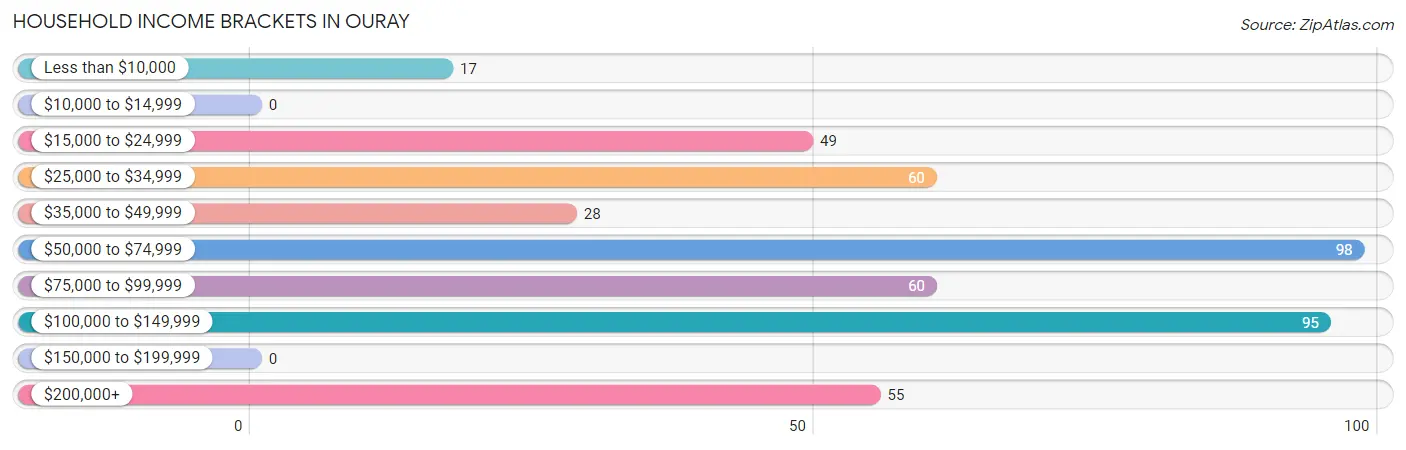
| Income Bracket | # Households | % Households |
| Less than $10,000 | 17 | 3.7% |
| $10,000 to $14,999 | 0 | 0.0% |
| $15,000 to $24,999 | 49 | 10.6% |
| $25,000 to $34,999 | 60 | 13.0% |
| $35,000 to $49,999 | 28 | 6.1% |
| $50,000 to $74,999 | 98 | 21.2% |
| $75,000 to $99,999 | 60 | 13.0% |
| $100,000 to $149,999 | 95 | 20.6% |
| $150,000 to $199,999 | 0 | 0.0% |
| $200,000+ | 55 | 11.9% |
Household Income by Householder Age in Ouray
The median household income in Ouray is $68,750, with the highest median household income of $87,596 found in the 25 to 44 years age bracket for the primary householder. A total of 85 households (18.4%) fall into this category.
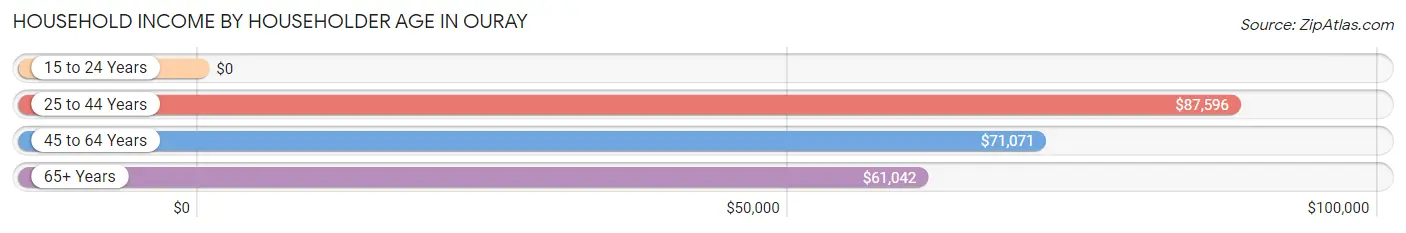
| Income Bracket | # Households | Median Income |
| 15 to 24 Years | 0 (0.0%) | $0 |
| 25 to 44 Years | 85 (18.4%) | $87,596 |
| 45 to 64 Years | 150 (32.5%) | $71,071 |
| 65+ Years | 227 (49.1%) | $61,042 |
| Total | 462 (100.0%) | $68,750 |
Poverty in Ouray
Income Below Poverty by Sex and Age in Ouray
With 3.2% poverty level for males and 5.6% for females among the residents of Ouray, 55 to 64 year old males and 25 to 34 year old females are the most vulnerable to poverty, with 15 males (34.9%) and 16 females (20.3%) in their respective age groups living below the poverty level.
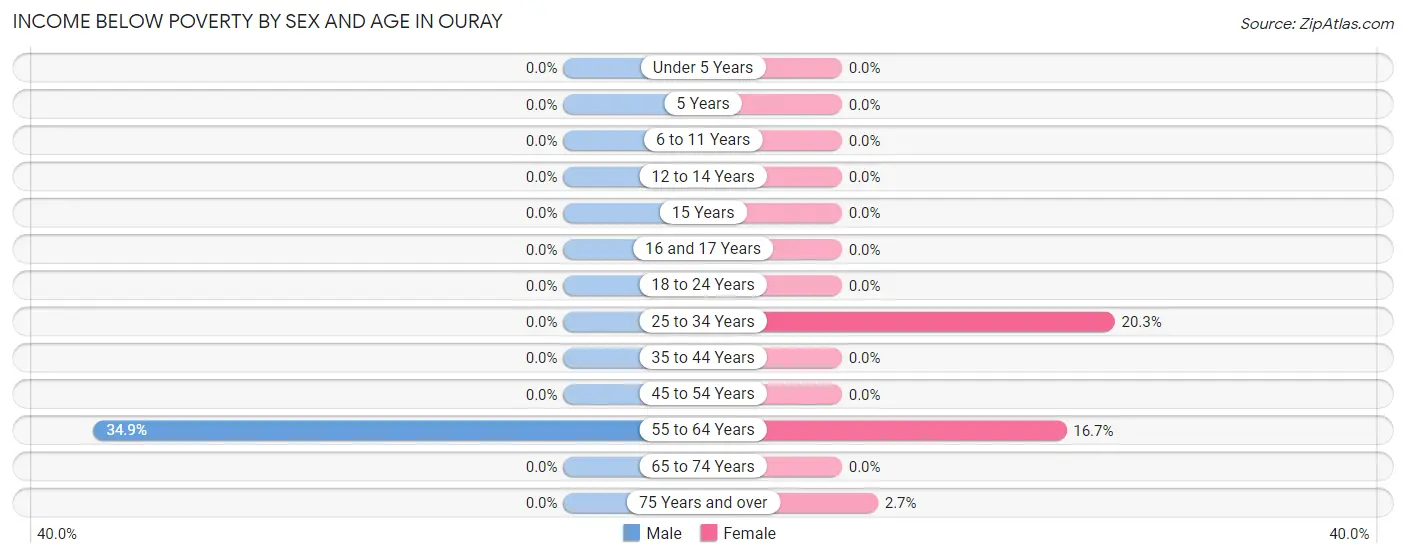
| Age Bracket | Male | Female |
| Under 5 Years | 0 (0.0%) | 0 (0.0%) |
| 5 Years | 0 (0.0%) | 0 (0.0%) |
| 6 to 11 Years | 0 (0.0%) | 0 (0.0%) |
| 12 to 14 Years | 0 (0.0%) | 0 (0.0%) |
| 15 Years | 0 (0.0%) | 0 (0.0%) |
| 16 and 17 Years | 0 (0.0%) | 0 (0.0%) |
| 18 to 24 Years | 0 (0.0%) | 0 (0.0%) |
| 25 to 34 Years | 0 (0.0%) | 16 (20.3%) |
| 35 to 44 Years | 0 (0.0%) | 0 (0.0%) |
| 45 to 54 Years | 0 (0.0%) | 0 (0.0%) |
| 55 to 64 Years | 15 (34.9%) | 12 (16.7%) |
| 65 to 74 Years | 0 (0.0%) | 0 (0.0%) |
| 75 Years and over | 0 (0.0%) | 2 (2.7%) |
| Total | 15 (3.2%) | 30 (5.6%) |
Income Above Poverty by Sex and Age in Ouray
According to the poverty statistics in Ouray, males aged under 5 years and females aged 6 to 11 years are the age groups that are most secure financially, with 100.0% of males and 100.0% of females in these age groups living above the poverty line.
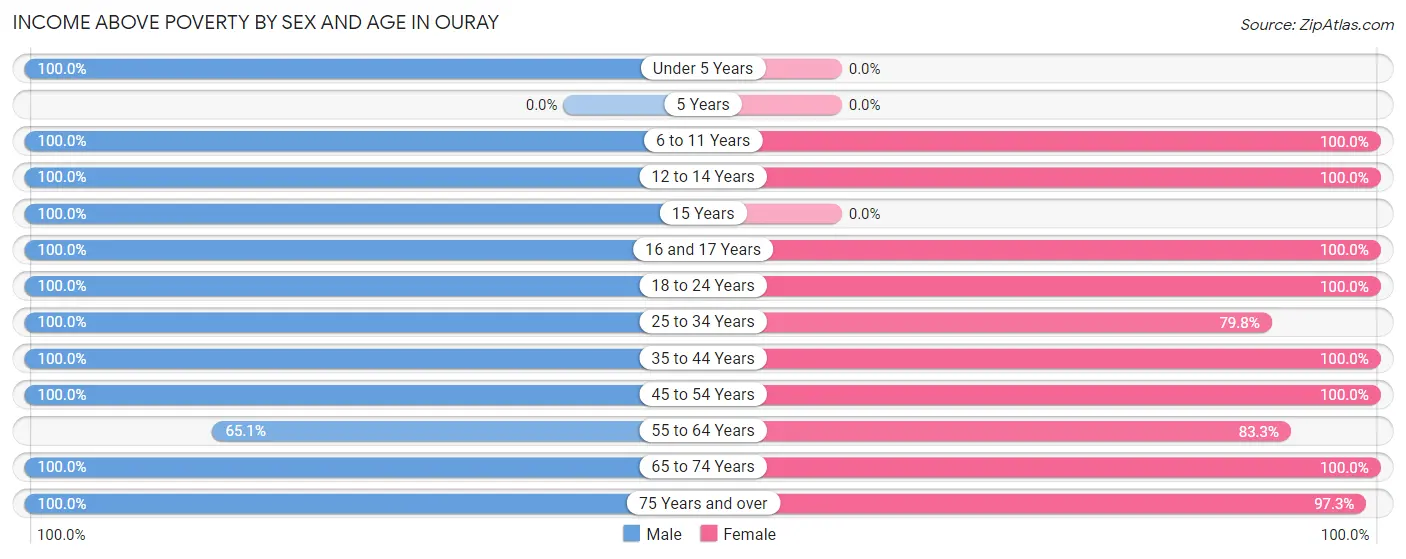
| Age Bracket | Male | Female |
| Under 5 Years | 9 (100.0%) | 0 (0.0%) |
| 5 Years | 0 (0.0%) | 0 (0.0%) |
| 6 to 11 Years | 20 (100.0%) | 32 (100.0%) |
| 12 to 14 Years | 14 (100.0%) | 4 (100.0%) |
| 15 Years | 7 (100.0%) | 0 (0.0%) |
| 16 and 17 Years | 28 (100.0%) | 22 (100.0%) |
| 18 to 24 Years | 22 (100.0%) | 24 (100.0%) |
| 25 to 34 Years | 58 (100.0%) | 63 (79.7%) |
| 35 to 44 Years | 69 (100.0%) | 62 (100.0%) |
| 45 to 54 Years | 39 (100.0%) | 86 (100.0%) |
| 55 to 64 Years | 28 (65.1%) | 60 (83.3%) |
| 65 to 74 Years | 105 (100.0%) | 82 (100.0%) |
| 75 Years and over | 55 (100.0%) | 73 (97.3%) |
| Total | 454 (96.8%) | 508 (94.4%) |
Income Below Poverty Among Married-Couple Families in Ouray
| Children | Above Poverty | Below Poverty |
| No Children | 187 (100.0%) | 0 (0.0%) |
| 1 or 2 Children | 36 (100.0%) | 0 (0.0%) |
| 3 or 4 Children | 21 (100.0%) | 0 (0.0%) |
| 5 or more Children | 0 (0.0%) | 0 (0.0%) |
| Total | 244 (100.0%) | 0 (0.0%) |
Income Below Poverty Among Single-Parent Households in Ouray
| Children | Single Father | Single Mother |
| No Children | 0 (0.0%) | 0 (0.0%) |
| 1 or 2 Children | 0 (0.0%) | 0 (0.0%) |
| 3 or 4 Children | 0 (0.0%) | 0 (0.0%) |
| 5 or more Children | 0 (0.0%) | 0 (0.0%) |
| Total | 0 (0.0%) | 0 (0.0%) |
Income Below Poverty Among Married-Couple vs Single-Parent Households in Ouray
| Children | Married-Couple Families | Single-Parent Households |
| No Children | 0 (0.0%) | 0 (0.0%) |
| 1 or 2 Children | 0 (0.0%) | 0 (0.0%) |
| 3 or 4 Children | 0 (0.0%) | 0 (0.0%) |
| 5 or more Children | 0 (0.0%) | 0 (0.0%) |
| Total | 0 (0.0%) | 0 (0.0%) |
Race in Ouray
The most populous races in Ouray are White / Caucasian (880 | 87.4%), Hispanic or Latino (106 | 10.5%), and Black / African American (65 | 6.5%).
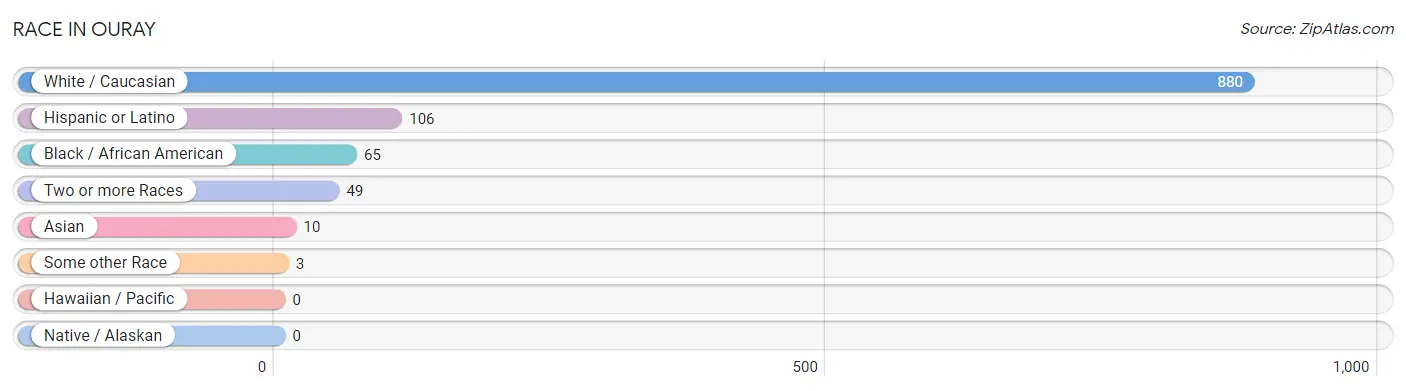
| Race | # Population | % Population |
| Asian | 10 | 1.0% |
| Black / African American | 65 | 6.5% |
| Hawaiian / Pacific | 0 | 0.0% |
| Hispanic or Latino | 106 | 10.5% |
| Native / Alaskan | 0 | 0.0% |
| White / Caucasian | 880 | 87.4% |
| Two or more Races | 49 | 4.9% |
| Some other Race | 3 | 0.3% |
| Total | 1,007 | 100.0% |
Ancestry in Ouray
The most populous ancestries reported in Ouray are English (148 | 14.7%), Irish (126 | 12.5%), German (114 | 11.3%), Mexican (96 | 9.5%), and Dutch (33 | 3.3%), together accounting for 51.3% of all Ouray residents.
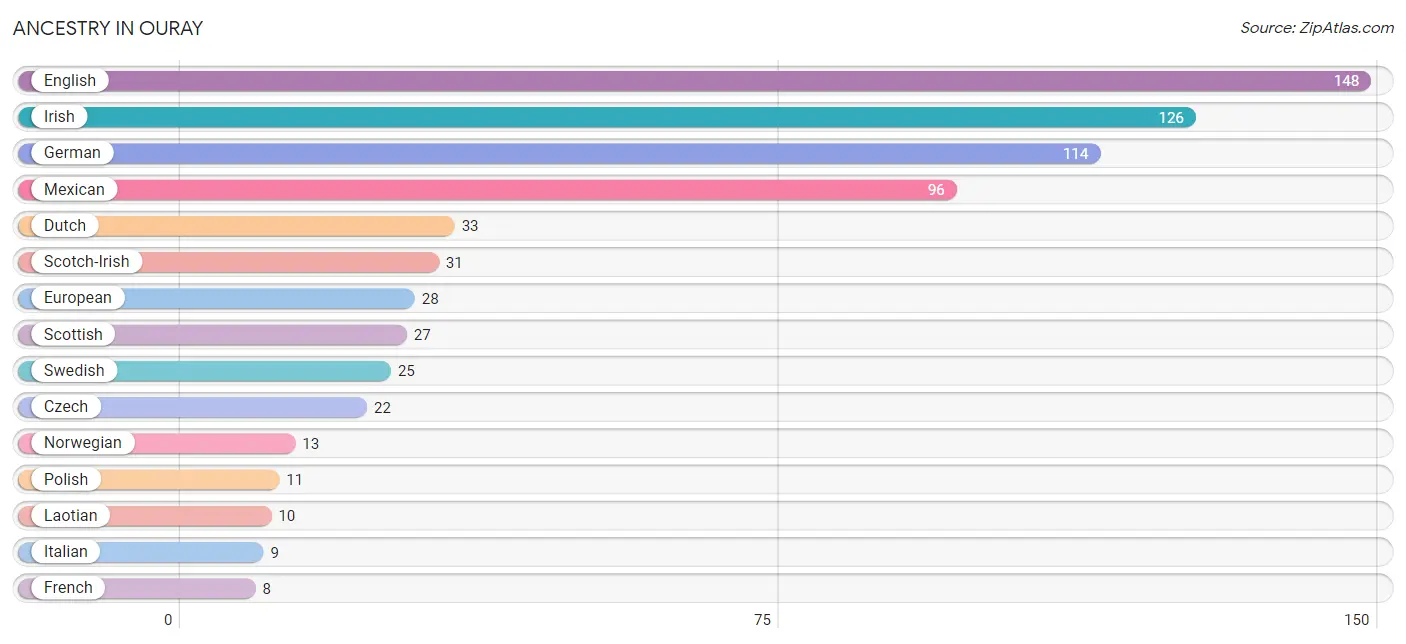
| Ancestry | # Population | % Population |
| Austrian | 2 | 0.2% |
| Czech | 22 | 2.2% |
| Dutch | 33 | 3.3% |
| English | 148 | 14.7% |
| European | 28 | 2.8% |
| French | 8 | 0.8% |
| German | 114 | 11.3% |
| Indian (Asian) | 8 | 0.8% |
| Irish | 126 | 12.5% |
| Italian | 9 | 0.9% |
| Laotian | 10 | 1.0% |
| Mexican | 96 | 9.5% |
| Native Hawaiian | 8 | 0.8% |
| Norwegian | 13 | 1.3% |
| Polish | 11 | 1.1% |
| Romanian | 8 | 0.8% |
| Scotch-Irish | 31 | 3.1% |
| Scottish | 27 | 2.7% |
| Spanish | 6 | 0.6% |
| Swedish | 25 | 2.5% |
| Ukrainian | 7 | 0.7% | View All 21 Rows |
Immigrants in Ouray
The most numerous immigrant groups reported in Ouray came from Central America (26 | 2.6%), Latin America (26 | 2.6%), Mexico (26 | 2.6%), Europe (15 | 1.5%), and Eastern Europe (8 | 0.8%), together accounting for 10.0% of all Ouray residents.
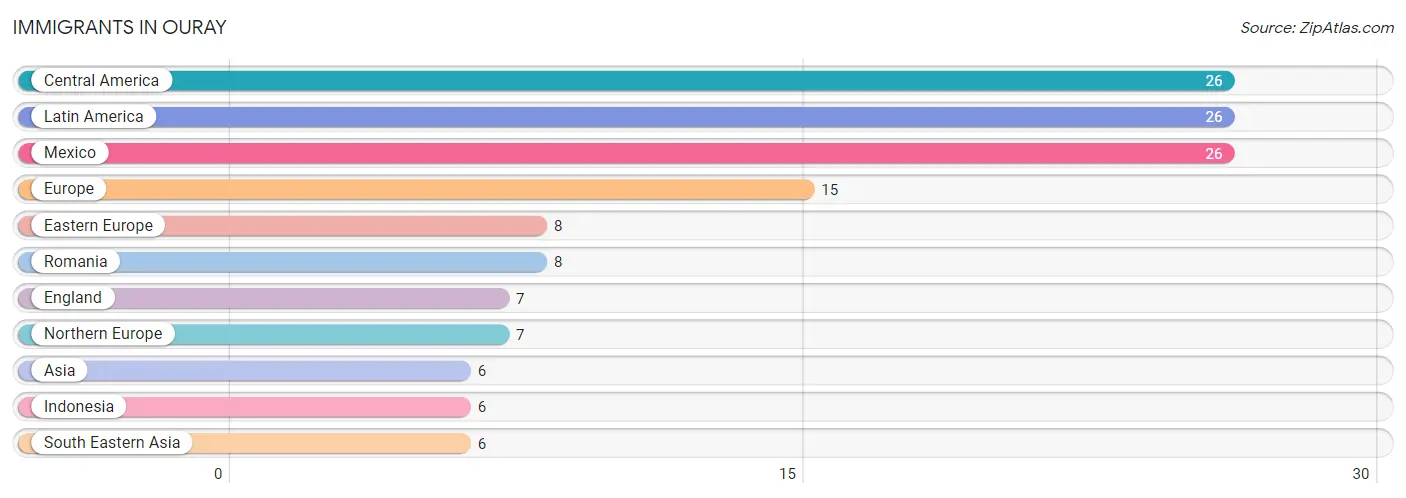
| Immigration Origin | # Population | % Population |
| Asia | 6 | 0.6% |
| Central America | 26 | 2.6% |
| Eastern Europe | 8 | 0.8% |
| England | 7 | 0.7% |
| Europe | 15 | 1.5% |
| Indonesia | 6 | 0.6% |
| Latin America | 26 | 2.6% |
| Mexico | 26 | 2.6% |
| Northern Europe | 7 | 0.7% |
| Romania | 8 | 0.8% |
| South Eastern Asia | 6 | 0.6% | View All 11 Rows |
Sex and Age in Ouray
Sex and Age in Ouray
The most populous age groups in Ouray are 70 to 74 Years (77 | 16.4%) for men and 25 to 29 Years (77 | 14.3%) for women.
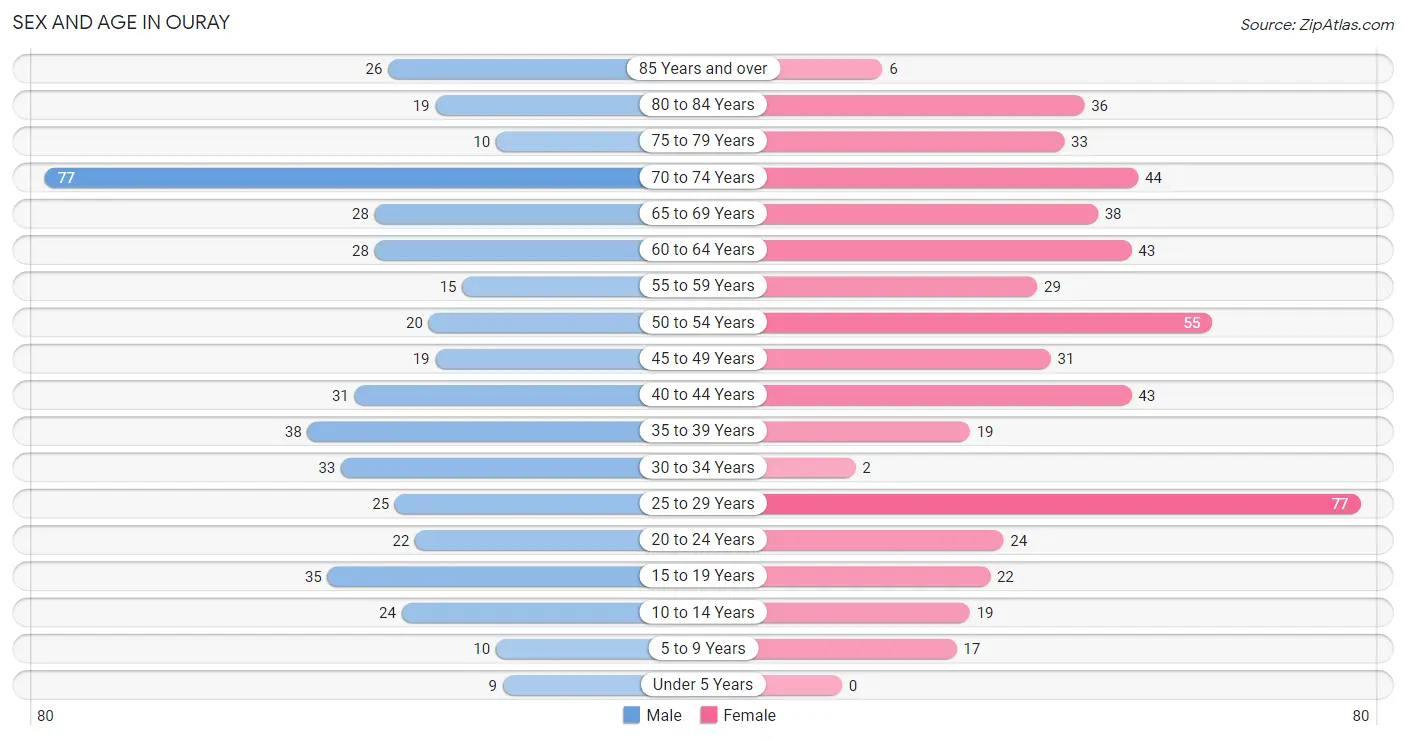
| Age Bracket | Male | Female |
| Under 5 Years | 9 (1.9%) | 0 (0.0%) |
| 5 to 9 Years | 10 (2.1%) | 17 (3.2%) |
| 10 to 14 Years | 24 (5.1%) | 19 (3.5%) |
| 15 to 19 Years | 35 (7.5%) | 22 (4.1%) |
| 20 to 24 Years | 22 (4.7%) | 24 (4.5%) |
| 25 to 29 Years | 25 (5.3%) | 77 (14.3%) |
| 30 to 34 Years | 33 (7.0%) | 2 (0.4%) |
| 35 to 39 Years | 38 (8.1%) | 19 (3.5%) |
| 40 to 44 Years | 31 (6.6%) | 43 (8.0%) |
| 45 to 49 Years | 19 (4.1%) | 31 (5.8%) |
| 50 to 54 Years | 20 (4.3%) | 55 (10.2%) |
| 55 to 59 Years | 15 (3.2%) | 29 (5.4%) |
| 60 to 64 Years | 28 (6.0%) | 43 (8.0%) |
| 65 to 69 Years | 28 (6.0%) | 38 (7.1%) |
| 70 to 74 Years | 77 (16.4%) | 44 (8.2%) |
| 75 to 79 Years | 10 (2.1%) | 33 (6.1%) |
| 80 to 84 Years | 19 (4.1%) | 36 (6.7%) |
| 85 Years and over | 26 (5.5%) | 6 (1.1%) |
| Total | 469 (100.0%) | 538 (100.0%) |
Families and Households in Ouray
Median Family Size in Ouray
The median family size in Ouray is 2.74 persons per family, with married-couple families (244 | 92.1%) accounting for the largest median family size of 2.79 persons per family. On the other hand, single male/father families (5 | 1.9%) represent the smallest median family size with 2.00 persons per family.
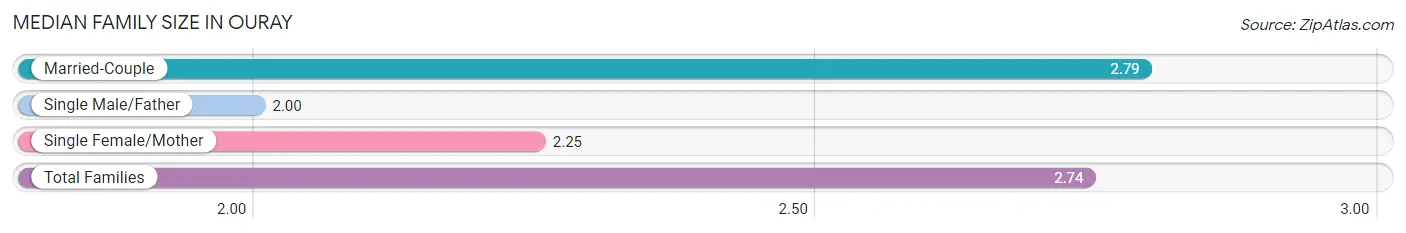
| Family Type | # Families | Family Size |
| Married-Couple | 244 (92.1%) | 2.79 |
| Single Male/Father | 5 (1.9%) | 2.00 |
| Single Female/Mother | 16 (6.0%) | 2.25 |
| Total Families | 265 (100.0%) | 2.74 |
Median Household Size in Ouray
The median household size in Ouray is 2.18 persons per household, with single male/father households (5 | 1.1%) accounting for the largest median household size of 2.8 persons per household. non-family households (197 | 42.6%) represent the smallest median household size with 1.41 persons per household.
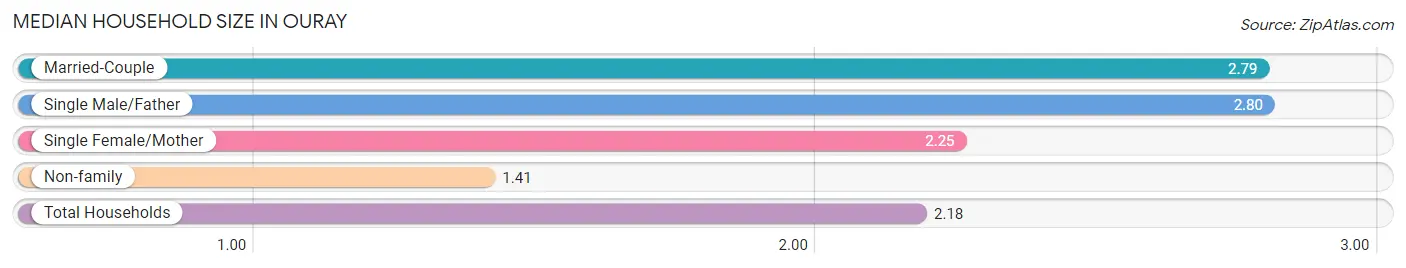
| Household Type | # Households | Household Size |
| Married-Couple | 244 (52.8%) | 2.79 |
| Single Male/Father | 5 (1.1%) | 2.80 |
| Single Female/Mother | 16 (3.5%) | 2.25 |
| Non-family | 197 (42.6%) | 1.41 |
| Total Households | 462 (100.0%) | 2.18 |
Household Size by Marriage Status in Ouray
Out of a total of 462 households in Ouray, 265 (57.4%) are family households, while 197 (42.6%) are nonfamily households. The most numerous type of family households are 2-person households, comprising 193, and the most common type of nonfamily households are 1-person households, comprising 146.
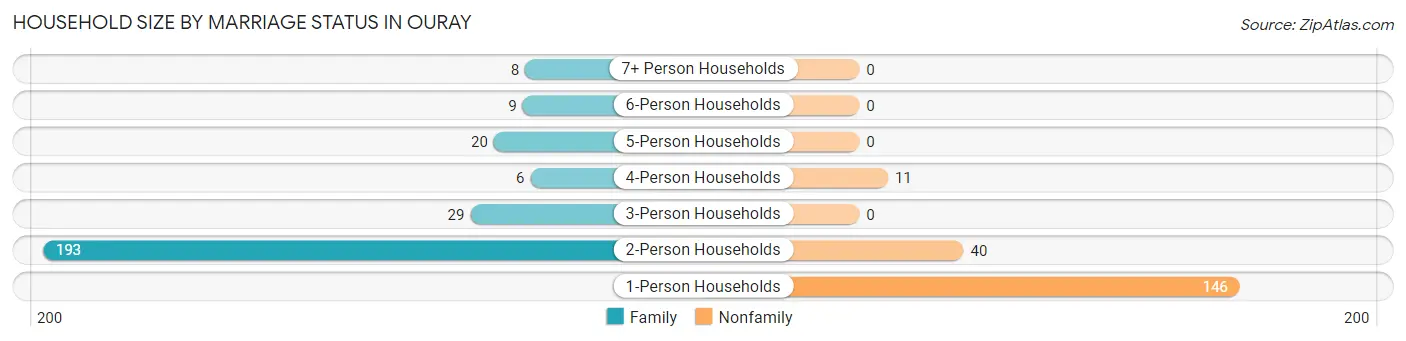
| Household Size | Family Households | Nonfamily Households |
| 1-Person Households | - | 146 (31.6%) |
| 2-Person Households | 193 (41.8%) | 40 (8.7%) |
| 3-Person Households | 29 (6.3%) | 0 (0.0%) |
| 4-Person Households | 6 (1.3%) | 11 (2.4%) |
| 5-Person Households | 20 (4.3%) | 0 (0.0%) |
| 6-Person Households | 9 (1.9%) | 0 (0.0%) |
| 7+ Person Households | 8 (1.7%) | 0 (0.0%) |
| Total | 265 (57.4%) | 197 (42.6%) |
Female Fertility in Ouray
Fertility by Age in Ouray
Average fertility rate in Ouray is 34.0 births per 1,000 women. Women in the age bracket of 35 to 50 years have the highest fertility rate with 75.0 births per 1,000 women. Women in the age bracket of 35 to 50 years acount for 100.0% of all women with births.
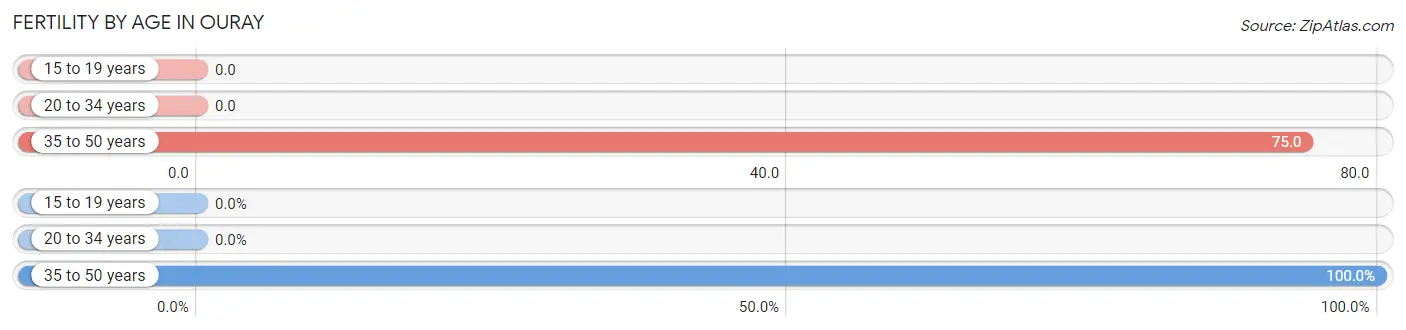
| Age Bracket | Women with Births | Births / 1,000 Women |
| 15 to 19 years | 0 (0.0%) | 0.0 |
| 20 to 34 years | 0 (0.0%) | 0.0 |
| 35 to 50 years | 8 (100.0%) | 75.0 |
| Total | 8 (100.0%) | 34.0 |
Fertility by Age by Marriage Status in Ouray
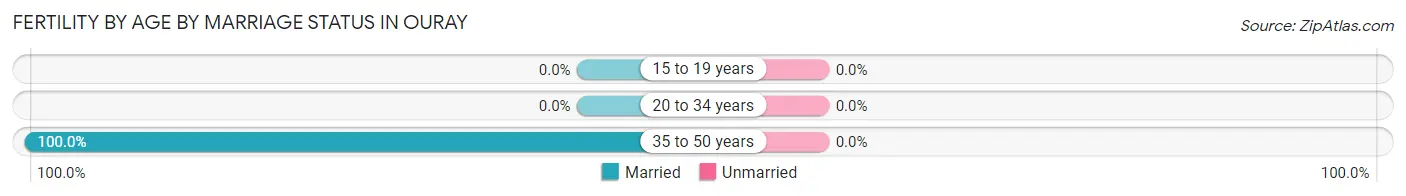
| Age Bracket | Married | Unmarried |
| 15 to 19 years | 0 (0.0%) | 0 (0.0%) |
| 20 to 34 years | 0 (0.0%) | 0 (0.0%) |
| 35 to 50 years | 8 (100.0%) | 0 (0.0%) |
| Total | 8 (100.0%) | 0 (0.0%) |
Fertility by Education in Ouray
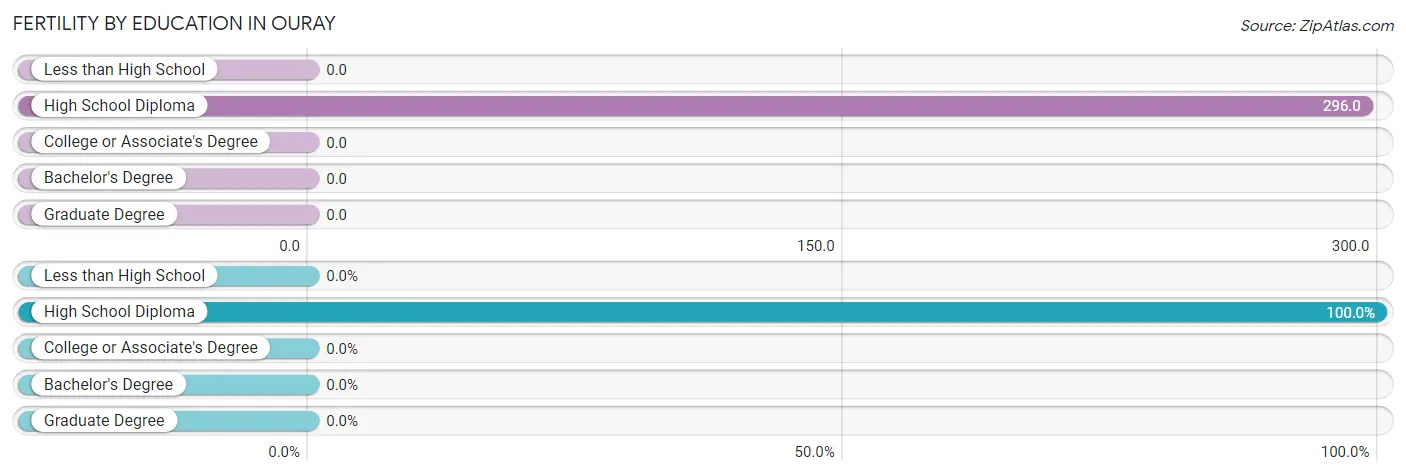
| Educational Attainment | Women with Births | Births / 1,000 Women |
| Less than High School | 0 (0.0%) | 0.0 |
| High School Diploma | 8 (100.0%) | 296.0 |
| College or Associate's Degree | 0 (0.0%) | 0.0 |
| Bachelor's Degree | 0 (0.0%) | 0.0 |
| Graduate Degree | 0 (0.0%) | 0.0 |
| Total | 8 (100.0%) | 34.0 |
Fertility by Education by Marriage Status in Ouray
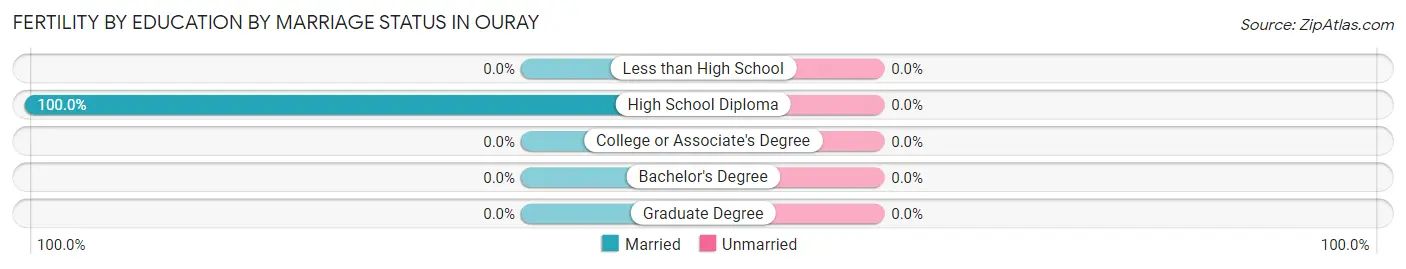
| Educational Attainment | Married | Unmarried |
| Less than High School | 0 (0.0%) | 0 (0.0%) |
| High School Diploma | 8 (100.0%) | 0 (0.0%) |
| College or Associate's Degree | 0 (0.0%) | 0 (0.0%) |
| Bachelor's Degree | 0 (0.0%) | 0 (0.0%) |
| Graduate Degree | 0 (0.0%) | 0 (0.0%) |
| Total | 8 (100.0%) | 0 (0.0%) |
Employment Characteristics in Ouray
Employment by Class of Employer in Ouray
Among the 525 employed individuals in Ouray, private company employees (276 | 52.6%), local government employees (93 | 17.7%), and self-employed (incorporated) (56 | 10.7%) make up the most common classes of employment.
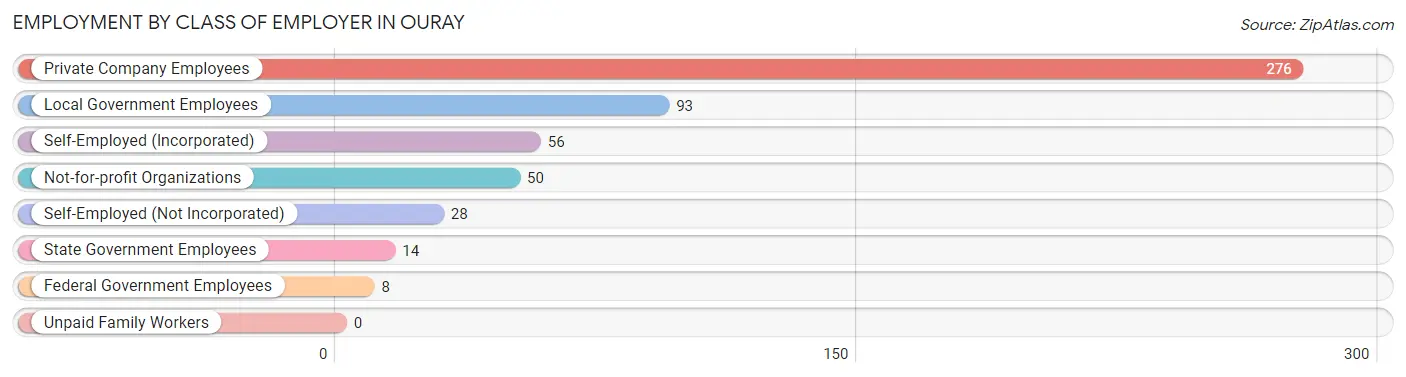
| Employer Class | # Employees | % Employees |
| Private Company Employees | 276 | 52.6% |
| Self-Employed (Incorporated) | 56 | 10.7% |
| Self-Employed (Not Incorporated) | 28 | 5.3% |
| Not-for-profit Organizations | 50 | 9.5% |
| Local Government Employees | 93 | 17.7% |
| State Government Employees | 14 | 2.7% |
| Federal Government Employees | 8 | 1.5% |
| Unpaid Family Workers | 0 | 0.0% |
| Total | 525 | 100.0% |
Employment Status by Age in Ouray
According to the labor force statistics for Ouray, out of the total population over 16 years of age (921), 59.7% or 550 individuals are in the labor force, with 4.5% or 25 of them unemployed. The age group with the highest labor force participation rate is 25 to 29 years, with 100.0% or 102 individuals in the labor force. Within the labor force, the 20 to 24 years age range has the highest percentage of unemployed individuals, with 25.0% or 8 of them being unemployed.
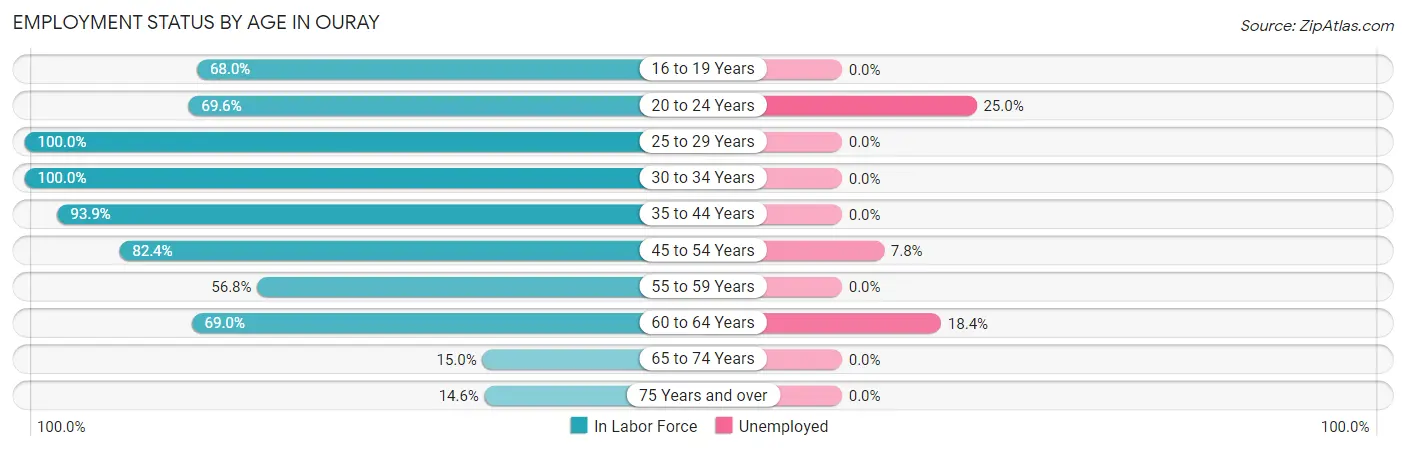
| Age Bracket | In Labor Force | Unemployed |
| 16 to 19 Years | 34 (68.0%) | 0 (0.0%) |
| 20 to 24 Years | 32 (69.6%) | 8 (25.0%) |
| 25 to 29 Years | 102 (100.0%) | 0 (0.0%) |
| 30 to 34 Years | 35 (100.0%) | 0 (0.0%) |
| 35 to 44 Years | 123 (93.9%) | 0 (0.0%) |
| 45 to 54 Years | 103 (82.4%) | 8 (7.8%) |
| 55 to 59 Years | 25 (56.8%) | 0 (0.0%) |
| 60 to 64 Years | 49 (69.0%) | 9 (18.4%) |
| 65 to 74 Years | 28 (15.0%) | 0 (0.0%) |
| 75 Years and over | 19 (14.6%) | 0 (0.0%) |
| Total | 550 (59.7%) | 25 (4.5%) |
Employment Status by Educational Attainment in Ouray
According to labor force statistics for Ouray, 86.0% of individuals (437) out of the total population between 25 and 64 years of age (508) are in the labor force, with 3.9% or 17 of them being unemployed. The group with the highest labor force participation rate are those with the educational attainment of less than high school, with 100.0% or 9 individuals in the labor force. Within the labor force, individuals with high school diploma education have the highest percentage of unemployment, with 12.0% or 9 of them being unemployed.
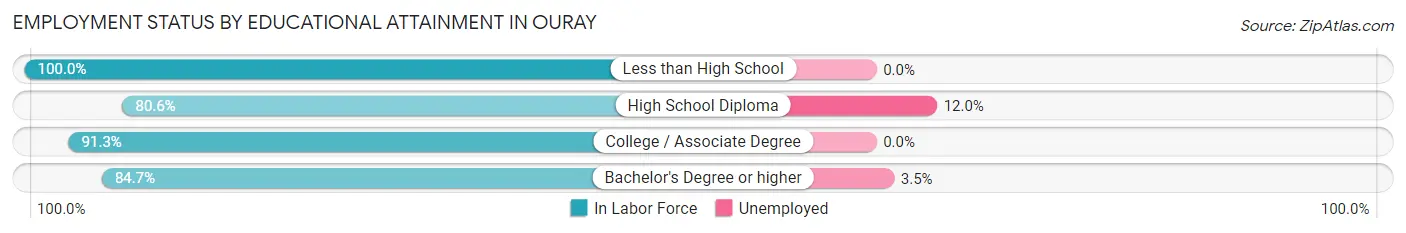
| Educational Attainment | In Labor Force | Unemployed |
| Less than High School | 9 (100.0%) | 0 (0.0%) |
| High School Diploma | 75 (80.6%) | 11 (12.0%) |
| College / Associate Degree | 126 (91.3%) | 0 (0.0%) |
| Bachelor's Degree or higher | 227 (84.7%) | 9 (3.5%) |
| Total | 437 (86.0%) | 20 (3.9%) |
Employment Occupations by Sex in Ouray
Management, Business, Science and Arts Occupations
The most common Management, Business, Science and Arts occupations in Ouray are Community & Social Service (131 | 24.9%), Education, Arts & Media (81 | 15.4%), Management (75 | 14.3%), Business & Financial (53 | 10.1%), and Education Instruction & Library (34 | 6.5%).
Management, Business, Science and Arts Occupations by Sex
Within the Management, Business, Science and Arts occupations in Ouray, the most male-oriented occupations are Computers, Engineering & Science (59.3%), Computers & Mathematics (59.3%), and Management (53.3%), while the most female-oriented occupations are Education Instruction & Library (100.0%), Arts, Media & Entertainment (81.2%), and Business & Financial (69.8%).
| Occupation | Male | Female |
| Management | 40 (53.3%) | 35 (46.7%) |
| Business & Financial | 16 (30.2%) | 37 (69.8%) |
| Computers, Engineering & Science | 16 (59.3%) | 11 (40.7%) |
| Computers & Mathematics | 16 (59.3%) | 11 (40.7%) |
| Architecture & Engineering | 0 (0.0%) | 0 (0.0%) |
| Life, Physical & Social Science | 0 (0.0%) | 0 (0.0%) |
| Community & Social Service | 44 (33.6%) | 87 (66.4%) |
| Education, Arts & Media | 41 (50.6%) | 40 (49.4%) |
| Legal Services & Support | 0 (0.0%) | 0 (0.0%) |
| Education Instruction & Library | 0 (0.0%) | 34 (100.0%) |
| Arts, Media & Entertainment | 3 (18.8%) | 13 (81.2%) |
| Health Diagnosing & Treating | 0 (0.0%) | 0 (0.0%) |
| Health Technologists | 0 (0.0%) | 0 (0.0%) |
| Total (Category) | 116 (40.6%) | 170 (59.4%) |
| Total (Overall) | 246 (46.9%) | 279 (53.1%) |
Services Occupations
The most common Services occupations in Ouray are Cleaning & Maintenance (57 | 10.9%), Food Preparation & Serving (46 | 8.8%), and Personal Care & Service (13 | 2.5%).
Services Occupations by Sex
Within the Services occupations in Ouray, the most male-oriented occupations are Food Preparation & Serving (80.4%), Personal Care & Service (69.2%), and Cleaning & Maintenance (29.8%), while the most female-oriented occupations are Cleaning & Maintenance (70.2%), Personal Care & Service (30.8%), and Food Preparation & Serving (19.6%).
| Occupation | Male | Female |
| Healthcare Support | 0 (0.0%) | 0 (0.0%) |
| Security & Protection | 0 (0.0%) | 0 (0.0%) |
| Firefighting & Prevention | 0 (0.0%) | 0 (0.0%) |
| Law Enforcement | 0 (0.0%) | 0 (0.0%) |
| Food Preparation & Serving | 37 (80.4%) | 9 (19.6%) |
| Cleaning & Maintenance | 17 (29.8%) | 40 (70.2%) |
| Personal Care & Service | 9 (69.2%) | 4 (30.8%) |
| Total (Category) | 63 (54.3%) | 53 (45.7%) |
| Total (Overall) | 246 (46.9%) | 279 (53.1%) |
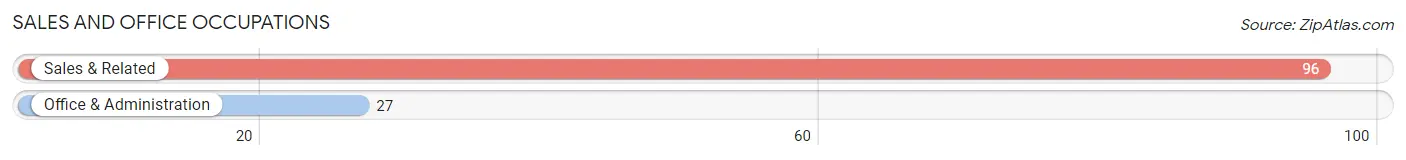
Sales and Office Occupations
The most common Sales and Office occupations in Ouray are Sales & Related (96 | 18.3%), and Office & Administration (27 | 5.1%).
Sales and Office Occupations by Sex
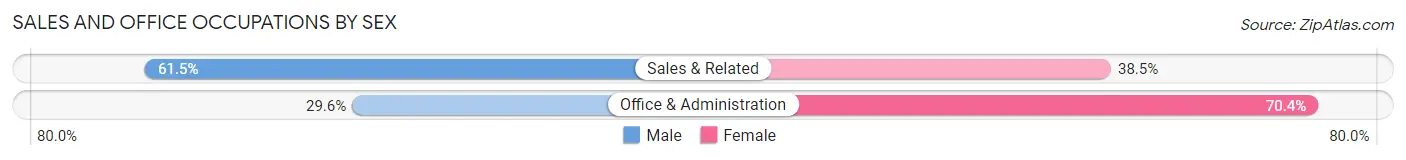
| Occupation | Male | Female |
| Sales & Related | 59 (61.5%) | 37 (38.5%) |
| Office & Administration | 8 (29.6%) | 19 (70.4%) |
| Total (Category) | 67 (54.5%) | 56 (45.5%) |
| Total (Overall) | 246 (46.9%) | 279 (53.1%) |
Natural Resources, Construction and Maintenance Occupations
Natural Resources, Construction and Maintenance Occupations by Sex
| Occupation | Male | Female |
| Farming, Fishing & Forestry | 0 (0.0%) | 0 (0.0%) |
| Construction & Extraction | 0 (0.0%) | 0 (0.0%) |
| Installation, Maintenance & Repair | 0 (0.0%) | 0 (0.0%) |
| Total (Category) | 0 (0.0%) | 0 (0.0%) |
| Total (Overall) | 246 (46.9%) | 279 (53.1%) |
Production, Transportation and Moving Occupations
Production, Transportation and Moving Occupations by Sex
| Occupation | Male | Female |
| Production | 0 (0.0%) | 0 (0.0%) |
| Transportation | 0 (0.0%) | 0 (0.0%) |
| Material Moving | 0 (0.0%) | 0 (0.0%) |
| Total (Category) | 0 (0.0%) | 0 (0.0%) |
| Total (Overall) | 246 (46.9%) | 279 (53.1%) |
Employment Industries by Sex in Ouray
Employment Industries in Ouray
The major employment industries in Ouray include Health Care & Social Assistance (77 | 14.7%), Accommodation & Food Services (71 | 13.5%), Professional & Scientific (51 | 9.7%), Arts, Entertainment & Recreation (39 | 7.4%), and Public Administration (38 | 7.2%).
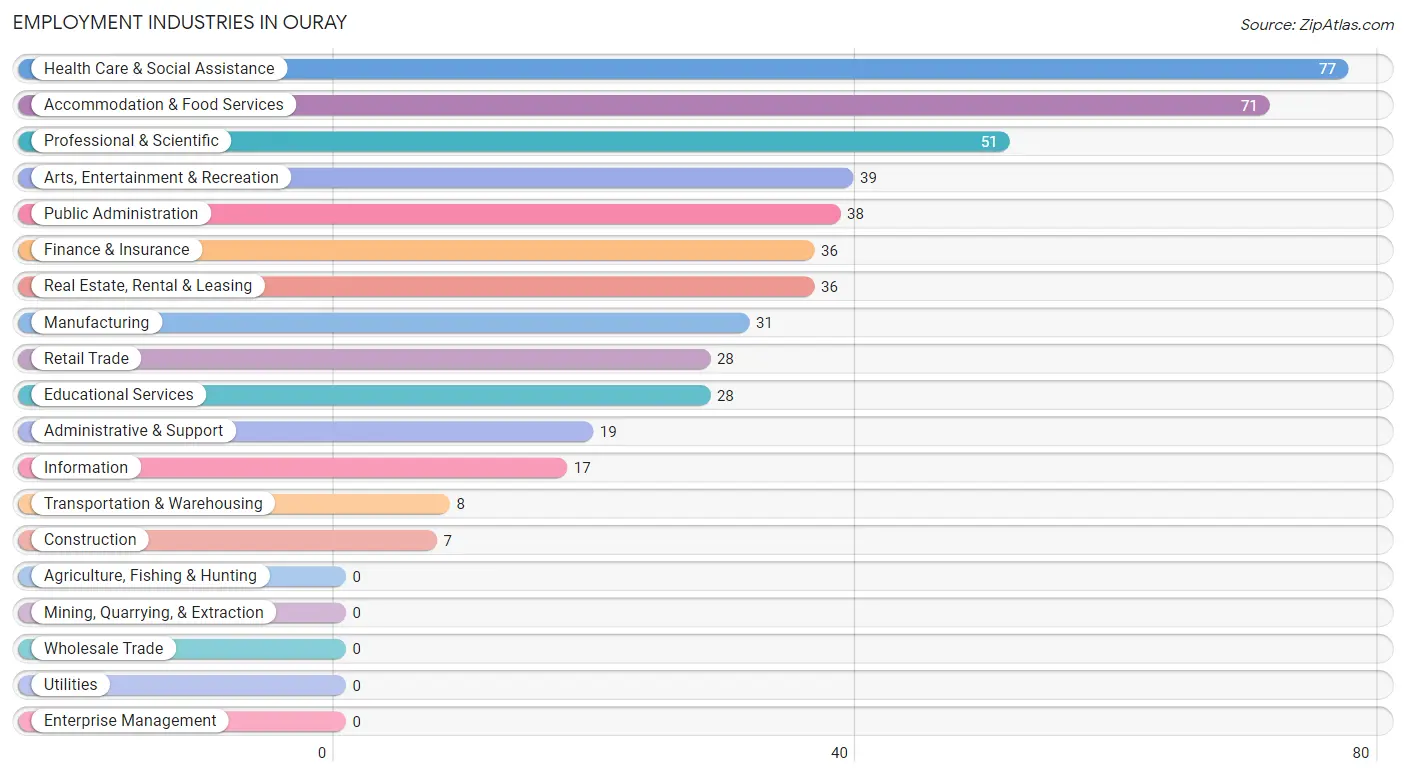
Employment Industries by Sex in Ouray
The Ouray industries that see more men than women are Construction (100.0%), Manufacturing (100.0%), and Transportation & Warehousing (100.0%), whereas the industries that tend to have a higher number of women are Information (100.0%), Educational Services (100.0%), and Arts, Entertainment & Recreation (100.0%).
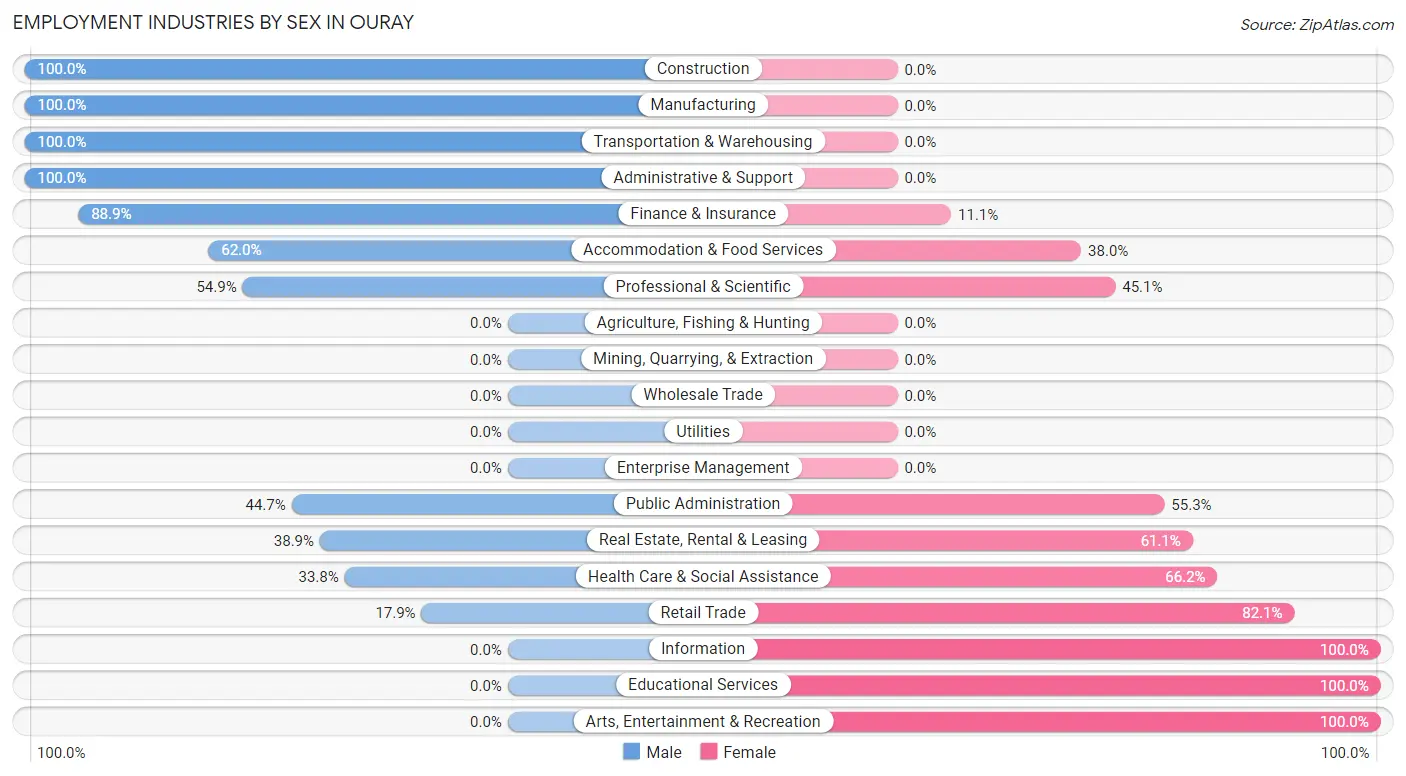
| Industry | Male | Female |
| Agriculture, Fishing & Hunting | 0 (0.0%) | 0 (0.0%) |
| Mining, Quarrying, & Extraction | 0 (0.0%) | 0 (0.0%) |
| Construction | 7 (100.0%) | 0 (0.0%) |
| Manufacturing | 31 (100.0%) | 0 (0.0%) |
| Wholesale Trade | 0 (0.0%) | 0 (0.0%) |
| Retail Trade | 5 (17.9%) | 23 (82.1%) |
| Transportation & Warehousing | 8 (100.0%) | 0 (0.0%) |
| Utilities | 0 (0.0%) | 0 (0.0%) |
| Information | 0 (0.0%) | 17 (100.0%) |
| Finance & Insurance | 32 (88.9%) | 4 (11.1%) |
| Real Estate, Rental & Leasing | 14 (38.9%) | 22 (61.1%) |
| Professional & Scientific | 28 (54.9%) | 23 (45.1%) |
| Enterprise Management | 0 (0.0%) | 0 (0.0%) |
| Administrative & Support | 19 (100.0%) | 0 (0.0%) |
| Educational Services | 0 (0.0%) | 28 (100.0%) |
| Health Care & Social Assistance | 26 (33.8%) | 51 (66.2%) |
| Arts, Entertainment & Recreation | 0 (0.0%) | 39 (100.0%) |
| Accommodation & Food Services | 44 (62.0%) | 27 (38.0%) |
| Public Administration | 17 (44.7%) | 21 (55.3%) |
| Total | 246 (46.9%) | 279 (53.1%) |
Education in Ouray
School Enrollment in Ouray
The most common levels of schooling among the 147 students in Ouray are high school (57 | 38.8%), middle school (39 | 26.5%), and elementary school (31 | 21.1%).
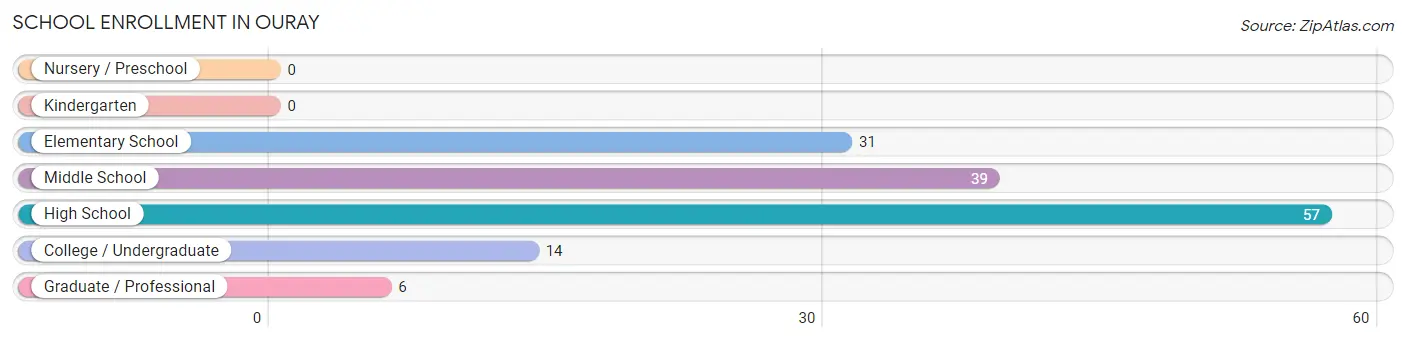
| School Level | # Students | % Students |
| Nursery / Preschool | 0 | 0.0% |
| Kindergarten | 0 | 0.0% |
| Elementary School | 31 | 21.1% |
| Middle School | 39 | 26.5% |
| High School | 57 | 38.8% |
| College / Undergraduate | 14 | 9.5% |
| Graduate / Professional | 6 | 4.1% |
| Total | 147 | 100.0% |
School Enrollment by Age by Funding Source in Ouray
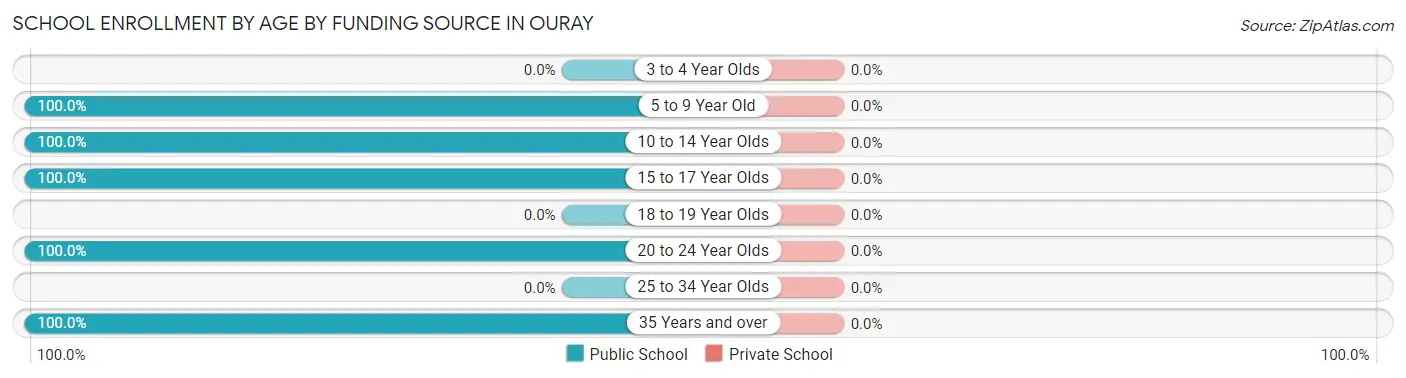
| Age Bracket | Public School | Private School |
| 3 to 4 Year Olds | 0 (0.0%) | 0 (0.0%) |
| 5 to 9 Year Old | 27 (100.0%) | 0 (0.0%) |
| 10 to 14 Year Olds | 43 (100.0%) | 0 (0.0%) |
| 15 to 17 Year Olds | 57 (100.0%) | 0 (0.0%) |
| 18 to 19 Year Olds | 0 (0.0%) | 0 (0.0%) |
| 20 to 24 Year Olds | 14 (100.0%) | 0 (0.0%) |
| 25 to 34 Year Olds | 0 (0.0%) | 0 (0.0%) |
| 35 Years and over | 6 (100.0%) | 0 (0.0%) |
| Total | 147 (100.0%) | 0 (0.0%) |
Educational Attainment by Field of Study in Ouray
Business (110 | 21.5%), visual & performing arts (86 | 16.8%), arts & humanities (67 | 13.1%), education (57 | 11.2%), and engineering (41 | 8.0%) are the most common fields of study among 511 individuals in Ouray who have obtained a bachelor's degree or higher.
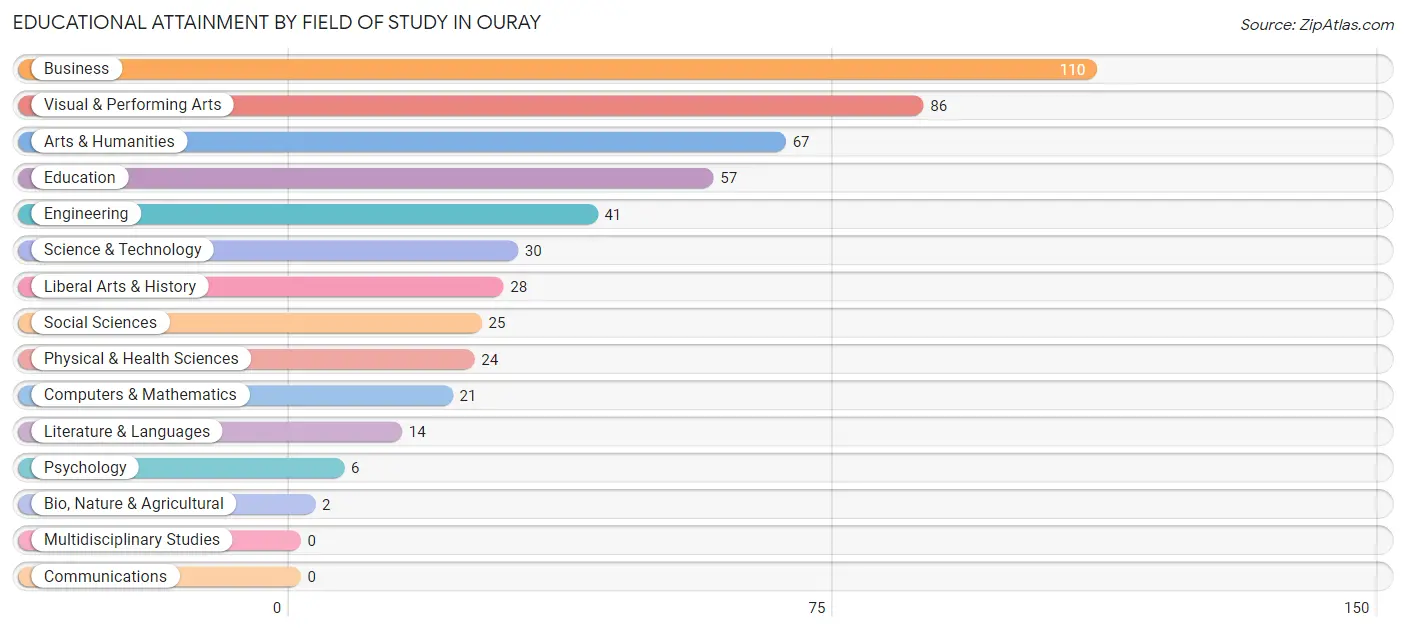
| Field of Study | # Graduates | % Graduates |
| Computers & Mathematics | 21 | 4.1% |
| Bio, Nature & Agricultural | 2 | 0.4% |
| Physical & Health Sciences | 24 | 4.7% |
| Psychology | 6 | 1.2% |
| Social Sciences | 25 | 4.9% |
| Engineering | 41 | 8.0% |
| Multidisciplinary Studies | 0 | 0.0% |
| Science & Technology | 30 | 5.9% |
| Business | 110 | 21.5% |
| Education | 57 | 11.2% |
| Literature & Languages | 14 | 2.7% |
| Liberal Arts & History | 28 | 5.5% |
| Visual & Performing Arts | 86 | 16.8% |
| Communications | 0 | 0.0% |
| Arts & Humanities | 67 | 13.1% |
| Total | 511 | 100.0% |
Transportation & Commute in Ouray
Vehicle Availability by Sex in Ouray
The most prevalent vehicle ownership categories in Ouray are males with 2 vehicles (114, accounting for 46.3%) and females with 2 vehicles (102, making up 40.9%).
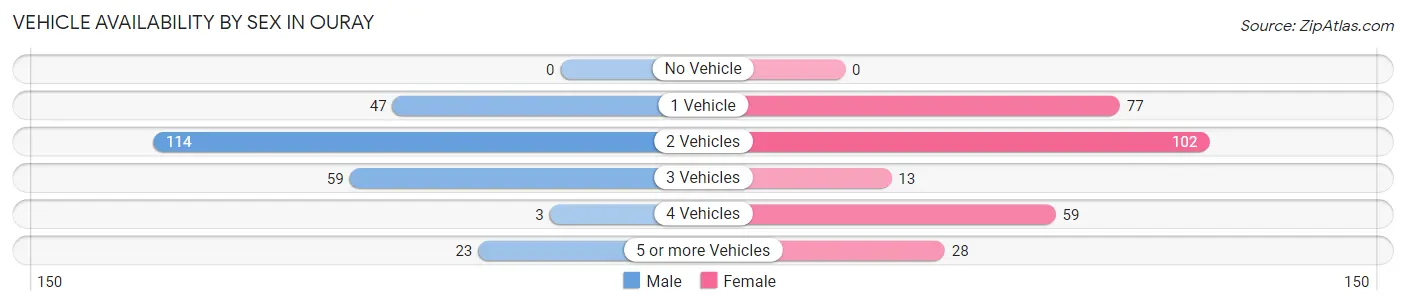
| Vehicles Available | Male | Female |
| No Vehicle | 0 (0.0%) | 0 (0.0%) |
| 1 Vehicle | 47 (19.1%) | 77 (27.6%) |
| 2 Vehicles | 114 (46.3%) | 102 (36.6%) |
| 3 Vehicles | 59 (24.0%) | 13 (4.7%) |
| 4 Vehicles | 3 (1.2%) | 59 (21.1%) |
| 5 or more Vehicles | 23 (9.3%) | 28 (10.0%) |
| Total | 246 (100.0%) | 279 (100.0%) |
Commute Time in Ouray
The most frequently occuring commute durations in Ouray are 5 to 9 minutes (194 commuters, 42.5%), 15 to 19 minutes (98 commuters, 21.5%), and 10 to 14 minutes (80 commuters, 17.5%).
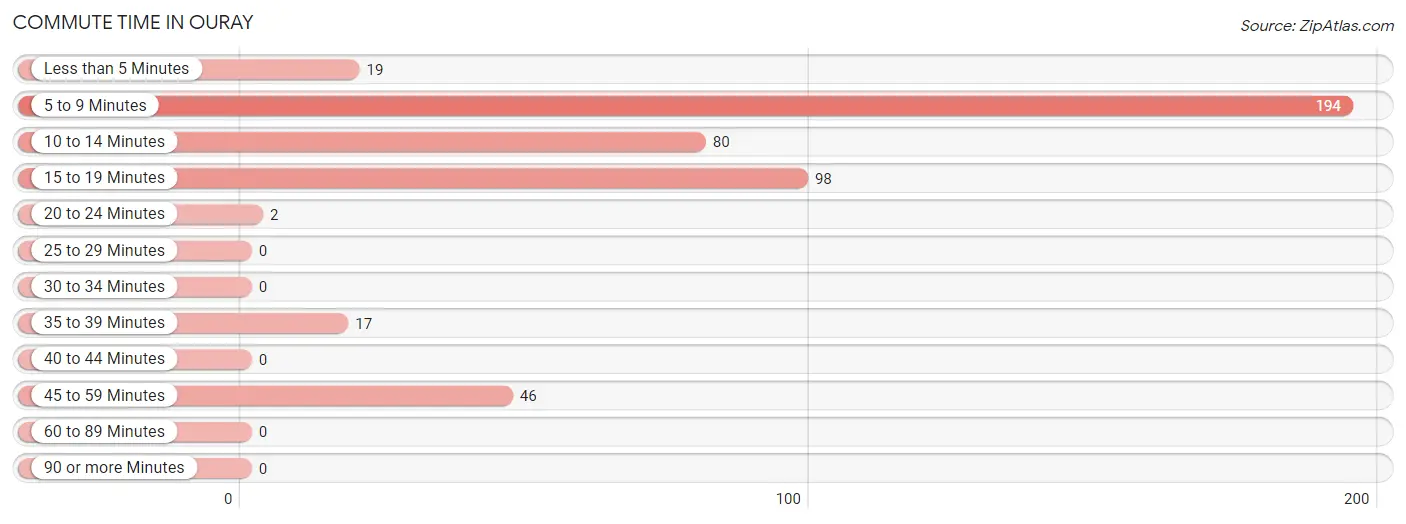
| Commute Time | # Commuters | % Commuters |
| Less than 5 Minutes | 19 | 4.2% |
| 5 to 9 Minutes | 194 | 42.5% |
| 10 to 14 Minutes | 80 | 17.5% |
| 15 to 19 Minutes | 98 | 21.5% |
| 20 to 24 Minutes | 2 | 0.4% |
| 25 to 29 Minutes | 0 | 0.0% |
| 30 to 34 Minutes | 0 | 0.0% |
| 35 to 39 Minutes | 17 | 3.7% |
| 40 to 44 Minutes | 0 | 0.0% |
| 45 to 59 Minutes | 46 | 10.1% |
| 60 to 89 Minutes | 0 | 0.0% |
| 90 or more Minutes | 0 | 0.0% |
Commute Time by Sex in Ouray
The most common commute times in Ouray are 5 to 9 minutes (94 commuters, 43.1%) for males and 5 to 9 minutes (100 commuters, 42.0%) for females.
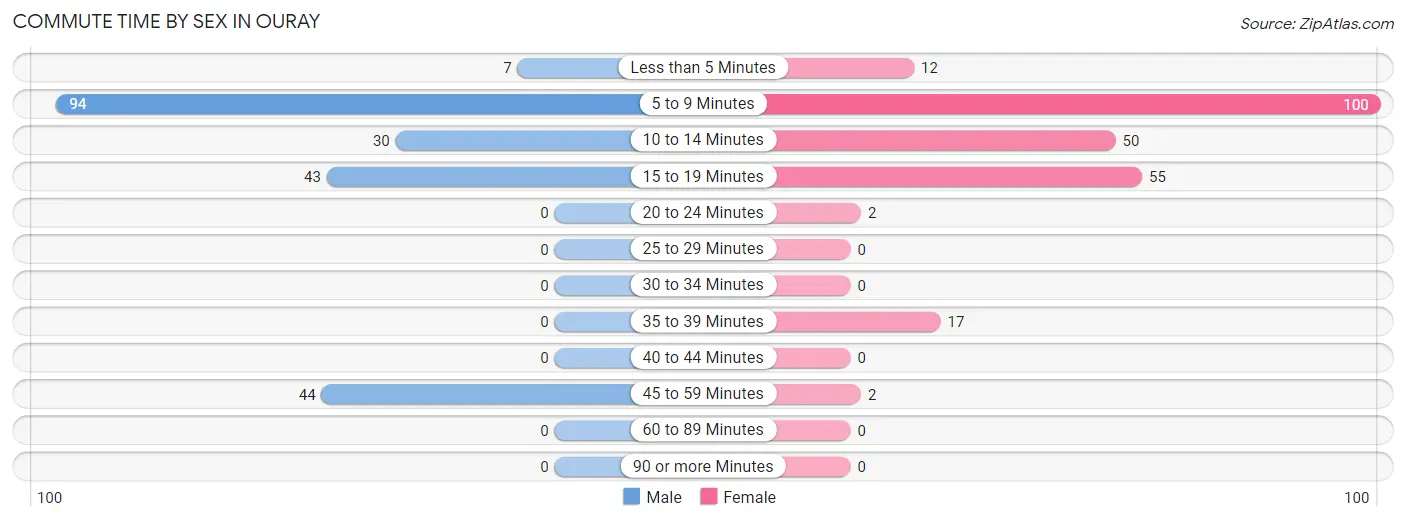
| Commute Time | Male | Female |
| Less than 5 Minutes | 7 (3.2%) | 12 (5.0%) |
| 5 to 9 Minutes | 94 (43.1%) | 100 (42.0%) |
| 10 to 14 Minutes | 30 (13.8%) | 50 (21.0%) |
| 15 to 19 Minutes | 43 (19.7%) | 55 (23.1%) |
| 20 to 24 Minutes | 0 (0.0%) | 2 (0.8%) |
| 25 to 29 Minutes | 0 (0.0%) | 0 (0.0%) |
| 30 to 34 Minutes | 0 (0.0%) | 0 (0.0%) |
| 35 to 39 Minutes | 0 (0.0%) | 17 (7.1%) |
| 40 to 44 Minutes | 0 (0.0%) | 0 (0.0%) |
| 45 to 59 Minutes | 44 (20.2%) | 2 (0.8%) |
| 60 to 89 Minutes | 0 (0.0%) | 0 (0.0%) |
| 90 or more Minutes | 0 (0.0%) | 0 (0.0%) |
Time of Departure to Work by Sex in Ouray
The most frequent times of departure to work in Ouray are 7:00 AM to 7:29 AM (113, 51.8%) for males and 7:30 AM to 7:59 AM (79, 33.2%) for females.
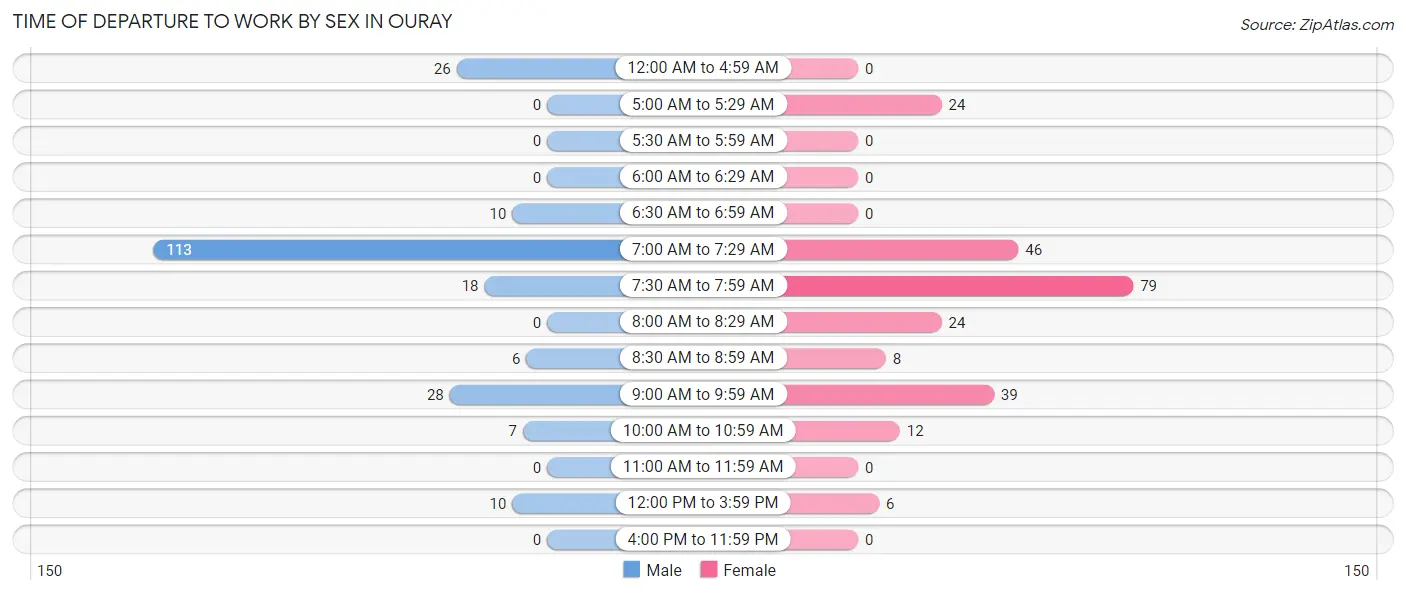
| Time of Departure | Male | Female |
| 12:00 AM to 4:59 AM | 26 (11.9%) | 0 (0.0%) |
| 5:00 AM to 5:29 AM | 0 (0.0%) | 24 (10.1%) |
| 5:30 AM to 5:59 AM | 0 (0.0%) | 0 (0.0%) |
| 6:00 AM to 6:29 AM | 0 (0.0%) | 0 (0.0%) |
| 6:30 AM to 6:59 AM | 10 (4.6%) | 0 (0.0%) |
| 7:00 AM to 7:29 AM | 113 (51.8%) | 46 (19.3%) |
| 7:30 AM to 7:59 AM | 18 (8.3%) | 79 (33.2%) |
| 8:00 AM to 8:29 AM | 0 (0.0%) | 24 (10.1%) |
| 8:30 AM to 8:59 AM | 6 (2.8%) | 8 (3.4%) |
| 9:00 AM to 9:59 AM | 28 (12.8%) | 39 (16.4%) |
| 10:00 AM to 10:59 AM | 7 (3.2%) | 12 (5.0%) |
| 11:00 AM to 11:59 AM | 0 (0.0%) | 0 (0.0%) |
| 12:00 PM to 3:59 PM | 10 (4.6%) | 6 (2.5%) |
| 4:00 PM to 11:59 PM | 0 (0.0%) | 0 (0.0%) |
| Total | 218 (100.0%) | 238 (100.0%) |
Housing Occupancy in Ouray
Occupancy by Ownership in Ouray
Of the total 462 dwellings in Ouray, owner-occupied units account for 339 (73.4%), while renter-occupied units make up 123 (26.6%).
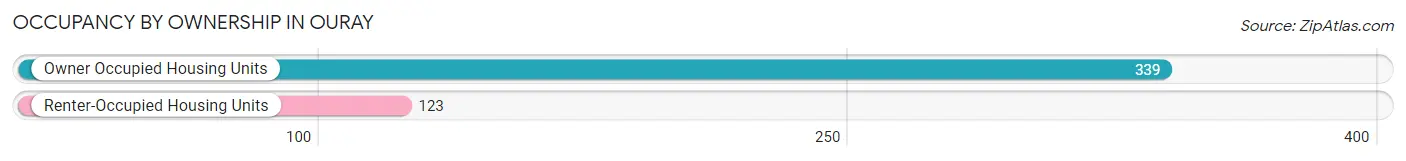
| Occupancy | # Housing Units | % Housing Units |
| Owner Occupied Housing Units | 339 | 73.4% |
| Renter-Occupied Housing Units | 123 | 26.6% |
| Total Occupied Housing Units | 462 | 100.0% |
Occupancy by Household Size in Ouray
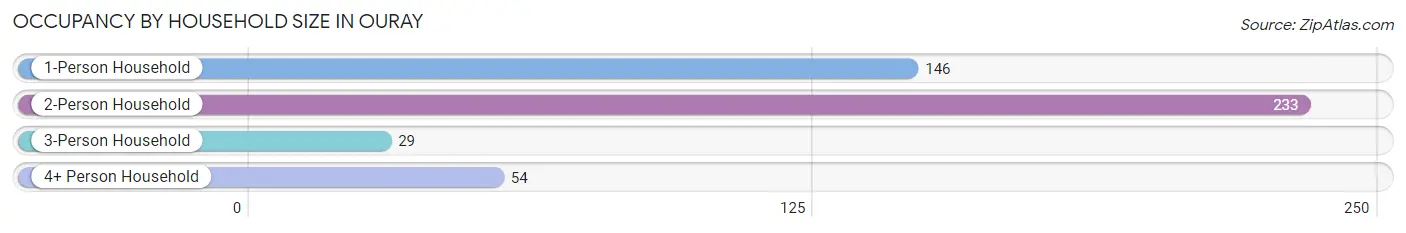
| Household Size | # Housing Units | % Housing Units |
| 1-Person Household | 146 | 31.6% |
| 2-Person Household | 233 | 50.4% |
| 3-Person Household | 29 | 6.3% |
| 4+ Person Household | 54 | 11.7% |
| Total Housing Units | 462 | 100.0% |
Occupancy by Ownership by Household Size in Ouray
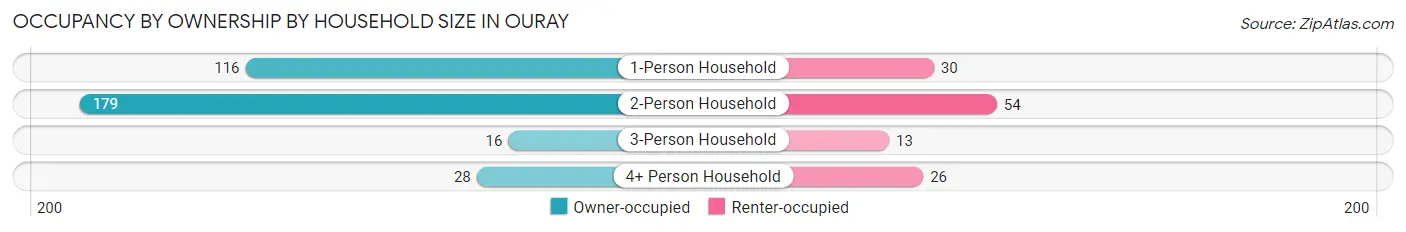
| Household Size | Owner-occupied | Renter-occupied |
| 1-Person Household | 116 (79.4%) | 30 (20.5%) |
| 2-Person Household | 179 (76.8%) | 54 (23.2%) |
| 3-Person Household | 16 (55.2%) | 13 (44.8%) |
| 4+ Person Household | 28 (51.8%) | 26 (48.1%) |
| Total Housing Units | 339 (73.4%) | 123 (26.6%) |
Occupancy by Educational Attainment in Ouray
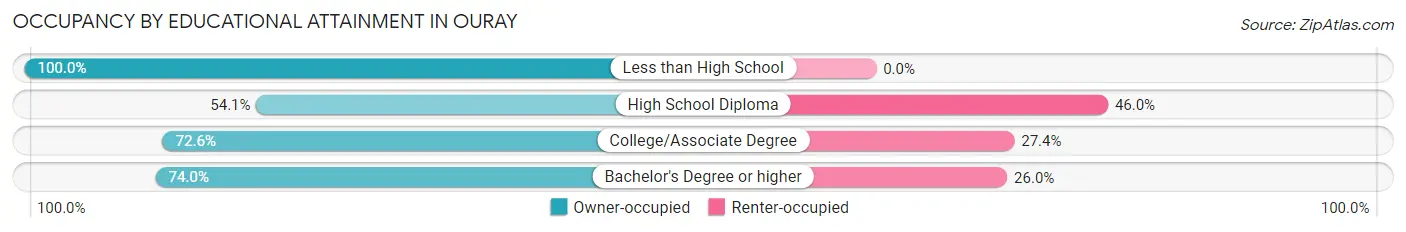
| Household Size | Owner-occupied | Renter-occupied |
| Less than High School | 26 (100.0%) | 0 (0.0%) |
| High School Diploma | 20 (54.0%) | 17 (46.0%) |
| College/Associate Degree | 122 (72.6%) | 46 (27.4%) |
| Bachelor's Degree or higher | 171 (74.0%) | 60 (26.0%) |
Occupancy by Age of Householder in Ouray
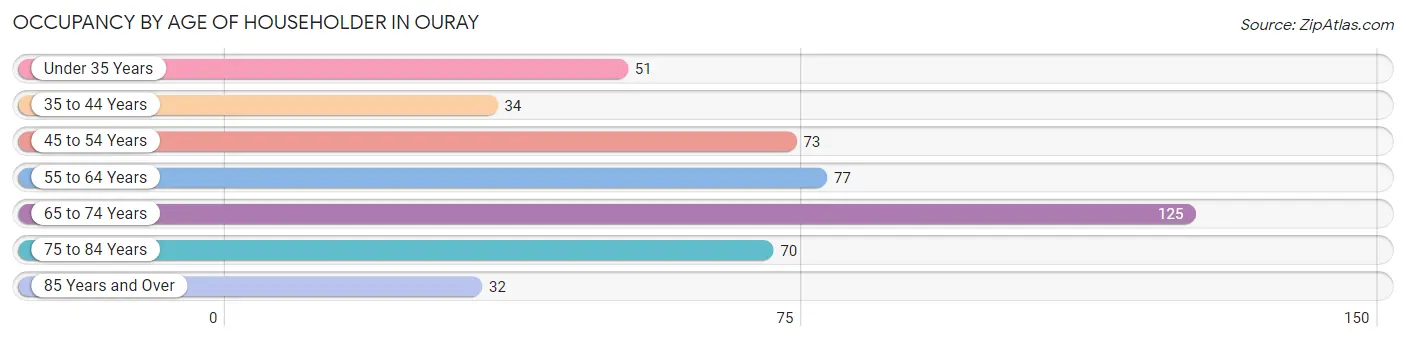
| Age Bracket | # Households | % Households |
| Under 35 Years | 51 | 11.0% |
| 35 to 44 Years | 34 | 7.4% |
| 45 to 54 Years | 73 | 15.8% |
| 55 to 64 Years | 77 | 16.7% |
| 65 to 74 Years | 125 | 27.1% |
| 75 to 84 Years | 70 | 15.1% |
| 85 Years and Over | 32 | 6.9% |
| Total | 462 | 100.0% |
Housing Finances in Ouray
Median Income by Occupancy in Ouray
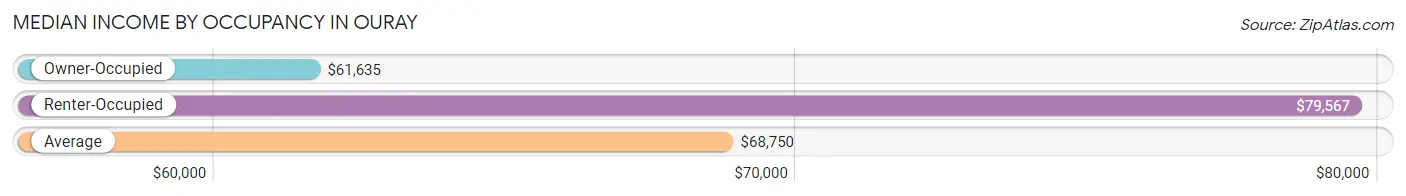
| Occupancy Type | # Households | Median Income |
| Owner-Occupied | 339 (73.4%) | $61,635 |
| Renter-Occupied | 123 (26.6%) | $79,567 |
| Average | 462 (100.0%) | $68,750 |
Occupancy by Householder Income Bracket in Ouray
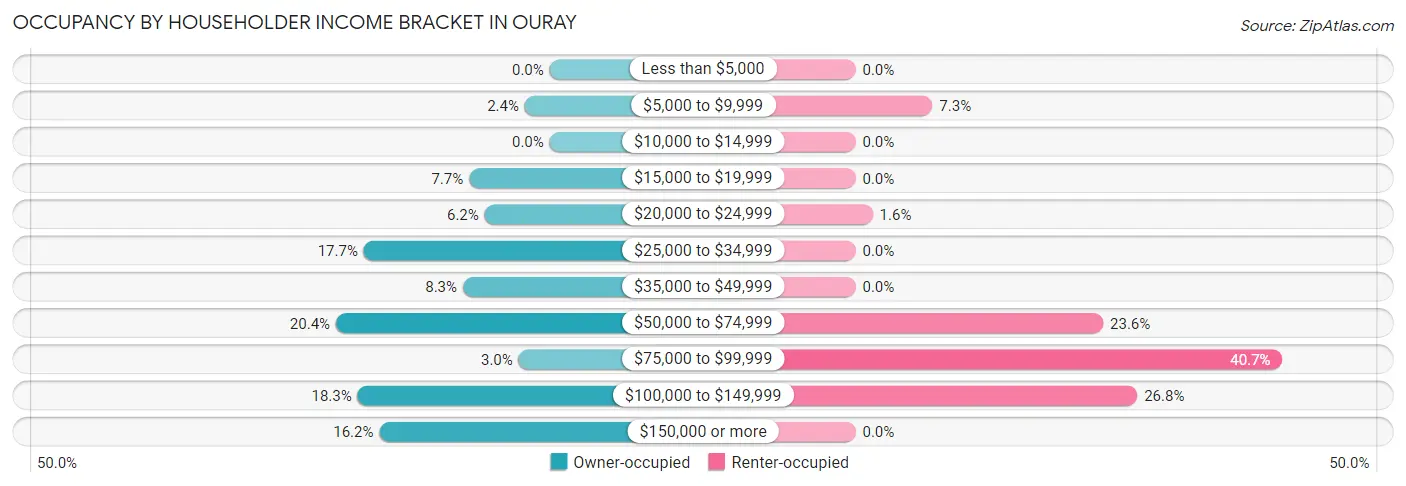
| Income Bracket | Owner-occupied | Renter-occupied |
| Less than $5,000 | 0 (0.0%) | 0 (0.0%) |
| $5,000 to $9,999 | 8 (2.4%) | 9 (7.3%) |
| $10,000 to $14,999 | 0 (0.0%) | 0 (0.0%) |
| $15,000 to $19,999 | 26 (7.7%) | 0 (0.0%) |
| $20,000 to $24,999 | 21 (6.2%) | 2 (1.6%) |
| $25,000 to $34,999 | 60 (17.7%) | 0 (0.0%) |
| $35,000 to $49,999 | 28 (8.3%) | 0 (0.0%) |
| $50,000 to $74,999 | 69 (20.3%) | 29 (23.6%) |
| $75,000 to $99,999 | 10 (2.9%) | 50 (40.6%) |
| $100,000 to $149,999 | 62 (18.3%) | 33 (26.8%) |
| $150,000 or more | 55 (16.2%) | 0 (0.0%) |
| Total | 339 (100.0%) | 123 (100.0%) |
Monthly Housing Cost Tiers in Ouray
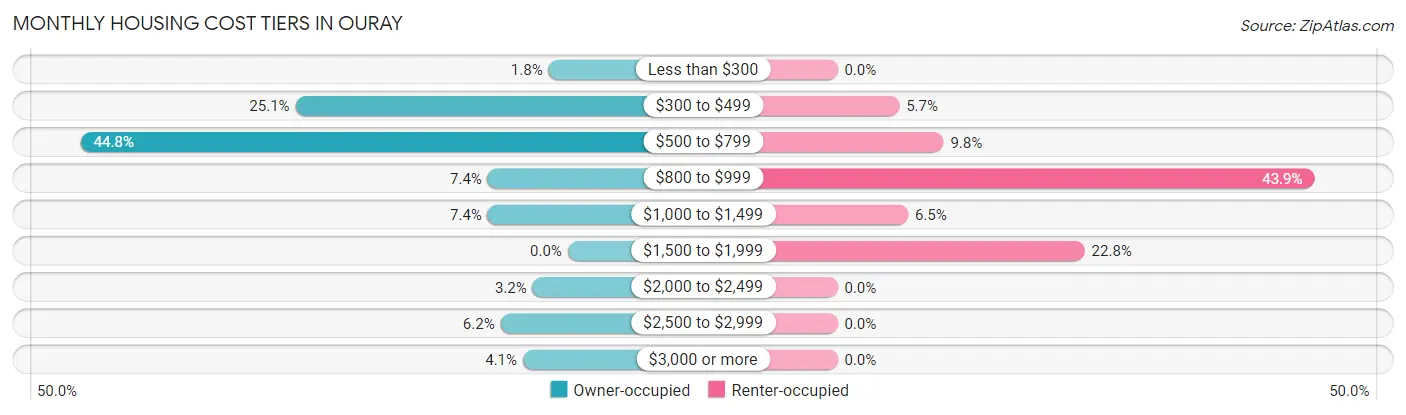
| Monthly Cost | Owner-occupied | Renter-occupied |
| Less than $300 | 6 (1.8%) | 0 (0.0%) |
| $300 to $499 | 85 (25.1%) | 7 (5.7%) |
| $500 to $799 | 152 (44.8%) | 12 (9.8%) |
| $800 to $999 | 25 (7.4%) | 54 (43.9%) |
| $1,000 to $1,499 | 25 (7.4%) | 8 (6.5%) |
| $1,500 to $1,999 | 0 (0.0%) | 28 (22.8%) |
| $2,000 to $2,499 | 11 (3.2%) | 0 (0.0%) |
| $2,500 to $2,999 | 21 (6.2%) | 0 (0.0%) |
| $3,000 or more | 14 (4.1%) | 0 (0.0%) |
| Total | 339 (100.0%) | 123 (100.0%) |
Physical Housing Characteristics in Ouray
Housing Structures in Ouray
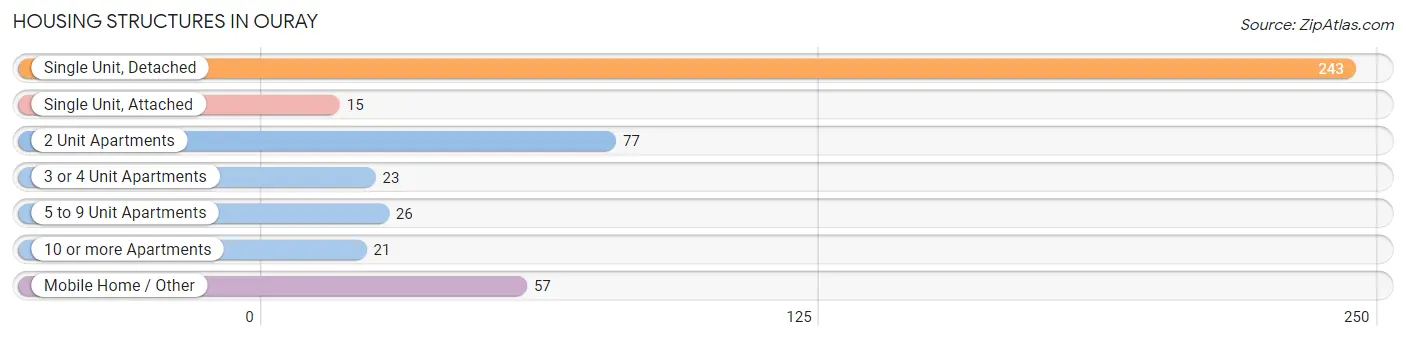
| Structure Type | # Housing Units | % Housing Units |
| Single Unit, Detached | 243 | 52.6% |
| Single Unit, Attached | 15 | 3.3% |
| 2 Unit Apartments | 77 | 16.7% |
| 3 or 4 Unit Apartments | 23 | 5.0% |
| 5 to 9 Unit Apartments | 26 | 5.6% |
| 10 or more Apartments | 21 | 4.5% |
| Mobile Home / Other | 57 | 12.3% |
| Total | 462 | 100.0% |
Housing Structures by Occupancy in Ouray
| Structure Type | Owner-occupied | Renter-occupied |
| Single Unit, Detached | 195 (80.2%) | 48 (19.8%) |
| Single Unit, Attached | 2 (13.3%) | 13 (86.7%) |
| 2 Unit Apartments | 62 (80.5%) | 15 (19.5%) |
| 3 or 4 Unit Apartments | 14 (60.9%) | 9 (39.1%) |
| 5 to 9 Unit Apartments | 0 (0.0%) | 26 (100.0%) |
| 10 or more Apartments | 21 (100.0%) | 0 (0.0%) |
| Mobile Home / Other | 45 (78.9%) | 12 (21.0%) |
| Total | 339 (73.4%) | 123 (26.6%) |
Housing Structures by Number of Rooms in Ouray
| Number of Rooms | Owner-occupied | Renter-occupied |
| 1 Room | 8 (2.4%) | 9 (7.3%) |
| 2 or 3 Rooms | 0 (0.0%) | 2 (1.6%) |
| 4 or 5 Rooms | 101 (29.8%) | 45 (36.6%) |
| 6 or 7 Rooms | 184 (54.3%) | 67 (54.5%) |
| 8 or more Rooms | 46 (13.6%) | 0 (0.0%) |
| Total | 339 (100.0%) | 123 (100.0%) |
Housing Structure by Heating Type in Ouray
| Heating Type | Owner-occupied | Renter-occupied |
| Utility Gas | 212 (62.5%) | 76 (61.8%) |
| Bottled, Tank, or LP Gas | 29 (8.6%) | 33 (26.8%) |
| Electricity | 80 (23.6%) | 9 (7.3%) |
| Fuel Oil or Kerosene | 0 (0.0%) | 0 (0.0%) |
| Coal or Coke | 0 (0.0%) | 0 (0.0%) |
| All other Fuels | 18 (5.3%) | 5 (4.1%) |
| No Fuel Used | 0 (0.0%) | 0 (0.0%) |
| Total | 339 (100.0%) | 123 (100.0%) |
Household Vehicle Usage in Ouray
| Vehicles per Household | Owner-occupied | Renter-occupied |
| No Vehicle | 32 (9.4%) | 0 (0.0%) |
| 1 Vehicle | 95 (28.0%) | 50 (40.6%) |
| 2 Vehicles | 156 (46.0%) | 53 (43.1%) |
| 3 or more Vehicles | 56 (16.5%) | 20 (16.3%) |
| Total | 339 (100.0%) | 123 (100.0%) |
Real Estate & Mortgages in Ouray
Real Estate and Mortgage Overview in Ouray
| Characteristic | Without Mortgage | With Mortgage |
| Housing Units | 268 | 71 |
| Median Property Value | $466,700 | $421,400 |
| Median Household Income | $56,458 | $7 |
| Monthly Housing Costs | $554 | $14 |
| Real Estate Taxes | $1,299 | $0 |
Property Value by Mortgage Status in Ouray
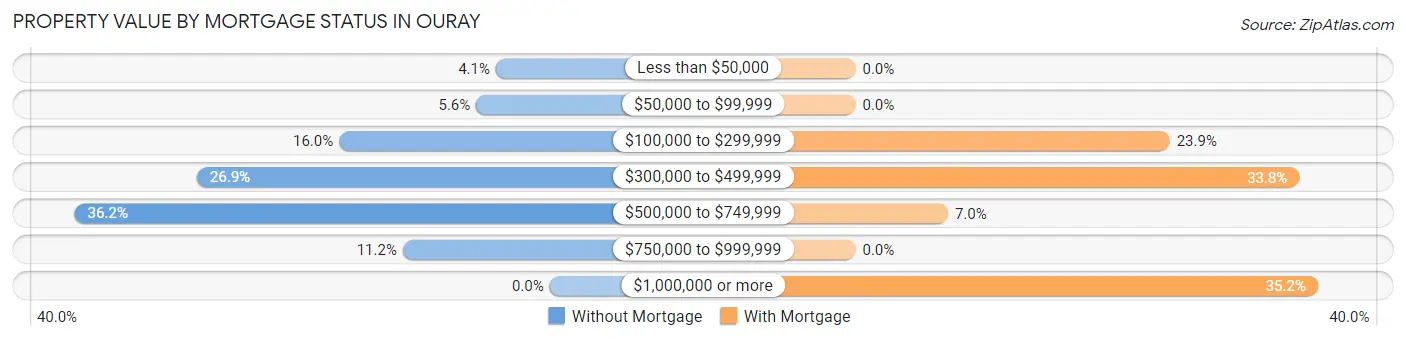
| Property Value | Without Mortgage | With Mortgage |
| Less than $50,000 | 11 (4.1%) | 0 (0.0%) |
| $50,000 to $99,999 | 15 (5.6%) | 0 (0.0%) |
| $100,000 to $299,999 | 43 (16.0%) | 17 (23.9%) |
| $300,000 to $499,999 | 72 (26.9%) | 24 (33.8%) |
| $500,000 to $749,999 | 97 (36.2%) | 5 (7.0%) |
| $750,000 to $999,999 | 30 (11.2%) | 0 (0.0%) |
| $1,000,000 or more | 0 (0.0%) | 25 (35.2%) |
| Total | 268 (100.0%) | 71 (100.0%) |
Household Income by Mortgage Status in Ouray
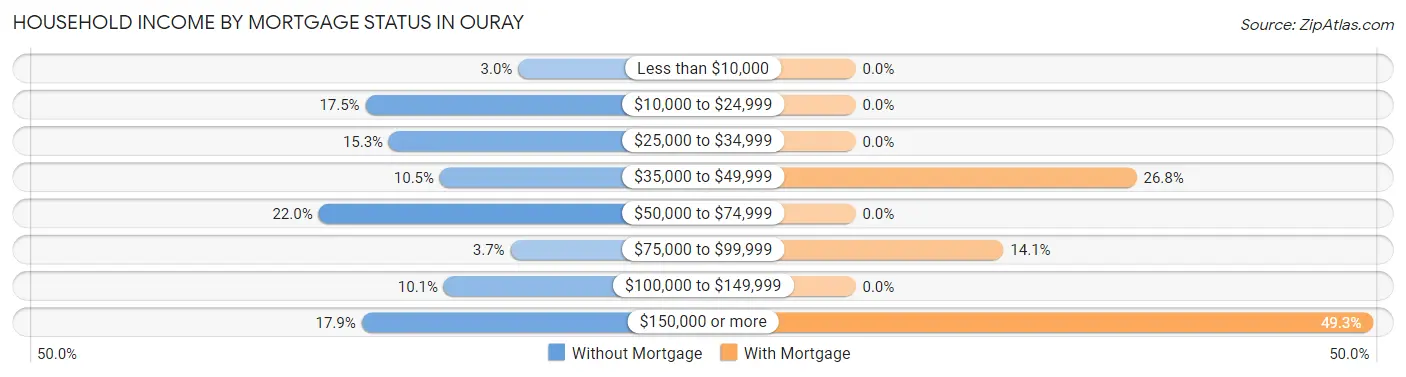
| Household Income | Without Mortgage | With Mortgage |
| Less than $10,000 | 8 (3.0%) | 0 (0.0%) |
| $10,000 to $24,999 | 47 (17.5%) | 0 (0.0%) |
| $25,000 to $34,999 | 41 (15.3%) | 0 (0.0%) |
| $35,000 to $49,999 | 28 (10.4%) | 19 (26.8%) |
| $50,000 to $74,999 | 59 (22.0%) | 0 (0.0%) |
| $75,000 to $99,999 | 10 (3.7%) | 10 (14.1%) |
| $100,000 to $149,999 | 27 (10.1%) | 0 (0.0%) |
| $150,000 or more | 48 (17.9%) | 35 (49.3%) |
| Total | 268 (100.0%) | 71 (100.0%) |
Property Value to Household Income Ratio in Ouray
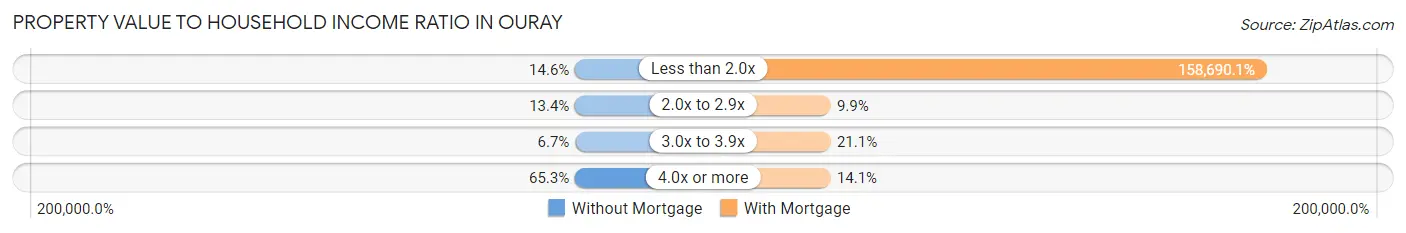
| Value-to-Income Ratio | Without Mortgage | With Mortgage |
| Less than 2.0x | 39 (14.5%) | 112,670 (158,690.1%) |
| 2.0x to 2.9x | 36 (13.4%) | 7 (9.9%) |
| 3.0x to 3.9x | 18 (6.7%) | 15 (21.1%) |
| 4.0x or more | 175 (65.3%) | 10 (14.1%) |
| Total | 268 (100.0%) | 71 (100.0%) |
Real Estate Taxes by Mortgage Status in Ouray
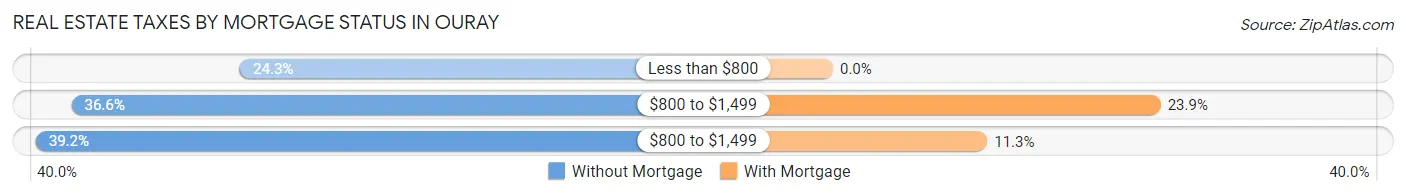
| Property Taxes | Without Mortgage | With Mortgage |
| Less than $800 | 65 (24.2%) | 0 (0.0%) |
| $800 to $1,499 | 98 (36.6%) | 17 (23.9%) |
| $800 to $1,499 | 105 (39.2%) | 8 (11.3%) |
| Total | 268 (100.0%) | 71 (100.0%) |
Health & Disability in Ouray
Health Insurance Coverage by Age in Ouray
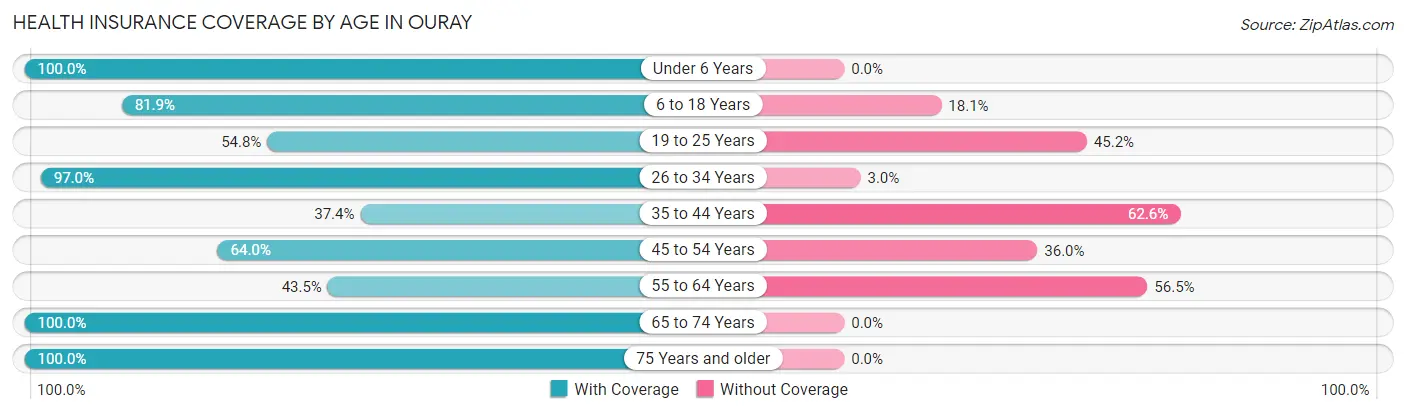
| Age Bracket | With Coverage | Without Coverage |
| Under 6 Years | 9 (100.0%) | 0 (0.0%) |
| 6 to 18 Years | 104 (81.9%) | 23 (18.1%) |
| 19 to 25 Years | 46 (54.8%) | 38 (45.2%) |
| 26 to 34 Years | 96 (97.0%) | 3 (3.0%) |
| 35 to 44 Years | 49 (37.4%) | 82 (62.6%) |
| 45 to 54 Years | 80 (64.0%) | 45 (36.0%) |
| 55 to 64 Years | 50 (43.5%) | 65 (56.5%) |
| 65 to 74 Years | 187 (100.0%) | 0 (0.0%) |
| 75 Years and older | 130 (100.0%) | 0 (0.0%) |
| Total | 751 (74.6%) | 256 (25.4%) |
Health Insurance Coverage by Citizenship Status in Ouray
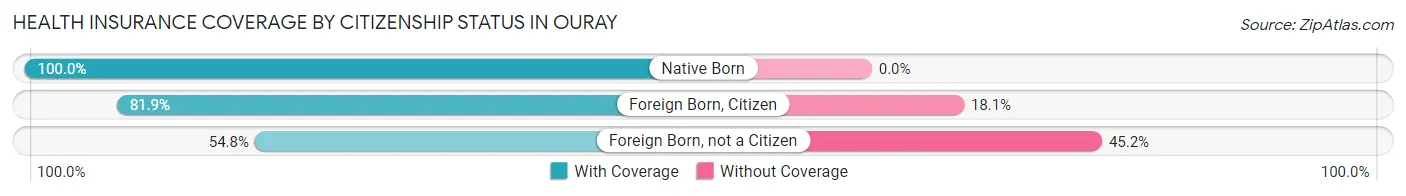
| Citizenship Status | With Coverage | Without Coverage |
| Native Born | 9 (100.0%) | 0 (0.0%) |
| Foreign Born, Citizen | 104 (81.9%) | 23 (18.1%) |
| Foreign Born, not a Citizen | 46 (54.8%) | 38 (45.2%) |
Health Insurance Coverage by Household Income in Ouray
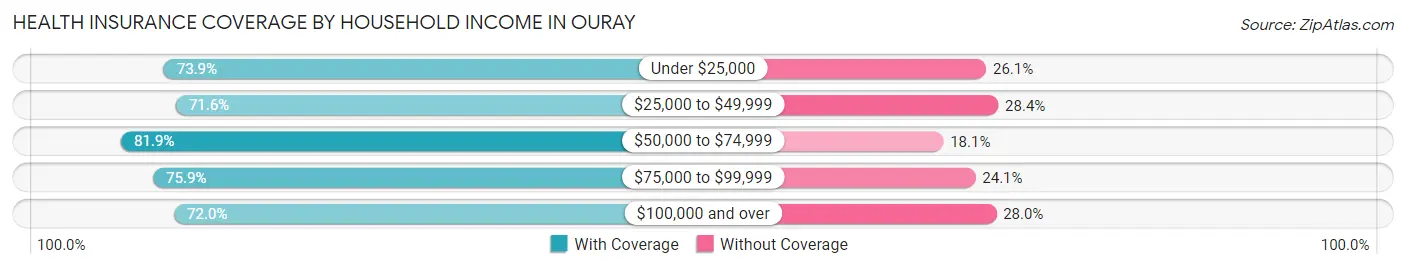
| Household Income | With Coverage | Without Coverage |
| Under $25,000 | 51 (73.9%) | 18 (26.1%) |
| $25,000 to $49,999 | 96 (71.6%) | 38 (28.4%) |
| $50,000 to $74,999 | 136 (81.9%) | 30 (18.1%) |
| $75,000 to $99,999 | 167 (75.9%) | 53 (24.1%) |
| $100,000 and over | 301 (72.0%) | 117 (28.0%) |
Public vs Private Health Insurance Coverage by Age in Ouray
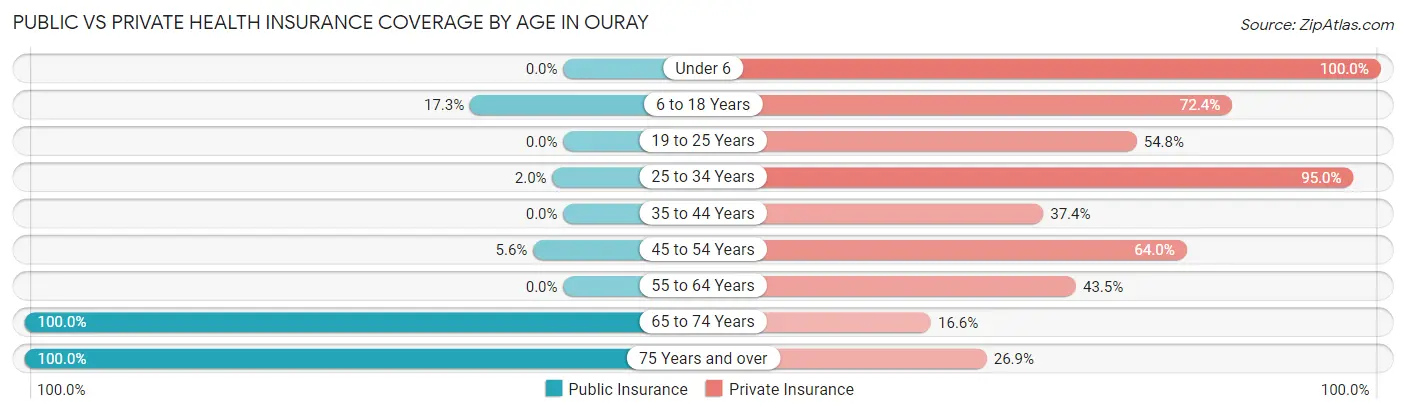
| Age Bracket | Public Insurance | Private Insurance |
| Under 6 | 0 (0.0%) | 9 (100.0%) |
| 6 to 18 Years | 22 (17.3%) | 92 (72.4%) |
| 19 to 25 Years | 0 (0.0%) | 46 (54.8%) |
| 25 to 34 Years | 2 (2.0%) | 94 (95.0%) |
| 35 to 44 Years | 0 (0.0%) | 49 (37.4%) |
| 45 to 54 Years | 7 (5.6%) | 80 (64.0%) |
| 55 to 64 Years | 0 (0.0%) | 50 (43.5%) |
| 65 to 74 Years | 187 (100.0%) | 31 (16.6%) |
| 75 Years and over | 130 (100.0%) | 35 (26.9%) |
| Total | 348 (34.6%) | 486 (48.3%) |
Disability Status by Sex by Age in Ouray
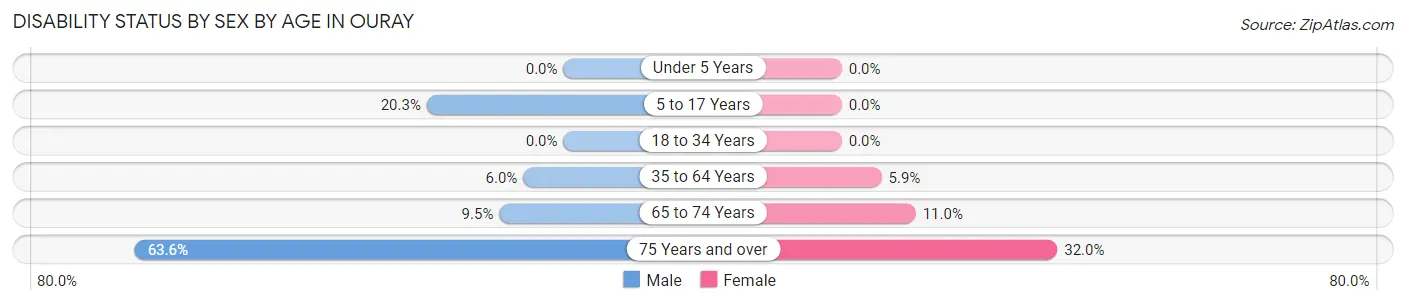
| Age Bracket | Male | Female |
| Under 5 Years | 0 (0.0%) | 0 (0.0%) |
| 5 to 17 Years | 14 (20.3%) | 0 (0.0%) |
| 18 to 34 Years | 0 (0.0%) | 0 (0.0%) |
| 35 to 64 Years | 9 (6.0%) | 13 (5.9%) |
| 65 to 74 Years | 10 (9.5%) | 9 (11.0%) |
| 75 Years and over | 35 (63.6%) | 24 (32.0%) |
Disability Class by Sex by Age in Ouray
Disability Class: Hearing Difficulty
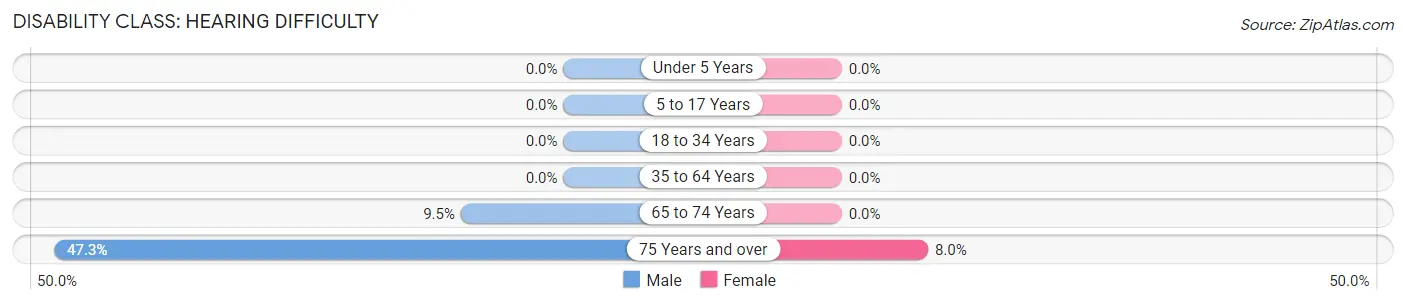
| Age Bracket | Male | Female |
| Under 5 Years | 0 (0.0%) | 0 (0.0%) |
| 5 to 17 Years | 0 (0.0%) | 0 (0.0%) |
| 18 to 34 Years | 0 (0.0%) | 0 (0.0%) |
| 35 to 64 Years | 0 (0.0%) | 0 (0.0%) |
| 65 to 74 Years | 10 (9.5%) | 0 (0.0%) |
| 75 Years and over | 26 (47.3%) | 6 (8.0%) |
Disability Class: Vision Difficulty
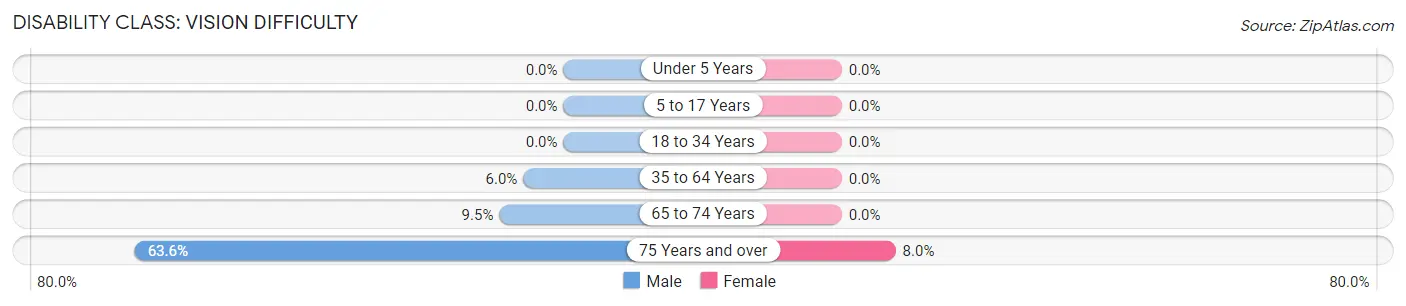
| Age Bracket | Male | Female |
| Under 5 Years | 0 (0.0%) | 0 (0.0%) |
| 5 to 17 Years | 0 (0.0%) | 0 (0.0%) |
| 18 to 34 Years | 0 (0.0%) | 0 (0.0%) |
| 35 to 64 Years | 9 (6.0%) | 0 (0.0%) |
| 65 to 74 Years | 10 (9.5%) | 0 (0.0%) |
| 75 Years and over | 35 (63.6%) | 6 (8.0%) |
Disability Class: Cognitive Difficulty
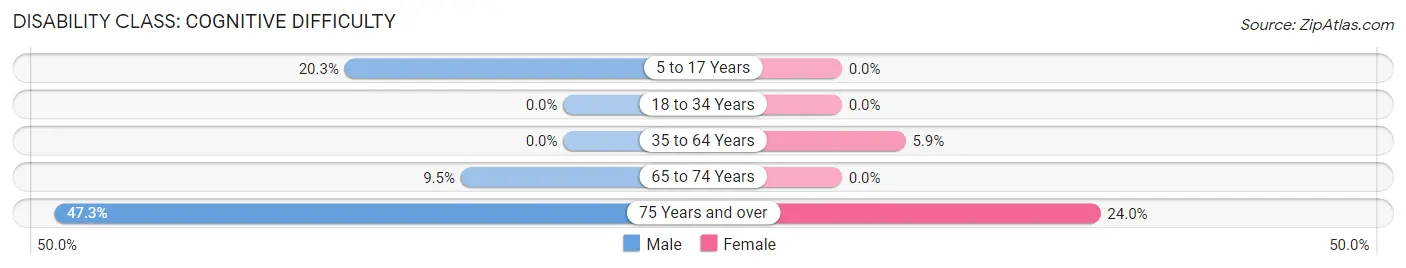
| Age Bracket | Male | Female |
| 5 to 17 Years | 14 (20.3%) | 0 (0.0%) |
| 18 to 34 Years | 0 (0.0%) | 0 (0.0%) |
| 35 to 64 Years | 0 (0.0%) | 13 (5.9%) |
| 65 to 74 Years | 10 (9.5%) | 0 (0.0%) |
| 75 Years and over | 26 (47.3%) | 18 (24.0%) |
Disability Class: Ambulatory Difficulty
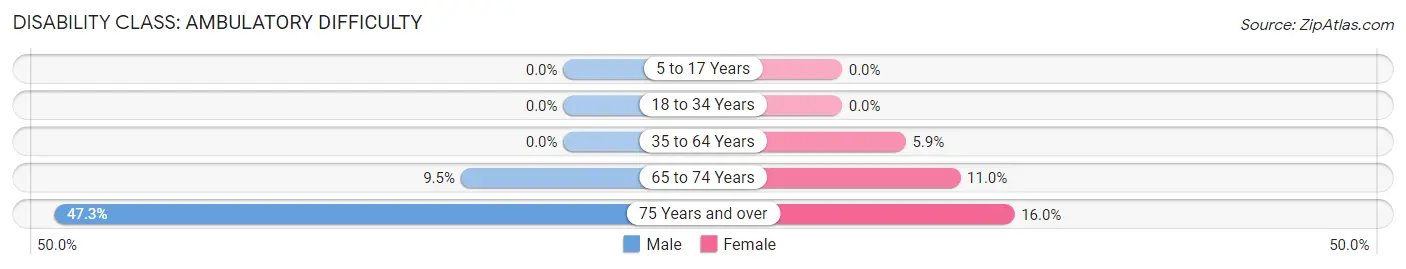
| Age Bracket | Male | Female |
| 5 to 17 Years | 0 (0.0%) | 0 (0.0%) |
| 18 to 34 Years | 0 (0.0%) | 0 (0.0%) |
| 35 to 64 Years | 0 (0.0%) | 13 (5.9%) |
| 65 to 74 Years | 10 (9.5%) | 9 (11.0%) |
| 75 Years and over | 26 (47.3%) | 12 (16.0%) |
Disability Class: Self-Care Difficulty
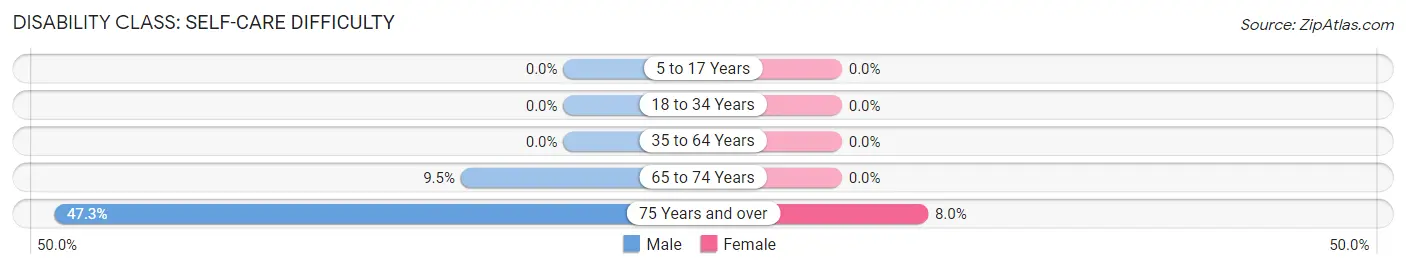
| Age Bracket | Male | Female |
| 5 to 17 Years | 0 (0.0%) | 0 (0.0%) |
| 18 to 34 Years | 0 (0.0%) | 0 (0.0%) |
| 35 to 64 Years | 0 (0.0%) | 0 (0.0%) |
| 65 to 74 Years | 10 (9.5%) | 0 (0.0%) |
| 75 Years and over | 26 (47.3%) | 6 (8.0%) |
Technology Access in Ouray
Computing Device Access in Ouray
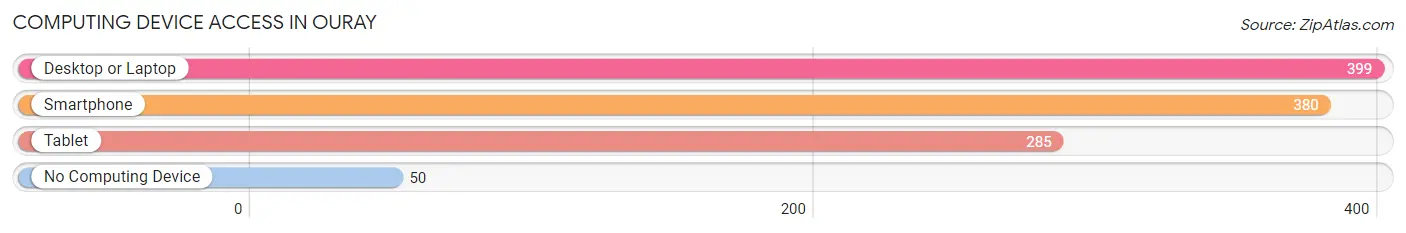
| Device Type | # Households | % Households |
| Desktop or Laptop | 399 | 86.4% |
| Smartphone | 380 | 82.3% |
| Tablet | 285 | 61.7% |
| No Computing Device | 50 | 10.8% |
| Total | 462 | 100.0% |
Internet Access in Ouray
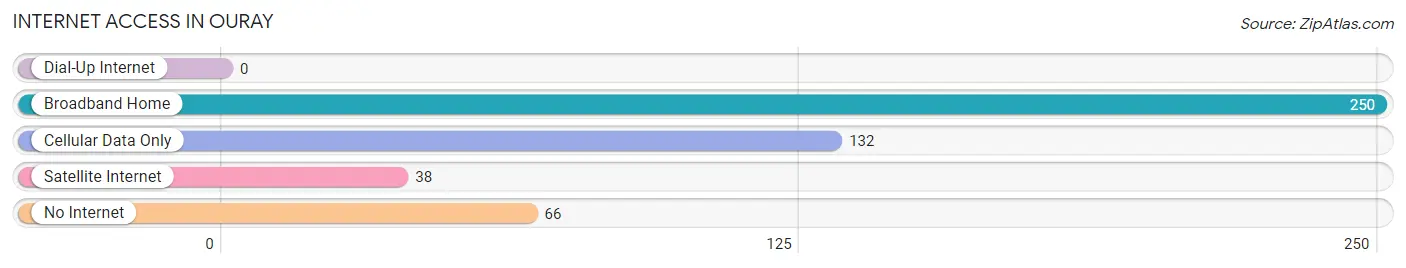
| Internet Type | # Households | % Households |
| Dial-Up Internet | 0 | 0.0% |
| Broadband Home | 250 | 54.1% |
| Cellular Data Only | 132 | 28.6% |
| Satellite Internet | 38 | 8.2% |
| No Internet | 66 | 14.3% |
| Total | 462 | 100.0% |
Ouray Summary
Ouray, Colorado is a small mountain town located in the San Juan Mountains of southwestern Colorado. It is situated in the Uncompahgre Valley, at an elevation of 7,792 feet. The town is named after Chief Ouray of the Ute Indian tribe, who lived in the area in the late 19th century. Ouray is known as the “Switzerland of America” due to its picturesque mountain scenery and its location in a narrow mountain valley.
History
The area around Ouray has been inhabited by Native Americans for thousands of years. The Ute Indians were the first to settle in the area, and they lived in the Uncompahgre Valley for centuries. In the late 19th century, Chief Ouray of the Ute tribe negotiated a treaty with the United States government that allowed the Ute people to remain in the area.
In 1876, prospectors discovered gold and silver in the San Juan Mountains, and the area around Ouray quickly became a mining boomtown. The town was officially founded in 1877, and it was named after Chief Ouray. The town quickly grew, and by 1880 it had a population of over 1,000 people.
The mining industry in Ouray declined in the early 20th century, and the town’s population decreased. In the 1950s, the town began to attract tourists due to its scenic beauty and its proximity to the ski resorts in the San Juan Mountains. Today, Ouray is a popular tourist destination, and it is known for its hot springs, hiking trails, and mountain scenery.
Geography
Ouray is located in the San Juan Mountains of southwestern Colorado. It is situated in the Uncompahgre Valley, at an elevation of 7,792 feet. The town is surrounded by mountains, and it is located near the headwaters of the Uncompahgre River. The town is located about 25 miles south of Montrose, and it is about 100 miles southwest of Denver.
The climate in Ouray is semi-arid, with hot summers and cold winters. The average high temperature in July is 78 degrees Fahrenheit, and the average low temperature in January is 11 degrees Fahrenheit. The town receives an average of 18 inches of precipitation per year.
Economy
The economy of Ouray is largely based on tourism. The town is a popular destination for outdoor recreation, and it is known for its hot springs, hiking trails, and mountain scenery. The town is also home to several ski resorts, including Telluride Ski Resort and Silverton Mountain.
The town is also home to several businesses, including restaurants, hotels, and retail stores. The town is also home to several mining companies, which are involved in the extraction of gold, silver, and other minerals from the surrounding mountains.
Demographics
As of the 2010 census, the population of Ouray was 1,000 people. The racial makeup of the town was 95.2% White, 0.7% Native American, 0.3% Asian, 0.2% African American, and 3.6% from other races. The median household income in Ouray was $41,250, and the median age was 44.7 years.
Common Questions
What is Per Capita Income in Ouray?
Per Capita income in Ouray is $40,699.
What is the Median Family Income in Ouray?
Median Family Income in Ouray is $82,232.
What is the Median Household income in Ouray?
Median Household Income in Ouray is $68,750.
What is Income or Wage Gap in Ouray?
Income or Wage Gap in Ouray is 33.0%.
Women in Ouray earn 67.0 cents for every dollar earned by a man.
What is Inequality or Gini Index in Ouray?
Inequality or Gini Index in Ouray is 0.42.
What is the Total Population of Ouray?
Total Population of Ouray is 1,007.
What is the Total Male Population of Ouray?
Total Male Population of Ouray is 469.
What is the Total Female Population of Ouray?
Total Female Population of Ouray is 538.
What is the Ratio of Males per 100 Females in Ouray?
There are 87.17 Males per 100 Females in Ouray.
What is the Ratio of Females per 100 Males in Ouray?
There are 114.71 Females per 100 Males in Ouray.
What is the Median Population Age in Ouray?
Median Population Age in Ouray is 50.3 Years.
What is the Average Family Size in Ouray
Average Family Size in Ouray is 2.7 People.
What is the Average Household Size in Ouray
Average Household Size in Ouray is 2.2 People.
How Large is the Labor Force in Ouray?
There are 550 People in the Labor Forcein in Ouray.
What is the Percentage of People in the Labor Force in Ouray?
59.7% of People are in the Labor Force in Ouray.
What is the Unemployment Rate in Ouray?
Unemployment Rate in Ouray is 4.5%.