Orchard Mesa, CO Map & Demographics
Orchard Mesa Map
Orchard Mesa Overview
$28,305
PER CAPITA INCOME
$72,624
AVG FAMILY INCOME
$64,688
AVG HOUSEHOLD INCOME
39.7%
WAGE / INCOME GAP [ % ]
60.3¢/ $1
WAGE / INCOME GAP [ $ ]
0.37
INEQUALITY / GINI INDEX
7,173
TOTAL POPULATION
3,474
MALE POPULATION
3,699
FEMALE POPULATION
93.92
MALES / 100 FEMALES
106.48
FEMALES / 100 MALES
42.0
MEDIAN AGE
3.0
AVG FAMILY SIZE
2.6
AVG HOUSEHOLD SIZE
3,267
LABOR FORCE [ PEOPLE ]
56.9%
PERCENT IN LABOR FORCE
7.9%
UNEMPLOYMENT RATE
Income in Orchard Mesa
Income Overview in Orchard Mesa
Per Capita Income in Orchard Mesa is $28,305, while median incomes of families and households are $72,624 and $64,688 respectively.
| Characteristic | Number | Measure |
| Per Capita Income | 7,173 | $28,305 |
| Median Family Income | 2,132 | $72,624 |
| Mean Family Income | 2,132 | $81,424 |
| Median Household Income | 2,685 | $64,688 |
| Mean Household Income | 2,685 | $74,462 |
| Income Deficit | 2,132 | $0 |
| Wage / Income Gap (%) | 7,173 | 39.66% |
| Wage / Income Gap ($) | 7,173 | 60.34¢ per $1 |
| Gini / Inequality Index | 7,173 | 0.37 |
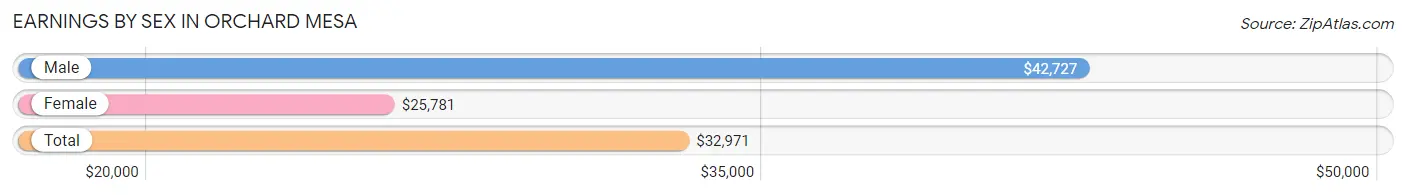
Earnings by Sex in Orchard Mesa
Average Earnings in Orchard Mesa are $32,971, $42,727 for men and $25,781 for women, a difference of 39.7%.
| Sex | Number | Average Earnings |
| Male | 1,674 (48.1%) | $42,727 |
| Female | 1,807 (51.9%) | $25,781 |
| Total | 3,481 (100.0%) | $32,971 |
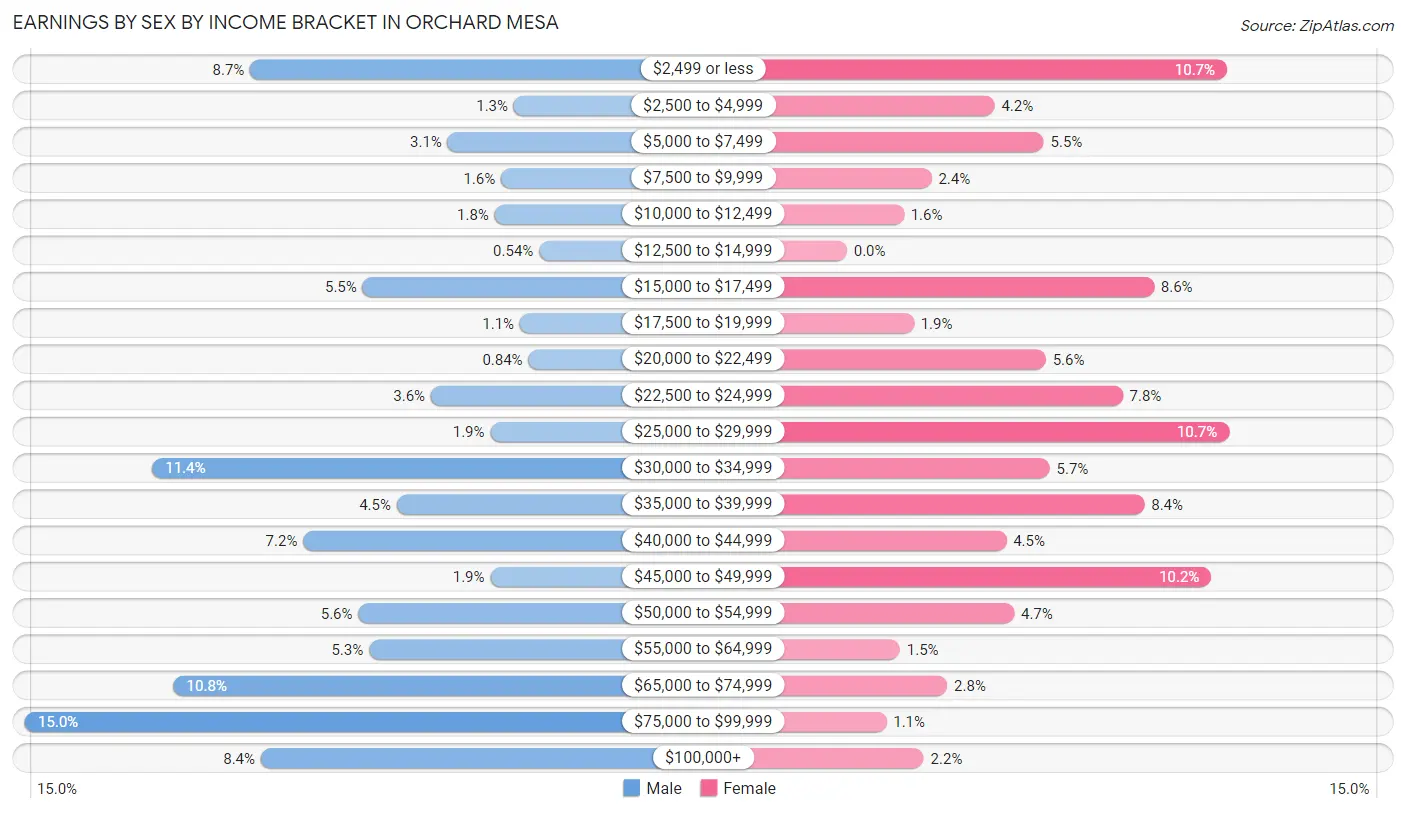
Earnings by Sex by Income Bracket in Orchard Mesa
The most common earnings brackets in Orchard Mesa are $75,000 to $99,999 for men (251 | 15.0%) and $25,000 to $29,999 for women (194 | 10.7%).
| Income | Male | Female |
| $2,499 or less | 145 (8.7%) | 193 (10.7%) |
| $2,500 to $4,999 | 21 (1.3%) | 75 (4.2%) |
| $5,000 to $7,499 | 52 (3.1%) | 100 (5.5%) |
| $7,500 to $9,999 | 27 (1.6%) | 43 (2.4%) |
| $10,000 to $12,499 | 30 (1.8%) | 29 (1.6%) |
| $12,500 to $14,999 | 9 (0.5%) | 0 (0.0%) |
| $15,000 to $17,499 | 92 (5.5%) | 156 (8.6%) |
| $17,500 to $19,999 | 18 (1.1%) | 34 (1.9%) |
| $20,000 to $22,499 | 14 (0.8%) | 101 (5.6%) |
| $22,500 to $24,999 | 60 (3.6%) | 140 (7.7%) |
| $25,000 to $29,999 | 32 (1.9%) | 194 (10.7%) |
| $30,000 to $34,999 | 191 (11.4%) | 103 (5.7%) |
| $35,000 to $39,999 | 76 (4.5%) | 151 (8.4%) |
| $40,000 to $44,999 | 120 (7.2%) | 81 (4.5%) |
| $45,000 to $49,999 | 32 (1.9%) | 185 (10.2%) |
| $50,000 to $54,999 | 94 (5.6%) | 85 (4.7%) |
| $55,000 to $64,999 | 89 (5.3%) | 27 (1.5%) |
| $65,000 to $74,999 | 181 (10.8%) | 51 (2.8%) |
| $75,000 to $99,999 | 251 (15.0%) | 20 (1.1%) |
| $100,000+ | 140 (8.4%) | 39 (2.2%) |
| Total | 1,674 (100.0%) | 1,807 (100.0%) |
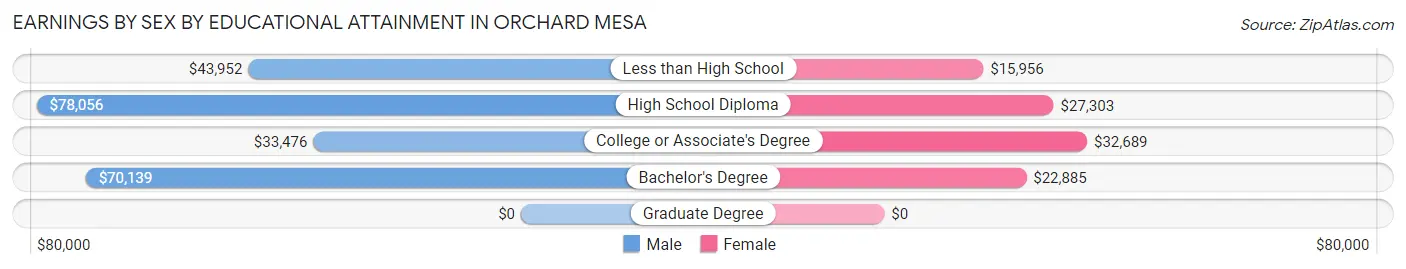
Earnings by Sex by Educational Attainment in Orchard Mesa
Average earnings in Orchard Mesa are $46,797 for men and $28,014 for women, a difference of 40.1%. Men with an educational attainment of high school diploma enjoy the highest average annual earnings of $78,056, while those with college or associate's degree education earn the least with $33,476. Women with an educational attainment of college or associate's degree earn the most with the average annual earnings of $32,689, while those with less than high school education have the smallest earnings of $15,956.
| Educational Attainment | Male Income | Female Income |
| Less than High School | $43,952 | $15,956 |
| High School Diploma | $78,056 | $27,303 |
| College or Associate's Degree | $33,476 | $32,689 |
| Bachelor's Degree | $70,139 | $22,885 |
| Graduate Degree | - | - |
| Total | $46,797 | $28,014 |
Family Income in Orchard Mesa
Family Income Brackets in Orchard Mesa
According to the Orchard Mesa family income data, there are 597 families falling into the $50,000 to $74,999 income range, which is the most common income bracket and makes up 28.0% of all families. Conversely, the $150,000 to $199,999 income bracket is the least frequent group with only 30 families (1.4%) belonging to this category.
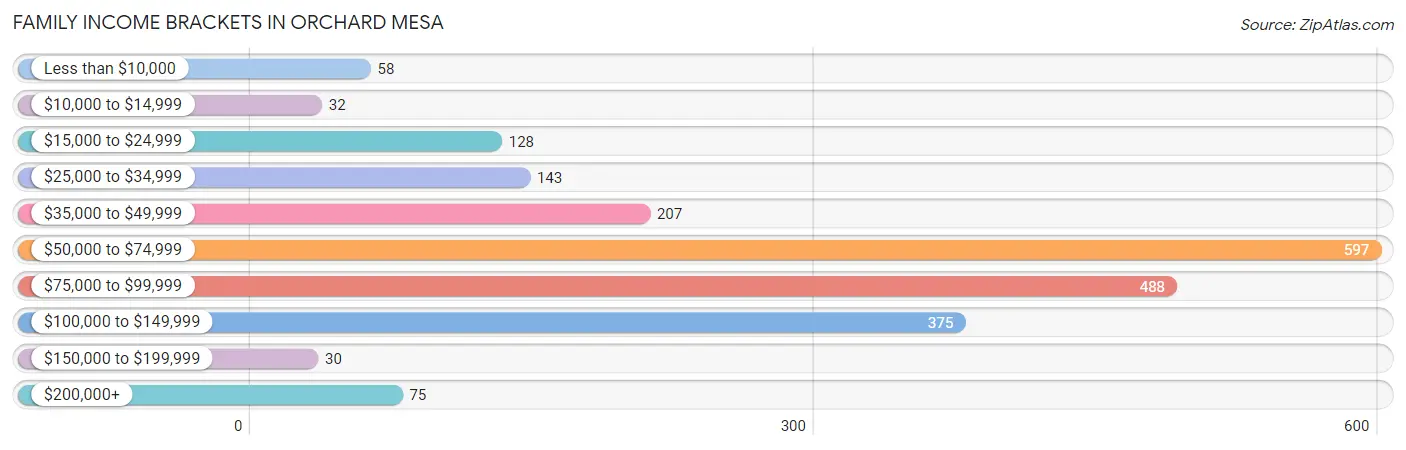
| Income Bracket | # Families | % Families |
| Less than $10,000 | 58 | 2.7% |
| $10,000 to $14,999 | 32 | 1.5% |
| $15,000 to $24,999 | 128 | 6.0% |
| $25,000 to $34,999 | 143 | 6.7% |
| $35,000 to $49,999 | 207 | 9.7% |
| $50,000 to $74,999 | 597 | 28.0% |
| $75,000 to $99,999 | 488 | 22.9% |
| $100,000 to $149,999 | 375 | 17.6% |
| $150,000 to $199,999 | 30 | 1.4% |
| $200,000+ | 75 | 3.5% |
Family Income by Famaliy Size in Orchard Mesa
5-person families (93 | 4.4%) account for the highest median family income in Orchard Mesa with $88,264 per family, while 2-person families (1,159 | 54.4%) have the highest median income of $37,382 per family member.
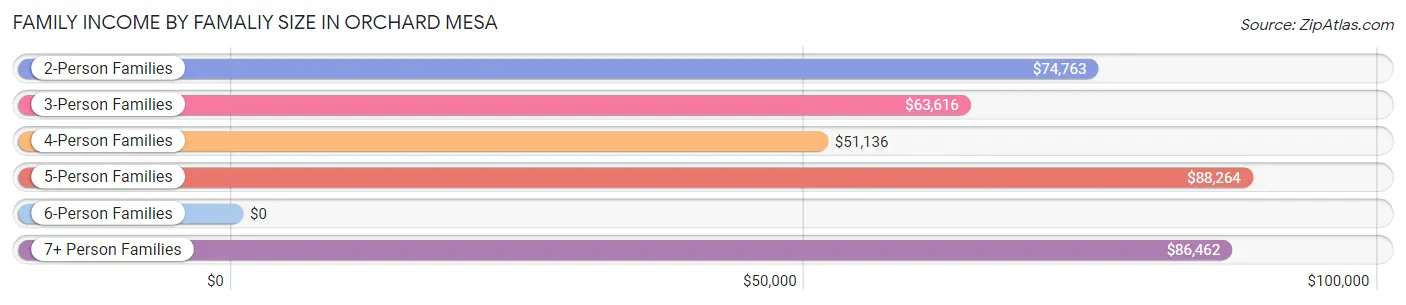
| Income Bracket | # Families | Median Income |
| 2-Person Families | 1,159 (54.4%) | $74,763 |
| 3-Person Families | 453 (21.2%) | $63,616 |
| 4-Person Families | 258 (12.1%) | $51,136 |
| 5-Person Families | 93 (4.4%) | $88,264 |
| 6-Person Families | 71 (3.3%) | $0 |
| 7+ Person Families | 98 (4.6%) | $86,462 |
| Total | 2,132 (100.0%) | $72,624 |
Family Income by Number of Earners in Orchard Mesa
The median family income in Orchard Mesa is $72,624, with families comprising 3+ earners (199) having the highest median family income of $86,250, while families with 1 earner (769) have the lowest median family income of $55,477, accounting for 9.3% and 36.1% of families, respectively.
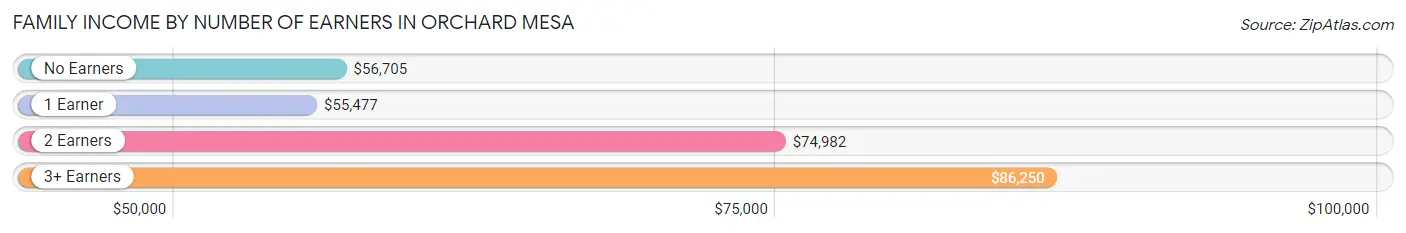
| Number of Earners | # Families | Median Income |
| No Earners | 393 (18.4%) | $56,705 |
| 1 Earner | 769 (36.1%) | $55,477 |
| 2 Earners | 771 (36.2%) | $74,982 |
| 3+ Earners | 199 (9.3%) | $86,250 |
| Total | 2,132 (100.0%) | $72,624 |
Household Income in Orchard Mesa
Household Income Brackets in Orchard Mesa
With 674 households falling in the category, the $50,000 to $74,999 income range is the most frequent in Orchard Mesa, accounting for 25.1% of all households. In contrast, only 51 households (1.9%) fall into the $150,000 to $199,999 income bracket, making it the least populous group.
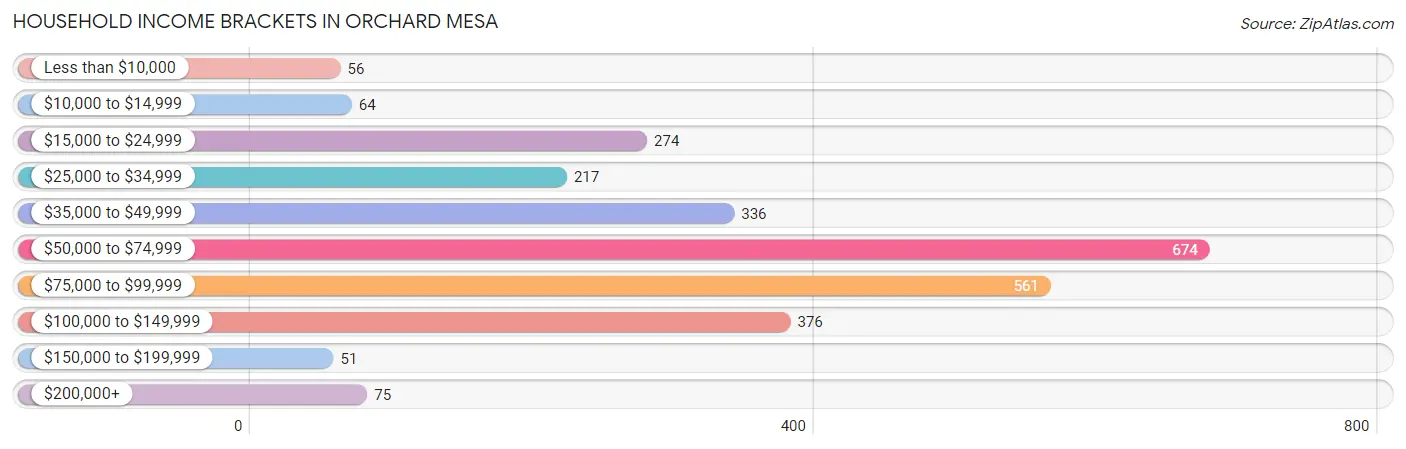
| Income Bracket | # Households | % Households |
| Less than $10,000 | 56 | 2.1% |
| $10,000 to $14,999 | 64 | 2.4% |
| $15,000 to $24,999 | 274 | 10.2% |
| $25,000 to $34,999 | 217 | 8.1% |
| $35,000 to $49,999 | 336 | 12.5% |
| $50,000 to $74,999 | 674 | 25.1% |
| $75,000 to $99,999 | 561 | 20.9% |
| $100,000 to $149,999 | 376 | 14.0% |
| $150,000 to $199,999 | 51 | 1.9% |
| $200,000+ | 75 | 2.8% |
Household Income by Householder Age in Orchard Mesa
The median household income in Orchard Mesa is $64,688, with the highest median household income of $74,777 found in the 45 to 64 years age bracket for the primary householder. A total of 1,062 households (39.6%) fall into this category. Meanwhile, the 15 to 24 years age bracket for the primary householder has the lowest median household income of $0, with 66 households (2.5%) in this group.
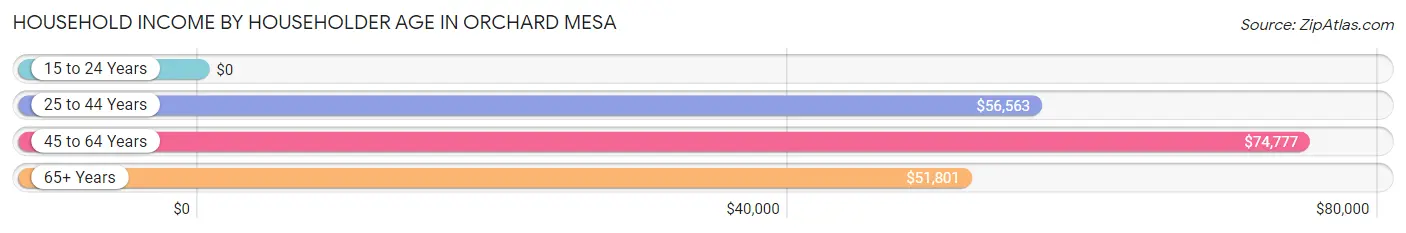
| Income Bracket | # Households | Median Income |
| 15 to 24 Years | 66 (2.5%) | $0 |
| 25 to 44 Years | 798 (29.7%) | $56,563 |
| 45 to 64 Years | 1,062 (39.6%) | $74,777 |
| 65+ Years | 759 (28.3%) | $51,801 |
| Total | 2,685 (100.0%) | $64,688 |
Poverty in Orchard Mesa
Income Below Poverty by Sex and Age in Orchard Mesa
With 9.4% poverty level for males and 7.4% for females among the residents of Orchard Mesa, under 5 year old males and 6 to 11 year old females are the most vulnerable to poverty, with 62 males (31.2%) and 62 females (29.5%) in their respective age groups living below the poverty level.
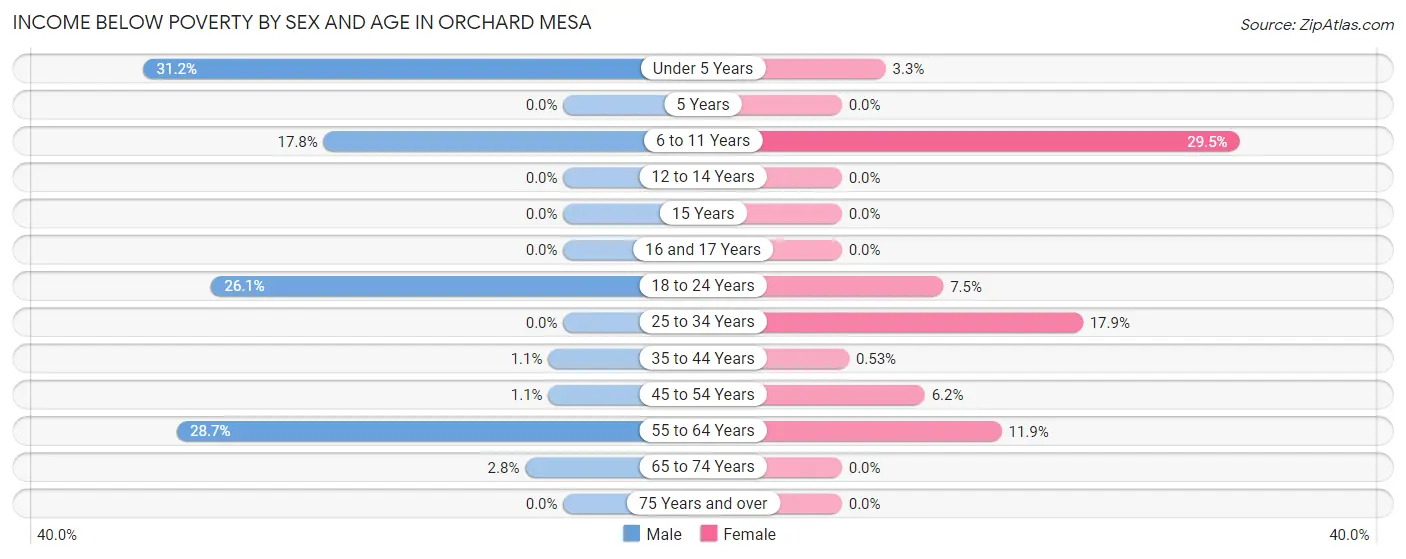
| Age Bracket | Male | Female |
| Under 5 Years | 62 (31.2%) | 10 (3.3%) |
| 5 Years | 0 (0.0%) | 0 (0.0%) |
| 6 to 11 Years | 60 (17.8%) | 62 (29.5%) |
| 12 to 14 Years | 0 (0.0%) | 0 (0.0%) |
| 15 Years | 0 (0.0%) | 0 (0.0%) |
| 16 and 17 Years | 0 (0.0%) | 0 (0.0%) |
| 18 to 24 Years | 52 (26.1%) | 11 (7.5%) |
| 25 to 34 Years | 0 (0.0%) | 88 (17.9%) |
| 35 to 44 Years | 5 (1.1%) | 3 (0.5%) |
| 45 to 54 Years | 4 (1.1%) | 26 (6.2%) |
| 55 to 64 Years | 127 (28.7%) | 74 (11.9%) |
| 65 to 74 Years | 15 (2.8%) | 0 (0.0%) |
| 75 Years and over | 0 (0.0%) | 0 (0.0%) |
| Total | 325 (9.4%) | 274 (7.4%) |
Income Above Poverty by Sex and Age in Orchard Mesa
According to the poverty statistics in Orchard Mesa, males aged 12 to 14 years and females aged 5 years are the age groups that are most secure financially, with 100.0% of males and 100.0% of females in these age groups living above the poverty line.
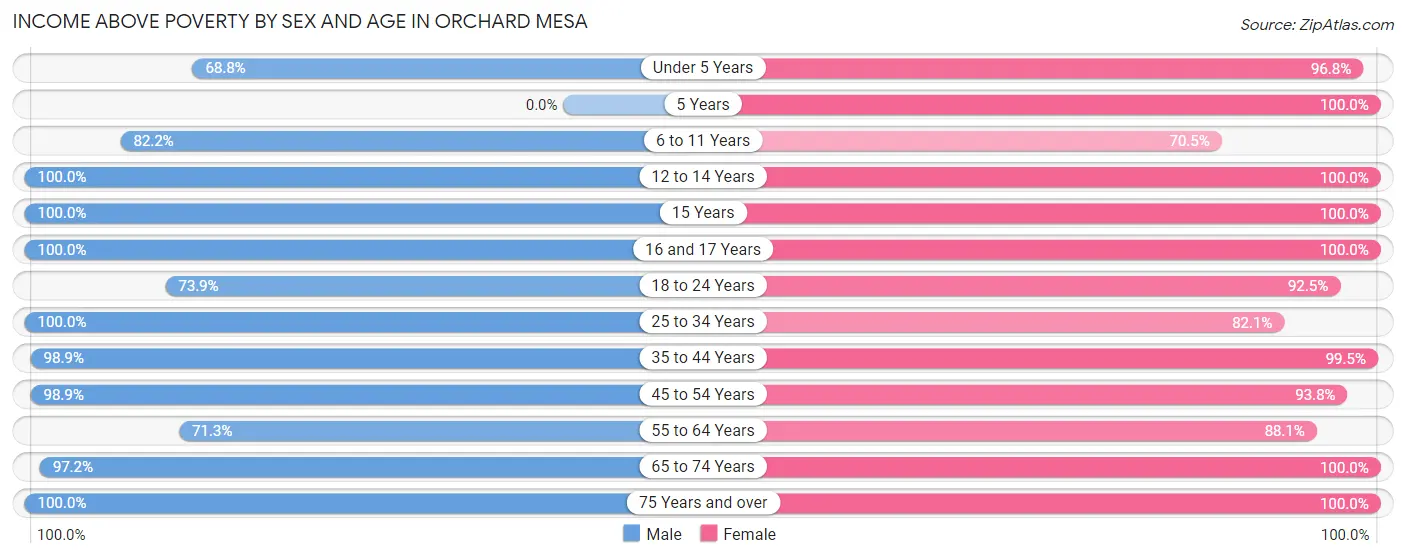
| Age Bracket | Male | Female |
| Under 5 Years | 137 (68.8%) | 298 (96.8%) |
| 5 Years | 0 (0.0%) | 20 (100.0%) |
| 6 to 11 Years | 277 (82.2%) | 148 (70.5%) |
| 12 to 14 Years | 151 (100.0%) | 156 (100.0%) |
| 15 Years | 40 (100.0%) | 11 (100.0%) |
| 16 and 17 Years | 160 (100.0%) | 95 (100.0%) |
| 18 to 24 Years | 147 (73.9%) | 135 (92.5%) |
| 25 to 34 Years | 319 (100.0%) | 404 (82.1%) |
| 35 to 44 Years | 442 (98.9%) | 558 (99.5%) |
| 45 to 54 Years | 356 (98.9%) | 396 (93.8%) |
| 55 to 64 Years | 316 (71.3%) | 550 (88.1%) |
| 65 to 74 Years | 515 (97.2%) | 458 (100.0%) |
| 75 Years and over | 289 (100.0%) | 196 (100.0%) |
| Total | 3,149 (90.6%) | 3,425 (92.6%) |
Income Below Poverty Among Married-Couple Families in Orchard Mesa
The poverty statistics for married-couple families in Orchard Mesa show that 5.3% or 89 of the total 1,664 families live below the poverty line. Families with no children have the highest poverty rate of 7.1%, comprising of 78 families. On the other hand, families with 3 or 4 children have the lowest poverty rate of 0.0%, which includes 0 families.
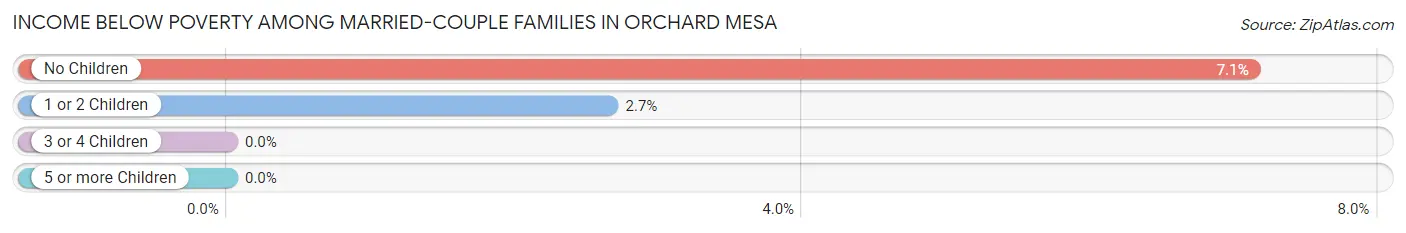
| Children | Above Poverty | Below Poverty |
| No Children | 1,017 (92.9%) | 78 (7.1%) |
| 1 or 2 Children | 404 (97.4%) | 11 (2.6%) |
| 3 or 4 Children | 141 (100.0%) | 0 (0.0%) |
| 5 or more Children | 13 (100.0%) | 0 (0.0%) |
| Total | 1,575 (94.7%) | 89 (5.3%) |
Income Below Poverty Among Single-Parent Households in Orchard Mesa
According to the poverty data in Orchard Mesa, 22.2% or 26 single-father households and 24.2% or 85 single-mother households are living below the poverty line. Among single-father households, those with no children have the highest poverty rate, with 26 households (30.2%) experiencing poverty. Likewise, among single-mother households, those with 3 or 4 children have the highest poverty rate, with 85 households (100.0%) falling below the poverty line.
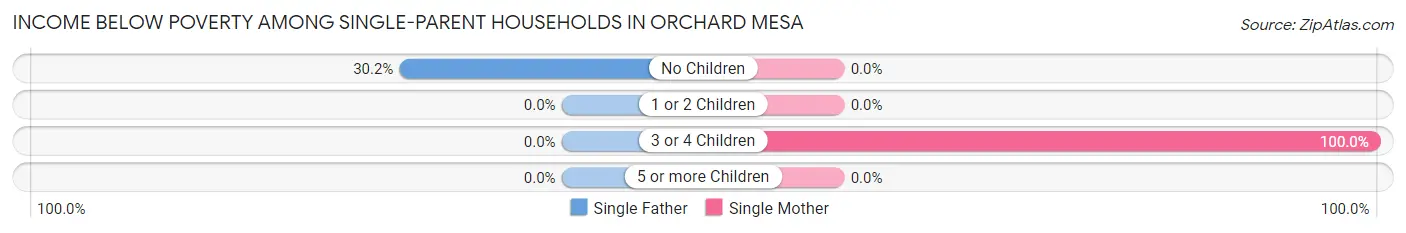
| Children | Single Father | Single Mother |
| No Children | 26 (30.2%) | 0 (0.0%) |
| 1 or 2 Children | 0 (0.0%) | 0 (0.0%) |
| 3 or 4 Children | 0 (0.0%) | 85 (100.0%) |
| 5 or more Children | 0 (0.0%) | 0 (0.0%) |
| Total | 26 (22.2%) | 85 (24.2%) |
Income Below Poverty Among Married-Couple vs Single-Parent Households in Orchard Mesa
The poverty data for Orchard Mesa shows that 89 of the married-couple family households (5.3%) and 111 of the single-parent households (23.7%) are living below the poverty level. Within the married-couple family households, those with no children have the highest poverty rate, with 78 households (7.1%) falling below the poverty line. Among the single-parent households, those with 3 or 4 children have the highest poverty rate, with 85 household (100.0%) living below poverty.
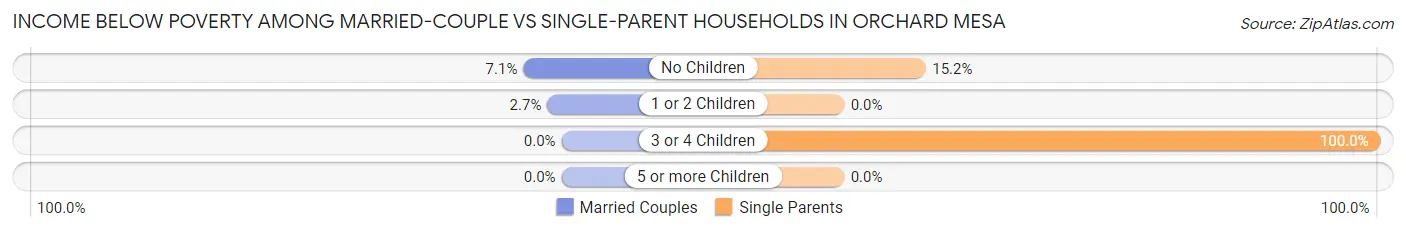
| Children | Married-Couple Families | Single-Parent Households |
| No Children | 78 (7.1%) | 26 (15.2%) |
| 1 or 2 Children | 11 (2.6%) | 0 (0.0%) |
| 3 or 4 Children | 0 (0.0%) | 85 (100.0%) |
| 5 or more Children | 0 (0.0%) | 0 (0.0%) |
| Total | 89 (5.3%) | 111 (23.7%) |
Race in Orchard Mesa
The most populous races in Orchard Mesa are White / Caucasian (6,531 | 91.0%), Hispanic or Latino (534 | 7.4%), and Two or more Races (402 | 5.6%).
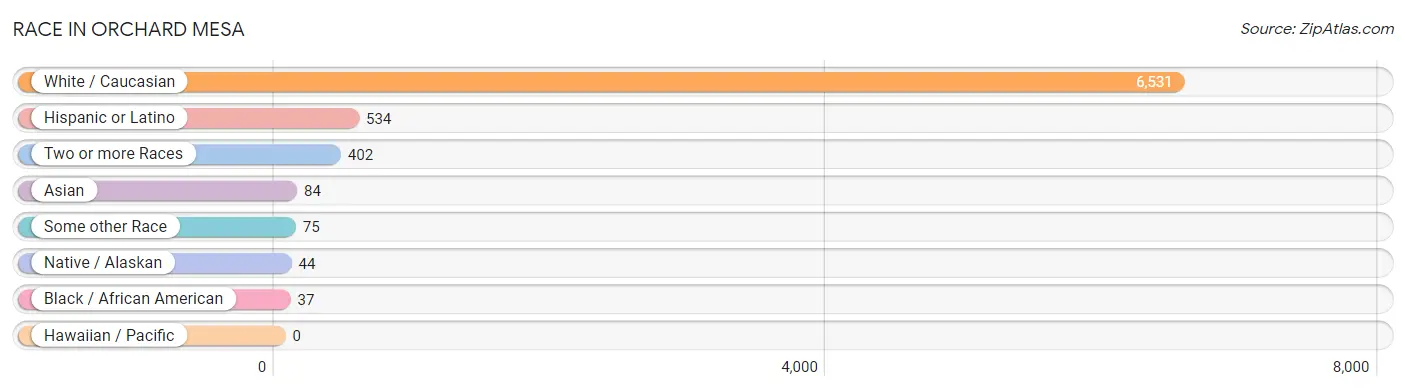
| Race | # Population | % Population |
| Asian | 84 | 1.2% |
| Black / African American | 37 | 0.5% |
| Hawaiian / Pacific | 0 | 0.0% |
| Hispanic or Latino | 534 | 7.4% |
| Native / Alaskan | 44 | 0.6% |
| White / Caucasian | 6,531 | 91.0% |
| Two or more Races | 402 | 5.6% |
| Some other Race | 75 | 1.1% |
| Total | 7,173 | 100.0% |
Ancestry in Orchard Mesa
The most populous ancestries reported in Orchard Mesa are German (1,757 | 24.5%), Irish (1,003 | 14.0%), English (955 | 13.3%), Italian (583 | 8.1%), and American (397 | 5.5%), together accounting for 65.4% of all Orchard Mesa residents.
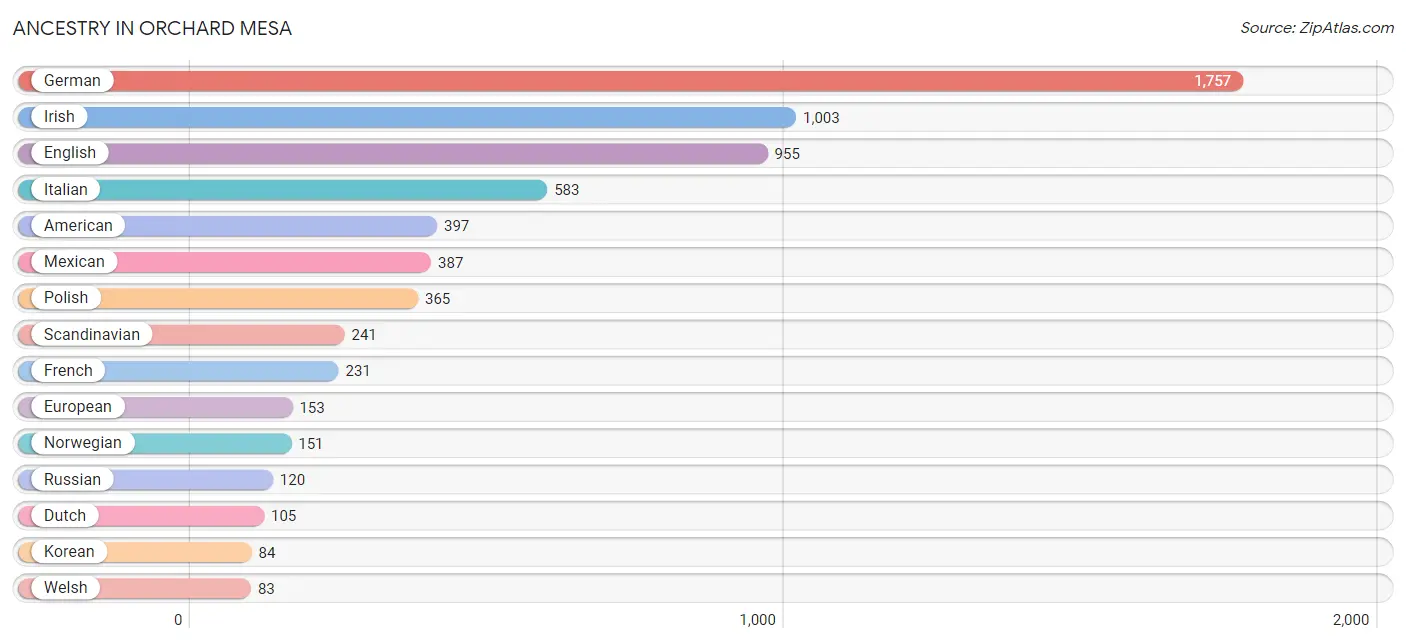
| Ancestry | # Population | % Population |
| American | 397 | 5.5% |
| Arab | 2 | 0.0% |
| Austrian | 13 | 0.2% |
| Belgian | 10 | 0.1% |
| Bulgarian | 22 | 0.3% |
| Canadian | 17 | 0.2% |
| Central American | 15 | 0.2% |
| Cherokee | 28 | 0.4% |
| Creek | 44 | 0.6% |
| Czech | 22 | 0.3% |
| Czechoslovakian | 20 | 0.3% |
| Danish | 55 | 0.8% |
| Dutch | 105 | 1.5% |
| Dutch West Indian | 13 | 0.2% |
| Eastern European | 23 | 0.3% |
| English | 955 | 13.3% |
| European | 153 | 2.1% |
| Finnish | 9 | 0.1% |
| French | 231 | 3.2% |
| French Canadian | 11 | 0.2% |
| German | 1,757 | 24.5% |
| Irish | 1,003 | 14.0% |
| Italian | 583 | 8.1% |
| Korean | 84 | 1.2% |
| Mexican | 387 | 5.4% |
| Navajo | 17 | 0.2% |
| Northern European | 28 | 0.4% |
| Norwegian | 151 | 2.1% |
| Polish | 365 | 5.1% |
| Pueblo | 17 | 0.2% |
| Russian | 120 | 1.7% |
| Salvadoran | 15 | 0.2% |
| Scandinavian | 241 | 3.4% |
| Scotch-Irish | 34 | 0.5% |
| Scottish | 62 | 0.9% |
| Sioux | 6 | 0.1% |
| Slovene | 81 | 1.1% |
| Spaniard | 6 | 0.1% |
| Spanish | 41 | 0.6% |
| Swedish | 39 | 0.5% |
| Swiss | 10 | 0.1% |
| Ute | 23 | 0.3% |
| Welsh | 83 | 1.2% | View All 43 Rows |
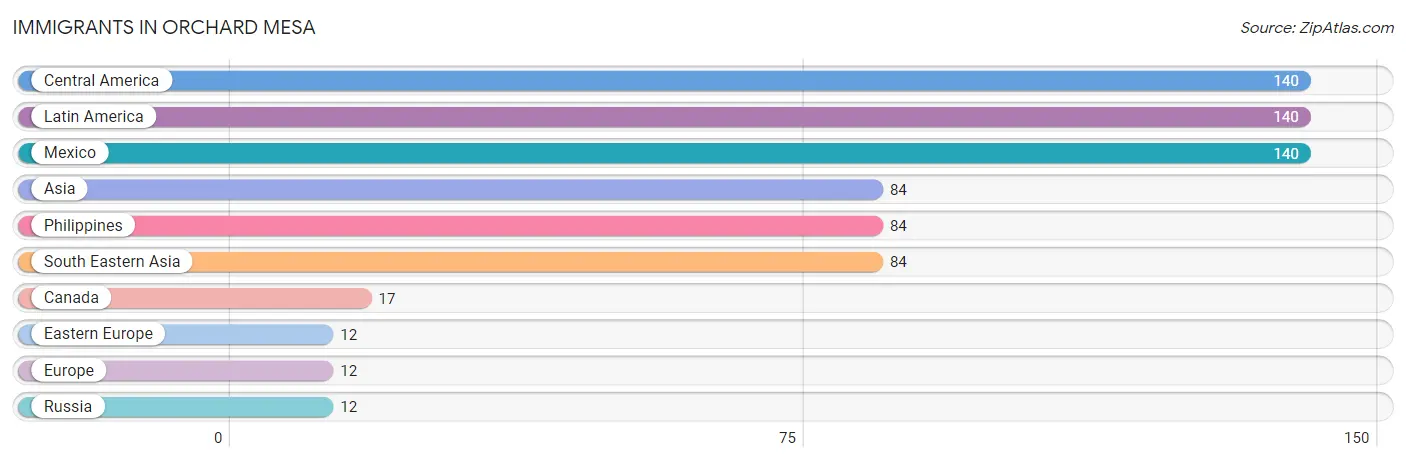
Immigrants in Orchard Mesa
The most numerous immigrant groups reported in Orchard Mesa came from Central America (140 | 1.9%), Latin America (140 | 1.9%), Mexico (140 | 1.9%), Asia (84 | 1.2%), and Philippines (84 | 1.2%), together accounting for 8.2% of all Orchard Mesa residents.
| Immigration Origin | # Population | % Population |
| Asia | 84 | 1.2% |
| Canada | 17 | 0.2% |
| Central America | 140 | 1.9% |
| Eastern Europe | 12 | 0.2% |
| Europe | 12 | 0.2% |
| Latin America | 140 | 1.9% |
| Mexico | 140 | 1.9% |
| Philippines | 84 | 1.2% |
| Russia | 12 | 0.2% |
| South Eastern Asia | 84 | 1.2% | View All 10 Rows |
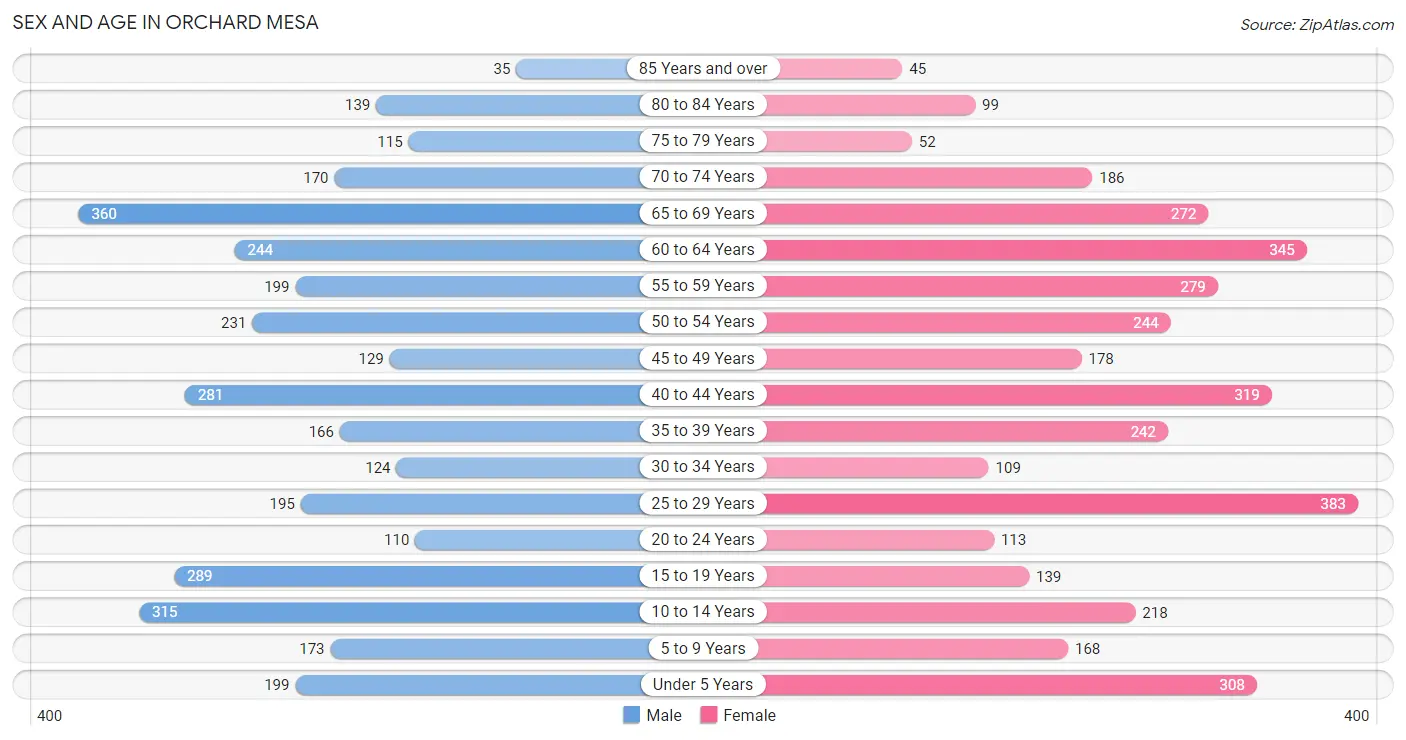
Sex and Age in Orchard Mesa
Sex and Age in Orchard Mesa
The most populous age groups in Orchard Mesa are 65 to 69 Years (360 | 10.4%) for men and 25 to 29 Years (383 | 10.3%) for women.
| Age Bracket | Male | Female |
| Under 5 Years | 199 (5.7%) | 308 (8.3%) |
| 5 to 9 Years | 173 (5.0%) | 168 (4.5%) |
| 10 to 14 Years | 315 (9.1%) | 218 (5.9%) |
| 15 to 19 Years | 289 (8.3%) | 139 (3.8%) |
| 20 to 24 Years | 110 (3.2%) | 113 (3.0%) |
| 25 to 29 Years | 195 (5.6%) | 383 (10.3%) |
| 30 to 34 Years | 124 (3.6%) | 109 (2.9%) |
| 35 to 39 Years | 166 (4.8%) | 242 (6.5%) |
| 40 to 44 Years | 281 (8.1%) | 319 (8.6%) |
| 45 to 49 Years | 129 (3.7%) | 178 (4.8%) |
| 50 to 54 Years | 231 (6.7%) | 244 (6.6%) |
| 55 to 59 Years | 199 (5.7%) | 279 (7.5%) |
| 60 to 64 Years | 244 (7.0%) | 345 (9.3%) |
| 65 to 69 Years | 360 (10.4%) | 272 (7.3%) |
| 70 to 74 Years | 170 (4.9%) | 186 (5.0%) |
| 75 to 79 Years | 115 (3.3%) | 52 (1.4%) |
| 80 to 84 Years | 139 (4.0%) | 99 (2.7%) |
| 85 Years and over | 35 (1.0%) | 45 (1.2%) |
| Total | 3,474 (100.0%) | 3,699 (100.0%) |
Families and Households in Orchard Mesa
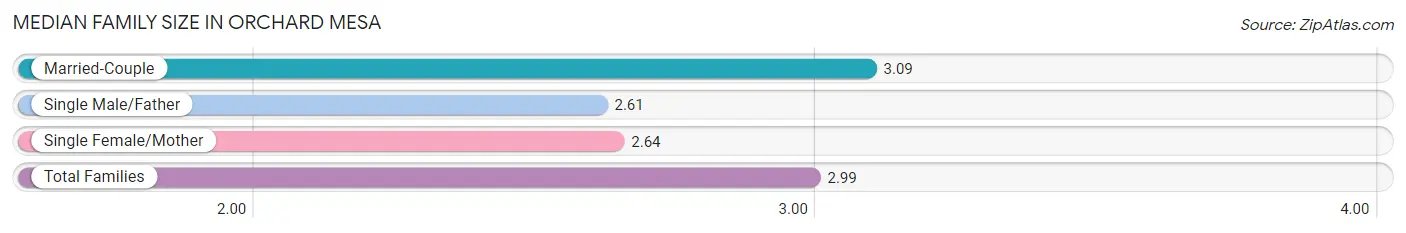
Median Family Size in Orchard Mesa
The median family size in Orchard Mesa is 2.99 persons per family, with married-couple families (1,664 | 78.0%) accounting for the largest median family size of 3.09 persons per family. On the other hand, single male/father families (117 | 5.5%) represent the smallest median family size with 2.61 persons per family.
| Family Type | # Families | Family Size |
| Married-Couple | 1,664 (78.0%) | 3.09 |
| Single Male/Father | 117 (5.5%) | 2.61 |
| Single Female/Mother | 351 (16.5%) | 2.64 |
| Total Families | 2,132 (100.0%) | 2.99 |
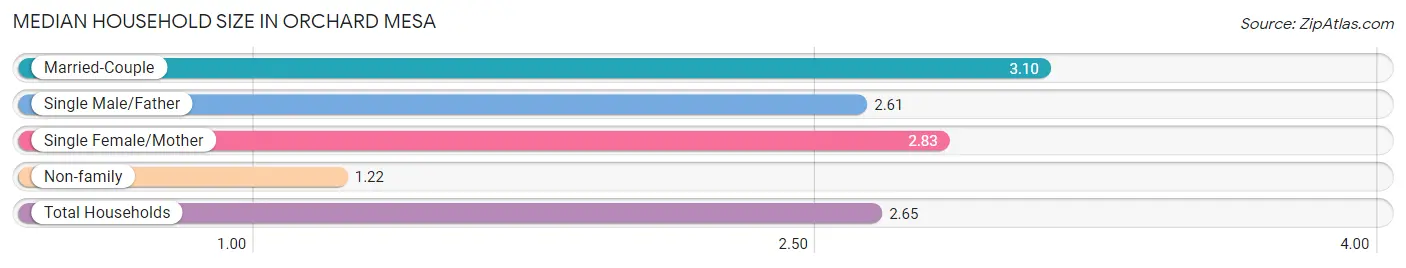
Median Household Size in Orchard Mesa
The median household size in Orchard Mesa is 2.65 persons per household, with married-couple households (1,664 | 62.0%) accounting for the largest median household size of 3.1 persons per household. non-family households (553 | 20.6%) represent the smallest median household size with 1.22 persons per household.
| Household Type | # Households | Household Size |
| Married-Couple | 1,664 (62.0%) | 3.10 |
| Single Male/Father | 117 (4.4%) | 2.61 |
| Single Female/Mother | 351 (13.1%) | 2.83 |
| Non-family | 553 (20.6%) | 1.22 |
| Total Households | 2,685 (100.0%) | 2.65 |
Household Size by Marriage Status in Orchard Mesa
Out of a total of 2,685 households in Orchard Mesa, 2,132 (79.4%) are family households, while 553 (20.6%) are nonfamily households. The most numerous type of family households are 2-person households, comprising 1,093, and the most common type of nonfamily households are 1-person households, comprising 445.
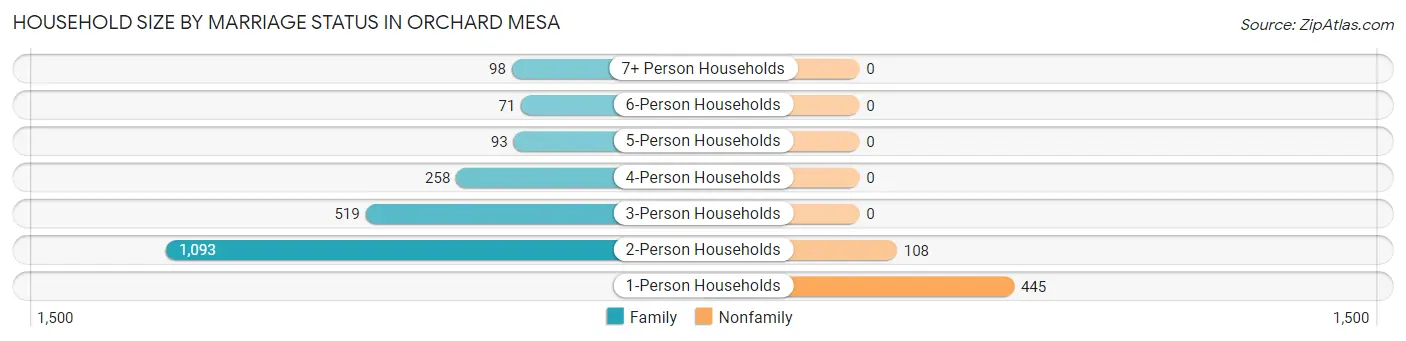
| Household Size | Family Households | Nonfamily Households |
| 1-Person Households | - | 445 (16.6%) |
| 2-Person Households | 1,093 (40.7%) | 108 (4.0%) |
| 3-Person Households | 519 (19.3%) | 0 (0.0%) |
| 4-Person Households | 258 (9.6%) | 0 (0.0%) |
| 5-Person Households | 93 (3.5%) | 0 (0.0%) |
| 6-Person Households | 71 (2.6%) | 0 (0.0%) |
| 7+ Person Households | 98 (3.6%) | 0 (0.0%) |
| Total | 2,132 (79.4%) | 553 (20.6%) |
Female Fertility in Orchard Mesa
Fertility by Age in Orchard Mesa
Average fertility rate in Orchard Mesa is 165.0 births per 1,000 women. Women in the age bracket of 20 to 34 years have the highest fertility rate with 349.0 births per 1,000 women. Women in the age bracket of 20 to 34 years acount for 80.5% of all women with births.
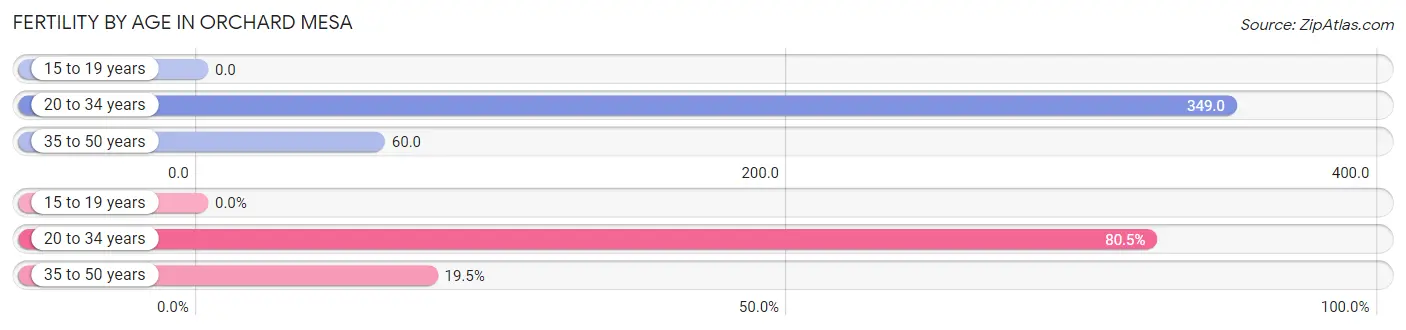
| Age Bracket | Women with Births | Births / 1,000 Women |
| 15 to 19 years | 0 (0.0%) | 0.0 |
| 20 to 34 years | 211 (80.5%) | 349.0 |
| 35 to 50 years | 51 (19.5%) | 60.0 |
| Total | 262 (100.0%) | 165.0 |
Fertility by Age by Marriage Status in Orchard Mesa
67.6% of women with births (262) in Orchard Mesa are married. The highest percentage of unmarried women with births falls into 20 to 34 years age bracket with 40.3% of them unmarried at the time of birth, while the lowest percentage of unmarried women with births belong to 35 to 50 years age bracket with 0.0% of them unmarried.
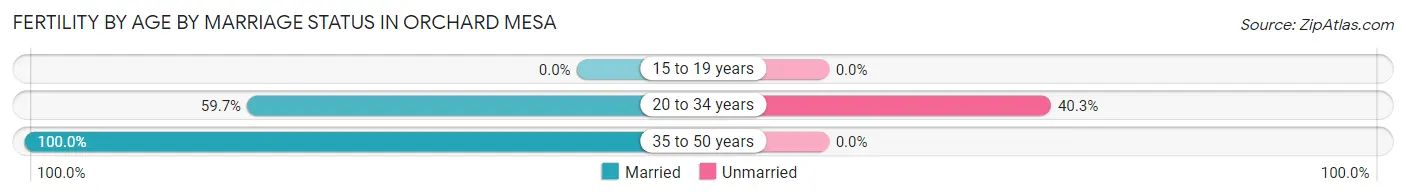
| Age Bracket | Married | Unmarried |
| 15 to 19 years | 0 (0.0%) | 0 (0.0%) |
| 20 to 34 years | 126 (59.7%) | 85 (40.3%) |
| 35 to 50 years | 51 (100.0%) | 0 (0.0%) |
| Total | 177 (67.6%) | 85 (32.4%) |
Fertility by Education in Orchard Mesa
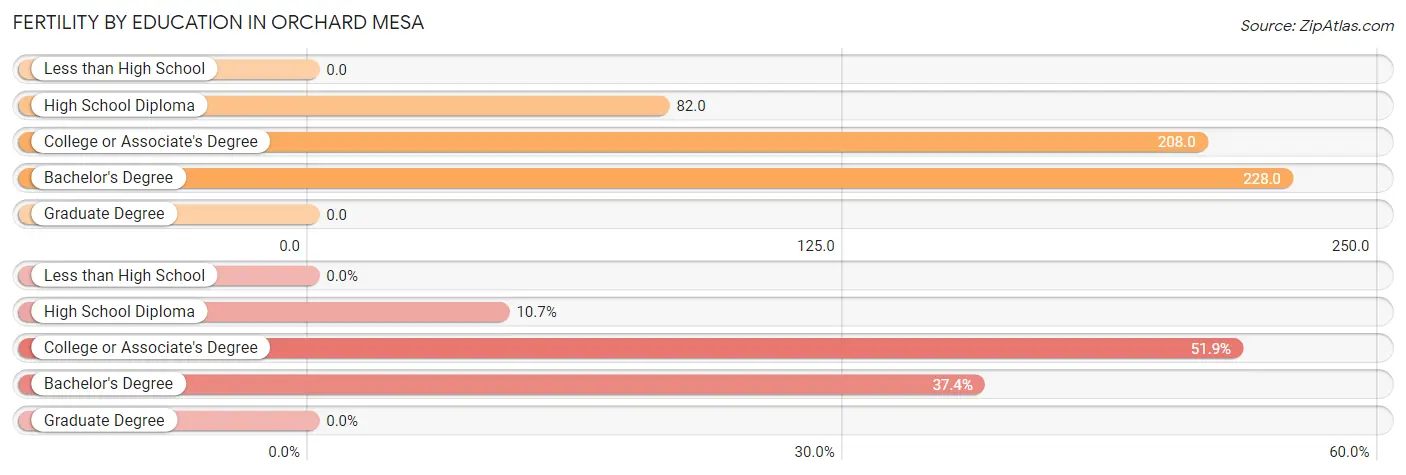
| Educational Attainment | Women with Births | Births / 1,000 Women |
| Less than High School | 0 (0.0%) | 0.0 |
| High School Diploma | 28 (10.7%) | 82.0 |
| College or Associate's Degree | 136 (51.9%) | 208.0 |
| Bachelor's Degree | 98 (37.4%) | 228.0 |
| Graduate Degree | 0 (0.0%) | 0.0 |
| Total | 262 (100.0%) | 165.0 |
Fertility by Education by Marriage Status in Orchard Mesa
32.4% of women with births in Orchard Mesa are unmarried. Women with the educational attainment of high school diploma are most likely to be married with 100.0% of them married at childbirth, while women with the educational attainment of college or associate's degree are least likely to be married with 62.5% of them unmarried at childbirth.
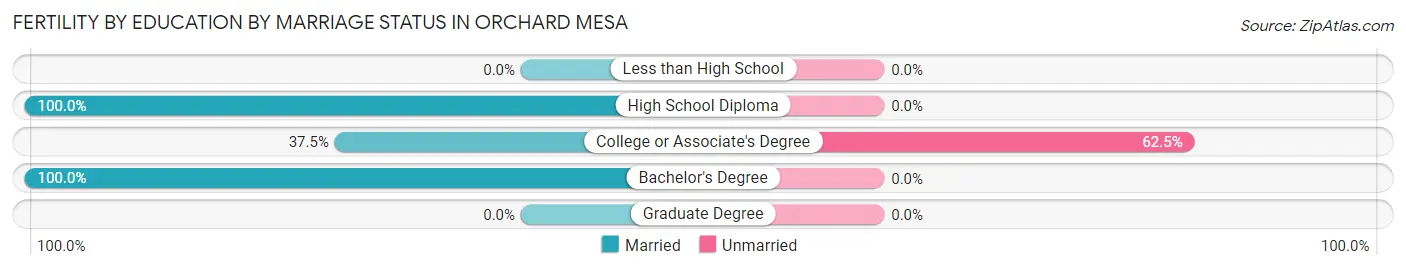
| Educational Attainment | Married | Unmarried |
| Less than High School | 0 (0.0%) | 0 (0.0%) |
| High School Diploma | 28 (100.0%) | 0 (0.0%) |
| College or Associate's Degree | 51 (37.5%) | 85 (62.5%) |
| Bachelor's Degree | 98 (100.0%) | 0 (0.0%) |
| Graduate Degree | 0 (0.0%) | 0 (0.0%) |
| Total | 177 (67.6%) | 85 (32.4%) |
Employment Characteristics in Orchard Mesa
Employment by Class of Employer in Orchard Mesa
Among the 2,905 employed individuals in Orchard Mesa, private company employees (1,800 | 62.0%), not-for-profit organizations (325 | 11.2%), and self-employed (incorporated) (278 | 9.6%) make up the most common classes of employment.
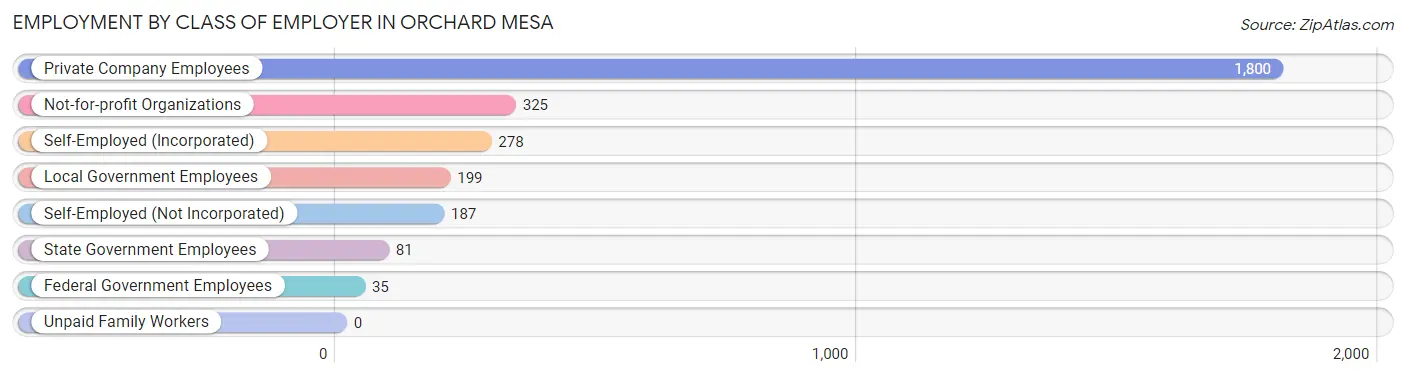
| Employer Class | # Employees | % Employees |
| Private Company Employees | 1,800 | 62.0% |
| Self-Employed (Incorporated) | 278 | 9.6% |
| Self-Employed (Not Incorporated) | 187 | 6.4% |
| Not-for-profit Organizations | 325 | 11.2% |
| Local Government Employees | 199 | 6.9% |
| State Government Employees | 81 | 2.8% |
| Federal Government Employees | 35 | 1.2% |
| Unpaid Family Workers | 0 | 0.0% |
| Total | 2,905 | 100.0% |
Employment Status by Age in Orchard Mesa
According to the labor force statistics for Orchard Mesa, out of the total population over 16 years of age (5,741), 56.9% or 3,267 individuals are in the labor force, with 7.9% or 258 of them unemployed. The age group with the highest labor force participation rate is 35 to 44 years, with 98.0% or 988 individuals in the labor force. Within the labor force, the 30 to 34 years age range has the highest percentage of unemployed individuals, with 31.9% or 37 of them being unemployed.
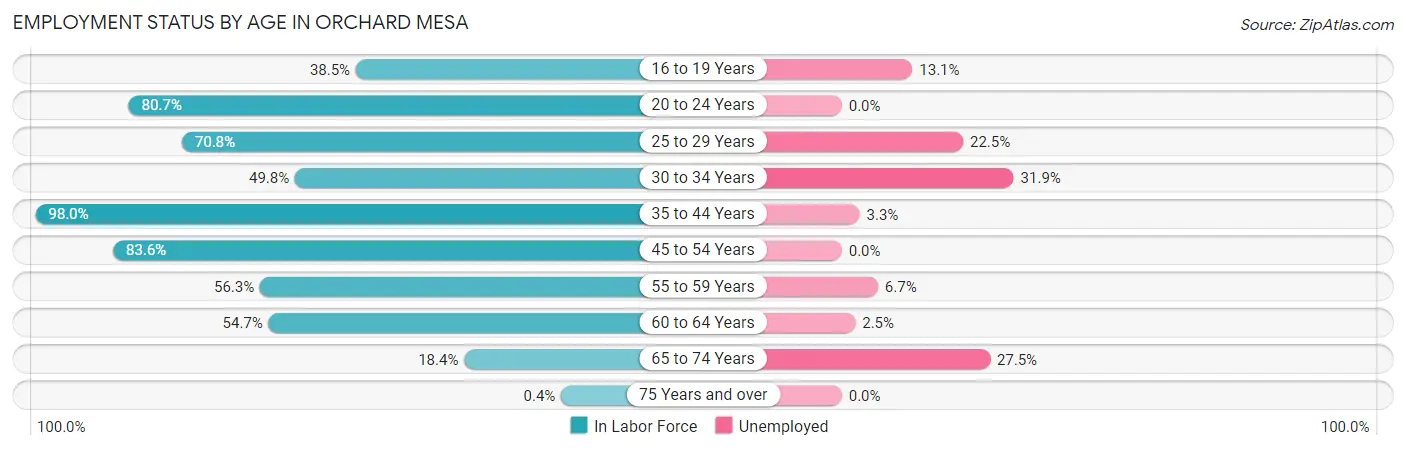
| Age Bracket | In Labor Force | Unemployed |
| 16 to 19 Years | 145 (38.5%) | 19 (13.1%) |
| 20 to 24 Years | 180 (80.7%) | 0 (0.0%) |
| 25 to 29 Years | 409 (70.8%) | 92 (22.5%) |
| 30 to 34 Years | 116 (49.8%) | 37 (31.9%) |
| 35 to 44 Years | 988 (98.0%) | 33 (3.3%) |
| 45 to 54 Years | 654 (83.6%) | 0 (0.0%) |
| 55 to 59 Years | 269 (56.3%) | 18 (6.7%) |
| 60 to 64 Years | 322 (54.7%) | 8 (2.5%) |
| 65 to 74 Years | 182 (18.4%) | 50 (27.5%) |
| 75 Years and over | 2 (0.4%) | 0 (0.0%) |
| Total | 3,267 (56.9%) | 258 (7.9%) |
Employment Status by Educational Attainment in Orchard Mesa
According to labor force statistics for Orchard Mesa, 75.2% of individuals (2,758) out of the total population between 25 and 64 years of age (3,668) are in the labor force, with 6.8% or 188 of them being unemployed. The group with the highest labor force participation rate are those with the educational attainment of college / associate degree, with 89.6% or 1,254 individuals in the labor force. Within the labor force, individuals with bachelor's degree or higher education have the highest percentage of unemployment, with 23.3% or 143 of them being unemployed.
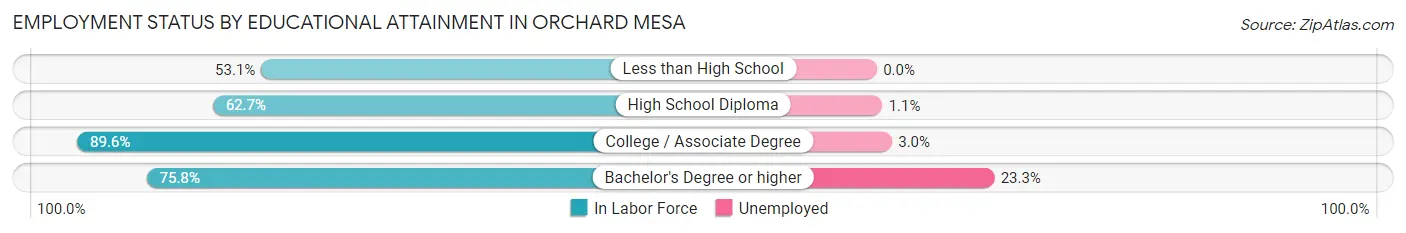
| Educational Attainment | In Labor Force | Unemployed |
| Less than High School | 135 (53.1%) | 0 (0.0%) |
| High School Diploma | 756 (62.7%) | 13 (1.1%) |
| College / Associate Degree | 1,254 (89.6%) | 42 (3.0%) |
| Bachelor's Degree or higher | 614 (75.8%) | 189 (23.3%) |
| Total | 2,758 (75.2%) | 249 (6.8%) |
Employment Occupations by Sex in Orchard Mesa
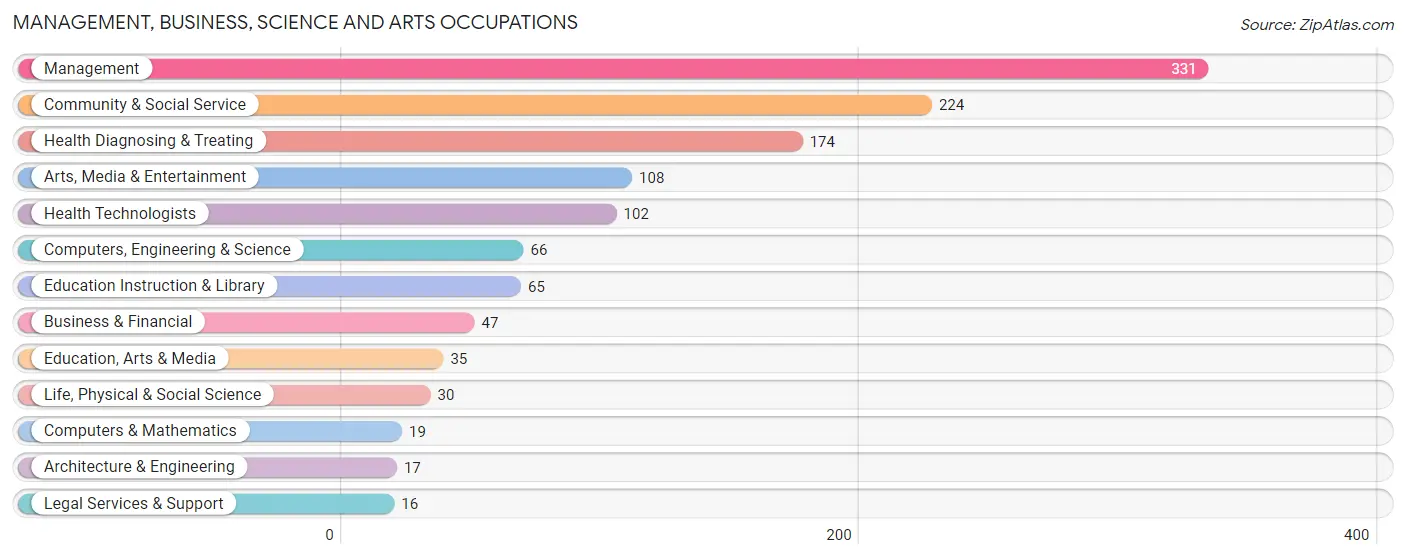
Management, Business, Science and Arts Occupations
The most common Management, Business, Science and Arts occupations in Orchard Mesa are Management (331 | 11.0%), Community & Social Service (224 | 7.4%), Health Diagnosing & Treating (174 | 5.8%), Arts, Media & Entertainment (108 | 3.6%), and Health Technologists (102 | 3.4%).
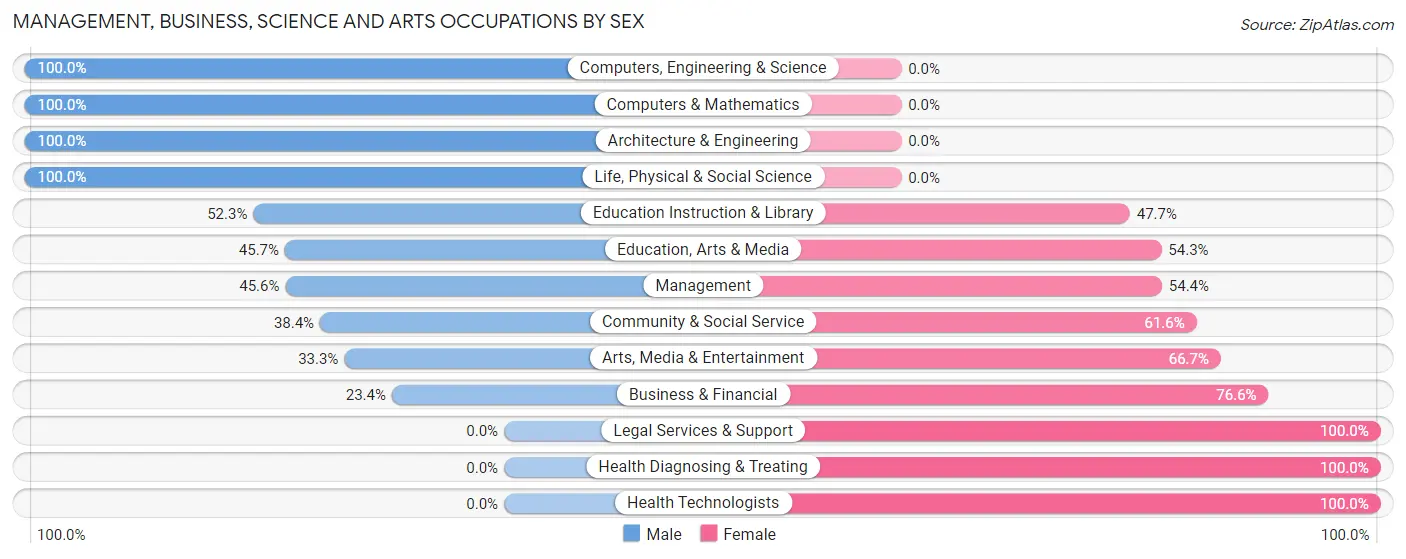
Management, Business, Science and Arts Occupations by Sex
Within the Management, Business, Science and Arts occupations in Orchard Mesa, the most male-oriented occupations are Computers, Engineering & Science (100.0%), Computers & Mathematics (100.0%), and Architecture & Engineering (100.0%), while the most female-oriented occupations are Legal Services & Support (100.0%), Health Diagnosing & Treating (100.0%), and Health Technologists (100.0%).
| Occupation | Male | Female |
| Management | 151 (45.6%) | 180 (54.4%) |
| Business & Financial | 11 (23.4%) | 36 (76.6%) |
| Computers, Engineering & Science | 66 (100.0%) | 0 (0.0%) |
| Computers & Mathematics | 19 (100.0%) | 0 (0.0%) |
| Architecture & Engineering | 17 (100.0%) | 0 (0.0%) |
| Life, Physical & Social Science | 30 (100.0%) | 0 (0.0%) |
| Community & Social Service | 86 (38.4%) | 138 (61.6%) |
| Education, Arts & Media | 16 (45.7%) | 19 (54.3%) |
| Legal Services & Support | 0 (0.0%) | 16 (100.0%) |
| Education Instruction & Library | 34 (52.3%) | 31 (47.7%) |
| Arts, Media & Entertainment | 36 (33.3%) | 72 (66.7%) |
| Health Diagnosing & Treating | 0 (0.0%) | 174 (100.0%) |
| Health Technologists | 0 (0.0%) | 102 (100.0%) |
| Total (Category) | 314 (37.3%) | 528 (62.7%) |
| Total (Overall) | 1,461 (48.5%) | 1,549 (51.5%) |
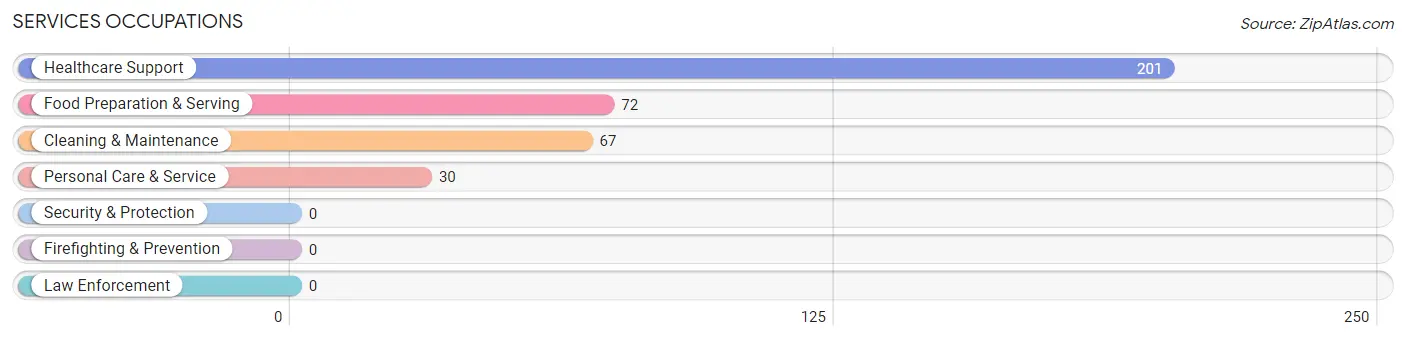
Services Occupations
The most common Services occupations in Orchard Mesa are Healthcare Support (201 | 6.7%), Food Preparation & Serving (72 | 2.4%), Cleaning & Maintenance (67 | 2.2%), and Personal Care & Service (30 | 1.0%).
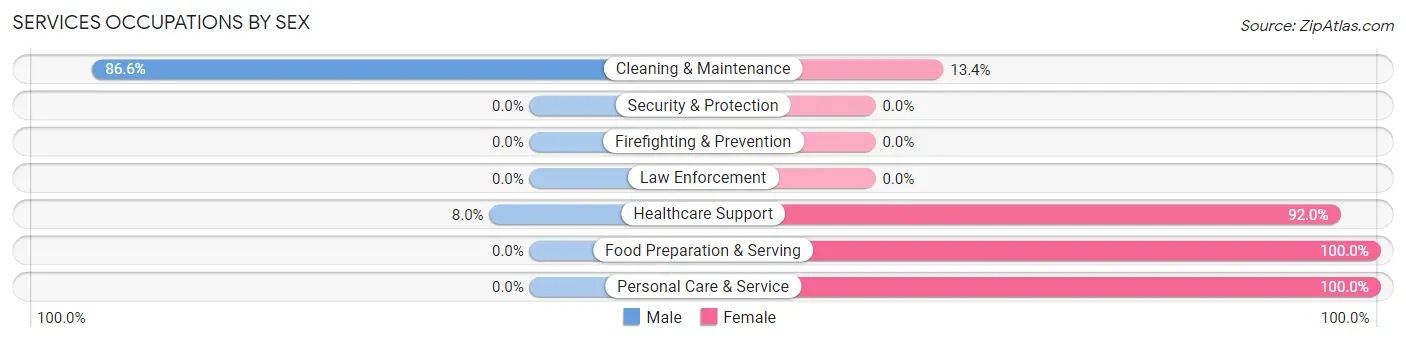
Services Occupations by Sex
Within the Services occupations in Orchard Mesa, the most male-oriented occupations are Cleaning & Maintenance (86.6%), and Healthcare Support (8.0%), while the most female-oriented occupations are Food Preparation & Serving (100.0%), Personal Care & Service (100.0%), and Healthcare Support (92.0%).
| Occupation | Male | Female |
| Healthcare Support | 16 (8.0%) | 185 (92.0%) |
| Security & Protection | 0 (0.0%) | 0 (0.0%) |
| Firefighting & Prevention | 0 (0.0%) | 0 (0.0%) |
| Law Enforcement | 0 (0.0%) | 0 (0.0%) |
| Food Preparation & Serving | 0 (0.0%) | 72 (100.0%) |
| Cleaning & Maintenance | 58 (86.6%) | 9 (13.4%) |
| Personal Care & Service | 0 (0.0%) | 30 (100.0%) |
| Total (Category) | 74 (20.0%) | 296 (80.0%) |
| Total (Overall) | 1,461 (48.5%) | 1,549 (51.5%) |
Sales and Office Occupations
The most common Sales and Office occupations in Orchard Mesa are Sales & Related (332 | 11.0%), and Office & Administration (282 | 9.4%).
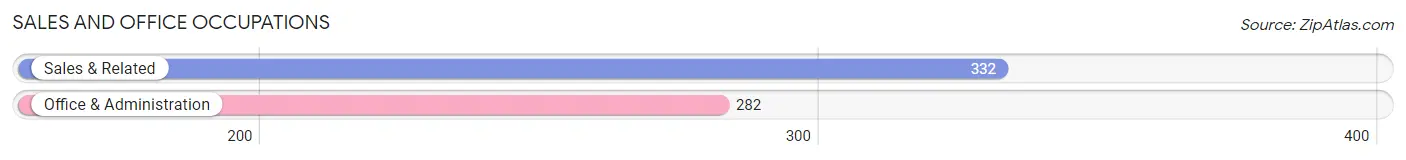
Sales and Office Occupations by Sex

| Occupation | Male | Female |
| Sales & Related | 63 (19.0%) | 269 (81.0%) |
| Office & Administration | 83 (29.4%) | 199 (70.6%) |
| Total (Category) | 146 (23.8%) | 468 (76.2%) |
| Total (Overall) | 1,461 (48.5%) | 1,549 (51.5%) |
Natural Resources, Construction and Maintenance Occupations
The most common Natural Resources, Construction and Maintenance occupations in Orchard Mesa are Construction & Extraction (341 | 11.3%), and Installation, Maintenance & Repair (206 | 6.8%).
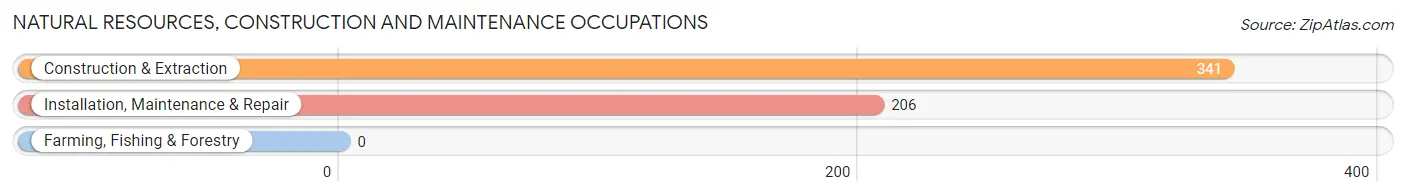
Natural Resources, Construction and Maintenance Occupations by Sex
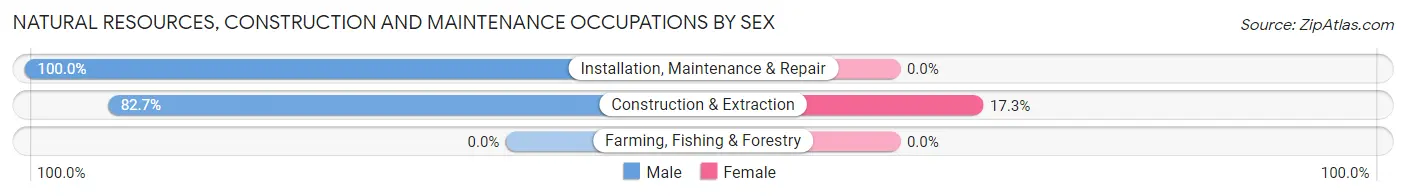
| Occupation | Male | Female |
| Farming, Fishing & Forestry | 0 (0.0%) | 0 (0.0%) |
| Construction & Extraction | 282 (82.7%) | 59 (17.3%) |
| Installation, Maintenance & Repair | 206 (100.0%) | 0 (0.0%) |
| Total (Category) | 488 (89.2%) | 59 (10.8%) |
| Total (Overall) | 1,461 (48.5%) | 1,549 (51.5%) |
Production, Transportation and Moving Occupations
The most common Production, Transportation and Moving occupations in Orchard Mesa are Material Moving (220 | 7.3%), Transportation (219 | 7.3%), and Production (198 | 6.6%).
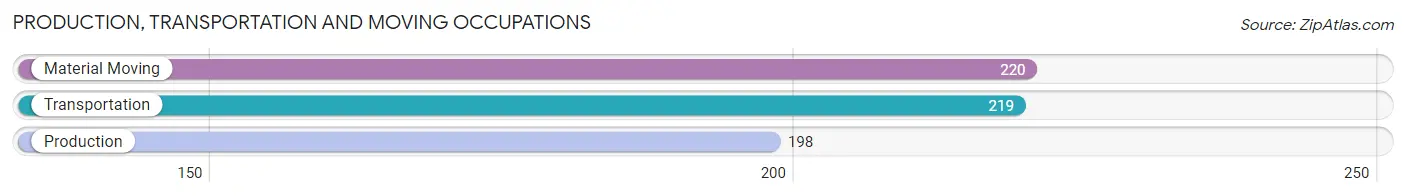
Production, Transportation and Moving Occupations by Sex
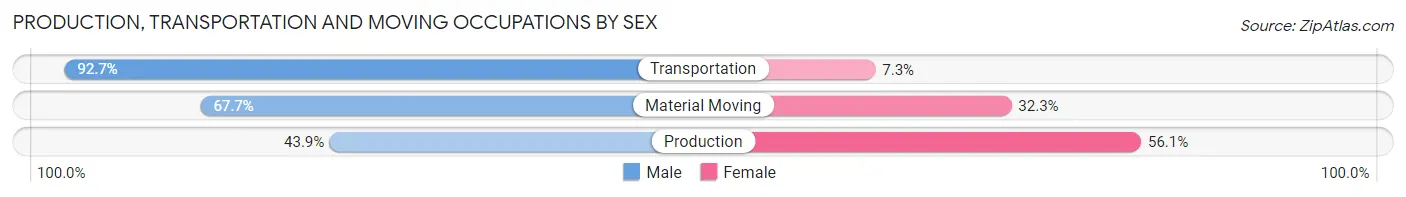
| Occupation | Male | Female |
| Production | 87 (43.9%) | 111 (56.1%) |
| Transportation | 203 (92.7%) | 16 (7.3%) |
| Material Moving | 149 (67.7%) | 71 (32.3%) |
| Total (Category) | 439 (68.9%) | 198 (31.1%) |
| Total (Overall) | 1,461 (48.5%) | 1,549 (51.5%) |
Employment Industries by Sex in Orchard Mesa
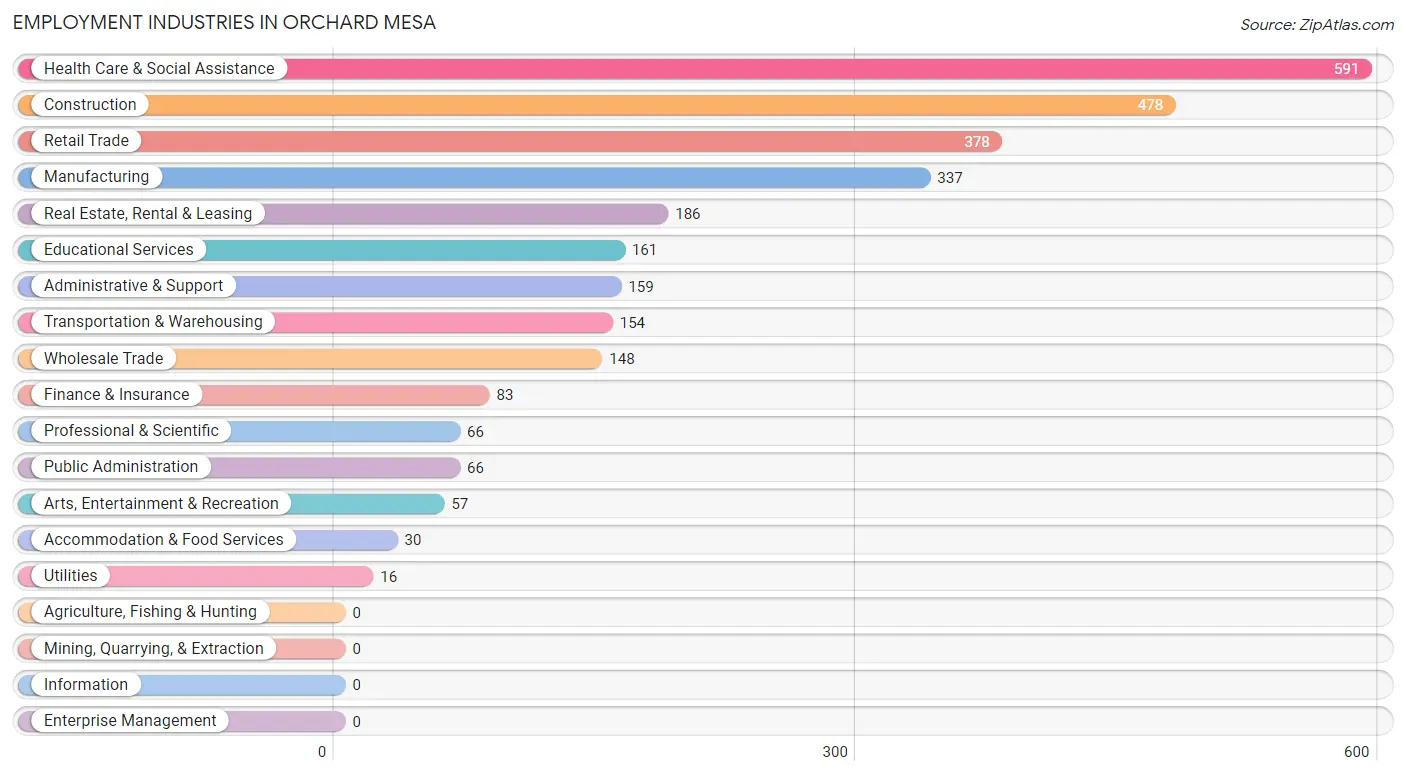
Employment Industries in Orchard Mesa
The major employment industries in Orchard Mesa include Health Care & Social Assistance (591 | 19.6%), Construction (478 | 15.9%), Retail Trade (378 | 12.6%), Manufacturing (337 | 11.2%), and Real Estate, Rental & Leasing (186 | 6.2%).
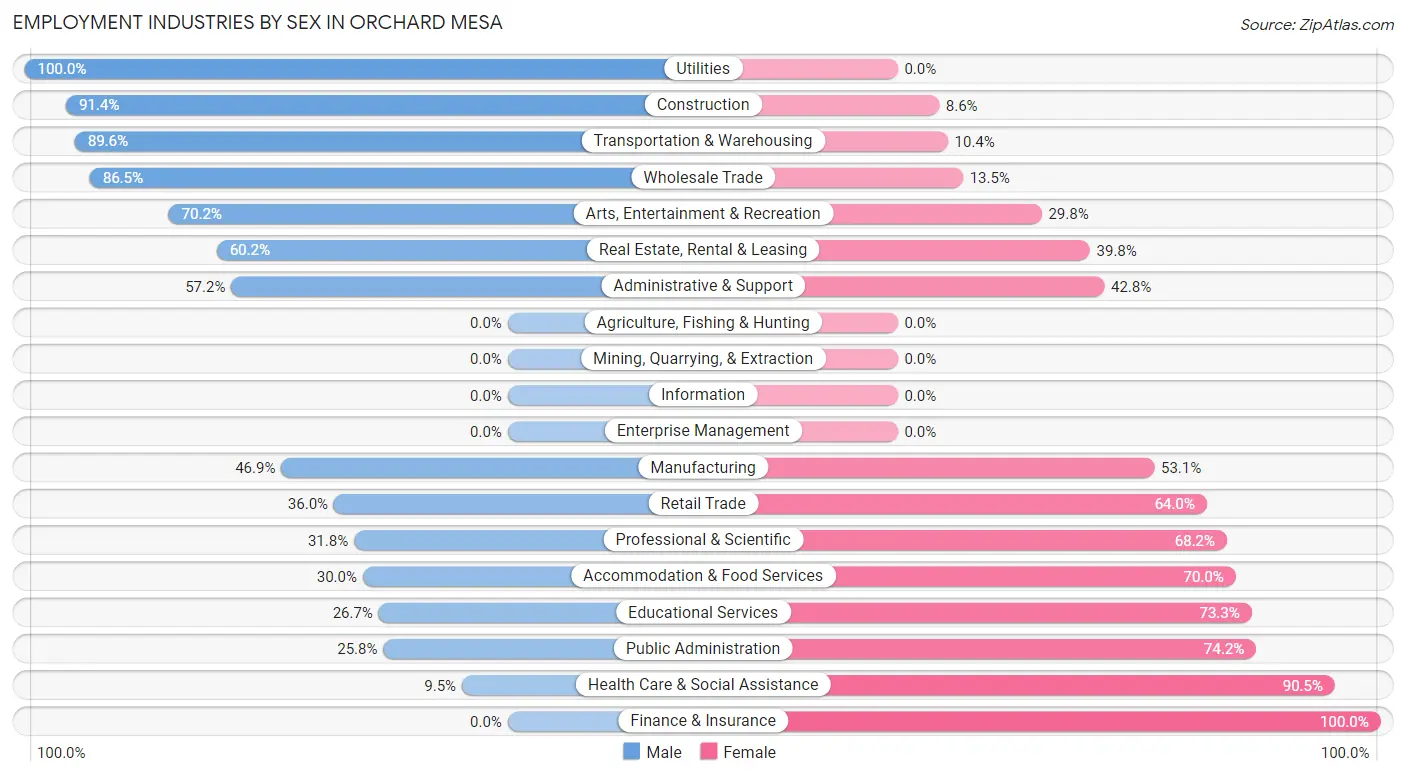
Employment Industries by Sex in Orchard Mesa
The Orchard Mesa industries that see more men than women are Utilities (100.0%), Construction (91.4%), and Transportation & Warehousing (89.6%), whereas the industries that tend to have a higher number of women are Finance & Insurance (100.0%), Health Care & Social Assistance (90.5%), and Public Administration (74.2%).
| Industry | Male | Female |
| Agriculture, Fishing & Hunting | 0 (0.0%) | 0 (0.0%) |
| Mining, Quarrying, & Extraction | 0 (0.0%) | 0 (0.0%) |
| Construction | 437 (91.4%) | 41 (8.6%) |
| Manufacturing | 158 (46.9%) | 179 (53.1%) |
| Wholesale Trade | 128 (86.5%) | 20 (13.5%) |
| Retail Trade | 136 (36.0%) | 242 (64.0%) |
| Transportation & Warehousing | 138 (89.6%) | 16 (10.4%) |
| Utilities | 16 (100.0%) | 0 (0.0%) |
| Information | 0 (0.0%) | 0 (0.0%) |
| Finance & Insurance | 0 (0.0%) | 83 (100.0%) |
| Real Estate, Rental & Leasing | 112 (60.2%) | 74 (39.8%) |
| Professional & Scientific | 21 (31.8%) | 45 (68.2%) |
| Enterprise Management | 0 (0.0%) | 0 (0.0%) |
| Administrative & Support | 91 (57.2%) | 68 (42.8%) |
| Educational Services | 43 (26.7%) | 118 (73.3%) |
| Health Care & Social Assistance | 56 (9.5%) | 535 (90.5%) |
| Arts, Entertainment & Recreation | 40 (70.2%) | 17 (29.8%) |
| Accommodation & Food Services | 9 (30.0%) | 21 (70.0%) |
| Public Administration | 17 (25.8%) | 49 (74.2%) |
| Total | 1,461 (48.5%) | 1,549 (51.5%) |
Education in Orchard Mesa
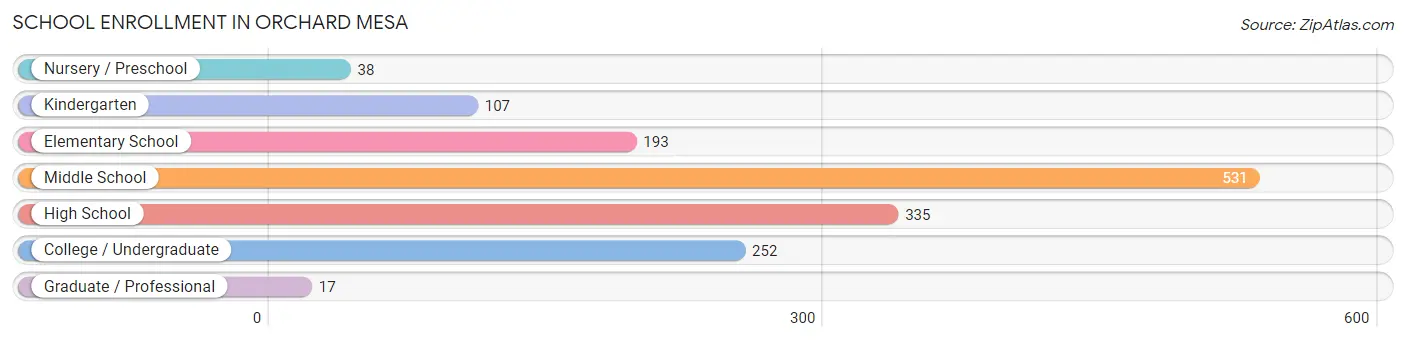
School Enrollment in Orchard Mesa
The most common levels of schooling among the 1,473 students in Orchard Mesa are middle school (531 | 36.0%), high school (335 | 22.7%), and college / undergraduate (252 | 17.1%).
| School Level | # Students | % Students |
| Nursery / Preschool | 38 | 2.6% |
| Kindergarten | 107 | 7.3% |
| Elementary School | 193 | 13.1% |
| Middle School | 531 | 36.0% |
| High School | 335 | 22.7% |
| College / Undergraduate | 252 | 17.1% |
| Graduate / Professional | 17 | 1.1% |
| Total | 1,473 | 100.0% |
School Enrollment by Age by Funding Source in Orchard Mesa
Out of a total of 1,473 students who are enrolled in schools in Orchard Mesa, 209 (14.2%) attend a private institution, while the remaining 1,264 (85.8%) are enrolled in public schools. The age group of 5 to 9 year old has the highest likelihood of being enrolled in private schools, with 93 (29.1% in the age bracket) enrolled. Conversely, the age group of 3 to 4 year olds has the lowest likelihood of being enrolled in a private school, with 18 (100.0% in the age bracket) attending a public institution.
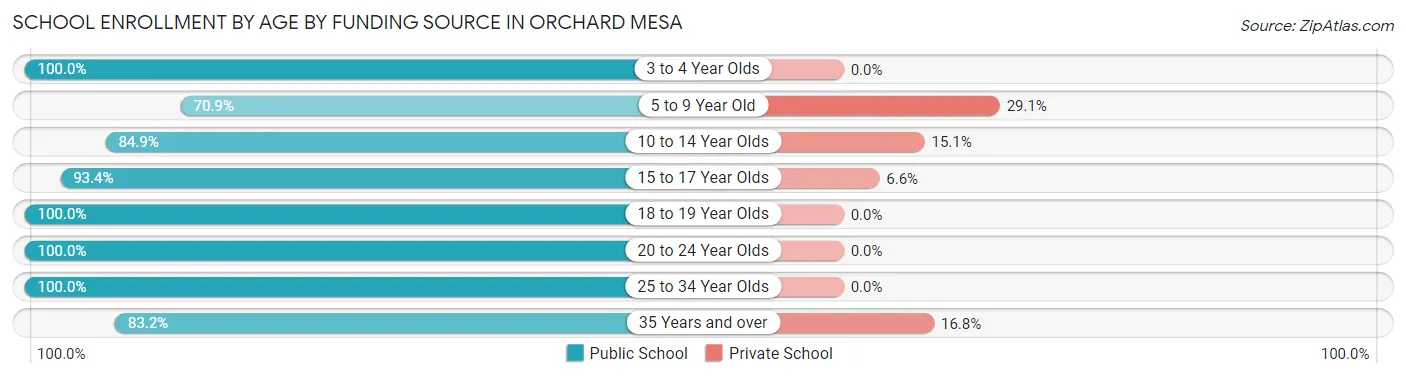
| Age Bracket | Public School | Private School |
| 3 to 4 Year Olds | 18 (100.0%) | 0 (0.0%) |
| 5 to 9 Year Old | 227 (70.9%) | 93 (29.1%) |
| 10 to 14 Year Olds | 451 (84.9%) | 80 (15.1%) |
| 15 to 17 Year Olds | 267 (93.4%) | 19 (6.6%) |
| 18 to 19 Year Olds | 96 (100.0%) | 0 (0.0%) |
| 20 to 24 Year Olds | 48 (100.0%) | 0 (0.0%) |
| 25 to 34 Year Olds | 73 (100.0%) | 0 (0.0%) |
| 35 Years and over | 84 (83.2%) | 17 (16.8%) |
| Total | 1,264 (85.8%) | 209 (14.2%) |
Educational Attainment by Field of Study in Orchard Mesa
Business (198 | 16.9%), psychology (173 | 14.7%), bio, nature & agricultural (166 | 14.1%), education (96 | 8.2%), and science & technology (91 | 7.7%) are the most common fields of study among 1,175 individuals in Orchard Mesa who have obtained a bachelor's degree or higher.
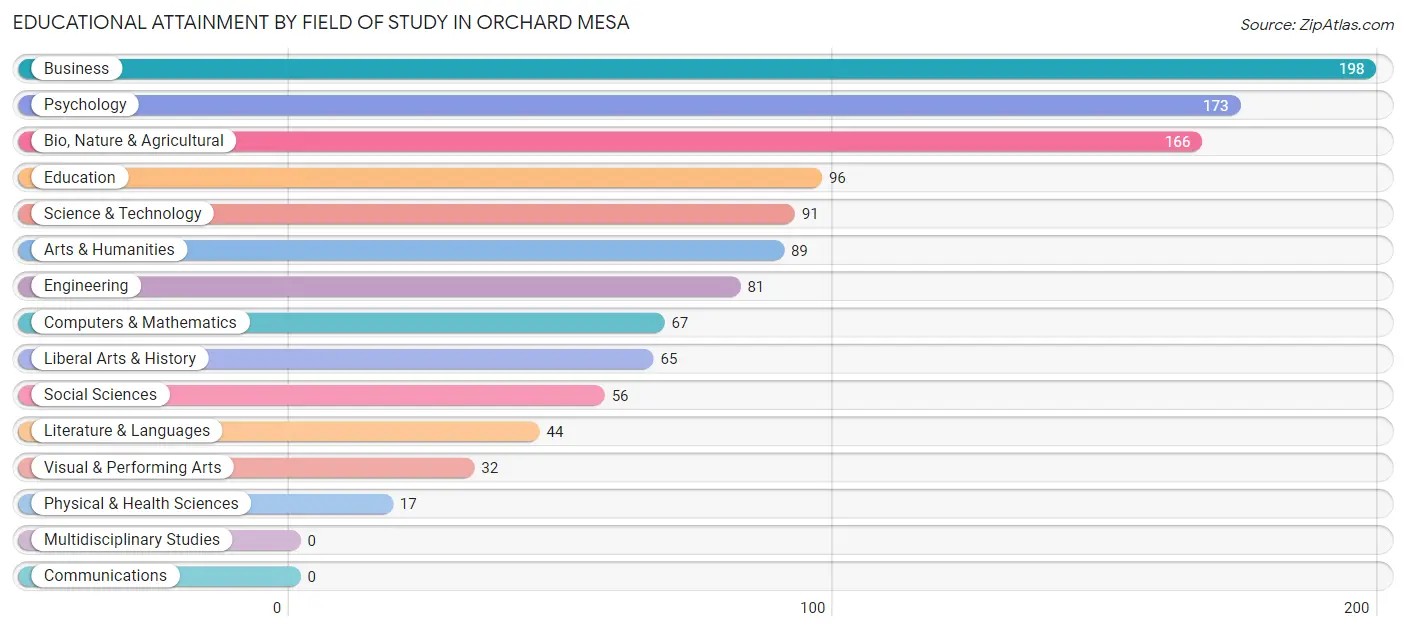
| Field of Study | # Graduates | % Graduates |
| Computers & Mathematics | 67 | 5.7% |
| Bio, Nature & Agricultural | 166 | 14.1% |
| Physical & Health Sciences | 17 | 1.5% |
| Psychology | 173 | 14.7% |
| Social Sciences | 56 | 4.8% |
| Engineering | 81 | 6.9% |
| Multidisciplinary Studies | 0 | 0.0% |
| Science & Technology | 91 | 7.7% |
| Business | 198 | 16.9% |
| Education | 96 | 8.2% |
| Literature & Languages | 44 | 3.7% |
| Liberal Arts & History | 65 | 5.5% |
| Visual & Performing Arts | 32 | 2.7% |
| Communications | 0 | 0.0% |
| Arts & Humanities | 89 | 7.6% |
| Total | 1,175 | 100.0% |
Transportation & Commute in Orchard Mesa
Vehicle Availability by Sex in Orchard Mesa
The most prevalent vehicle ownership categories in Orchard Mesa are males with 3 vehicles (419, accounting for 31.1%) and females with 3 vehicles (432, making up 27.4%).
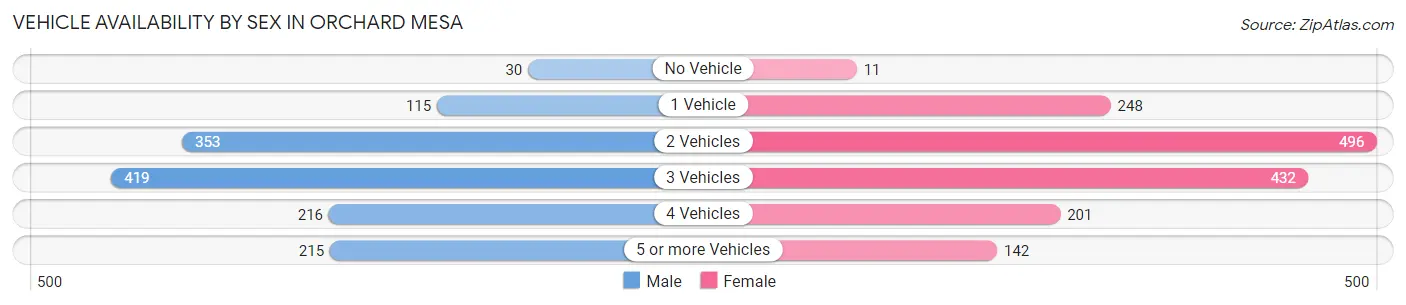
| Vehicles Available | Male | Female |
| No Vehicle | 30 (2.2%) | 11 (0.7%) |
| 1 Vehicle | 115 (8.5%) | 248 (16.2%) |
| 2 Vehicles | 353 (26.2%) | 496 (32.4%) |
| 3 Vehicles | 419 (31.1%) | 432 (28.2%) |
| 4 Vehicles | 216 (16.0%) | 201 (13.1%) |
| 5 or more Vehicles | 215 (16.0%) | 142 (9.3%) |
| Total | 1,348 (100.0%) | 1,530 (100.0%) |
Commute Time in Orchard Mesa
The most frequently occuring commute durations in Orchard Mesa are 15 to 19 minutes (696 commuters, 26.2%), 10 to 14 minutes (558 commuters, 21.0%), and 20 to 24 minutes (482 commuters, 18.2%).
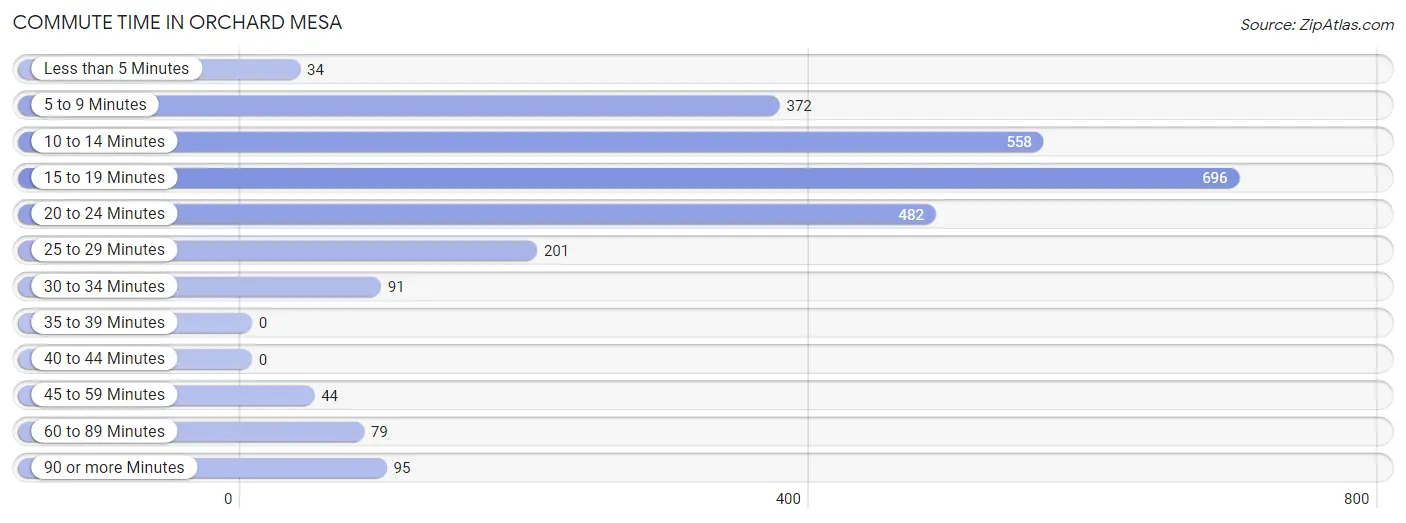
| Commute Time | # Commuters | % Commuters |
| Less than 5 Minutes | 34 | 1.3% |
| 5 to 9 Minutes | 372 | 14.0% |
| 10 to 14 Minutes | 558 | 21.0% |
| 15 to 19 Minutes | 696 | 26.2% |
| 20 to 24 Minutes | 482 | 18.2% |
| 25 to 29 Minutes | 201 | 7.6% |
| 30 to 34 Minutes | 91 | 3.4% |
| 35 to 39 Minutes | 0 | 0.0% |
| 40 to 44 Minutes | 0 | 0.0% |
| 45 to 59 Minutes | 44 | 1.7% |
| 60 to 89 Minutes | 79 | 3.0% |
| 90 or more Minutes | 95 | 3.6% |
Commute Time by Sex in Orchard Mesa
The most common commute times in Orchard Mesa are 15 to 19 minutes (310 commuters, 25.4%) for males and 15 to 19 minutes (386 commuters, 27.0%) for females.
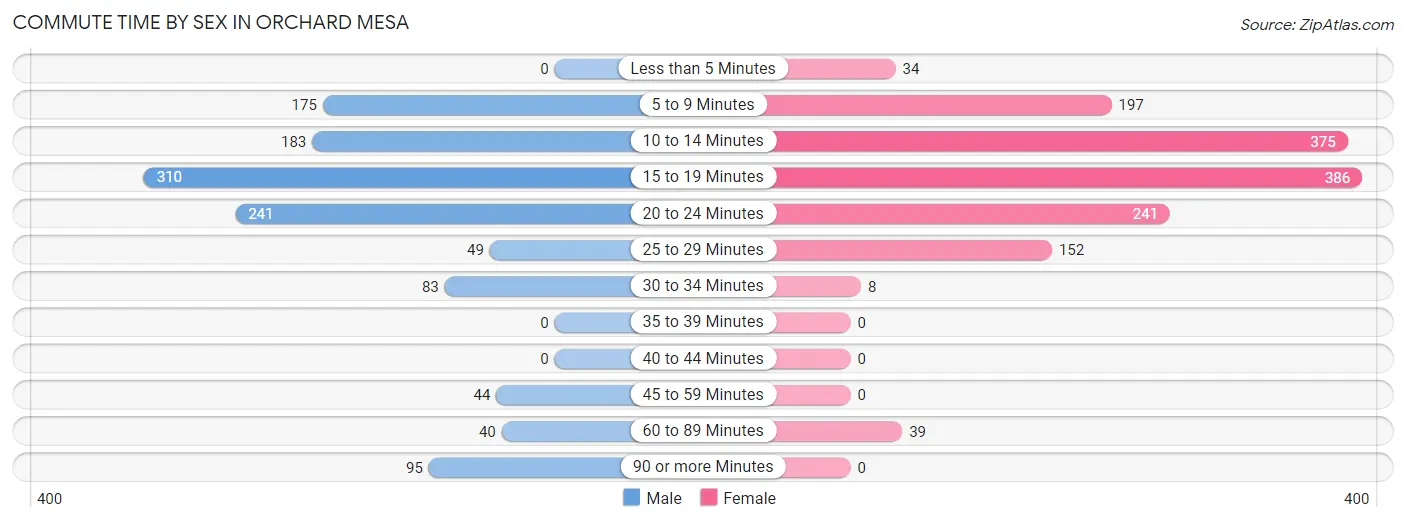
| Commute Time | Male | Female |
| Less than 5 Minutes | 0 (0.0%) | 34 (2.4%) |
| 5 to 9 Minutes | 175 (14.3%) | 197 (13.8%) |
| 10 to 14 Minutes | 183 (15.0%) | 375 (26.2%) |
| 15 to 19 Minutes | 310 (25.4%) | 386 (27.0%) |
| 20 to 24 Minutes | 241 (19.8%) | 241 (16.8%) |
| 25 to 29 Minutes | 49 (4.0%) | 152 (10.6%) |
| 30 to 34 Minutes | 83 (6.8%) | 8 (0.6%) |
| 35 to 39 Minutes | 0 (0.0%) | 0 (0.0%) |
| 40 to 44 Minutes | 0 (0.0%) | 0 (0.0%) |
| 45 to 59 Minutes | 44 (3.6%) | 0 (0.0%) |
| 60 to 89 Minutes | 40 (3.3%) | 39 (2.7%) |
| 90 or more Minutes | 95 (7.8%) | 0 (0.0%) |
Time of Departure to Work by Sex in Orchard Mesa
The most frequent times of departure to work in Orchard Mesa are 7:00 AM to 7:29 AM (187, 15.3%) for males and 7:30 AM to 7:59 AM (413, 28.8%) for females.
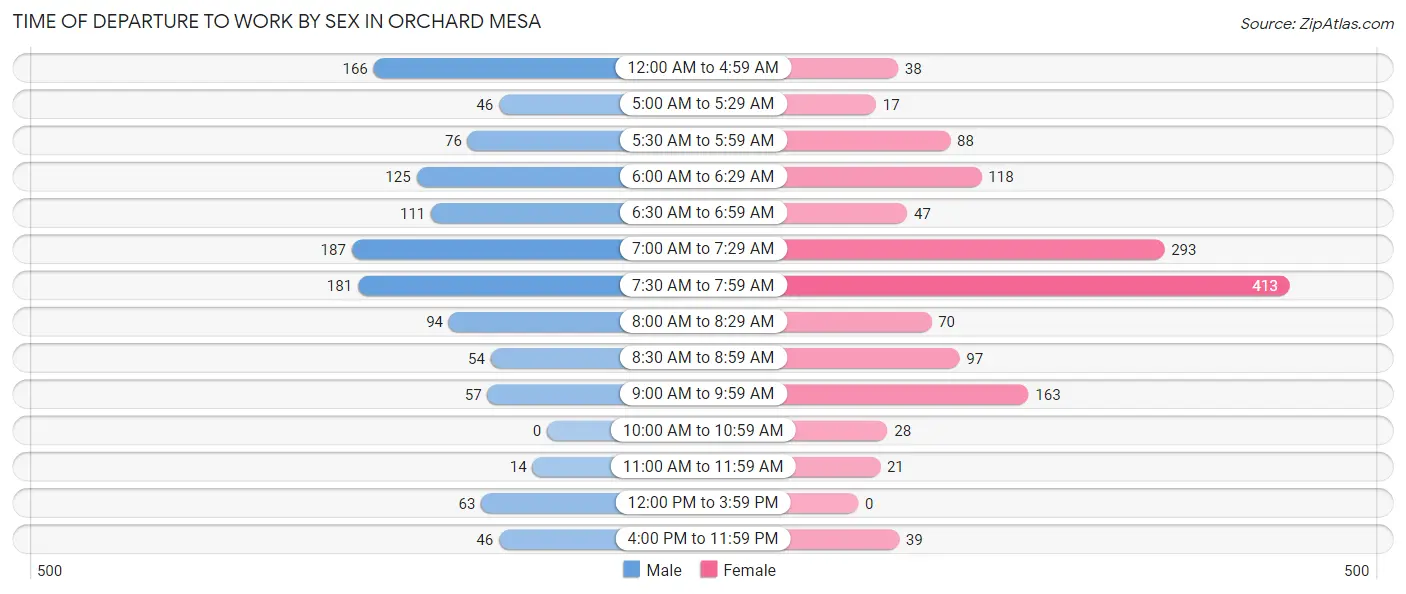
| Time of Departure | Male | Female |
| 12:00 AM to 4:59 AM | 166 (13.6%) | 38 (2.6%) |
| 5:00 AM to 5:29 AM | 46 (3.8%) | 17 (1.2%) |
| 5:30 AM to 5:59 AM | 76 (6.2%) | 88 (6.1%) |
| 6:00 AM to 6:29 AM | 125 (10.2%) | 118 (8.2%) |
| 6:30 AM to 6:59 AM | 111 (9.1%) | 47 (3.3%) |
| 7:00 AM to 7:29 AM | 187 (15.3%) | 293 (20.5%) |
| 7:30 AM to 7:59 AM | 181 (14.8%) | 413 (28.8%) |
| 8:00 AM to 8:29 AM | 94 (7.7%) | 70 (4.9%) |
| 8:30 AM to 8:59 AM | 54 (4.4%) | 97 (6.8%) |
| 9:00 AM to 9:59 AM | 57 (4.7%) | 163 (11.4%) |
| 10:00 AM to 10:59 AM | 0 (0.0%) | 28 (2.0%) |
| 11:00 AM to 11:59 AM | 14 (1.1%) | 21 (1.5%) |
| 12:00 PM to 3:59 PM | 63 (5.2%) | 0 (0.0%) |
| 4:00 PM to 11:59 PM | 46 (3.8%) | 39 (2.7%) |
| Total | 1,220 (100.0%) | 1,432 (100.0%) |
Housing Occupancy in Orchard Mesa
Occupancy by Ownership in Orchard Mesa
Of the total 2,685 dwellings in Orchard Mesa, owner-occupied units account for 2,203 (82.1%), while renter-occupied units make up 482 (17.9%).
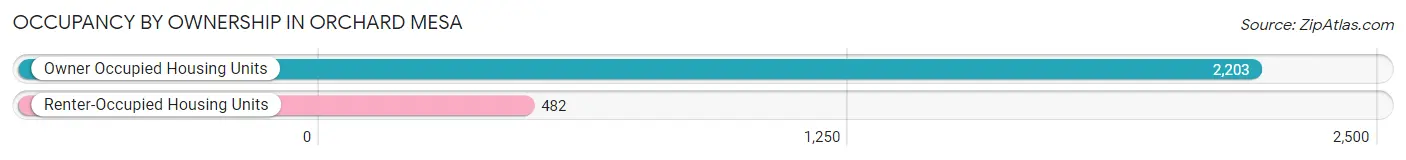
| Occupancy | # Housing Units | % Housing Units |
| Owner Occupied Housing Units | 2,203 | 82.1% |
| Renter-Occupied Housing Units | 482 | 17.9% |
| Total Occupied Housing Units | 2,685 | 100.0% |
Occupancy by Household Size in Orchard Mesa
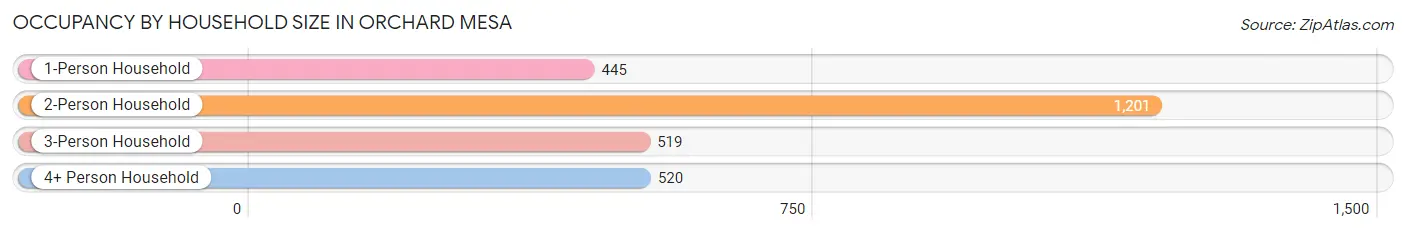
| Household Size | # Housing Units | % Housing Units |
| 1-Person Household | 445 | 16.6% |
| 2-Person Household | 1,201 | 44.7% |
| 3-Person Household | 519 | 19.3% |
| 4+ Person Household | 520 | 19.4% |
| Total Housing Units | 2,685 | 100.0% |
Occupancy by Ownership by Household Size in Orchard Mesa
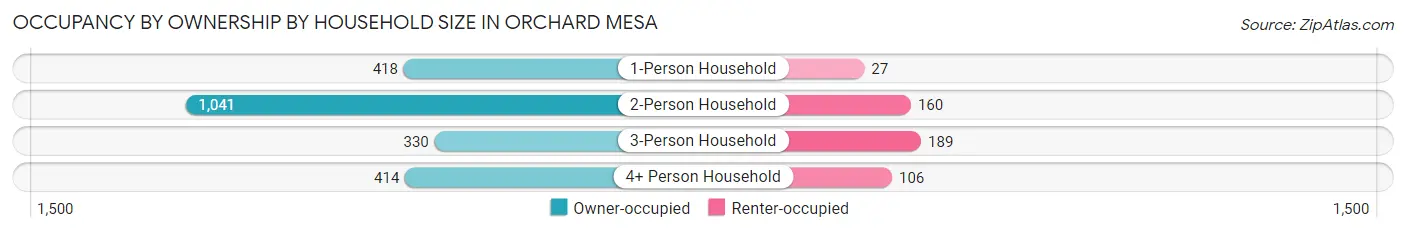
| Household Size | Owner-occupied | Renter-occupied |
| 1-Person Household | 418 (93.9%) | 27 (6.1%) |
| 2-Person Household | 1,041 (86.7%) | 160 (13.3%) |
| 3-Person Household | 330 (63.6%) | 189 (36.4%) |
| 4+ Person Household | 414 (79.6%) | 106 (20.4%) |
| Total Housing Units | 2,203 (82.1%) | 482 (17.9%) |
Occupancy by Educational Attainment in Orchard Mesa
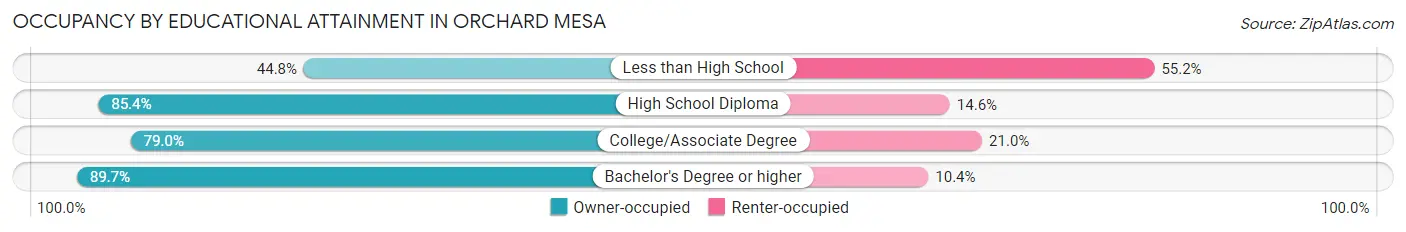
| Household Size | Owner-occupied | Renter-occupied |
| Less than High School | 39 (44.8%) | 48 (55.2%) |
| High School Diploma | 724 (85.4%) | 124 (14.6%) |
| College/Associate Degree | 955 (79.0%) | 254 (21.0%) |
| Bachelor's Degree or higher | 485 (89.6%) | 56 (10.3%) |
Occupancy by Age of Householder in Orchard Mesa
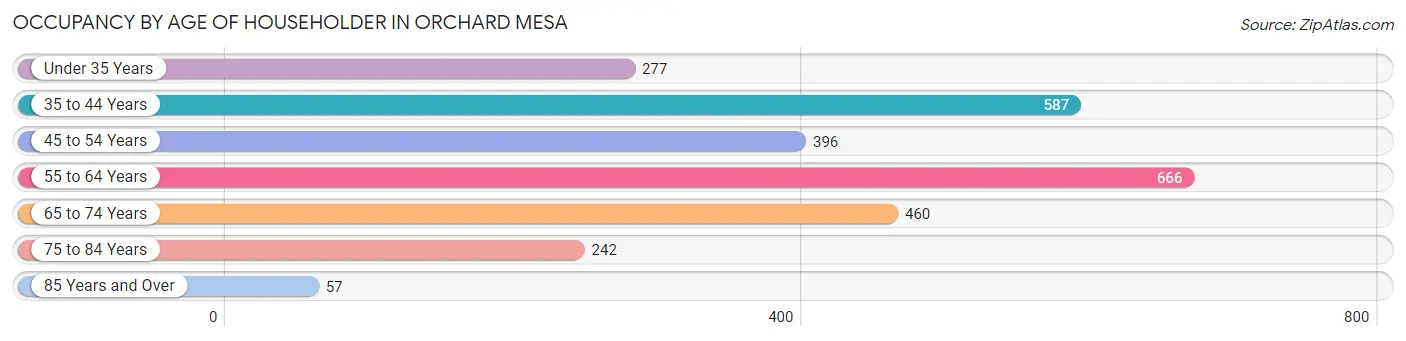
| Age Bracket | # Households | % Households |
| Under 35 Years | 277 | 10.3% |
| 35 to 44 Years | 587 | 21.9% |
| 45 to 54 Years | 396 | 14.7% |
| 55 to 64 Years | 666 | 24.8% |
| 65 to 74 Years | 460 | 17.1% |
| 75 to 84 Years | 242 | 9.0% |
| 85 Years and Over | 57 | 2.1% |
| Total | 2,685 | 100.0% |
Housing Finances in Orchard Mesa
Median Income by Occupancy in Orchard Mesa
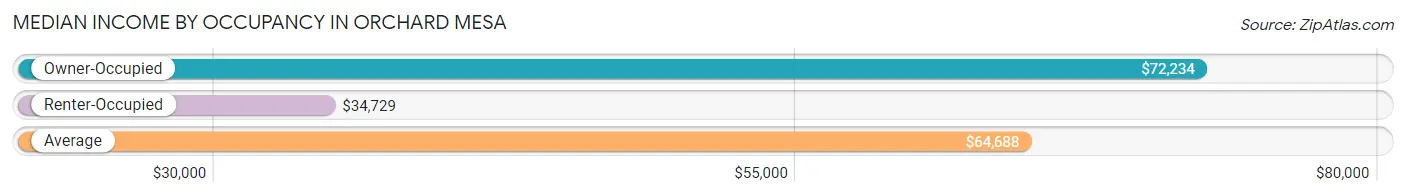
| Occupancy Type | # Households | Median Income |
| Owner-Occupied | 2,203 (82.1%) | $72,234 |
| Renter-Occupied | 482 (17.9%) | $34,729 |
| Average | 2,685 (100.0%) | $64,688 |
Occupancy by Householder Income Bracket in Orchard Mesa
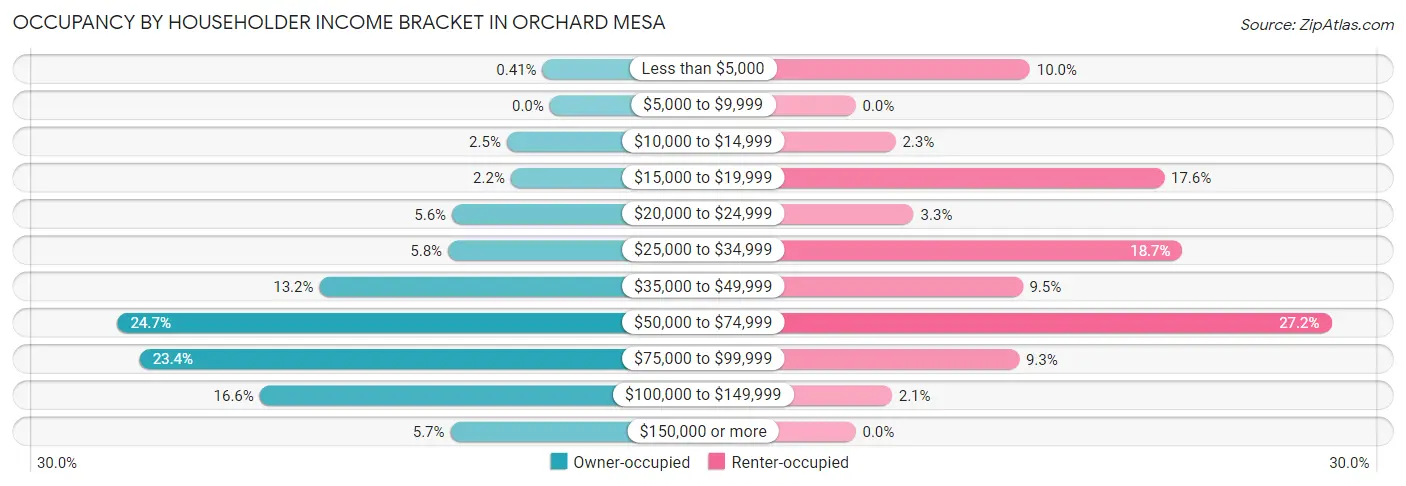
| Income Bracket | Owner-occupied | Renter-occupied |
| Less than $5,000 | 9 (0.4%) | 48 (10.0%) |
| $5,000 to $9,999 | 0 (0.0%) | 0 (0.0%) |
| $10,000 to $14,999 | 54 (2.5%) | 11 (2.3%) |
| $15,000 to $19,999 | 49 (2.2%) | 85 (17.6%) |
| $20,000 to $24,999 | 123 (5.6%) | 16 (3.3%) |
| $25,000 to $34,999 | 128 (5.8%) | 90 (18.7%) |
| $35,000 to $49,999 | 290 (13.2%) | 46 (9.5%) |
| $50,000 to $74,999 | 544 (24.7%) | 131 (27.2%) |
| $75,000 to $99,999 | 516 (23.4%) | 45 (9.3%) |
| $100,000 to $149,999 | 365 (16.6%) | 10 (2.1%) |
| $150,000 or more | 125 (5.7%) | 0 (0.0%) |
| Total | 2,203 (100.0%) | 482 (100.0%) |
Monthly Housing Cost Tiers in Orchard Mesa
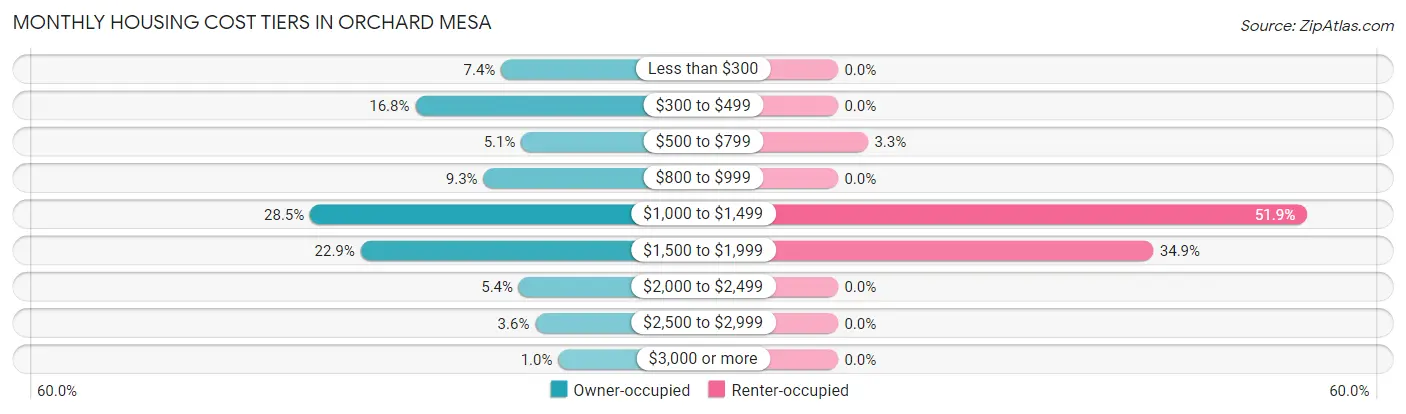
| Monthly Cost | Owner-occupied | Renter-occupied |
| Less than $300 | 162 (7.3%) | 0 (0.0%) |
| $300 to $499 | 371 (16.8%) | 0 (0.0%) |
| $500 to $799 | 113 (5.1%) | 16 (3.3%) |
| $800 to $999 | 205 (9.3%) | 0 (0.0%) |
| $1,000 to $1,499 | 627 (28.5%) | 250 (51.9%) |
| $1,500 to $1,999 | 504 (22.9%) | 168 (34.8%) |
| $2,000 to $2,499 | 119 (5.4%) | 0 (0.0%) |
| $2,500 to $2,999 | 79 (3.6%) | 0 (0.0%) |
| $3,000 or more | 23 (1.0%) | 0 (0.0%) |
| Total | 2,203 (100.0%) | 482 (100.0%) |
Physical Housing Characteristics in Orchard Mesa
Housing Structures in Orchard Mesa
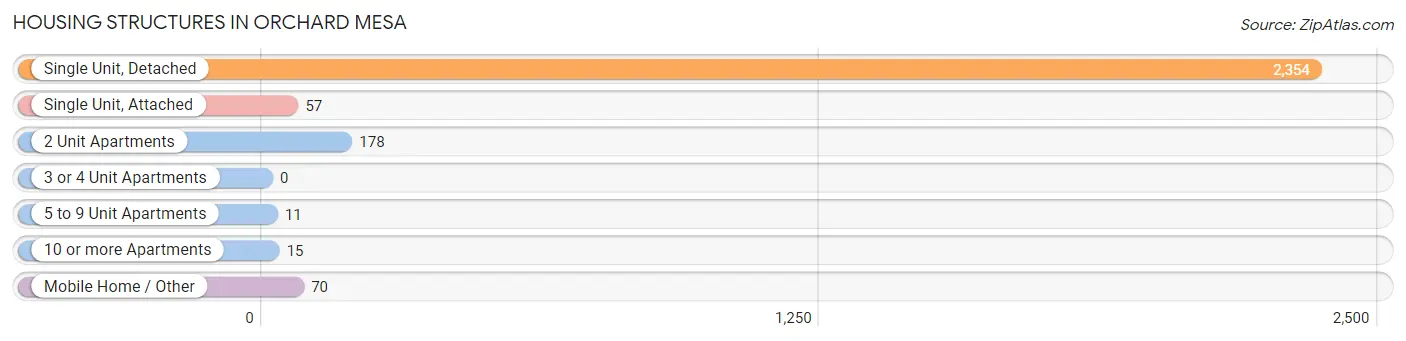
| Structure Type | # Housing Units | % Housing Units |
| Single Unit, Detached | 2,354 | 87.7% |
| Single Unit, Attached | 57 | 2.1% |
| 2 Unit Apartments | 178 | 6.6% |
| 3 or 4 Unit Apartments | 0 | 0.0% |
| 5 to 9 Unit Apartments | 11 | 0.4% |
| 10 or more Apartments | 15 | 0.6% |
| Mobile Home / Other | 70 | 2.6% |
| Total | 2,685 | 100.0% |
Housing Structures by Occupancy in Orchard Mesa
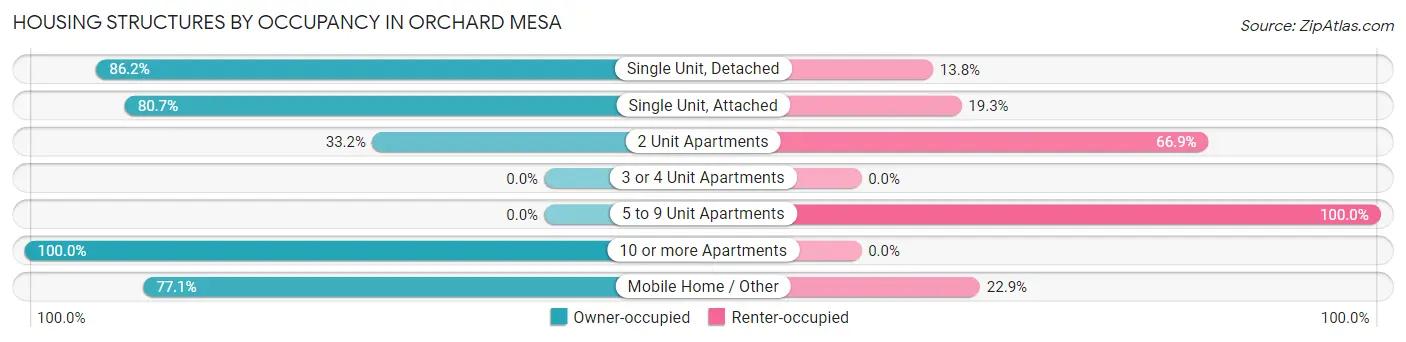
| Structure Type | Owner-occupied | Renter-occupied |
| Single Unit, Detached | 2,029 (86.2%) | 325 (13.8%) |
| Single Unit, Attached | 46 (80.7%) | 11 (19.3%) |
| 2 Unit Apartments | 59 (33.2%) | 119 (66.8%) |
| 3 or 4 Unit Apartments | 0 (0.0%) | 0 (0.0%) |
| 5 to 9 Unit Apartments | 0 (0.0%) | 11 (100.0%) |
| 10 or more Apartments | 15 (100.0%) | 0 (0.0%) |
| Mobile Home / Other | 54 (77.1%) | 16 (22.9%) |
| Total | 2,203 (82.1%) | 482 (17.9%) |
Housing Structures by Number of Rooms in Orchard Mesa
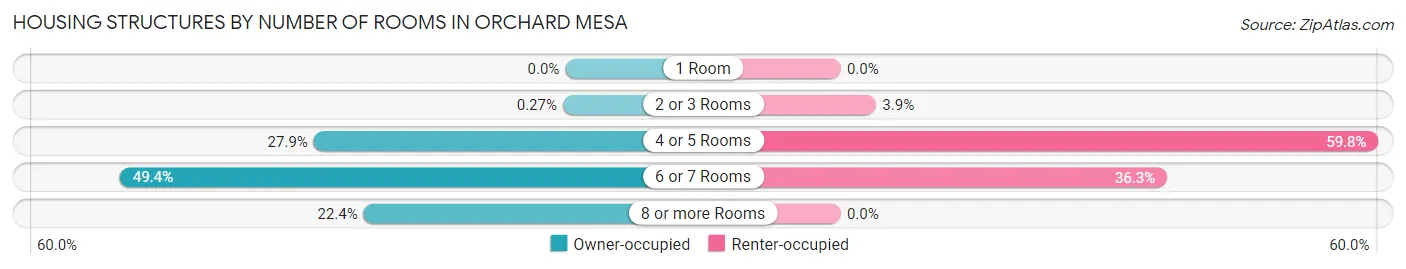
| Number of Rooms | Owner-occupied | Renter-occupied |
| 1 Room | 0 (0.0%) | 0 (0.0%) |
| 2 or 3 Rooms | 6 (0.3%) | 19 (3.9%) |
| 4 or 5 Rooms | 615 (27.9%) | 288 (59.8%) |
| 6 or 7 Rooms | 1,089 (49.4%) | 175 (36.3%) |
| 8 or more Rooms | 493 (22.4%) | 0 (0.0%) |
| Total | 2,203 (100.0%) | 482 (100.0%) |
Housing Structure by Heating Type in Orchard Mesa
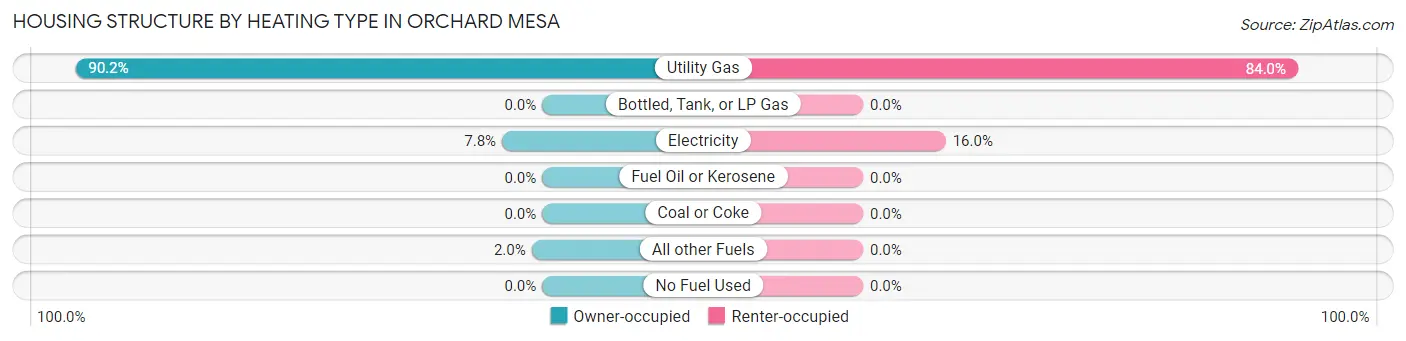
| Heating Type | Owner-occupied | Renter-occupied |
| Utility Gas | 1,987 (90.2%) | 405 (84.0%) |
| Bottled, Tank, or LP Gas | 0 (0.0%) | 0 (0.0%) |
| Electricity | 171 (7.8%) | 77 (16.0%) |
| Fuel Oil or Kerosene | 0 (0.0%) | 0 (0.0%) |
| Coal or Coke | 0 (0.0%) | 0 (0.0%) |
| All other Fuels | 45 (2.0%) | 0 (0.0%) |
| No Fuel Used | 0 (0.0%) | 0 (0.0%) |
| Total | 2,203 (100.0%) | 482 (100.0%) |
Household Vehicle Usage in Orchard Mesa
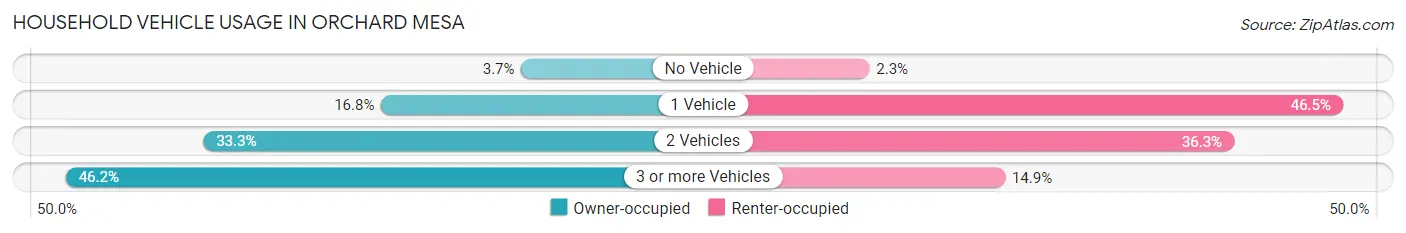
| Vehicles per Household | Owner-occupied | Renter-occupied |
| No Vehicle | 82 (3.7%) | 11 (2.3%) |
| 1 Vehicle | 370 (16.8%) | 224 (46.5%) |
| 2 Vehicles | 734 (33.3%) | 175 (36.3%) |
| 3 or more Vehicles | 1,017 (46.2%) | 72 (14.9%) |
| Total | 2,203 (100.0%) | 482 (100.0%) |
Real Estate & Mortgages in Orchard Mesa
Real Estate and Mortgage Overview in Orchard Mesa
| Characteristic | Without Mortgage | With Mortgage |
| Housing Units | 624 | 1,579 |
| Median Property Value | $286,100 | $283,400 |
| Median Household Income | $57,973 | $104 |
| Monthly Housing Costs | $361 | $23 |
| Real Estate Taxes | $1,114 | $0 |
Property Value by Mortgage Status in Orchard Mesa
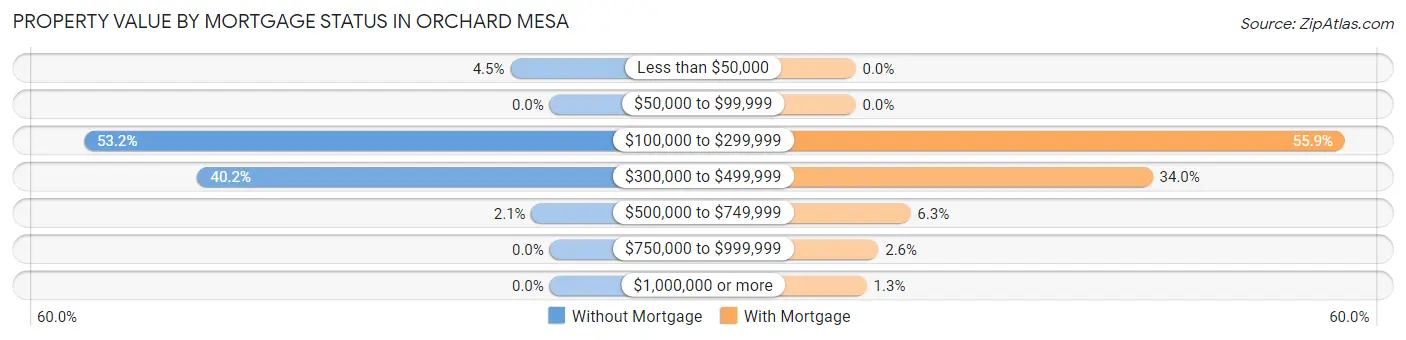
| Property Value | Without Mortgage | With Mortgage |
| Less than $50,000 | 28 (4.5%) | 0 (0.0%) |
| $50,000 to $99,999 | 0 (0.0%) | 0 (0.0%) |
| $100,000 to $299,999 | 332 (53.2%) | 883 (55.9%) |
| $300,000 to $499,999 | 251 (40.2%) | 536 (34.0%) |
| $500,000 to $749,999 | 13 (2.1%) | 99 (6.3%) |
| $750,000 to $999,999 | 0 (0.0%) | 41 (2.6%) |
| $1,000,000 or more | 0 (0.0%) | 20 (1.3%) |
| Total | 624 (100.0%) | 1,579 (100.0%) |
Household Income by Mortgage Status in Orchard Mesa
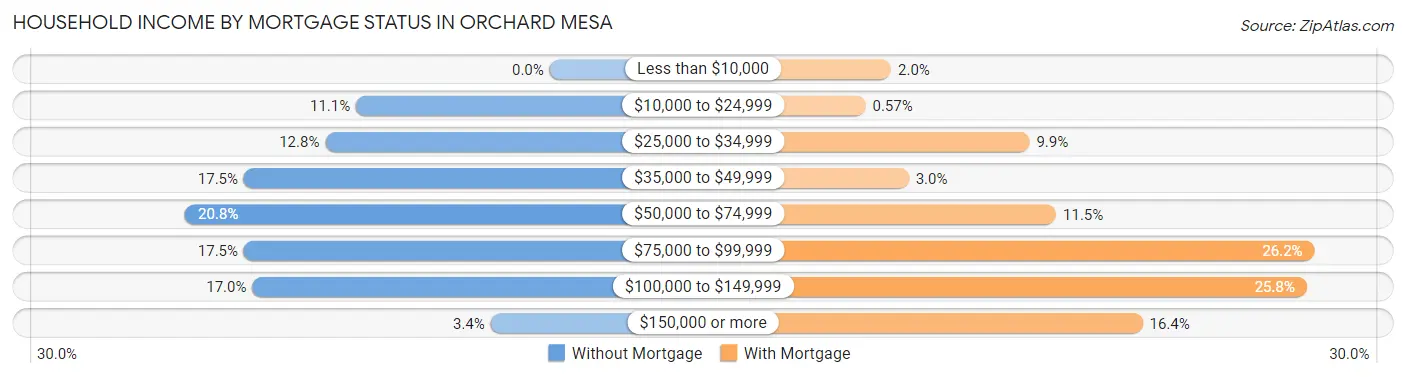
| Household Income | Without Mortgage | With Mortgage |
| Less than $10,000 | 0 (0.0%) | 32 (2.0%) |
| $10,000 to $24,999 | 69 (11.1%) | 9 (0.6%) |
| $25,000 to $34,999 | 80 (12.8%) | 157 (9.9%) |
| $35,000 to $49,999 | 109 (17.5%) | 48 (3.0%) |
| $50,000 to $74,999 | 130 (20.8%) | 181 (11.5%) |
| $75,000 to $99,999 | 109 (17.5%) | 414 (26.2%) |
| $100,000 to $149,999 | 106 (17.0%) | 407 (25.8%) |
| $150,000 or more | 21 (3.4%) | 259 (16.4%) |
| Total | 624 (100.0%) | 1,579 (100.0%) |
Property Value to Household Income Ratio in Orchard Mesa
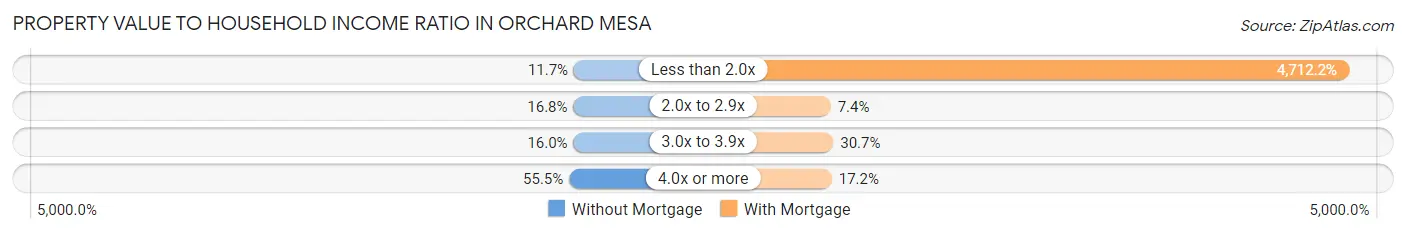
| Value-to-Income Ratio | Without Mortgage | With Mortgage |
| Less than 2.0x | 73 (11.7%) | 74,405 (4,712.2%) |
| 2.0x to 2.9x | 105 (16.8%) | 116 (7.3%) |
| 3.0x to 3.9x | 100 (16.0%) | 484 (30.6%) |
| 4.0x or more | 346 (55.4%) | 271 (17.2%) |
| Total | 624 (100.0%) | 1,579 (100.0%) |
Real Estate Taxes by Mortgage Status in Orchard Mesa
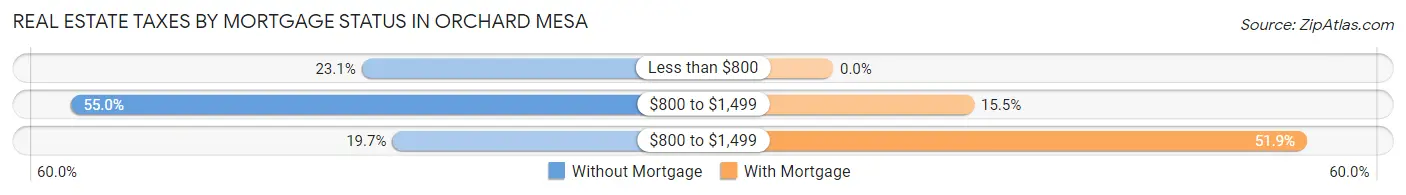
| Property Taxes | Without Mortgage | With Mortgage |
| Less than $800 | 144 (23.1%) | 0 (0.0%) |
| $800 to $1,499 | 343 (55.0%) | 244 (15.4%) |
| $800 to $1,499 | 123 (19.7%) | 820 (51.9%) |
| Total | 624 (100.0%) | 1,579 (100.0%) |
Health & Disability in Orchard Mesa
Health Insurance Coverage by Age in Orchard Mesa
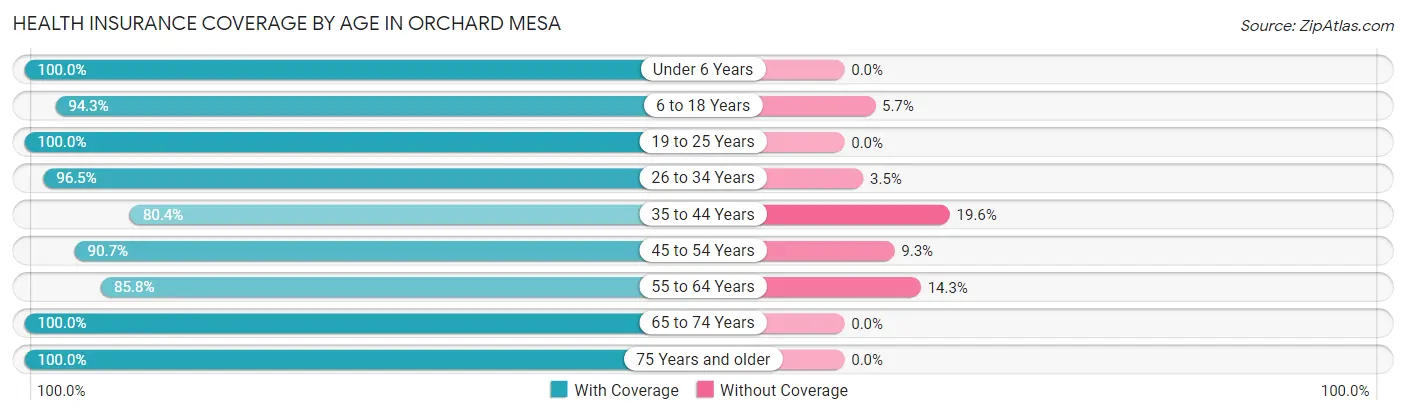
| Age Bracket | With Coverage | Without Coverage |
| Under 6 Years | 527 (100.0%) | 0 (0.0%) |
| 6 to 18 Years | 1,184 (94.3%) | 72 (5.7%) |
| 19 to 25 Years | 377 (100.0%) | 0 (0.0%) |
| 26 to 34 Years | 659 (96.5%) | 24 (3.5%) |
| 35 to 44 Years | 810 (80.4%) | 198 (19.6%) |
| 45 to 54 Years | 709 (90.7%) | 73 (9.3%) |
| 55 to 64 Years | 915 (85.8%) | 152 (14.2%) |
| 65 to 74 Years | 988 (100.0%) | 0 (0.0%) |
| 75 Years and older | 485 (100.0%) | 0 (0.0%) |
| Total | 6,654 (92.8%) | 519 (7.2%) |
Health Insurance Coverage by Citizenship Status in Orchard Mesa
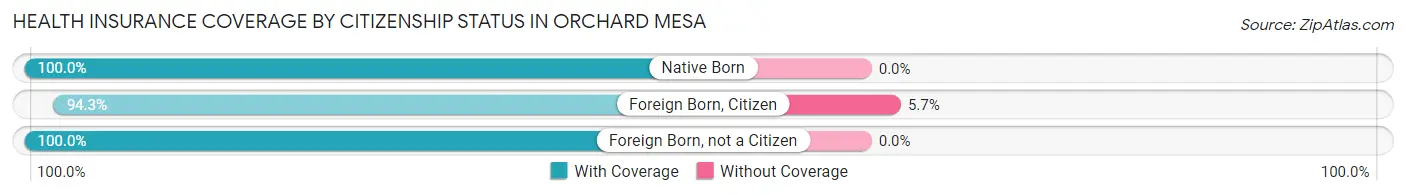
| Citizenship Status | With Coverage | Without Coverage |
| Native Born | 527 (100.0%) | 0 (0.0%) |
| Foreign Born, Citizen | 1,184 (94.3%) | 72 (5.7%) |
| Foreign Born, not a Citizen | 377 (100.0%) | 0 (0.0%) |
Health Insurance Coverage by Household Income in Orchard Mesa
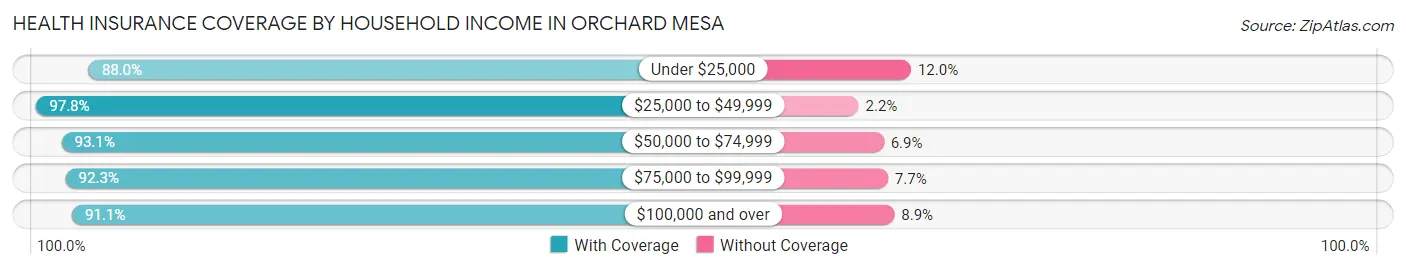
| Household Income | With Coverage | Without Coverage |
| Under $25,000 | 636 (88.0%) | 87 (12.0%) |
| $25,000 to $49,999 | 1,107 (97.8%) | 25 (2.2%) |
| $50,000 to $74,999 | 1,896 (93.1%) | 141 (6.9%) |
| $75,000 to $99,999 | 1,666 (92.3%) | 139 (7.7%) |
| $100,000 and over | 1,299 (91.1%) | 127 (8.9%) |
Public vs Private Health Insurance Coverage by Age in Orchard Mesa
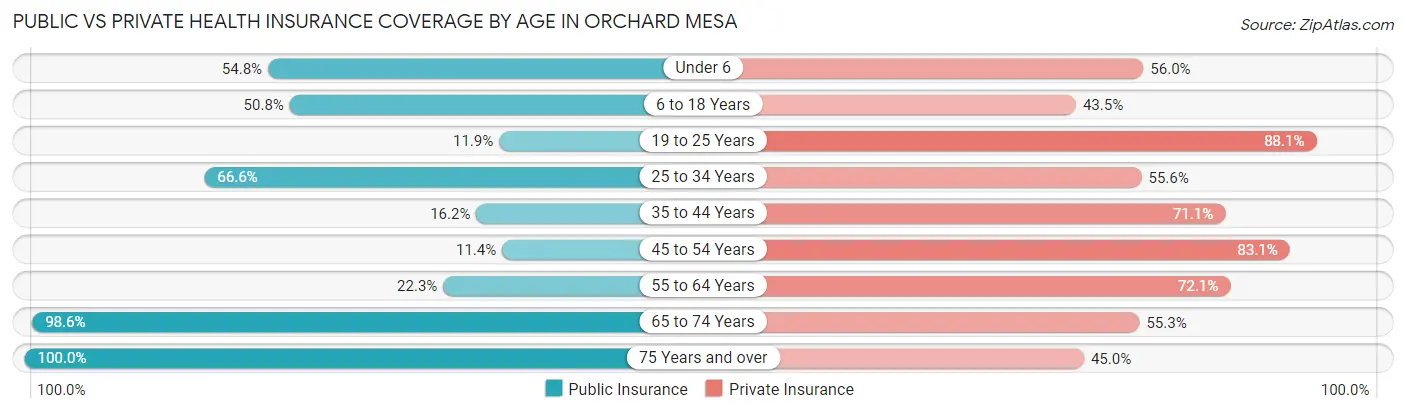
| Age Bracket | Public Insurance | Private Insurance |
| Under 6 | 289 (54.8%) | 295 (56.0%) |
| 6 to 18 Years | 638 (50.8%) | 546 (43.5%) |
| 19 to 25 Years | 45 (11.9%) | 332 (88.1%) |
| 25 to 34 Years | 455 (66.6%) | 380 (55.6%) |
| 35 to 44 Years | 163 (16.2%) | 717 (71.1%) |
| 45 to 54 Years | 89 (11.4%) | 650 (83.1%) |
| 55 to 64 Years | 238 (22.3%) | 769 (72.1%) |
| 65 to 74 Years | 974 (98.6%) | 546 (55.3%) |
| 75 Years and over | 485 (100.0%) | 218 (45.0%) |
| Total | 3,376 (47.1%) | 4,453 (62.1%) |
Disability Status by Sex by Age in Orchard Mesa
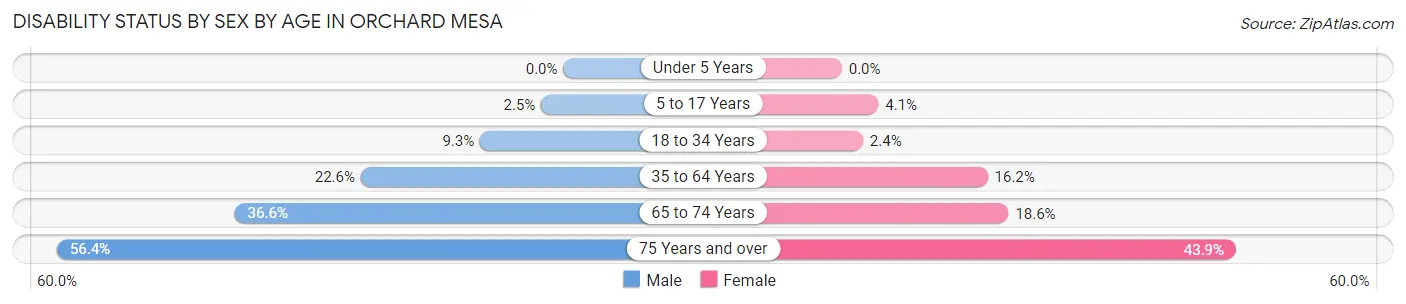
| Age Bracket | Male | Female |
| Under 5 Years | 0 (0.0%) | 0 (0.0%) |
| 5 to 17 Years | 17 (2.5%) | 20 (4.1%) |
| 18 to 34 Years | 48 (9.3%) | 15 (2.4%) |
| 35 to 64 Years | 282 (22.6%) | 261 (16.2%) |
| 65 to 74 Years | 194 (36.6%) | 85 (18.6%) |
| 75 Years and over | 163 (56.4%) | 86 (43.9%) |
Disability Class by Sex by Age in Orchard Mesa
Disability Class: Hearing Difficulty
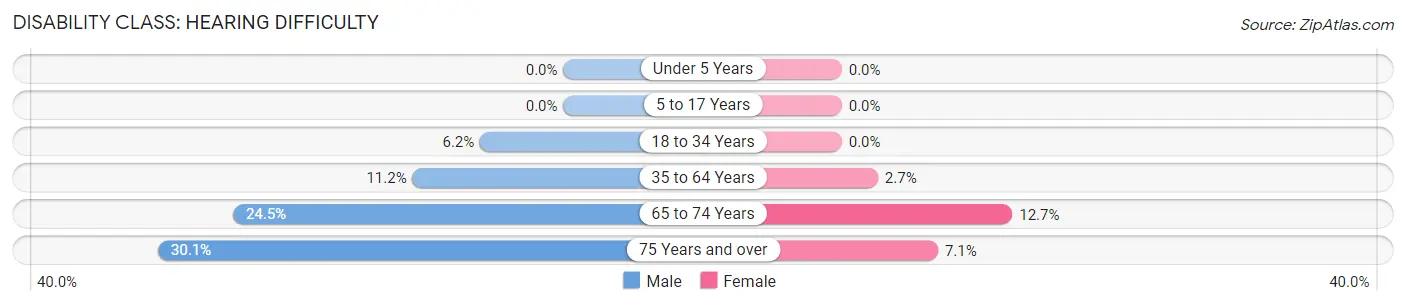
| Age Bracket | Male | Female |
| Under 5 Years | 0 (0.0%) | 0 (0.0%) |
| 5 to 17 Years | 0 (0.0%) | 0 (0.0%) |
| 18 to 34 Years | 32 (6.2%) | 0 (0.0%) |
| 35 to 64 Years | 140 (11.2%) | 43 (2.7%) |
| 65 to 74 Years | 130 (24.5%) | 58 (12.7%) |
| 75 Years and over | 87 (30.1%) | 14 (7.1%) |
Disability Class: Vision Difficulty
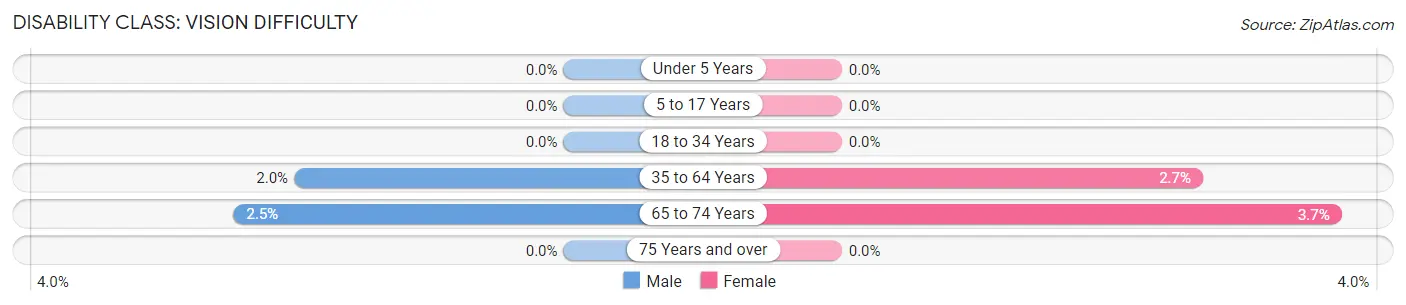
| Age Bracket | Male | Female |
| Under 5 Years | 0 (0.0%) | 0 (0.0%) |
| 5 to 17 Years | 0 (0.0%) | 0 (0.0%) |
| 18 to 34 Years | 0 (0.0%) | 0 (0.0%) |
| 35 to 64 Years | 25 (2.0%) | 43 (2.7%) |
| 65 to 74 Years | 13 (2.5%) | 17 (3.7%) |
| 75 Years and over | 0 (0.0%) | 0 (0.0%) |
Disability Class: Cognitive Difficulty
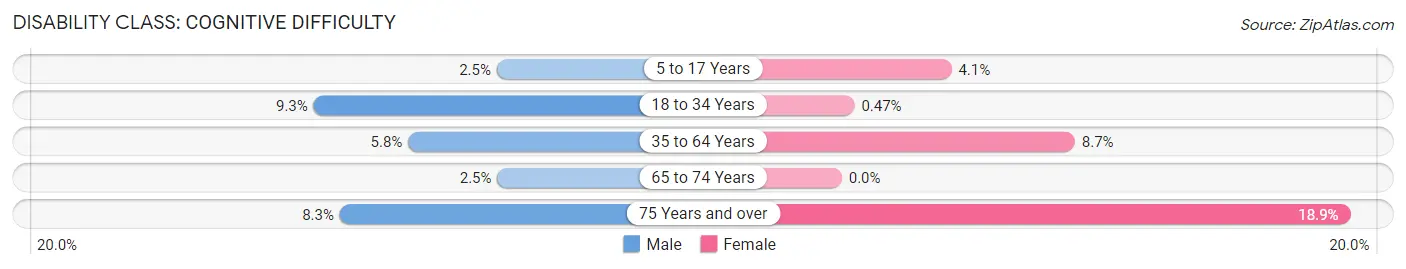
| Age Bracket | Male | Female |
| 5 to 17 Years | 17 (2.5%) | 20 (4.1%) |
| 18 to 34 Years | 48 (9.3%) | 3 (0.5%) |
| 35 to 64 Years | 72 (5.8%) | 139 (8.6%) |
| 65 to 74 Years | 13 (2.5%) | 0 (0.0%) |
| 75 Years and over | 24 (8.3%) | 37 (18.9%) |
Disability Class: Ambulatory Difficulty
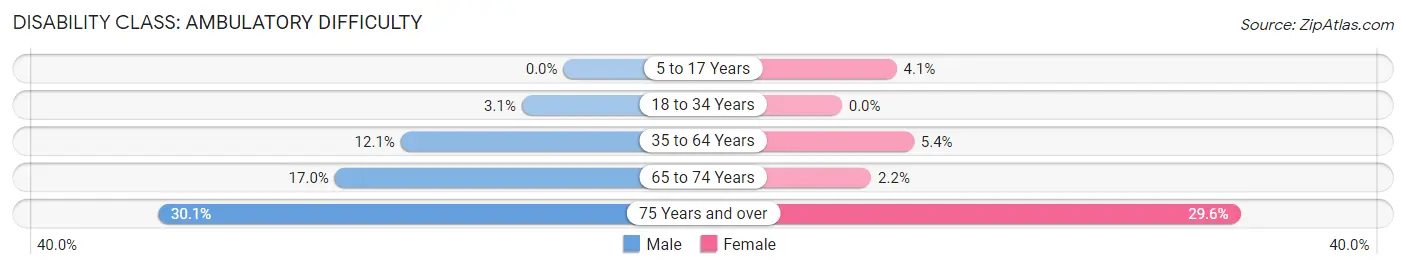
| Age Bracket | Male | Female |
| 5 to 17 Years | 0 (0.0%) | 20 (4.1%) |
| 18 to 34 Years | 16 (3.1%) | 0 (0.0%) |
| 35 to 64 Years | 151 (12.1%) | 86 (5.3%) |
| 65 to 74 Years | 90 (17.0%) | 10 (2.2%) |
| 75 Years and over | 87 (30.1%) | 58 (29.6%) |
Disability Class: Self-Care Difficulty
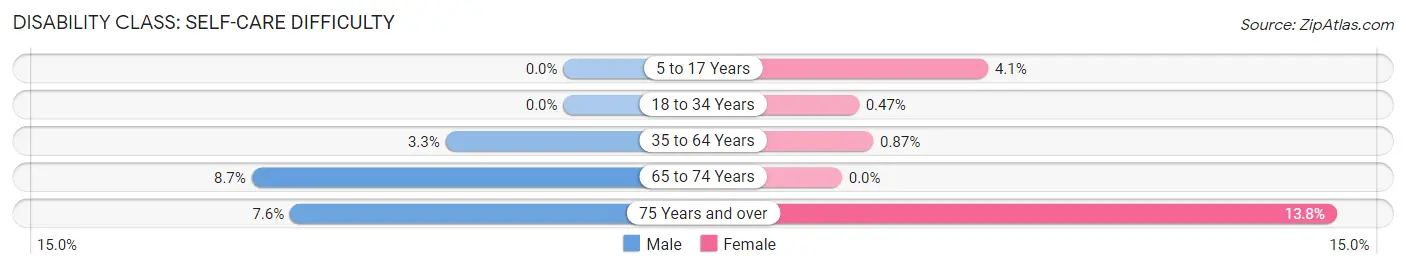
| Age Bracket | Male | Female |
| 5 to 17 Years | 0 (0.0%) | 20 (4.1%) |
| 18 to 34 Years | 0 (0.0%) | 3 (0.5%) |
| 35 to 64 Years | 41 (3.3%) | 14 (0.9%) |
| 65 to 74 Years | 46 (8.7%) | 0 (0.0%) |
| 75 Years and over | 22 (7.6%) | 27 (13.8%) |
Technology Access in Orchard Mesa
Computing Device Access in Orchard Mesa
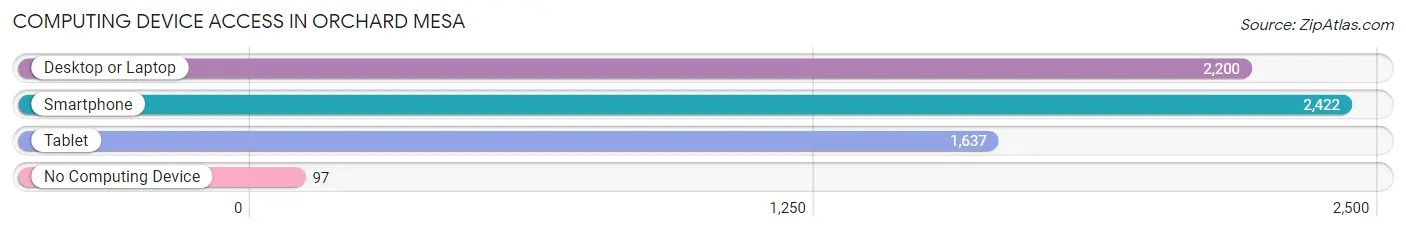
| Device Type | # Households | % Households |
| Desktop or Laptop | 2,200 | 81.9% |
| Smartphone | 2,422 | 90.2% |
| Tablet | 1,637 | 61.0% |
| No Computing Device | 97 | 3.6% |
| Total | 2,685 | 100.0% |
Internet Access in Orchard Mesa
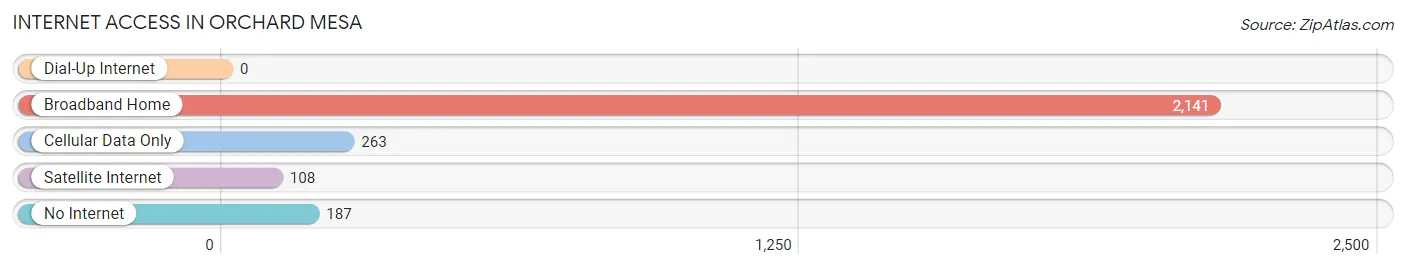
| Internet Type | # Households | % Households |
| Dial-Up Internet | 0 | 0.0% |
| Broadband Home | 2,141 | 79.7% |
| Cellular Data Only | 263 | 9.8% |
| Satellite Internet | 108 | 4.0% |
| No Internet | 187 | 7.0% |
| Total | 2,685 | 100.0% |
Orchard Mesa Summary
Orchard Mesa is a census-designated place (CDP) located in Mesa County, Colorado, United States. The population was 8,945 at the 2010 census. It is located on the western edge of Grand Junction, the county seat and largest city in Mesa County.
History
The area that is now Orchard Mesa was first settled in the late 19th century by homesteaders. The area was originally known as "Orchard Valley" due to the abundance of fruit trees planted by the settlers. The area was annexed by the City of Grand Junction in the early 20th century and was officially named "Orchard Mesa" in the 1950s.
Geography
Orchard Mesa is located at 39°6'17" North, 108°32'45" West (39.104722, -108.545833). It is situated on the western edge of Grand Junction, on the south side of the Colorado River. The CDP has a total area of 4.2 square miles, all of it land.
Economy
Orchard Mesa is primarily a residential area, with most of its residents commuting to work in Grand Junction or other nearby towns. The area is home to several small businesses, including a grocery store, a hardware store, and several restaurants.
Demographics
As of the 2010 census, there were 8,945 people, 3,717 households, and 2,541 families residing in the CDP. The population density was 2,133.3 people per square mile. The racial makeup of the CDP was 87.2% White, 0.7% African American, 1.2% Native American, 0.7% Asian, 0.1% Pacific Islander, 8.2% from other races, and 2.1% from two or more races. Hispanic or Latino of any race were 18.3% of the population.
There were 3,717 households, out of which 28.3% had children under the age of 18 living with them, 51.2% were married couples living together, 11.7% had a female householder with no husband present, and 32.2% were non-families. 25.7% of all households were made up of individuals, and 10.2% had someone living alone who was 65 years of age or older. The average household size was 2.41 and the average family size was 2.88.
In the CDP, the population was spread out, with 23.2% under the age of 18, 8.2% from 18 to 24, 25.2% from 25 to 44, 28.2% from 45 to 64, and 15.2% who were 65 years of age or older. The median age was 40 years. For every 100 females, there were 94.2 males. For every 100 females age 18 and over, there were 91.2 males.
The median income for a household in the CDP was $41,944, and the median income for a family was $48,958. Males had a median income of $35,938 versus $25,917 for females. The per capita income for the CDP was $20,945. About 8.2% of families and 10.3% of the population were below the poverty line, including 14.2% of those under age 18 and 6.2% of those age 65 or over.
Common Questions
What is Per Capita Income in Orchard Mesa?
Per Capita income in Orchard Mesa is $28,305.
What is the Median Family Income in Orchard Mesa?
Median Family Income in Orchard Mesa is $72,624.
What is the Median Household income in Orchard Mesa?
Median Household Income in Orchard Mesa is $64,688.
What is Income or Wage Gap in Orchard Mesa?
Income or Wage Gap in Orchard Mesa is 39.7%.
Women in Orchard Mesa earn 60.3 cents for every dollar earned by a man.
What is Inequality or Gini Index in Orchard Mesa?
Inequality or Gini Index in Orchard Mesa is 0.37.
What is the Total Population of Orchard Mesa?
Total Population of Orchard Mesa is 7,173.
What is the Total Male Population of Orchard Mesa?
Total Male Population of Orchard Mesa is 3,474.
What is the Total Female Population of Orchard Mesa?
Total Female Population of Orchard Mesa is 3,699.
What is the Ratio of Males per 100 Females in Orchard Mesa?
There are 93.92 Males per 100 Females in Orchard Mesa.
What is the Ratio of Females per 100 Males in Orchard Mesa?
There are 106.48 Females per 100 Males in Orchard Mesa.
What is the Median Population Age in Orchard Mesa?
Median Population Age in Orchard Mesa is 42.0 Years.
What is the Average Family Size in Orchard Mesa
Average Family Size in Orchard Mesa is 3.0 People.
What is the Average Household Size in Orchard Mesa
Average Household Size in Orchard Mesa is 2.6 People.
How Large is the Labor Force in Orchard Mesa?
There are 3,267 People in the Labor Forcein in Orchard Mesa.
What is the Percentage of People in the Labor Force in Orchard Mesa?
56.9% of People are in the Labor Force in Orchard Mesa.
What is the Unemployment Rate in Orchard Mesa?
Unemployment Rate in Orchard Mesa is 7.9%.