Orchard City, CO Map & Demographics
Orchard City Map
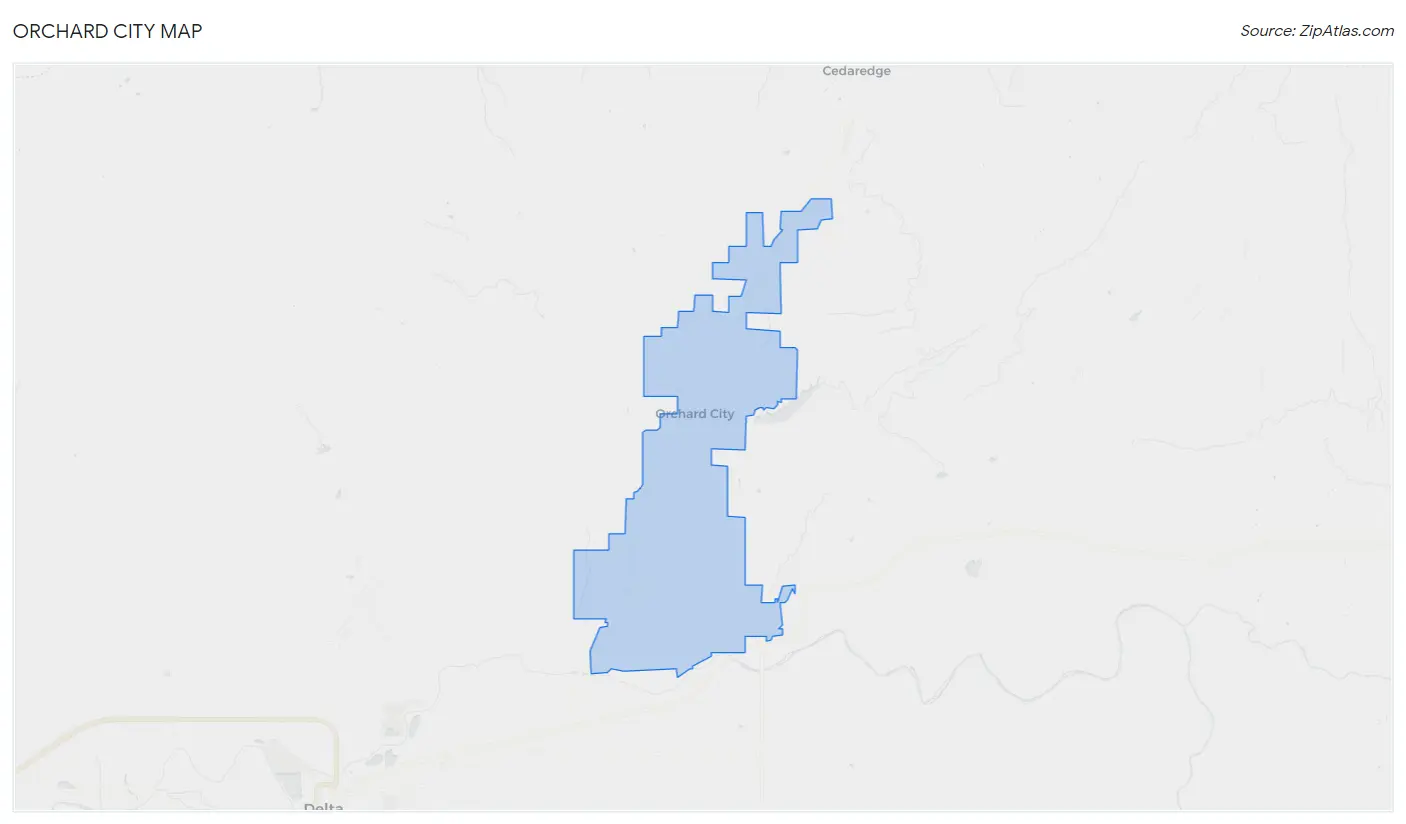
Orchard City Overview
$33,754
PER CAPITA INCOME
$78,636
AVG FAMILY INCOME
$69,556
AVG HOUSEHOLD INCOME
57.3%
WAGE / INCOME GAP [ % ]
42.7¢/ $1
WAGE / INCOME GAP [ $ ]
0.37
INEQUALITY / GINI INDEX
3,150
TOTAL POPULATION
1,453
MALE POPULATION
1,697
FEMALE POPULATION
85.62
MALES / 100 FEMALES
116.79
FEMALES / 100 MALES
52.5
MEDIAN AGE
2.8
AVG FAMILY SIZE
2.4
AVG HOUSEHOLD SIZE
1,570
LABOR FORCE [ PEOPLE ]
57.2%
PERCENT IN LABOR FORCE
4.8%
UNEMPLOYMENT RATE
Orchard City Area Codes
Income in Orchard City
Income Overview in Orchard City
Per Capita Income in Orchard City is $33,754, while median incomes of families and households are $78,636 and $69,556 respectively.
| Characteristic | Number | Measure |
| Per Capita Income | 3,150 | $33,754 |
| Median Family Income | 920 | $78,636 |
| Mean Family Income | 920 | $87,495 |
| Median Household Income | 1,311 | $69,556 |
| Mean Household Income | 1,311 | $79,101 |
| Income Deficit | 920 | $0 |
| Wage / Income Gap (%) | 3,150 | 57.28% |
| Wage / Income Gap ($) | 3,150 | 42.72¢ per $1 |
| Gini / Inequality Index | 3,150 | 0.37 |
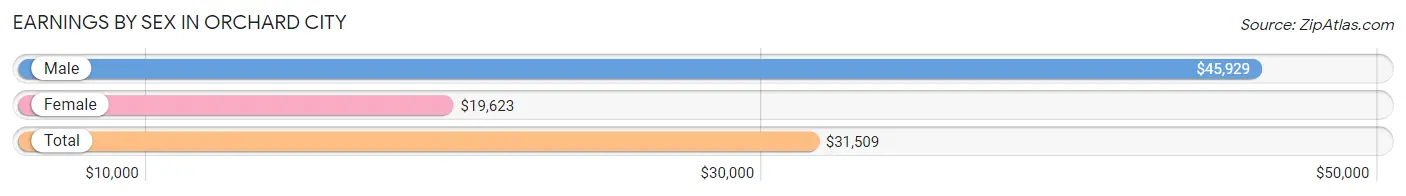
Earnings by Sex in Orchard City
Average Earnings in Orchard City are $31,509, $45,929 for men and $19,623 for women, a difference of 57.3%.
| Sex | Number | Average Earnings |
| Male | 916 (54.6%) | $45,929 |
| Female | 762 (45.4%) | $19,623 |
| Total | 1,678 (100.0%) | $31,509 |
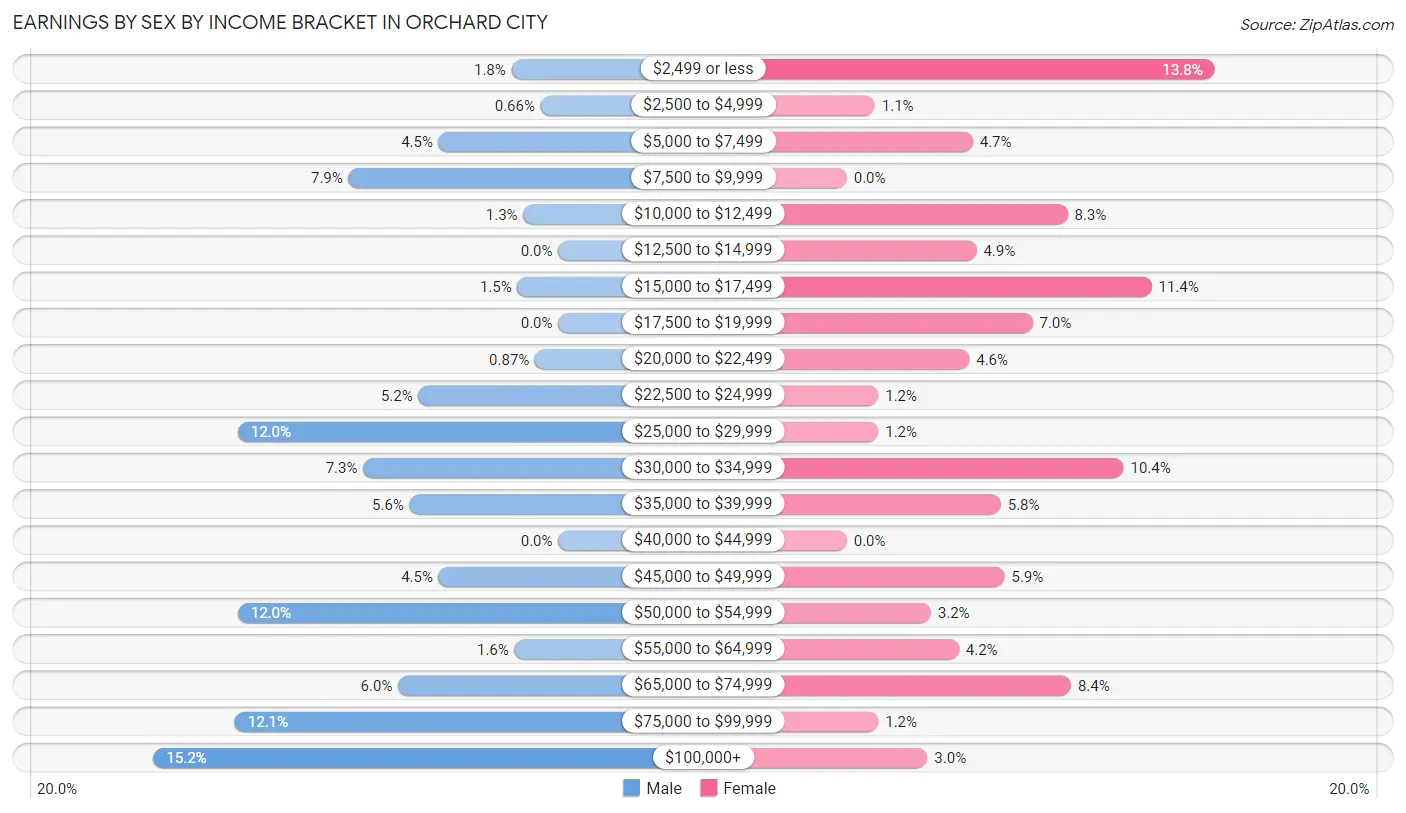
Earnings by Sex by Income Bracket in Orchard City
The most common earnings brackets in Orchard City are $100,000+ for men (139 | 15.2%) and $2,499 or less for women (105 | 13.8%).
| Income | Male | Female |
| $2,499 or less | 16 (1.8%) | 105 (13.8%) |
| $2,500 to $4,999 | 6 (0.7%) | 8 (1.1%) |
| $5,000 to $7,499 | 41 (4.5%) | 36 (4.7%) |
| $7,500 to $9,999 | 72 (7.9%) | 0 (0.0%) |
| $10,000 to $12,499 | 12 (1.3%) | 63 (8.3%) |
| $12,500 to $14,999 | 0 (0.0%) | 37 (4.9%) |
| $15,000 to $17,499 | 14 (1.5%) | 87 (11.4%) |
| $17,500 to $19,999 | 0 (0.0%) | 53 (7.0%) |
| $20,000 to $22,499 | 8 (0.9%) | 35 (4.6%) |
| $22,500 to $24,999 | 48 (5.2%) | 9 (1.2%) |
| $25,000 to $29,999 | 110 (12.0%) | 9 (1.2%) |
| $30,000 to $34,999 | 67 (7.3%) | 79 (10.4%) |
| $35,000 to $39,999 | 51 (5.6%) | 44 (5.8%) |
| $40,000 to $44,999 | 0 (0.0%) | 0 (0.0%) |
| $45,000 to $49,999 | 41 (4.5%) | 45 (5.9%) |
| $50,000 to $54,999 | 110 (12.0%) | 24 (3.2%) |
| $55,000 to $64,999 | 15 (1.6%) | 32 (4.2%) |
| $65,000 to $74,999 | 55 (6.0%) | 64 (8.4%) |
| $75,000 to $99,999 | 111 (12.1%) | 9 (1.2%) |
| $100,000+ | 139 (15.2%) | 23 (3.0%) |
| Total | 916 (100.0%) | 762 (100.0%) |
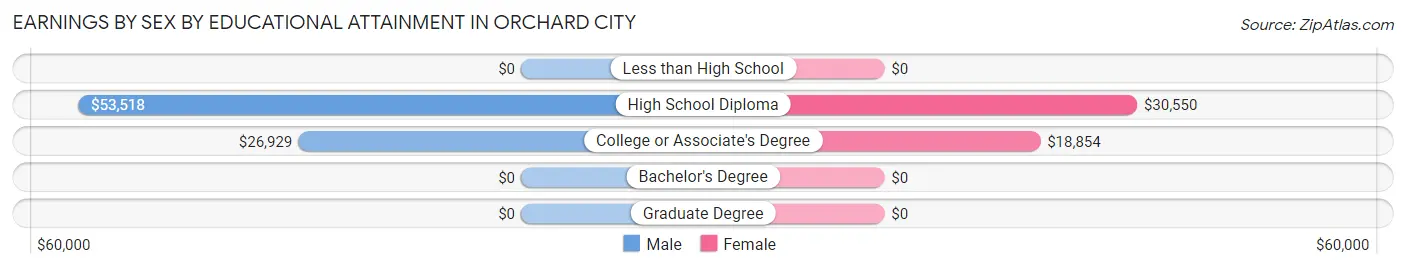
Earnings by Sex by Educational Attainment in Orchard City
Average earnings in Orchard City are $50,682 for men and $20,750 for women, a difference of 59.1%. Men with an educational attainment of high school diploma enjoy the highest average annual earnings of $53,518, while those with college or associate's degree education earn the least with $26,929. Women with an educational attainment of high school diploma earn the most with the average annual earnings of $30,550, while those with college or associate's degree education have the smallest earnings of $18,854.
| Educational Attainment | Male Income | Female Income |
| Less than High School | - | - |
| High School Diploma | $53,518 | $30,550 |
| College or Associate's Degree | $26,929 | $18,854 |
| Bachelor's Degree | - | - |
| Graduate Degree | - | - |
| Total | $50,682 | $20,750 |
Family Income in Orchard City
Family Income Brackets in Orchard City
According to the Orchard City family income data, there are 273 families falling into the $50,000 to $74,999 income range, which is the most common income bracket and makes up 29.7% of all families.
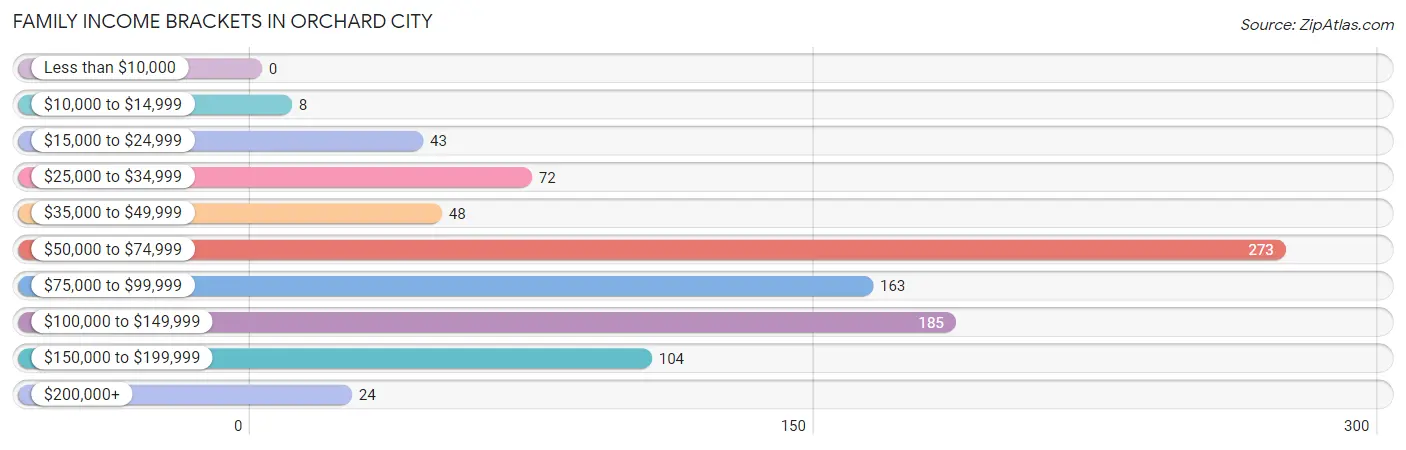
| Income Bracket | # Families | % Families |
| Less than $10,000 | 0 | 0.0% |
| $10,000 to $14,999 | 8 | 0.9% |
| $15,000 to $24,999 | 43 | 4.7% |
| $25,000 to $34,999 | 72 | 7.8% |
| $35,000 to $49,999 | 48 | 5.2% |
| $50,000 to $74,999 | 273 | 29.7% |
| $75,000 to $99,999 | 163 | 17.7% |
| $100,000 to $149,999 | 185 | 20.1% |
| $150,000 to $199,999 | 104 | 11.3% |
| $200,000+ | 24 | 2.6% |
Family Income by Famaliy Size in Orchard City
3-person families (59 | 6.4%) account for the highest median family income in Orchard City with $86,635 per family, while 2-person families (610 | 66.3%) have the highest median income of $39,375 per family member.
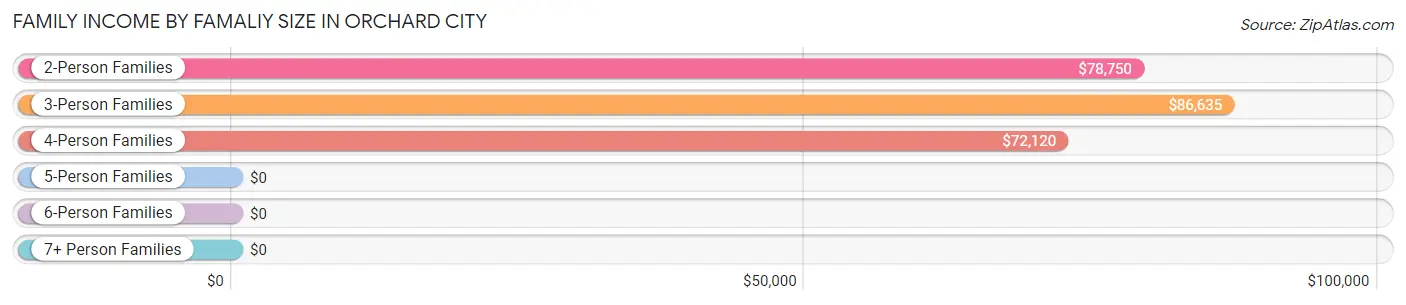
| Income Bracket | # Families | Median Income |
| 2-Person Families | 610 (66.3%) | $78,750 |
| 3-Person Families | 59 (6.4%) | $86,635 |
| 4-Person Families | 125 (13.6%) | $72,120 |
| 5-Person Families | 100 (10.9%) | $0 |
| 6-Person Families | 26 (2.8%) | $0 |
| 7+ Person Families | 0 (0.0%) | $0 |
| Total | 920 (100.0%) | $78,636 |
Family Income by Number of Earners in Orchard City
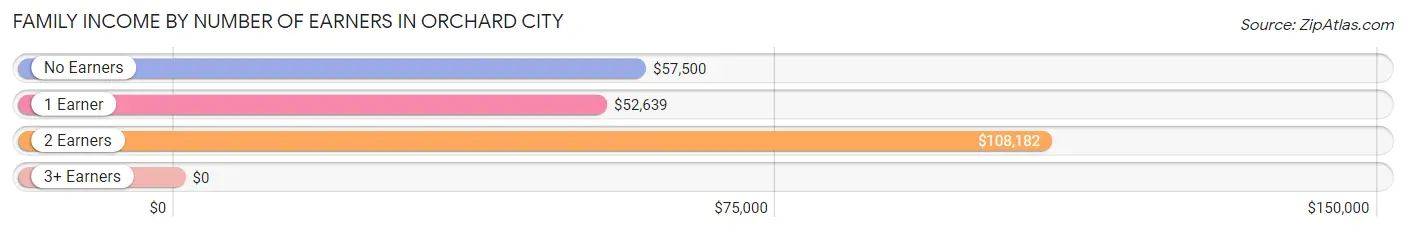
| Number of Earners | # Families | Median Income |
| No Earners | 228 (24.8%) | $57,500 |
| 1 Earner | 177 (19.2%) | $52,639 |
| 2 Earners | 470 (51.1%) | $108,182 |
| 3+ Earners | 45 (4.9%) | $0 |
| Total | 920 (100.0%) | $78,636 |
Household Income in Orchard City
Household Income Brackets in Orchard City
With 326 households falling in the category, the $50,000 to $74,999 income range is the most frequent in Orchard City, accounting for 24.9% of all households. In contrast, only 33 households (2.5%) fall into the $10,000 to $14,999 income bracket, making it the least populous group.
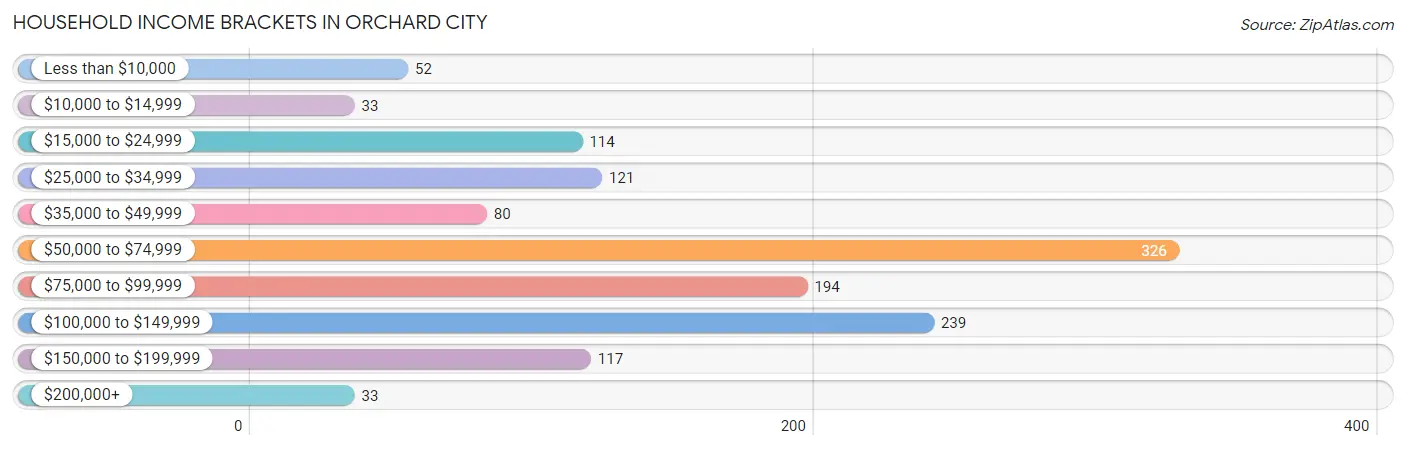
| Income Bracket | # Households | % Households |
| Less than $10,000 | 52 | 4.0% |
| $10,000 to $14,999 | 33 | 2.5% |
| $15,000 to $24,999 | 114 | 8.7% |
| $25,000 to $34,999 | 121 | 9.2% |
| $35,000 to $49,999 | 80 | 6.1% |
| $50,000 to $74,999 | 326 | 24.9% |
| $75,000 to $99,999 | 194 | 14.8% |
| $100,000 to $149,999 | 239 | 18.2% |
| $150,000 to $199,999 | 117 | 8.9% |
| $200,000+ | 33 | 2.5% |
Household Income by Householder Age in Orchard City
The median household income in Orchard City is $69,556, with the highest median household income of $87,500 found in the 45 to 64 years age bracket for the primary householder. A total of 516 households (39.4%) fall into this category.
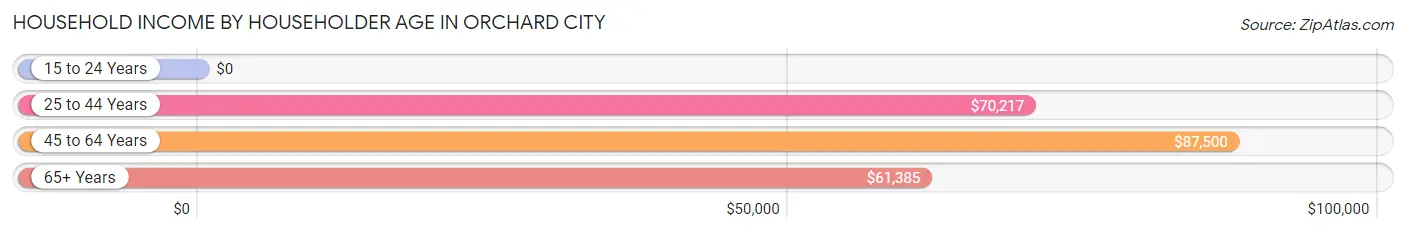
| Income Bracket | # Households | Median Income |
| 15 to 24 Years | 0 (0.0%) | $0 |
| 25 to 44 Years | 320 (24.4%) | $70,217 |
| 45 to 64 Years | 516 (39.4%) | $87,500 |
| 65+ Years | 475 (36.2%) | $61,385 |
| Total | 1,311 (100.0%) | $69,556 |
Poverty in Orchard City
Income Below Poverty by Sex and Age in Orchard City
With 15.4% poverty level for males and 17.0% for females among the residents of Orchard City, 18 to 24 year old males and 15 year old females are the most vulnerable to poverty, with 56 males (53.8%) and 7 females (100.0%) in their respective age groups living below the poverty level.
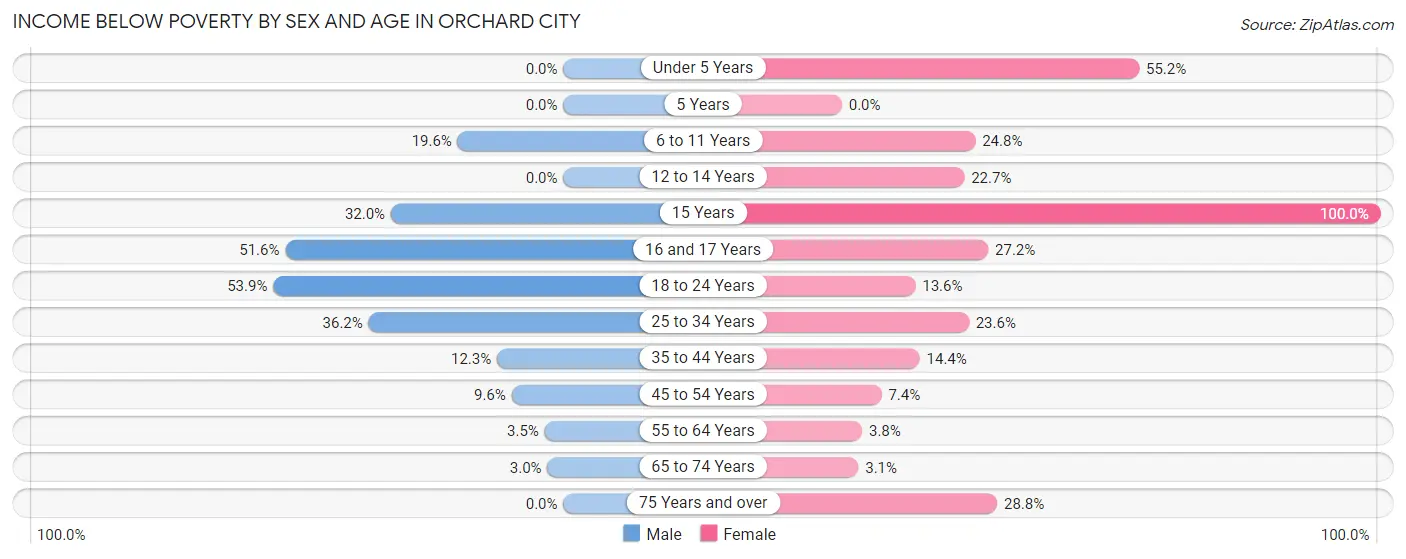
| Age Bracket | Male | Female |
| Under 5 Years | 0 (0.0%) | 32 (55.2%) |
| 5 Years | 0 (0.0%) | 0 (0.0%) |
| 6 to 11 Years | 10 (19.6%) | 27 (24.8%) |
| 12 to 14 Years | 0 (0.0%) | 15 (22.7%) |
| 15 Years | 16 (32.0%) | 7 (100.0%) |
| 16 and 17 Years | 16 (51.6%) | 22 (27.2%) |
| 18 to 24 Years | 56 (53.8%) | 6 (13.6%) |
| 25 to 34 Years | 77 (36.1%) | 45 (23.6%) |
| 35 to 44 Years | 16 (12.3%) | 27 (14.4%) |
| 45 to 54 Years | 12 (9.6%) | 17 (7.4%) |
| 55 to 64 Years | 10 (3.5%) | 8 (3.8%) |
| 65 to 74 Years | 8 (2.9%) | 7 (3.1%) |
| 75 Years and over | 0 (0.0%) | 66 (28.8%) |
| Total | 221 (15.4%) | 279 (17.0%) |
Income Above Poverty by Sex and Age in Orchard City
According to the poverty statistics in Orchard City, males aged under 5 years and females aged 65 to 74 years are the age groups that are most secure financially, with 100.0% of males and 96.9% of females in these age groups living above the poverty line.
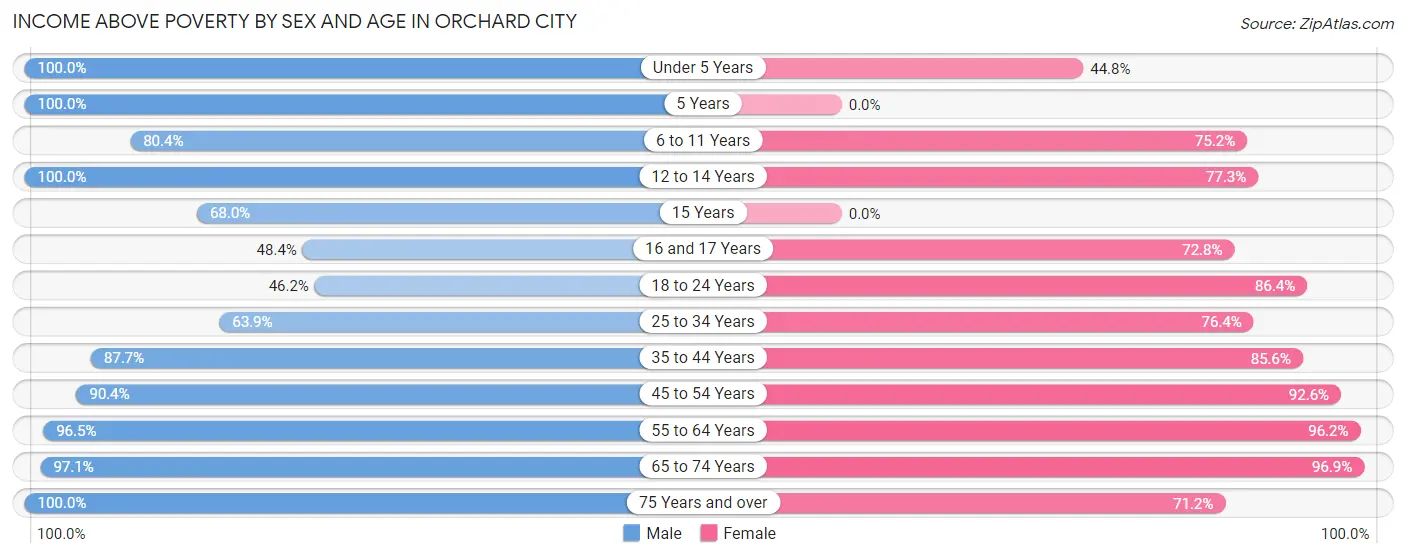
| Age Bracket | Male | Female |
| Under 5 Years | 40 (100.0%) | 26 (44.8%) |
| 5 Years | 14 (100.0%) | 0 (0.0%) |
| 6 to 11 Years | 41 (80.4%) | 82 (75.2%) |
| 12 to 14 Years | 10 (100.0%) | 51 (77.3%) |
| 15 Years | 34 (68.0%) | 0 (0.0%) |
| 16 and 17 Years | 15 (48.4%) | 59 (72.8%) |
| 18 to 24 Years | 48 (46.2%) | 38 (86.4%) |
| 25 to 34 Years | 136 (63.8%) | 146 (76.4%) |
| 35 to 44 Years | 114 (87.7%) | 160 (85.6%) |
| 45 to 54 Years | 113 (90.4%) | 214 (92.6%) |
| 55 to 64 Years | 279 (96.5%) | 205 (96.2%) |
| 65 to 74 Years | 263 (97.1%) | 222 (96.9%) |
| 75 Years and over | 110 (100.0%) | 163 (71.2%) |
| Total | 1,217 (84.6%) | 1,366 (83.0%) |
Income Below Poverty Among Married-Couple Families in Orchard City
The poverty statistics for married-couple families in Orchard City show that 3.5% or 26 of the total 739 families live below the poverty line. Families with 1 or 2 children have the highest poverty rate of 13.8%, comprising of 16 families. On the other hand, families with no children have the lowest poverty rate of 0.0%, which includes 0 families.
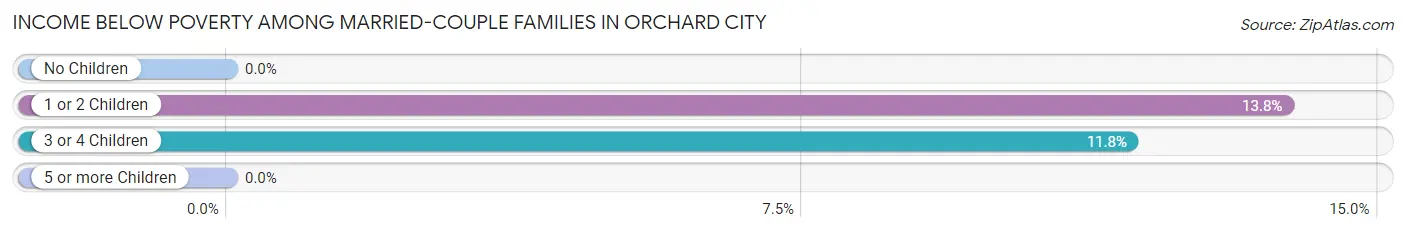
| Children | Above Poverty | Below Poverty |
| No Children | 538 (100.0%) | 0 (0.0%) |
| 1 or 2 Children | 100 (86.2%) | 16 (13.8%) |
| 3 or 4 Children | 75 (88.2%) | 10 (11.8%) |
| 5 or more Children | 0 (0.0%) | 0 (0.0%) |
| Total | 713 (96.5%) | 26 (3.5%) |
Income Below Poverty Among Single-Parent Households in Orchard City
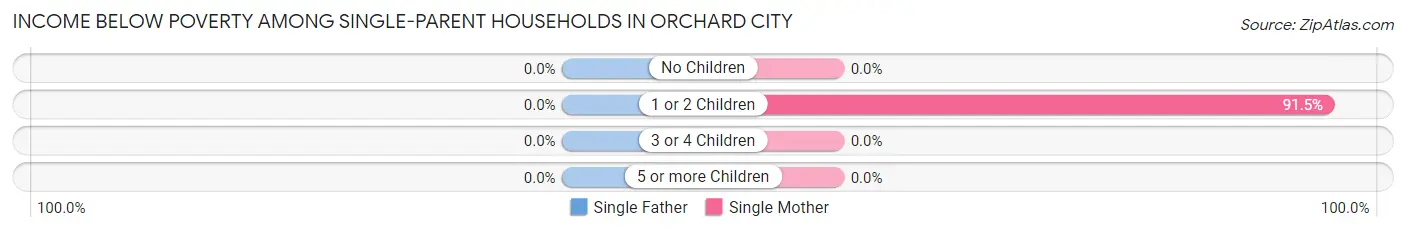
| Children | Single Father | Single Mother |
| No Children | 0 (0.0%) | 0 (0.0%) |
| 1 or 2 Children | 0 (0.0%) | 43 (91.5%) |
| 3 or 4 Children | 0 (0.0%) | 0 (0.0%) |
| 5 or more Children | 0 (0.0%) | 0 (0.0%) |
| Total | 0 (0.0%) | 43 (47.8%) |
Income Below Poverty Among Married-Couple vs Single-Parent Households in Orchard City
The poverty data for Orchard City shows that 26 of the married-couple family households (3.5%) and 43 of the single-parent households (23.8%) are living below the poverty level. Within the married-couple family households, those with 1 or 2 children have the highest poverty rate, with 16 households (13.8%) falling below the poverty line. Among the single-parent households, those with 1 or 2 children have the highest poverty rate, with 43 household (91.5%) living below poverty.
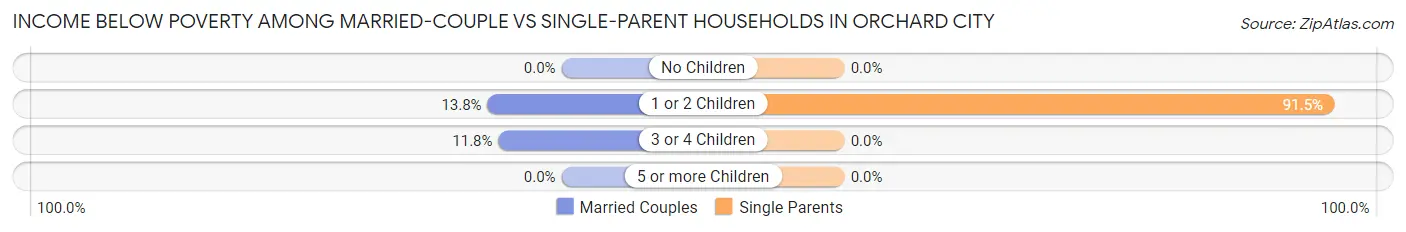
| Children | Married-Couple Families | Single-Parent Households |
| No Children | 0 (0.0%) | 0 (0.0%) |
| 1 or 2 Children | 16 (13.8%) | 43 (91.5%) |
| 3 or 4 Children | 10 (11.8%) | 0 (0.0%) |
| 5 or more Children | 0 (0.0%) | 0 (0.0%) |
| Total | 26 (3.5%) | 43 (23.8%) |
Race in Orchard City
The most populous races in Orchard City are White / Caucasian (2,983 | 94.7%), Hispanic or Latino (208 | 6.6%), and Two or more Races (108 | 3.4%).
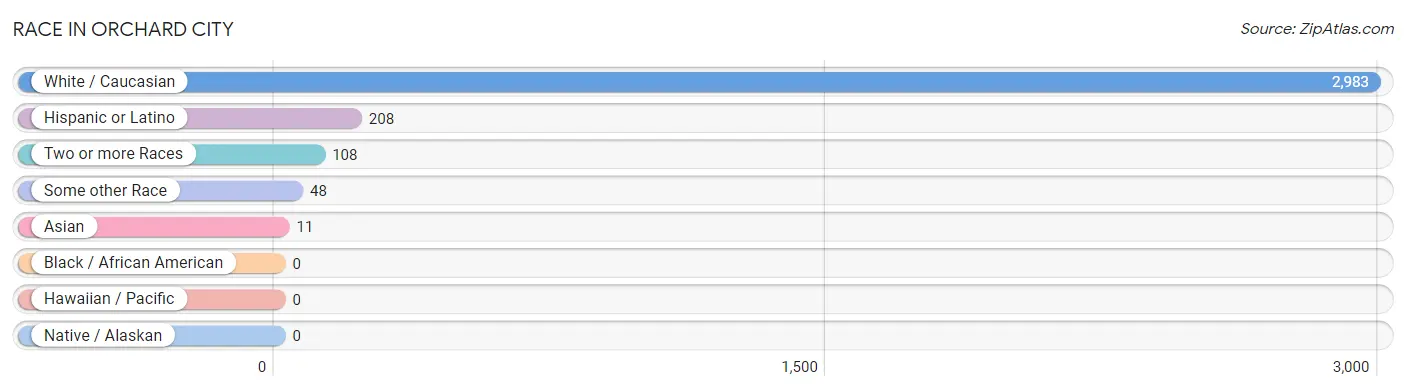
| Race | # Population | % Population |
| Asian | 11 | 0.4% |
| Black / African American | 0 | 0.0% |
| Hawaiian / Pacific | 0 | 0.0% |
| Hispanic or Latino | 208 | 6.6% |
| Native / Alaskan | 0 | 0.0% |
| White / Caucasian | 2,983 | 94.7% |
| Two or more Races | 108 | 3.4% |
| Some other Race | 48 | 1.5% |
| Total | 3,150 | 100.0% |
Ancestry in Orchard City
The most populous ancestries reported in Orchard City are German (961 | 30.5%), English (602 | 19.1%), Irish (470 | 14.9%), French (189 | 6.0%), and Mexican (167 | 5.3%), together accounting for 75.8% of all Orchard City residents.
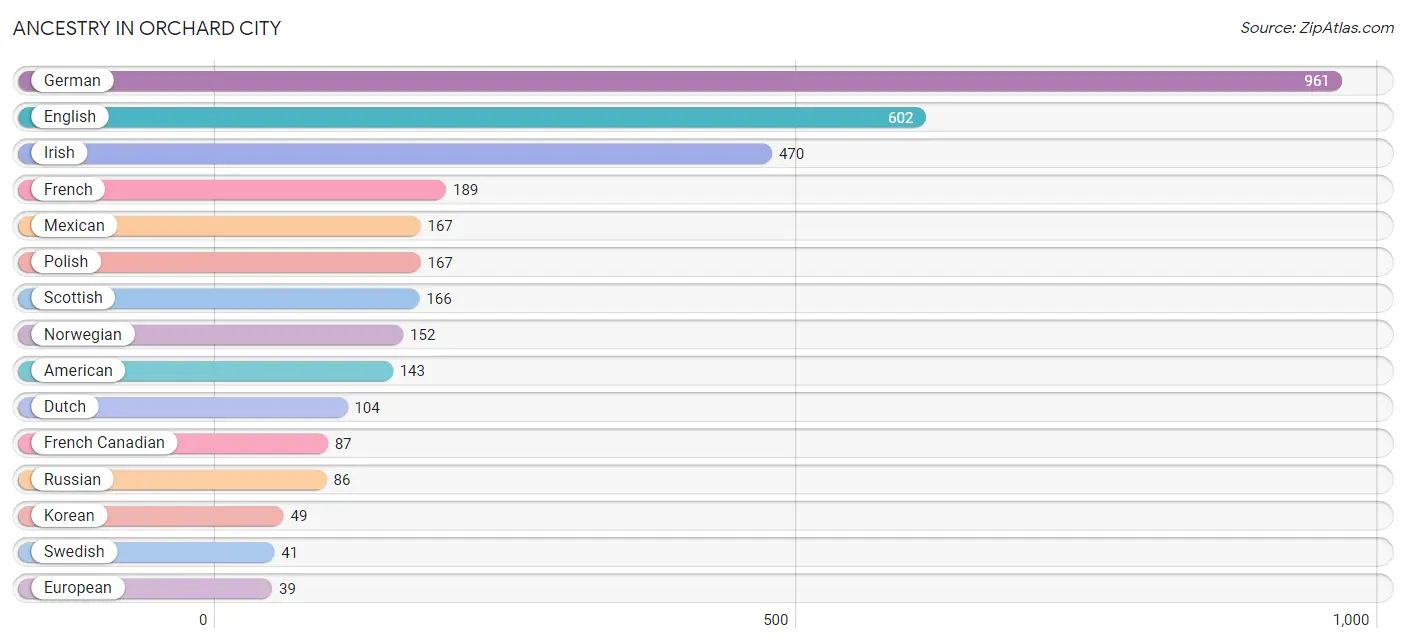
| Ancestry | # Population | % Population |
| American | 143 | 4.5% |
| Bhutanese | 18 | 0.6% |
| British | 7 | 0.2% |
| Cherokee | 18 | 0.6% |
| Czech | 9 | 0.3% |
| Danish | 21 | 0.7% |
| Dutch | 104 | 3.3% |
| English | 602 | 19.1% |
| European | 39 | 1.2% |
| French | 189 | 6.0% |
| French Canadian | 87 | 2.8% |
| German | 961 | 30.5% |
| Irish | 470 | 14.9% |
| Italian | 25 | 0.8% |
| Korean | 49 | 1.6% |
| Mexican | 167 | 5.3% |
| Northern European | 7 | 0.2% |
| Norwegian | 152 | 4.8% |
| Polish | 167 | 5.3% |
| Russian | 86 | 2.7% |
| Scandinavian | 22 | 0.7% |
| Scotch-Irish | 9 | 0.3% |
| Scottish | 166 | 5.3% |
| Spaniard | 22 | 0.7% |
| Swedish | 41 | 1.3% |
| Welsh | 8 | 0.3% | View All 26 Rows |
Immigrants in Orchard City
The most numerous immigrant groups reported in Orchard City came from Central America (68 | 2.2%), Latin America (68 | 2.2%), Mexico (68 | 2.2%), England (16 | 0.5%), and Europe (16 | 0.5%), together accounting for 7.5% of all Orchard City residents.
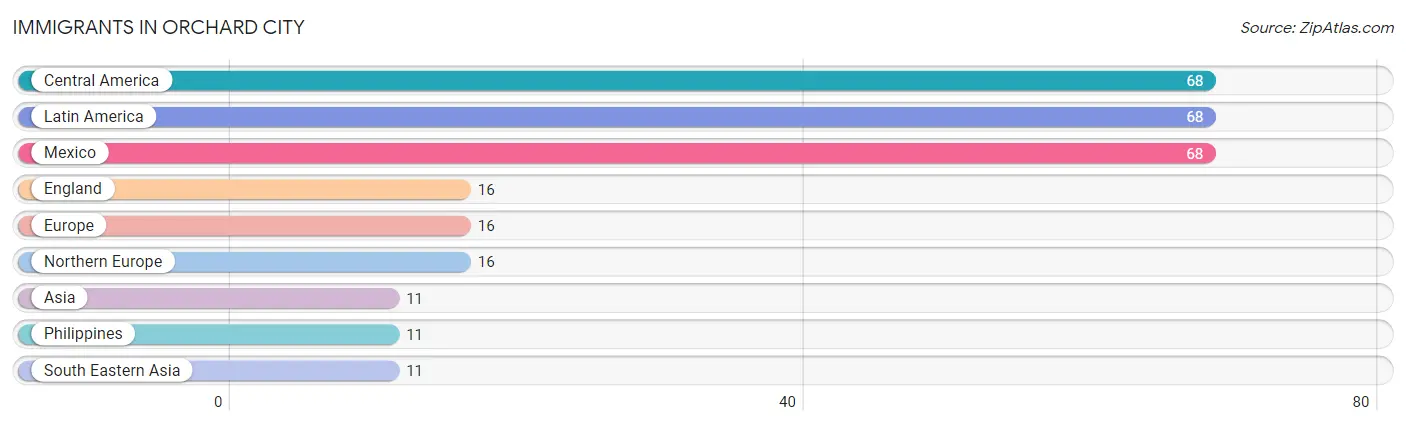
| Immigration Origin | # Population | % Population |
| Asia | 11 | 0.4% |
| Central America | 68 | 2.2% |
| England | 16 | 0.5% |
| Europe | 16 | 0.5% |
| Latin America | 68 | 2.2% |
| Mexico | 68 | 2.2% |
| Northern Europe | 16 | 0.5% |
| Philippines | 11 | 0.4% |
| South Eastern Asia | 11 | 0.4% | View All 9 Rows |
Sex and Age in Orchard City
Sex and Age in Orchard City
The most populous age groups in Orchard City are 70 to 74 Years (215 | 14.8%) for men and 50 to 54 Years (186 | 11.0%) for women.
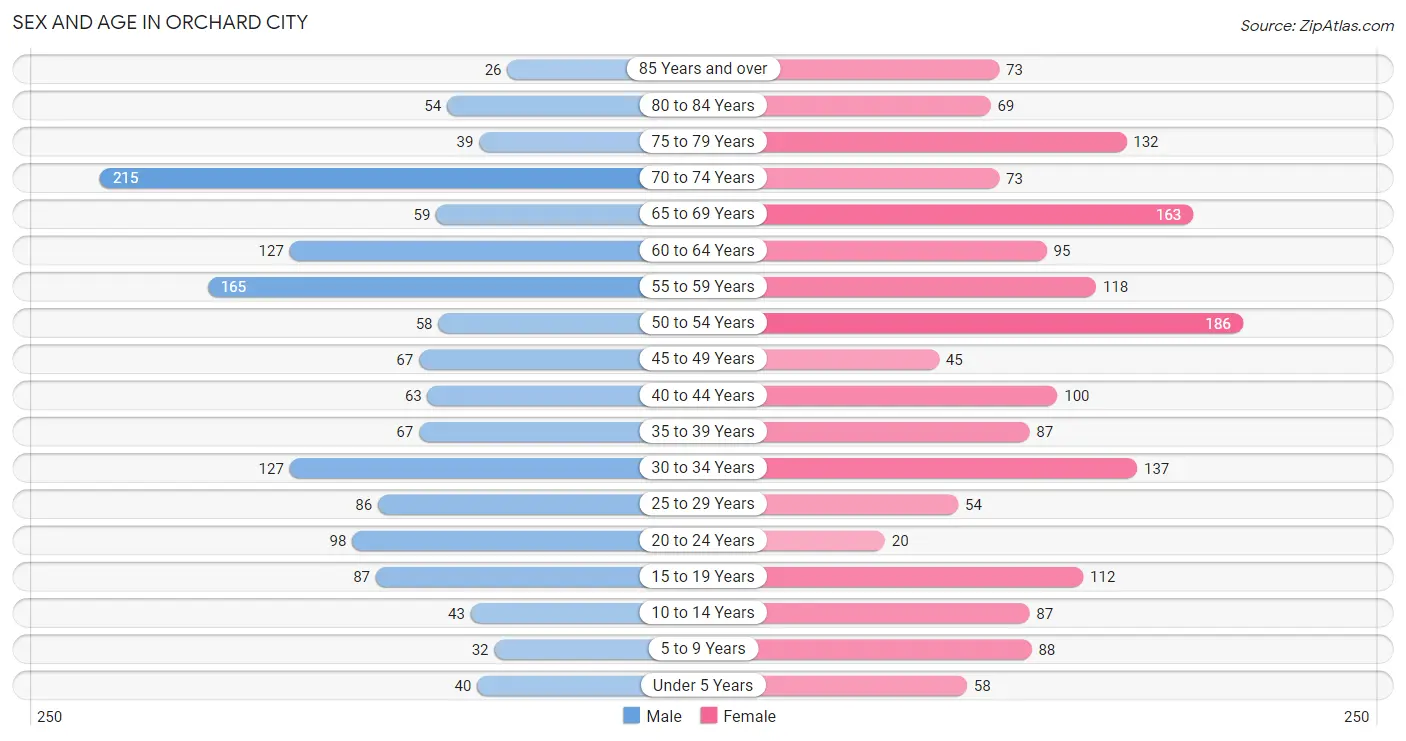
| Age Bracket | Male | Female |
| Under 5 Years | 40 (2.8%) | 58 (3.4%) |
| 5 to 9 Years | 32 (2.2%) | 88 (5.2%) |
| 10 to 14 Years | 43 (3.0%) | 87 (5.1%) |
| 15 to 19 Years | 87 (6.0%) | 112 (6.6%) |
| 20 to 24 Years | 98 (6.7%) | 20 (1.2%) |
| 25 to 29 Years | 86 (5.9%) | 54 (3.2%) |
| 30 to 34 Years | 127 (8.7%) | 137 (8.1%) |
| 35 to 39 Years | 67 (4.6%) | 87 (5.1%) |
| 40 to 44 Years | 63 (4.3%) | 100 (5.9%) |
| 45 to 49 Years | 67 (4.6%) | 45 (2.6%) |
| 50 to 54 Years | 58 (4.0%) | 186 (11.0%) |
| 55 to 59 Years | 165 (11.4%) | 118 (7.0%) |
| 60 to 64 Years | 127 (8.7%) | 95 (5.6%) |
| 65 to 69 Years | 59 (4.1%) | 163 (9.6%) |
| 70 to 74 Years | 215 (14.8%) | 73 (4.3%) |
| 75 to 79 Years | 39 (2.7%) | 132 (7.8%) |
| 80 to 84 Years | 54 (3.7%) | 69 (4.1%) |
| 85 Years and over | 26 (1.8%) | 73 (4.3%) |
| Total | 1,453 (100.0%) | 1,697 (100.0%) |
Families and Households in Orchard City
Median Family Size in Orchard City
The median family size in Orchard City is 2.76 persons per family, with single male/father families (91 | 9.9%) accounting for the largest median family size of 2.95 persons per family. On the other hand, married-couple families (739 | 80.3%) represent the smallest median family size with 2.73 persons per family.
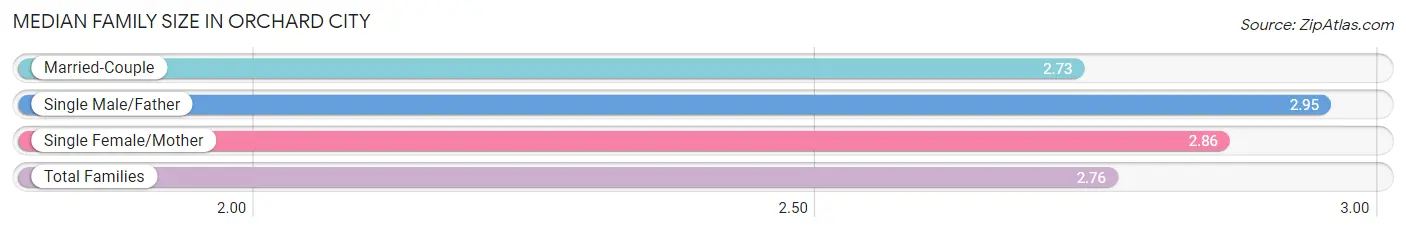
| Family Type | # Families | Family Size |
| Married-Couple | 739 (80.3%) | 2.73 |
| Single Male/Father | 91 (9.9%) | 2.95 |
| Single Female/Mother | 90 (9.8%) | 2.86 |
| Total Families | 920 (100.0%) | 2.76 |
Median Household Size in Orchard City
The median household size in Orchard City is 2.35 persons per household, with single male/father households (91 | 6.9%) accounting for the largest median household size of 3.04 persons per household. non-family households (391 | 29.8%) represent the smallest median household size with 1.33 persons per household.
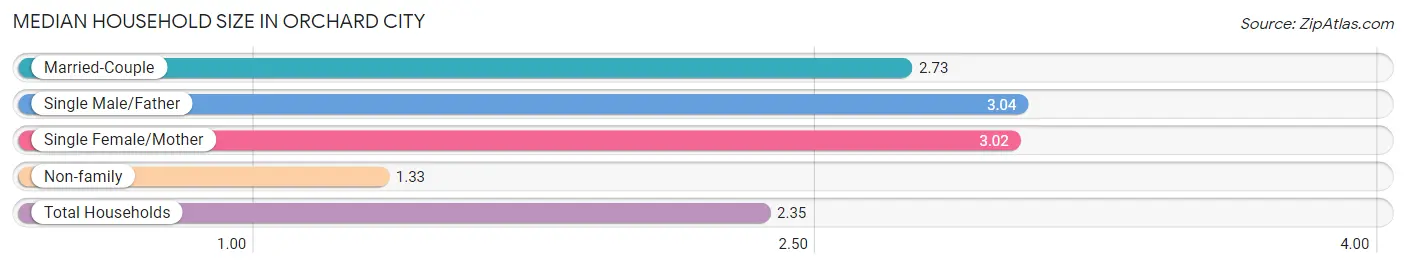
| Household Type | # Households | Household Size |
| Married-Couple | 739 (56.4%) | 2.73 |
| Single Male/Father | 91 (6.9%) | 3.04 |
| Single Female/Mother | 90 (6.9%) | 3.02 |
| Non-family | 391 (29.8%) | 1.33 |
| Total Households | 1,311 (100.0%) | 2.35 |
Household Size by Marriage Status in Orchard City
Out of a total of 1,311 households in Orchard City, 920 (70.2%) are family households, while 391 (29.8%) are nonfamily households. The most numerous type of family households are 2-person households, comprising 597, and the most common type of nonfamily households are 1-person households, comprising 310.
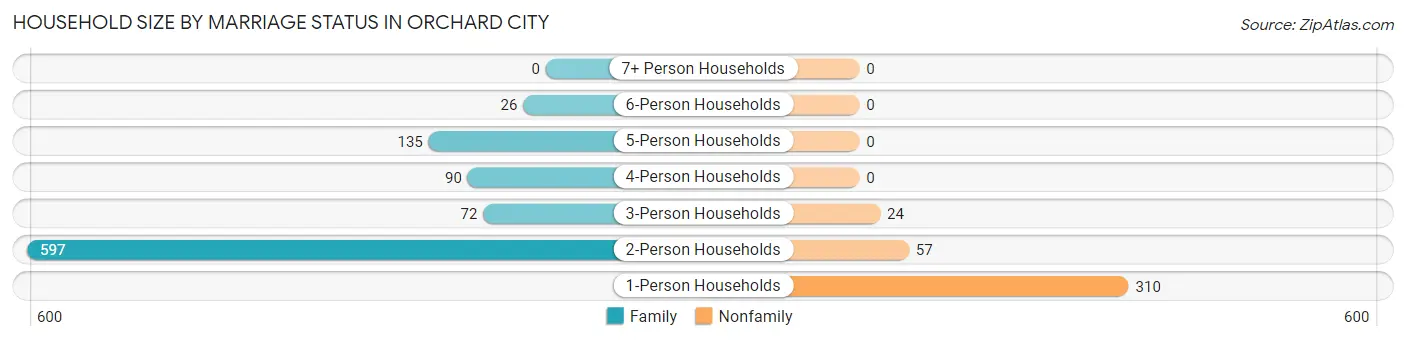
| Household Size | Family Households | Nonfamily Households |
| 1-Person Households | - | 310 (23.6%) |
| 2-Person Households | 597 (45.5%) | 57 (4.3%) |
| 3-Person Households | 72 (5.5%) | 24 (1.8%) |
| 4-Person Households | 90 (6.9%) | 0 (0.0%) |
| 5-Person Households | 135 (10.3%) | 0 (0.0%) |
| 6-Person Households | 26 (2.0%) | 0 (0.0%) |
| 7+ Person Households | 0 (0.0%) | 0 (0.0%) |
| Total | 920 (70.2%) | 391 (29.8%) |
Female Fertility in Orchard City
Fertility by Age in Orchard City
Average fertility rate in Orchard City is 18.0 births per 1,000 women. Women in the age bracket of 20 to 34 years have the highest fertility rate with 47.0 births per 1,000 women. Women in the age bracket of 20 to 34 years acount for 100.0% of all women with births.
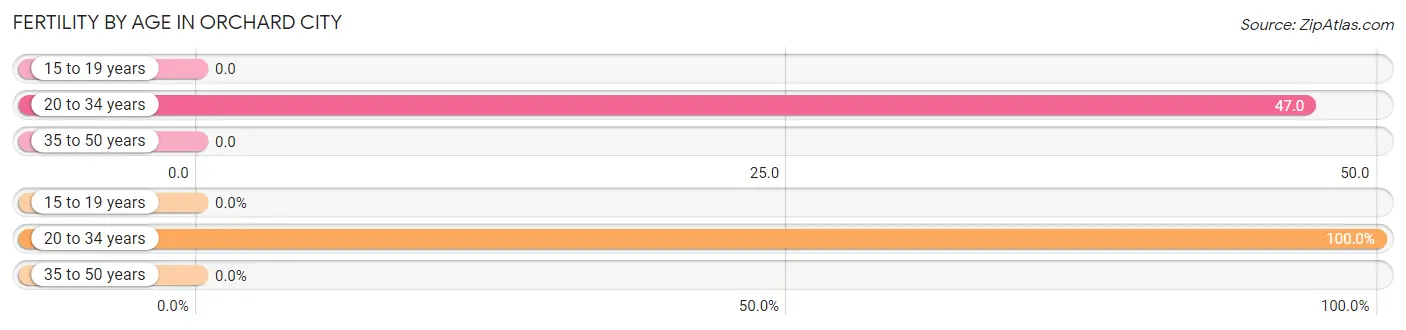
| Age Bracket | Women with Births | Births / 1,000 Women |
| 15 to 19 years | 0 (0.0%) | 0.0 |
| 20 to 34 years | 10 (100.0%) | 47.0 |
| 35 to 50 years | 0 (0.0%) | 0.0 |
| Total | 10 (100.0%) | 18.0 |
Fertility by Age by Marriage Status in Orchard City
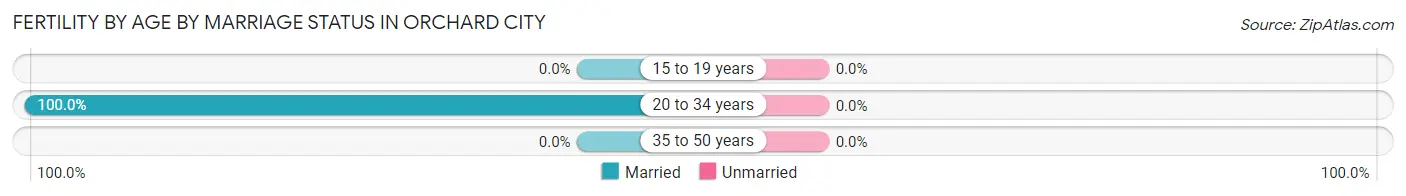
| Age Bracket | Married | Unmarried |
| 15 to 19 years | 0 (0.0%) | 0 (0.0%) |
| 20 to 34 years | 10 (100.0%) | 0 (0.0%) |
| 35 to 50 years | 0 (0.0%) | 0 (0.0%) |
| Total | 10 (100.0%) | 0 (0.0%) |
Fertility by Education in Orchard City
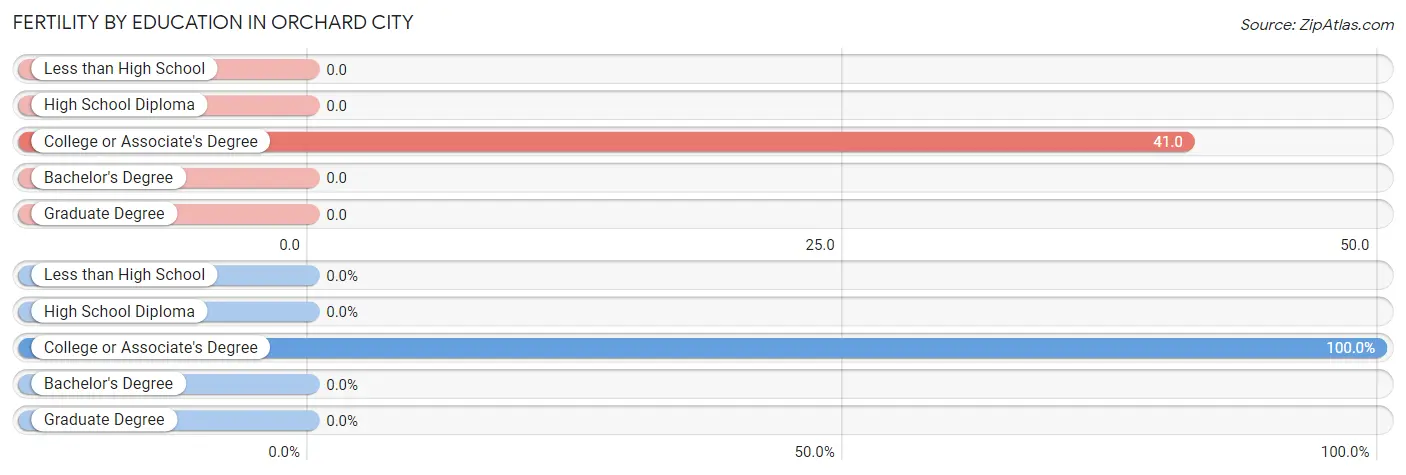
| Educational Attainment | Women with Births | Births / 1,000 Women |
| Less than High School | 0 (0.0%) | 0.0 |
| High School Diploma | 0 (0.0%) | 0.0 |
| College or Associate's Degree | 10 (100.0%) | 41.0 |
| Bachelor's Degree | 0 (0.0%) | 0.0 |
| Graduate Degree | 0 (0.0%) | 0.0 |
| Total | 10 (100.0%) | 18.0 |
Fertility by Education by Marriage Status in Orchard City
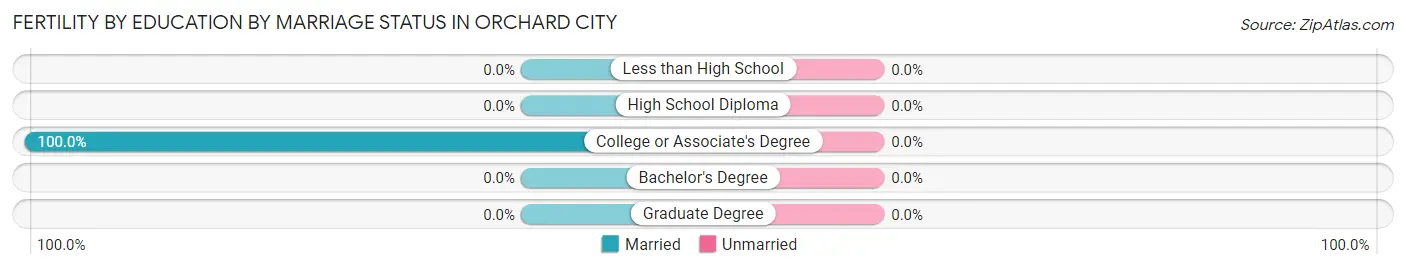
| Educational Attainment | Married | Unmarried |
| Less than High School | 0 (0.0%) | 0 (0.0%) |
| High School Diploma | 0 (0.0%) | 0 (0.0%) |
| College or Associate's Degree | 10 (100.0%) | 0 (0.0%) |
| Bachelor's Degree | 0 (0.0%) | 0 (0.0%) |
| Graduate Degree | 0 (0.0%) | 0 (0.0%) |
| Total | 10 (100.0%) | 0 (0.0%) |
Employment Characteristics in Orchard City
Employment by Class of Employer in Orchard City
Among the 1,483 employed individuals in Orchard City, private company employees (1,078 | 72.7%), self-employed (not incorporated) (138 | 9.3%), and local government employees (132 | 8.9%) make up the most common classes of employment.
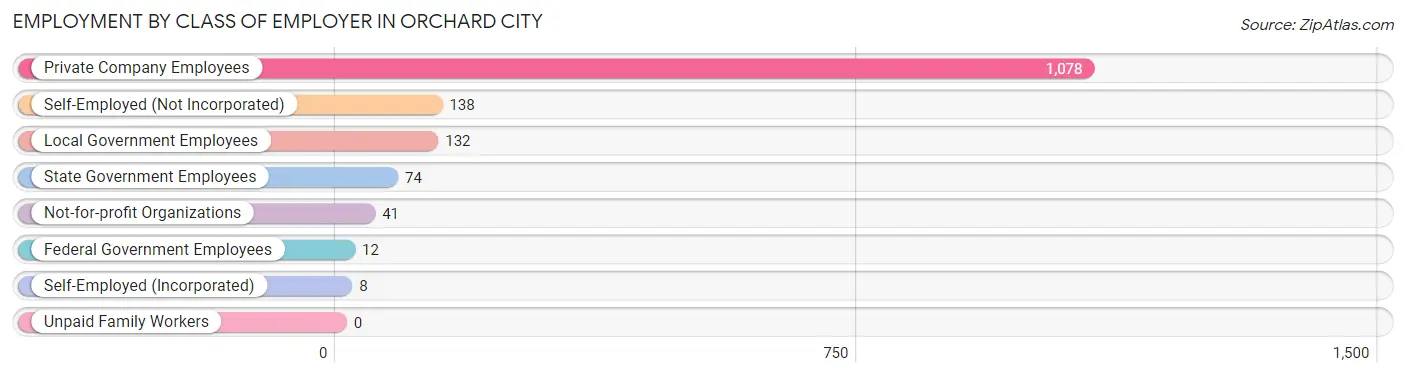
| Employer Class | # Employees | % Employees |
| Private Company Employees | 1,078 | 72.7% |
| Self-Employed (Incorporated) | 8 | 0.5% |
| Self-Employed (Not Incorporated) | 138 | 9.3% |
| Not-for-profit Organizations | 41 | 2.8% |
| Local Government Employees | 132 | 8.9% |
| State Government Employees | 74 | 5.0% |
| Federal Government Employees | 12 | 0.8% |
| Unpaid Family Workers | 0 | 0.0% |
| Total | 1,483 | 100.0% |
Employment Status by Age in Orchard City
According to the labor force statistics for Orchard City, out of the total population over 16 years of age (2,745), 57.2% or 1,570 individuals are in the labor force, with 4.8% or 75 of them unemployed. The age group with the highest labor force participation rate is 25 to 29 years, with 100.0% or 140 individuals in the labor force. Within the labor force, the 25 to 29 years age range has the highest percentage of unemployed individuals, with 29.3% or 41 of them being unemployed.
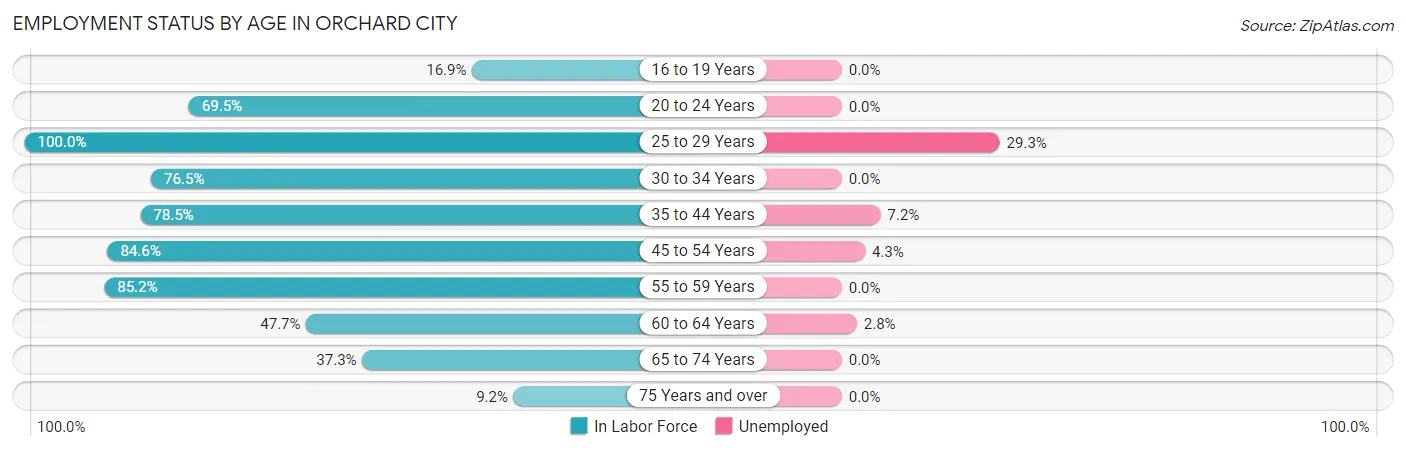
| Age Bracket | In Labor Force | Unemployed |
| 16 to 19 Years | 24 (16.9%) | 0 (0.0%) |
| 20 to 24 Years | 82 (69.5%) | 0 (0.0%) |
| 25 to 29 Years | 140 (100.0%) | 41 (29.3%) |
| 30 to 34 Years | 202 (76.5%) | 0 (0.0%) |
| 35 to 44 Years | 249 (78.5%) | 18 (7.2%) |
| 45 to 54 Years | 301 (84.6%) | 13 (4.3%) |
| 55 to 59 Years | 241 (85.2%) | 0 (0.0%) |
| 60 to 64 Years | 106 (47.7%) | 3 (2.8%) |
| 65 to 74 Years | 190 (37.3%) | 0 (0.0%) |
| 75 Years and over | 36 (9.2%) | 0 (0.0%) |
| Total | 1,570 (57.2%) | 75 (4.8%) |
Employment Status by Educational Attainment in Orchard City
According to labor force statistics for Orchard City, 78.3% of individuals (1,239) out of the total population between 25 and 64 years of age (1,582) are in the labor force, with 6.1% or 76 of them being unemployed. The group with the highest labor force participation rate are those with the educational attainment of college / associate degree, with 84.3% or 458 individuals in the labor force. Within the labor force, individuals with college / associate degree education have the highest percentage of unemployment, with 9.0% or 41 of them being unemployed.
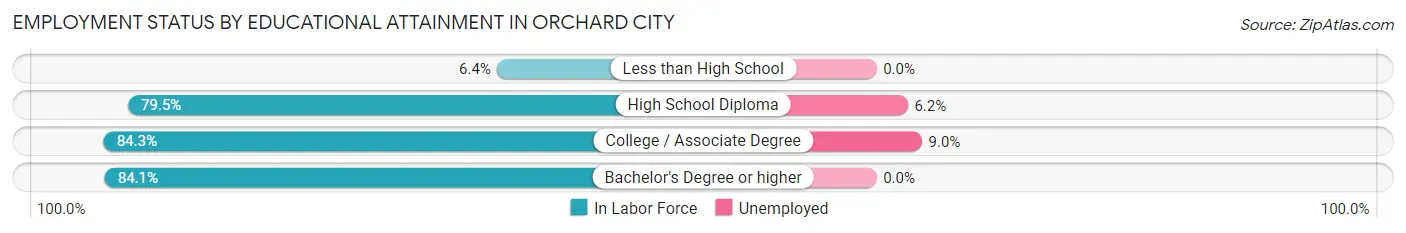
| Educational Attainment | In Labor Force | Unemployed |
| Less than High School | 5 (6.4%) | 0 (0.0%) |
| High School Diploma | 549 (79.5%) | 43 (6.2%) |
| College / Associate Degree | 458 (84.3%) | 49 (9.0%) |
| Bachelor's Degree or higher | 227 (84.1%) | 0 (0.0%) |
| Total | 1,239 (78.3%) | 97 (6.1%) |
Employment Occupations by Sex in Orchard City
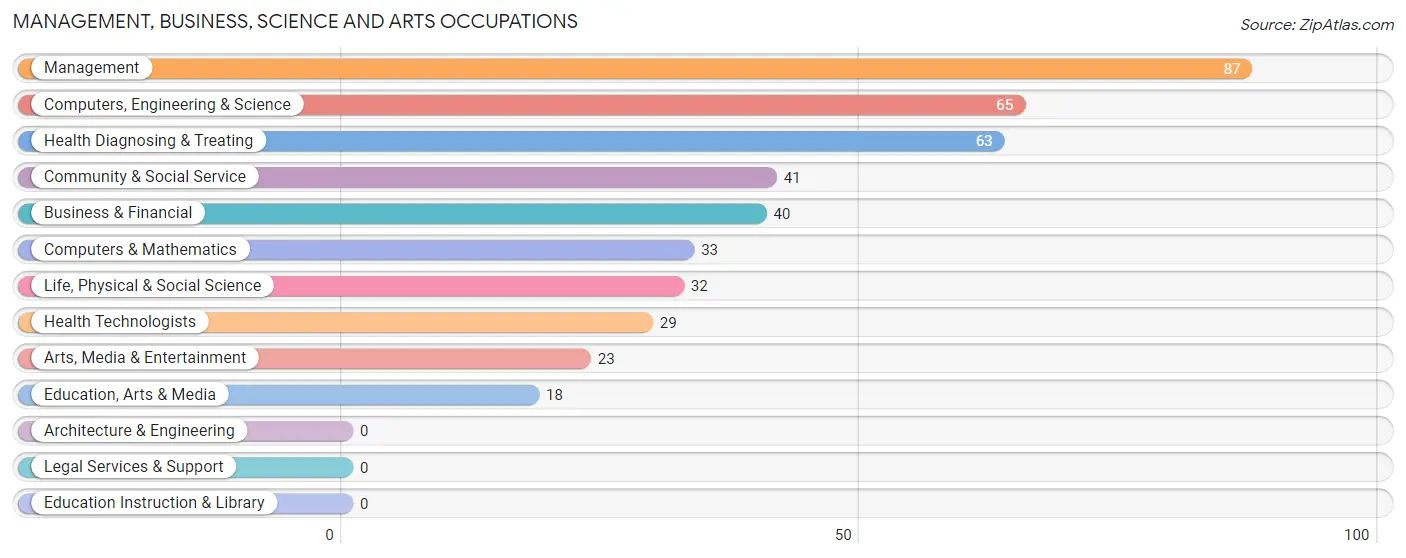
Management, Business, Science and Arts Occupations
The most common Management, Business, Science and Arts occupations in Orchard City are Management (87 | 5.8%), Computers, Engineering & Science (65 | 4.3%), Health Diagnosing & Treating (63 | 4.2%), Community & Social Service (41 | 2.7%), and Business & Financial (40 | 2.7%).
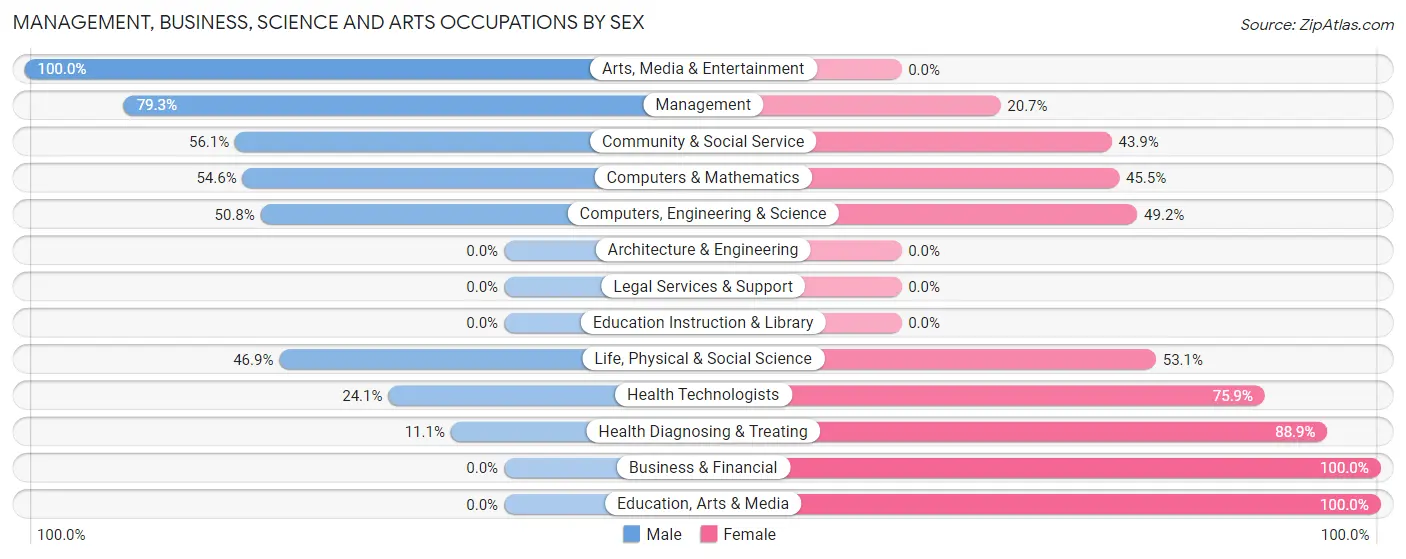
Management, Business, Science and Arts Occupations by Sex
Within the Management, Business, Science and Arts occupations in Orchard City, the most male-oriented occupations are Arts, Media & Entertainment (100.0%), Management (79.3%), and Community & Social Service (56.1%), while the most female-oriented occupations are Business & Financial (100.0%), Education, Arts & Media (100.0%), and Health Diagnosing & Treating (88.9%).
| Occupation | Male | Female |
| Management | 69 (79.3%) | 18 (20.7%) |
| Business & Financial | 0 (0.0%) | 40 (100.0%) |
| Computers, Engineering & Science | 33 (50.8%) | 32 (49.2%) |
| Computers & Mathematics | 18 (54.5%) | 15 (45.5%) |
| Architecture & Engineering | 0 (0.0%) | 0 (0.0%) |
| Life, Physical & Social Science | 15 (46.9%) | 17 (53.1%) |
| Community & Social Service | 23 (56.1%) | 18 (43.9%) |
| Education, Arts & Media | 0 (0.0%) | 18 (100.0%) |
| Legal Services & Support | 0 (0.0%) | 0 (0.0%) |
| Education Instruction & Library | 0 (0.0%) | 0 (0.0%) |
| Arts, Media & Entertainment | 23 (100.0%) | 0 (0.0%) |
| Health Diagnosing & Treating | 7 (11.1%) | 56 (88.9%) |
| Health Technologists | 7 (24.1%) | 22 (75.9%) |
| Total (Category) | 132 (44.6%) | 164 (55.4%) |
| Total (Overall) | 866 (57.9%) | 630 (42.1%) |
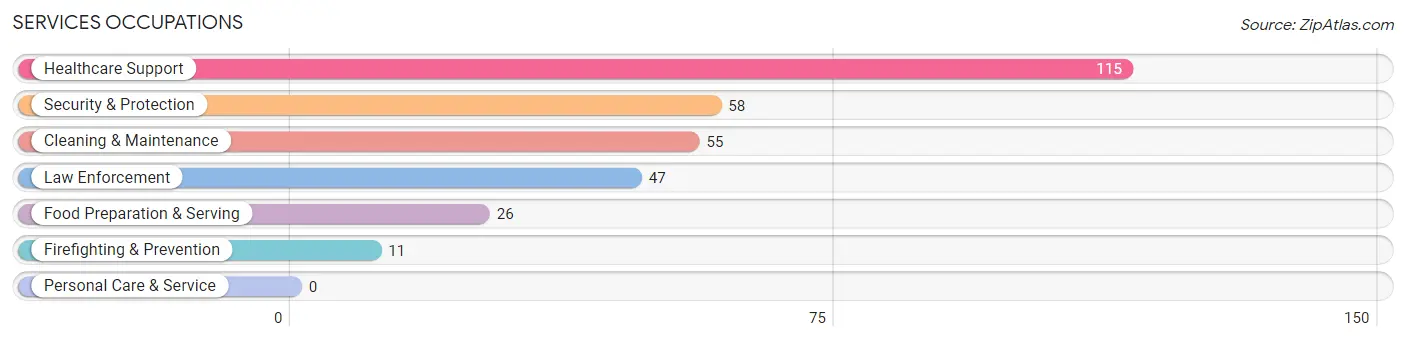
Services Occupations
The most common Services occupations in Orchard City are Healthcare Support (115 | 7.7%), Security & Protection (58 | 3.9%), Cleaning & Maintenance (55 | 3.7%), Law Enforcement (47 | 3.1%), and Food Preparation & Serving (26 | 1.7%).
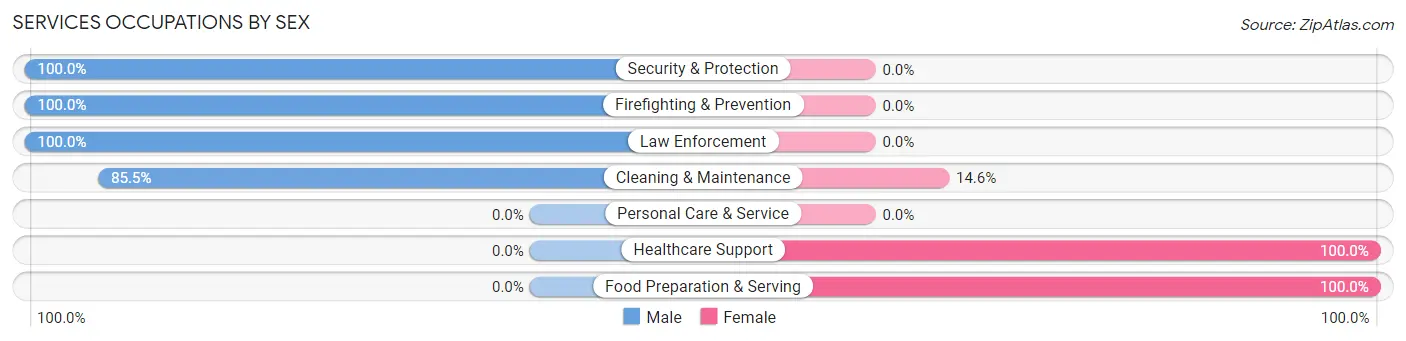
Services Occupations by Sex
Within the Services occupations in Orchard City, the most male-oriented occupations are Security & Protection (100.0%), Firefighting & Prevention (100.0%), and Law Enforcement (100.0%), while the most female-oriented occupations are Healthcare Support (100.0%), Food Preparation & Serving (100.0%), and Cleaning & Maintenance (14.5%).
| Occupation | Male | Female |
| Healthcare Support | 0 (0.0%) | 115 (100.0%) |
| Security & Protection | 58 (100.0%) | 0 (0.0%) |
| Firefighting & Prevention | 11 (100.0%) | 0 (0.0%) |
| Law Enforcement | 47 (100.0%) | 0 (0.0%) |
| Food Preparation & Serving | 0 (0.0%) | 26 (100.0%) |
| Cleaning & Maintenance | 47 (85.5%) | 8 (14.5%) |
| Personal Care & Service | 0 (0.0%) | 0 (0.0%) |
| Total (Category) | 105 (41.3%) | 149 (58.7%) |
| Total (Overall) | 866 (57.9%) | 630 (42.1%) |
Sales and Office Occupations
The most common Sales and Office occupations in Orchard City are Sales & Related (227 | 15.2%), and Office & Administration (166 | 11.1%).
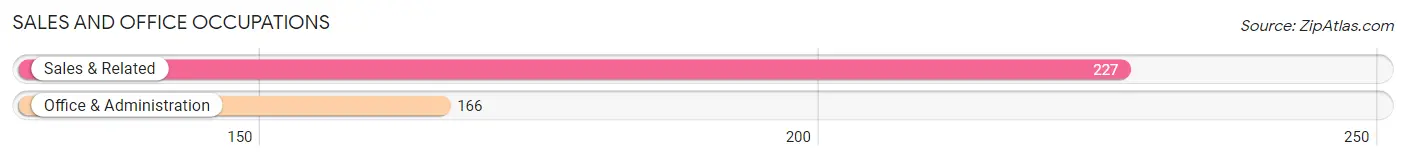
Sales and Office Occupations by Sex

| Occupation | Male | Female |
| Sales & Related | 101 (44.5%) | 126 (55.5%) |
| Office & Administration | 23 (13.9%) | 143 (86.1%) |
| Total (Category) | 124 (31.6%) | 269 (68.4%) |
| Total (Overall) | 866 (57.9%) | 630 (42.1%) |
Natural Resources, Construction and Maintenance Occupations
The most common Natural Resources, Construction and Maintenance occupations in Orchard City are Construction & Extraction (142 | 9.5%), Installation, Maintenance & Repair (82 | 5.5%), and Farming, Fishing & Forestry (59 | 3.9%).
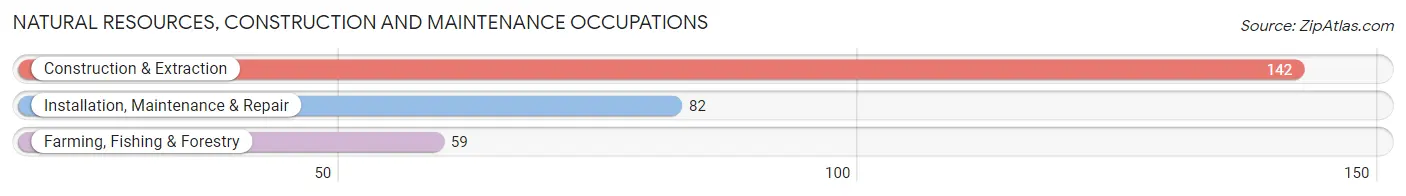
Natural Resources, Construction and Maintenance Occupations by Sex

| Occupation | Male | Female |
| Farming, Fishing & Forestry | 59 (100.0%) | 0 (0.0%) |
| Construction & Extraction | 142 (100.0%) | 0 (0.0%) |
| Installation, Maintenance & Repair | 82 (100.0%) | 0 (0.0%) |
| Total (Category) | 283 (100.0%) | 0 (0.0%) |
| Total (Overall) | 866 (57.9%) | 630 (42.1%) |
Production, Transportation and Moving Occupations
The most common Production, Transportation and Moving occupations in Orchard City are Production (132 | 8.8%), Material Moving (91 | 6.1%), and Transportation (47 | 3.1%).
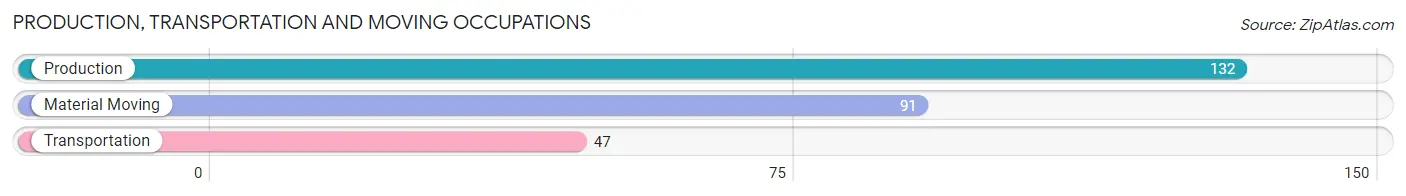
Production, Transportation and Moving Occupations by Sex
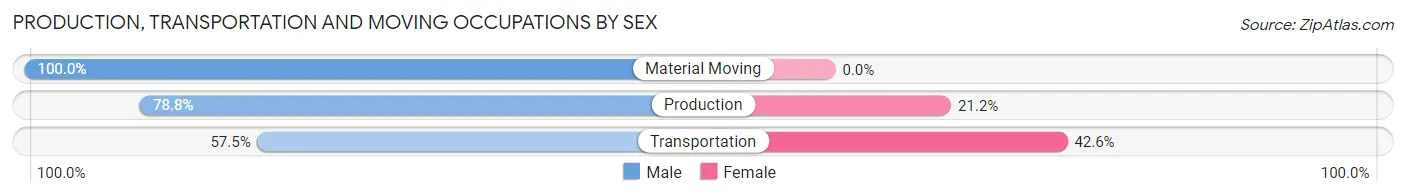
| Occupation | Male | Female |
| Production | 104 (78.8%) | 28 (21.2%) |
| Transportation | 27 (57.5%) | 20 (42.5%) |
| Material Moving | 91 (100.0%) | 0 (0.0%) |
| Total (Category) | 222 (82.2%) | 48 (17.8%) |
| Total (Overall) | 866 (57.9%) | 630 (42.1%) |
Employment Industries by Sex in Orchard City
Employment Industries in Orchard City
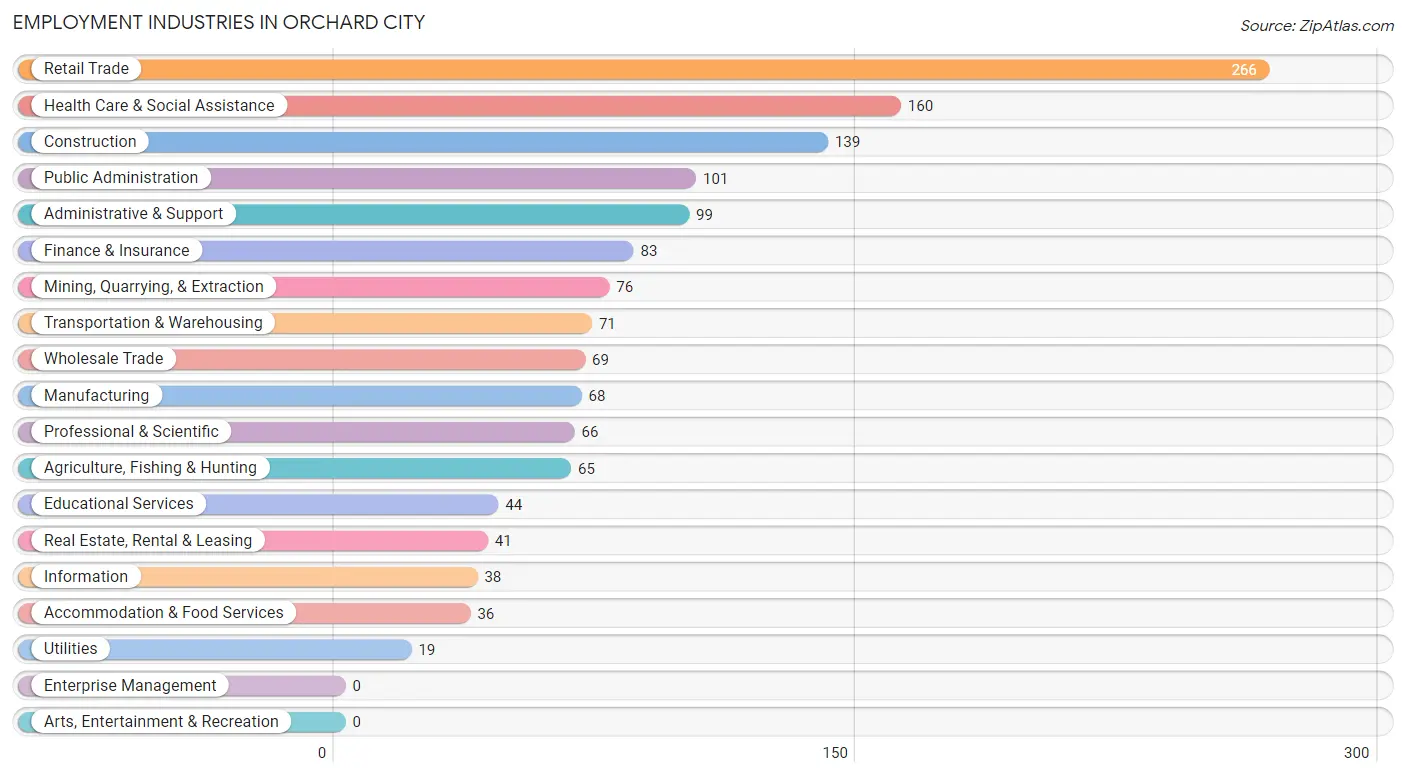
The major employment industries in Orchard City include Retail Trade (266 | 17.8%), Health Care & Social Assistance (160 | 10.7%), Construction (139 | 9.3%), Public Administration (101 | 6.8%), and Administrative & Support (99 | 6.6%).
Employment Industries by Sex in Orchard City
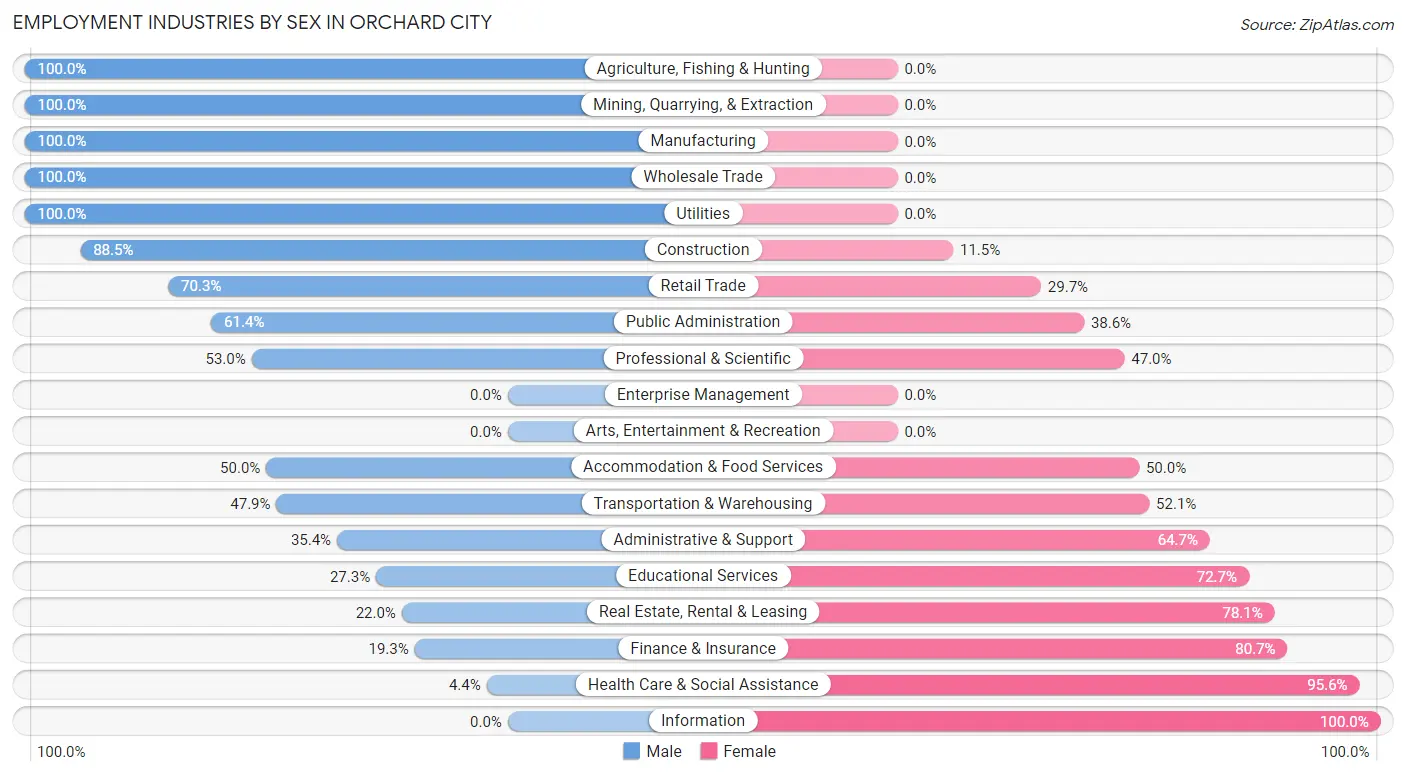
The Orchard City industries that see more men than women are Agriculture, Fishing & Hunting (100.0%), Mining, Quarrying, & Extraction (100.0%), and Manufacturing (100.0%), whereas the industries that tend to have a higher number of women are Information (100.0%), Health Care & Social Assistance (95.6%), and Finance & Insurance (80.7%).
| Industry | Male | Female |
| Agriculture, Fishing & Hunting | 65 (100.0%) | 0 (0.0%) |
| Mining, Quarrying, & Extraction | 76 (100.0%) | 0 (0.0%) |
| Construction | 123 (88.5%) | 16 (11.5%) |
| Manufacturing | 68 (100.0%) | 0 (0.0%) |
| Wholesale Trade | 69 (100.0%) | 0 (0.0%) |
| Retail Trade | 187 (70.3%) | 79 (29.7%) |
| Transportation & Warehousing | 34 (47.9%) | 37 (52.1%) |
| Utilities | 19 (100.0%) | 0 (0.0%) |
| Information | 0 (0.0%) | 38 (100.0%) |
| Finance & Insurance | 16 (19.3%) | 67 (80.7%) |
| Real Estate, Rental & Leasing | 9 (22.0%) | 32 (78.0%) |
| Professional & Scientific | 35 (53.0%) | 31 (47.0%) |
| Enterprise Management | 0 (0.0%) | 0 (0.0%) |
| Administrative & Support | 35 (35.3%) | 64 (64.6%) |
| Educational Services | 12 (27.3%) | 32 (72.7%) |
| Health Care & Social Assistance | 7 (4.4%) | 153 (95.6%) |
| Arts, Entertainment & Recreation | 0 (0.0%) | 0 (0.0%) |
| Accommodation & Food Services | 18 (50.0%) | 18 (50.0%) |
| Public Administration | 62 (61.4%) | 39 (38.6%) |
| Total | 866 (57.9%) | 630 (42.1%) |
Education in Orchard City
School Enrollment in Orchard City
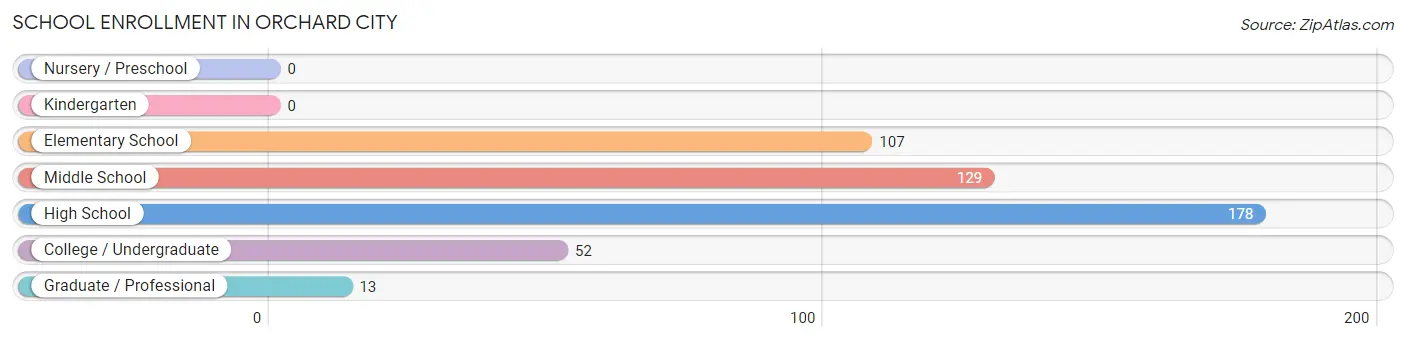
The most common levels of schooling among the 479 students in Orchard City are high school (178 | 37.2%), middle school (129 | 26.9%), and elementary school (107 | 22.3%).
| School Level | # Students | % Students |
| Nursery / Preschool | 0 | 0.0% |
| Kindergarten | 0 | 0.0% |
| Elementary School | 107 | 22.3% |
| Middle School | 129 | 26.9% |
| High School | 178 | 37.2% |
| College / Undergraduate | 52 | 10.9% |
| Graduate / Professional | 13 | 2.7% |
| Total | 479 | 100.0% |
School Enrollment by Age by Funding Source in Orchard City
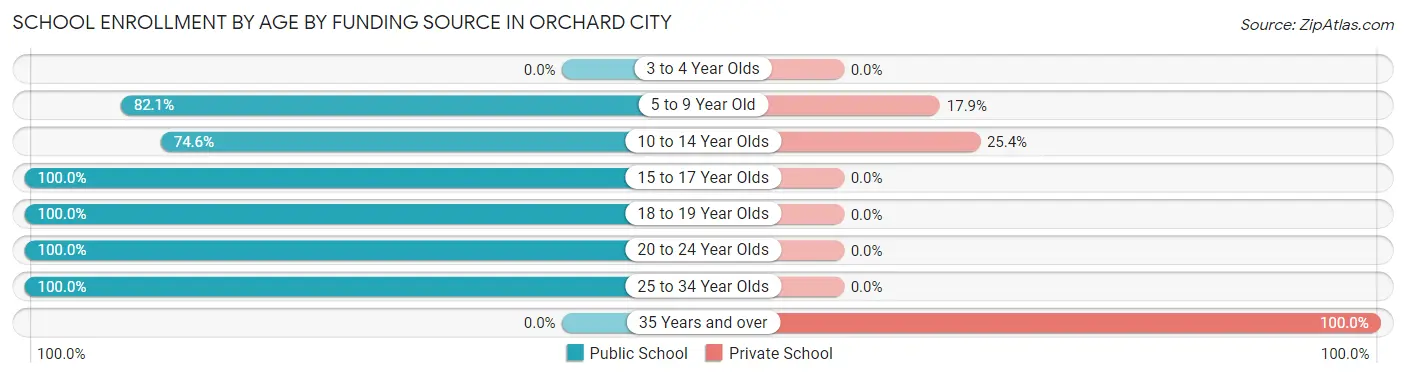
Out of a total of 479 students who are enrolled in schools in Orchard City, 68 (14.2%) attend a private institution, while the remaining 411 (85.8%) are enrolled in public schools. The age group of 35 years and over has the highest likelihood of being enrolled in private schools, with 16 (100.0% in the age bracket) enrolled. Conversely, the age group of 15 to 17 year olds has the lowest likelihood of being enrolled in a private school, with 154 (100.0% in the age bracket) attending a public institution.
| Age Bracket | Public School | Private School |
| 3 to 4 Year Olds | 0 (0.0%) | 0 (0.0%) |
| 5 to 9 Year Old | 87 (82.1%) | 19 (17.9%) |
| 10 to 14 Year Olds | 97 (74.6%) | 33 (25.4%) |
| 15 to 17 Year Olds | 154 (100.0%) | 0 (0.0%) |
| 18 to 19 Year Olds | 24 (100.0%) | 0 (0.0%) |
| 20 to 24 Year Olds | 36 (100.0%) | 0 (0.0%) |
| 25 to 34 Year Olds | 13 (100.0%) | 0 (0.0%) |
| 35 Years and over | 0 (0.0%) | 16 (100.0%) |
| Total | 411 (85.8%) | 68 (14.2%) |
Educational Attainment by Field of Study in Orchard City
Education (152 | 23.4%), bio, nature & agricultural (101 | 15.5%), liberal arts & history (66 | 10.2%), business (65 | 10.0%), and arts & humanities (46 | 7.1%) are the most common fields of study among 650 individuals in Orchard City who have obtained a bachelor's degree or higher.
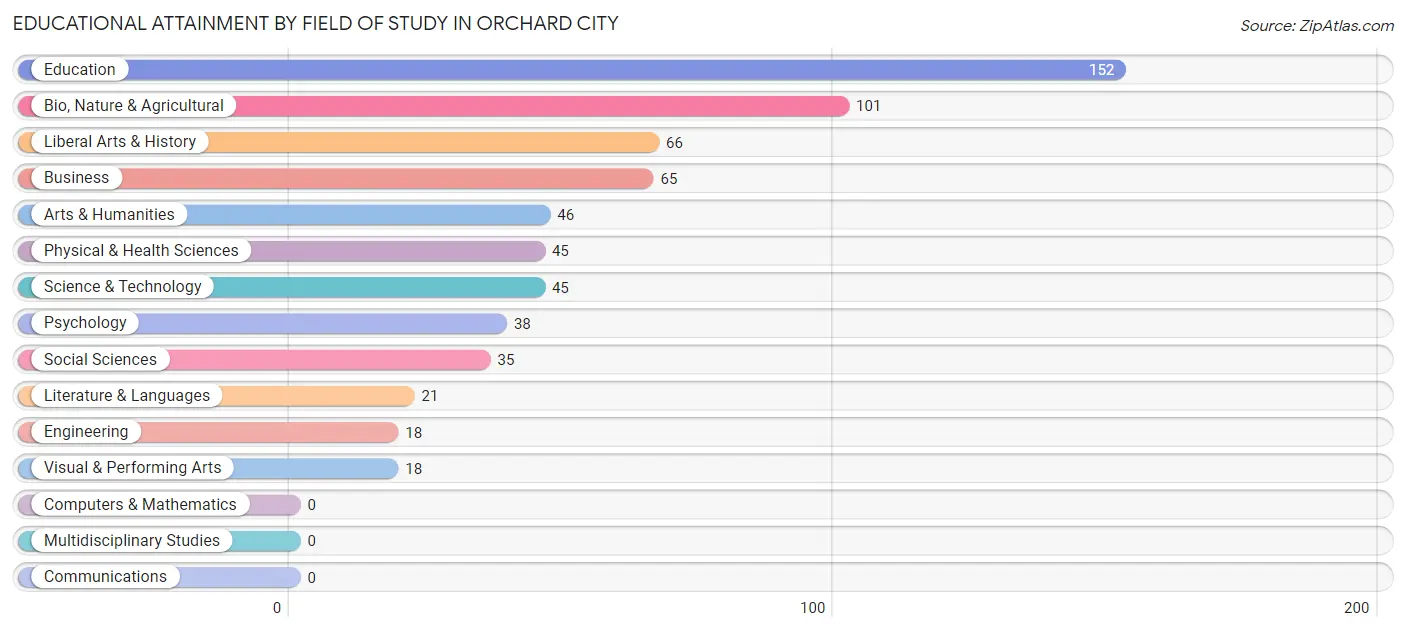
| Field of Study | # Graduates | % Graduates |
| Computers & Mathematics | 0 | 0.0% |
| Bio, Nature & Agricultural | 101 | 15.5% |
| Physical & Health Sciences | 45 | 6.9% |
| Psychology | 38 | 5.9% |
| Social Sciences | 35 | 5.4% |
| Engineering | 18 | 2.8% |
| Multidisciplinary Studies | 0 | 0.0% |
| Science & Technology | 45 | 6.9% |
| Business | 65 | 10.0% |
| Education | 152 | 23.4% |
| Literature & Languages | 21 | 3.2% |
| Liberal Arts & History | 66 | 10.2% |
| Visual & Performing Arts | 18 | 2.8% |
| Communications | 0 | 0.0% |
| Arts & Humanities | 46 | 7.1% |
| Total | 650 | 100.0% |
Transportation & Commute in Orchard City
Vehicle Availability by Sex in Orchard City
The most prevalent vehicle ownership categories in Orchard City are males with 2 vehicles (293, accounting for 34.4%) and females with 2 vehicles (198, making up 46.5%).
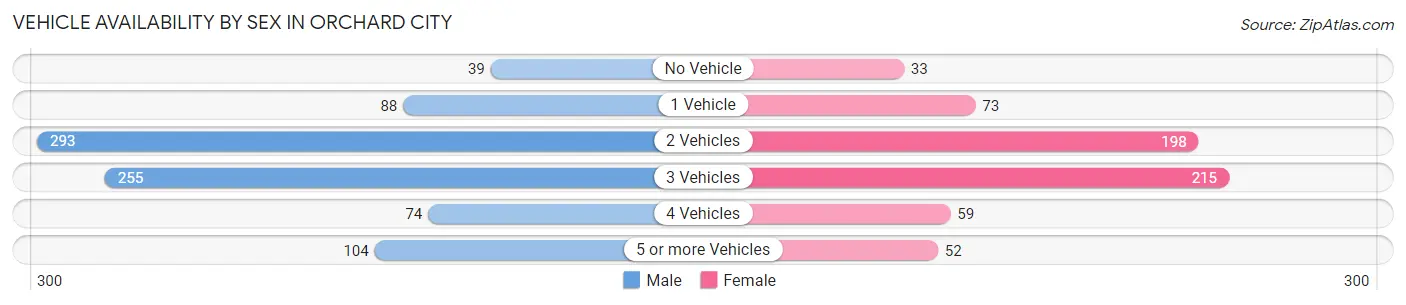
| Vehicles Available | Male | Female |
| No Vehicle | 39 (4.6%) | 33 (5.2%) |
| 1 Vehicle | 88 (10.3%) | 73 (11.6%) |
| 2 Vehicles | 293 (34.4%) | 198 (31.4%) |
| 3 Vehicles | 255 (29.9%) | 215 (34.1%) |
| 4 Vehicles | 74 (8.7%) | 59 (9.4%) |
| 5 or more Vehicles | 104 (12.2%) | 52 (8.3%) |
| Total | 853 (100.0%) | 630 (100.0%) |
Commute Time in Orchard City
The most frequently occuring commute durations in Orchard City are 15 to 19 minutes (323 commuters, 23.3%), 10 to 14 minutes (212 commuters, 15.3%), and 20 to 24 minutes (164 commuters, 11.8%).
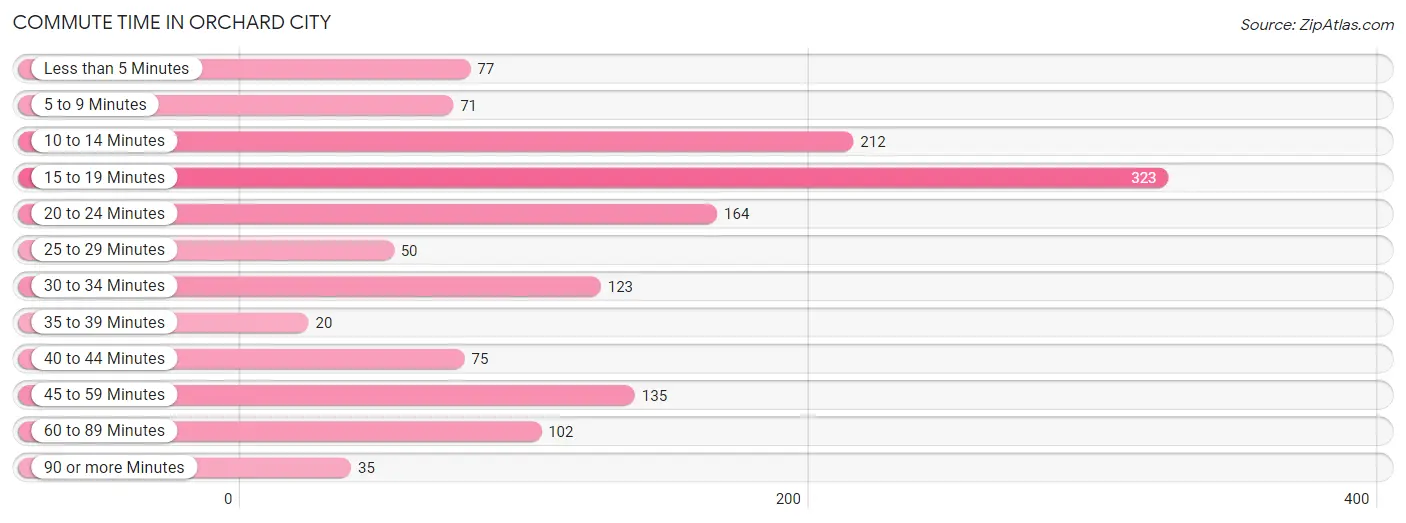
| Commute Time | # Commuters | % Commuters |
| Less than 5 Minutes | 77 | 5.6% |
| 5 to 9 Minutes | 71 | 5.1% |
| 10 to 14 Minutes | 212 | 15.3% |
| 15 to 19 Minutes | 323 | 23.3% |
| 20 to 24 Minutes | 164 | 11.8% |
| 25 to 29 Minutes | 50 | 3.6% |
| 30 to 34 Minutes | 123 | 8.9% |
| 35 to 39 Minutes | 20 | 1.4% |
| 40 to 44 Minutes | 75 | 5.4% |
| 45 to 59 Minutes | 135 | 9.7% |
| 60 to 89 Minutes | 102 | 7.3% |
| 90 or more Minutes | 35 | 2.5% |
Commute Time by Sex in Orchard City
The most common commute times in Orchard City are 15 to 19 minutes (212 commuters, 25.4%) for males and 10 to 14 minutes (129 commuters, 23.3%) for females.
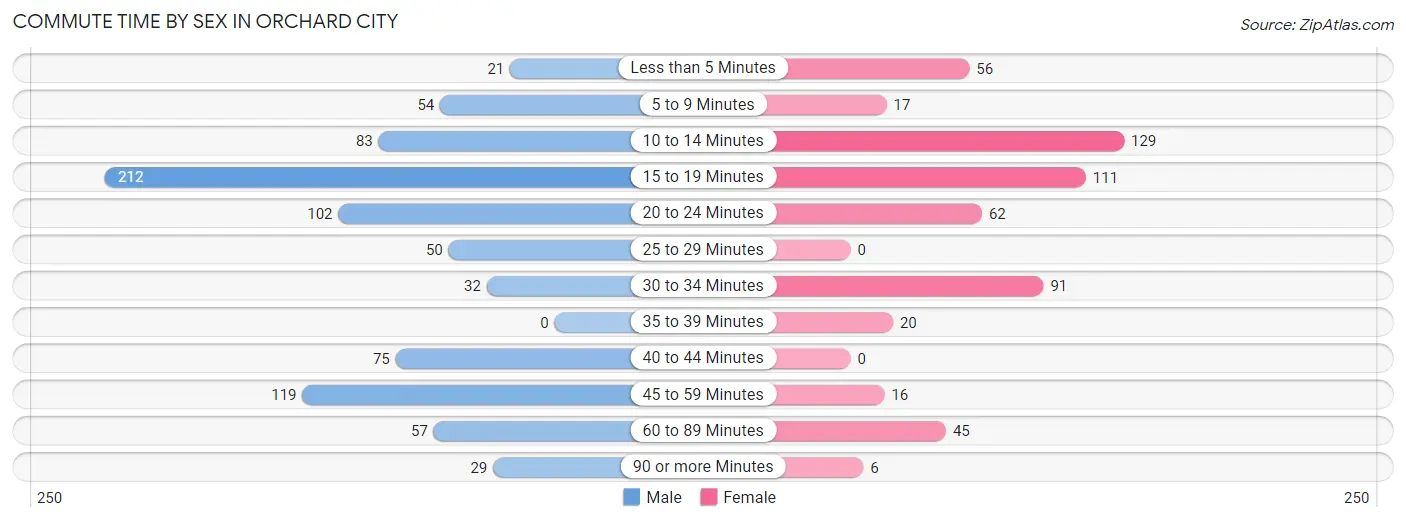
| Commute Time | Male | Female |
| Less than 5 Minutes | 21 (2.5%) | 56 (10.1%) |
| 5 to 9 Minutes | 54 (6.5%) | 17 (3.1%) |
| 10 to 14 Minutes | 83 (10.0%) | 129 (23.3%) |
| 15 to 19 Minutes | 212 (25.4%) | 111 (20.1%) |
| 20 to 24 Minutes | 102 (12.2%) | 62 (11.2%) |
| 25 to 29 Minutes | 50 (6.0%) | 0 (0.0%) |
| 30 to 34 Minutes | 32 (3.8%) | 91 (16.5%) |
| 35 to 39 Minutes | 0 (0.0%) | 20 (3.6%) |
| 40 to 44 Minutes | 75 (9.0%) | 0 (0.0%) |
| 45 to 59 Minutes | 119 (14.3%) | 16 (2.9%) |
| 60 to 89 Minutes | 57 (6.8%) | 45 (8.1%) |
| 90 or more Minutes | 29 (3.5%) | 6 (1.1%) |
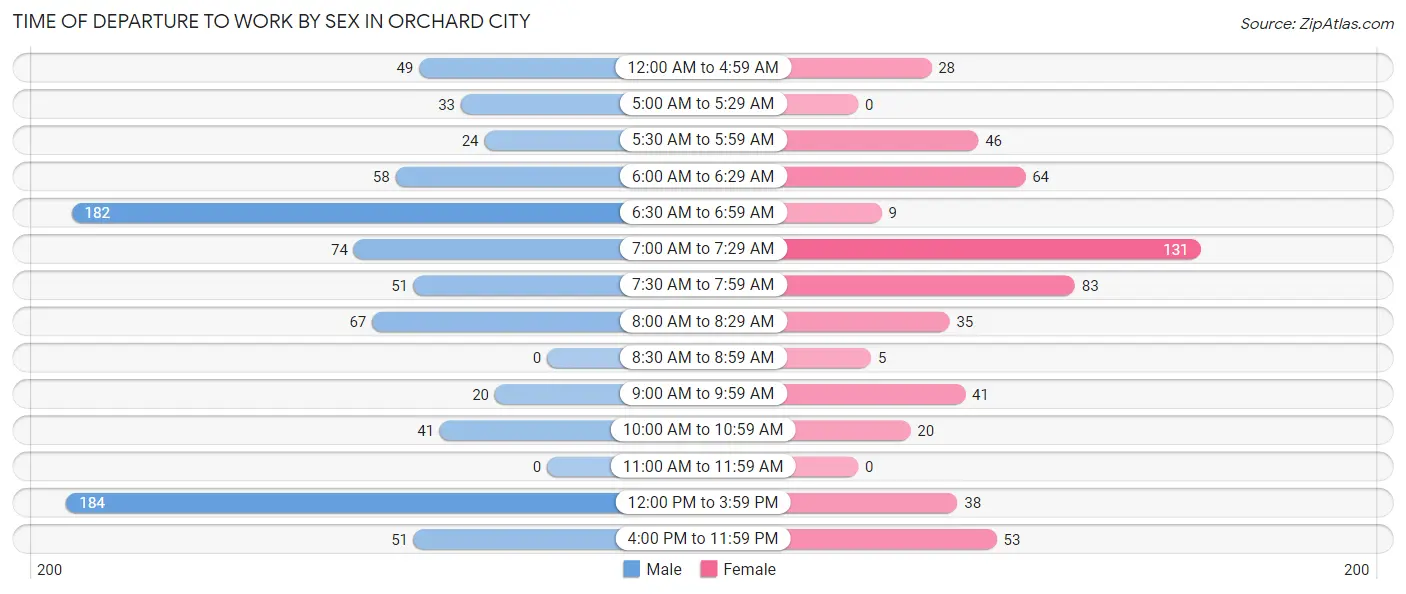
Time of Departure to Work by Sex in Orchard City
The most frequent times of departure to work in Orchard City are 12:00 PM to 3:59 PM (184, 22.1%) for males and 7:00 AM to 7:29 AM (131, 23.7%) for females.
| Time of Departure | Male | Female |
| 12:00 AM to 4:59 AM | 49 (5.9%) | 28 (5.1%) |
| 5:00 AM to 5:29 AM | 33 (4.0%) | 0 (0.0%) |
| 5:30 AM to 5:59 AM | 24 (2.9%) | 46 (8.3%) |
| 6:00 AM to 6:29 AM | 58 (7.0%) | 64 (11.6%) |
| 6:30 AM to 6:59 AM | 182 (21.8%) | 9 (1.6%) |
| 7:00 AM to 7:29 AM | 74 (8.9%) | 131 (23.7%) |
| 7:30 AM to 7:59 AM | 51 (6.1%) | 83 (15.0%) |
| 8:00 AM to 8:29 AM | 67 (8.0%) | 35 (6.3%) |
| 8:30 AM to 8:59 AM | 0 (0.0%) | 5 (0.9%) |
| 9:00 AM to 9:59 AM | 20 (2.4%) | 41 (7.4%) |
| 10:00 AM to 10:59 AM | 41 (4.9%) | 20 (3.6%) |
| 11:00 AM to 11:59 AM | 0 (0.0%) | 0 (0.0%) |
| 12:00 PM to 3:59 PM | 184 (22.1%) | 38 (6.9%) |
| 4:00 PM to 11:59 PM | 51 (6.1%) | 53 (9.6%) |
| Total | 834 (100.0%) | 553 (100.0%) |
Housing Occupancy in Orchard City
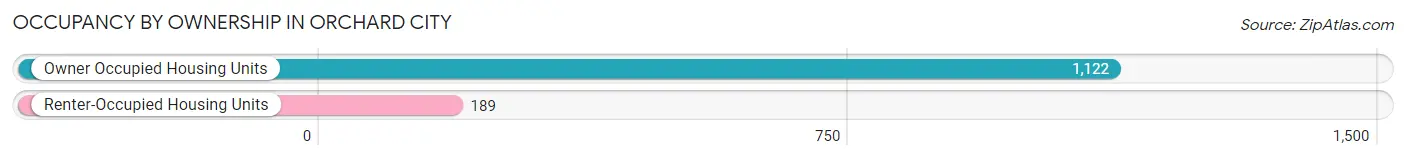
Occupancy by Ownership in Orchard City
Of the total 1,311 dwellings in Orchard City, owner-occupied units account for 1,122 (85.6%), while renter-occupied units make up 189 (14.4%).
| Occupancy | # Housing Units | % Housing Units |
| Owner Occupied Housing Units | 1,122 | 85.6% |
| Renter-Occupied Housing Units | 189 | 14.4% |
| Total Occupied Housing Units | 1,311 | 100.0% |
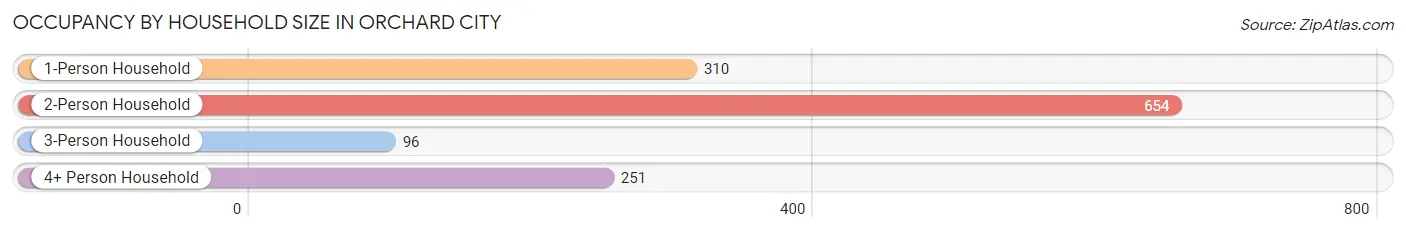
Occupancy by Household Size in Orchard City
| Household Size | # Housing Units | % Housing Units |
| 1-Person Household | 310 | 23.6% |
| 2-Person Household | 654 | 49.9% |
| 3-Person Household | 96 | 7.3% |
| 4+ Person Household | 251 | 19.2% |
| Total Housing Units | 1,311 | 100.0% |
Occupancy by Ownership by Household Size in Orchard City
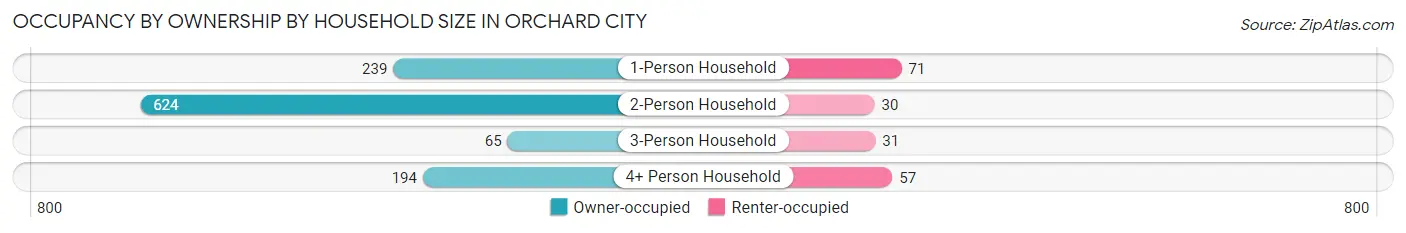
| Household Size | Owner-occupied | Renter-occupied |
| 1-Person Household | 239 (77.1%) | 71 (22.9%) |
| 2-Person Household | 624 (95.4%) | 30 (4.6%) |
| 3-Person Household | 65 (67.7%) | 31 (32.3%) |
| 4+ Person Household | 194 (77.3%) | 57 (22.7%) |
| Total Housing Units | 1,122 (85.6%) | 189 (14.4%) |
Occupancy by Educational Attainment in Orchard City
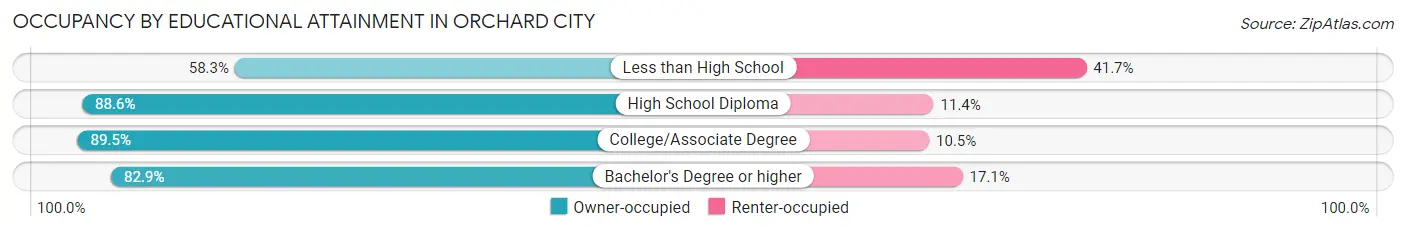
| Household Size | Owner-occupied | Renter-occupied |
| Less than High School | 49 (58.3%) | 35 (41.7%) |
| High School Diploma | 420 (88.6%) | 54 (11.4%) |
| College/Associate Degree | 392 (89.5%) | 46 (10.5%) |
| Bachelor's Degree or higher | 261 (82.9%) | 54 (17.1%) |
Occupancy by Age of Householder in Orchard City
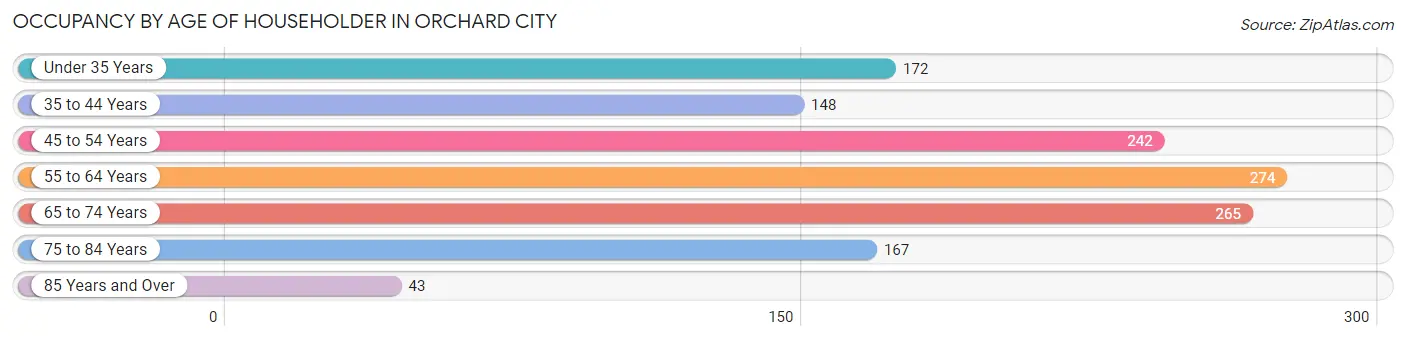
| Age Bracket | # Households | % Households |
| Under 35 Years | 172 | 13.1% |
| 35 to 44 Years | 148 | 11.3% |
| 45 to 54 Years | 242 | 18.5% |
| 55 to 64 Years | 274 | 20.9% |
| 65 to 74 Years | 265 | 20.2% |
| 75 to 84 Years | 167 | 12.7% |
| 85 Years and Over | 43 | 3.3% |
| Total | 1,311 | 100.0% |
Housing Finances in Orchard City
Median Income by Occupancy in Orchard City
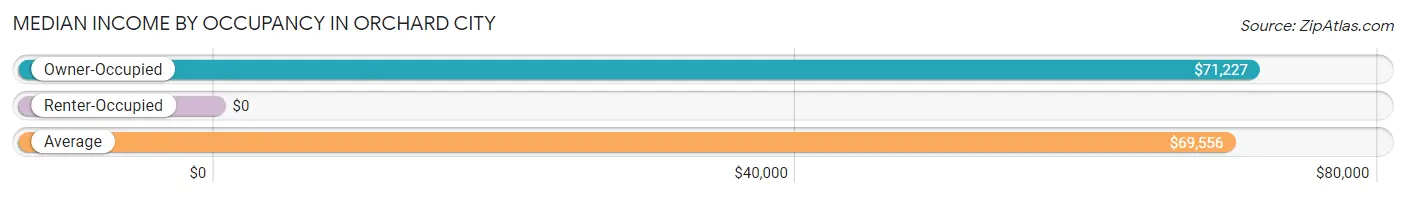
| Occupancy Type | # Households | Median Income |
| Owner-Occupied | 1,122 (85.6%) | $71,227 |
| Renter-Occupied | 189 (14.4%) | $0 |
| Average | 1,311 (100.0%) | $69,556 |
Occupancy by Householder Income Bracket in Orchard City
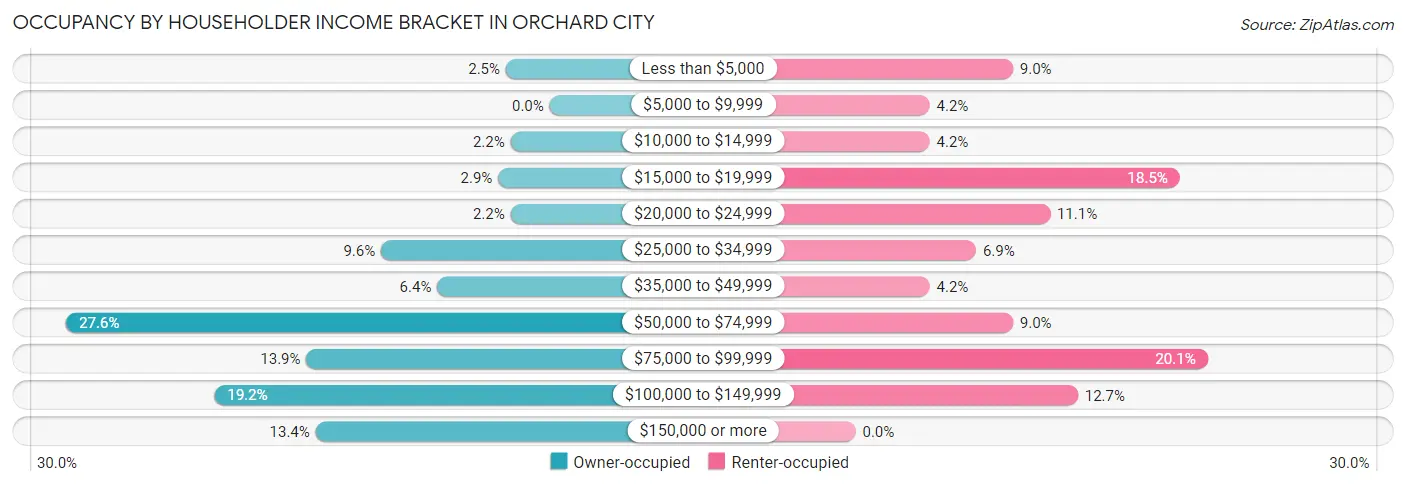
| Income Bracket | Owner-occupied | Renter-occupied |
| Less than $5,000 | 28 (2.5%) | 17 (9.0%) |
| $5,000 to $9,999 | 0 (0.0%) | 8 (4.2%) |
| $10,000 to $14,999 | 25 (2.2%) | 8 (4.2%) |
| $15,000 to $19,999 | 33 (2.9%) | 35 (18.5%) |
| $20,000 to $24,999 | 25 (2.2%) | 21 (11.1%) |
| $25,000 to $34,999 | 108 (9.6%) | 13 (6.9%) |
| $35,000 to $49,999 | 72 (6.4%) | 8 (4.2%) |
| $50,000 to $74,999 | 310 (27.6%) | 17 (9.0%) |
| $75,000 to $99,999 | 156 (13.9%) | 38 (20.1%) |
| $100,000 to $149,999 | 215 (19.2%) | 24 (12.7%) |
| $150,000 or more | 150 (13.4%) | 0 (0.0%) |
| Total | 1,122 (100.0%) | 189 (100.0%) |
Monthly Housing Cost Tiers in Orchard City
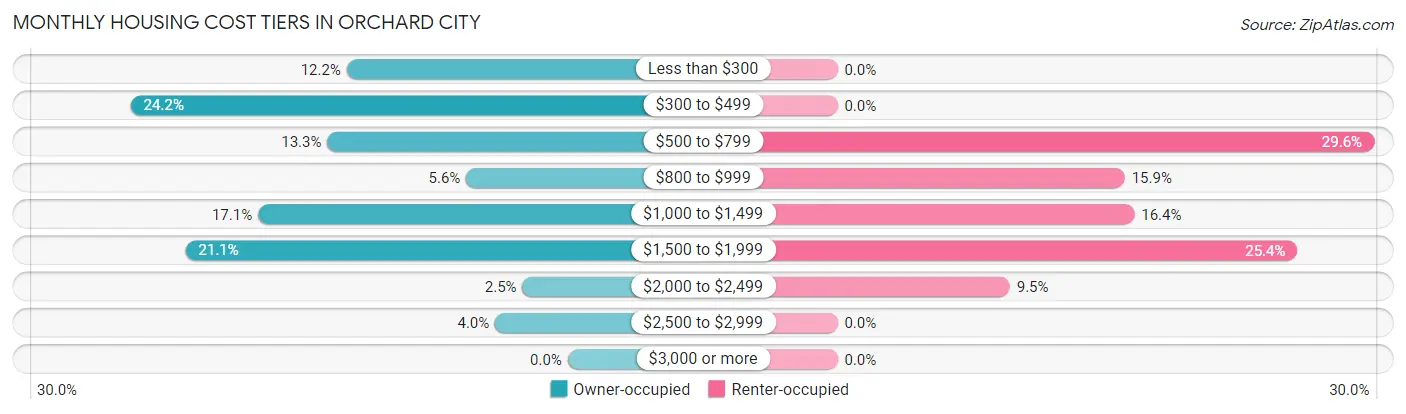
| Monthly Cost | Owner-occupied | Renter-occupied |
| Less than $300 | 137 (12.2%) | 0 (0.0%) |
| $300 to $499 | 271 (24.1%) | 0 (0.0%) |
| $500 to $799 | 149 (13.3%) | 56 (29.6%) |
| $800 to $999 | 63 (5.6%) | 30 (15.9%) |
| $1,000 to $1,499 | 192 (17.1%) | 31 (16.4%) |
| $1,500 to $1,999 | 237 (21.1%) | 48 (25.4%) |
| $2,000 to $2,499 | 28 (2.5%) | 18 (9.5%) |
| $2,500 to $2,999 | 45 (4.0%) | 0 (0.0%) |
| $3,000 or more | 0 (0.0%) | 0 (0.0%) |
| Total | 1,122 (100.0%) | 189 (100.0%) |
Physical Housing Characteristics in Orchard City
Housing Structures in Orchard City
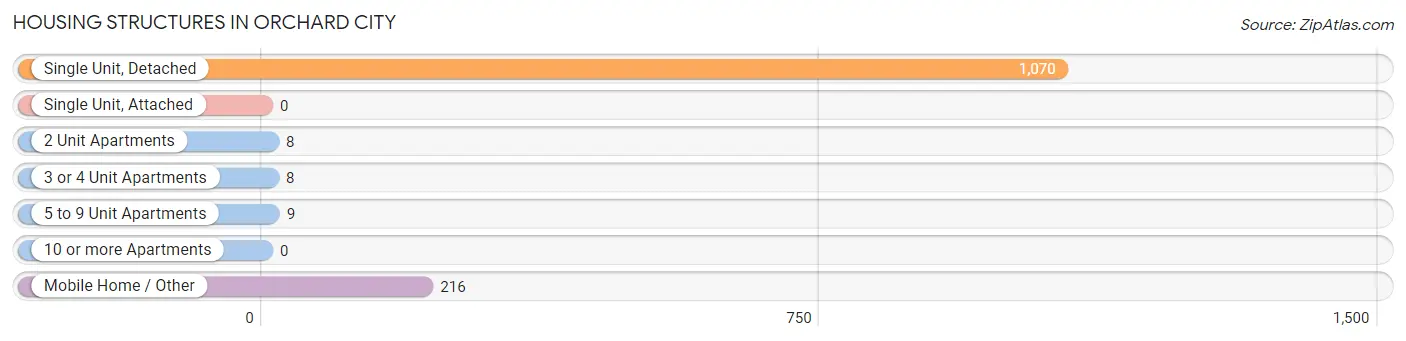
| Structure Type | # Housing Units | % Housing Units |
| Single Unit, Detached | 1,070 | 81.6% |
| Single Unit, Attached | 0 | 0.0% |
| 2 Unit Apartments | 8 | 0.6% |
| 3 or 4 Unit Apartments | 8 | 0.6% |
| 5 to 9 Unit Apartments | 9 | 0.7% |
| 10 or more Apartments | 0 | 0.0% |
| Mobile Home / Other | 216 | 16.5% |
| Total | 1,311 | 100.0% |
Housing Structures by Occupancy in Orchard City
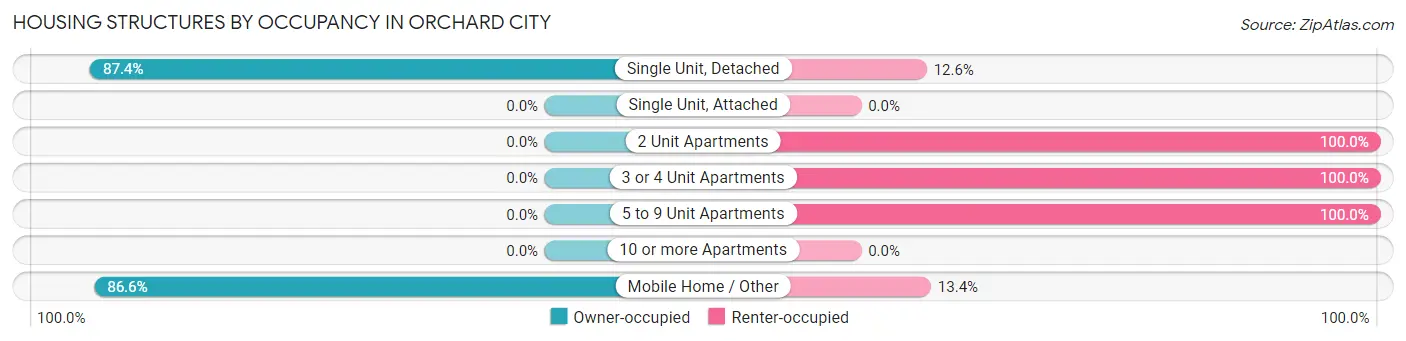
| Structure Type | Owner-occupied | Renter-occupied |
| Single Unit, Detached | 935 (87.4%) | 135 (12.6%) |
| Single Unit, Attached | 0 (0.0%) | 0 (0.0%) |
| 2 Unit Apartments | 0 (0.0%) | 8 (100.0%) |
| 3 or 4 Unit Apartments | 0 (0.0%) | 8 (100.0%) |
| 5 to 9 Unit Apartments | 0 (0.0%) | 9 (100.0%) |
| 10 or more Apartments | 0 (0.0%) | 0 (0.0%) |
| Mobile Home / Other | 187 (86.6%) | 29 (13.4%) |
| Total | 1,122 (85.6%) | 189 (14.4%) |
Housing Structures by Number of Rooms in Orchard City
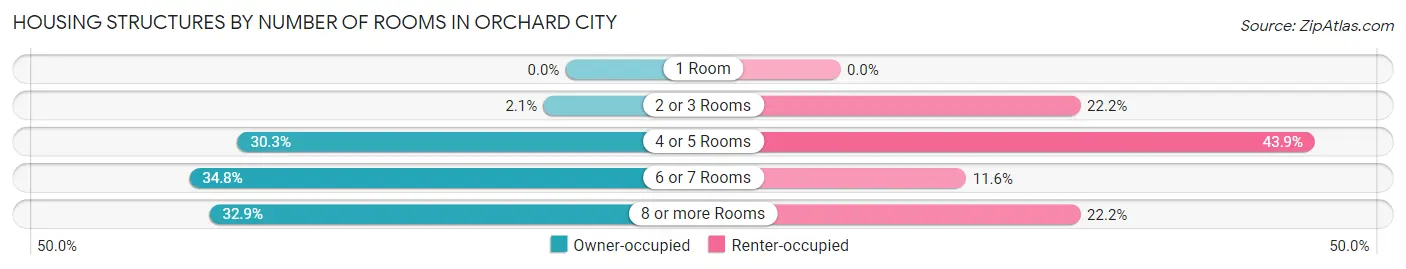
| Number of Rooms | Owner-occupied | Renter-occupied |
| 1 Room | 0 (0.0%) | 0 (0.0%) |
| 2 or 3 Rooms | 23 (2.1%) | 42 (22.2%) |
| 4 or 5 Rooms | 340 (30.3%) | 83 (43.9%) |
| 6 or 7 Rooms | 390 (34.8%) | 22 (11.6%) |
| 8 or more Rooms | 369 (32.9%) | 42 (22.2%) |
| Total | 1,122 (100.0%) | 189 (100.0%) |
Housing Structure by Heating Type in Orchard City
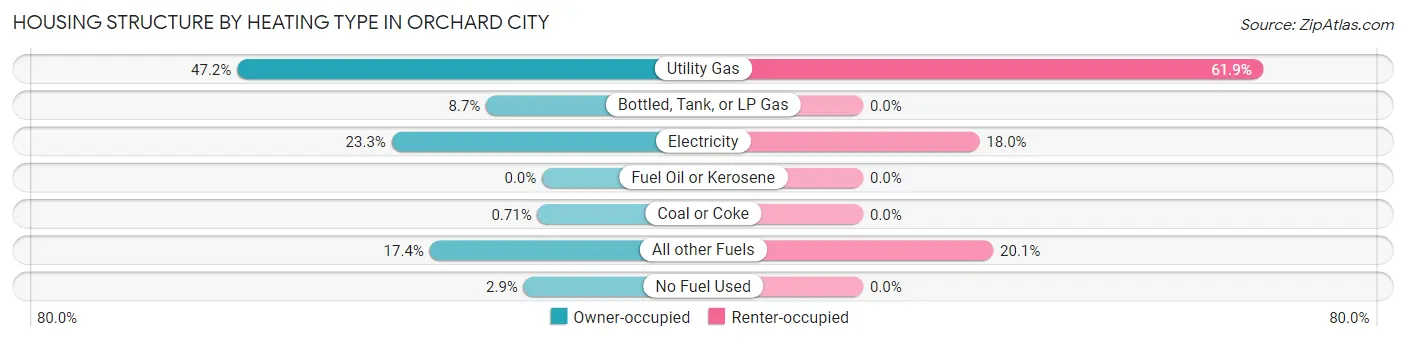
| Heating Type | Owner-occupied | Renter-occupied |
| Utility Gas | 529 (47.1%) | 117 (61.9%) |
| Bottled, Tank, or LP Gas | 97 (8.6%) | 0 (0.0%) |
| Electricity | 261 (23.3%) | 34 (18.0%) |
| Fuel Oil or Kerosene | 0 (0.0%) | 0 (0.0%) |
| Coal or Coke | 8 (0.7%) | 0 (0.0%) |
| All other Fuels | 195 (17.4%) | 38 (20.1%) |
| No Fuel Used | 32 (2.9%) | 0 (0.0%) |
| Total | 1,122 (100.0%) | 189 (100.0%) |
Household Vehicle Usage in Orchard City
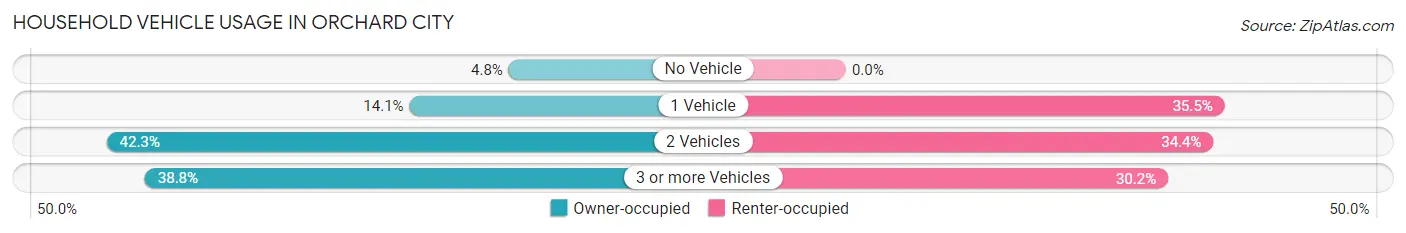
| Vehicles per Household | Owner-occupied | Renter-occupied |
| No Vehicle | 54 (4.8%) | 0 (0.0%) |
| 1 Vehicle | 158 (14.1%) | 67 (35.4%) |
| 2 Vehicles | 475 (42.3%) | 65 (34.4%) |
| 3 or more Vehicles | 435 (38.8%) | 57 (30.2%) |
| Total | 1,122 (100.0%) | 189 (100.0%) |
Real Estate & Mortgages in Orchard City
Real Estate and Mortgage Overview in Orchard City
| Characteristic | Without Mortgage | With Mortgage |
| Housing Units | 552 | 570 |
| Median Property Value | $233,300 | $310,700 |
| Median Household Income | $64,130 | $110 |
| Monthly Housing Costs | $404 | $0 |
| Real Estate Taxes | $738 | $0 |
Property Value by Mortgage Status in Orchard City
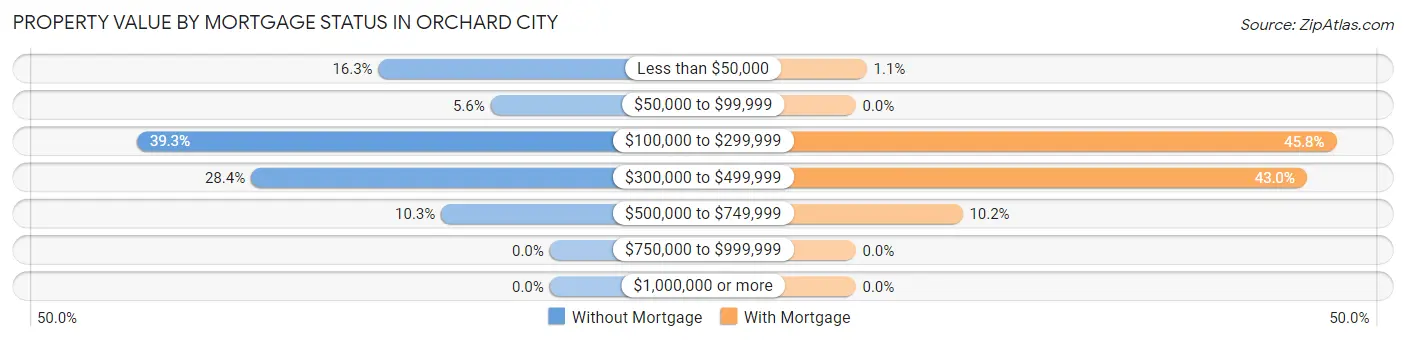
| Property Value | Without Mortgage | With Mortgage |
| Less than $50,000 | 90 (16.3%) | 6 (1.1%) |
| $50,000 to $99,999 | 31 (5.6%) | 0 (0.0%) |
| $100,000 to $299,999 | 217 (39.3%) | 261 (45.8%) |
| $300,000 to $499,999 | 157 (28.4%) | 245 (43.0%) |
| $500,000 to $749,999 | 57 (10.3%) | 58 (10.2%) |
| $750,000 to $999,999 | 0 (0.0%) | 0 (0.0%) |
| $1,000,000 or more | 0 (0.0%) | 0 (0.0%) |
| Total | 552 (100.0%) | 570 (100.0%) |
Household Income by Mortgage Status in Orchard City
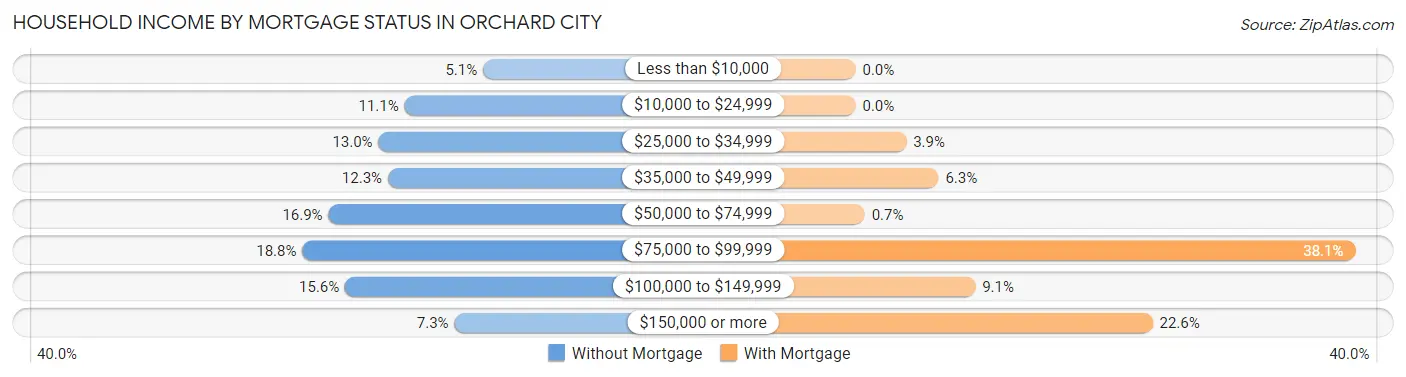
| Household Income | Without Mortgage | With Mortgage |
| Less than $10,000 | 28 (5.1%) | 0 (0.0%) |
| $10,000 to $24,999 | 61 (11.1%) | 0 (0.0%) |
| $25,000 to $34,999 | 72 (13.0%) | 22 (3.9%) |
| $35,000 to $49,999 | 68 (12.3%) | 36 (6.3%) |
| $50,000 to $74,999 | 93 (16.9%) | 4 (0.7%) |
| $75,000 to $99,999 | 104 (18.8%) | 217 (38.1%) |
| $100,000 to $149,999 | 86 (15.6%) | 52 (9.1%) |
| $150,000 or more | 40 (7.2%) | 129 (22.6%) |
| Total | 552 (100.0%) | 570 (100.0%) |
Property Value to Household Income Ratio in Orchard City
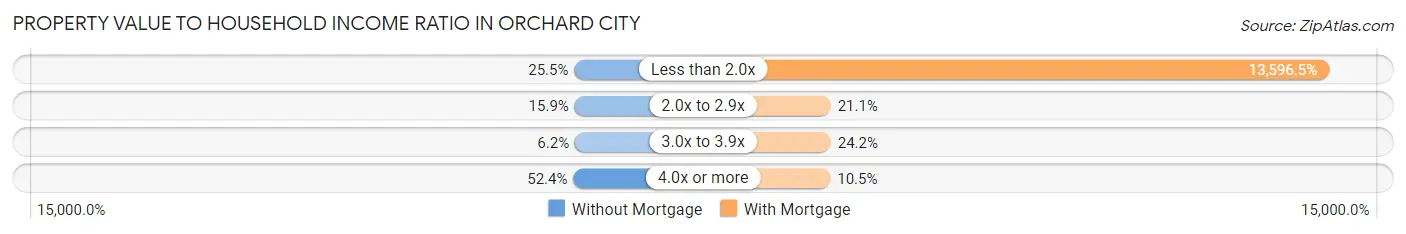
| Value-to-Income Ratio | Without Mortgage | With Mortgage |
| Less than 2.0x | 141 (25.5%) | 77,500 (13,596.5%) |
| 2.0x to 2.9x | 88 (15.9%) | 120 (21.0%) |
| 3.0x to 3.9x | 34 (6.2%) | 138 (24.2%) |
| 4.0x or more | 289 (52.4%) | 60 (10.5%) |
| Total | 552 (100.0%) | 570 (100.0%) |
Real Estate Taxes by Mortgage Status in Orchard City
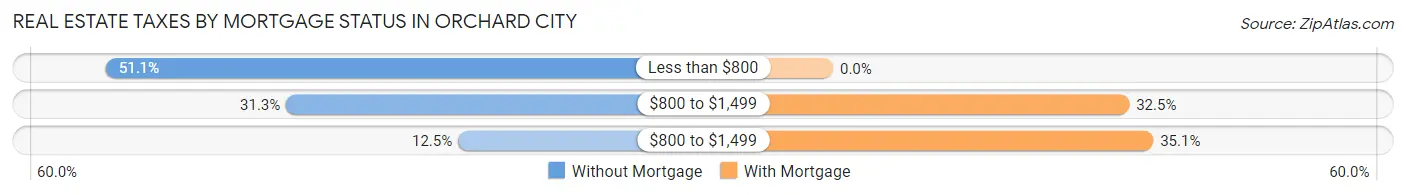
| Property Taxes | Without Mortgage | With Mortgage |
| Less than $800 | 282 (51.1%) | 0 (0.0%) |
| $800 to $1,499 | 173 (31.3%) | 185 (32.5%) |
| $800 to $1,499 | 69 (12.5%) | 200 (35.1%) |
| Total | 552 (100.0%) | 570 (100.0%) |
Health & Disability in Orchard City
Health Insurance Coverage by Age in Orchard City
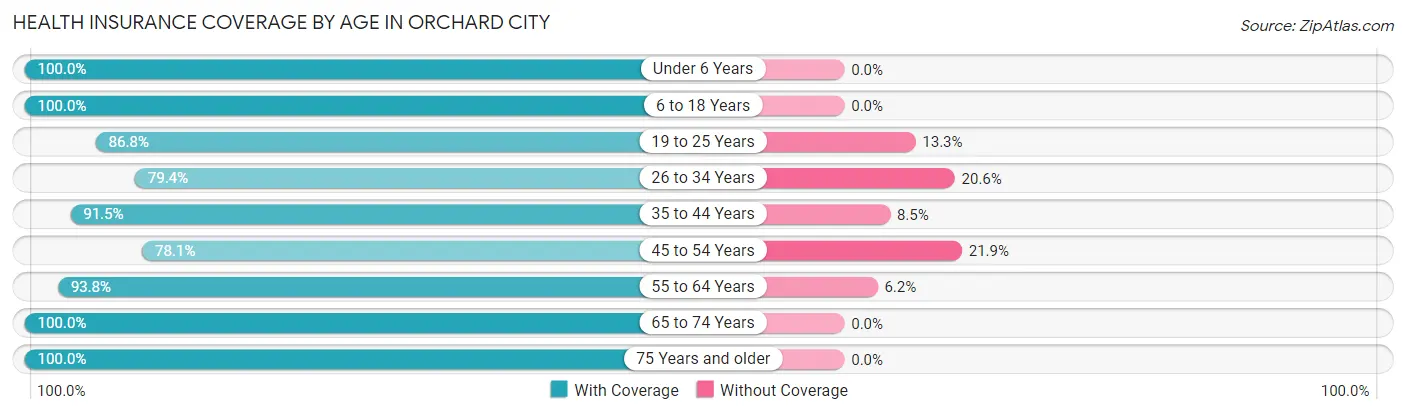
| Age Bracket | With Coverage | Without Coverage |
| Under 6 Years | 112 (100.0%) | 0 (0.0%) |
| 6 to 18 Years | 417 (100.0%) | 0 (0.0%) |
| 19 to 25 Years | 131 (86.8%) | 20 (13.3%) |
| 26 to 34 Years | 309 (79.4%) | 80 (20.6%) |
| 35 to 44 Years | 290 (91.5%) | 27 (8.5%) |
| 45 to 54 Years | 278 (78.1%) | 78 (21.9%) |
| 55 to 64 Years | 471 (93.8%) | 31 (6.2%) |
| 65 to 74 Years | 500 (100.0%) | 0 (0.0%) |
| 75 Years and older | 339 (100.0%) | 0 (0.0%) |
| Total | 2,847 (92.3%) | 236 (7.6%) |
Health Insurance Coverage by Citizenship Status in Orchard City
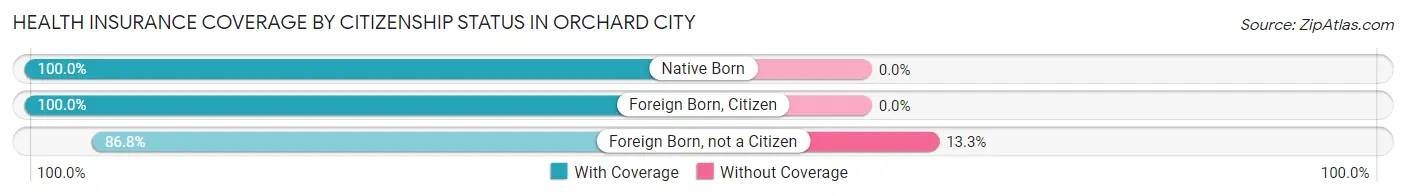
| Citizenship Status | With Coverage | Without Coverage |
| Native Born | 112 (100.0%) | 0 (0.0%) |
| Foreign Born, Citizen | 417 (100.0%) | 0 (0.0%) |
| Foreign Born, not a Citizen | 131 (86.8%) | 20 (13.3%) |
Health Insurance Coverage by Household Income in Orchard City
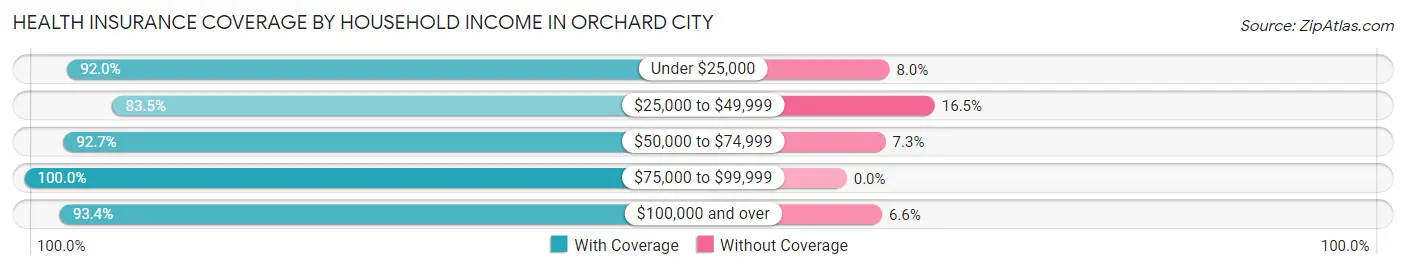
| Household Income | With Coverage | Without Coverage |
| Under $25,000 | 287 (92.0%) | 25 (8.0%) |
| $25,000 to $49,999 | 430 (83.5%) | 85 (16.5%) |
| $50,000 to $74,999 | 790 (92.7%) | 62 (7.3%) |
| $75,000 to $99,999 | 434 (100.0%) | 0 (0.0%) |
| $100,000 and over | 906 (93.4%) | 64 (6.6%) |
Public vs Private Health Insurance Coverage by Age in Orchard City
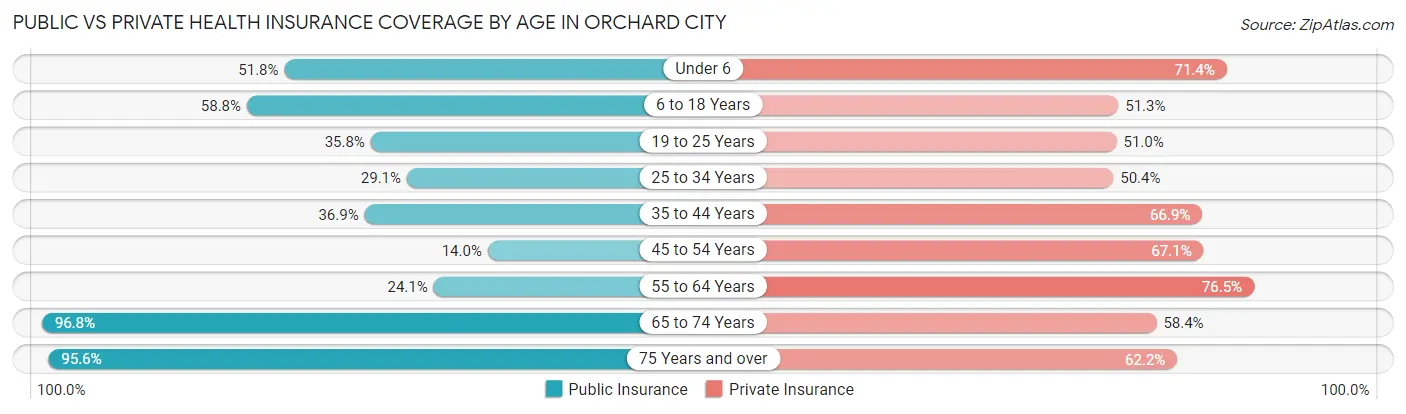
| Age Bracket | Public Insurance | Private Insurance |
| Under 6 | 58 (51.8%) | 80 (71.4%) |
| 6 to 18 Years | 245 (58.8%) | 214 (51.3%) |
| 19 to 25 Years | 54 (35.8%) | 77 (51.0%) |
| 25 to 34 Years | 113 (29.0%) | 196 (50.4%) |
| 35 to 44 Years | 117 (36.9%) | 212 (66.9%) |
| 45 to 54 Years | 50 (14.0%) | 239 (67.1%) |
| 55 to 64 Years | 121 (24.1%) | 384 (76.5%) |
| 65 to 74 Years | 484 (96.8%) | 292 (58.4%) |
| 75 Years and over | 324 (95.6%) | 211 (62.2%) |
| Total | 1,566 (50.8%) | 1,905 (61.8%) |
Disability Status by Sex by Age in Orchard City
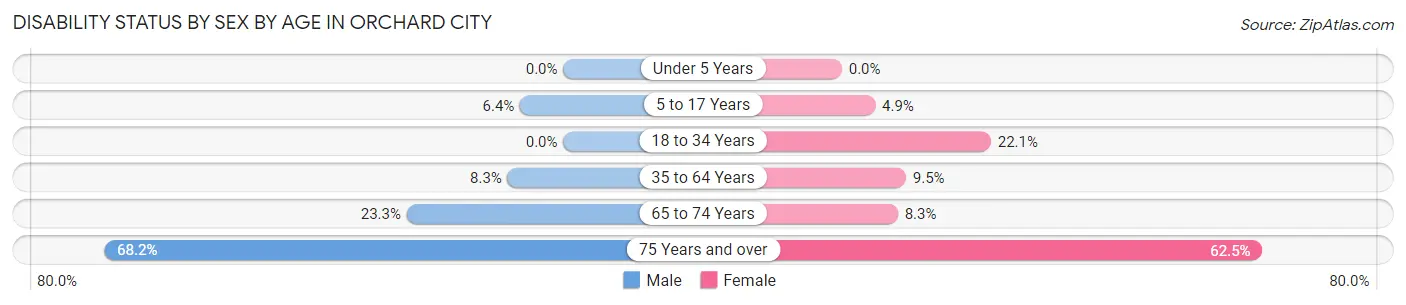
| Age Bracket | Male | Female |
| Under 5 Years | 0 (0.0%) | 0 (0.0%) |
| 5 to 17 Years | 10 (6.4%) | 13 (4.9%) |
| 18 to 34 Years | 0 (0.0%) | 52 (22.1%) |
| 35 to 64 Years | 45 (8.3%) | 60 (9.5%) |
| 65 to 74 Years | 63 (23.3%) | 19 (8.3%) |
| 75 Years and over | 75 (68.2%) | 143 (62.5%) |
Disability Class by Sex by Age in Orchard City
Disability Class: Hearing Difficulty
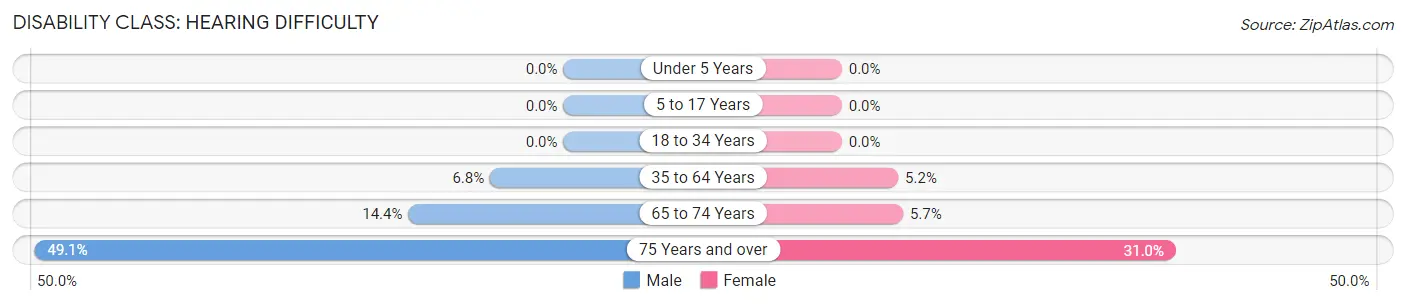
| Age Bracket | Male | Female |
| Under 5 Years | 0 (0.0%) | 0 (0.0%) |
| 5 to 17 Years | 0 (0.0%) | 0 (0.0%) |
| 18 to 34 Years | 0 (0.0%) | 0 (0.0%) |
| 35 to 64 Years | 37 (6.8%) | 33 (5.2%) |
| 65 to 74 Years | 39 (14.4%) | 13 (5.7%) |
| 75 Years and over | 54 (49.1%) | 71 (31.0%) |
Disability Class: Vision Difficulty
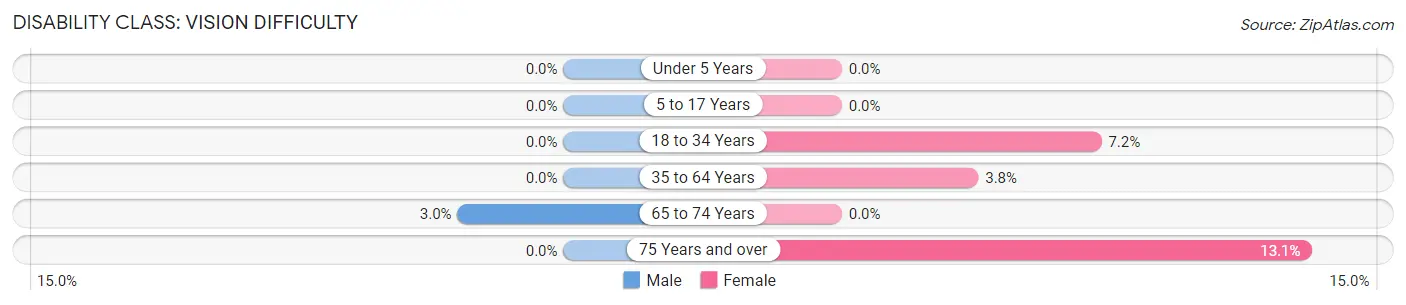
| Age Bracket | Male | Female |
| Under 5 Years | 0 (0.0%) | 0 (0.0%) |
| 5 to 17 Years | 0 (0.0%) | 0 (0.0%) |
| 18 to 34 Years | 0 (0.0%) | 17 (7.2%) |
| 35 to 64 Years | 0 (0.0%) | 24 (3.8%) |
| 65 to 74 Years | 8 (2.9%) | 0 (0.0%) |
| 75 Years and over | 0 (0.0%) | 30 (13.1%) |
Disability Class: Cognitive Difficulty
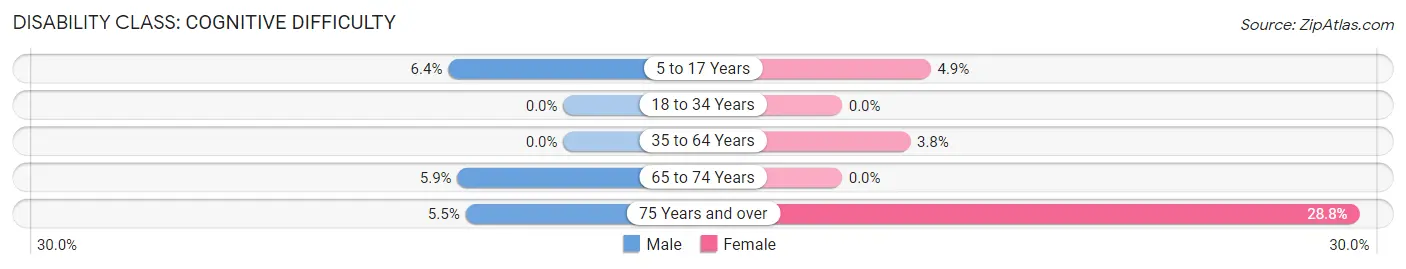
| Age Bracket | Male | Female |
| 5 to 17 Years | 10 (6.4%) | 13 (4.9%) |
| 18 to 34 Years | 0 (0.0%) | 0 (0.0%) |
| 35 to 64 Years | 0 (0.0%) | 24 (3.8%) |
| 65 to 74 Years | 16 (5.9%) | 0 (0.0%) |
| 75 Years and over | 6 (5.4%) | 66 (28.8%) |
Disability Class: Ambulatory Difficulty
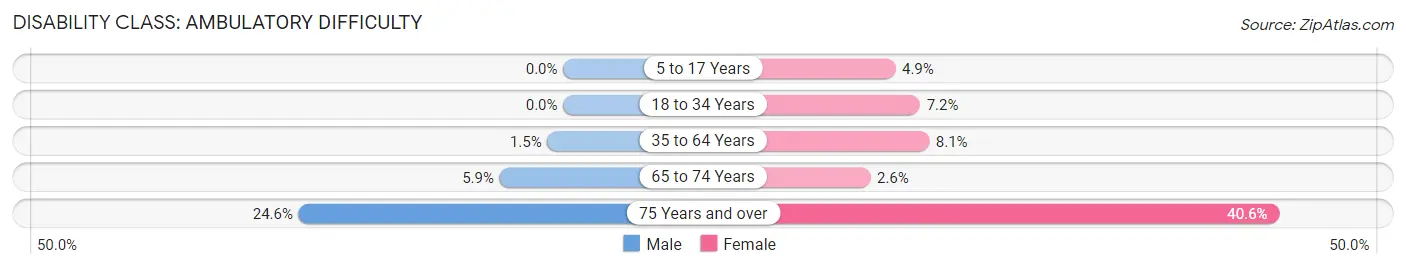
| Age Bracket | Male | Female |
| 5 to 17 Years | 0 (0.0%) | 13 (4.9%) |
| 18 to 34 Years | 0 (0.0%) | 17 (7.2%) |
| 35 to 64 Years | 8 (1.5%) | 51 (8.1%) |
| 65 to 74 Years | 16 (5.9%) | 6 (2.6%) |
| 75 Years and over | 27 (24.5%) | 93 (40.6%) |
Disability Class: Self-Care Difficulty
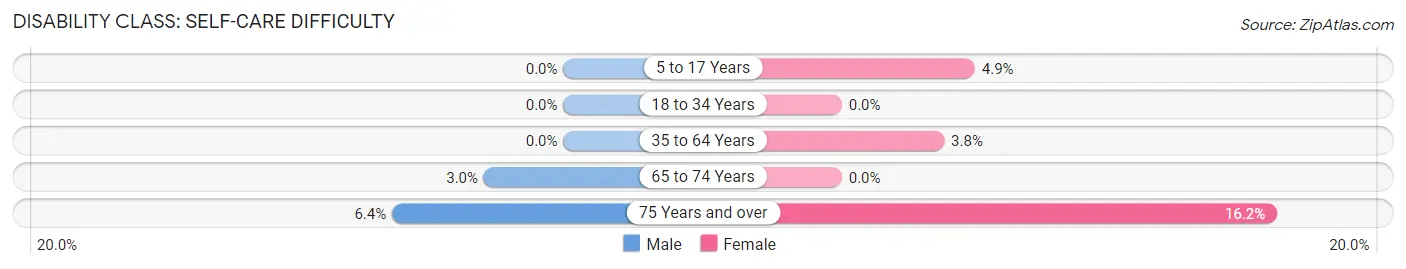
| Age Bracket | Male | Female |
| 5 to 17 Years | 0 (0.0%) | 13 (4.9%) |
| 18 to 34 Years | 0 (0.0%) | 0 (0.0%) |
| 35 to 64 Years | 0 (0.0%) | 24 (3.8%) |
| 65 to 74 Years | 8 (2.9%) | 0 (0.0%) |
| 75 Years and over | 7 (6.4%) | 37 (16.2%) |
Technology Access in Orchard City
Computing Device Access in Orchard City
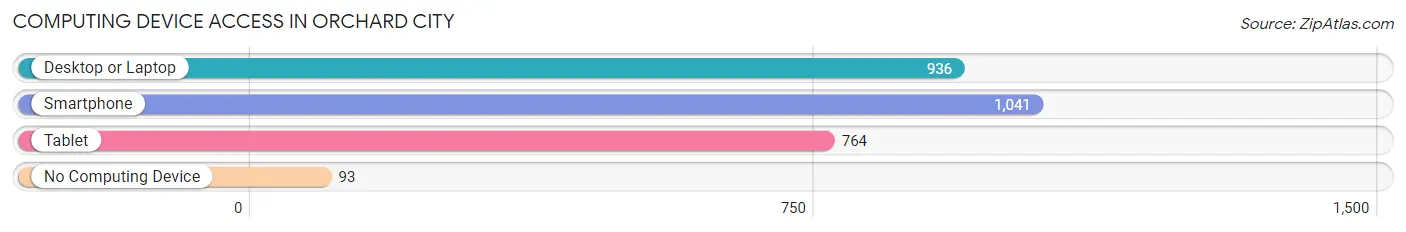
| Device Type | # Households | % Households |
| Desktop or Laptop | 936 | 71.4% |
| Smartphone | 1,041 | 79.4% |
| Tablet | 764 | 58.3% |
| No Computing Device | 93 | 7.1% |
| Total | 1,311 | 100.0% |
Internet Access in Orchard City
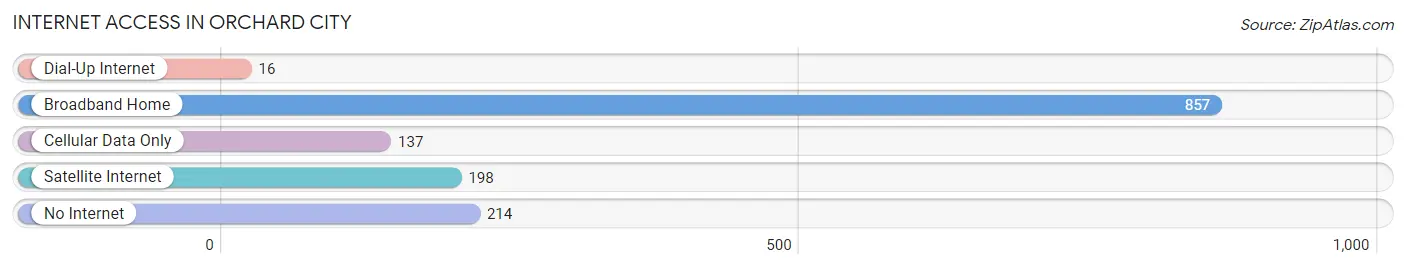
| Internet Type | # Households | % Households |
| Dial-Up Internet | 16 | 1.2% |
| Broadband Home | 857 | 65.4% |
| Cellular Data Only | 137 | 10.4% |
| Satellite Internet | 198 | 15.1% |
| No Internet | 214 | 16.3% |
| Total | 1,311 | 100.0% |
Orchard City Summary
Orchard City, Colorado is a small town located in Delta County, Colorado. It is situated in the Grand Valley, which is a large agricultural area in western Colorado. The town was founded in 1881 and has a population of approximately 1,500 people.
History
Orchard City was founded in 1881 by a group of settlers from the Midwest. The settlers were looking for a place to start a new life and found the Grand Valley to be an ideal location. The town was originally called Grand Valley, but the name was changed to Orchard City in 1883. The name was chosen to reflect the abundance of fruit trees in the area.
The town quickly grew and by the early 1900s, it had become a thriving agricultural center. The town was home to several large farms and orchards, as well as a number of small businesses. The town also had a school, a post office, and a train station.
In the 1950s, the town began to decline as many of the farms and orchards were sold off or abandoned. The town’s population decreased and many of the businesses closed. However, in the late 1970s, the town began to experience a resurgence as people began to move back to the area.
Geography
Orchard City is located in the Grand Valley of western Colorado. The town is situated at an elevation of 4,890 feet and is surrounded by the Uncompahgre Plateau to the north and the Grand Mesa to the south. The town is located near the Gunnison River, which provides a source of irrigation for the area.
The climate in Orchard City is semi-arid, with hot summers and cold winters. The average annual temperature is around 50 degrees Fahrenheit. The town receives an average of 12 inches of precipitation per year, most of which falls in the form of snow.
Economy
The economy of Orchard City is largely based on agriculture. The town is home to several large farms and orchards, as well as a number of small businesses. The town is also home to a number of wineries and breweries, which attract tourists to the area.
The town is also home to a number of manufacturing companies, including a furniture factory and a plastics factory. The town is also home to a number of retail stores, including a grocery store, a hardware store, and a clothing store.
Demographics
As of the 2010 census, the population of Orchard City was 1,500. The town is predominantly white, with a small Hispanic population. The median household income is $41,000 and the median home value is $150,000.
The town is served by the Delta County School District, which includes two elementary schools, a middle school, and a high school. The town is also home to a branch of the Delta County Library.
Conclusion
Orchard City, Colorado is a small town located in Delta County, Colorado. The town was founded in 1881 and has a population of approximately 1,500 people. The town’s economy is largely based on agriculture, with a number of wineries and breweries, as well as a number of manufacturing and retail businesses. The town is predominantly white, with a small Hispanic population. The town is served by the Delta County School District and is home to a branch of the Delta County Library.
Common Questions
What is Per Capita Income in Orchard City?
Per Capita income in Orchard City is $33,754.
What is the Median Family Income in Orchard City?
Median Family Income in Orchard City is $78,636.
What is the Median Household income in Orchard City?
Median Household Income in Orchard City is $69,556.
What is Income or Wage Gap in Orchard City?
Income or Wage Gap in Orchard City is 57.3%.
Women in Orchard City earn 42.7 cents for every dollar earned by a man.
What is Inequality or Gini Index in Orchard City?
Inequality or Gini Index in Orchard City is 0.37.
What is the Total Population of Orchard City?
Total Population of Orchard City is 3,150.
What is the Total Male Population of Orchard City?
Total Male Population of Orchard City is 1,453.
What is the Total Female Population of Orchard City?
Total Female Population of Orchard City is 1,697.
What is the Ratio of Males per 100 Females in Orchard City?
There are 85.62 Males per 100 Females in Orchard City.
What is the Ratio of Females per 100 Males in Orchard City?
There are 116.79 Females per 100 Males in Orchard City.
What is the Median Population Age in Orchard City?
Median Population Age in Orchard City is 52.5 Years.
What is the Average Family Size in Orchard City
Average Family Size in Orchard City is 2.8 People.
What is the Average Household Size in Orchard City
Average Household Size in Orchard City is 2.4 People.
How Large is the Labor Force in Orchard City?
There are 1,570 People in the Labor Forcein in Orchard City.
What is the Percentage of People in the Labor Force in Orchard City?
57.2% of People are in the Labor Force in Orchard City.
What is the Unemployment Rate in Orchard City?
Unemployment Rate in Orchard City is 4.8%.