Oak Creek, CO Map & Demographics
Oak Creek Map
Oak Creek Overview
$46,652
PER CAPITA INCOME
$109,464
AVG FAMILY INCOME
$87,228
AVG HOUSEHOLD INCOME
30.3%
WAGE / INCOME GAP [ % ]
69.7¢/ $1
WAGE / INCOME GAP [ $ ]
0.38
INEQUALITY / GINI INDEX
681
TOTAL POPULATION
362
MALE POPULATION
319
FEMALE POPULATION
113.48
MALES / 100 FEMALES
88.12
FEMALES / 100 MALES
45.2
MEDIAN AGE
2.7
AVG FAMILY SIZE
2.1
AVG HOUSEHOLD SIZE
405
LABOR FORCE [ PEOPLE ]
70.8%
PERCENT IN LABOR FORCE
3.2%
UNEMPLOYMENT RATE
Oak Creek Zip Codes
Oak Creek Area Codes
Income in Oak Creek
Income Overview in Oak Creek
Per Capita Income in Oak Creek is $46,652, while median incomes of families and households are $109,464 and $87,228 respectively.
| Characteristic | Number | Measure |
| Per Capita Income | 681 | $46,652 |
| Median Family Income | 202 | $109,464 |
| Mean Family Income | 202 | $123,127 |
| Median Household Income | 327 | $87,228 |
| Mean Household Income | 327 | $97,408 |
| Income Deficit | 202 | $0 |
| Wage / Income Gap (%) | 681 | 30.34% |
| Wage / Income Gap ($) | 681 | 69.66¢ per $1 |
| Gini / Inequality Index | 681 | 0.38 |
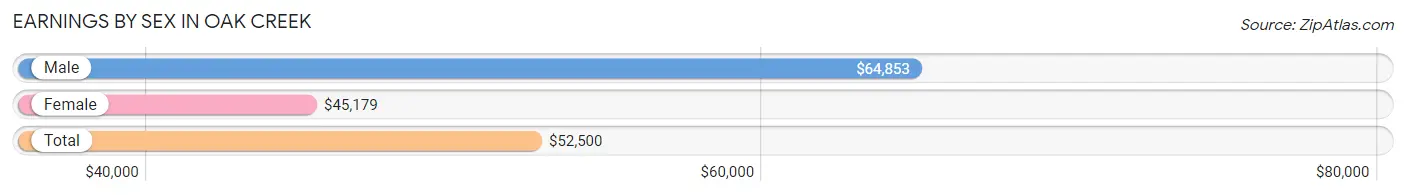
Earnings by Sex in Oak Creek
Average Earnings in Oak Creek are $52,500, $64,853 for men and $45,179 for women, a difference of 30.3%.
| Sex | Number | Average Earnings |
| Male | 222 (53.4%) | $64,853 |
| Female | 194 (46.6%) | $45,179 |
| Total | 416 (100.0%) | $52,500 |
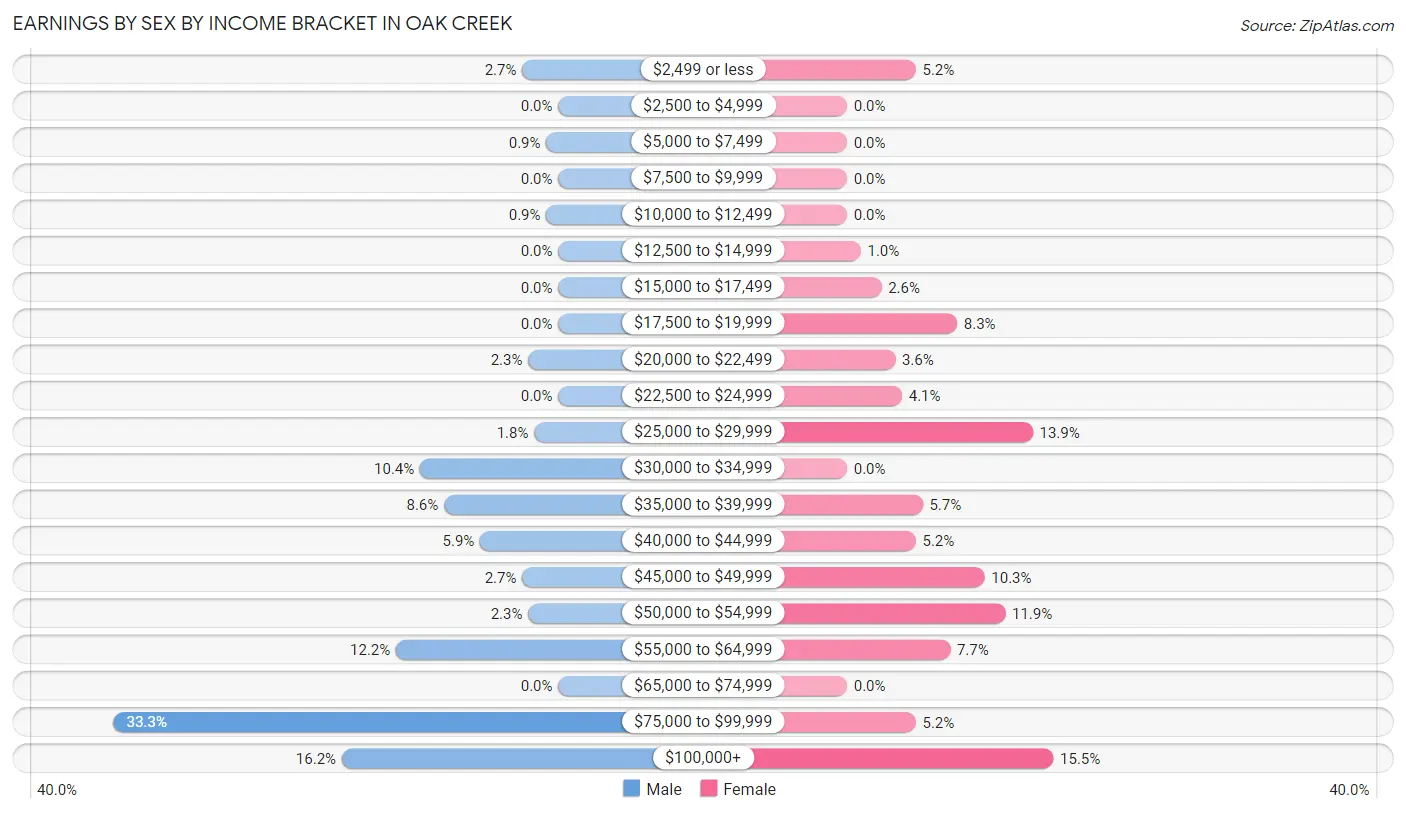
Earnings by Sex by Income Bracket in Oak Creek
The most common earnings brackets in Oak Creek are $75,000 to $99,999 for men (74 | 33.3%) and $100,000+ for women (30 | 15.5%).
| Income | Male | Female |
| $2,499 or less | 6 (2.7%) | 10 (5.1%) |
| $2,500 to $4,999 | 0 (0.0%) | 0 (0.0%) |
| $5,000 to $7,499 | 2 (0.9%) | 0 (0.0%) |
| $7,500 to $9,999 | 0 (0.0%) | 0 (0.0%) |
| $10,000 to $12,499 | 2 (0.9%) | 0 (0.0%) |
| $12,500 to $14,999 | 0 (0.0%) | 2 (1.0%) |
| $15,000 to $17,499 | 0 (0.0%) | 5 (2.6%) |
| $17,500 to $19,999 | 0 (0.0%) | 16 (8.3%) |
| $20,000 to $22,499 | 5 (2.2%) | 7 (3.6%) |
| $22,500 to $24,999 | 0 (0.0%) | 8 (4.1%) |
| $25,000 to $29,999 | 4 (1.8%) | 27 (13.9%) |
| $30,000 to $34,999 | 23 (10.4%) | 0 (0.0%) |
| $35,000 to $39,999 | 19 (8.6%) | 11 (5.7%) |
| $40,000 to $44,999 | 13 (5.9%) | 10 (5.1%) |
| $45,000 to $49,999 | 6 (2.7%) | 20 (10.3%) |
| $50,000 to $54,999 | 5 (2.2%) | 23 (11.9%) |
| $55,000 to $64,999 | 27 (12.2%) | 15 (7.7%) |
| $65,000 to $74,999 | 0 (0.0%) | 0 (0.0%) |
| $75,000 to $99,999 | 74 (33.3%) | 10 (5.1%) |
| $100,000+ | 36 (16.2%) | 30 (15.5%) |
| Total | 222 (100.0%) | 194 (100.0%) |
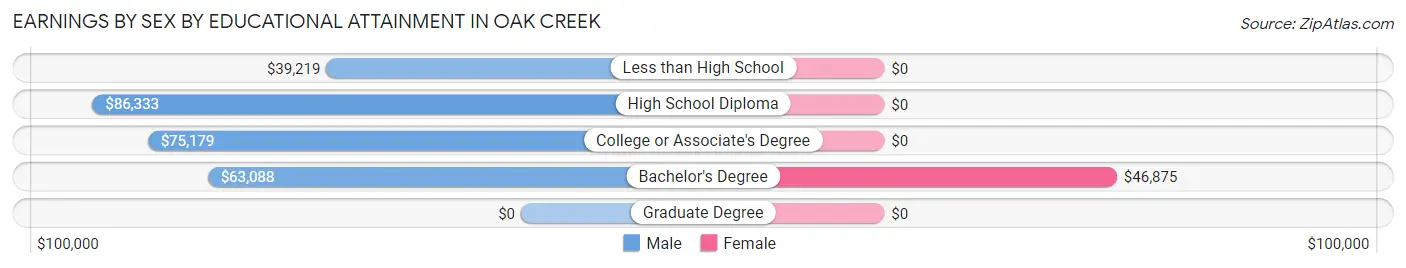
Earnings by Sex by Educational Attainment in Oak Creek
Average earnings in Oak Creek are $75,357 for men and $45,625 for women, a difference of 39.5%. Men with an educational attainment of high school diploma enjoy the highest average annual earnings of $86,333, while those with less than high school education earn the least with $39,219. Women with an educational attainment of bachelor's degree earn the most with the average annual earnings of $46,875, while those with bachelor's degree education have the smallest earnings of $46,875.
| Educational Attainment | Male Income | Female Income |
| Less than High School | $39,219 | $0 |
| High School Diploma | $86,333 | $0 |
| College or Associate's Degree | $75,179 | $0 |
| Bachelor's Degree | $63,088 | $46,875 |
| Graduate Degree | - | - |
| Total | $75,357 | $45,625 |
Family Income in Oak Creek
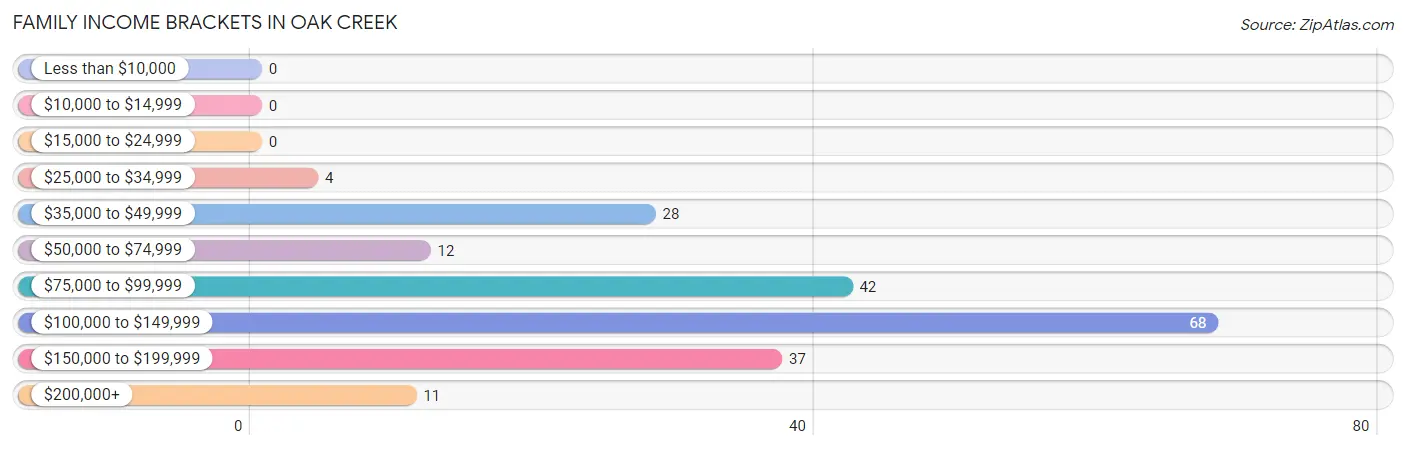
Family Income Brackets in Oak Creek
According to the Oak Creek family income data, there are 68 families falling into the $100,000 to $149,999 income range, which is the most common income bracket and makes up 33.7% of all families.
| Income Bracket | # Families | % Families |
| Less than $10,000 | 0 | 0.0% |
| $10,000 to $14,999 | 0 | 0.0% |
| $15,000 to $24,999 | 0 | 0.0% |
| $25,000 to $34,999 | 4 | 2.0% |
| $35,000 to $49,999 | 28 | 13.9% |
| $50,000 to $74,999 | 12 | 5.9% |
| $75,000 to $99,999 | 42 | 20.8% |
| $100,000 to $149,999 | 68 | 33.7% |
| $150,000 to $199,999 | 37 | 18.3% |
| $200,000+ | 11 | 5.4% |
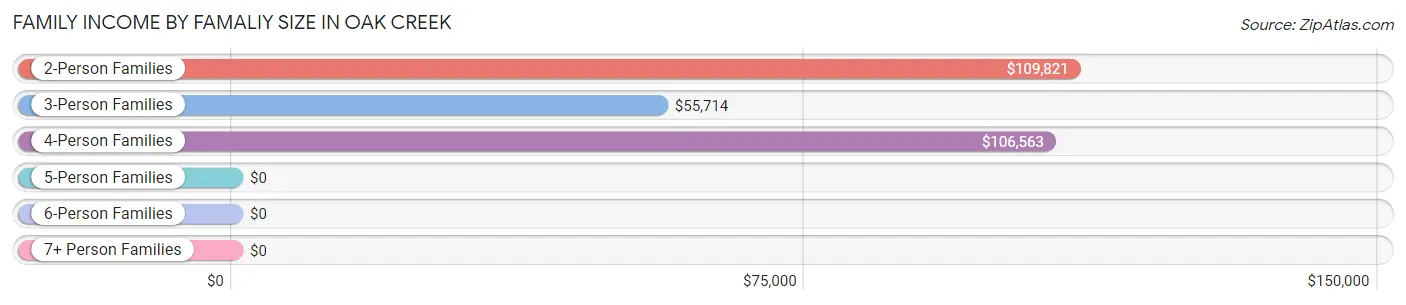
Family Income by Famaliy Size in Oak Creek
2-person families (120 | 59.4%) account for the highest median family income in Oak Creek with $109,821 per family, while 2-person families (120 | 59.4%) have the highest median income of $54,910 per family member.
| Income Bracket | # Families | Median Income |
| 2-Person Families | 120 (59.4%) | $109,821 |
| 3-Person Families | 22 (10.9%) | $55,714 |
| 4-Person Families | 39 (19.3%) | $106,563 |
| 5-Person Families | 21 (10.4%) | $0 |
| 6-Person Families | 0 (0.0%) | $0 |
| 7+ Person Families | 0 (0.0%) | $0 |
| Total | 202 (100.0%) | $109,464 |
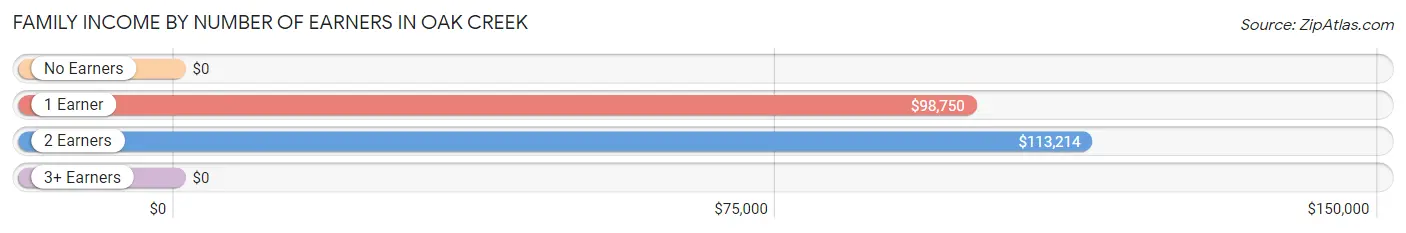
Family Income by Number of Earners in Oak Creek
| Number of Earners | # Families | Median Income |
| No Earners | 10 (5.0%) | $0 |
| 1 Earner | 68 (33.7%) | $98,750 |
| 2 Earners | 120 (59.4%) | $113,214 |
| 3+ Earners | 4 (2.0%) | $0 |
| Total | 202 (100.0%) | $109,464 |
Household Income in Oak Creek
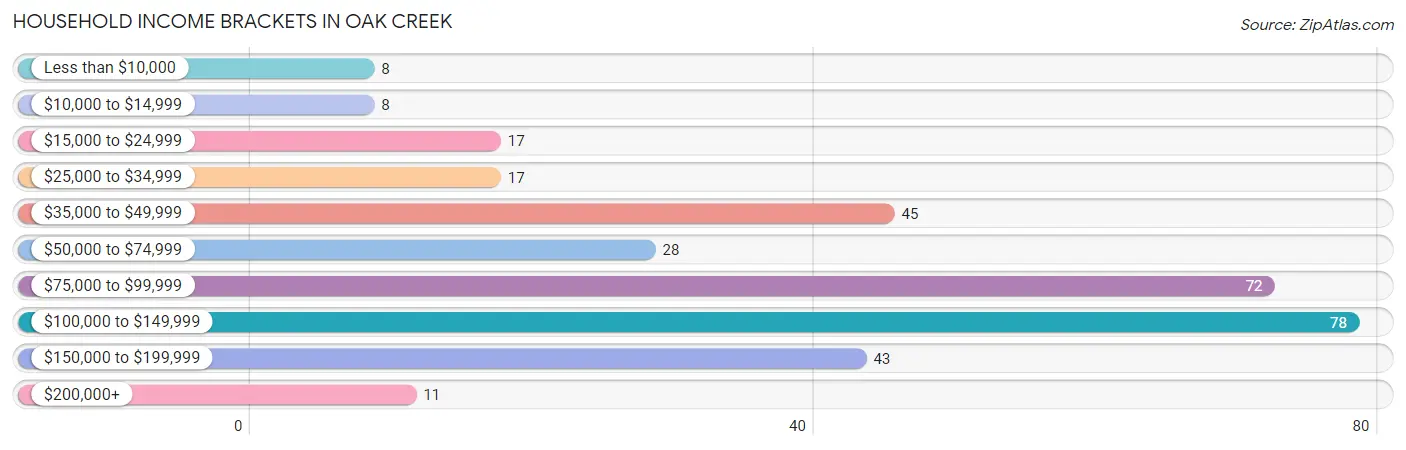
Household Income Brackets in Oak Creek
With 78 households falling in the category, the $100,000 to $149,999 income range is the most frequent in Oak Creek, accounting for 23.8% of all households. In contrast, only 8 households (2.5%) fall into the less than $10,000 income bracket, making it the least populous group.
| Income Bracket | # Households | % Households |
| Less than $10,000 | 8 | 2.4% |
| $10,000 to $14,999 | 8 | 2.4% |
| $15,000 to $24,999 | 17 | 5.2% |
| $25,000 to $34,999 | 17 | 5.2% |
| $35,000 to $49,999 | 45 | 13.8% |
| $50,000 to $74,999 | 28 | 8.6% |
| $75,000 to $99,999 | 72 | 22.0% |
| $100,000 to $149,999 | 78 | 23.9% |
| $150,000 to $199,999 | 43 | 13.1% |
| $200,000+ | 11 | 3.4% |
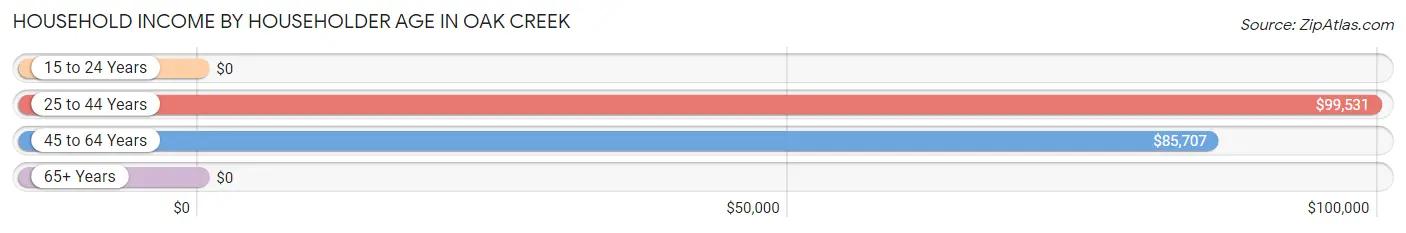
Household Income by Householder Age in Oak Creek
The median household income in Oak Creek is $87,228, with the highest median household income of $99,531 found in the 25 to 44 years age bracket for the primary householder. A total of 87 households (26.6%) fall into this category. Meanwhile, the 15 to 24 years age bracket for the primary householder has the lowest median household income of $0, with 5 households (1.5%) in this group.
| Income Bracket | # Households | Median Income |
| 15 to 24 Years | 5 (1.5%) | $0 |
| 25 to 44 Years | 87 (26.6%) | $99,531 |
| 45 to 64 Years | 155 (47.4%) | $85,707 |
| 65+ Years | 80 (24.5%) | $0 |
| Total | 327 (100.0%) | $87,228 |
Poverty in Oak Creek
Income Below Poverty by Sex and Age in Oak Creek
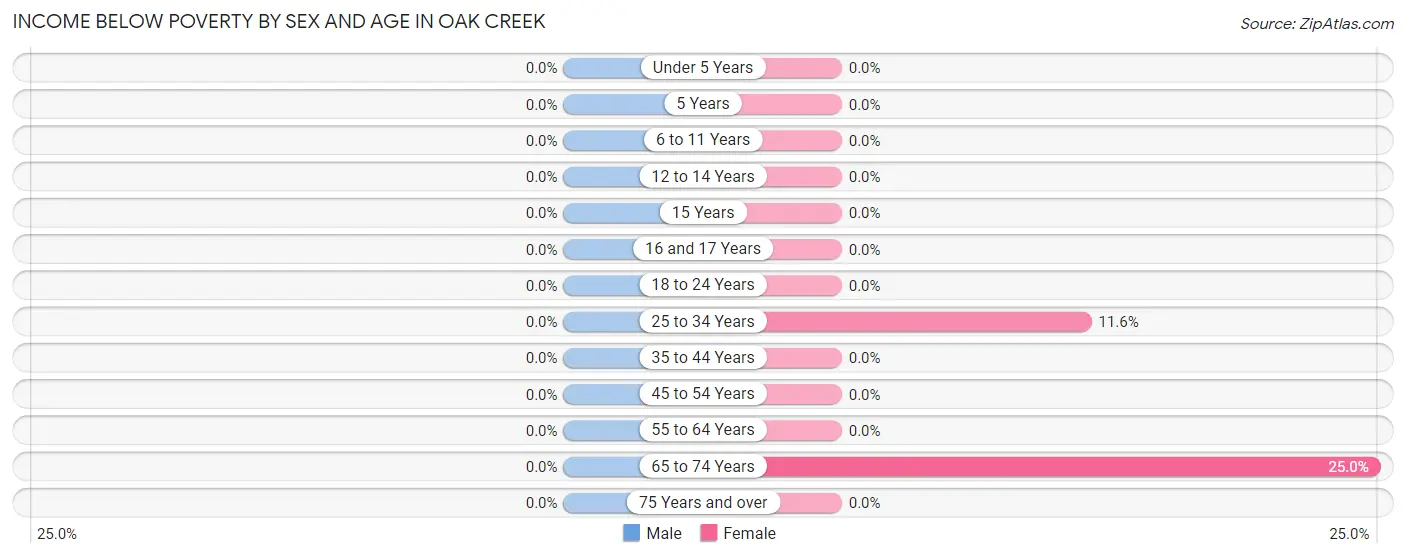
| Age Bracket | Male | Female |
| Under 5 Years | 0 (0.0%) | 0 (0.0%) |
| 5 Years | 0 (0.0%) | 0 (0.0%) |
| 6 to 11 Years | 0 (0.0%) | 0 (0.0%) |
| 12 to 14 Years | 0 (0.0%) | 0 (0.0%) |
| 15 Years | 0 (0.0%) | 0 (0.0%) |
| 16 and 17 Years | 0 (0.0%) | 0 (0.0%) |
| 18 to 24 Years | 0 (0.0%) | 0 (0.0%) |
| 25 to 34 Years | 0 (0.0%) | 8 (11.6%) |
| 35 to 44 Years | 0 (0.0%) | 0 (0.0%) |
| 45 to 54 Years | 0 (0.0%) | 0 (0.0%) |
| 55 to 64 Years | 0 (0.0%) | 0 (0.0%) |
| 65 to 74 Years | 0 (0.0%) | 8 (25.0%) |
| 75 Years and over | 0 (0.0%) | 0 (0.0%) |
| Total | 0 (0.0%) | 16 (5.0%) |
Income Above Poverty by Sex and Age in Oak Creek
According to the poverty statistics in Oak Creek, males aged 5 years and females aged under 5 years are the age groups that are most secure financially, with 100.0% of males and 100.0% of females in these age groups living above the poverty line.
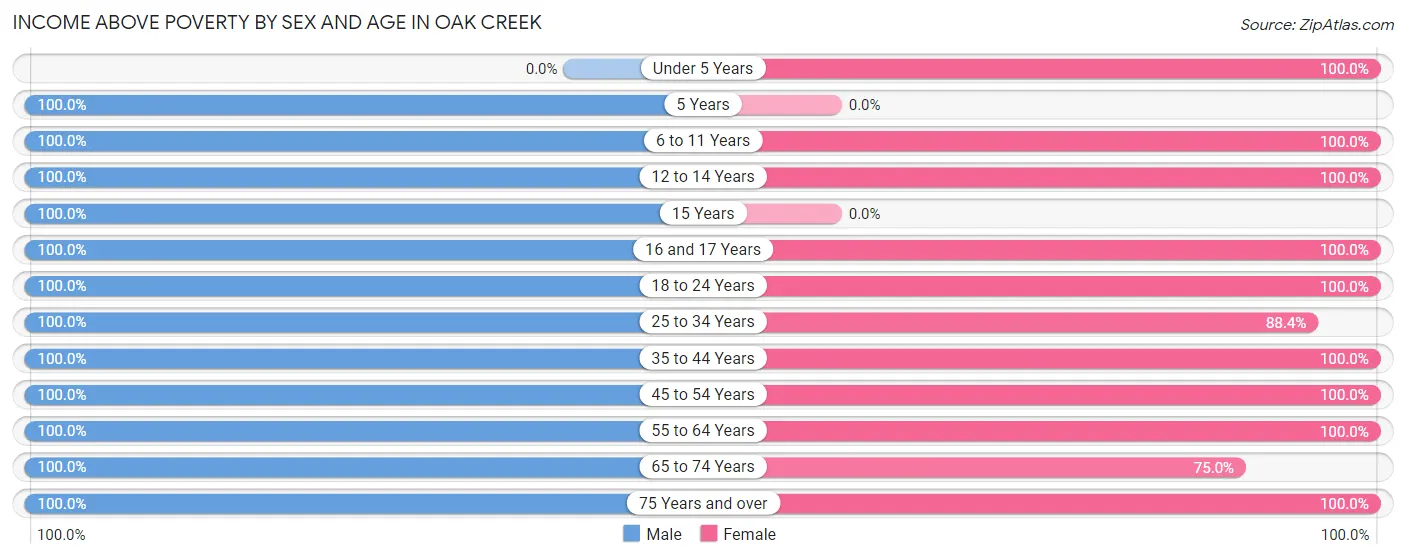
| Age Bracket | Male | Female |
| Under 5 Years | 0 (0.0%) | 13 (100.0%) |
| 5 Years | 9 (100.0%) | 0 (0.0%) |
| 6 to 11 Years | 51 (100.0%) | 8 (100.0%) |
| 12 to 14 Years | 22 (100.0%) | 2 (100.0%) |
| 15 Years | 4 (100.0%) | 0 (0.0%) |
| 16 and 17 Years | 6 (100.0%) | 4 (100.0%) |
| 18 to 24 Years | 4 (100.0%) | 17 (100.0%) |
| 25 to 34 Years | 33 (100.0%) | 61 (88.4%) |
| 35 to 44 Years | 44 (100.0%) | 49 (100.0%) |
| 45 to 54 Years | 53 (100.0%) | 83 (100.0%) |
| 55 to 64 Years | 79 (100.0%) | 28 (100.0%) |
| 65 to 74 Years | 54 (100.0%) | 24 (75.0%) |
| 75 Years and over | 3 (100.0%) | 14 (100.0%) |
| Total | 362 (100.0%) | 303 (95.0%) |
Income Below Poverty Among Married-Couple Families in Oak Creek
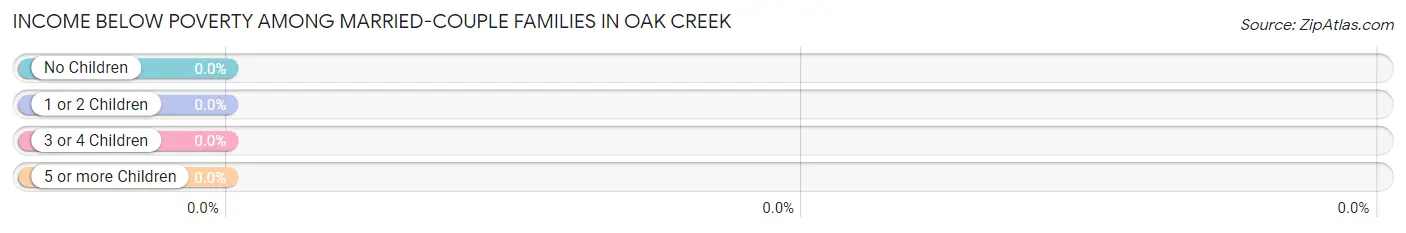
| Children | Above Poverty | Below Poverty |
| No Children | 114 (100.0%) | 0 (0.0%) |
| 1 or 2 Children | 56 (100.0%) | 0 (0.0%) |
| 3 or 4 Children | 11 (100.0%) | 0 (0.0%) |
| 5 or more Children | 0 (0.0%) | 0 (0.0%) |
| Total | 181 (100.0%) | 0 (0.0%) |
Income Below Poverty Among Single-Parent Households in Oak Creek
| Children | Single Father | Single Mother |
| No Children | 0 (0.0%) | 0 (0.0%) |
| 1 or 2 Children | 0 (0.0%) | 0 (0.0%) |
| 3 or 4 Children | 0 (0.0%) | 0 (0.0%) |
| 5 or more Children | 0 (0.0%) | 0 (0.0%) |
| Total | 0 (0.0%) | 0 (0.0%) |
Income Below Poverty Among Married-Couple vs Single-Parent Households in Oak Creek
| Children | Married-Couple Families | Single-Parent Households |
| No Children | 0 (0.0%) | 0 (0.0%) |
| 1 or 2 Children | 0 (0.0%) | 0 (0.0%) |
| 3 or 4 Children | 0 (0.0%) | 0 (0.0%) |
| 5 or more Children | 0 (0.0%) | 0 (0.0%) |
| Total | 0 (0.0%) | 0 (0.0%) |
Race in Oak Creek
The most populous races in Oak Creek are White / Caucasian (638 | 93.7%), Two or more Races (32 | 4.7%), and Hispanic or Latino (23 | 3.4%).
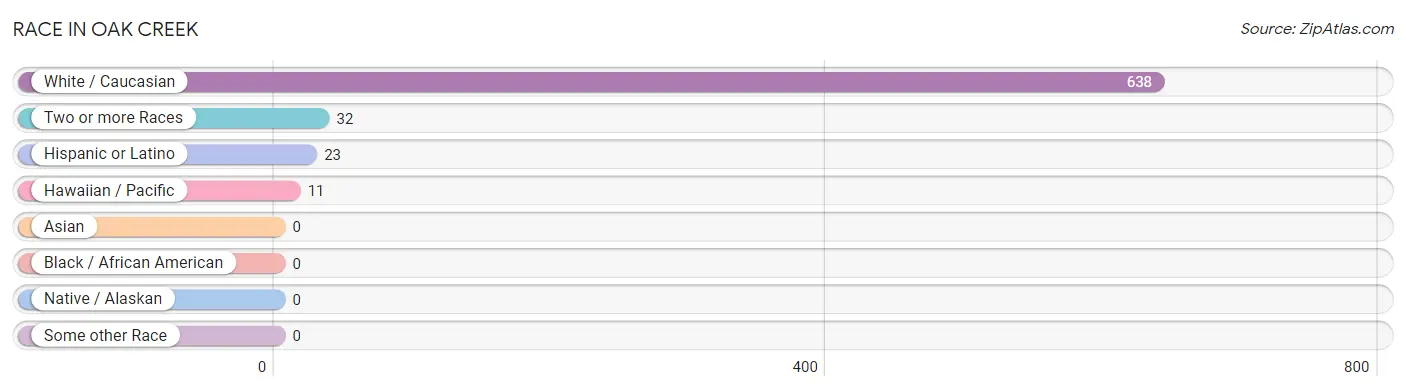
| Race | # Population | % Population |
| Asian | 0 | 0.0% |
| Black / African American | 0 | 0.0% |
| Hawaiian / Pacific | 11 | 1.6% |
| Hispanic or Latino | 23 | 3.4% |
| Native / Alaskan | 0 | 0.0% |
| White / Caucasian | 638 | 93.7% |
| Two or more Races | 32 | 4.7% |
| Some other Race | 0 | 0.0% |
| Total | 681 | 100.0% |
Ancestry in Oak Creek
The most populous ancestries reported in Oak Creek are German (152 | 22.3%), Irish (99 | 14.5%), English (83 | 12.2%), American (25 | 3.7%), and Danish (14 | 2.1%), together accounting for 54.8% of all Oak Creek residents.
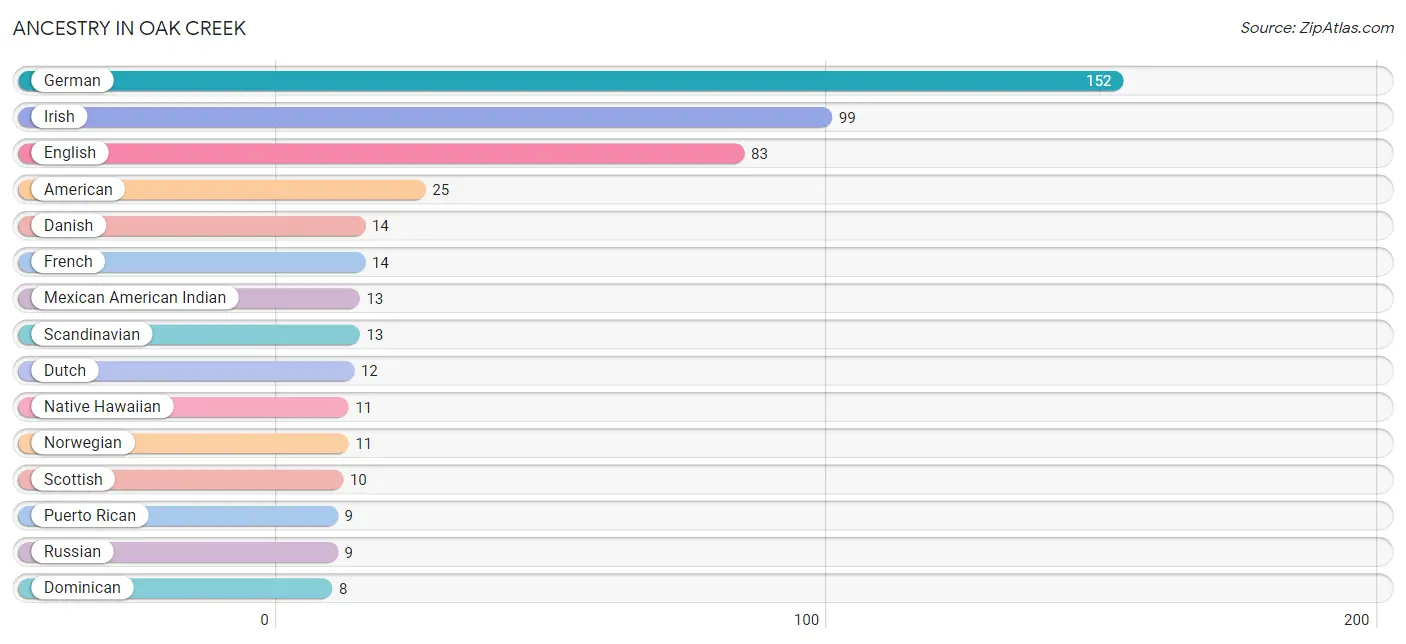
| Ancestry | # Population | % Population |
| American | 25 | 3.7% |
| Croatian | 7 | 1.0% |
| Danish | 14 | 2.1% |
| Dominican | 8 | 1.2% |
| Dutch | 12 | 1.8% |
| English | 83 | 12.2% |
| French | 14 | 2.1% |
| German | 152 | 22.3% |
| Irish | 99 | 14.5% |
| Mexican | 6 | 0.9% |
| Mexican American Indian | 13 | 1.9% |
| Native Hawaiian | 11 | 1.6% |
| Norwegian | 11 | 1.6% |
| Puerto Rican | 9 | 1.3% |
| Romanian | 5 | 0.7% |
| Russian | 9 | 1.3% |
| Scandinavian | 13 | 1.9% |
| Scotch-Irish | 6 | 0.9% |
| Scottish | 10 | 1.5% | View All 19 Rows |
Immigrants in Oak Creek
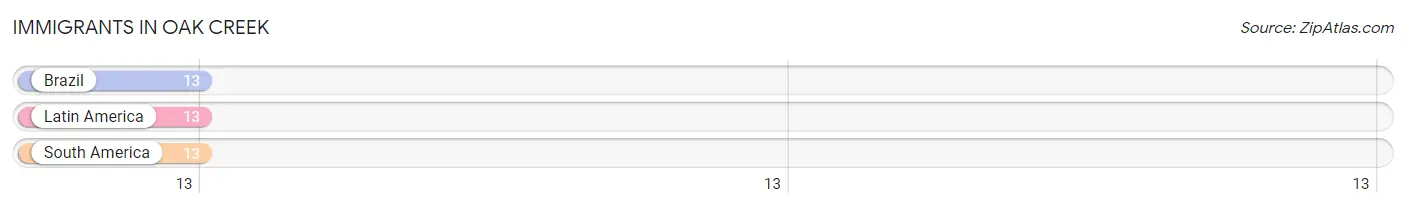
The most numerous immigrant groups reported in Oak Creek came from Brazil (13 | 1.9%), Latin America (13 | 1.9%), and South America (13 | 1.9%), together accounting for 5.7% of all Oak Creek residents.
| Immigration Origin | # Population | % Population |
| Brazil | 13 | 1.9% |
| Latin America | 13 | 1.9% |
| South America | 13 | 1.9% | View All 3 Rows |
Sex and Age in Oak Creek
Sex and Age in Oak Creek
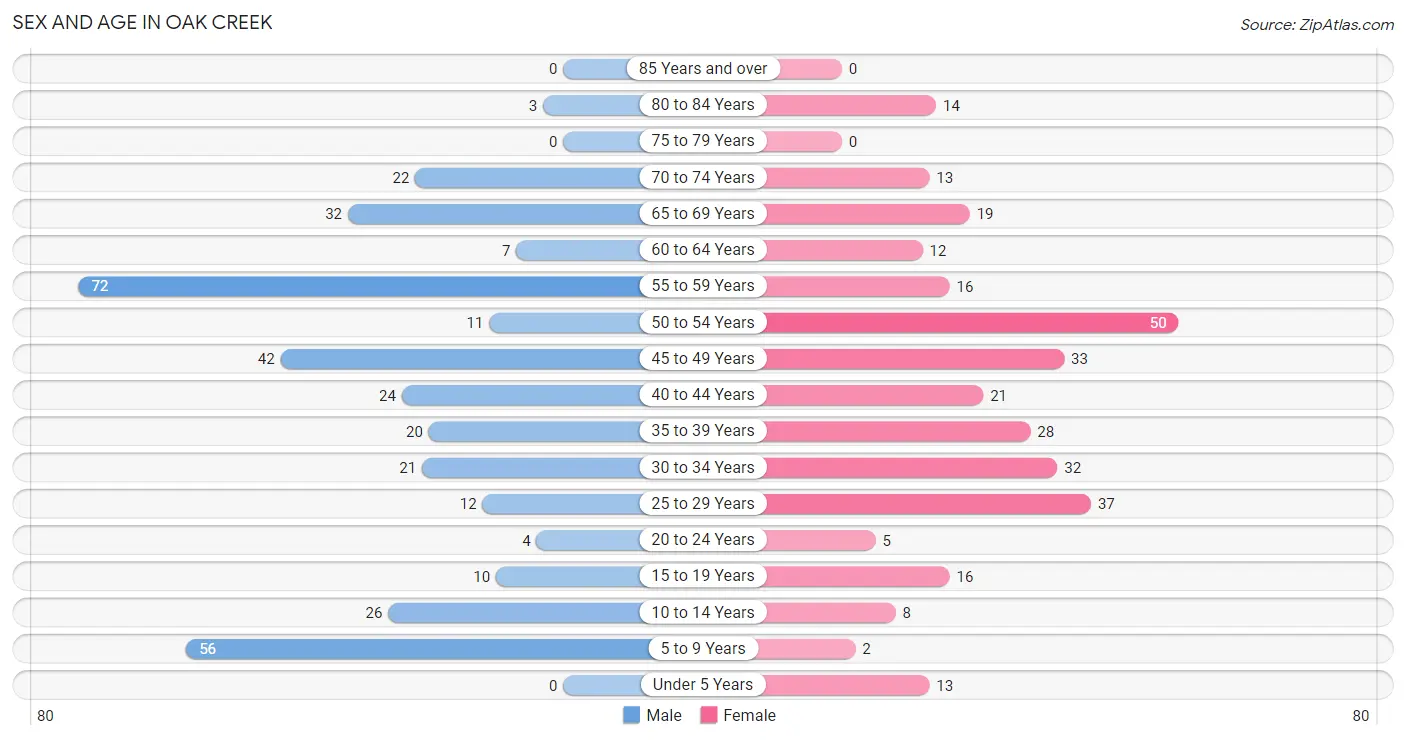
The most populous age groups in Oak Creek are 55 to 59 Years (72 | 19.9%) for men and 50 to 54 Years (50 | 15.7%) for women.
| Age Bracket | Male | Female |
| Under 5 Years | 0 (0.0%) | 13 (4.1%) |
| 5 to 9 Years | 56 (15.5%) | 2 (0.6%) |
| 10 to 14 Years | 26 (7.2%) | 8 (2.5%) |
| 15 to 19 Years | 10 (2.8%) | 16 (5.0%) |
| 20 to 24 Years | 4 (1.1%) | 5 (1.6%) |
| 25 to 29 Years | 12 (3.3%) | 37 (11.6%) |
| 30 to 34 Years | 21 (5.8%) | 32 (10.0%) |
| 35 to 39 Years | 20 (5.5%) | 28 (8.8%) |
| 40 to 44 Years | 24 (6.6%) | 21 (6.6%) |
| 45 to 49 Years | 42 (11.6%) | 33 (10.3%) |
| 50 to 54 Years | 11 (3.0%) | 50 (15.7%) |
| 55 to 59 Years | 72 (19.9%) | 16 (5.0%) |
| 60 to 64 Years | 7 (1.9%) | 12 (3.8%) |
| 65 to 69 Years | 32 (8.8%) | 19 (6.0%) |
| 70 to 74 Years | 22 (6.1%) | 13 (4.1%) |
| 75 to 79 Years | 0 (0.0%) | 0 (0.0%) |
| 80 to 84 Years | 3 (0.8%) | 14 (4.4%) |
| 85 Years and over | 0 (0.0%) | 0 (0.0%) |
| Total | 362 (100.0%) | 319 (100.0%) |
Families and Households in Oak Creek
Median Family Size in Oak Creek
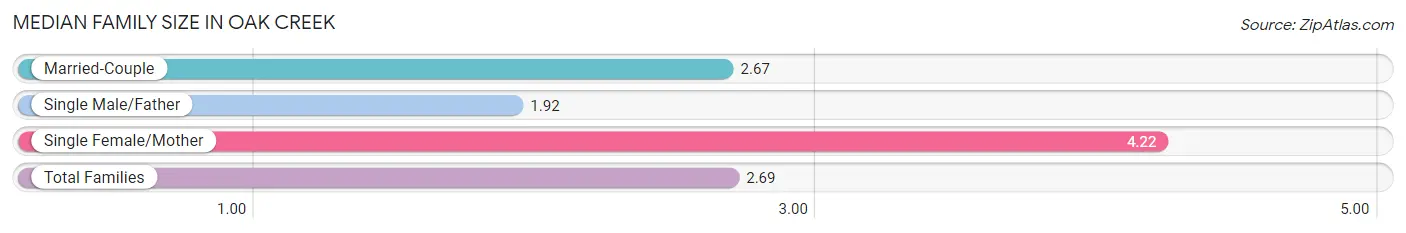
The median family size in Oak Creek is 2.69 persons per family, with single female/mother families (9 | 4.5%) accounting for the largest median family size of 4.22 persons per family. On the other hand, single male/father families (12 | 5.9%) represent the smallest median family size with 1.92 persons per family.
| Family Type | # Families | Family Size |
| Married-Couple | 181 (89.6%) | 2.67 |
| Single Male/Father | 12 (5.9%) | 1.92 |
| Single Female/Mother | 9 (4.5%) | 4.22 |
| Total Families | 202 (100.0%) | 2.69 |
Median Household Size in Oak Creek
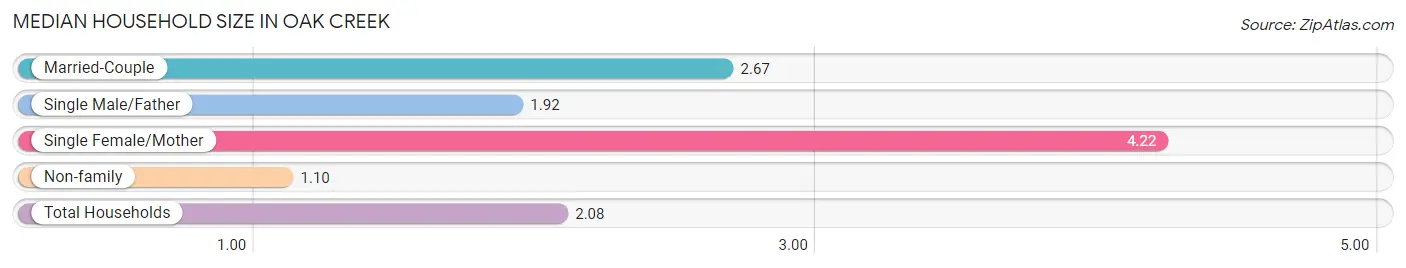
The median household size in Oak Creek is 2.08 persons per household, with single female/mother households (9 | 2.8%) accounting for the largest median household size of 4.22 persons per household. non-family households (125 | 38.2%) represent the smallest median household size with 1.10 persons per household.
| Household Type | # Households | Household Size |
| Married-Couple | 181 (55.3%) | 2.67 |
| Single Male/Father | 12 (3.7%) | 1.92 |
| Single Female/Mother | 9 (2.8%) | 4.22 |
| Non-family | 125 (38.2%) | 1.10 |
| Total Households | 327 (100.0%) | 2.08 |
Household Size by Marriage Status in Oak Creek
Out of a total of 327 households in Oak Creek, 202 (61.8%) are family households, while 125 (38.2%) are nonfamily households. The most numerous type of family households are 2-person households, comprising 120, and the most common type of nonfamily households are 1-person households, comprising 114.
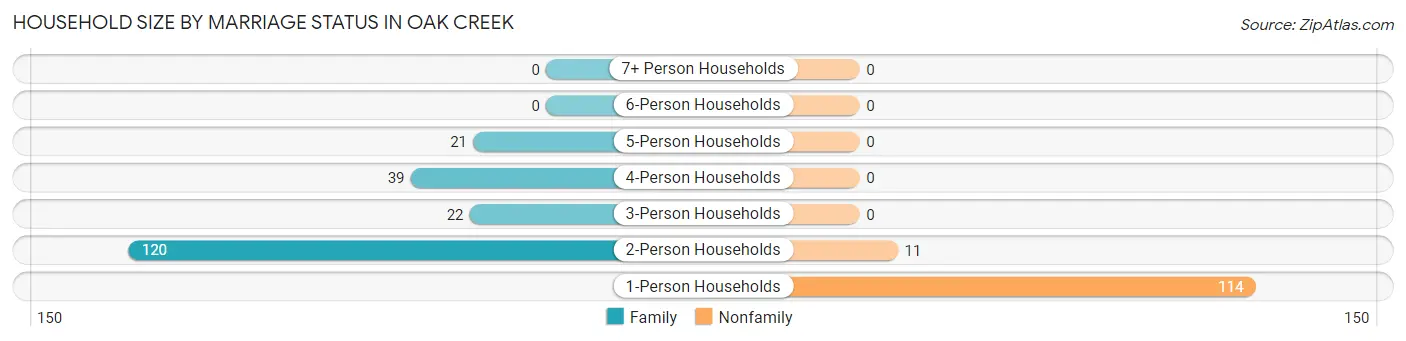
| Household Size | Family Households | Nonfamily Households |
| 1-Person Households | - | 114 (34.9%) |
| 2-Person Households | 120 (36.7%) | 11 (3.4%) |
| 3-Person Households | 22 (6.7%) | 0 (0.0%) |
| 4-Person Households | 39 (11.9%) | 0 (0.0%) |
| 5-Person Households | 21 (6.4%) | 0 (0.0%) |
| 6-Person Households | 0 (0.0%) | 0 (0.0%) |
| 7+ Person Households | 0 (0.0%) | 0 (0.0%) |
| Total | 202 (61.8%) | 125 (38.2%) |
Female Fertility in Oak Creek
Fertility by Age in Oak Creek
| Age Bracket | Women with Births | Births / 1,000 Women |
| 15 to 19 years | 0 (0.0%) | 0.0 |
| 20 to 34 years | 0 (0.0%) | 0.0 |
| 35 to 50 years | 0 (0.0%) | 0.0 |
| Total | 0 (0.0%) | 0.0 |
Fertility by Age by Marriage Status in Oak Creek
| Age Bracket | Married | Unmarried |
| 15 to 19 years | 0 (0.0%) | 0 (0.0%) |
| 20 to 34 years | 0 (0.0%) | 0 (0.0%) |
| 35 to 50 years | 0 (0.0%) | 0 (0.0%) |
| Total | 0 (0.0%) | 0 (0.0%) |
Fertility by Education in Oak Creek
| Educational Attainment | Women with Births | Births / 1,000 Women |
| Less than High School | 0 (0.0%) | 0.0 |
| High School Diploma | 0 (0.0%) | 0.0 |
| College or Associate's Degree | 0 (0.0%) | 0.0 |
| Bachelor's Degree | 0 (0.0%) | 0.0 |
| Graduate Degree | 0 (0.0%) | 0.0 |
| Total | 0 (0.0%) | 0.0 |
Fertility by Education by Marriage Status in Oak Creek
| Educational Attainment | Married | Unmarried |
| Less than High School | 0 (0.0%) | 0 (0.0%) |
| High School Diploma | 0 (0.0%) | 0 (0.0%) |
| College or Associate's Degree | 0 (0.0%) | 0 (0.0%) |
| Bachelor's Degree | 0 (0.0%) | 0 (0.0%) |
| Graduate Degree | 0 (0.0%) | 0 (0.0%) |
| Total | 0 (0.0%) | 0 (0.0%) |
Employment Characteristics in Oak Creek
Employment by Class of Employer in Oak Creek
Among the 387 employed individuals in Oak Creek, private company employees (303 | 78.3%), self-employed (not incorporated) (21 | 5.4%), and local government employees (15 | 3.9%) make up the most common classes of employment.
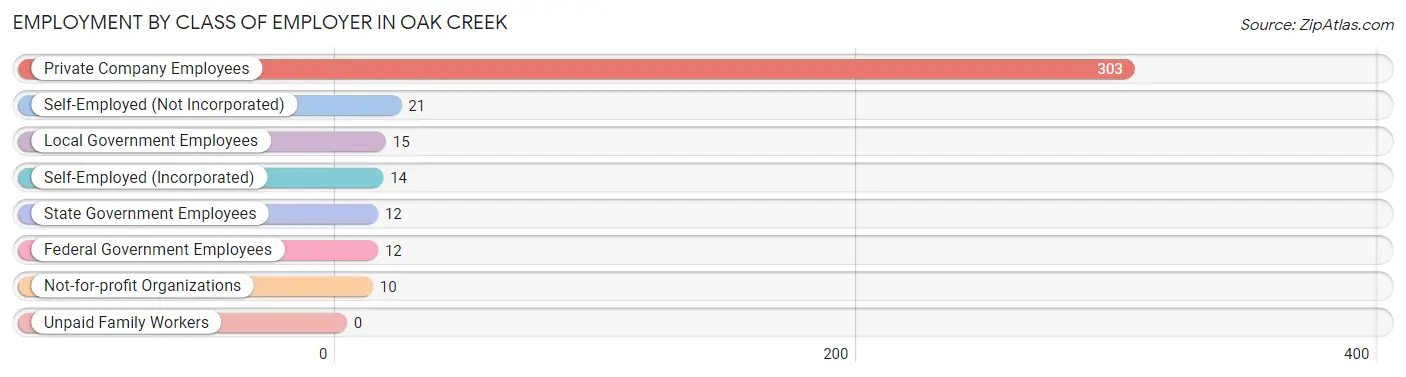
| Employer Class | # Employees | % Employees |
| Private Company Employees | 303 | 78.3% |
| Self-Employed (Incorporated) | 14 | 3.6% |
| Self-Employed (Not Incorporated) | 21 | 5.4% |
| Not-for-profit Organizations | 10 | 2.6% |
| Local Government Employees | 15 | 3.9% |
| State Government Employees | 12 | 3.1% |
| Federal Government Employees | 12 | 3.1% |
| Unpaid Family Workers | 0 | 0.0% |
| Total | 387 | 100.0% |
Employment Status by Age in Oak Creek
According to the labor force statistics for Oak Creek, out of the total population over 16 years of age (572), 70.8% or 405 individuals are in the labor force, with 3.2% or 13 of them unemployed. The age group with the highest labor force participation rate is 35 to 44 years, with 100.0% or 93 individuals in the labor force. Within the labor force, the 25 to 29 years age range has the highest percentage of unemployed individuals, with 29.6% or 8 of them being unemployed.
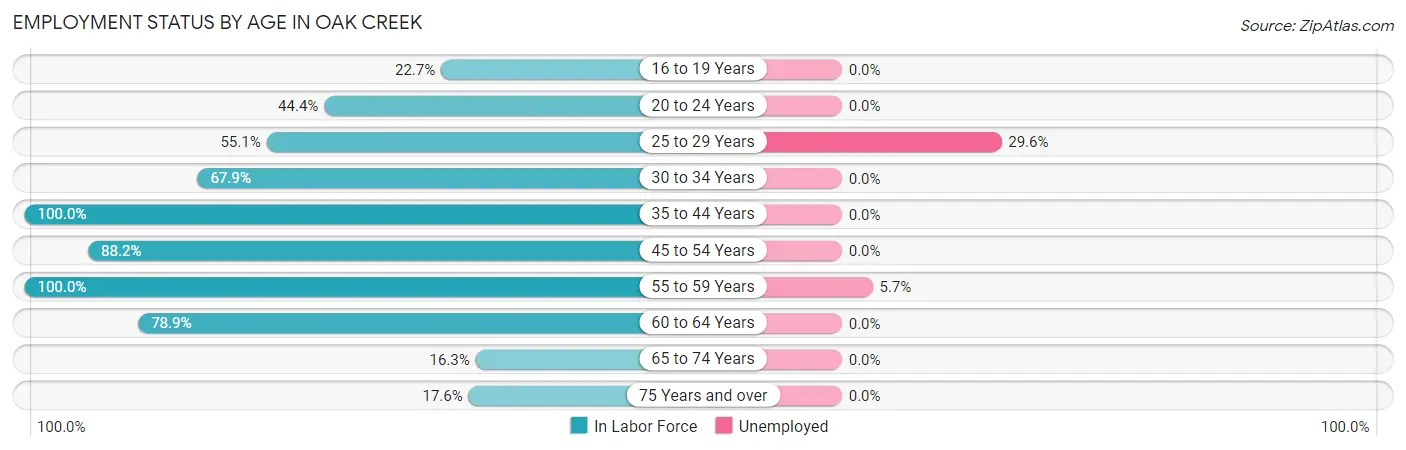
| Age Bracket | In Labor Force | Unemployed |
| 16 to 19 Years | 5 (22.7%) | 0 (0.0%) |
| 20 to 24 Years | 4 (44.4%) | 0 (0.0%) |
| 25 to 29 Years | 27 (55.1%) | 8 (29.6%) |
| 30 to 34 Years | 36 (67.9%) | 0 (0.0%) |
| 35 to 44 Years | 93 (100.0%) | 0 (0.0%) |
| 45 to 54 Years | 120 (88.2%) | 0 (0.0%) |
| 55 to 59 Years | 88 (100.0%) | 5 (5.7%) |
| 60 to 64 Years | 15 (78.9%) | 0 (0.0%) |
| 65 to 74 Years | 14 (16.3%) | 0 (0.0%) |
| 75 Years and over | 3 (17.6%) | 0 (0.0%) |
| Total | 405 (70.8%) | 13 (3.2%) |
Employment Status by Educational Attainment in Oak Creek
According to labor force statistics for Oak Creek, 86.5% of individuals (379) out of the total population between 25 and 64 years of age (438) are in the labor force, with 3.4% or 13 of them being unemployed. The group with the highest labor force participation rate are those with the educational attainment of bachelor's degree or higher, with 100.0% or 169 individuals in the labor force. Within the labor force, individuals with bachelor's degree or higher education have the highest percentage of unemployment, with 7.7% or 13 of them being unemployed.
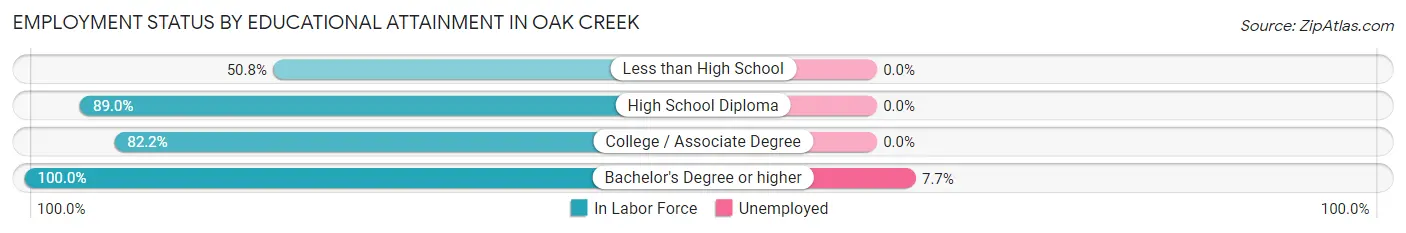
| Educational Attainment | In Labor Force | Unemployed |
| Less than High School | 31 (50.8%) | 0 (0.0%) |
| High School Diploma | 105 (89.0%) | 0 (0.0%) |
| College / Associate Degree | 74 (82.2%) | 0 (0.0%) |
| Bachelor's Degree or higher | 169 (100.0%) | 13 (7.7%) |
| Total | 379 (86.5%) | 15 (3.4%) |
Employment Occupations by Sex in Oak Creek
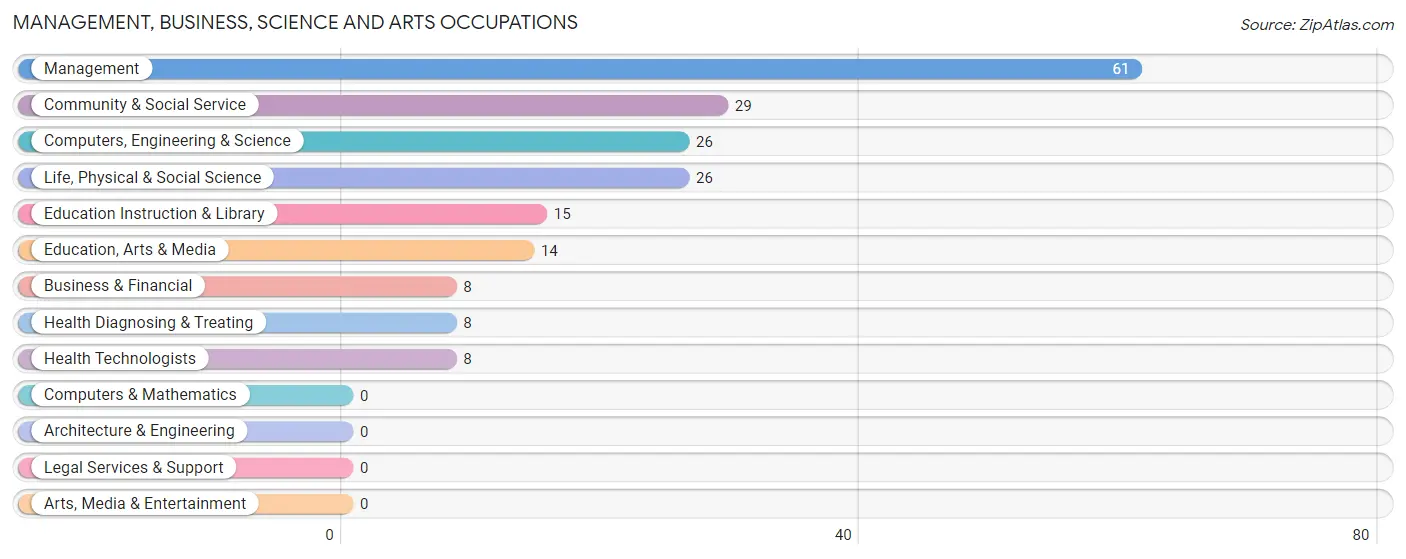
Management, Business, Science and Arts Occupations
The most common Management, Business, Science and Arts occupations in Oak Creek are Management (61 | 15.6%), Community & Social Service (29 | 7.4%), Computers, Engineering & Science (26 | 6.6%), Life, Physical & Social Science (26 | 6.6%), and Education Instruction & Library (15 | 3.8%).
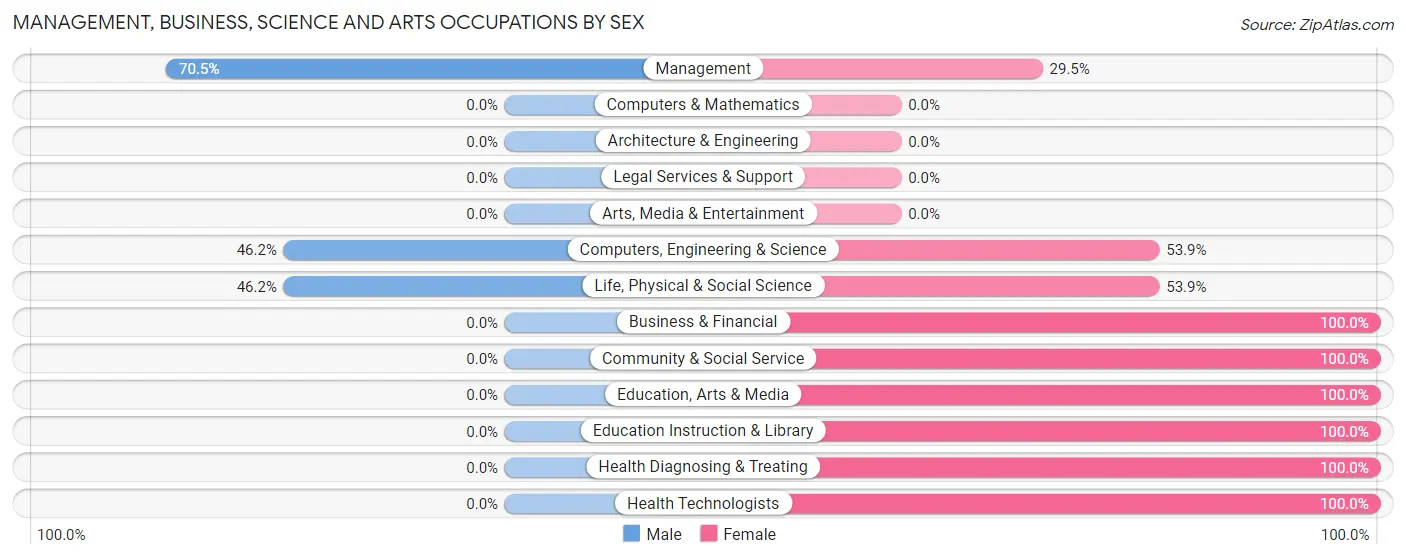
Management, Business, Science and Arts Occupations by Sex
Within the Management, Business, Science and Arts occupations in Oak Creek, the most male-oriented occupations are Management (70.5%), Computers, Engineering & Science (46.2%), and Life, Physical & Social Science (46.2%), while the most female-oriented occupations are Business & Financial (100.0%), Community & Social Service (100.0%), and Education, Arts & Media (100.0%).
| Occupation | Male | Female |
| Management | 43 (70.5%) | 18 (29.5%) |
| Business & Financial | 0 (0.0%) | 8 (100.0%) |
| Computers, Engineering & Science | 12 (46.2%) | 14 (53.8%) |
| Computers & Mathematics | 0 (0.0%) | 0 (0.0%) |
| Architecture & Engineering | 0 (0.0%) | 0 (0.0%) |
| Life, Physical & Social Science | 12 (46.2%) | 14 (53.8%) |
| Community & Social Service | 0 (0.0%) | 29 (100.0%) |
| Education, Arts & Media | 0 (0.0%) | 14 (100.0%) |
| Legal Services & Support | 0 (0.0%) | 0 (0.0%) |
| Education Instruction & Library | 0 (0.0%) | 15 (100.0%) |
| Arts, Media & Entertainment | 0 (0.0%) | 0 (0.0%) |
| Health Diagnosing & Treating | 0 (0.0%) | 8 (100.0%) |
| Health Technologists | 0 (0.0%) | 8 (100.0%) |
| Total (Category) | 55 (41.7%) | 77 (58.3%) |
| Total (Overall) | 203 (51.8%) | 189 (48.2%) |
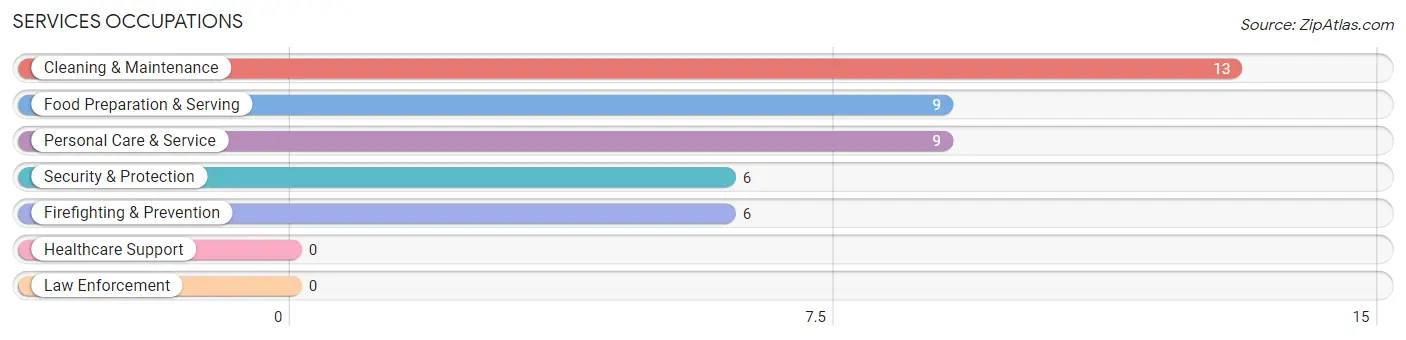
Services Occupations
The most common Services occupations in Oak Creek are Cleaning & Maintenance (13 | 3.3%), Food Preparation & Serving (9 | 2.3%), Personal Care & Service (9 | 2.3%), Security & Protection (6 | 1.5%), and Firefighting & Prevention (6 | 1.5%).
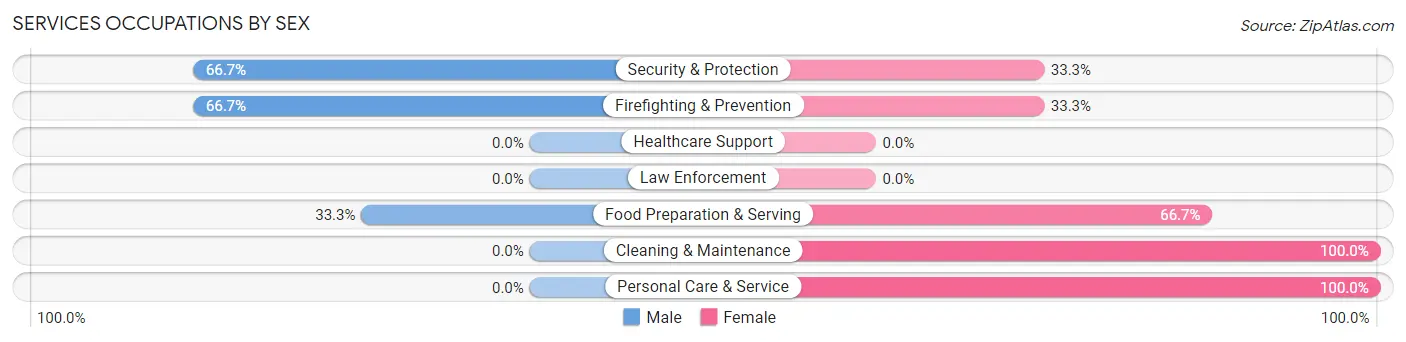
Services Occupations by Sex
Within the Services occupations in Oak Creek, the most male-oriented occupations are Security & Protection (66.7%), Firefighting & Prevention (66.7%), and Food Preparation & Serving (33.3%), while the most female-oriented occupations are Cleaning & Maintenance (100.0%), Personal Care & Service (100.0%), and Food Preparation & Serving (66.7%).
| Occupation | Male | Female |
| Healthcare Support | 0 (0.0%) | 0 (0.0%) |
| Security & Protection | 4 (66.7%) | 2 (33.3%) |
| Firefighting & Prevention | 4 (66.7%) | 2 (33.3%) |
| Law Enforcement | 0 (0.0%) | 0 (0.0%) |
| Food Preparation & Serving | 3 (33.3%) | 6 (66.7%) |
| Cleaning & Maintenance | 0 (0.0%) | 13 (100.0%) |
| Personal Care & Service | 0 (0.0%) | 9 (100.0%) |
| Total (Category) | 7 (18.9%) | 30 (81.1%) |
| Total (Overall) | 203 (51.8%) | 189 (48.2%) |
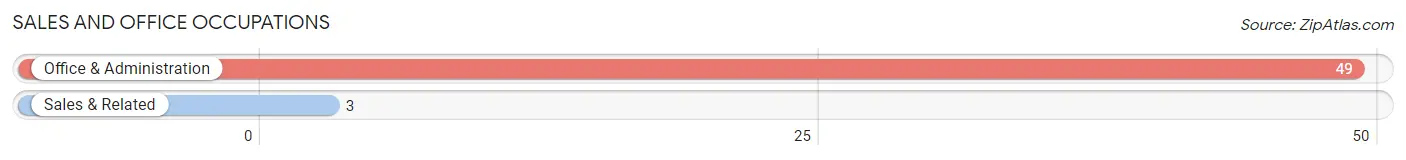
Sales and Office Occupations
The most common Sales and Office occupations in Oak Creek are Office & Administration (49 | 12.5%), and Sales & Related (3 | 0.8%).
Sales and Office Occupations by Sex
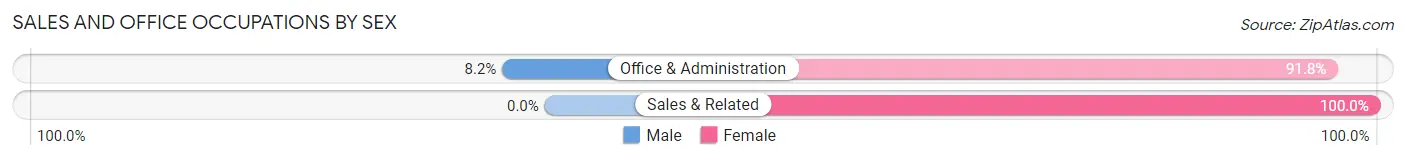
| Occupation | Male | Female |
| Sales & Related | 0 (0.0%) | 3 (100.0%) |
| Office & Administration | 4 (8.2%) | 45 (91.8%) |
| Total (Category) | 4 (7.7%) | 48 (92.3%) |
| Total (Overall) | 203 (51.8%) | 189 (48.2%) |
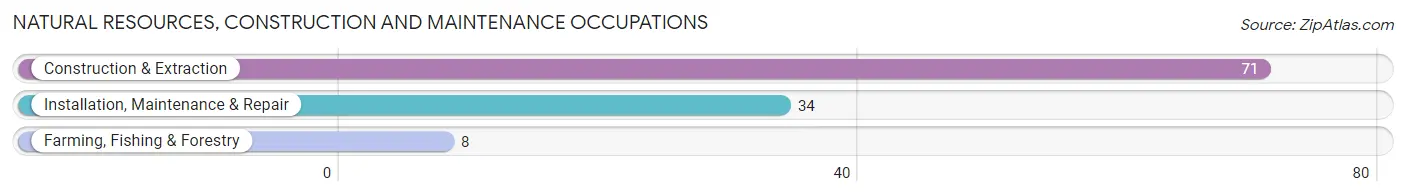
Natural Resources, Construction and Maintenance Occupations
The most common Natural Resources, Construction and Maintenance occupations in Oak Creek are Construction & Extraction (71 | 18.1%), Installation, Maintenance & Repair (34 | 8.7%), and Farming, Fishing & Forestry (8 | 2.0%).
Natural Resources, Construction and Maintenance Occupations by Sex
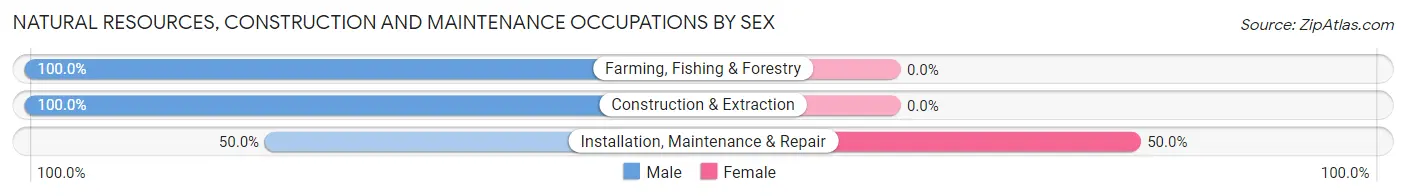
| Occupation | Male | Female |
| Farming, Fishing & Forestry | 8 (100.0%) | 0 (0.0%) |
| Construction & Extraction | 71 (100.0%) | 0 (0.0%) |
| Installation, Maintenance & Repair | 17 (50.0%) | 17 (50.0%) |
| Total (Category) | 96 (85.0%) | 17 (15.0%) |
| Total (Overall) | 203 (51.8%) | 189 (48.2%) |
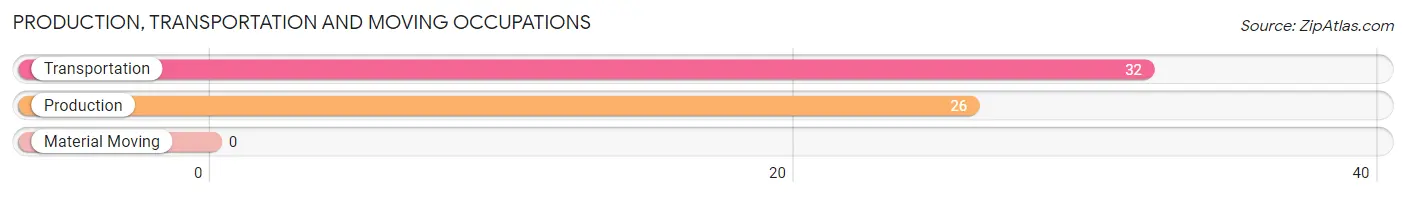
Production, Transportation and Moving Occupations
The most common Production, Transportation and Moving occupations in Oak Creek are Transportation (32 | 8.2%), and Production (26 | 6.6%).
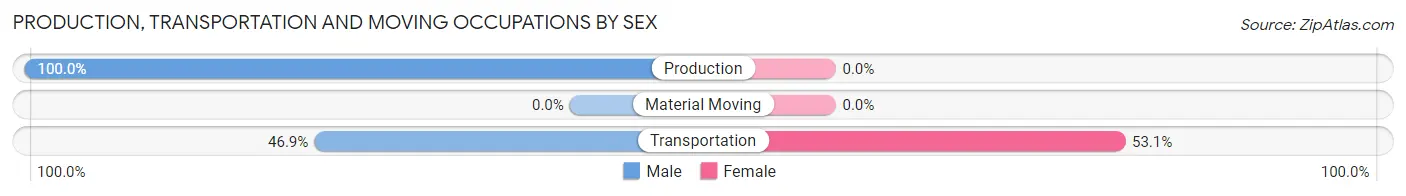
Production, Transportation and Moving Occupations by Sex
| Occupation | Male | Female |
| Production | 26 (100.0%) | 0 (0.0%) |
| Transportation | 15 (46.9%) | 17 (53.1%) |
| Material Moving | 0 (0.0%) | 0 (0.0%) |
| Total (Category) | 41 (70.7%) | 17 (29.3%) |
| Total (Overall) | 203 (51.8%) | 189 (48.2%) |
Employment Industries by Sex in Oak Creek
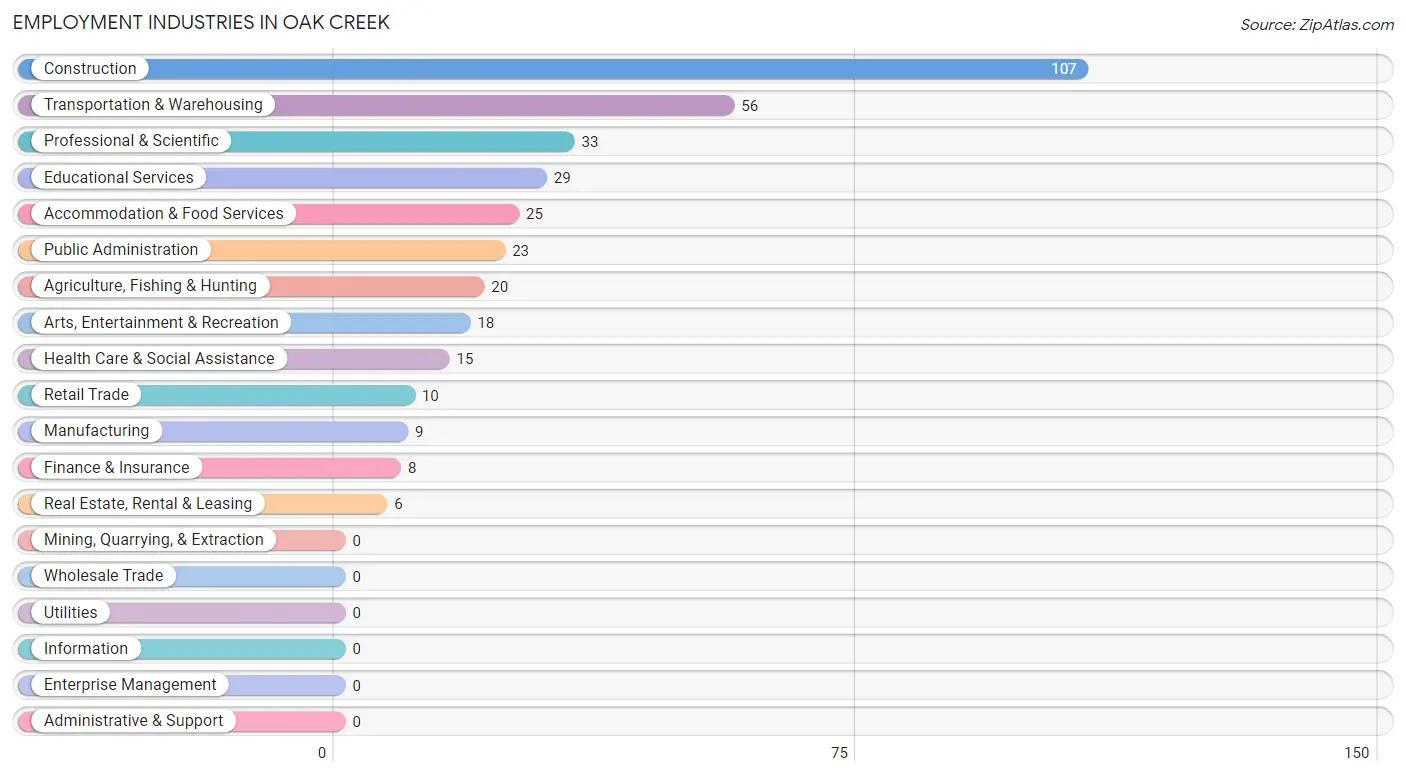
Employment Industries in Oak Creek
The major employment industries in Oak Creek include Construction (107 | 27.3%), Transportation & Warehousing (56 | 14.3%), Professional & Scientific (33 | 8.4%), Educational Services (29 | 7.4%), and Accommodation & Food Services (25 | 6.4%).
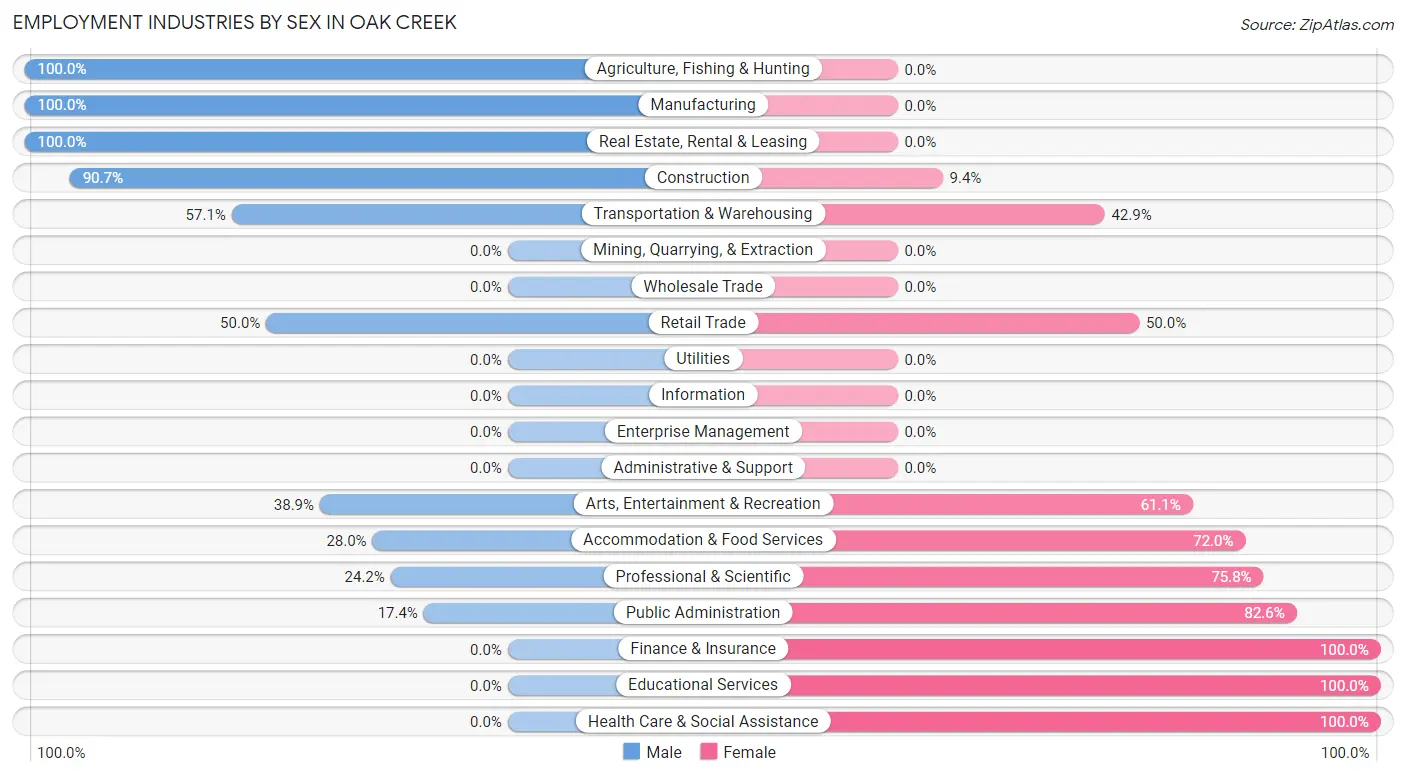
Employment Industries by Sex in Oak Creek
The Oak Creek industries that see more men than women are Agriculture, Fishing & Hunting (100.0%), Manufacturing (100.0%), and Real Estate, Rental & Leasing (100.0%), whereas the industries that tend to have a higher number of women are Finance & Insurance (100.0%), Educational Services (100.0%), and Health Care & Social Assistance (100.0%).
| Industry | Male | Female |
| Agriculture, Fishing & Hunting | 20 (100.0%) | 0 (0.0%) |
| Mining, Quarrying, & Extraction | 0 (0.0%) | 0 (0.0%) |
| Construction | 97 (90.6%) | 10 (9.3%) |
| Manufacturing | 9 (100.0%) | 0 (0.0%) |
| Wholesale Trade | 0 (0.0%) | 0 (0.0%) |
| Retail Trade | 5 (50.0%) | 5 (50.0%) |
| Transportation & Warehousing | 32 (57.1%) | 24 (42.9%) |
| Utilities | 0 (0.0%) | 0 (0.0%) |
| Information | 0 (0.0%) | 0 (0.0%) |
| Finance & Insurance | 0 (0.0%) | 8 (100.0%) |
| Real Estate, Rental & Leasing | 6 (100.0%) | 0 (0.0%) |
| Professional & Scientific | 8 (24.2%) | 25 (75.8%) |
| Enterprise Management | 0 (0.0%) | 0 (0.0%) |
| Administrative & Support | 0 (0.0%) | 0 (0.0%) |
| Educational Services | 0 (0.0%) | 29 (100.0%) |
| Health Care & Social Assistance | 0 (0.0%) | 15 (100.0%) |
| Arts, Entertainment & Recreation | 7 (38.9%) | 11 (61.1%) |
| Accommodation & Food Services | 7 (28.0%) | 18 (72.0%) |
| Public Administration | 4 (17.4%) | 19 (82.6%) |
| Total | 203 (51.8%) | 189 (48.2%) |
Education in Oak Creek
School Enrollment in Oak Creek
The most common levels of schooling among the 146 students in Oak Creek are elementary school (50 | 34.3%), high school (26 | 17.8%), and graduate / professional (26 | 17.8%).
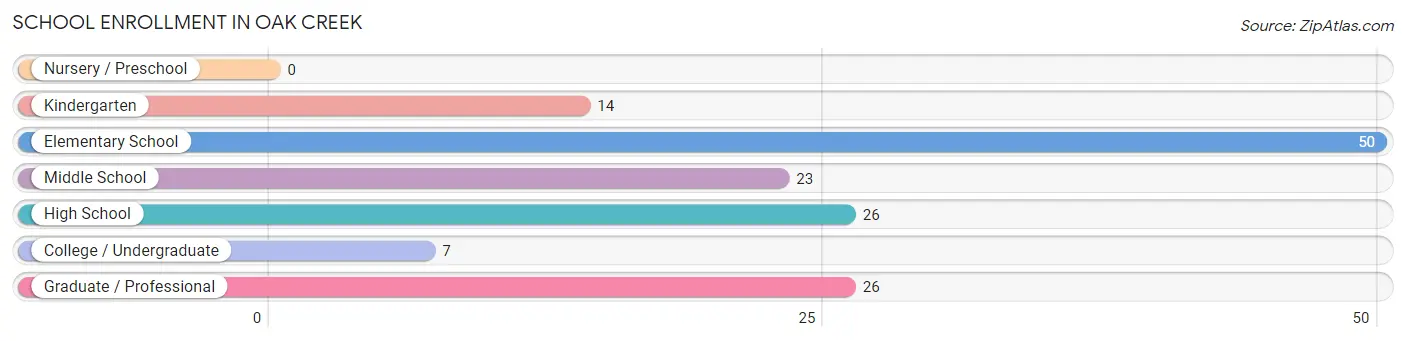
| School Level | # Students | % Students |
| Nursery / Preschool | 0 | 0.0% |
| Kindergarten | 14 | 9.6% |
| Elementary School | 50 | 34.3% |
| Middle School | 23 | 15.8% |
| High School | 26 | 17.8% |
| College / Undergraduate | 7 | 4.8% |
| Graduate / Professional | 26 | 17.8% |
| Total | 146 | 100.0% |
School Enrollment by Age by Funding Source in Oak Creek
Out of a total of 146 students who are enrolled in schools in Oak Creek, 18 (12.3%) attend a private institution, while the remaining 128 (87.7%) are enrolled in public schools. The age group of 5 to 9 year old has the highest likelihood of being enrolled in private schools, with 12 (20.7% in the age bracket) enrolled. Conversely, the age group of 15 to 17 year olds has the lowest likelihood of being enrolled in a private school, with 14 (100.0% in the age bracket) attending a public institution.
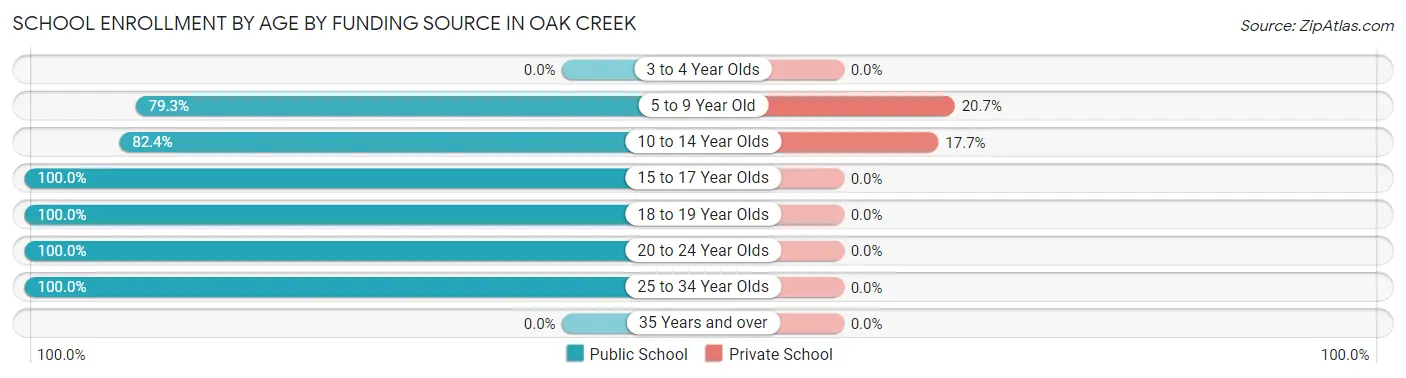
| Age Bracket | Public School | Private School |
| 3 to 4 Year Olds | 0 (0.0%) | 0 (0.0%) |
| 5 to 9 Year Old | 46 (79.3%) | 12 (20.7%) |
| 10 to 14 Year Olds | 28 (82.4%) | 6 (17.6%) |
| 15 to 17 Year Olds | 14 (100.0%) | 0 (0.0%) |
| 18 to 19 Year Olds | 12 (100.0%) | 0 (0.0%) |
| 20 to 24 Year Olds | 2 (100.0%) | 0 (0.0%) |
| 25 to 34 Year Olds | 26 (100.0%) | 0 (0.0%) |
| 35 Years and over | 0 (0.0%) | 0 (0.0%) |
| Total | 128 (87.7%) | 18 (12.3%) |
Educational Attainment by Field of Study in Oak Creek
Business (43 | 20.4%), arts & humanities (31 | 14.7%), literature & languages (30 | 14.2%), science & technology (21 | 10.0%), and physical & health sciences (14 | 6.6%) are the most common fields of study among 211 individuals in Oak Creek who have obtained a bachelor's degree or higher.
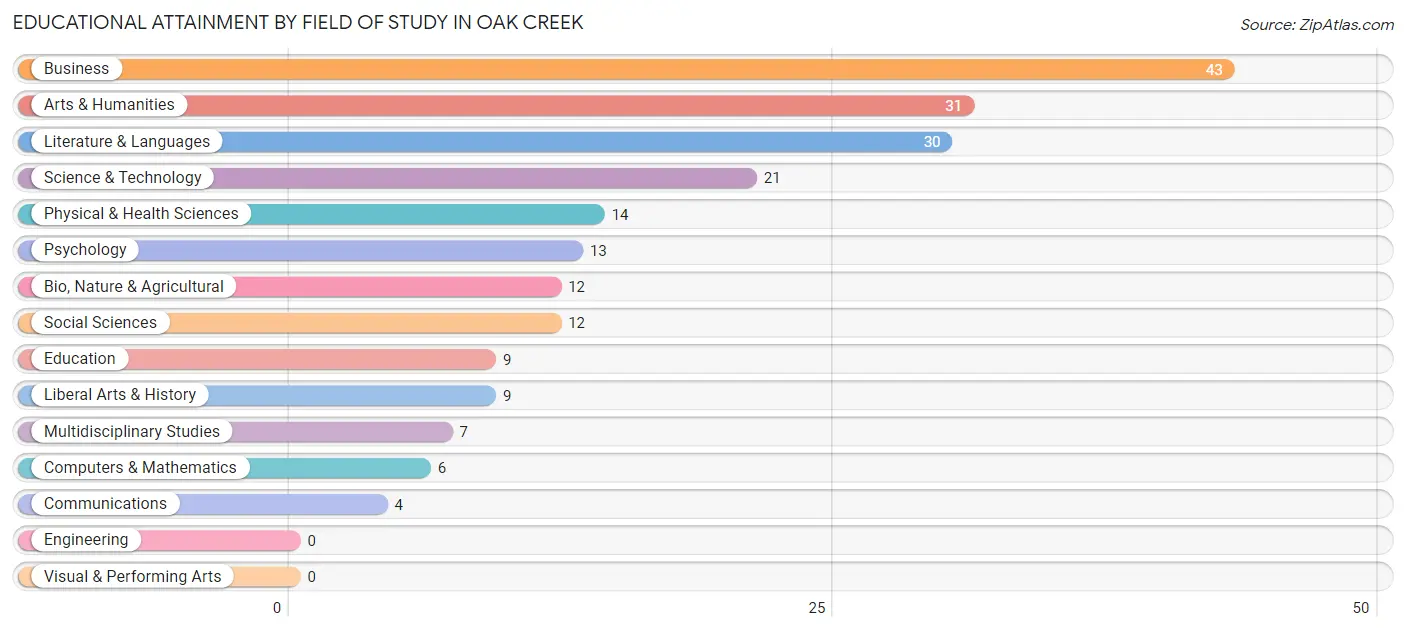
| Field of Study | # Graduates | % Graduates |
| Computers & Mathematics | 6 | 2.8% |
| Bio, Nature & Agricultural | 12 | 5.7% |
| Physical & Health Sciences | 14 | 6.6% |
| Psychology | 13 | 6.2% |
| Social Sciences | 12 | 5.7% |
| Engineering | 0 | 0.0% |
| Multidisciplinary Studies | 7 | 3.3% |
| Science & Technology | 21 | 10.0% |
| Business | 43 | 20.4% |
| Education | 9 | 4.3% |
| Literature & Languages | 30 | 14.2% |
| Liberal Arts & History | 9 | 4.3% |
| Visual & Performing Arts | 0 | 0.0% |
| Communications | 4 | 1.9% |
| Arts & Humanities | 31 | 14.7% |
| Total | 211 | 100.0% |
Transportation & Commute in Oak Creek
Vehicle Availability by Sex in Oak Creek
The most prevalent vehicle ownership categories in Oak Creek are males with 2 vehicles (98, accounting for 49.0%) and females with 2 vehicles (76, making up 52.4%).
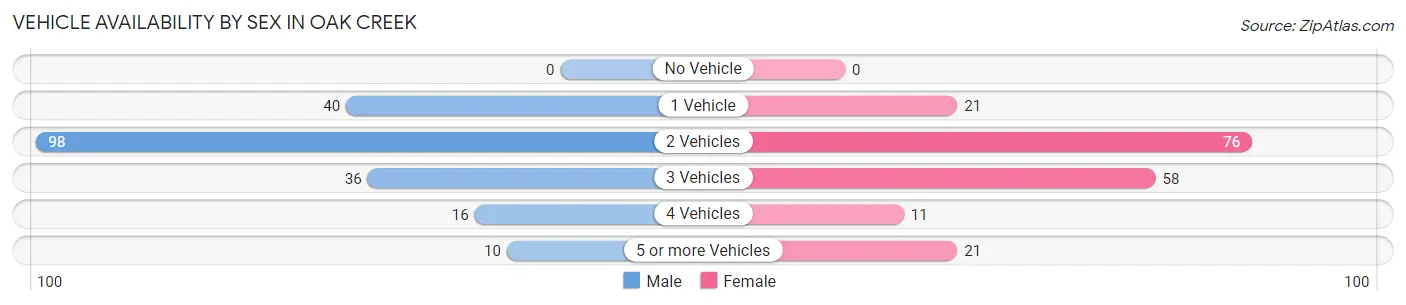
| Vehicles Available | Male | Female |
| No Vehicle | 0 (0.0%) | 0 (0.0%) |
| 1 Vehicle | 40 (20.0%) | 21 (11.2%) |
| 2 Vehicles | 98 (49.0%) | 76 (40.6%) |
| 3 Vehicles | 36 (18.0%) | 58 (31.0%) |
| 4 Vehicles | 16 (8.0%) | 11 (5.9%) |
| 5 or more Vehicles | 10 (5.0%) | 21 (11.2%) |
| Total | 200 (100.0%) | 187 (100.0%) |
Commute Time in Oak Creek
The most frequently occuring commute durations in Oak Creek are 30 to 34 minutes (166 commuters, 45.5%), 5 to 9 minutes (71 commuters, 19.5%), and 15 to 19 minutes (22 commuters, 6.0%).
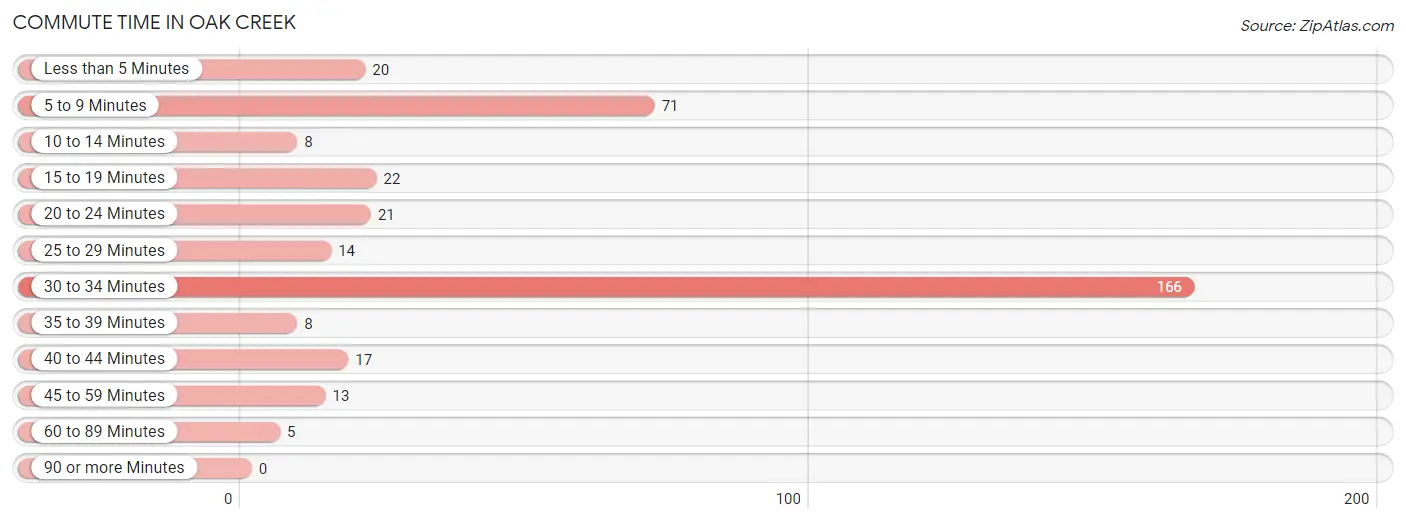
| Commute Time | # Commuters | % Commuters |
| Less than 5 Minutes | 20 | 5.5% |
| 5 to 9 Minutes | 71 | 19.5% |
| 10 to 14 Minutes | 8 | 2.2% |
| 15 to 19 Minutes | 22 | 6.0% |
| 20 to 24 Minutes | 21 | 5.8% |
| 25 to 29 Minutes | 14 | 3.8% |
| 30 to 34 Minutes | 166 | 45.5% |
| 35 to 39 Minutes | 8 | 2.2% |
| 40 to 44 Minutes | 17 | 4.7% |
| 45 to 59 Minutes | 13 | 3.6% |
| 60 to 89 Minutes | 5 | 1.4% |
| 90 or more Minutes | 0 | 0.0% |
Commute Time by Sex in Oak Creek
The most common commute times in Oak Creek are 30 to 34 minutes (89 commuters, 44.5%) for males and 30 to 34 minutes (77 commuters, 46.7%) for females.
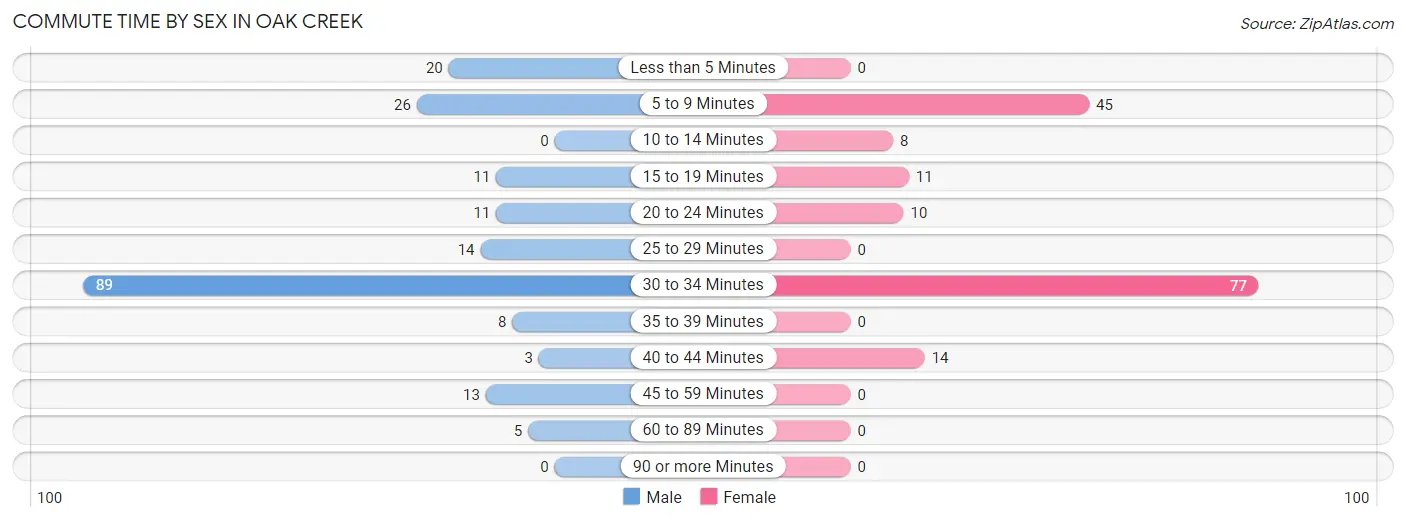
| Commute Time | Male | Female |
| Less than 5 Minutes | 20 (10.0%) | 0 (0.0%) |
| 5 to 9 Minutes | 26 (13.0%) | 45 (27.3%) |
| 10 to 14 Minutes | 0 (0.0%) | 8 (4.9%) |
| 15 to 19 Minutes | 11 (5.5%) | 11 (6.7%) |
| 20 to 24 Minutes | 11 (5.5%) | 10 (6.1%) |
| 25 to 29 Minutes | 14 (7.0%) | 0 (0.0%) |
| 30 to 34 Minutes | 89 (44.5%) | 77 (46.7%) |
| 35 to 39 Minutes | 8 (4.0%) | 0 (0.0%) |
| 40 to 44 Minutes | 3 (1.5%) | 14 (8.5%) |
| 45 to 59 Minutes | 13 (6.5%) | 0 (0.0%) |
| 60 to 89 Minutes | 5 (2.5%) | 0 (0.0%) |
| 90 or more Minutes | 0 (0.0%) | 0 (0.0%) |
Time of Departure to Work by Sex in Oak Creek
The most frequent times of departure to work in Oak Creek are 7:30 AM to 7:59 AM (63, 31.5%) for males and 7:30 AM to 7:59 AM (45, 27.3%) for females.
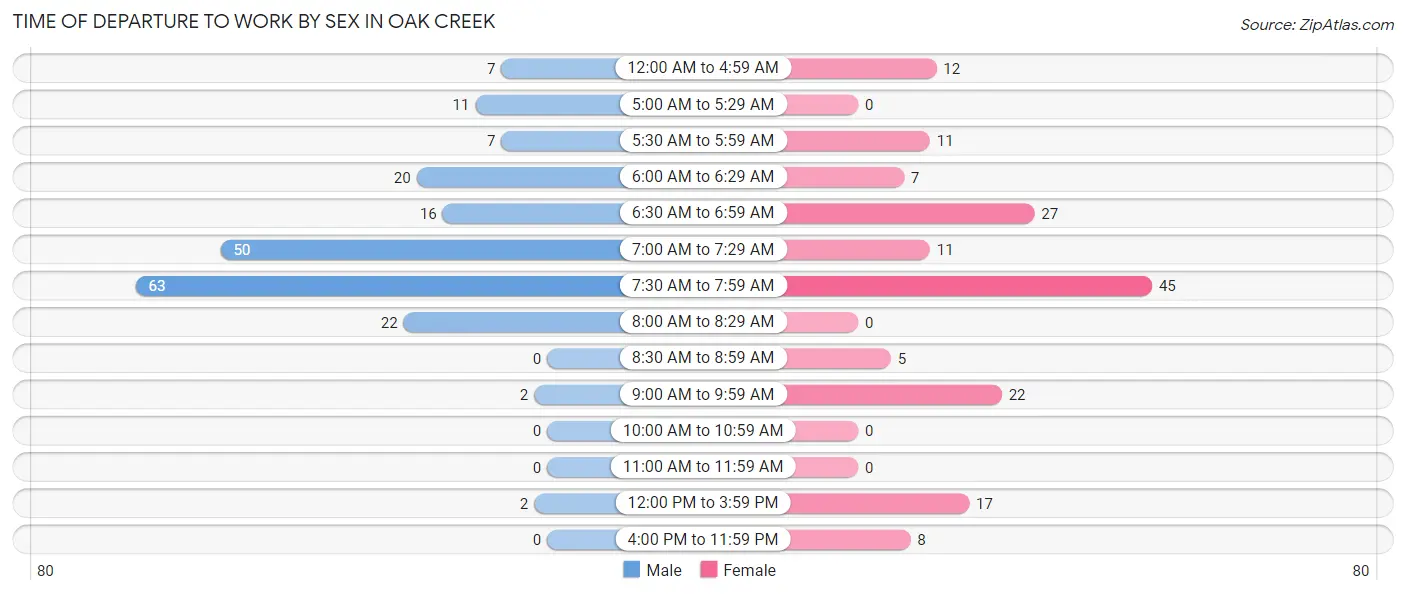
| Time of Departure | Male | Female |
| 12:00 AM to 4:59 AM | 7 (3.5%) | 12 (7.3%) |
| 5:00 AM to 5:29 AM | 11 (5.5%) | 0 (0.0%) |
| 5:30 AM to 5:59 AM | 7 (3.5%) | 11 (6.7%) |
| 6:00 AM to 6:29 AM | 20 (10.0%) | 7 (4.2%) |
| 6:30 AM to 6:59 AM | 16 (8.0%) | 27 (16.4%) |
| 7:00 AM to 7:29 AM | 50 (25.0%) | 11 (6.7%) |
| 7:30 AM to 7:59 AM | 63 (31.5%) | 45 (27.3%) |
| 8:00 AM to 8:29 AM | 22 (11.0%) | 0 (0.0%) |
| 8:30 AM to 8:59 AM | 0 (0.0%) | 5 (3.0%) |
| 9:00 AM to 9:59 AM | 2 (1.0%) | 22 (13.3%) |
| 10:00 AM to 10:59 AM | 0 (0.0%) | 0 (0.0%) |
| 11:00 AM to 11:59 AM | 0 (0.0%) | 0 (0.0%) |
| 12:00 PM to 3:59 PM | 2 (1.0%) | 17 (10.3%) |
| 4:00 PM to 11:59 PM | 0 (0.0%) | 8 (4.9%) |
| Total | 200 (100.0%) | 165 (100.0%) |
Housing Occupancy in Oak Creek
Occupancy by Ownership in Oak Creek
Of the total 327 dwellings in Oak Creek, owner-occupied units account for 220 (67.3%), while renter-occupied units make up 107 (32.7%).
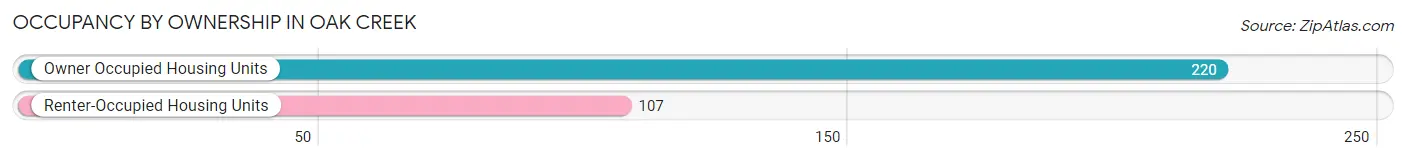
| Occupancy | # Housing Units | % Housing Units |
| Owner Occupied Housing Units | 220 | 67.3% |
| Renter-Occupied Housing Units | 107 | 32.7% |
| Total Occupied Housing Units | 327 | 100.0% |
Occupancy by Household Size in Oak Creek
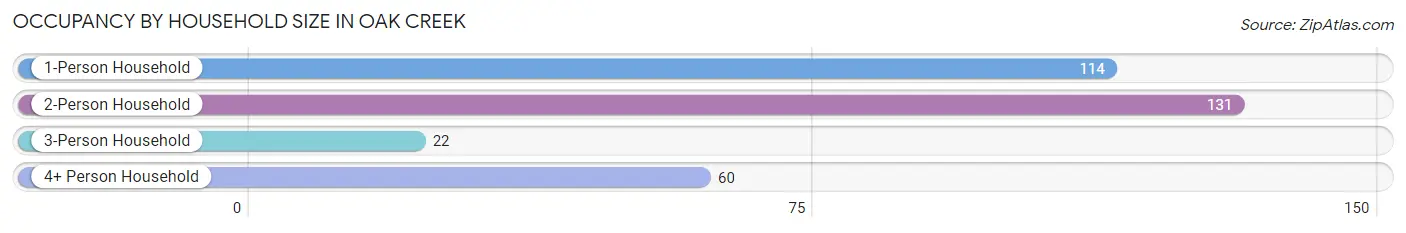
| Household Size | # Housing Units | % Housing Units |
| 1-Person Household | 114 | 34.9% |
| 2-Person Household | 131 | 40.1% |
| 3-Person Household | 22 | 6.7% |
| 4+ Person Household | 60 | 18.3% |
| Total Housing Units | 327 | 100.0% |
Occupancy by Ownership by Household Size in Oak Creek
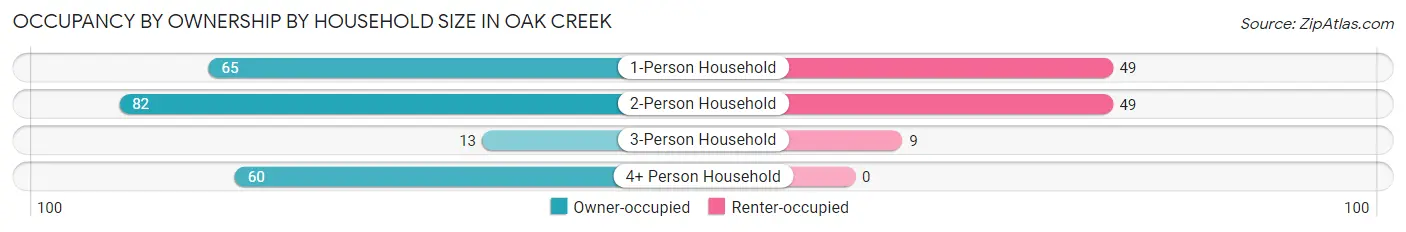
| Household Size | Owner-occupied | Renter-occupied |
| 1-Person Household | 65 (57.0%) | 49 (43.0%) |
| 2-Person Household | 82 (62.6%) | 49 (37.4%) |
| 3-Person Household | 13 (59.1%) | 9 (40.9%) |
| 4+ Person Household | 60 (100.0%) | 0 (0.0%) |
| Total Housing Units | 220 (67.3%) | 107 (32.7%) |
Occupancy by Educational Attainment in Oak Creek
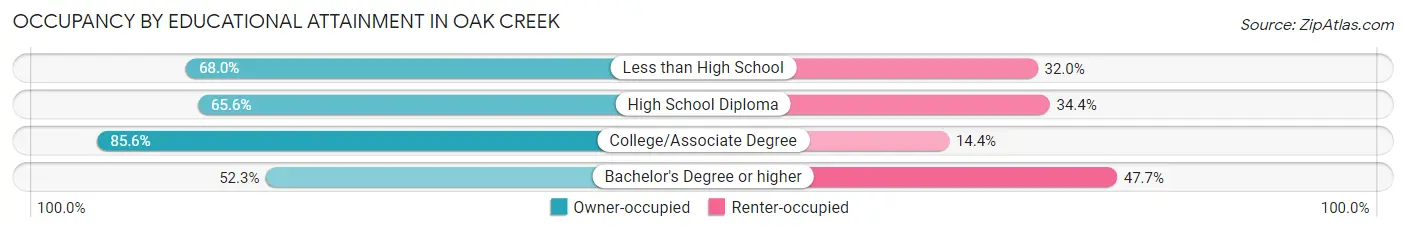
| Household Size | Owner-occupied | Renter-occupied |
| Less than High School | 17 (68.0%) | 8 (32.0%) |
| High School Diploma | 63 (65.6%) | 33 (34.4%) |
| College/Associate Degree | 83 (85.6%) | 14 (14.4%) |
| Bachelor's Degree or higher | 57 (52.3%) | 52 (47.7%) |
Occupancy by Age of Householder in Oak Creek
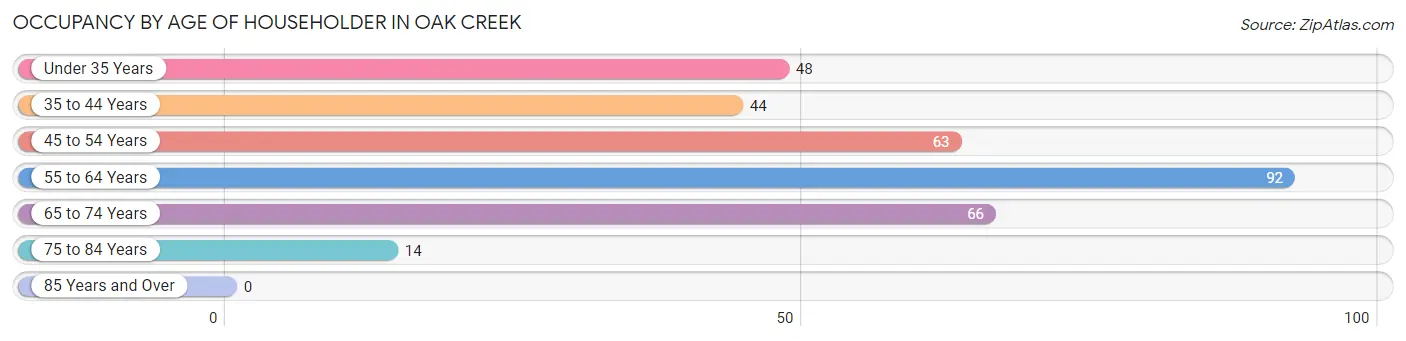
| Age Bracket | # Households | % Households |
| Under 35 Years | 48 | 14.7% |
| 35 to 44 Years | 44 | 13.5% |
| 45 to 54 Years | 63 | 19.3% |
| 55 to 64 Years | 92 | 28.1% |
| 65 to 74 Years | 66 | 20.2% |
| 75 to 84 Years | 14 | 4.3% |
| 85 Years and Over | 0 | 0.0% |
| Total | 327 | 100.0% |
Housing Finances in Oak Creek
Median Income by Occupancy in Oak Creek
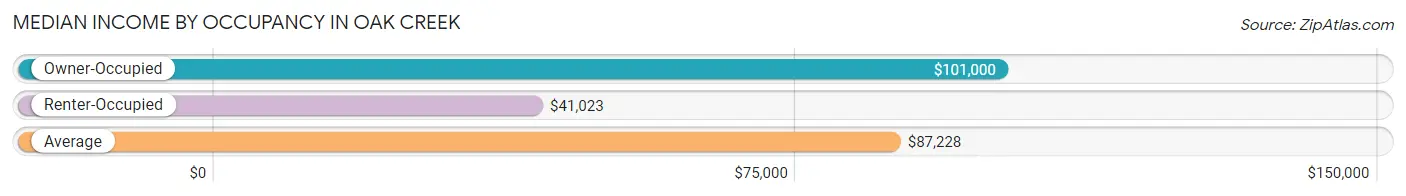
| Occupancy Type | # Households | Median Income |
| Owner-Occupied | 220 (67.3%) | $101,000 |
| Renter-Occupied | 107 (32.7%) | $41,023 |
| Average | 327 (100.0%) | $87,228 |
Occupancy by Householder Income Bracket in Oak Creek
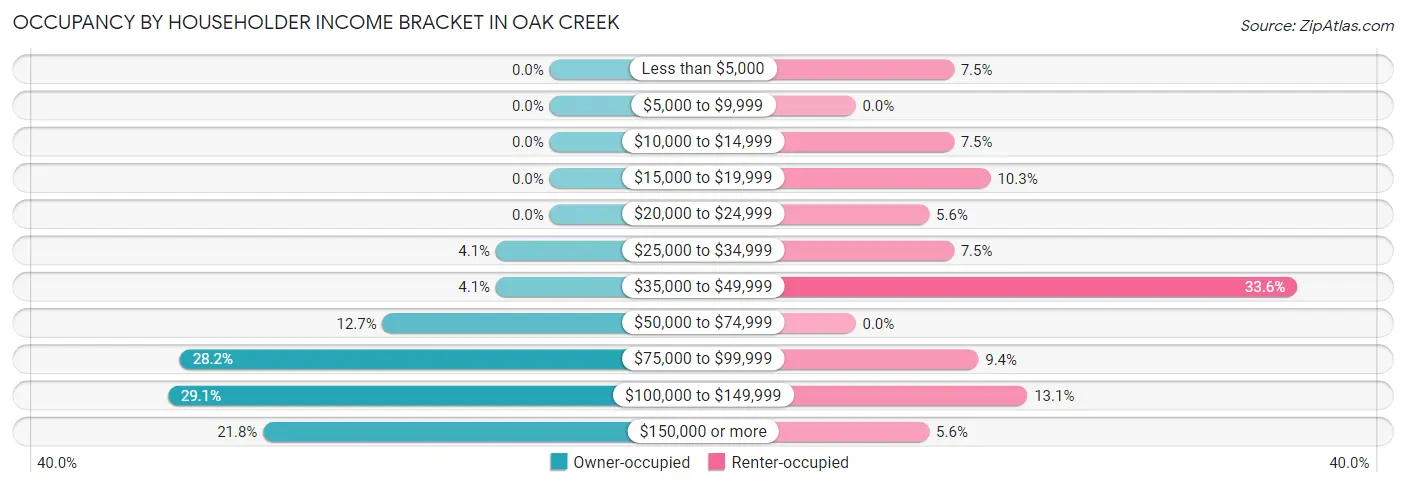
| Income Bracket | Owner-occupied | Renter-occupied |
| Less than $5,000 | 0 (0.0%) | 8 (7.5%) |
| $5,000 to $9,999 | 0 (0.0%) | 0 (0.0%) |
| $10,000 to $14,999 | 0 (0.0%) | 8 (7.5%) |
| $15,000 to $19,999 | 0 (0.0%) | 11 (10.3%) |
| $20,000 to $24,999 | 0 (0.0%) | 6 (5.6%) |
| $25,000 to $34,999 | 9 (4.1%) | 8 (7.5%) |
| $35,000 to $49,999 | 9 (4.1%) | 36 (33.6%) |
| $50,000 to $74,999 | 28 (12.7%) | 0 (0.0%) |
| $75,000 to $99,999 | 62 (28.2%) | 10 (9.3%) |
| $100,000 to $149,999 | 64 (29.1%) | 14 (13.1%) |
| $150,000 or more | 48 (21.8%) | 6 (5.6%) |
| Total | 220 (100.0%) | 107 (100.0%) |
Monthly Housing Cost Tiers in Oak Creek
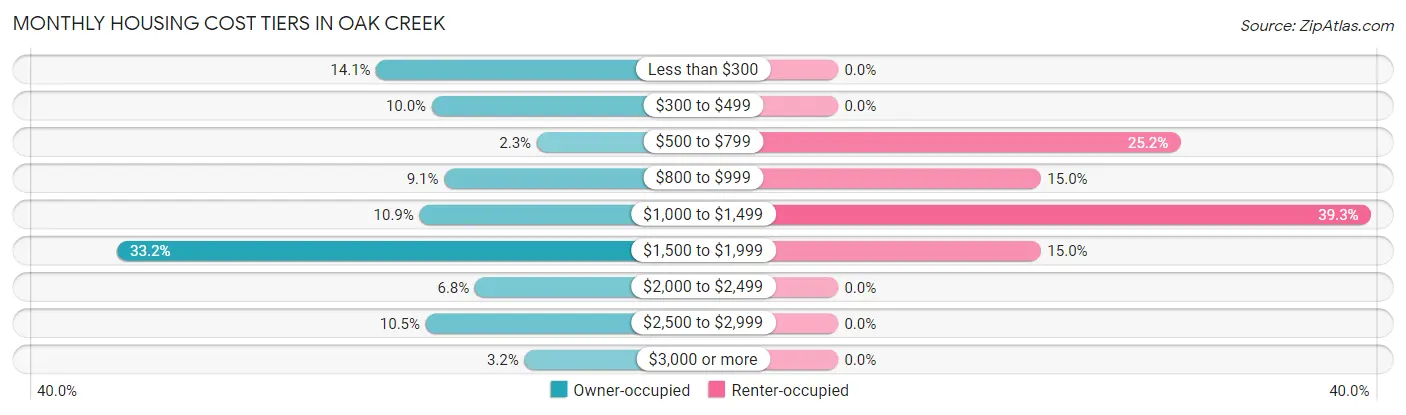
| Monthly Cost | Owner-occupied | Renter-occupied |
| Less than $300 | 31 (14.1%) | 0 (0.0%) |
| $300 to $499 | 22 (10.0%) | 0 (0.0%) |
| $500 to $799 | 5 (2.3%) | 27 (25.2%) |
| $800 to $999 | 20 (9.1%) | 16 (14.9%) |
| $1,000 to $1,499 | 24 (10.9%) | 42 (39.3%) |
| $1,500 to $1,999 | 73 (33.2%) | 16 (14.9%) |
| $2,000 to $2,499 | 15 (6.8%) | 0 (0.0%) |
| $2,500 to $2,999 | 23 (10.4%) | 0 (0.0%) |
| $3,000 or more | 7 (3.2%) | 0 (0.0%) |
| Total | 220 (100.0%) | 107 (100.0%) |
Physical Housing Characteristics in Oak Creek
Housing Structures in Oak Creek
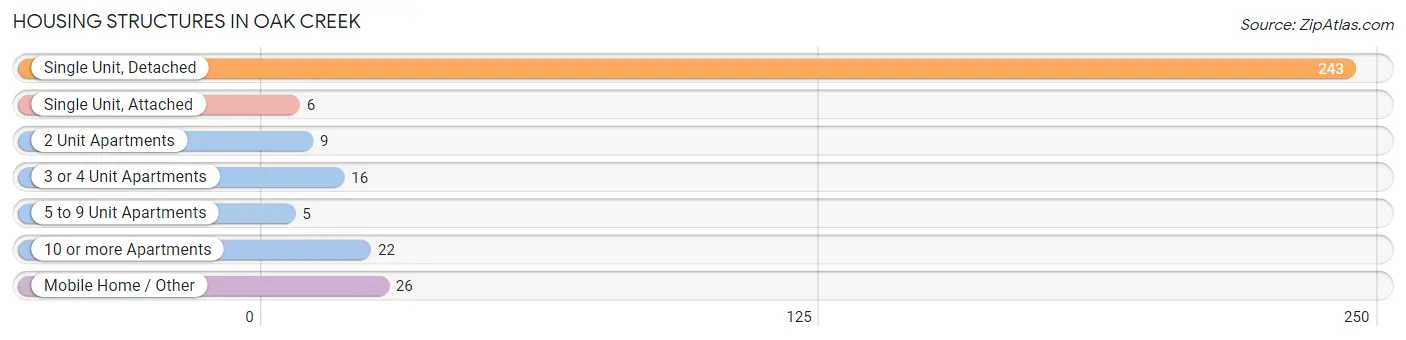
| Structure Type | # Housing Units | % Housing Units |
| Single Unit, Detached | 243 | 74.3% |
| Single Unit, Attached | 6 | 1.8% |
| 2 Unit Apartments | 9 | 2.8% |
| 3 or 4 Unit Apartments | 16 | 4.9% |
| 5 to 9 Unit Apartments | 5 | 1.5% |
| 10 or more Apartments | 22 | 6.7% |
| Mobile Home / Other | 26 | 8.0% |
| Total | 327 | 100.0% |
Housing Structures by Occupancy in Oak Creek
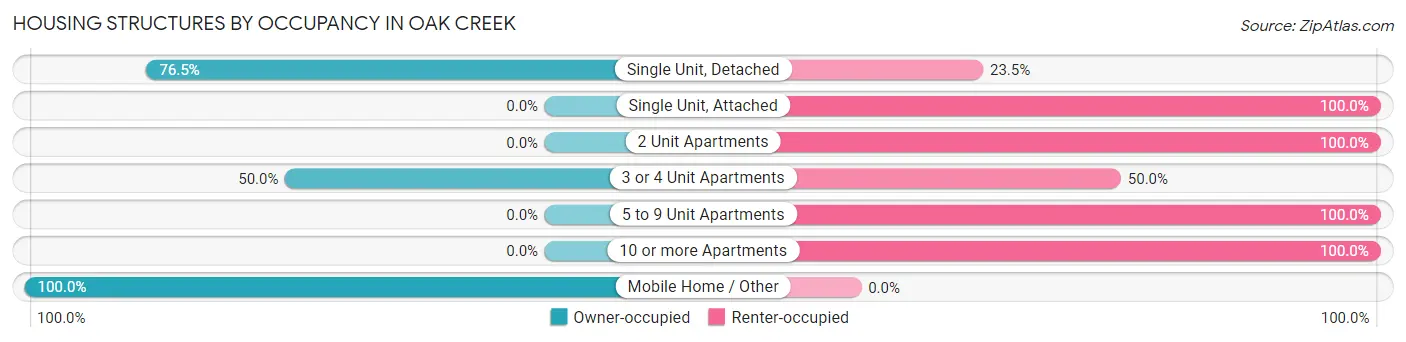
| Structure Type | Owner-occupied | Renter-occupied |
| Single Unit, Detached | 186 (76.5%) | 57 (23.5%) |
| Single Unit, Attached | 0 (0.0%) | 6 (100.0%) |
| 2 Unit Apartments | 0 (0.0%) | 9 (100.0%) |
| 3 or 4 Unit Apartments | 8 (50.0%) | 8 (50.0%) |
| 5 to 9 Unit Apartments | 0 (0.0%) | 5 (100.0%) |
| 10 or more Apartments | 0 (0.0%) | 22 (100.0%) |
| Mobile Home / Other | 26 (100.0%) | 0 (0.0%) |
| Total | 220 (67.3%) | 107 (32.7%) |
Housing Structures by Number of Rooms in Oak Creek
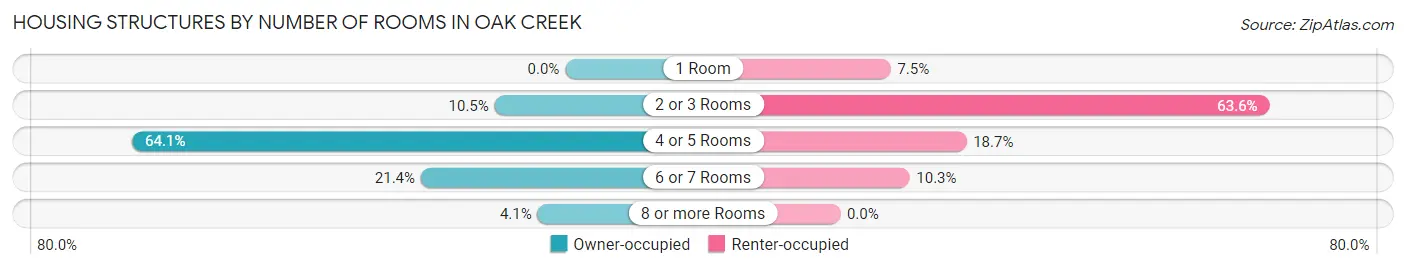
| Number of Rooms | Owner-occupied | Renter-occupied |
| 1 Room | 0 (0.0%) | 8 (7.5%) |
| 2 or 3 Rooms | 23 (10.4%) | 68 (63.5%) |
| 4 or 5 Rooms | 141 (64.1%) | 20 (18.7%) |
| 6 or 7 Rooms | 47 (21.4%) | 11 (10.3%) |
| 8 or more Rooms | 9 (4.1%) | 0 (0.0%) |
| Total | 220 (100.0%) | 107 (100.0%) |
Housing Structure by Heating Type in Oak Creek
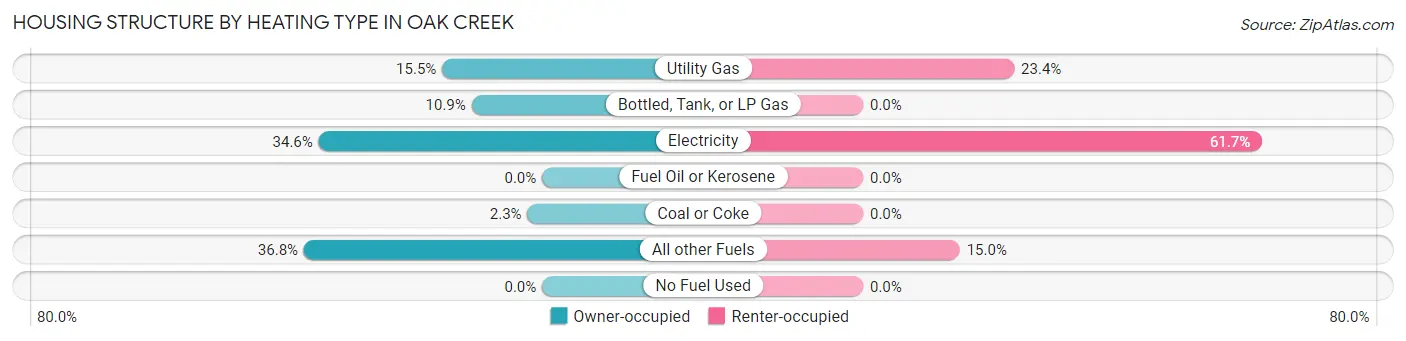
| Heating Type | Owner-occupied | Renter-occupied |
| Utility Gas | 34 (15.4%) | 25 (23.4%) |
| Bottled, Tank, or LP Gas | 24 (10.9%) | 0 (0.0%) |
| Electricity | 76 (34.5%) | 66 (61.7%) |
| Fuel Oil or Kerosene | 0 (0.0%) | 0 (0.0%) |
| Coal or Coke | 5 (2.3%) | 0 (0.0%) |
| All other Fuels | 81 (36.8%) | 16 (14.9%) |
| No Fuel Used | 0 (0.0%) | 0 (0.0%) |
| Total | 220 (100.0%) | 107 (100.0%) |
Household Vehicle Usage in Oak Creek
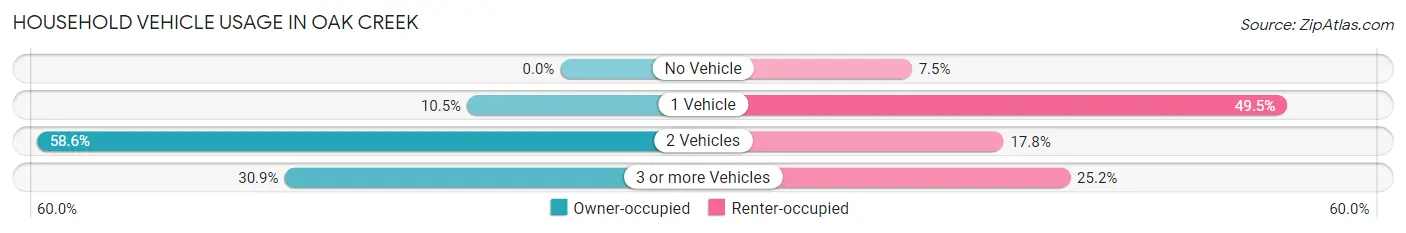
| Vehicles per Household | Owner-occupied | Renter-occupied |
| No Vehicle | 0 (0.0%) | 8 (7.5%) |
| 1 Vehicle | 23 (10.4%) | 53 (49.5%) |
| 2 Vehicles | 129 (58.6%) | 19 (17.8%) |
| 3 or more Vehicles | 68 (30.9%) | 27 (25.2%) |
| Total | 220 (100.0%) | 107 (100.0%) |
Real Estate & Mortgages in Oak Creek
Real Estate and Mortgage Overview in Oak Creek
| Characteristic | Without Mortgage | With Mortgage |
| Housing Units | 80 | 140 |
| Median Property Value | $118,500 | $430,300 |
| Median Household Income | $85,978 | $42 |
| Monthly Housing Costs | $441 | $7 |
| Real Estate Taxes | $684 | $0 |
Property Value by Mortgage Status in Oak Creek
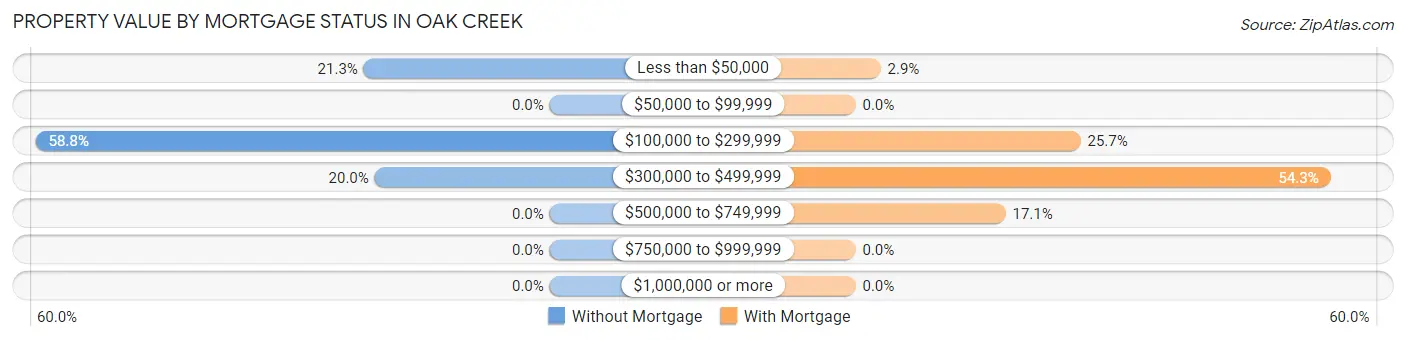
| Property Value | Without Mortgage | With Mortgage |
| Less than $50,000 | 17 (21.2%) | 4 (2.9%) |
| $50,000 to $99,999 | 0 (0.0%) | 0 (0.0%) |
| $100,000 to $299,999 | 47 (58.8%) | 36 (25.7%) |
| $300,000 to $499,999 | 16 (20.0%) | 76 (54.3%) |
| $500,000 to $749,999 | 0 (0.0%) | 24 (17.1%) |
| $750,000 to $999,999 | 0 (0.0%) | 0 (0.0%) |
| $1,000,000 or more | 0 (0.0%) | 0 (0.0%) |
| Total | 80 (100.0%) | 140 (100.0%) |
Household Income by Mortgage Status in Oak Creek
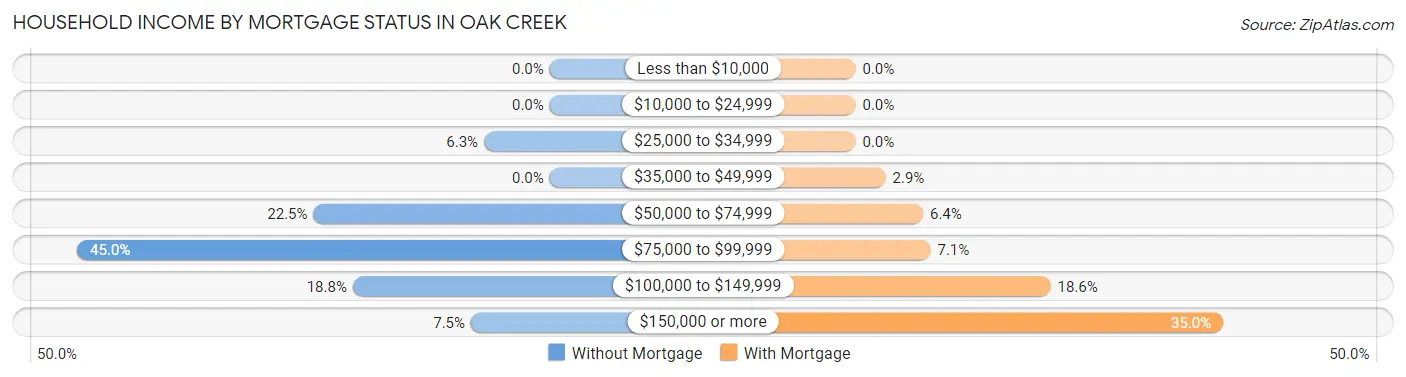
| Household Income | Without Mortgage | With Mortgage |
| Less than $10,000 | 0 (0.0%) | 0 (0.0%) |
| $10,000 to $24,999 | 0 (0.0%) | 0 (0.0%) |
| $25,000 to $34,999 | 5 (6.2%) | 0 (0.0%) |
| $35,000 to $49,999 | 0 (0.0%) | 4 (2.9%) |
| $50,000 to $74,999 | 18 (22.5%) | 9 (6.4%) |
| $75,000 to $99,999 | 36 (45.0%) | 10 (7.1%) |
| $100,000 to $149,999 | 15 (18.8%) | 26 (18.6%) |
| $150,000 or more | 6 (7.5%) | 49 (35.0%) |
| Total | 80 (100.0%) | 140 (100.0%) |
Property Value to Household Income Ratio in Oak Creek
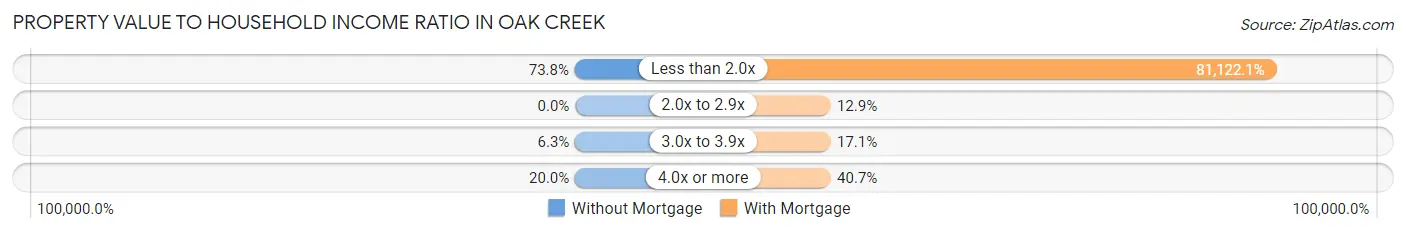
| Value-to-Income Ratio | Without Mortgage | With Mortgage |
| Less than 2.0x | 59 (73.8%) | 113,571 (81,122.1%) |
| 2.0x to 2.9x | 0 (0.0%) | 18 (12.9%) |
| 3.0x to 3.9x | 5 (6.2%) | 24 (17.1%) |
| 4.0x or more | 16 (20.0%) | 57 (40.7%) |
| Total | 80 (100.0%) | 140 (100.0%) |
Real Estate Taxes by Mortgage Status in Oak Creek
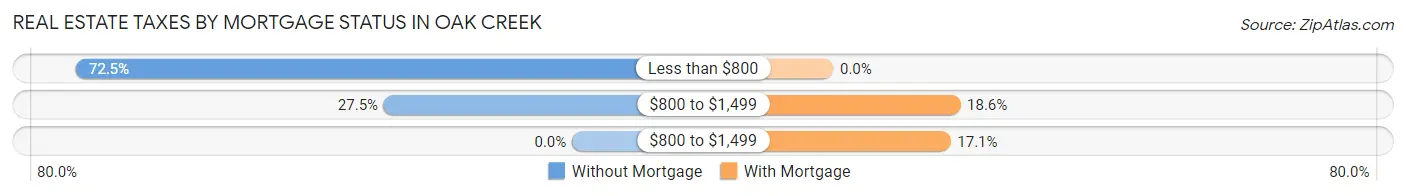
| Property Taxes | Without Mortgage | With Mortgage |
| Less than $800 | 58 (72.5%) | 0 (0.0%) |
| $800 to $1,499 | 22 (27.5%) | 26 (18.6%) |
| $800 to $1,499 | 0 (0.0%) | 24 (17.1%) |
| Total | 80 (100.0%) | 140 (100.0%) |
Health & Disability in Oak Creek
Health Insurance Coverage by Age in Oak Creek
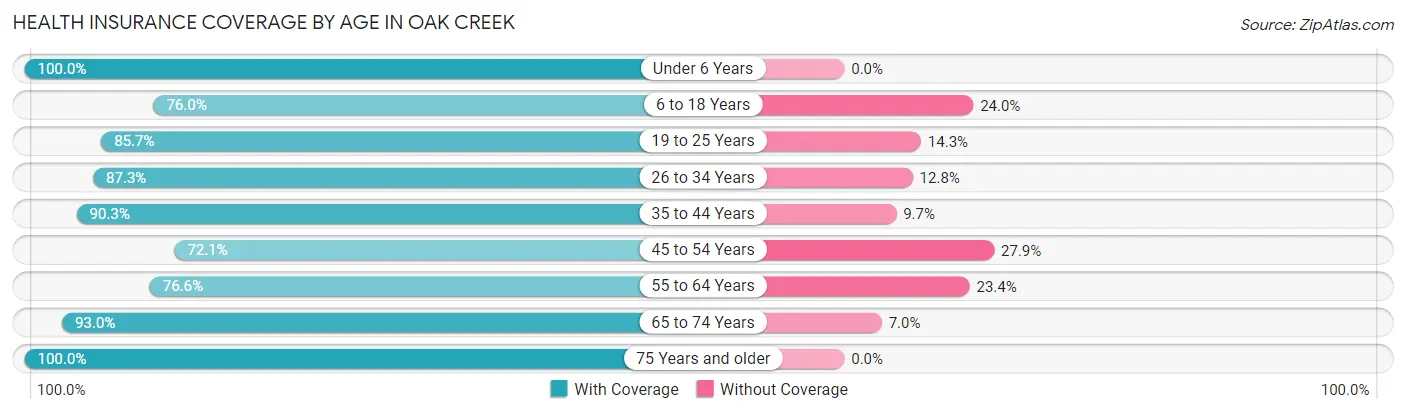
| Age Bracket | With Coverage | Without Coverage |
| Under 6 Years | 22 (100.0%) | 0 (0.0%) |
| 6 to 18 Years | 79 (76.0%) | 25 (24.0%) |
| 19 to 25 Years | 12 (85.7%) | 2 (14.3%) |
| 26 to 34 Years | 89 (87.3%) | 13 (12.8%) |
| 35 to 44 Years | 84 (90.3%) | 9 (9.7%) |
| 45 to 54 Years | 98 (72.1%) | 38 (27.9%) |
| 55 to 64 Years | 82 (76.6%) | 25 (23.4%) |
| 65 to 74 Years | 80 (93.0%) | 6 (7.0%) |
| 75 Years and older | 17 (100.0%) | 0 (0.0%) |
| Total | 563 (82.7%) | 118 (17.3%) |
Health Insurance Coverage by Citizenship Status in Oak Creek
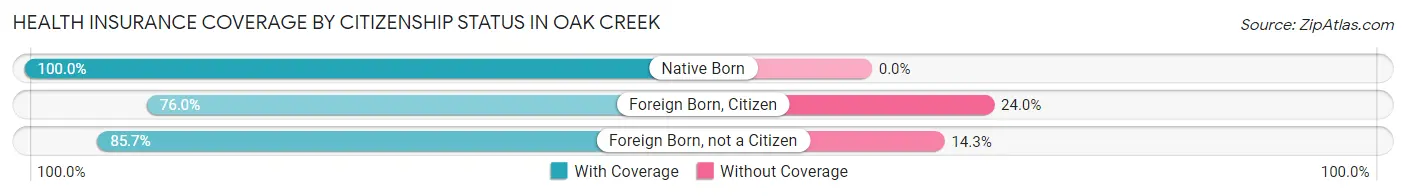
| Citizenship Status | With Coverage | Without Coverage |
| Native Born | 22 (100.0%) | 0 (0.0%) |
| Foreign Born, Citizen | 79 (76.0%) | 25 (24.0%) |
| Foreign Born, not a Citizen | 12 (85.7%) | 2 (14.3%) |
Health Insurance Coverage by Household Income in Oak Creek
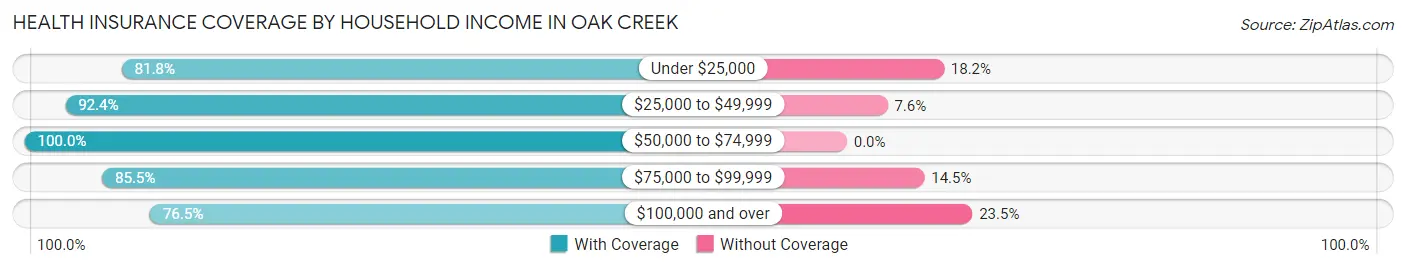
| Household Income | With Coverage | Without Coverage |
| Under $25,000 | 27 (81.8%) | 6 (18.2%) |
| $25,000 to $49,999 | 97 (92.4%) | 8 (7.6%) |
| $50,000 to $74,999 | 53 (100.0%) | 0 (0.0%) |
| $75,000 to $99,999 | 106 (85.5%) | 18 (14.5%) |
| $100,000 and over | 280 (76.5%) | 86 (23.5%) |
Public vs Private Health Insurance Coverage by Age in Oak Creek
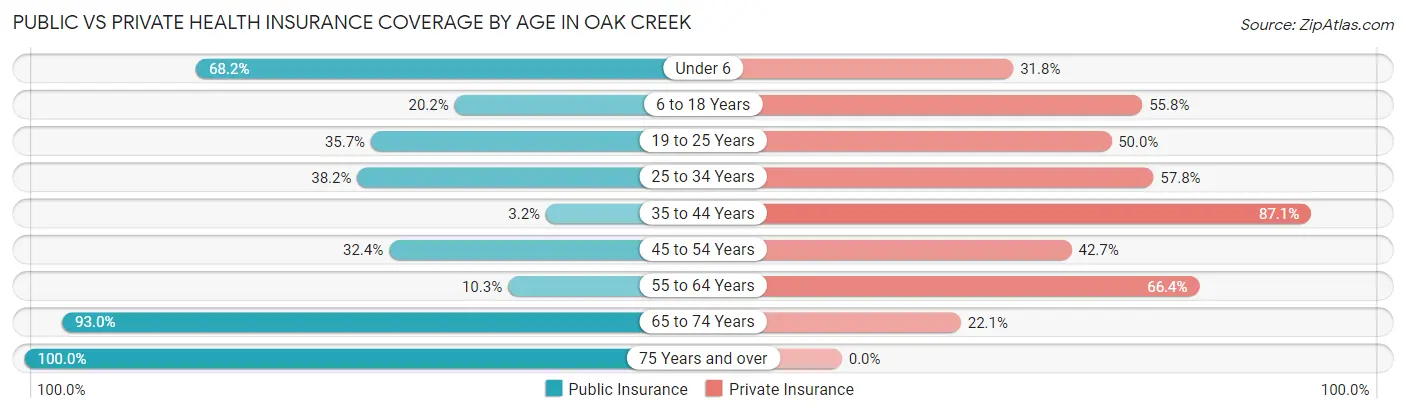
| Age Bracket | Public Insurance | Private Insurance |
| Under 6 | 15 (68.2%) | 7 (31.8%) |
| 6 to 18 Years | 21 (20.2%) | 58 (55.8%) |
| 19 to 25 Years | 5 (35.7%) | 7 (50.0%) |
| 25 to 34 Years | 39 (38.2%) | 59 (57.8%) |
| 35 to 44 Years | 3 (3.2%) | 81 (87.1%) |
| 45 to 54 Years | 44 (32.4%) | 58 (42.6%) |
| 55 to 64 Years | 11 (10.3%) | 71 (66.4%) |
| 65 to 74 Years | 80 (93.0%) | 19 (22.1%) |
| 75 Years and over | 17 (100.0%) | 0 (0.0%) |
| Total | 235 (34.5%) | 360 (52.9%) |
Disability Status by Sex by Age in Oak Creek
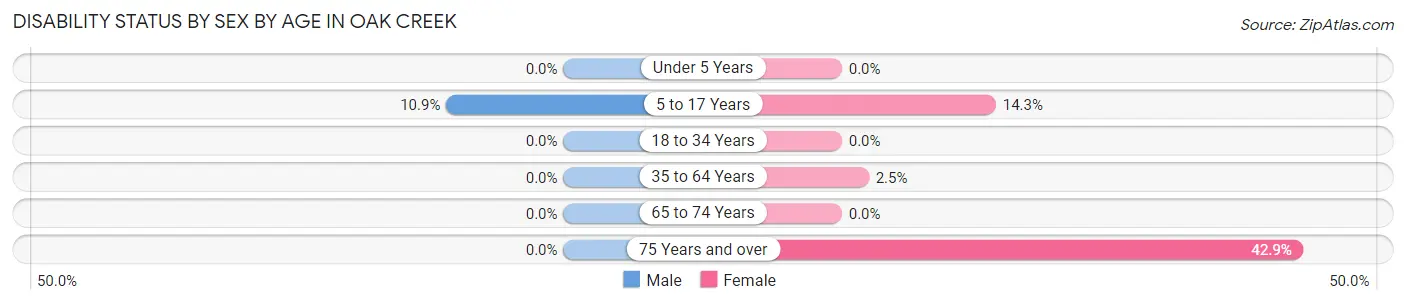
| Age Bracket | Male | Female |
| Under 5 Years | 0 (0.0%) | 0 (0.0%) |
| 5 to 17 Years | 10 (10.9%) | 2 (14.3%) |
| 18 to 34 Years | 0 (0.0%) | 0 (0.0%) |
| 35 to 64 Years | 0 (0.0%) | 4 (2.5%) |
| 65 to 74 Years | 0 (0.0%) | 0 (0.0%) |
| 75 Years and over | 0 (0.0%) | 6 (42.9%) |
Disability Class by Sex by Age in Oak Creek
Disability Class: Hearing Difficulty
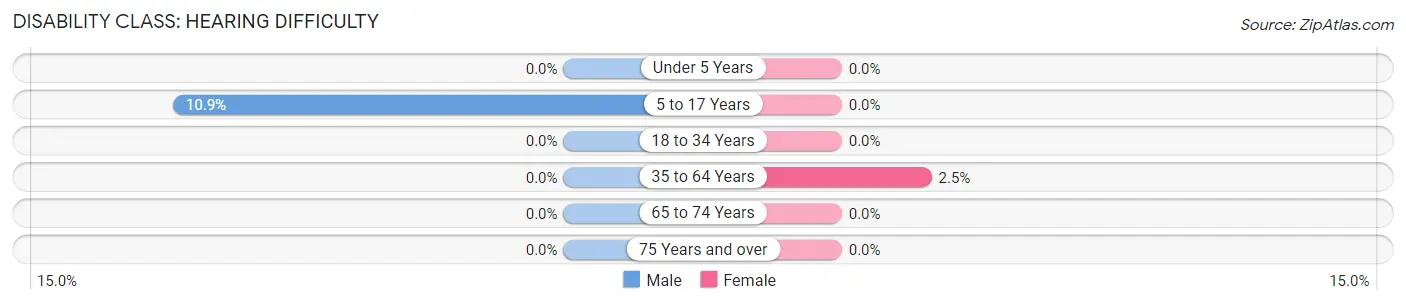
| Age Bracket | Male | Female |
| Under 5 Years | 0 (0.0%) | 0 (0.0%) |
| 5 to 17 Years | 10 (10.9%) | 0 (0.0%) |
| 18 to 34 Years | 0 (0.0%) | 0 (0.0%) |
| 35 to 64 Years | 0 (0.0%) | 4 (2.5%) |
| 65 to 74 Years | 0 (0.0%) | 0 (0.0%) |
| 75 Years and over | 0 (0.0%) | 0 (0.0%) |
Disability Class: Vision Difficulty
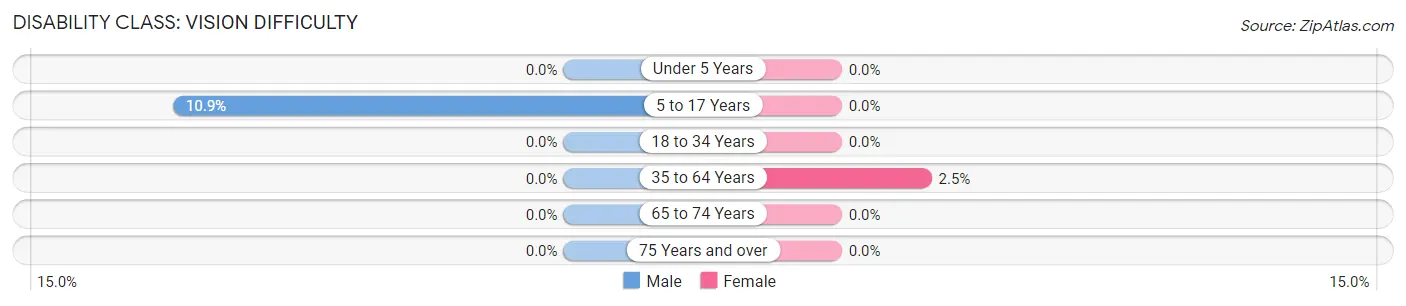
| Age Bracket | Male | Female |
| Under 5 Years | 0 (0.0%) | 0 (0.0%) |
| 5 to 17 Years | 10 (10.9%) | 0 (0.0%) |
| 18 to 34 Years | 0 (0.0%) | 0 (0.0%) |
| 35 to 64 Years | 0 (0.0%) | 4 (2.5%) |
| 65 to 74 Years | 0 (0.0%) | 0 (0.0%) |
| 75 Years and over | 0 (0.0%) | 0 (0.0%) |
Disability Class: Cognitive Difficulty
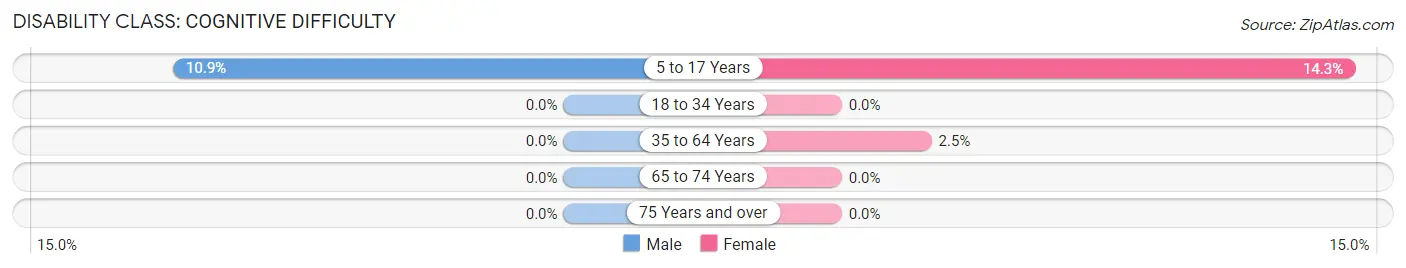
| Age Bracket | Male | Female |
| 5 to 17 Years | 10 (10.9%) | 2 (14.3%) |
| 18 to 34 Years | 0 (0.0%) | 0 (0.0%) |
| 35 to 64 Years | 0 (0.0%) | 4 (2.5%) |
| 65 to 74 Years | 0 (0.0%) | 0 (0.0%) |
| 75 Years and over | 0 (0.0%) | 0 (0.0%) |
Disability Class: Ambulatory Difficulty

| Age Bracket | Male | Female |
| 5 to 17 Years | 10 (10.9%) | 0 (0.0%) |
| 18 to 34 Years | 0 (0.0%) | 0 (0.0%) |
| 35 to 64 Years | 0 (0.0%) | 4 (2.5%) |
| 65 to 74 Years | 0 (0.0%) | 0 (0.0%) |
| 75 Years and over | 0 (0.0%) | 6 (42.9%) |
Disability Class: Self-Care Difficulty
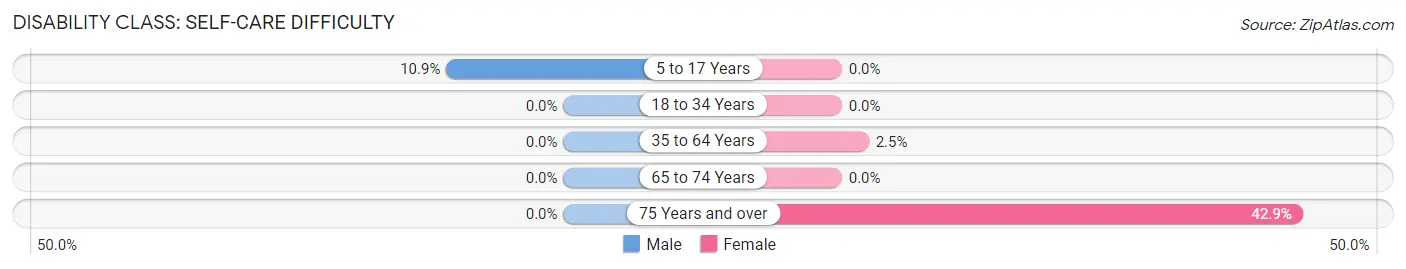
| Age Bracket | Male | Female |
| 5 to 17 Years | 10 (10.9%) | 0 (0.0%) |
| 18 to 34 Years | 0 (0.0%) | 0 (0.0%) |
| 35 to 64 Years | 0 (0.0%) | 4 (2.5%) |
| 65 to 74 Years | 0 (0.0%) | 0 (0.0%) |
| 75 Years and over | 0 (0.0%) | 6 (42.9%) |
Technology Access in Oak Creek
Computing Device Access in Oak Creek
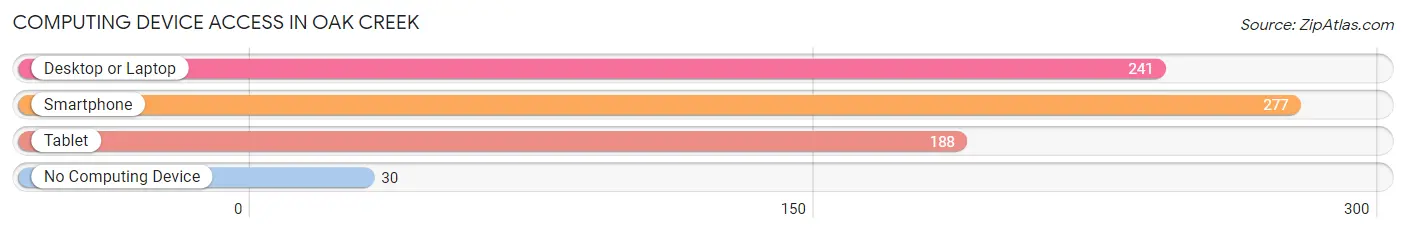
| Device Type | # Households | % Households |
| Desktop or Laptop | 241 | 73.7% |
| Smartphone | 277 | 84.7% |
| Tablet | 188 | 57.5% |
| No Computing Device | 30 | 9.2% |
| Total | 327 | 100.0% |
Internet Access in Oak Creek
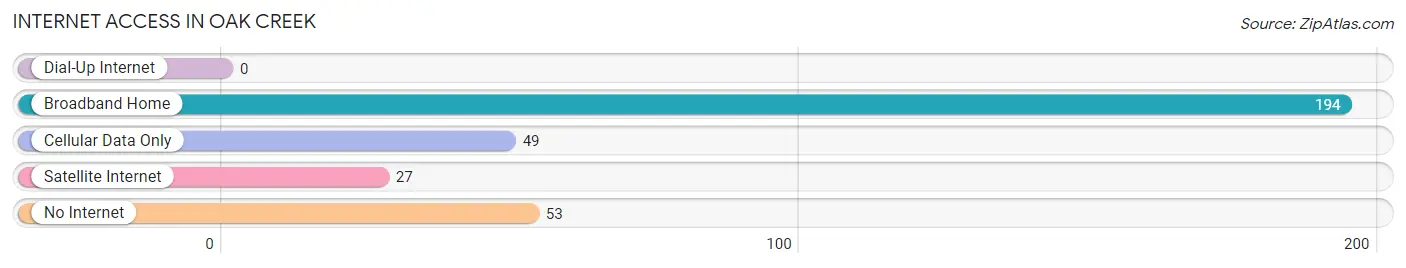
| Internet Type | # Households | % Households |
| Dial-Up Internet | 0 | 0.0% |
| Broadband Home | 194 | 59.3% |
| Cellular Data Only | 49 | 15.0% |
| Satellite Internet | 27 | 8.3% |
| No Internet | 53 | 16.2% |
| Total | 327 | 100.0% |
Oak Creek Summary
Oak Creek is a small town located in Routt County, Colorado. It is situated in the Yampa Valley, at the base of the Flat Tops Mountains. The town is located at an elevation of 6,400 feet and has a population of 1,541 as of the 2010 census.
History
Oak Creek was founded in 1881 by a group of settlers from the Midwest. The town was originally called Oak Creek Crossing, as it was located at the intersection of two major trails. The first settlers were primarily farmers and ranchers, and the town quickly grew to become a major hub for the surrounding area.
In the early 1900s, Oak Creek began to experience a period of growth and prosperity. The town was home to several businesses, including a hotel, a bank, a general store, and a post office. The town also had a school, a library, and a newspaper.
In the 1920s, Oak Creek experienced a period of decline. The Great Depression caused many businesses to close, and the population began to decline. However, the town was able to survive and eventually began to experience a period of growth in the 1950s.
Geography
Oak Creek is located in the Yampa Valley, at the base of the Flat Tops Mountains. The town is situated at an elevation of 6,400 feet and is surrounded by rolling hills and open meadows. The town is located near several major rivers, including the Yampa, White, and Elk Rivers.
The climate in Oak Creek is semi-arid, with hot summers and cold winters. The average annual temperature is around 50 degrees Fahrenheit, and the average annual precipitation is around 16 inches.
Economy
Oak Creek’s economy is primarily based on agriculture and tourism. The town is home to several farms and ranches, and the surrounding area is known for its production of hay, wheat, and other crops.
Tourism is also an important part of the local economy. The town is home to several popular attractions, including the Yampa River State Park, the Flat Tops Wilderness Area, and the Steamboat Ski Resort.
Demographics
As of the 2010 census, Oak Creek had a population of 1,541. The racial makeup of the town was 95.3% White, 0.7% African American, 0.7% Native American, 0.3% Asian, 0.1% Pacific Islander, and 2.0% from other races. The median household income was $41,250, and the median family income was $50,000.
Conclusion
Oak Creek is a small town located in Routt County, Colorado. It is situated in the Yampa Valley, at the base of the Flat Tops Mountains. The town is home to several farms and ranches, and the surrounding area is known for its production of hay, wheat, and other crops. Tourism is also an important part of the local economy, and the town is home to several popular attractions. As of the 2010 census, Oak Creek had a population of 1,541. The racial makeup of the town was 95.3% White, 0.7% African American, 0.7% Native American, 0.3% Asian, 0.1% Pacific Islander, and 2.0% from other races. The median household income was $41,250, and the median family income was $50,000.
Common Questions
What is Per Capita Income in Oak Creek?
Per Capita income in Oak Creek is $46,652.
What is the Median Family Income in Oak Creek?
Median Family Income in Oak Creek is $109,464.
What is the Median Household income in Oak Creek?
Median Household Income in Oak Creek is $87,228.
What is Income or Wage Gap in Oak Creek?
Income or Wage Gap in Oak Creek is 30.3%.
Women in Oak Creek earn 69.7 cents for every dollar earned by a man.
What is Inequality or Gini Index in Oak Creek?
Inequality or Gini Index in Oak Creek is 0.38.
What is the Total Population of Oak Creek?
Total Population of Oak Creek is 681.
What is the Total Male Population of Oak Creek?
Total Male Population of Oak Creek is 362.
What is the Total Female Population of Oak Creek?
Total Female Population of Oak Creek is 319.
What is the Ratio of Males per 100 Females in Oak Creek?
There are 113.48 Males per 100 Females in Oak Creek.
What is the Ratio of Females per 100 Males in Oak Creek?
There are 88.12 Females per 100 Males in Oak Creek.
What is the Median Population Age in Oak Creek?
Median Population Age in Oak Creek is 45.2 Years.
What is the Average Family Size in Oak Creek
Average Family Size in Oak Creek is 2.7 People.
What is the Average Household Size in Oak Creek
Average Household Size in Oak Creek is 2.1 People.
How Large is the Labor Force in Oak Creek?
There are 405 People in the Labor Forcein in Oak Creek.
What is the Percentage of People in the Labor Force in Oak Creek?
70.8% of People are in the Labor Force in Oak Creek.
What is the Unemployment Rate in Oak Creek?
Unemployment Rate in Oak Creek is 3.2%.