Niwot, CO Map & Demographics
Niwot Map
Niwot Overview
$78,726
PER CAPITA INCOME
$169,737
AVG FAMILY INCOME
$135,758
AVG HOUSEHOLD INCOME
84.0%
WAGE / INCOME GAP [ % ]
16.0¢/ $1
WAGE / INCOME GAP [ $ ]
0.49
INEQUALITY / GINI INDEX
4,091
TOTAL POPULATION
2,065
MALE POPULATION
2,026
FEMALE POPULATION
101.92
MALES / 100 FEMALES
98.11
FEMALES / 100 MALES
51.0
MEDIAN AGE
2.9
AVG FAMILY SIZE
2.5
AVG HOUSEHOLD SIZE
1,907
LABOR FORCE [ PEOPLE ]
54.9%
PERCENT IN LABOR FORCE
7.4%
UNEMPLOYMENT RATE
Income in Niwot
Income Overview in Niwot
Per Capita Income in Niwot is $78,726, while median incomes of families and households are $169,737 and $135,758 respectively.
| Characteristic | Number | Measure |
| Per Capita Income | 4,091 | $78,726 |
| Median Family Income | 1,184 | $169,737 |
| Mean Family Income | 1,184 | $244,651 |
| Median Household Income | 1,619 | $135,758 |
| Mean Household Income | 1,619 | $198,743 |
| Income Deficit | 1,184 | $0 |
| Wage / Income Gap (%) | 4,091 | 84.01% |
| Wage / Income Gap ($) | 4,091 | 15.99¢ per $1 |
| Gini / Inequality Index | 4,091 | 0.49 |
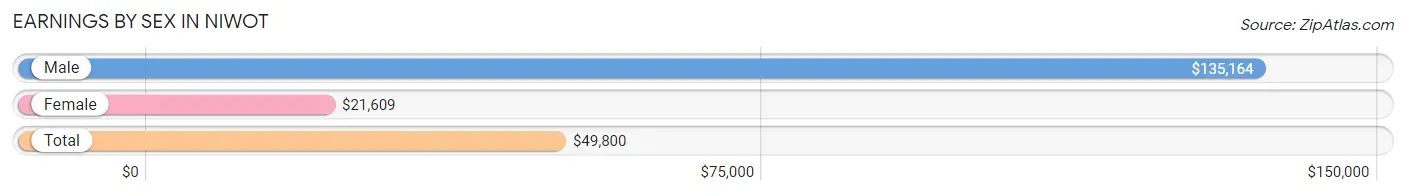
Earnings by Sex in Niwot
Average Earnings in Niwot are $49,800, $135,164 for men and $21,609 for women, a difference of 84.0%.
| Sex | Number | Average Earnings |
| Male | 1,107 (55.6%) | $135,164 |
| Female | 883 (44.4%) | $21,609 |
| Total | 1,990 (100.0%) | $49,800 |
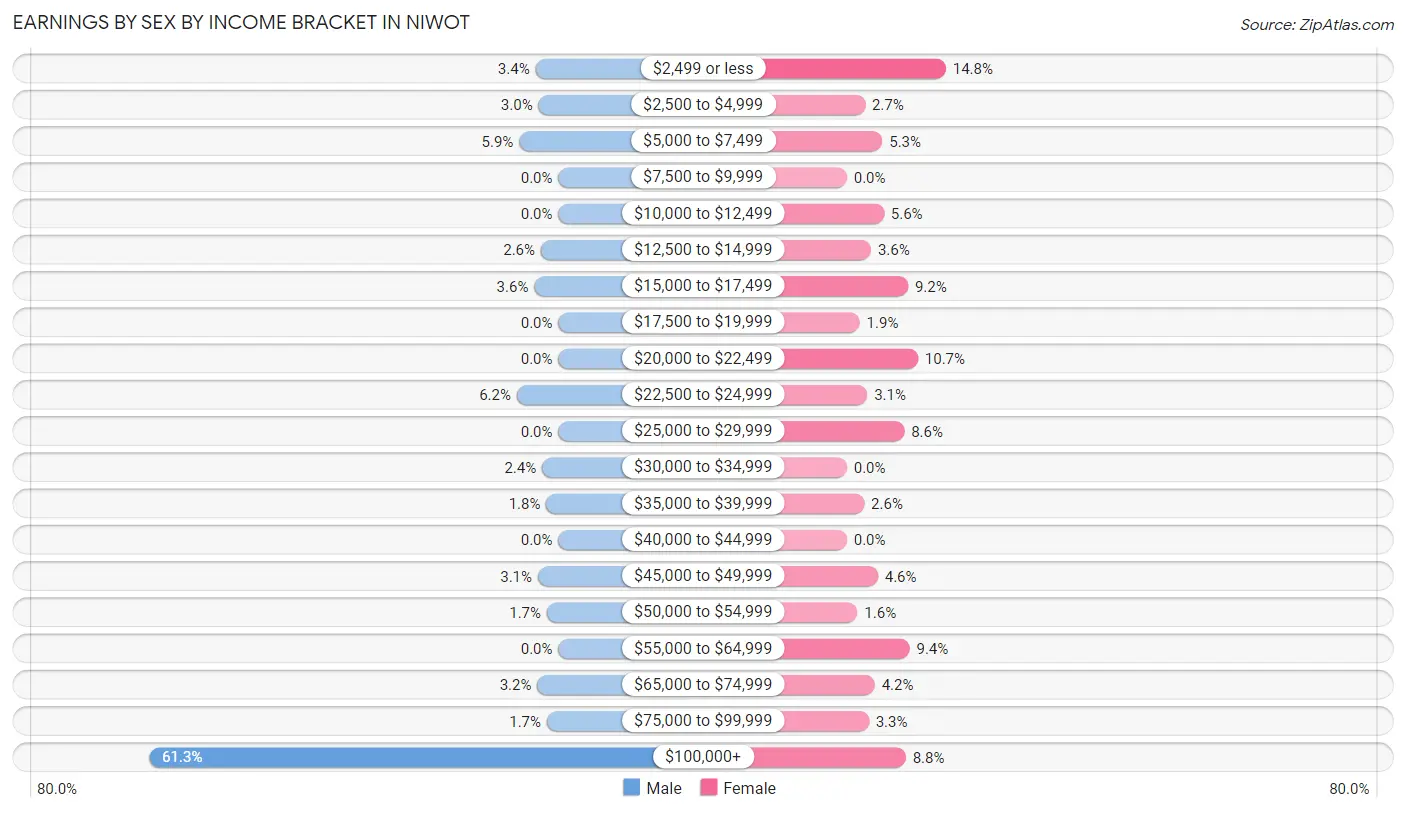
Earnings by Sex by Income Bracket in Niwot
The most common earnings brackets in Niwot are $100,000+ for men (679 | 61.3%) and $2,499 or less for women (131 | 14.8%).
| Income | Male | Female |
| $2,499 or less | 38 (3.4%) | 131 (14.8%) |
| $2,500 to $4,999 | 33 (3.0%) | 24 (2.7%) |
| $5,000 to $7,499 | 65 (5.9%) | 47 (5.3%) |
| $7,500 to $9,999 | 0 (0.0%) | 0 (0.0%) |
| $10,000 to $12,499 | 0 (0.0%) | 49 (5.6%) |
| $12,500 to $14,999 | 29 (2.6%) | 32 (3.6%) |
| $15,000 to $17,499 | 40 (3.6%) | 81 (9.2%) |
| $17,500 to $19,999 | 0 (0.0%) | 17 (1.9%) |
| $20,000 to $22,499 | 0 (0.0%) | 94 (10.6%) |
| $22,500 to $24,999 | 69 (6.2%) | 27 (3.1%) |
| $25,000 to $29,999 | 0 (0.0%) | 76 (8.6%) |
| $30,000 to $34,999 | 27 (2.4%) | 0 (0.0%) |
| $35,000 to $39,999 | 20 (1.8%) | 23 (2.6%) |
| $40,000 to $44,999 | 0 (0.0%) | 0 (0.0%) |
| $45,000 to $49,999 | 34 (3.1%) | 41 (4.6%) |
| $50,000 to $54,999 | 19 (1.7%) | 14 (1.6%) |
| $55,000 to $64,999 | 0 (0.0%) | 83 (9.4%) |
| $65,000 to $74,999 | 35 (3.2%) | 37 (4.2%) |
| $75,000 to $99,999 | 19 (1.7%) | 29 (3.3%) |
| $100,000+ | 679 (61.3%) | 78 (8.8%) |
| Total | 1,107 (100.0%) | 883 (100.0%) |
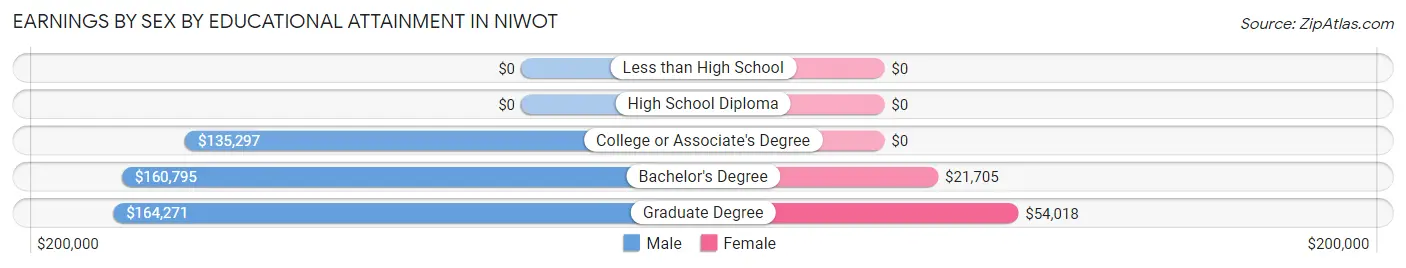
Earnings by Sex by Educational Attainment in Niwot
Average earnings in Niwot are $136,288 for men and $27,973 for women, a difference of 79.5%. Men with an educational attainment of graduate degree enjoy the highest average annual earnings of $164,271, while those with college or associate's degree education earn the least with $135,297. Women with an educational attainment of graduate degree earn the most with the average annual earnings of $54,018, while those with bachelor's degree education have the smallest earnings of $21,705.
| Educational Attainment | Male Income | Female Income |
| Less than High School | - | - |
| High School Diploma | - | - |
| College or Associate's Degree | $135,297 | $0 |
| Bachelor's Degree | $160,795 | $21,705 |
| Graduate Degree | $164,271 | $54,018 |
| Total | $136,288 | $27,973 |
Family Income in Niwot
Family Income Brackets in Niwot
According to the Niwot family income data, there are 516 families falling into the $200,000+ income range, which is the most common income bracket and makes up 43.6% of all families.
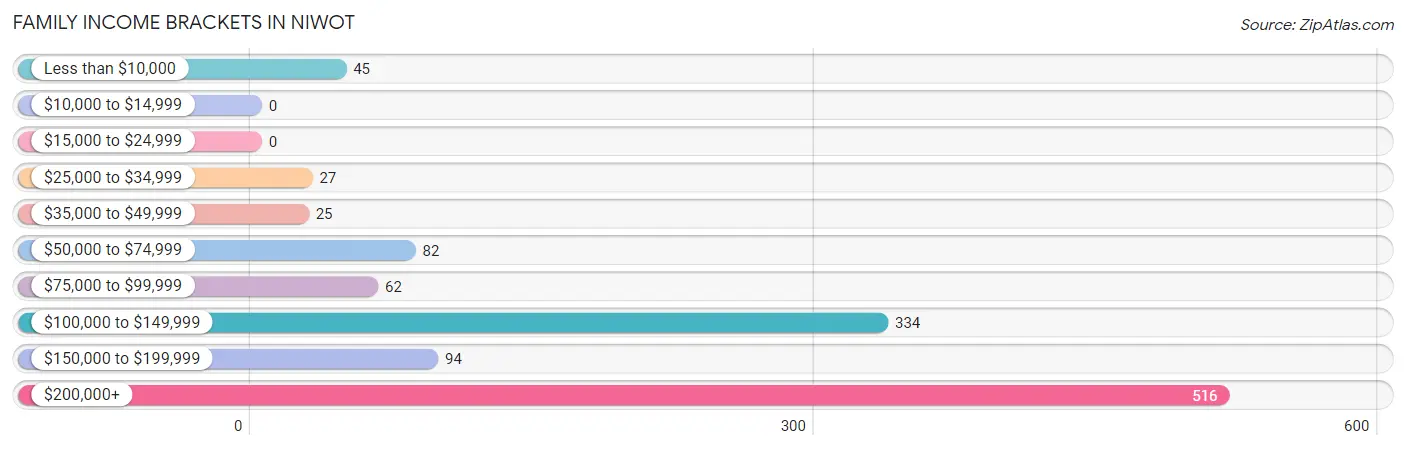
| Income Bracket | # Families | % Families |
| Less than $10,000 | 45 | 3.8% |
| $10,000 to $14,999 | 0 | 0.0% |
| $15,000 to $24,999 | 0 | 0.0% |
| $25,000 to $34,999 | 27 | 2.3% |
| $35,000 to $49,999 | 25 | 2.1% |
| $50,000 to $74,999 | 82 | 6.9% |
| $75,000 to $99,999 | 62 | 5.2% |
| $100,000 to $149,999 | 334 | 28.2% |
| $150,000 to $199,999 | 94 | 7.9% |
| $200,000+ | 516 | 43.6% |
Family Income by Famaliy Size in Niwot
5-person families (38 | 3.2%) account for the highest median family income in Niwot with $250,001 per family, while 3-person families (231 | 19.5%) have the highest median income of $70,887 per family member.
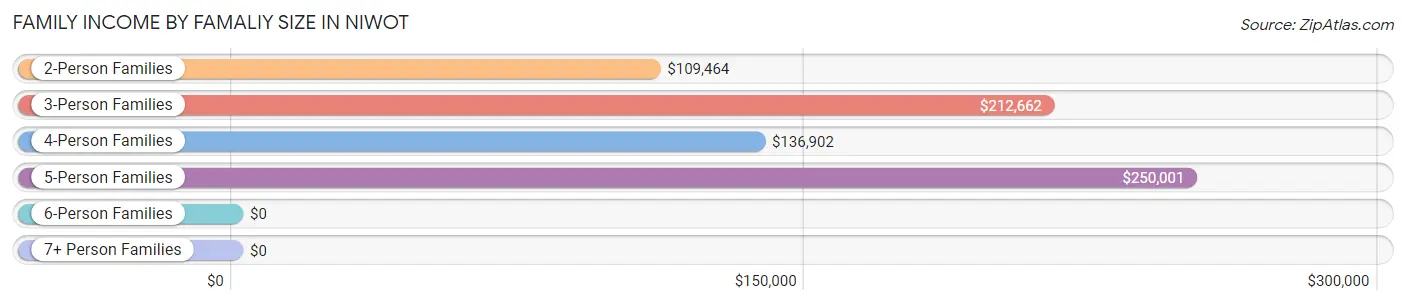
| Income Bracket | # Families | Median Income |
| 2-Person Families | 543 (45.9%) | $109,464 |
| 3-Person Families | 231 (19.5%) | $212,662 |
| 4-Person Families | 336 (28.4%) | $136,902 |
| 5-Person Families | 38 (3.2%) | $250,001 |
| 6-Person Families | 36 (3.0%) | $0 |
| 7+ Person Families | 0 (0.0%) | $0 |
| Total | 1,184 (100.0%) | $169,737 |
Family Income by Number of Earners in Niwot
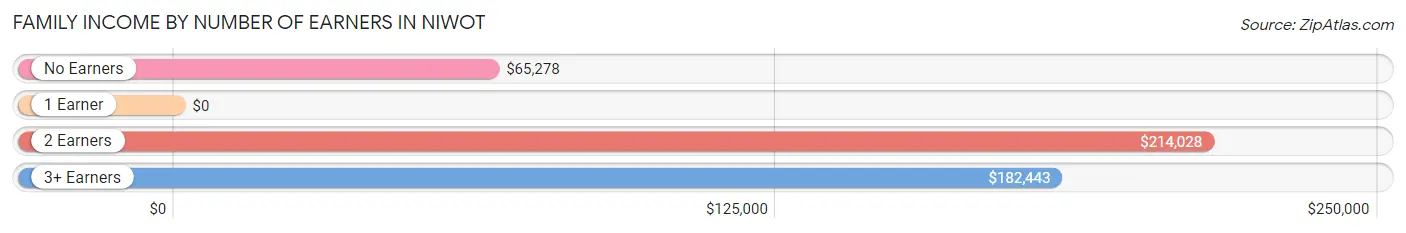
| Number of Earners | # Families | Median Income |
| No Earners | 224 (18.9%) | $65,278 |
| 1 Earner | 399 (33.7%) | $0 |
| 2 Earners | 456 (38.5%) | $214,028 |
| 3+ Earners | 105 (8.9%) | $182,443 |
| Total | 1,184 (100.0%) | $169,737 |
Household Income in Niwot
Household Income Brackets in Niwot
With 542 households falling in the category, the $200,000+ income range is the most frequent in Niwot, accounting for 33.5% of all households. In contrast, only 18 households (1.1%) fall into the $10,000 to $14,999 income bracket, making it the least populous group.
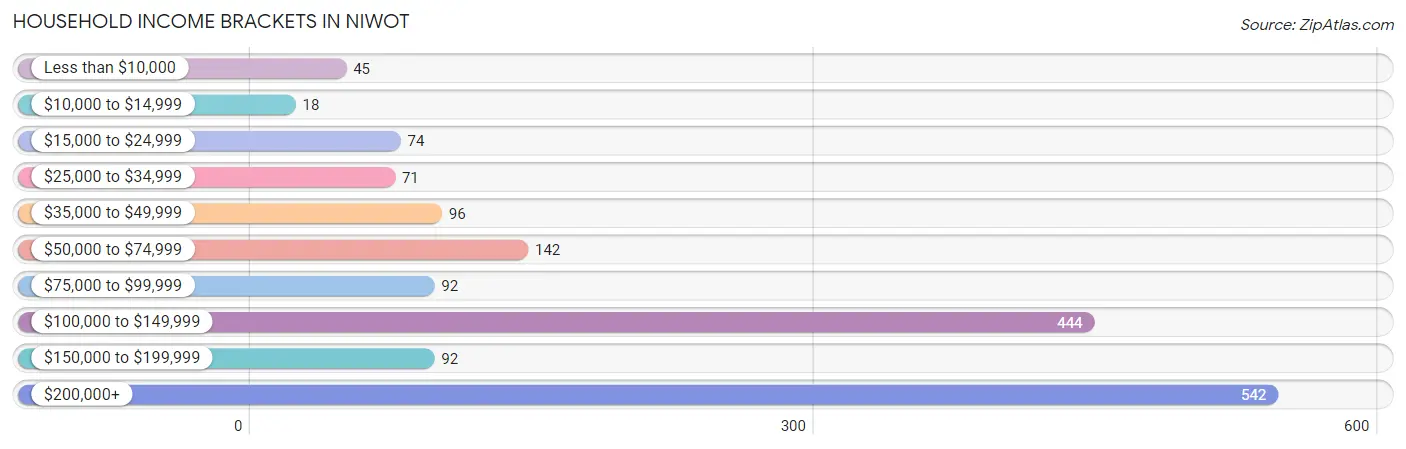
| Income Bracket | # Households | % Households |
| Less than $10,000 | 45 | 2.8% |
| $10,000 to $14,999 | 18 | 1.1% |
| $15,000 to $24,999 | 74 | 4.6% |
| $25,000 to $34,999 | 71 | 4.4% |
| $35,000 to $49,999 | 96 | 5.9% |
| $50,000 to $74,999 | 142 | 8.8% |
| $75,000 to $99,999 | 92 | 5.7% |
| $100,000 to $149,999 | 444 | 27.4% |
| $150,000 to $199,999 | 92 | 5.7% |
| $200,000+ | 542 | 33.5% |
Household Income by Householder Age in Niwot
The median household income in Niwot is $135,758, with the highest median household income of $182,273 found in the 45 to 64 years age bracket for the primary householder. A total of 706 households (43.6%) fall into this category.
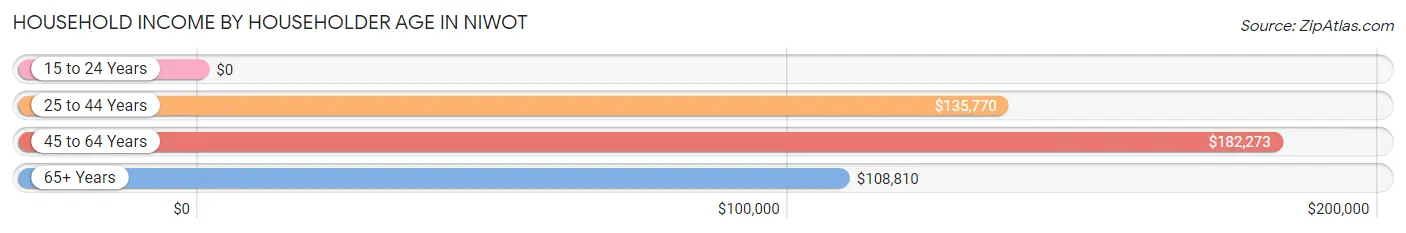
| Income Bracket | # Households | Median Income |
| 15 to 24 Years | 0 (0.0%) | $0 |
| 25 to 44 Years | 381 (23.5%) | $135,770 |
| 45 to 64 Years | 706 (43.6%) | $182,273 |
| 65+ Years | 532 (32.9%) | $108,810 |
| Total | 1,619 (100.0%) | $135,758 |
Poverty in Niwot
Income Below Poverty by Sex and Age in Niwot
With 2.2% poverty level for males and 6.7% for females among the residents of Niwot, 55 to 64 year old males and 18 to 24 year old females are the most vulnerable to poverty, with 46 males (10.5%) and 46 females (30.9%) in their respective age groups living below the poverty level.
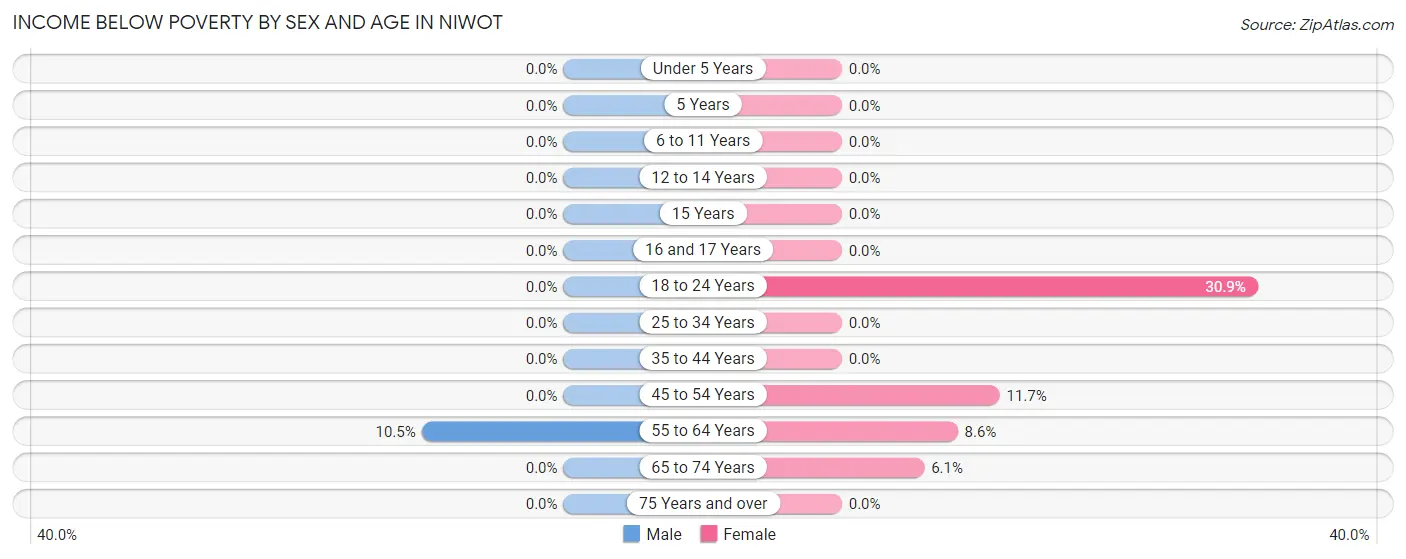
| Age Bracket | Male | Female |
| Under 5 Years | 0 (0.0%) | 0 (0.0%) |
| 5 Years | 0 (0.0%) | 0 (0.0%) |
| 6 to 11 Years | 0 (0.0%) | 0 (0.0%) |
| 12 to 14 Years | 0 (0.0%) | 0 (0.0%) |
| 15 Years | 0 (0.0%) | 0 (0.0%) |
| 16 and 17 Years | 0 (0.0%) | 0 (0.0%) |
| 18 to 24 Years | 0 (0.0%) | 46 (30.9%) |
| 25 to 34 Years | 0 (0.0%) | 0 (0.0%) |
| 35 to 44 Years | 0 (0.0%) | 0 (0.0%) |
| 45 to 54 Years | 0 (0.0%) | 24 (11.7%) |
| 55 to 64 Years | 46 (10.5%) | 45 (8.6%) |
| 65 to 74 Years | 0 (0.0%) | 18 (6.1%) |
| 75 Years and over | 0 (0.0%) | 0 (0.0%) |
| Total | 46 (2.2%) | 133 (6.7%) |
Income Above Poverty by Sex and Age in Niwot
According to the poverty statistics in Niwot, males aged under 5 years and females aged under 5 years are the age groups that are most secure financially, with 100.0% of males and 100.0% of females in these age groups living above the poverty line.
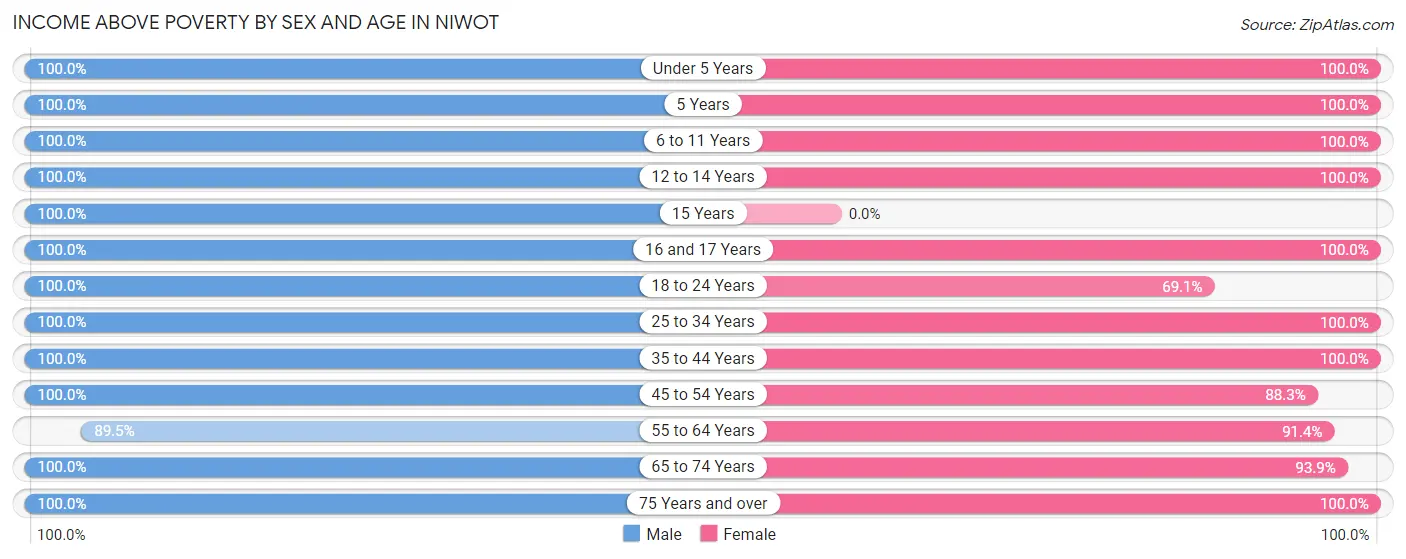
| Age Bracket | Male | Female |
| Under 5 Years | 36 (100.0%) | 72 (100.0%) |
| 5 Years | 56 (100.0%) | 13 (100.0%) |
| 6 to 11 Years | 121 (100.0%) | 94 (100.0%) |
| 12 to 14 Years | 37 (100.0%) | 174 (100.0%) |
| 15 Years | 15 (100.0%) | 0 (0.0%) |
| 16 and 17 Years | 30 (100.0%) | 60 (100.0%) |
| 18 to 24 Years | 147 (100.0%) | 103 (69.1%) |
| 25 to 34 Years | 160 (100.0%) | 60 (100.0%) |
| 35 to 44 Years | 329 (100.0%) | 252 (100.0%) |
| 45 to 54 Years | 172 (100.0%) | 181 (88.3%) |
| 55 to 64 Years | 391 (89.5%) | 478 (91.4%) |
| 65 to 74 Years | 275 (100.0%) | 276 (93.9%) |
| 75 Years and over | 233 (100.0%) | 86 (100.0%) |
| Total | 2,002 (97.8%) | 1,849 (93.3%) |
Income Below Poverty Among Married-Couple Families in Niwot
The poverty statistics for married-couple families in Niwot show that 4.0% or 45 of the total 1,138 families live below the poverty line. Families with no children have the highest poverty rate of 6.2%, comprising of 45 families. On the other hand, families with 1 or 2 children have the lowest poverty rate of 0.0%, which includes 0 families.
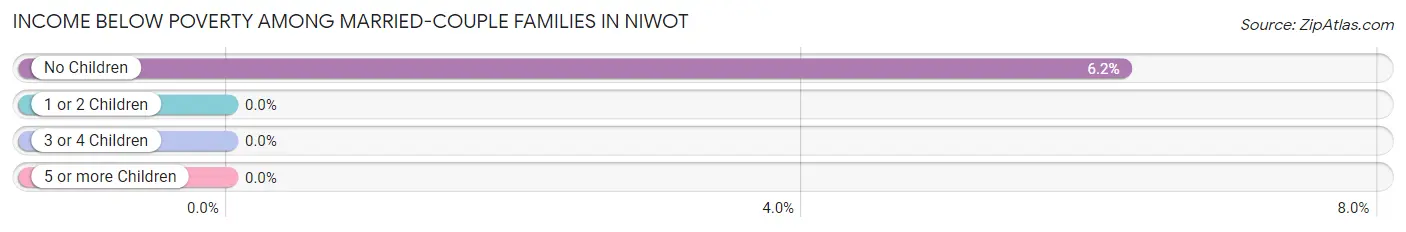
| Children | Above Poverty | Below Poverty |
| No Children | 678 (93.8%) | 45 (6.2%) |
| 1 or 2 Children | 371 (100.0%) | 0 (0.0%) |
| 3 or 4 Children | 44 (100.0%) | 0 (0.0%) |
| 5 or more Children | 0 (0.0%) | 0 (0.0%) |
| Total | 1,093 (96.1%) | 45 (4.0%) |
Income Below Poverty Among Single-Parent Households in Niwot
| Children | Single Father | Single Mother |
| No Children | 0 (0.0%) | 0 (0.0%) |
| 1 or 2 Children | 0 (0.0%) | 0 (0.0%) |
| 3 or 4 Children | 0 (0.0%) | 0 (0.0%) |
| 5 or more Children | 0 (0.0%) | 0 (0.0%) |
| Total | 0 (0.0%) | 0 (0.0%) |
Income Below Poverty Among Married-Couple vs Single-Parent Households in Niwot
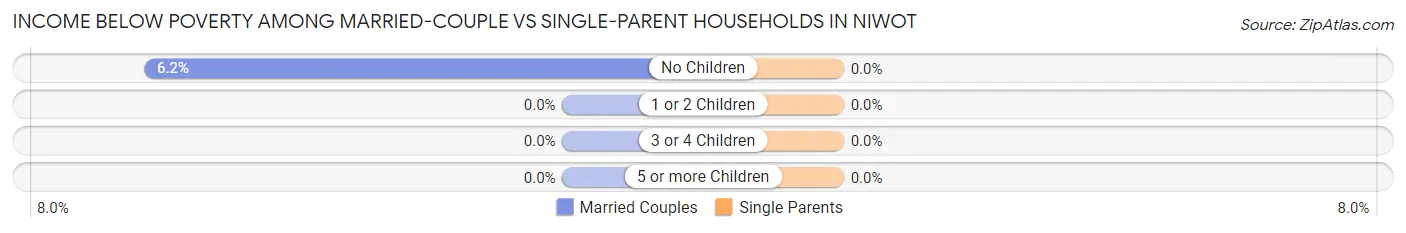
| Children | Married-Couple Families | Single-Parent Households |
| No Children | 45 (6.2%) | 0 (0.0%) |
| 1 or 2 Children | 0 (0.0%) | 0 (0.0%) |
| 3 or 4 Children | 0 (0.0%) | 0 (0.0%) |
| 5 or more Children | 0 (0.0%) | 0 (0.0%) |
| Total | 45 (4.0%) | 0 (0.0%) |
Race in Niwot
The most populous races in Niwot are White / Caucasian (3,934 | 96.2%), Hispanic or Latino (218 | 5.3%), and Two or more Races (88 | 2.1%).
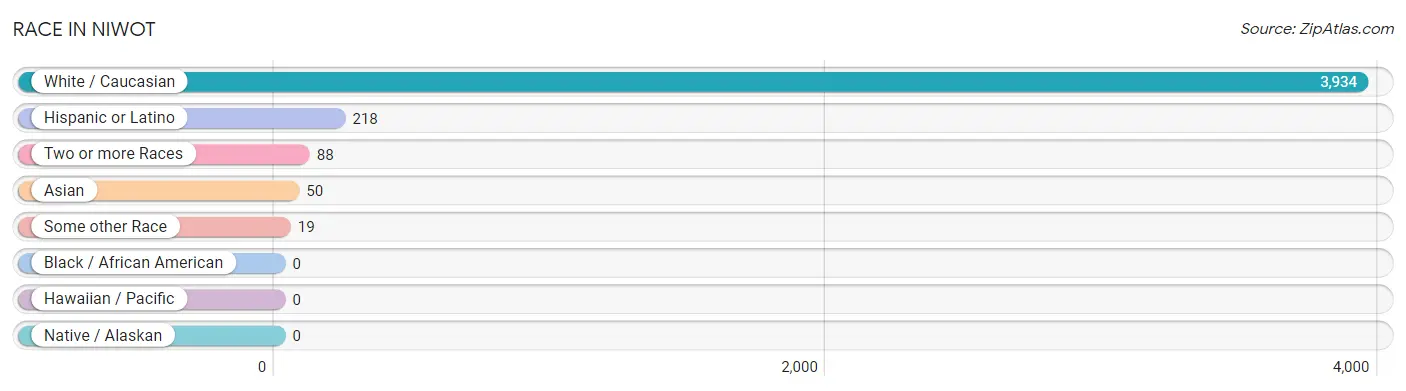
| Race | # Population | % Population |
| Asian | 50 | 1.2% |
| Black / African American | 0 | 0.0% |
| Hawaiian / Pacific | 0 | 0.0% |
| Hispanic or Latino | 218 | 5.3% |
| Native / Alaskan | 0 | 0.0% |
| White / Caucasian | 3,934 | 96.2% |
| Two or more Races | 88 | 2.1% |
| Some other Race | 19 | 0.5% |
| Total | 4,091 | 100.0% |
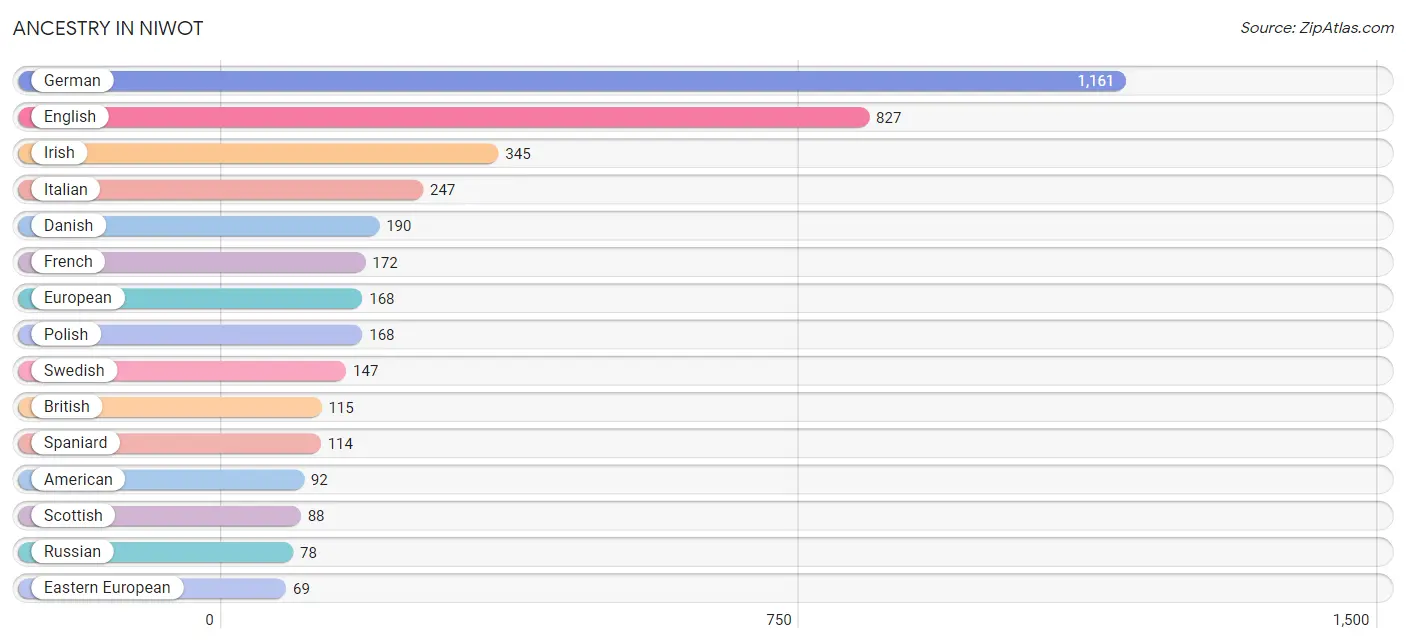
Ancestry in Niwot
The most populous ancestries reported in Niwot are German (1,161 | 28.4%), English (827 | 20.2%), Irish (345 | 8.4%), Italian (247 | 6.0%), and Danish (190 | 4.6%), together accounting for 67.7% of all Niwot residents.
| Ancestry | # Population | % Population |
| American | 92 | 2.2% |
| Arab | 8 | 0.2% |
| Austrian | 13 | 0.3% |
| Brazilian | 9 | 0.2% |
| British | 115 | 2.8% |
| Canadian | 14 | 0.3% |
| Chilean | 38 | 0.9% |
| Colombian | 25 | 0.6% |
| Croatian | 17 | 0.4% |
| Danish | 190 | 4.6% |
| Dutch | 55 | 1.3% |
| Eastern European | 69 | 1.7% |
| English | 827 | 20.2% |
| European | 168 | 4.1% |
| Finnish | 29 | 0.7% |
| French | 172 | 4.2% |
| German | 1,161 | 28.4% |
| Indian (Asian) | 47 | 1.1% |
| Iranian | 61 | 1.5% |
| Irish | 345 | 8.4% |
| Italian | 247 | 6.0% |
| New Zealander | 18 | 0.4% |
| Norwegian | 68 | 1.7% |
| Polish | 168 | 4.1% |
| Puerto Rican | 41 | 1.0% |
| Russian | 78 | 1.9% |
| Scandinavian | 19 | 0.5% |
| Scotch-Irish | 15 | 0.4% |
| Scottish | 88 | 2.1% |
| Slovak | 16 | 0.4% |
| South American | 63 | 1.5% |
| Spaniard | 114 | 2.8% |
| Swedish | 147 | 3.6% |
| Swiss | 14 | 0.3% |
| Thai | 3 | 0.1% |
| Welsh | 13 | 0.3% | View All 36 Rows |
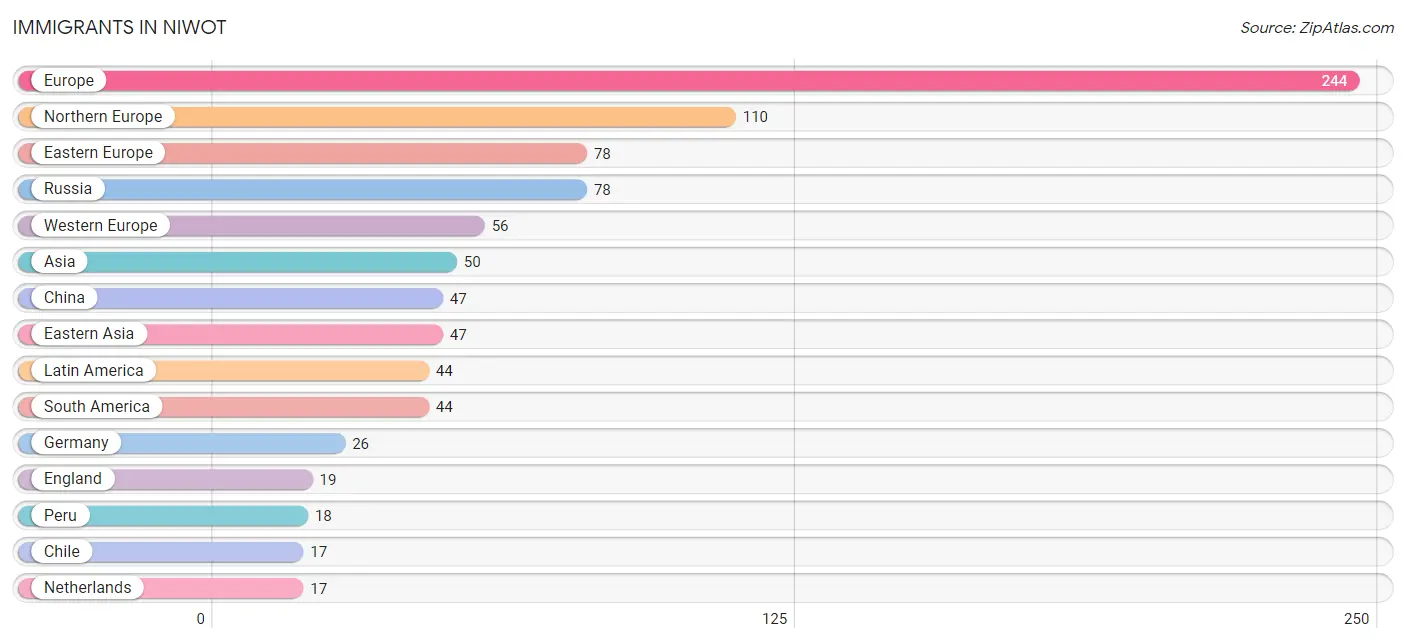
Immigrants in Niwot
The most numerous immigrant groups reported in Niwot came from Europe (244 | 6.0%), Northern Europe (110 | 2.7%), Eastern Europe (78 | 1.9%), Russia (78 | 1.9%), and Western Europe (56 | 1.4%), together accounting for 13.8% of all Niwot residents.
| Immigration Origin | # Population | % Population |
| Asia | 50 | 1.2% |
| Austria | 13 | 0.3% |
| Brazil | 9 | 0.2% |
| Chile | 17 | 0.4% |
| China | 47 | 1.1% |
| Eastern Asia | 47 | 1.1% |
| Eastern Europe | 78 | 1.9% |
| England | 19 | 0.5% |
| Europe | 244 | 6.0% |
| Germany | 26 | 0.6% |
| India | 3 | 0.1% |
| Latin America | 44 | 1.1% |
| Netherlands | 17 | 0.4% |
| Northern Europe | 110 | 2.7% |
| Peru | 18 | 0.4% |
| Russia | 78 | 1.9% |
| South America | 44 | 1.1% |
| South Central Asia | 3 | 0.1% |
| Western Europe | 56 | 1.4% | View All 19 Rows |
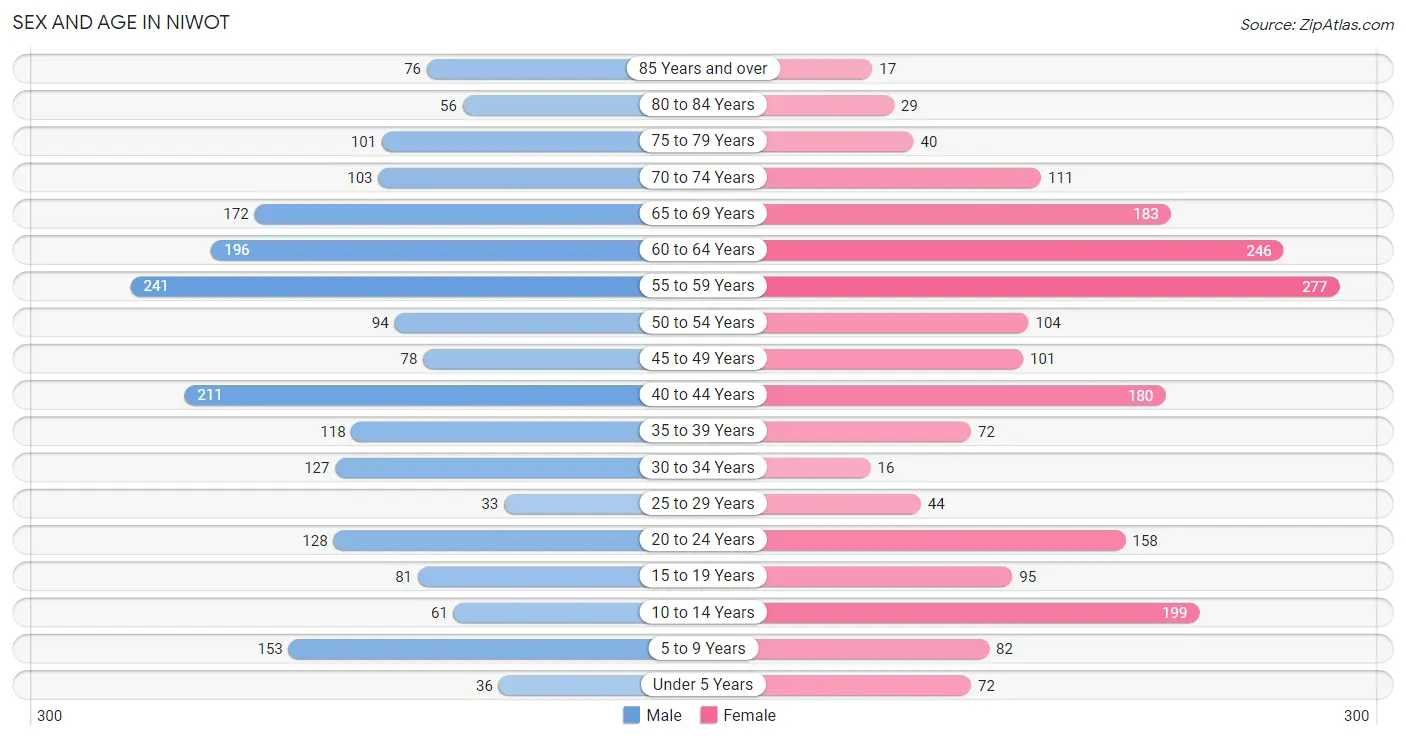
Sex and Age in Niwot
Sex and Age in Niwot
The most populous age groups in Niwot are 55 to 59 Years (241 | 11.7%) for men and 55 to 59 Years (277 | 13.7%) for women.
| Age Bracket | Male | Female |
| Under 5 Years | 36 (1.7%) | 72 (3.5%) |
| 5 to 9 Years | 153 (7.4%) | 82 (4.1%) |
| 10 to 14 Years | 61 (2.9%) | 199 (9.8%) |
| 15 to 19 Years | 81 (3.9%) | 95 (4.7%) |
| 20 to 24 Years | 128 (6.2%) | 158 (7.8%) |
| 25 to 29 Years | 33 (1.6%) | 44 (2.2%) |
| 30 to 34 Years | 127 (6.1%) | 16 (0.8%) |
| 35 to 39 Years | 118 (5.7%) | 72 (3.5%) |
| 40 to 44 Years | 211 (10.2%) | 180 (8.9%) |
| 45 to 49 Years | 78 (3.8%) | 101 (5.0%) |
| 50 to 54 Years | 94 (4.5%) | 104 (5.1%) |
| 55 to 59 Years | 241 (11.7%) | 277 (13.7%) |
| 60 to 64 Years | 196 (9.5%) | 246 (12.1%) |
| 65 to 69 Years | 172 (8.3%) | 183 (9.0%) |
| 70 to 74 Years | 103 (5.0%) | 111 (5.5%) |
| 75 to 79 Years | 101 (4.9%) | 40 (2.0%) |
| 80 to 84 Years | 56 (2.7%) | 29 (1.4%) |
| 85 Years and over | 76 (3.7%) | 17 (0.8%) |
| Total | 2,065 (100.0%) | 2,026 (100.0%) |
Families and Households in Niwot
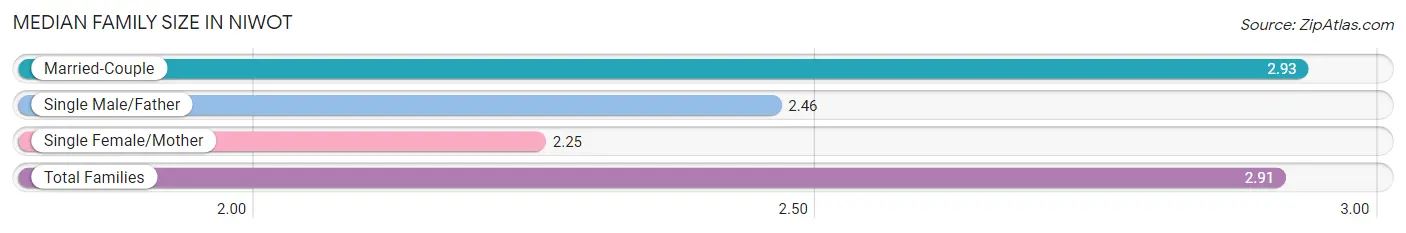
Median Family Size in Niwot
The median family size in Niwot is 2.91 persons per family, with married-couple families (1,138 | 96.1%) accounting for the largest median family size of 2.93 persons per family. On the other hand, single female/mother families (20 | 1.7%) represent the smallest median family size with 2.25 persons per family.
| Family Type | # Families | Family Size |
| Married-Couple | 1,138 (96.1%) | 2.93 |
| Single Male/Father | 26 (2.2%) | 2.46 |
| Single Female/Mother | 20 (1.7%) | 2.25 |
| Total Families | 1,184 (100.0%) | 2.91 |
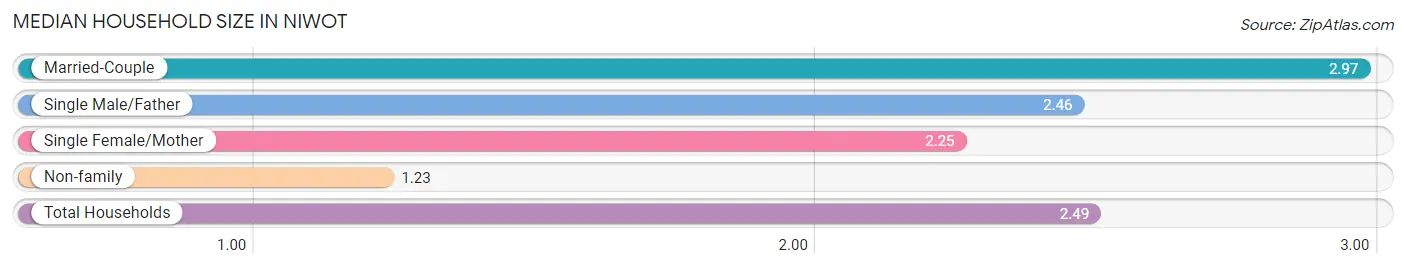
Median Household Size in Niwot
The median household size in Niwot is 2.49 persons per household, with married-couple households (1,138 | 70.3%) accounting for the largest median household size of 2.97 persons per household. non-family households (435 | 26.9%) represent the smallest median household size with 1.23 persons per household.
| Household Type | # Households | Household Size |
| Married-Couple | 1,138 (70.3%) | 2.97 |
| Single Male/Father | 26 (1.6%) | 2.46 |
| Single Female/Mother | 20 (1.2%) | 2.25 |
| Non-family | 435 (26.9%) | 1.23 |
| Total Households | 1,619 (100.0%) | 2.49 |
Household Size by Marriage Status in Niwot
Out of a total of 1,619 households in Niwot, 1,184 (73.1%) are family households, while 435 (26.9%) are nonfamily households. The most numerous type of family households are 2-person households, comprising 543, and the most common type of nonfamily households are 1-person households, comprising 371.
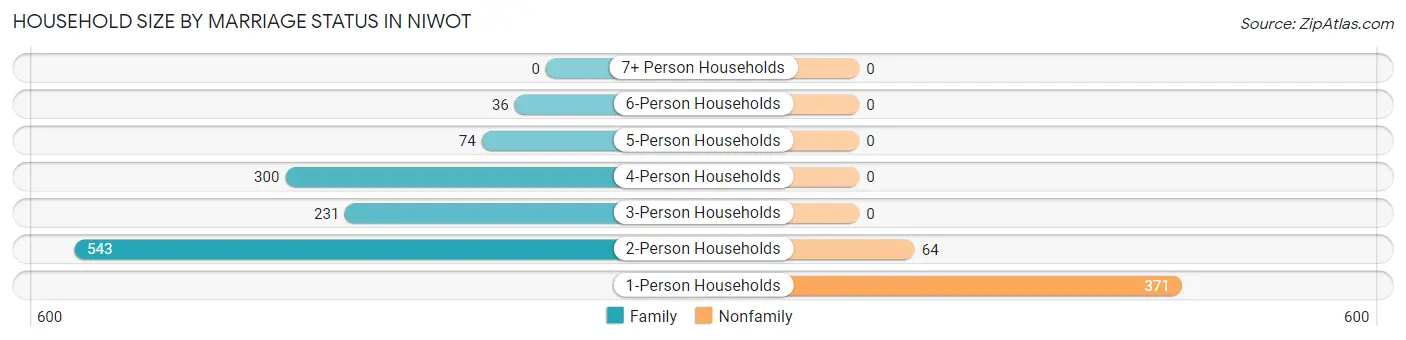
| Household Size | Family Households | Nonfamily Households |
| 1-Person Households | - | 371 (22.9%) |
| 2-Person Households | 543 (33.5%) | 64 (4.0%) |
| 3-Person Households | 231 (14.3%) | 0 (0.0%) |
| 4-Person Households | 300 (18.5%) | 0 (0.0%) |
| 5-Person Households | 74 (4.6%) | 0 (0.0%) |
| 6-Person Households | 36 (2.2%) | 0 (0.0%) |
| 7+ Person Households | 0 (0.0%) | 0 (0.0%) |
| Total | 1,184 (73.1%) | 435 (26.9%) |
Female Fertility in Niwot
Fertility by Age in Niwot
| Age Bracket | Women with Births | Births / 1,000 Women |
| 15 to 19 years | 0 (0.0%) | 0.0 |
| 20 to 34 years | 0 (0.0%) | 0.0 |
| 35 to 50 years | 0 (0.0%) | 0.0 |
| Total | 0 (0.0%) | 0.0 |
Fertility by Age by Marriage Status in Niwot
| Age Bracket | Married | Unmarried |
| 15 to 19 years | 0 (0.0%) | 0 (0.0%) |
| 20 to 34 years | 0 (0.0%) | 0 (0.0%) |
| 35 to 50 years | 0 (0.0%) | 0 (0.0%) |
| Total | 0 (0.0%) | 0 (0.0%) |
Fertility by Education in Niwot
| Educational Attainment | Women with Births | Births / 1,000 Women |
| Less than High School | 0 (0.0%) | 0.0 |
| High School Diploma | 0 (0.0%) | 0.0 |
| College or Associate's Degree | 0 (0.0%) | 0.0 |
| Bachelor's Degree | 0 (0.0%) | 0.0 |
| Graduate Degree | 0 (0.0%) | 0.0 |
| Total | 0 (0.0%) | 0.0 |
Fertility by Education by Marriage Status in Niwot
| Educational Attainment | Married | Unmarried |
| Less than High School | 0 (0.0%) | 0 (0.0%) |
| High School Diploma | 0 (0.0%) | 0 (0.0%) |
| College or Associate's Degree | 0 (0.0%) | 0 (0.0%) |
| Bachelor's Degree | 0 (0.0%) | 0 (0.0%) |
| Graduate Degree | 0 (0.0%) | 0 (0.0%) |
| Total | 0 (0.0%) | 0 (0.0%) |
Employment Characteristics in Niwot
Employment by Class of Employer in Niwot
Among the 1,688 employed individuals in Niwot, private company employees (1,187 | 70.3%), self-employed (not incorporated) (177 | 10.5%), and self-employed (incorporated) (172 | 10.2%) make up the most common classes of employment.
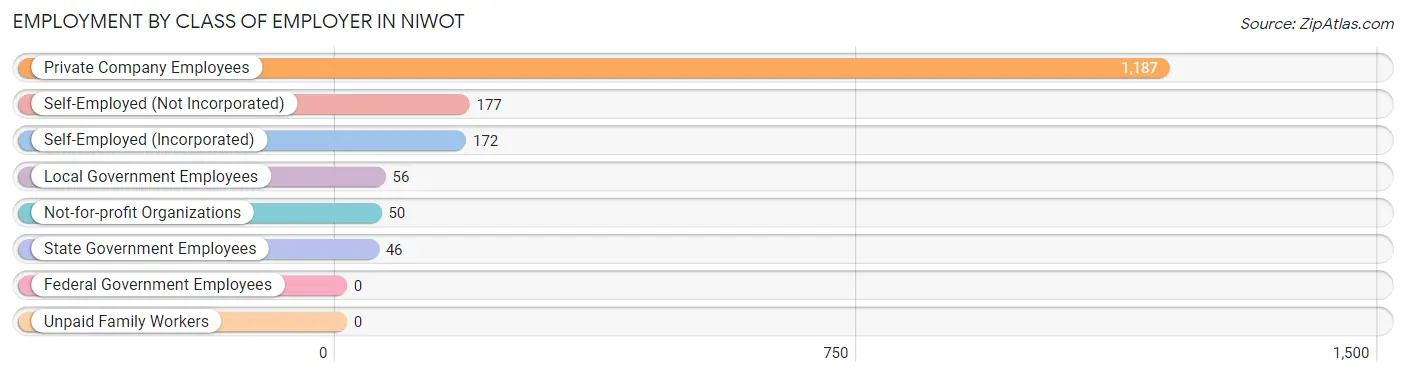
| Employer Class | # Employees | % Employees |
| Private Company Employees | 1,187 | 70.3% |
| Self-Employed (Incorporated) | 172 | 10.2% |
| Self-Employed (Not Incorporated) | 177 | 10.5% |
| Not-for-profit Organizations | 50 | 3.0% |
| Local Government Employees | 56 | 3.3% |
| State Government Employees | 46 | 2.7% |
| Federal Government Employees | 0 | 0.0% |
| Unpaid Family Workers | 0 | 0.0% |
| Total | 1,688 | 100.0% |
Employment Status by Age in Niwot
According to the labor force statistics for Niwot, out of the total population over 16 years of age (3,473), 54.9% or 1,907 individuals are in the labor force, with 7.4% or 141 of them unemployed. The age group with the highest labor force participation rate is 25 to 29 years, with 100.0% or 77 individuals in the labor force. Within the labor force, the 35 to 44 years age range has the highest percentage of unemployed individuals, with 24.9% or 103 of them being unemployed.
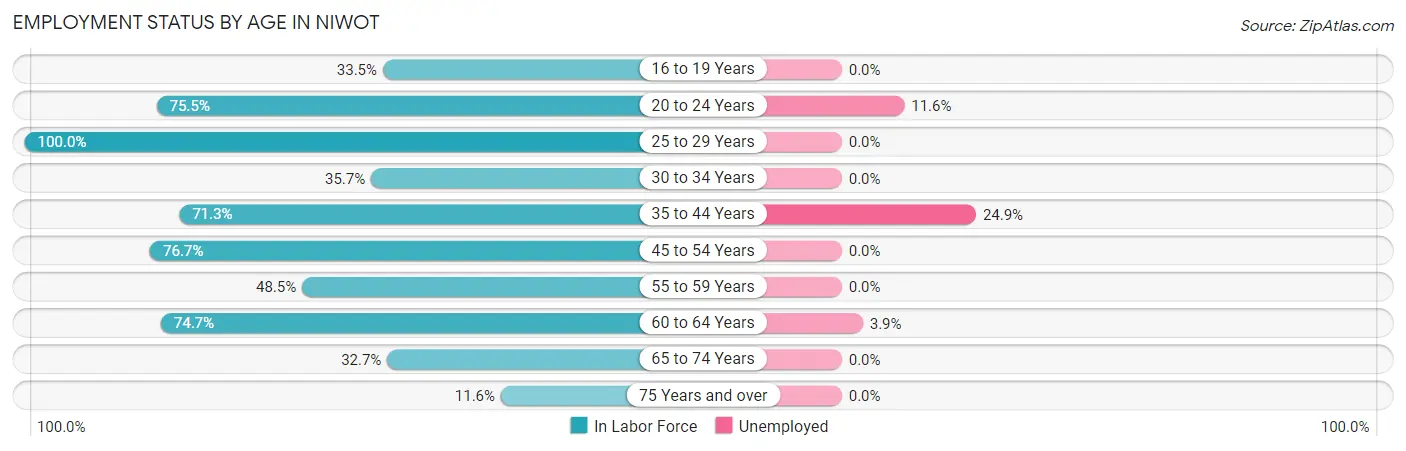
| Age Bracket | In Labor Force | Unemployed |
| 16 to 19 Years | 54 (33.5%) | 0 (0.0%) |
| 20 to 24 Years | 216 (75.5%) | 25 (11.6%) |
| 25 to 29 Years | 77 (100.0%) | 0 (0.0%) |
| 30 to 34 Years | 51 (35.7%) | 0 (0.0%) |
| 35 to 44 Years | 414 (71.3%) | 103 (24.9%) |
| 45 to 54 Years | 289 (76.7%) | 0 (0.0%) |
| 55 to 59 Years | 251 (48.5%) | 0 (0.0%) |
| 60 to 64 Years | 330 (74.7%) | 13 (3.9%) |
| 65 to 74 Years | 186 (32.7%) | 0 (0.0%) |
| 75 Years and over | 37 (11.6%) | 0 (0.0%) |
| Total | 1,907 (54.9%) | 141 (7.4%) |
Employment Status by Educational Attainment in Niwot
According to labor force statistics for Niwot, 66.0% of individuals (1,411) out of the total population between 25 and 64 years of age (2,138) are in the labor force, with 8.2% or 116 of them being unemployed. The group with the highest labor force participation rate are those with the educational attainment of high school diploma, with 82.1% or 92 individuals in the labor force. Within the labor force, individuals with college / associate degree education have the highest percentage of unemployment, with 19.7% or 47 of them being unemployed.
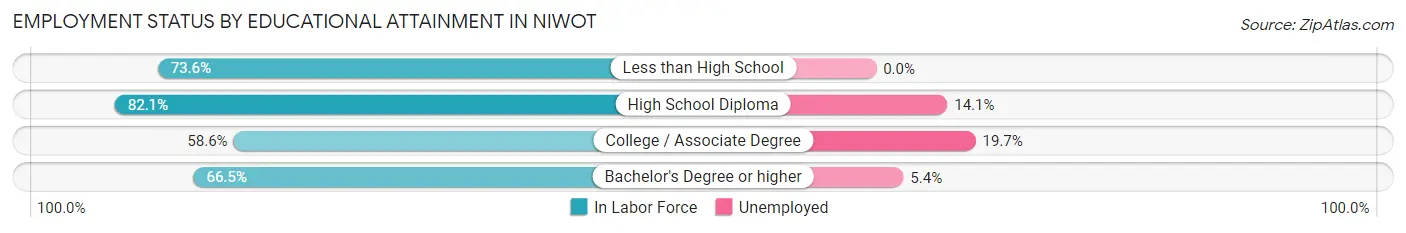
| Educational Attainment | In Labor Force | Unemployed |
| Less than High School | 53 (73.6%) | 0 (0.0%) |
| High School Diploma | 92 (82.1%) | 16 (14.1%) |
| College / Associate Degree | 239 (58.6%) | 80 (19.7%) |
| Bachelor's Degree or higher | 1,028 (66.5%) | 83 (5.4%) |
| Total | 1,411 (66.0%) | 175 (8.2%) |
Employment Occupations by Sex in Niwot
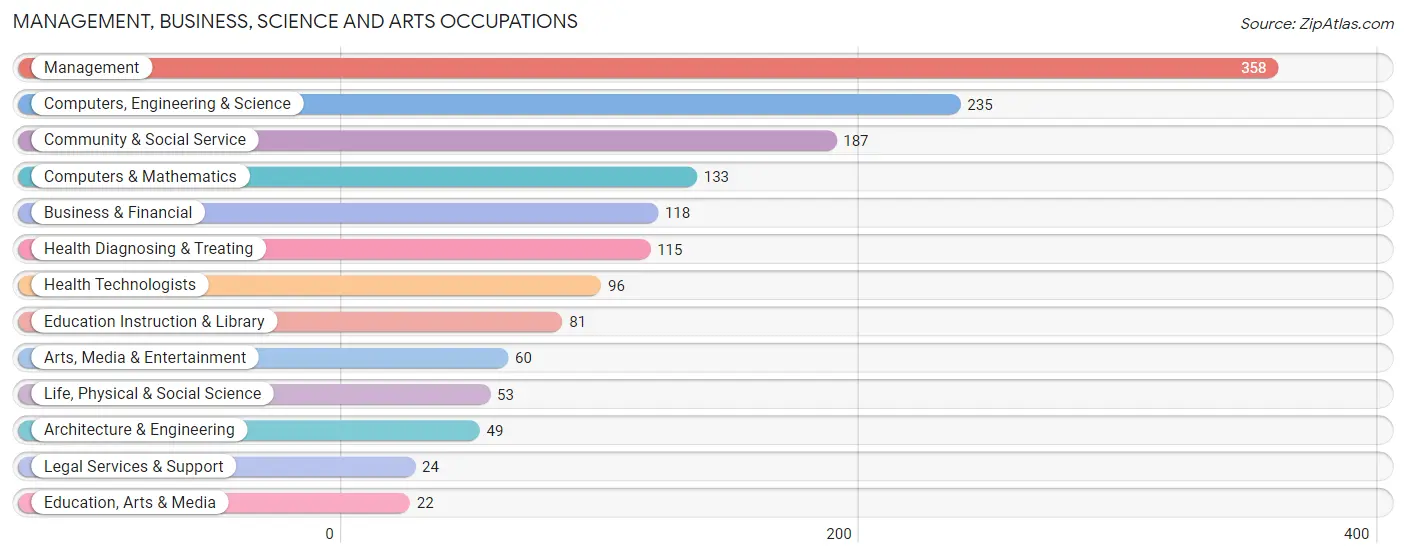
Management, Business, Science and Arts Occupations
The most common Management, Business, Science and Arts occupations in Niwot are Management (358 | 20.3%), Computers, Engineering & Science (235 | 13.3%), Community & Social Service (187 | 10.6%), Computers & Mathematics (133 | 7.5%), and Business & Financial (118 | 6.7%).
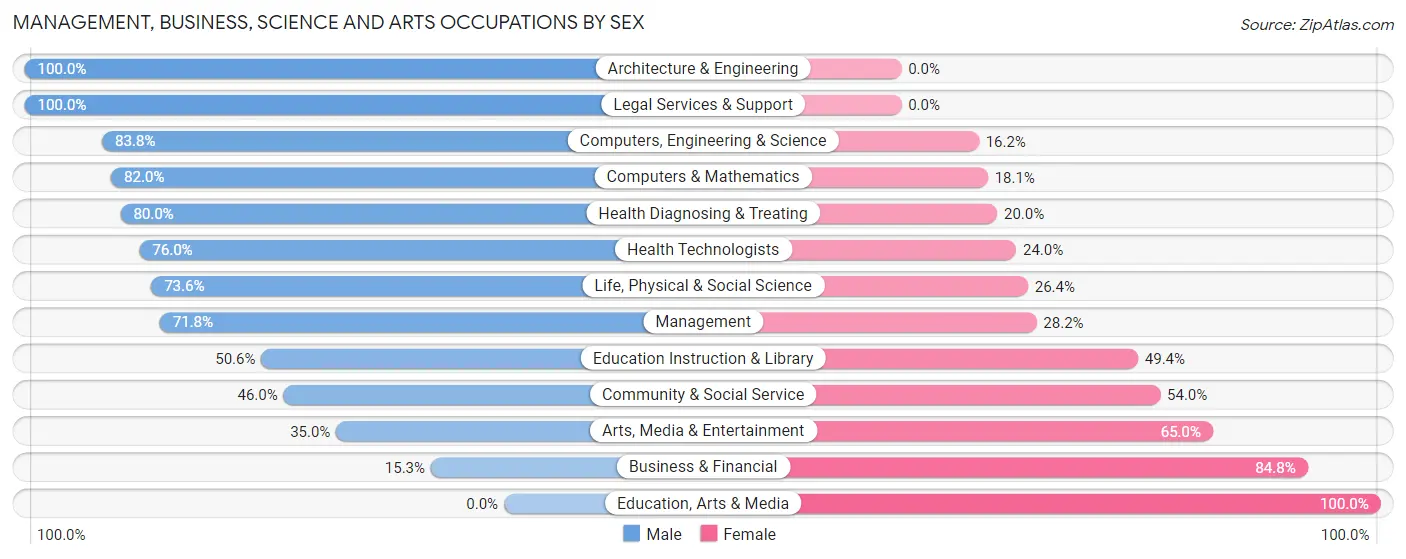
Management, Business, Science and Arts Occupations by Sex
Within the Management, Business, Science and Arts occupations in Niwot, the most male-oriented occupations are Architecture & Engineering (100.0%), Legal Services & Support (100.0%), and Computers, Engineering & Science (83.8%), while the most female-oriented occupations are Education, Arts & Media (100.0%), Business & Financial (84.8%), and Arts, Media & Entertainment (65.0%).
| Occupation | Male | Female |
| Management | 257 (71.8%) | 101 (28.2%) |
| Business & Financial | 18 (15.2%) | 100 (84.8%) |
| Computers, Engineering & Science | 197 (83.8%) | 38 (16.2%) |
| Computers & Mathematics | 109 (82.0%) | 24 (18.0%) |
| Architecture & Engineering | 49 (100.0%) | 0 (0.0%) |
| Life, Physical & Social Science | 39 (73.6%) | 14 (26.4%) |
| Community & Social Service | 86 (46.0%) | 101 (54.0%) |
| Education, Arts & Media | 0 (0.0%) | 22 (100.0%) |
| Legal Services & Support | 24 (100.0%) | 0 (0.0%) |
| Education Instruction & Library | 41 (50.6%) | 40 (49.4%) |
| Arts, Media & Entertainment | 21 (35.0%) | 39 (65.0%) |
| Health Diagnosing & Treating | 92 (80.0%) | 23 (20.0%) |
| Health Technologists | 73 (76.0%) | 23 (24.0%) |
| Total (Category) | 650 (64.2%) | 363 (35.8%) |
| Total (Overall) | 987 (55.9%) | 777 (44.1%) |
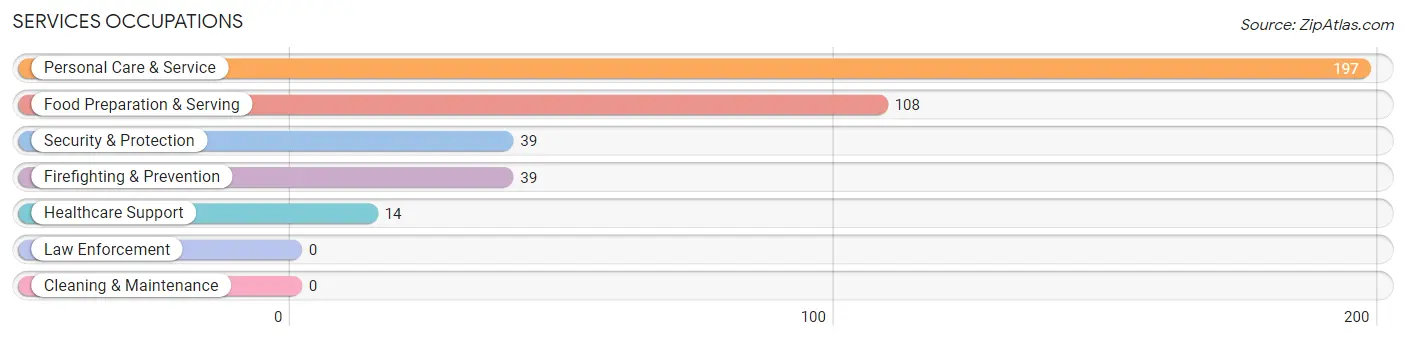
Services Occupations
The most common Services occupations in Niwot are Personal Care & Service (197 | 11.2%), Food Preparation & Serving (108 | 6.1%), Security & Protection (39 | 2.2%), Firefighting & Prevention (39 | 2.2%), and Healthcare Support (14 | 0.8%).
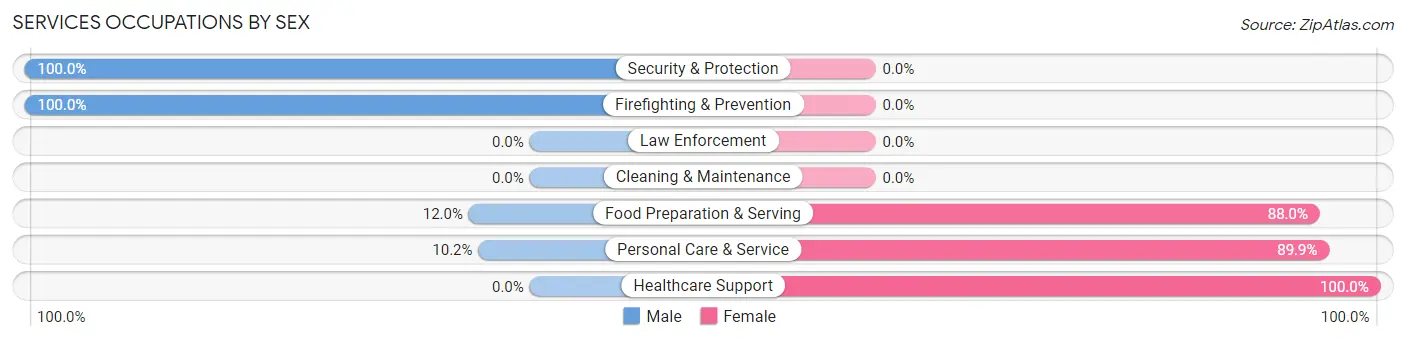
Services Occupations by Sex
Within the Services occupations in Niwot, the most male-oriented occupations are Security & Protection (100.0%), Firefighting & Prevention (100.0%), and Food Preparation & Serving (12.0%), while the most female-oriented occupations are Healthcare Support (100.0%), Personal Care & Service (89.8%), and Food Preparation & Serving (88.0%).
| Occupation | Male | Female |
| Healthcare Support | 0 (0.0%) | 14 (100.0%) |
| Security & Protection | 39 (100.0%) | 0 (0.0%) |
| Firefighting & Prevention | 39 (100.0%) | 0 (0.0%) |
| Law Enforcement | 0 (0.0%) | 0 (0.0%) |
| Food Preparation & Serving | 13 (12.0%) | 95 (88.0%) |
| Cleaning & Maintenance | 0 (0.0%) | 0 (0.0%) |
| Personal Care & Service | 20 (10.2%) | 177 (89.8%) |
| Total (Category) | 72 (20.1%) | 286 (79.9%) |
| Total (Overall) | 987 (55.9%) | 777 (44.1%) |
Sales and Office Occupations
The most common Sales and Office occupations in Niwot are Sales & Related (185 | 10.5%), and Office & Administration (56 | 3.2%).
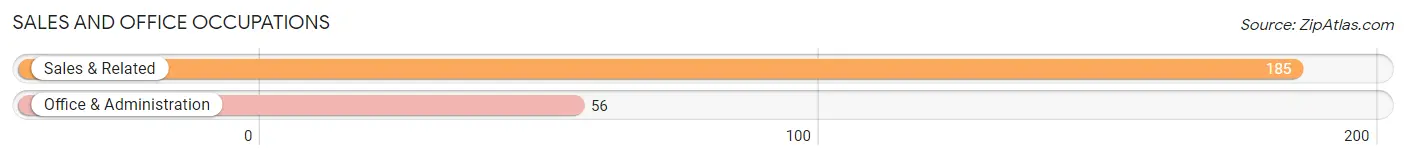
Sales and Office Occupations by Sex
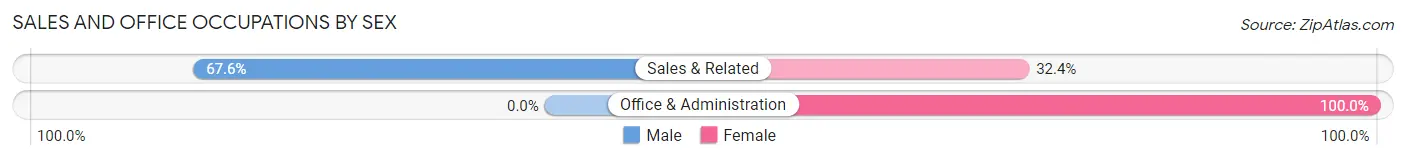
| Occupation | Male | Female |
| Sales & Related | 125 (67.6%) | 60 (32.4%) |
| Office & Administration | 0 (0.0%) | 56 (100.0%) |
| Total (Category) | 125 (51.9%) | 116 (48.1%) |
| Total (Overall) | 987 (55.9%) | 777 (44.1%) |
Natural Resources, Construction and Maintenance Occupations
The most common Natural Resources, Construction and Maintenance occupations in Niwot are , and Installation, Maintenance & Repair (43 | 2.4%).
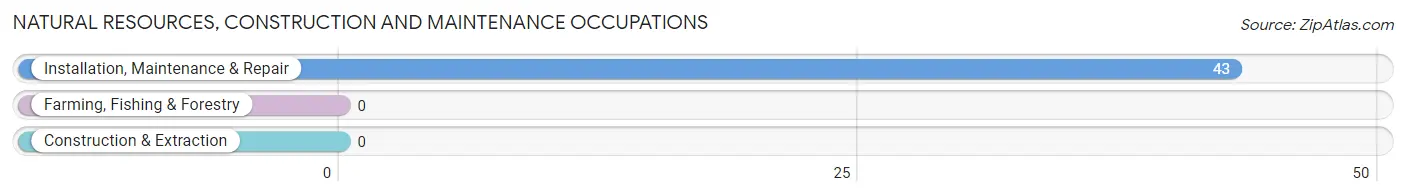
Natural Resources, Construction and Maintenance Occupations by Sex
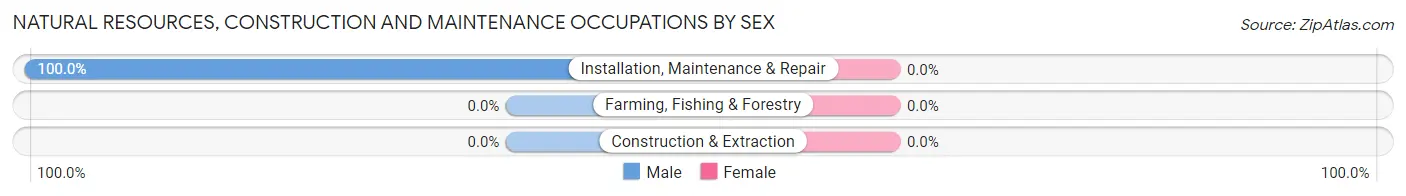
| Occupation | Male | Female |
| Farming, Fishing & Forestry | 0 (0.0%) | 0 (0.0%) |
| Construction & Extraction | 0 (0.0%) | 0 (0.0%) |
| Installation, Maintenance & Repair | 43 (100.0%) | 0 (0.0%) |
| Total (Category) | 43 (100.0%) | 0 (0.0%) |
| Total (Overall) | 987 (55.9%) | 777 (44.1%) |
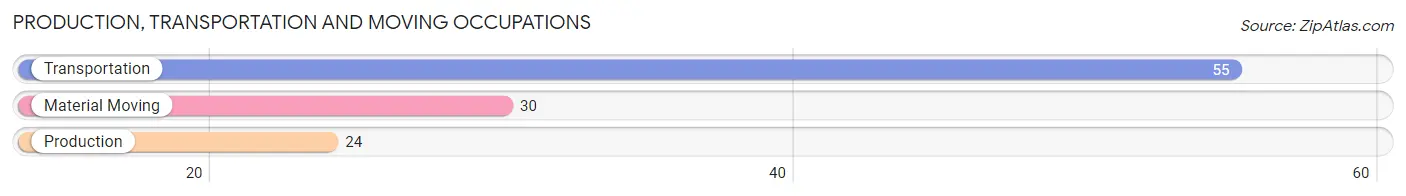
Production, Transportation and Moving Occupations
The most common Production, Transportation and Moving occupations in Niwot are Transportation (55 | 3.1%), Material Moving (30 | 1.7%), and Production (24 | 1.4%).
Production, Transportation and Moving Occupations by Sex
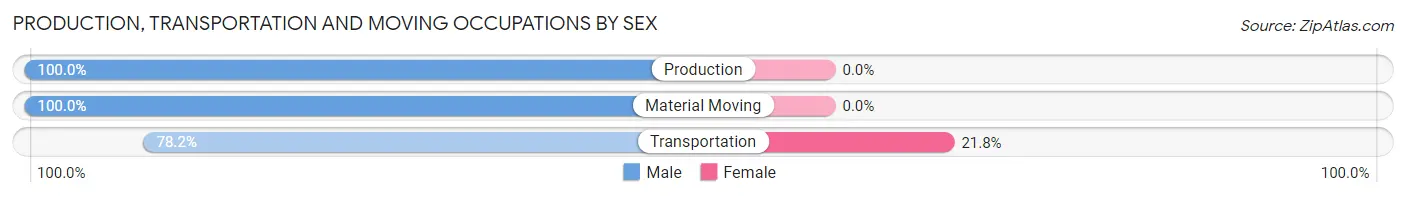
| Occupation | Male | Female |
| Production | 24 (100.0%) | 0 (0.0%) |
| Transportation | 43 (78.2%) | 12 (21.8%) |
| Material Moving | 30 (100.0%) | 0 (0.0%) |
| Total (Category) | 97 (89.0%) | 12 (11.0%) |
| Total (Overall) | 987 (55.9%) | 777 (44.1%) |
Employment Industries by Sex in Niwot
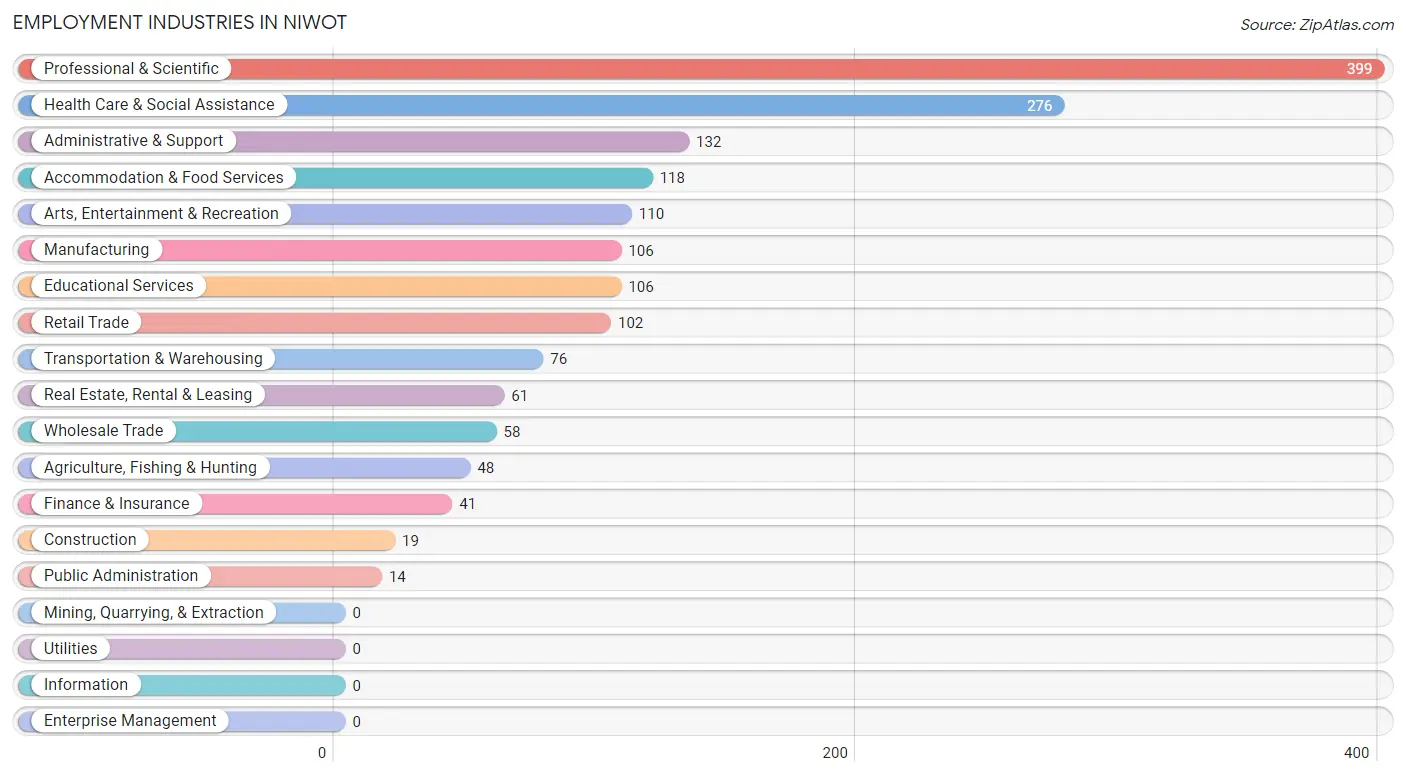
Employment Industries in Niwot
The major employment industries in Niwot include Professional & Scientific (399 | 22.6%), Health Care & Social Assistance (276 | 15.7%), Administrative & Support (132 | 7.5%), Accommodation & Food Services (118 | 6.7%), and Arts, Entertainment & Recreation (110 | 6.2%).
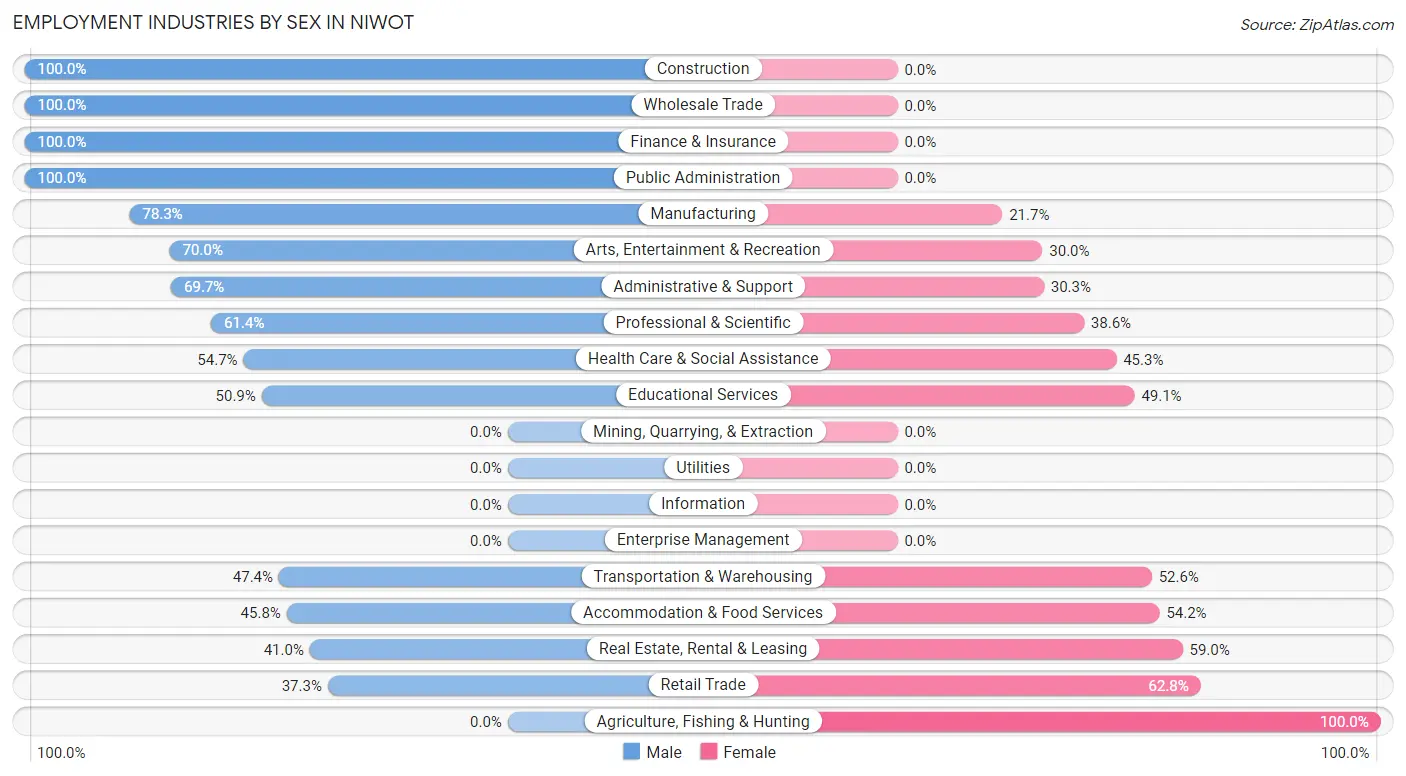
Employment Industries by Sex in Niwot
The Niwot industries that see more men than women are Construction (100.0%), Wholesale Trade (100.0%), and Finance & Insurance (100.0%), whereas the industries that tend to have a higher number of women are Agriculture, Fishing & Hunting (100.0%), Retail Trade (62.7%), and Real Estate, Rental & Leasing (59.0%).
| Industry | Male | Female |
| Agriculture, Fishing & Hunting | 0 (0.0%) | 48 (100.0%) |
| Mining, Quarrying, & Extraction | 0 (0.0%) | 0 (0.0%) |
| Construction | 19 (100.0%) | 0 (0.0%) |
| Manufacturing | 83 (78.3%) | 23 (21.7%) |
| Wholesale Trade | 58 (100.0%) | 0 (0.0%) |
| Retail Trade | 38 (37.2%) | 64 (62.7%) |
| Transportation & Warehousing | 36 (47.4%) | 40 (52.6%) |
| Utilities | 0 (0.0%) | 0 (0.0%) |
| Information | 0 (0.0%) | 0 (0.0%) |
| Finance & Insurance | 41 (100.0%) | 0 (0.0%) |
| Real Estate, Rental & Leasing | 25 (41.0%) | 36 (59.0%) |
| Professional & Scientific | 245 (61.4%) | 154 (38.6%) |
| Enterprise Management | 0 (0.0%) | 0 (0.0%) |
| Administrative & Support | 92 (69.7%) | 40 (30.3%) |
| Educational Services | 54 (50.9%) | 52 (49.1%) |
| Health Care & Social Assistance | 151 (54.7%) | 125 (45.3%) |
| Arts, Entertainment & Recreation | 77 (70.0%) | 33 (30.0%) |
| Accommodation & Food Services | 54 (45.8%) | 64 (54.2%) |
| Public Administration | 14 (100.0%) | 0 (0.0%) |
| Total | 987 (55.9%) | 777 (44.1%) |
Education in Niwot
School Enrollment in Niwot
The most common levels of schooling among the 986 students in Niwot are college / undergraduate (264 | 26.8%), elementary school (190 | 19.3%), and high school (178 | 18.0%).
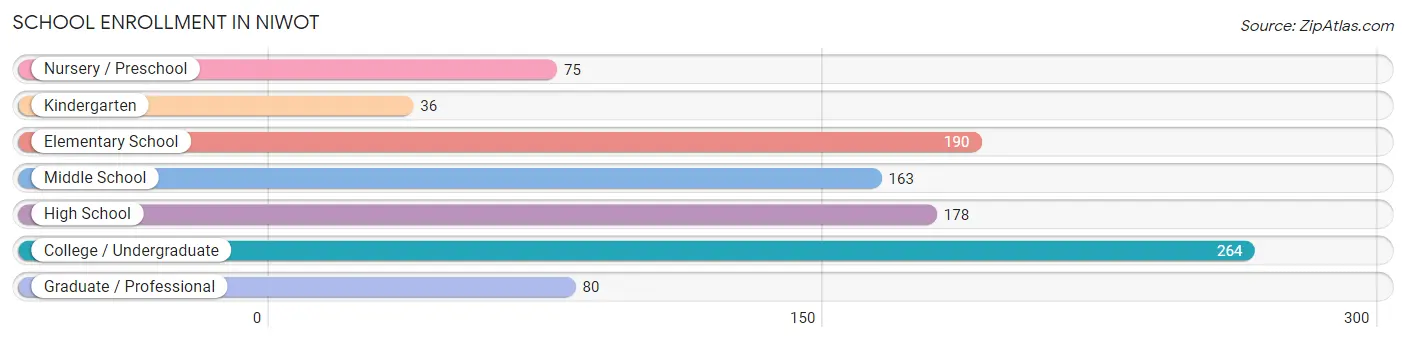
| School Level | # Students | % Students |
| Nursery / Preschool | 75 | 7.6% |
| Kindergarten | 36 | 3.6% |
| Elementary School | 190 | 19.3% |
| Middle School | 163 | 16.5% |
| High School | 178 | 18.0% |
| College / Undergraduate | 264 | 26.8% |
| Graduate / Professional | 80 | 8.1% |
| Total | 986 | 100.0% |
School Enrollment by Age by Funding Source in Niwot
Out of a total of 986 students who are enrolled in schools in Niwot, 297 (30.1%) attend a private institution, while the remaining 689 (69.9%) are enrolled in public schools. The age group of 3 to 4 year olds has the highest likelihood of being enrolled in private schools, with 55 (100.0% in the age bracket) enrolled. Conversely, the age group of 15 to 17 year olds has the lowest likelihood of being enrolled in a private school, with 105 (100.0% in the age bracket) attending a public institution.
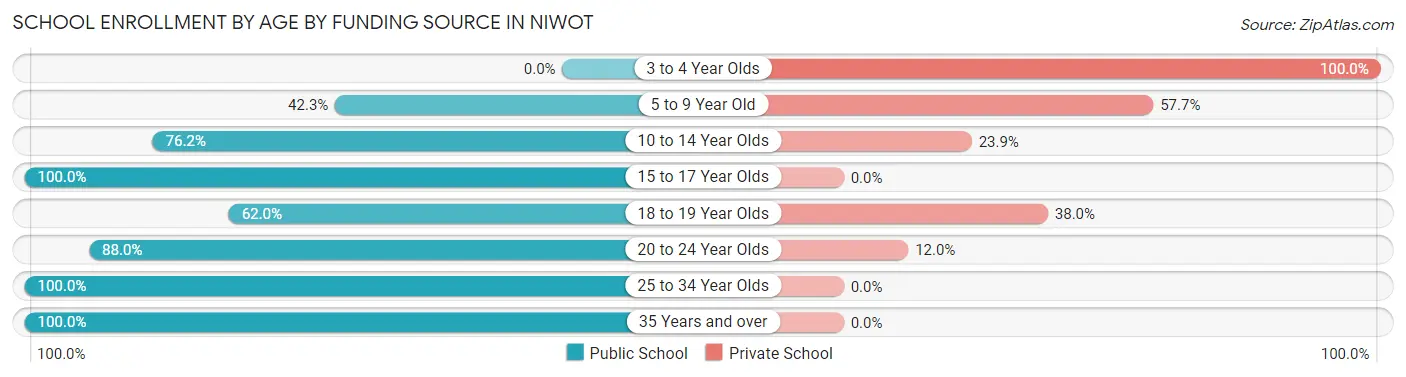
| Age Bracket | Public School | Private School |
| 3 to 4 Year Olds | 0 (0.0%) | 55 (100.0%) |
| 5 to 9 Year Old | 94 (42.3%) | 128 (57.7%) |
| 10 to 14 Year Olds | 198 (76.1%) | 62 (23.8%) |
| 15 to 17 Year Olds | 105 (100.0%) | 0 (0.0%) |
| 18 to 19 Year Olds | 44 (62.0%) | 27 (38.0%) |
| 20 to 24 Year Olds | 183 (88.0%) | 25 (12.0%) |
| 25 to 34 Year Olds | 9 (100.0%) | 0 (0.0%) |
| 35 Years and over | 56 (100.0%) | 0 (0.0%) |
| Total | 689 (69.9%) | 297 (30.1%) |
Educational Attainment by Field of Study in Niwot
Business (302 | 13.6%), engineering (271 | 12.2%), education (271 | 12.2%), bio, nature & agricultural (241 | 10.9%), and computers & mathematics (203 | 9.1%) are the most common fields of study among 2,220 individuals in Niwot who have obtained a bachelor's degree or higher.
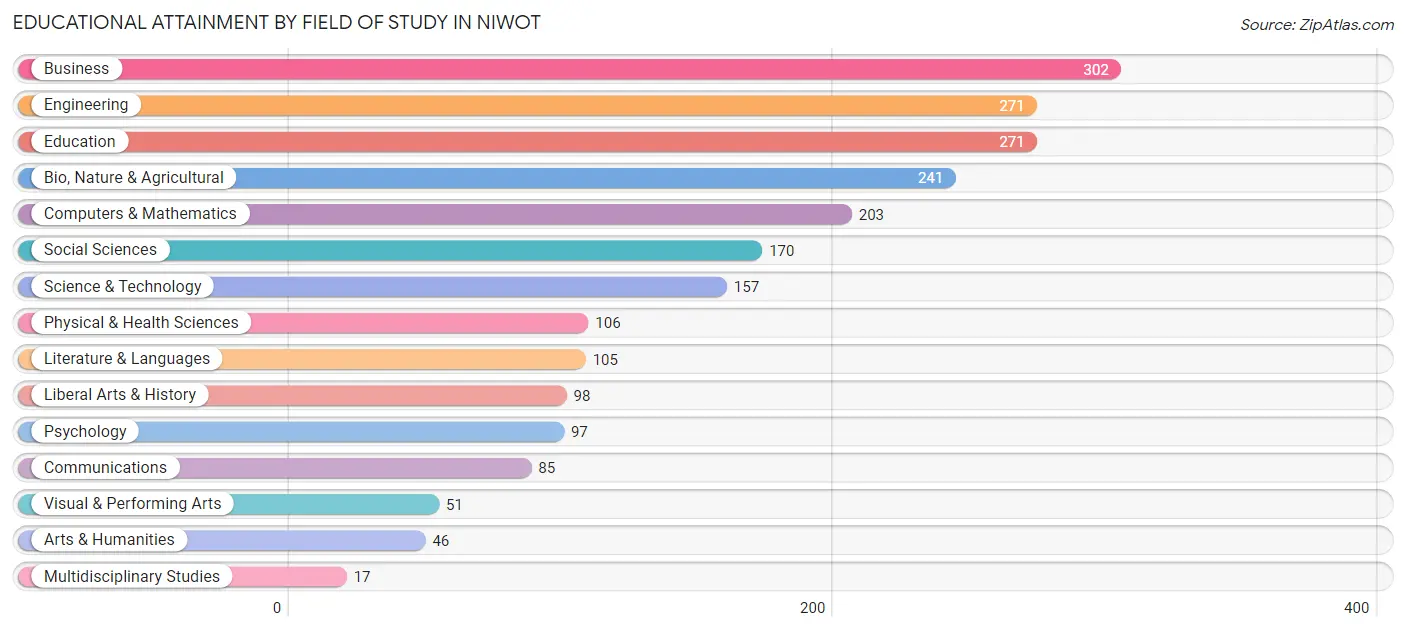
| Field of Study | # Graduates | % Graduates |
| Computers & Mathematics | 203 | 9.1% |
| Bio, Nature & Agricultural | 241 | 10.9% |
| Physical & Health Sciences | 106 | 4.8% |
| Psychology | 97 | 4.4% |
| Social Sciences | 170 | 7.7% |
| Engineering | 271 | 12.2% |
| Multidisciplinary Studies | 17 | 0.8% |
| Science & Technology | 157 | 7.1% |
| Business | 302 | 13.6% |
| Education | 271 | 12.2% |
| Literature & Languages | 105 | 4.7% |
| Liberal Arts & History | 98 | 4.4% |
| Visual & Performing Arts | 51 | 2.3% |
| Communications | 85 | 3.8% |
| Arts & Humanities | 46 | 2.1% |
| Total | 2,220 | 100.0% |
Transportation & Commute in Niwot
Vehicle Availability by Sex in Niwot
The most prevalent vehicle ownership categories in Niwot are males with 3 vehicles (373, accounting for 39.3%) and females with 3 vehicles (188, making up 51.7%).
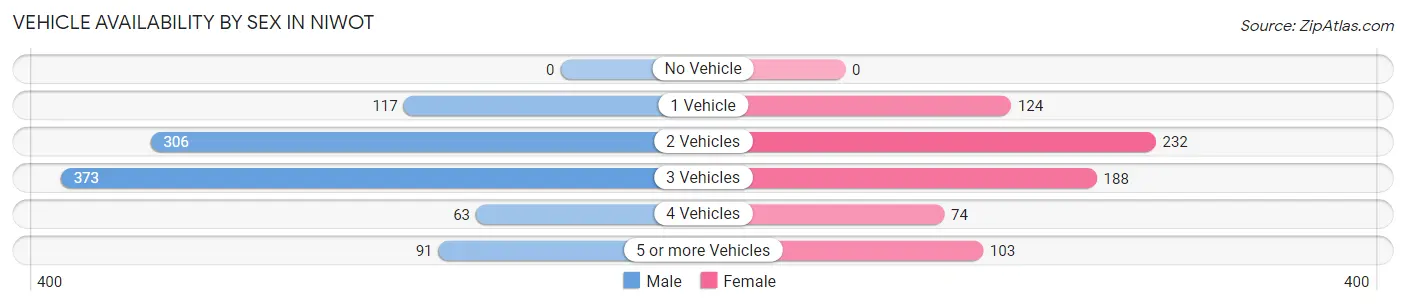
| Vehicles Available | Male | Female |
| No Vehicle | 0 (0.0%) | 0 (0.0%) |
| 1 Vehicle | 117 (12.3%) | 124 (17.2%) |
| 2 Vehicles | 306 (32.2%) | 232 (32.2%) |
| 3 Vehicles | 373 (39.3%) | 188 (26.1%) |
| 4 Vehicles | 63 (6.6%) | 74 (10.3%) |
| 5 or more Vehicles | 91 (9.6%) | 103 (14.3%) |
| Total | 950 (100.0%) | 721 (100.0%) |
Commute Time in Niwot
The most frequently occuring commute durations in Niwot are 20 to 24 minutes (274 commuters, 21.2%), 30 to 34 minutes (243 commuters, 18.8%), and 15 to 19 minutes (179 commuters, 13.8%).
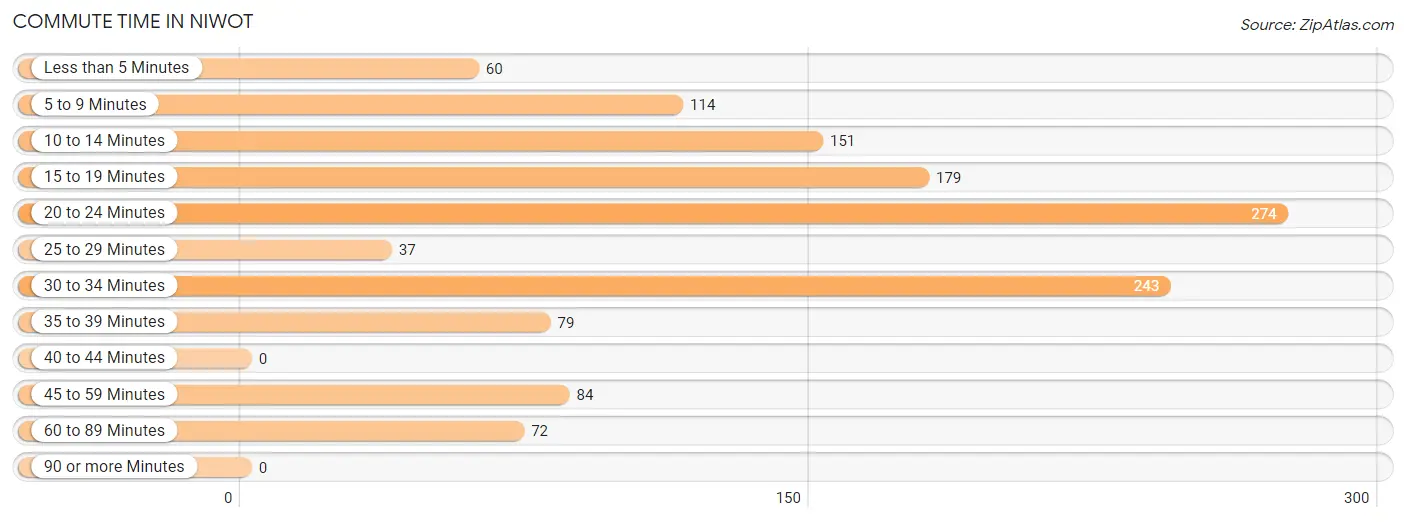
| Commute Time | # Commuters | % Commuters |
| Less than 5 Minutes | 60 | 4.6% |
| 5 to 9 Minutes | 114 | 8.8% |
| 10 to 14 Minutes | 151 | 11.7% |
| 15 to 19 Minutes | 179 | 13.8% |
| 20 to 24 Minutes | 274 | 21.2% |
| 25 to 29 Minutes | 37 | 2.9% |
| 30 to 34 Minutes | 243 | 18.8% |
| 35 to 39 Minutes | 79 | 6.1% |
| 40 to 44 Minutes | 0 | 0.0% |
| 45 to 59 Minutes | 84 | 6.5% |
| 60 to 89 Minutes | 72 | 5.6% |
| 90 or more Minutes | 0 | 0.0% |
Commute Time by Sex in Niwot
The most common commute times in Niwot are 20 to 24 minutes (190 commuters, 25.8%) for males and 30 to 34 minutes (112 commuters, 20.1%) for females.
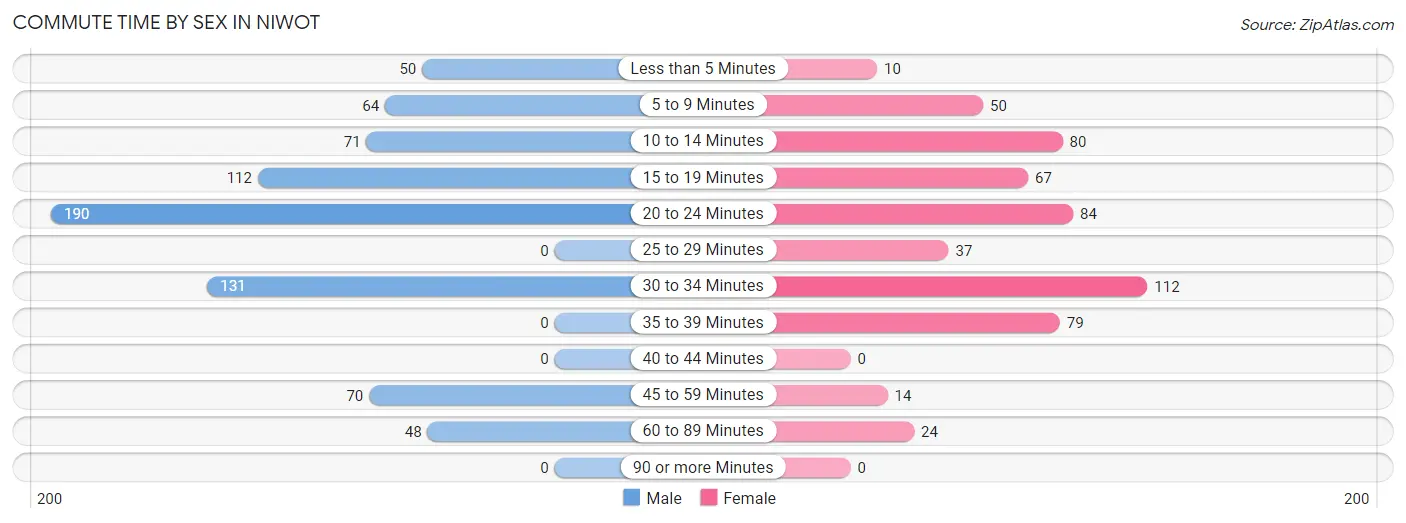
| Commute Time | Male | Female |
| Less than 5 Minutes | 50 (6.8%) | 10 (1.8%) |
| 5 to 9 Minutes | 64 (8.7%) | 50 (9.0%) |
| 10 to 14 Minutes | 71 (9.7%) | 80 (14.4%) |
| 15 to 19 Minutes | 112 (15.2%) | 67 (12.0%) |
| 20 to 24 Minutes | 190 (25.8%) | 84 (15.1%) |
| 25 to 29 Minutes | 0 (0.0%) | 37 (6.6%) |
| 30 to 34 Minutes | 131 (17.8%) | 112 (20.1%) |
| 35 to 39 Minutes | 0 (0.0%) | 79 (14.2%) |
| 40 to 44 Minutes | 0 (0.0%) | 0 (0.0%) |
| 45 to 59 Minutes | 70 (9.5%) | 14 (2.5%) |
| 60 to 89 Minutes | 48 (6.5%) | 24 (4.3%) |
| 90 or more Minutes | 0 (0.0%) | 0 (0.0%) |
Time of Departure to Work by Sex in Niwot
The most frequent times of departure to work in Niwot are 7:30 AM to 7:59 AM (247, 33.6%) for males and 7:30 AM to 7:59 AM (106, 19.0%) for females.
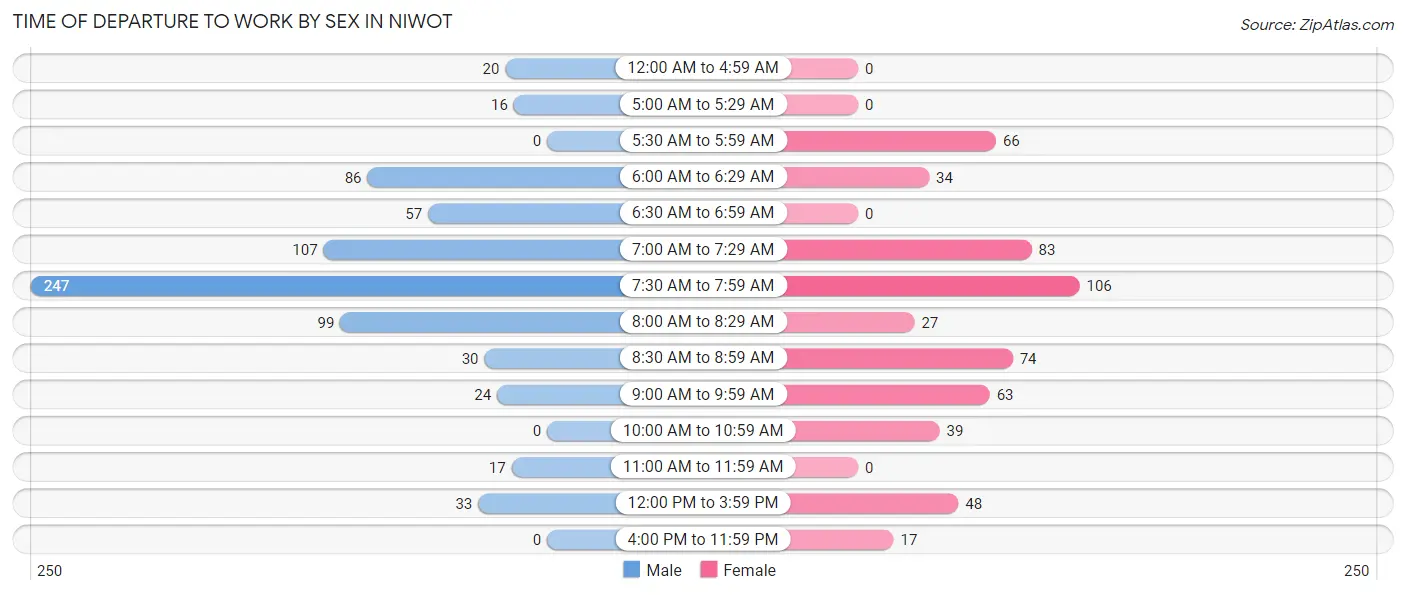
| Time of Departure | Male | Female |
| 12:00 AM to 4:59 AM | 20 (2.7%) | 0 (0.0%) |
| 5:00 AM to 5:29 AM | 16 (2.2%) | 0 (0.0%) |
| 5:30 AM to 5:59 AM | 0 (0.0%) | 66 (11.8%) |
| 6:00 AM to 6:29 AM | 86 (11.7%) | 34 (6.1%) |
| 6:30 AM to 6:59 AM | 57 (7.7%) | 0 (0.0%) |
| 7:00 AM to 7:29 AM | 107 (14.5%) | 83 (14.9%) |
| 7:30 AM to 7:59 AM | 247 (33.6%) | 106 (19.0%) |
| 8:00 AM to 8:29 AM | 99 (13.5%) | 27 (4.9%) |
| 8:30 AM to 8:59 AM | 30 (4.1%) | 74 (13.3%) |
| 9:00 AM to 9:59 AM | 24 (3.3%) | 63 (11.3%) |
| 10:00 AM to 10:59 AM | 0 (0.0%) | 39 (7.0%) |
| 11:00 AM to 11:59 AM | 17 (2.3%) | 0 (0.0%) |
| 12:00 PM to 3:59 PM | 33 (4.5%) | 48 (8.6%) |
| 4:00 PM to 11:59 PM | 0 (0.0%) | 17 (3.0%) |
| Total | 736 (100.0%) | 557 (100.0%) |
Housing Occupancy in Niwot
Occupancy by Ownership in Niwot
Of the total 1,619 dwellings in Niwot, owner-occupied units account for 1,334 (82.4%), while renter-occupied units make up 285 (17.6%).
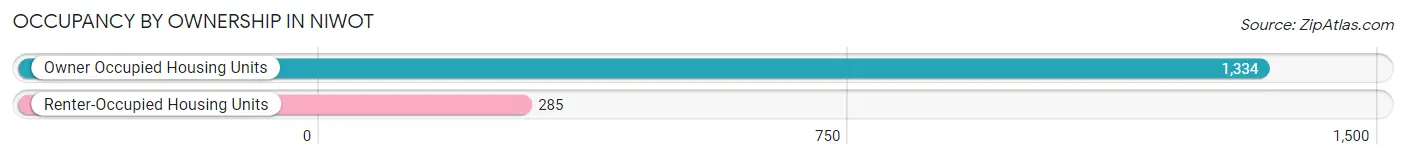
| Occupancy | # Housing Units | % Housing Units |
| Owner Occupied Housing Units | 1,334 | 82.4% |
| Renter-Occupied Housing Units | 285 | 17.6% |
| Total Occupied Housing Units | 1,619 | 100.0% |
Occupancy by Household Size in Niwot
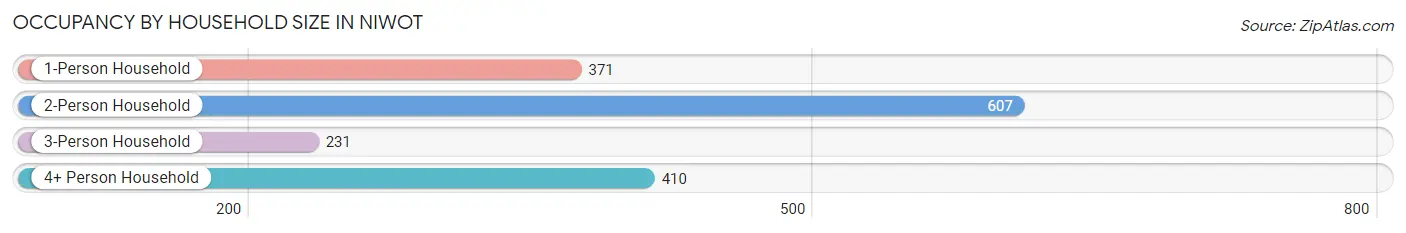
| Household Size | # Housing Units | % Housing Units |
| 1-Person Household | 371 | 22.9% |
| 2-Person Household | 607 | 37.5% |
| 3-Person Household | 231 | 14.3% |
| 4+ Person Household | 410 | 25.3% |
| Total Housing Units | 1,619 | 100.0% |
Occupancy by Ownership by Household Size in Niwot
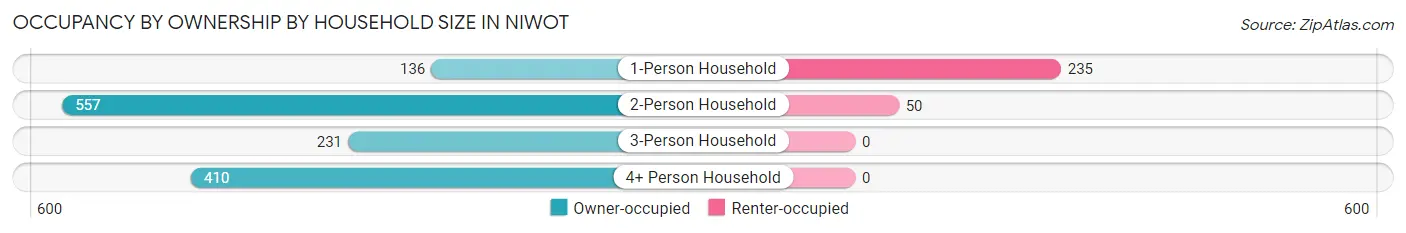
| Household Size | Owner-occupied | Renter-occupied |
| 1-Person Household | 136 (36.7%) | 235 (63.3%) |
| 2-Person Household | 557 (91.8%) | 50 (8.2%) |
| 3-Person Household | 231 (100.0%) | 0 (0.0%) |
| 4+ Person Household | 410 (100.0%) | 0 (0.0%) |
| Total Housing Units | 1,334 (82.4%) | 285 (17.6%) |
Occupancy by Educational Attainment in Niwot
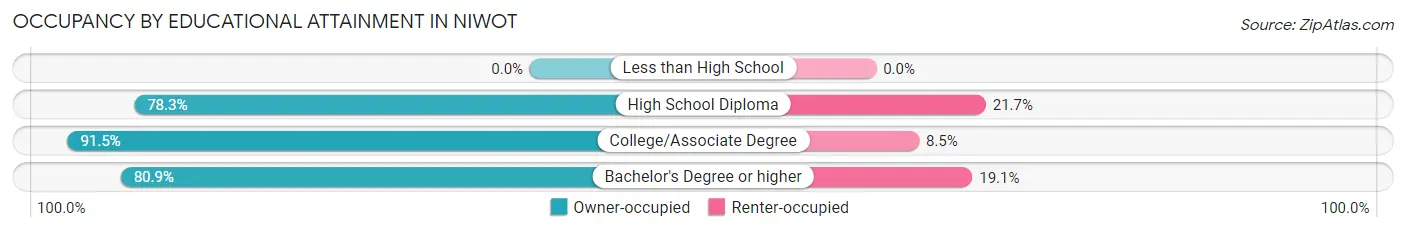
| Household Size | Owner-occupied | Renter-occupied |
| Less than High School | 0 (0.0%) | 0 (0.0%) |
| High School Diploma | 72 (78.3%) | 20 (21.7%) |
| College/Associate Degree | 226 (91.5%) | 21 (8.5%) |
| Bachelor's Degree or higher | 1,036 (80.9%) | 244 (19.1%) |
Occupancy by Age of Householder in Niwot
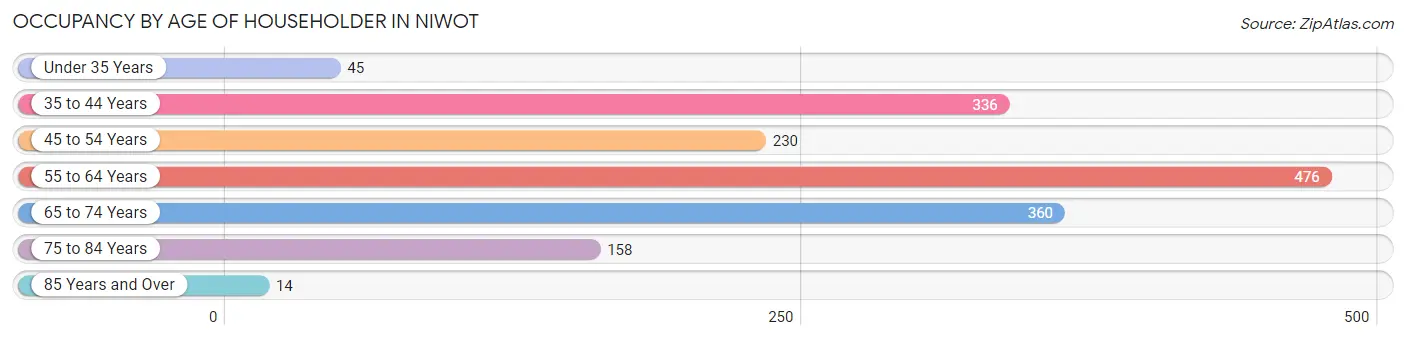
| Age Bracket | # Households | % Households |
| Under 35 Years | 45 | 2.8% |
| 35 to 44 Years | 336 | 20.7% |
| 45 to 54 Years | 230 | 14.2% |
| 55 to 64 Years | 476 | 29.4% |
| 65 to 74 Years | 360 | 22.2% |
| 75 to 84 Years | 158 | 9.8% |
| 85 Years and Over | 14 | 0.9% |
| Total | 1,619 | 100.0% |
Housing Finances in Niwot
Median Income by Occupancy in Niwot
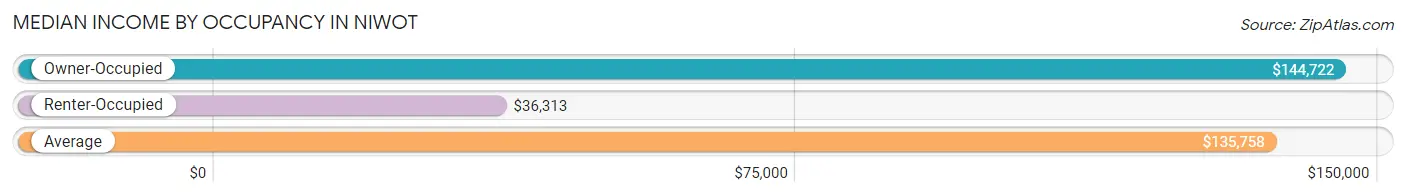
| Occupancy Type | # Households | Median Income |
| Owner-Occupied | 1,334 (82.4%) | $144,722 |
| Renter-Occupied | 285 (17.6%) | $36,313 |
| Average | 1,619 (100.0%) | $135,758 |
Occupancy by Householder Income Bracket in Niwot
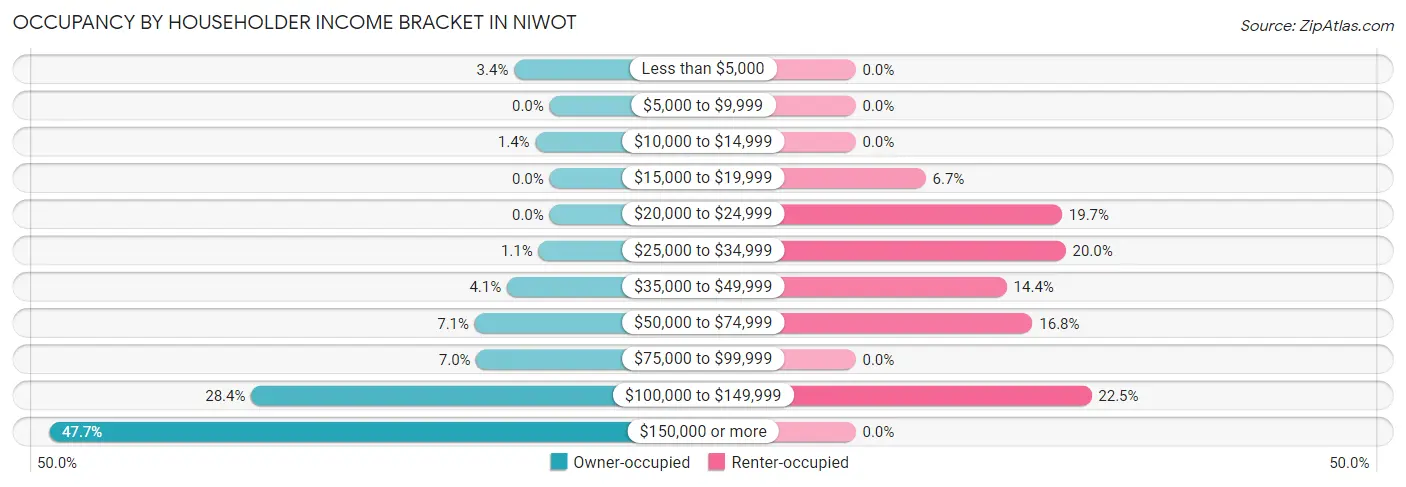
| Income Bracket | Owner-occupied | Renter-occupied |
| Less than $5,000 | 45 (3.4%) | 0 (0.0%) |
| $5,000 to $9,999 | 0 (0.0%) | 0 (0.0%) |
| $10,000 to $14,999 | 18 (1.3%) | 0 (0.0%) |
| $15,000 to $19,999 | 0 (0.0%) | 19 (6.7%) |
| $20,000 to $24,999 | 0 (0.0%) | 56 (19.7%) |
| $25,000 to $34,999 | 14 (1.1%) | 57 (20.0%) |
| $35,000 to $49,999 | 54 (4.1%) | 41 (14.4%) |
| $50,000 to $74,999 | 95 (7.1%) | 48 (16.8%) |
| $75,000 to $99,999 | 93 (7.0%) | 0 (0.0%) |
| $100,000 to $149,999 | 379 (28.4%) | 64 (22.5%) |
| $150,000 or more | 636 (47.7%) | 0 (0.0%) |
| Total | 1,334 (100.0%) | 285 (100.0%) |
Monthly Housing Cost Tiers in Niwot
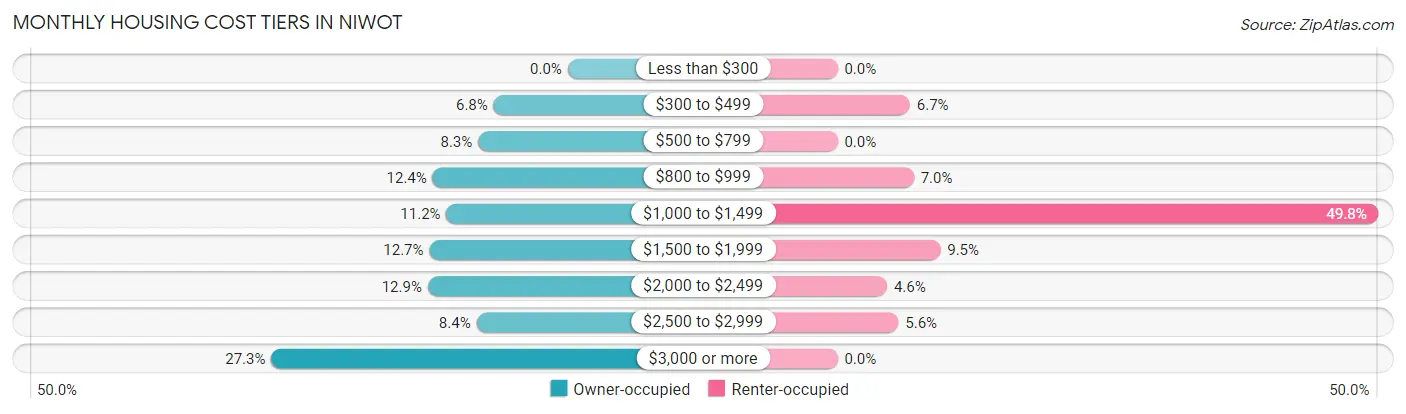
| Monthly Cost | Owner-occupied | Renter-occupied |
| Less than $300 | 0 (0.0%) | 0 (0.0%) |
| $300 to $499 | 91 (6.8%) | 19 (6.7%) |
| $500 to $799 | 110 (8.3%) | 0 (0.0%) |
| $800 to $999 | 166 (12.4%) | 20 (7.0%) |
| $1,000 to $1,499 | 149 (11.2%) | 142 (49.8%) |
| $1,500 to $1,999 | 170 (12.7%) | 27 (9.5%) |
| $2,000 to $2,499 | 172 (12.9%) | 13 (4.6%) |
| $2,500 to $2,999 | 112 (8.4%) | 16 (5.6%) |
| $3,000 or more | 364 (27.3%) | 0 (0.0%) |
| Total | 1,334 (100.0%) | 285 (100.0%) |
Physical Housing Characteristics in Niwot
Housing Structures in Niwot
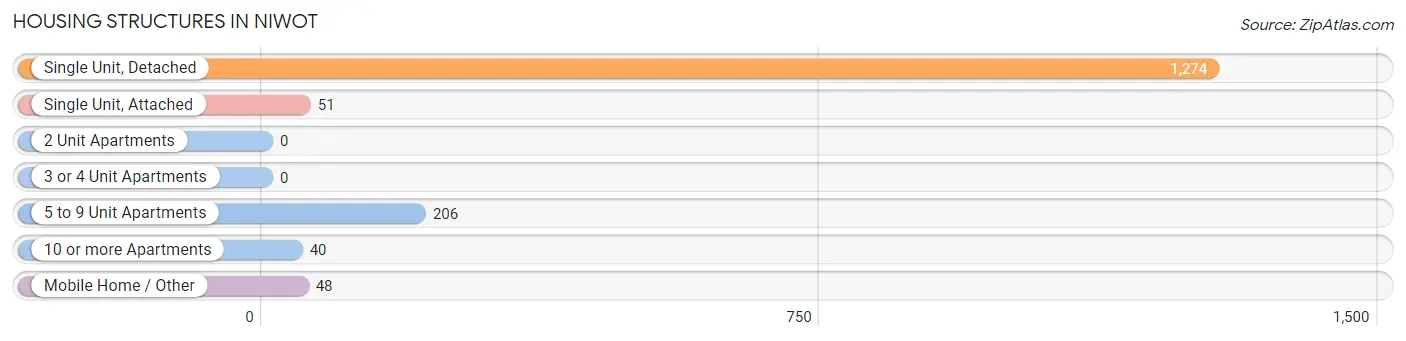
| Structure Type | # Housing Units | % Housing Units |
| Single Unit, Detached | 1,274 | 78.7% |
| Single Unit, Attached | 51 | 3.2% |
| 2 Unit Apartments | 0 | 0.0% |
| 3 or 4 Unit Apartments | 0 | 0.0% |
| 5 to 9 Unit Apartments | 206 | 12.7% |
| 10 or more Apartments | 40 | 2.5% |
| Mobile Home / Other | 48 | 3.0% |
| Total | 1,619 | 100.0% |
Housing Structures by Occupancy in Niwot
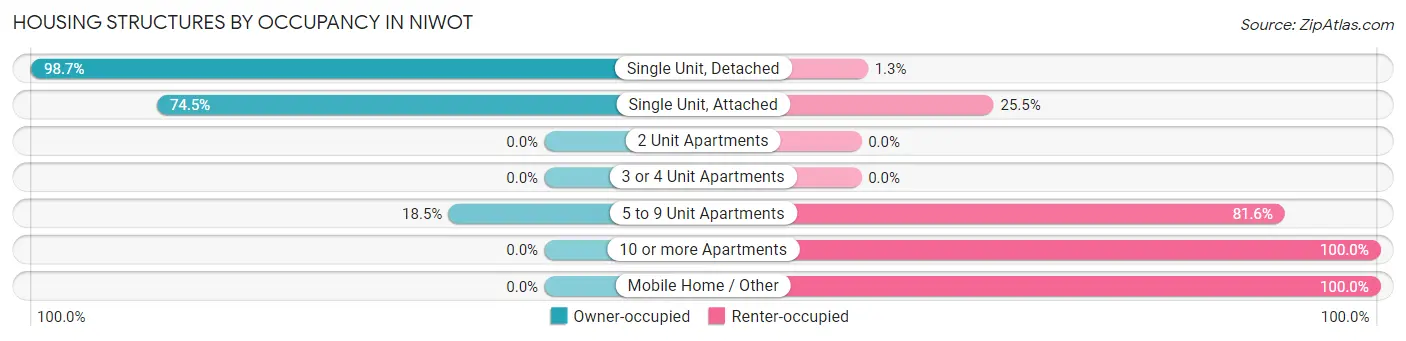
| Structure Type | Owner-occupied | Renter-occupied |
| Single Unit, Detached | 1,258 (98.7%) | 16 (1.3%) |
| Single Unit, Attached | 38 (74.5%) | 13 (25.5%) |
| 2 Unit Apartments | 0 (0.0%) | 0 (0.0%) |
| 3 or 4 Unit Apartments | 0 (0.0%) | 0 (0.0%) |
| 5 to 9 Unit Apartments | 38 (18.4%) | 168 (81.6%) |
| 10 or more Apartments | 0 (0.0%) | 40 (100.0%) |
| Mobile Home / Other | 0 (0.0%) | 48 (100.0%) |
| Total | 1,334 (82.4%) | 285 (17.6%) |
Housing Structures by Number of Rooms in Niwot
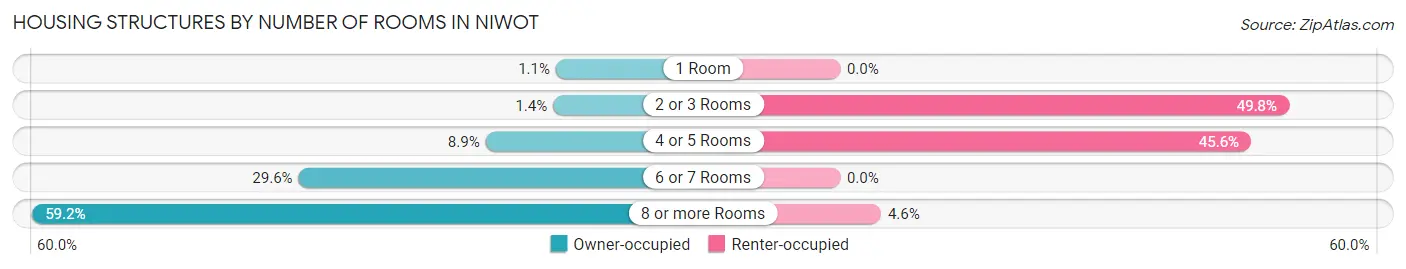
| Number of Rooms | Owner-occupied | Renter-occupied |
| 1 Room | 14 (1.1%) | 0 (0.0%) |
| 2 or 3 Rooms | 18 (1.3%) | 142 (49.8%) |
| 4 or 5 Rooms | 118 (8.8%) | 130 (45.6%) |
| 6 or 7 Rooms | 395 (29.6%) | 0 (0.0%) |
| 8 or more Rooms | 789 (59.2%) | 13 (4.6%) |
| Total | 1,334 (100.0%) | 285 (100.0%) |
Housing Structure by Heating Type in Niwot
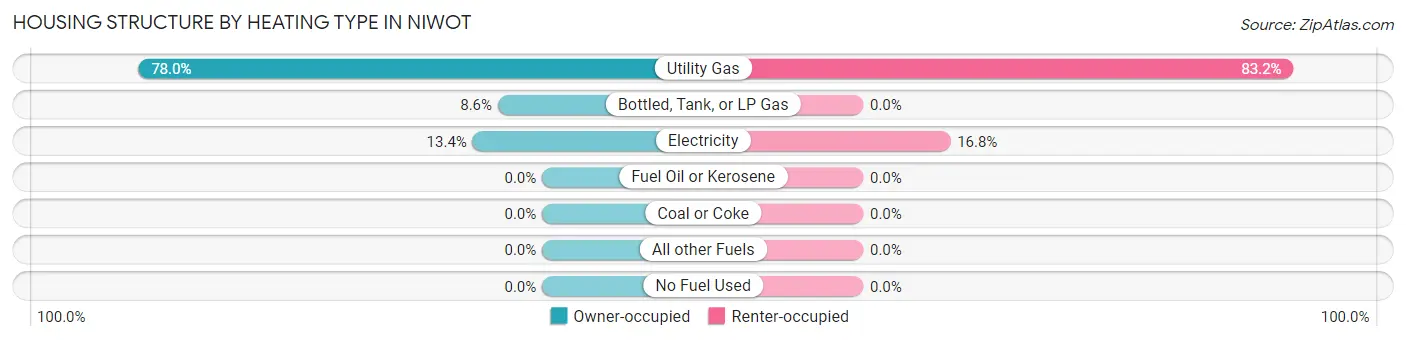
| Heating Type | Owner-occupied | Renter-occupied |
| Utility Gas | 1,041 (78.0%) | 237 (83.2%) |
| Bottled, Tank, or LP Gas | 114 (8.6%) | 0 (0.0%) |
| Electricity | 179 (13.4%) | 48 (16.8%) |
| Fuel Oil or Kerosene | 0 (0.0%) | 0 (0.0%) |
| Coal or Coke | 0 (0.0%) | 0 (0.0%) |
| All other Fuels | 0 (0.0%) | 0 (0.0%) |
| No Fuel Used | 0 (0.0%) | 0 (0.0%) |
| Total | 1,334 (100.0%) | 285 (100.0%) |
Household Vehicle Usage in Niwot
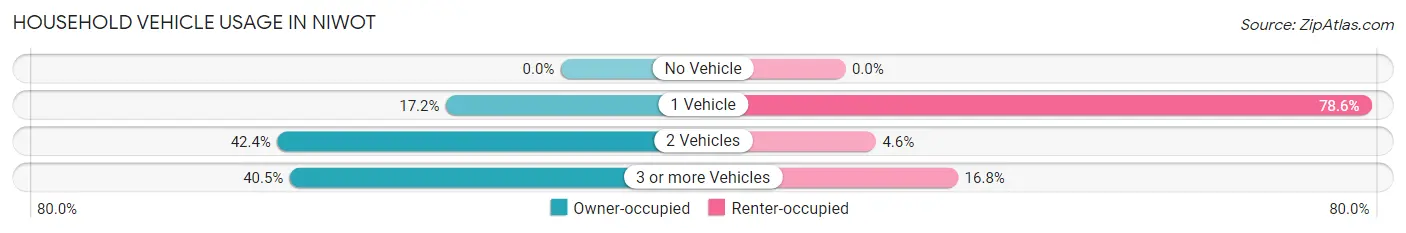
| Vehicles per Household | Owner-occupied | Renter-occupied |
| No Vehicle | 0 (0.0%) | 0 (0.0%) |
| 1 Vehicle | 229 (17.2%) | 224 (78.6%) |
| 2 Vehicles | 565 (42.3%) | 13 (4.6%) |
| 3 or more Vehicles | 540 (40.5%) | 48 (16.8%) |
| Total | 1,334 (100.0%) | 285 (100.0%) |
Real Estate & Mortgages in Niwot
Real Estate and Mortgage Overview in Niwot
| Characteristic | Without Mortgage | With Mortgage |
| Housing Units | 459 | 875 |
| Median Property Value | $872,100 | $760,400 |
| Median Household Income | $135,386 | $453 |
| Monthly Housing Costs | $878 | $364 |
| Real Estate Taxes | $4,781 | $0 |
Property Value by Mortgage Status in Niwot
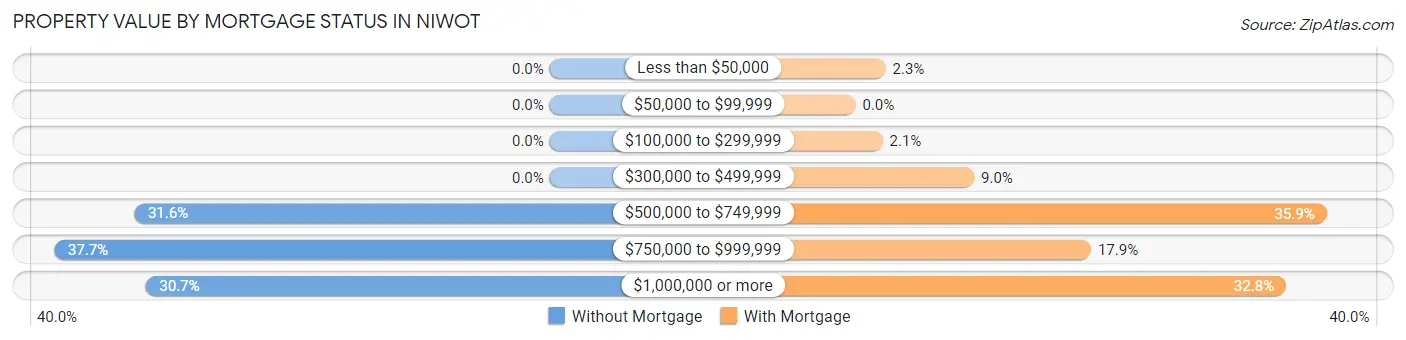
| Property Value | Without Mortgage | With Mortgage |
| Less than $50,000 | 0 (0.0%) | 20 (2.3%) |
| $50,000 to $99,999 | 0 (0.0%) | 0 (0.0%) |
| $100,000 to $299,999 | 0 (0.0%) | 18 (2.1%) |
| $300,000 to $499,999 | 0 (0.0%) | 79 (9.0%) |
| $500,000 to $749,999 | 145 (31.6%) | 314 (35.9%) |
| $750,000 to $999,999 | 173 (37.7%) | 157 (17.9%) |
| $1,000,000 or more | 141 (30.7%) | 287 (32.8%) |
| Total | 459 (100.0%) | 875 (100.0%) |
Household Income by Mortgage Status in Niwot
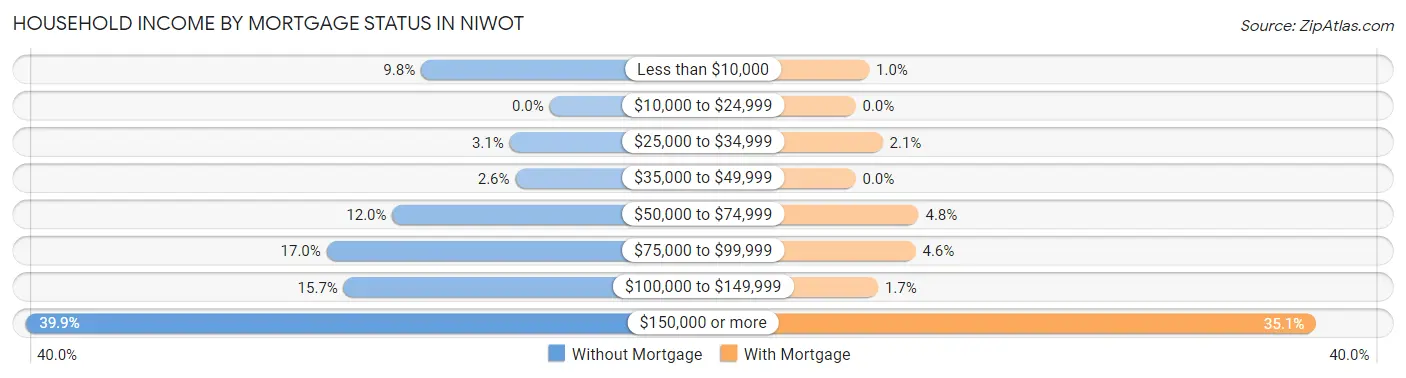
| Household Income | Without Mortgage | With Mortgage |
| Less than $10,000 | 45 (9.8%) | 9 (1.0%) |
| $10,000 to $24,999 | 0 (0.0%) | 0 (0.0%) |
| $25,000 to $34,999 | 14 (3.0%) | 18 (2.1%) |
| $35,000 to $49,999 | 12 (2.6%) | 0 (0.0%) |
| $50,000 to $74,999 | 55 (12.0%) | 42 (4.8%) |
| $75,000 to $99,999 | 78 (17.0%) | 40 (4.6%) |
| $100,000 to $149,999 | 72 (15.7%) | 15 (1.7%) |
| $150,000 or more | 183 (39.9%) | 307 (35.1%) |
| Total | 459 (100.0%) | 875 (100.0%) |
Property Value to Household Income Ratio in Niwot
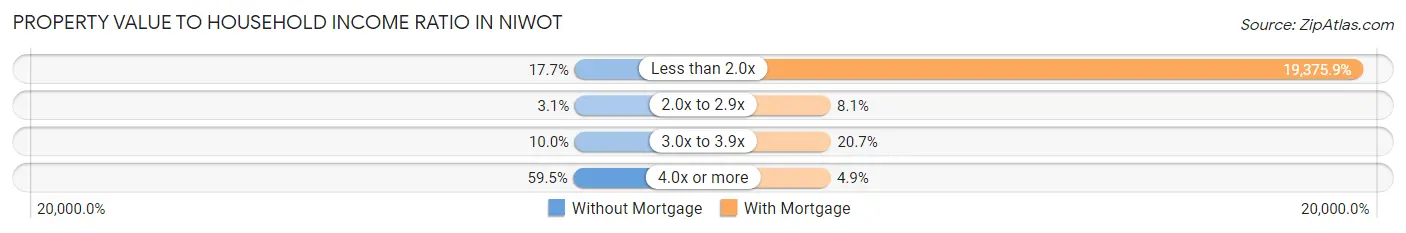
| Value-to-Income Ratio | Without Mortgage | With Mortgage |
| Less than 2.0x | 81 (17.6%) | 169,539 (19,375.9%) |
| 2.0x to 2.9x | 14 (3.0%) | 71 (8.1%) |
| 3.0x to 3.9x | 46 (10.0%) | 181 (20.7%) |
| 4.0x or more | 273 (59.5%) | 43 (4.9%) |
| Total | 459 (100.0%) | 875 (100.0%) |
Real Estate Taxes by Mortgage Status in Niwot
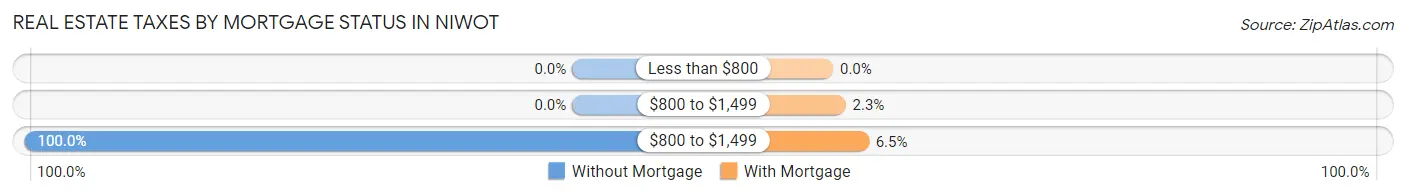
| Property Taxes | Without Mortgage | With Mortgage |
| Less than $800 | 0 (0.0%) | 0 (0.0%) |
| $800 to $1,499 | 0 (0.0%) | 20 (2.3%) |
| $800 to $1,499 | 459 (100.0%) | 57 (6.5%) |
| Total | 459 (100.0%) | 875 (100.0%) |
Health & Disability in Niwot
Health Insurance Coverage by Age in Niwot
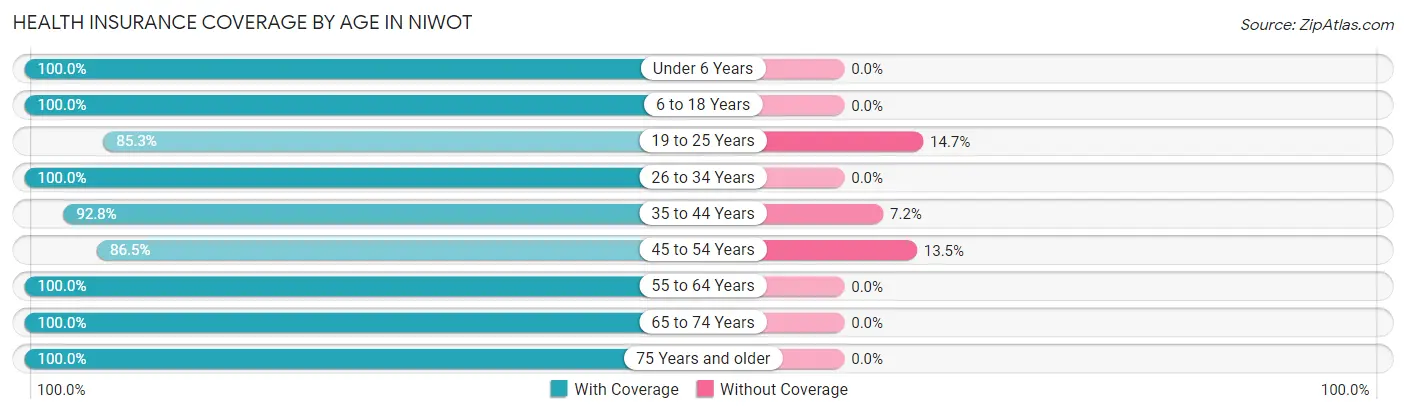
| Age Bracket | With Coverage | Without Coverage |
| Under 6 Years | 177 (100.0%) | 0 (0.0%) |
| 6 to 18 Years | 575 (100.0%) | 0 (0.0%) |
| 19 to 25 Years | 267 (85.3%) | 46 (14.7%) |
| 26 to 34 Years | 220 (100.0%) | 0 (0.0%) |
| 35 to 44 Years | 539 (92.8%) | 42 (7.2%) |
| 45 to 54 Years | 326 (86.5%) | 51 (13.5%) |
| 55 to 64 Years | 960 (100.0%) | 0 (0.0%) |
| 65 to 74 Years | 569 (100.0%) | 0 (0.0%) |
| 75 Years and older | 319 (100.0%) | 0 (0.0%) |
| Total | 3,952 (96.6%) | 139 (3.4%) |
Health Insurance Coverage by Citizenship Status in Niwot
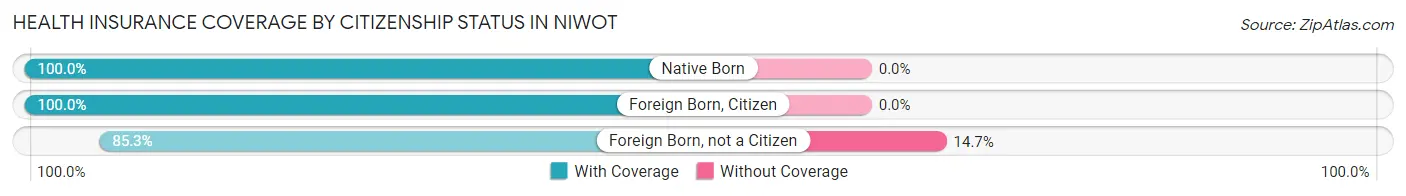
| Citizenship Status | With Coverage | Without Coverage |
| Native Born | 177 (100.0%) | 0 (0.0%) |
| Foreign Born, Citizen | 575 (100.0%) | 0 (0.0%) |
| Foreign Born, not a Citizen | 267 (85.3%) | 46 (14.7%) |
Health Insurance Coverage by Household Income in Niwot
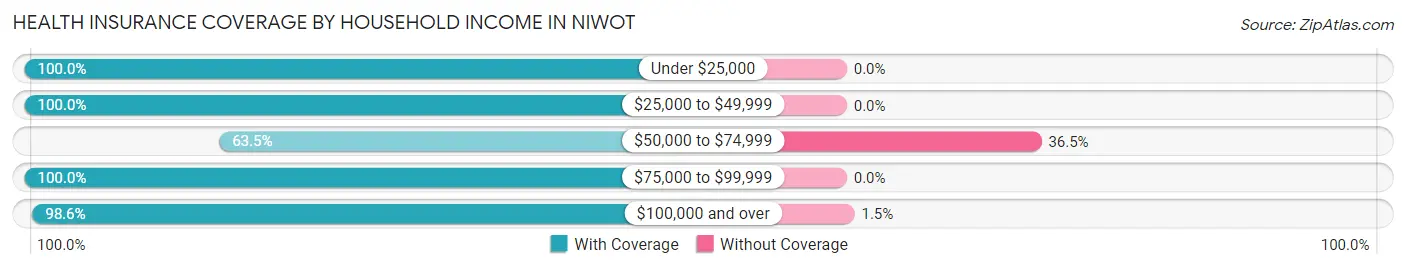
| Household Income | With Coverage | Without Coverage |
| Under $25,000 | 184 (100.0%) | 0 (0.0%) |
| $25,000 to $49,999 | 232 (100.0%) | 0 (0.0%) |
| $50,000 to $74,999 | 162 (63.5%) | 93 (36.5%) |
| $75,000 to $99,999 | 182 (100.0%) | 0 (0.0%) |
| $100,000 and over | 3,131 (98.6%) | 46 (1.5%) |
Public vs Private Health Insurance Coverage by Age in Niwot
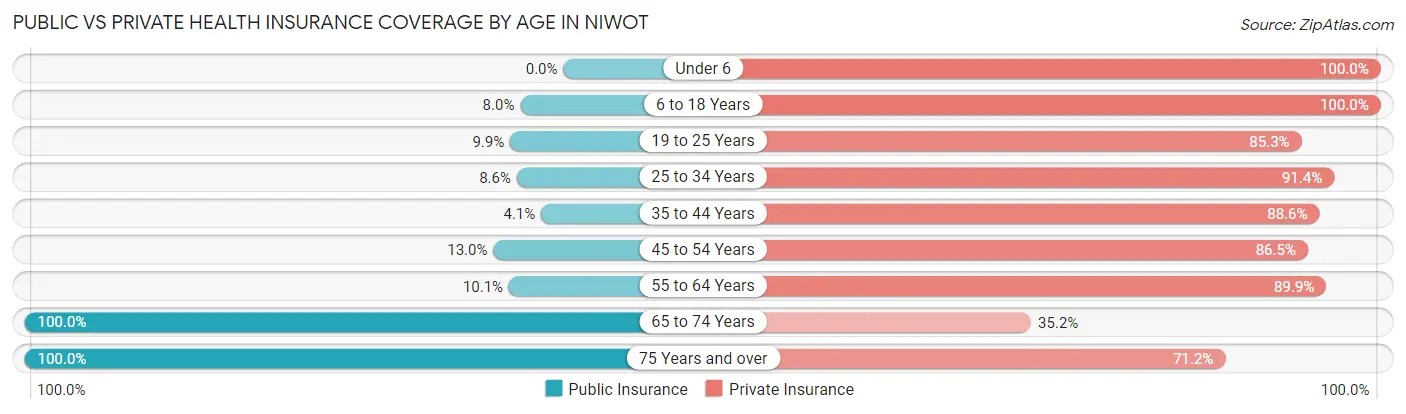
| Age Bracket | Public Insurance | Private Insurance |
| Under 6 | 0 (0.0%) | 177 (100.0%) |
| 6 to 18 Years | 46 (8.0%) | 575 (100.0%) |
| 19 to 25 Years | 31 (9.9%) | 267 (85.3%) |
| 25 to 34 Years | 19 (8.6%) | 201 (91.4%) |
| 35 to 44 Years | 24 (4.1%) | 515 (88.6%) |
| 45 to 54 Years | 49 (13.0%) | 326 (86.5%) |
| 55 to 64 Years | 97 (10.1%) | 863 (89.9%) |
| 65 to 74 Years | 569 (100.0%) | 200 (35.1%) |
| 75 Years and over | 319 (100.0%) | 227 (71.2%) |
| Total | 1,154 (28.2%) | 3,351 (81.9%) |
Disability Status by Sex by Age in Niwot
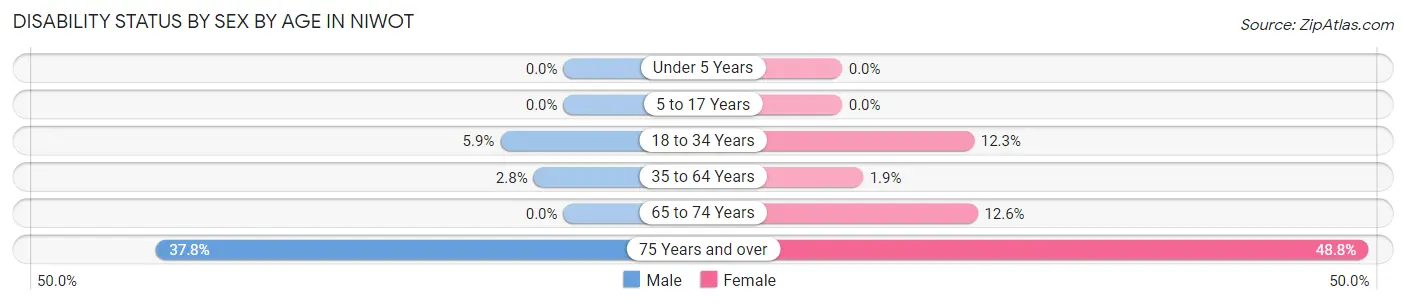
| Age Bracket | Male | Female |
| Under 5 Years | 0 (0.0%) | 0 (0.0%) |
| 5 to 17 Years | 0 (0.0%) | 0 (0.0%) |
| 18 to 34 Years | 19 (5.9%) | 31 (12.2%) |
| 35 to 64 Years | 26 (2.8%) | 19 (1.9%) |
| 65 to 74 Years | 0 (0.0%) | 37 (12.6%) |
| 75 Years and over | 88 (37.8%) | 42 (48.8%) |
Disability Class by Sex by Age in Niwot
Disability Class: Hearing Difficulty
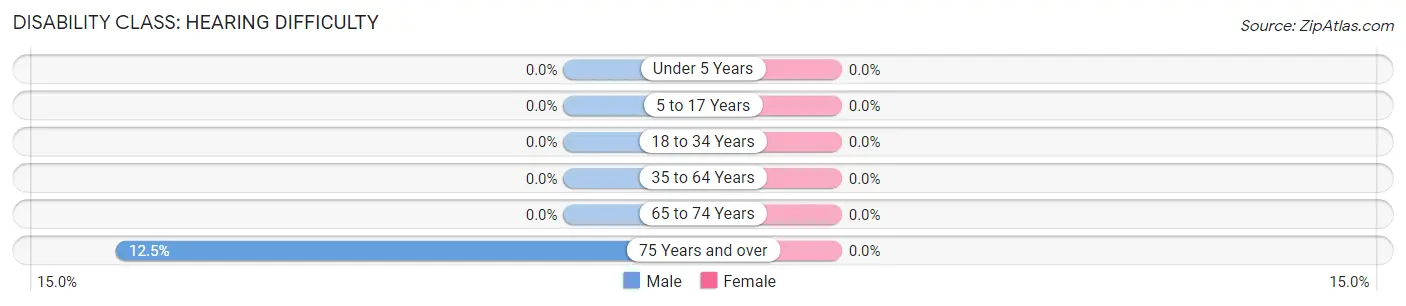
| Age Bracket | Male | Female |
| Under 5 Years | 0 (0.0%) | 0 (0.0%) |
| 5 to 17 Years | 0 (0.0%) | 0 (0.0%) |
| 18 to 34 Years | 0 (0.0%) | 0 (0.0%) |
| 35 to 64 Years | 0 (0.0%) | 0 (0.0%) |
| 65 to 74 Years | 0 (0.0%) | 0 (0.0%) |
| 75 Years and over | 29 (12.4%) | 0 (0.0%) |
Disability Class: Vision Difficulty
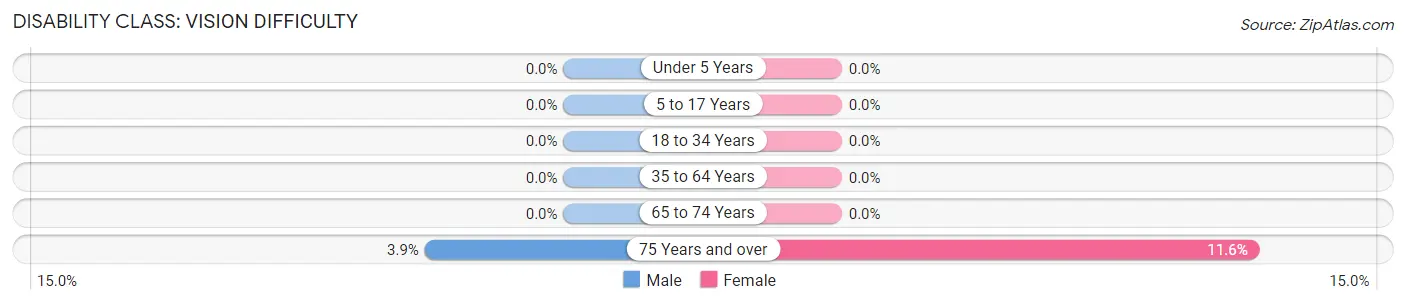
| Age Bracket | Male | Female |
| Under 5 Years | 0 (0.0%) | 0 (0.0%) |
| 5 to 17 Years | 0 (0.0%) | 0 (0.0%) |
| 18 to 34 Years | 0 (0.0%) | 0 (0.0%) |
| 35 to 64 Years | 0 (0.0%) | 0 (0.0%) |
| 65 to 74 Years | 0 (0.0%) | 0 (0.0%) |
| 75 Years and over | 9 (3.9%) | 10 (11.6%) |
Disability Class: Cognitive Difficulty
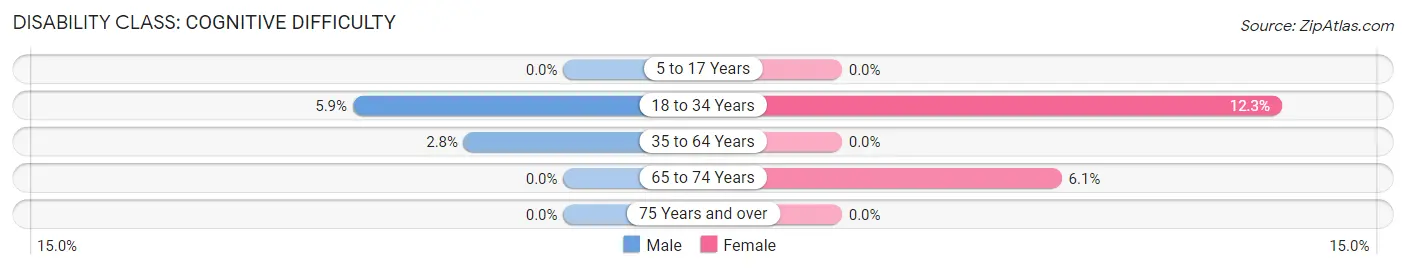
| Age Bracket | Male | Female |
| 5 to 17 Years | 0 (0.0%) | 0 (0.0%) |
| 18 to 34 Years | 19 (5.9%) | 31 (12.2%) |
| 35 to 64 Years | 26 (2.8%) | 0 (0.0%) |
| 65 to 74 Years | 0 (0.0%) | 18 (6.1%) |
| 75 Years and over | 0 (0.0%) | 0 (0.0%) |
Disability Class: Ambulatory Difficulty
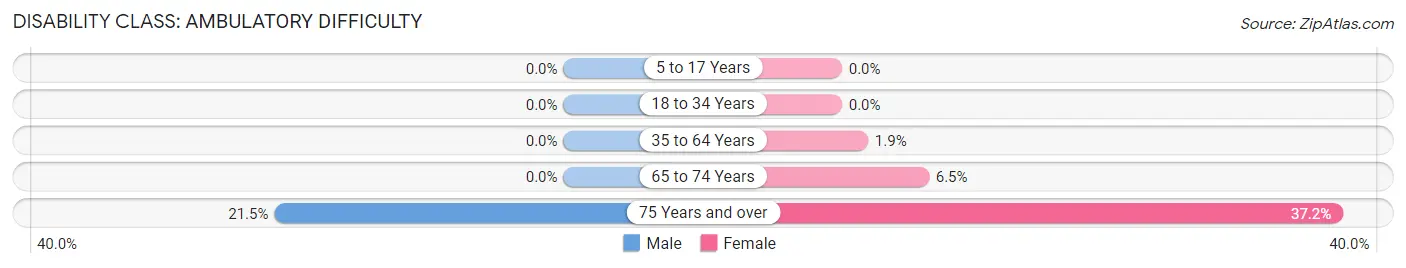
| Age Bracket | Male | Female |
| 5 to 17 Years | 0 (0.0%) | 0 (0.0%) |
| 18 to 34 Years | 0 (0.0%) | 0 (0.0%) |
| 35 to 64 Years | 0 (0.0%) | 19 (1.9%) |
| 65 to 74 Years | 0 (0.0%) | 19 (6.5%) |
| 75 Years and over | 50 (21.5%) | 32 (37.2%) |
Disability Class: Self-Care Difficulty
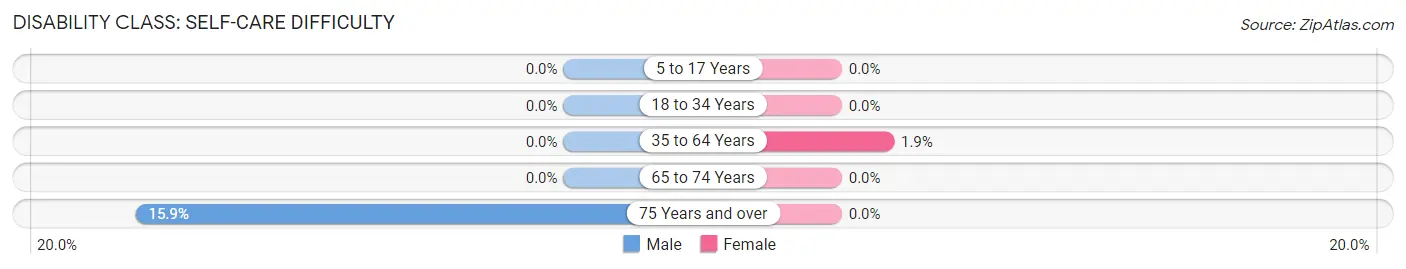
| Age Bracket | Male | Female |
| 5 to 17 Years | 0 (0.0%) | 0 (0.0%) |
| 18 to 34 Years | 0 (0.0%) | 0 (0.0%) |
| 35 to 64 Years | 0 (0.0%) | 19 (1.9%) |
| 65 to 74 Years | 0 (0.0%) | 0 (0.0%) |
| 75 Years and over | 37 (15.9%) | 0 (0.0%) |
Technology Access in Niwot
Computing Device Access in Niwot
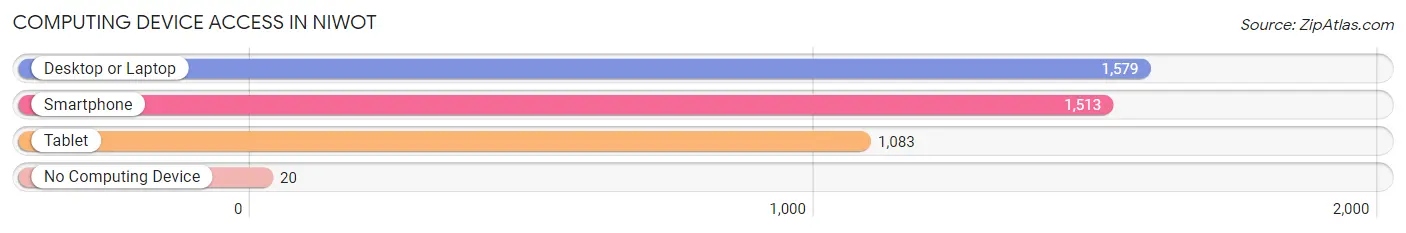
| Device Type | # Households | % Households |
| Desktop or Laptop | 1,579 | 97.5% |
| Smartphone | 1,513 | 93.4% |
| Tablet | 1,083 | 66.9% |
| No Computing Device | 20 | 1.2% |
| Total | 1,619 | 100.0% |
Internet Access in Niwot
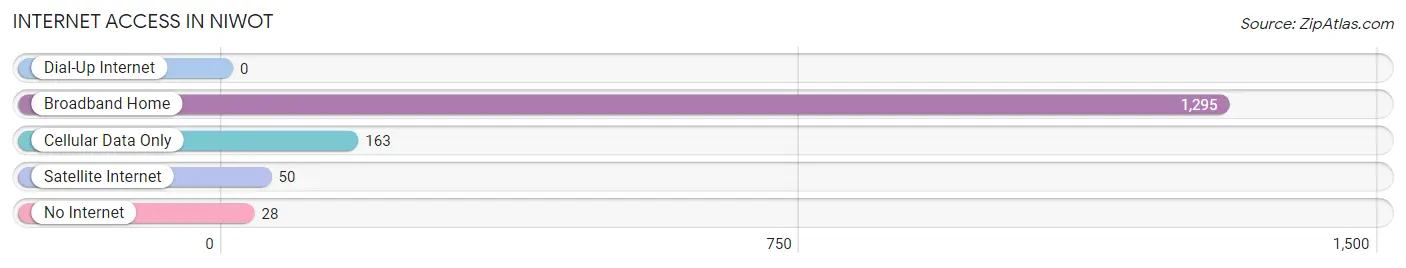
| Internet Type | # Households | % Households |
| Dial-Up Internet | 0 | 0.0% |
| Broadband Home | 1,295 | 80.0% |
| Cellular Data Only | 163 | 10.1% |
| Satellite Internet | 50 | 3.1% |
| No Internet | 28 | 1.7% |
| Total | 1,619 | 100.0% |
Niwot Summary
Niwot is a small town located in Boulder County, Colorado, United States. It is situated in the foothills of the Rocky Mountains, approximately 25 miles northwest of Denver. The town was founded in 1866 by a group of settlers from the Midwest, and was named after Chief Niwot of the Arapaho tribe. The town has a population of around 3,000 people and is known for its small-town charm and rural atmosphere.
Geography
Niwot is located in the foothills of the Rocky Mountains, at an elevation of 5,400 feet. The town is situated on the eastern edge of the Front Range, and is surrounded by rolling hills and open plains. The town is located in the South Platte River Valley, and is bordered by the towns of Longmont to the north, Boulder to the east, and Lyons to the south. The town is located approximately 25 miles northwest of Denver, and is accessible via Interstate 25 and U.S. Highway 287.
Climate
Niwot has a semi-arid climate, with hot summers and cold winters. The average high temperature in the summer is around 85°F, and the average low temperature in the winter is around 20°F. The town receives an average of 16 inches of precipitation per year, with most of it falling in the spring and summer months.
Economy
Niwot’s economy is largely based on agriculture and tourism. The town is home to several farms and ranches, which produce a variety of crops and livestock. The town is also home to several wineries, breweries, and distilleries, which attract visitors from all over the region. In addition, the town is home to several small businesses, including restaurants, shops, and galleries.
Demographics
As of the 2010 census, the population of Niwot was 3,072. The racial makeup of the town was 94.3% White, 0.7% African American, 0.3% Native American, 1.2% Asian, 0.1% Pacific Islander, 1.3% from other races, and 2.3% from two or more races. Hispanic or Latino of any race were 4.3% of the population.
The median household income in Niwot was $76,944, and the median family income was $90,938. The per capita income for the town was $37,945. About 4.3% of families and 6.2% of the population were below the poverty line, including 8.2% of those under age 18 and 4.2% of those age 65 or over.
Conclusion
Niwot is a small town located in Boulder County, Colorado, United States. It is situated in the foothills of the Rocky Mountains, approximately 25 miles northwest of Denver. The town was founded in 1866 by a group of settlers from the Midwest, and was named after Chief Niwot of the Arapaho tribe. The town has a population of around 3,000 people and is known for its small-town charm and rural atmosphere. The town’s economy is largely based on agriculture and tourism, and the town is home to several farms, wineries, breweries, and distilleries. The population of Niwot is predominantly White, with a small percentage of African American, Native American, Asian, and Pacific Islander residents. The median household income in Niwot is $76,944, and the per capita income is $37,945.
Common Questions
What is Per Capita Income in Niwot?
Per Capita income in Niwot is $78,726.
What is the Median Family Income in Niwot?
Median Family Income in Niwot is $169,737.
What is the Median Household income in Niwot?
Median Household Income in Niwot is $135,758.
What is Income or Wage Gap in Niwot?
Income or Wage Gap in Niwot is 84.0%.
Women in Niwot earn 16.0 cents for every dollar earned by a man.
What is Inequality or Gini Index in Niwot?
Inequality or Gini Index in Niwot is 0.49.
What is the Total Population of Niwot?
Total Population of Niwot is 4,091.
What is the Total Male Population of Niwot?
Total Male Population of Niwot is 2,065.
What is the Total Female Population of Niwot?
Total Female Population of Niwot is 2,026.
What is the Ratio of Males per 100 Females in Niwot?
There are 101.92 Males per 100 Females in Niwot.
What is the Ratio of Females per 100 Males in Niwot?
There are 98.11 Females per 100 Males in Niwot.
What is the Median Population Age in Niwot?
Median Population Age in Niwot is 51.0 Years.
What is the Average Family Size in Niwot
Average Family Size in Niwot is 2.9 People.
What is the Average Household Size in Niwot
Average Household Size in Niwot is 2.5 People.
How Large is the Labor Force in Niwot?
There are 1,907 People in the Labor Forcein in Niwot.
What is the Percentage of People in the Labor Force in Niwot?
54.9% of People are in the Labor Force in Niwot.
What is the Unemployment Rate in Niwot?
Unemployment Rate in Niwot is 7.4%.