New Castle, CO Map & Demographics
New Castle Map
New Castle Overview
$34,679
PER CAPITA INCOME
$92,500
AVG FAMILY INCOME
$82,473
AVG HOUSEHOLD INCOME
18.2%
WAGE / INCOME GAP [ % ]
81.8¢/ $1
WAGE / INCOME GAP [ $ ]
0.38
INEQUALITY / GINI INDEX
4,874
TOTAL POPULATION
2,451
MALE POPULATION
2,423
FEMALE POPULATION
101.16
MALES / 100 FEMALES
98.86
FEMALES / 100 MALES
36.2
MEDIAN AGE
3.4
AVG FAMILY SIZE
2.7
AVG HOUSEHOLD SIZE
2,405
LABOR FORCE [ PEOPLE ]
66.3%
PERCENT IN LABOR FORCE
2.7%
UNEMPLOYMENT RATE
New Castle Zip Codes
New Castle Area Codes
Income in New Castle
Income Overview in New Castle
Per Capita Income in New Castle is $34,679, while median incomes of families and households are $92,500 and $82,473 respectively.
| Characteristic | Number | Measure |
| Per Capita Income | 4,874 | $34,679 |
| Median Family Income | 1,138 | $92,500 |
| Mean Family Income | 1,138 | $107,286 |
| Median Household Income | 1,812 | $82,473 |
| Mean Household Income | 1,812 | $94,493 |
| Income Deficit | 1,138 | $0 |
| Wage / Income Gap (%) | 4,874 | 18.19% |
| Wage / Income Gap ($) | 4,874 | 81.81¢ per $1 |
| Gini / Inequality Index | 4,874 | 0.38 |
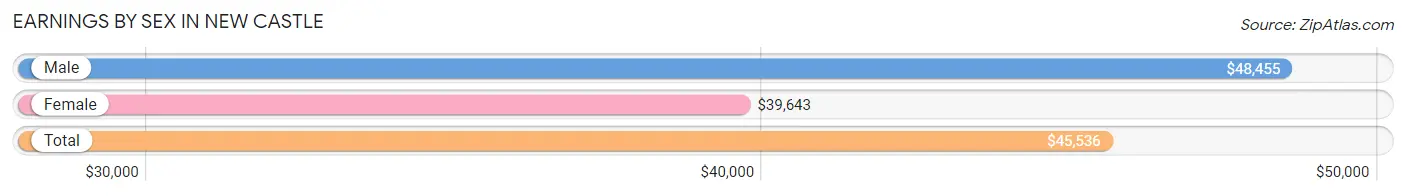
Earnings by Sex in New Castle
Average Earnings in New Castle are $45,536, $48,455 for men and $39,643 for women, a difference of 18.2%.
| Sex | Number | Average Earnings |
| Male | 1,539 (59.3%) | $48,455 |
| Female | 1,058 (40.7%) | $39,643 |
| Total | 2,597 (100.0%) | $45,536 |
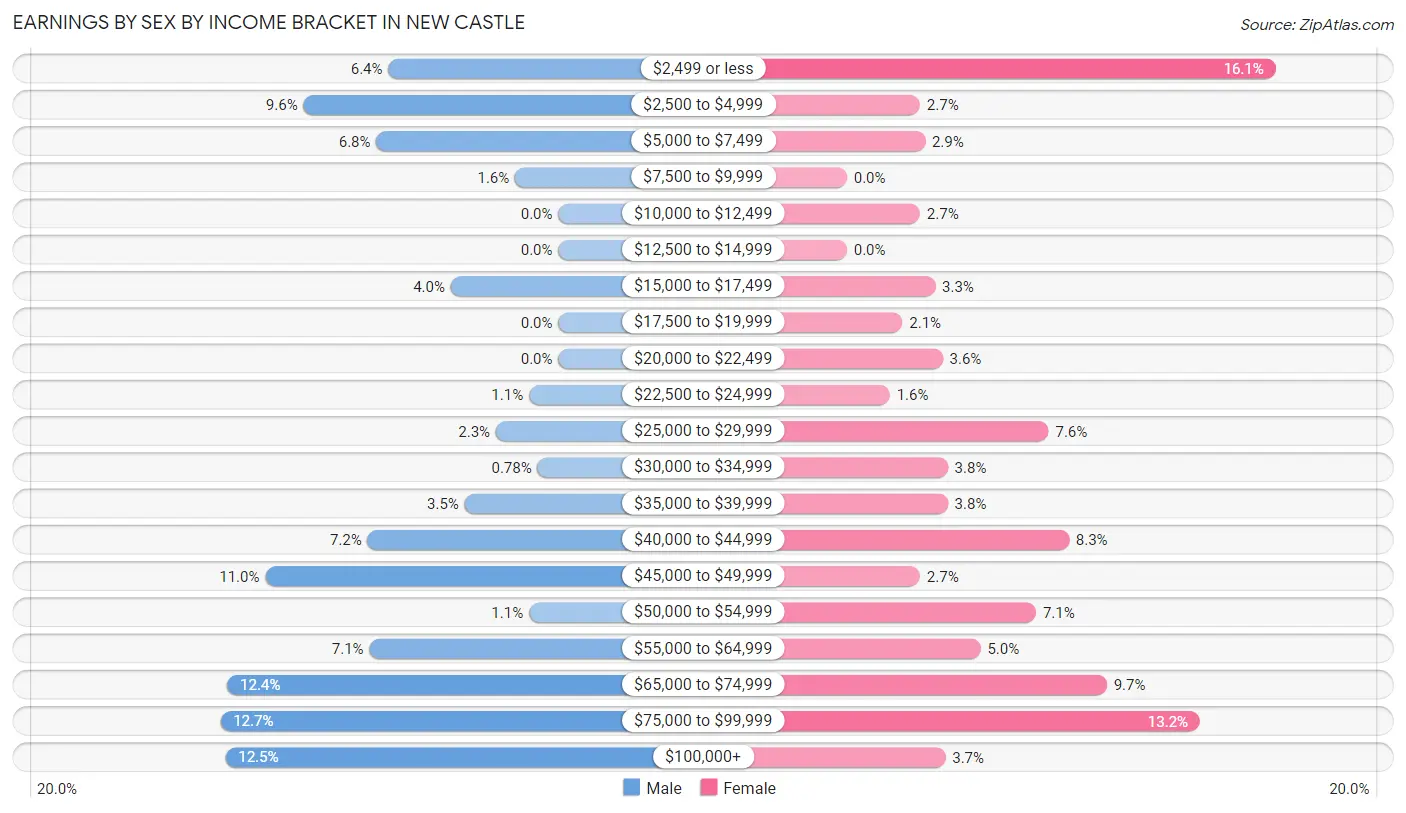
Earnings by Sex by Income Bracket in New Castle
The most common earnings brackets in New Castle are $75,000 to $99,999 for men (195 | 12.7%) and $2,499 or less for women (170 | 16.1%).
| Income | Male | Female |
| $2,499 or less | 98 (6.4%) | 170 (16.1%) |
| $2,500 to $4,999 | 147 (9.6%) | 29 (2.7%) |
| $5,000 to $7,499 | 105 (6.8%) | 31 (2.9%) |
| $7,500 to $9,999 | 25 (1.6%) | 0 (0.0%) |
| $10,000 to $12,499 | 0 (0.0%) | 29 (2.7%) |
| $12,500 to $14,999 | 0 (0.0%) | 0 (0.0%) |
| $15,000 to $17,499 | 62 (4.0%) | 35 (3.3%) |
| $17,500 to $19,999 | 0 (0.0%) | 22 (2.1%) |
| $20,000 to $22,499 | 0 (0.0%) | 38 (3.6%) |
| $22,500 to $24,999 | 17 (1.1%) | 17 (1.6%) |
| $25,000 to $29,999 | 36 (2.3%) | 80 (7.6%) |
| $30,000 to $34,999 | 12 (0.8%) | 40 (3.8%) |
| $35,000 to $39,999 | 54 (3.5%) | 40 (3.8%) |
| $40,000 to $44,999 | 110 (7.1%) | 88 (8.3%) |
| $45,000 to $49,999 | 169 (11.0%) | 29 (2.7%) |
| $50,000 to $54,999 | 17 (1.1%) | 75 (7.1%) |
| $55,000 to $64,999 | 109 (7.1%) | 53 (5.0%) |
| $65,000 to $74,999 | 191 (12.4%) | 103 (9.7%) |
| $75,000 to $99,999 | 195 (12.7%) | 140 (13.2%) |
| $100,000+ | 192 (12.5%) | 39 (3.7%) |
| Total | 1,539 (100.0%) | 1,058 (100.0%) |
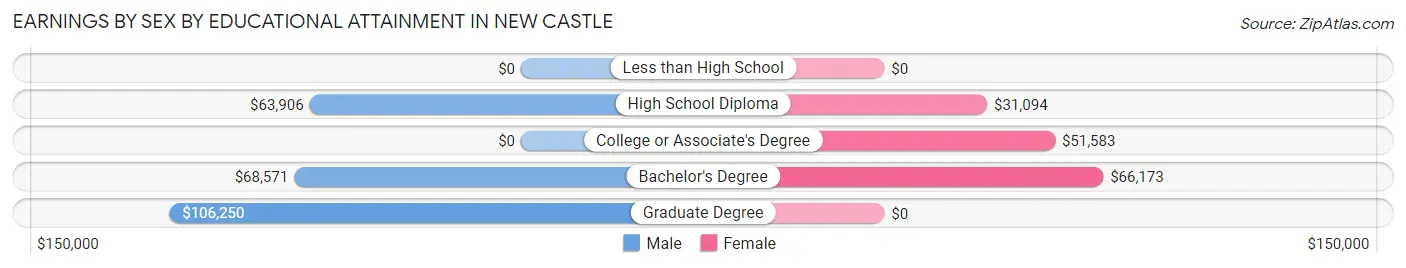
Earnings by Sex by Educational Attainment in New Castle
Average earnings in New Castle are $63,780 for men and $48,534 for women, a difference of 23.9%. Men with an educational attainment of graduate degree enjoy the highest average annual earnings of $106,250, while those with high school diploma education earn the least with $63,906. Women with an educational attainment of bachelor's degree earn the most with the average annual earnings of $66,173, while those with high school diploma education have the smallest earnings of $31,094.
| Educational Attainment | Male Income | Female Income |
| Less than High School | - | - |
| High School Diploma | $63,906 | $31,094 |
| College or Associate's Degree | - | - |
| Bachelor's Degree | $68,571 | $66,173 |
| Graduate Degree | $106,250 | $0 |
| Total | $63,780 | $48,534 |
Family Income in New Castle
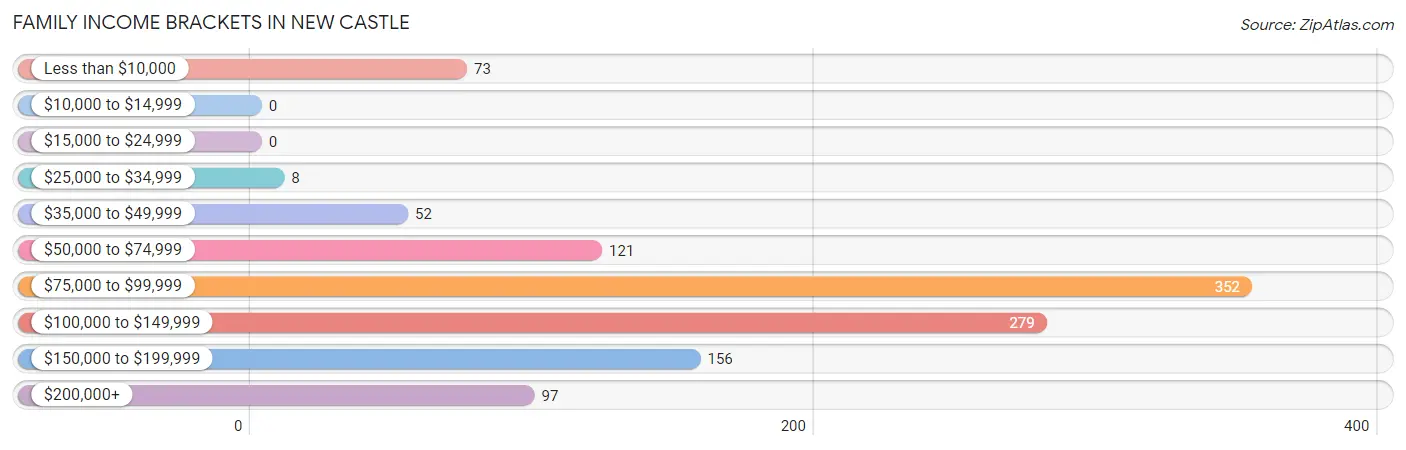
Family Income Brackets in New Castle
According to the New Castle family income data, there are 352 families falling into the $75,000 to $99,999 income range, which is the most common income bracket and makes up 30.9% of all families.
| Income Bracket | # Families | % Families |
| Less than $10,000 | 73 | 6.4% |
| $10,000 to $14,999 | 0 | 0.0% |
| $15,000 to $24,999 | 0 | 0.0% |
| $25,000 to $34,999 | 8 | 0.7% |
| $35,000 to $49,999 | 52 | 4.6% |
| $50,000 to $74,999 | 121 | 10.6% |
| $75,000 to $99,999 | 352 | 30.9% |
| $100,000 to $149,999 | 279 | 24.5% |
| $150,000 to $199,999 | 156 | 13.7% |
| $200,000+ | 97 | 8.5% |
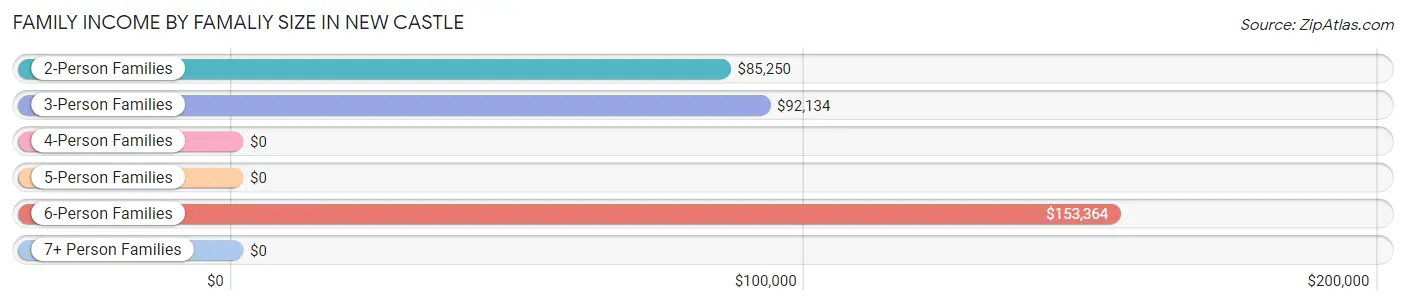
Family Income by Famaliy Size in New Castle
6-person families (89 | 7.8%) account for the highest median family income in New Castle with $153,364 per family, while 2-person families (346 | 30.4%) have the highest median income of $42,625 per family member.
| Income Bracket | # Families | Median Income |
| 2-Person Families | 346 (30.4%) | $85,250 |
| 3-Person Families | 436 (38.3%) | $92,134 |
| 4-Person Families | 161 (14.1%) | $0 |
| 5-Person Families | 106 (9.3%) | $0 |
| 6-Person Families | 89 (7.8%) | $153,364 |
| 7+ Person Families | 0 (0.0%) | $0 |
| Total | 1,138 (100.0%) | $92,500 |
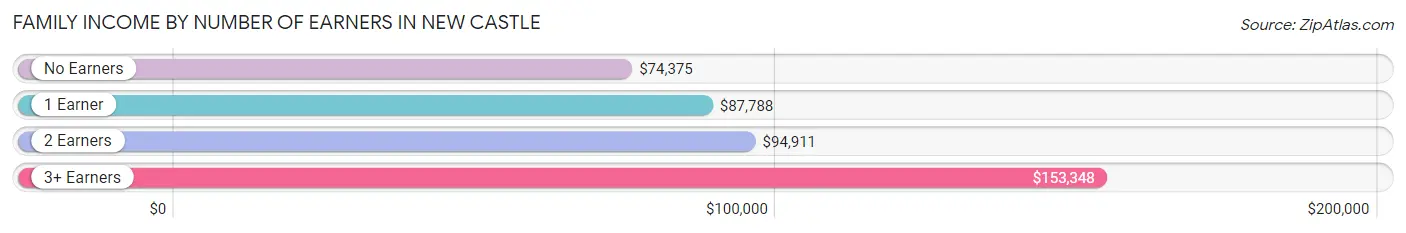
Family Income by Number of Earners in New Castle
The median family income in New Castle is $92,500, with families comprising 3+ earners (201) having the highest median family income of $153,348, while families with no earners (129) have the lowest median family income of $74,375, accounting for 17.7% and 11.3% of families, respectively.
| Number of Earners | # Families | Median Income |
| No Earners | 129 (11.3%) | $74,375 |
| 1 Earner | 399 (35.1%) | $87,788 |
| 2 Earners | 409 (35.9%) | $94,911 |
| 3+ Earners | 201 (17.7%) | $153,348 |
| Total | 1,138 (100.0%) | $92,500 |
Household Income in New Castle
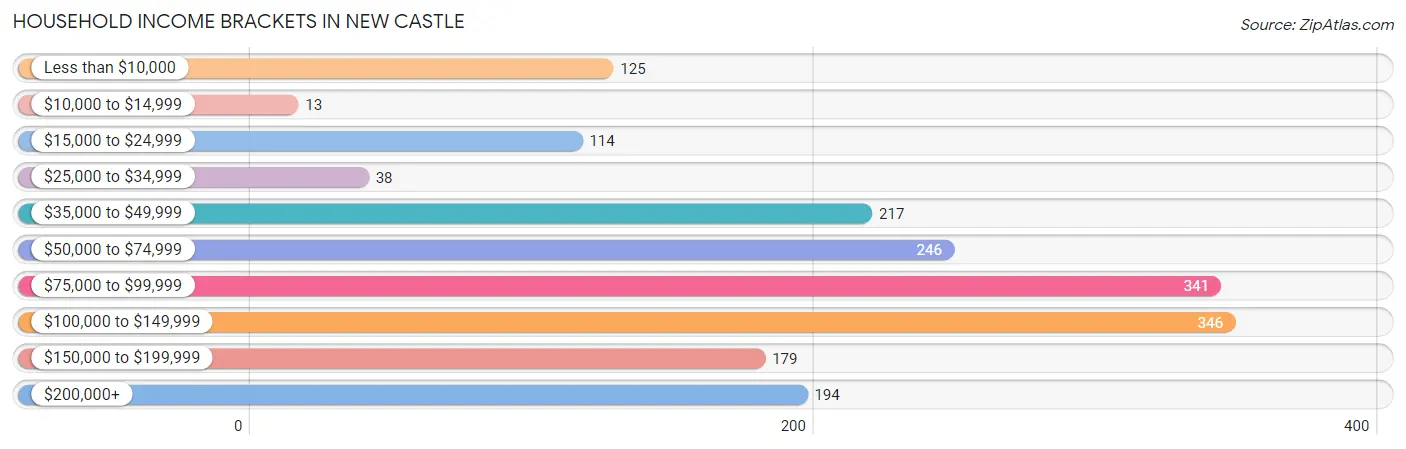
Household Income Brackets in New Castle
With 346 households falling in the category, the $100,000 to $149,999 income range is the most frequent in New Castle, accounting for 19.1% of all households. In contrast, only 13 households (0.7%) fall into the $10,000 to $14,999 income bracket, making it the least populous group.
| Income Bracket | # Households | % Households |
| Less than $10,000 | 125 | 6.9% |
| $10,000 to $14,999 | 13 | 0.7% |
| $15,000 to $24,999 | 114 | 6.3% |
| $25,000 to $34,999 | 38 | 2.1% |
| $35,000 to $49,999 | 217 | 12.0% |
| $50,000 to $74,999 | 246 | 13.6% |
| $75,000 to $99,999 | 341 | 18.8% |
| $100,000 to $149,999 | 346 | 19.1% |
| $150,000 to $199,999 | 179 | 9.9% |
| $200,000+ | 194 | 10.7% |
Household Income by Householder Age in New Castle
The median household income in New Castle is $82,473, with the highest median household income of $92,857 found in the 45 to 64 years age bracket for the primary householder. A total of 780 households (43.0%) fall into this category. Meanwhile, the 15 to 24 years age bracket for the primary householder has the lowest median household income of $0, with 60 households (3.3%) in this group.
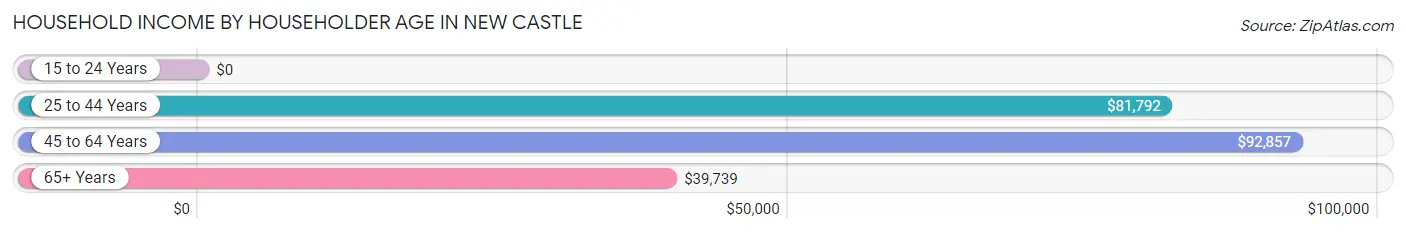
| Income Bracket | # Households | Median Income |
| 15 to 24 Years | 60 (3.3%) | $0 |
| 25 to 44 Years | 526 (29.0%) | $81,792 |
| 45 to 64 Years | 780 (43.0%) | $92,857 |
| 65+ Years | 446 (24.6%) | $39,739 |
| Total | 1,812 (100.0%) | $82,473 |
Poverty in New Castle
Income Below Poverty by Sex and Age in New Castle
With 12.2% poverty level for males and 5.8% for females among the residents of New Castle, 6 to 11 year old males and 6 to 11 year old females are the most vulnerable to poverty, with 89 males (51.1%) and 63 females (19.0%) in their respective age groups living below the poverty level.
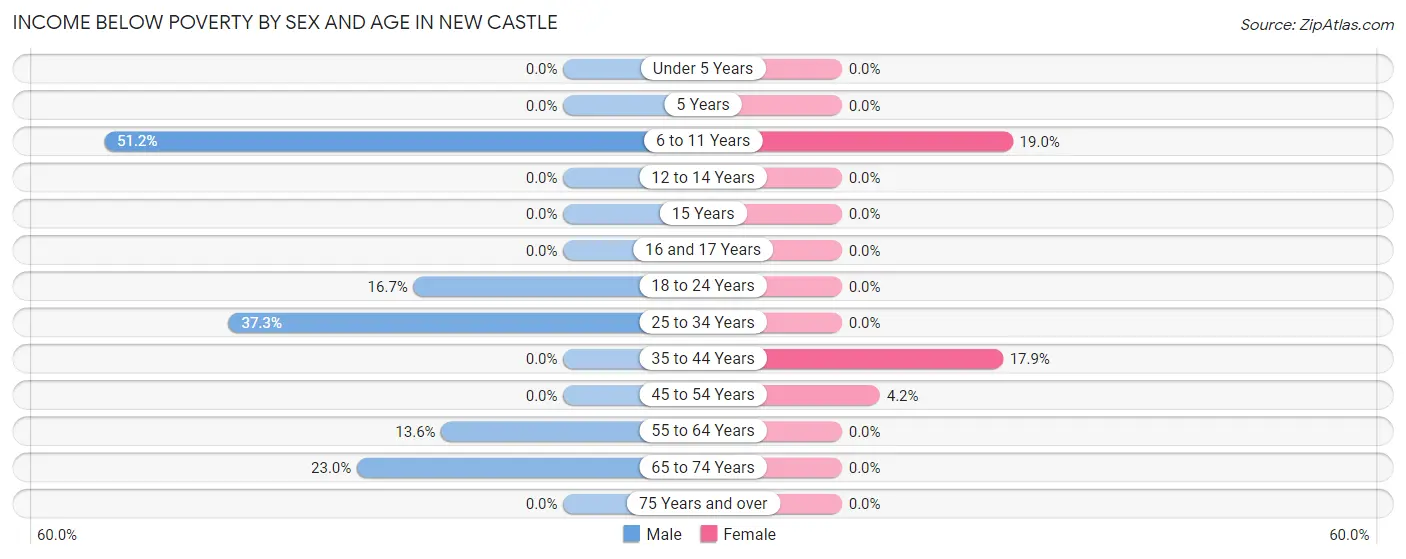
| Age Bracket | Male | Female |
| Under 5 Years | 0 (0.0%) | 0 (0.0%) |
| 5 Years | 0 (0.0%) | 0 (0.0%) |
| 6 to 11 Years | 89 (51.1%) | 63 (19.0%) |
| 12 to 14 Years | 0 (0.0%) | 0 (0.0%) |
| 15 Years | 0 (0.0%) | 0 (0.0%) |
| 16 and 17 Years | 0 (0.0%) | 0 (0.0%) |
| 18 to 24 Years | 50 (16.7%) | 0 (0.0%) |
| 25 to 34 Years | 85 (37.3%) | 0 (0.0%) |
| 35 to 44 Years | 0 (0.0%) | 62 (17.9%) |
| 45 to 54 Years | 0 (0.0%) | 15 (4.2%) |
| 55 to 64 Years | 41 (13.6%) | 0 (0.0%) |
| 65 to 74 Years | 34 (23.0%) | 0 (0.0%) |
| 75 Years and over | 0 (0.0%) | 0 (0.0%) |
| Total | 299 (12.2%) | 140 (5.8%) |
Income Above Poverty by Sex and Age in New Castle
According to the poverty statistics in New Castle, males aged under 5 years and females aged under 5 years are the age groups that are most secure financially, with 100.0% of males and 100.0% of females in these age groups living above the poverty line.
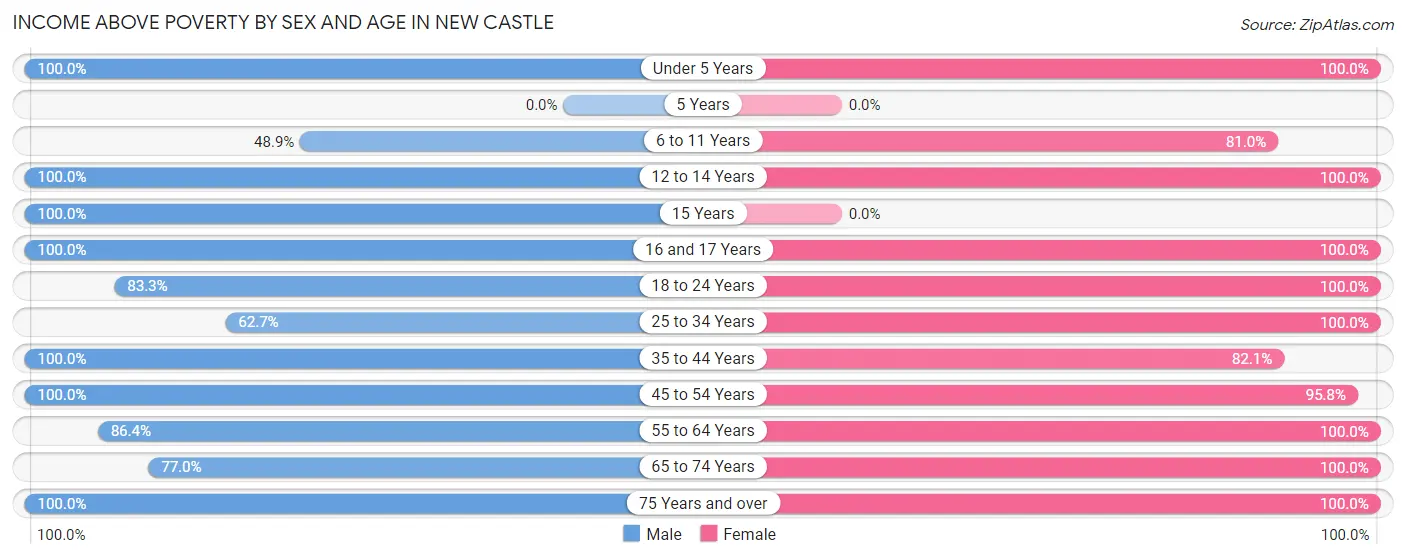
| Age Bracket | Male | Female |
| Under 5 Years | 218 (100.0%) | 297 (100.0%) |
| 5 Years | 0 (0.0%) | 0 (0.0%) |
| 6 to 11 Years | 85 (48.8%) | 268 (81.0%) |
| 12 to 14 Years | 94 (100.0%) | 57 (100.0%) |
| 15 Years | 76 (100.0%) | 0 (0.0%) |
| 16 and 17 Years | 127 (100.0%) | 80 (100.0%) |
| 18 to 24 Years | 250 (83.3%) | 191 (100.0%) |
| 25 to 34 Years | 143 (62.7%) | 215 (100.0%) |
| 35 to 44 Years | 310 (100.0%) | 284 (82.1%) |
| 45 to 54 Years | 397 (100.0%) | 340 (95.8%) |
| 55 to 64 Years | 261 (86.4%) | 166 (100.0%) |
| 65 to 74 Years | 114 (77.0%) | 115 (100.0%) |
| 75 Years and over | 77 (100.0%) | 270 (100.0%) |
| Total | 2,152 (87.8%) | 2,283 (94.2%) |
Income Below Poverty Among Married-Couple Families in New Castle
The poverty statistics for married-couple families in New Castle show that 1.2% or 11 of the total 909 families live below the poverty line. Families with no children have the highest poverty rate of 3.8%, comprising of 11 families. On the other hand, families with 1 or 2 children have the lowest poverty rate of 0.0%, which includes 0 families.
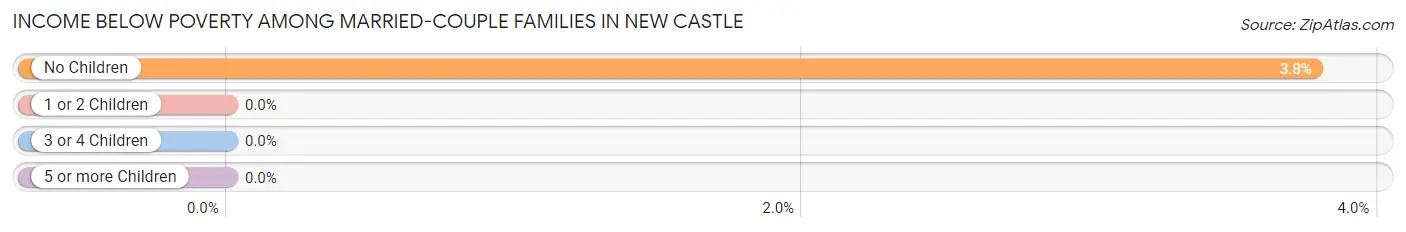
| Children | Above Poverty | Below Poverty |
| No Children | 280 (96.2%) | 11 (3.8%) |
| 1 or 2 Children | 525 (100.0%) | 0 (0.0%) |
| 3 or 4 Children | 93 (100.0%) | 0 (0.0%) |
| 5 or more Children | 0 (0.0%) | 0 (0.0%) |
| Total | 898 (98.8%) | 11 (1.2%) |
Income Below Poverty Among Single-Parent Households in New Castle
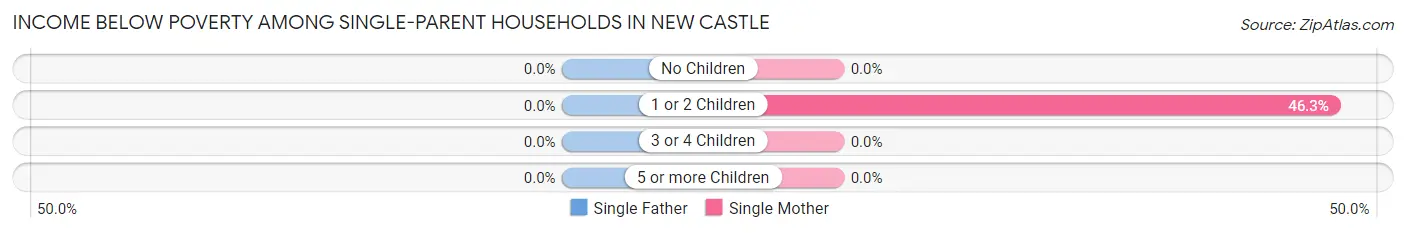
| Children | Single Father | Single Mother |
| No Children | 0 (0.0%) | 0 (0.0%) |
| 1 or 2 Children | 0 (0.0%) | 62 (46.3%) |
| 3 or 4 Children | 0 (0.0%) | 0 (0.0%) |
| 5 or more Children | 0 (0.0%) | 0 (0.0%) |
| Total | 0 (0.0%) | 62 (42.2%) |
Income Below Poverty Among Married-Couple vs Single-Parent Households in New Castle
The poverty data for New Castle shows that 11 of the married-couple family households (1.2%) and 62 of the single-parent households (27.1%) are living below the poverty level. Within the married-couple family households, those with no children have the highest poverty rate, with 11 households (3.8%) falling below the poverty line. Among the single-parent households, those with 1 or 2 children have the highest poverty rate, with 62 household (28.7%) living below poverty.
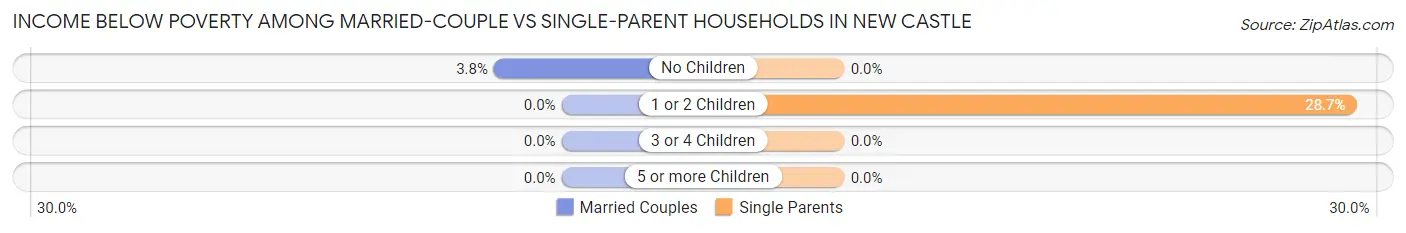
| Children | Married-Couple Families | Single-Parent Households |
| No Children | 11 (3.8%) | 0 (0.0%) |
| 1 or 2 Children | 0 (0.0%) | 62 (28.7%) |
| 3 or 4 Children | 0 (0.0%) | 0 (0.0%) |
| 5 or more Children | 0 (0.0%) | 0 (0.0%) |
| Total | 11 (1.2%) | 62 (27.1%) |
Race in New Castle
The most populous races in New Castle are White / Caucasian (3,597 | 73.8%), Hispanic or Latino (1,404 | 28.8%), and Two or more Races (634 | 13.0%).
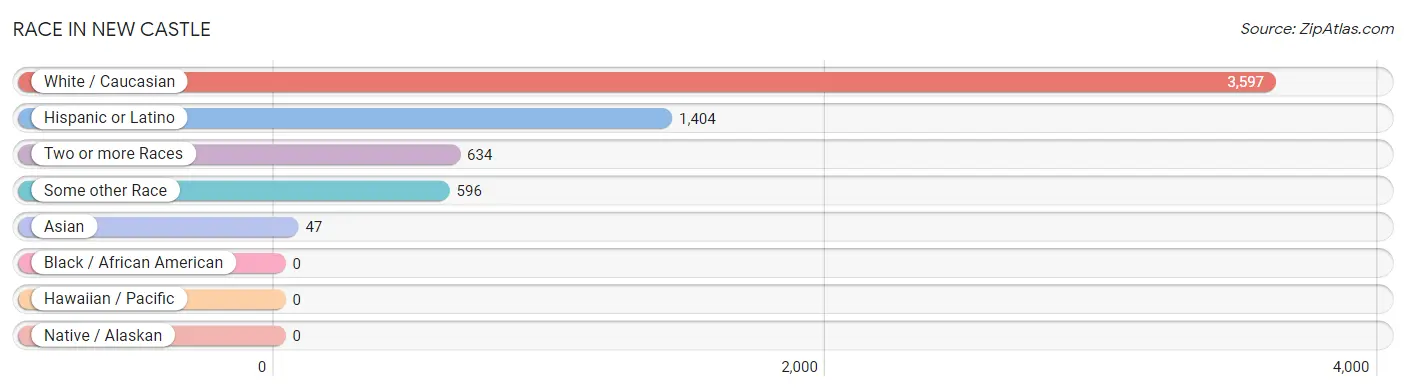
| Race | # Population | % Population |
| Asian | 47 | 1.0% |
| Black / African American | 0 | 0.0% |
| Hawaiian / Pacific | 0 | 0.0% |
| Hispanic or Latino | 1,404 | 28.8% |
| Native / Alaskan | 0 | 0.0% |
| White / Caucasian | 3,597 | 73.8% |
| Two or more Races | 634 | 13.0% |
| Some other Race | 596 | 12.2% |
| Total | 4,874 | 100.0% |
Ancestry in New Castle
The most populous ancestries reported in New Castle are German (1,068 | 21.9%), Mexican (748 | 15.3%), Central American (551 | 11.3%), English (462 | 9.5%), and Salvadoran (389 | 8.0%), together accounting for 66.0% of all New Castle residents.
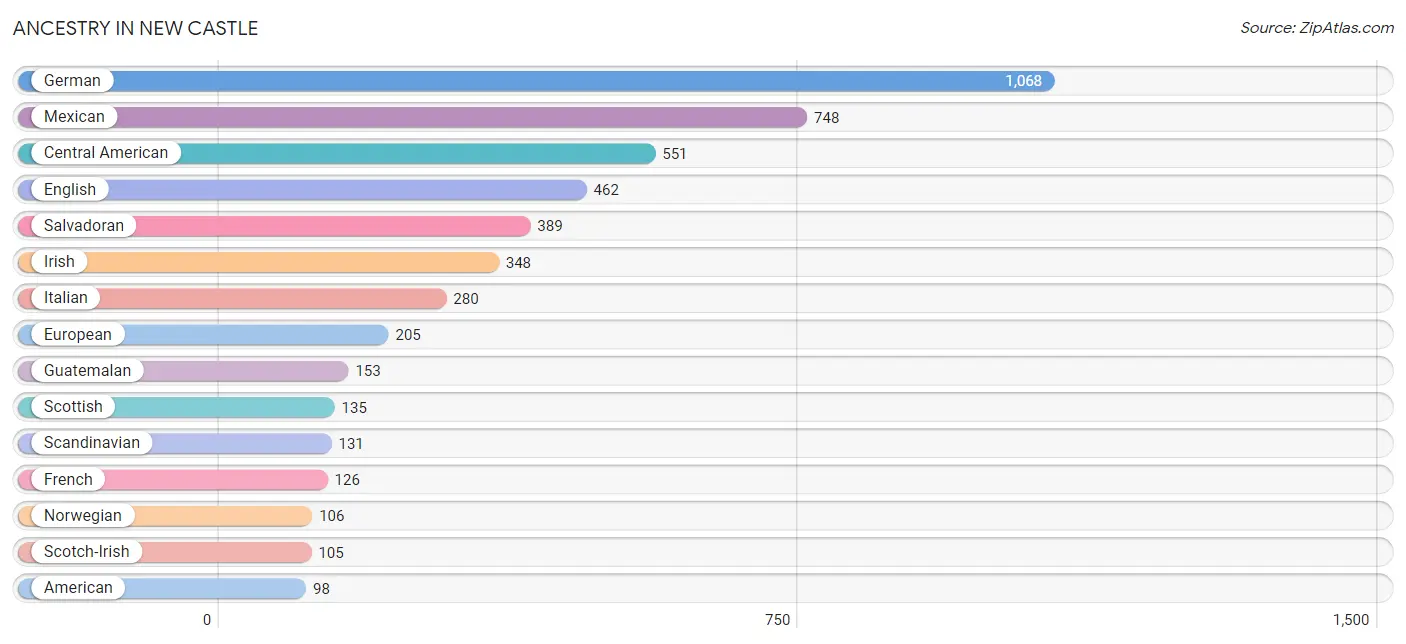
| Ancestry | # Population | % Population |
| American | 98 | 2.0% |
| Austrian | 49 | 1.0% |
| Brazilian | 15 | 0.3% |
| British | 14 | 0.3% |
| Central American | 551 | 11.3% |
| Cherokee | 31 | 0.6% |
| Czech | 41 | 0.8% |
| Dutch | 6 | 0.1% |
| English | 462 | 9.5% |
| European | 205 | 4.2% |
| Finnish | 28 | 0.6% |
| French | 126 | 2.6% |
| French Canadian | 23 | 0.5% |
| German | 1,068 | 21.9% |
| Greek | 94 | 1.9% |
| Guatemalan | 153 | 3.1% |
| Honduran | 9 | 0.2% |
| Hungarian | 23 | 0.5% |
| Irish | 348 | 7.1% |
| Italian | 280 | 5.7% |
| Korean | 47 | 1.0% |
| Mexican | 748 | 15.3% |
| Norwegian | 106 | 2.2% |
| Polish | 69 | 1.4% |
| Puerto Rican | 28 | 0.6% |
| Salvadoran | 389 | 8.0% |
| Scandinavian | 131 | 2.7% |
| Scotch-Irish | 105 | 2.1% |
| Scottish | 135 | 2.8% |
| Slovak | 10 | 0.2% |
| Spanish | 11 | 0.2% |
| Spanish American | 10 | 0.2% |
| Swedish | 87 | 1.8% |
| Swiss | 13 | 0.3% |
| Welsh | 9 | 0.2% | View All 35 Rows |
Immigrants in New Castle
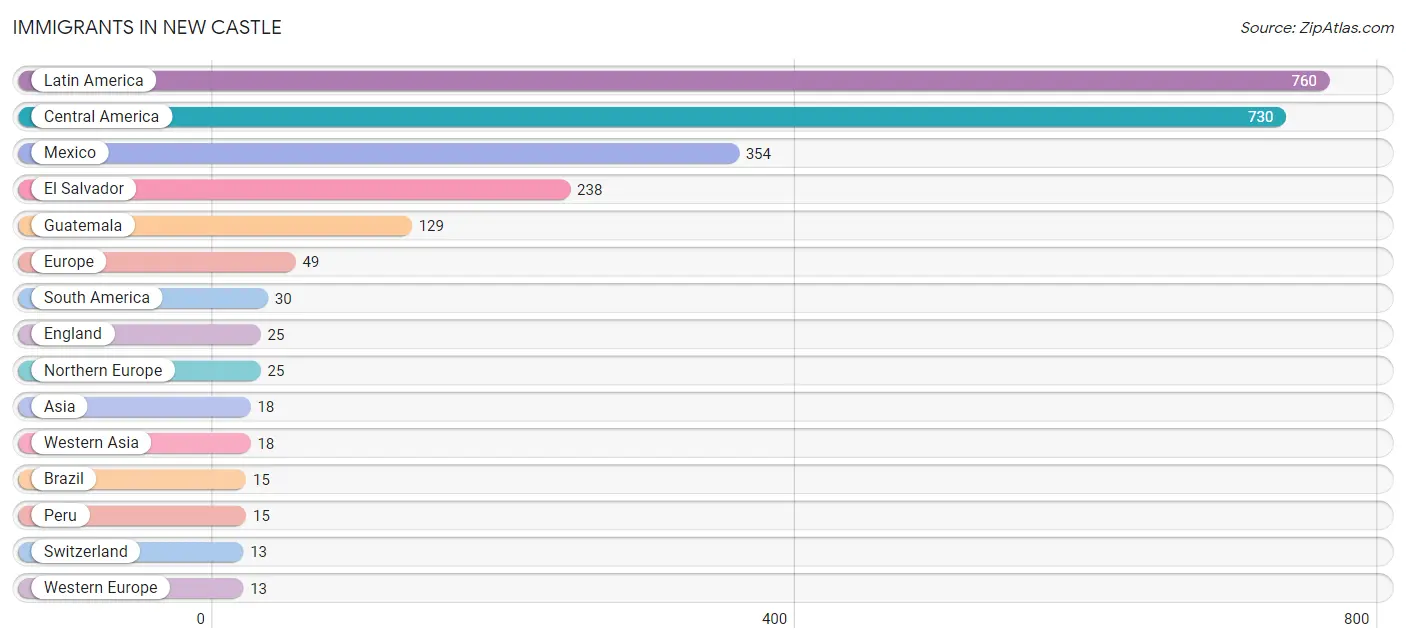
The most numerous immigrant groups reported in New Castle came from Latin America (760 | 15.6%), Central America (730 | 15.0%), Mexico (354 | 7.3%), El Salvador (238 | 4.9%), and Guatemala (129 | 2.6%), together accounting for 45.4% of all New Castle residents.
| Immigration Origin | # Population | % Population |
| Asia | 18 | 0.4% |
| Brazil | 15 | 0.3% |
| Central America | 730 | 15.0% |
| El Salvador | 238 | 4.9% |
| England | 25 | 0.5% |
| Europe | 49 | 1.0% |
| Guatemala | 129 | 2.6% |
| Honduras | 9 | 0.2% |
| Latin America | 760 | 15.6% |
| Mexico | 354 | 7.3% |
| Northern Europe | 25 | 0.5% |
| Peru | 15 | 0.3% |
| Portugal | 11 | 0.2% |
| South America | 30 | 0.6% |
| Southern Europe | 11 | 0.2% |
| Switzerland | 13 | 0.3% |
| Western Asia | 18 | 0.4% |
| Western Europe | 13 | 0.3% | View All 18 Rows |
Sex and Age in New Castle
Sex and Age in New Castle
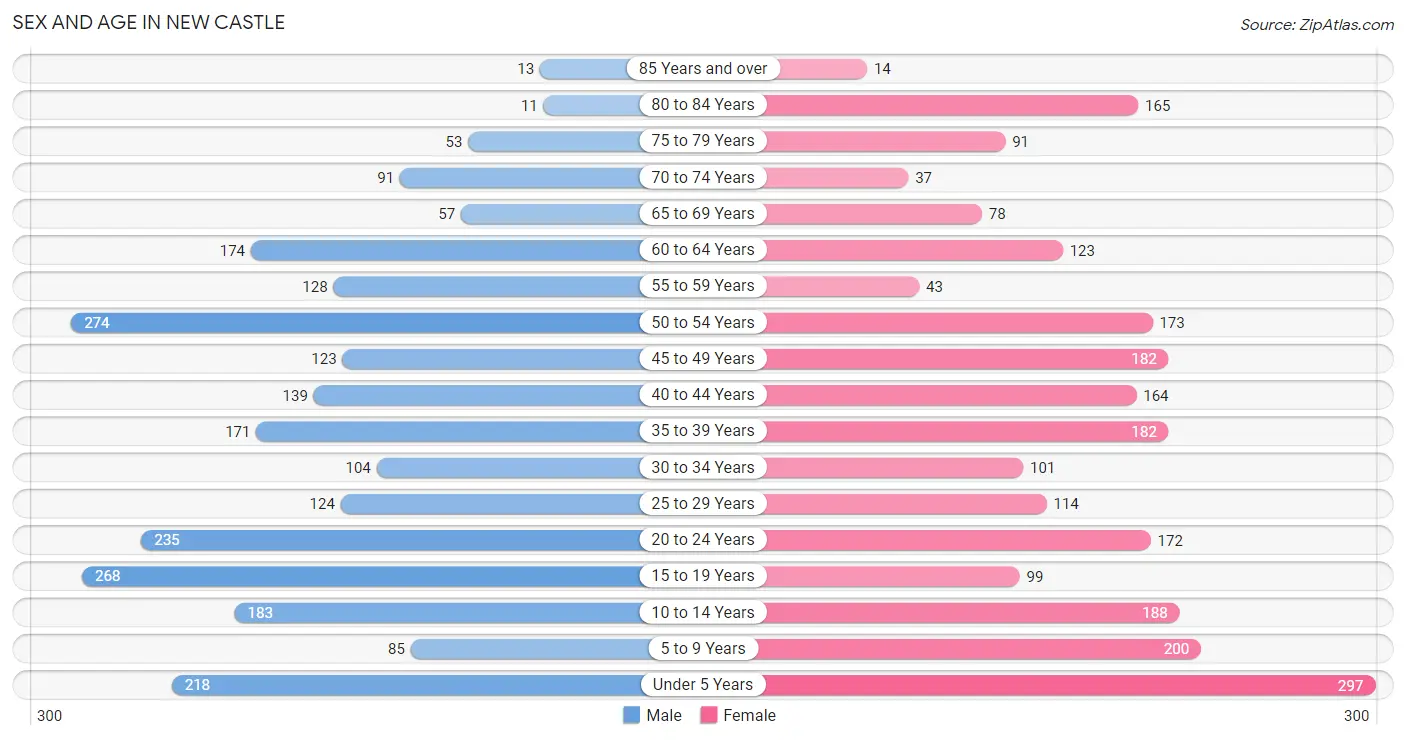
The most populous age groups in New Castle are 50 to 54 Years (274 | 11.2%) for men and Under 5 Years (297 | 12.3%) for women.
| Age Bracket | Male | Female |
| Under 5 Years | 218 (8.9%) | 297 (12.3%) |
| 5 to 9 Years | 85 (3.5%) | 200 (8.3%) |
| 10 to 14 Years | 183 (7.5%) | 188 (7.8%) |
| 15 to 19 Years | 268 (10.9%) | 99 (4.1%) |
| 20 to 24 Years | 235 (9.6%) | 172 (7.1%) |
| 25 to 29 Years | 124 (5.1%) | 114 (4.7%) |
| 30 to 34 Years | 104 (4.2%) | 101 (4.2%) |
| 35 to 39 Years | 171 (7.0%) | 182 (7.5%) |
| 40 to 44 Years | 139 (5.7%) | 164 (6.8%) |
| 45 to 49 Years | 123 (5.0%) | 182 (7.5%) |
| 50 to 54 Years | 274 (11.2%) | 173 (7.1%) |
| 55 to 59 Years | 128 (5.2%) | 43 (1.8%) |
| 60 to 64 Years | 174 (7.1%) | 123 (5.1%) |
| 65 to 69 Years | 57 (2.3%) | 78 (3.2%) |
| 70 to 74 Years | 91 (3.7%) | 37 (1.5%) |
| 75 to 79 Years | 53 (2.2%) | 91 (3.8%) |
| 80 to 84 Years | 11 (0.4%) | 165 (6.8%) |
| 85 Years and over | 13 (0.5%) | 14 (0.6%) |
| Total | 2,451 (100.0%) | 2,423 (100.0%) |
Families and Households in New Castle
Median Family Size in New Castle
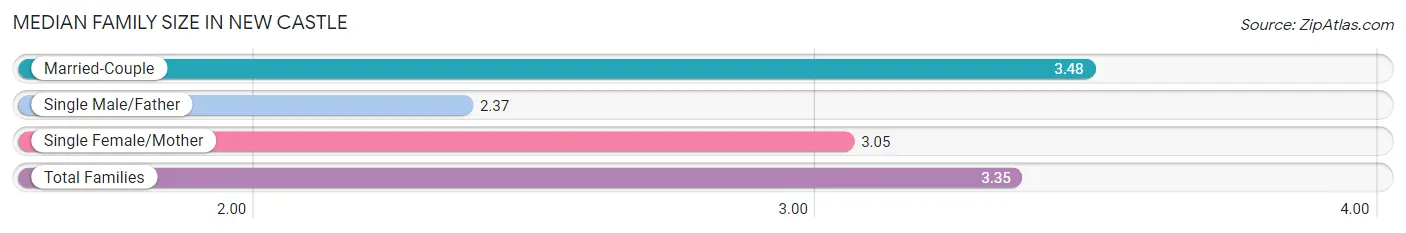
The median family size in New Castle is 3.35 persons per family, with married-couple families (909 | 79.9%) accounting for the largest median family size of 3.48 persons per family. On the other hand, single male/father families (82 | 7.2%) represent the smallest median family size with 2.37 persons per family.
| Family Type | # Families | Family Size |
| Married-Couple | 909 (79.9%) | 3.48 |
| Single Male/Father | 82 (7.2%) | 2.37 |
| Single Female/Mother | 147 (12.9%) | 3.05 |
| Total Families | 1,138 (100.0%) | 3.35 |
Median Household Size in New Castle
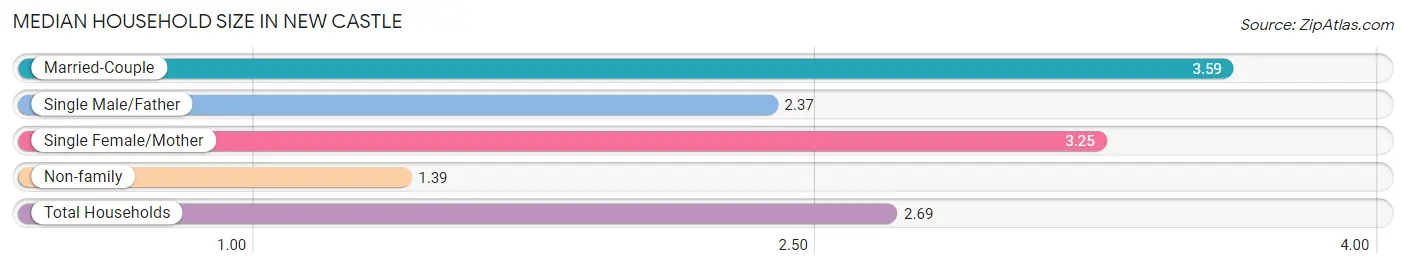
The median household size in New Castle is 2.69 persons per household, with married-couple households (909 | 50.2%) accounting for the largest median household size of 3.59 persons per household. non-family households (674 | 37.2%) represent the smallest median household size with 1.39 persons per household.
| Household Type | # Households | Household Size |
| Married-Couple | 909 (50.2%) | 3.59 |
| Single Male/Father | 82 (4.5%) | 2.37 |
| Single Female/Mother | 147 (8.1%) | 3.25 |
| Non-family | 674 (37.2%) | 1.39 |
| Total Households | 1,812 (100.0%) | 2.69 |
Household Size by Marriage Status in New Castle
Out of a total of 1,812 households in New Castle, 1,138 (62.8%) are family households, while 674 (37.2%) are nonfamily households. The most numerous type of family households are 3-person households, comprising 469, and the most common type of nonfamily households are 1-person households, comprising 589.
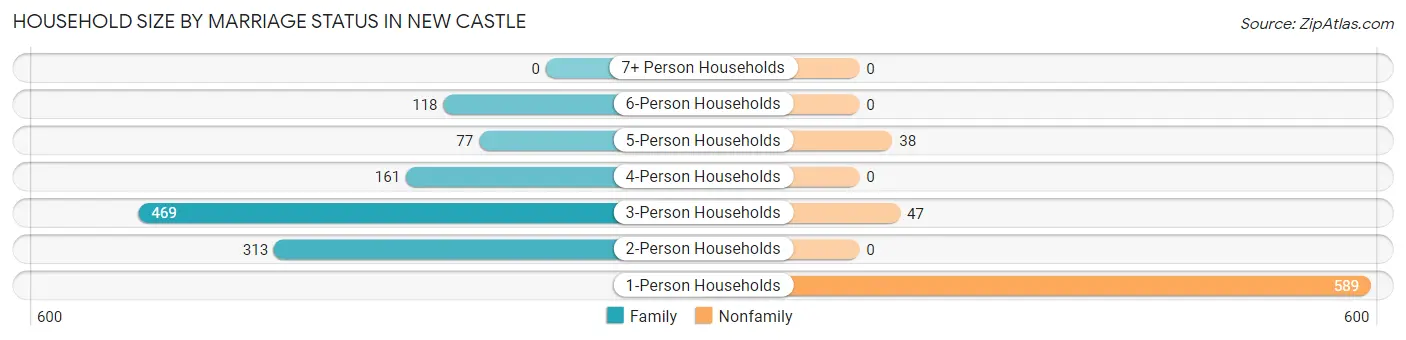
| Household Size | Family Households | Nonfamily Households |
| 1-Person Households | - | 589 (32.5%) |
| 2-Person Households | 313 (17.3%) | 0 (0.0%) |
| 3-Person Households | 469 (25.9%) | 47 (2.6%) |
| 4-Person Households | 161 (8.9%) | 0 (0.0%) |
| 5-Person Households | 77 (4.3%) | 38 (2.1%) |
| 6-Person Households | 118 (6.5%) | 0 (0.0%) |
| 7+ Person Households | 0 (0.0%) | 0 (0.0%) |
| Total | 1,138 (62.8%) | 674 (37.2%) |
Female Fertility in New Castle
Fertility by Age in New Castle
Average fertility rate in New Castle is 38.0 births per 1,000 women. Women in the age bracket of 35 to 50 years have the highest fertility rate with 69.0 births per 1,000 women. Women in the age bracket of 35 to 50 years acount for 100.0% of all women with births.
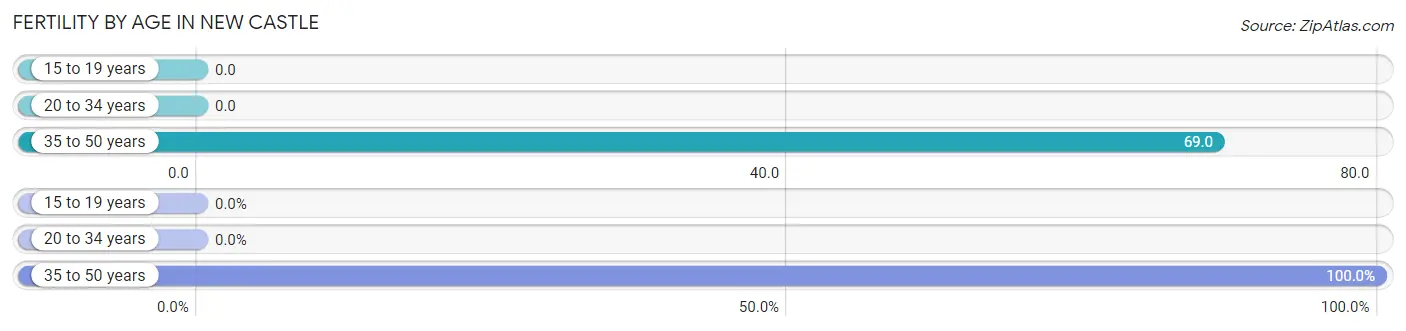
| Age Bracket | Women with Births | Births / 1,000 Women |
| 15 to 19 years | 0 (0.0%) | 0.0 |
| 20 to 34 years | 0 (0.0%) | 0.0 |
| 35 to 50 years | 41 (100.0%) | 69.0 |
| Total | 41 (100.0%) | 38.0 |
Fertility by Age by Marriage Status in New Castle
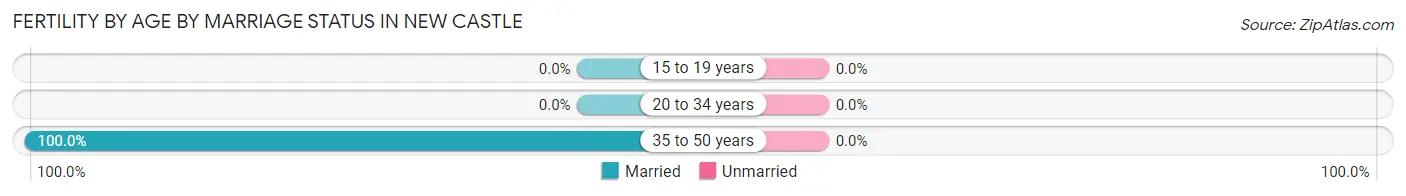
| Age Bracket | Married | Unmarried |
| 15 to 19 years | 0 (0.0%) | 0 (0.0%) |
| 20 to 34 years | 0 (0.0%) | 0 (0.0%) |
| 35 to 50 years | 41 (100.0%) | 0 (0.0%) |
| Total | 41 (100.0%) | 0 (0.0%) |
Fertility by Education in New Castle
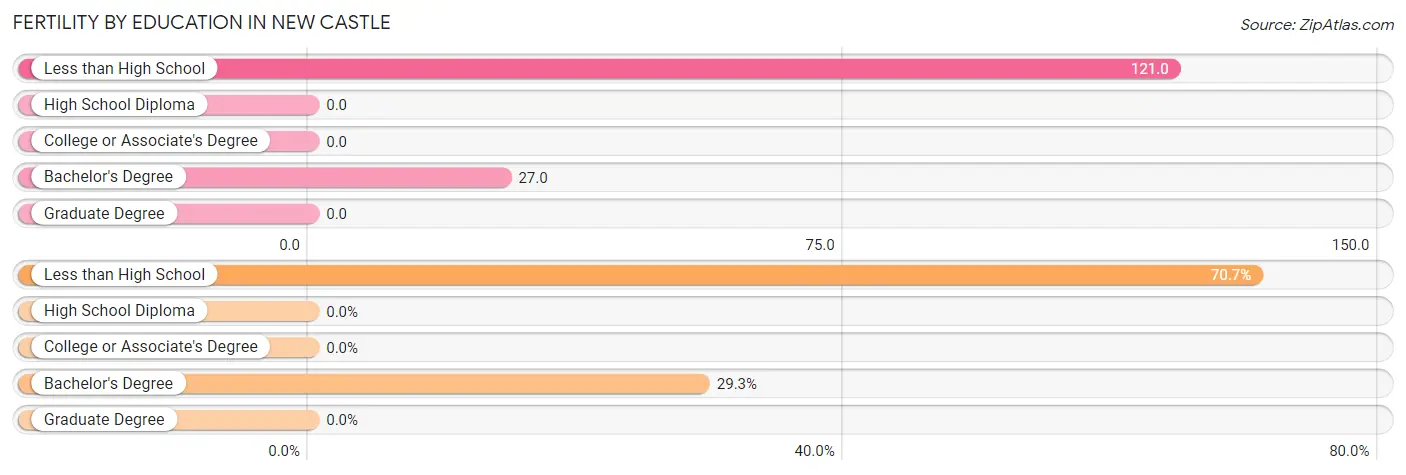
| Educational Attainment | Women with Births | Births / 1,000 Women |
| Less than High School | 29 (70.7%) | 121.0 |
| High School Diploma | 0 (0.0%) | 0.0 |
| College or Associate's Degree | 0 (0.0%) | 0.0 |
| Bachelor's Degree | 12 (29.3%) | 27.0 |
| Graduate Degree | 0 (0.0%) | 0.0 |
| Total | 41 (100.0%) | 38.0 |
Fertility by Education by Marriage Status in New Castle
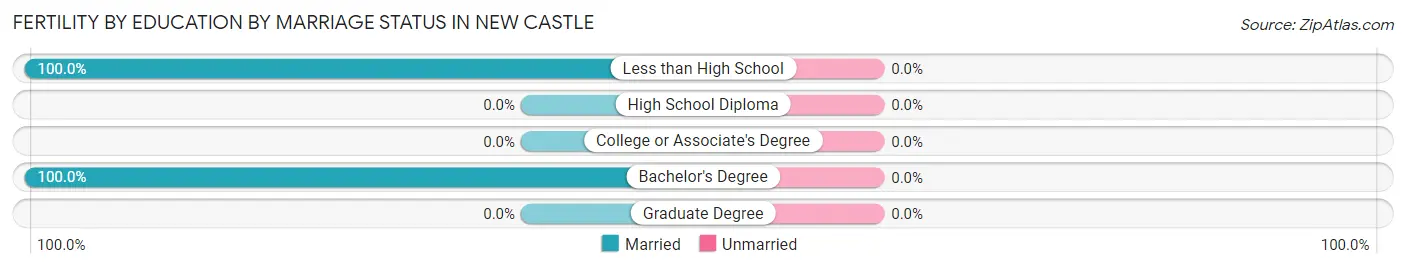
| Educational Attainment | Married | Unmarried |
| Less than High School | 29 (100.0%) | 0 (0.0%) |
| High School Diploma | 0 (0.0%) | 0 (0.0%) |
| College or Associate's Degree | 0 (0.0%) | 0 (0.0%) |
| Bachelor's Degree | 12 (100.0%) | 0 (0.0%) |
| Graduate Degree | 0 (0.0%) | 0 (0.0%) |
| Total | 41 (100.0%) | 0 (0.0%) |
Employment Characteristics in New Castle
Employment by Class of Employer in New Castle
Among the 2,340 employed individuals in New Castle, private company employees (1,367 | 58.4%), local government employees (396 | 16.9%), and not-for-profit organizations (196 | 8.4%) make up the most common classes of employment.
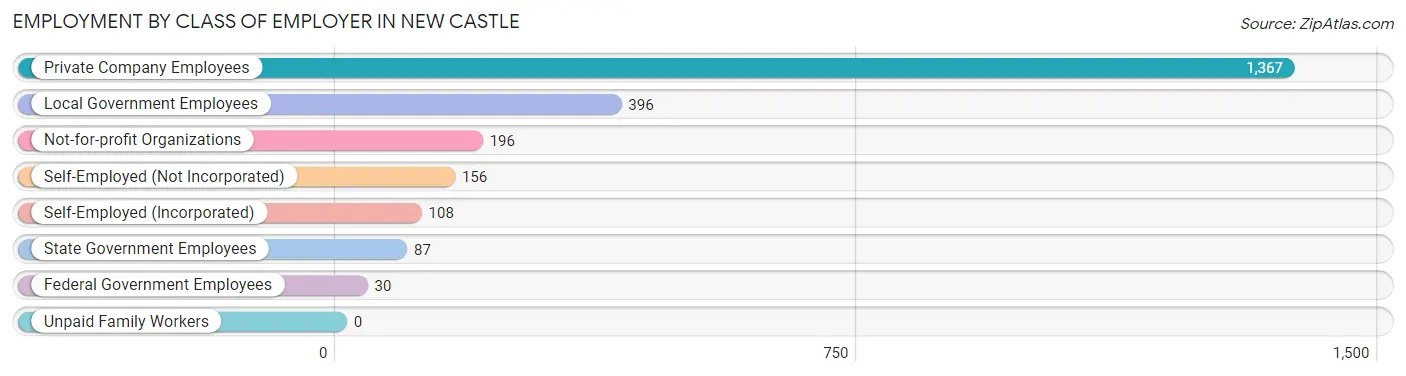
| Employer Class | # Employees | % Employees |
| Private Company Employees | 1,367 | 58.4% |
| Self-Employed (Incorporated) | 108 | 4.6% |
| Self-Employed (Not Incorporated) | 156 | 6.7% |
| Not-for-profit Organizations | 196 | 8.4% |
| Local Government Employees | 396 | 16.9% |
| State Government Employees | 87 | 3.7% |
| Federal Government Employees | 30 | 1.3% |
| Unpaid Family Workers | 0 | 0.0% |
| Total | 2,340 | 100.0% |
Employment Status by Age in New Castle
According to the labor force statistics for New Castle, out of the total population over 16 years of age (3,627), 66.3% or 2,405 individuals are in the labor force, with 2.7% or 65 of them unemployed. The age group with the highest labor force participation rate is 55 to 59 years, with 100.0% or 171 individuals in the labor force. Within the labor force, the 16 to 19 years age range has the highest percentage of unemployed individuals, with 25.0% or 35 of them being unemployed.
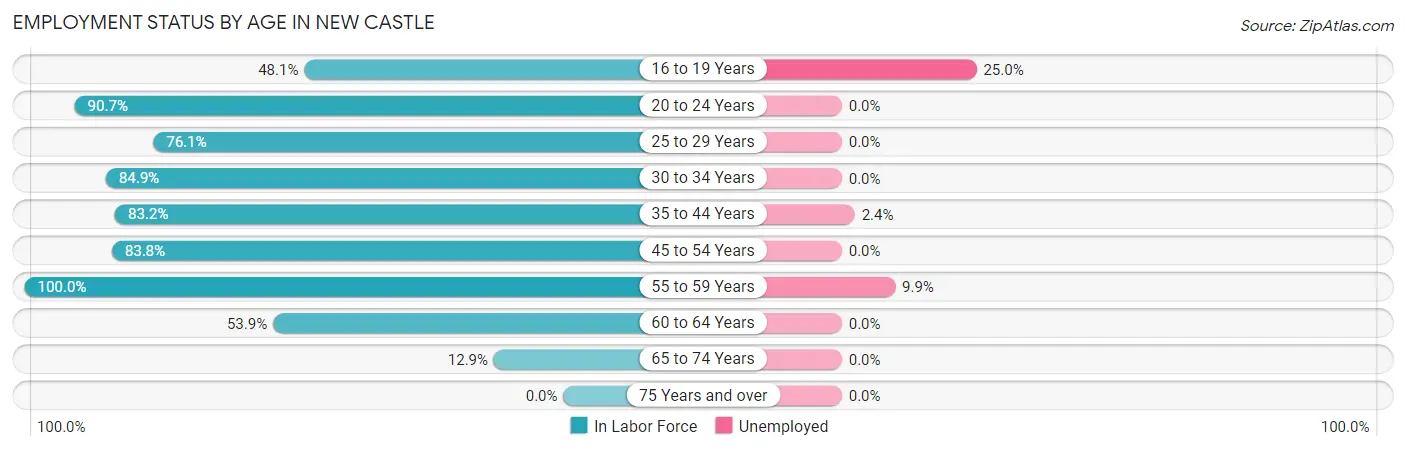
| Age Bracket | In Labor Force | Unemployed |
| 16 to 19 Years | 140 (48.1%) | 35 (25.0%) |
| 20 to 24 Years | 369 (90.7%) | 0 (0.0%) |
| 25 to 29 Years | 181 (76.1%) | 0 (0.0%) |
| 30 to 34 Years | 174 (84.9%) | 0 (0.0%) |
| 35 to 44 Years | 546 (83.2%) | 13 (2.4%) |
| 45 to 54 Years | 630 (83.8%) | 0 (0.0%) |
| 55 to 59 Years | 171 (100.0%) | 17 (9.9%) |
| 60 to 64 Years | 160 (53.9%) | 0 (0.0%) |
| 65 to 74 Years | 34 (12.9%) | 0 (0.0%) |
| 75 Years and over | 0 (0.0%) | 0 (0.0%) |
| Total | 2,405 (66.3%) | 65 (2.7%) |
Employment Status by Educational Attainment in New Castle
According to labor force statistics for New Castle, 80.3% of individuals (1,862) out of the total population between 25 and 64 years of age (2,319) are in the labor force, with 1.6% or 30 of them being unemployed. The group with the highest labor force participation rate are those with the educational attainment of college / associate degree, with 88.0% or 523 individuals in the labor force. Within the labor force, individuals with college / associate degree education have the highest percentage of unemployment, with 3.3% or 17 of them being unemployed.
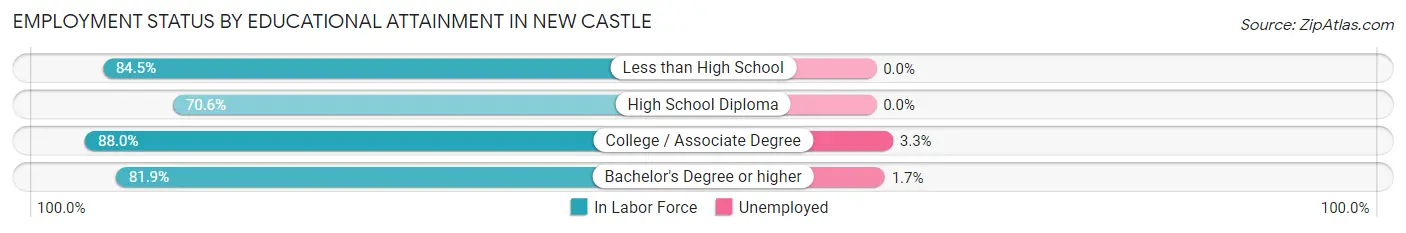
| Educational Attainment | In Labor Force | Unemployed |
| Less than High School | 82 (84.5%) | 0 (0.0%) |
| High School Diploma | 472 (70.6%) | 0 (0.0%) |
| College / Associate Degree | 523 (88.0%) | 20 (3.3%) |
| Bachelor's Degree or higher | 785 (81.9%) | 16 (1.7%) |
| Total | 1,862 (80.3%) | 37 (1.6%) |
Employment Occupations by Sex in New Castle
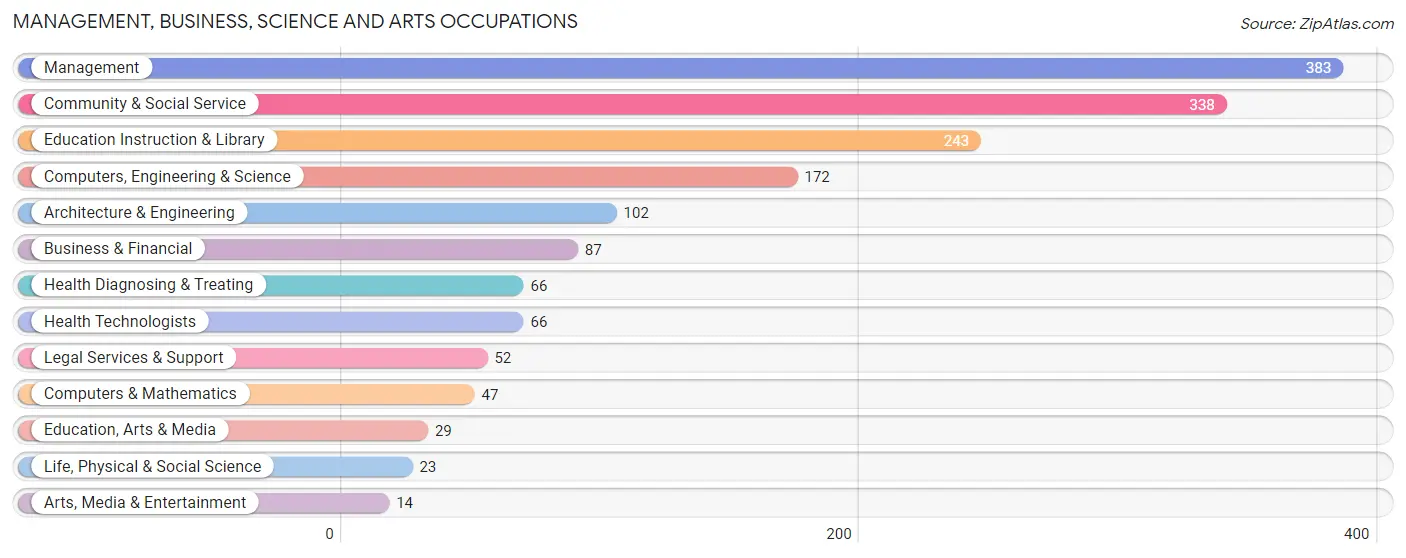
Management, Business, Science and Arts Occupations
The most common Management, Business, Science and Arts occupations in New Castle are Management (383 | 16.4%), Community & Social Service (338 | 14.4%), Education Instruction & Library (243 | 10.4%), Computers, Engineering & Science (172 | 7.3%), and Architecture & Engineering (102 | 4.4%).
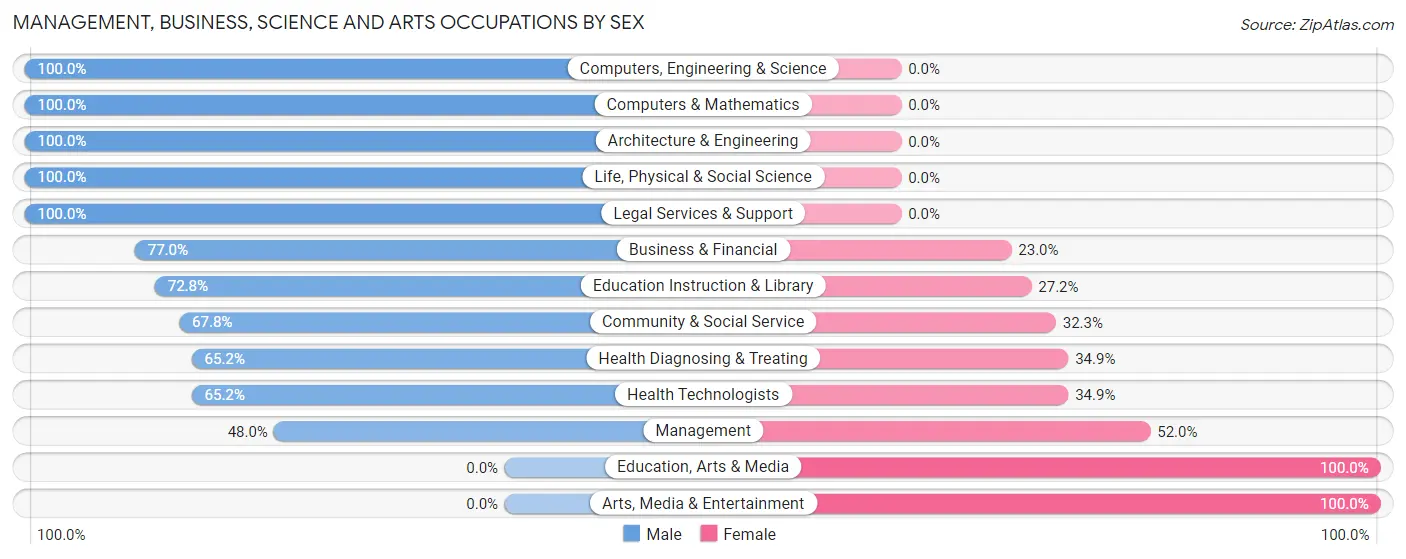
Management, Business, Science and Arts Occupations by Sex
Within the Management, Business, Science and Arts occupations in New Castle, the most male-oriented occupations are Computers, Engineering & Science (100.0%), Computers & Mathematics (100.0%), and Architecture & Engineering (100.0%), while the most female-oriented occupations are Education, Arts & Media (100.0%), Arts, Media & Entertainment (100.0%), and Management (52.0%).
| Occupation | Male | Female |
| Management | 184 (48.0%) | 199 (52.0%) |
| Business & Financial | 67 (77.0%) | 20 (23.0%) |
| Computers, Engineering & Science | 172 (100.0%) | 0 (0.0%) |
| Computers & Mathematics | 47 (100.0%) | 0 (0.0%) |
| Architecture & Engineering | 102 (100.0%) | 0 (0.0%) |
| Life, Physical & Social Science | 23 (100.0%) | 0 (0.0%) |
| Community & Social Service | 229 (67.7%) | 109 (32.3%) |
| Education, Arts & Media | 0 (0.0%) | 29 (100.0%) |
| Legal Services & Support | 52 (100.0%) | 0 (0.0%) |
| Education Instruction & Library | 177 (72.8%) | 66 (27.2%) |
| Arts, Media & Entertainment | 0 (0.0%) | 14 (100.0%) |
| Health Diagnosing & Treating | 43 (65.1%) | 23 (34.8%) |
| Health Technologists | 43 (65.1%) | 23 (34.8%) |
| Total (Category) | 695 (66.4%) | 351 (33.6%) |
| Total (Overall) | 1,466 (62.6%) | 874 (37.3%) |
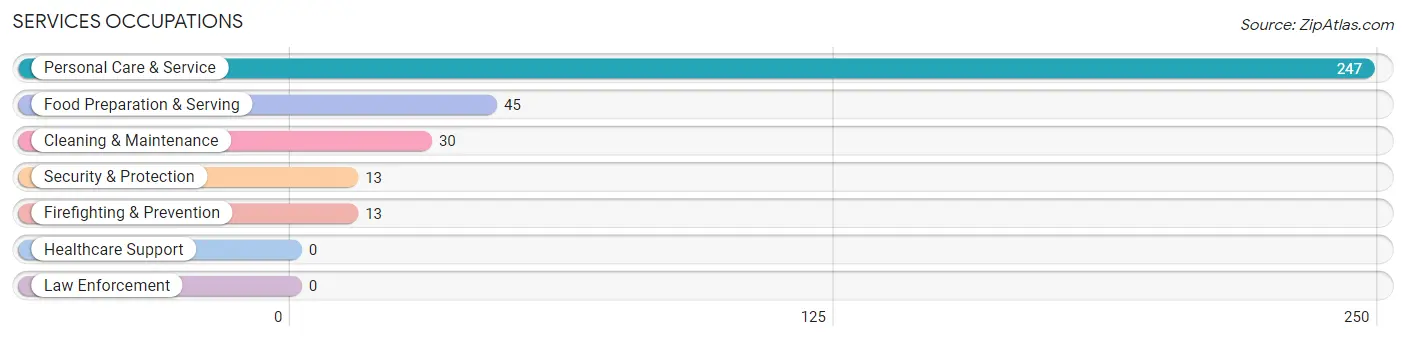
Services Occupations
The most common Services occupations in New Castle are Personal Care & Service (247 | 10.6%), Food Preparation & Serving (45 | 1.9%), Cleaning & Maintenance (30 | 1.3%), Security & Protection (13 | 0.6%), and Firefighting & Prevention (13 | 0.6%).
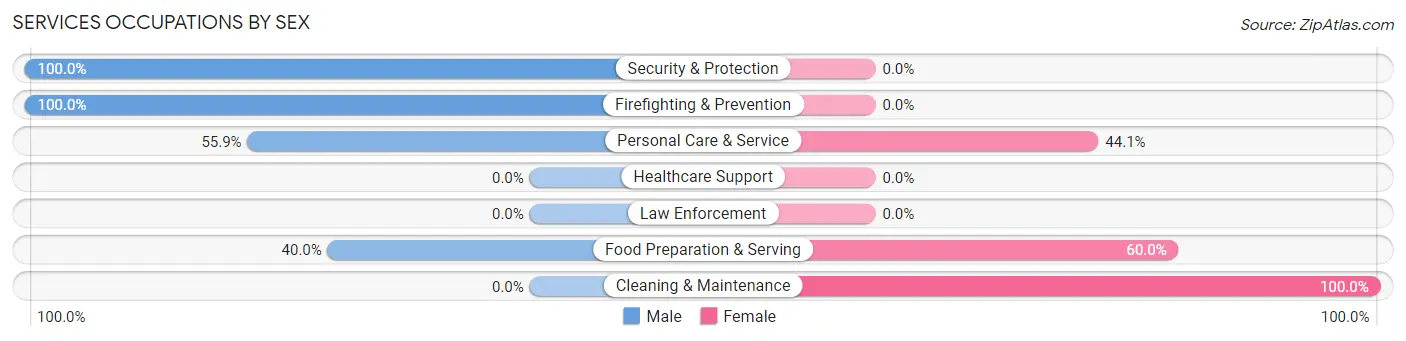
Services Occupations by Sex
Within the Services occupations in New Castle, the most male-oriented occupations are Security & Protection (100.0%), Firefighting & Prevention (100.0%), and Personal Care & Service (55.9%), while the most female-oriented occupations are Cleaning & Maintenance (100.0%), Food Preparation & Serving (60.0%), and Personal Care & Service (44.1%).
| Occupation | Male | Female |
| Healthcare Support | 0 (0.0%) | 0 (0.0%) |
| Security & Protection | 13 (100.0%) | 0 (0.0%) |
| Firefighting & Prevention | 13 (100.0%) | 0 (0.0%) |
| Law Enforcement | 0 (0.0%) | 0 (0.0%) |
| Food Preparation & Serving | 18 (40.0%) | 27 (60.0%) |
| Cleaning & Maintenance | 0 (0.0%) | 30 (100.0%) |
| Personal Care & Service | 138 (55.9%) | 109 (44.1%) |
| Total (Category) | 169 (50.4%) | 166 (49.5%) |
| Total (Overall) | 1,466 (62.6%) | 874 (37.3%) |
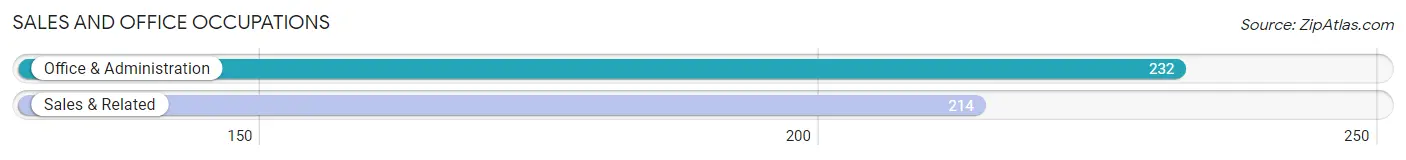
Sales and Office Occupations
The most common Sales and Office occupations in New Castle are Office & Administration (232 | 9.9%), and Sales & Related (214 | 9.1%).
Sales and Office Occupations by Sex
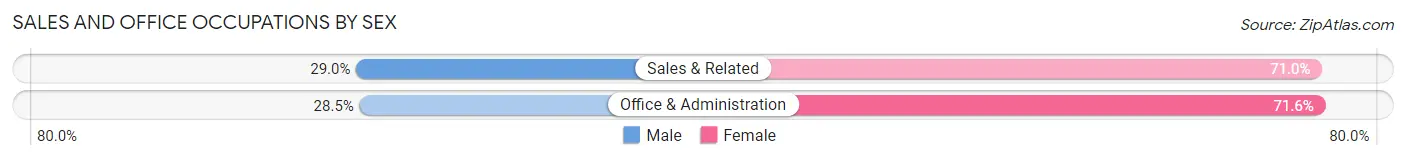
| Occupation | Male | Female |
| Sales & Related | 62 (29.0%) | 152 (71.0%) |
| Office & Administration | 66 (28.4%) | 166 (71.6%) |
| Total (Category) | 128 (28.7%) | 318 (71.3%) |
| Total (Overall) | 1,466 (62.6%) | 874 (37.3%) |
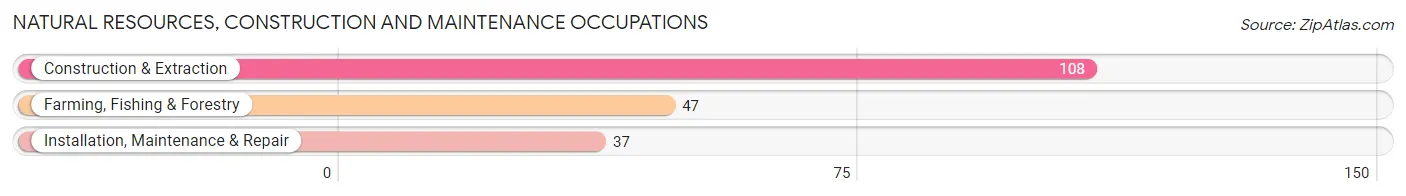
Natural Resources, Construction and Maintenance Occupations
The most common Natural Resources, Construction and Maintenance occupations in New Castle are Construction & Extraction (108 | 4.6%), Farming, Fishing & Forestry (47 | 2.0%), and Installation, Maintenance & Repair (37 | 1.6%).
Natural Resources, Construction and Maintenance Occupations by Sex
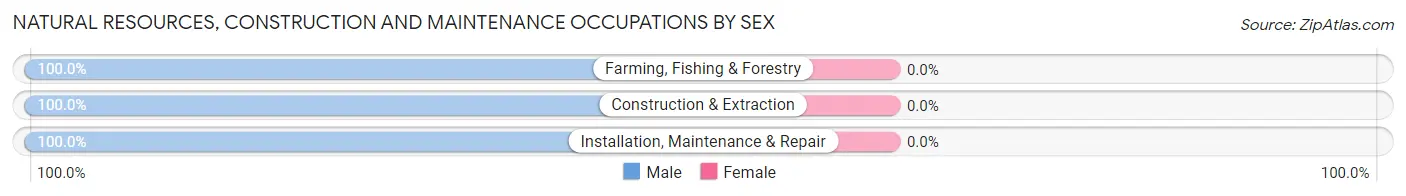
| Occupation | Male | Female |
| Farming, Fishing & Forestry | 47 (100.0%) | 0 (0.0%) |
| Construction & Extraction | 108 (100.0%) | 0 (0.0%) |
| Installation, Maintenance & Repair | 37 (100.0%) | 0 (0.0%) |
| Total (Category) | 192 (100.0%) | 0 (0.0%) |
| Total (Overall) | 1,466 (62.6%) | 874 (37.3%) |
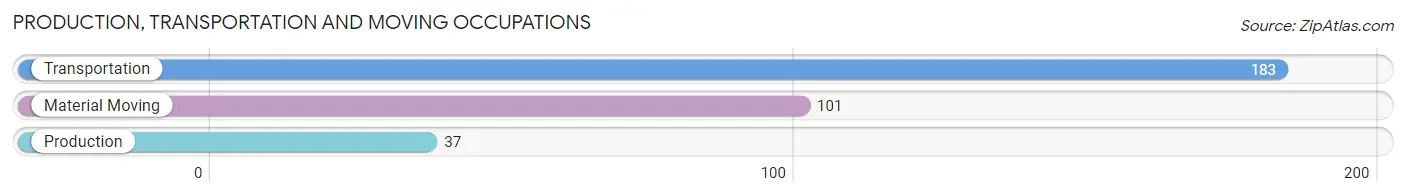
Production, Transportation and Moving Occupations
The most common Production, Transportation and Moving occupations in New Castle are Transportation (183 | 7.8%), Material Moving (101 | 4.3%), and Production (37 | 1.6%).
Production, Transportation and Moving Occupations by Sex
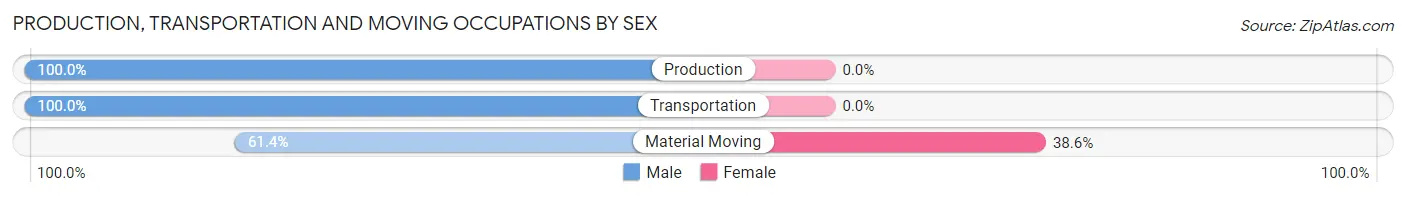
| Occupation | Male | Female |
| Production | 37 (100.0%) | 0 (0.0%) |
| Transportation | 183 (100.0%) | 0 (0.0%) |
| Material Moving | 62 (61.4%) | 39 (38.6%) |
| Total (Category) | 282 (87.8%) | 39 (12.1%) |
| Total (Overall) | 1,466 (62.6%) | 874 (37.3%) |
Employment Industries by Sex in New Castle
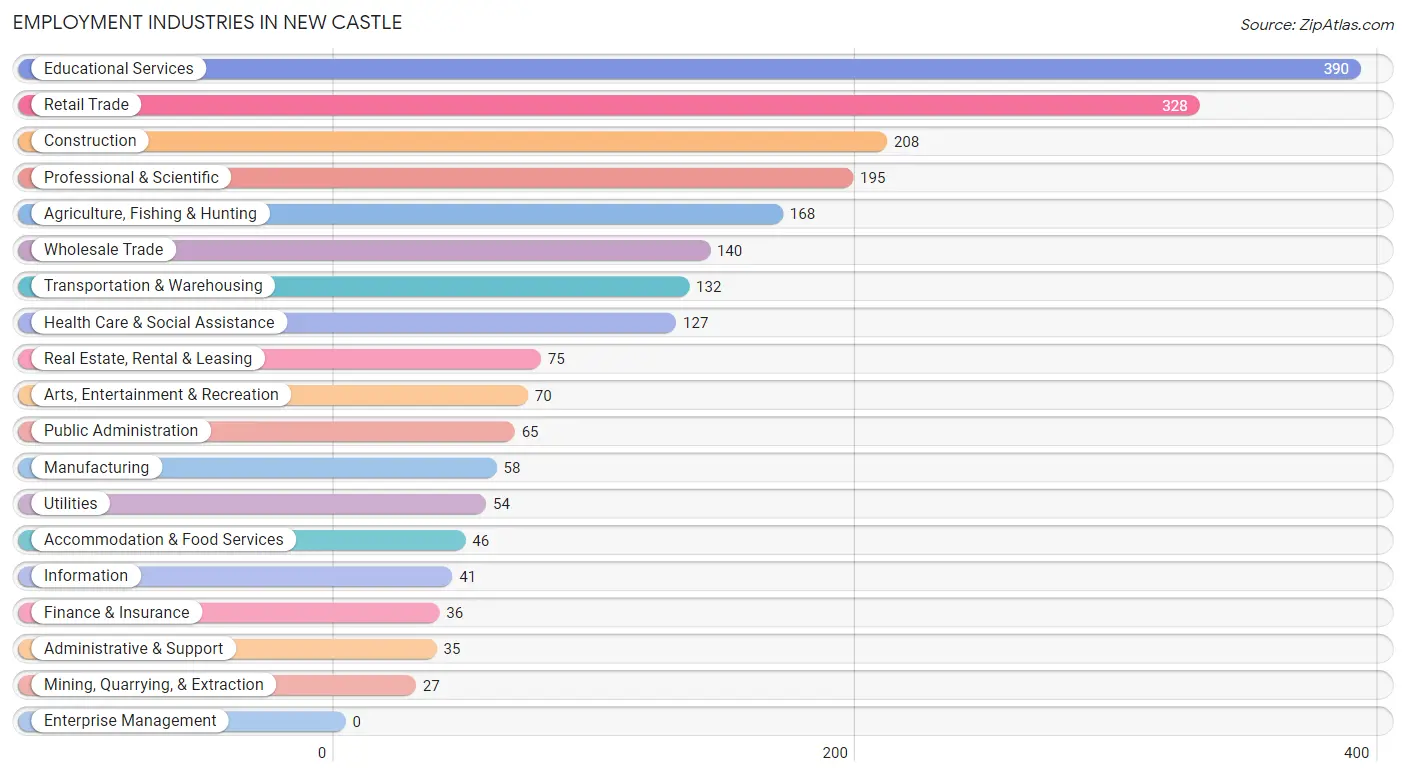
Employment Industries in New Castle
The major employment industries in New Castle include Educational Services (390 | 16.7%), Retail Trade (328 | 14.0%), Construction (208 | 8.9%), Professional & Scientific (195 | 8.3%), and Agriculture, Fishing & Hunting (168 | 7.2%).
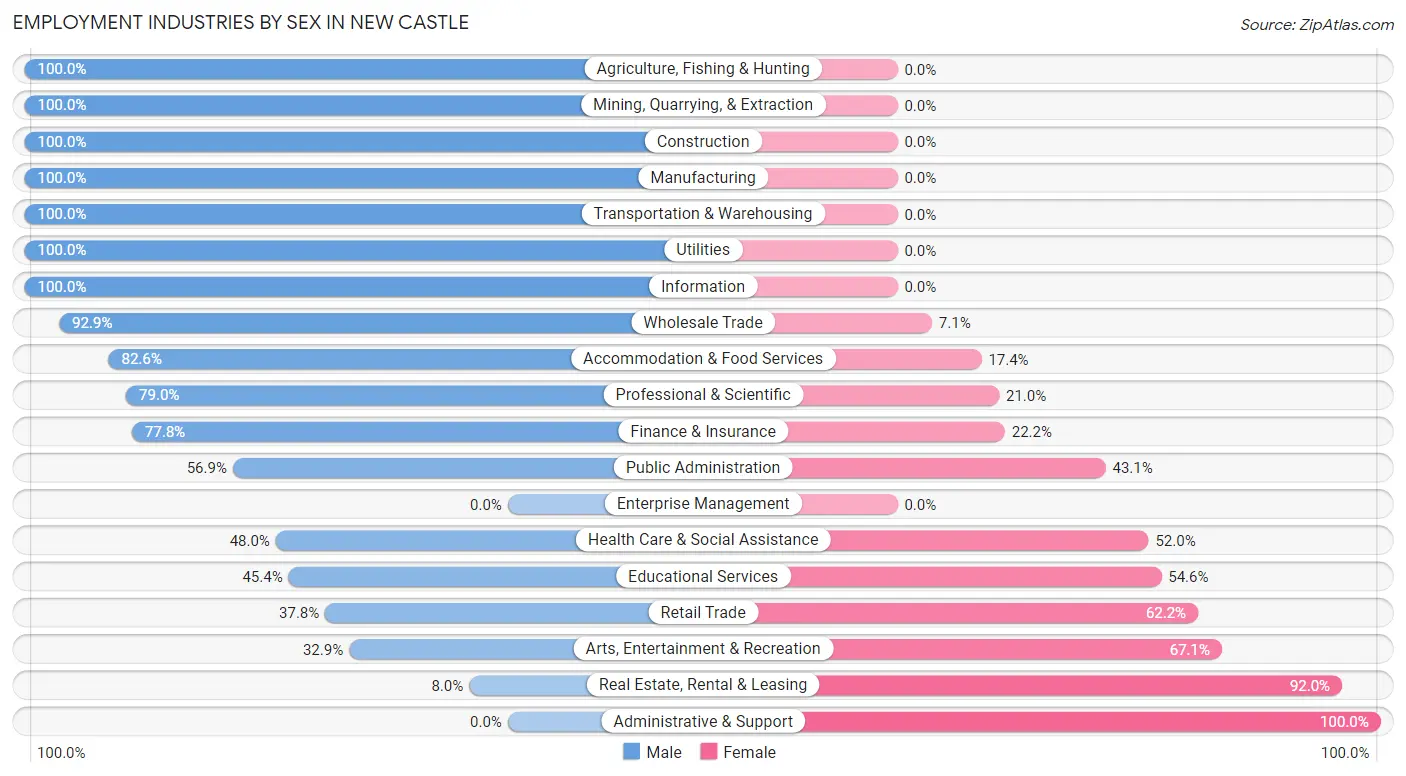
Employment Industries by Sex in New Castle
The New Castle industries that see more men than women are Agriculture, Fishing & Hunting (100.0%), Mining, Quarrying, & Extraction (100.0%), and Construction (100.0%), whereas the industries that tend to have a higher number of women are Administrative & Support (100.0%), Real Estate, Rental & Leasing (92.0%), and Arts, Entertainment & Recreation (67.1%).
| Industry | Male | Female |
| Agriculture, Fishing & Hunting | 168 (100.0%) | 0 (0.0%) |
| Mining, Quarrying, & Extraction | 27 (100.0%) | 0 (0.0%) |
| Construction | 208 (100.0%) | 0 (0.0%) |
| Manufacturing | 58 (100.0%) | 0 (0.0%) |
| Wholesale Trade | 130 (92.9%) | 10 (7.1%) |
| Retail Trade | 124 (37.8%) | 204 (62.2%) |
| Transportation & Warehousing | 132 (100.0%) | 0 (0.0%) |
| Utilities | 54 (100.0%) | 0 (0.0%) |
| Information | 41 (100.0%) | 0 (0.0%) |
| Finance & Insurance | 28 (77.8%) | 8 (22.2%) |
| Real Estate, Rental & Leasing | 6 (8.0%) | 69 (92.0%) |
| Professional & Scientific | 154 (79.0%) | 41 (21.0%) |
| Enterprise Management | 0 (0.0%) | 0 (0.0%) |
| Administrative & Support | 0 (0.0%) | 35 (100.0%) |
| Educational Services | 177 (45.4%) | 213 (54.6%) |
| Health Care & Social Assistance | 61 (48.0%) | 66 (52.0%) |
| Arts, Entertainment & Recreation | 23 (32.9%) | 47 (67.1%) |
| Accommodation & Food Services | 38 (82.6%) | 8 (17.4%) |
| Public Administration | 37 (56.9%) | 28 (43.1%) |
| Total | 1,466 (62.6%) | 874 (37.3%) |
Education in New Castle
School Enrollment in New Castle
The most common levels of schooling among the 1,558 students in New Castle are middle school (318 | 20.4%), nursery / preschool (294 | 18.9%), and high school (287 | 18.4%).
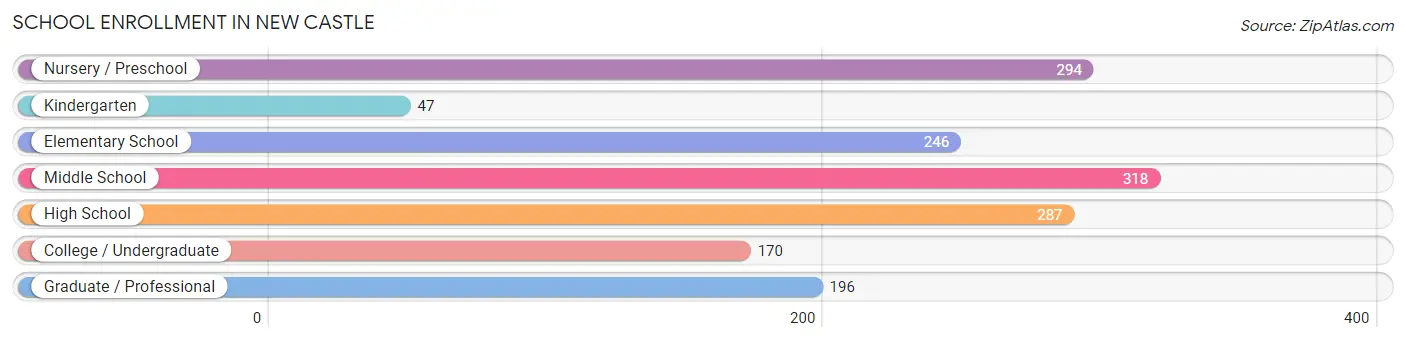
| School Level | # Students | % Students |
| Nursery / Preschool | 294 | 18.9% |
| Kindergarten | 47 | 3.0% |
| Elementary School | 246 | 15.8% |
| Middle School | 318 | 20.4% |
| High School | 287 | 18.4% |
| College / Undergraduate | 170 | 10.9% |
| Graduate / Professional | 196 | 12.6% |
| Total | 1,558 | 100.0% |
School Enrollment by Age by Funding Source in New Castle
Out of a total of 1,558 students who are enrolled in schools in New Castle, 279 (17.9%) attend a private institution, while the remaining 1,279 (82.1%) are enrolled in public schools. The age group of 25 to 34 year olds has the highest likelihood of being enrolled in private schools, with 49 (100.0% in the age bracket) enrolled. Conversely, the age group of 15 to 17 year olds has the lowest likelihood of being enrolled in a private school, with 248 (100.0% in the age bracket) attending a public institution.
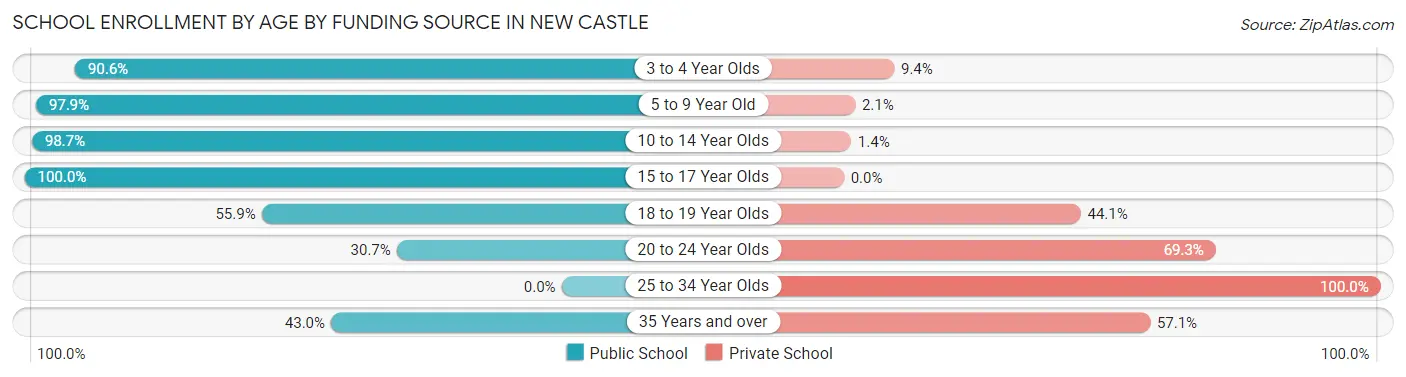
| Age Bracket | Public School | Private School |
| 3 to 4 Year Olds | 261 (90.6%) | 27 (9.4%) |
| 5 to 9 Year Old | 279 (97.9%) | 6 (2.1%) |
| 10 to 14 Year Olds | 366 (98.7%) | 5 (1.3%) |
| 15 to 17 Year Olds | 248 (100.0%) | 0 (0.0%) |
| 18 to 19 Year Olds | 19 (55.9%) | 15 (44.1%) |
| 20 to 24 Year Olds | 39 (30.7%) | 88 (69.3%) |
| 25 to 34 Year Olds | 0 (0.0%) | 49 (100.0%) |
| 35 Years and over | 67 (42.9%) | 89 (57.1%) |
| Total | 1,279 (82.1%) | 279 (17.9%) |
Educational Attainment by Field of Study in New Castle
Education (333 | 26.3%), business (258 | 20.4%), bio, nature & agricultural (136 | 10.7%), social sciences (117 | 9.2%), and engineering (86 | 6.8%) are the most common fields of study among 1,267 individuals in New Castle who have obtained a bachelor's degree or higher.
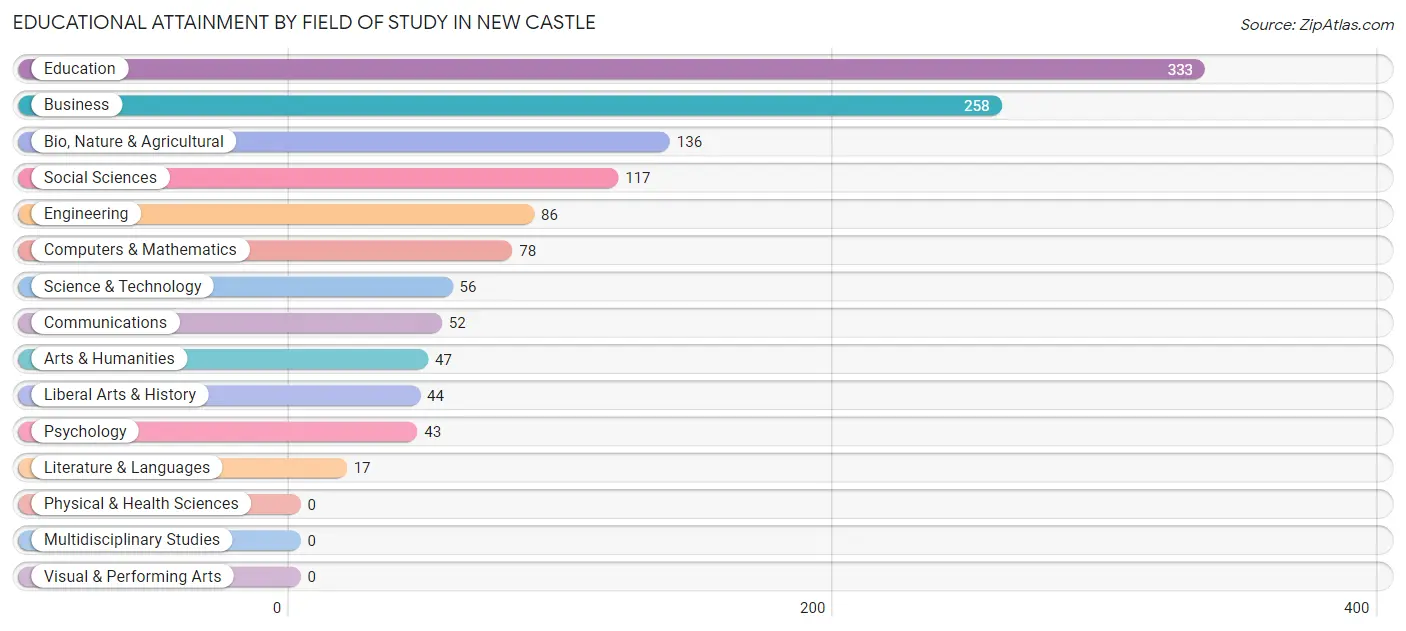
| Field of Study | # Graduates | % Graduates |
| Computers & Mathematics | 78 | 6.2% |
| Bio, Nature & Agricultural | 136 | 10.7% |
| Physical & Health Sciences | 0 | 0.0% |
| Psychology | 43 | 3.4% |
| Social Sciences | 117 | 9.2% |
| Engineering | 86 | 6.8% |
| Multidisciplinary Studies | 0 | 0.0% |
| Science & Technology | 56 | 4.4% |
| Business | 258 | 20.4% |
| Education | 333 | 26.3% |
| Literature & Languages | 17 | 1.3% |
| Liberal Arts & History | 44 | 3.5% |
| Visual & Performing Arts | 0 | 0.0% |
| Communications | 52 | 4.1% |
| Arts & Humanities | 47 | 3.7% |
| Total | 1,267 | 100.0% |
Transportation & Commute in New Castle
Vehicle Availability by Sex in New Castle
The most prevalent vehicle ownership categories in New Castle are males with 2 vehicles (571, accounting for 39.0%) and females with 2 vehicles (305, making up 65.3%).
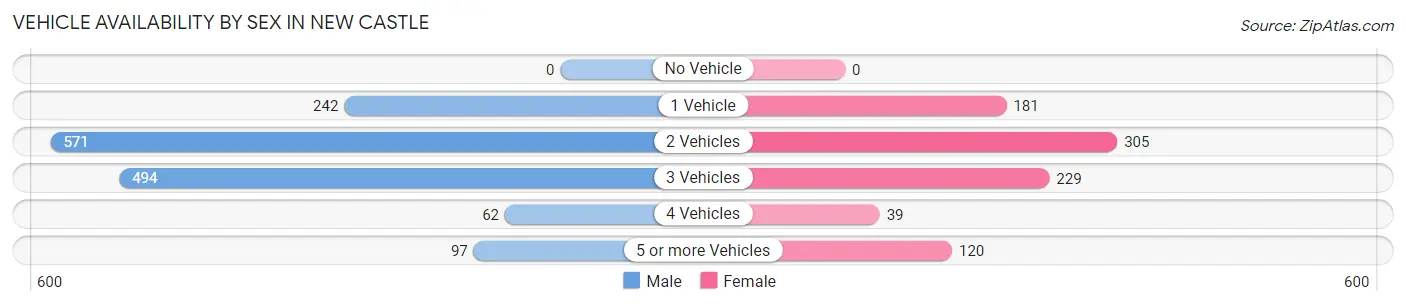
| Vehicles Available | Male | Female |
| No Vehicle | 0 (0.0%) | 0 (0.0%) |
| 1 Vehicle | 242 (16.5%) | 181 (20.7%) |
| 2 Vehicles | 571 (39.0%) | 305 (34.9%) |
| 3 Vehicles | 494 (33.7%) | 229 (26.2%) |
| 4 Vehicles | 62 (4.2%) | 39 (4.5%) |
| 5 or more Vehicles | 97 (6.6%) | 120 (13.7%) |
| Total | 1,466 (100.0%) | 874 (100.0%) |
Commute Time in New Castle
The most frequently occuring commute durations in New Castle are 20 to 24 minutes (759 commuters, 34.6%), 10 to 14 minutes (275 commuters, 12.5%), and 15 to 19 minutes (264 commuters, 12.0%).
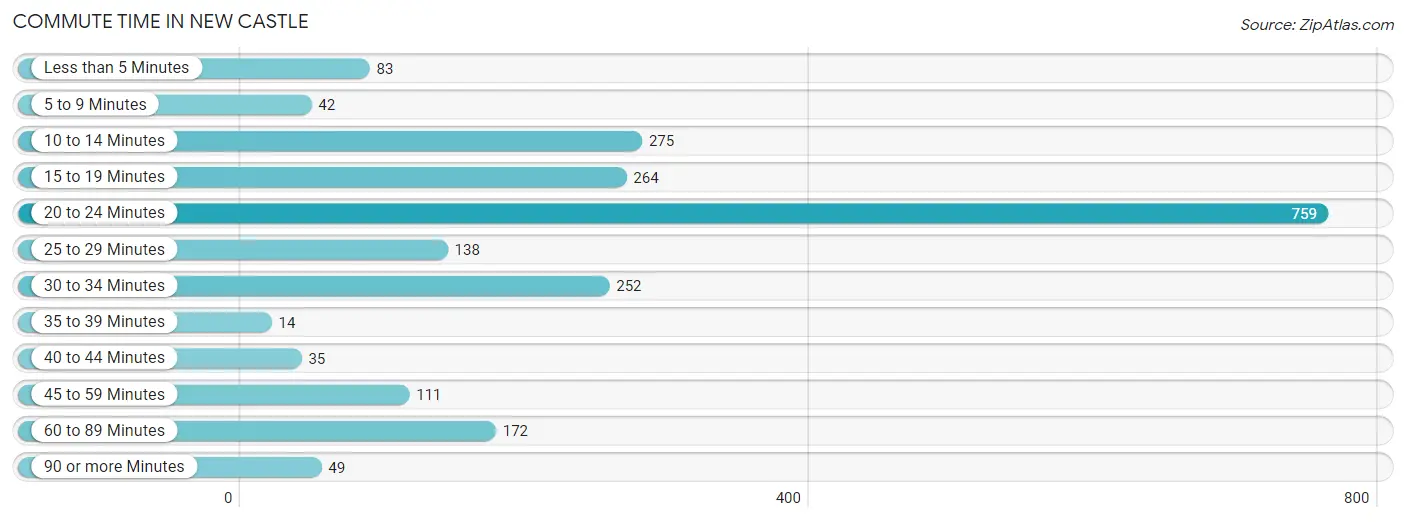
| Commute Time | # Commuters | % Commuters |
| Less than 5 Minutes | 83 | 3.8% |
| 5 to 9 Minutes | 42 | 1.9% |
| 10 to 14 Minutes | 275 | 12.5% |
| 15 to 19 Minutes | 264 | 12.0% |
| 20 to 24 Minutes | 759 | 34.6% |
| 25 to 29 Minutes | 138 | 6.3% |
| 30 to 34 Minutes | 252 | 11.5% |
| 35 to 39 Minutes | 14 | 0.6% |
| 40 to 44 Minutes | 35 | 1.6% |
| 45 to 59 Minutes | 111 | 5.1% |
| 60 to 89 Minutes | 172 | 7.8% |
| 90 or more Minutes | 49 | 2.2% |
Commute Time by Sex in New Castle
The most common commute times in New Castle are 20 to 24 minutes (401 commuters, 29.2%) for males and 20 to 24 minutes (358 commuters, 43.5%) for females.
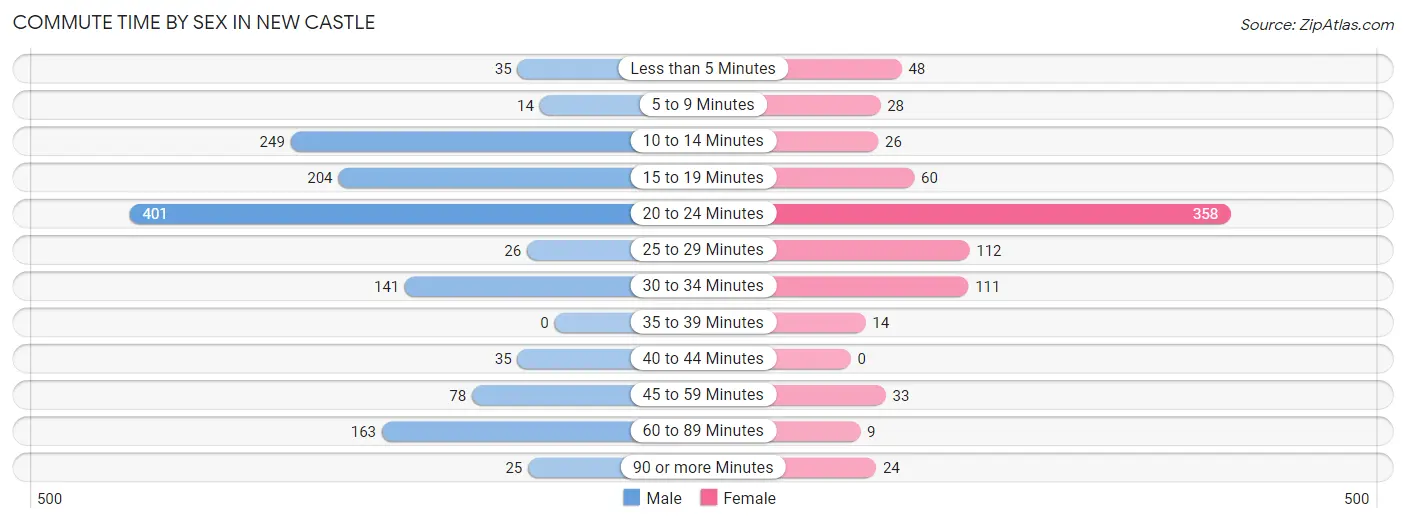
| Commute Time | Male | Female |
| Less than 5 Minutes | 35 (2.5%) | 48 (5.8%) |
| 5 to 9 Minutes | 14 (1.0%) | 28 (3.4%) |
| 10 to 14 Minutes | 249 (18.2%) | 26 (3.2%) |
| 15 to 19 Minutes | 204 (14.9%) | 60 (7.3%) |
| 20 to 24 Minutes | 401 (29.2%) | 358 (43.5%) |
| 25 to 29 Minutes | 26 (1.9%) | 112 (13.6%) |
| 30 to 34 Minutes | 141 (10.3%) | 111 (13.5%) |
| 35 to 39 Minutes | 0 (0.0%) | 14 (1.7%) |
| 40 to 44 Minutes | 35 (2.5%) | 0 (0.0%) |
| 45 to 59 Minutes | 78 (5.7%) | 33 (4.0%) |
| 60 to 89 Minutes | 163 (11.9%) | 9 (1.1%) |
| 90 or more Minutes | 25 (1.8%) | 24 (2.9%) |
Time of Departure to Work by Sex in New Castle
The most frequent times of departure to work in New Castle are 7:30 AM to 7:59 AM (222, 16.2%) for males and 7:00 AM to 7:29 AM (282, 34.3%) for females.
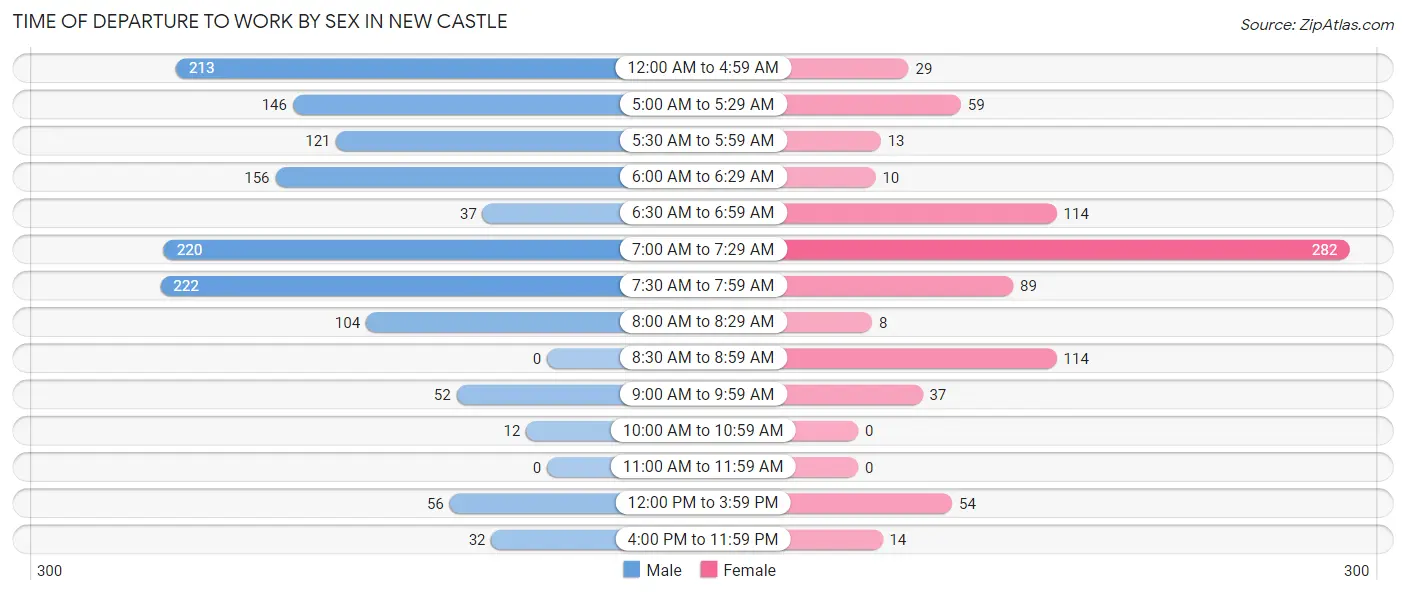
| Time of Departure | Male | Female |
| 12:00 AM to 4:59 AM | 213 (15.5%) | 29 (3.5%) |
| 5:00 AM to 5:29 AM | 146 (10.6%) | 59 (7.2%) |
| 5:30 AM to 5:59 AM | 121 (8.8%) | 13 (1.6%) |
| 6:00 AM to 6:29 AM | 156 (11.4%) | 10 (1.2%) |
| 6:30 AM to 6:59 AM | 37 (2.7%) | 114 (13.9%) |
| 7:00 AM to 7:29 AM | 220 (16.1%) | 282 (34.3%) |
| 7:30 AM to 7:59 AM | 222 (16.2%) | 89 (10.8%) |
| 8:00 AM to 8:29 AM | 104 (7.6%) | 8 (1.0%) |
| 8:30 AM to 8:59 AM | 0 (0.0%) | 114 (13.9%) |
| 9:00 AM to 9:59 AM | 52 (3.8%) | 37 (4.5%) |
| 10:00 AM to 10:59 AM | 12 (0.9%) | 0 (0.0%) |
| 11:00 AM to 11:59 AM | 0 (0.0%) | 0 (0.0%) |
| 12:00 PM to 3:59 PM | 56 (4.1%) | 54 (6.6%) |
| 4:00 PM to 11:59 PM | 32 (2.3%) | 14 (1.7%) |
| Total | 1,371 (100.0%) | 823 (100.0%) |
Housing Occupancy in New Castle
Occupancy by Ownership in New Castle
Of the total 1,812 dwellings in New Castle, owner-occupied units account for 1,277 (70.5%), while renter-occupied units make up 535 (29.5%).
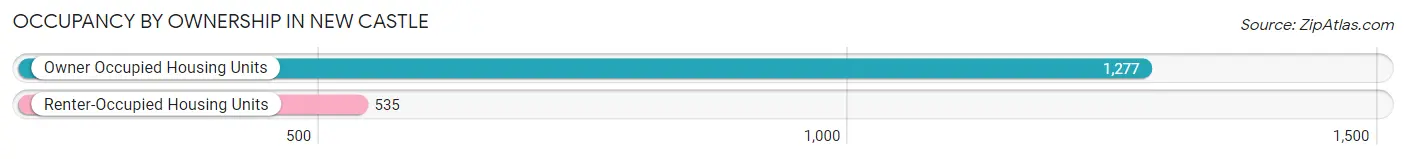
| Occupancy | # Housing Units | % Housing Units |
| Owner Occupied Housing Units | 1,277 | 70.5% |
| Renter-Occupied Housing Units | 535 | 29.5% |
| Total Occupied Housing Units | 1,812 | 100.0% |
Occupancy by Household Size in New Castle
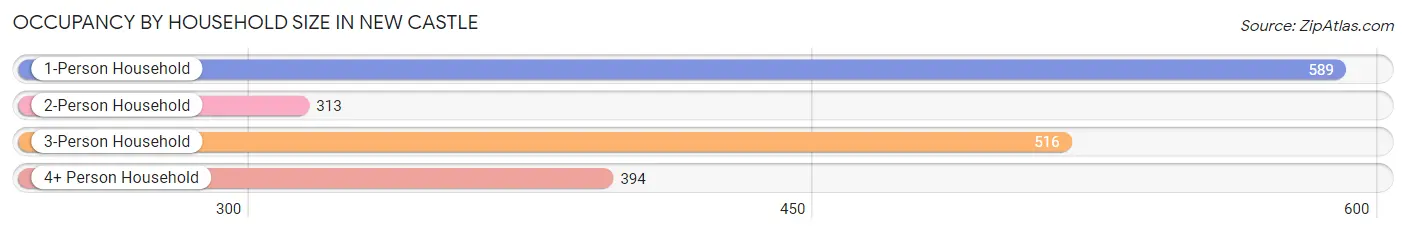
| Household Size | # Housing Units | % Housing Units |
| 1-Person Household | 589 | 32.5% |
| 2-Person Household | 313 | 17.3% |
| 3-Person Household | 516 | 28.5% |
| 4+ Person Household | 394 | 21.7% |
| Total Housing Units | 1,812 | 100.0% |
Occupancy by Ownership by Household Size in New Castle
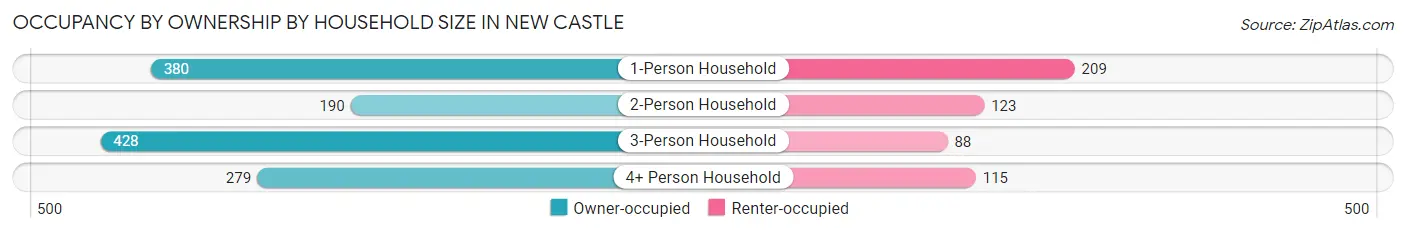
| Household Size | Owner-occupied | Renter-occupied |
| 1-Person Household | 380 (64.5%) | 209 (35.5%) |
| 2-Person Household | 190 (60.7%) | 123 (39.3%) |
| 3-Person Household | 428 (83.0%) | 88 (17.1%) |
| 4+ Person Household | 279 (70.8%) | 115 (29.2%) |
| Total Housing Units | 1,277 (70.5%) | 535 (29.5%) |
Occupancy by Educational Attainment in New Castle
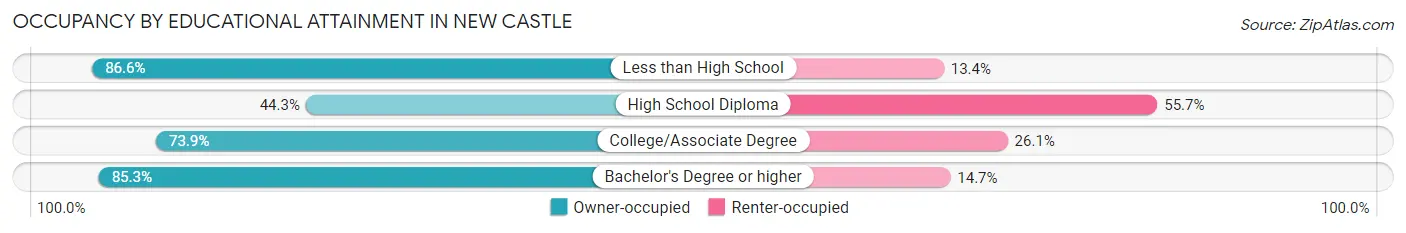
| Household Size | Owner-occupied | Renter-occupied |
| Less than High School | 71 (86.6%) | 11 (13.4%) |
| High School Diploma | 239 (44.3%) | 301 (55.7%) |
| College/Associate Degree | 312 (73.9%) | 110 (26.1%) |
| Bachelor's Degree or higher | 655 (85.3%) | 113 (14.7%) |
Occupancy by Age of Householder in New Castle
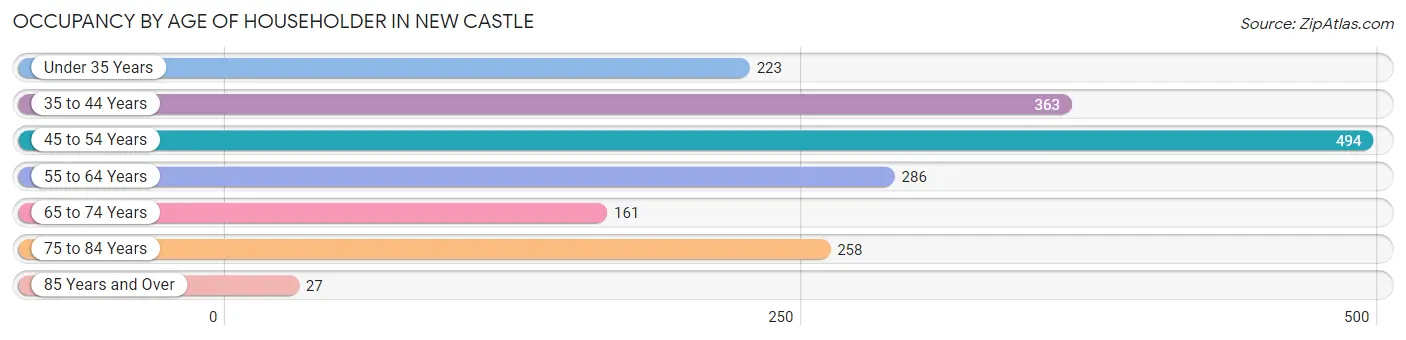
| Age Bracket | # Households | % Households |
| Under 35 Years | 223 | 12.3% |
| 35 to 44 Years | 363 | 20.0% |
| 45 to 54 Years | 494 | 27.3% |
| 55 to 64 Years | 286 | 15.8% |
| 65 to 74 Years | 161 | 8.9% |
| 75 to 84 Years | 258 | 14.2% |
| 85 Years and Over | 27 | 1.5% |
| Total | 1,812 | 100.0% |
Housing Finances in New Castle
Median Income by Occupancy in New Castle
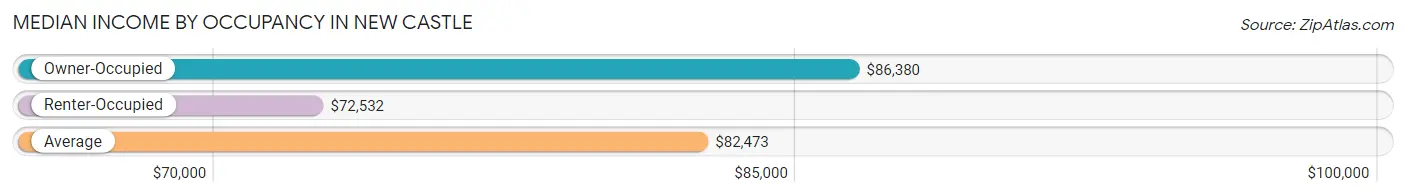
| Occupancy Type | # Households | Median Income |
| Owner-Occupied | 1,277 (70.5%) | $86,380 |
| Renter-Occupied | 535 (29.5%) | $72,532 |
| Average | 1,812 (100.0%) | $82,473 |
Occupancy by Householder Income Bracket in New Castle
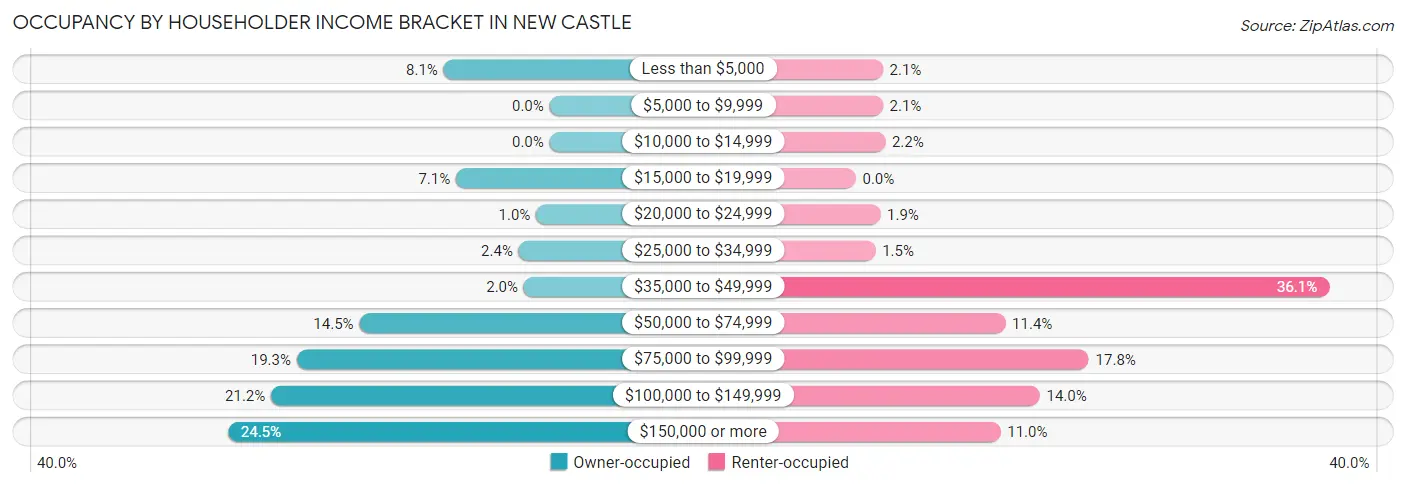
| Income Bracket | Owner-occupied | Renter-occupied |
| Less than $5,000 | 103 (8.1%) | 11 (2.1%) |
| $5,000 to $9,999 | 0 (0.0%) | 11 (2.1%) |
| $10,000 to $14,999 | 0 (0.0%) | 12 (2.2%) |
| $15,000 to $19,999 | 91 (7.1%) | 0 (0.0%) |
| $20,000 to $24,999 | 13 (1.0%) | 10 (1.9%) |
| $25,000 to $34,999 | 30 (2.4%) | 8 (1.5%) |
| $35,000 to $49,999 | 25 (2.0%) | 193 (36.1%) |
| $50,000 to $74,999 | 185 (14.5%) | 61 (11.4%) |
| $75,000 to $99,999 | 246 (19.3%) | 95 (17.8%) |
| $100,000 to $149,999 | 271 (21.2%) | 75 (14.0%) |
| $150,000 or more | 313 (24.5%) | 59 (11.0%) |
| Total | 1,277 (100.0%) | 535 (100.0%) |
Monthly Housing Cost Tiers in New Castle
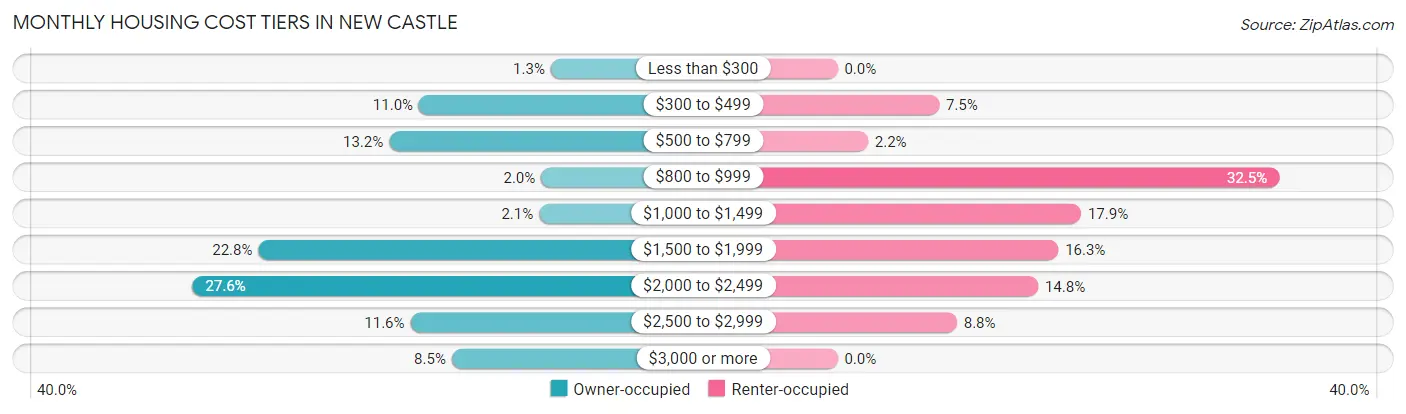
| Monthly Cost | Owner-occupied | Renter-occupied |
| Less than $300 | 16 (1.3%) | 0 (0.0%) |
| $300 to $499 | 140 (11.0%) | 40 (7.5%) |
| $500 to $799 | 168 (13.2%) | 12 (2.2%) |
| $800 to $999 | 25 (2.0%) | 174 (32.5%) |
| $1,000 to $1,499 | 27 (2.1%) | 96 (17.9%) |
| $1,500 to $1,999 | 291 (22.8%) | 87 (16.3%) |
| $2,000 to $2,499 | 353 (27.6%) | 79 (14.8%) |
| $2,500 to $2,999 | 148 (11.6%) | 47 (8.8%) |
| $3,000 or more | 109 (8.5%) | 0 (0.0%) |
| Total | 1,277 (100.0%) | 535 (100.0%) |
Physical Housing Characteristics in New Castle
Housing Structures in New Castle
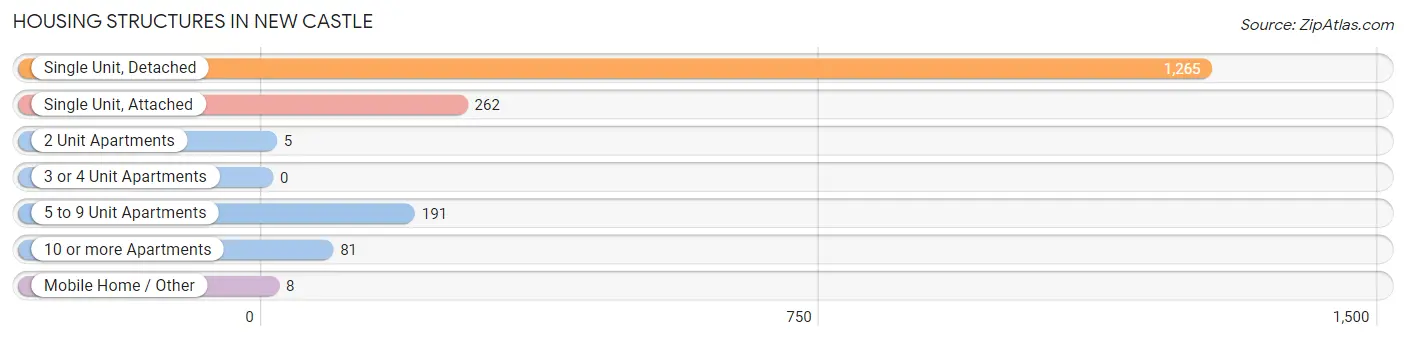
| Structure Type | # Housing Units | % Housing Units |
| Single Unit, Detached | 1,265 | 69.8% |
| Single Unit, Attached | 262 | 14.5% |
| 2 Unit Apartments | 5 | 0.3% |
| 3 or 4 Unit Apartments | 0 | 0.0% |
| 5 to 9 Unit Apartments | 191 | 10.5% |
| 10 or more Apartments | 81 | 4.5% |
| Mobile Home / Other | 8 | 0.4% |
| Total | 1,812 | 100.0% |
Housing Structures by Occupancy in New Castle
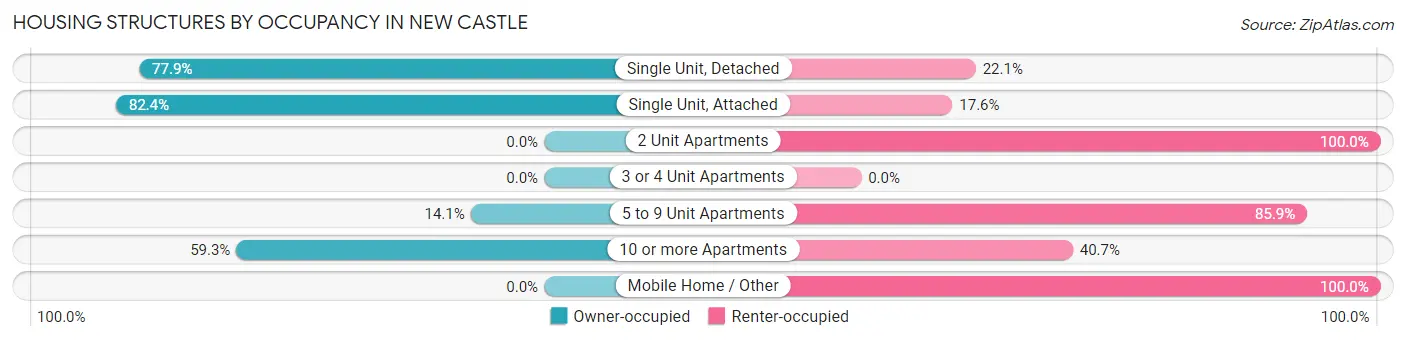
| Structure Type | Owner-occupied | Renter-occupied |
| Single Unit, Detached | 986 (77.9%) | 279 (22.1%) |
| Single Unit, Attached | 216 (82.4%) | 46 (17.6%) |
| 2 Unit Apartments | 0 (0.0%) | 5 (100.0%) |
| 3 or 4 Unit Apartments | 0 (0.0%) | 0 (0.0%) |
| 5 to 9 Unit Apartments | 27 (14.1%) | 164 (85.9%) |
| 10 or more Apartments | 48 (59.3%) | 33 (40.7%) |
| Mobile Home / Other | 0 (0.0%) | 8 (100.0%) |
| Total | 1,277 (70.5%) | 535 (29.5%) |
Housing Structures by Number of Rooms in New Castle
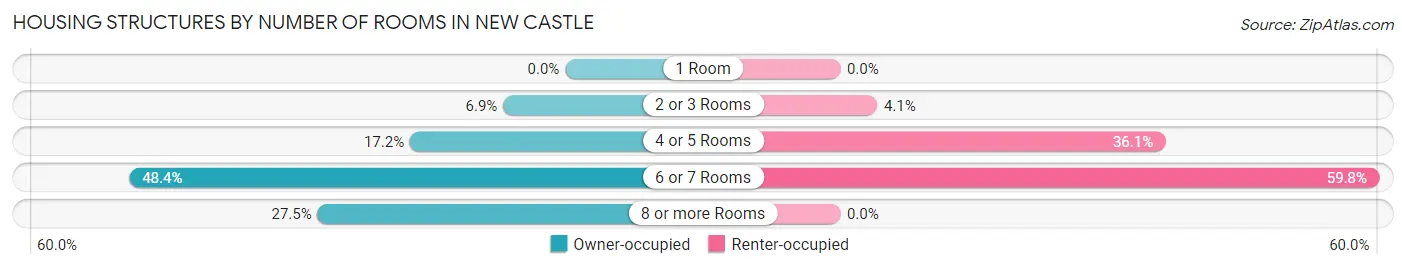
| Number of Rooms | Owner-occupied | Renter-occupied |
| 1 Room | 0 (0.0%) | 0 (0.0%) |
| 2 or 3 Rooms | 88 (6.9%) | 22 (4.1%) |
| 4 or 5 Rooms | 220 (17.2%) | 193 (36.1%) |
| 6 or 7 Rooms | 618 (48.4%) | 320 (59.8%) |
| 8 or more Rooms | 351 (27.5%) | 0 (0.0%) |
| Total | 1,277 (100.0%) | 535 (100.0%) |
Housing Structure by Heating Type in New Castle
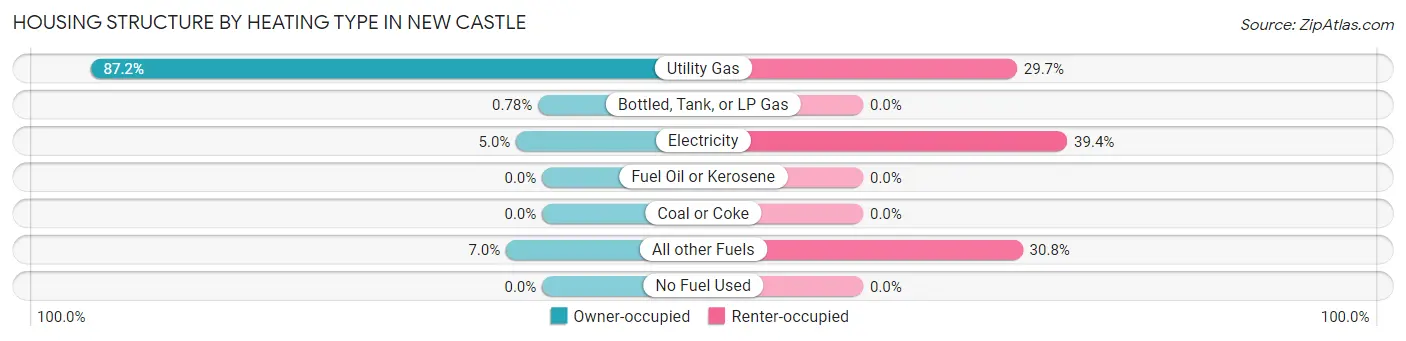
| Heating Type | Owner-occupied | Renter-occupied |
| Utility Gas | 1,114 (87.2%) | 159 (29.7%) |
| Bottled, Tank, or LP Gas | 10 (0.8%) | 0 (0.0%) |
| Electricity | 64 (5.0%) | 211 (39.4%) |
| Fuel Oil or Kerosene | 0 (0.0%) | 0 (0.0%) |
| Coal or Coke | 0 (0.0%) | 0 (0.0%) |
| All other Fuels | 89 (7.0%) | 165 (30.8%) |
| No Fuel Used | 0 (0.0%) | 0 (0.0%) |
| Total | 1,277 (100.0%) | 535 (100.0%) |
Household Vehicle Usage in New Castle
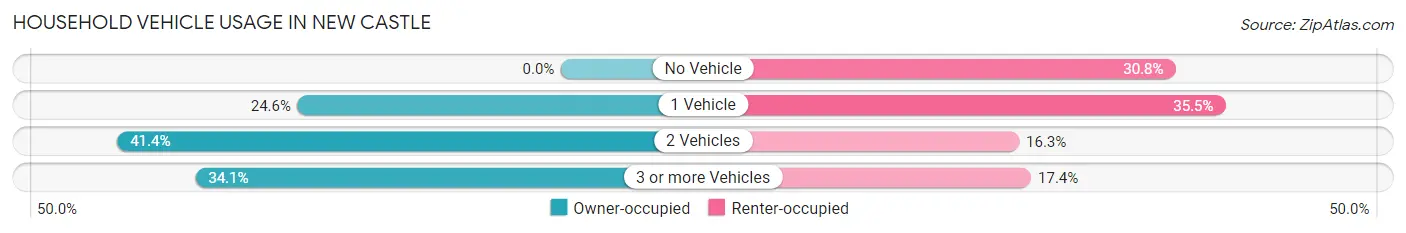
| Vehicles per Household | Owner-occupied | Renter-occupied |
| No Vehicle | 0 (0.0%) | 165 (30.8%) |
| 1 Vehicle | 314 (24.6%) | 190 (35.5%) |
| 2 Vehicles | 528 (41.3%) | 87 (16.3%) |
| 3 or more Vehicles | 435 (34.1%) | 93 (17.4%) |
| Total | 1,277 (100.0%) | 535 (100.0%) |
Real Estate & Mortgages in New Castle
Real Estate and Mortgage Overview in New Castle
| Characteristic | Without Mortgage | With Mortgage |
| Housing Units | 323 | 954 |
| Median Property Value | $365,600 | $451,100 |
| Median Household Income | - | - |
| Monthly Housing Costs | $504 | $109 |
| Real Estate Taxes | - | - |
Property Value by Mortgage Status in New Castle
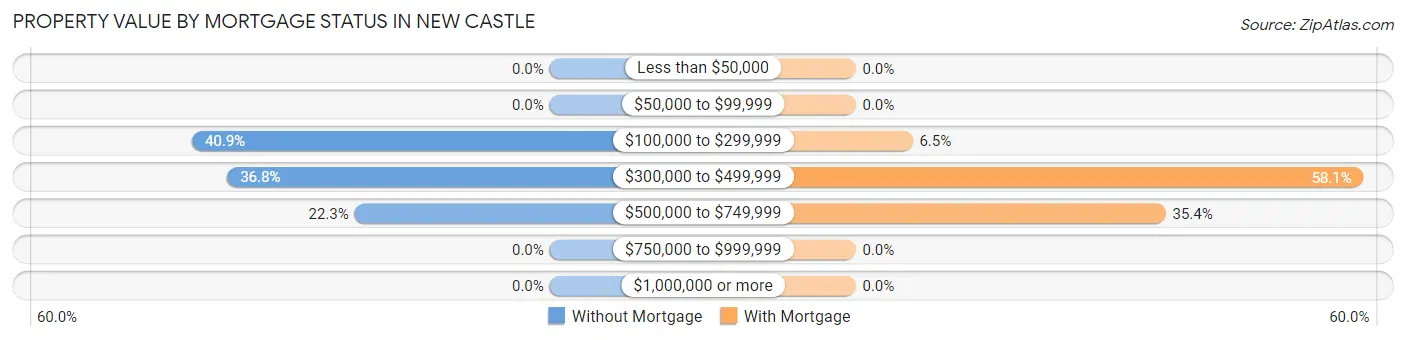
| Property Value | Without Mortgage | With Mortgage |
| Less than $50,000 | 0 (0.0%) | 0 (0.0%) |
| $50,000 to $99,999 | 0 (0.0%) | 0 (0.0%) |
| $100,000 to $299,999 | 132 (40.9%) | 62 (6.5%) |
| $300,000 to $499,999 | 119 (36.8%) | 554 (58.1%) |
| $500,000 to $749,999 | 72 (22.3%) | 338 (35.4%) |
| $750,000 to $999,999 | 0 (0.0%) | 0 (0.0%) |
| $1,000,000 or more | 0 (0.0%) | 0 (0.0%) |
| Total | 323 (100.0%) | 954 (100.0%) |
Household Income by Mortgage Status in New Castle
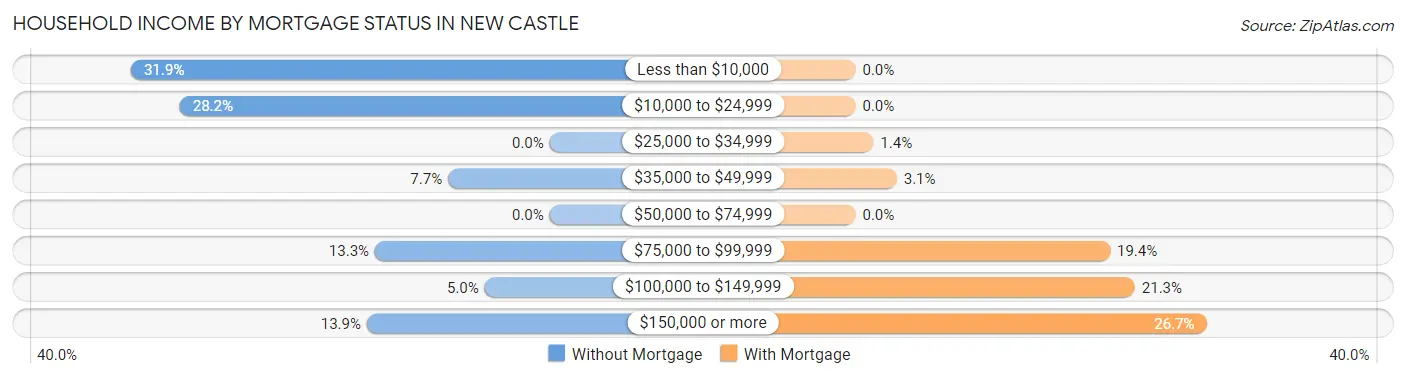
| Household Income | Without Mortgage | With Mortgage |
| Less than $10,000 | 103 (31.9%) | 0 (0.0%) |
| $10,000 to $24,999 | 91 (28.2%) | 0 (0.0%) |
| $25,000 to $34,999 | 0 (0.0%) | 13 (1.4%) |
| $35,000 to $49,999 | 25 (7.7%) | 30 (3.1%) |
| $50,000 to $74,999 | 0 (0.0%) | 0 (0.0%) |
| $75,000 to $99,999 | 43 (13.3%) | 185 (19.4%) |
| $100,000 to $149,999 | 16 (5.0%) | 203 (21.3%) |
| $150,000 or more | 45 (13.9%) | 255 (26.7%) |
| Total | 323 (100.0%) | 954 (100.0%) |
Property Value to Household Income Ratio in New Castle
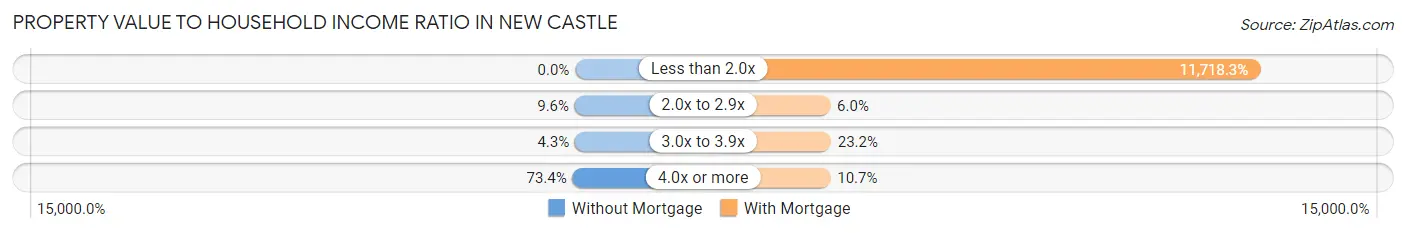
| Value-to-Income Ratio | Without Mortgage | With Mortgage |
| Less than 2.0x | 0 (0.0%) | 111,793 (11,718.3%) |
| 2.0x to 2.9x | 31 (9.6%) | 57 (6.0%) |
| 3.0x to 3.9x | 14 (4.3%) | 221 (23.2%) |
| 4.0x or more | 237 (73.4%) | 102 (10.7%) |
| Total | 323 (100.0%) | 954 (100.0%) |
Real Estate Taxes by Mortgage Status in New Castle
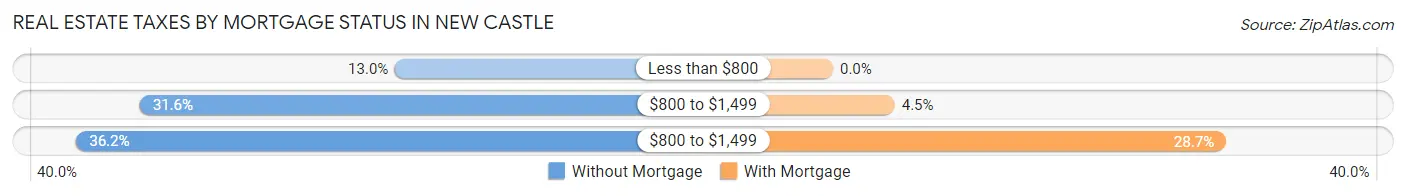
| Property Taxes | Without Mortgage | With Mortgage |
| Less than $800 | 42 (13.0%) | 0 (0.0%) |
| $800 to $1,499 | 102 (31.6%) | 43 (4.5%) |
| $800 to $1,499 | 117 (36.2%) | 274 (28.7%) |
| Total | 323 (100.0%) | 954 (100.0%) |
Health & Disability in New Castle
Health Insurance Coverage by Age in New Castle
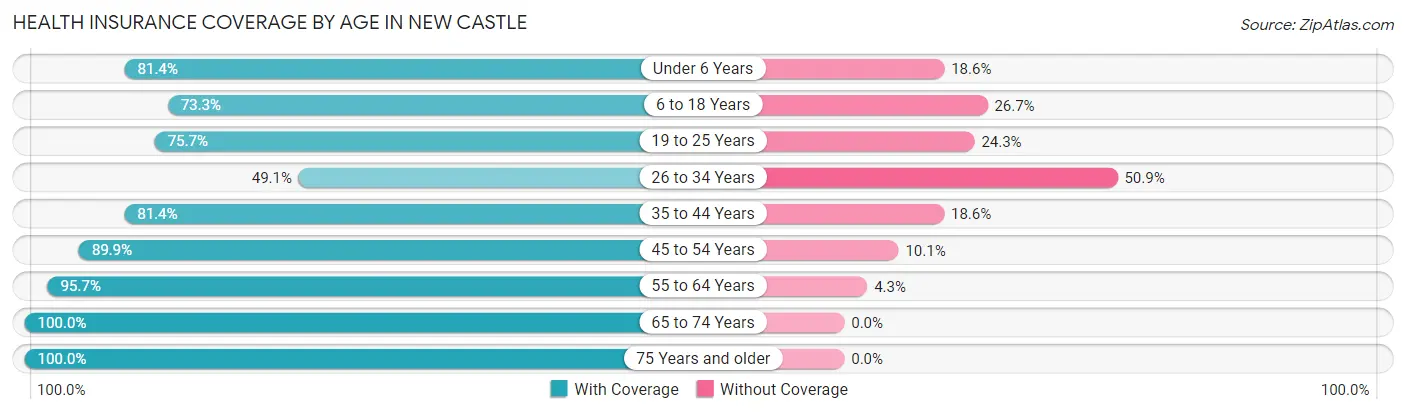
| Age Bracket | With Coverage | Without Coverage |
| Under 6 Years | 419 (81.4%) | 96 (18.6%) |
| 6 to 18 Years | 725 (73.3%) | 264 (26.7%) |
| 19 to 25 Years | 387 (75.7%) | 124 (24.3%) |
| 26 to 34 Years | 183 (49.1%) | 190 (50.9%) |
| 35 to 44 Years | 534 (81.4%) | 122 (18.6%) |
| 45 to 54 Years | 676 (89.9%) | 76 (10.1%) |
| 55 to 64 Years | 448 (95.7%) | 20 (4.3%) |
| 65 to 74 Years | 263 (100.0%) | 0 (0.0%) |
| 75 Years and older | 347 (100.0%) | 0 (0.0%) |
| Total | 3,982 (81.7%) | 892 (18.3%) |
Health Insurance Coverage by Citizenship Status in New Castle
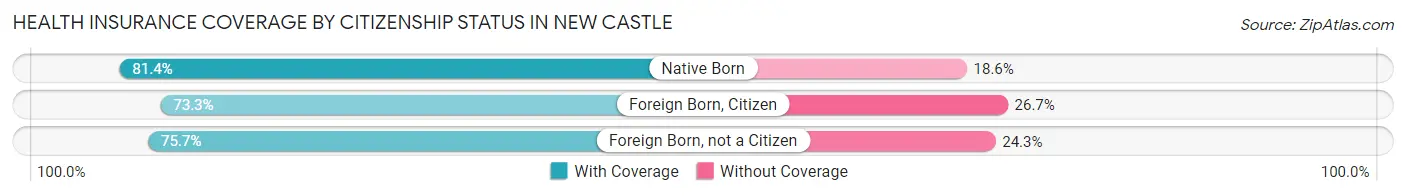
| Citizenship Status | With Coverage | Without Coverage |
| Native Born | 419 (81.4%) | 96 (18.6%) |
| Foreign Born, Citizen | 725 (73.3%) | 264 (26.7%) |
| Foreign Born, not a Citizen | 387 (75.7%) | 124 (24.3%) |
Health Insurance Coverage by Household Income in New Castle
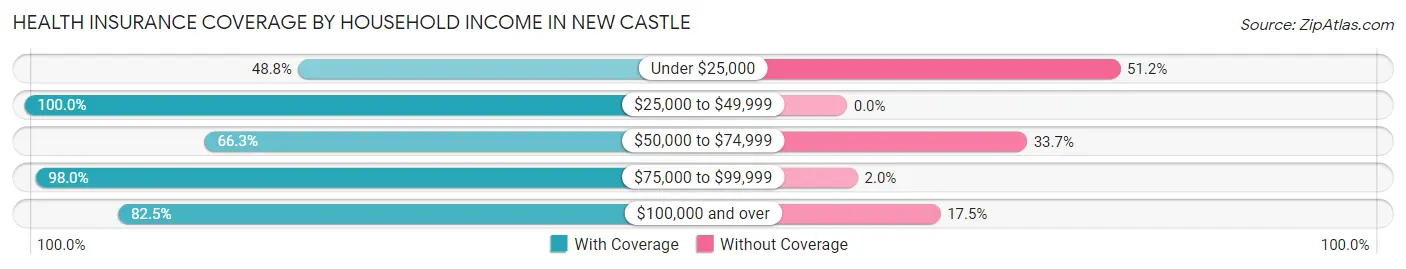
| Household Income | With Coverage | Without Coverage |
| Under $25,000 | 204 (48.8%) | 214 (51.2%) |
| $25,000 to $49,999 | 355 (100.0%) | 0 (0.0%) |
| $50,000 to $74,999 | 466 (66.3%) | 237 (33.7%) |
| $75,000 to $99,999 | 972 (98.0%) | 20 (2.0%) |
| $100,000 and over | 1,985 (82.5%) | 421 (17.5%) |
Public vs Private Health Insurance Coverage by Age in New Castle
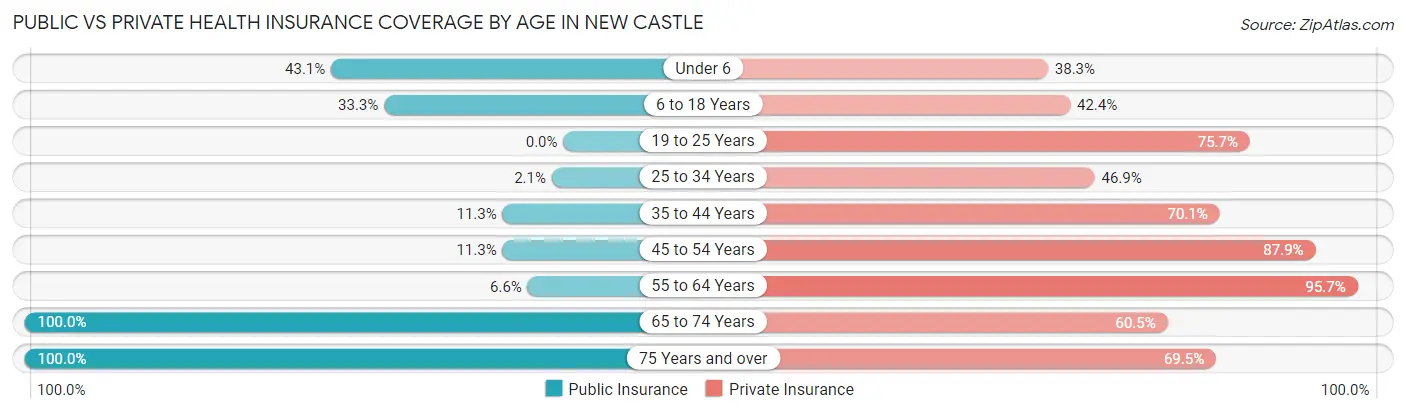
| Age Bracket | Public Insurance | Private Insurance |
| Under 6 | 222 (43.1%) | 197 (38.3%) |
| 6 to 18 Years | 329 (33.3%) | 419 (42.4%) |
| 19 to 25 Years | 0 (0.0%) | 387 (75.7%) |
| 25 to 34 Years | 8 (2.1%) | 175 (46.9%) |
| 35 to 44 Years | 74 (11.3%) | 460 (70.1%) |
| 45 to 54 Years | 85 (11.3%) | 661 (87.9%) |
| 55 to 64 Years | 31 (6.6%) | 448 (95.7%) |
| 65 to 74 Years | 263 (100.0%) | 159 (60.5%) |
| 75 Years and over | 347 (100.0%) | 241 (69.5%) |
| Total | 1,359 (27.9%) | 3,147 (64.6%) |
Disability Status by Sex by Age in New Castle
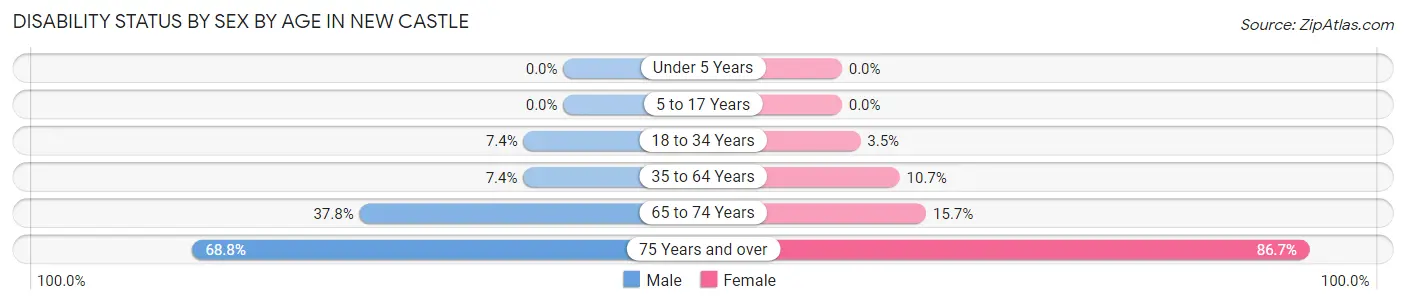
| Age Bracket | Male | Female |
| Under 5 Years | 0 (0.0%) | 0 (0.0%) |
| 5 to 17 Years | 0 (0.0%) | 0 (0.0%) |
| 18 to 34 Years | 39 (7.4%) | 14 (3.5%) |
| 35 to 64 Years | 75 (7.4%) | 93 (10.7%) |
| 65 to 74 Years | 56 (37.8%) | 18 (15.7%) |
| 75 Years and over | 53 (68.8%) | 234 (86.7%) |
Disability Class by Sex by Age in New Castle
Disability Class: Hearing Difficulty
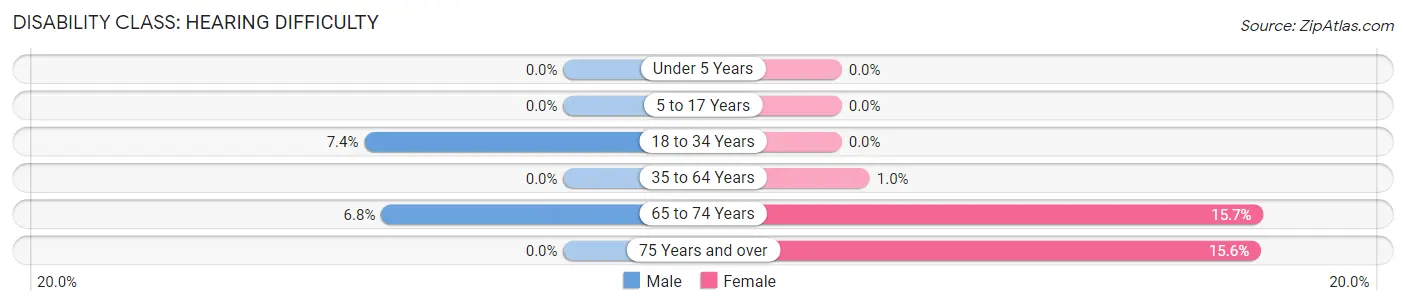
| Age Bracket | Male | Female |
| Under 5 Years | 0 (0.0%) | 0 (0.0%) |
| 5 to 17 Years | 0 (0.0%) | 0 (0.0%) |
| 18 to 34 Years | 39 (7.4%) | 0 (0.0%) |
| 35 to 64 Years | 0 (0.0%) | 9 (1.0%) |
| 65 to 74 Years | 10 (6.8%) | 18 (15.7%) |
| 75 Years and over | 0 (0.0%) | 42 (15.6%) |
Disability Class: Vision Difficulty
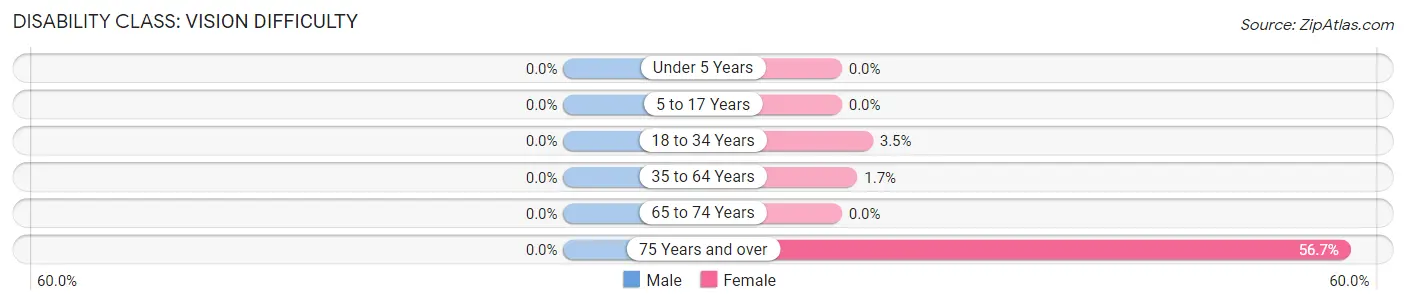
| Age Bracket | Male | Female |
| Under 5 Years | 0 (0.0%) | 0 (0.0%) |
| 5 to 17 Years | 0 (0.0%) | 0 (0.0%) |
| 18 to 34 Years | 0 (0.0%) | 14 (3.5%) |
| 35 to 64 Years | 0 (0.0%) | 15 (1.7%) |
| 65 to 74 Years | 0 (0.0%) | 0 (0.0%) |
| 75 Years and over | 0 (0.0%) | 153 (56.7%) |
Disability Class: Cognitive Difficulty
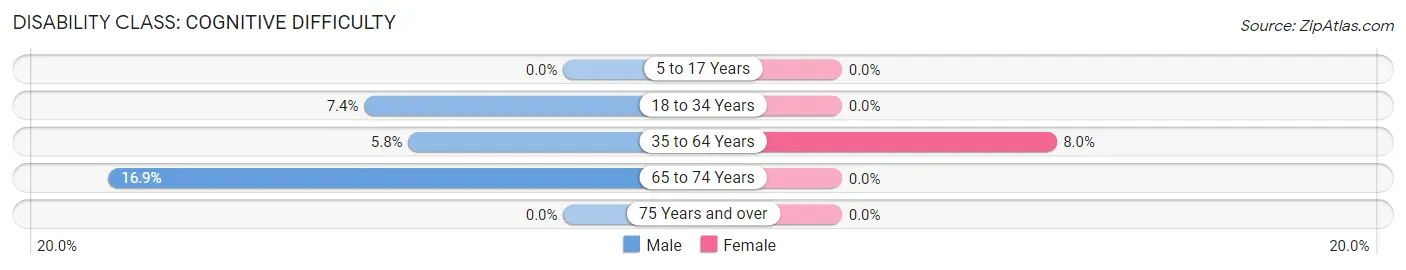
| Age Bracket | Male | Female |
| 5 to 17 Years | 0 (0.0%) | 0 (0.0%) |
| 18 to 34 Years | 39 (7.4%) | 0 (0.0%) |
| 35 to 64 Years | 58 (5.8%) | 69 (8.0%) |
| 65 to 74 Years | 25 (16.9%) | 0 (0.0%) |
| 75 Years and over | 0 (0.0%) | 0 (0.0%) |
Disability Class: Ambulatory Difficulty
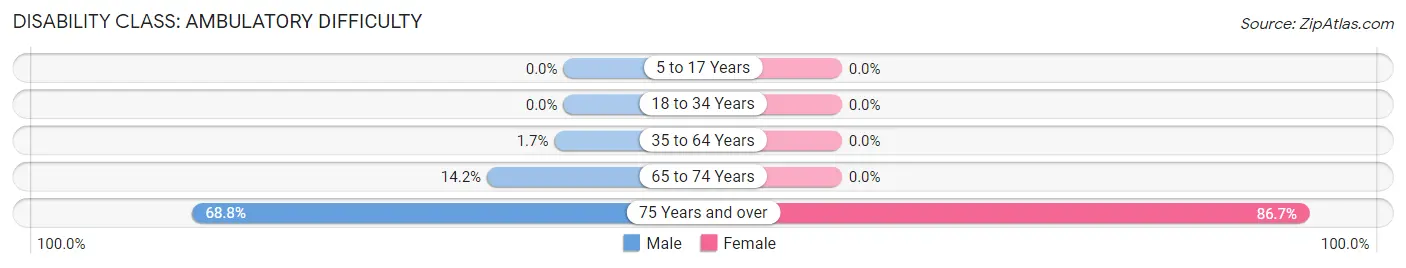
| Age Bracket | Male | Female |
| 5 to 17 Years | 0 (0.0%) | 0 (0.0%) |
| 18 to 34 Years | 0 (0.0%) | 0 (0.0%) |
| 35 to 64 Years | 17 (1.7%) | 0 (0.0%) |
| 65 to 74 Years | 21 (14.2%) | 0 (0.0%) |
| 75 Years and over | 53 (68.8%) | 234 (86.7%) |
Disability Class: Self-Care Difficulty
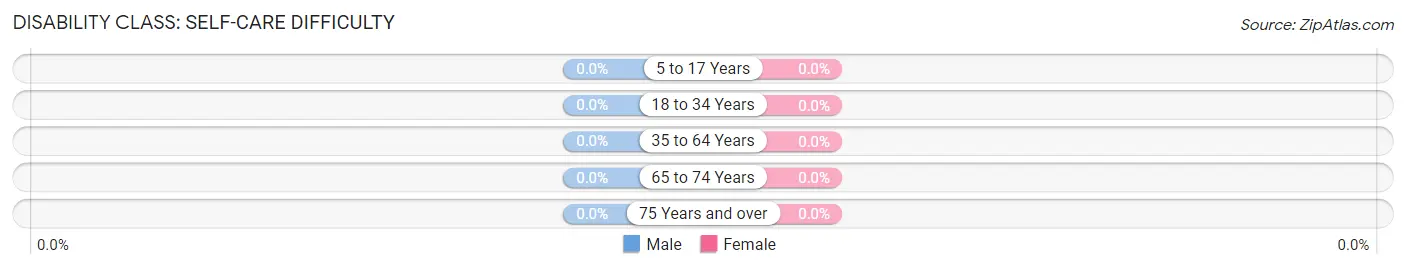
| Age Bracket | Male | Female |
| 5 to 17 Years | 0 (0.0%) | 0 (0.0%) |
| 18 to 34 Years | 0 (0.0%) | 0 (0.0%) |
| 35 to 64 Years | 0 (0.0%) | 0 (0.0%) |
| 65 to 74 Years | 0 (0.0%) | 0 (0.0%) |
| 75 Years and over | 0 (0.0%) | 0 (0.0%) |
Technology Access in New Castle
Computing Device Access in New Castle
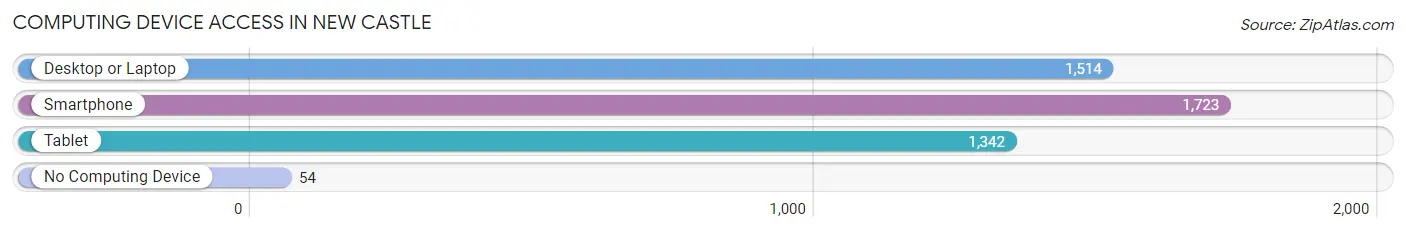
| Device Type | # Households | % Households |
| Desktop or Laptop | 1,514 | 83.6% |
| Smartphone | 1,723 | 95.1% |
| Tablet | 1,342 | 74.1% |
| No Computing Device | 54 | 3.0% |
| Total | 1,812 | 100.0% |
Internet Access in New Castle
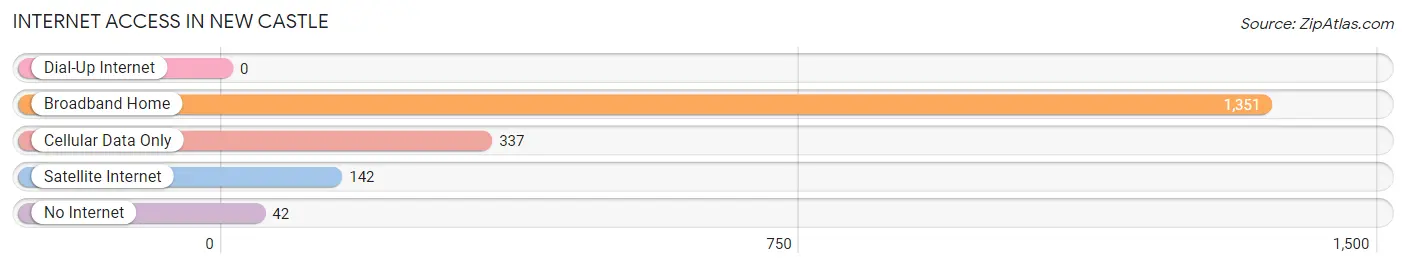
| Internet Type | # Households | % Households |
| Dial-Up Internet | 0 | 0.0% |
| Broadband Home | 1,351 | 74.6% |
| Cellular Data Only | 337 | 18.6% |
| Satellite Internet | 142 | 7.8% |
| No Internet | 42 | 2.3% |
| Total | 1,812 | 100.0% |
New Castle Summary
New Castle is a small town located in Garfield County, Colorado, United States. It is situated in the Roaring Fork Valley, approximately 10 miles east of Glenwood Springs and 30 miles west of Aspen. The town has a population of approximately 4,000 people and is the county seat of Garfield County.
History
The area that is now New Castle was first settled in the late 1800s by ranchers and miners. The town was originally known as “Rifle”, after the nearby Rifle Creek. In 1883, the town was renamed “New Castle” after the nearby Castle Creek. The town was officially incorporated in 1891.
In the early 1900s, New Castle was a bustling mining town. The town was home to several coal mines, including the New Castle Coal Company, which operated from 1902 to 1923. The coal mines provided employment for many of the town’s residents.
In the 1920s, the town began to transition away from mining and towards agriculture. The town’s economy was bolstered by the construction of the Colorado Midland Railroad in the late 1800s, which allowed for the transportation of agricultural products to other parts of the state.
Geography
New Castle is located in the Roaring Fork Valley, approximately 10 miles east of Glenwood Springs and 30 miles west of Aspen. The town is situated at an elevation of 5,890 feet above sea level. The town is surrounded by the White River National Forest and is located near the Colorado River.
The climate in New Castle is semi-arid, with hot summers and cold winters. The average annual temperature is 48°F, with an average high of 79°F in the summer and an average low of 17°F in the winter. The average annual precipitation is 13.5 inches.
Economy
The economy of New Castle is largely based on agriculture and tourism. The town is home to several farms and ranches, which produce a variety of crops and livestock. The town is also home to several wineries and breweries, which attract tourists from all over the state.
In addition to agriculture and tourism, New Castle is home to several businesses, including restaurants, retail stores, and professional services. The town is also home to several manufacturing companies, which produce a variety of products, including furniture, clothing, and electronics.
Demographics
As of the 2010 census, the population of New Castle was 4,039. The racial makeup of the town was 94.3% White, 0.7% African American, 0.3% Native American, 0.7% Asian, 0.1% Pacific Islander, 1.7% from other races, and 2.0% from two or more races. Hispanic or Latino of any race were 5.3% of the population.
The median household income in New Castle was $50,945, and the median family income was $60,938. The per capita income was $25,945. About 8.3% of families and 11.2% of the population were below the poverty line, including 15.2% of those under age 18 and 6.2% of those age 65 or over.
Common Questions
What is Per Capita Income in New Castle?
Per Capita income in New Castle is $34,679.
What is the Median Family Income in New Castle?
Median Family Income in New Castle is $92,500.
What is the Median Household income in New Castle?
Median Household Income in New Castle is $82,473.
What is Income or Wage Gap in New Castle?
Income or Wage Gap in New Castle is 18.2%.
Women in New Castle earn 81.8 cents for every dollar earned by a man.
What is Inequality or Gini Index in New Castle?
Inequality or Gini Index in New Castle is 0.38.
What is the Total Population of New Castle?
Total Population of New Castle is 4,874.
What is the Total Male Population of New Castle?
Total Male Population of New Castle is 2,451.
What is the Total Female Population of New Castle?
Total Female Population of New Castle is 2,423.
What is the Ratio of Males per 100 Females in New Castle?
There are 101.16 Males per 100 Females in New Castle.
What is the Ratio of Females per 100 Males in New Castle?
There are 98.86 Females per 100 Males in New Castle.
What is the Median Population Age in New Castle?
Median Population Age in New Castle is 36.2 Years.
What is the Average Family Size in New Castle
Average Family Size in New Castle is 3.4 People.
What is the Average Household Size in New Castle
Average Household Size in New Castle is 2.7 People.
How Large is the Labor Force in New Castle?
There are 2,405 People in the Labor Forcein in New Castle.
What is the Percentage of People in the Labor Force in New Castle?
66.3% of People are in the Labor Force in New Castle.
What is the Unemployment Rate in New Castle?
Unemployment Rate in New Castle is 2.7%.