Nederland, CO Map & Demographics
Nederland Map
Nederland Overview
$66,603
PER CAPITA INCOME
$116,324
AVG FAMILY INCOME
$115,120
AVG HOUSEHOLD INCOME
23.8%
WAGE / INCOME GAP [ % ]
76.2¢/ $1
WAGE / INCOME GAP [ $ ]
0.45
INEQUALITY / GINI INDEX
1,413
TOTAL POPULATION
763
MALE POPULATION
650
FEMALE POPULATION
117.38
MALES / 100 FEMALES
85.19
FEMALES / 100 MALES
46.6
MEDIAN AGE
2.8
AVG FAMILY SIZE
2.3
AVG HOUSEHOLD SIZE
904
LABOR FORCE [ PEOPLE ]
79.2%
PERCENT IN LABOR FORCE
2.5%
UNEMPLOYMENT RATE
Nederland Zip Codes
Nederland Area Codes
Income in Nederland
Income Overview in Nederland
Per Capita Income in Nederland is $66,603, while median incomes of families and households are $116,324 and $115,120 respectively.
| Characteristic | Number | Measure |
| Per Capita Income | 1,413 | $66,603 |
| Median Family Income | 402 | $116,324 |
| Mean Family Income | 402 | $139,879 |
| Median Household Income | 609 | $115,120 |
| Mean Household Income | 609 | $150,049 |
| Income Deficit | 402 | $0 |
| Wage / Income Gap (%) | 1,413 | 23.76% |
| Wage / Income Gap ($) | 1,413 | 76.24¢ per $1 |
| Gini / Inequality Index | 1,413 | 0.45 |
Earnings by Sex in Nederland
Average Earnings in Nederland are $58,261, $65,088 for men and $49,625 for women, a difference of 23.8%.
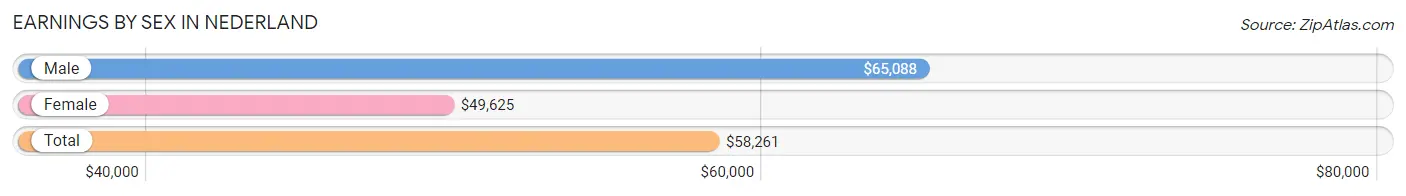
| Sex | Number | Average Earnings |
| Male | 490 (52.6%) | $65,088 |
| Female | 442 (47.4%) | $49,625 |
| Total | 932 (100.0%) | $58,261 |
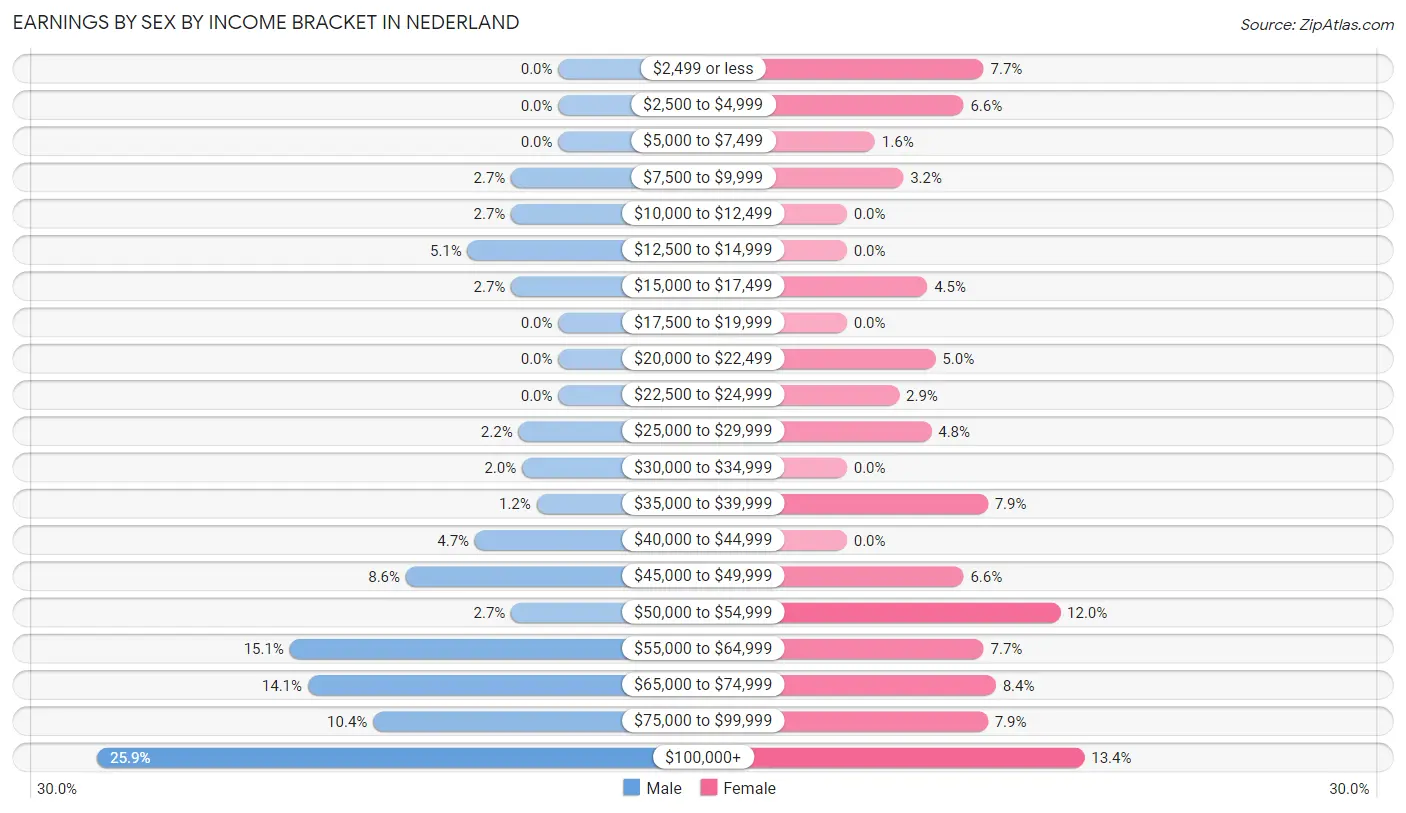
Earnings by Sex by Income Bracket in Nederland
The most common earnings brackets in Nederland are $100,000+ for men (127 | 25.9%) and $100,000+ for women (59 | 13.4%).
| Income | Male | Female |
| $2,499 or less | 0 (0.0%) | 34 (7.7%) |
| $2,500 to $4,999 | 0 (0.0%) | 29 (6.6%) |
| $5,000 to $7,499 | 0 (0.0%) | 7 (1.6%) |
| $7,500 to $9,999 | 13 (2.6%) | 14 (3.2%) |
| $10,000 to $12,499 | 13 (2.6%) | 0 (0.0%) |
| $12,500 to $14,999 | 25 (5.1%) | 0 (0.0%) |
| $15,000 to $17,499 | 13 (2.6%) | 20 (4.5%) |
| $17,500 to $19,999 | 0 (0.0%) | 0 (0.0%) |
| $20,000 to $22,499 | 0 (0.0%) | 22 (5.0%) |
| $22,500 to $24,999 | 0 (0.0%) | 13 (2.9%) |
| $25,000 to $29,999 | 11 (2.2%) | 21 (4.8%) |
| $30,000 to $34,999 | 10 (2.0%) | 0 (0.0%) |
| $35,000 to $39,999 | 6 (1.2%) | 35 (7.9%) |
| $40,000 to $44,999 | 23 (4.7%) | 0 (0.0%) |
| $45,000 to $49,999 | 42 (8.6%) | 29 (6.6%) |
| $50,000 to $54,999 | 13 (2.6%) | 53 (12.0%) |
| $55,000 to $64,999 | 74 (15.1%) | 34 (7.7%) |
| $65,000 to $74,999 | 69 (14.1%) | 37 (8.4%) |
| $75,000 to $99,999 | 51 (10.4%) | 35 (7.9%) |
| $100,000+ | 127 (25.9%) | 59 (13.4%) |
| Total | 490 (100.0%) | 442 (100.0%) |
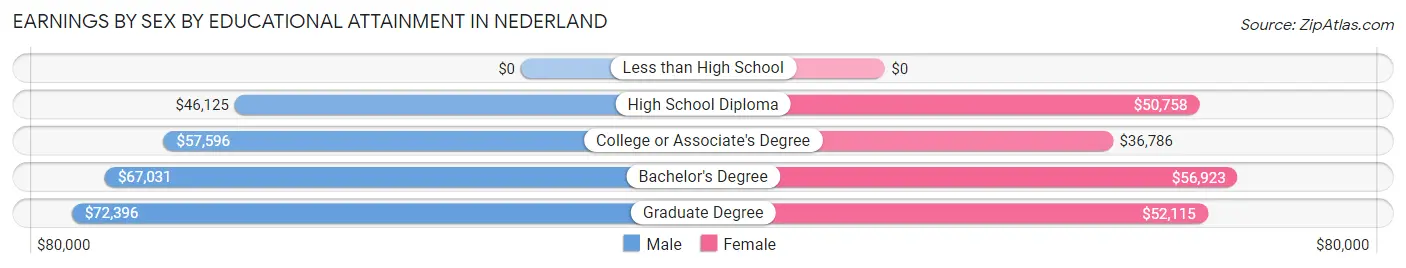
Earnings by Sex by Educational Attainment in Nederland
Average earnings in Nederland are $65,088 for men and $50,815 for women, a difference of 21.9%. Men with an educational attainment of graduate degree enjoy the highest average annual earnings of $72,396, while those with high school diploma education earn the least with $46,125. Women with an educational attainment of bachelor's degree earn the most with the average annual earnings of $56,923, while those with college or associate's degree education have the smallest earnings of $36,786.
| Educational Attainment | Male Income | Female Income |
| Less than High School | - | - |
| High School Diploma | $46,125 | $50,758 |
| College or Associate's Degree | $57,596 | $36,786 |
| Bachelor's Degree | $67,031 | $56,923 |
| Graduate Degree | $72,396 | $52,115 |
| Total | $65,088 | $50,815 |
Family Income in Nederland
Family Income Brackets in Nederland
According to the Nederland family income data, there are 128 families falling into the $100,000 to $149,999 income range, which is the most common income bracket and makes up 31.8% of all families.
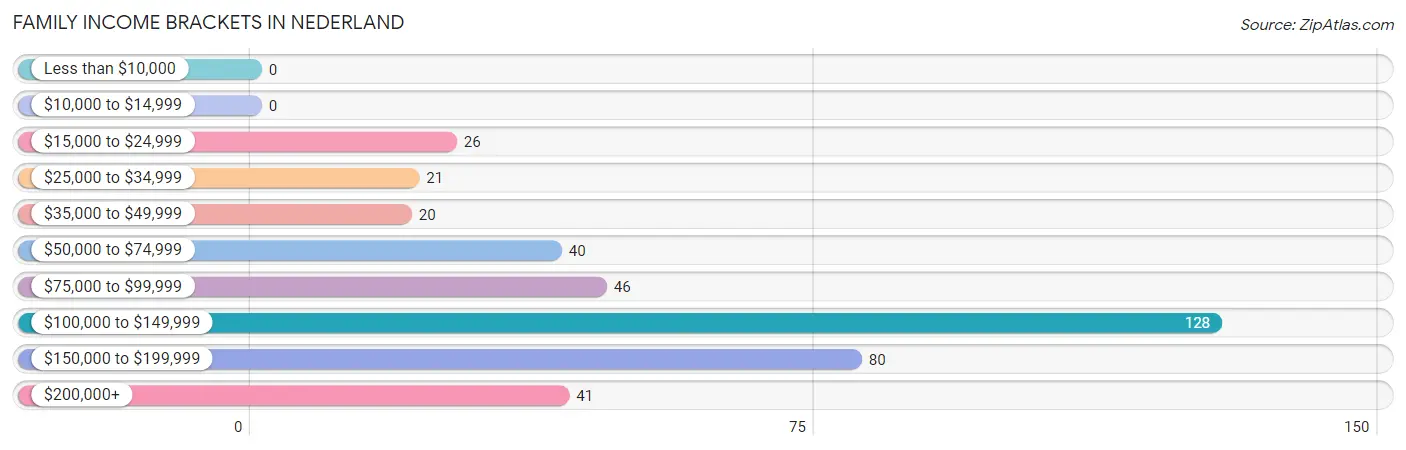
| Income Bracket | # Families | % Families |
| Less than $10,000 | 0 | 0.0% |
| $10,000 to $14,999 | 0 | 0.0% |
| $15,000 to $24,999 | 26 | 6.5% |
| $25,000 to $34,999 | 21 | 5.2% |
| $35,000 to $49,999 | 20 | 5.0% |
| $50,000 to $74,999 | 40 | 10.0% |
| $75,000 to $99,999 | 46 | 11.4% |
| $100,000 to $149,999 | 128 | 31.8% |
| $150,000 to $199,999 | 80 | 19.9% |
| $200,000+ | 41 | 10.2% |
Family Income by Famaliy Size in Nederland
4-person families (88 | 21.9%) account for the highest median family income in Nederland with $137,727 per family, while 2-person families (211 | 52.5%) have the highest median income of $58,453 per family member.
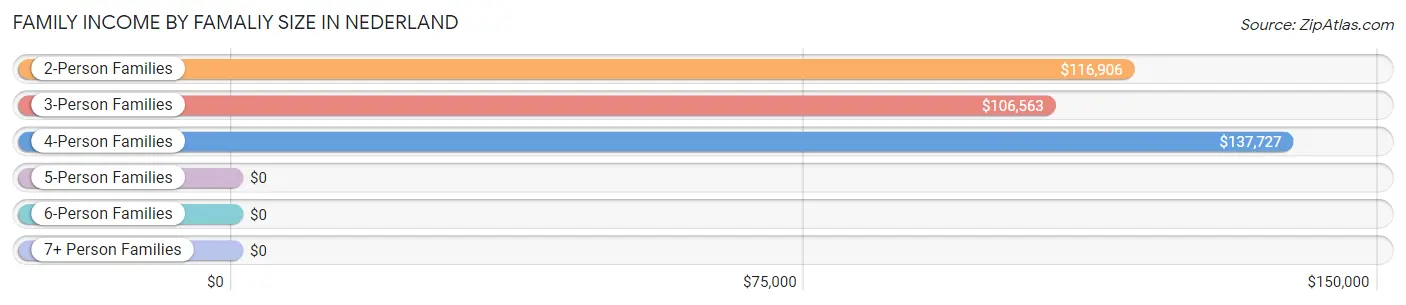
| Income Bracket | # Families | Median Income |
| 2-Person Families | 211 (52.5%) | $116,906 |
| 3-Person Families | 100 (24.9%) | $106,563 |
| 4-Person Families | 88 (21.9%) | $137,727 |
| 5-Person Families | 0 (0.0%) | $0 |
| 6-Person Families | 3 (0.7%) | $0 |
| 7+ Person Families | 0 (0.0%) | $0 |
| Total | 402 (100.0%) | $116,324 |
Family Income by Number of Earners in Nederland
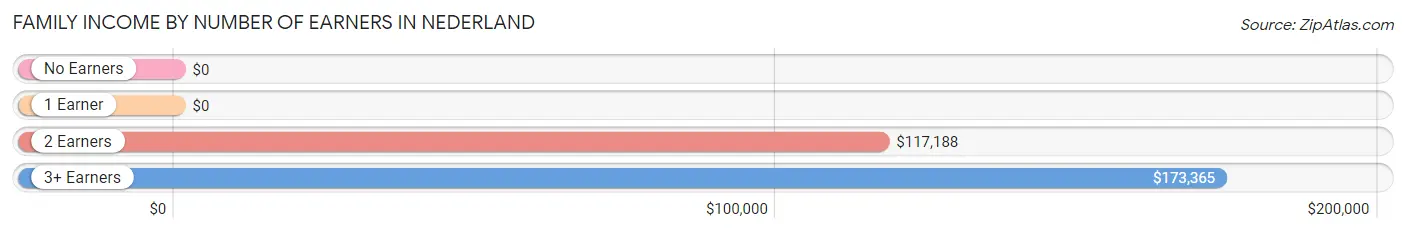
| Number of Earners | # Families | Median Income |
| No Earners | 12 (3.0%) | $0 |
| 1 Earner | 153 (38.1%) | $0 |
| 2 Earners | 208 (51.7%) | $117,188 |
| 3+ Earners | 29 (7.2%) | $173,365 |
| Total | 402 (100.0%) | $116,324 |
Household Income in Nederland
Household Income Brackets in Nederland
With 165 households falling in the category, the $100,000 to $149,999 income range is the most frequent in Nederland, accounting for 27.1% of all households.
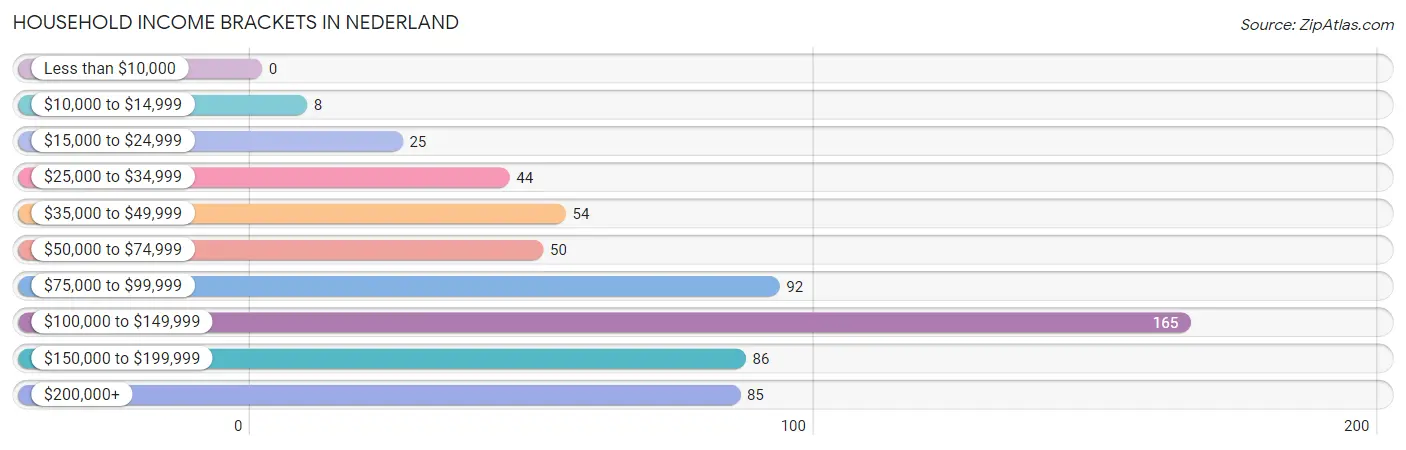
| Income Bracket | # Households | % Households |
| Less than $10,000 | 0 | 0.0% |
| $10,000 to $14,999 | 8 | 1.3% |
| $15,000 to $24,999 | 25 | 4.1% |
| $25,000 to $34,999 | 44 | 7.2% |
| $35,000 to $49,999 | 54 | 8.9% |
| $50,000 to $74,999 | 50 | 8.2% |
| $75,000 to $99,999 | 92 | 15.1% |
| $100,000 to $149,999 | 165 | 27.1% |
| $150,000 to $199,999 | 86 | 14.1% |
| $200,000+ | 85 | 14.0% |
Household Income by Householder Age in Nederland
The median household income in Nederland is $115,120, with the highest median household income of $123,750 found in the 45 to 64 years age bracket for the primary householder. A total of 362 households (59.4%) fall into this category.
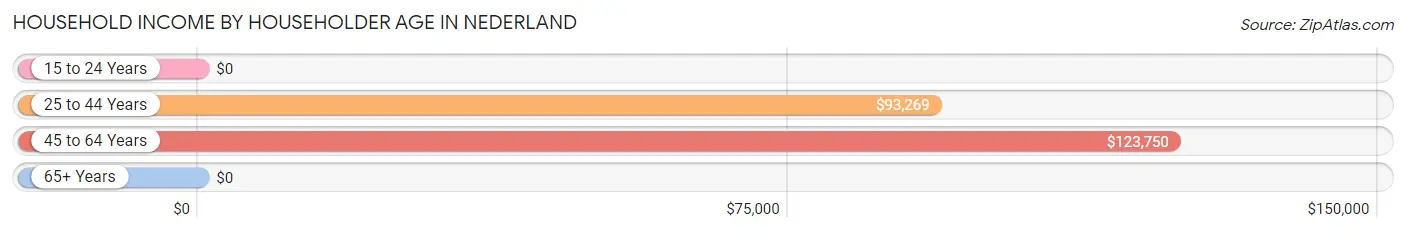
| Income Bracket | # Households | Median Income |
| 15 to 24 Years | 0 (0.0%) | $0 |
| 25 to 44 Years | 164 (26.9%) | $93,269 |
| 45 to 64 Years | 362 (59.4%) | $123,750 |
| 65+ Years | 83 (13.6%) | $0 |
| Total | 609 (100.0%) | $115,120 |
Poverty in Nederland
Income Below Poverty by Sex and Age in Nederland
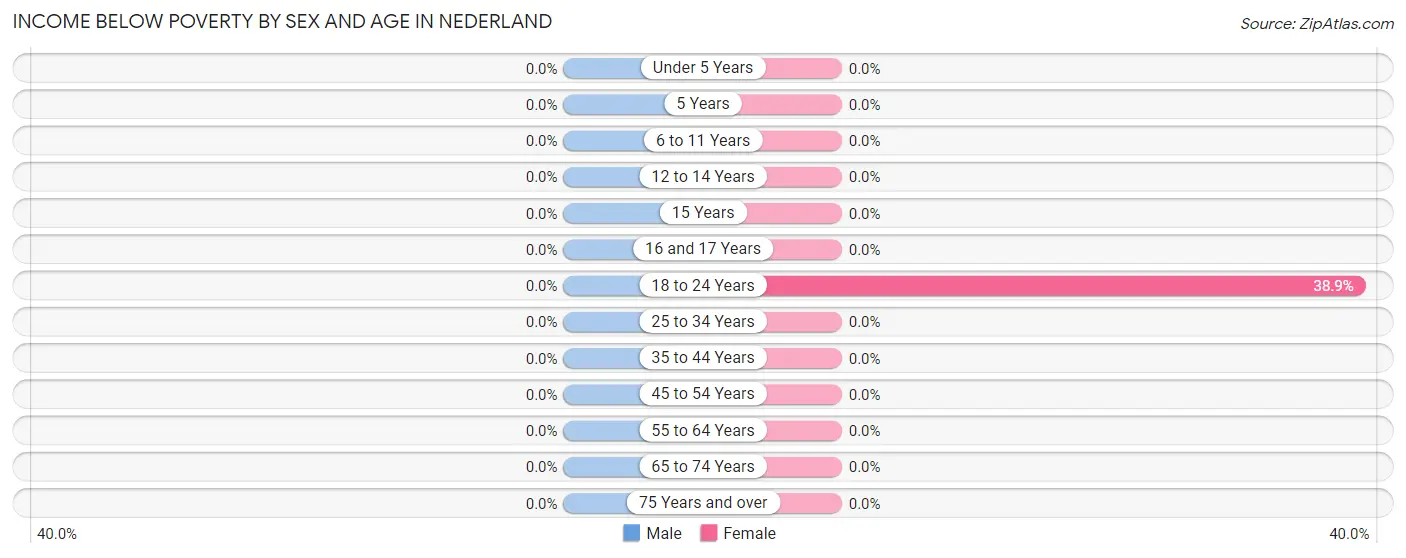
| Age Bracket | Male | Female |
| Under 5 Years | 0 (0.0%) | 0 (0.0%) |
| 5 Years | 0 (0.0%) | 0 (0.0%) |
| 6 to 11 Years | 0 (0.0%) | 0 (0.0%) |
| 12 to 14 Years | 0 (0.0%) | 0 (0.0%) |
| 15 Years | 0 (0.0%) | 0 (0.0%) |
| 16 and 17 Years | 0 (0.0%) | 0 (0.0%) |
| 18 to 24 Years | 0 (0.0%) | 14 (38.9%) |
| 25 to 34 Years | 0 (0.0%) | 0 (0.0%) |
| 35 to 44 Years | 0 (0.0%) | 0 (0.0%) |
| 45 to 54 Years | 0 (0.0%) | 0 (0.0%) |
| 55 to 64 Years | 0 (0.0%) | 0 (0.0%) |
| 65 to 74 Years | 0 (0.0%) | 0 (0.0%) |
| 75 Years and over | 0 (0.0%) | 0 (0.0%) |
| Total | 0 (0.0%) | 14 (2.1%) |
Income Above Poverty by Sex and Age in Nederland
According to the poverty statistics in Nederland, males aged under 5 years and females aged under 5 years are the age groups that are most secure financially, with 100.0% of males and 100.0% of females in these age groups living above the poverty line.
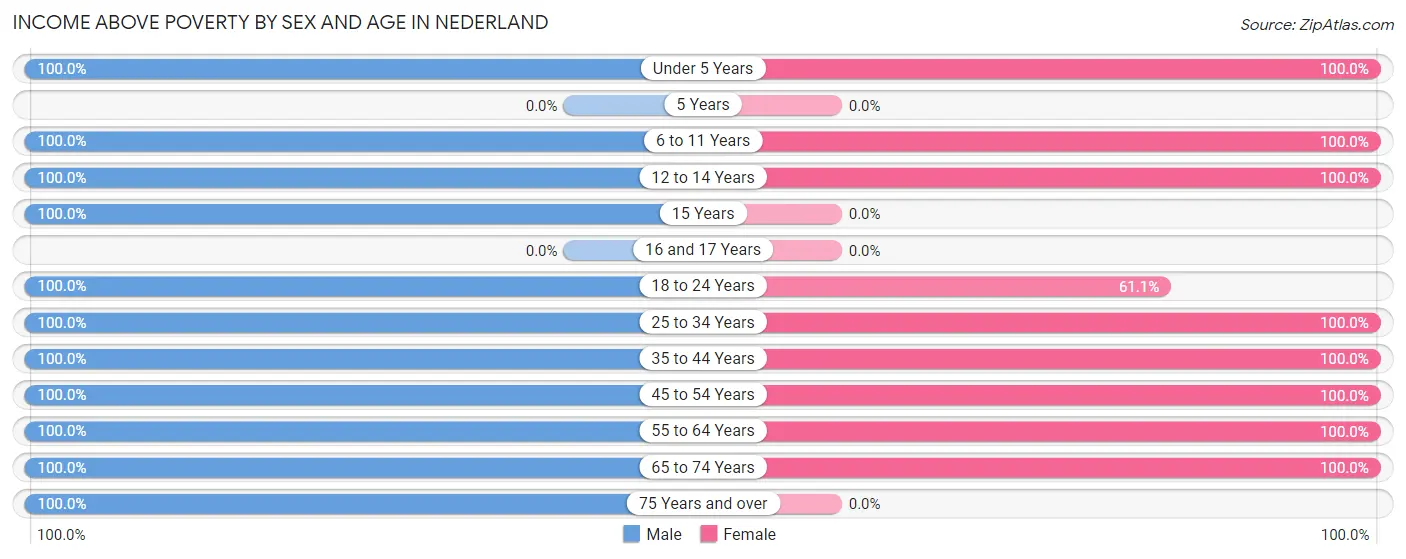
| Age Bracket | Male | Female |
| Under 5 Years | 57 (100.0%) | 61 (100.0%) |
| 5 Years | 0 (0.0%) | 0 (0.0%) |
| 6 to 11 Years | 57 (100.0%) | 34 (100.0%) |
| 12 to 14 Years | 11 (100.0%) | 26 (100.0%) |
| 15 Years | 25 (100.0%) | 0 (0.0%) |
| 16 and 17 Years | 0 (0.0%) | 0 (0.0%) |
| 18 to 24 Years | 8 (100.0%) | 22 (61.1%) |
| 25 to 34 Years | 123 (100.0%) | 66 (100.0%) |
| 35 to 44 Years | 70 (100.0%) | 87 (100.0%) |
| 45 to 54 Years | 126 (100.0%) | 129 (100.0%) |
| 55 to 64 Years | 190 (100.0%) | 162 (100.0%) |
| 65 to 74 Years | 85 (100.0%) | 49 (100.0%) |
| 75 Years and over | 11 (100.0%) | 0 (0.0%) |
| Total | 763 (100.0%) | 636 (97.9%) |
Income Below Poverty Among Married-Couple Families in Nederland
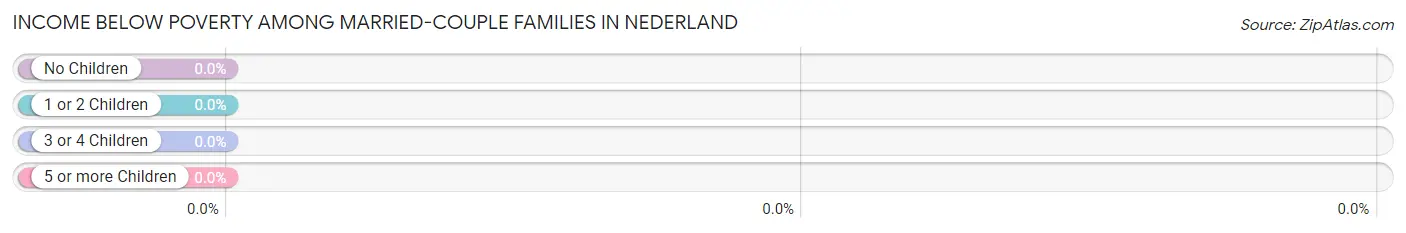
| Children | Above Poverty | Below Poverty |
| No Children | 213 (100.0%) | 0 (0.0%) |
| 1 or 2 Children | 135 (100.0%) | 0 (0.0%) |
| 3 or 4 Children | 3 (100.0%) | 0 (0.0%) |
| 5 or more Children | 0 (0.0%) | 0 (0.0%) |
| Total | 351 (100.0%) | 0 (0.0%) |
Income Below Poverty Among Single-Parent Households in Nederland
| Children | Single Father | Single Mother |
| No Children | 0 (0.0%) | 0 (0.0%) |
| 1 or 2 Children | 0 (0.0%) | 0 (0.0%) |
| 3 or 4 Children | 0 (0.0%) | 0 (0.0%) |
| 5 or more Children | 0 (0.0%) | 0 (0.0%) |
| Total | 0 (0.0%) | 0 (0.0%) |
Income Below Poverty Among Married-Couple vs Single-Parent Households in Nederland
| Children | Married-Couple Families | Single-Parent Households |
| No Children | 0 (0.0%) | 0 (0.0%) |
| 1 or 2 Children | 0 (0.0%) | 0 (0.0%) |
| 3 or 4 Children | 0 (0.0%) | 0 (0.0%) |
| 5 or more Children | 0 (0.0%) | 0 (0.0%) |
| Total | 0 (0.0%) | 0 (0.0%) |
Race in Nederland
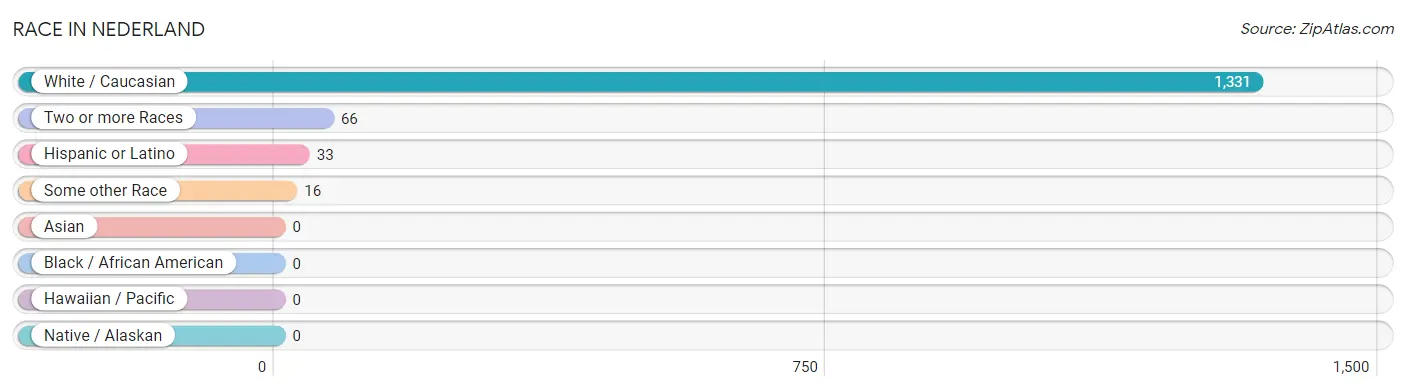
The most populous races in Nederland are White / Caucasian (1,331 | 94.2%), Two or more Races (66 | 4.7%), and Hispanic or Latino (33 | 2.3%).
| Race | # Population | % Population |
| Asian | 0 | 0.0% |
| Black / African American | 0 | 0.0% |
| Hawaiian / Pacific | 0 | 0.0% |
| Hispanic or Latino | 33 | 2.3% |
| Native / Alaskan | 0 | 0.0% |
| White / Caucasian | 1,331 | 94.2% |
| Two or more Races | 66 | 4.7% |
| Some other Race | 16 | 1.1% |
| Total | 1,413 | 100.0% |
Ancestry in Nederland
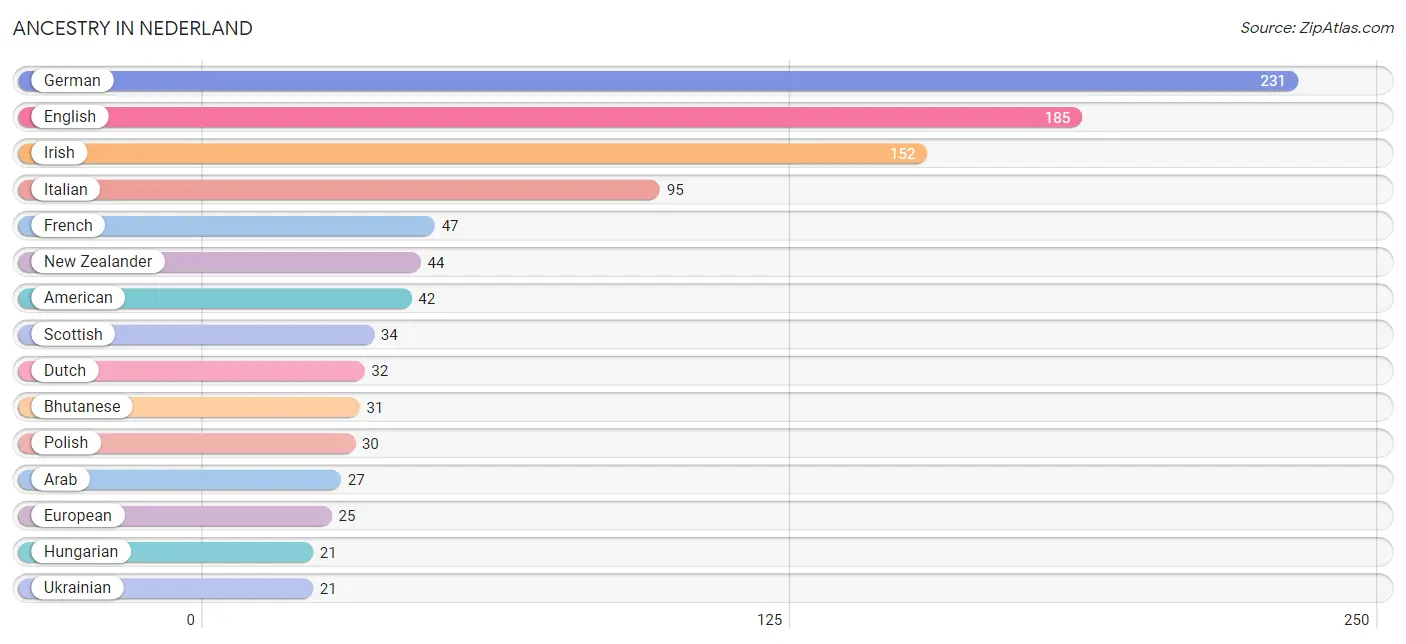
The most populous ancestries reported in Nederland are German (231 | 16.4%), English (185 | 13.1%), Irish (152 | 10.8%), Italian (95 | 6.7%), and French (47 | 3.3%), together accounting for 50.3% of all Nederland residents.
| Ancestry | # Population | % Population |
| American | 42 | 3.0% |
| Arab | 27 | 1.9% |
| Argentinean | 17 | 1.2% |
| Austrian | 10 | 0.7% |
| Belgian | 7 | 0.5% |
| Bhutanese | 31 | 2.2% |
| British | 7 | 0.5% |
| Central American | 16 | 1.1% |
| Cherokee | 6 | 0.4% |
| Dutch | 32 | 2.3% |
| English | 185 | 13.1% |
| European | 25 | 1.8% |
| French | 47 | 3.3% |
| German | 231 | 16.4% |
| Hungarian | 21 | 1.5% |
| Irish | 152 | 10.8% |
| Italian | 95 | 6.7% |
| Lebanese | 17 | 1.2% |
| Navajo | 10 | 0.7% |
| New Zealander | 44 | 3.1% |
| Northern European | 12 | 0.9% |
| Panamanian | 16 | 1.1% |
| Polish | 30 | 2.1% |
| Romanian | 8 | 0.6% |
| Russian | 18 | 1.3% |
| Scotch-Irish | 11 | 0.8% |
| Scottish | 34 | 2.4% |
| South American | 17 | 1.2% |
| Swedish | 6 | 0.4% |
| Ukrainian | 21 | 1.5% |
| Welsh | 6 | 0.4% | View All 31 Rows |
Immigrants in Nederland
The most numerous immigrant groups reported in Nederland came from Oceania (44 | 3.1%), Canada (32 | 2.3%), Belgium (7 | 0.5%), Europe (7 | 0.5%), and Western Europe (7 | 0.5%), together accounting for 6.9% of all Nederland residents.
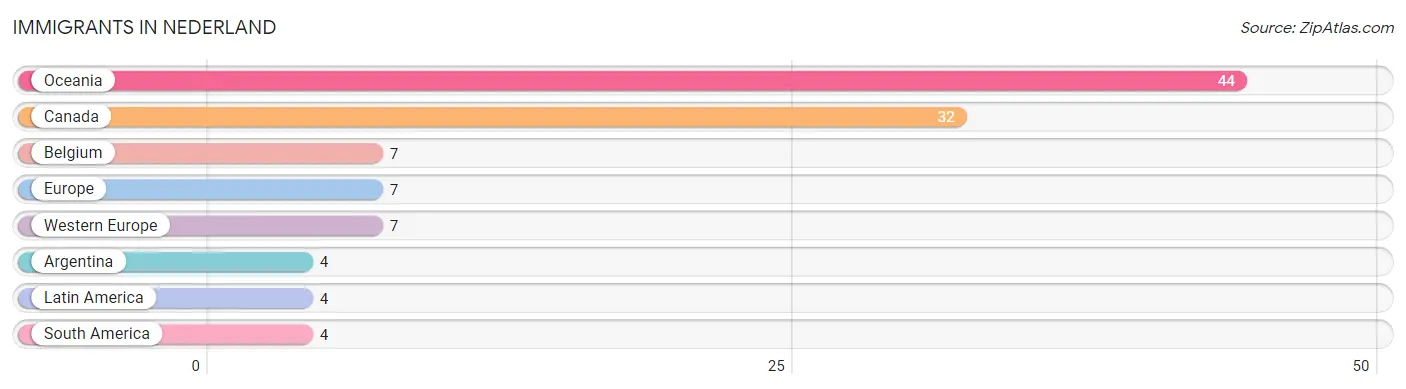
| Immigration Origin | # Population | % Population |
| Argentina | 4 | 0.3% |
| Belgium | 7 | 0.5% |
| Canada | 32 | 2.3% |
| Europe | 7 | 0.5% |
| Latin America | 4 | 0.3% |
| Oceania | 44 | 3.1% |
| South America | 4 | 0.3% |
| Western Europe | 7 | 0.5% | View All 8 Rows |
Sex and Age in Nederland
Sex and Age in Nederland
The most populous age groups in Nederland are 55 to 59 Years (134 | 17.6%) for men and 45 to 49 Years (115 | 17.7%) for women.
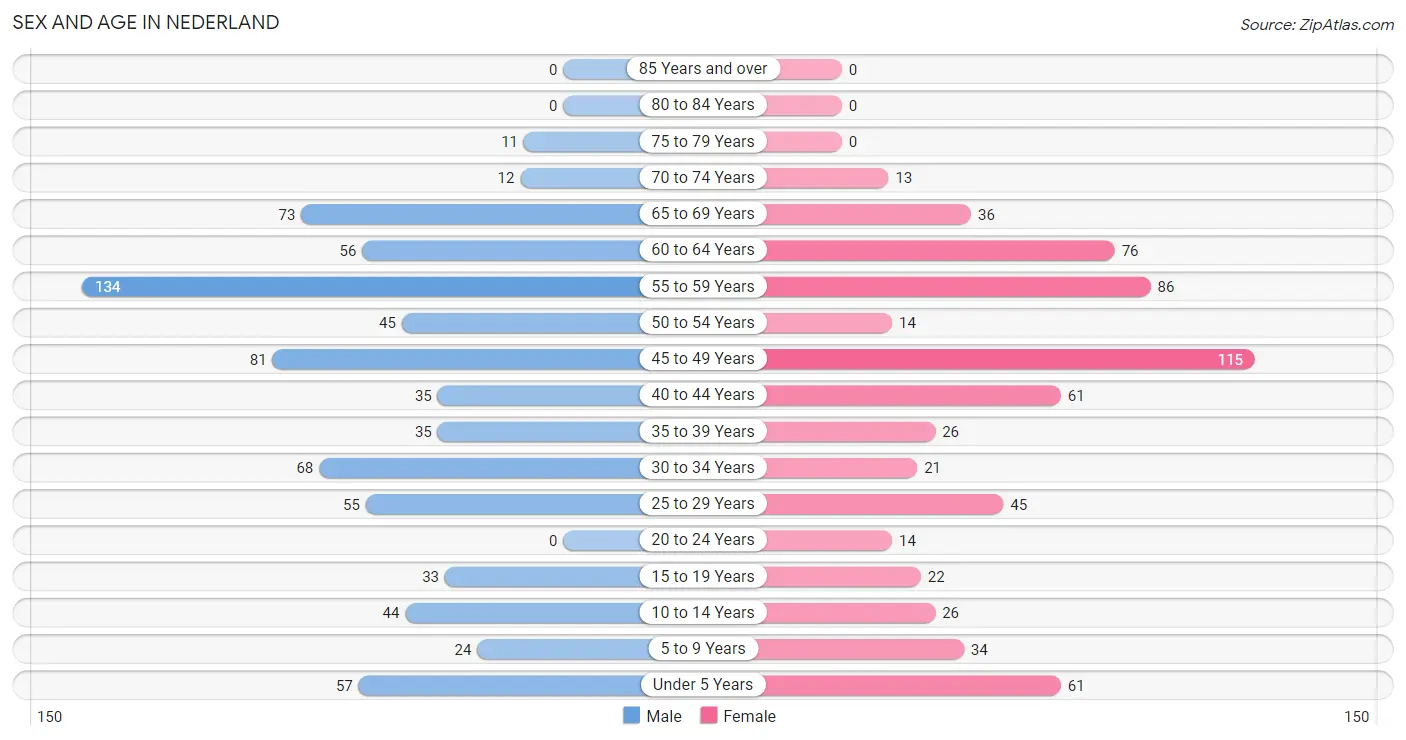
| Age Bracket | Male | Female |
| Under 5 Years | 57 (7.5%) | 61 (9.4%) |
| 5 to 9 Years | 24 (3.2%) | 34 (5.2%) |
| 10 to 14 Years | 44 (5.8%) | 26 (4.0%) |
| 15 to 19 Years | 33 (4.3%) | 22 (3.4%) |
| 20 to 24 Years | 0 (0.0%) | 14 (2.1%) |
| 25 to 29 Years | 55 (7.2%) | 45 (6.9%) |
| 30 to 34 Years | 68 (8.9%) | 21 (3.2%) |
| 35 to 39 Years | 35 (4.6%) | 26 (4.0%) |
| 40 to 44 Years | 35 (4.6%) | 61 (9.4%) |
| 45 to 49 Years | 81 (10.6%) | 115 (17.7%) |
| 50 to 54 Years | 45 (5.9%) | 14 (2.1%) |
| 55 to 59 Years | 134 (17.6%) | 86 (13.2%) |
| 60 to 64 Years | 56 (7.3%) | 76 (11.7%) |
| 65 to 69 Years | 73 (9.6%) | 36 (5.5%) |
| 70 to 74 Years | 12 (1.6%) | 13 (2.0%) |
| 75 to 79 Years | 11 (1.4%) | 0 (0.0%) |
| 80 to 84 Years | 0 (0.0%) | 0 (0.0%) |
| 85 Years and over | 0 (0.0%) | 0 (0.0%) |
| Total | 763 (100.0%) | 650 (100.0%) |
Families and Households in Nederland
Median Family Size in Nederland
The median family size in Nederland is 2.77 persons per family, with single male/father families (27 | 6.7%) accounting for the largest median family size of 3.11 persons per family. On the other hand, single female/mother families (24 | 6.0%) represent the smallest median family size with 2.38 persons per family.
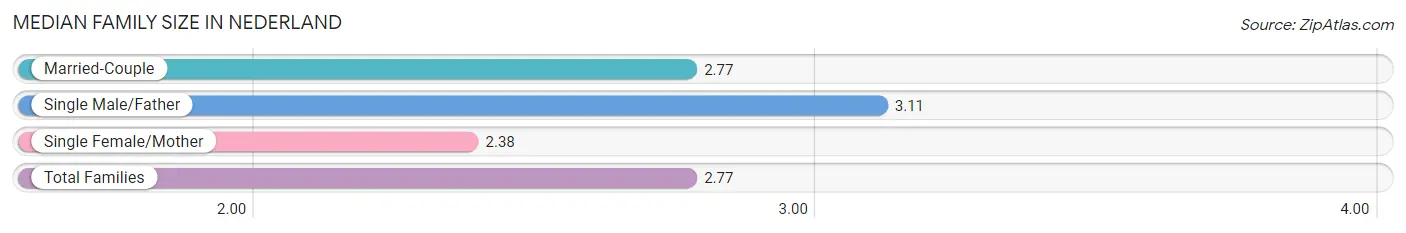
| Family Type | # Families | Family Size |
| Married-Couple | 351 (87.3%) | 2.77 |
| Single Male/Father | 27 (6.7%) | 3.11 |
| Single Female/Mother | 24 (6.0%) | 2.38 |
| Total Families | 402 (100.0%) | 2.77 |
Median Household Size in Nederland
The median household size in Nederland is 2.32 persons per household, with single male/father households (27 | 4.4%) accounting for the largest median household size of 4.04 persons per household. non-family households (207 | 34.0%) represent the smallest median household size with 1.09 persons per household.
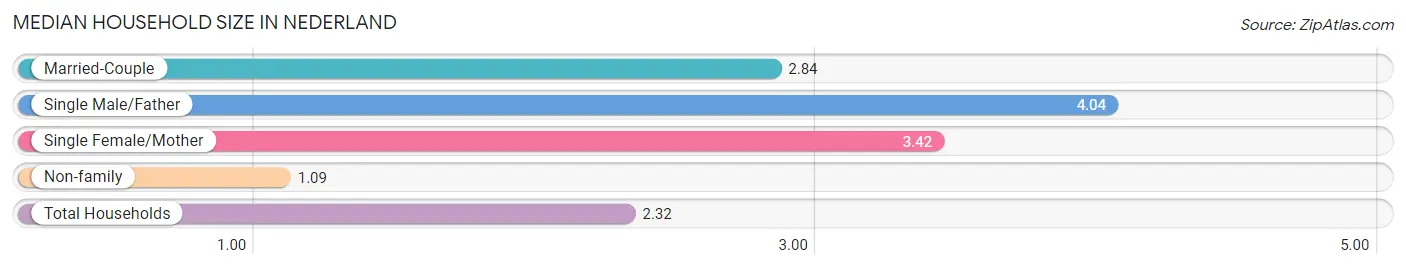
| Household Type | # Households | Household Size |
| Married-Couple | 351 (57.6%) | 2.84 |
| Single Male/Father | 27 (4.4%) | 4.04 |
| Single Female/Mother | 24 (3.9%) | 3.42 |
| Non-family | 207 (34.0%) | 1.09 |
| Total Households | 609 (100.0%) | 2.32 |
Household Size by Marriage Status in Nederland
Out of a total of 609 households in Nederland, 402 (66.0%) are family households, while 207 (34.0%) are nonfamily households. The most numerous type of family households are 2-person households, comprising 186, and the most common type of nonfamily households are 1-person households, comprising 189.
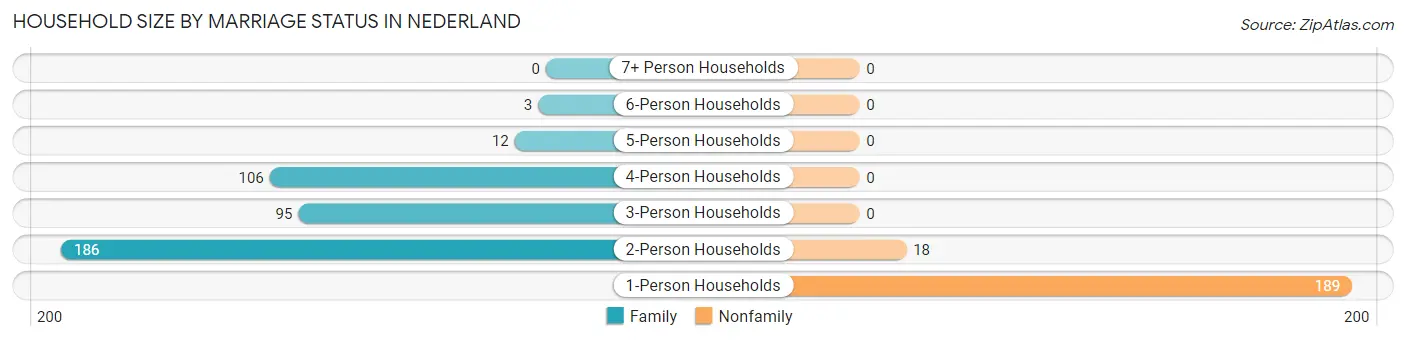
| Household Size | Family Households | Nonfamily Households |
| 1-Person Households | - | 189 (31.0%) |
| 2-Person Households | 186 (30.5%) | 18 (3.0%) |
| 3-Person Households | 95 (15.6%) | 0 (0.0%) |
| 4-Person Households | 106 (17.4%) | 0 (0.0%) |
| 5-Person Households | 12 (2.0%) | 0 (0.0%) |
| 6-Person Households | 3 (0.5%) | 0 (0.0%) |
| 7+ Person Households | 0 (0.0%) | 0 (0.0%) |
| Total | 402 (66.0%) | 207 (34.0%) |
Female Fertility in Nederland
Fertility by Age in Nederland
Average fertility rate in Nederland is 53.0 births per 1,000 women. Women in the age bracket of 35 to 50 years have the highest fertility rate with 79.0 births per 1,000 women. Women in the age bracket of 35 to 50 years acount for 100.0% of all women with births.
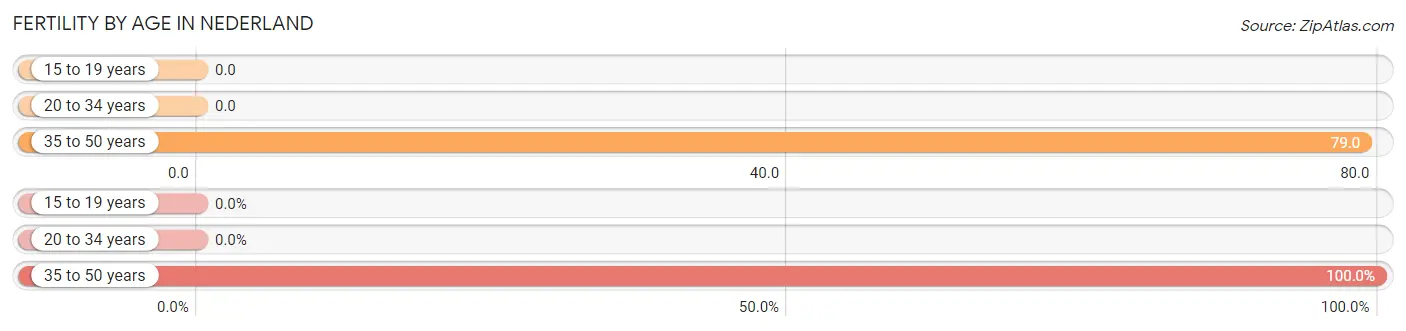
| Age Bracket | Women with Births | Births / 1,000 Women |
| 15 to 19 years | 0 (0.0%) | 0.0 |
| 20 to 34 years | 0 (0.0%) | 0.0 |
| 35 to 50 years | 16 (100.0%) | 79.0 |
| Total | 16 (100.0%) | 53.0 |
Fertility by Age by Marriage Status in Nederland
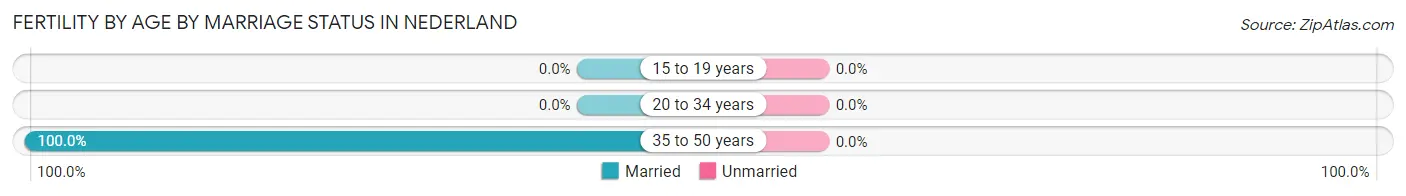
| Age Bracket | Married | Unmarried |
| 15 to 19 years | 0 (0.0%) | 0 (0.0%) |
| 20 to 34 years | 0 (0.0%) | 0 (0.0%) |
| 35 to 50 years | 16 (100.0%) | 0 (0.0%) |
| Total | 16 (100.0%) | 0 (0.0%) |
Fertility by Education in Nederland
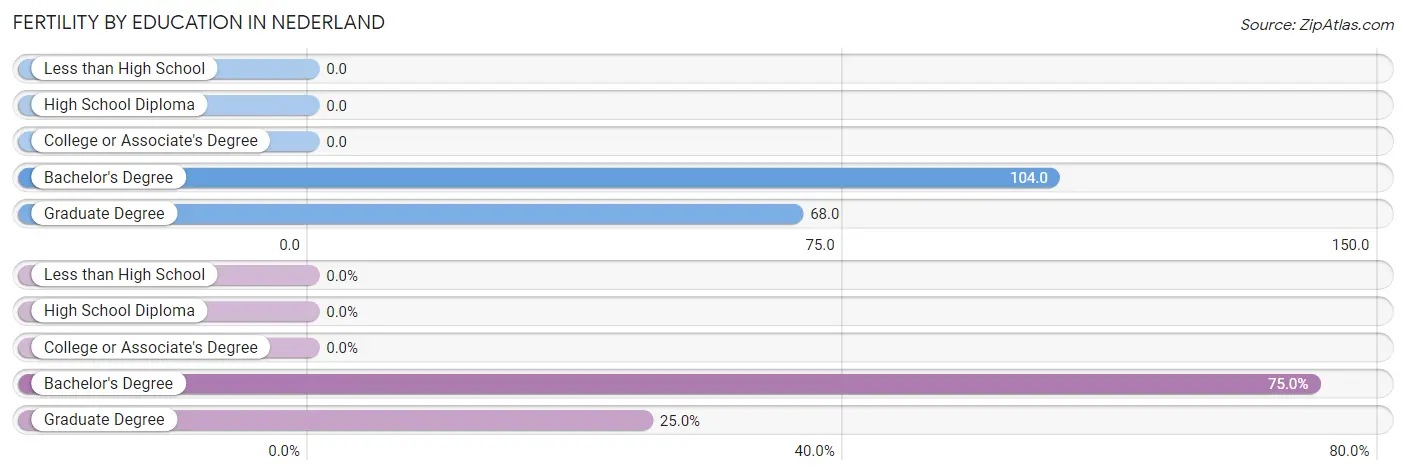
| Educational Attainment | Women with Births | Births / 1,000 Women |
| Less than High School | 0 (0.0%) | 0.0 |
| High School Diploma | 0 (0.0%) | 0.0 |
| College or Associate's Degree | 0 (0.0%) | 0.0 |
| Bachelor's Degree | 12 (75.0%) | 104.0 |
| Graduate Degree | 4 (25.0%) | 68.0 |
| Total | 16 (100.0%) | 53.0 |
Fertility by Education by Marriage Status in Nederland
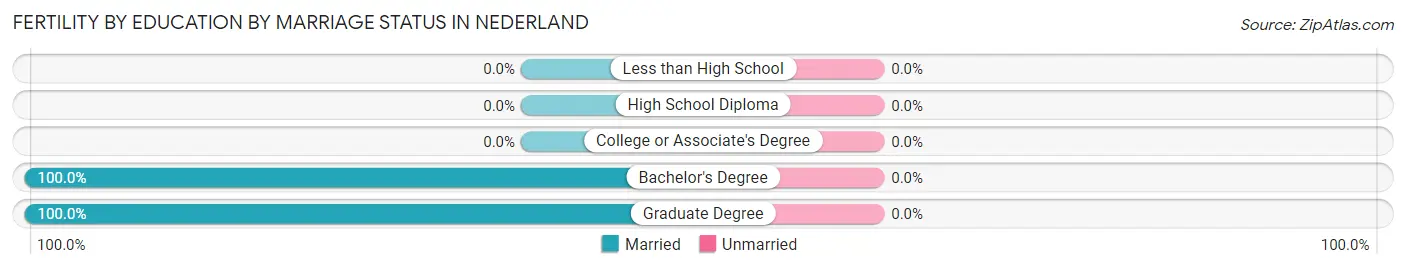
| Educational Attainment | Married | Unmarried |
| Less than High School | 0 (0.0%) | 0 (0.0%) |
| High School Diploma | 0 (0.0%) | 0 (0.0%) |
| College or Associate's Degree | 0 (0.0%) | 0 (0.0%) |
| Bachelor's Degree | 12 (100.0%) | 0 (0.0%) |
| Graduate Degree | 4 (100.0%) | 0 (0.0%) |
| Total | 16 (100.0%) | 0 (0.0%) |
Employment Characteristics in Nederland
Employment by Class of Employer in Nederland
Among the 829 employed individuals in Nederland, private company employees (518 | 62.5%), self-employed (incorporated) (96 | 11.6%), and local government employees (67 | 8.1%) make up the most common classes of employment.
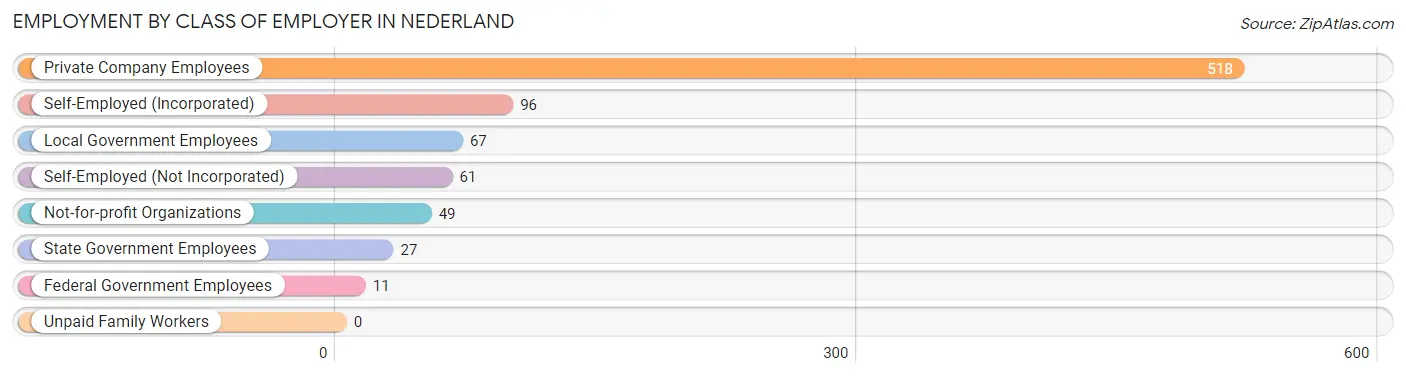
| Employer Class | # Employees | % Employees |
| Private Company Employees | 518 | 62.5% |
| Self-Employed (Incorporated) | 96 | 11.6% |
| Self-Employed (Not Incorporated) | 61 | 7.4% |
| Not-for-profit Organizations | 49 | 5.9% |
| Local Government Employees | 67 | 8.1% |
| State Government Employees | 27 | 3.3% |
| Federal Government Employees | 11 | 1.3% |
| Unpaid Family Workers | 0 | 0.0% |
| Total | 829 | 100.0% |
Employment Status by Age in Nederland
According to the labor force statistics for Nederland, out of the total population over 16 years of age (1,142), 79.2% or 904 individuals are in the labor force, with 2.5% or 23 of them unemployed. The age group with the highest labor force participation rate is 20 to 24 years, with 100.0% or 14 individuals in the labor force. Within the labor force, the 65 to 74 years age range has the highest percentage of unemployed individuals, with 35.1% or 13 of them being unemployed.
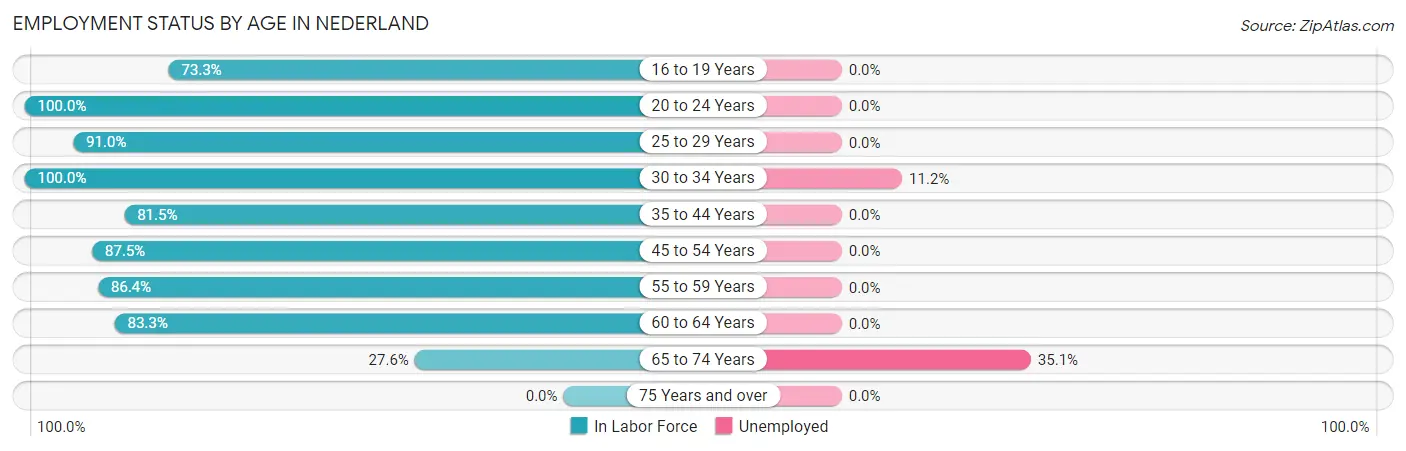
| Age Bracket | In Labor Force | Unemployed |
| 16 to 19 Years | 22 (73.3%) | 0 (0.0%) |
| 20 to 24 Years | 14 (100.0%) | 0 (0.0%) |
| 25 to 29 Years | 91 (91.0%) | 0 (0.0%) |
| 30 to 34 Years | 89 (100.0%) | 10 (11.2%) |
| 35 to 44 Years | 128 (81.5%) | 0 (0.0%) |
| 45 to 54 Years | 223 (87.5%) | 0 (0.0%) |
| 55 to 59 Years | 190 (86.4%) | 0 (0.0%) |
| 60 to 64 Years | 110 (83.3%) | 0 (0.0%) |
| 65 to 74 Years | 37 (27.6%) | 13 (35.1%) |
| 75 Years and over | 0 (0.0%) | 0 (0.0%) |
| Total | 904 (79.2%) | 23 (2.5%) |
Employment Status by Educational Attainment in Nederland
According to labor force statistics for Nederland, 87.2% of individuals (831) out of the total population between 25 and 64 years of age (953) are in the labor force, with 1.2% or 10 of them being unemployed. The group with the highest labor force participation rate are those with the educational attainment of less than high school, with 100.0% or 20 individuals in the labor force. Within the labor force, individuals with high school diploma education have the highest percentage of unemployment, with 7.0% or 10 of them being unemployed.
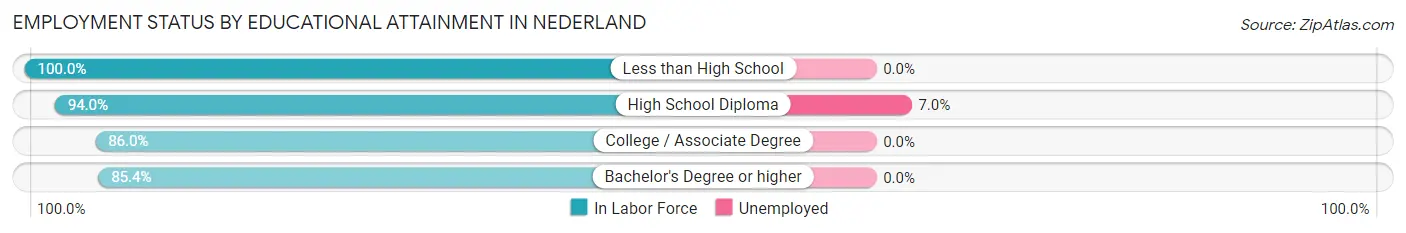
| Educational Attainment | In Labor Force | Unemployed |
| Less than High School | 20 (100.0%) | 0 (0.0%) |
| High School Diploma | 142 (94.0%) | 11 (7.0%) |
| College / Associate Degree | 154 (86.0%) | 0 (0.0%) |
| Bachelor's Degree or higher | 515 (85.4%) | 0 (0.0%) |
| Total | 831 (87.2%) | 11 (1.2%) |
Employment Occupations by Sex in Nederland
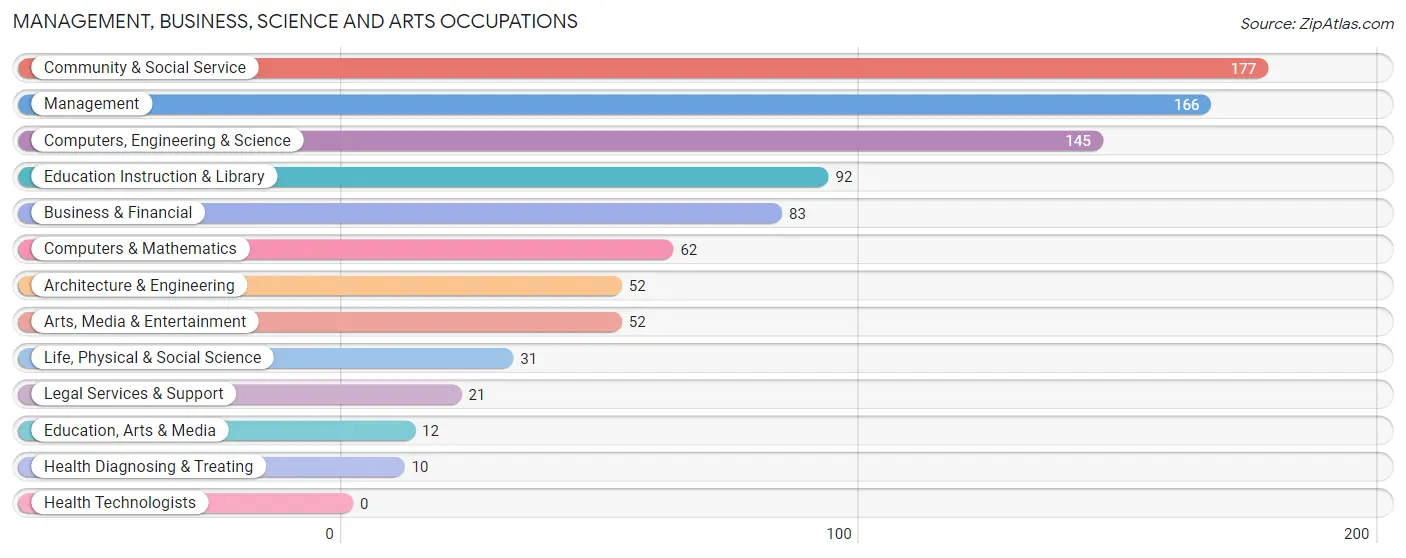
Management, Business, Science and Arts Occupations
The most common Management, Business, Science and Arts occupations in Nederland are Community & Social Service (177 | 20.1%), Management (166 | 18.8%), Computers, Engineering & Science (145 | 16.5%), Education Instruction & Library (92 | 10.4%), and Business & Financial (83 | 9.4%).
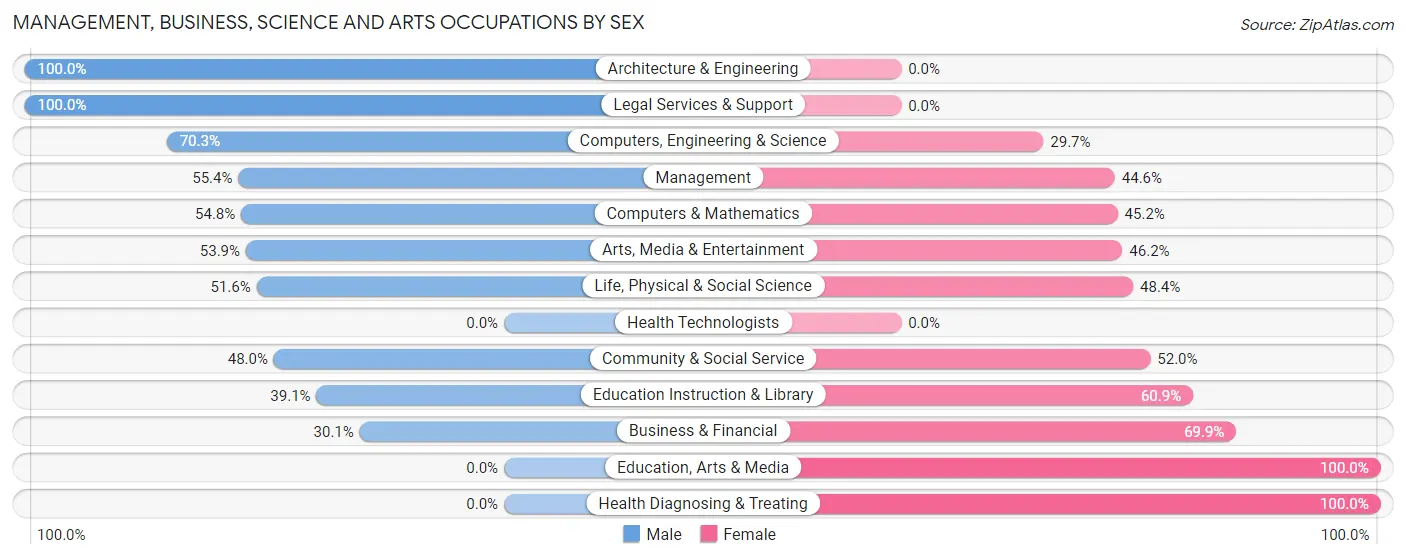
Management, Business, Science and Arts Occupations by Sex
Within the Management, Business, Science and Arts occupations in Nederland, the most male-oriented occupations are Architecture & Engineering (100.0%), Legal Services & Support (100.0%), and Computers, Engineering & Science (70.3%), while the most female-oriented occupations are Education, Arts & Media (100.0%), Health Diagnosing & Treating (100.0%), and Business & Financial (69.9%).
| Occupation | Male | Female |
| Management | 92 (55.4%) | 74 (44.6%) |
| Business & Financial | 25 (30.1%) | 58 (69.9%) |
| Computers, Engineering & Science | 102 (70.3%) | 43 (29.7%) |
| Computers & Mathematics | 34 (54.8%) | 28 (45.2%) |
| Architecture & Engineering | 52 (100.0%) | 0 (0.0%) |
| Life, Physical & Social Science | 16 (51.6%) | 15 (48.4%) |
| Community & Social Service | 85 (48.0%) | 92 (52.0%) |
| Education, Arts & Media | 0 (0.0%) | 12 (100.0%) |
| Legal Services & Support | 21 (100.0%) | 0 (0.0%) |
| Education Instruction & Library | 36 (39.1%) | 56 (60.9%) |
| Arts, Media & Entertainment | 28 (53.8%) | 24 (46.2%) |
| Health Diagnosing & Treating | 0 (0.0%) | 10 (100.0%) |
| Health Technologists | 0 (0.0%) | 0 (0.0%) |
| Total (Category) | 304 (52.3%) | 277 (47.7%) |
| Total (Overall) | 468 (53.1%) | 413 (46.9%) |
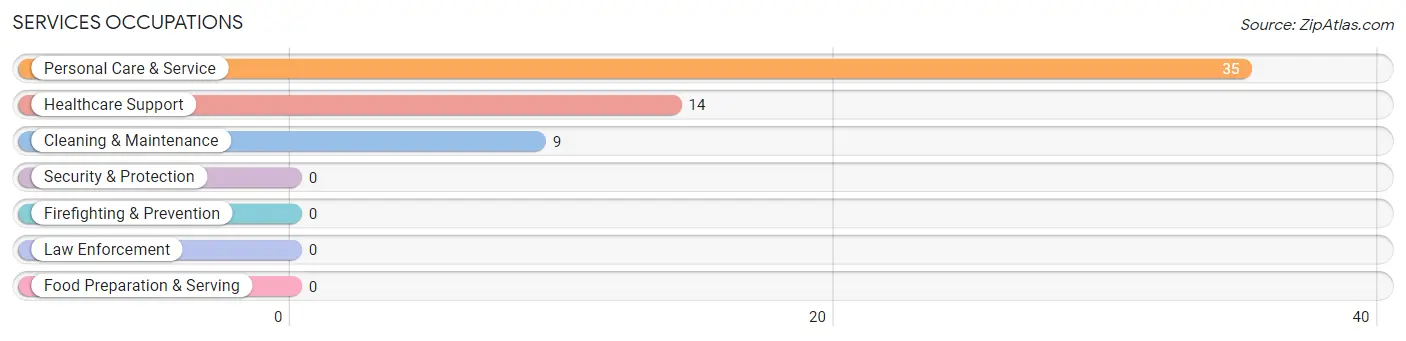
Services Occupations
The most common Services occupations in Nederland are Personal Care & Service (35 | 4.0%), Healthcare Support (14 | 1.6%), and Cleaning & Maintenance (9 | 1.0%).
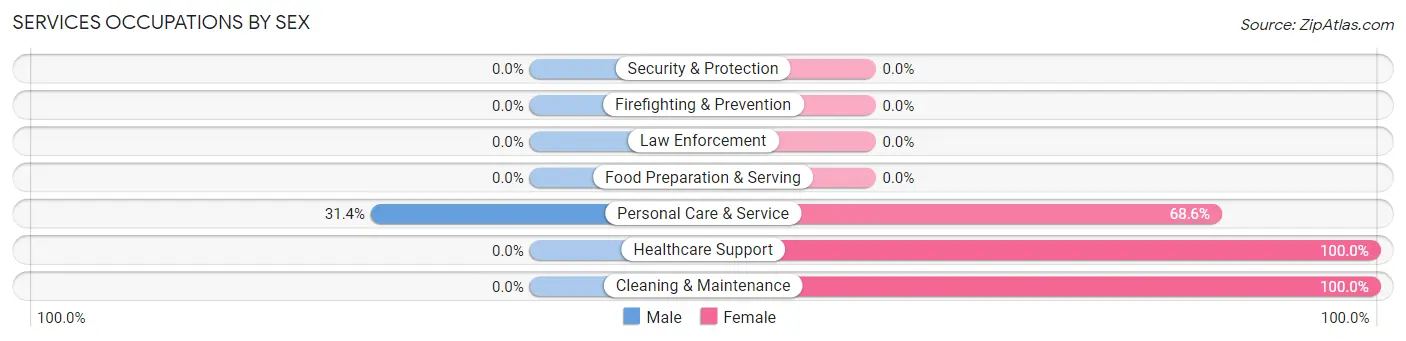
Services Occupations by Sex
| Occupation | Male | Female |
| Healthcare Support | 0 (0.0%) | 14 (100.0%) |
| Security & Protection | 0 (0.0%) | 0 (0.0%) |
| Firefighting & Prevention | 0 (0.0%) | 0 (0.0%) |
| Law Enforcement | 0 (0.0%) | 0 (0.0%) |
| Food Preparation & Serving | 0 (0.0%) | 0 (0.0%) |
| Cleaning & Maintenance | 0 (0.0%) | 9 (100.0%) |
| Personal Care & Service | 11 (31.4%) | 24 (68.6%) |
| Total (Category) | 11 (19.0%) | 47 (81.0%) |
| Total (Overall) | 468 (53.1%) | 413 (46.9%) |
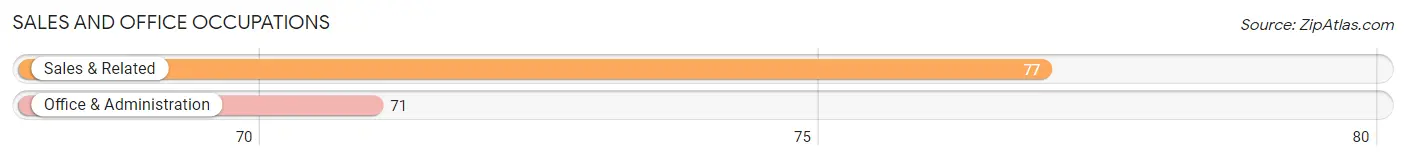
Sales and Office Occupations
The most common Sales and Office occupations in Nederland are Sales & Related (77 | 8.7%), and Office & Administration (71 | 8.1%).
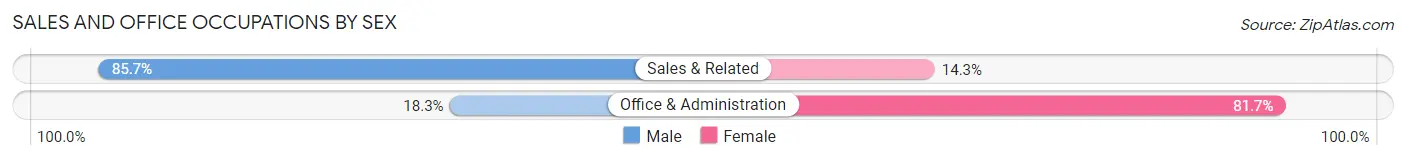
Sales and Office Occupations by Sex
| Occupation | Male | Female |
| Sales & Related | 66 (85.7%) | 11 (14.3%) |
| Office & Administration | 13 (18.3%) | 58 (81.7%) |
| Total (Category) | 79 (53.4%) | 69 (46.6%) |
| Total (Overall) | 468 (53.1%) | 413 (46.9%) |
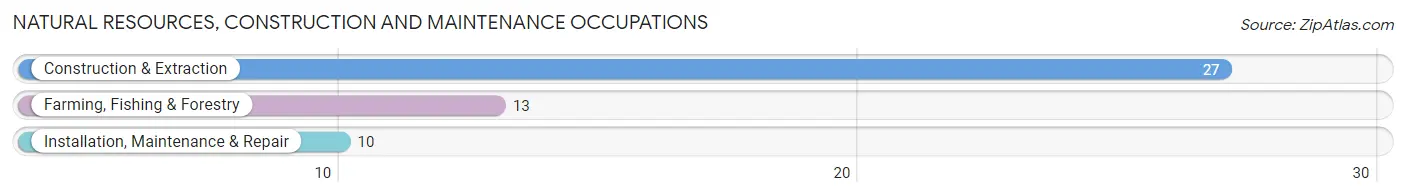
Natural Resources, Construction and Maintenance Occupations
The most common Natural Resources, Construction and Maintenance occupations in Nederland are Construction & Extraction (27 | 3.1%), Farming, Fishing & Forestry (13 | 1.5%), and Installation, Maintenance & Repair (10 | 1.1%).
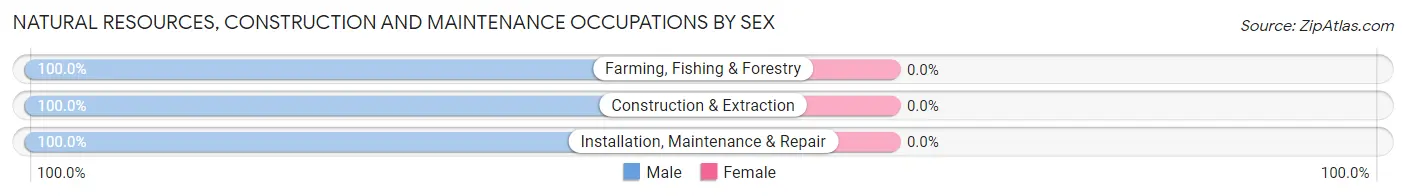
Natural Resources, Construction and Maintenance Occupations by Sex
| Occupation | Male | Female |
| Farming, Fishing & Forestry | 13 (100.0%) | 0 (0.0%) |
| Construction & Extraction | 27 (100.0%) | 0 (0.0%) |
| Installation, Maintenance & Repair | 10 (100.0%) | 0 (0.0%) |
| Total (Category) | 50 (100.0%) | 0 (0.0%) |
| Total (Overall) | 468 (53.1%) | 413 (46.9%) |
Production, Transportation and Moving Occupations
The most common Production, Transportation and Moving occupations in Nederland are Transportation (33 | 3.7%), and Production (11 | 1.3%).
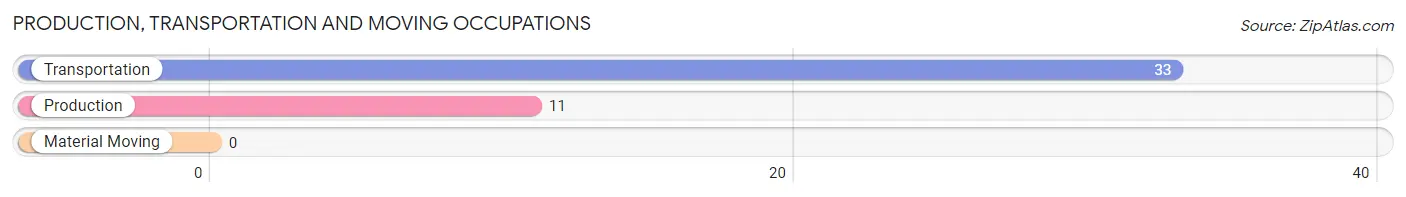
Production, Transportation and Moving Occupations by Sex
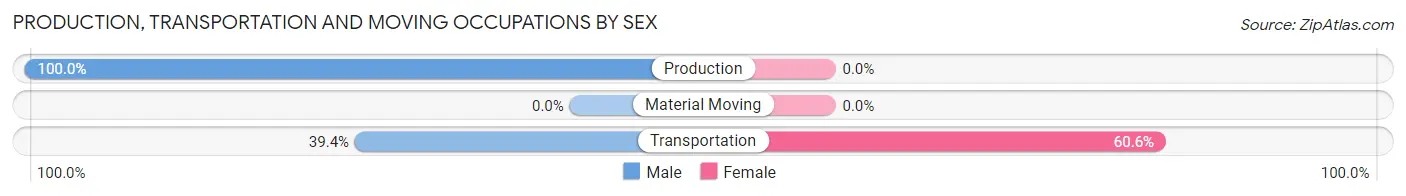
| Occupation | Male | Female |
| Production | 11 (100.0%) | 0 (0.0%) |
| Transportation | 13 (39.4%) | 20 (60.6%) |
| Material Moving | 0 (0.0%) | 0 (0.0%) |
| Total (Category) | 24 (54.5%) | 20 (45.5%) |
| Total (Overall) | 468 (53.1%) | 413 (46.9%) |
Employment Industries by Sex in Nederland
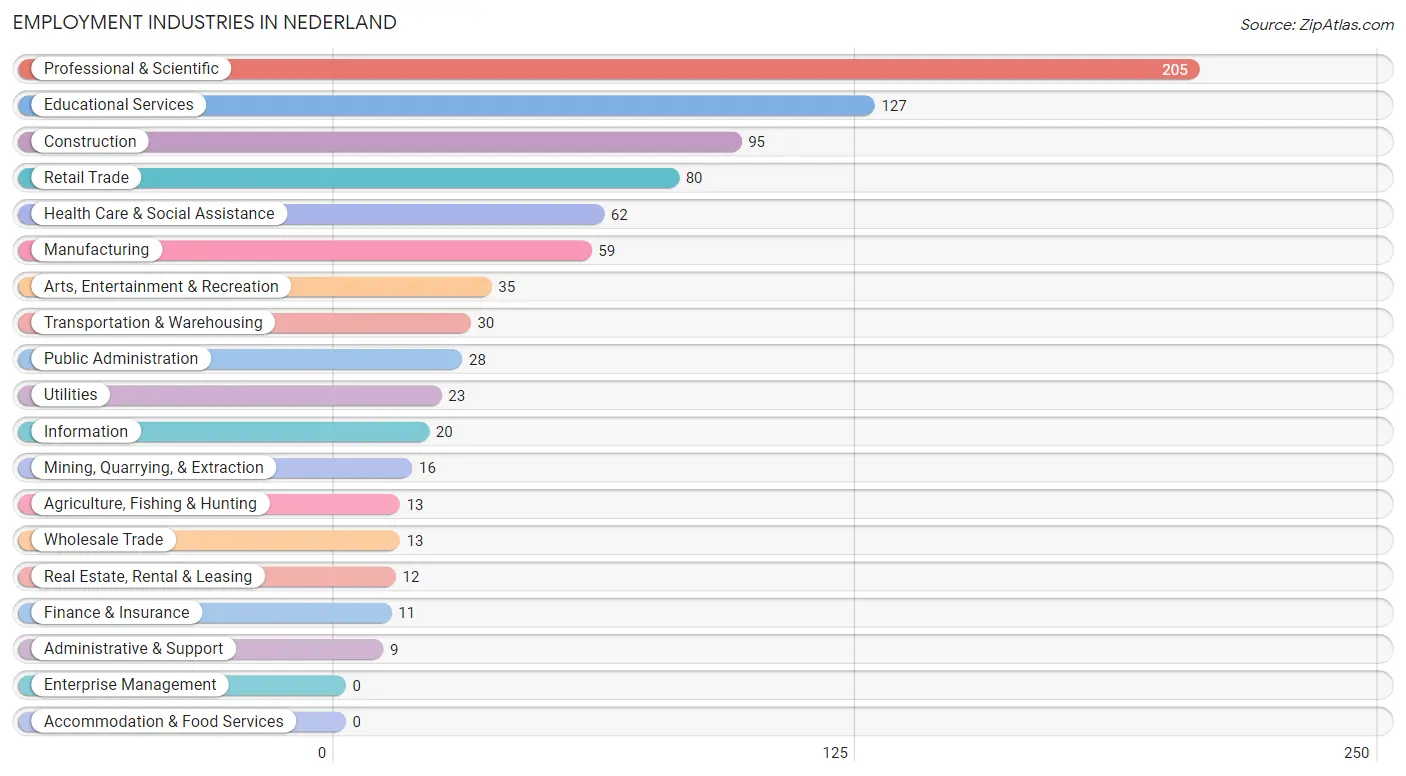
Employment Industries in Nederland
The major employment industries in Nederland include Professional & Scientific (205 | 23.3%), Educational Services (127 | 14.4%), Construction (95 | 10.8%), Retail Trade (80 | 9.1%), and Health Care & Social Assistance (62 | 7.0%).
Employment Industries by Sex in Nederland
The Nederland industries that see more men than women are Agriculture, Fishing & Hunting (100.0%), Manufacturing (100.0%), and Wholesale Trade (100.0%), whereas the industries that tend to have a higher number of women are Information (100.0%), Finance & Insurance (100.0%), and Real Estate, Rental & Leasing (100.0%).
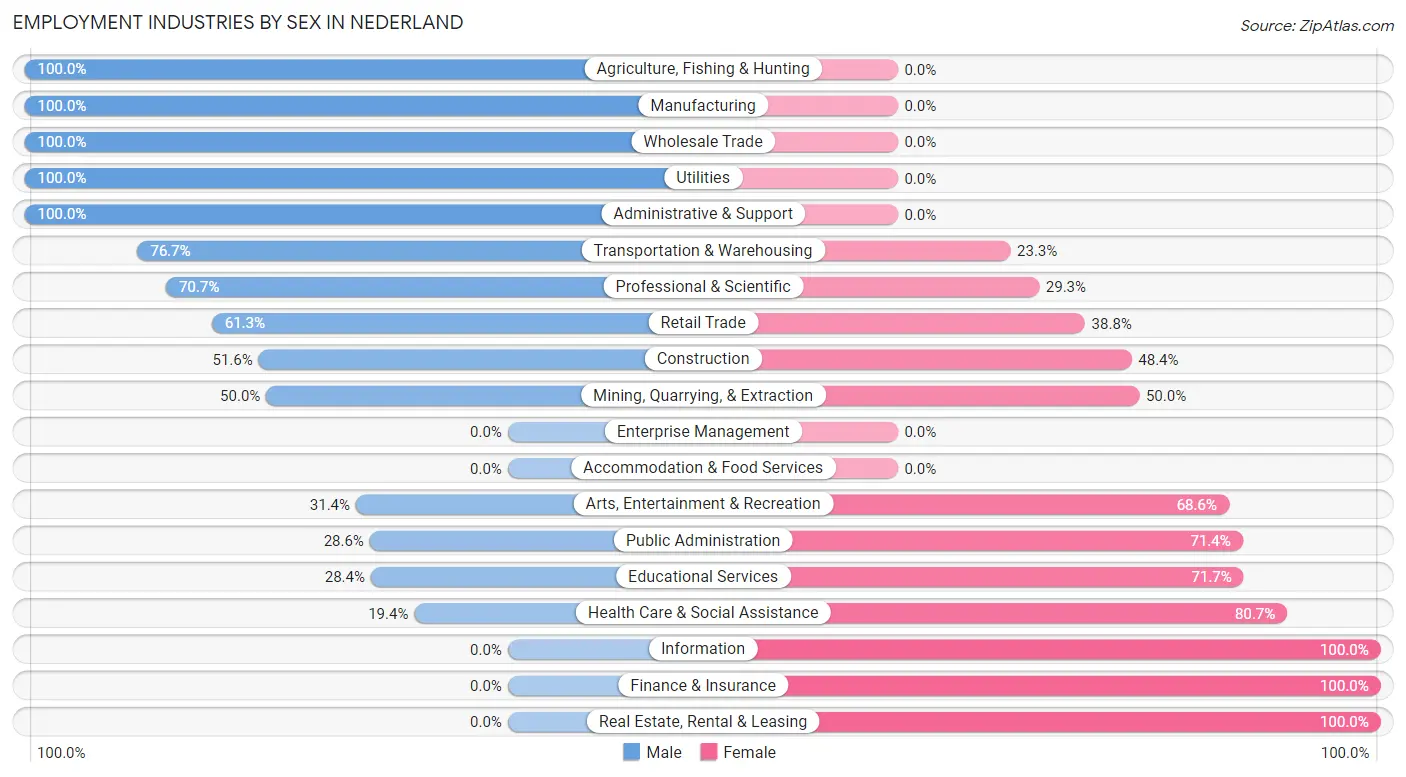
| Industry | Male | Female |
| Agriculture, Fishing & Hunting | 13 (100.0%) | 0 (0.0%) |
| Mining, Quarrying, & Extraction | 8 (50.0%) | 8 (50.0%) |
| Construction | 49 (51.6%) | 46 (48.4%) |
| Manufacturing | 59 (100.0%) | 0 (0.0%) |
| Wholesale Trade | 13 (100.0%) | 0 (0.0%) |
| Retail Trade | 49 (61.3%) | 31 (38.8%) |
| Transportation & Warehousing | 23 (76.7%) | 7 (23.3%) |
| Utilities | 23 (100.0%) | 0 (0.0%) |
| Information | 0 (0.0%) | 20 (100.0%) |
| Finance & Insurance | 0 (0.0%) | 11 (100.0%) |
| Real Estate, Rental & Leasing | 0 (0.0%) | 12 (100.0%) |
| Professional & Scientific | 145 (70.7%) | 60 (29.3%) |
| Enterprise Management | 0 (0.0%) | 0 (0.0%) |
| Administrative & Support | 9 (100.0%) | 0 (0.0%) |
| Educational Services | 36 (28.3%) | 91 (71.7%) |
| Health Care & Social Assistance | 12 (19.4%) | 50 (80.6%) |
| Arts, Entertainment & Recreation | 11 (31.4%) | 24 (68.6%) |
| Accommodation & Food Services | 0 (0.0%) | 0 (0.0%) |
| Public Administration | 8 (28.6%) | 20 (71.4%) |
| Total | 468 (53.1%) | 413 (46.9%) |
Education in Nederland
School Enrollment in Nederland
The most common levels of schooling among the 293 students in Nederland are elementary school (71 | 24.2%), college / undergraduate (70 | 23.9%), and middle school (57 | 19.5%).
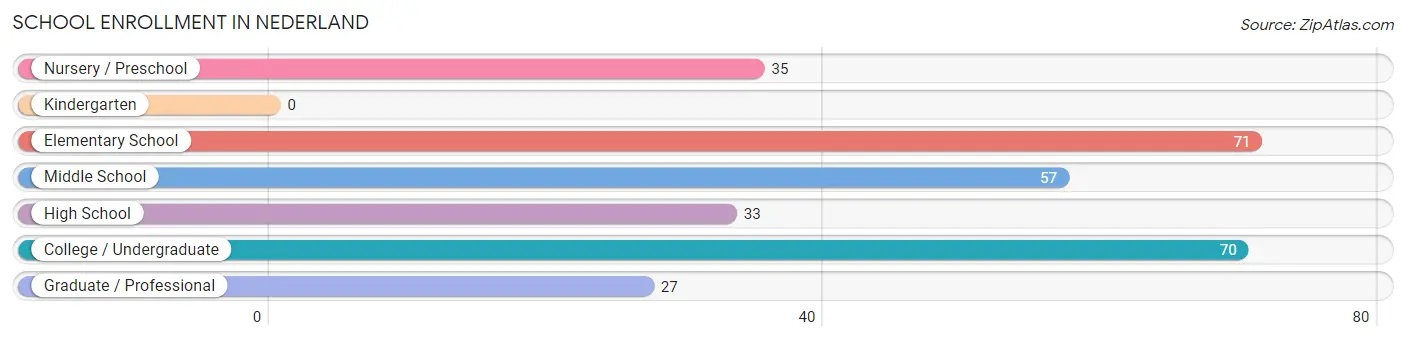
| School Level | # Students | % Students |
| Nursery / Preschool | 35 | 11.9% |
| Kindergarten | 0 | 0.0% |
| Elementary School | 71 | 24.2% |
| Middle School | 57 | 19.5% |
| High School | 33 | 11.3% |
| College / Undergraduate | 70 | 23.9% |
| Graduate / Professional | 27 | 9.2% |
| Total | 293 | 100.0% |
School Enrollment by Age by Funding Source in Nederland
Out of a total of 293 students who are enrolled in schools in Nederland, 65 (22.2%) attend a private institution, while the remaining 228 (77.8%) are enrolled in public schools. The age group of 20 to 24 year olds has the highest likelihood of being enrolled in private schools, with 14 (100.0% in the age bracket) enrolled. Conversely, the age group of 10 to 14 year olds has the lowest likelihood of being enrolled in a private school, with 70 (100.0% in the age bracket) attending a public institution.
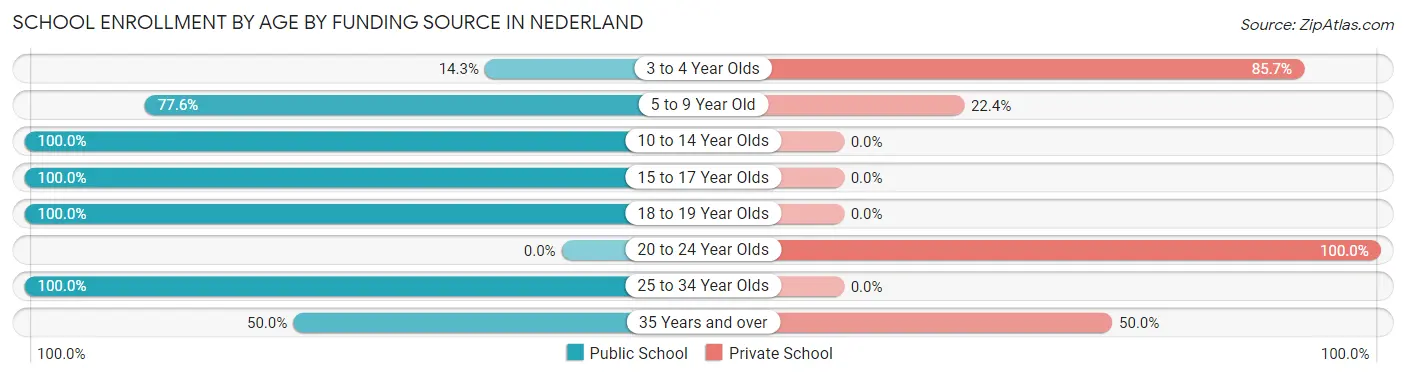
| Age Bracket | Public School | Private School |
| 3 to 4 Year Olds | 5 (14.3%) | 30 (85.7%) |
| 5 to 9 Year Old | 45 (77.6%) | 13 (22.4%) |
| 10 to 14 Year Olds | 70 (100.0%) | 0 (0.0%) |
| 15 to 17 Year Olds | 25 (100.0%) | 0 (0.0%) |
| 18 to 19 Year Olds | 30 (100.0%) | 0 (0.0%) |
| 20 to 24 Year Olds | 0 (0.0%) | 14 (100.0%) |
| 25 to 34 Year Olds | 45 (100.0%) | 0 (0.0%) |
| 35 Years and over | 8 (50.0%) | 8 (50.0%) |
| Total | 228 (77.8%) | 65 (22.2%) |
Educational Attainment by Field of Study in Nederland
Business (152 | 20.0%), bio, nature & agricultural (93 | 12.2%), social sciences (80 | 10.5%), engineering (61 | 8.0%), and computers & mathematics (55 | 7.2%) are the most common fields of study among 759 individuals in Nederland who have obtained a bachelor's degree or higher.
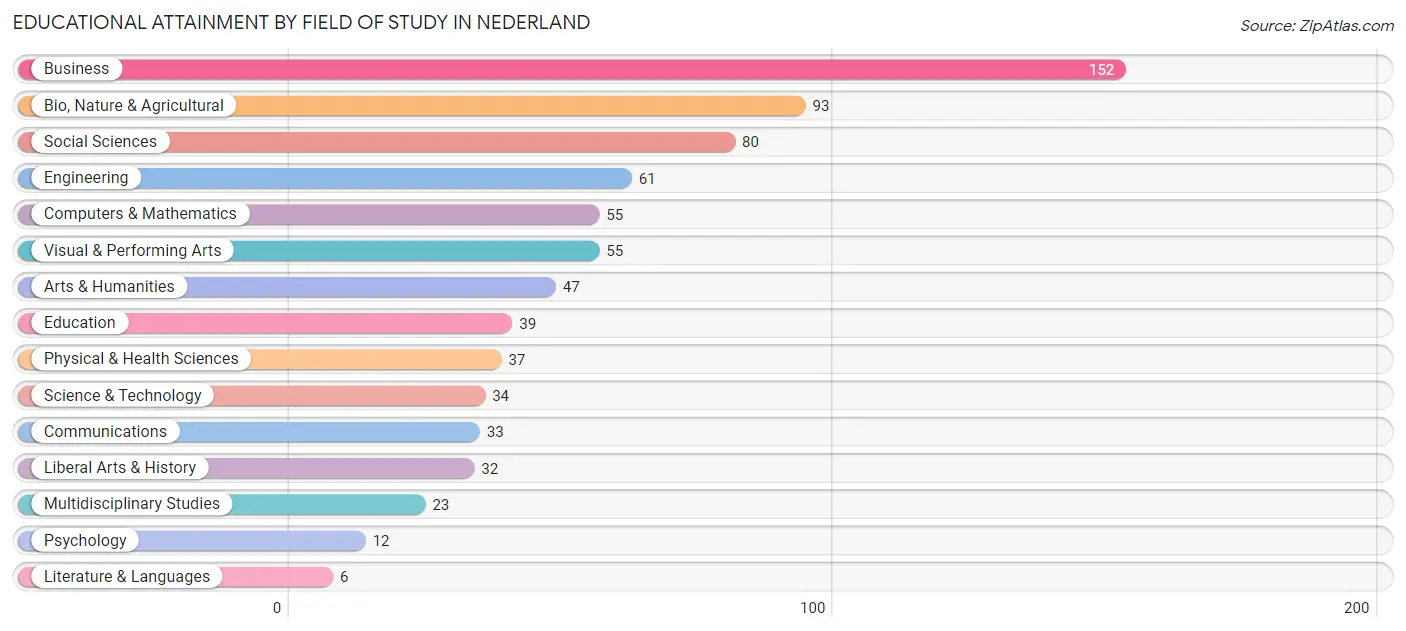
| Field of Study | # Graduates | % Graduates |
| Computers & Mathematics | 55 | 7.2% |
| Bio, Nature & Agricultural | 93 | 12.2% |
| Physical & Health Sciences | 37 | 4.9% |
| Psychology | 12 | 1.6% |
| Social Sciences | 80 | 10.5% |
| Engineering | 61 | 8.0% |
| Multidisciplinary Studies | 23 | 3.0% |
| Science & Technology | 34 | 4.5% |
| Business | 152 | 20.0% |
| Education | 39 | 5.1% |
| Literature & Languages | 6 | 0.8% |
| Liberal Arts & History | 32 | 4.2% |
| Visual & Performing Arts | 55 | 7.2% |
| Communications | 33 | 4.3% |
| Arts & Humanities | 47 | 6.2% |
| Total | 759 | 100.0% |
Transportation & Commute in Nederland
Vehicle Availability by Sex in Nederland
The most prevalent vehicle ownership categories in Nederland are males with 2 vehicles (209, accounting for 44.7%) and females with 2 vehicles (192, making up 57.9%).
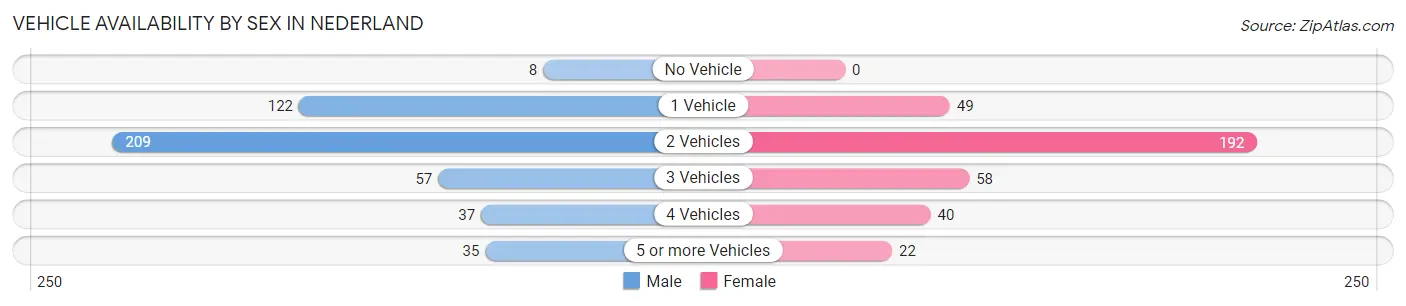
| Vehicles Available | Male | Female |
| No Vehicle | 8 (1.7%) | 0 (0.0%) |
| 1 Vehicle | 122 (26.1%) | 49 (13.6%) |
| 2 Vehicles | 209 (44.7%) | 192 (53.2%) |
| 3 Vehicles | 57 (12.2%) | 58 (16.1%) |
| 4 Vehicles | 37 (7.9%) | 40 (11.1%) |
| 5 or more Vehicles | 35 (7.5%) | 22 (6.1%) |
| Total | 468 (100.0%) | 361 (100.0%) |
Commute Time in Nederland
The most frequently occuring commute durations in Nederland are 10 to 14 minutes (114 commuters, 23.0%), 30 to 34 minutes (94 commuters, 19.0%), and 60 to 89 minutes (66 commuters, 13.3%).
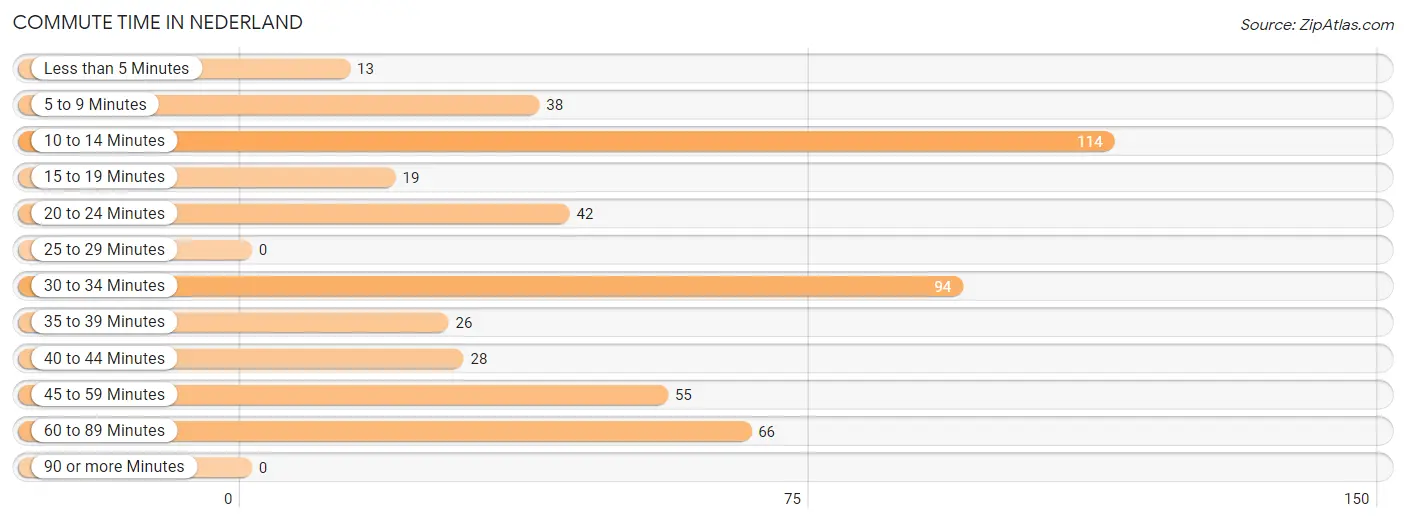
| Commute Time | # Commuters | % Commuters |
| Less than 5 Minutes | 13 | 2.6% |
| 5 to 9 Minutes | 38 | 7.7% |
| 10 to 14 Minutes | 114 | 23.0% |
| 15 to 19 Minutes | 19 | 3.8% |
| 20 to 24 Minutes | 42 | 8.5% |
| 25 to 29 Minutes | 0 | 0.0% |
| 30 to 34 Minutes | 94 | 19.0% |
| 35 to 39 Minutes | 26 | 5.2% |
| 40 to 44 Minutes | 28 | 5.7% |
| 45 to 59 Minutes | 55 | 11.1% |
| 60 to 89 Minutes | 66 | 13.3% |
| 90 or more Minutes | 0 | 0.0% |
Commute Time by Sex in Nederland
The most common commute times in Nederland are 10 to 14 minutes (114 commuters, 38.4%) for males and 60 to 89 minutes (40 commuters, 20.2%) for females.
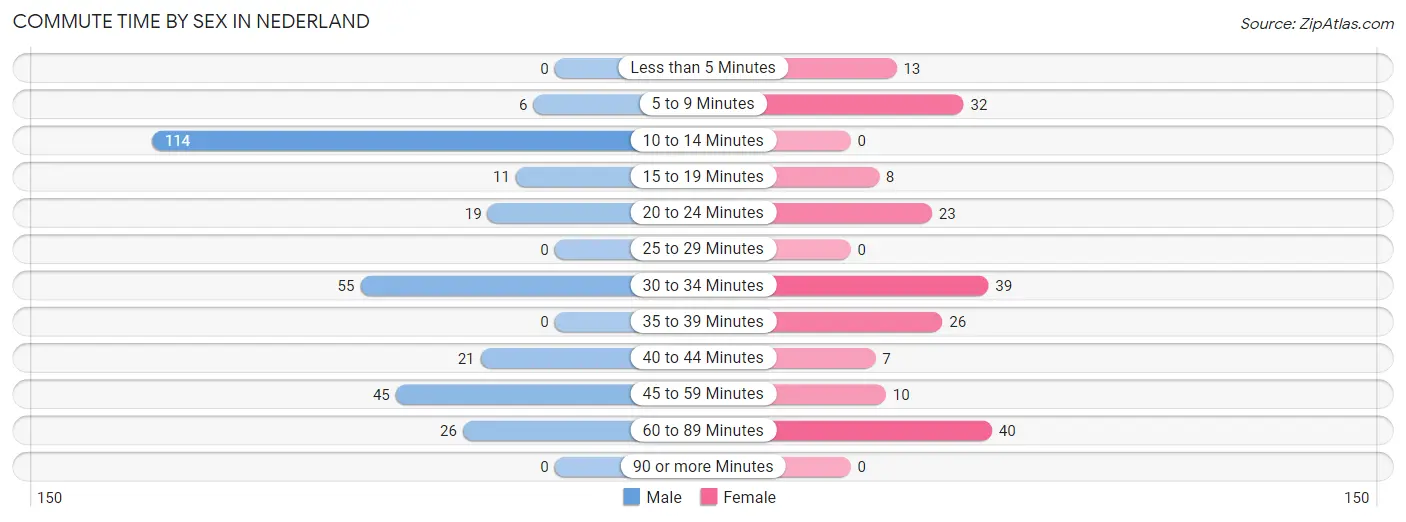
| Commute Time | Male | Female |
| Less than 5 Minutes | 0 (0.0%) | 13 (6.6%) |
| 5 to 9 Minutes | 6 (2.0%) | 32 (16.2%) |
| 10 to 14 Minutes | 114 (38.4%) | 0 (0.0%) |
| 15 to 19 Minutes | 11 (3.7%) | 8 (4.0%) |
| 20 to 24 Minutes | 19 (6.4%) | 23 (11.6%) |
| 25 to 29 Minutes | 0 (0.0%) | 0 (0.0%) |
| 30 to 34 Minutes | 55 (18.5%) | 39 (19.7%) |
| 35 to 39 Minutes | 0 (0.0%) | 26 (13.1%) |
| 40 to 44 Minutes | 21 (7.1%) | 7 (3.5%) |
| 45 to 59 Minutes | 45 (15.1%) | 10 (5.1%) |
| 60 to 89 Minutes | 26 (8.7%) | 40 (20.2%) |
| 90 or more Minutes | 0 (0.0%) | 0 (0.0%) |
Time of Departure to Work by Sex in Nederland
The most frequent times of departure to work in Nederland are 7:30 AM to 7:59 AM (70, 23.6%) for males and 5:00 AM to 5:29 AM (37, 18.7%) for females.
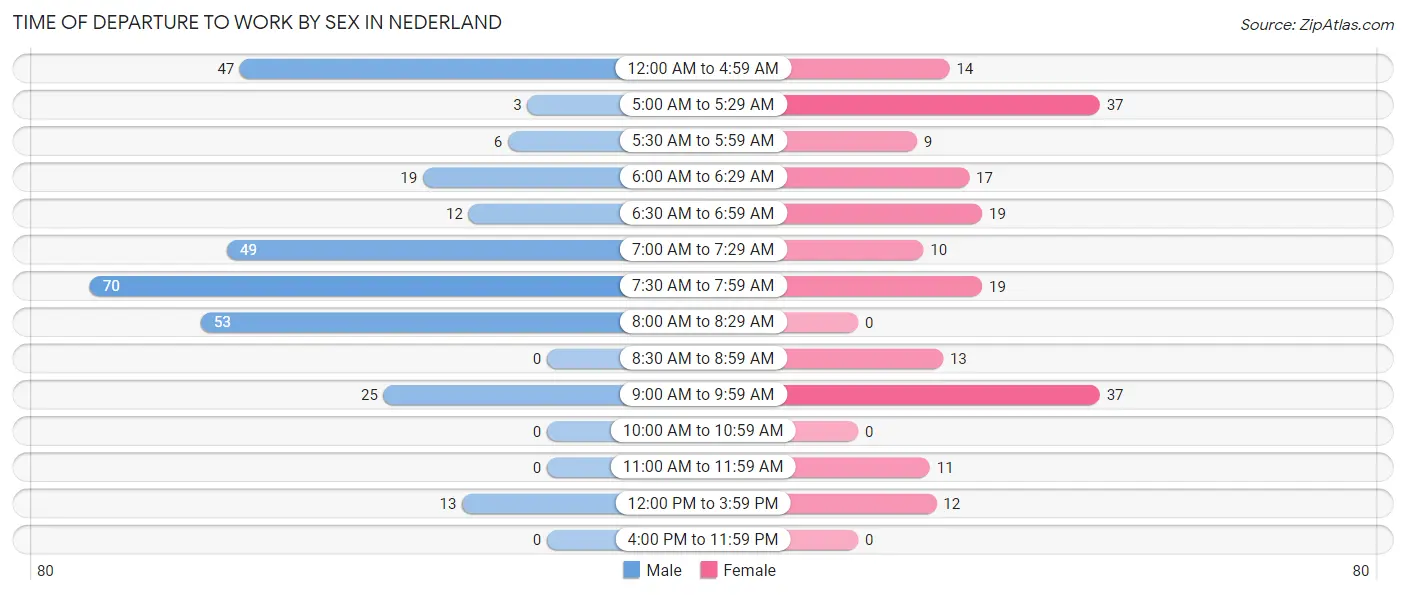
| Time of Departure | Male | Female |
| 12:00 AM to 4:59 AM | 47 (15.8%) | 14 (7.1%) |
| 5:00 AM to 5:29 AM | 3 (1.0%) | 37 (18.7%) |
| 5:30 AM to 5:59 AM | 6 (2.0%) | 9 (4.5%) |
| 6:00 AM to 6:29 AM | 19 (6.4%) | 17 (8.6%) |
| 6:30 AM to 6:59 AM | 12 (4.0%) | 19 (9.6%) |
| 7:00 AM to 7:29 AM | 49 (16.5%) | 10 (5.1%) |
| 7:30 AM to 7:59 AM | 70 (23.6%) | 19 (9.6%) |
| 8:00 AM to 8:29 AM | 53 (17.8%) | 0 (0.0%) |
| 8:30 AM to 8:59 AM | 0 (0.0%) | 13 (6.6%) |
| 9:00 AM to 9:59 AM | 25 (8.4%) | 37 (18.7%) |
| 10:00 AM to 10:59 AM | 0 (0.0%) | 0 (0.0%) |
| 11:00 AM to 11:59 AM | 0 (0.0%) | 11 (5.6%) |
| 12:00 PM to 3:59 PM | 13 (4.4%) | 12 (6.1%) |
| 4:00 PM to 11:59 PM | 0 (0.0%) | 0 (0.0%) |
| Total | 297 (100.0%) | 198 (100.0%) |
Housing Occupancy in Nederland
Occupancy by Ownership in Nederland
Of the total 609 dwellings in Nederland, owner-occupied units account for 415 (68.1%), while renter-occupied units make up 194 (31.9%).
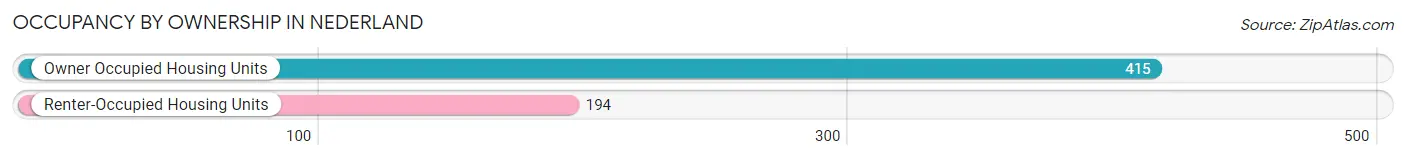
| Occupancy | # Housing Units | % Housing Units |
| Owner Occupied Housing Units | 415 | 68.1% |
| Renter-Occupied Housing Units | 194 | 31.9% |
| Total Occupied Housing Units | 609 | 100.0% |
Occupancy by Household Size in Nederland
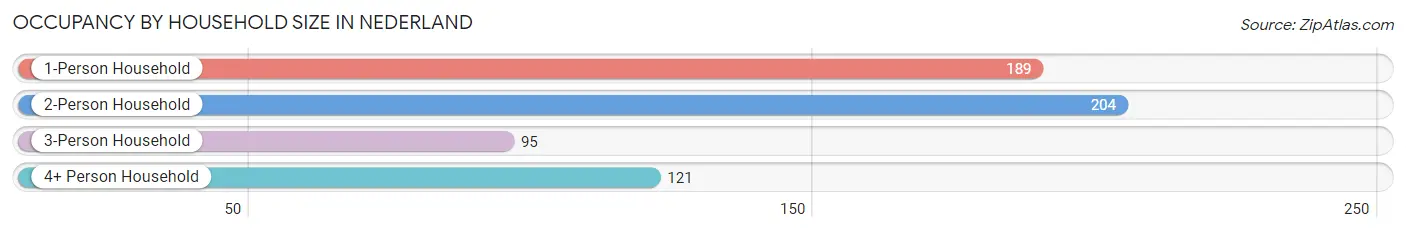
| Household Size | # Housing Units | % Housing Units |
| 1-Person Household | 189 | 31.0% |
| 2-Person Household | 204 | 33.5% |
| 3-Person Household | 95 | 15.6% |
| 4+ Person Household | 121 | 19.9% |
| Total Housing Units | 609 | 100.0% |
Occupancy by Ownership by Household Size in Nederland
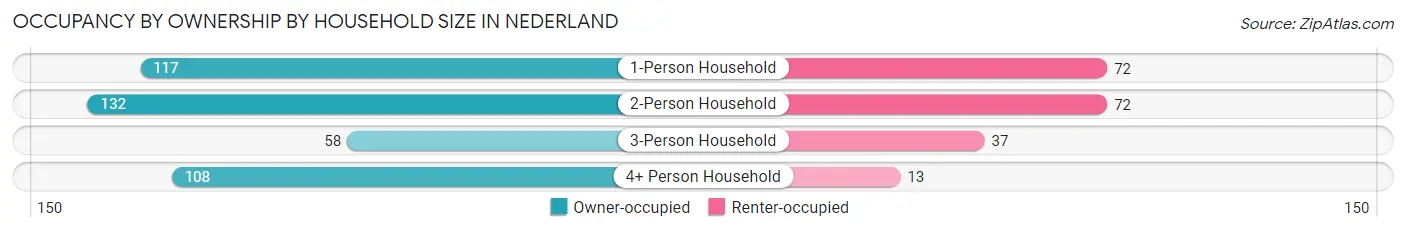
| Household Size | Owner-occupied | Renter-occupied |
| 1-Person Household | 117 (61.9%) | 72 (38.1%) |
| 2-Person Household | 132 (64.7%) | 72 (35.3%) |
| 3-Person Household | 58 (61.1%) | 37 (39.0%) |
| 4+ Person Household | 108 (89.3%) | 13 (10.7%) |
| Total Housing Units | 415 (68.1%) | 194 (31.9%) |
Occupancy by Educational Attainment in Nederland
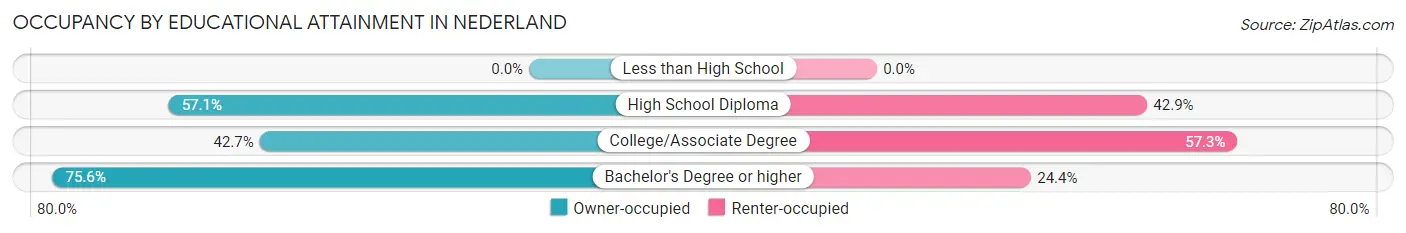
| Household Size | Owner-occupied | Renter-occupied |
| Less than High School | 0 (0.0%) | 0 (0.0%) |
| High School Diploma | 28 (57.1%) | 21 (42.9%) |
| College/Associate Degree | 47 (42.7%) | 63 (57.3%) |
| Bachelor's Degree or higher | 340 (75.6%) | 110 (24.4%) |
Occupancy by Age of Householder in Nederland
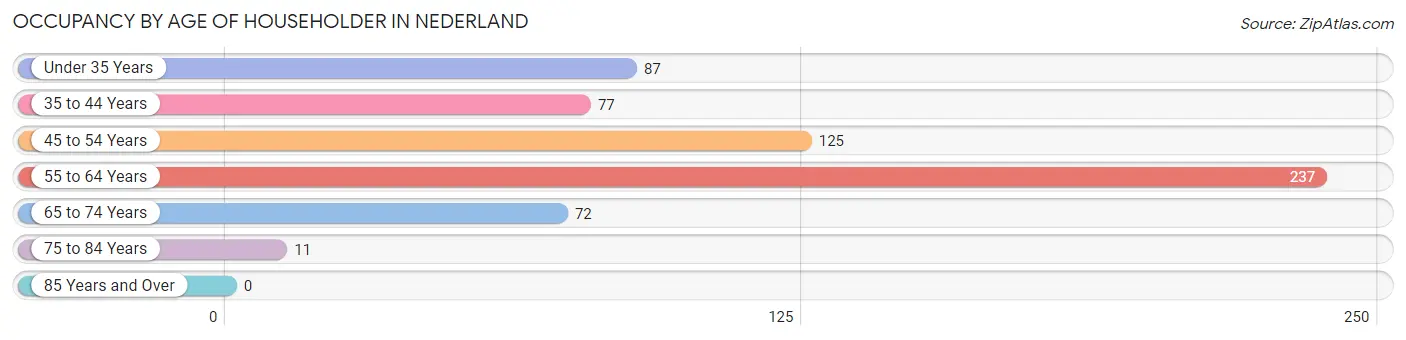
| Age Bracket | # Households | % Households |
| Under 35 Years | 87 | 14.3% |
| 35 to 44 Years | 77 | 12.6% |
| 45 to 54 Years | 125 | 20.5% |
| 55 to 64 Years | 237 | 38.9% |
| 65 to 74 Years | 72 | 11.8% |
| 75 to 84 Years | 11 | 1.8% |
| 85 Years and Over | 0 | 0.0% |
| Total | 609 | 100.0% |
Housing Finances in Nederland
Median Income by Occupancy in Nederland
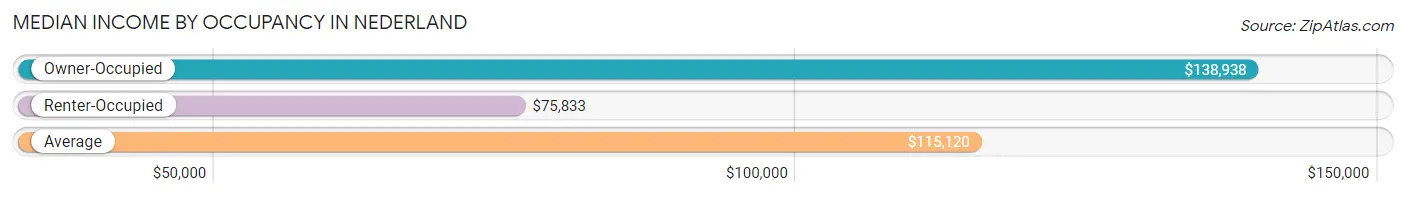
| Occupancy Type | # Households | Median Income |
| Owner-Occupied | 415 (68.1%) | $138,938 |
| Renter-Occupied | 194 (31.9%) | $75,833 |
| Average | 609 (100.0%) | $115,120 |
Occupancy by Householder Income Bracket in Nederland
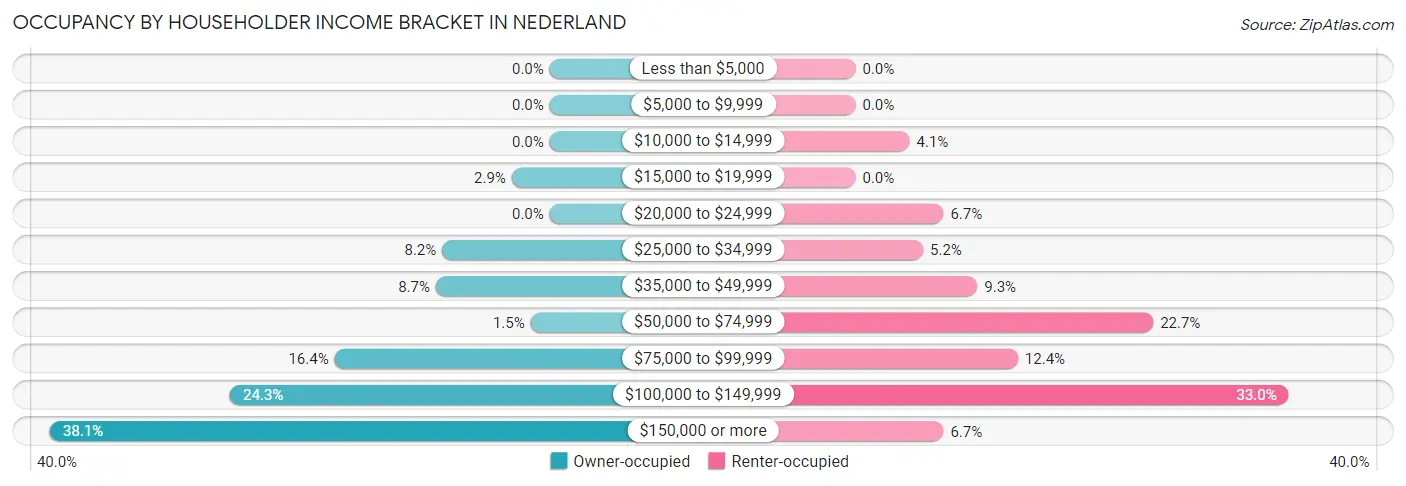
| Income Bracket | Owner-occupied | Renter-occupied |
| Less than $5,000 | 0 (0.0%) | 0 (0.0%) |
| $5,000 to $9,999 | 0 (0.0%) | 0 (0.0%) |
| $10,000 to $14,999 | 0 (0.0%) | 8 (4.1%) |
| $15,000 to $19,999 | 12 (2.9%) | 0 (0.0%) |
| $20,000 to $24,999 | 0 (0.0%) | 13 (6.7%) |
| $25,000 to $34,999 | 34 (8.2%) | 10 (5.1%) |
| $35,000 to $49,999 | 36 (8.7%) | 18 (9.3%) |
| $50,000 to $74,999 | 6 (1.5%) | 44 (22.7%) |
| $75,000 to $99,999 | 68 (16.4%) | 24 (12.4%) |
| $100,000 to $149,999 | 101 (24.3%) | 64 (33.0%) |
| $150,000 or more | 158 (38.1%) | 13 (6.7%) |
| Total | 415 (100.0%) | 194 (100.0%) |
Monthly Housing Cost Tiers in Nederland
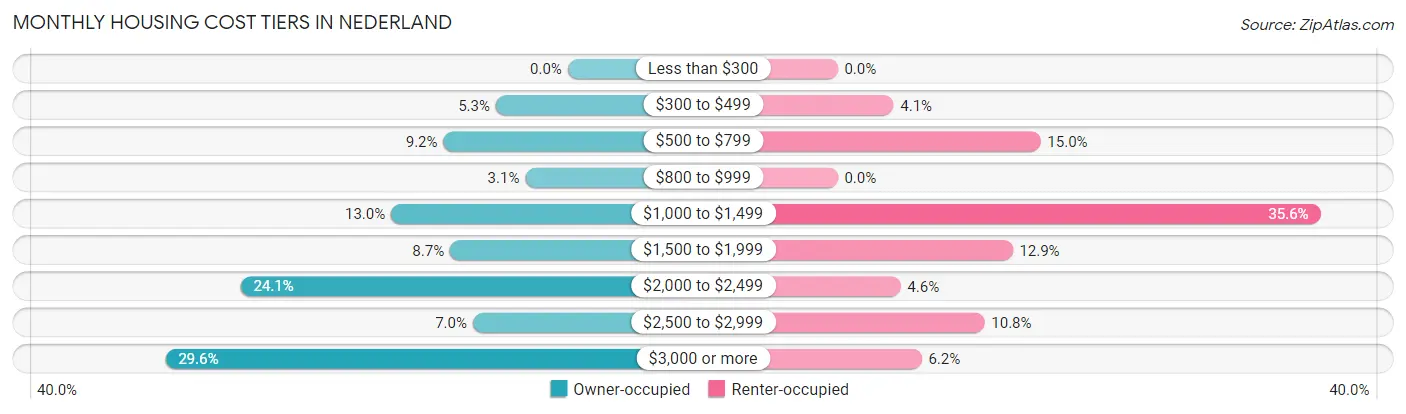
| Monthly Cost | Owner-occupied | Renter-occupied |
| Less than $300 | 0 (0.0%) | 0 (0.0%) |
| $300 to $499 | 22 (5.3%) | 8 (4.1%) |
| $500 to $799 | 38 (9.2%) | 29 (14.9%) |
| $800 to $999 | 13 (3.1%) | 0 (0.0%) |
| $1,000 to $1,499 | 54 (13.0%) | 69 (35.6%) |
| $1,500 to $1,999 | 36 (8.7%) | 25 (12.9%) |
| $2,000 to $2,499 | 100 (24.1%) | 9 (4.6%) |
| $2,500 to $2,999 | 29 (7.0%) | 21 (10.8%) |
| $3,000 or more | 123 (29.6%) | 12 (6.2%) |
| Total | 415 (100.0%) | 194 (100.0%) |
Physical Housing Characteristics in Nederland
Housing Structures in Nederland
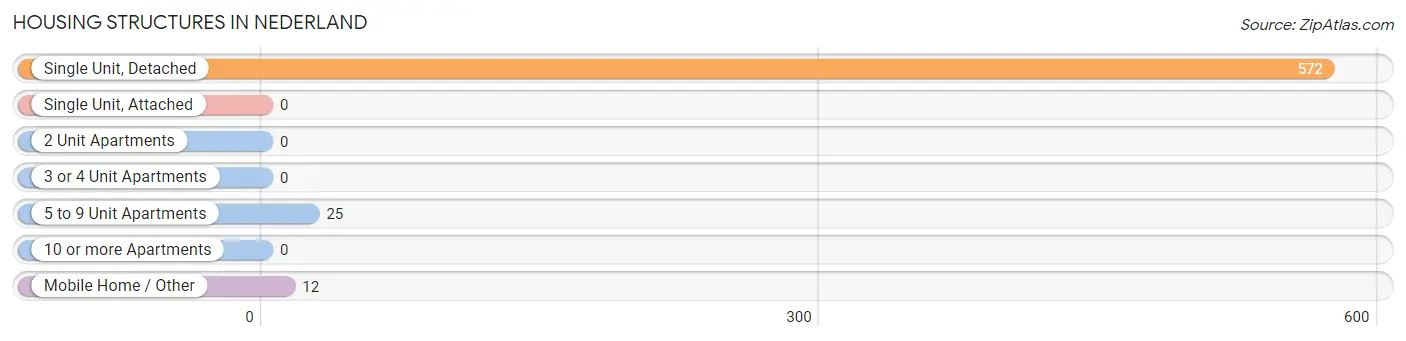
| Structure Type | # Housing Units | % Housing Units |
| Single Unit, Detached | 572 | 93.9% |
| Single Unit, Attached | 0 | 0.0% |
| 2 Unit Apartments | 0 | 0.0% |
| 3 or 4 Unit Apartments | 0 | 0.0% |
| 5 to 9 Unit Apartments | 25 | 4.1% |
| 10 or more Apartments | 0 | 0.0% |
| Mobile Home / Other | 12 | 2.0% |
| Total | 609 | 100.0% |
Housing Structures by Occupancy in Nederland
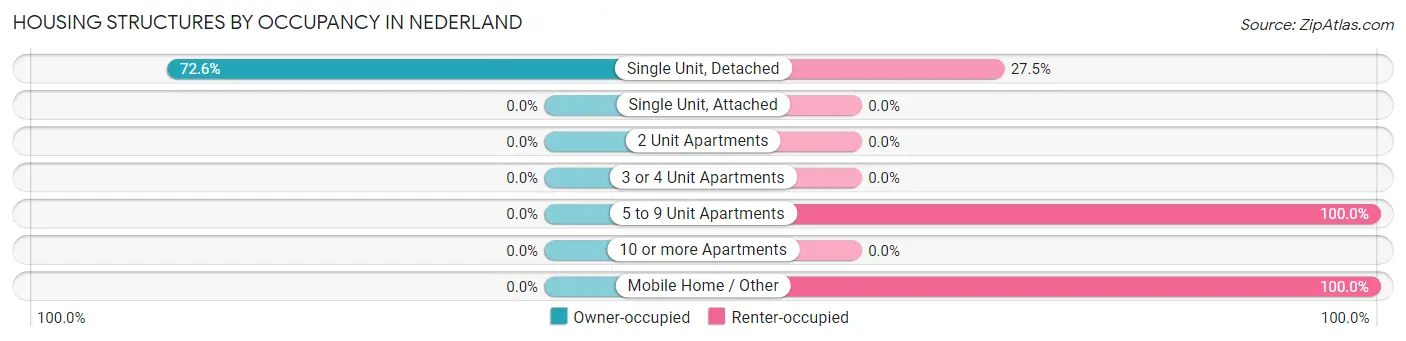
| Structure Type | Owner-occupied | Renter-occupied |
| Single Unit, Detached | 415 (72.6%) | 157 (27.5%) |
| Single Unit, Attached | 0 (0.0%) | 0 (0.0%) |
| 2 Unit Apartments | 0 (0.0%) | 0 (0.0%) |
| 3 or 4 Unit Apartments | 0 (0.0%) | 0 (0.0%) |
| 5 to 9 Unit Apartments | 0 (0.0%) | 25 (100.0%) |
| 10 or more Apartments | 0 (0.0%) | 0 (0.0%) |
| Mobile Home / Other | 0 (0.0%) | 12 (100.0%) |
| Total | 415 (68.1%) | 194 (31.9%) |
Housing Structures by Number of Rooms in Nederland
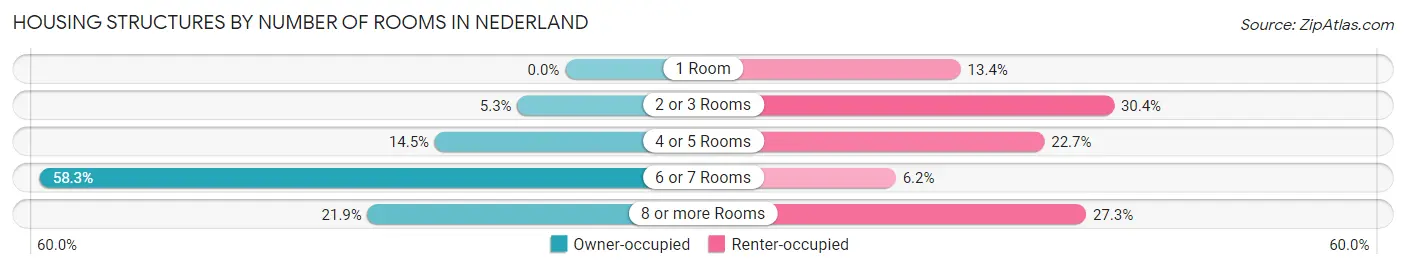
| Number of Rooms | Owner-occupied | Renter-occupied |
| 1 Room | 0 (0.0%) | 26 (13.4%) |
| 2 or 3 Rooms | 22 (5.3%) | 59 (30.4%) |
| 4 or 5 Rooms | 60 (14.5%) | 44 (22.7%) |
| 6 or 7 Rooms | 242 (58.3%) | 12 (6.2%) |
| 8 or more Rooms | 91 (21.9%) | 53 (27.3%) |
| Total | 415 (100.0%) | 194 (100.0%) |
Housing Structure by Heating Type in Nederland
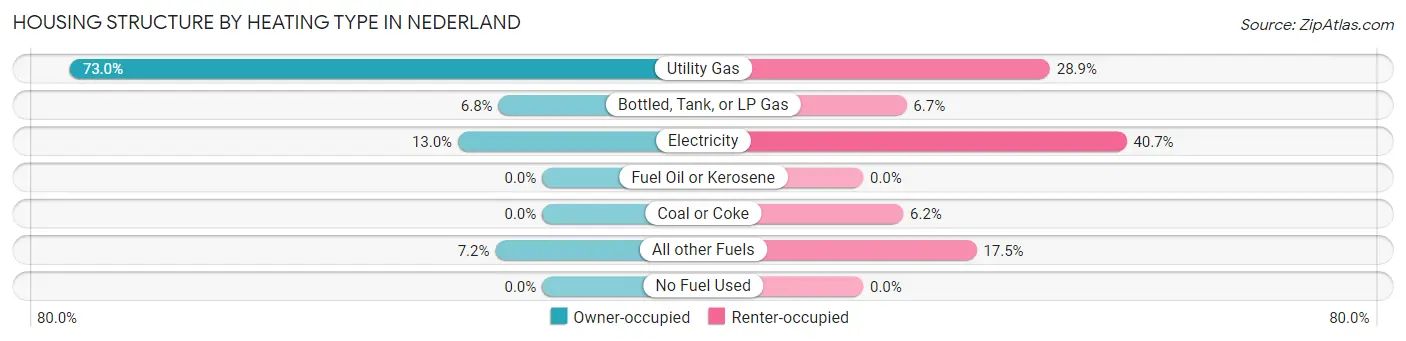
| Heating Type | Owner-occupied | Renter-occupied |
| Utility Gas | 303 (73.0%) | 56 (28.9%) |
| Bottled, Tank, or LP Gas | 28 (6.8%) | 13 (6.7%) |
| Electricity | 54 (13.0%) | 79 (40.7%) |
| Fuel Oil or Kerosene | 0 (0.0%) | 0 (0.0%) |
| Coal or Coke | 0 (0.0%) | 12 (6.2%) |
| All other Fuels | 30 (7.2%) | 34 (17.5%) |
| No Fuel Used | 0 (0.0%) | 0 (0.0%) |
| Total | 415 (100.0%) | 194 (100.0%) |
Household Vehicle Usage in Nederland
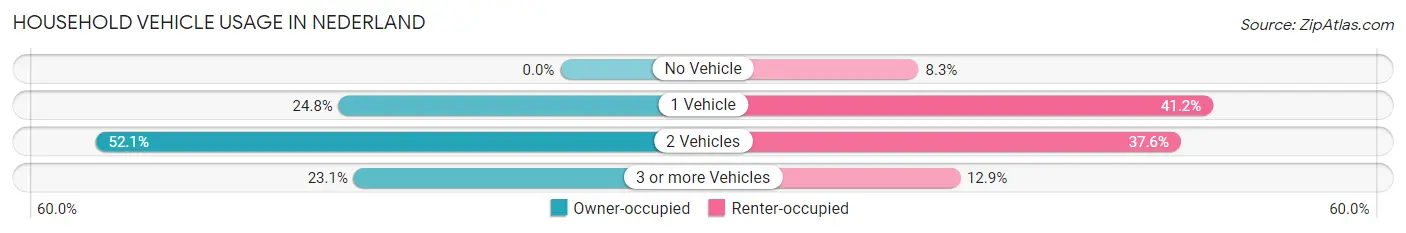
| Vehicles per Household | Owner-occupied | Renter-occupied |
| No Vehicle | 0 (0.0%) | 16 (8.3%) |
| 1 Vehicle | 103 (24.8%) | 80 (41.2%) |
| 2 Vehicles | 216 (52.0%) | 73 (37.6%) |
| 3 or more Vehicles | 96 (23.1%) | 25 (12.9%) |
| Total | 415 (100.0%) | 194 (100.0%) |
Real Estate & Mortgages in Nederland
Real Estate and Mortgage Overview in Nederland
| Characteristic | Without Mortgage | With Mortgage |
| Housing Units | 79 | 336 |
| Median Property Value | $540,200 | $627,400 |
| Median Household Income | $93,029 | $142 |
| Monthly Housing Costs | $707 | $123 |
| Real Estate Taxes | $3,382 | $0 |
Property Value by Mortgage Status in Nederland
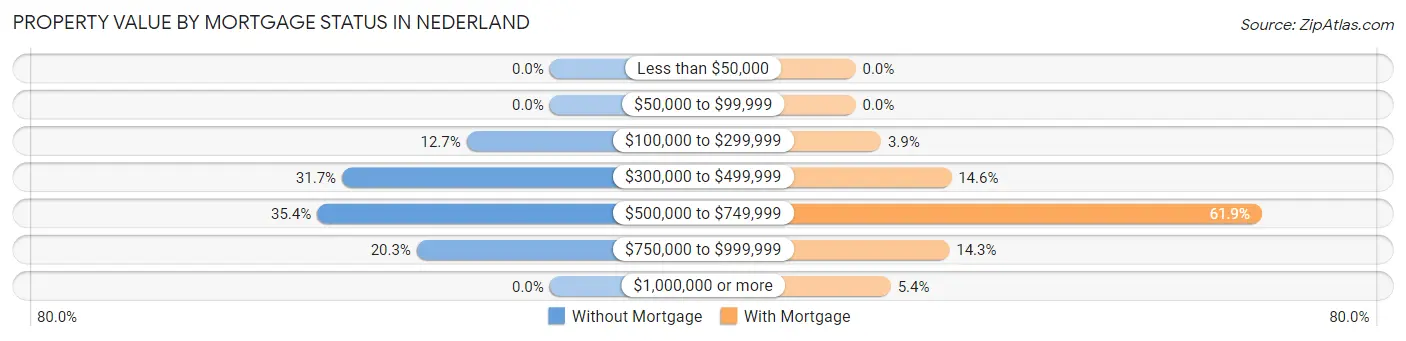
| Property Value | Without Mortgage | With Mortgage |
| Less than $50,000 | 0 (0.0%) | 0 (0.0%) |
| $50,000 to $99,999 | 0 (0.0%) | 0 (0.0%) |
| $100,000 to $299,999 | 10 (12.7%) | 13 (3.9%) |
| $300,000 to $499,999 | 25 (31.7%) | 49 (14.6%) |
| $500,000 to $749,999 | 28 (35.4%) | 208 (61.9%) |
| $750,000 to $999,999 | 16 (20.3%) | 48 (14.3%) |
| $1,000,000 or more | 0 (0.0%) | 18 (5.4%) |
| Total | 79 (100.0%) | 336 (100.0%) |
Household Income by Mortgage Status in Nederland
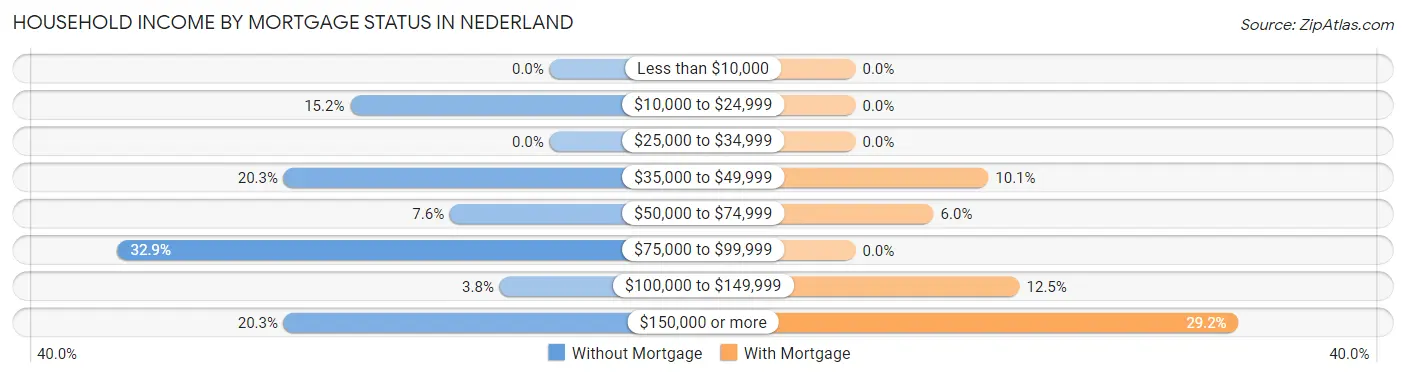
| Household Income | Without Mortgage | With Mortgage |
| Less than $10,000 | 0 (0.0%) | 0 (0.0%) |
| $10,000 to $24,999 | 12 (15.2%) | 0 (0.0%) |
| $25,000 to $34,999 | 0 (0.0%) | 0 (0.0%) |
| $35,000 to $49,999 | 16 (20.3%) | 34 (10.1%) |
| $50,000 to $74,999 | 6 (7.6%) | 20 (5.9%) |
| $75,000 to $99,999 | 26 (32.9%) | 0 (0.0%) |
| $100,000 to $149,999 | 3 (3.8%) | 42 (12.5%) |
| $150,000 or more | 16 (20.3%) | 98 (29.2%) |
| Total | 79 (100.0%) | 336 (100.0%) |
Property Value to Household Income Ratio in Nederland
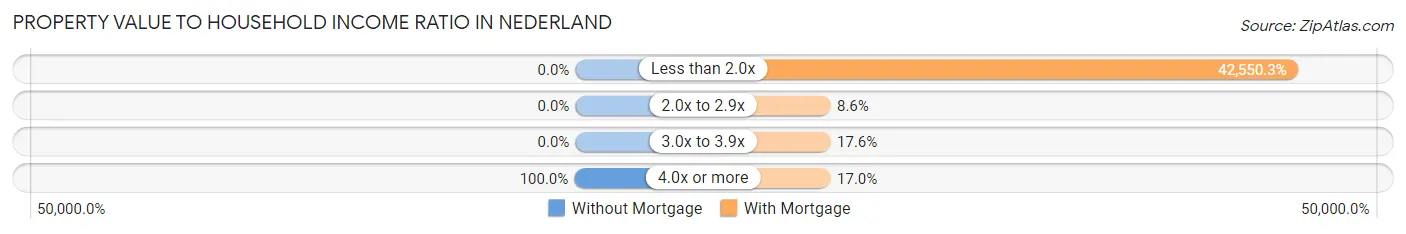
| Value-to-Income Ratio | Without Mortgage | With Mortgage |
| Less than 2.0x | 0 (0.0%) | 142,969 (42,550.3%) |
| 2.0x to 2.9x | 0 (0.0%) | 29 (8.6%) |
| 3.0x to 3.9x | 0 (0.0%) | 59 (17.6%) |
| 4.0x or more | 79 (100.0%) | 57 (17.0%) |
| Total | 79 (100.0%) | 336 (100.0%) |
Real Estate Taxes by Mortgage Status in Nederland
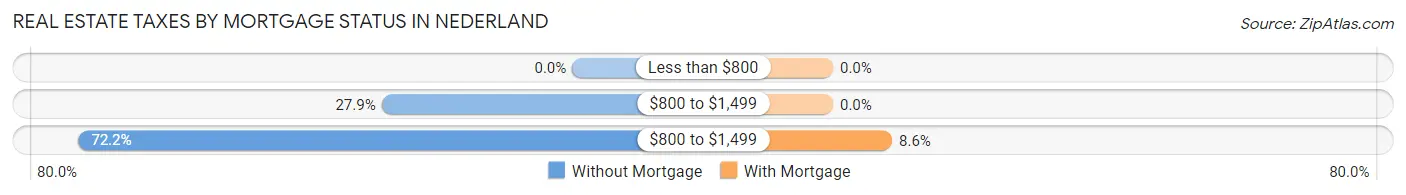
| Property Taxes | Without Mortgage | With Mortgage |
| Less than $800 | 0 (0.0%) | 0 (0.0%) |
| $800 to $1,499 | 22 (27.9%) | 0 (0.0%) |
| $800 to $1,499 | 57 (72.2%) | 29 (8.6%) |
| Total | 79 (100.0%) | 336 (100.0%) |
Health & Disability in Nederland
Health Insurance Coverage by Age in Nederland
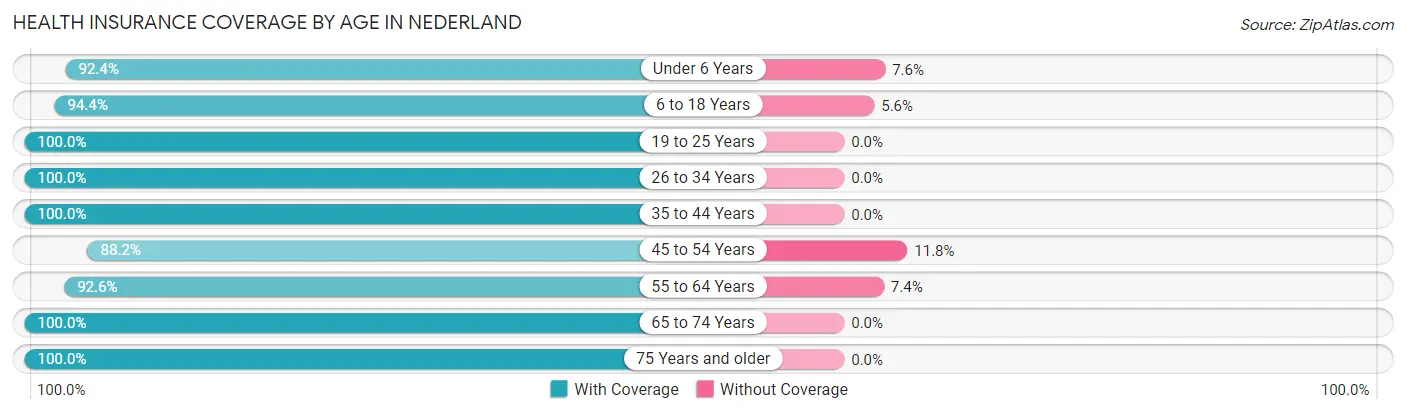
| Age Bracket | With Coverage | Without Coverage |
| Under 6 Years | 109 (92.4%) | 9 (7.6%) |
| 6 to 18 Years | 152 (94.4%) | 9 (5.6%) |
| 19 to 25 Years | 36 (100.0%) | 0 (0.0%) |
| 26 to 34 Years | 189 (100.0%) | 0 (0.0%) |
| 35 to 44 Years | 157 (100.0%) | 0 (0.0%) |
| 45 to 54 Years | 225 (88.2%) | 30 (11.8%) |
| 55 to 64 Years | 326 (92.6%) | 26 (7.4%) |
| 65 to 74 Years | 134 (100.0%) | 0 (0.0%) |
| 75 Years and older | 11 (100.0%) | 0 (0.0%) |
| Total | 1,339 (94.8%) | 74 (5.2%) |
Health Insurance Coverage by Citizenship Status in Nederland
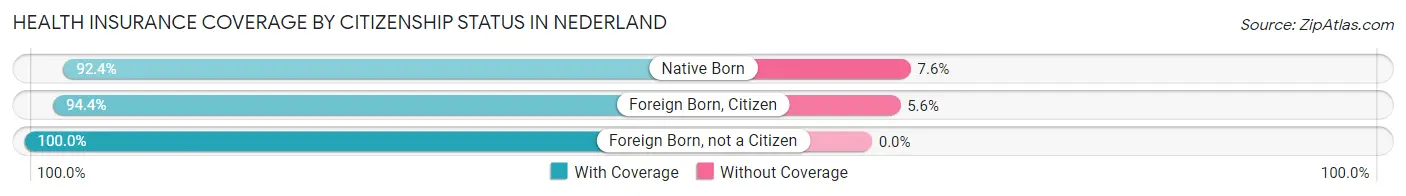
| Citizenship Status | With Coverage | Without Coverage |
| Native Born | 109 (92.4%) | 9 (7.6%) |
| Foreign Born, Citizen | 152 (94.4%) | 9 (5.6%) |
| Foreign Born, not a Citizen | 36 (100.0%) | 0 (0.0%) |
Health Insurance Coverage by Household Income in Nederland
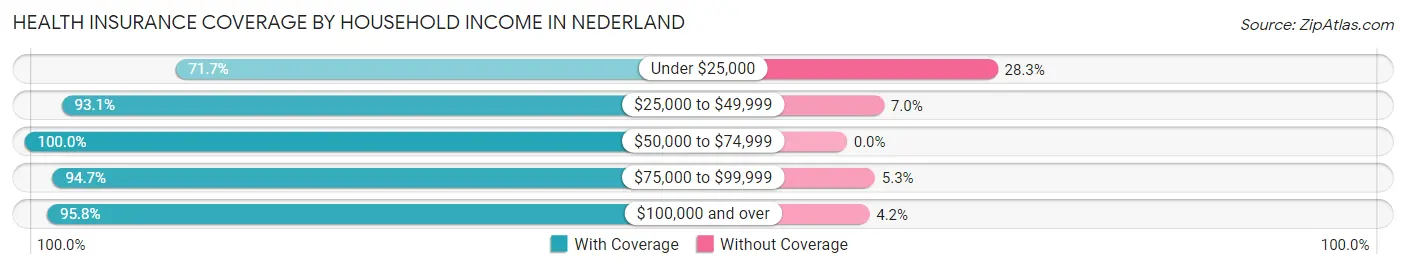
| Household Income | With Coverage | Without Coverage |
| Under $25,000 | 33 (71.7%) | 13 (28.3%) |
| $25,000 to $49,999 | 174 (93.0%) | 13 (7.0%) |
| $50,000 to $74,999 | 101 (100.0%) | 0 (0.0%) |
| $75,000 to $99,999 | 234 (94.7%) | 13 (5.3%) |
| $100,000 and over | 797 (95.8%) | 35 (4.2%) |
Public vs Private Health Insurance Coverage by Age in Nederland
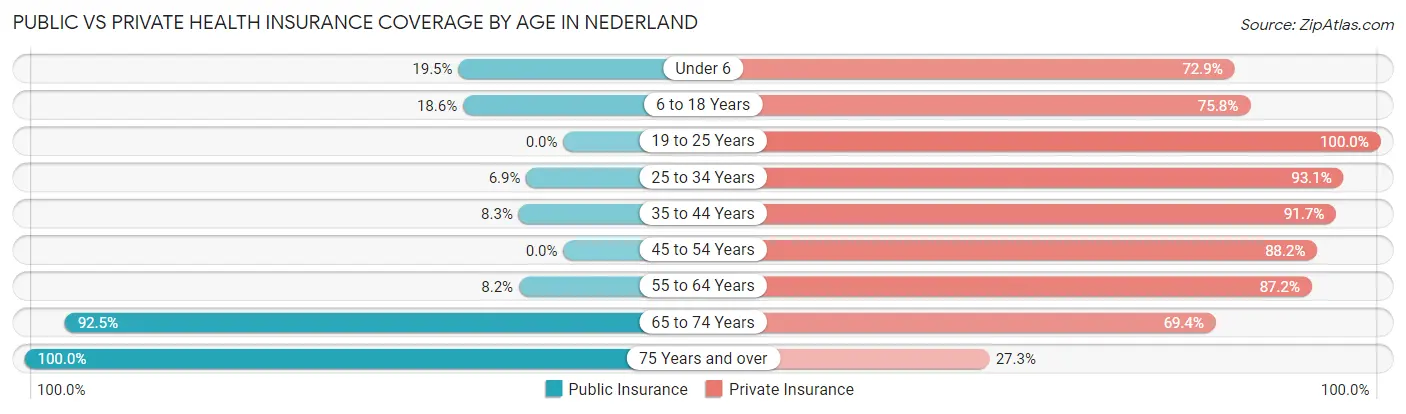
| Age Bracket | Public Insurance | Private Insurance |
| Under 6 | 23 (19.5%) | 86 (72.9%) |
| 6 to 18 Years | 30 (18.6%) | 122 (75.8%) |
| 19 to 25 Years | 0 (0.0%) | 36 (100.0%) |
| 25 to 34 Years | 13 (6.9%) | 176 (93.1%) |
| 35 to 44 Years | 13 (8.3%) | 144 (91.7%) |
| 45 to 54 Years | 0 (0.0%) | 225 (88.2%) |
| 55 to 64 Years | 29 (8.2%) | 307 (87.2%) |
| 65 to 74 Years | 124 (92.5%) | 93 (69.4%) |
| 75 Years and over | 11 (100.0%) | 3 (27.3%) |
| Total | 243 (17.2%) | 1,192 (84.4%) |
Disability Status by Sex by Age in Nederland
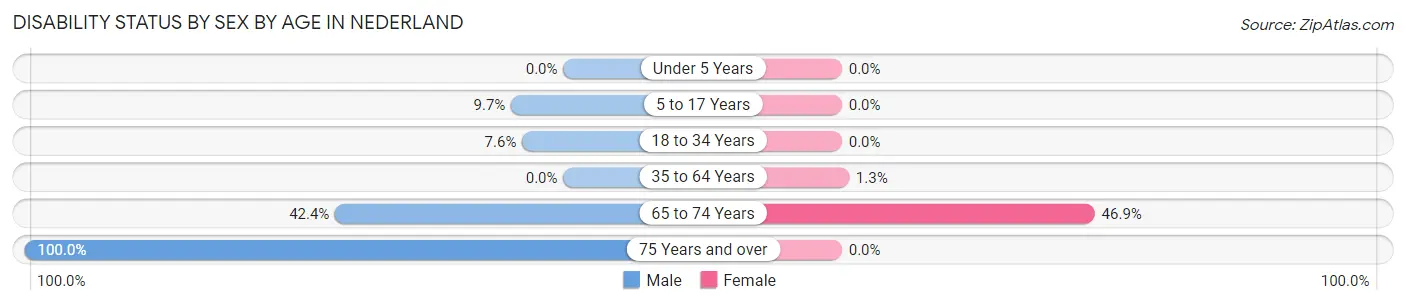
| Age Bracket | Male | Female |
| Under 5 Years | 0 (0.0%) | 0 (0.0%) |
| 5 to 17 Years | 9 (9.7%) | 0 (0.0%) |
| 18 to 34 Years | 10 (7.6%) | 0 (0.0%) |
| 35 to 64 Years | 0 (0.0%) | 5 (1.3%) |
| 65 to 74 Years | 36 (42.3%) | 23 (46.9%) |
| 75 Years and over | 11 (100.0%) | 0 (0.0%) |
Disability Class by Sex by Age in Nederland
Disability Class: Hearing Difficulty
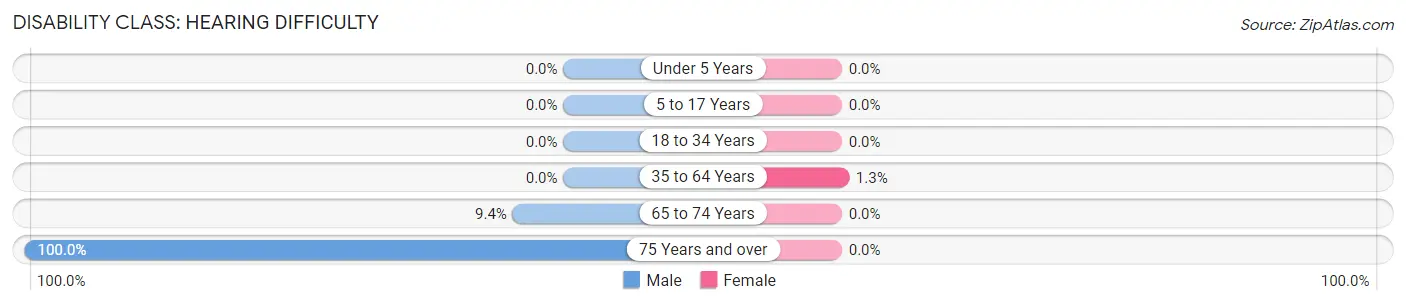
| Age Bracket | Male | Female |
| Under 5 Years | 0 (0.0%) | 0 (0.0%) |
| 5 to 17 Years | 0 (0.0%) | 0 (0.0%) |
| 18 to 34 Years | 0 (0.0%) | 0 (0.0%) |
| 35 to 64 Years | 0 (0.0%) | 5 (1.3%) |
| 65 to 74 Years | 8 (9.4%) | 0 (0.0%) |
| 75 Years and over | 11 (100.0%) | 0 (0.0%) |
Disability Class: Vision Difficulty
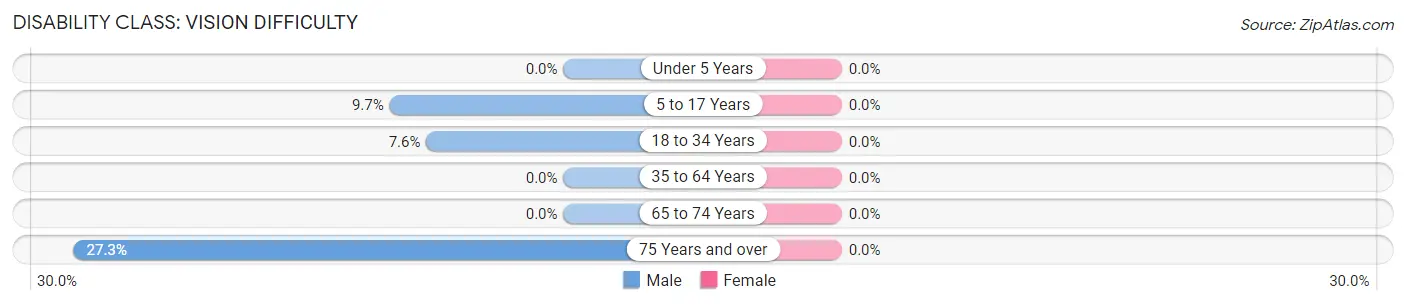
| Age Bracket | Male | Female |
| Under 5 Years | 0 (0.0%) | 0 (0.0%) |
| 5 to 17 Years | 9 (9.7%) | 0 (0.0%) |
| 18 to 34 Years | 10 (7.6%) | 0 (0.0%) |
| 35 to 64 Years | 0 (0.0%) | 0 (0.0%) |
| 65 to 74 Years | 0 (0.0%) | 0 (0.0%) |
| 75 Years and over | 3 (27.3%) | 0 (0.0%) |
Disability Class: Cognitive Difficulty
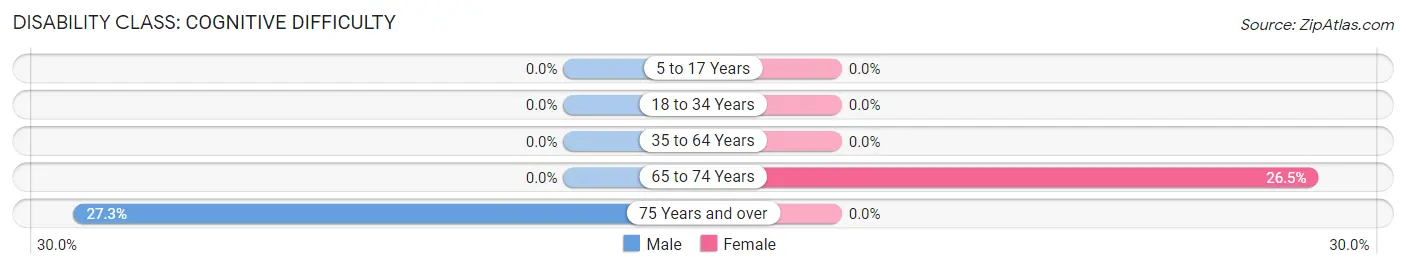
| Age Bracket | Male | Female |
| 5 to 17 Years | 0 (0.0%) | 0 (0.0%) |
| 18 to 34 Years | 0 (0.0%) | 0 (0.0%) |
| 35 to 64 Years | 0 (0.0%) | 0 (0.0%) |
| 65 to 74 Years | 0 (0.0%) | 13 (26.5%) |
| 75 Years and over | 3 (27.3%) | 0 (0.0%) |
Disability Class: Ambulatory Difficulty
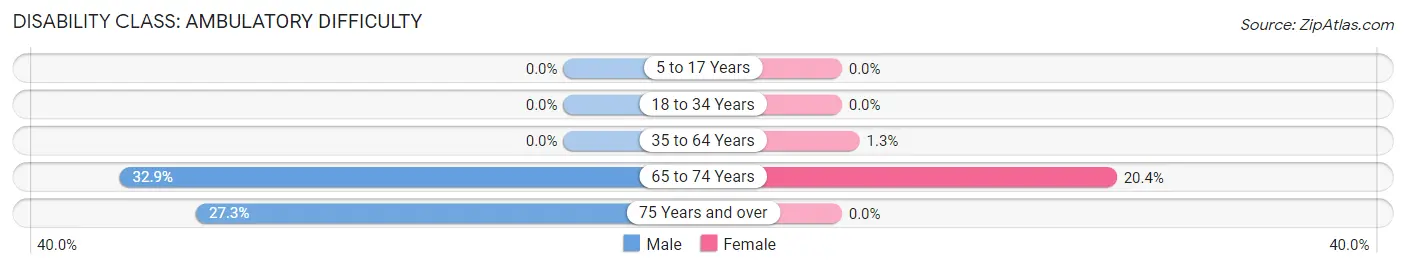
| Age Bracket | Male | Female |
| 5 to 17 Years | 0 (0.0%) | 0 (0.0%) |
| 18 to 34 Years | 0 (0.0%) | 0 (0.0%) |
| 35 to 64 Years | 0 (0.0%) | 5 (1.3%) |
| 65 to 74 Years | 28 (32.9%) | 10 (20.4%) |
| 75 Years and over | 3 (27.3%) | 0 (0.0%) |
Disability Class: Self-Care Difficulty
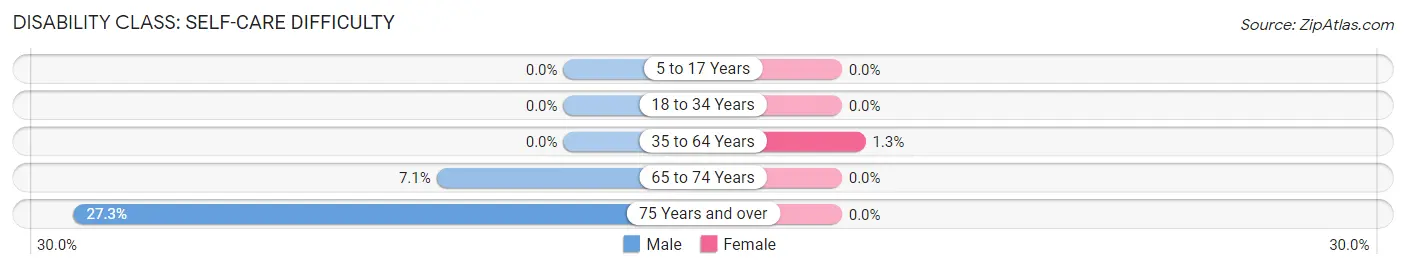
| Age Bracket | Male | Female |
| 5 to 17 Years | 0 (0.0%) | 0 (0.0%) |
| 18 to 34 Years | 0 (0.0%) | 0 (0.0%) |
| 35 to 64 Years | 0 (0.0%) | 5 (1.3%) |
| 65 to 74 Years | 6 (7.1%) | 0 (0.0%) |
| 75 Years and over | 3 (27.3%) | 0 (0.0%) |
Technology Access in Nederland
Computing Device Access in Nederland
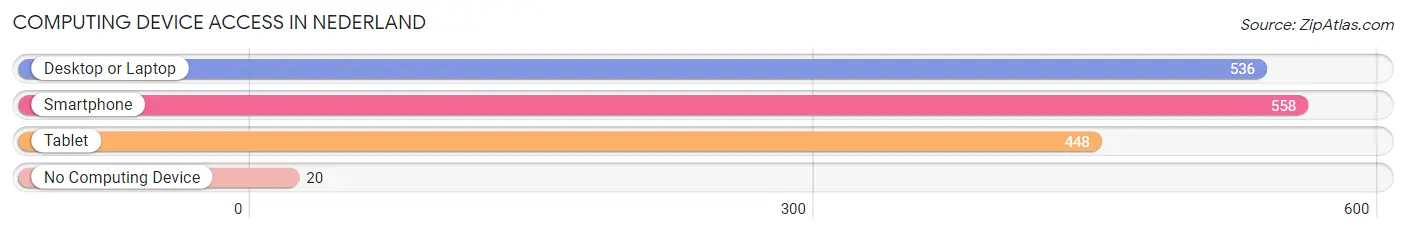
| Device Type | # Households | % Households |
| Desktop or Laptop | 536 | 88.0% |
| Smartphone | 558 | 91.6% |
| Tablet | 448 | 73.6% |
| No Computing Device | 20 | 3.3% |
| Total | 609 | 100.0% |
Internet Access in Nederland
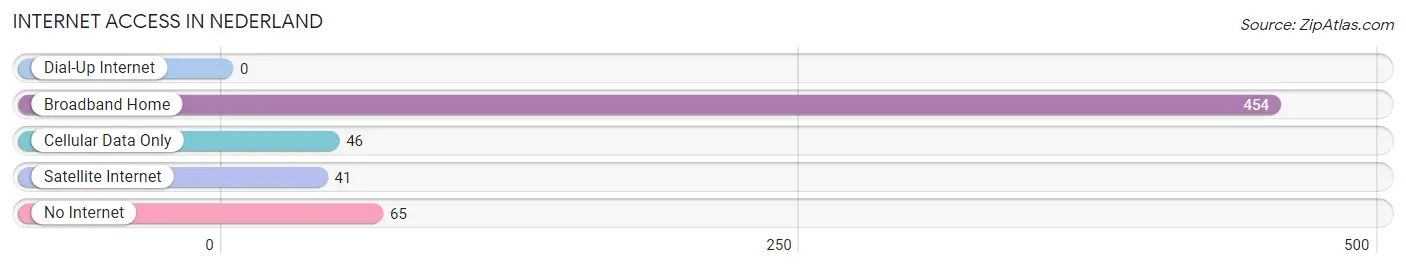
| Internet Type | # Households | % Households |
| Dial-Up Internet | 0 | 0.0% |
| Broadband Home | 454 | 74.6% |
| Cellular Data Only | 46 | 7.5% |
| Satellite Internet | 41 | 6.7% |
| No Internet | 65 | 10.7% |
| Total | 609 | 100.0% |
Nederland Summary
Nederland is a small town located in Boulder County, Colorado, United States. It is situated in the foothills of the Rocky Mountains, at an elevation of 8,228 feet (2,510 m). The town is located approximately 15 miles (24 km) west of Boulder and 25 miles (40 km) northwest of Denver. The population of Nederland was 1,445 at the 2010 census.
Geography
Nederland is located in the foothills of the Rocky Mountains, at an elevation of 8,228 feet (2,510 m). The town is located approximately 15 miles (24 km) west of Boulder and 25 miles (40 km) northwest of Denver. The town is surrounded by the Roosevelt National Forest and the Indian Peaks Wilderness Area. The town is situated at the base of Barker Reservoir, which is fed by the North and Middle St. Vrain Creeks.
Climate
Nederland has a humid continental climate, with cold, snowy winters and mild summers. The average annual temperature is 41.3°F (5.2°C). The average annual precipitation is 24.3 inches (616 mm).
History
Nederland was founded in 1874 by Dutch settlers who named the town after their homeland. The town was originally a mining camp, and the first gold discovery was made in 1875. The town was incorporated in 1876.
In the early 1900s, Nederland was a popular tourist destination, with many visitors coming to enjoy the scenery and outdoor activities. The town was also home to a number of ski resorts, including the Eldora Ski Area, which opened in 1939.
Economy
Nederland’s economy is largely based on tourism and outdoor recreation. The town is home to several ski resorts, including Eldora Mountain Resort, which is the closest ski area to Denver. The town is also home to a number of restaurants, shops, and other businesses catering to tourists.
Demographics
As of the 2010 census, there were 1,445 people, 645 households, and 393 families residing in Nederland. The population density was 545.3 people per square mile (210.9/km2). The racial makeup of the town was 94.2% White, 0.7% African American, 0.7% Native American, 0.7% Asian, 0.1% Pacific Islander, 1.2% from other races, and 2.4% from two or more races. Hispanic or Latino of any race were 4.2% of the population.
The median income for a household in Nederland was $50,000, and the median income for a family was $60,000. The per capita income for the town was $27,000. About 8.2% of families and 11.2% of the population were below the poverty line, including 15.2% of those under age 18 and 4.2% of those age 65 or over.
Common Questions
What is Per Capita Income in Nederland?
Per Capita income in Nederland is $66,603.
What is the Median Family Income in Nederland?
Median Family Income in Nederland is $116,324.
What is the Median Household income in Nederland?
Median Household Income in Nederland is $115,120.
What is Income or Wage Gap in Nederland?
Income or Wage Gap in Nederland is 23.8%.
Women in Nederland earn 76.2 cents for every dollar earned by a man.
What is Inequality or Gini Index in Nederland?
Inequality or Gini Index in Nederland is 0.45.
What is the Total Population of Nederland?
Total Population of Nederland is 1,413.
What is the Total Male Population of Nederland?
Total Male Population of Nederland is 763.
What is the Total Female Population of Nederland?
Total Female Population of Nederland is 650.
What is the Ratio of Males per 100 Females in Nederland?
There are 117.38 Males per 100 Females in Nederland.
What is the Ratio of Females per 100 Males in Nederland?
There are 85.19 Females per 100 Males in Nederland.
What is the Median Population Age in Nederland?
Median Population Age in Nederland is 46.6 Years.
What is the Average Family Size in Nederland
Average Family Size in Nederland is 2.8 People.
What is the Average Household Size in Nederland
Average Household Size in Nederland is 2.3 People.
How Large is the Labor Force in Nederland?
There are 904 People in the Labor Forcein in Nederland.
What is the Percentage of People in the Labor Force in Nederland?
79.2% of People are in the Labor Force in Nederland.
What is the Unemployment Rate in Nederland?
Unemployment Rate in Nederland is 2.5%.